BANK OF NEW YORK MELLON CORP
10-Ks and 10-Qs
|
|
|
|
|
|
|
|
|
|
|
|
|
|
|
|
|
|
|
|
|
|
|
|
|
|
|
|
|
|
|
|
|
|
|
|
|
|
|
|
|
|
|
|
|
|
|
|
|
|
|
|
|
|
|
|
UNITED STATES
SECURITIES AND EXCHANGE COMMISSION
Washington, D.C. 20549
FORM 10-Q
[ X ] Quarterly Report Pursuant To Section 13 or 15(d) of the Securities Exchange Act of 1934
For the Quarterly Period Ended
June 30, 2018
or
[ ] Transition Report Pursuant to Section 13 or 15(d) of the Securities Exchange Act of 1934
Commission File No. 001-35651
THE BANK OF NEW YORK MELLON CORPORATION
(Exact name of registrant as specified in its charter)
|
Delaware
|
13-2614959
|
|
(State or other jurisdiction of
|
(I.R.S. Employer Identification No.)
|
|
incorporation or organization)
|
|
240 Greenwich Street
New York, New York 10286
(Address of principal executive offices) (Zip Code)
Registrant’s telephone number, including area code -- (212) 495-1784
Indicate by check mark whether the registrant (1) has filed all reports required to be filed by Section 13 or 15(d) of the Securities Exchange Act of 1934 during the preceding 12 months (or for such shorter period that the registrant was required to file such reports), and (2) has been subject to such filing requirements for the past 90 days. Yes
x
No
o
Indicate by check mark whether the registrant has submitted electronically and posted on its corporate Web site, if any, every Interactive Data File required to be submitted and posted pursuant to Rule 405 of Regulation S-T (§232.405 of this chapter) during the preceding 12 months (or for such shorter period that the registrant was required to submit and post such files). Yes
x
No
o
Indicate by check mark whether the registrant is a large accelerated filer, an accelerated filer, a non-accelerated filer, a smaller reporting company, or an emerging growth company. See the definitions of “large accelerated filer,” “accelerated filer,” “smaller reporting company,” and “emerging growth company” in Rule 12b-2 of the Exchange Act.
|
Large accelerated filer
x
|
Smaller reporting company
o
|
|
Accelerated filer
o
|
Emerging growth company
o
|
|
Non-accelerated filer
o
(Do not check if a smaller reporting company)
|
|
If an emerging growth company, indicate by check mark if the registrant has elected not to use the extended transition period for complying with any new or revised financial accounting standards provided pursuant to Section 13(a) of the Exchange Act.
o
Indicate by check mark whether the registrant is a shell company (as defined in Rule 12b-2 of the Exchange Act). Yes
o
No
x
Indicate the number of shares outstanding of each of the issuer’s classes of common stock, as of the latest practicable date.
|
Class
|
Outstanding as of
|
|
||
|
June 30, 2018
|
|
|||
|
Common Stock, $0.01 par value
|
999,944,587
|
|
||
THE BANK OF NEW YORK MELLON CORPORATION
Second Quarter 2018 Form 10-Q
Table of Contents
|
|
Page
|
|
Part I - Financial Information
|
|
|
Items 2. and 3. Management’s Discussion and Analysis of Financial Condition and Results of Operations; Quantitative and Qualitative Disclosures about Market Risk:
|
|
|
Key second quarter 2018 and subsequent events
|
|
|
Highlights of second quarter 2018 results
|
|
|
Business continuity and operational resiliency
|
|
|
Item 1. Financial Statements:
|
|
|
|
Page
|
|
Notes to Consolidated Financial Statements:
|
|
|
Note 3—Acquisitions
and dispositions
|
|
|
Part II - Other Information
|
|
|
Index to Exhibits
|
|
|
Signature
|
|
The Bank of New York Mellon Corporation (and its subsidiaries)
Consolidated Financial Highlights (unaudited)
|
Quarter ended
|
Year-to-date
|
|||||||||||||||
|
(dollars in millions, except per share amounts and unless otherwise noted)
|
June 30, 2018
|
|
March 31, 2018
|
|
June 30, 2017
|
|
June 30, 2018
|
|
June 30, 2017
|
|
||||||
|
Results applicable to common shareholders of The Bank of New York Mellon Corporation:
|
||||||||||||||||
|
Net income
|
$
|
1,055
|
|
$
|
1,135
|
|
$
|
926
|
|
$
|
2,190
|
|
$
|
1,806
|
|
|
|
Basic earnings per share
|
$
|
1.04
|
|
$
|
1.11
|
|
$
|
0.88
|
|
$
|
2.15
|
|
$
|
1.71
|
|
|
|
Diluted earnings per share
|
$
|
1.03
|
|
$
|
1.10
|
|
$
|
0.88
|
|
$
|
2.14
|
|
$
|
1.70
|
|
|
|
Fee and other revenue
|
$
|
3,210
|
|
$
|
3,270
|
|
$
|
3,120
|
|
$
|
6,480
|
|
$
|
6,138
|
|
|
|
Income (loss) from consolidated investment management funds
|
12
|
|
(11
|
)
|
10
|
|
1
|
|
43
|
|
||||||
|
Net interest revenue
|
916
|
|
919
|
|
826
|
|
1,835
|
|
1,618
|
|
||||||
|
Total revenue
|
$
|
4,138
|
|
$
|
4,178
|
|
$
|
3,956
|
|
$
|
8,316
|
|
$
|
7,799
|
|
|
|
Return on common equity
(annualized)
|
11.2
|
%
|
12.2
|
%
|
10.4
|
%
|
11.7
|
%
|
10.3
|
%
|
||||||
|
Return on tangible common equity
(annualized) –
Non-GAAP
(a)
|
23.5
|
%
|
25.9
|
%
|
21.9
|
%
|
24.6
|
%
|
22.1
|
%
|
||||||
|
Return on average assets
(annualized)
|
1.22
|
%
|
1.29
|
%
|
1.09
|
%
|
1.25
|
%
|
1.07
|
%
|
||||||
|
Fee revenue as a percentage of total revenue
|
78
|
%
|
79
|
%
|
79
|
%
|
78
|
%
|
79
|
%
|
||||||
|
Percentage of non-U.S. total revenue
|
37
|
%
|
37
|
%
|
35
|
%
|
37
|
%
|
34
|
%
|
||||||
|
Pre-tax operating margin
|
34
|
%
|
35
|
%
|
33
|
%
|
34
|
%
|
32
|
%
|
||||||
|
Net interest margin
|
1.26
|
%
|
1.22
|
%
|
1.14
|
%
|
1.24
|
%
|
1.14
|
%
|
||||||
|
Net interest margin on a fully taxable equivalent (“FTE”) basis
– Non-GAAP
(b)
|
1.26
|
%
|
1.23
|
%
|
1.16
|
%
|
1.25
|
%
|
1.15
|
%
|
||||||
|
Assets under custody and/or administration (“AUC/A”) at period end
(in trillions) (c)
|
$
|
33.6
|
|
$
|
33.5
|
|
$
|
31.1
|
|
$
|
33.6
|
|
$
|
31.1
|
|
|
|
Assets under management (“AUM”) at period end
(in billions) (d)
|
$
|
1,805
|
|
$
|
1,868
|
|
$
|
1,771
|
|
$
|
1,805
|
|
$
|
1,771
|
|
|
|
Market value of securities on loan at period end
(in billions) (e)
|
$
|
432
|
|
$
|
436
|
|
$
|
336
|
|
$
|
432
|
|
$
|
336
|
|
|
|
Average common shares and equivalents outstanding
(in thousands)
:
|
||||||||||||||||
|
Basic
|
1,010,179
|
|
1,016,797
|
|
1,035,829
|
|
1,013,507
|
|
1,038,479
|
|
||||||
|
Diluted
|
1,014,357
|
|
1,021,731
|
|
1,041,879
|
|
1,018,020
|
|
1,044,809
|
|
||||||
|
Selected average balances:
|
||||||||||||||||
|
Interest-earning assets
|
$
|
292,086
|
|
$
|
302,069
|
|
$
|
289,496
|
|
$
|
297,050
|
|
$
|
286,475
|
|
|
|
Assets of operations
|
$
|
345,840
|
|
$
|
357,483
|
|
$
|
341,607
|
|
$
|
351,630
|
|
$
|
338,362
|
|
|
|
Total assets
|
$
|
346,328
|
|
$
|
358,175
|
|
$
|
342,515
|
|
$
|
352,219
|
|
$
|
339,375
|
|
|
|
Interest-bearing deposits
|
$
|
152,799
|
|
$
|
155,704
|
|
$
|
142,336
|
|
$
|
154,244
|
|
$
|
141,084
|
|
|
|
Long-term debt
|
$
|
28,349
|
|
$
|
28,407
|
|
$
|
27,398
|
|
$
|
28,378
|
|
$
|
26,644
|
|
|
|
Noninterest-bearing deposits
|
$
|
64,768
|
|
$
|
71,005
|
|
$
|
73,886
|
|
$
|
67,869
|
|
$
|
73,721
|
|
|
|
Preferred stock
|
$
|
3,542
|
|
$
|
3,542
|
|
$
|
3,542
|
|
$
|
3,542
|
|
$
|
3,542
|
|
|
|
Total The Bank of New York Mellon Corporation common shareholders’ equity
|
$
|
37,750
|
|
$
|
37,593
|
|
$
|
35,862
|
|
$
|
37,672
|
|
$
|
35,416
|
|
|
|
Other information at period end:
|
||||||||||||||||
|
Cash dividends per common share
|
$
|
0.24
|
|
$
|
0.24
|
|
$
|
0.19
|
|
$
|
0.48
|
|
$
|
0.38
|
|
|
|
Common dividend payout ratio
|
23
|
%
|
22
|
%
|
22
|
%
|
22
|
%
|
22
|
%
|
||||||
|
Common dividend yield
(annualized)
|
1.8
|
%
|
1.9
|
%
|
1.5
|
%
|
1.8
|
%
|
1.5
|
%
|
||||||
|
Closing stock price per common share
|
$
|
53.93
|
|
$
|
51.53
|
|
$
|
51.02
|
|
$
|
53.93
|
|
$
|
51.02
|
|
|
|
Market capitalization
|
$
|
53,927
|
|
$
|
52,080
|
|
$
|
52,712
|
|
$
|
53,927
|
|
$
|
52,712
|
|
|
|
Book value per common share
|
$
|
37.97
|
|
$
|
37.78
|
|
$
|
35.26
|
|
$
|
37.97
|
|
$
|
35.26
|
|
|
|
Tangible book value per common share – Non-GAAP
(a)
|
$
|
19.00
|
|
$
|
18.78
|
|
$
|
17.53
|
|
$
|
19.00
|
|
$
|
17.53
|
|
|
|
Full-time employees
|
52,000
|
|
52,100
|
|
52,800
|
|
52,000
|
|
52,800
|
|
||||||
|
Common shares outstanding
(in thousands)
|
999,945
|
|
1,010,676
|
|
1,033,156
|
|
999,945
|
|
1,033,156
|
|
||||||
2
BNY Mellon
Consolidated Financial Highlights (unaudited)
(continued)
|
Regulatory capital and other ratios
|
June 30, 2018
|
|
March 31, 2018
|
|
Dec. 31, 2017
|
|
|
Average liquidity coverage ratio (“LCR”)
|
118
|
%
|
116
|
%
|
118
|
%
|
|
Regulatory capital ratios:
(f)
|
||||||
|
Advanced:
|
||||||
|
Common equity Tier 1 (“CET1”) ratio
|
11.0
|
%
|
10.7
|
%
|
10.3
|
%
|
|
Tier 1 capital ratio
|
13.1
|
|
12.7
|
|
12.3
|
|
|
Total (Tier 1 plus Tier 2) capital ratio
|
13.8
|
|
13.4
|
|
13.0
|
|
|
Standardized:
|
||||||
|
CET1 ratio
|
11.9
|
%
|
11.7
|
%
|
11.5
|
%
|
|
Tier 1 capital ratio
|
14.1
|
|
14.0
|
|
13.7
|
|
|
Total (Tier 1 plus Tier 2) capital ratio
|
15.1
|
|
14.9
|
|
14.7
|
|
|
Tier 1 leverage ratio
(f)
|
6.7
|
%
|
6.5
|
%
|
6.4
|
%
|
|
Supplementary leverage ratio (“SLR”)
(f)
|
6.1
|
|
5.9
|
|
5.9
|
|
|
BNY Mellon shareholders’ equity to total assets ratio
|
11.8
|
%
|
11.2
|
%
|
11.1
|
%
|
|
BNY Mellon common shareholders’ equity to total assets ratio
|
10.8
|
|
10.2
|
|
10.1
|
|
|
(a)
|
Return on tangible common equity and tangible book value per common share, Non-GAAP measures, exclude goodwill and intangible assets, net of deferred tax liabilities. See “Supplemental information – Explanation of GAAP and Non-GAAP financial measures” beginning on page
40
for the reconciliation of Non-GAAP measures.
|
|
(b)
|
See “Average balances and interest rates” on page
9
for a reconciliation of this Non-GAAP measure.
|
|
(c)
|
Includes the AUC/A of CIBC Mellon Global Securities Services Company (“CIBC Mellon”), a joint venture with the Canadian Imperial Bank of Commerce, of
$1.4 trillion
at
June 30, 2018
,
$1.3 trillion
at
March 31, 2018
and
$1.2 trillion
at
June 30, 2017
.
|
|
(d)
|
Excludes securities lending cash management assets and assets managed in the Investment Services business.
|
|
(e)
|
Represents the total amount of securities on loan in our agency securities lending program managed by the Investment Services business. Excludes securities for which BNY Mellon acts as an agent on behalf of CIBC Mellon clients, which totaled
$70 billion
at
June 30, 2018
,
$73 billion
at
March 31, 2018
and
$66 billion
at
June 30, 2017
.
|
|
(f)
|
For our CET1, Tier 1 capital and Total capital ratios, our effective capital ratios under U.S. capital rules are the lower of the ratios as calculated under the Standardized and Advanced Approaches. The risk-based regulatory capital ratios, Tier 1 leverage ratio and SLR are presented on a fully phased-in basis for Dec. 31, 2017. Beginning Jan. 1, 2018, regulatory ratios are fully phased-in. For additional information on our capital ratios, see “Capital” beginning on page
32
.
|
BNY Mellon
3
|
Part I - Financial Information
|
|
Items 2. and 3. Management’s Discussion and Analysis of Financial Condition and Results of Operations; Quantitative and Qualitative Disclosures about Market Risk
|
General
In this Quarterly Report on Form 10-Q,
references to “our,” “we,” “us,” “BNY Mellon,” the “Company” and similar terms refer to The Bank of New York Mellon Corporation and its consolidated subsidiaries.
The term “Parent” refers to The Bank of New York Mellon Corporation but not its subsidiaries.
Certain business terms used in this report are defined in the Glossary included in our Annual Report on Form 10-K for the year ended Dec. 31, 2017 (“2017 Annual Report”).
The following should be read in conjunction with the Consolidated Financial Statements included in this report.
Investors should also read the section titled “Forward-looking Statements.”
Overview
Established in 1784 by Alexander Hamilton, we were the first company listed on the New York Stock Exchange (NYSE: BK). With a more than 230-year history, BNY Mellon is a global company that manages and services assets for financial institutions, corporations and individual investors in 35 countries.
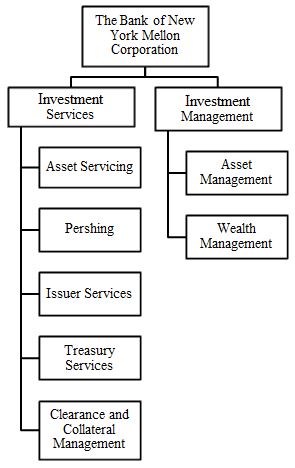
BNY Mellon has two business segments, Investment Services and Investment Management, which offer a comprehensive set of capabilities and deep expertise across the investment lifecycle, enabling the company to provide solutions to buy-side and sell-side market participants, as well as leading institutional and wealth management clients globally.
The diagram below presents our two business segments and lines of business, with the remaining operations in the Other segment.
Key second quarter 2018 and subsequent events
Capital plan, share repurchase program and increase in cash dividend on common stock
In June 2018, BNY Mellon received confirmation that the Federal Reserve did not object to our 2018 capital plan submitted in connection with its Comprehensive Capital Analysis and Review (“CCAR”). Our board of directors subsequently approved the repurchase of up to $2.4 billion of common stock starting in the third quarter of 2018 and continuing through the second quarter of 2019.
Additionally, in July 2018, our board of directors approved a 17% increase in the quarterly cash dividend on common stock, which was also included in our 2018 capital plan, from $0.24 to $0.28 per share. This increased quarterly cash dividend will be paid on Aug. 10, 2018.
Corporate headquarters
In July 2018, BNY Mellon relocated its corporate headquarters to 240 Greenwich Street in lower Manhattan.
4
BNY Mellon
Highlights of second quarter 2018 results
We reported net income applicable to common shareholders of
$1.06 billion
, or
$1.03
per diluted common share, in the
second quarter of 2018
. Net income applicable to common shareholders was
$926 million
, or
$0.88
per diluted common share, in the
second quarter of 2017
.
The highlights below are based on the
second quarter of 2018
compared with the
second quarter of 2017
, unless otherwise noted.
|
•
|
Total revenue of
$4.1 billion
increased
5%
primarily reflecting:
|
|
•
|
Fee revenue increased
3%
primarily reflecting higher equity market values, the favorable impact of a weaker U.S. dollar, higher foreign exchange revenue and growth in collateral management, partially offset by lease-related gains recorded in the second quarter of 2017. (See “Fee and other revenue” beginning on page
6
.)
|
|
•
|
Net interest revenue increased
11%
primarily driven by higher rates. (See “Net interest revenue” on page
8
.)
|
|
•
|
Noninterest expense of
$2.7 billion
increased
3%
primarily reflecting investments in technology, expenses associated with the continued consolidation of our real estate and the unfavorable impact of a weaker U.S. dollar, partially offset by decreases in other expenses. (See “Noninterest expense” beginning on page
11
.)
|
|
•
|
Effective tax rate of
20.5%
. (See “Income taxes” on page
11
.)
|
Capital and liquidity
|
•
|
CET1 ratio under the Advanced Approach was
11.0%
at
June 30, 2018
and
10.7%
at
March 31, 2018
. The increase primarily reflects capital generated through earnings and lower risk-weighted assets, partially offset by capital deployed through common stock repurchases and payments of dividends, as well as foreign currency translation adjustments. (See “Capital” beginning on page
32
.)
|
|
•
|
Repurchased
12 million
common shares for
$651 million
and paid $244 million in dividends to common shareholders.
|
Highlights of our principal businesses
Investment Services
|
•
|
Total revenue increased
8%
.
|
|
•
|
Income before taxes increased
20%
.
|
|
•
|
Record AUC/A of
$33.6 trillion
, up
8%
, reflecting higher market values and business growth.
|
Investment Management
|
•
|
Total revenue increased
3%
.
|
|
•
|
Income before taxes increased
11%
.
|
|
•
|
AUM of
$1.8 trillion
increased
2%
primarily reflecting higher market values and the favorable impact of a weaker U.S. dollar (principally versus the British pound), partially offset by the divestiture of CenterSquare Investment Management (“CenterSquare”), net outflows and other changes.
|
See “Review of businesses” and Note 19 for additional information on our businesses.
BNY Mellon
5
Fee and other revenue
|
Fee and other revenue
|
YTD18
|
|
||||||||||||||||||||
|
2Q18 vs.
|
vs.
|
|||||||||||||||||||||
|
(dollars in millions, unless otherwise noted)
|
2Q18
|
|
1Q18
|
|
2Q17
|
|
1Q18
|
|
2Q17
|
|
YTD18
|
|
YTD17
|
|
YTD17
|
|
||||||
|
Investment services fees:
|
||||||||||||||||||||||
|
Asset servicing
(a)
|
$
|
1,157
|
|
$
|
1,168
|
|
$
|
1,085
|
|
(1
|
)%
|
7
|
%
|
$
|
2,325
|
|
$
|
2,148
|
|
8
|
%
|
|
|
Clearing services
|
392
|
|
414
|
|
394
|
|
(5
|
)
|
(1
|
)
|
806
|
|
770
|
|
5
|
|
||||||
|
Issuer services
|
266
|
|
260
|
|
241
|
|
2
|
|
10
|
|
526
|
|
492
|
|
7
|
|
||||||
|
Treasury services
|
140
|
|
138
|
|
140
|
|
1
|
|
—
|
|
278
|
|
279
|
|
—
|
|
||||||
|
Total investment services fees
|
1,955
|
|
1,980
|
|
1,860
|
|
(1
|
)
|
5
|
|
3,935
|
|
3,689
|
|
7
|
|
||||||
|
Investment management and performance fees
|
910
|
|
960
|
|
879
|
|
(5
|
)
|
4
|
|
1,870
|
|
1,721
|
|
9
|
|
||||||
|
Foreign exchange and other trading revenue
|
187
|
|
209
|
|
165
|
|
(11
|
)
|
13
|
|
396
|
|
329
|
|
20
|
|
||||||
|
Financing-related fees
|
53
|
|
52
|
|
53
|
|
2
|
|
—
|
|
105
|
|
108
|
|
(3
|
)
|
||||||
|
Distribution and servicing
|
34
|
|
36
|
|
41
|
|
(6
|
)
|
(17
|
)
|
70
|
|
82
|
|
(15
|
)
|
||||||
|
Investment and other income
|
70
|
|
82
|
|
122
|
|
N/M
|
N/M
|
152
|
|
199
|
|
N/M
|
|||||||||
|
Total fee revenue
|
3,209
|
|
3,319
|
|
3,120
|
|
(3
|
)
|
3
|
|
6,528
|
|
6,128
|
|
7
|
|
||||||
|
Net securities gains (losses)
|
1
|
|
(49
|
)
|
—
|
|
N/M
|
N/M
|
(48
|
)
|
10
|
|
N/M
|
|||||||||
|
Total fee and other revenue
|
$
|
3,210
|
|
$
|
3,270
|
|
$
|
3,120
|
|
(2
|
)%
|
3
|
%
|
$
|
6,480
|
|
$
|
6,138
|
|
6
|
%
|
|
|
Fee revenue as a percentage of total revenue
|
78
|
%
|
79
|
%
|
79
|
%
|
78
|
%
|
79
|
%
|
||||||||||||
|
AUM at period end
(in billions) (b)
|
$
|
1,805
|
|
$
|
1,868
|
|
$
|
1,771
|
|
(3
|
)%
|
2
|
%
|
$
|
1,805
|
|
$
|
1,771
|
|
2
|
%
|
|
|
AUC/A at period end
(in trillions) (c)
|
$
|
33.6
|
|
$
|
33.5
|
|
$
|
31.1
|
|
—
|
%
|
8
|
%
|
$
|
33.6
|
|
$
|
31.1
|
|
8
|
%
|
|
|
(a)
|
Asset servicing fees include securities lending revenue of
$60 million
in the
second quarter of 2018
,
$55 million
in the
first quarter of 2018
,
$48 million
in the
second quarter of 2017
,
$115 million
in the
first six months of 2018
and
$97 million
in the
first six months of 2017
.
|
|
(b)
|
Excludes securities lending cash management assets and assets managed in the Investment Services business.
|
|
(c)
|
Includes the AUC/A of CIBC Mellon of
$1.4 trillion
at
June 30, 2018
,
$1.3 trillion
at
March 31, 2018
and
$1.2 trillion
at
June 30, 2017
.
|
N/M - Not meaningful.
Fee and other revenue increased
3%
compared with the
second quarter of 2017
and decreased
2%
(unannualized) compared with the
first quarter of 2018
.
The increase compared with the second quarter of 2017 primarily reflects higher asset servicing fees, investment management and performance fees, issuer services fees and foreign currency and other trading revenue, partially offset by lower investment and other income. The decrease compared with the first quarter of 2018 primarily reflects lower investment management and performance fees, clearing services and foreign exchange and other trading revenue, partially offset by net securities losses recorded in the first quarter of 2018.
Investment services fees
Investment services fees were impacted by the following compared with the
second quarter of 2017
and the
first quarter of 2018
:
|
•
|
Asset servicing fees increased
7%
compared with the
second quarter of 2017
and decreased
1%
(unannualized) compared with the
first quarter of 2018
. The increase compared with the second
|
quarter of 2017 primarily reflects growth in collateral management, higher securities lending volume and equity market values as well as the favorable impact of a weaker U.S. dollar.
|
•
|
Clearing services fees decreased
1%
compared with the
second quarter of 2017
and
5%
(unannualized) compared with the
first quarter of 2018
. The decrease compared with the second quarter of 2017 was primarily driven by the impact of the previously disclosed lost business, partially offset by growth in long-term mutual fund balances. The decrease compared with the first quarter of 2018 primarily reflects lower clearance revenue.
|
|
•
|
Issuer services fees increased
10%
compared with the
second quarter of 2017
and
2%
(unannualized) compared with the
first quarter of 2018
. Both increases primarily reflect
higher Depository Receipts revenue.
|
|
•
|
Treasury services fees were unchanged compared with the
second quarter of 2017
and increased
1%
(unannualized) compared with the
first quarter of 2018
. Both comparisons reflect
higher payment volumes partially offset by higher compensating
|
6
BNY Mellon
balance credits provided to clients, which reduce fee revenue and increase net interest revenue.
See the “Investment Services business” in “Review of businesses” for additional details.
Investment management and performance fees
Investment management and performance fees increased
4%
compared with the
second quarter of 2017
and decreased
5%
(unannualized) compared with the
first quarter of 2018
. On a constant currency basis (Non-GAAP), investment management and performance fees increased 1% compared with the
second quarter of 2017
. Performance fees were
$12 million
in the
second quarter of 2018
,
$17 million
in the
second quarter of 2017
and
$48 million
in the
first quarter of 2018
.
AUM was
$1.8 trillion
, an increase of
2%
compared with
June 30, 2017
and a decrease of
3%
compared with
March 31, 2018
. See the “Investment Management business” in “Review of businesses” for additional details regarding the drivers of investment management and performance fees, AUM and AUM flows.
Foreign exchange and other trading revenue
|
Foreign exchange and other trading revenue
|
|||||||||||||||
|
(in millions)
|
2Q18
|
|
1Q18
|
|
2Q17
|
|
YTD18
|
|
YTD17
|
|
|||||
|
Foreign exchange
|
$
|
171
|
|
$
|
183
|
|
$
|
151
|
|
$
|
354
|
|
$
|
305
|
|
|
Other trading revenue
|
16
|
|
26
|
|
14
|
|
42
|
|
24
|
|
|||||
|
Total foreign exchange and other trading revenue
|
$
|
187
|
|
$
|
209
|
|
$
|
165
|
|
$
|
396
|
|
$
|
329
|
|
Foreign exchange revenue is primarily driven by the volume of client transactions and the spread realized on these transactions, both of which are impacted by market volatility, and the impact of foreign currency hedging activities. Foreign exchange revenue increased
13%
compared with the
second quarter of 2017
and decreased
7%
(unannualized) compared with the
first quarter of 2018
. The increase compared with
second quarter of 2017
primarily reflects higher volumes. The decrease compared with the
first quarter of 2018
primarily reflects lower gains on foreign currency hedging activities and lower volatility. Foreign exchange revenue is primarily reported in the Investment Services business and, to a
lesser extent, the Investment Management business and the Other segment.
Distribution and servicing fees
The decrease in distribution and servicing fees compared with the
second quarter of 2017
primarily reflects lower fees from money market funds.
Investment and other income
The following table provides the components of investment and other income.
|
Investment and other income
|
|||||||||||||||
|
(in millions)
|
2Q18
|
|
1Q18
|
|
2Q17
|
|
YTD18
|
|
YTD17
|
|
|||||
|
Corporate/bank-owned life insurance
|
$
|
31
|
|
$
|
36
|
|
$
|
43
|
|
$
|
67
|
|
$
|
73
|
|
|
Asset-related gains (losses)
|
15
|
|
46
|
|
(5
|
)
|
61
|
|
(2
|
)
|
|||||
|
Expense reimbursements from joint venture
|
19
|
|
16
|
|
17
|
|
35
|
|
31
|
|
|||||
|
Seed capital gains
(a)
|
3
|
|
—
|
|
10
|
|
3
|
|
19
|
|
|||||
|
Equity investment income
|
2
|
|
—
|
|
7
|
|
2
|
|
33
|
|
|||||
|
Lease-related gains
|
—
|
|
—
|
|
51
|
|
—
|
|
52
|
|
|||||
|
Other income (loss)
|
—
|
|
(16
|
)
|
(1
|
)
|
(16
|
)
|
(7
|
)
|
|||||
|
Total investment and other income
|
$
|
70
|
|
$
|
82
|
|
$
|
122
|
|
$
|
152
|
|
$
|
199
|
|
|
(a)
|
Excludes seed capital gains related to consolidated investment management funds, which are reflected in operations of consolidated investment management funds.
|
Investment and other income decreased compared with both the
second quarter of 2017
and
first quarter of 2018
. The decrease compared with the
second quarter of 2017
primarily reflects lease-related gains recorded in the second quarter of 2017, lower income from corporate/bank-owned life insurance and losses on increased investments in renewable energy, partially offset by foreign currency translation gains. Pre-tax losses on our renewable energy investments are offset by corresponding tax benefits and credits. The decrease compared with the
first quarter of 2018
primarily reflects lower asset-related gains, partially offset by higher other income driven by foreign currency translation gains.
Year-to-date 2018 compared with year-to-date 2017
Fee and other revenue increased
6%
in the
first six months of 2018
, compared with the
first six months of 2017
, primarily reflecting higher asset servicing fees, investment management and performance fees, foreign exchange and other trading revenue, partially
BNY Mellon
7
offset by net securities losses and lower investment and other income. The
8%
increase in asset servicing fees primarily reflects higher equity market values, the favorable impact of a weaker U.S. dollar and higher securities lending volume. The
9%
increase in investment management and performance fees primarily reflects higher equity market values, the favorable impact of a weaker U.S. dollar (principally versus the British pound) and higher performance fees. The
20%
increase in foreign exchange and
other trading revenue primarily reflects higher volumes. Net securities losses primarily reflect losses recorded in the first quarter of 2018 related to the sale of debt securities. The decrease in investment and other income primarily reflects lease-related gains and a net gain related to an equity investment, both recorded in the first six months of 2017, and lower other income due in part to our investments in renewable energy, partially offset by an increase in asset-related gains.
Net interest revenue
|
Net interest revenue
|
YTD18
|
|
||||||||||||||||||||
|
2Q18 vs.
|
vs.
|
|||||||||||||||||||||
|
(dollars in millions)
|
2Q18
|
|
1Q18
|
|
2Q17
|
|
1Q18
|
|
2Q17
|
|
YTD18
|
|
YTD17
|
|
YTD17
|
|
||||||
|
Net interest revenue
|
$
|
916
|
|
$
|
919
|
|
$
|
826
|
|
—
|
|
11
|
%
|
$
|
1,835
|
|
$
|
1,618
|
|
13
|
%
|
|
|
Add: Tax equivalent adjustment
|
5
|
|
6
|
|
12
|
|
N/M
|
N/M
|
11
|
|
24
|
|
N/M
|
|||||||||
|
Net interest revenue (FTE) – Non-GAAP
(a)
|
$
|
921
|
|
$
|
925
|
|
$
|
838
|
|
—
|
|
10
|
%
|
$
|
1,846
|
|
$
|
1,642
|
|
12
|
%
|
|
|
Average interest-earning assets
|
$
|
292,086
|
|
$
|
302,069
|
|
$
|
289,496
|
|
(3
|
)%
|
1
|
%
|
$
|
297,050
|
|
$
|
286,475
|
|
4
|
%
|
|
|
Net interest margin
|
1.26
|
%
|
1.22
|
%
|
1.14
|
%
|
4
|
bps
|
12
|
bps
|
1.24
|
%
|
1.14
|
%
|
10
|
bps
|
||||||
|
Net interest margin (FTE) – Non-GAAP
(a)
|
1.26
|
%
|
1.23
|
%
|
1.16
|
%
|
3
|
bps
|
10
|
bps
|
1.25
|
%
|
1.15
|
%
|
10
|
bps
|
||||||
|
(a)
|
Net interest revenue (FTE) – Non-GAAP and net interest margin (FTE) – Non-GAAP include the tax equivalent adjustments on tax-exempt income which allows for comparisons of amounts arising from both taxable and tax-exempt sources and is consistent with industry practice. The adjustment to an FTE basis has no impact on net income.
|
N/M - Not meaningful.
bps - basis points.
Net interest revenue increased
11%
compared with the
second quarter of 2017
and decreased less than 1% (unannualized) compared with the
first quarter of 2018
. The increase compared with the
second quarter of 2017
primarily reflects higher interest rates. The decrease compared with the
first quarter of 2018
was primarily driven by a lower level of deposits, partially offset by higher interest rates.
Net interest margin increased
12 basis points
compared with the
second quarter of 2017
and
4 basis points
compared with the
first quarter of 2018
. Both increases primarily reflect higher interest rates.
Average non-U.S. dollar deposits comprised approximately
30%
of our average total deposits in the
second quarter of 2018
.
Approximately 40% of the average non-U.S. dollar deposits in the second quarter of 2018 were euro-denominated.
Year-to-date 2018 compared with year-to-date 2017
Net interest revenue increased
13%
in the
first six months of 2018
compared with the
first six months of 2017
, primarily driven by higher interest rates and interest-earning assets. The increase in the net interest margin was primarily driven by the factors listed above.
8
BNY Mellon
|
Average balances and interest rates
|
Quarter ended
|
|||||||||||||||||||||||||
|
June 30, 2018
|
March 31, 2018
|
June 30, 2017
|
||||||||||||||||||||||||
|
(dollars in millions, presented on an FTE basis)
|
Average
balance
|
|
Interest
|
|
Average
rates
|
|
Average
balance
|
|
Interest
|
|
Average
rates
|
|
Average balance
|
|
Interest
|
|
Average rates
|
|
||||||||
|
Assets
|
||||||||||||||||||||||||||
|
Interest-earning assets:
|
||||||||||||||||||||||||||
|
Interest-bearing deposits with banks (primarily foreign banks)
|
$
|
15,748
|
|
$
|
56
|
|
1.41
|
%
|
$
|
13,850
|
|
$
|
42
|
|
1.25
|
%
|
$
|
14,832
|
|
$
|
27
|
|
0.73
|
%
|
||
|
Interest-bearing deposits held at the Federal Reserve and other central banks
|
69,676
|
|
136
|
|
0.77
|
|
79,068
|
|
126
|
|
0.64
|
|
69,316
|
|
71
|
|
0.41
|
|
||||||||
|
Federal funds sold and securities purchased under resale agreements
(a)
|
28,051
|
|
230
|
|
3.29
|
|
27,903
|
|
170
|
|
2.47
|
|
26,873
|
|
86
|
|
1.29
|
|
||||||||
|
Margin loans
|
14,838
|
|
128
|
|
3.46
|
|
15,674
|
|
115
|
|
2.98
|
|
15,058
|
|
87
|
|
2.32
|
|
||||||||
|
Non-margin loans:
|
||||||||||||||||||||||||||
|
Domestic offices
|
29,970
|
|
257
|
|
3.44
|
|
30,415
|
|
228
|
|
3.02
|
|
30,734
|
|
207
|
|
2.70
|
|
||||||||
|
Foreign offices
|
12,258
|
|
88
|
|
2.87
|
|
12,517
|
|
77
|
|
2.51
|
|
13,001
|
|
65
|
|
1.99
|
|
||||||||
|
Total non-margin loans
|
42,228
|
|
345
|
|
3.27
|
|
42,932
|
|
305
|
|
2.87
|
|
43,735
|
|
272
|
|
2.49
|
|
||||||||
|
Securities:
|
||||||||||||||||||||||||||
|
U.S. Government obligations
|
23,199
|
|
116
|
|
2.02
|
|
23,460
|
|
109
|
|
1.88
|
|
25,928
|
|
106
|
|
1.64
|
|
||||||||
|
U.S. Government agency obligations
|
63,022
|
|
374
|
|
2.37
|
|
62,975
|
|
350
|
|
2.23
|
|
59,533
|
|
290
|
|
1.95
|
|
||||||||
|
State and political subdivisions – tax-exempt
(b)
|
2,677
|
|
18
|
|
2.75
|
|
2,875
|
|
19
|
|
2.62
|
|
3,298
|
|
26
|
|
3.09
|
|
||||||||
|
Other securities
|
28,863
|
|
126
|
|
1.75
|
|
29,149
|
|
123
|
|
1.69
|
|
28,468
|
|
81
|
|
1.15
|
|
||||||||
|
Trading securities
(b)
|
3,784
|
|
29
|
|
3.10
|
|
4,183
|
|
28
|
|
2.62
|
|
2,455
|
|
18
|
|
2.85
|
|
||||||||
|
Total securities
|
121,545
|
|
663
|
|
2.19
|
|
122,642
|
|
629
|
|
2.05
|
|
119,682
|
|
521
|
|
1.74
|
|
||||||||
|
Total interest-earning assets
(b)
|
$
|
292,086
|
|
$
|
1,558
|
|
2.14
|
%
|
$
|
302,069
|
|
$
|
1,387
|
|
1.85
|
%
|
$
|
289,496
|
|
$
|
1,064
|
|
1.47
|
%
|
||
|
Noninterest-earnings assets
|
54,242
|
|
56,106
|
|
53,019
|
|
||||||||||||||||||||
|
Total assets
|
$
|
346,328
|
|
$
|
358,175
|
|
$
|
342,515
|
|
|||||||||||||||||
|
Liabilities
|
||||||||||||||||||||||||||
|
Interest-bearing liabilities:
|
||||||||||||||||||||||||||
|
Interest-bearing deposits:
|
||||||||||||||||||||||||||
|
Domestic offices
|
$
|
54,200
|
|
$
|
105
|
|
0.78
|
%
|
$
|
51,612
|
|
$
|
71
|
|
0.55
|
%
|
$
|
48,809
|
|
$
|
20
|
|
0.17
|
%
|
||
|
Foreign offices
|
98,599
|
|
68
|
|
0.28
|
|
104,092
|
|
46
|
|
0.18
|
|
93,527
|
|
12
|
|
0.05
|
|
||||||||
|
Total interest-bearing deposits
|
152,799
|
|
173
|
|
0.45
|
|
155,704
|
|
117
|
|
0.30
|
|
142,336
|
|
32
|
|
0.09
|
|
||||||||
|
Federal funds purchased and securities sold under repurchase agreements
(a)
|
18,146
|
|
158
|
|
3.48
|
|
18,963
|
|
107
|
|
2.29
|
|
17,970
|
|
38
|
|
0.84
|
|
||||||||
|
Trading liabilities
|
1,198
|
|
7
|
|
2.43
|
|
1,569
|
|
9
|
|
2.26
|
|
1,216
|
|
2
|
|
0.61
|
|
||||||||
|
Other borrowed funds
|
2,399
|
|
14
|
|
2.40
|
|
2,119
|
|
9
|
|
1.67
|
|
1,193
|
|
4
|
|
1.24
|
|
||||||||
|
Commercial paper
|
3,869
|
|
21
|
|
2.13
|
|
3,131
|
|
12
|
|
1.59
|
|
2,215
|
|
5
|
|
0.95
|
|
||||||||
|
Payables to customers and broker-dealers
|
16,349
|
|
45
|
|
1.10
|
|
17,101
|
|
31
|
|
0.75
|
|
20,609
|
|
16
|
|
0.30
|
|
||||||||
|
Long-term debt
|
28,349
|
|
219
|
|
3.06
|
|
28,407
|
|
177
|
|
2.49
|
|
27,398
|
|
129
|
|
1.87
|
|
||||||||
|
Total interest-bearing liabilities
|
$
|
223,109
|
|
$
|
637
|
|
1.14
|
%
|
$
|
226,994
|
|
$
|
462
|
|
0.82
|
%
|
$
|
212,937
|
|
$
|
226
|
|
0.42
|
%
|
||
|
Total noninterest-bearing deposits
|
64,768
|
|
71,005
|
|
73,886
|
|
||||||||||||||||||||
|
Other noninterest-bearing liabilities
|
16,857
|
|
18,571
|
|
15,656
|
|
||||||||||||||||||||
|
Total liabilities
|
304,734
|
|
316,570
|
|
302,479
|
|
||||||||||||||||||||
|
Temporary equity
|
||||||||||||||||||||||||||
|
Redeemable noncontrolling interests
|
184
|
|
193
|
|
172
|
|
||||||||||||||||||||
|
Permanent equity
|
||||||||||||||||||||||||||
|
Total The Bank of New York Mellon Corporation shareholders’ equity
|
41,292
|
|
41,135
|
|
39,404
|
|
||||||||||||||||||||
|
Noncontrolling interests
|
118
|
|
277
|
|
460
|
|
||||||||||||||||||||
|
Total permanent equity
|
41,410
|
|
41,412
|
|
39,864
|
|
||||||||||||||||||||
|
Total liabilities, temporary equity and permanent equity
|
$
|
346,328
|
|
$
|
358,175
|
|
$
|
342,515
|
|
|||||||||||||||||
|
Net interest revenue (FTE) – Non-GAAP
|
$
|
921
|
|
$
|
925
|
|
$
|
838
|
|
|||||||||||||||||
|
Net interest margin (FTE) – Non-GAAP
|
1.26
|
%
|
1.23
|
%
|
1.16
|
%
|
||||||||||||||||||||
|
Less: Tax equivalent adjustment
(c)
|
5
|
|
6
|
|
12
|
|
||||||||||||||||||||
|
Net interest revenue – GAAP
|
$
|
916
|
|
$
|
919
|
|
$
|
826
|
|
|||||||||||||||||
|
Net interest margin – GAAP
|
1.26
|
%
|
1.22
|
%
|
1.14
|
%
|
||||||||||||||||||||
|
(a)
|
Includes the impact of offsetting under enforceable netting agreements of approximately
$18 billion
for the
second quarter of 2018
,
$14 billion
for the
first quarter of 2018
and
$1 billion
for the
second quarter of 2017
.
|
|
(b)
|
Interest income and average yields are presented on an FTE basis (Non-GAAP).
|
|
(c)
|
The tax equivalent adjustment relates to tax-exempt securities, primarily state and political subdivisions, and is based on the federal statutory tax rate of 21% for the quarters in 2018 and 35% for the quarter in 2017, adjusted for applicable state income taxes, net of the related federal tax benefit.
|
BNY Mellon
9
|
Average balances and interest rates
|
Year-to-date
|
||||||||||||||||
|
June 30, 2018
|
June 30, 2017
|
||||||||||||||||
|
(dollars in millions, presented on an FTE basis)
|
Average balance
|
|
Interest
|
|
Average rates
|
|
Average balance
|
|
Interest
|
|
Average rates
|
|
|||||
|
Assets
|
|||||||||||||||||
|
Interest-earning assets:
|
|||||||||||||||||
|
Interest-bearing deposits with banks (primarily foreign banks)
|
$
|
14,804
|
|
$
|
98
|
|
1.33
|
%
|
$
|
14,773
|
|
$
|
49
|
|
0.66
|
%
|
|
|
Interest-bearing deposits held at the Federal Reserve and other central banks
|
74,346
|
|
262
|
|
0.70
|
|
67,689
|
|
128
|
|
0.38
|
|
|||||
|
Federal funds sold and securities purchased under resale agreements
(a)
|
27,978
|
|
400
|
|
2.88
|
|
26,097
|
|
153
|
|
1.18
|
|
|||||
|
Margin loans
|
15,254
|
|
243
|
|
3.21
|
|
15,403
|
|
162
|
|
2.12
|
|
|||||
|
Non-margin loans:
|
|||||||||||||||||
|
Domestic offices
|
30,191
|
|
485
|
|
3.23
|
|
30,848
|
|
395
|
|
2.57
|
|
|||||
|
Foreign offices
|
12,387
|
|
165
|
|
2.68
|
|
13,297
|
|
122
|
|
1.85
|
|
|||||
|
Total non-margin loans
|
42,578
|
|
650
|
|
3.07
|
|
44,145
|
|
517
|
|
2.35
|
|
|||||
|
Securities:
|
|||||||||||||||||
|
U.S. Government obligations
|
23,329
|
|
225
|
|
1.95
|
|
26,083
|
|
210
|
|
1.62
|
|
|||||
|
U.S. Government agency obligations
|
62,998
|
|
724
|
|
2.30
|
|
58,202
|
|
561
|
|
1.93
|
|
|||||
|
State and political subdivisions – tax-exempt
(b)
|
2,776
|
|
37
|
|
2.68
|
|
3,335
|
|
52
|
|
3.10
|
|
|||||
|
Other securities
|
29,005
|
|
249
|
|
1.72
|
|
28,393
|
|
169
|
|
1.20
|
|
|||||
|
Trading securities
(b)
|
3,982
|
|
57
|
|
2.85
|
|
2,355
|
|
35
|
|
2.98
|
|
|||||
|
Total securities
|
122,090
|
|
1,292
|
|
2.12
|
|
118,368
|
|
1,027
|
|
1.74
|
|
|||||
|
Total interest-earning assets
(b)
|
$
|
297,050
|
|
$
|
2,945
|
|
1.99
|
%
|
$
|
286,475
|
|
$
|
2,036
|
|
1.43
|
%
|
|
|
Noninterest-earnings assets
|
55,169
|
|
52,900
|
|
|||||||||||||
|
Total assets
|
$
|
352,219
|
|
$
|
339,375
|
|
|||||||||||
|
Liabilities
|
|||||||||||||||||
|
Interest-bearing liabilities:
|
|||||||||||||||||
|
Interest-bearing deposits:
|
|||||||||||||||||
|
Domestic offices
|
$
|
52,914
|
|
$
|
176
|
|
0.67
|
%
|
$
|
49,104
|
|
$
|
35
|
|
0.14
|
%
|
|
|
Foreign offices
|
101,330
|
|
114
|
|
0.23
|
|
91,980
|
|
6
|
|
0.01
|
|
|||||
|
Total interest-bearing deposits
|
154,244
|
|
290
|
|
0.38
|
|
141,084
|
|
41
|
|
0.06
|
|
|||||
|
Federal funds purchased and securities sold under repurchase agreements
(a)
|
18,552
|
|
265
|
|
2.88
|
|
18,480
|
|
62
|
|
0.67
|
|
|||||
|
Trading liabilities
|
1,382
|
|
16
|
|
2.33
|
|
1,063
|
|
4
|
|
0.73
|
|
|||||
|
Other borrowed funds
|
2,260
|
|
23
|
|
2.06
|
|
1,009
|
|
6
|
|
1.13
|
|
|||||
|
Commercial paper
|
3,502
|
|
33
|
|
1.89
|
|
2,190
|
|
10
|
|
0.91
|
|
|||||
|
Payables to customers and broker-dealers
|
16,723
|
|
76
|
|
0.92
|
|
19,789
|
|
23
|
|
0.23
|
|
|||||
|
Long-term debt
|
28,378
|
|
396
|
|
2.78
|
|
26,644
|
|
248
|
|
1.86
|
|
|||||
|
Total interest-bearing liabilities
|
$
|
225,041
|
|
$
|
1,099
|
|
0.98
|
%
|
$
|
210,259
|
|
$
|
394
|
|
0.38
|
%
|
|
|
Total noninterest-bearing deposits
|
67,869
|
|
73,721
|
|
|||||||||||||
|
Other noninterest-bearing liabilities
|
17,710
|
|
15,750
|
|
|||||||||||||
|
Total liabilities
|
310,620
|
|
299,730
|
|
|||||||||||||
|
Temporary equity
|
|||||||||||||||||
|
Redeemable noncontrolling interests
|
188
|
|
167
|
|
|||||||||||||
|
Permanent equity
|
|||||||||||||||||
|
Total The Bank of New York Mellon Corporation shareholders’ equity
|
41,214
|
|
38,958
|
|
|||||||||||||
|
Noncontrolling interests
|
197
|
|
520
|
|
|||||||||||||
|
Total permanent equity
|
41,411
|
|
39,478
|
|
|||||||||||||
|
Total liabilities, temporary equity and permanent equity
|
$
|
352,219
|
|
$
|
339,375
|
|
|||||||||||
|
Net interest revenue (FTE) – Non-GAAP
|
$
|
1,846
|
|
$
|
1,642
|
|
|||||||||||
|
Net interest margin (FTE) – Non-GAAP
|
1.25
|
%
|
1.15
|
%
|
|||||||||||||
|
Less: Tax equivalent adjustment
(c)
|
11
|
|
24
|
|
|||||||||||||
|
Net interest revenue – GAAP
|
$
|
1,835
|
|
$
|
1,618
|
|
|||||||||||
|
Net interest margin – GAAP
|
1.24
|
%
|
1.14
|
%
|
|||||||||||||
|
(a)
|
Includes the impact of offsetting under enforceable netting agreements of approximately
$16 billion
for the
first six months of 2018
and
$1 billion
for the
first six months of 2017
.
|
|
(b)
|
Interest income and average yields are presented on an FTE basis (Non-GAAP).
|
|
(c)
|
The tax equivalent adjustment relates to tax-exempt securities, primarily state and political subdivisions, and is based on the federal statutory tax rate of 21% for year-to-date 2018 and 35% for year-to-date 2017, adjusted for applicable state income taxes, net of the related federal tax benefit.
|
10
BNY Mellon
Noninterest expense
|
Noninterest expense
|
YTD18
|
|
||||||||||||||||||||
|
2Q18 vs.
|
vs.
|
|||||||||||||||||||||
|
(dollars in millions)
|
2Q18
|
|
1Q18
|
|
2Q17
|
|
1Q18
|
|
2Q17
|
|
YTD18
|
|
YTD17
|
|
YTD17
|
|
||||||
|
Staff
(a)
|
$
|
1,489
|
|
$
|
1,576
|
|
$
|
1,432
|
|
(6
|
)%
|
4
|
%
|
$
|
3,065
|
|
$
|
2,920
|
|
5
|
%
|
|
|
Professional, legal and other purchased services
|
328
|
|
291
|
|
319
|
|
13
|
|
3
|
|
619
|
|
632
|
|
(2
|
)
|
||||||
|
Software
|
192
|
|
173
|
|
173
|
|
11
|
|
11
|
|
365
|
|
339
|
|
8
|
|
||||||
|
Net occupancy
|
156
|
|
139
|
|
140
|
|
12
|
|
11
|
|
295
|
|
276
|
|
7
|
|
||||||
|
Sub-custodian and clearing
(b)
|
110
|
|
119
|
|
108
|
|
(8
|
)
|
2
|
|
229
|
|
211
|
|
9
|
|
||||||
|
Distribution and servicing
|
106
|
|
106
|
|
104
|
|
—
|
|
2
|
|
212
|
|
204
|
|
4
|
|
||||||
|
Furniture and equipment
|
74
|
|
61
|
|
59
|
|
21
|
|
25
|
|
135
|
|
116
|
|
16
|
|
||||||
|
Business development
|
62
|
|
51
|
|
63
|
|
22
|
|
(2
|
)
|
113
|
|
114
|
|
(1
|
)
|
||||||
|
Bank assessment charges
|
47
|
|
52
|
|
59
|
|
(10
|
)
|
(20
|
)
|
99
|
|
116
|
|
(15
|
)
|
||||||
|
Amortization of intangible assets
|
48
|
|
49
|
|
53
|
|
(2
|
)
|
(9
|
)
|
97
|
|
105
|
|
(8
|
)
|
||||||
|
Other
(a)(b)(c)
|
135
|
|
122
|
|
145
|
|
11
|
|
(7
|
)
|
257
|
|
264
|
|
(3
|
)
|
||||||
|
Total noninterest expense
|
$
|
2,747
|
|
$
|
2,739
|
|
$
|
2,655
|
|
—
|
%
|
3
|
%
|
$
|
5,486
|
|
$
|
5,297
|
|
4
|
%
|
|
|
|
|
|
||||||||||||||||||||
|
Full-time employees at period end
|
52,000
|
|
52,100
|
|
52,800
|
|
—
|
%
|
(2
|
)%
|
|
|
||||||||||
|
(a)
|
In the first quarter of 2018, we adopted new accounting guidance included in Accounting Standards Update (“ASU”) 2017-07, Compensation-Retirement Benefits: Improving the Presentation of Net Periodic Pension Cost and Net Periodic Postretirement Benefit Cost, which required the reclassification of the components of pension and other postretirement costs, other than the service cost component. As a result, staff expense increased and other expense decreased. Prior periods have been reclassified. For additional information, see Note 2 of the Notes to Consolidated Financial Statements.
|
|
(b)
|
Beginning in the first quarter of 2018, clearing expense, which was previously included in other expense, was included with sub-custodian expense. Prior periods were reclassified.
|
|
(c)
|
Beginning in the first quarter of 2018, merger and integration (“M&I”), litigation and restructuring charges are no longer separately disclosed. Expenses previously reported in this line have been reclassified to existing expense categories, primarily other expense.
|
Total noninterest expense increased
3%
compared with the
second quarter of 2017
and increased slightly compared with the
first quarter of 2018
. The increase compared with the
second quarter of 2017
primarily reflects investments in technology, which impacted staff, professional, legal and other purchased services, software and furniture and equipment expenses. The increase also reflects the unfavorable impact of a weaker U.S. dollar and expenses associated with the continued consolidation of our real estate, partially offset by decreases in other expense categories. The increase compared with the
first quarter of 2018
primarily reflects investments in technology and expenses associated with the continued consolidation of our real estate. These expenses were partially offset by lower staff expense, primarily driven by the impact of vesting of long-term stock awards for retirement eligible employees recorded in the first quarter of 2018, and the favorable impact of a stronger U.S. dollar.
We expect to continue to incur additional expenses as we invest in our technology infrastructure and platforms. We also expect to incur expenses related to relocating our corporate headquarters, which is estimated to total $75 million, of which $12 million was recorded in the second quarter of 2018. We
expect the remaining expenses related to relocating our corporate headquarters to be recorded in the fourth quarter of 2018.
Year-to-date 2018 compared with year-to-date 2017
Noninterest expense increased
4%
compared with the
first six months of 2017
. The increase primarily reflects investments in technology, the unfavorable impact of a weaker U.S. dollar, expenses associated with the continued consolidation of our real estate and higher volume-related sub-custodian and clearing expenses, partially offset by lower consulting expense and decreases in other expenses.
Income taxes
BNY Mellon recorded an income tax provision of
$286 million
(
20.5%
effective tax rate) in the
second quarter of 2018
,
$332 million
(
25.4%
effective tax rate) in the
second quarter of 2017
and
$282 million
(
19.5%
effective tax rate) in the
first quarter of 2018
. The lower effective tax rate in the second quarter of 2018 compared with the second quarter of 2017 reflects the decrease in the federal statutory tax rate resulting from U.S. tax legislation.
For additional
BNY Mellon
11
information, see Note 11 of the Notes to Consolidated Financial Statements.
We expect the effective tax rate to be approximately 21% in 2018.
Review of businesses
We have an internal information system that produces performance data along product and service lines for our two principal businesses, Investment Services and Investment Management, and the Other segment.
Business accounting principles
Our business data has been determined on an internal management basis of accounting, rather than the generally accepted accounting principles used for consolidated financial reporting. These measurement principles are designed so that reported results of the businesses will track their economic performance.
For information on the accounting principles of our businesses, the primary products and services in each line of business, the primary types of revenue by business and how our businesses are presented and analyzed, see Note 19 of the Notes to Consolidated Financial Statements.
Business results are subject to reclassification when organizational changes are made. There were no significant organizational changes in the second
quarter of 2018
. The results are also subject to refinements in revenue and expense allocation methodologies, which are typically reflected on a prospective basis.
The results of our businesses may be influenced by client and other activities that vary by quarter. In the first quarter, incentive expense typically increases reflecting the vesting of long-term stock awards for
retirement-eligible employees. In the third quarter, Depositary Receipts revenue is typically higher due to an increased level of client dividend payments. Also in the third quarter, volume-related fees may decline due to reduced client activity. In the third quarter, staff expense typically increases reflecting the annual employee merit increase. In the fourth quarter, we typically incur higher business development and marketing expenses. In our Investment Management business, performance fees are typically higher in the fourth quarter, as the fourth quarter represents the end of the measurement period for many of the performance fee-eligible relationships.
The results of our businesses may also be impacted by the translation of financial results denominated in foreign currencies to the U.S. dollar. We are primarily impacted by activities denominated in the British pound and the euro. On a consolidated basis and in our Investment Services business, we typically have more foreign currency-denominated expenses than revenues. However, our Investment Management business typically has more foreign currency-denominated revenues than expenses. Overall, currency fluctuations impact the year-over-year growth rate in the Investment Management business more than the Investment Services business. However, currency fluctuations, in isolation, are not expected to significantly impact net income on a consolidated basis.
Fee
revenue in Investment Management, and to a lesser extent in Investment Services, is impacted by the value of market indices. At
June 30, 2018
, we estimate that a 5% change in global equity markets, spread evenly throughout the year, would impact fee revenue by less than 1% and diluted earnings per common share by
$0.03 to $0.05
.
See Note 19 of the Notes to Consolidated Financial Statements for the consolidating schedules which show the contribution of our businesses to our overall profitability.
12
BNY Mellon
Investment Services business
|
YTD18
|
|
|||||||||||||||||||||||||||
|
(dollars in millions unless otherwise noted)
|
2Q18 vs.
|
vs.
|
||||||||||||||||||||||||||
|
2Q18
|
|
1Q18
|
|
4Q17
|
|
3Q17
|
|
2Q17
|
|
1Q18
|
|
2Q17
|
|
YTD18
|
|
YTD17
|
|
YTD17
|
|
|||||||||
|
Revenue:
|
||||||||||||||||||||||||||||
|
Investment services fees:
|
||||||||||||||||||||||||||||
|
Asset servicing
|
$
|
1,135
|
|
$
|
1,143
|
|
$
|
1,106
|
|
$
|
1,081
|
|
$
|
1,061
|
|
(1
|
)%
|
7
|
%
|
$
|
2,278
|
|
$
|
2,099
|
|
9
|
%
|
|
|
Clearing services
|
391
|
|
414
|
|
400
|
|
381
|
|
393
|
|
(6
|
)
|
(1
|
)
|
805
|
|
768
|
|
5
|
|
||||||||
|
Issuer services
|
265
|
|
260
|
|
196
|
|
288
|
|
241
|
|
2
|
|
10
|
|
525
|
|
491
|
|
7
|
|
||||||||
|
Treasury services
|
140
|
|
138
|
|
136
|
|
141
|
|
139
|
|
1
|
|
1
|
|
278
|
|
278
|
|
—
|
|
||||||||
|
Total investment services fees
|
1,931
|
|
1,955
|
|
1,838
|
|
1,891
|
|
1,834
|
|
(1
|
)
|
5
|
|
3,886
|
|
3,636
|
|
7
|
|
||||||||
|
Foreign exchange and other trading revenue
|
172
|
|
169
|
|
168
|
|
154
|
|
145
|
|
2
|
|
19
|
|
341
|
|
298
|
|
14
|
|
||||||||
|
Other
(a)
|
130
|
|
126
|
|
135
|
|
142
|
|
136
|
|
3
|
|
(4
|
)
|
256
|
|
265
|
|
(3
|
)
|
||||||||
|
Total fee and other revenue
|
2,233
|
|
2,250
|
|
2,141
|
|
2,187
|
|
2,115
|
|
(1
|
)
|
6
|
|
4,483
|
|
4,199
|
|
7
|
|
||||||||
|
Net interest revenue
|
874
|
|
844
|
|
813
|
|
777
|
|
761
|
|
4
|
|
15
|
|
1,718
|
|
1,468
|
|
17
|
|
||||||||
|
Total revenue
|
3,107
|
|
3,094
|
|
2,954
|
|
2,964
|
|
2,876
|
|
—
|
|
8
|
|
6,201
|
|
5,667
|
|
9
|
|
||||||||
|
Provision for credit losses
|
1
|
|
(7
|
)
|
(2
|
)
|
(2
|
)
|
(3
|
)
|
N/M
|
N/M
|
(6
|
)
|
(3
|
)
|
N/M
|
|||||||||||
|
Noninterest expense (excluding amortization of intangible assets)
|
1,931
|
|
1,913
|
|
2,060
|
|
1,837
|
|
1,889
|
|
1
|
|
2
|
|
3,844
|
|
3,701
|
|
4
|
|
||||||||
|
Amortization of intangible assets
|
36
|
|
36
|
|
37
|
|
37
|
|
38
|
|
—
|
|
(5
|
)
|
72
|
|
75
|
|
(4
|
)
|
||||||||
|
Total noninterest expense
|
1,967
|
|
1,949
|
|
2,097
|
|
1,874
|
|
1,927
|
|
1
|
|
2
|
|
3,916
|
|
3,776
|
|
4
|
|
||||||||
|
Income before taxes
|
$
|
1,139
|
|
$
|
1,152
|
|
$
|
859
|
|
$
|
1,092
|
|
$
|
952
|
|
(1
|
)%
|
20
|
%
|
$
|
2,291
|
|
$
|
1,894
|
|
21
|
%
|
|
|
|
|
|||||||||||||||||||||||||||
|
Pre-tax operating margin
|
37
|
%
|
37
|
%
|
29
|
%
|
37
|
%
|
33
|
%
|
|
|
37
|
%
|
33
|
%
|
|
|
||||||||||
|
|
|
|
|
|||||||||||||||||||||||||
|
Securities lending revenue
|
$
|
55
|
|
$
|
48
|
|
$
|
45
|
|
$
|
41
|
|
$
|
42
|
|
15
|
%
|
31
|
%
|
$
|
103
|
|
$
|
82
|
|
26
|
%
|
|
|
|
|
|
|
|
|
|||||||||||||||||||||||
|
Total revenue by line of business:
|
|
|
|
|
|
|
||||||||||||||||||||||
|
Asset Servicing
|
$
|
1,520
|
|
$
|
1,519
|
|
$
|
1,459
|
|
$
|
1,420
|
|
$
|
1,378
|
|
—
|
%
|
10
|
%
|
$
|
3,039
|
|
$
|
2,724
|
|
12
|
%
|
|
|
Pershing
|
558
|
|
581
|
|
569
|
|
542
|
|
547
|
|
(4
|
)
|
2
|
|
1,139
|
|
1,069
|
|
7
|
|
||||||||
|
Issuer Services
|
431
|
|
418
|
|
352
|
|
442
|
|
398
|
|
3
|
|
8
|
|
849
|
|
794
|
|
7
|
|
||||||||
|
Treasury Services
|
329
|
|
321
|
|
322
|
|
316
|
|
311
|
|
2
|
|
6
|
|
650
|
|
613
|
|
6
|
|
||||||||
|
Clearance and Collateral Management
|
269
|
|
255
|
|
252
|
|
244
|
|
242
|
|
5
|
|
11
|
|
524
|
|
467
|
|
12
|
|
||||||||
|
Total revenue by line of business
|
$
|
3,107
|
|
$
|
3,094
|
|
$
|
2,954
|
|
$
|
2,964
|
|
$
|
2,876
|
|
—
|
%
|
8
|
%
|
$
|
6,201
|
|
$
|
5,667
|
|
9
|
%
|
|
|
|
||||||||||||||||||||||||||||
|
Metrics:
|
|
|
||||||||||||||||||||||||||
|
Average loans
|
$
|
38,002
|
|
$
|
39,200
|
|
$
|
38,845
|
|
$
|
38,038
|
|
$
|
40,931
|
|
(3
|
)%
|
(7
|
)%
|
$
|
38,598
|
|
$
|
41,870
|
|
(8
|
)%
|
|
|
Average deposits
|
$
|
203,064
|
|
$
|
214,130
|
|
$
|
204,680
|
|
$
|
198,299
|
|
$
|
200,417
|
|
(5
|
)%
|
1
|
%
|
$
|
208,567
|
|
$
|
199,206
|
|
5
|
%
|
|
|
|
|
|
|
|||||||||||||||||||||||||
|
AUC/A at period end
(in trillions) (b)
|
$
|
33.6
|
|
$
|
33.5
|
|
$
|
33.3
|
|
$
|
32.2
|
|
$
|
31.1
|
|
—
|
%
|
8
|
%
|
$
|
33.6
|
|
$
|
31.1
|
|
8
|
%
|
|
|
Market value of securities on loan at period end
(in billions) (c)
|
$
|
432
|
|
$
|
436
|
|
$
|
408
|
|
$
|
382
|
|
$
|
336
|
|
(1
|
)%
|
29
|
%
|
$
|
432
|
|
$
|
336
|
|
29
|
%
|
|
|
|
|
|||||||||||||||||||||||||||
|
Pershing:
|
||||||||||||||||||||||||||||
|
Average active clearing accounts (U.S. platform)
(in thousands)
|
6,080
|
|
6,075
|
|
6,126
|
|
6,203
|
|
6,159
|
|
—
|
%
|
(1
|
)%
|
||||||||||||||
|
Average long-term mutual fund assets (U.S. platform)
|
$
|
512,645
|
|
$
|
514,542
|
|
$
|
508,873
|
|
$
|
500,998
|
|
$
|
480,532
|
|
—
|
%
|
7
|
%
|
|||||||||
|
Average investor margin loans (U.S. platform)
|
$
|
10,772
|
|
$
|
10,930
|
|
$
|
9,822
|
|
$
|
8,886
|
|
$
|
9,812
|
|
(1
|
)%
|
10
|
%
|
|||||||||
|
Clearance and Collateral Management:
|
||||||||||||||||||||||||||||
|
Average tri-party collateral management balances
(in billions)
|
$
|
2,801
|
|
$
|
2,698
|
|
$
|
2,606
|
|
$
|
2,534
|
|
$
|
2,498
|
|
4
|
%
|
12
|
%
|
|||||||||
|
(a)
|
Other revenue includes investment management fees, financing-related fees, distribution and servicing revenue and investment and other income.
|
|
(b)
|
Includes the AUC/A of CIBC Mellon of
$1.4 trillion
at
June 30, 2018
,
$1.3 trillion
at
March 31, 2018
,
Dec. 31, 2017
and
Sept. 30, 2017
and
$1.2 trillion
at
June 30, 2017
.
|
|
(c)
|
Represents the total amount of securities on loan in our agency securities lending program managed by the Investment Services business. Excludes securities for which BNY Mellon acts as agent on behalf of CIBC Mellon clients, which totaled
$70 billion
at
June 30, 2018
,
$73 billion
at
March 31, 2018
,
$71 billion
at
Dec. 31, 2017
,
$68 billion
at
Sept. 30, 2017
and
$66 billion
at
June 30, 2017
.
|
N/M - Not meaningful.
BNY Mellon
13
Business description
BNY Mellon Investment Services provides business services and technology solutions to entities including financial institutions, corporations, foundations and endowments, public funds and government agencies. Our lines of business include: Asset Servicing, Pershing, Issuer Services, Treasury Services and Clearance and Collateral Management.
We are one of the leading global investment services providers with
$33.6 trillion
of AUC/A at
June 30, 2018
.
|
•
|
We are the primary provider of U.S. government securities clearance and a provider of non-U.S. government securities clearance.
|
|
•
|
We are a leading provider of tri-party collateral management services with an average of $2.8 trillion serviced globally including approximately $1.8 trillion of the U.S. tri-party repo market.
|
|
•
|
Our agency securities lending program is one of the largest lenders of U.S. and non-U.S. securities, servicing a lendable asset pool of approximately $3.5 trillion in 34 separate markets.
|
The Asset Servicing business provides a comprehensive suite of solutions. As one of the largest global custody and fund accounting providers and a trusted partner, we offer services for the safekeeping of assets in capital markets globally as well as alternative investment and structured product strategies. We provide custody and foreign exchange services, support exchange-traded funds and unit investment trusts and provide our clients outsourcing capabilities. We deliver securities lending and financing solutions on both an agency and principal basis. Our market leading liquidity services portal enables cash investments for institutional clients and includes fund research and analytics.
Pershing provides a comprehensive set of global solutions to broker-dealers, family offices, asset managers, registered investment advisor firms and wealth managers. Our clients rely on Pershing for clearing and custody; investment, wealth and retirement solutions; technology and enterprise data management; trading services and prime brokerage.
The Issuer Services business includes Corporate Trust and Depositary Receipts. Our Corporate
Trust business delivers a full range of issuer and related investor services, including trustee, paying agency, fiduciary, escrow and other financial services. We are a leading provider to the debt capital markets, providing customized and market-driven solutions to investors, bondholders and lenders. Our Depositary Receipts business drives global investing by providing servicing and value-added solutions that enable, facilitate and enhance cross-border trading, clearing, settlement and ownership. We are one of the largest providers of depositary receipts services in the world, partnering with leading companies from more than 50 countries.
Our Treasury Services business includes customizable solutions and innovative technology that deliver high-quality cash management, payment and trade support for corporate and institutional global treasury needs.
Our Clearance and Collateral Management business clears and settles equity and fixed-income transactions globally and serves as custodian for tri-party repo collateral worldwide. Our collateral services include collateral management, administration and segregation.
We offer innovative solutions and industry expertise which help financial institutions and institutional investors to mine opportunities from liquidity, financing, risk and balance sheet challenges.
Review of financial results
AUC/A increased
8%
compared with
June 30, 2017
to a record
$33.6 trillion
, reflecting higher market values and business growth. AUC/A consisted of 37% equity securities and 63% fixed-income securities at
June 30, 2018
and 36% equity securities and 64% fixed-income securities at
June 30, 2017
.
Total revenue of
$3.1 billion
increased
8%
compared with the
second quarter of 2017
and slightly compared with the
first quarter of 2018
. Net interest revenue increased in most businesses primarily driven by higher interest rates. The drivers of fee revenue by line of business are indicated below.
Asset Servicing revenue of
$1.5 billion
increased
10%
compared with the
second quarter of 2017
and slightly compared with the
first quarter of 2018
. The
14
BNY Mellon
increase compared with the
second quarter of 2017
primarily reflects higher net interest revenue, foreign exchange and securities lending volumes, equity market values and the favorable impact of a weaker U.S. dollar.
Pershing revenue of
$558 million
increased
2%
compared with the
second quarter of 2017
and decreased
4%
(unannualized) compared with the
first quarter of 2018
. The increase compared to the
second quarter of 2017
primarily reflects higher net interest revenue and higher fees due to growth in long-term mutual fund balances, partially offset by the impact of the previously disclosed lost business. The decrease compared with the
first quarter of 2018
was primarily driven by lower clearance revenue.
Issuer Services revenue of
$431 million
increased
8%
compared with the
second quarter of 2017
and
3%
(unannualized) compared with the
first quarter of 2018
. Both increases primarily reflect higher net interest revenue in Corporate Trust and higher Depositary Receipts revenue.
Treasury Services revenue of
$329 million
increased
6%
compared with the
second quarter of 2017
and
2%
(unannualized) compared with the
first quarter of 2018
. Both increases primarily reflect higher net interest revenue and payment volumes.
Clearance and Collateral Management revenue of
$269 million
increased
11%
compared with the
second quarter of 2017
and
5%
(unannualized) compared with the
first quarter of 2018
. Both increases primarily reflect growth in collateral management, higher clearance volumes and net interest revenue.
Market and regulatory trends are driving investable assets toward lower fee asset management products at reduced margins for our clients. These dynamics are also negatively impacting our investment services fees. However, at the same time, these trends are providing additional outsourcing opportunities as clients and other market participants seek to comply with new regulations and reduce their operating costs.
Noninterest expense of
$2.0 billion
increased
2%
compared with the
second quarter of 2017
and
1%
(unannualized) compared with the
first quarter of 2018
. The increase compared with the
second quarter of 2017
was primarily driven by investments in technology and the unfavorable impact of a weaker U.S. dollar. The increase compared with the
first quarter of 2018
primarily reflects investments in technology and business development expenses.
Year-to-date 2018 compared with year-to-date 2017
Total revenue of
$6.2 billion
increased
9%
compared with the
first six months of 2017
. Net interest revenue increased in all lines of business primarily driven by higher interest rates. Asset Servicing revenue of
$3.0 billion
increased
12%
compared with the
first six months of 2017
primarily reflecting higher net interest revenue due in part to an increase in deposit balances, higher foreign exchange and securities lending volumes, equity market values and the favorable impact of a weaker U.S. dollar. Pershing revenue of
$1.1 billion
increased
7%
compared with the
first six months of 2017
primarily reflecting higher net interest revenue, and higher fees due to growth in long-term mutual fund balances, partially offset by the impact of lost business. Issuer Services revenue of
$849 million
increased
7%
compared with the
first six months of 2017
primarily reflecting higher net interest revenue in Corporate Trust and higher Depositary Receipts revenue. Treasury Services revenue of
$650 million
increased
6%
compared with the
first six months of 2017
primarily reflecting higher net interest revenue and higher payment volumes. Clearance and Collateral Management revenue of
$524 million
increased
12%
compared with the
first six months of 2017
primarily reflecting growth in collateral management, higher clearance volumes and higher net interest revenue.
Noninterest expense of
$3.9 billion
increased
4%
compared with the
first six months of 2017
primarily reflecting investments in technology and the unfavorable impact of a weaker U.S. dollar.
BNY Mellon
15
Investment Management business
|
YTD18
|
||||||||||||||||||||||||||||
|
2Q18 vs.
|
vs.
|
|||||||||||||||||||||||||||
|
(dollars in millions)
|
2Q18
|
|
1Q18
|
|
4Q17
|
|
3Q17
|
|
2Q17
|
|
1Q18
|
|
2Q17
|
|
YTD18
|
|
YTD17
|
|
YTD17
|
|
||||||||
|
Revenue:
|
||||||||||||||||||||||||||||
|
Investment management fees
(a)
|
$
|
885
|
|
$
|
898
|
|
$
|
898
|
|
$
|
871
|
|
$
|
845
|
|
(1
|
)%
|
5
|
%
|
$
|
1,783
|
|
$
|
1,659
|
|
7
|
%
|
|
|
Performance fees
|
12
|
|
48
|
|
50
|
|
15
|
|
17
|
|
N/M
|
|
(29
|
)
|
60
|
|
29
|
|
107
|
|
||||||||
|
Investment management and performance fees
(b)
|
897
|
|
946
|
|
948
|
|
886
|
|
862
|
|
(5
|
)
|
4
|
|
1,843
|
|
1,688
|
|
9
|
|
||||||||
|
Distribution and servicing
|
48
|
|
50
|
|
51
|
|
51
|
|
53
|
|
(4
|
)
|
(9
|
)
|
98
|
|
105
|
|
(7
|
)
|
||||||||
|
Other
(a)
|
(4
|
)
|
16
|
|
(25
|
)
|
(19
|
)
|
(16
|
)
|
N/M
|
|
N/M
|
|
12
|
|
(17
|
)
|
N/M
|
|
||||||||
|
Total fee and other revenue
(a)
|
941
|
|
1,012
|
|
974
|
|
918
|
|
899
|
|
(7
|
)
|
5
|
|
1,953
|
|
1,776
|
|
10
|
|
||||||||
|
Net interest revenue
|
77
|
|
76
|
|
74
|
|
82
|
|
87
|
|
1
|
|
(11
|
)
|
153
|
|
173
|
|
(12
|
)
|
||||||||
|
Total revenue
|
1,018
|
|
1,088
|
|
1,048
|
|
1,000
|
|
986
|
|
(6
|
)
|
3
|
|
2,106
|
|
1,949
|
|
8
|
|
||||||||
|
Provision for credit losses
|
2
|
|
2
|
|
1
|
|
(2
|
)
|
—
|
|
N/M
|
|
N/M
|
|
4
|
|
3
|
|
N/M
|
|
||||||||
|
Noninterest expense (excluding amortization of intangible assets)
|
685
|
|
692
|
|
756
|
|
687
|
|
683
|
|
(1
|
)
|
—
|
|
1,377
|
|
1,351
|
|
2
|
|
||||||||
|
Amortization of intangible assets
|
12
|
|
13
|
|
15
|
|
15
|
|
15
|
|
(8
|
)
|
(20
|
)
|
25
|
|
30
|
|
(17
|
)
|
||||||||
|
Total noninterest expense
|
697
|
|
705
|
|
771
|
|
702
|
|
698
|
|
(1
|
)
|
—
|
|
1,402
|
|
1,381
|
|
2
|
|
||||||||
|
Income before taxes
|
$
|
319
|
|
$
|
381
|
|
$
|
276
|
|
$
|
300
|
|
$
|
288
|
|
(16
|
)%
|
11
|
%
|
$
|
700
|
|
$
|
565
|
|
24
|
%
|
|
|
|
||||||||||||||||||||||||||||
|
Pre-tax operating margin
|
31
|
%
|
35
|
%
|
26
|
%
|
30
|
%
|
29
|
%
|
33
|
%
|
29
|
%
|
|
|
||||||||||||
|
Adjusted pre-tax operating margin
–
Non-GAAP
(c)
|
35
|
%
|
39
|
%
|
29
|
%
|
34
|
%
|
33
|
%
|
37
|
%
|
32
|
%
|
|
|
||||||||||||
|
|
||||||||||||||||||||||||||||
|
Total revenue by line of business:
|
|
|||||||||||||||||||||||||||
|
Asset Management
|
$
|
702
|
|
$
|
770
|
|
$
|
738
|
|
$
|
693
|
|
$
|
683
|
|
(9
|
)%
|
3
|
%
|
$
|
1,472
|
|
$
|
1,344
|
|
10
|
%
|
|
|
Wealth Management
|
316
|
|
318
|
|
310
|
|
307
|
|
303
|
|
(1
|
)
|
4
|
|
634
|
|
605
|
|
5
|
|
||||||||
|
Total revenue by line of business
|
$
|
1,018
|
|
$
|
1,088
|
|
$
|
1,048
|
|
$
|
1,000
|
|
$
|
986
|
|
(6
|
)%
|
3
|
%
|
$
|
2,106
|
|
$
|
1,949
|
|
8
|
%
|
|
|
Average balances:
|
||||||||||||||||||||||||||||
|
Average loans
|
$
|
16,974
|
|
$
|
16,876
|
|
$
|
16,813
|
|
$
|
16,724
|
|
$
|
16,560
|
|
1
|
%
|
3
|
%
|
$
|
16,926
|
|
$
|
16,358
|
|
3
|
%
|
|
|
Average deposits
|
$
|
14,252
|
|
$
|
13,363
|
|
$
|
11,633
|
|
$
|
12,374
|
|
$
|
14,866
|
|
7
|
%
|
(4
|
)%
|
$
|
13,810
|
|
$
|
15,380
|
|
(10
|
)%
|
|
|
(a)
|
Total fee and other revenue includes the impact of the consolidated investment management funds, net of noncontrolling interests. Additionally, other revenue includes asset servicing, treasury services, foreign exchange and other trading revenue and investment and other income.
|
|
(b)
|
On a constant currency basis, investment management and performance fees increased
2%
(Non-GAAP) compared with the
second quarter of 2017
. See “Supplemental information – Explanation of GAAP and Non-GAAP financial measures” beginning on page
40
for the reconciliation of this Non-GAAP measure.
|
|
(c)
|
Net of distribution and servicing expense. See “Supplemental information – Explanation of GAAP and Non-GAAP financial measures” beginning on page
40
for the reconciliation of this Non-GAAP measure. In the first quarter of 2018, the adjusted pre-tax margin
–
Non-GAAP for prior periods was restated to include amortization of intangible assets and the provision for credit losses.
|
N/M - Not meaningful.
16
BNY Mellon
|
AUM trends
(a)
|
2Q18 vs.
|
|||||||||||||||||||
|
(dollars in billions)
|
2Q18
|
|
1Q18
|
|
4Q17
|
|
3Q17
|
|
2Q17
|
|
1Q18
|
|
2Q17
|
|
||||||
|
AUM at period end, by product type:
|
||||||||||||||||||||
|
Equity
|
$
|
160
|
|
$
|
161
|
|
$
|
161
|
|
$
|
158
|
|
$
|
163
|
|
(1
|
)%
|
(2
|
)%
|
|
|
Fixed income
|
197
|
|
206
|
|
206
|
|
206
|
|
198
|
|
(4
|
)
|
(1
|
)
|
||||||
|
Index
|
334
|
|
333
|
|
350
|
|
333
|
|
324
|
|
—
|
|
3
|
|
||||||
|
Liability-driven investments
(b)
|
663
|
|
700
|
|
667
|
|
622
|
|
607
|
|
(5
|
)
|
9
|
|
||||||
|
Multi-asset and alternative investments
|
181
|
|
185
|
|
214
|
|
207
|
|
192
|
|
(2
|
)
|
(6
|
)
|
||||||
|
Cash
|
270
|
|
283
|
|
295
|
|
298
|
|
287
|
|
(5
|
)
|
(6
|
)
|
||||||
|
Total AUM
|
$
|
1,805
|
|
$
|
1,868
|
|
$
|
1,893
|
|
$
|
1,824
|
|
$
|
1,771
|
|
(3
|
)%
|
2
|
%
|
|
|
|
|
|||||||||||||||||||
|
Changes in AUM:
|
||||||||||||||||||||
|
Beginning balance of AUM
|
$
|
1,868
|
|
$
|
1,893
|
|
$
|
1,824
|
|
$
|
1,771
|
|
$
|
1,727
|
|
|||||
|
Net (outflows) inflows:
|
||||||||||||||||||||
|
Long-term strategies:
|
||||||||||||||||||||
|
Equity
|
(3
|
)
|
—
|
|
(6
|
)
|
(2
|
)
|
(2
|
)
|
||||||||||
|
Fixed income
|
(4
|
)
|
7
|
|
(2
|
)
|
4
|
|
2
|
|
||||||||||
|
Liability-driven investments
(b)
|
2
|
|
13
|
|
23
|
|
(2
|
)
|
15
|
|
||||||||||
|
Multi-asset and alternative investments
|
(3
|
)
|
(3
|
)
|
2
|
|
3
|
|
1
|
|
||||||||||
|
Total long-term active strategies (outflows) inflows
|
(8
|
)
|
17
|
|
17
|
|
3
|
|
16
|
|
||||||||||
|
Index
|
(7
|
)
|
(13
|
)
|
(1
|
)
|
(3
|
)
|
(13
|
)
|
||||||||||
|
Total long-term strategies (outflows) inflows
|
(15
|
)
|
4
|
|
16
|
|
—
|
|
3
|
|
||||||||||
|
Short-term strategies:
|
||||||||||||||||||||
|
Cash
|
(11
|
)
|
(14
|
)
|
(4
|
)
|
10
|
|
11
|
|
||||||||||
|
Total net (outflows) inflows
|
(26
|
)
|
(10
|
)
|
12
|
|
10
|
|
14
|
|
||||||||||
|
Net market impact
|
17
|
|
(14
|
)
|
47
|
|
17
|
|
1
|
|
||||||||||
|
Net currency impact
|
(53
|
)
|
29
|
|
10
|
|
26
|
|
29
|
|
||||||||||
|
Divestitures/Other
|
(1
|
)
|
(30
|
)
|
(c)
|
—
|
|
—
|
|
—
|
|
|||||||||
|
Ending balance of AUM
|
$
|
1,805
|
|
$
|
1,868
|
|
$
|
1,893
|
|
$
|
1,824
|
|
$
|
1,771
|
|
(3
|
)%
|
2
|
%
|
|
|
|
|
|
|
|||||||||||||||||
|
Wealth Management client assets
(d)
|
$
|
254
|
|
$
|
246
|
|
$
|
251
|
|
$
|
245
|
|
$
|
239
|
|
3
|
%
|
6
|
%
|
|
|
(a)
|
Excludes securities lending cash management assets and assets managed in the Investment Services business.
|
|
(b)
|
Includes currency overlay AUM.
|
|
(c)
|
Primarily reflects a change in methodology beginning in the first quarter of 2018 to exclude AUM related to equity method investments as well as the CenterSquare divestiture.
|
|
(d)
|
Includes AUM and AUC/A in the Wealth Management business.
|
Business description
Our Investment Management business consists of two lines of business, Asset Management and Wealth Management. The Asset Management business offers diversified investment management strategies and distribution of investment products. The Wealth Management business provides investment management, custody, wealth and estate planning and private banking services. See pages 19 and 20 of our 2017 Annual Report for additional information on our Investment Management business.
Review of financial results
AUM increased
2%
compared with
June 30, 2017
primarily reflecting higher market values and the favorable impact of a weaker U.S. dollar (principally
versus the British pound), partially offset by the divestiture of CenterSquare, net outflows and other changes.
Net long-term outflows of
$15 billion
in the
second quarter of 2018
were a result of
$8 billion
of outflows from actively managed strategies, primarily fixed income, and
$7 billion
of outflows from index funds. Net short-term outflows were
$11 billion
in the
second quarter of 2018
.
Market and regulatory trends have resulted in increased demand for lower fee asset management products, and for performance-based fees.
Total revenue of
$1.0 billion
increased
3%
compared with
the
second quarter of 2017
and decreased
6%
(unannualized) compared with the
first quarter of 2018
.
BNY Mellon
17
Asset Management revenue of
$702 million
increased
3%
compared with the
second quarter of 2017
and decreased
9%
(unannualized) compared with the
first quarter of 2018
. The increase compared with the
second quarter of 2017
reflects higher equity market values and the favorable impact of a weaker U.S. dollar (principally versus the British pound), partially offset by the divestiture of CenterSquare and the impact of net outflows. The decrease compared with the
first quarter of 2018
primarily reflects lower performance fees and the gain on the divestiture of CenterSquare recorded in the
first quarter of 2018
.
Wealth Management revenue of
$316 million
increased
4%
compared with the
second quarter of 2017
and decreased
1%
(unannualized) compared with the
first quarter of 2018
. The increase compared with the
second quarter of 2017
primarily reflects higher equity market values, partially offset by lower net interest revenue.
Revenue generated in the Investment Management business included
41%
from non-U.S. sources in the
second quarter of 2018
, compared with
40%
in the
second quarter of 2017
and
42%
in the
first quarter of 2018
.
Year-to-date 2018 compared with year-to-date 2017
Total revenue of
$2.1 billion
increased
8%
compared with the
first six months of 2017
. Asset Management revenue of
$1.5 billion
increased
10%
compared with the
first six months of 2017
, primarily reflecting higher equity market values, the favorable impact of a weaker U.S. dollar (principally versus the British pound) and higher performance fees. Wealth management revenue of
$634 million
increased
5%
, primarily reflecting higher equity market values, partially offset by lower net interest revenue.
Noninterest expense of
$1.4 billion
increased
2%
primarily reflecting the unfavorable impact of a weaker U.S. dollar, partially offset by lower incentive expense.
Other segment
|
(in millions)
|
2Q18
|
|
1Q18
|
|
4Q17
|
|
3Q17
|
|
2Q17
|
|
YTD18
|
|
YTD17
|
|
|||||||
|
Fee revenue (loss)
|
$
|
40
|
|
$
|
57
|
|
$
|
(221
|
)
|
$
|
50
|
|
$
|
113
|
|
$
|
97
|
|
$
|
175
|
|
|
Net securities gains (losses)
|
1
|
|
(49
|
)
|
(26
|
)
|
19
|
|
—
|
|
(48
|
)
|
10
|
|
|||||||
|
Total fee and other revenue (loss)
|
41
|
|
8
|
|
(247
|
)
|
69
|
|
113
|
|
49
|
|
185
|
|
|||||||
|
Net interest (expense)
|
(35
|
)
|
(1
|
)
|
(36
|
)
|
(20
|
)
|
(22
|
)
|
(36
|
)
|
(23
|
)
|
|||||||
|
Total revenue (loss)
|
6
|
|
7
|
|
(283
|
)
|
49
|
|
91
|
|
13
|
|
162
|
|
|||||||
|
Provision for credit losses
|
(6
|
)
|
—
|
|
(5
|
)
|
(2
|
)
|
(4
|
)
|
(6
|
)
|
(12
|
)
|
|||||||
|
Noninterest expense
|
81
|
|
87
|
|
135
|
|
77
|
|
28
|
|
168
|
|
135
|
|
|||||||
|
(Loss) income before taxes
|
$
|
(69
|
)
|
$
|
(80
|
)
|
$
|
(413
|
)
|
$
|
(26
|
)
|
$
|
67
|
|
$
|
(149
|
)
|
$
|
39
|
|
|
Average loans and leases
|
$
|
2,090
|
|
$
|
2,530
|
|
$
|
1,114
|
|
$
|
1,182
|
|
$
|
1,302
|
|
$
|
2,308
|
|
$
|
1,320
|
|
See pages 25 and 26 of our 2017 Annual Report for additional information on the Other segment.
Review of financial results
Fee and other revenue
decreased
$72 million
compared with the
second quarter of 2017
and increased
$33 million
compared with the
first quarter of 2018
. The
decrease
compared with the
second quarter of 2017
primarily reflects lease-related gains recorded in the
second quarter of 2017
and lower income from corporate/bank-owned life insurance. The
increase
compared with the
first quarter of 2018
primarily reflects net securities losses recorded in the
first quarter of 2018, partially offset by lower asset-related gains.
Net interest expense
increased
$13 million
compared with the second quarter of 2017 and
$34 million
compared with the first quarter of 2018. Both increases primarily resulted from corporate treasury activity.
Noninterest expense
increased
$53 million
compared with the
second quarter of 2017
and
decreased
$6 million
compared with the
first quarter of 2018
. Both comparisons were impacted by investments in
18
BNY Mellon
technology and expenses associated with the continued consolidation of our real estate.
Year-to-date 2018 compared with year-to-date 2017
Income before taxes
decreased
$188 million
compared with the
first six months of 2017
. Total revenue
decreased
$149 million
, primarily reflecting lower net securities and lease-related gains, and a net gain related to an equity investment. Noninterest expense
increased
$
33 million
, primarily reflecting higher net occupancy expense, including the expenses associated with the continued consolidation of our real estate.
Critical accounting estimates
Our significant accounting policies are described in Note 1 of the Notes to Consolidated Financial Statements in our 2017 Annual Report. Our critical accounting estimates are those related to the allowance for loan losses and allowance for lending-related commitments, fair value of financial instruments and derivatives, other-than-temporary impairment (“OTTI”), goodwill and other intangibles, and pension accounting, as referenced below.
|
Critical policy
|
Reference
|
|
Allowance for loan losses and allowance for lending-related commitments
|
2017 Annual Report, pages 29-30
|
|
Fair value of financial instruments and derivatives
|
2017 Annual Report, pages 30-32
|
|
OTTI
|
2017 Annual Report, pages 32-33
|
|
Goodwill and other intangibles
|
2017 Annual Report, pages 33-34
|
|
Pension accounting
|
2017 Annual Report, pages 34-35
|
Consolidated balance sheet review
One of our key risk management objectives is to maintain a balance sheet that remains strong throughout market cycles to meet the expectations of our major stakeholders, including our shareholders, clients, creditors and regulators.
We also seek to verify that the overall liquidity risk, including intraday liquidity risk, that we undertake stays within our risk appetite. The objective of our balance sheet management strategy is to maintain a balance sheet that is characterized by strong liquidity and asset quality, ready access to external funding
sources at competitive rates and a strong capital structure that supports our risk-taking activities and is adequate to absorb potential losses. In managing the balance sheet, appropriate consideration is given to balancing the competing needs of maintaining sufficient levels of liquidity and complying with applicable regulations and supervisory expectations while optimizing profitability.
At
June 30, 2018
, total assets were
$353 billion
compared with
$372 billion
at
Dec. 31, 2017
. The decrease in total assets was primarily driven by lower interest-bearing deposits with the Federal Reserve and other central banks. Deposits totaled
$231 billion
at
June 30, 2018
and
$244 billion
at
Dec. 31, 2017
, and were driven by lower interest-bearing deposits in non-U.S. offices and noninterest-bearing deposits principally in U.S. offices, partially offset by higher interest-bearing deposits in U.S. offices. At
June 30, 2018
, total interest-bearing deposits were
52%
of total interest-earning assets, compared with 51% at
Dec. 31, 2017
.
At
June 30, 2018
, we had
$43 billion
of liquid funds (which include interest-bearing deposits with banks and federal funds sold and securities purchased under resale agreements) and
$80 billion
of cash (including
$75 billion
of overnight deposits with the Federal Reserve and other central banks) for a total of
$123 billion
of available funds. This compares with available funds of
$137 billion
at
Dec. 31, 2017
. Total available funds as a percentage of total assets were
35%
at
June 30, 2018
and 37% at
Dec. 31, 2017
. For additional information on our liquid funds and available funds, see “Liquidity and dividends.”
Securities were
$119 billion
, or
34%
of total assets, at
June 30, 2018
, compared with
$120 billion
, or
32%
of total assets, at
Dec. 31, 2017
. The decrease primarily reflects a decline in sovereign debt/sovereign guaranteed, U.S. Treasury securities and other securities, partially offset by increases in agency commercial mortgage-backed securities (“MBS”) and U.S. government agency securities. For additional information on our securities portfolio, see “Securities” and Note 4 of the Notes to Consolidated Financial Statements.
Loans were
$58 billion
, or
16%
of total assets, at
June 30, 2018
, compared with
$62 billion
, or
17%
of total assets, at
Dec. 31, 2017
. The decrease in loans was primarily driven by lower loans to financial institutions and overdrafts. For additional information on our loan portfolio, see “Loans” and
BNY Mellon
19
Note 5 of the Notes to Consolidated Financial Statements.
Long-term debt totaled
$28 billion
at both
June 30, 2018
and
Dec. 31, 2017
. The balance reflects issuances of
$3.0 billion
, offset by the maturities of
$2.2 billion
and a decrease in the fair value of hedged long-term debt. For additional information on long-term debt, see “Liquidity and dividends.”
The Bank of New York Mellon Corporation total shareholders’ equity increased to
$42 billion
from
$41 billion
at
Dec. 31, 2017
. For additional information on our capital, see “Capital.”
Country risk exposure
We have exposure to certain countries with higher risk profiles. Exposure described below reflects the country of operations and risk of the immediate counterparty.
Ratings of our counterparties are capped at the rating of the country.
We continue to monitor our exposure to these and other countries as part of our risk management process. See “Risk management” in our 2017 Annual Report for additional information on how our exposures are managed.
BNY Mellon has a limited economic interest in the performance of assets of consolidated investment management funds, and therefore they are excluded from this disclosure.
Italy and Spain
We had net exposure of $1.3 billion to Italy and $2.0 billion to Spain at
June 30, 2018
and $1.8 billion to Italy and $2.1 billion to Spain at
Dec. 31, 2017
. At both
June 30, 2018
and
Dec. 31, 2017
, exposure to Italy and Spain primarily consisted of investment grade sovereign debt. Securities exposure totaled
$998 million to Italy and $1.6 billion to Spain at
June 30, 2018
and $1.3 billion to Italy and $1.6 billion to Spain at
Dec. 31, 2017
.
Brazil
We have operations in Brazil providing investment services and investment management services. At
June 30, 2018
and
Dec. 31, 2017
, we had total net exposure to Brazil of $1.5 billion and $1.4 billion, respectively. This included $1.4 billion and $1.3 billion, respectively, in loans, which are primarily short-term trade finance loans extended to large established financial institutions. At
June 30, 2018
and
Dec. 31, 2017
, we held $116 million and $136 million, respectively, of non-investment grade sovereign debt.
Turkey
We mainly provide treasury and issuer services, as well as foreign exchange products primarily to the top-ten largest financial institutions in the country. As of
June 30, 2018
and
Dec. 31, 2017
,
our exposure totaled $634 million and $707 million, respectively, consisting primarily of syndicated credit facilities and trade finance loans.
Securities
In the discussion of our securities portfolio, we have included certain credit ratings information because the information can indicate the degree of credit risk to which we are exposed. Significant changes in ratings classifications for our securities portfolio could indicate increased credit risk for us and could be accompanied by a reduction in the fair value of our securities portfolio.
20
BNY Mellon
The following table shows the distribution of our total securities portfolio.
|
Securities portfolio
|
March 31, 2018
|
|
2Q18
change in
unrealized
gain (loss)
|
|
June 30, 2018
|
Fair value
as a % of amortized
cost
(a)
|
|
Unrealized
gain (loss)
|
|
Ratings
(b)
|
||||||||||||||||||||
|
BB+
and
lower
|
||||||||||||||||||||||||||||||
|
(dollars in millions)
|
Fair
value
|
|
Amortized
cost
|
|
Fair
value
|
|
AAA/
AA-
|
A+/
A-
|
BBB+/
BBB-
|
Not
rated
|
||||||||||||||||||||
|
Agency RMBS
|
$
|
49,093
|
|
$
|
(145
|
)
|
$
|
50,906
|
|
$
|
49,741
|
|
98
|
%
|
$
|
(1,165
|
)
|
100
|
%
|
—
|
%
|
—
|
%
|
—
|
%
|
—
|
%
|
|||
|
U.S. Treasury
|
23,545
|
|
17
|
|
24,106
|
|
23,962
|
|
99
|
|
(144
|
)
|
100
|
|
—
|
|
—
|
|
—
|
|
—
|
|
||||||||
|
Sovereign debt/sovereign guaranteed
(c)
|
14,732
|
|
(26
|
)
|
12,976
|
|
13,069
|
|
101
|
|
93
|
|
74
|
|
6
|
|
19
|
|
1
|
|
—
|
|
||||||||
|
Agency commercial MBS
|
10,805
|
|
105
|
|
11,096
|
|
11,019
|
|
99
|
|
(77
|
)
|
100
|
|
—
|
|
—
|
|
—
|
|
—
|
|
||||||||
|
U.S. government agencies
|
2,669
|
|
(2
|
)
|
3,284
|
|
3,269
|
|
100
|
|
(15
|
)
|
100
|
|
—
|
|
—
|
|
—
|
|
—
|
|
||||||||
|
CLOs
|
3,129
|
|
(10
|
)
|
3,179
|
|
3,177
|
|
100
|
|
(2
|
)
|
98
|
|
—
|
|
—
|
|
1
|
|
1
|
|
||||||||
|
Foreign covered bonds
(d)
|
2,806
|
|
(2
|
)
|
2,980
|
|
2,976
|
|
100
|
|
(4
|
)
|
100
|
|
—
|
|
—
|
|
—
|
|
—
|
|
||||||||
|
State and political subdivisions
|
2,742
|
|
7
|
|
2,653
|
|
2,646
|
|
100
|
|
(7
|
)
|
76
|
|
16
|
|
4
|
|
—
|
|
4
|
|
||||||||
|
Non-agency RMBS
(e)
|
1,745
|
|
(22
|
)
|
1,340
|
|
1,621
|
|
121
|
|
281
|
|
7
|
|
9
|
|
9
|
|
60
|
|
15
|
|
||||||||
|
Non-agency commercial MBS
|
1,532
|
|
(148
|
)
|
1,403
|
|
1,391
|
|
99
|
|
(12
|
)
|
96
|
|
4
|
|
—
|
|
—
|
|
—
|
|
||||||||
|
Corporate bonds
|
1,222
|
|
(7
|
)
|
1,167
|
|
1,146
|
|
98
|
|
(21
|
)
|
13
|
|
71
|
|
16
|
|
—
|
|
—
|
|
||||||||
|
Other
(f)
|
4,183
|
|
—
|
|
4,497
|
|
4,484
|
|
100
|
|
(13
|
)
|
82
|
|
16
|
|
—
|
|
—
|
|
2
|
|
||||||||
|
Total securities
|
$
|
118,203
|
|
(g)
|
$
|
(233
|
)
|
$
|
119,587
|
|
$
|
118,501
|
|
(g)
|
99
|
%
|
$
|
(1,086
|
)
|
(g)(h)
|
94
|
%
|
2
|
%
|
3
|
%
|
1
|
%
|
—
|
%
|
|
(a)
|
Amortized cost reflects historical impairments.
|
|
(b)
|
Represents ratings by S&P or the equivalent.
|
|
(c)
|
Primarily consists of exposure to UK, France, Germany, Spain, Italy and the Netherlands.
|
|
(d)
|
Primarily consists of exposure to Canada, UK, Australia and Sweden.
|
|
(e)
|
Includes RMBS that were included in the former Grantor Trust of
$1,019 million
at
March 31, 2018
and
$943 million
at
June 30, 2018
.
|
|
(f)
|
Includes commercial paper with a fair value of
$700 million
at
March 31, 2018
and
$699 million
at
June 30, 2018
.
|
|
(g)
|
Includes net unrealized gains on derivatives hedging securities available-for-sale of
$238 million
at
March 31, 2018
and
$373 million
at
June 30, 2018
.
|
|
(h)
|
Unrealized losses of
$133 million
at
June 30, 2018
related to available-for-sale securities, net of hedges.
|
The fair value of our securities portfolio, including related hedges, was
$118.5 billion
at
June 30, 2018
, compared with $119.9 billion at
Dec. 31, 2017
.
The decrease primarily reflects a decline in sovereign debt/sovereign guaranteed, U.S. Treasury securities and other securities driven by the reclassification of money market fund investments to trading assets, partially offset by increases in agency commercial mortgage-backed and U.S. government agency securities.
At
June 30, 2018
, the total securities portfolio had a net unrealized loss of
$1.1 billion
,
compared with a net unrealized loss of $85 million at
Dec. 31, 2017
,
including the impact of related hedges. The increase in the net unrealized pre-tax loss was primarily driven by higher interest rates.
The unrealized loss, net of tax, on our available-for-sale securities portfolio included in accumulated other comprehensive income (“OCI”) was
$92 million
at
June 30, 2018
, compared with an unrealized gain of
$184 million
at
Dec. 31, 2017
.
At
June 30, 2018
,
94%
of the securities in our portfolio were rated AAA/AA-, compared with 93% at
Dec. 31, 2017
.
BNY Mellon
21
The following table presents the amortizable purchase premium (net of discount) related to the securities portfolio and accretable discount related to the 2009 restructuring of the securities portfolio.
|
Net premium amortization and discount accretion of securities
(a)
|
|||||||||||||||
|
(dollars in millions)
|
2Q18
|
|
1Q18
|
|
4Q17
|
|
3Q17
|
|
2Q17
|
|
|||||
|
Amortizable purchase premium (net of discount) relating to securities:
|
|||||||||||||||
|
Balance at period end
|
$
|
1,642
|
|
$
|
1,827
|
|
$
|
1,987
|
|
$
|
2,053
|
|
$
|
2,111
|
|
|
Estimated average life remaining at period end
(in years)
|
5.3
|
|
5.2
|
|
5.0
|
|
5.0
|
|
5.0
|
|
|||||
|
Amortization
|
$
|
115
|
|
$
|
122
|
|
$
|
135
|
|
$
|
140
|
|
$
|
134
|
|
|
Accretable discount related to the prior restructuring of the securities portfolio:
|
|||||||||||||||
|
Balance at period end
|
$
|
239
|
|
$
|
250
|
|
$
|
274
|
|
$
|
302
|
|
$
|
279
|
|
|
Estimated average life remaining at period end
(in years)
|
6.3
|
|
6.3
|
|
6.3
|
|
6.5
|
|
6.3
|
|
|||||
|
Accretion
|
$
|
24
|
|
$
|
25
|
|
$
|
26
|
|
$
|
24
|
|
$
|
25
|
|
|
(a)
|
Amortization of purchase premium decreases net interest revenue while accretion of discount increases net interest revenue. Both were recorded on a level yield basis.
|
We routinely test our securities for OTTI. See “Critical accounting estimates” for additional information regarding OTTI.
On a quarterly basis, we perform our impairment analysis using several factors, including projected loss severities and default rates. In the
second quarter of 2018
, this analysis resulted in other-than-temporary credit losses of less than $1 million, primarily in our non-agency RMBS portfolio. At
June 30, 2018
, if we were to increase or decrease each of our projected loss severity and default rates by 100 basis points on each of the positions in our
non-agency RMBS portfolio, including the securities previously held by the Grantor Trust, credit-related impairment charges on these securities would have increased or decreased by less than $1 million (pre-tax). See Note 4 of the Notes to Consolidated Financial Statements for the projected weighted-average default rates and loss severities.
See Note 4 of the Notes to Consolidated Financial Statements for the pre-tax net securities gains (losses) by security type. See Note 15 of the Notes to Consolidated Financial Statements for details of securities by level in the fair value hierarchy.
Loans
|
Total exposure – consolidated
|
June 30, 2018
|
Dec. 31, 2017
|
|||||||||||||||||
|
(in billions)
|
Loans
|
|
Unfunded
commitments
|
|
Total
exposure
|
|
Loans
|
|
Unfunded
commitments
|
|
Total
exposure
|
|
|||||||
|
Non-margin loans:
|
|||||||||||||||||||
|
Financial institutions
|
$
|
11.8
|
|
$
|
31.6
|
|
$
|
43.4
|
|
$
|
13.1
|
|
$
|
32.5
|
|
$
|
45.6
|
|
|
|
Commercial
|
2.5
|
|
16.6
|
|
19.1
|
|
2.9
|
|
18.0
|
|
20.9
|
|
|||||||
|
Subtotal institutional
|
14.3
|
|
48.2
|
|
62.5
|
|
16.0
|
|
50.5
|
|
66.5
|
|
|||||||
|
Wealth management loans and mortgages
|
16.3
|
|
1.0
|
|
17.3
|
|
16.5
|
|
1.1
|
|
17.6
|
|
|||||||
|
Commercial real estate
|
5.0
|
|
3.6
|
|
8.6
|
|
4.9
|
|
3.5
|
|
8.4
|
|
|||||||
|
Lease financings
|
1.3
|
|
—
|
|
1.3
|
|
1.3
|
|
—
|
|
1.3
|
|
|||||||
|
Other residential mortgages
|
0.7
|
|
—
|
|
0.7
|
|
0.7
|
|
—
|
|
0.7
|
|
|||||||
|
Overdrafts
|
4.0
|
|
—
|
|
4.0
|
|
5.1
|
|
—
|
|
5.1
|
|
|||||||
|
Other
|
1.1
|
|
—
|
|
1.1
|
|
1.2
|
|
—
|
|
1.2
|
|
|||||||
|
Subtotal non-margin loans
|
42.7
|
|
52.8
|
|
95.5
|
|
45.7
|
|
55.1
|
|
100.8
|
|
|||||||
|
Margin loans
|
15.1
|
|
—
|
|
15.1
|
|
15.8
|
|
—
|
|
15.8
|
|
|||||||
|
Total
|
$
|
57.8
|
|
$
|
52.8
|
|
$
|
110.6
|
|
$
|
61.5
|
|
$
|
55.1
|
|
$
|
116.6
|
|
|
At
June 30, 2018
, total exposures of
$110.6 billion
decreased
5%
compared with
Dec. 31, 2017
, primarily reflecting lower exposure in both the
financial institutions and commercial portfolios and lower overdrafts, partially offset by a slight increase in commercial real estate.
22
BNY Mellon
Our financial institutions and commercial portfolios comprise our largest concentrated risk. These portfolios comprised
57%
of our total exposure at
June 30, 2018
, compared with
57%
at
Dec. 31, 2017
. Additionally, most of our overdrafts relate to financial institutions.
Financial institutions
The financial institutions portfolio is shown below.
|
Financial institutions
portfolio exposure
(dollars in billions)
|
June 30, 2018
|
Dec. 31, 2017
|
|||||||||||||||||||||
|
Loans
|
|
Unfunded
commitments
|
|
Total
exposure
|
|
% Inv.
grade
|
|
% due
<1 yr.
|
|
Loans
|
|
Unfunded
commitments
|
|
Total
exposure
|
|
||||||||
|
Securities industry
|
$
|
3.4
|
|
$
|
18.8
|
|
$
|
22.2
|
|
99
|
%
|
99
|
%
|
$
|
3.6
|
|
$
|
19.2
|
|
$
|
22.8
|
|
|
|
Asset managers
|
1.4
|
|
6.3
|
|
7.7
|
|
99
|
|
87
|
|
1.4
|
|
6.4
|
|
7.8
|
|
|||||||
|
Banks
|
6.0
|
|
1.2
|
|
7.2
|
|
67
|
|
94
|
|
7.0
|
|
1.2
|
|
8.2
|
|
|||||||
|
Insurance
|
0.1
|
|
3.3
|
|
3.4
|
|
100
|
|
7
|
|
0.1
|
|
3.5
|
|
3.6
|
|
|||||||
|
Government
|
0.1
|
|
0.7
|
|
0.8
|
|
100
|
|
44
|
|
0.1
|
|
0.9
|
|
1.0
|
|
|||||||
|
Other
|
0.8
|
|
1.3
|
|
2.1
|
|
98
|
|
62
|
|
0.9
|
|
1.3
|
|
2.2
|
|
|||||||
|
Total
|
$
|
11.8
|
|
$
|
31.6
|
|
$
|
43.4
|
|
94
|
%
|
86
|
%
|
$
|
13.1
|
|
$
|
32.5
|
|
$
|
45.6
|
|
|
The financial institutions portfolio exposure was
$43.4 billion
at
June 30, 2018
, a
5%
decrease compared with
$45.6 billion
at
Dec. 31, 2017
, reflecting decreases in all portfolios.
Financial institution exposures are high-quality, with
94%
of the exposures meeting the investment grade equivalent criteria of our internal credit rating classification at
June 30, 2018
. Each customer is assigned an internal credit rating, which is mapped to an equivalent external rating agency grade based upon a number of dimensions, which are continually evaluated and may change over time. The exposure to financial institutions is generally short-term. Of these exposures,
86%
expire within one year and
19%
expire within 90 days. In addition,
78%
of the financial institutions exposure is secured. For example, securities industry clients and asset managers often borrow against marketable securities held in custody.
For ratings of non-U.S. counterparties, our internal credit rating is generally capped at a rating equivalent to the sovereign rating of the country where the counterparty resides, regardless of the internal credit rating assigned to the counterparty or the underlying collateral.
At
June 30, 2018
, the secured intraday credit provided to dealers in connection with their tri-party repo activity totaled
$18.3 billion
and was primarily included in the securities industry portfolio. Dealers secure the outstanding intraday credit with high-quality liquid collateral having a market value in excess of the amount of the outstanding credit.
Our bank exposure primarily relates to our global trade finance. These exposures are short-term in nature, with 94% due in less than one year. The investment grade percentage of our bank exposure was 67% at June 30, 2018, compared with 68% at Dec. 31, 2017. Our non-investment grade exposures are primarily to Brazil and Turkey. These loans are primarily trade finance loans and syndicated credit facilities.
The asset manager portfolio exposure was high-quality with
99%
of the exposures meeting our investment grade equivalent ratings criteria as of
June 30, 2018
. These exposures are generally short-term liquidity facilities, with the majority to regulated mutual funds.
BNY Mellon
23
Commercial
The commercial portfolio is presented below.
|
Commercial portfolio exposure
|
June 30, 2018
|
Dec. 31, 2017
|
|||||||||||||||||||||
|
(dollars in billions)
|
Loans
|
|
Unfunded
commitments
|
|
Total
exposure
|
|
% Inv.
grade
|
|
% due
<1 yr.
|
|
Loans
|
|
Unfunded
commitments
|
|
Total
exposure
|
|
|||||||
|
Manufacturing
|
$
|
1.2
|
|
$
|
5.4
|
|
$
|
6.6
|
|
95
|
%
|
14
|
%
|
$
|
1.3
|
|
$
|
6.1
|
|
$
|
7.4
|
|
|
|
Services and other
|
0.7
|
|
5.5
|
|
6.2
|
|
97
|
|
28
|
|
0.9
|
|
6.0
|
|
6.9
|
|
|||||||
|
Energy and utilities
|
0.4
|
|
4.6
|
|
5.0
|
|
95
|
|
11
|
|
0.7
|
|
4.4
|
|
5.1
|
|
|||||||
|
Media and telecom
|
0.2
|
|
1.1
|
|
1.3
|
|
94
|
|
—
|
|
—
|
|
1.5
|
|
1.5
|
|
|||||||
|
Total
|
$
|
2.5
|
|
$
|
16.6
|
|
$
|
19.1
|
|
96
|
%
|
17
|
%
|
$
|
2.9
|
|
$
|
18.0
|
|
$
|
20.9
|
|
|
The commercial portfolio exposure was
$19.1 billion
at
June 30, 2018
, a
9%
decrease compared with
$20.9 billion
at
Dec. 31, 2017
, primarily reflecting lower exposure in the manufacturing and services and other portfolios.
Utilities-related exposure represents approximately 76% of the energy and utilities portfolio at June 30, 2018. The remaining exposure in the energy and utilities portfolio, which includes exposure to refining, exploration and production companies, integrated companies and pipelines, was 83% investment grade at
June 30, 2018
, and 77% at
Dec. 31, 2017
.
Our credit strategy is to focus on investment grade clients that are active users of our non-credit services. The following table summarizes the percentage of the financial institutions and commercial portfolio exposures that are investment grade.
|
Percentage of the portfolios that are investment grade
|
||||||||||
|
June 30,
2018 |
|
March 31,
2018 |
|
Dec. 31, 2017
|
|
Sept. 30, 2017
|
|
June 30, 2017
|
|
|
|
Financial institutions
|
94
|
%
|
93
|
%
|
93
|
%
|
93
|
%
|
93
|
%
|
|
Commercial
|
96
|
%
|
95
|
%
|
95
|
%
|
95
|
%
|
96
|
%
|
Wealth management loans and mortgages
Our wealth management exposure was
$17.3 billion
at
June 30, 2018
, compared with
$17.6 billion
at
Dec. 31, 2017
. Wealth management loans and mortgages primarily consist of loans to high-net-worth individuals, which are secured by marketable securities and/or residential property. Wealth management mortgages are primarily interest-only, adjustable-rate mortgages with a weighted-average loan-to-value ratio of
62%
at origination. Less than
1%
of the mortgages were past due at
June 30, 2018
.
At
June 30, 2018
, the wealth management mortgage portfolio consisted of the following geographic concentrations: California -
24%
; New York -
18%
; Massachusetts -
11%
; Florida -
8%
; and other -
39%
.
Commercial real estate
Our commercial real estate exposure totaled $
8.6 billion
at
June 30, 2018
, compared with
$8.4 billion
at
Dec. 31, 2017
. Our income-producing commercial real estate facilities are focused on experienced owners and are structured with moderate leverage based on existing cash flows. Our commercial real estate lending activities also include construction and renovation facilities. Our client base consists of experienced developers and long-term holders of real estate assets. Loans are approved on the basis of existing or projected cash flows and supported by appraisals and knowledge of local market conditions. Development loans are structured with moderate leverage, and in many instances, involve some level of recourse to the developer.
At
June 30, 2018
,
58%
of our commercial real estate portfolio was secured. The secured portfolio is diverse by project type, with
45%
secured by residential buildings,
32%
secured by office buildings,
14%
secured by retail properties and
9%
secured by other categories. Approximately
97%
of the unsecured portfolio consists of real estate investment trusts (“REITs”) and real estate operating companies, which are both predominantly investment grade.
At
June 30, 2018
, our commercial real estate portfolio consists of the following concentrations: REITs and real estate operating companies -
41%
; New York metro -
38%
; and other -
21%
.
24
BNY Mellon
Lease financings
The leasing portfolio exposure totaled $
1.3 billion
at
June 30, 2018
and
Dec. 31, 2017
. At
June 30, 2018
, the lease financings portfolio consisted of exposures backed by well-diversified assets, including large-ticket transportation equipment, and approximately
96%
of the leasing portfolio exposure was investment grade, or investment grade equivalent.
Other residential mortgages
The other residential mortgages portfolio primarily consists of 1-4 family residential mortgage loans and totaled
$653 million
at
June 30, 2018
and
$708 million
at
Dec. 31, 2017
. Included in this portfolio at
June 30, 2018
are
$151 million
of mortgage loans purchased in 2005, 2006 and the first quarter of 2007 that are predominantly prime mortgage loans, with a small portion of Alt-A loans. As of
June 30, 2018
, the purchased loans in this portfolio had a weighted-average loan-to-value ratio of
76%
at origination and
12%
of the serviced loan balance was at least 60 days delinquent. The properties securing the prime and Alt-A mortgage loans were located (in order of concentration) in California, Florida, Virginia, the tri-state area (New York, New Jersey and Connecticut) and Maryland.
To determine the projected loss on the prime and Alt-A mortgage portfolios, we calculate the total estimated defaults of these mortgages and multiply that amount by an estimate of realizable value upon sale in the marketplace (severity).
Overdrafts
Overdrafts primarily relate to custody and securities clearance clients. Overdrafts occur on a daily basis primarily in the custody and securities clearance business and are generally repaid within two business days.
Other loans
Other loans primarily include loans to consumers that are fully collateralized with equities, mutual funds and fixed-income securities.
Margin loans
Margin loans are collateralized with marketable securities, and borrowers are required to maintain a daily collateral margin in excess of 100% of the value of the loan. Margin loans included
$4.0 billion
at
June 30, 2018
and
$4.2 billion
at
Dec. 31, 2017
related to a term loan program that offers fully collateralized loans to broker-dealers.
Asset quality and allowance for credit losses
Our credit strategy is to focus on investment grade clients who are active users of our non-credit services. Our primary exposure to the credit risk of a customer consists of funded loans, unfunded contractual commitments to lend, standby letters of credit (“SBLC”) and overdrafts associated with our custody and securities clearance businesses.
The following table details changes in our allowance for credit losses.
|
Allowance for credit losses activity
|
June 30, 2018
|
|
March 31, 2018
|
|
Dec. 31, 2017
|
|
June 30, 2017
|
|
||||
|
(dollars in millions)
|
||||||||||||
|
Non-margin loans
|
$
|
42,719
|
|
$
|
45,670
|
|
$
|
45,755
|
|
$
|
47,516
|
|
|
Margin loans
|
15,057
|
|
15,139
|
|
15,785
|
|
14,157
|
|
||||
|
Total loans
|
$
|
57,776
|
|
$
|
60,809
|
|
$
|
61,540
|
|
$
|
61,673
|
|
|
Beginning balance of allowance for credit losses
|
$
|
256
|
|
$
|
261
|
|
$
|
265
|
|
$
|
276
|
|
|
Provision for credit losses
|
(3
|
)
|
(5
|
)
|
(6
|
)
|
(7
|
)
|
||||
|
Net recoveries:
|
||||||||||||
|
Other residential mortgages
|
1
|
|
—
|
|
2
|
|
1
|
|
||||
|
Net recoveries
|
1
|
|
—
|
|
2
|
|
1
|
|
||||
|
Ending balance of allowance for credit losses
|
$
|
254
|
|
$
|
256
|
|
$
|
261
|
|
$
|
270
|
|
|
Allowance for loan losses
|
$
|
145
|
|
$
|
156
|
|
$
|
159
|
|
$
|
165
|
|
|
Allowance for lending-related commitments
|
109
|
|
100
|
|
102
|
|
105
|
|
||||
|
Allowance for loan losses as a percentage of total loans
|
0.25
|
%
|
0.26
|
%
|
0.26
|
%
|
0.27
|
%
|
||||
|
Allowance for loan losses as a percentage of non-margin loans
|
0.34
|
|
0.34
|
|
0.35
|
|
0.35
|
|
||||
|
Total allowance for credit losses as a percentage of total loans
|
0.44
|
|
0.42
|
|
0.42
|
|
0.44
|
|
||||
|
Total allowance for credit losses as a percentage of non-margin loans
|
0.59
|
|
0.56
|
|
0.57
|
|
0.57
|
|
||||
BNY Mellon
25
The allowance for credit losses decreased $7 million compared with Dec. 31, 2017 and $16 million compared with June 30, 2017. Both decreases were driven by the credit to provision for credit losses, partially offset by the impact of an update to the usage given default parameter.
The usage given default parameter associated with the estimate of the probability of drawdown at default was updated which resulted in an $11 million increase to the allowance for lending-related commitments.
We had
$15.1 billion
of secured margin loans on our balance sheet at
June 30, 2018
compared with
$15.8 billion
at
Dec. 31, 2017
and
$14.2 billion
at
June 30, 2017
. We have rarely suffered a loss on these types of loans and do not allocate any of our allowance for credit losses to them. As a result, we believe that the ratio of total allowance for credit losses as a percentage of non-margin loans is a more appropriate metric to measure the adequacy of the reserve.
The allowance for loan losses and allowance for lending-related commitments represent management’s estimate of losses inherent in our credit portfolio. This evaluation process is subject to numerous estimates and judgments. To the extent actual results differ from forecasts or management’s judgment, the allowance for credit losses may be greater or less than future charge-offs.
Based on an evaluation of the allowance for credit losses as discussed in “Critical accounting estimates” and Note 1 of the Notes to Consolidated Financial Statements, both in our 2017 Annual Report, we have allocated our allowance for credit losses as follows.
|
Allocation of allowance
|
June 30, 2018
|
|
March 31, 2018
|
|
Dec. 31, 2017
|
|
June 30, 2017
|
|
|
|
Commercial
|
30
|
%
|
29
|
%
|
30
|
%
|
30
|
%
|
|
|
Commercial real estate
|
29
|
|
29
|
|
29
|
|
28
|
|
|
|
Foreign
|
13
|
|
14
|
|
13
|
|
13
|
|
|
|
Financial institutions
|
10
|
|
9
|
|
9
|
|
8
|
|
|
|
Wealth management
(a)
|
9
|
|
9
|
|
8
|
|
9
|
|
|
|
Other residential mortgages
|
7
|
|
7
|
|
8
|
|
8
|
|
|
|
Lease financing
|
2
|
|
3
|
|
3
|
|
4
|
|
|
|
Total
|
100
|
%
|
100
|
%
|
100
|
%
|
100
|
%
|
|
|
(a)
|
Includes the allowance for wealth management mortgages.
|
The allocation of the allowance for credit losses is inherently judgmental, and the entire allowance for credit losses is available to absorb credit losses regardless of the nature of the losses.
The credit rating assigned to each credit is a significant variable in determining the allowance. If each credit were rated one grade better, the allowance would have decreased by $61 million, while if each credit were rated one grade worse, the allowance would have increased by $96 million. Similarly, if the loss given default were one rating worse, the allowance would have increased by $41 million, while if the loss given default were one rating better, the allowance would have decreased by $28 million. For impaired credits, if the net carrying value of the loans was 10% higher or lower, the allowance would have decreased or increased by less than $1 million, respectively.
Nonperforming assets
Total nonperforming assets were
$82 million
at
June 30, 2018
compared with
$90 million
at
Dec. 31, 2017
. The decrease primarily reflects lower other residential mortgage loans driven by paydowns and sales. See Note 5 of the Notes to Consolidated Financial Statements for additional information on nonperforming assets.
Deposits
Total deposits were
$230.6 billion
at
June 30, 2018
, a decrease of
6%
compared with
$244.3 billion
at
Dec. 31, 2017
. The decrease in deposits primarily reflects lower interest-bearing deposits in non-U.S. offices and noninterest-bearing deposits principally in U.S. offices, partially offset by higher interest-bearing deposits in U.S. offices.
Noninterest-bearing deposits were
$75.5 billion
at
June 30, 2018
compared with
$82.7 billion
at
Dec. 31, 2017
. Interest-bearing deposits were
$155.1 billion
at
June 30, 2018
compared with
$161.6 billion
at
Dec. 31, 2017
.
Short-term borrowings
We fund ourselves primarily through deposits and, to a lesser extent, other short-term borrowings and long-term debt. Short-term borrowings consist of federal funds purchased and securities sold under repurchase agreements, payables to customers and broker-dealers, commercial paper and other borrowed funds. Certain other borrowings, for example, securities sold under repurchase agreements, require the delivery of securities as collateral.
26
BNY Mellon
See “Liquidity and dividends” for a discussion of long-term debt and liquidity metrics that we monitor.
Information related to federal funds purchased and securities sold under repurchase agreements is presented below.
|
Federal funds purchased and securities sold under repurchase agreements
|
|||||||||
|
Quarter ended
|
|||||||||
|
(dollars in millions)
|
June 30, 2018
|
|
March 31, 2018
|
|
June 30, 2017
|
|
|||
|
Maximum month-end balance during the quarter
|
$
|
14,138
|
|
$
|
21,600
|
|
$
|
19,786
|
|
|
Average daily balance
(a)
|
$
|
18,146
|
|
$
|
18,963
|
|
$
|
17,970
|
|
|
Weighted-average rate during the quarter
|
3.48
|
%
|
2.29
|
%
|
0.84
|
%
|
|||
|
Ending balance
|
$
|
13,200
|
|
$
|
21,600
|
|
$
|
10,934
|
|
|
Weighted-average rate at period end
|
4.24
|
%
|
2.24
|
%
|
0.93
|
%
|
|||
|
(a)
|
Includes the impact of offsetting under enforceable netting agreements of
$17,975 million
for the
second quarter of 2018
,
$13,870 million
for the
first quarter of 2018
and
$913 million
for the
second quarter of 2017
.
|
Fluctuations of federal funds purchased and securities sold under repurchase agreements between periods reflect changes in overnight borrowing opportunities. The increase in the weighted-average rates, compared with both
March 31, 2018
and
June 30, 2017
, primarily reflects the impact of offsetting under enforceable netting agreements on the balance sheet and higher interest rates.
Information related to payables to customers and broker-dealers is presented below.
|
Payables to customers and broker-dealers
|
|||||||||
|
Quarter ended
|
|||||||||
|
(dollars in millions)
|
June 30, 2018
|
|
March 31, 2018
|
|
June 30, 2017
|
|
|||
|
Maximum month-end balance during the quarter
|
$
|
20,349
|
|
$
|
20,905
|
|
$
|
21,622
|
|
|
Average daily balance
(a)
|
$
|
19,402
|
|
$
|
20,389
|
|
$
|
21,078
|
|
|
Weighted-average rate during the quarter
(a)
|
1.10
|
%
|
0.75
|
%
|
0.30
|
%
|
|||
|
Ending balance
|
$
|
19,123
|
|
$
|
20,172
|
|
$
|
21,622
|
|
|
Weighted-average rate at period end
|
1.08
|
%
|
0.85
|
%
|
0.34
|
%
|
|||
|
(a)
|
The weighted-average rate is calculated based on, and is applied to, the average interest-bearing payables to customers and broker-dealers, which were
$16,349 million
in the
second quarter of 2018
,
$17,101 million
in the
first quarter of 2018
and
$20,609 million
in the
second quarter of 2017
.
|
Payables to customers and broker-dealers represent funds awaiting re-investment and short sale proceeds payable on demand. Payables to customers and broker-dealers are driven by customer trading activity levels and market volatility.
Information related to commercial paper is presented below.
|
Commercial paper
|
Quarter ended
|
||||||||
|
(dollars in millions)
|
June 30, 2018
|
|
March 31, 2018
|
|
June 30, 2017
|
|
|||
|
Maximum month-end balance during the quarter
|
$
|
4,470
|
|
$
|
3,936
|
|
$
|
2,193
|
|
|
Average daily balance
|
$
|
3,869
|
|
$
|
3,131
|
|
$
|
2,215
|
|
|
Weighted-average rate during the quarter
|
2.13
|
%
|
1.59
|
%
|
0.95
|
%
|
|||
|
Ending balance
|
$
|
2,508
|
|
$
|
3,936
|
|
$
|
876
|
|
|
Weighted-average rate at period end
|
2.24
|
%
|
1.97
|
%
|
0.98
|
%
|
|||
The Bank of New York Mellon, our largest bank subsidiary, issues commercial paper that matures within 397 days from date of issue and is not redeemable prior to maturity or subject to voluntary prepayment.
The increase in commercial paper compared with
June 30, 2017
primarily reflects management of overall liquidity. The increase in weighted-average rates, compared with the
second quarter of 2017
, primarily reflects increases in the Fed Funds effective rate and the issuance of higher-yielding term commercial paper.
Information related to other borrowed funds is presented below.
|
Other borrowed funds
|
Quarter ended
|
||||||||
|
(dollars in millions)
|
June 30, 2018
|
|
March 31, 2018
|
|
June 30, 2017
|
|
|||
|
Maximum month-end balance during the quarter
|
$
|
3,053
|
|
$
|
2,227
|
|
$
|
2,379
|
|
|
Average daily balance
|
$
|
2,399
|
|
$
|
2,119
|
|
$
|
1,193
|
|
|
Weighted-average rate during the quarter
|
2.40
|
%
|
1.67
|
%
|
1.24
|
%
|
|||
|
Ending balance
|
$
|
3,053
|
|
$
|
1,550
|
|
$
|
1,338
|
|
|
Weighted-average rate at period end
|
2.53
|
%
|
2.03
|
%
|
1.69
|
%
|
|||
Other borrowed funds primarily include borrowings from the Federal Home Loan Bank (“FHLB”), overdrafts of sub-custodian account balances in our Investment Services businesses, capital lease obligations and borrowings under lines of credit by our Pershing subsidiaries. Overdrafts typically relate
BNY Mellon
27
to timing differences for settlements. The increase in other borrowed funds compared with both
March 31, 2018
and
June 30, 2017
primarily reflects borrowings from the FHLB.
Liquidity and dividends
BNY Mellon defines liquidity as the ability of the Parent and its subsidiaries to access funding or convert assets to cash quickly and efficiently, or to roll over or issue new debt, especially during periods of market stress, at a reasonable cost and in order to meet its short-term (up to one year) obligations. Funding liquidity risk is the risk that BNY Mellon cannot meet its cash and collateral obligations at a reasonable cost for both expected and unexpected cash flow and collateral needs without adversely affecting daily operations or our financial condition. Funding liquidity risk can arise from funding mismatches, market constraints from the inability to convert assets to cash, the inability to hold or raise cash, low overnight deposits, deposit run-off or contingent liquidity events.
We also manage liquidity risks on an intraday basis. Intraday liquidity risk is the risk that BNY Mellon cannot access funds during the business day to make payments or settle immediate obligations, usually in real time. Intraday liquidity risk can arise from timing mismatches, market constraints from an inability to convert assets to cash, an inability to raise cash intraday, low overnight deposits and/or adverse stress events.
Changes in economic conditions or exposure to credit, market, operational, legal and reputational risks also can affect BNY Mellon’s liquidity risk profile and are considered in our liquidity risk framework.
The Parent’s policy is to have access to sufficient unencumbered cash and cash equivalents at each quarter-end to cover forecasted debt redemptions, net interest payments and net tax payments for the following 18-month period, and to provide sufficient collateral to satisfy transactions subject to Section 23A of the Federal Reserve Act. As of
June 30, 2018
, the Parent was in compliance with this policy. For additional information on our liquidity policy, see “Risk Management - Liquidity risk” in our 2017 Annual Report. Our overall approach to liquidity management is further described in “Liquidity and dividends” in our 2017 Annual Report.
We define available funds for internal liquidity management purposes as liquid funds (which include interest-bearing deposits with banks and federal funds sold and securities purchased under resale agreements), cash and due from banks, and interest-bearing deposits with the Federal Reserve and other central banks. The following table presents our total available funds, including liquid funds, at period end and on an average basis.
|
Available and liquid funds
|
June 30, 2018
|
|
Dec. 31, 2017
|
|
Average
|
||||||||||
|
(in millions)
|
2Q18
|
|
1Q18
|
|
2Q17
|
|
|||||||||
|
Available funds:
|
|||||||||||||||
|
Liquid funds:
|
|||||||||||||||
|
Interest-bearing deposits with banks
|
$
|
16,134
|
|
$
|
11,979
|
|
$
|
15,748
|
|
$
|
13,850
|
|
$
|
14,832
|
|
|
Federal funds sold and securities purchased under resale agreements
|
26,494
|
|
28,135
|
|
28,051
|
|
27,903
|
|
26,873
|
|
|||||
|
Total liquid funds
|
42,628
|
|
40,114
|
|
43,799
|
|
41,753
|
|
41,705
|
|
|||||
|
Cash and due from banks
|
5,361
|
|
5,382
|
|
4,916
|
|
5,047
|
|
4,972
|
|
|||||
|
Interest-bearing deposits with the Federal Reserve and other central banks
|
75,116
|
|
91,510
|
|
69,676
|
|
79,068
|
|
69,316
|
|
|||||
|
Total available funds
|
$
|
123,105
|
|
$
|
137,006
|
|
$
|
118,391
|
|
$
|
125,868
|
|
$
|
115,993
|
|
|
Total available funds as a percentage of total assets
|
35
|
%
|
37
|
%
|
34
|
%
|
35
|
%
|
34
|
%
|
|||||
We had
$42.6 billion
of liquid funds at
June 30, 2018
and
$40.1 billion
at
Dec. 31, 2017
. Of the
$42.6 billion
in liquid funds held at
June 30, 2018
,
$16.1 billion
was placed in interest-bearing deposits with large, highly rated global financial institutions with a weighted-average life to maturity of approximately
17 days. Of the
$16.1 billion
, $2.4 billion was placed with banks in the Eurozone.
Total available funds were
$123.1 billion
at
June 30, 2018
, compared with
$137.0 billion
at
Dec. 31, 2017
. The decrease was primarily due to a decrease in
28
BNY Mellon
interest-bearing deposits with the Federal Reserve and other central banks.
Average non-core sources of funds, such as money market rate accounts, federal funds purchased and securities sold under repurchase agreements, trading liabilities, commercial paper and other borrowings, were
$34.6 billion
for the
six months ended June 30, 2018
and
$30.2 billion
for the
six months ended June 30, 2017
. The increase primarily reflects increases in money market rate accounts, commercial paper and other borrowed funds.
Average foreign deposits, primarily from our European-based Investment Services business, were
$101.3 billion
for the
six months ended June 30, 2018
, compared with
$92.0 billion
for the
six months ended June 30, 2017
. Domestic savings, interest-bearing demand and time deposits averaged
$44.0 billion
for the
six months ended June 30, 2018
and
$41.7 billion
for the
six months ended June 30, 2017
. The increase primarily reflects an increase in demand deposits.
Average payables to customers and broker-dealers were
$16.7 billion
for the
six months ended June 30, 2018
and
$19.8 billion
for the six months ended June
30, 2017. Payables to customers and broker-dealers are driven by customer trading activity and market volatility.
Long-term debt averaged
$28.4 billion
for the
six months ended June 30, 2018
and
$26.6 billion
for the
six months ended June 30, 2017
, with the increase reflecting issuances of long-term debt.
Average noninterest-bearing deposits decreased to
$67.9 billion
for the
six months ended June 30, 2018
from
$73.7 billion
for the
six months ended June 30, 2017
, reflecting a decrease in client deposits.
A significant reduction in our Investment Services business would reduce our access to deposits. See “Asset/liability management” for additional factors that could impact our deposit balances.
Sources of liquidity
The Parent’s three major sources of liquidity are access to the debt and equity markets, dividends from its subsidiaries, and cash on hand and cash otherwise made available in business-as-usual circumstances to the Parent through a committed credit facility with our intermediate holding company (“IHC”).
Our ability to access the capital markets on favorable terms, or at all, is partially dependent on our credit ratings, which are as follows:
|
Credit ratings at June 30, 2018
|
|||||||
|
|
Moody’s
|
S&P
|
Fitch
|
DBRS
|
|||
|
Parent:
|
|
||||||
|
Long-term senior debt
|
A1
|
A
|
AA-
|
AA (low)
|
|||
|
Subordinated debt
|
A2
|
A-
|
A+
|
A (high)
|
|||
|
Preferred stock
|
Baa1
|
BBB
|
BBB
|
A (low)
|
|||
|
Outlook - Parent:
|
Stable
|
Stable
|
Stable
|
Stable
|
|||
|
The Bank of New York Mellon:
|
|||||||
|
Long-term senior debt
|
Aa2
|
AA-
|
AA
|
AA
|
|||
|
Subordinated debt
|
Aa3
|
A
|
A+
|
NR
|
|||
|
Long-term deposits
|
Aa1
|
AA-
|
AA+
|
AA
|
|||
|
Short-term deposits
|
P1
|
A-1+
|
F1+
|
R-1 (high)
|
|||
|
Commercial paper
|
P1
|
A-1+
|
F1+
|
R-1 (high)
|
|||
|
BNY Mellon, N.A.:
|
|||||||
|
Long-term senior debt
|
Aa2
|
AA-
|
AA
|
(a)
|
AA
|
||
|
Long-term deposits
|
Aa1
|
AA-
|
AA+
|
AA
|
|||
|
Short-term deposits
|
P1
|
A-1+
|
F1+
|
R-1 (high)
|
|||
|
Outlook - Banks:
|
Stable
|
Stable
|
Stable
|
Stable
|
|||
|
(a)
|
Represents senior debt issuer default rating.
|
NR - Not rated.
BNY Mellon
29
Long-term debt totaled
$28.3 billion
at
June 30, 2018
and
$28.0 billion
at
Dec. 31, 2017
. The balance reflects issuances of
$3.0 billion
, offset by the maturities of
$2.2 billion
and a decrease in the fair value of hedged long-term debt. The Parent has
$1.45 billion
of long-term debt that will mature in the second half of
2018
.
In the second quarter of 2018, BNY Mellon established programs for the issuance of notes and certificates of deposits (“CDs”) issued by The Bank of New York Mellon, our largest bank subsidiary. These programs are designed to improve diversity of our funding sources and provide additional flexibility in our liquidity planning. There were no notes or CDs issued through these programs in the second quarter of 2018.
The Bank of New York Mellon, our largest bank subsidiary, issues commercial paper that matures within 397 days from date of issue and is not redeemable prior to maturity or subject to voluntary prepayment.
The average commercial paper borrowings were
$3.9 billion
for the
three months ended June 30, 2018
and
$2.2 billion
for the
three months ended June 30, 2017
. Commercial paper outstanding was
$2.5 billion
at
June 30, 2018
and
$3.1 billion
at
Dec. 31, 2017
.
Subsequent to
June 30, 2018
, our U.S. bank subsidiaries could declare dividends to the Parent of approximately
$5.0 billion
, without the need for a regulatory waiver. In addition, at
June 30, 2018
, non-bank subsidiaries of the Parent had liquid assets of approximately
$1.1 billion
.
Restrictions on our ability to obtain funds from our subsidiaries are discussed in more detail in “Supervision and Regulation - Capital Planning and Stress Testing - Payment of Dividends, Stock Repurchases and Other Capital Distributions” and in Note 17 of the Notes to Consolidated Financial Statements in our 2017 Annual Report.
Pershing LLC has uncommitted lines of credit in place for liquidity purposes which are guaranteed by the Parent. Pershing LLC has eight separate uncommitted lines of credit amounting to $1.5 billion in aggregate. There were no borrowings under these lines in the
second quarter of 2018
. Pershing Limited, an indirect UK-based subsidiary of BNY Mellon, has two separate uncommitted lines of credit amounting to $250 million in aggregate. Average borrowings under these lines were $1 million, in aggregate, in the
second quarter of 2018
.
The double leverage ratio is the ratio of our equity investment in subsidiaries divided by our consolidated parent company equity, which includes our noncumulative perpetual preferred stock. In short, the double leverage ratio measures the extent to which equity in subsidiaries is financed by Parent company debt. As the double leverage ratio increases, this can reflect greater demands on a company’s cash flows in order to service interest payments and debt maturities. BNY Mellon’s double leverage ratio is managed in a range considering the high level of unencumbered available liquid assets held in its principal subsidiaries (such as central bank deposits and government securities), the Company’s cash generating fee-based business model, with fee revenue representing
78%
of total revenue in the
second quarter of 2018
, and the dividend capacity of our banking subsidiaries. Our double leverage ratio was
121.2%
at
June 30, 2018
and
122.5%
at
Dec. 31, 2017
, and within the range targeted by management.
Uses of funds
The Parent’s major uses of funds are payment of dividends, repurchases of common stock, principal and interest payments on its borrowings, acquisitions and additional investments in its subsidiaries.
In April 2018, our quarterly cash dividend to common shareholders was
$0.24
per common share. Our common stock dividend payout ratio was
22%
for the
first six months of 2018
.
In July 2018, BNY Mellon increased the quarterly cash dividend on common stock by approximately 17%, from $0.24 to $0.28 per share. This increased quarterly cash dividend will be paid on Aug. 10, 2018.
In the
second quarter of 2018
, we repurchased
12 million
common shares at an average price of
$55.88
per common share for a total cost of
$651 million
.
In June 2018, following the Federal Reserve’s non-objection to our 2018 capital plan, BNY Mellon announced a share repurchase plan providing for the repurchase of up to $2.4 billion of common stock starting in the third quarter of 2018 and continuing through the second quarter of 2019. This new share repurchase plan replaces all previously authorized share repurchase plans.
30
BNY Mellon
Liquidity coverage ratio
U.S. regulators have established an LCR that requires certain banking organizations, including BNY Mellon, to maintain a minimum amount of unencumbered high-quality liquid assets (“HQLA”) sufficient to withstand the net cash outflow under a hypothetical standardized acute liquidity stress scenario for a 30-day time horizon.
The following table presents the consolidated HQLA at
June 30, 2018
, and the average HQLA and average LCR for the
second quarter of 2018
.
|
Consolidated HQLA and LCR
|
June 30, 2018
|
|
|
|
(dollars in billions)
|
|||
|
Securities
(a)
|
$
|
104
|
|
|
Cash
(b)
|
68
|
|
|
|
Total consolidated HQLA
(c)
|
$
|
172
|
|
|
Total consolidated HQLA - average
(c)
|
$
|
168
|
|
|
Average LCR
|
118
|
%
|
|
|
(a)
|
Primarily includes securities of U.S. government-sponsored enterprises, sovereign securities, U.S. Treasury, U.S. agency and investment-grade corporate debt.
|
|
(b)
|
Primarily includes cash on deposit with central banks.
|
|
(c)
|
Consolidated HQLA presented before adjustments. After haircuts and the impact of trapped liquidity, consolidated HQLA totaled
$136 billion
at
June 30, 2018
and averaged
$129 billion
for the
second quarter of 2018
.
|
The U.S. LCR rule requires BNY Mellon and each of our affected domestic bank subsidiaries to meet an LCR of at least 100%. BNY Mellon and each of our domestic bank subsidiaries were compliant with the U.S. LCR requirements throughout the
first six months of 2018
.
We also perform liquidity stress tests (“LSTs”) to evaluate whether the Company maintains sufficient liquidity resources under multiple stress scenarios. LSTs are based on scenarios that measure liquidity risks under unlikely but plausible conditions. We perform these tests under various time horizons ranging from one day to one year in a base case, as well as supplemental tests to determine whether the Company’s liquidity is sufficient for severe market events and firm-specific events. Our LST framework includes a test known as the Resolution Liquidity Adequacy and Positioning (“RLAP”). The RLAP test is designed to ensure that the liquidity needs of certain key subsidiaries in a stress environment can be met by available resources held at the entity or at the Parent or IHC, as applicable. Under our scenario
testing program, the results of the tests indicate that the Company has sufficient liquidity.
Statement of cash flows
The following summarizes the activity reflected on the statement of cash flows. While this information may be helpful to highlight certain macro trends and business strategies, the cash flow analysis may not be as relevant when analyzing changes in our net earnings and net assets. We believe that in addition to the traditional cash flow analysis, the discussion related to liquidity and dividends and asset/liability management herein may provide more useful context in evaluating our liquidity position and related activity.
Net cash provided by operating activities was
$1.6 billion
in the
six months ended June 30, 2018
, compared with cash used for operating activities of
$1.8 billion
in the
six months ended June 30, 2017
. In the
first six months of 2018
, net cash provided by operations primarily resulted from earnings, partially offset by changes in accruals and trading activities. In the
first six months of 2017
, net cash used for operations primarily resulted from changes in accruals, partially offset by earnings.
Net cash provided by investing activities was
$15.2 billion
in the
six months ended June 30, 2018
, compared with net cash used for investing activities of
$13.7 billion
in the
six months ended June 30, 2017
. In the
first six months of 2018
, net cash provided by investing activities primarily reflects changes in interest-bearing deposits with the Federal Reserve and other central banks and changes in loans, partially offset by changes in interest-bearing deposits with banks. In the
first six months of 2017
, net cash used for investing activities primarily reflects changes in interest-bearing deposits with the Federal Reserve and other central banks.
Net cash used for financing activities was
$16.8 billion
in the
six months ended June 30, 2018
, compared with net cash provided by financing activities of
$15.1 billion
in the
six months ended June 30, 2017
. In the
first six months of 2018
, net cash used for financing activities primarily reflects changes in deposits, repayment of long-term debt, changes in federal funds purchased and securities sold under repurchase agreements and common stock repurchases, partially offset by net proceeds from the issuance of long-term debt. In the
first six months of
BNY Mellon
31
2017
, net cash provided by financing activities primarily reflects changes in deposits and proceeds
from the issuance of long-term debt, partially offset by common stock repurchases.
Capital
|
Capital data
(dollars in millions except per share amounts; common shares in thousands)
|
June 30, 2018
|
|
March 31, 2018
|
|
Dec. 31, 2017
|
|
|||
|
Average common equity to average assets
|
10.9
|
%
|
10.5
|
%
|
10.5
|
%
|
|||
|
At period end:
|
|||||||||
|
BNY Mellon shareholders’ equity to total assets ratio
|
11.8
|
%
|
11.2
|
%
|
11.1
|
%
|
|||
|
BNY Mellon common shareholders’ equity to total assets ratio
|
10.8
|
%
|
10.2
|
%
|
10.1
|
%
|
|||
|
Total BNY Mellon shareholders’ equity
|
$
|
41,505
|
|
$
|
41,728
|
|
$
|
41,251
|
|
|
Total BNY Mellon common shareholders’ equity
(a)
|
$
|
37,963
|
|
$
|
38,186
|
|
$
|
37,709
|
|
|
BNY Mellon tangible common shareholders’ equity – Non-GAAP
(a)
|
$
|
19,000
|
|
$
|
18,978
|
|
$
|
18,486
|
|
|
Book value per common share
(a)
|
$
|
37.97
|
|
$
|
37.78
|
|
$
|
37.21
|
|
|
Tangible book value per common share – Non-GAAP
(a)
|
$
|
19.00
|
|
$
|
18.78
|
|
$
|
18.24
|
|
|
Closing stock price per common share
|
$
|
53.93
|
|
$
|
51.53
|
|
$
|
53.86
|
|
|
Market capitalization
|
$
|
53,927
|
|
$
|
52,080
|
|
$
|
54,584
|
|
|
Common shares outstanding
|
999,945
|
|
1,010,676
|
|
1,013,442
|
|
|||
|
Cash dividends per common share
|
$
|
0.24
|
|
$
|
0.24
|
|
$
|
0.24
|
|
|
Common dividend payout ratio
|
23
|
%
|
22
|
%
|
22
|
%
|
|||
|
Common dividend yield
(annualized)
|
1.8
|
%
|
1.9
|
%
|
1.8
|
%
|
|||
|
(a)
|
See “Supplemental information – Explanation of GAAP and Non-GAAP financial measures” beginning on page
40
for a reconciliation of GAAP to Non-GAAP.
|
The Bank of New York Mellon Corporation total shareholders’ equity increased to
$41.5 billion
at
June 30, 2018
from
$41.3 billion
at
Dec. 31, 2017
. The increase primarily reflects earnings, partially offset by share repurchases, payments of dividends and unrealized losses on securities available-for-sale.
The unrealized loss, net of tax, on our available-for-sale securities portfolio included in accumulated other comprehensive income was
$92 million
at
June 30, 2018
, compared with a net unrealized gain of $184 million at
Dec. 31, 2017
. The decrease in the unrealized gain, net of tax, was primarily driven by higher interest rates.
In the
second quarter of 2018
, we repurchased
12 million
common shares at an average price of
$55.88
per common share for a total cost of
$651 million
under the current program.
Capital adequacy
Regulators establish certain levels of capital for BHCs and banks, including BNY Mellon and our bank subsidiaries, in accordance with established quantitative measurements. For the Parent to maintain its status as a financial holding company,
our U.S. bank subsidiaries and BNY Mellon must, among other things, qualify as “well capitalized.”
As of
June 30, 2018
and
Dec. 31, 2017
,
BNY Mellon and our U.S. bank subsidiaries were “well capitalized.”
Failure to satisfy regulatory standards, including “well capitalized” status or capital adequacy rules more generally, could result in limitations on our activities and adversely affect our financial condition. See the discussion of these matters in “Supervision and Regulation - Regulated Entities of BNY Mellon and Ancillary Regulatory Requirements” and “Risk Factors - Operational Risk - Failure to satisfy regulatory standards, including “well capitalized” and “well managed” status or capital adequacy and liquidity rules more generally, could result in limitations on our activities and adversely affect our business and financial condition” in our 2017 Annual Report.
The U.S. banking agencies’ capital rules are based on the framework adopted by the Basel Committee on Banking Supervision (“BCBS”), as amended from time to time. For additional information on these capital requirements, see “Supervision and Regulation” in our 2017 Annual Report. BNY Mellon is subject to the U.S. capital rules, which are
32
BNY Mellon
being gradually phased-in over a multi-year period through Jan. 1, 2019. The phase-in requirements for capital were completed on Jan. 1, 2018.
Our risk-based capital adequacy is determined using the higher of risk-weighted assets (“RWAs”) determined using the Advanced Approach and Standardized Approach.
The table below presents our consolidated and largest bank subsidiary regulatory capital ratios.
|
Consolidated and largest bank subsidiary regulatory capital ratios
|
June 30, 2018
|
Dec. 31, 2017
|
|||||||||||||||
|
Well capitalized
|
|
Minimum
required |
|
Capital
ratios
|
|
March 31, 2018
|
|
Fully phased-in
|
|
Transitional
|
|
(b)
|
|||||
|
(a)
|
|||||||||||||||||
|
Consolidated regulatory capital ratios
:
(c)(d)
|
|||||||||||||||||
|
Advanced Approach:
|
|||||||||||||||||
|
CET1 ratio
|
N/A
|
|
(e)
|
7.5
|
%
|
11.0
|
%
|
10.7
|
%
|
10.3
|
%
|
10.7
|
%
|
||||
|
Tier 1 capital ratio
|
6
|
%
|
9
|
|
13.1
|
|
12.7
|
|
12.3
|
|
12.7
|
|
|||||
|
Total capital ratio
|
10
|
|
11
|
|
13.8
|
|
13.4
|
|
13.0
|
|
13.4
|
|
|||||
|
Standardized Approach:
|
|||||||||||||||||
|
CET1 ratio
|
N/A
|
|
(e)
|
7.5
|
%
|
11.9
|
%
|
11.7
|
%
|
11.5
|
%
|
11.9
|
%
|
||||
|
Tier 1 capital ratio
|
6
|
%
|
9
|
|
14.1
|
|
14.0
|
|
13.7
|
|
14.2
|
|
|||||
|
Total capital ratio
|
10
|
|
11
|
|
15.1
|
|
14.9
|
|
14.7
|
|
15.1
|
|
|||||
|
Tier 1 leverage ratio
|
N/A
|
|
(e)
|
4
|
|
6.7
|
|
6.5
|
|
6.4
|
|
6.6
|
|
||||
|
SLR
(f)
|
N/A
|
|
(e)
|
5
|
|
6.1
|
|
5.9
|
|
5.9
|
|
6.1
|
|
||||
|
The Bank of New York Mellon regulatory
capital ratios
:
(c)
|
|||||||||||||||||
|
Advanced Approach:
|
|||||||||||||||||
|
CET1 ratio
|
6.5
|
%
|
6.375
|
%
|
14.9
|
%
|
14.6
|
%
|
N/A
|
|
14.1
|
%
|
|||||
|
Tier 1 capital ratio
|
8
|
|
7.875
|
|
15.2
|
|
14.8
|
|
N/A
|
|
14.4
|
|
|||||
|
Total capital ratio
|
10
|
|
9.875
|
|
15.6
|
|
15.2
|
|
N/A
|
|
14.7
|
|
|||||
|
Tier 1 leverage ratio
|
5
|
|
4
|
|
7.9
|
|
7.6
|
|
N/A
|
|
7.6
|
|
|||||
|
SLR
(f)
|
6
|
|
3
|
|
7.1
|
|
6.8
|
|
6.7
|
|
6.9
|
|
|||||
|
(a)
|
Minimum requirements for June 30, 2018 include minimum thresholds plus currently applicable buffers.
|
|
(b)
|
Reflects transitional adjustments to CET1, Tier 1 capital, Tier 2 capital required in 2017 under the U.S. capital rules.
|
|
(c)
|
For our CET1, Tier 1 capital and Total capital ratios, our effective capital ratios under U.S. capital rules are the lower of the ratios as calculated under the Standardized and Advanced Approaches. The Tier 1 leverage ratio is based on Tier 1 capital and quarterly average total assets.
|
|
(d)
|
See page
35
for the capital ratios with the phase-in of the capital conservation buffer and the U.S. G-SIB surcharge, as well as the introduction of the SLR buffer.
|
|
(e)
|
The Federal Reserve’s regulations do not establish well capitalized thresholds for these measures for BHCs.
|
|
(f)
|
SLR became a binding measure on Jan. 1, 2018. The SLR is based on Tier 1 capital and total leverage exposure, which includes certain off-balance sheet exposures.
|
Our CET1 ratio determined under the Advanced Approach was
11.0%
at
June 30, 2018
and
10.7%
, on a transitional basis, at
Dec. 31, 2017
.
The ratio increased compared to Dec. 31, 2017, primarily reflecting lower RWAs and capital generated through earnings, partially offset by the final phase-in requirements under the U.S. capital rules and the capital deployed through common stock repurchased and dividends paid.
Our SLR was
6.1%
at
June 30, 2018
and
6.1%
, on a transitional basis, at
Dec. 31, 2017
.
For additional information on the U.S. capital rules, see “Supervision and Regulation - Capital Requirements - Generally” in our 2017 Annual
Report and “Recent regulatory developments” in this report.
The Advanced Approach capital ratios are significantly impacted by RWAs for operational risk. Our operational loss risk model is informed by external losses, including fines and penalties levied against institutions in the financial services industry, particularly those that relate to businesses in which we operate, and as a result external losses have impacted and could in the future impact the amount of capital that we are required to hold.
Our capital ratios are necessarily subject to, among other things, anticipated compliance with all necessary enhancements to model calibration,
BNY Mellon
33
approval by regulators of certain models used as part of RWA calculations, other refinements, further implementation guidance from regulators, market practices and standards and any changes BNY Mellon
may make to its businesses. As a consequence of these factors, our capital ratios may materially change, and may be volatile over time and from period to period.
The following table presents our capital components and RWAs.
|
Capital components and risk-weighted assets
|
Dec. 31, 2017
|
||||||||||||
|
June 30, 2018
|
|
March 31, 2018
|
|
Fully phased-in
|
|
Transitional
Approach |
|
(a)
|
|||||
|
(in millions)
|
|||||||||||||
|
CET1:
|
|||||||||||||
|
Common shareholders’ equity
|
$
|
37,963
|
|
$
|
38,186
|
|
$
|
37,709
|
|
$
|
37,859
|
|
|
|
Adjustments for:
|
|||||||||||||
|
Goodwill and intangible assets
(b)
|
(18,963
|
)
|
(19,208
|
)
|
(19,223
|
)
|
(18,684
|
)
|
|||||
|
Net pension fund assets
|
(216
|
)
|
(218
|
)
|
(211
|
)
|
(169
|
)
|
|||||
|
Equity method investments
|
(363
|
)
|
(376
|
)
|
(387
|
)
|
(372
|
)
|
|||||
|
Deferred tax assets
|
(41
|
)
|
(42
|
)
|
(41
|
)
|
(33
|
)
|
|||||
|
Other
|
6
|
|
(8
|
)
|
(9
|
)
|
(8
|
)
|
|||||
|
Total CET1
|
18,386
|
|
18,334
|
|
17,838
|
|
18,593
|
|
|||||
|
Other Tier 1 capital:
|
|||||||||||||
|
Preferred stock
|
3,542
|
|
3,542
|
|
3,542
|
|
3,542
|
|
|||||
|
Deferred tax assets
|
—
|
|
—
|
|
—
|
|
(8
|
)
|
|||||
|
Net pension fund assets
|
—
|
|
—
|
|
—
|
|
(42
|
)
|
|||||
|
Other
|
(51
|
)
|
(41
|
)
|
(41
|
)
|
(41
|
)
|
|||||
|
Total Tier 1 capital
|
$
|
21,877
|
|
$
|
21,835
|
|
$
|
21,339
|
|
$
|
22,044
|
|
|
|
Tier 2 capital:
|
|||||||||||||
|
Subordinated debt
|
$
|
1,250
|
|
$
|
1,250
|
|
$
|
1,250
|
|
$
|
1,250
|
|
|
|
Allowance for credit losses
|
254
|
|
256
|
|
261
|
|
261
|
|
|||||
|
Other
|
(6
|
)
|
(1
|
)
|
(12
|
)
|
(12
|
)
|
|||||
|
Total Tier 2 capital – Standardized Approach
|
1,498
|
|
1,505
|
|
1,499
|
|
1,499
|
|
|||||
|
Excess of expected credit losses
|
53
|
|
37
|
|
31
|
|
31
|
|
|||||
|
Less: Allowance for credit losses
|
254
|
|
256
|
|
261
|
|
261
|
|
|||||
|
Total Tier 2 capital – Advanced Approach
|
$
|
1,297
|
|
$
|
1,286
|
|
$
|
1,269
|
|
$
|
1,269
|
|
|
|
Total capital:
|
|||||||||||||
|
Standardized Approach
|
$
|
23,375
|
|
$
|
23,340
|
|
$
|
22,838
|
|
$
|
23,543
|
|
|
|
Advanced Approach
|
$
|
23,174
|
|
$
|
23,121
|
|
$
|
22,608
|
|
$
|
23,313
|
|
|
|
Risk-weighted assets:
|
|||||||||||||
|
Standardized Approach
|
$
|
154,612
|
|
$
|
156,472
|
|
$
|
155,324
|
|
$
|
155,621
|
|
|
|
Advanced Approach:
|
|||||||||||||
|
Credit Risk
|
$
|
95,888
|
|
$
|
99,138
|
|
$
|
101,366
|
|
$
|
101,681
|
|
|
|
Market Risk
|
3,804
|
|
3,884
|
|
3,657
|
|
3,657
|
|
|||||
|
Operational Risk
|
67,888
|
|
68,888
|
|
68,688
|
|
68,688
|
|
|||||
|
Total Advanced Approach
|
$
|
167,580
|
|
$
|
171,910
|
|
$
|
173,711
|
|
$
|
174,026
|
|
|
|
Average assets for Tier 1 leverage ratio
|
$
|
326,700
|
|
$
|
338,291
|
|
$
|
330,894
|
|
$
|
331,600
|
|
|
|
Total leverage exposure for SLR
|
$
|
355,773
|
|
$
|
367,818
|
|
$
|
360,543
|
|
$
|
361,249
|
|
|
|
(a)
|
Reflects transitional adjustments to CET1, Tier 1 capital, Tier 2 capital required in 2017 under the U.S. capital rules.
|
|
(b)
|
Reduced by deferred tax liabilities associated with intangible assets and tax deductible goodwill.
|
34
BNY Mellon
The table below presents the factors that impacted the CET1 capital.
|
CET1 generation
|
June 30,
2018
|
|
|
|
(in millions)
|
|||
|
CET1 – Beginning of period
|
$
|
18,334
|
|
|
Net income applicable to common shareholders of The Bank of New York Mellon Corporation
|
1,055
|
|
|
|
Goodwill and intangible assets, net of related deferred tax liabilities
|
245
|
|
|
|
Gross CET1 generated
|
1,300
|
|
|
|
Capital deployed:
|
|||
|
Common stock dividends
|
(244
|
)
|
|
|
Common stock repurchased
|
(651
|
)
|
|
|
Total capital deployed
|
(895
|
)
|
|
|
Other comprehensive income:
|
|||
|
Foreign currency translation
|
(390
|
)
|
|
|
Unrealized loss on assets available-for-sale
|
(64
|
)
|
|
|
Defined benefit plans
|
16
|
|
|
|
Unrealized gain on cash flow hedges
|
(14
|
)
|
|
|
Total other comprehensive income
|
(452
|
)
|
|
|
Additional paid-in capital
(a)
|
70
|
|
|
|
Other additions:
|
|||
|
Net pension fund assets
|
2
|
|
|
|
Deferred tax assets
|
1
|
|
|
|
Embedded goodwill
|
13
|
|
|
|
Other
|
13
|
|
|
|
Total other additions
|
29
|
|
|
|
Net CET1 generated
|
52
|
|
|
|
CET1 – End of period
|
$
|
18,386
|
|
|
(a)
|
Primarily related to stock awards, the exercise of stock options and stock issued for employee benefit plans.
|
Minimum capital ratios and capital buffers
The U.S. capital rules include a series of buffers and surcharges over required minimums that apply to BHCs, including BNY Mellon, which are being phased-in over time. Banking organizations with a risk-based ratio or SLR above the minimum required level, but with a risk-based ratio or SLR below the minimum level with buffers will face constraints on dividends, equity repurchases and discretionary executive compensation based on the amount of the shortfall. Different regulatory capital buffers apply to our banking subsidiaries.
The following table presents the principal minimum capital ratio requirements with buffers and surcharges, as phased-in, applicable to the Parent and The Bank of New York Mellon. This table does not include the imposition of a countercyclical capital buffer. Buffers and surcharges are not applicable to the Tier 1 leverage ratio. These buffers, other than the SLR buffer, and surcharge will be fully implemented on Jan. 1, 2019.
|
Capital ratio requirements
|
Minimum ratios with buffers, as phased-in
(a)
|
||||||||||
|
Well capitalized
|
|
Minimum ratios
|
|
||||||||
|
2018
|
|
2019
|
|
||||||||
|
Capital conservation buffer (CET1)
|
1.875
|
%
|
2.5
|
%
|
|||||||
|
U.S. G-SIB surcharge (CET1)
(b)(c)
|
1.125
|
%
|
1.5
|
%
|
|||||||
|
Consolidated:
|
|||||||||||
|
CET1 ratio
|
N/A
|
|
4.5
|
%
|
7.5
|
%
|
8.5
|
%
|
|||
|
Tier 1 capital ratio
|
6.0
|
%
|
6.0
|
%
|
9.0
|
%
|
10.0
|
%
|
|||
|
Total capital ratio
|
10.0
|
%
|
8.0
|
%
|
11.0
|
%
|
12.0
|
%
|
|||
|
Enhanced SLR buffer (Tier 1 capital)
|
N/A
|
|
2.0
|
%
|
2.0
|
%
|
|||||
|
SLR
|
N/A
|
|
3.0
|
%
|
5.0
|
%
|
5.0
|
%
|
|||
|
Bank subsidiaries:
(c)
|
|||||||||||
|
CET1 ratio
|
6.5
|
%
|
4.5
|
%
|
6.375
|
%
|
7.0
|
%
|
|||
|
Tier 1 capital ratio
|
8.0
|
%
|
6.0
|
%
|
7.875
|
%
|
8.5
|
%
|
|||
|
Total capital ratio
|
10.0
|
%
|
8.0
|
%
|
9.875
|
%
|
10.5
|
%
|
|||
|
SLR
|
6.0
|
%
|
3.0
|
%
|
6.0
|
%
|
(d)
|
6.0
|
%
|
(d)
|
|
|
(a)
|
Countercyclical capital buffer currently set to 0%.
|
|
(b)
|
The fully phased-in U.S. G-SIB surcharge of 1.5% applicable to BNY Mellon is subject to change.
|
|
(c)
|
The U.S. G-SIB surcharge is not applicable to the regulatory capital ratios of the bank subsidiaries.
|
|
(d)
|
Well capitalized threshold.
|
BNY Mellon
35
The following table shows the impact on the consolidated capital ratios at
June 30, 2018
of a $100 million increase or decrease in common equity, or a $1 billion increase or decrease in RWAs, quarterly average assets or total leverage exposure.
|
Sensitivity of consolidated capital ratios at June 30, 2018
|
||||
|
|
Increase or decrease of
|
|||
|
(in basis points)
|
$100 million
in common
equity
|
$1 billion in
RWA, quarterly
average assets or total leverage exposure
|
||
|
CET1:
|
||||
|
Standardized Approach
|
6
|
bps
|
8
|
bps
|
|
Advanced Approach
|
6
|
7
|
||
|
Tier 1 capital:
|
||||
|
Standardized Approach
|
6
|
9
|
||
|
Advanced Approach
|
6
|
8
|
||
|
Total capital:
|
||||
|
Standardized Approach
|
6
|
10
|
||
|
Advanced Approach
|
6
|
8
|
||
|
Tier 1 leverage
|
3
|
2
|
||
|
SLR
|
3
|
2
|
||
Capital ratios vary depending on the size of the balance sheet at quarter-end and the levels and types of investments in assets. The balance sheet size fluctuates from quarter to quarter based on levels of customer and market activity. In general, when servicing clients are more actively trading securities, deposit balances and the balance sheet as a whole are higher. In addition, when markets experience significant volatility or stress, our balance sheet size may increase considerably as client deposit levels increase.
Trading activities and risk management
Our trading activities are focused on acting as a market-maker for our customers, facilitating customer trades and risk mitigating hedging in compliance with the Volcker Rule. The risk from market-making activities for customers is managed by our traders and limited in total exposure through a system of position limits, value-at-risk (“VaR”) methodology and other market sensitivity measures. VaR is the potential loss in value due to adverse market movements over a defined time horizon with a specified confidence level. The calculation of our VaR used by management and presented below assumes a one-day holding period, utilizes a 99% confidence level, and incorporates non-linear product characteristics. VaR
facilitates comparisons across portfolios of different risk characteristics. VaR also captures the diversification of aggregated risk at the firm-wide level.
VaR represents a key risk management measure and it is important to note the inherent limitations to VaR, which include:
|
•
|
VaR does not estimate potential losses over longer time horizons where moves may be extreme;
|
|
•
|
VaR does not take account of potential variability of market liquidity; and
|
|
•
|
Previous moves in market risk factors may not produce accurate predictions of all future market moves.
|
See Note 17 of the Notes to Consolidated Financial Statements for additional information on the VaR methodology.
The following tables indicate the calculated VaR amounts for the trading portfolio for the designated periods using the historical simulation VaR model.
|
VaR
(a)
|
2Q18
|
June 30, 2018
|
|
|||||||||
|
(in millions)
|
Average
|
|
Minimum
|
|
Maximum
|
|
||||||
|
Interest rate
|
$
|
4.0
|
|
$
|
3.3
|
|
$
|
5.2
|
|
$
|
3.5
|
|
|
Foreign exchange
|
3.7
|
|
2.9
|
|
5.7
|
|
3.5
|
|
||||
|
Equity
|
0.7
|
|
0.5
|
|
1.0
|
|
0.5
|
|
||||
|
Credit
|
0.8
|
|
0.6
|
|
1.0
|
|
1.0
|
|
||||
|
Diversification
|
(3.9
|
)
|
N/M
|
|
N/M
|
|
(3.9
|
)
|
||||
|
Overall portfolio
|
5.3
|
|
4.3
|
|
7.0
|
|
4.6
|
|
||||
|
VaR
(a)
|
1Q18
|
March 31, 2018
|
|
|||||||||
|
(in millions)
|
Average
|
|
Minimum
|
|
Maximum
|
|
||||||
|
Interest rate
|
$
|
4.5
|
|
$
|
4.0
|
|
$
|
5.5
|
|
$
|
4.1
|
|
|
Foreign exchange
|
5.3
|
|
4.0
|
|
8.3
|
|
4.0
|
|
||||
|
Equity
|
0.8
|
|
0.6
|
|
1.2
|
|
0.9
|
|
||||
|
Credit
|
1.4
|
|
0.9
|
|
2.6
|
|
1.0
|
|
||||
|
Diversification
|
(5.5
|
)
|
N/M
|
|
N/M
|
|
(4.3
|
)
|
||||
|
Overall portfolio
|
6.5
|
|
4.8
|
|
10.4
|
|
5.7
|
|
||||
|
VaR
(a)
|
2Q17
|
June 30, 2017
|
|
|||||||||
|
(in millions)
|
Average
|
|
Minimum
|
|
Maximum
|
|
||||||
|
Interest rate
|
$
|
3.3
|
|
$
|
2.8
|
|
$
|
4.1
|
|
$
|
4.0
|
|
|
Foreign exchange
|
4.3
|
|
3.4
|
|
5.8
|
|
4.6
|
|
||||
|
Equity
|
0.2
|
|
0.1
|
|
1.1
|
|
1.1
|
|
||||
|
Credit
|
1.1
|
|
0.5
|
|
1.4
|
|
0.8
|
|
||||
|
Diversification
|
(4.8
|
)
|
N/M
|
|
N/M
|
|
(5.8
|
)
|
||||
|
Overall portfolio
|
4.1
|
|
3.3
|
|
5.4
|
|
4.7
|
|
||||
36
BNY Mellon
|
VaR
(a)
|
YTD18
|
||||||||
|
(in millions)
|
Average
|
|
Minimum
|
|
Maximum
|
|
|||
|
Interest rate
|
$
|
4.2
|
|
$
|
3.3
|
|
$
|
5.5
|
|
|
Foreign exchange
|
4.5
|
|
2.9
|
|
8.3
|
|
|||
|
Equity
|
0.8
|
|
0.5
|
|
1.2
|
|
|||
|
Credit
|
1.1
|
|
0.6
|
|
2.6
|
|
|||
|
Diversification
|
(4.7
|
)
|
N/M
|
|
N/M
|
|
|||
|
Overall portfolio
|
5.9
|
|
4.3
|
|
10.4
|
|
|||
|
VaR
(a)
|
YTD17
|
||||||||
|
(in millions)
|
Average
|
|
Minimum
|
|
Maximum
|
|
|||
|
Interest rate
|
$
|
3.6
|
|
$
|
2.8
|
|
$
|
4.9
|
|
|
Foreign exchange
|
3.9
|
|
2.6
|
|
5.8
|
|
|||
|
Equity
|
0.2
|
|
0.1
|
|
1.1
|
|
|||
|
Credit
|
1.2
|
|
0.5
|
|
1.7
|
|
|||
|
Diversification
|
(4.8
|
)
|
N/M
|
|
N/M
|
|
|||
|
Overall portfolio
|
4.1
|
|
3.3
|
|
5.4
|
|
|||
|
(a)
|
VaR exposure does not include the impact of the Company’s consolidated investment management funds and seed capital investments.
|
N/M - Because the minimum and maximum may occur on different days for different risk components, it is not meaningful to compute a minimum and maximum portfolio diversification effect.
The interest rate component of VaR represents instruments whose values predominantly vary with the level or volatility of interest rates. These instruments include, but are not limited to: sovereign debt, swaps, swaptions, forward rate agreements, exchange-traded futures and options, and other interest rate derivative products.
The foreign exchange component of VaR represents instruments whose values predominantly vary with the level or volatility of currency exchange rates or interest rates. These instruments include, but are not limited to: currency balances, spot and forward transactions, currency options, exchange-traded futures and options, and other currency derivative products.
The equity component of VaR consists of instruments that represent an ownership interest in the form of domestic and foreign common stock or other equity-linked instruments. These instruments include, but are not limited to: common stock, exchange-traded funds, preferred stock, listed equity options (puts and calls), over-the-counter (“OTC”) equity options, equity total return swaps, equity index futures and other equity derivative products.
The credit component of VaR represents instruments whose values predominantly vary with the credit
worthiness of counterparties. These instruments include, but are not limited to, credit derivatives (credit default swaps and exchange-traded credit index instruments) and exposures from corporate credit spreads, and mortgage prepayments. Credit derivatives are used to hedge various credit exposures.
The diversification component of VaR is the risk reduction benefit that occurs when combining portfolios and offsetting positions, and from the correlated behavior of risk factor movements.
During the
second quarter of 2018
, interest rate risk generated
43%
of average gross VaR, foreign exchange risk generated
40%
of average gross VaR, equity risk accounted for
8%
of average gross VaR and credit risk generated
9%
of average gross VaR. During the
second quarter of 2018
, our daily trading loss did not exceed our calculated VaR amount of the overall portfolio on any occasion.
The following table of total daily trading revenue or loss illustrates the number of trading days in which our trading revenue or loss fell within particular ranges during the past five quarters.
|
Distribution of trading revenue (loss)
(a)
|
||||||||||
|
Quarter ended
|
||||||||||
|
(dollars in millions)
|
June 30,
2018 |
|
March 31,
2018 |
|
Dec. 31, 2017
|
|
Sept. 30, 2017
|
|
June 30, 2017
|
|
|
Revenue range:
|
Number of days
|
|||||||||
|
Less than $(2.5)
|
1
|
|
—
|
|
2
|
|
—
|
|
—
|
|
|
$(2.5) – $0
|
3
|
|
2
|
|
4
|
|
1
|
|
2
|
|
|
$0 – $2.5
|
21
|
|
18
|
|
23
|
|
29
|
|
31
|
|
|
$2.5 – $5.0
|
30
|
|
32
|
|
22
|
|
29
|
|
27
|
|
|
More than $5.0
|
9
|
|
10
|
|
11
|
|
4
|
|
4
|
|
|
(a)
|
Trading revenue (loss) includes realized and unrealized gains and losses primarily related to spot and forward foreign exchange transactions, derivatives and securities trades for our customers and excludes any associated commissions, underwriting fees and net interest revenue.
|
Trading assets include debt and equity instruments and derivative assets, primarily interest rate and foreign exchange contracts, not designated as hedging instruments. Trading assets were
$7.0 billion
at
June 30, 2018
and
$6.0 billion
at
Dec. 31, 2017
. The increase was impacted by the reclassification of money market fund investments of approximately
$1 billion
primarily from available-for-sale securities.
BNY Mellon
37
Trading liabilities include debt and equity instruments and derivative liabilities, primarily interest rate and foreign exchange contracts, not designated as hedging instruments. Trading liabilities were
$3.6 billion
at
June 30, 2018
and
$4.0 billion
at
Dec. 31, 2017
.
Under our fair value methodology for derivative contracts, an initial “risk-neutral” valuation is performed on each position assuming time-discounting based on a AA credit curve. In addition, we consider credit risk in arriving at the fair value of our derivatives.
We reflect external credit ratings as well as observable credit default swap spreads for both ourselves and our counterparties when measuring the fair value of our derivative positions. Accordingly, the valuation of our derivative positions is sensitive to the current changes in our own credit spreads, as well as those of our counterparties.
At
June 30, 2018
, our OTC derivative assets, including those in hedging relationships, of
$3.2 billion
included a credit valuation adjustment (“CVA”) deduction of $21 million. Our OTC derivative liabilities, including those in hedging relationships, of
$2.6 billion
included a debit valuation adjustment (“DVA”) of $2 million related to our own credit spread. Net of hedges, the CVA decreased by $2 million and the DVA was unchanged in the
second quarter of 2018
, which increased foreign exchange and other trading revenue. The net impact was an increase of $2 million in the
first quarter of 2018
and the
second quarter of 2017
.
The table below summarizes the risk ratings for our foreign exchange and interest rate derivative counterparty credit exposure during the past five quarters. This information indicates the degree of risk to which we are exposed. Significant changes in ratings classifications for our foreign exchange and other trading activity could result in increased risk for us.
|
Foreign exchange and other trading counterparty risk rating profile
(a)
|
||||||||||
|
Quarter ended
|
||||||||||
|
June 30, 2018
|
|
March 31,
2018 |
|
Dec. 31, 2017
|
|
Sept. 30, 2017
|
|
June 30,
2017 |
|
|
|
Rating:
|
||||||||||
|
AAA to AA-
|
37
|
%
|
48
|
%
|
44
|
%
|
41
|
%
|
44
|
%
|
|
A+ to A-
|
41
|
|
27
|
|
31
|
|
30
|
|
27
|
|
|
BBB+ to BBB-
|
18
|
|
20
|
|
20
|
|
24
|
|
22
|
|
|
Non-investment grade (BB+ and lower)
|
4
|
|
5
|
|
5
|
|
5
|
|
7
|
|
|
Total
|
100
|
%
|
100
|
%
|
100
|
%
|
100
|
%
|
100
|
%
|
|
(a)
|
Represents credit rating agency equivalent of internal credit ratings.
|
Asset/liability management
Our diversified business activities include processing securities, accepting deposits, investing in securities, lending, raising money as needed to fund assets and other transactions. The market risks from these activities include interest rate risk and foreign exchange risk. Our primary market risk is exposure to movements in U.S. dollar interest rates and certain foreign currency interest rates. We actively manage interest rate sensitivity and use earnings simulation and discounted cash flow models to identify interest rate exposures.
An earnings simulation model is the primary tool used to assess changes in pre-tax net interest revenue. The model incorporates management’s assumptions regarding interest rates, market spreads, changes in the prepayment behavior of loans and securities and the impact of derivative financial instruments used for interest rate risk management purposes. These assumptions have been developed through a combination of historical analysis and future expected pricing behavior and are inherently uncertain. Actual results may differ materially from projected results due to timing, magnitude and frequency of interest rate changes, and changes in market conditions and management’s strategies, among other factors.
In the table below, we use the earnings simulation model to run various interest rate ramp scenarios from a baseline scenario. The interest rate ramp scenarios examine the impact of large interest rate movements. In each scenario, all currencies’ interest rates are shifted higher or lower. The baseline scenario is based on our quarter-end balance sheet and the spot yield curve. The 100 basis point ramp scenario assumes rates increase 25 basis points above the yield curve in each of the next four quarters and
38
BNY Mellon
the 200 basis point ramp scenario assumes a 50 basis point per quarter increase. Interest rate sensitivity is quantified by calculating the change in pre-tax net interest revenue between the scenarios over a 12-month measurement period.
The following table shows net interest revenue sensitivity for BNY Mellon.
|
Estimated changes in net interest revenue
(in millions) |
June 30, 2018
|
|
March 31,
2018 |
|
June 30,
2017 |
|
|||
|
Up 200 bps parallel rate ramp vs. baseline
(a)
|
$
|
372
|
|
$
|
244
|
|
$
|
473
|
|
|
Up 100 bps parallel rate ramp vs. baseline
(a)
|
183
|
|
119
|
|
275
|
|
|||
|
Long-term up 50 bps, short-term unchanged
(b)
|
72
|
|
83
|
|
92
|
|
|||
|
Long-term down 50 bps, short-term unchanged
(b)
|
(89
|
)
|
(102
|
)
|
(85
|
)
|
|||
|
(a)
|
In the parallel rate ramp, both short-term and long-term rates move
in four equal quarterly increments.
|
|
(b)
|
Long-term is equal to or greater than one year.
|
Sensitivities in the 200 bps and 100 bps parallel rate ramp scenarios increased in the second quarter of 2018 from the first quarter of 2018 primarily driven by the change in the mix of floating-rate versus fixed-rate assets and liabilities. In the first quarter of 2018, we changed the net interest revenue sensitivity methodology to assume static deposit levels. Previously, our sensitivities included assumptions about deposit runoff which were difficult to predict. Prior period results have been restated to conform to the current methodology.
To illustrate the net interest revenue sensitivity to deposit runoff, we note that a $5 billion reduction of U.S. dollar denominated non-interest bearing deposits would reduce the net interest revenue sensitivity results in the ramp up 100 basis point and 200 basis point scenarios in the table above by approximately $130 million and approximately $160 million, respectively. The impact would be smaller if the runoff was assumed to be a mixture of interest-bearing and noninterest-bearing deposits.
For a discussion of factors impacting the growth or contraction of deposits, see “Risk Factors - Our business, financial condition and results of operations could be adversely affected if we do not effectively manage our liquidity,” in our 2017 Annual Report.
Off-balance sheet arrangements
Off-balance sheet arrangements discussed in this section are limited to guarantees, retained or contingent interests and obligations arising out of unconsolidated variable interest entities (“VIEs”). For BNY Mellon, these items include certain guarantees. Guarantees include SBLCs issued as part of our corporate banking business and securities lending indemnifications issued as part of our Investment Services business. See Note 18 of the Notes to Consolidated Financial Statements for a further discussion of our off-balance sheet arrangements.
BNY Mellon
39
Supplemental information - Explanation of GAAP and Non-GAAP financial measures
BNY Mellon has included in this Form 10-Q certain Non-GAAP financial measures on a tangible basis, as a supplement to GAAP information. Tangible common shareholders’ equity excludes goodwill and intangible assets, net of deferred tax liabilities. BNY Mellon believes that the return on tangible common equity measure is an additional useful measure for investors because it presents a measure of those assets that can generate income. BNY Mellon has provided a measure of tangible book value per common share, which it believes provides additional useful information as to the level of tangible assets in relation to shares of common stock outstanding.
The presentation of the growth rates of investment management and performance fees on a constant
currency basis permits investors to assess the significance of changes in foreign currency exchange rates. Growth rates on a constant currency basis were determined by applying the current period foreign currency exchange rates to the prior period revenue. BNY Mellon believes that this presentation, as a supplement to GAAP information, gives investors a clearer picture of the related revenue results without the variability caused by fluctuations in foreign currency exchange rates.
BNY Mellon has presented the operating margin for the Investment Management business net of distribution and servicing expense that was passed to third parties who distribute or service our managed funds. BNY Mellon believes that this measure is useful when evaluating the performance of the Investment Management business relative to industry competitors.
The following table presents the reconciliation of the return on common equity and tangible common equity.
|
Return on common equity and tangible common equity reconciliation
|
|||||||||||||||
|
(dollars in millions)
|
2Q18
|
|
1Q18
|
|
2Q17
|
|
YTD18
|
|
YTD17
|
|
|||||
|
Net income applicable to common shareholders of The Bank of New York Mellon Corporation – GAAP
|
$
|
1,055
|
|
$
|
1,135
|
|
$
|
926
|
|
$
|
2,190
|
|
$
|
1,806
|
|
|
Add: Amortization of intangible assets
|
48
|
|
49
|
|
53
|
|
97
|
|
105
|
|
|||||
|
Less: Tax impact of amortization of intangible assets
|
11
|
|
12
|
|
19
|
|
23
|
|
37
|
|
|||||
|
Adjusted net income applicable to common shareholders of The Bank of
New York Mellon Corporation, excluding amortization of intangible
assets – Non-GAAP
|
$
|
1,092
|
|
$
|
1,172
|
|
$
|
960
|
|
$
|
2,264
|
|
$
|
1,874
|
|
|
Average common shareholders’ equity
|
$
|
37,750
|
|
$
|
37,593
|
|
$
|
35,862
|
|
$
|
37,672
|
|
$
|
35,416
|
|
|
Less: Average goodwill
|
17,505
|
|
17,581
|
|
17,408
|
|
17,543
|
|
17,373
|
|
|||||
|
Average intangible assets
|
3,341
|
|
3,397
|
|
3,532
|
|
3,369
|
|
3,555
|
|
|||||
|
Add: Deferred tax liability – tax deductible goodwill
(a)
|
1,054
|
|
1,042
|
|
1,542
|
|
1,054
|
|
1,542
|
|
|||||
|
Deferred tax liability – intangible assets
(a)
|
709
|
|
716
|
|
1,095
|
|
709
|
|
1,095
|
|
|||||
|
Average tangible common shareholders’ equity – Non-GAAP
|
$
|
18,667
|
|
$
|
18,373
|
|
$
|
17,559
|
|
$
|
18,523
|
|
$
|
17,125
|
|
|
Return on common equity
(annualized)
– GAAP
|
11.2
|
%
|
12.2
|
%
|
10.4
|
%
|
11.7
|
%
|
10.3
|
%
|
|||||
|
Return on tangible common equity
(annualized)
– Non-GAAP
|
23.5
|
%
|
25.9
|
%
|
21.9
|
%
|
24.6
|
%
|
22.1
|
%
|
|||||
|
(a)
|
Deferred tax liabilities, for the periods in 2017, are based on fully phased-in U.S. capital rules.
|
40
BNY Mellon
The following table presents the reconciliation of the book value and tangible book value per common share.
|
Book value and tangible book value per common share reconciliation
|
June 30, 2018
|
|
March 31, 2018
|
|
Dec. 31, 2017
|
|
June 30, 2017
|
|
||||
|
(dollars in millions except common shares)
|
||||||||||||
|
BNY Mellon shareholders’ equity at period end – GAAP
|
$
|
41,505
|
|
$
|
41,728
|
|
$
|
41,251
|
|
$
|
39,974
|
|
|
Less: Preferred stock
|
3,542
|
|
3,542
|
|
3,542
|
|
3,542
|
|
||||
|
BNY Mellon common shareholders’ equity at period end – GAAP
|
37,963
|
|
38,186
|
|
37,709
|
|
36,432
|
|
||||
|
Less: Goodwill
|
17,418
|
|
17,596
|
|
17,564
|
|
17,457
|
|
||||
|
Intangible assets
|
3,308
|
|
3,370
|
|
3,411
|
|
3,506
|
|
||||
|
Add: Deferred tax liability – tax deductible goodwill
(a)
|
1,054
|
|
1,042
|
|
1,034
|
|
1,542
|
|
||||
|
Deferred tax liability – intangible assets
(a)
|
709
|
|
716
|
|
718
|
|
1,095
|
|
||||
|
BNY Mellon tangible common shareholders’ equity at period end – Non-GAAP
|
$
|
19,000
|
|
$
|
18,978
|
|
$
|
18,486
|
|
$
|
18,106
|
|
|
Period-end common shares outstanding
(in thousands)
|
999,945
|
|
1,010,676
|
|
1,013,442
|
|
1,033,156
|
|
||||
|
Book value per common share – GAAP
|
$
|
37.97
|
|
$
|
37.78
|
|
$
|
37.21
|
|
$
|
35.26
|
|
|
Tangible book value per common share – Non-GAAP
|
$
|
19.00
|
|
$
|
18.78
|
|
$
|
18.24
|
|
$
|
17.53
|
|
|
(a)
|
Deferred tax liabilities, for the periods in 2017, are based on fully phased-in U.S. capital rules.
|
The following table presents the impact of changes in foreign currency exchange rates on our consolidated investment management and performance fees.
|
Constant currency reconciliation – Consolidated
|
2Q18 vs.
|
|
||||||
|
(dollars in millions)
|
2Q18
|
|
2Q17
|
|
2Q17
|
|
||
|
Investment management and performance fees
|
$
|
910
|
|
$
|
879
|
|
4
|
%
|
|
Impact of changes in foreign currency exchange rates
|
—
|
|
20
|
|
||||
|
Adjusted investment management and performance fees – Non-GAAP
|
$
|
910
|
|
$
|
899
|
|
1
|
%
|
The following table presents the impact of changes in foreign currency exchange rates on investment management and performance fees reported in the Investment Management business.
|
Constant currency reconciliation – Investment Management business
|
2Q18 vs.
|
|
||||||
|
(dollars in millions)
|
2Q18
|
|
2Q17
|
|
2Q17
|
|
||
|
Investment management and performance fees
|
$
|
897
|
|
$
|
862
|
|
4
|
%
|
|
Impact of changes in foreign currency exchange rates
|
—
|
|
20
|
|
||||
|
Adjusted investment management and performance fees – Non-GAAP
|
$
|
897
|
|
$
|
882
|
|
2
|
%
|
The following table presents the reconciliation of the pre-tax operating margin for the Investment Management business.
|
Pre-tax operating margin reconciliation - Investment Management business
|
|||||||||||||||||||||
|
(dollars in millions)
|
2Q18
|
|
1Q18
|
|
4Q17
|
|
3Q17
|
|
2Q17
|
|
YTD18
|
|
YTD17
|
|
|||||||
|
Income before income taxes – GAAP
|
$
|
319
|
|
$
|
381
|
|
$
|
276
|
|
$
|
300
|
|
$
|
288
|
|
$
|
700
|
|
$
|
565
|
|
|
Total revenue – GAAP
|
$
|
1,018
|
|
$
|
1,088
|
|
$
|
1,048
|
|
$
|
1,000
|
|
$
|
986
|
|
$
|
2,106
|
|
$
|
1,949
|
|
|
Less:
Distribution and servicing expense
|
103
|
|
110
|
|
107
|
|
110
|
|
104
|
|
213
|
|
205
|
|
|||||||
|
Adjusted total revenue, net of distribution and servicing expense – Non-GAAP
|
$
|
915
|
|
$
|
978
|
|
$
|
941
|
|
$
|
890
|
|
$
|
882
|
|
$
|
1,893
|
|
$
|
1,744
|
|
|
Pre-tax operating margin – GAAP
(a)
|
31
|
%
|
35
|
%
|
26
|
%
|
30
|
%
|
29
|
%
|
33
|
%
|
29
|
%
|
|||||||
|
Adjusted pre-tax operating margin, net of distribution and servicing expense – Non-GAAP
(a)
|
35
|
%
|
39
|
%
|
29
|
%
|
34
|
%
|
33
|
%
|
37
|
%
|
32
|
%
|
|||||||
|
(a)
|
Income before taxes divided by total revenue.
|
BNY Mellon
41
Recent accounting and regulatory developments
Recently issued accounting standards
The following ASUs issued by the Financial Accounting Standards Board (“FASB”) have not yet been adopted.
ASU 2016-02, Leases
In February 2016, the FASB issued an ASU,
Leases
. The primary objective of this ASU is to increase transparency and comparability by recognizing lease assets and liabilities on the balance sheet and expand related disclosures. This ASU requires a “right-of-use” asset and a payment obligation liability on the balance sheet for most leases and subleases. Additionally, depending on the lease classification under the standard, it may result in different expense recognition patterns and classification than under existing accounting principles. For leases classified as finance leases, it will result in higher expense recognition in the earlier periods and lower expense in the later periods of the lease. The standard is effective for the first quarter of 2019, with early adoption permitted. As permitted under a recently approved ASU, we expect to elect the alternative transition method which allows for the recognition of leases using a cumulative effect adjustment to the opening balance of retained earnings in the period of adoption of the standard. We are currently evaluating the potential impact of the leasing standard on our consolidated financial statements and evaluating the practical expedients that may be elected. Upon adoption, the implementation of the leasing standard is expected to result in an immaterial increase in both assets and liabilities.
ASU 2018-02, Income Statement—Reporting Comprehensive Income: Reclassification of Certain Tax Effects from Accumulated Other Comprehensive Income
In February 2018, the FASB issued an ASU,
Income Statement—Reporting Comprehensive Income: Reclassification of Certain Tax Effects from Accumulated Other Comprehensive Income.
This ASU permits a reclassification from accumulated other comprehensive income to retained earnings for the tax effects of items within accumulated other comprehensive income that do not reflect the lower
statutory tax rate which was enacted by the U.S. tax legislation. This ASU is effective for the first quarter of 2019, with early adoption permitted. The guidance in this ASU may be applied retrospectively to the period in which the effect of the change in the U.S. federal corporate income tax rate in the Tax Cuts and Jobs Act is recognized. We are assessing the impacts of the new standard, but would not expect this ASU to have a material impact.
ASU 2016-13, Financial Instruments – Credit Losses: Measurement of Credit Losses on Financial Instruments
In June 2016, the FASB issued an ASU,
Financial Instruments – Credit Losses: Measurement of Credit Losses on Financial Instruments
. This ASU introduces a new current expected credit losses model, which will apply to financial assets subject to credit losses and measured at amortized cost, including held-to-maturity securities and certain off-balance sheet credit exposures. The guidance will also change current practice for the impairment model for available-for-sale debt securities. The available-for-sale debt securities model will require the use of an allowance to record estimated credit losses and subsequent recoveries. This ASU is effective for the first quarter of 2020, with early application permitted beginning with the first quarter of 2019.
BNY Mellon has begun its implementation efforts and is currently working through key interpretive issues, and in 2018, we are addressing credit loss forecasting models and related processes. The extent of the impact to our financial statements upon adoption depends on several factors including the remaining expected life of financial instruments at the time of adoption, the establishment of an allowance for expected credit loss on held-to-maturity securities, and the macroeconomic conditions and forecasts that exist at that date. We do not expect to early adopt this ASU.
Recent regulatory developments
For a summary of additional regulatory matters relevant to our operations, see “Supervision and Regulation” in our 2017 Annual Report. The following discussions summarize certain regulatory developments that may affect BNY Mellon, the impact of which we are continuing to assess and evaluate.
42
BNY Mellon
Financial Services Regulatory Reform Legislation
On May 24, 2018, President Trump signed into law the “Economic Growth, Regulatory Relief, and Consumer Protection Act,” which provides certain limited amendments to the Dodd-Frank Wall Street Reform and Consumer Protection Act (“Dodd-Frank”), as well as certain targeted modifications to other post-financial crisis regulatory requirements. Provisions of the legislation that may impact BNY Mellon include modifications to the SLR requirements as applied to custodial banks, elimination of the Dodd-Frank company-run stress tests for BHCs, banks, and other financial companies with less than $250 billion in assets, including BNY Mellon, N.A., and modifications to the LCR relating to the treatment of certain municipal securities.
The legislation eliminates the “adverse scenario” as a required stress test scenario, reducing the minimum number of supervisory scenarios from three (baseline, adverse, and severely adverse) to two (baseline and severely adverse).
The legislation also directs the U.S. banking agencies to exclude certain central bank deposits from the total leverage exposure (the SLR denominator) of custody banks, including BNY Mellon, to the extent of the value of client deposits at the custody bank that are linked to fiduciary, custody or safekeeping accounts. The legislation also requires the federal banking agencies to amend their LCR rules to classify “investment-grade” and “liquid and readily marketable” municipal securities as “level 2B” liquid assets under their LCR rules.
For more information regarding applicable leverage ratios, see “Supervision and Regulation - Leverage Ratios” in our 2017 Annual Report.
Federal Reserve and OCC Proposed Amendments to the Enhanced Supplementary Leverage Ratio Requirements for U.S. G-SIBs
On April 11, 2018, the Federal Reserve and the OCC issued a joint notice of proposed rule-making that would recalibrate the enhanced supplementary leverage ratio standards that apply to U.S. global systemically important bank holding companies (“G-SIBs”) and certain of their insured depository institution subsidiaries. The proposed rule would replace the 2% SLR buffer that currently applies to all U.S. G-SIBs with a buffer equal to 50% of the firm’s risk-based G-SIB surcharge.
For insured depository institution subsidiaries of U.S. G-SIBs regulated by the Federal Reserve or the OCC, the proposal would replace the current 6% SLR threshold requirement for those institutions to be considered “well capitalized” under the agencies’ prompt corrective action framework with an SLR of at least 3% plus 50% of the G-SIB surcharge applicable to their top-tier holding companies. The proposed rule would also make corresponding changes to the total loss absorbing capacity (“TLAC”) SLR buffer and long-term debt requirements for U.S. G-SIBs, as well as technical changes to the Federal Reserve’s TLAC rule.
For more information, see “Supervision & Regulation - Leverage Ratios” and “Supervision & Regulation - Total Loss-Absorbing Capacity” in our 2017 Annual Report.
Federal Reserve Proposed Changes to CCAR and its Capital Rules
On April 10, 2018, the Federal Reserve issued a proposed rule that would integrate its regulatory capital, capital planning, and stress test rules, as well as the CCAR process. The proposal would introduce a stress capital buffer (“SCB”) that would be part of the firm’s quarterly capital requirements. Specifically, the proposal would replace the current static 2.5% capital conservation buffer with an SCB requirement for Standardized Approach capital ratios, based on (i) the projected decrease in a firm’s common equity tier 1 capital ratio, measured from the beginning to its lowest point, in the severely adverse scenario of the Federal Reserve’s supervisory severely adverse scenario, plus (ii) planned common stock dividends for the fourth through seventh quarters of the CCAR planning horizon, subject to a floor of 2.5%. For firms subject to the Advanced Approaches, such as BNY Mellon, the static 2.5% capital conservation buffer would continue to apply for Advanced Approaches risk-based capital ratios. The proposed rule would maintain the requirement for covered firms to submit CCAR capital plans, but would introduce a new requirement that firms reduce their planned capital distributions if those distributions would not be consistent with the applicable buffer constraints based on the firms’ own baseline scenario projections.
Other aspects of the proposal include: (1) introducing a stress leverage buffer (“SLB”) that is analogous to the SCB and applies to firms’ tier 1 leverage ratios, although not subject to a floor; (2) limiting capital
BNY Mellon
43
distributions if a firm’s own BHC baseline scenario projections indicate that the firm would not satisfy applicable capital buffer requirements; (3) revising assumptions for balance sheet growth and capital actions in the supervisory stress test; and (4) eliminating heightened supervisory scrutiny of capital plans that include a dividend payout ratio of more than 30%. Under the proposal, a firm’s first SCB and SLB would become effective on Oct. 1, 2019.
Single Counterparty Credit Limits
On June 14, 2018, the Federal Reserve approved a final rule imposing single-counterparty credit limits (“SCCLs”) on, among other organizations, domestic bank holding companies, including BNY Mellon, that are G-SIBs or that have $250 billion or more in total consolidated assets. The SCCLs apply to the credit exposure of a covered firm and all of its subsidiaries to a single counterparty and all of its affiliates and connected entities. The final rule introduces new definitions of “subsidiary” and “affiliate” under a financial consolidation standard that is consistent with applicable accounting standards.
The final rule establishes two primary credit exposure limits: (1) a covered domestic BHC may not have aggregate net credit exposure to any unaffiliated counterparty in excess of 25% of its tier 1 capital, and (2) a U.S. G-SIB is further prohibited from having aggregate net credit exposure in excess of 15% of its tier 1 capital to any “major counterparty” (defined as a G-SIB or a nonbank SIFI). The final rule also adopts a more risk-sensitive exposure measurement methodology for securities financing transactions (“SFTs”) that includes the use of any method authorized under the Federal Reserve’s capital rules, including internal models, which parallels the exposure measurement methodology permitted for derivatives under both the proposed and final rules.
See “Supervision & Regulation - Enhanced Prudential Standards and Large Exposures” in our 2017 Annual Report for additional discussion of the Federal Reserve’s proposal to limit credit exposures to single counterparties.
Notice of Proposed Rulemaking to Amend Volcker Rule Regulations
The Federal Reserve, OCC, FDIC, CFTC and SEC approved a proposal to modify the current regulations implementing the Volcker Rule. The proposal would establish three categories of banking entities based on
trading activity and compliance requirements would vary based on the extent of an entity’s trading activity.
Other key proposals include: (1) significant revisions to the definition of the term “trading account” which would replace the current short-term purpose-based prong and its 60-day rebuttable presumption with a new accounting-based prong that would cover all financial instruments accounted for at fair value on a recurring basis; (2) loosening the requirements for relying on the underwriting, market-making, and hedging exemptions; and (3) significant revisions to the current metrics reporting requirements.
For more information regarding the Volcker Rule, see “Supervision and Regulation - Volcker Rule” in our 2017 Annual Report.
Federal Reserve, OCC and FDIC Release Joint Proposal Regarding the Implementation of CECL and Their Regulatory Capital Rules
On April 13 and April 17, 2018, the Federal Reserve, the OCC and the FDIC released a joint proposal to revise their regulatory capital rules to address U.S. generally accepted accounting principles’ upcoming change to the Current Expected Credit Losses (“CECL”) treatment of credit expense and allowances and provide an optional three-year phase-in period for the day-one adverse regulatory capital effects upon adopting CECL. Additionally, the proposal would address which credit loss allowances under CECL would be eligible for inclusion in tier 2 regulatory capital.
Upon adopting CECL, a company will record a onetime adjustment to its credit loss allowances as of the beginning of its fiscal year of adoption equal to the difference between the amounts of its credit loss allowances under the incurred loss methodology and CECL. The adjustment will be recognized with offsetting entries to deferred tax assets, if appropriate, and to the new fiscal year’s beginning retained earnings.
44
BNY Mellon
Business continuity and operational resiliency
Business continuity and operational resiliency are priorities for the Company. Core elements of our business continuity and operational resiliency strategies include advance planning, maintaining multiple data centers, testing our capabilities, maintaining diversity of business operations and telecommunications infrastructure, and reviewing the business continuity and information security capabilities of our service providers. These capabilities are intended to enable the Company to maintain its operations and appropriately respond to events that could damage our physical facilities, cause delays or disruptions to operational functions (including telecommunications networks), or impair the ability of our employees to work, of our vendors to provide services to us, or of our clients and counterparties to communicate and transact with us. Those events include information security incidents, technology disruptions, acts of terrorism, natural disasters, pandemics and global conflicts.
We continue to evaluate and strengthen our business continuity and operational resiliency capabilities and have increased our investments in technology to steadily enhance those capabilities, including our ability to resume and sustain our operations.
Website information
Our website is
www.bnymellon.com
. We currently make available the following information under the Investor Relations portion of our website. With respect to SEC filings, we post such information as soon as reasonably practicable after we electronically file such materials with, or furnish them to, the SEC.
|
•
|
All of our SEC filings, including annual reports on Form 10-K, quarterly reports on Form 10-Q, current reports on Form 8-K and all amendments to these reports, as well as proxy statements and SEC Forms 3, 4 and 5;
|
|
•
|
Financial statements and footnotes prepared using eXtensible Business Reporting Language (“XBRL”);
|
|
•
|
Our earnings materials and selected management conference calls and presentations;
|
|
•
|
Other regulatory disclosures, including: Pillar 3 Disclosures (and Market Risk Disclosure contained therein); Liquidity Coverage Ratio Disclosures; Federal Financial Institutions Examination Council - Consolidated Reports of Condition and Income for a Bank With Domestic and Foreign Offices; Consolidated Financial Statements for Bank Holding Companies; and the Dodd-Frank Act Stress Test Results for BNY Mellon and The Bank of New York Mellon; and
|
|
•
|
Our Corporate Governance Guidelines, Amended and Restated By-laws, Directors Code of Conduct and the Charters of the Audit, Finance, Corporate Governance, Nominating and Social Responsibility, Human Resources and Compensation, Risk and Technology Committees of our Board of Directors.
|
We may use our website, our Twitter account (twitter.com/BNYMellon) and other social media channels as additional means of disclosing information to the public. The information disclosed through those channels may be considered to be material. The contents of our website or social media channels referenced herein are not incorporated by reference into this Quarterly Report on Form 10-Q.
BNY Mellon
45
|
Item 1. Financial Statements
|
|
The Bank of New York Mellon Corporation (and its subsidiaries)
|
Consolidated Income Statement
(unaudited)
|
Quarter ended
|
Year-to-date
|
|||||||||||||||
|
June 30, 2018
|
|
March 31, 2018
|
|
June 30, 2017
|
|
June 30, 2018
|
|
June 30, 2017
|
|
|||||||
|
(in millions)
|
||||||||||||||||
|
Fee and other revenue
|
||||||||||||||||
|
Investment services fees:
|
||||||||||||||||
|
Asset servicing
|
$
|
1,157
|
|
$
|
1,168
|
|
$
|
1,085
|
|
$
|
2,325
|
|
$
|
2,148
|
|
|
|
Clearing services
|
392
|
|
414
|
|
394
|
|
806
|
|
770
|
|
||||||
|
Issuer services
|
266
|
|
260
|
|
241
|
|
526
|
|
492
|
|
||||||
|
Treasury services
|
140
|
|
138
|
|
140
|
|
278
|
|
279
|
|
||||||
|
Total investment services fees
|
1,955
|
|
1,980
|
|
1,860
|
|
3,935
|
|
3,689
|
|
||||||
|
Investment management and performance fees
|
910
|
|
960
|
|
879
|
|
1,870
|
|
1,721
|
|
||||||
|
Foreign exchange and other trading revenue
|
187
|
|
209
|
|
165
|
|
396
|
|
329
|
|
||||||
|
Financing-related fees
|
53
|
|
52
|
|
53
|
|
105
|
|
108
|
|
||||||
|
Distribution and servicing
|
34
|
|
36
|
|
41
|
|
70
|
|
82
|
|
||||||
|
Investment and other income
|
70
|
|
82
|
|
122
|
|
152
|
|
199
|
|
||||||
|
Total fee revenue
|
3,209
|
|
3,319
|
|
3,120
|
|
6,528
|
|
6,128
|
|
||||||
|
Net securities gains (losses) — including other-than-temporary impairment
|
1
|
|
(49
|
)
|
—
|
|
(48
|
)
|
10
|
|
||||||
|
Noncredit-related portion of other-than-temporary impairment (recognized in other comprehensive income)
|
—
|
|
—
|
|
—
|
|
—
|
|
—
|
|
||||||
|
Net securities gains (losses)
|
1
|
|
(49
|
)
|
—
|
|
(48
|
)
|
10
|
|
||||||
|
Total fee and other revenue
|
3,210
|
|
3,270
|
|
3,120
|
|
6,480
|
|
6,138
|
|
||||||
|
Operations of consolidated investment management funds
|
||||||||||||||||
|
Investment income (loss)
|
13
|
|
(11
|
)
|
10
|
|
2
|
|
47
|
|
||||||
|
Interest of investment management fund note holders
|
1
|
|
—
|
|
—
|
|
1
|
|
4
|
|
||||||
|
Income (loss) from consolidated investment management funds
|
12
|
|
(11
|
)
|
10
|
|
1
|
|
43
|
|
||||||
|
Net interest revenue
|
||||||||||||||||
|
Interest revenue
|
1,553
|
|
1,381
|
|
1,052
|
|
2,934
|
|
2,012
|
|
||||||
|
Interest expense
|
637
|
|
462
|
|
226
|
|
1,099
|
|
394
|
|
||||||
|
Net interest revenue
|
916
|
|
919
|
|
826
|
|
1,835
|
|
1,618
|
|
||||||
|
Total revenue
|
4,138
|
|
4,178
|
|
3,956
|
|
8,316
|
|
7,799
|
|
||||||
|
Provision for credit losses
|
(3
|
)
|
(5
|
)
|
(7
|
)
|
(8
|
)
|
(12
|
)
|
||||||
|
Noninterest expense
|
||||||||||||||||
|
Staff
(a)
|
1,489
|
|
1,576
|
|
1,432
|
|
3,065
|
|
2,920
|
|
||||||
|
Professional, legal and other purchased services
|
328
|
|
291
|
|
319
|
|
619
|
|
632
|
|
||||||
|
Software
|
192
|
|
173
|
|
173
|
|
365
|
|
339
|
|
||||||
|
Net occupancy
|
156
|
|
139
|
|
140
|
|
295
|
|
276
|
|
||||||
|
Sub-custodian and clearing
(b)
|
110
|
|
119
|
|
108
|
|
229
|
|
211
|
|
||||||
|
Distribution and servicing
|
106
|
|
106
|
|
104
|
|
212
|
|
204
|
|
||||||
|
Furniture and equipment
|
74
|
|
61
|
|
59
|
|
135
|
|
116
|
|
||||||
|
Business development
|
62
|
|
51
|
|
63
|
|
113
|
|
114
|
|
||||||
|
Bank assessment charges
|
47
|
|
52
|
|
59
|
|
99
|
|
116
|
|
||||||
|
Amortization of intangible assets
|
48
|
|
49
|
|
53
|
|
97
|
|
105
|
|
||||||
|
Other
(a)(b)(c)
|
135
|
|
122
|
|
145
|
|
257
|
|
264
|
|
||||||
|
Total noninterest expense
|
2,747
|
|
2,739
|
|
2,655
|
|
5,486
|
|
5,297
|
|
||||||
|
Income
|
||||||||||||||||
|
Income before income taxes
|
1,394
|
|
1,444
|
|
1,308
|
|
2,838
|
|
2,514
|
|
||||||
|
Provision for income taxes
|
286
|
|
282
|
|
332
|
|
568
|
|
601
|
|
||||||
|
Net income
|
1,108
|
|
1,162
|
|
976
|
|
2,270
|
|
1,913
|
|
||||||
|
Net (income) loss attributable to noncontrolling interests (includes $(7), $11, $(3), $4 and $(21) related to consolidated investment management funds, respectively)
|
(5
|
)
|
9
|
|
(1
|
)
|
4
|
|
(16
|
)
|
||||||
|
Net income applicable to shareholders of The Bank of New York Mellon Corporation
|
1,103
|
|
1,171
|
|
975
|
|
2,274
|
|
1,897
|
|
||||||
|
Preferred stock dividends
|
(48
|
)
|
(36
|
)
|
(49
|
)
|
(84
|
)
|
(91
|
)
|
||||||
|
Net income applicable to common shareholders of The Bank of New York Mellon Corporation
|
$
|
1,055
|
|
$
|
1,135
|
|
$
|
926
|
|
$
|
2,190
|
|
$
|
1,806
|
|
|
|
(a)
|
In the first quarter of 2018, we adopted new accounting guidance included in ASU 2017-07, Compensation-Retirement Benefits: Improving the Presentation of Net Periodic Pension Cost and Net Periodic Postretirement Benefit Cost, which required the reclassification of the components of pension and other postretirement costs, other than the service cost component. As a result, staff expense increased and other expense decreased. Prior periods have been reclassified. See Note 2 of the Notes to Consolidated Financial Statements for additional information.
|
|
(b)
|
Beginning in the first quarter of 2018, clearing expense, which was previously included in other expense, was included with sub-custodian expense. Prior periods have been reclassified.
|
|
(c)
|
Beginning in the first quarter of 2018, M&I, litigation and restructuring charges are no longer separately disclosed. Expenses previously reported in this line have been reclassified to existing expense categories, primarily other expense.
|
46
BNY Mellon
|
The Bank of New York Mellon Corporation (and its subsidiaries)
|
Consolidated Income Statement
(unaudited)
(continued)
|
Net income applicable to common shareholders of The Bank of New York Mellon Corporation used for the earnings per share calculation
|
Quarter ended
|
Year-to-date
|
||||||||||||||
|
June 30, 2018
|
|
March 31, 2018
|
|
June 30, 2017
|
|
June 30, 2018
|
|
June 30, 2017
|
|
|||||||
|
(in millions)
|
||||||||||||||||
|
Net income applicable to common shareholders of The Bank of New York Mellon Corporation
|
$
|
1,055
|
|
$
|
1,135
|
|
$
|
926
|
|
$
|
2,190
|
|
$
|
1,806
|
|
|
|
Less: Earnings allocated to participating securities
|
7
|
|
8
|
|
13
|
|
15
|
|
27
|
|
||||||
|
Net income applicable to common shareholders of The Bank of New York Mellon Corporation after required adjustment for the calculation of basic and diluted earnings per common share
|
$
|
1,048
|
|
$
|
1,127
|
|
$
|
913
|
|
|
$
|
2,175
|
|
$
|
1,779
|
|
|
Average common shares and equivalents outstanding of The Bank of New York Mellon Corporation
|
Quarter ended
|
Year-to-date
|
|||||||||
|
June 30, 2018
|
|
March 31, 2018
|
|
June 30, 2017
|
|
June 30, 2018
|
|
June 30, 2017
|
|
||
|
(in thousands)
|
|||||||||||
|
Basic
|
1,010,179
|
|
1,016,797
|
|
1,035,829
|
|
1,013,507
|
|
1,038,479
|
|
|
|
Common stock equivalents
|
6,451
|
|
8,188
|
|
15,598
|
|
7,277
|
|
16,710
|
|
|
|
Less: Participating securities
|
(2,273
|
)
|
(3,254
|
)
|
(9,548
|
)
|
(2,764
|
)
|
(10,380
|
)
|
|
|
Diluted
|
1,014,357
|
|
1,021,731
|
|
1,041,879
|
|
1,018,020
|
|
1,044,809
|
|
|
|
Anti-dilutive securities
(a)
|
7,208
|
|
7,248
|
|
16,256
|
|
7,203
|
|
16,756
|
|
|
|
Earnings per share applicable to common shareholders of The Bank of New York Mellon Corporation
(b)
|
Quarter ended
|
Year-to-date
|
||||||||||||||
|
June 30, 2018
|
|
March 31, 2018
|
|
June 30, 2017
|
|
June 30, 2018
|
|
June 30, 2017
|
|
|||||||
|
(in dollars)
|
||||||||||||||||
|
Basic
|
$
|
1.04
|
|
$
|
1.11
|
|
$
|
0.88
|
|
$
|
2.15
|
|
$
|
1.71
|
|
|
|
Diluted
|
$
|
1.03
|
|
$
|
1.10
|
|
$
|
0.88
|
|
$
|
2.14
|
|
$
|
1.70
|
|
|
|
(a)
|
Represents stock options, restricted stock, restricted stock units and participating securities outstanding but not included in the computation of diluted average common shares because their effect would be anti-dilutive.
|
|
(b)
|
Basic and diluted earnings per share under the two-class method are determined on the net income applicable to common shareholders of The Bank of New York Mellon Corporation reported on the income statement less earnings allocated to participating securities.
|
See accompanying unaudited Notes to Consolidated Financial Statements.
BNY Mellon
47
|
The Bank of New York Mellon Corporation (and its subsidiaries)
|
Consolidated Comprehensive Income Statement
(unaudited)
|
Quarter ended
|
Year-to-date
|
|||||||||||||||
|
June 30, 2018
|
|
March 31, 2018
|
|
June 30, 2017
|
|
June 30, 2018
|
|
June 30, 2017
|
|
|||||||
|
(in millions)
|
||||||||||||||||
|
Net income
|
$
|
1,108
|
|
$
|
1,162
|
|
$
|
976
|
|
$
|
2,270
|
|
$
|
1,913
|
|
|
|
Other comprehensive income, net of tax:
|
||||||||||||||||
|
Foreign currency translation adjustments
|
(400
|
)
|
244
|
|
330
|
|
(156
|
)
|
455
|
|
||||||
|
Unrealized (loss) gain on assets available-for-sale:
|
||||||||||||||||
|
Unrealized (loss) gain arising during the period
|
(64
|
)
|
(275
|
)
|
91
|
|
(339
|
)
|
185
|
|
||||||
|
Reclassification adjustment
|
—
|
|
37
|
|
(1
|
)
|
37
|
|
(7
|
)
|
||||||
|
Total unrealized (loss) gain on assets available-for-sale
|
(64
|
)
|
(238
|
)
|
90
|
|
(302
|
)
|
178
|
|
||||||
|
Defined benefit plans:
|
||||||||||||||||
|
Net gain arising during the period
|
—
|
|
—
|
|
—
|
|
—
|
|
2
|
|
||||||
|
Amortization of prior service credit, net loss and initial obligation included in net periodic benefit cost
|
16
|
|
17
|
|
16
|
|
33
|
|
34
|
|
||||||
|
Total defined benefit plans
|
16
|
|
17
|
|
16
|
|
33
|
|
36
|
|
||||||
|
Net unrealized (loss) gain on cash flow hedges
|
(14
|
)
|
(2
|
)
|
1
|
|
(16
|
)
|
11
|
|
||||||
|
Total other comprehensive (loss) income, net of tax
(a)
|
(462
|
)
|
21
|
|
437
|
|
(441
|
)
|
680
|
|
||||||
|
Total comprehensive income
|
646
|
|
1,183
|
|
1,413
|
|
1,829
|
|
2,593
|
|
||||||
|
Net (income) loss attributable to noncontrolling interests
|
(5
|
)
|
9
|
|
(1
|
)
|
4
|
|
(16
|
)
|
||||||
|
Other comprehensive loss (income) attributable to noncontrolling interests
|
10
|
|
(5
|
)
|
(6
|
)
|
5
|
|
(8
|
)
|
||||||
|
Comprehensive income applicable to shareholders of The Bank of New York Mellon Corporation
|
$
|
651
|
|
$
|
1,187
|
|
$
|
1,406
|
|
$
|
1,838
|
|
$
|
2,569
|
|
|
|
(a)
|
Other comprehensive income (loss) attributable to The Bank of New York Mellon Corporation shareholders was
$(452) million
for the
quarter ended
June 30, 2018
,
$16 million
for the
quarter ended
March 31, 2018
,
$431 million
for the
quarter ended
June 30, 2017
,
$(436) million
for the
six months ended June 30, 2018
and
$672 million
for the
six months ended June 30, 2017
.
|
See accompanying unaudited Notes to Consolidated Financial Statements.
48
BNY Mellon
|
The Bank of New York Mellon Corporation (and its subsidiaries)
|
Consolidated Balance Sheet
(unaudited)
|
|
June 30, 2018
|
|
Dec. 31, 2017
|
|
||
|
(dollars in millions, except per share amounts)
|
||||||
|
Assets
|
||||||
|
Cash and due from:
|
||||||
|
Banks
|
$
|
5,361
|
|
$
|
5,382
|
|
|
Interest-bearing deposits with the Federal Reserve and other central banks
|
75,116
|
|
91,510
|
|
||
|
Interest-bearing deposits with banks ($1,659 and $1,751 is restricted)
|
16,134
|
|
11,979
|
|
||
|
Federal funds sold and securities purchased under resale agreements
|
26,494
|
|
28,135
|
|
||
|
Securities:
|
|
|
||||
|
Held-to-maturity (fair value of $34,188 and $40,512)
|
35,141
|
|
40,827
|
|
||
|
Available-for-sale
|
83,940
|
|
79,543
|
|
||
|
Total securities
|
119,081
|
|
120,370
|
|
||
|
Trading assets
|
7,035
|
|
6,022
|
|
||
|
Loans
|
57,776
|
|
61,540
|
|
||
|
Allowance for loan losses
|
(145
|
)
|
(159
|
)
|
||
|
Net loans
|
57,631
|
|
61,381
|
|
||
|
Premises and equipment
|
1,752
|
|
1,634
|
|
||
|
Accrued interest receivable
|
663
|
|
610
|
|
||
|
Goodwill
|
17,418
|
|
17,564
|
|
||
|
Intangible assets
|
3,308
|
|
3,411
|
|
||
|
Other assets (includes $843 and $791, at fair value)
|
22,507
|
|
23,029
|
|
||
|
Subtotal assets of operations
|
352,500
|
|
371,027
|
|
||
|
Assets of consolidated investment management funds, at fair value
|
428
|
|
731
|
|
||
|
Total assets
|
$
|
352,928
|
|
$
|
371,758
|
|
|
Liabilities
|
|
|
||||
|
Deposits:
|
|
|
||||
|
Noninterest-bearing (principally U.S. offices)
|
$
|
75,463
|
|
$
|
82,716
|
|
|
Interest-bearing deposits in U.S. offices
|
57,054
|
|
52,294
|
|
||
|
Interest-bearing deposits in non-U.S. offices
|
98,043
|
|
109,312
|
|
||
|
Total deposits
|
230,560
|
|
244,322
|
|
||
|
Federal funds purchased and securities sold under repurchase agreements
|
13,200
|
|
15,163
|
|
||
|
Trading liabilities
|
3,580
|
|
3,984
|
|
||
|
Payables to customers and broker-dealers
|
19,123
|
|
20,184
|
|
||
|
Commercial paper
|
2,508
|
|
3,075
|
|
||
|
Other borrowed funds
|
3,053
|
|
3,028
|
|
||
|
Accrued taxes and other expenses
|
5,452
|
|
6,225
|
|
||
|
Other liabilities (including allowance for lending-related commitments of $109 and $102, also includes $75 and $800, at fair value)
|
5,443
|
|
6,050
|
|
||
|
Long-term debt (includes $363 and $367, at fair value)
|
28,260
|
|
27,979
|
|
||
|
Subtotal liabilities of operations
|
311,179
|
|
330,010
|
|
||
|
Liabilities of consolidated investment management funds, at fair value
|
3
|
|
2
|
|
||
|
Total liabilities
|
311,182
|
|
330,012
|
|
||
|
Temporary equity
|
|
|
||||
|
Redeemable noncontrolling interests
|
189
|
|
179
|
|
||
|
Permanent equity
|
|
|
||||
|
Preferred stock – par value $0.01 per share; authorized 100,000,000 shares; issued 35,826 and 35,826 shares
|
3,542
|
|
3,542
|
|
||
|
Common stock – par value $0.01 per share; authorized 3,500,000,000 shares; issued 1,363,777,643 and 1,354,163,581 shares
|
14
|
|
14
|
|
||
|
Additional paid-in capital
|
26,981
|
|
26,665
|
|
||
|
Retained earnings
|
27,306
|
|
25,635
|
|
||
|
Accumulated other comprehensive loss, net of tax
|
(2,795
|
)
|
(2,357
|
)
|
||
|
Less: Treasury stock of 363,833,056 and 340,721,136 common shares, at cost
|
(13,543
|
)
|
(12,248
|
)
|
||
|
Total The Bank of New York Mellon Corporation shareholders’ equity
|
41,505
|
|
41,251
|
|
||
|
Nonredeemable noncontrolling interests of consolidated investment management funds
|
52
|
|
316
|
|
||
|
Total permanent equity
|
41,557
|
|
41,567
|
|
||
|
Total liabilities, temporary equity and permanent equity
|
$
|
352,928
|
|
$
|
371,758
|
|
See accompanying unaudited Notes to Consolidated Financial Statements.
BNY Mellon
49
|
The Bank of New York Mellon Corporation (and its subsidiaries)
|
Consolidated Statement of Cash Flows
(unaudited)
|
Six months ended June 30,
|
||||||
|
(in millions)
|
2018
|
|
2017
|
|
||
|
Operating activities
|
||||||
|
Net income
|
$
|
2,270
|
|
1,913
|
|
|
|
Net loss (income) attributable to noncontrolling interests
|
4
|
|
(16
|
)
|
||
|
Net income applicable to shareholders of The Bank of New York Mellon Corporation
|
2,274
|
|
1,897
|
|
||
|
Adjustments to reconcile net income to net cash provided by (used for) operating activities:
|
||||||
|
Provision for credit losses
|
(8
|
)
|
(12
|
)
|
||
|
Pension plan contributions
|
(19
|
)
|
(8
|
)
|
||
|
Depreciation and amortization
|
677
|
|
693
|
|
||
|
Deferred tax (benefit) expense
|
(230
|
)
|
124
|
|
||
|
Net securities losses (gains)
|
48
|
|
(10
|
)
|
||
|
Change in trading assets and liabilities
|
(462
|
)
|
167
|
|
||
|
Change in accruals and other, net
(a)
|
(712
|
)
|
(4,687
|
)
|
||
|
Net cash provided by (used for) operating activities
(a)
|
1,568
|
|
(1,836
|
)
|
||
|
Investing activities
|
||||||
|
Change in interest-bearing deposits with banks
(a)
|
(4,592
|
)
|
1,740
|
|
||
|
Change in interest-bearing deposits with the Federal Reserve and other central banks
|
15,583
|
|
(13,836
|
)
|
||
|
Purchases of securities held-to-maturity
|
(2,944
|
)
|
(4,494
|
)
|
||
|
Paydowns of securities held-to-maturity
|
2,099
|
|
2,146
|
|
||
|
Maturities of securities held-to-maturity
|
5,535
|
|
2,825
|
|
||
|
Purchases of securities available-for-sale
|
(17,550
|
)
|
(13,569
|
)
|
||
|
Sales of securities available-for-sale
|
4,867
|
|
2,093
|
|
||
|
Paydowns of securities available-for-sale
|
3,871
|
|
4,679
|
|
||
|
Maturities of securities available-for-sale
|
3,767
|
|
3,842
|
|
||
|
Net change in loans
|
3,699
|
|
2,653
|
|
||
|
Sales of loans and other real estate
|
6
|
|
364
|
|
||
|
Change in federal funds sold and securities purchased under resale agreements
(a)
|
1,638
|
|
(1,639
|
)
|
||
|
Net change in seed capital investments
|
15
|
|
(23
|
)
|
||
|
Purchases of premises and equipment/capitalized software
|
(505
|
)
|
(722
|
)
|
||
|
Dispositions, net of cash
|
84
|
|
—
|
|
||
|
Other, net
(a)
|
(359
|
)
|
273
|
|
||
|
Net cash provided by (used for) investing activities
(a)
|
15,214
|
|
(13,668
|
)
|
||
|
Financing activities
|
||||||
|
Change in deposits
|
(12,270
|
)
|
10,812
|
|
||
|
Change in federal funds purchased and securities sold under repurchase agreements
|
(1,963
|
)
|
945
|
|
||
|
Change in payables to customers and broker-dealers
|
(1,051
|
)
|
626
|
|
||
|
Change in other borrowed funds
|
(5
|
)
|
196
|
|
||
|
Change in commercial paper
|
(567
|
)
|
876
|
|
||
|
Net proceeds from the issuance of long-term debt
|
2,991
|
|
3,990
|
|
||
|
Repayments of long-term debt
|
(2,200
|
)
|
(796
|
)
|
||
|
Proceeds from the exercise of stock options
|
70
|
|
256
|
|
||
|
Issuance of common stock
|
20
|
|
14
|
|
||
|
Treasury stock acquired
|
(1,295
|
)
|
(1,385
|
)
|
||
|
Common cash dividends paid
|
(491
|
)
|
(400
|
)
|
||
|
Preferred cash dividends paid
|
(84
|
)
|
(91
|
)
|
||
|
Other, net
|
10
|
|
30
|
|
||
|
Net cash (used for) provided by financing activities
|
(16,835
|
)
|
15,073
|
|
||
|
Effect of exchange rate changes on cash
|
(60
|
)
|
113
|
|
||
|
Change in cash and due from banks and restricted cash
(a)
|
||||||
|
Change in cash and due from banks and restricted cash
|
(113
|
)
|
(318
|
)
|
||
|
Cash and due from banks and restricted cash at beginning of period
|
7,133
|
|
8,204
|
|
||
|
Cash and due from banks and restricted cash at end of period
|
$
|
7,020
|
|
$
|
7,886
|
|
|
Cash and due from banks and restricted cash:
(a)
|
||||||
|
Cash and due from banks at end of period (unrestricted cash)
|
$
|
5,361
|
|
$
|
4,725
|
|
|
Restricted cash at end of period
|
1,659
|
|
3,161
|
|
||
|
Cash and due from banks and restricted cash at end of period
|
$
|
7,020
|
|
$
|
7,886
|
|
|
Supplemental disclosures
|
||||||
|
Interest paid
|
$
|
1,046
|
|
$
|
385
|
|
|
Income taxes paid
|
436
|
|
220
|
|
||
|
Income taxes refunded
|
57
|
|
2
|
|
||
|
(a)
|
Reflects the impact of adopting new accounting guidance included in ASU 2016-15 and ASU 2016-18. Prior periods have been restated. See Note 2 of the Notes to Consolidated Financial Statements for additional information.
|
See accompanying unaudited Notes to Consolidated Financial Statements.
50
BNY Mellon
|
The Bank of New York Mellon Corporation (and its subsidiaries)
|
Consolidated Statement of Changes in Equity
(unaudited)
|
The Bank of New York Mellon Corporation shareholders
|
Non-
redeemable
noncontrolling
interests of
consolidated
investment
management
funds
|
|
Total
permanent
equity
|
|
Redeemable
non-
controlling
interests/
temporary
equity
|
|
||||||||||||||||||||||
|
(in millions, except per
share amount) |
Preferred stock
|
|
Common
stock
|
|
Additional
paid-in
capital
|
|
Retained
earnings
|
|
Accumulated other comprehensive (loss), net
of tax |
|
Treasury
stock
|
|
||||||||||||||||
|
Balance at Dec. 31, 2017
|
$
|
3,542
|
|
$
|
14
|
|
$
|
26,665
|
|
$
|
25,635
|
|
$
|
(2,357
|
)
|
$
|
(12,248
|
)
|
$
|
316
|
|
$
|
41,567
|
|
(a)
|
$
|
179
|
|
|
Adjustment for the cumulative effect of applying ASU 2014-09 for contract revenue
|
—
|
|
—
|
|
—
|
|
(55
|
)
|
—
|
|
—
|
|
—
|
|
(55
|
)
|
—
|
|
||||||||||
|
Adjustment for the cumulative effect of applying ASU 2017-12 for derivatives and hedging
|
—
|
|
—
|
|
—
|
|
27
|
|
(2
|
)
|
—
|
|
—
|
|
25
|
|
—
|
|
||||||||||
|
Adjusted balance at Jan. 1, 2018
|
3,542
|
|
14
|
|
26,665
|
|
25,607
|
|
(2,359
|
)
|
(12,248
|
)
|
316
|
|
41,537
|
|
179
|
|
||||||||||
|
Shares issued to shareholders of noncontrolling interests
|
—
|
|
—
|
|
—
|
|
—
|
|
—
|
|
—
|
|
—
|
|
—
|
|
34
|
|
||||||||||
|
Redemption of subsidiary shares from noncontrolling interests
|
—
|
|
—
|
|
—
|
|
—
|
|
—
|
|
—
|
|
—
|
|
—
|
|
(32
|
)
|
||||||||||
|
Other net changes in noncontrolling interests
|
—
|
|
—
|
|
(13
|
)
|
—
|
|
—
|
|
—
|
|
(260
|
)
|
(273
|
)
|
13
|
|
||||||||||
|
Net income (loss)
|
—
|
|
—
|
|
—
|
|
2,274
|
|
—
|
|
—
|
|
(4
|
)
|
2,270
|
|
—
|
|
||||||||||
|
Other comprehensive (loss)
|
—
|
|
—
|
|
—
|
|
—
|
|
(436
|
)
|
—
|
|
—
|
|
(436
|
)
|
(5
|
)
|
||||||||||
|
Dividends:
|
||||||||||||||||||||||||||||
|
Common stock at $0.48 per
share |
—
|
|
—
|
|
—
|
|
(491
|
)
|
—
|
|
—
|
|
—
|
|
(491
|
)
|
—
|
|
||||||||||
|
Preferred stock
|
—
|
|
—
|
|
—
|
|
(84
|
)
|
—
|
|
—
|
|
—
|
|
(84
|
)
|
—
|
|
||||||||||
|
Repurchase of common stock
|
—
|
|
—
|
|
—
|
|
—
|
|
—
|
|
(1,295
|
)
|
—
|
|
(1,295
|
)
|
—
|
|
||||||||||
|
Common stock issued under:
|
||||||||||||||||||||||||||||
|
Employee benefit plans
|
—
|
|
—
|
|
17
|
|
—
|
|
—
|
|
—
|
|
—
|
|
17
|
|
—
|
|
||||||||||
|
Direct stock purchase and dividend reinvestment plan
|
—
|
|
—
|
|
16
|
|
—
|
|
—
|
|
—
|
|
—
|
|
16
|
|
—
|
|
||||||||||
|
Stock awards and options exercised
|
—
|
|
—
|
|
296
|
|
—
|
|
—
|
|
—
|
|
—
|
|
296
|
|
—
|
|
||||||||||
|
Balance at June 30, 2018
|
$
|
3,542
|
|
$
|
14
|
|
$
|
26,981
|
|
$
|
27,306
|
|
$
|
(2,795
|
)
|
$
|
(13,543
|
)
|
$
|
52
|
|
$
|
41,557
|
|
(a)
|
$
|
189
|
|
|
(a)
|
Includes total The Bank of New York Mellon Corporation common shareholders’ equity of
$37,709 million
at
Dec. 31, 2017
and
$37,963 million
at
June 30, 2018
.
|
See accompanying unaudited Notes to Consolidated Financial Statements.
BNY Mellon
51
|
Notes to Consolidated Financial Statements
|
Note 1–Basis of presentation
Basis of presentation
The accounting and financial reporting policies of BNY Mellon, a global financial services company, conform to U.S. generally accepted accounting principles (“GAAP”) and prevailing industry practices.
The accompanying consolidated financial statements are unaudited. In the opinion of management, all adjustments necessary for a fair presentation of financial position, results of operations and cash flows for the periods presented have been made. These financial statements should be read in conjunction with BNY Mellon’s Annual Report on Form 10-K for the year ended
Dec. 31, 2017
. Certain immaterial reclassifications have been made to prior periods to place them on a basis comparable with current period presentation.
Use of estimates
The preparation of financial statements in conformity with U.S. GAAP requires management to make estimates based upon assumptions about future economic and market conditions which affect reported amounts and related disclosures in our financial statements. Although our current estimates contemplate current conditions and how we expect them to change in the future, it is reasonably possible that actual conditions could be worse than anticipated in those estimates, which could materially affect our results of operations and financial condition. Amounts subject to estimates are items such as allowance for loan losses and lending-related commitments, fair value of financial instruments and derivatives, other-than-temporary impairment, goodwill and other intangibles and pension accounting. Among other effects, such changes in estimates could result in future impairments of securities, goodwill and intangible assets and establishment of allowances for loan losses and lending-related commitments as well as changes in pension and postretirement expense.
Note 2–Accounting changes and new accounting guidance
The following accounting changes and new accounting guidance were adopted in the first quarter of 2018.
ASU 2017-12, Derivatives and Hedging: Targeted Improvements to Accounting for Hedging Activities
In August 2017, the FASB issued an ASU,
Derivatives and Hedging: Targeted Improvements to Accounting for Hedging Activities
. The objective of this ASU is to improve the financial reporting of hedging relationships to better portray the economic results of an entity’s risk management activities and to simplify the application of hedge accounting guidance.
The most significant impact of the new guidance to the Company relates to the new accounting alternatives for fair value hedges of interest rate risk, specifically, the ability to hedge only the benchmark component of the contractual cash flows and partial-term hedging. The guidance also changed presentation and disclosure requirements and made changes to how the shortcut method is applied, which resulted in the Company using that method going forward for certain hedging relationships.
BNY Mellon elected to early adopt this ASU on Jan. 31, 2018, which is the “as of” date for which the Company was permitted to make certain elections and the measurement date for recording the adoption impact for certain hedge modifications. As part of the adoption, we elected to reclassify approximately
$1.1 billion
of debt securities from held-to-maturity to available-for-sale which resulted in a decrease of
$47 million
pre-tax to accumulated other comprehensive income. The Company also elected to modify certain hedge relationships as of the adoption date primarily to utilize the benchmark component method of measuring hedge effectiveness, as such method is deemed to more closely match risk management objectives with accounting results. The Company recognized a
$27 million
after-tax increase in retained earnings as of Jan. 1, 2018 associated with the adoption impact of these hedge modifications.
52
BNY Mellon
|
Notes to Consolidated Financial Statements
(continued)
|
ASU 2017-07, Compensation-Retirement Benefits: Improving the Presentation of Net Periodic Pension Cost and Net Periodic Postretirement Benefit Cost
In March 2017, the FASB issued an ASU,
Compensation-Retirement Benefits: Improving the Presentation of Net Periodic Pension Cost and Net Periodic Postretirement Benefit Cost
. The ASU requires the disaggregation of the service cost component from the other components of the net benefit cost in the income statement. The ASU also permits only the service cost component of net benefit cost to be eligible for capitalization. BNY Mellon adopted this ASU in the first quarter of 2018, and applied the guidance retrospectively for the presentation of the service cost component and the other components in the income statement, and prospectively for the capitalization of the service cost component in assets. The adoption of this standard increased staff expense and decreased other expense by
$16 million
for the second quarter of 2017 and
$32 million
for the first six months of 2017.
ASU 2016-18, Statement of Cash Flows: Restricted Cash
In November 2016, the FASB issued an ASU,
Statement of Cash Flows: Restricted Cash
. This ASU provides guidance on the presentation of restricted cash or restricted cash equivalents in the statement of cash flows. Restricted cash consists of excess client funds held by our broker-dealer business and totaled
$1.7 billion
at June 30, 2018 and
$3.2 billion
at June 30, 2017. Restricted cash is included in interest-bearing deposits with banks on the consolidated balance sheet and with cash and due from banks when reconciling the beginning and end-of-period balances on the consolidated cash flow statement.
We adopted the guidance in this ASU retrospectively. As a result, the change in interest-bearing deposits with banks, which is included in investing activities on the consolidated statement of cash flows, was restated to reflect the decrease in restricted cash of
$221 million
for the six months ended June 30, 2017. The change in restricted cash was a
$92 million
decrease for the six months ended June 30, 2018.
ASU 2016-15, Statement of Cash Flows:
Classification of Certain Cash Receipts and Cash Payments
In August 2016, the FASB issued an ASU,
Statement of Cash Flows: Classification of Certain Cash Receipts and Cash Payments
. This ASU provides guidance on eight specific cash flow presentation issues. The most significant impact for BNY Mellon relates to distributions received from equity method investees. For equity method investments, BNY Mellon elected to report distributions received from equity method investees using the cumulative earnings approach. Distributions received are considered returns on investment and classified as cash inflows from operating activities on the consolidated cash flows statement. To the extent the returns on investment exceeded the cumulative equity in earnings recognized, the excess would be considered a return of investment and classified as cash inflows from investing activities on the consolidated cash flows statement. We adopted the guidance in this ASU retrospectively. As a result, the change in accruals and other, net, which is included in operating activities on the consolidated cash flows statement, was restated to reflect distributions received of
$19 million
for the
six months ended June 30, 2017
. These distributions were previously included in other, net in investing activities on the consolidated cash flows statement. Distributions received for the
six months ended June 30, 2018
were
$19 million
. The remaining seven specific cash flow presentation issues do not materially impact BNY Mellon.
ASU 2014-09, Revenue from Contracts with Customers
In May 2014, the FASB issued an ASU,
Revenue from Contracts with Customers
. This ASU, as amended, provides guidance on the recognition of revenue related to the transfer of promised goods or services to customers and guidance on accounting for certain contract costs. The standard provides a single revenue model to be applied by reporting companies under U.S. GAAP and supersedes most existing revenue recognition guidance.
The Company adopted the guidance on Jan. 1, 2018 using the cumulative effect transition method applied to contracts not completed as of Dec. 31, 2017, which resulted in a
$55 million
after-tax reduction to retained earnings. The comparative financial
BNY Mellon
53
|
Notes to Consolidated Financial Statements
(continued)
|
information for 2017 has not been restated and continues to be reported under the accounting standards in effect for that period.
Although the impact of the adoption of this ASU was not material, the most significant changes and quantitative impact of the changes are disclosed below.
Payments to customers
The timing of recognizing the reduction in revenue for certain payments made to depositary receipts customers has changed. Prior to adoption, annual payments to customers were capitalized and amortized as contra revenue over the remaining contract period, subject to impairment reviews.
Under the new guidance, annual payments are recorded as a reduction in revenue in proportion to the expected annual revenue generated from the related customer contract.
Costs to obtain a customer contract
Prior to adoption, costs to obtain a customer contract, primarily sales incentives, were expensed as incurred. Under the new guidance, an asset is recognized for the incremental sales incentives that are considered costs of obtaining a contract with a customer, if those costs are expected to be recovered.
The table below presents the cumulative effect of the adoption of the new guidance on the consolidated balance sheet as of
Dec. 31, 2017
.
|
Impact on the consolidated balance sheet
|
|||||||||
|
Dec. 31, 2017
|
|
Impact of
adoption
|
|
Jan. 1, 2018
|
|
||||
|
(in millions)
|
|||||||||
|
Assets
|
|||||||||
|
Other assets
|
$
|
23,029
|
|
$
|
(9
|
)
|
$
|
23,020
|
|
|
|
|||||||||
|
Liabilities
|
|
||||||||
|
Accrued tax and other expenses
|
$
|
6,225
|
|
$
|
(18
|
)
|
$
|
6,207
|
|
|
Other liabilities
|
6,050
|
|
64
|
|
6,114
|
|
|||
|
|
|||||||||
|
Equity
|
|
||||||||
|
Retained earnings
|
$
|
25,635
|
|
$
|
(55
|
)
|
$
|
25,580
|
|
The impact of the new guidance on the consolidated income statement for the
second quarter of 2018
and the first six months of 2018, and consolidated balance sheet as of
June 30, 2018
, was de minimis. See Note 8 for additional revenue and contract costs disclosures.
ASU 2016-01, Financial Instruments—Overall: Recognition and Measurement of Financial Assets and Financial Liabilities
In January 2016, the FASB issued an ASU,
Financial Instruments—Overall:
Recognition and Measurement of Financial Assets and Financial Liabilities
. The ASU requires investments in equity securities that do not result in consolidation and are not accounted for under the equity method to be measured at fair value with changes in the fair value recognized through net income, unless one of two available exceptions applies. The first exception, a scope exception, allows Federal Reserve Bank stock, FHLB stock and exchange memberships to remain accounted for at cost, less impairment. The second practicability exception is an election available for equity investments that do not have readily determinable fair values. For certain investments where the Company has chosen the practicability exception, such investments are accounted for at cost adjusted for impairment, if any, plus or minus observable price changes.
The Company adopted this guidance in the first quarter of 2018 using the cumulative effect method of adoption, with a de minimis impact to retained earnings. As part of the adoption, we reclassified money market fund investments of approximately
$1 billion
to trading assets, primarily from available-for-sale securities.
We have non-readily marketable equity securities where we are utilizing the practicability exception of
$53 million
at
June 30, 2018
and
$47 million
at March 31, 2018. We recognized upward adjustments on these securities of
$5 million
in the
second quarter of 2018
and
$20 million
in the first quarter of 2018. Both upward adjustments were driven by activity that resulted in observable price changes.
54
BNY Mellon
|
Notes to Consolidated Financial Statements
(continued)
|
Note 3–Acquisitions and dispositions
We sometimes structure our acquisitions with both an initial payment and later contingent payments tied to post-closing revenue or income growth. There were
no
contingent payments in the
second quarter of 2018
or the
first six months of 2018
.
At
June 30, 2018
, we are potentially obligated to pay additional consideration
which, using reasonable assumptions, could range from
$0 million
to
$7 million
over the next
two years
, but could be higher as certain of the arrangements do not contain a contractual maximum.
The transactions described below did
not have a material impact on BNY Mellon’s results of operations.
On Jan. 2, 2018, BNY Mellon completed the sale of CenterSquare, one of our Investment Management boutiques, and recorded a gain on this transaction. CenterSquare had approximately
$10 billion
in AUM in U.S. and global real estate and infrastructure investments. In addition, goodwill of
$52 million
was removed from the balance sheet as a result of this sale.
On June 29, 2018, BNY Mellon completed the exchange of its majority equity interest in Amherst Capital Management LLC for a minority equity stake in Amherst Holdings LLC. Goodwill of
$13 million
was removed from the balance sheet and a gain was recorded as a result of this sale.
Note 4–Securities
The following tables present the amortized cost, the gross unrealized gains and losses and the fair value of securities at
June 30, 2018
and
Dec. 31, 2017
, respectively.
|
Securities at June 30, 2018
|
Gross
unrealized
|
|||||||||||
|
Amortized cost
|
|
Fair
value
|
|
|||||||||
|
(in millions)
|
Gains
|
|
Losses
|
|
||||||||
|
Available-for-sale:
|
||||||||||||
|
U.S. Treasury
|
$
|
19,063
|
|
$
|
99
|
|
$
|
307
|
|
$
|
18,855
|
|
|
U.S. government agencies
|
1,481
|
|
—
|
|
34
|
|
1,447
|
|
||||
|
State and political subdivisions
|
2,636
|
|
23
|
|
29
|
|
2,630
|
|
||||
|
Agency RMBS
|
25,159
|
|
89
|
|
445
|
|
24,803
|
|
||||
|
Non-agency RMBS
(a)
|
1,229
|
|
285
|
|
7
|
|
1,507
|
|
||||
|
Non-agency commercial MBS
|
1,403
|
|
1
|
|
26
|
|
1,378
|
|
||||
|
Agency commercial MBS
|
9,775
|
|
11
|
|
220
|
|
9,566
|
|
||||
|
CLOs
|
3,179
|
|
4
|
|
6
|
|
3,177
|
|
||||
|
Foreign covered bonds
|
2,898
|
|
13
|
|
18
|
|
2,893
|
|
||||
|
Corporate bonds
|
1,167
|
|
9
|
|
30
|
|
1,146
|
|
||||
|
Sovereign debt/sovereign guaranteed
|
11,986
|
|
136
|
|
36
|
|
12,086
|
|
||||
|
Other debt securities
|
4,470
|
|
5
|
|
23
|
|
4,452
|
|
||||
|
Total securities available-for-sale
(b)
|
$
|
84,446
|
|
$
|
675
|
|
$
|
1,181
|
|
$
|
83,940
|
|
|
Held-to-maturity:
|
||||||||||||
|
U.S. Treasury
|
$
|
5,043
|
|
$
|
2
|
|
$
|
116
|
|
$
|
4,929
|
|
|
U.S. government agencies
|
1,803
|
|
—
|
|
17
|
|
1,786
|
|
||||
|
State and political subdivisions
|
17
|
|
—
|
|
1
|
|
16
|
|
||||
|
Agency RMBS
|
25,747
|
|
10
|
|
818
|
|
24,939
|
|
||||
|
Non-agency RMBS
|
111
|
|
4
|
|
1
|
|
114
|
|
||||
|
Agency commercial MBS
|
1,321
|
|
—
|
|
46
|
|
1,275
|
|
||||
|
Foreign covered bonds
|
82
|
|
1
|
|
—
|
|
83
|
|
||||
|
Sovereign debt/sovereign guaranteed
|
990
|
|
29
|
|
—
|
|
1,019
|
|
||||
|
Other debt securities
|
27
|
|
—
|
|
—
|
|
27
|
|
||||
|
Total securities held-to-maturity
|
$
|
35,141
|
|
$
|
46
|
|
$
|
999
|
|
$
|
34,188
|
|
|
Total securities
|
$
|
119,587
|
|
$
|
721
|
|
$
|
2,180
|
|
$
|
118,128
|
|
|
(a)
|
Includes
$943 million
that were included in the former Grantor Trust.
|
|
(b)
|
Includes gross unrealized gains of
$44 million
and gross unrealized losses of
$100 million
recorded in accumulated other comprehensive income related to securities that were transferred from available-for-sale to held-to-maturity. The unrealized gains and losses are primarily related to Agency RMBS and will be amortized into net interest revenue over the contractual lives of the securities.
|
BNY Mellon
55
|
Notes to Consolidated Financial Statements
(continued)
|
|
Securities at Dec. 31, 2017
|
Gross
unrealized
|
|||||||||||
|
Amortized cost
|
|
Fair
value
|
|
|||||||||
|
(in millions)
|
Gains
|
|
Losses
|
|
||||||||
|
Available-for-sale:
|
||||||||||||
|
U.S. Treasury
|
$
|
15,159
|
|
$
|
264
|
|
$
|
160
|
|
$
|
15,263
|
|
|
U.S. government agencies
|
917
|
|
1
|
|
10
|
|
908
|
|
||||
|
State and political subdivisions
|
2,949
|
|
31
|
|
23
|
|
2,957
|
|
||||
|
Agency RMBS
|
24,002
|
|
108
|
|
291
|
|
23,819
|
|
||||
|
Non-agency RMBS
(a)
|
1,265
|
|
317
|
|
4
|
|
1,578
|
|
||||
|
Other RMBS
|
152
|
|
3
|
|
6
|
|
149
|
|
||||
|
Non-agency commercial MBS
|
1,360
|
|
6
|
|
6
|
|
1,360
|
|
||||
|
Agency commercial MBS
|
8,793
|
|
36
|
|
67
|
|
8,762
|
|
||||
|
CLOs
|
2,898
|
|
12
|
|
1
|
|
2,909
|
|
||||
|
Other asset-backed securities
|
1,040
|
|
3
|
|
—
|
|
1,043
|
|
||||
|
Foreign covered bonds
|
2,520
|
|
18
|
|
9
|
|
2,529
|
|
||||
|
Corporate bonds
|
1,249
|
|
17
|
|
11
|
|
1,255
|
|
||||
|
Sovereign debt/sovereign guaranteed
|
12,405
|
|
175
|
|
23
|
|
12,557
|
|
||||
|
Other debt securities
|
3,494
|
|
9
|
|
12
|
|
3,491
|
|
||||
|
Money market funds
|
963
|
|
—
|
|
—
|
|
963
|
|
||||
|
Total securities available-for-sale
(b)
|
$
|
79,166
|
|
$
|
1,000
|
|
$
|
623
|
|
$
|
79,543
|
|
|
Held-to-maturity:
|
||||||||||||
|
U.S. Treasury
|
$
|
9,792
|
|
$
|
6
|
|
$
|
56
|
|
$
|
9,742
|
|
|
U.S. government agencies
|
1,653
|
|
—
|
|
12
|
|
1,641
|
|
||||
|
State and political subdivisions
|
17
|
|
—
|
|
1
|
|
16
|
|
||||
|
Agency RMBS
|
26,208
|
|
51
|
|
332
|
|
25,927
|
|
||||
|
Non-agency RMBS
|
57
|
|
5
|
|
—
|
|
62
|
|
||||
|
Other RMBS
|
65
|
|
—
|
|
1
|
|
64
|
|
||||
|
Non-agency commercial MBS
|
6
|
|
—
|
|
—
|
|
6
|
|
||||
|
Agency commercial MBS
|
1,324
|
|
2
|
|
9
|
|
1,317
|
|
||||
|
Foreign covered bonds
|
84
|
|
2
|
|
—
|
|
86
|
|
||||
|
Sovereign debt/sovereign guaranteed
|
1,593
|
|
30
|
|
—
|
|
1,623
|
|
||||
|
Other debt securities
|
28
|
|
—
|
|
—
|
|
28
|
|
||||
|
Total securities held-to-maturity
|
$
|
40,827
|
|
$
|
96
|
|
$
|
411
|
|
$
|
40,512
|
|
|
Total securities
|
$
|
119,993
|
|
$
|
1,096
|
|
$
|
1,034
|
|
$
|
120,055
|
|
|
(a)
|
Includes
$1,091 million
that were included in the former Grantor Trust.
|
|
(b)
|
Includes gross unrealized gains of
$50 million
and gross unrealized losses of
$144 million
recorded in accumulated other comprehensive income related to securities that were transferred from available-for-sale to held-to-maturity. The unrealized gains and losses are primarily related to Agency RMBS and will be amortized into net interest revenue over the contractual lives of the securities.
|
The following table presents the realized gains, losses and impairments, on a gross basis.
|
Net securities gains (losses)
|
|||||||||||||||
|
(in millions)
|
2Q18
|
|
1Q18
|
|
2Q17
|
|
YTD18
|
|
YTD17
|
|
|||||
|
Realized gross gains
|
$
|
2
|
|
$
|
2
|
|
$
|
3
|
|
$
|
4
|
|
$
|
14
|
|
|
Realized gross losses
|
(1
|
)
|
(51
|
)
|
(2
|
)
|
(52
|
)
|
(2
|
)
|
|||||
|
Recognized gross impairments
|
—
|
|
—
|
|
(1
|
)
|
—
|
|
(2
|
)
|
|||||
|
Total net securities gains (losses)
|
$
|
1
|
|
$
|
(49
|
)
|
$
|
—
|
|
$
|
(48
|
)
|
$
|
10
|
|
In the first quarter of 2018, we adopted the new accounting guidance included in ASU 2016-01,
Financial Instruments—Overall: Recognition and Measurement of Financial Assets and Financial Liabilities
. As a result, money market fund investments were reclassified to trading assets, primarily from available-for-sale securities.
In the first quarter of 2018, certain debt securities with an aggregate amortized cost of
$1,117 million
and fair value of
$1,070 million
were transferred from held-to-maturity securities to available-for-sale securities as part of the adoption of ASU 2017-12,
Derivatives and Hedging: Targeted Improvements to Accounting for Hedging Activities
.
Temporarily impaired securities
At
June 30, 2018
, the unrealized losses on the securities portfolio were primarily attributable to an increase in interest rates from date of purchase, and for certain securities that were transferred from available-for-sale to held-to-maturity, an increase in interest rates through the date they were transferred. Specifically,
$100 million
of the unrealized losses at
June 30, 2018
and
$144 million
at
Dec. 31, 2017
reflected in the available-for-sale sections of the tables below relate to certain securities (primarily Agency RMBS) that were transferred in prior periods from available-for-sale to held-to-maturity. The unrealized losses will be amortized into net interest revenue over the contractual lives of the securities. The transfer created a new cost basis for the securities. As a result, if these securities have experienced unrealized losses since the date of transfer, the corresponding fair value and unrealized losses would be reflected in the held-to-maturity sections of the following tables. We do not intend to sell these securities and it is not more likely than not that we will have to sell these securities.
56
BNY Mellon
|
Notes to Consolidated Financial Statements
(continued)
|
The following tables show the aggregate fair value of securities with a continuous unrealized loss position for less than 12 months and those that have been in a continuous unrealized loss position for 12 months or more at
June 30, 2018
and
Dec. 31, 2017
, respectively.
|
Temporarily impaired securities at June 30, 2018
|
Less than 12 months
|
12 months or more
|
Total
|
|||||||||||||||||
|
Fair
value
|
|
Unrealized
losses
|
|
Fair
value
|
|
Unrealized
losses
|
|
Fair
value
|
|
Unrealized
losses
|
|
|||||||||
|
(in millions)
|
||||||||||||||||||||
|
Available-for-sale:
|
||||||||||||||||||||
|
U.S. Treasury
|
$
|
10,447
|
|
$
|
140
|
|
$
|
3,550
|
|
$
|
167
|
|
$
|
13,997
|
|
$
|
307
|
|
||
|
U.S. government agencies
|
1,140
|
|
29
|
|
119
|
|
5
|
|
1,259
|
|
34
|
|
||||||||
|
State and political subdivisions
|
488
|
|
6
|
|
470
|
|
23
|
|
958
|
|
29
|
|
||||||||
|
Agency RMBS
|
10,909
|
|
209
|
|
4,821
|
|
236
|
|
15,730
|
|
445
|
|
||||||||
|
Non-agency RMBS
(a)
|
96
|
|
3
|
|
156
|
|
4
|
|
252
|
|
7
|
|
||||||||
|
Non-agency commercial MBS
|
955
|
|
21
|
|
115
|
|
5
|
|
1,070
|
|
26
|
|
||||||||
|
Agency commercial MBS
|
5,541
|
|
159
|
|
1,062
|
|
61
|
|
6,603
|
|
220
|
|
||||||||
|
CLOs
|
1,292
|
|
6
|
|
45
|
|
—
|
|
1,337
|
|
6
|
|
||||||||
|
Foreign covered bonds
|
1,197
|
|
12
|
|
281
|
|
6
|
|
1,478
|
|
18
|
|
||||||||
|
Corporate bonds
|
707
|
|
28
|
|
49
|
|
2
|
|
756
|
|
30
|
|
||||||||
|
Sovereign debt/sovereign guaranteed
|
2,647
|
|
23
|
|
626
|
|
13
|
|
3,273
|
|
36
|
|
||||||||
|
Other debt securities
|
2,519
|
|
15
|
|
409
|
|
8
|
|
2,928
|
|
23
|
|
||||||||
|
Total securities available-for-sale
(b)
|
$
|
37,938
|
|
$
|
651
|
|
$
|
11,703
|
|
$
|
530
|
|
$
|
49,641
|
|
$
|
1,181
|
|
||
|
Held-to-maturity:
|
||||||||||||||||||||
|
U.S. Treasury
|
$
|
3,591
|
|
$
|
80
|
|
$
|
1,136
|
|
$
|
36
|
|
$
|
4,727
|
|
$
|
116
|
|
||
|
U.S. government agencies
|
554
|
|
10
|
|
856
|
|
7
|
|
1,410
|
|
17
|
|
||||||||
|
State and political subdivisions
|
—
|
|
—
|
|
4
|
|
1
|
|
4
|
|
1
|
|
||||||||
|
Agency RMBS
|
14,697
|
|
428
|
|
8,805
|
|
390
|
|
23,502
|
|
818
|
|
||||||||
|
Non-agency RMBS
|
36
|
|
—
|
|
24
|
|
1
|
|
60
|
|
1
|
|
||||||||
|
Agency commercial MBS
|
1,217
|
|
42
|
|
57
|
|
4
|
|
1,274
|
|
46
|
|
||||||||
|
Total securities held-to-maturity
|
$
|
20,095
|
|
$
|
560
|
|
$
|
10,882
|
|
$
|
439
|
|
$
|
30,977
|
|
$
|
999
|
|
||
|
Total temporarily impaired securities
|
$
|
58,033
|
|
$
|
1,211
|
|
$
|
22,585
|
|
$
|
969
|
|
$
|
80,618
|
|
$
|
2,180
|
|
||
|
(a)
|
Includes
$15 million
with an unrealized loss of
$1 million
for less than 12 months and
$5 million
with an unrealized loss of less than
$1 million
for 12 months or more that were included in the former Grantor Trust.
|
|
(b)
|
Includes gross unrealized losses of
$100 million
for 12 months or more recorded in accumulated other comprehensive income related to securities that were transferred from available-for-sale to held-to-maturity. The unrealized losses are primarily related to Agency RMBS and will be amortized into net interest revenue over the contractual lives of the securities. There were
no
gross unrealized losses for less than 12 months.
|
BNY Mellon
57
|
Notes to Consolidated Financial Statements
(continued)
|
|
Temporarily impaired securities at Dec. 31, 2017
|
Less than 12 months
|
12 months or more
|
Total
|
|||||||||||||||||
|
(in millions)
|
Fair
value
|
|
Unrealized
losses
|
|
Fair
value
|
|
Unrealized
losses
|
|
Fair
value
|
|
Unrealized
losses
|
|
||||||||
|
Available-for-sale:
|
||||||||||||||||||||
|
U.S. Treasury
|
$
|
7,429
|
|
$
|
131
|
|
$
|
2,175
|
|
$
|
29
|
|
$
|
9,604
|
|
$
|
160
|
|
||
|
U.S. government agencies
|
588
|
|
6
|
|
160
|
|
4
|
|
748
|
|
10
|
|
||||||||
|
State and political subdivisions
|
732
|
|
3
|
|
518
|
|
20
|
|
1,250
|
|
23
|
|
||||||||
|
Agency RMBS
|
8,567
|
|
66
|
|
5,834
|
|
225
|
|
14,401
|
|
291
|
|
||||||||
|
Non-agency RMBS
(a)
|
20
|
|
—
|
|
149
|
|
4
|
|
169
|
|
4
|
|
||||||||
|
Other RMBS
|
71
|
|
4
|
|
45
|
|
2
|
|
116
|
|
6
|
|
||||||||
|
Non-agency commercial MBS
|
476
|
|
3
|
|
122
|
|
3
|
|
598
|
|
6
|
|
||||||||
|
Agency commercial MBS
|
3,077
|
|
28
|
|
1,332
|
|
39
|
|
4,409
|
|
67
|
|
||||||||
|
CLOs
|
260
|
|
1
|
|
—
|
|
—
|
|
260
|
|
1
|
|
||||||||
|
Foreign covered bonds
|
953
|
|
7
|
|
116
|
|
2
|
|
1,069
|
|
9
|
|
||||||||
|
Corporate bonds
|
274
|
|
2
|
|
288
|
|
9
|
|
562
|
|
11
|
|
||||||||
|
Sovereign debt/sovereign guaranteed
|
1,880
|
|
12
|
|
559
|
|
11
|
|
2,439
|
|
23
|
|
||||||||
|
Other debt securities
|
1,855
|
|
7
|
|
368
|
|
5
|
|
2,223
|
|
12
|
|
||||||||
|
Total securities available-for-sale
(b)
|
$
|
26,182
|
|
$
|
270
|
|
$
|
11,666
|
|
$
|
353
|
|
$
|
37,848
|
|
$
|
623
|
|
||
|
Held-to-maturity:
|
||||||||||||||||||||
|
U.S. Treasury
|
$
|
6,389
|
|
$
|
41
|
|
$
|
2,909
|
|
$
|
15
|
|
$
|
9,298
|
|
$
|
56
|
|
||
|
U.S. government agencies
|
791
|
|
4
|
|
850
|
|
8
|
|
1,641
|
|
12
|
|
||||||||
|
State and political subdivisions
|
—
|
|
—
|
|
4
|
|
1
|
|
4
|
|
1
|
|
||||||||
|
Agency RMBS
|
9,458
|
|
81
|
|
12,305
|
|
251
|
|
21,763
|
|
332
|
|
||||||||
|
Other RMBS
|
—
|
|
—
|
|
50
|
|
1
|
|
50
|
|
1
|
|
||||||||
|
Agency commercial MBS
|
737
|
|
7
|
|
60
|
|
2
|
|
797
|
|
9
|
|
||||||||
|
Total securities held-to-maturity
|
$
|
17,375
|
|
$
|
133
|
|
$
|
16,178
|
|
$
|
278
|
|
$
|
33,553
|
|
$
|
411
|
|
||
|
Total temporarily impaired securities
|
$
|
43,557
|
|
$
|
403
|
|
$
|
27,844
|
|
$
|
631
|
|
$
|
71,401
|
|
$
|
1,034
|
|
||
|
(a)
|
Includes
$7 million
with an unrealized loss of less than
$1 million
for less than 12 months and
$12 million
with an unrealized loss of
$1 million
for 12 months or more
that were included in the former Grantor Trust.
|
|
(b)
|
Includes gross unrealized losses of
$144 million
for 12 months or more recorded in accumulated other comprehensive income related to securities that were transferred from available-for-sale to held-to-maturity. The unrealized losses are primarily related to Agency RMBS and will be amortized into net interest revenue over the contractual lives of the securities. There were
no
gross unrealized losses for less than 12 months.
|
The following table shows the maturity distribution by carrying amount and yield (on a tax equivalent basis) of our securities portfolio.
|
Maturity distribution and yields on securities at June 30, 2018
|
U.S. Treasury
|
U.S. government
agencies
|
State and political
subdivisions
|
Other bonds, notes and debentures
|
Mortgage/
asset-backed
|
||||||||||||||||||||||||||||
|
(dollars in millions)
|
Amount
|
|
Yield
(a)
|
|
Amount
|
|
Yield
(a)
|
|
Amount
|
|
Yield
(a)
|
|
Amount
|
|
Yield
(a)
|
|
Amount
|
|
Yield
(a)
|
|
Total
|
|
|||||||||||
|
Securities available-for-sale:
|
|||||||||||||||||||||||||||||||||
|
One year or less
|
$
|
6,518
|
|
1.82
|
%
|
$
|
40
|
|
2.17
|
%
|
$
|
438
|
|
2.14
|
%
|
$
|
5,444
|
|
1.22
|
%
|
$
|
—
|
|
—
|
%
|
$
|
12,440
|
|
|||||
|
Over 1 through 5 years
|
6,395
|
|
1.97
|
|
454
|
|
2.18
|
|
1,352
|
|
2.94
|
|
12,364
|
|
1.17
|
|
—
|
|
—
|
|
20,565
|
|
|||||||||||
|
Over 5 through 10 years
|
2,556
|
|
2.21
|
|
953
|
|
2.72
|
|
645
|
|
2.67
|
|
2,322
|
|
0.84
|
|
—
|
|
—
|
|
6,476
|
|
|||||||||||
|
Over 10 years
|
3,386
|
|
3.11
|
|
—
|
|
—
|
|
195
|
|
2.87
|
|
192
|
|
1.66
|
|
—
|
|
—
|
|
3,773
|
|
|||||||||||
|
Mortgage-backed securities
|
—
|
|
—
|
|
—
|
|
—
|
|
—
|
|
—
|
|
—
|
|
—
|
|
37,254
|
|
3.11
|
|
37,254
|
|
|||||||||||
|
Asset-backed securities
|
—
|
|
—
|
|
—
|
|
—
|
|
—
|
|
—
|
|
—
|
|
—
|
|
3,432
|
|
3.03
|
|
3,432
|
|
|||||||||||
|
Total
|
$
|
18,855
|
|
2.16
|
%
|
$
|
1,447
|
|
2.53
|
%
|
$
|
2,630
|
|
2.74
|
%
|
$
|
20,322
|
|
1.18
|
%
|
$
|
40,686
|
|
3.11
|
%
|
$
|
83,940
|
|
|||||
|
Securities held-to-maturity:
|
|||||||||||||||||||||||||||||||||
|
One year or less
|
$
|
577
|
|
1.18
|
%
|
$
|
631
|
|
1.18
|
%
|
$
|
—
|
|
—
|
%
|
$
|
136
|
|
0.83
|
%
|
$
|
—
|
|
—
|
%
|
$
|
1,344
|
|
|||||
|
Over 1 through 5 years
|
3,807
|
|
1.81
|
|
1,172
|
|
2.23
|
|
2
|
|
5.66
|
|
442
|
|
0.46
|
|
—
|
|
—
|
|
5,423
|
|
|||||||||||
|
Over 5 through 10 years
|
659
|
|
1.78
|
|
—
|
|
—
|
|
1
|
|
5.78
|
|
521
|
|
0.85
|
|
—
|
|
—
|
|
1,181
|
|
|||||||||||
|
Over 10 years
|
—
|
|
—
|
|
—
|
|
—
|
|
14
|
|
4.76
|
|
—
|
|
—
|
|
—
|
|
—
|
|
14
|
|
|||||||||||
|
Mortgage-backed securities
|
—
|
|
—
|
|
—
|
|
—
|
|
—
|
|
—
|
|
—
|
|
—
|
|
27,179
|
|
2.85
|
|
27,179
|
|
|||||||||||
|
Total
|
$
|
5,043
|
|
1.74
|
%
|
$
|
1,803
|
|
1.86
|
%
|
$
|
17
|
|
4.94
|
%
|
$
|
1,099
|
|
0.69
|
%
|
$
|
27,179
|
|
2.85
|
%
|
$
|
35,141
|
|
|||||
|
(a)
|
Yields are based upon the amortized cost of securities.
|
58
BNY Mellon
|
Notes to Consolidated Financial Statements
(continued)
|
Other-than-temporary impairment
We conduct periodic reviews of all securities to determine whether OTTI has occurred. Such reviews may incorporate the use of economic models. Various inputs to the economic models are used to determine if an unrealized loss on securities is other-than-temporary. For example, the most significant inputs related to non-agency RMBS are:
|
•
|
Default rate - the number of mortgage loans expected to go into default over the life of the transaction, which is driven by the roll rate of loans in each performance bucket that will ultimately migrate to default; and
|
|
•
|
Severity - the loss expected to be realized when a loan defaults.
|
To determine if an unrealized loss is other-than-temporary, we project total estimated defaults of the underlying assets (mortgages) and multiply that calculated amount by an estimate of realizable value upon sale of these assets in the marketplace (severity) in order to determine the projected collateral loss. In determining estimated default rate and severity assumptions, we review the performance of the underlying securities, industry studies and market forecasts, as well as our view of the economic outlook affecting collateral. We also evaluate the current credit enhancement underlying the bond to determine the impact on cash flows. If we determine that a given security will be subject to a write-down or loss, we record the expected credit loss as a charge to earnings.
The table below shows the projected weighted-average default rates and loss severities for the 2007, 2006 and late 2005 non-agency RMBS and the securities previously held in the Grantor Trust that we established in connection with the restructuring of our securities portfolio in 2009, at
June 30, 2018
and
Dec. 31, 2017
. See Note 15 for carrying values of these securities.
|
Projected weighted-average default rates and loss severities
|
|||||||||
|
June 30, 2018
|
Dec. 31, 2017
|
||||||||
|
Default rate
|
|
Severity
|
|
Default rate
|
|
Severity
|
|
||
|
Alt-A
|
21
|
%
|
52
|
%
|
22
|
%
|
53
|
%
|
|
|
Subprime
|
36
|
%
|
65
|
%
|
38
|
%
|
66
|
%
|
|
|
Prime
|
12
|
%
|
40
|
%
|
13
|
%
|
39
|
%
|
|
The following table presents pre-tax net securities gains (losses) by type.
|
Net securities gains (losses)
|
|||||||||||||||
|
(in millions)
|
2Q18
|
|
1Q18
|
|
2Q17
|
|
YTD18
|
|
YTD17
|
|
|||||
|
Agency RMBS
|
$
|
—
|
|
$
|
(42
|
)
|
$
|
—
|
|
$
|
(42
|
)
|
$
|
1
|
|
|
U.S. Treasury
|
—
|
|
(4
|
)
|
(1
|
)
|
(4
|
)
|
(1
|
)
|
|||||
|
Non-agency RMBS
|
—
|
|
—
|
|
—
|
|
—
|
|
(1
|
)
|
|||||
|
Other
|
1
|
|
(3
|
)
|
1
|
|
(2
|
)
|
11
|
|
|||||
|
Total net securities gains (losses)
|
$
|
1
|
|
$
|
(49
|
)
|
$
|
—
|
|
$
|
(48
|
)
|
$
|
10
|
|
The following tables reflect securities credit losses recorded in earnings. The beginning balance represents the credit loss component for which OTTI occurred on debt securities in prior periods. The additions represent the first time a debt security was credit impaired or when subsequent credit impairments have occurred. The deductions represent credit losses on securities that have been sold, are required to be sold, or for which it is our intention to sell.
|
Debt securities credit loss roll forward
|
||||||
|
(in millions)
|
2Q18
|
|
2Q17
|
|
||
|
Beginning balance as of March 31
|
$
|
80
|
|
$
|
89
|
|
|
Add: Initial OTTI credit losses
|
—
|
|
—
|
|
||
|
Subsequent OTTI credit losses
|
—
|
|
1
|
|
||
|
Less: Realized losses for securities sold
|
1
|
|
5
|
|
||
|
Ending balance as of June 30
|
$
|
79
|
|
$
|
85
|
|
|
Debt securities credit loss roll forward
|
||||||
|
(in millions)
|
YTD18
|
|
YTD17
|
|
||
|
Beginning balance as of Dec. 31
|
$
|
84
|
|
$
|
88
|
|
|
Add: Initial OTTI credit losses
|
—
|
|
—
|
|
||
|
Subsequent OTTI credit losses
|
—
|
|
2
|
|
||
|
Less: Realized losses for securities sold
|
5
|
|
5
|
|
||
|
Ending balance as of June 30
|
$
|
79
|
|
$
|
85
|
|
Pledged assets
At
June 30, 2018
, BNY Mellon had pledged assets of
$112 billion
, including
$92 billion
pledged as collateral for potential borrowings at the Federal Reserve Discount Window and
$6 billion
pledged as collateral for borrowing at the Federal Home Loan Bank. The components of the assets pledged at
June 30, 2018
included
$95 billion
of securities,
$13 billion
of loans,
$3 billion
of trading assets and
$1 billion
of interest-bearing deposits with banks.
BNY Mellon
59
|
Notes to Consolidated Financial Statements
(continued)
|
If there has been no borrowing at the Federal Reserve Discount Window, the Federal Reserve generally allows banks to freely move assets in and out of their pledged assets account to sell or repledge the assets for other purposes. BNY Mellon regularly moves assets in and out of its pledged assets account at the Federal Reserve.
At
Dec. 31, 2017
, BNY Mellon had pledged assets of
$111 billion
, including
$92 billion
pledged as collateral for potential borrowing at the Federal Reserve Discount Window and
$5 billion
pledged as collateral for borrowing at the Federal Home Loan Bank. The components of the assets pledged at
Dec. 31, 2017
included
$96 billion
of securities,
$13 billion
of loans and
$2 billion
of trading assets.
At
June 30, 2018
and
Dec. 31, 2017
, pledged assets included
$11 billion
and
$10 billion
, respectively, for which the recipients were permitted to sell or repledge the assets delivered.
We also obtain securities as collateral, including receipts under resale agreements, securities borrowed, derivative contracts and custody agreements on terms which permit us to sell or repledge the securities to others. At
June 30, 2018
and
Dec. 31, 2017
, the market value of the securities received that can be sold or repledged was
$94 billion
and
$86 billion
, respectively. We routinely sell or repledge these securities through delivery to third parties. As of
June 30, 2018
and
Dec. 31, 2017
, the market value of securities collateral sold or repledged was
$62 billion
and
$49 billion
, respectively.
Restricted cash and securities
Cash and securities may be segregated under federal and other regulations or requirements. At
June 30, 2018
and
Dec. 31, 2017
, cash segregated under federal and other regulations or requirements was
$2 billion
and
$2 billion
, respectively. Restricted cash is included in interest-bearing deposits with banks on the consolidated balance sheet. Securities segregated for these purposes were
$1 billion
at
June 30, 2018
and
$1 billion
at
Dec. 31, 2017
. Restricted securities were sourced from securities purchased under resale agreements at
June 30, 2018
and
Dec. 31, 2017
and are included in federal funds sold and securities purchased under resale agreements on the consolidated balance sheet.
Note 5–Loans and asset quality
Loans
The table below provides the details of our loan portfolio and industry concentrations of credit risk at
June 30, 2018
and
Dec. 31, 2017
.
|
Loans
|
June 30, 2018
|
|
Dec. 31, 2017
|
|
||
|
(in millions)
|
||||||
|
Domestic:
|
||||||
|
Commercial
|
$
|
2,117
|
|
$
|
2,744
|
|
|
Commercial real estate
|
4,974
|
|
4,900
|
|
||
|
Financial institutions
|
5,526
|
|
5,568
|
|
||
|
Lease financings
|
758
|
|
772
|
|
||
|
Wealth management loans and mortgages
|
16,191
|
|
16,420
|
|
||
|
Other residential mortgages
|
653
|
|
708
|
|
||
|
Overdrafts
|
1,090
|
|
963
|
|
||
|
Other
|
1,169
|
|
1,131
|
|
||
|
Margin loans
|
14,914
|
|
15,689
|
|
||
|
Total domestic
|
47,392
|
|
48,895
|
|
||
|
Foreign:
|
||||||
|
Commercial
|
336
|
|
167
|
|
||
|
Commercial real estate
|
5
|
|
—
|
|
||
|
Financial institutions
|
6,304
|
|
7,483
|
|
||
|
Lease financings
|
539
|
|
527
|
|
||
|
Wealth management loans and mortgages
|
110
|
|
108
|
|
||
|
Other (primarily overdrafts)
|
2,947
|
|
4,264
|
|
||
|
Margin loans
|
143
|
|
96
|
|
||
|
Total foreign
|
10,384
|
|
12,645
|
|
||
|
Total loans
(a)
|
$
|
57,776
|
|
$
|
61,540
|
|
|
(a)
|
Net of unearned income of
$375 million
at
June 30, 2018
and
$394 million
at
Dec. 31, 2017
primarily related to domestic and foreign lease financings.
|
Our loan portfolio consists of
three
portfolio segments: commercial, lease financings and mortgages. We manage our portfolio at the class level, which consists of
six
classes of financing receivables: commercial, commercial real estate, financial institutions, lease financings, wealth management loans and mortgages, and other residential mortgages.
The following tables are presented for each class of financing receivable and provide additional information about our credit risks and the adequacy of our allowance for credit losses.
60
BNY Mellon
|
Notes to Consolidated Financial Statements
(continued)
|
Allowance for credit losses
Transactions in the allowance for credit losses are summarized as follows.
|
Allowance for credit losses activity for the quarter ended June 30, 2018
|
Wealth management loans and mortgages
|
|
Other
residential
mortgages
|
|
||||||||||||||||||||||||
|
(in millions)
|
Commercial
|
|
Commercial
real estate
|
|
Financial
institutions
|
|
Lease
financings
|
|
All
other
|
|
Foreign
|
|
Total
|
|
||||||||||||||
|
Beginning balance
|
$
|
75
|
|
$
|
75
|
|
$
|
22
|
|
$
|
7
|
|
$
|
23
|
|
$
|
19
|
|
$
|
—
|
|
$
|
35
|
|
$
|
256
|
|
|
|
Charge-offs
|
—
|
|
—
|
|
—
|
|
—
|
|
—
|
|
—
|
|
—
|
|
—
|
|
—
|
|
||||||||||
|
Recoveries
|
—
|
|
—
|
|
—
|
|
—
|
|
—
|
|
1
|
|
—
|
|
—
|
|
1
|
|
||||||||||
|
Net recoveries
|
—
|
|
—
|
|
—
|
|
—
|
|
—
|
|
1
|
|
—
|
|
—
|
|
1
|
|
||||||||||
|
Provision
|
1
|
|
(1
|
)
|
2
|
|
(1
|
)
|
—
|
|
(2
|
)
|
—
|
|
(2
|
)
|
(3
|
)
|
||||||||||
|
Ending balance
|
$
|
76
|
|
$
|
74
|
|
$
|
24
|
|
$
|
6
|
|
$
|
23
|
|
$
|
18
|
|
$
|
—
|
|
$
|
33
|
|
$
|
254
|
|
|
|
Allowance for:
|
||||||||||||||||||||||||||||
|
Loan losses
|
$
|
17
|
|
$
|
55
|
|
$
|
8
|
|
$
|
6
|
|
$
|
19
|
|
$
|
18
|
|
$
|
—
|
|
$
|
22
|
|
$
|
145
|
|
|
|
Lending-related commitments
|
59
|
|
19
|
|
16
|
|
—
|
|
4
|
|
—
|
|
—
|
|
11
|
|
109
|
|
||||||||||
|
Individually evaluated for impairment:
|
||||||||||||||||||||||||||||
|
Loan balance
|
$
|
—
|
|
$
|
—
|
|
$
|
—
|
|
$
|
—
|
|
$
|
5
|
|
$
|
—
|
|
$
|
—
|
|
$
|
—
|
|
$
|
5
|
|
|
|
Allowance for loan losses
|
—
|
|
—
|
|
—
|
|
—
|
|
—
|
|
—
|
|
—
|
|
—
|
|
—
|
|
||||||||||
|
Collectively evaluated for impairment:
|
||||||||||||||||||||||||||||
|
Loan balance
|
$
|
2,117
|
|
$
|
4,974
|
|
$
|
5,526
|
|
$
|
758
|
|
$
|
16,186
|
|
$
|
653
|
|
$
|
17,173
|
|
(a)
|
$
|
10,384
|
|
$
|
57,771
|
|
|
Allowance for loan losses
|
17
|
|
55
|
|
8
|
|
6
|
|
19
|
|
18
|
|
—
|
|
22
|
|
145
|
|
||||||||||
|
(a)
|
Includes
$1,090 million
of domestic overdrafts,
$14,914 million
of margin loans and
$1,169 million
of other loans at
June 30, 2018
.
|
|
Allowance for credit losses activity for the quarter ended March 31, 2018
|
Wealth management loans and mortgages
|
|
Other
residential
mortgages
|
|
||||||||||||||||||||||||
|
(in millions)
|
Commercial
|
|
Commercial
real estate
|
|
Financial
institutions
|
|
Lease
financings
|
|
All
other
|
|
Foreign
|
|
Total
|
|
||||||||||||||
|
Beginning balance
|
$
|
77
|
|
$
|
76
|
|
$
|
23
|
|
$
|
8
|
|
$
|
22
|
|
$
|
20
|
|
$
|
—
|
|
$
|
35
|
|
$
|
261
|
|
|
|
Charge-offs
|
—
|
|
—
|
|
—
|
|
—
|
|
—
|
|
—
|
|
—
|
|
—
|
|
—
|
|
||||||||||
|
Recoveries
|
—
|
|
—
|
|
—
|
|
—
|
|
—
|
|
—
|
|
—
|
|
—
|
|
—
|
|
||||||||||
|
Net recoveries
|
—
|
|
—
|
|
—
|
|
—
|
|
—
|
|
—
|
|
—
|
|
—
|
|
—
|
|
||||||||||
|
Provision
|
(2
|
)
|
(1
|
)
|
(1
|
)
|
(1
|
)
|
1
|
|
(1
|
)
|
—
|
|
—
|
|
(5
|
)
|
||||||||||
|
Ending balance
|
$
|
75
|
|
$
|
75
|
|
$
|
22
|
|
$
|
7
|
|
$
|
23
|
|
$
|
19
|
|
$
|
—
|
|
$
|
35
|
|
$
|
256
|
|
|
|
Allowance for:
|
||||||||||||||||||||||||||||
|
Loan losses
|
$
|
23
|
|
$
|
58
|
|
$
|
8
|
|
$
|
7
|
|
$
|
19
|
|
$
|
19
|
|
$
|
—
|
|
$
|
22
|
|
$
|
156
|
|
|
|
Lending-related commitments
|
52
|
|
17
|
|
14
|
|
—
|
|
4
|
|
—
|
|
—
|
|
13
|
|
100
|
|
||||||||||
|
Individually evaluated for impairment:
|
||||||||||||||||||||||||||||
|
Loan balance
|
$
|
—
|
|
$
|
—
|
|
$
|
1
|
|
$
|
—
|
|
$
|
4
|
|
$
|
—
|
|
$
|
—
|
|
$
|
—
|
|
$
|
5
|
|
|
|
Allowance for loan losses
|
—
|
|
—
|
|
—
|
|
—
|
|
1
|
|
—
|
|
—
|
|
—
|
|
1
|
|
||||||||||
|
Collectively evaluated for impairment:
|
||||||||||||||||||||||||||||
|
Loan balance
|
$
|
2,284
|
|
$
|
4,888
|
|
$
|
5,781
|
|
$
|
749
|
|
$
|
16,284
|
|
$
|
680
|
|
$
|
16,867
|
|
(a)
|
$
|
13,271
|
|
$
|
60,804
|
|
|
Allowance for loan losses
|
23
|
|
58
|
|
8
|
|
7
|
|
18
|
|
19
|
|
—
|
|
22
|
|
155
|
|
||||||||||
|
(a)
|
Includes
$785 million
of domestic overdrafts,
$14,993 million
of margin loans and
$1,089 million
of other loans at
March 31, 2018
.
|
BNY Mellon
61
|
Notes to Consolidated Financial Statements
(continued)
|
|
Allowance for credit losses activity for the quarter ended June 30, 2017
|
Wealth management loans and mortgages
|
|
Other
residential
mortgages
|
|
All
other
|
|
Foreign
|
|
Total
|
|
||||||||||||||||||
|
(in millions)
|
Commercial
|
|
Commercial
real estate
|
|
Financial
institutions
|
|
Lease
financings
|
|
||||||||||||||||||||
|
Beginning balance
|
$
|
82
|
|
$
|
73
|
|
$
|
23
|
|
$
|
10
|
|
$
|
26
|
|
$
|
25
|
|
$
|
—
|
|
$
|
37
|
|
$
|
276
|
|
|
|
Charge-offs
|
—
|
|
—
|
|
—
|
|
—
|
|
—
|
|
—
|
|
—
|
|
—
|
|
—
|
|
||||||||||
|
Recoveries
|
—
|
|
—
|
|
—
|
|
—
|
|
—
|
|
1
|
|
—
|
|
—
|
|
1
|
|
||||||||||
|
Net recoveries
|
—
|
|
—
|
|
—
|
|
—
|
|
—
|
|
1
|
|
—
|
|
—
|
|
1
|
|
||||||||||
|
Provision
|
(2
|
)
|
2
|
|
—
|
|
—
|
|
(1
|
)
|
(3
|
)
|
—
|
|
(3
|
)
|
(7
|
)
|
||||||||||
|
Ending balance
|
$
|
80
|
|
$
|
75
|
|
$
|
23
|
|
$
|
10
|
|
$
|
25
|
|
$
|
23
|
|
$
|
—
|
|
$
|
34
|
|
$
|
270
|
|
|
|
Allowance for:
|
||||||||||||||||||||||||||||
|
Loan losses
|
$
|
26
|
|
$
|
55
|
|
$
|
7
|
|
$
|
10
|
|
$
|
21
|
|
$
|
23
|
|
$
|
—
|
|
$
|
23
|
|
$
|
165
|
|
|
|
Lending-related commitments
|
54
|
|
20
|
|
16
|
|
—
|
|
4
|
|
—
|
|
—
|
|
11
|
|
105
|
|
||||||||||
|
Individually evaluated for impairment:
|
||||||||||||||||||||||||||||
|
Loan balance
|
$
|
—
|
|
$
|
—
|
|
$
|
2
|
|
$
|
—
|
|
$
|
7
|
|
$
|
—
|
|
$
|
—
|
|
$
|
—
|
|
$
|
9
|
|
|
|
Allowance for loan losses
|
—
|
|
—
|
|
2
|
|
—
|
|
3
|
|
—
|
|
—
|
|
—
|
|
5
|
|
||||||||||
|
Collectively evaluated for impairment:
|
||||||||||||||||||||||||||||
|
Loan balance
|
$
|
2,580
|
|
$
|
5,017
|
|
$
|
5,952
|
|
$
|
847
|
|
$
|
16,024
|
|
$
|
780
|
|
$
|
15,950
|
|
(a)
|
$
|
14,514
|
|
$
|
61,664
|
|
|
Allowance for loan losses
|
26
|
|
55
|
|
5
|
|
10
|
|
18
|
|
23
|
|
—
|
|
23
|
|
160
|
|
||||||||||
|
(a)
|
Includes
$855 million
of domestic overdrafts,
$13,973 million
of margin loans and
$1,122 million
of other loans at
June 30, 2017
.
|
|
Allowance for credit losses activity for the six months ended June 30, 2018
|
Wealth management loans and mortgages
|
|
Other
residential mortgages |
|
All
other |
|
Foreign
|
|
Total
|
|
|||||||||||||||||
|
(in millions)
|
Commercial
|
|
Commercial
real estate |
|
Financial
institutions |
|
Lease
financings |
|
|||||||||||||||||||
|
Beginning balance
|
$
|
77
|
|
$
|
76
|
|
$
|
23
|
|
$
|
8
|
|
$
|
22
|
|
$
|
20
|
|
$
|
—
|
|
$
|
35
|
|
$
|
261
|
|
|
Charge-offs
|
—
|
|
—
|
|
—
|
|
—
|
|
—
|
|
—
|
|
—
|
|
—
|
|
—
|
|
|||||||||
|
Recoveries
|
—
|
|
—
|
|
—
|
|
—
|
|
—
|
|
1
|
|
—
|
|
—
|
|
1
|
|
|||||||||
|
Net recoveries
|
—
|
|
—
|
|
—
|
|
—
|
|
—
|
|
1
|
|
—
|
|
—
|
|
1
|
|
|||||||||
|
Provision
|
(1
|
)
|
(2
|
)
|
1
|
|
(2
|
)
|
1
|
|
(3
|
)
|
—
|
|
(2
|
)
|
(8
|
)
|
|||||||||
|
Ending balance
|
$
|
76
|
|
$
|
74
|
|
$
|
24
|
|
$
|
6
|
|
$
|
23
|
|
$
|
18
|
|
$
|
—
|
|
$
|
33
|
|
$
|
254
|
|
|
Allowance for credit losses activity for the six months ended June 30, 2017
|
Wealth management loans and mortgages
|
|
Other
residential mortgages |
|
All
other |
|
Foreign
|
|
Total
|
|
|||||||||||||||||
|
(in millions)
|
Commercial
|
|
Commercial
real estate |
|
Financial
institutions |
|
Lease
financings |
|
|||||||||||||||||||
|
Beginning balance
|
$
|
82
|
|
$
|
73
|
|
$
|
26
|
|
$
|
13
|
|
$
|
23
|
|
$
|
28
|
|
$
|
—
|
|
$
|
36
|
|
$
|
281
|
|
|
Charge-offs
|
—
|
|
—
|
|
—
|
|
—
|
|
—
|
|
(1
|
)
|
—
|
|
—
|
|
(1
|
)
|
|||||||||
|
Recoveries
|
—
|
|
—
|
|
—
|
|
—
|
|
—
|
|
2
|
|
—
|
|
—
|
|
2
|
|
|||||||||
|
Net recoveries
|
—
|
|
—
|
|
—
|
|
—
|
|
—
|
|
1
|
|
—
|
|
—
|
|
1
|
|
|||||||||
|
Provision
|
(2
|
)
|
2
|
|
(3
|
)
|
(3
|
)
|
2
|
|
(6
|
)
|
—
|
|
(2
|
)
|
(12
|
)
|
|||||||||
|
Ending balance
|
$
|
80
|
|
$
|
75
|
|
$
|
23
|
|
$
|
10
|
|
$
|
25
|
|
$
|
23
|
|
$
|
—
|
|
$
|
34
|
|
$
|
270
|
|
62
BNY Mellon
|
Notes to Consolidated Financial Statements
(continued)
|
Nonperforming assets
The table below presents our nonperforming assets.
|
Nonperforming assets
(in millions)
|
June 30, 2018
|
|
Dec. 31, 2017
|
|
|||
|
Nonperforming loans:
|
|||||||
|
Other residential mortgages
|
$
|
71
|
|
$
|
78
|
|
|
|
Wealth management loans and mortgages
|
8
|
|
7
|
|
|||
|
Commercial real estate
|
—
|
|
1
|
|
|||
|
Total nonperforming loans
|
79
|
|
86
|
|
|||
|
Other assets owned
|
3
|
|
4
|
|
|||
|
Total nonperforming assets
|
$
|
82
|
|
$
|
90
|
|
|
Lost interest
Interest income would have increased by
$1 million
in the second quarter of 2018, first quarter of 2018 and second quarter of 2017,
$2 million
in the first six months of 2018 and
$3 million
in the first six months of 2017 if nonperforming loans at period-end had been performing for the entire respective quarter.
Impaired loans
We use the discounted cash flow method as the primary method for valuing impaired loans. The average recorded investment and unpaid principal balance of impaired loans were less than
$13 million
for the second quarter of 2018, first quarter of 2018 and the second quarter of 2017. The allowance related to impaired loans was less than
$1 million
at June 30, 2018 and
$1 million
at Dec. 31, 2017.
Past due loans
The table below presents our past due loans.
|
Past due loans and still accruing interest
|
June 30, 2018
|
Dec. 31, 2017
|
|||||||||||||||||||||||
|
|
Days past due
|
Total
past due
|
|
Days past due
|
Total
past due
|
|
|||||||||||||||||||
|
(in millions)
|
30-59
|
|
60-89
|
|
≥90
|
|
30-59
|
|
60-89
|
|
≥90
|
|
|||||||||||||
|
Commercial real estate
|
$
|
104
|
|
$
|
25
|
|
$
|
—
|
|
$
|
129
|
|
$
|
44
|
|
$
|
—
|
|
$
|
—
|
|
$
|
44
|
|
|
|
Wealth management loans and mortgages
|
17
|
|
1
|
|
—
|
|
18
|
|
39
|
|
5
|
|
—
|
|
44
|
|
|||||||||
|
Other residential mortgages
|
23
|
|
2
|
|
6
|
|
31
|
|
18
|
|
5
|
|
5
|
|
28
|
|
|||||||||
|
Financial institutions
|
24
|
|
—
|
|
—
|
|
24
|
|
1
|
|
—
|
|
—
|
|
1
|
|
|||||||||
|
Total past due loans
|
$
|
168
|
|
$
|
28
|
|
$
|
6
|
|
$
|
202
|
|
$
|
102
|
|
$
|
10
|
|
$
|
5
|
|
$
|
117
|
|
|
Troubled debt restructurings (“TDRs”)
A modified loan is considered a TDR if the debtor is experiencing financial difficulties and the creditor grants a concession to the debtor that would not otherwise be considered. We modified loans of
$1 million
in the second quarter of 2018,
$1 million
in the first quarter of 2018 and
$4 million
in the second quarter of 2017, primarily other residential mortgages.
Credit quality indicators
Our credit strategy is to focus on investment-grade clients that are active users of our non-credit services. Each customer is assigned an internal credit rating, which is mapped to an external rating agency grade equivalent, if possible, based upon a number of dimensions, which are continually evaluated and may change over time.
BNY Mellon
63
|
Notes to Consolidated Financial Statements
(continued)
|
The following tables present information about credit quality indicators.
Commercial loan portfolio
|
Commercial loan portfolio – Credit risk profile
by creditworthiness category
|
Commercial
|
Commercial real estate
|
Financial institutions
|
|||||||||||||||||
|
June 30,
2018 |
|
Dec. 31, 2017
|
|
June 30,
2018 |
|
Dec. 31, 2017
|
|
June 30,
2018 |
|
Dec. 31, 2017
|
|
|||||||||
|
(in millions)
|
||||||||||||||||||||
|
Investment grade
|
$
|
2,342
|
|
$
|
2,685
|
|
$
|
4,266
|
|
$
|
4,277
|
|
$
|
9,262
|
|
$
|
10,021
|
|
||
|
Non-investment grade
|
111
|
|
226
|
|
713
|
|
623
|
|
2,568
|
|
3,030
|
|
||||||||
|
Total
|
$
|
2,453
|
|
$
|
2,911
|
|
$
|
4,979
|
|
$
|
4,900
|
|
$
|
11,830
|
|
$
|
13,051
|
|
||
The commercial loan portfolio is divided into investment grade and non-investment grade categories based on rating criteria largely consistent with those of the public rating agencies. Each customer in the portfolio is assigned an internal credit rating. These internal credit ratings are generally consistent with the ratings categories of the public rating agencies. Customers with ratings consistent with BBB- (S&P)/Baa3 (Moody’s) or better are considered to be investment grade. Those clients with ratings lower than this threshold are considered to be non-investment grade.
Wealth management loans and mortgages
|
Wealth management loans and mortgages – Credit risk
profile by internally assigned grade
|
||||||
|
(in millions)
|
June 30,
2018 |
|
Dec. 31, 2017
|
|
||
|
Wealth management loans:
|
||||||
|
Investment grade
|
$
|
6,791
|
|
$
|
7,042
|
|
|
Non-investment grade
|
145
|
|
185
|
|
||
|
Wealth management mortgages
|
9,365
|
|
9,301
|
|
||
|
Total
|
$
|
16,301
|
|
$
|
16,528
|
|
Wealth management non-mortgage loans are not typically rated by external rating agencies. A majority of the wealth management loans are secured by the customers’ investment management accounts or custody accounts. Eligible assets pledged for these loans are typically investment grade fixed-income securities, equities and/or mutual funds. Internal ratings for this portion of the wealth management portfolio, therefore, would equate to investment-grade external ratings. Wealth management loans are provided to select customers based on the pledge of other types of assets, including business assets, fixed assets or a modest amount of commercial real estate. For the loans collateralized by other assets, the credit
quality of the obligor is carefully analyzed, but we do not consider this portfolio of loans to be investment grade.
Credit quality indicators for wealth management mortgages are not correlated to external ratings. Wealth management mortgages are typically loans to high-net-worth individuals, which are secured primarily by residential property. These loans are primarily interest-only, adjustable rate mortgages with a weighted-average loan-to-value ratio of
62%
at origination. In the wealth management portfolio, less than
1%
of the mortgages were past due at
June 30, 2018
.
At
June 30, 2018
, the wealth management mortgage portfolio consisted of the following geographic concentrations: California -
24%
; New York -
18%
; Massachusetts -
11%
; Florida -
8%
; and other -
39%
.
Other residential mortgages
The other residential mortgage portfolio primarily consists of 1-4 family residential mortgage loans and totaled $
653 million
at
June 30, 2018
and
$708 million
at
Dec. 31, 2017
. These loans are not typically correlated to external ratings. Included in this portfolio at
June 30, 2018
are
$151 million
of mortgage loans purchased in 2005, 2006 and the first quarter of 2007 that are predominantly prime mortgage loans, with a small portion of Alt-A loans. As of
June 30, 2018
, the purchased loans in this portfolio had a weighted-average loan-to-value ratio of
76%
at origination, and
12%
of the serviced loan balance was at least 60 days delinquent. The properties securing the prime and Alt-A mortgage loans were located (in order of concentration) in California, Florida, Virginia, the tri-state area (New York, New Jersey and Connecticut) and Maryland.
64
BNY Mellon
|
Notes to Consolidated Financial Statements
(continued)
|
Overdrafts
Overdrafts primarily relate to custody and securities clearance clients and totaled
$4.0 billion
at
June 30, 2018
and
$5.1 billion
at
Dec. 31, 2017
. Overdrafts occur on a daily basis primarily in the custody and securities clearance business and are generally repaid within
two
business days.
Other loans
Other loans primarily include loans to consumers that are fully collateralized with equities, mutual funds and fixed-income securities.
Margin loans
We had
$15.1 billion
of secured margin loans on our balance sheet at
June 30, 2018
compared with
$15.8
billion
at
Dec. 31, 2017
. Margin loans are collateralized with marketable securities, and borrowers are required to maintain a daily collateral margin in excess of
100%
of the value of the loan. We have rarely suffered a loss on these types of loans and do not allocate any of our allowance for credit losses to margin loans.
Reverse repurchase agreements
Reverse repurchase agreements are transactions fully collateralized with high-quality liquid securities. These transactions carry minimal credit risk and therefore are not allocated an allowance for credit losses.
Note 6–Goodwill and intangible assets
Goodwill
The tables below provide a breakdown of goodwill by business.
|
Goodwill by business
|
Investment
Services
|
|
Investment
Management
|
|
Other
|
|
Consolidated
|
|
||||
|
(in millions)
|
||||||||||||
|
Balance at Dec. 31, 2017
|
$
|
8,389
|
|
$
|
9,128
|
|
$
|
47
|
|
$
|
17,564
|
|
|
Dispositions
|
—
|
|
(65
|
)
|
—
|
|
(65
|
)
|
||||
|
Foreign currency translation
|
(31
|
)
|
(50
|
)
|
—
|
|
(81
|
)
|
||||
|
Balance at June 30, 2018
|
$
|
8,358
|
|
$
|
9,013
|
|
$
|
47
|
|
$
|
17,418
|
|
|
Goodwill by business
|
Investment
Services
|
|
Investment
Management
|
|
Other
|
|
Consolidated
|
|
||||
|
(in millions)
|
||||||||||||
|
Balance at Dec. 31, 2016
|
$
|
8,269
|
|
$
|
9,000
|
|
$
|
47
|
|
$
|
17,316
|
|
|
Foreign currency translation
|
72
|
|
69
|
|
—
|
|
141
|
|
||||
|
Balance at June 30, 2017
|
$
|
8,341
|
|
$
|
9,069
|
|
$
|
47
|
|
$
|
17,457
|
|
Intangible assets
The tables below provide a breakdown of intangible assets by business.
|
Intangible assets – net carrying amount by business
|
Investment
Services
|
|
Investment
Management
|
|
Other
|
|
Consolidated
|
|
||||
|
(in millions)
|
||||||||||||
|
Balance at Dec. 31, 2017
|
$
|
888
|
|
$
|
1,674
|
|
$
|
849
|
|
$
|
3,411
|
|
|
Amortization
|
(72
|
)
|
(25
|
)
|
—
|
|
(97
|
)
|
||||
|
Foreign currency translation
|
(1
|
)
|
(5
|
)
|
—
|
|
(6
|
)
|
||||
|
Balance at June 30, 2018
|
$
|
815
|
|
$
|
1,644
|
|
$
|
849
|
|
$
|
3,308
|
|
BNY Mellon
65
|
Notes to Consolidated Financial Statements
(continued)
|
|
Intangible assets – net carrying amount by business
|
Investment
Services
|
|
Investment
Management
|
|
Other
|
|
Consolidated
|
|
||||
|
(in millions)
|
||||||||||||
|
Balance at Dec. 31, 2016
|
$
|
1,032
|
|
$
|
1,717
|
|
$
|
849
|
|
$
|
3,598
|
|
|
Amortization
|
(75
|
)
|
(30
|
)
|
—
|
|
(105
|
)
|
||||
|
Foreign currency translation
|
3
|
|
10
|
|
—
|
|
13
|
|
||||
|
Balance at June 30, 2017
|
$
|
960
|
|
$
|
1,697
|
|
$
|
849
|
|
$
|
3,506
|
|
The table below provides a breakdown of intangible assets by type.
|
Intangible assets
|
June 30, 2018
|
Dec. 31, 2017
|
||||||||||||||||||
|
(in millions)
|
Gross
carrying
amount
|
|
Accumulated
amortization
|
|
Net
carrying
amount
|
|
Remaining
weighted-
average
amortization
period
|
Gross
carrying amount |
|
Accumulated
amortization |
|
Net
carrying
amount
|
|
|||||||
|
Subject to amortization:
(a)
|
||||||||||||||||||||
|
Customer contracts—Investment Services
|
$
|
2,255
|
|
$
|
(1,811
|
)
|
$
|
444
|
|
10 years
|
$
|
2,260
|
|
$
|
(1,744
|
)
|
$
|
516
|
|
|
|
Customer relationships—Investment Management
|
1,253
|
|
(1,030
|
)
|
223
|
|
11 years
|
1,262
|
|
(1,015
|
)
|
247
|
|
|||||||
|
Other
|
29
|
|
(13
|
)
|
16
|
|
4 years
|
42
|
|
(23
|
)
|
19
|
|
|||||||
|
Total subject to amortization
|
3,537
|
|
(2,854
|
)
|
683
|
|
10 years
|
3,564
|
|
(2,782
|
)
|
782
|
|
|||||||
|
Not subject to amortization:
(b)
|
||||||||||||||||||||
|
Tradenames
|
1,333
|
|
N/A
|
|
1,333
|
|
N/A
|
1,334
|
|
N/A
|
|
1,334
|
|
|||||||
|
Customer relationships
|
1,292
|
|
N/A
|
|
1,292
|
|
N/A
|
1,295
|
|
N/A
|
|
1,295
|
|
|||||||
|
Total not subject to amortization
|
2,625
|
|
N/A
|
|
2,625
|
|
N/A
|
2,629
|
|
N/A
|
|
2,629
|
|
|||||||
|
Total intangible assets
|
$
|
6,162
|
|
$
|
(2,854
|
)
|
$
|
3,308
|
|
N/A
|
$
|
6,193
|
|
$
|
(2,782
|
)
|
$
|
3,411
|
|
|
|
(a)
|
Excludes fully amortized intangible assets.
|
|
(b)
|
Intangible assets not subject to amortization have an indefinite life.
|
N/A - Not applicable.
Estimated annual amortization expense for current intangibles for the next five years is as follows:
|
For the year ended
Dec. 31, |
Estimated amortization expense
(in millions)
|
|||
|
2018
|
$
|
180
|
|
|
|
2019
|
116
|
|
||
|
2020
|
102
|
|
||
|
2021
|
79
|
|
||
|
2022
|
60
|
|
||
Impairment testing
The goodwill impairment test is performed at least annually at the reporting unit level. Intangible assets not subject to amortization are tested for impairment annually or more often if events or circumstances indicate they may be impaired.
BNY Mellon’s
three
business segments include
seven
reporting units for which goodwill impairment testing is performed on an annual basis. The Investment Services segment is comprised of
four
reporting units; the Investment Management segment is comprised of
two
reporting units and
one
reporting unit is included in the Other segment. As a result of the annual goodwill impairment test of the
seven
reporting units conducted in the second quarter of 2018,
no
goodwill impairment was recognized.
66
BNY Mellon
|
Notes to Consolidated Financial Statements
(continued)
|
Note 7–Other assets
The following table provides the components of other assets presented on the consolidated balance sheet.
|
Other assets
|
June 30, 2018
|
|
Dec. 31, 2017
|
|
||
|
(in millions)
|
||||||
|
Corporate/bank-owned life insurance
|
$
|
4,876
|
|
$
|
4,857
|
|
|
Accounts receivable
|
3,675
|
|
4,590
|
|
||
|
Fails to deliver
|
3,073
|
|
2,817
|
|
||
|
Software
|
1,550
|
|
1,499
|
|
||
|
Prepaid pension assets
|
1,511
|
|
1,416
|
|
||
|
Renewable energy investments
|
1,324
|
|
1,368
|
|
||
|
Income taxes receivable
|
1,225
|
|
1,533
|
|
||
|
Equity in a joint venture and other investments
|
1,112
|
|
1,083
|
|
||
|
Qualified affordable housing project investments
|
1,054
|
|
1,014
|
|
||
|
Prepaid expense
|
502
|
|
395
|
|
||
|
Federal Reserve Bank stock
|
482
|
|
477
|
|
||
|
Fair value of hedging derivatives
|
313
|
|
323
|
|
||
|
Seed capital
|
302
|
|
288
|
|
||
|
Other
(a)
|
1,508
|
|
1,369
|
|
||
|
Total other assets
|
$
|
22,507
|
|
$
|
23,029
|
|
|
(a)
|
At
June 30, 2018
and
Dec. 31, 2017
, other assets include
$93 million
and
$82 million
, respectively, of Federal Home Loan Bank stock, at cost.
|
Qualified affordable housing project investments
We invest in affordable housing projects primarily to satisfy the Company’s requirements under the Community Reinvestment Act. Our total investment in qualified affordable housing projects totaled
$1.1 billion
at
June 30, 2018
and
$1.0 billion
at
Dec. 31, 2017
. Commitments to fund future investments in qualified affordable housing projects totaled
$498 million
at
June 30, 2018
and
$486 million
at
Dec. 31, 2017
and is recorded in other liabilities. A summary of the commitments to fund future investments is as
follows: 2018
–
$113 million
; 2019
–
$120 million
; 2020
–
$119 million
; 2021
–
$99 million
; 2022
–
$29 million
; and 2023 and thereafter
–
$18 million
.
Tax credits and other tax benefits recognized were
$42 million
in the
second quarter of 2018
,
$40 million
in the
first quarter of 2018
,
$38 million
in the
second quarter of 2017
,
$82 million
in the
first six months of 2018
and
$76 million
in the
first six months of 2017
.
Amortization expense included in the provision for income taxes was
$35 million
in the
second quarter of 2018
,
$33 million
in the
first quarter of 2018
,
$28 million
in the
second quarter of 2017
,
$68 million
in the
first six months of 2018
and
$55 million
in the
first six months of 2017
.
Investments valued using net asset value per share
In our Investment Management business, we manage investment assets, including equities, fixed income, money market and multi-asset and alternative investment funds for institutions and other investors. As part of that activity, we make seed capital investments in certain funds. We also hold private equity investments, specifically in small business investment companies (“SBICs”), which are compliant with the Volcker Rule, and certain other corporate investments. Seed capital, private equity and other corporate investments are included in other assets on the consolidated balance sheet. The fair value of these investments was estimated using the net asset value (“NAV”) per share for BNY Mellon’s ownership interest in the funds.
The table below presents information on our investments valued using NAV.
|
Other assets valued using NAV
|
|||||||||||||||||||
|
June 30, 2018
|
Dec. 31, 2017
|
||||||||||||||||||
|
(dollars
in millions)
|
Fair
value
|
|
Unfunded
commitments
|
Redemption
frequency
|
Redemption
notice period
|
Fair
value
|
|
Unfunded
commitments
|
Redemption
frequency
|
Redemption
notice period
|
|||||||||
|
Seed capital
|
$
|
44
|
|
$
|
—
|
|
Daily-quarterly
|
1-90 days
|
$
|
40
|
|
$
|
1
|
|
Daily-quarterly
|
1-90 days
|
|||
|
Private equity investments (SBICs)
(a)
|
68
|
|
46
|
|
N/A
|
N/A
|
55
|
|
42
|
|
N/A
|
N/A
|
|||||||
|
Other (
b)
|
73
|
|
—
|
|
Daily-quarterly
|
1-95 days
|
59
|
|
—
|
|
Daily-quarterly
|
1-95 days
|
|||||||
|
Total
|
$
|
185
|
|
$
|
46
|
|
|
|
$
|
154
|
|
$
|
43
|
|
|||||
|
(a)
|
Private equity investments primarily include Volcker Rule-compliant investments in SBICs that invest in various sectors of the economy. Private equity investments do not have redemption rights. Distributions from such investments will be received as the underlying investments in the private equity investments, which have a life of 10 years, are liquidated.
|
|
(b)
|
Primarily relates to investments in funds that relate to deferred compensation arrangements with employees.
|
N/A - Not applicable.
BNY Mellon
67
|
Notes to Consolidated Financial Statements
(continued)
|
Note 8–Contract revenue
Significant accounting policy
Revenue is based on terms specified in a contract with a customer, and excludes any amounts collected on behalf of third parties. Revenue is recognized when, or as, a performance obligation is satisfied by transferring control of a good or service to a customer. A performance obligation may be satisfied over time or at a point in time. Revenue from a performance obligation satisfied over time is recognized by measuring our progress in satisfying the performance obligation in a manner that reflects the transfer of goods and services to the customer. Revenue from a performance obligation satisfied at a point in time is recognized at the point in time the customer obtains control of the promised good or service. The amount of revenue recognized reflects the consideration we expect to be entitled to in exchange for the promised goods and services. Taxes assessed by a governmental authority, that are both imposed on, and concurrent with, a specific revenue-producing transaction, are collected from a customer and are excluded from revenue.
Nature of services and revenue recognition
Fee revenue in Investment Services and Investment Management is primarily variable, based on levels of AUC/A, AUM and the level of client-driven transactions, as specified in fee schedules.
Investment Services fees are based primarily on the market value of AUC/A; client accounts, balances and the volume of transactions; securities lending volume and spreads; and fees for other services. Certain fees based on the market value of assets are calculated in arrears on a monthly or quarterly basis.
Substantially all services within the Investment Services business are provided over time. Revenue on these services is recognized using the time elapsed method, equal to the expected invoice amount, which typically represents the value provided to the customer for our performance completed to date.
Trade execution and clearing services are delivered at a point-in-time, based on customer actions. Revenue for trade execution and clearing services is recognized on trade date, which is consistent with the time that the service was provided. Customers are generally billed for services on a monthly or quarterly basis.
Investment management fees are dependent on the overall level and mix of AUM. The management fees, expressed in basis points, are charged for managing those assets. Management fees are typically subject to fee schedules based on the overall level of assets managed and products in which those assets are invested.
Investment management fee revenue also includes transactional- and account-based fees. These fees along with distribution and servicing fees are recognized when the services have been complete. Clients are generally billed for services performed on a monthly or quarterly basis.
Performance fees are generally calculated as a percentage of the applicable portfolio’s performance in excess of a benchmark index or a peer group’s performance. Performance fees are recognized at the end of the measurement period when they are determinable.
See Note 19 for additional information on our two principal businesses, Investment Services and Investment Management and the primary services provided.
Disaggregation of contract revenue
Contract revenue is included in fee revenue on the consolidated income statement. The following table presents fee revenue related to contracts with customers, disaggregated by type, for each business segment.
68
BNY Mellon
|
Notes to Consolidated Financial Statements
(continued)
|
|
Disaggregation of contract revenue by business segment
(a)
|
|||||||||||||||||||||||||
|
Quarter ended June 30, 2018
|
Quarter ended March 31, 2018
|
||||||||||||||||||||||||
|
(in millions)
|
Investment Services
|
|
Investment Management
|
|
Other
|
|
Total
|
|
Investment Services
|
|
Investment Management
|
|
Other
|
|
Total
|
|
|||||||||
|
Fee revenue - contract revenue:
|
|||||||||||||||||||||||||
|
Investment services fees:
|
|||||||||||||||||||||||||
|
Asset servicing
|
$
|
1,098
|
|
$
|
21
|
|
$
|
1
|
|
$
|
1,120
|
|
$
|
1,117
|
|
$
|
25
|
|
$
|
—
|
|
$
|
1,142
|
|
|
|
Clearing services
|
392
|
|
—
|
|
—
|
|
392
|
|
413
|
|
—
|
|
1
|
|
414
|
|
|||||||||
|
Issuer services
|
265
|
|
—
|
|
—
|
|
265
|
|
260
|
|
—
|
|
—
|
|
260
|
|
|||||||||
|
Treasury services
|
140
|
|
1
|
|
—
|
|
141
|
|
138
|
|
—
|
|
—
|
|
138
|
|
|||||||||
|
Total investment services fees
|
1,895
|
|
22
|
|
1
|
|
1,918
|
|
1,928
|
|
25
|
|
1
|
|
1,954
|
|
|||||||||
|
Investment management and performance fees
|
14
|
|
893
|
|
—
|
|
907
|
|
14
|
|
942
|
|
—
|
|
956
|
|
|||||||||
|
Financing-related fees
|
15
|
|
—
|
|
—
|
|
15
|
|
17
|
|
—
|
|
—
|
|
17
|
|
|||||||||
|
Distribution and servicing
|
(14
|
)
|
48
|
|
—
|
|
34
|
|
(14
|
)
|
50
|
|
—
|
|
36
|
|
|||||||||
|
Investment and other income
|
69
|
|
(50
|
)
|
1
|
|
20
|
|
69
|
|
(51
|
)
|
—
|
|
18
|
|
|||||||||
|
Total fee revenue - contract revenue
|
1,979
|
|
913
|
|
2
|
|
2,894
|
|
2,014
|
|
966
|
|
1
|
|
2,981
|
|
|||||||||
|
Fee and other revenue - not in scope of
ASC 606
(b)(c)
|
254
|
|
28
|
|
39
|
|
321
|
|
236
|
|
46
|
|
7
|
|
289
|
|
|||||||||
|
Total fee and other revenue
|
$
|
2,233
|
|
$
|
941
|
|
$
|
41
|
|
$
|
3,215
|
|
$
|
2,250
|
|
$
|
1,012
|
|
$
|
8
|
|
$
|
3,270
|
|
|
|
(a)
|
Business segment data has been determined on an internal management basis of accounting, rather than the generally accepted accounting principles used for consolidated financial reporting.
|
|
(b)
|
Primarily includes foreign exchange and other trading revenue, financing-related fees, investment and other income and net securities gains, all of which are accounted for using other accounting guidance.
|
|
(c)
|
The Investment Management business includes income from consolidated investment management funds, net of noncontrolling interests, of
$5 million
in the
second quarter of 2018
and less than
$1 million
in the first quarter of 2018.
|
|
Disaggregation of contract revenue by business segment
(a)
|
||||||||||||
|
Year-to-date June 30, 2018
|
||||||||||||
|
(in millions)
|
Investment Services
|
|
Investment Management
|
|
Other
|
|
Total
|
|
||||
|
Fee revenue - contract revenue:
|
||||||||||||
|
Investment services fees:
|
||||||||||||
|
Asset servicing
|
$
|
2,215
|
|
$
|
46
|
|
$
|
1
|
|
$
|
2,262
|
|
|
Clearing services
|
805
|
|
—
|
|
1
|
|
806
|
|
||||
|
Issuer services
|
525
|
|
—
|
|
—
|
|
525
|
|
||||
|
Treasury services
|
278
|
|
1
|
|
—
|
|
279
|
|
||||
|
Total investment services fees
|
3,823
|
|
47
|
|
2
|
|
3,872
|
|
||||
|
Investment management and performance fees
|
28
|
|
1,835
|
|
—
|
|
1,863
|
|
||||
|
Financing-related fees
|
32
|
|
—
|
|
—
|
|
32
|
|
||||
|
Distribution and servicing
|
(28
|
)
|
98
|
|
—
|
|
70
|
|
||||
|
Investment and other income
|
138
|
|
(101
|
)
|
1
|
|
38
|
|
||||
|
Total fee revenue - contract revenue
|
3,993
|
|
1,879
|
|
3
|
|
5,875
|
|
||||
|
Fee and other revenue - not in scope of
ASC 606
(b)(c)
|
490
|
|
74
|
|
46
|
|
610
|
|
||||
|
Total fee and other revenue
|
$
|
4,483
|
|
$
|
1,953
|
|
$
|
49
|
|
$
|
6,485
|
|
|
(a)
|
Business segment data has been determined on an internal management basis of accounting, rather than the generally accepted accounting principles used for consolidated financial reporting.
|
|
(b)
|
Primarily includes foreign exchange and other trading revenue, financing-related fees, investment and other income and net securities gains, all of which are accounted for using other accounting guidance.
|
|
(c)
|
The Investment Management business includes income from consolidated investment management funds, net of noncontrolling interests of
$5 million
in the first six months of 2018.
|
Contract balances
Our clients are billed based on fee schedules that are agreed upon in each customer contract. Receivables from customers were
$3.9 billion
at Jan. 1, 2018 and
$2.4 billion
at
June 30, 2018
. An allowance is maintained for accounts receivables which is generally based on the number of days outstanding. Adjustments to the allowance are recorded in other expense in the consolidated income statement. Provisions of
$4 million
and
$6 million
were recorded in the
second quarter of 2018
and first six months of 2018, respectively.
Contract assets represent accrued revenues that have not yet been billed to the customers due to certain contractual terms other than the passage of time and were
$30 million
at Jan. 1, 2018 and
$65 million
at
June 30, 2018
. Accrued revenues recorded as contract assets are usually billed on an annual basis. There were
no
impairments recorded on contract assets in the
second quarter of 2018
.
Both receivables from customers and contract assets are included in other assets on the consolidated balance sheet.
Contract liabilities represent payments received in advance of providing services under certain contracts and were
$167 million
at Jan. 1, 2018 and
$193 million
at
June 30, 2018
. Contract liabilities are
BNY Mellon
69
|
Notes to Consolidated Financial Statements
(continued)
|
included in other liabilities on the consolidated balance sheet. Revenue recognized in the
second quarter of 2018
relating to contract liabilities as of
March 31, 2018
was
$53 million
. Revenue recognized in the
first six months of 2018
relating to contract liabilities as of Jan. 1, 2018 was
$70 million
.
Changes in contract assets and liabilities primarily relate to either party’s performance under the contracts.
Contract costs
Incremental costs for obtaining contracts that are deemed recoverable are capitalized as contract costs. Such costs result from the payment of sales incentives, primarily in the Wealth Management business, and totaled
$109 million
at
June 30, 2018
. Capitalized sales incentives are amortized based on the transfer of goods or services to which the assets relate and typically average
nine years
. The amortization of capitalized sales incentives, which is primarily included in staff expense, totaled
$6 million
in the
second quarter of 2018
and
$11 million
in the first six months of 2018.
Costs to fulfill a contract are capitalized when they relate directly to an existing contract or specific
anticipated contract, generate or enhance resources that will be used to fulfill performance obligations and are recoverable. Such costs generally represent set-up costs, which include any direct cost incurred at inception of a contract which enables the fulfillment of the performance obligation and totaled
$14 million
at
June 30, 2018
. These capitalized costs are amortized on a straight line basis over the expected contract period which generally range from
seven
to
nine years
. The amortization is included in other expense and totaled
$2 million
in the
second quarter of 2018
and
$3 million
in the first six months of 2018.
There were
no
impairments recorded on capitalized contract costs in the
second quarter of 2018
.
Unsatisfied performance obligations
We do not have any unsatisfied performance obligations other than those that are subject to a practical expedient election under ASC 606,
Revenue From Contracts With Customers
. The practical expedient election applies to (i) contracts with an original expected length of one year or less, and (ii)
contracts for which we recognize revenue at the amount to which we have the right to invoice for services performed.
70
BNY Mellon
|
Notes to Consolidated Financial Statements
(continued)
|
Note 9–Net interest revenue
The following table provides the components of net interest revenue presented on the consolidated income statement.
|
Net interest revenue
|
Quarter ended
|
Year-to-date
|
||||||||||||||
|
June 30, 2018
|
|
March 31, 2018
|
|
June 30, 2017
|
|
June 30, 2018
|
|
June 30, 2017
|
|
|||||||
|
(in millions)
|
||||||||||||||||
|
Interest revenue
|
||||||||||||||||
|
Non-margin loans
|
$
|
345
|
|
$
|
305
|
|
$
|
272
|
|
$
|
650
|
|
$
|
517
|
|
|
|
Margin loans
|
128
|
|
115
|
|
87
|
|
243
|
|
162
|
|
||||||
|
Securities:
|
||||||||||||||||
|
Taxable
|
615
|
|
581
|
|
476
|
|
1,196
|
|
937
|
|
||||||
|
Exempt from federal income taxes
|
14
|
|
15
|
|
16
|
|
29
|
|
33
|
|
||||||
|
Total securities
|
629
|
|
596
|
|
492
|
|
1,225
|
|
970
|
|
||||||
|
Deposits with banks
|
56
|
|
42
|
|
27
|
|
98
|
|
49
|
|
||||||
|
Deposits with the Federal Reserve and other central banks
|
136
|
|
126
|
|
71
|
|
262
|
|
128
|
|
||||||
|
Federal funds sold and securities purchased under resale agreements
|
230
|
|
170
|
|
86
|
|
400
|
|
153
|
|
||||||
|
Trading assets
|
29
|
|
27
|
|
17
|
|
56
|
|
33
|
|
||||||
|
Total interest revenue
|
1,553
|
|
1,381
|
|
1,052
|
|
2,934
|
|
2,012
|
|
||||||
|
Interest expense
|
||||||||||||||||
|
Deposits
|
173
|
|
117
|
|
32
|
|
290
|
|
41
|
|
||||||
|
Federal funds purchased and securities sold under repurchase agreements
|
158
|
|
107
|
|
38
|
|
265
|
|
62
|
|
||||||
|
Trading liabilities
|
7
|
|
9
|
|
2
|
|
16
|
|
4
|
|
||||||
|
Other borrowed funds
|
14
|
|
9
|
|
4
|
|
23
|
|
6
|
|
||||||
|
Commercial paper
|
21
|
|
12
|
|
5
|
|
33
|
|
10
|
|
||||||
|
Customer payables
|
45
|
|
31
|
|
16
|
|
76
|
|
23
|
|
||||||
|
Long-term debt
|
219
|
|
177
|
|
129
|
|
396
|
|
248
|
|
||||||
|
Total interest expense
|
637
|
|
462
|
|
226
|
|
1,099
|
|
394
|
|
||||||
|
Net interest revenue
|
916
|
|
919
|
|
826
|
|
1,835
|
|
1,618
|
|
||||||
|
Provision for credit losses
|
(3
|
)
|
(5
|
)
|
(7
|
)
|
(8
|
)
|
(12
|
)
|
||||||
|
Net interest revenue after provision for credit losses
|
$
|
919
|
|
$
|
924
|
|
$
|
833
|
|
$
|
1,843
|
|
$
|
1,630
|
|
|
Note 10–Employee benefit plans
The components of net periodic benefit (credit) cost are as follows. The service cost component is reflected in staff expense, whereas the remaining components are reflected in other expense.
|
Net periodic benefit (credit) cost
|
Quarter ended
|
||||||||||||||||||||||||||||
|
June 30, 2018
|
March 31, 2018
|
June 30, 2017
|
|||||||||||||||||||||||||||
|
(in millions)
|
Domestic pension benefits
|
|
Foreign pension benefits
|
|
Health care benefits
|
|
Domestic pension benefits
|
|
Foreign pension benefits
|
|
Health care benefits
|
|
Domestic pension benefits
|
|
Foreign pension benefits
|
|
Health care benefits
|
|
|||||||||||
|
Service cost
|
$
|
—
|
|
$
|
7
|
|
$
|
—
|
|
$
|
—
|
|
$
|
7
|
|
$
|
—
|
|
$
|
—
|
|
$
|
7
|
|
$
|
—
|
|
||
|
Interest cost
|
42
|
|
8
|
|
2
|
|
43
|
|
8
|
|
2
|
|
45
|
|
8
|
|
2
|
|
|||||||||||
|
Expected return on assets
|
(85
|
)
|
(14
|
)
|
(2
|
)
|
(85
|
)
|
(15
|
)
|
(2
|
)
|
(81
|
)
|
(12
|
)
|
(2
|
)
|
|||||||||||
|
Other
|
17
|
|
6
|
|
—
|
|
17
|
|
6
|
|
(1
|
)
|
17
|
|
9
|
|
(1
|
)
|
|||||||||||
|
Net periodic benefit (credit) cost
|
$
|
(26
|
)
|
$
|
7
|
|
$
|
—
|
|
$
|
(25
|
)
|
$
|
6
|
|
$
|
(1
|
)
|
$
|
(19
|
)
|
$
|
12
|
|
$
|
(1
|
)
|
||
BNY Mellon
71
|
Notes to Consolidated Financial Statements
(continued)
|
|
Net periodic benefit (credit) cost
|
Year-to-date
|
||||||||||||||||||
|
June 30, 2018
|
June 30, 2017
|
||||||||||||||||||
|
(in millions)
|
Domestic pension benefits
|
|
Foreign pension benefits
|
|
Health care benefits
|
|
Domestic pension benefits
|
|
Foreign pension benefits
|
|
Health care benefits
|
|
|||||||
|
Service cost
|
$
|
—
|
|
$
|
14
|
|
$
|
—
|
|
$
|
—
|
|
$
|
14
|
|
$
|
—
|
|
|
|
Interest cost
|
85
|
|
16
|
|
4
|
|
90
|
|
16
|
|
4
|
|
|||||||
|
Expected return on assets
|
(170
|
)
|
(29
|
)
|
(4
|
)
|
(162
|
)
|
(24
|
)
|
(4
|
)
|
|||||||
|
Other
|
34
|
|
12
|
|
(1
|
)
|
34
|
|
18
|
|
(2
|
)
|
|||||||
|
Net periodic benefit (credit) cost
|
$
|
(51
|
)
|
$
|
13
|
|
$
|
(1
|
)
|
$
|
(38
|
)
|
$
|
24
|
|
$
|
(2
|
)
|
|
Note 11–Income taxes
BNY Mellon recorded an income tax provision of
$286 million
(
20.5%
effective tax rate) in the
second quarter of 2018
. The income tax provision was
$332 million
(
25.4%
effective tax rate) in the
second quarter of 2017
and
$282 million
(
19.5%
effective tax rate) in the
first quarter of 2018
. There were no adjustments recorded in the second quarter of 2018 to the estimated tax benefit related to U.S. tax legislation.
Our total tax reserves as of
June 30, 2018
were
$101 million
compared with
$130 million
at
March 31, 2018
. If these tax reserves were unnecessary,
$101 million
would affect the effective tax rate in future periods. We recognize accrued interest and penalties, if applicable, related to income taxes in income tax expense. Included in the balance sheet at
June 30, 2018
is accrued interest, where applicable, of
$16 million
. The additional tax expense related to interest for the
six months ended June 30, 2018
was
$2 million
, compared with
$4 million
for the
six months ended June 30, 2017
.
It is reasonably possible the total reserve for uncertain tax positions could decrease within the next 12 months by approximately
$7 million
as a result of adjustments related to tax years that are still subject to examination.
Our federal income tax returns are closed to examination through 2013. Our New York State,
New York City and UK income tax returns are closed to examination through 2012.
Note 12–Variable interest entities and securitization
BNY Mellon has variable interests in VIEs, which include investments in retail, institutional and alternative investment funds, including
collateralized
loan obligation (“CLO”)
structures in which we provide asset management services, some of which are consolidated. The investment funds are offered to our retail and institutional clients to provide them with access to investment vehicles with specific investment objectives and strategies that address the client’s investment needs.
BNY Mellon earns management fees from these funds as well as performance fees in certain funds and may also provide start-up capital for its new funds. The funds are primarily financed by our customers’ investments in the funds’ equity or debt.
Additionally, BNY Mellon invests in qualified affordable housing and renewable energy projects, which are designed to generate a return primarily through the realization of tax credits by the Company. The projects, which are structured as limited partnerships and LLCs, are also VIEs, but are not consolidated.
The VIEs previously discussed are included in the scope of ASU 2015-02 and are reviewed for consolidation based on the guidance in ASC 810,
Consolidation
.
We reconsider and reassess whether or not we are the primary beneficiary of a VIE when governing
documents or contractual arrangements are changed that would reallocate the obligation to absorb expected losses or receive expected residual returns between BNY Mellon and the other investors. This could occur when BNY Mellon disposes of its variable interests in the fund, when additional variable interests are issued to other investors or when we acquire additional variable interests in the VIE.
The following table presents the incremental assets and liabilities included in BNY Mellon’s consolidated financial statements, after applying intercompany eliminations, as of
June 30, 2018
and
Dec. 31, 2017
.
The net assets of any consolidated VIE are solely
72
BNY Mellon
|
Notes to Consolidated Financial Statements
(continued)
|
available to settle the liabilities of the VIE and to settle any investors’ ownership liquidation requests,
including any seed capital invested in the VIE by BNY Mellon.
|
Consolidated investments
|
|||||||||||||||||||||
|
June 30, 2018
|
Dec. 31, 2017
|
||||||||||||||||||||
|
(in millions)
|
Investment
Management
funds
|
Securitization
|
|
Total
consolidated
investments
|
|
Investment
Management
funds
|
Securitization
|
|
Total
consolidated
investments
|
|
|||||||||||
|
Securities - Available-for-sale
|
$
|
—
|
|
$
|
—
|
|
$
|
—
|
|
$
|
—
|
|
$
|
400
|
|
$
|
400
|
|
|||
|
Trading assets
|
175
|
|
400
|
|
575
|
|
516
|
|
—
|
|
516
|
|
|||||||||
|
Other assets
|
253
|
|
—
|
|
253
|
|
215
|
|
—
|
|
215
|
|
|||||||||
|
Total assets
|
$
|
428
|
|
(a)
|
$
|
400
|
|
$
|
828
|
|
$
|
731
|
|
(b)
|
$
|
400
|
|
$
|
1,131
|
|
|
|
Other liabilities
|
$
|
3
|
|
$
|
363
|
|
$
|
366
|
|
$
|
2
|
|
$
|
367
|
|
$
|
369
|
|
|||
|
Total liabilities
|
$
|
3
|
|
(a)
|
$
|
363
|
|
$
|
366
|
|
$
|
2
|
|
(b)
|
$
|
367
|
|
$
|
369
|
|
|
|
Nonredeemable noncontrolling interests
|
$
|
52
|
|
(a)
|
$
|
—
|
|
$
|
52
|
|
$
|
316
|
|
(b)
|
$
|
—
|
|
$
|
316
|
|
|
|
(a)
|
Includes voting model entities (“VMEs”) with assets of
$295 million
, liabilities of
$3 million
and nonredeemable noncontrolling interests of less than
$1 million
.
|
|
(b)
|
Includes VMEs with assets of
$84 million
, liabilities of
$1 million
and nonredeemable noncontrolling interests of
$1 million
.
|
BNY Mellon has not provided financial or other support that was not otherwise contractually required to be provided to our VIEs. Additionally, creditors of any consolidated VIEs do not have any recourse to the general credit of BNY Mellon.
Non-consolidated VIEs
As of
June 30, 2018
and
Dec. 31, 2017
, the following assets and liabilities related to the VIEs where BNY
Mellon is not the primary beneficiary are included in our consolidated financial statements and primarily relate to accounting for our investments in qualified affordable housing and renewable energy projects.
The maximum loss exposure indicated in the table below relates solely to BNY Mellon’s investments in, and unfunded commitments to, the VIEs.
|
Non-consolidated VIEs
|
|||||||||||||||||||
|
June 30, 2018
|
Dec. 31, 2017
|
||||||||||||||||||
|
(in millions)
|
Assets
|
|
Liabilities
|
|
Maximum loss exposure
|
|
Assets
|
|
Liabilities
|
|
Maximum loss exposure
|
|
|||||||
|
Securities - Available-for-sale
(a)
|
$
|
222
|
|
$
|
—
|
|
$
|
222
|
|
$
|
203
|
|
$
|
—
|
|
$
|
203
|
|
|
|
Other
|
2,603
|
|
498
|
|
3,101
|
|
2,592
|
|
486
|
|
3,078
|
|
|||||||
|
(a)
|
Includes investments in the Company’s sponsored CLOs.
|
BNY Mellon
73
|
Notes to Consolidated Financial Statements
(continued)
|
Note 13–Preferred stock
BNY Mellon has
100 million
authorized shares of preferred stock with a par value of
$0.01
per share. The following table summarizes BNY Mellon’s preferred stock issued and outstanding at
June 30, 2018
and
Dec. 31, 2017
.
|
Preferred stock summary
(a)
|
Total shares issued and outstanding
|
Carrying value
(b)
|
||||||||||
|
(in millions)
|
||||||||||||
|
Per annum dividend rate
|
June 30, 2018
|
|
Dec. 31, 2017
|
|
June 30, 2018
|
|
Dec. 31, 2017
|
|
||||
|
Series A
|
Greater of (i) three-month LIBOR plus 0.565% for the related distribution period; or (ii) 4.000%
|
5,001
|
|
5,001
|
|
$
|
500
|
|
$
|
500
|
|
|
|
Series C
|
5.2%
|
5,825
|
|
5,825
|
|
568
|
|
568
|
|
|||
|
Series D
|
4.50% to but excluding June 20, 2023, then a floating rate equal to the three-month LIBOR plus 2.46%
|
5,000
|
|
5,000
|
|
494
|
|
494
|
|
|||
|
Series E
|
4.95% to and including June 20, 2020, then a floating rate equal to the three-month LIBOR plus 3.42%
|
10,000
|
|
10,000
|
|
990
|
|
990
|
|
|||
|
Series F
|
4.625% to and including Sept. 20, 2026, then a floating rate equal to the three-month LIBOR plus 3.131%
|
10,000
|
|
10,000
|
|
990
|
|
990
|
|
|||
|
Total
|
35,826
|
|
35,826
|
|
$
|
3,542
|
|
$
|
3,542
|
|
||
|
(a)
|
All outstanding preferred stock is noncumulative perpetual preferred stock with a liquidation preference of $100,000 per share.
|
|
(b)
|
The carrying value of the Series C, Series D, Series E and Series F preferred stock is recorded net of issuance costs.
|
On June 20, 2018, The Bank of New York Mellon Corporation paid the following dividends for the noncumulative perpetual preferred stock for the dividend period ending in June 2018 to holders of record as of the close of business on June 5, 2018:
|
•
|
$1,022.22
per share on the Series A Preferred Stock (equivalent to
$10.2222
per Normal Preferred Capital Security of Mellon Capital IV, each representing a 1/100th interest in a share of the Series A Preferred Stock);
|
|
•
|
$1,300.00
per share on the Series C Preferred Stock (equivalent to
$0.3250
per depositary share, each representing a 1/4,000th interest in a share of the Series C Preferred Stock);
|
|
•
|
$2,250.00
per share on the Series D Preferred Stock (equivalent to
$22.5000
per depositary share, each representing a 1/100th interest in a share of the Series D Preferred Stock); and
|
|
•
|
$2,475.00
per share on the Series E Preferred Stock (equivalent to
$24.7500
per depositary share, each representing a 1/100th interest in a share of the Series E Preferred Stock).
|
For additional information on the preferred stock, see Note 13 of the Notes to Consolidated Financial Statements in our 2017 Annual Report.
Terms of the Series A, Series C, Series D, Series E and Series F preferred stock are more fully described in each of their Certificates of Designations, each of which is filed as an Exhibit to this Form 10-Q.
74
BNY Mellon
|
Notes to Consolidated Financial Statements
(continued)
|
Note 14–Other comprehensive income (loss)
|
Components of other comprehensive income (loss)
|
Quarter ended
|
||||||||||||||||||||||||||||
|
June 30, 2018
|
March 31, 2018
|
June 30, 2017
|
|||||||||||||||||||||||||||
|
(in millions)
|
Pre-tax
amount
|
|
Tax
(expense)
benefit
|
|
After-tax
amount
|
|
Pre-tax
amount
|
|
Tax
(expense)
benefit
|
|
After-tax
amount
|
|
Pre-tax
amount
|
|
Tax
(expense)
benefit
|
|
After-tax
amount
|
|
|||||||||||
|
Foreign currency translation:
|
|||||||||||||||||||||||||||||
|
Foreign currency translation adjustments arising during the period
(a)
|
$
|
(302
|
)
|
$
|
(98
|
)
|
$
|
(400
|
)
|
$
|
201
|
|
$
|
43
|
|
$
|
244
|
|
$
|
249
|
|
$
|
81
|
|
$
|
330
|
|
||
|
Total foreign currency translation
|
(302
|
)
|
(98
|
)
|
(400
|
)
|
201
|
|
43
|
|
244
|
|
249
|
|
81
|
|
330
|
|
|||||||||||
|
Unrealized (loss) gain on assets available-for-sale:
|
|||||||||||||||||||||||||||||
|
Unrealized (loss) gain arising during period
|
(103
|
)
|
39
|
|
(64
|
)
|
(342
|
)
|
67
|
|
(275
|
)
|
146
|
|
(55
|
)
|
91
|
|
|||||||||||
|
Reclassification adjustment
(b)
|
(1
|
)
|
1
|
|
—
|
|
49
|
|
(12
|
)
|
37
|
|
—
|
|
(1
|
)
|
(1
|
)
|
|||||||||||
|
Net unrealized (loss) gain on assets available-for-sale
|
(104
|
)
|
40
|
|
(64
|
)
|
(293
|
)
|
55
|
|
(238
|
)
|
146
|
|
(56
|
)
|
90
|
|
|||||||||||
|
Defined benefit plans:
|
|||||||||||||||||||||||||||||
|
Amortization of prior service credit, net loss and initial obligation included in net periodic benefit cost
(b)
|
22
|
|
(6
|
)
|
16
|
|
22
|
|
(5
|
)
|
17
|
|
24
|
|
(8
|
)
|
16
|
|
|||||||||||
|
Total defined benefit plans
|
22
|
|
(6
|
)
|
16
|
|
22
|
|
(5
|
)
|
17
|
|
24
|
|
(8
|
)
|
16
|
|
|||||||||||
|
Unrealized gain (loss) on cash flow hedges:
|
|||||||||||||||||||||||||||||
|
Unrealized hedge (loss) gain arising during period
|
(17
|
)
|
3
|
|
(14
|
)
|
7
|
|
(1
|
)
|
6
|
|
(8
|
)
|
4
|
|
(4
|
)
|
|||||||||||
|
Reclassification of net loss (gain) to net income:
|
|||||||||||||||||||||||||||||
|
FX contracts - other revenue
|
1
|
|
—
|
|
1
|
|
(4
|
)
|
1
|
|
(3
|
)
|
—
|
|
—
|
|
—
|
|
|||||||||||
|
FX contracts - salary expense
|
(2
|
)
|
1
|
|
(1
|
)
|
(6
|
)
|
1
|
|
(5
|
)
|
9
|
|
(4
|
)
|
5
|
|
|||||||||||
|
Total reclassifications to net income
(b)
|
(1
|
)
|
1
|
|
—
|
|
(10
|
)
|
2
|
|
(8
|
)
|
9
|
|
(4
|
)
|
5
|
|
|||||||||||
|
Net unrealized (loss) gain on cash flow hedges
|
(18
|
)
|
4
|
|
(14
|
)
|
(3
|
)
|
1
|
|
(2
|
)
|
1
|
|
—
|
|
1
|
|
|||||||||||
|
Total other comprehensive (loss) income
|
$
|
(402
|
)
|
$
|
(60
|
)
|
$
|
(462
|
)
|
$
|
(73
|
)
|
$
|
94
|
|
$
|
21
|
|
$
|
420
|
|
$
|
17
|
|
$
|
437
|
|
||
|
Components of other comprehensive income (loss)
|
Year-to-date
|
||||||||||||||||||
|
June 30, 2018
|
June 30, 2017
|
||||||||||||||||||
|
(in millions)
|
Pre-tax
amount
|
|
Tax
(expense)
benefit
|
|
After-tax
amount
|
|
Pre-tax
amount
|
|
Tax
(expense)
benefit
|
|
After-tax
amount
|
|
|||||||
|
Foreign currency translation:
|
|||||||||||||||||||
|
Foreign currency translation adjustments arising during the period
(a)
|
$
|
(101
|
)
|
$
|
(55
|
)
|
$
|
(156
|
)
|
$
|
345
|
|
$
|
110
|
|
$
|
455
|
|
|
|
Total foreign currency translation
|
(101
|
)
|
(55
|
)
|
(156
|
)
|
345
|
|
110
|
|
455
|
|
|||||||
|
Unrealized (loss) gain on assets available-for-sale:
|
|||||||||||||||||||
|
Unrealized (loss) gain arising during period
|
(445
|
)
|
106
|
|
(339
|
)
|
310
|
|
(125
|
)
|
185
|
|
|||||||
|
Reclassification adjustment
(b)
|
48
|
|
(11
|
)
|
37
|
|
(10
|
)
|
3
|
|
(7
|
)
|
|||||||
|
Net unrealized (loss) gain on assets available-for-sale
|
(397
|
)
|
95
|
|
(302
|
)
|
300
|
|
(122
|
)
|
178
|
|
|||||||
|
Defined benefit plans:
|
|||||||||||||||||||
|
Net gain (loss) arising during the period
|
—
|
|
—
|
|
—
|
|
3
|
|
(1
|
)
|
2
|
|
|||||||
|
Amortization of prior service credit, net loss and initial obligation included in net periodic benefit cost
(b)
|
44
|
|
(11
|
)
|
33
|
|
49
|
|
(15
|
)
|
34
|
|
|||||||
|
Total defined benefit plans
|
44
|
|
(11
|
)
|
33
|
|
52
|
|
(16
|
)
|
36
|
|
|||||||
|
Unrealized (loss) gain on cash flow hedges:
|
|||||||||||||||||||
|
Unrealized hedge (loss) gain arising during period
|
(10
|
)
|
2
|
|
(8
|
)
|
6
|
|
(1
|
)
|
5
|
|
|||||||
|
Reclassification of net loss (gain) to net income:
|
|||||||||||||||||||
|
FX contracts - trading revenue
|
—
|
|
—
|
|
—
|
|
(3
|
)
|
1
|
|
(2
|
)
|
|||||||
|
FX contracts - other revenue
|
(3
|
)
|
1
|
|
(2
|
)
|
—
|
|
—
|
|
—
|
|
|||||||
|
FX contracts - salary expense
|
(8
|
)
|
2
|
|
(6
|
)
|
13
|
|
(5
|
)
|
8
|
|
|||||||
|
Total reclassifications to net income
(b)
|
(11
|
)
|
3
|
|
(8
|
)
|
10
|
|
(4
|
)
|
6
|
|
|||||||
|
Net unrealized (loss) gain on cash flow hedges
|
(21
|
)
|
5
|
|
(16
|
)
|
16
|
|
(5
|
)
|
11
|
|
|||||||
|
Total other comprehensive (loss) income
|
$
|
(475
|
)
|
$
|
34
|
|
$
|
(441
|
)
|
$
|
713
|
|
$
|
(33
|
)
|
$
|
680
|
|
|
|
(a)
|
Includes the impact of hedges of net investments in foreign subsidiaries. See Note 17 for additional information.
|
|
(b)
|
The reclassification adjustment related to the unrealized gain (loss) on assets available-for-sale is recorded as net securities gains on the Consolidated Income Statement. The amortization of prior service credit, net loss and initial obligation included in net periodic benefit cost is recorded as staff expense on the Consolidated Income Statement. See Note 17 of the Notes to Consolidated Financial Statements for the location of the reclassification adjustment related to cash flow hedges on the Consolidated Income Statement.
|
BNY Mellon
75
|
Notes to Consolidated Financial Statements
(continued)
|
Note 15–Fair value measurement
Fair value is defined as the price that would be received to sell an asset, or paid to transfer a liability, in an orderly transaction between market participants at the measurement date. A three-level hierarchy for fair value measurements is utilized based upon the transparency of inputs to the valuation of an asset or liability as of the measurement date. BNY Mellon’s own creditworthiness is considered when valuing liabilities. See Note 18 of the Notes to Consolidated Financial Statements in our 2017 Annual Report for information on how we determine fair value and the fair value hierarchy.
The following tables present the financial instruments carried at fair value at
June 30, 2018
and
Dec. 31, 2017
, by caption on the consolidated balance sheet and by the three-level valuation hierarchy. We have included credit ratings information in certain of the tables because the information indicates the degree of credit risk to which we are exposed, and significant changes in ratings classifications could result in increased risk for us. There were no material transfers between Level 1 and Level 2 during the
second quarter of 2018
.
|
Assets measured at fair value on a recurring basis at June 30, 2018
|
Total carrying
value |
|
|||||||||||||
|
(dollars in millions)
|
Level 1
|
|
Level 2
|
|
Level 3
|
|
Netting
(a)
|
|
|||||||
|
Available-for-sale securities:
|
|||||||||||||||
|
U.S. Treasury
|
$
|
18,855
|
|
$
|
—
|
|
$
|
—
|
|
$
|
—
|
|
$
|
18,855
|
|
|
U.S. government agencies
|
—
|
|
1,447
|
|
—
|
|
—
|
|
1,447
|
|
|||||
|
Sovereign debt/sovereign guaranteed
|
9,353
|
|
2,733
|
|
—
|
|
—
|
|
12,086
|
|
|||||
|
State and political subdivisions
|
—
|
|
2,630
|
|
—
|
|
—
|
|
2,630
|
|
|||||
|
Agency RMBS
|
—
|
|
24,803
|
|
—
|
|
—
|
|
24,803
|
|
|||||
|
Non-agency RMBS
(b)
|
—
|
|
1,507
|
|
—
|
|
—
|
|
1,507
|
|
|||||
|
Non-agency commercial MBS
|
—
|
|
1,378
|
|
—
|
|
—
|
|
1,378
|
|
|||||
|
Agency commercial MBS
|
—
|
|
9,566
|
|
—
|
|
—
|
|
9,566
|
|
|||||
|
CLOs
|
—
|
|
3,177
|
|
—
|
|
—
|
|
3,177
|
|
|||||
|
Corporate bonds
|
—
|
|
1,146
|
|
—
|
|
—
|
|
1,146
|
|
|||||
|
Other debt securities
|
—
|
|
4,452
|
|
—
|
|
—
|
|
4,452
|
|
|||||
|
Foreign covered bonds
|
—
|
|
2,893
|
|
—
|
|
—
|
|
2,893
|
|
|||||
|
Total available-for-sale securities
|
28,208
|
|
55,732
|
|
—
|
|
—
|
|
83,940
|
|
|||||
|
Trading assets:
|
|||||||||||||||
|
Debt instruments
|
1,054
|
|
2,019
|
|
—
|
|
—
|
|
3,073
|
|
|||||
|
Equity instruments
(c)
|
1,087
|
|
—
|
|
—
|
|
—
|
|
1,087
|
|
|||||
|
Derivative assets not designated as hedging:
|
|||||||||||||||
|
Interest rate
|
14
|
|
3,572
|
|
—
|
|
(2,322
|
)
|
1,264
|
|
|||||
|
Foreign exchange
|
—
|
|
5,082
|
|
—
|
|
(3,495
|
)
|
1,587
|
|
|||||
|
Equity and other contracts
|
1
|
|
77
|
|
—
|
|
(54
|
)
|
24
|
|
|||||
|
Total derivative assets not designated as hedging
|
15
|
|
8,731
|
|
—
|
|
(5,871
|
)
|
2,875
|
|
|||||
|
Total trading assets
|
2,156
|
|
10,750
|
|
—
|
|
(5,871
|
)
|
7,035
|
|
|||||
|
Other assets:
|
|||||||||||||||
|
Derivative assets designated as hedging:
|
|||||||||||||||
|
Interest rate
|
—
|
|
60
|
|
—
|
|
—
|
|
60
|
|
|||||
|
Foreign exchange
|
—
|
|
253
|
|
—
|
|
—
|
|
253
|
|
|||||
|
Total derivative assets designated as hedging
|
—
|
|
313
|
|
—
|
|
—
|
|
313
|
|
|||||
|
Other assets
(d)
|
122
|
|
223
|
|
—
|
|
—
|
|
345
|
|
|||||
|
Other assets measured at NAV
(d)
|
185
|
|
|||||||||||||
|
Total other assets
|
122
|
|
536
|
|
—
|
|
—
|
|
843
|
|
|||||
|
Subtotal assets of operations at fair value
|
30,486
|
|
67,018
|
|
—
|
|
(5,871
|
)
|
91,818
|
|
|||||
|
Percentage of assets of operations prior to netting
|
31
|
%
|
69
|
%
|
—
|
%
|
|||||||||
|
Assets of consolidated investment management funds
|
154
|
|
274
|
|
—
|
|
—
|
|
428
|
|
|||||
|
Total assets
|
$
|
30,640
|
|
$
|
67,292
|
|
$
|
—
|
|
$
|
(5,871
|
)
|
$
|
92,246
|
|
|
Percentage of total assets prior to netting
|
31
|
%
|
69
|
%
|
—
|
%
|
|||||||||
76
BNY Mellon
|
Notes to Consolidated Financial Statements
(continued)
|
|
Liabilities measured at fair value on a recurring basis at June 30, 2018
|
Total carrying
value |
|
|||||||||||||
|
(dollars in millions)
|
Level 1
|
|
Level 2
|
|
Level 3
|
|
Netting
(a)
|
|
|||||||
|
Trading liabilities:
|
|||||||||||||||
|
Debt instruments
|
$
|
973
|
|
$
|
116
|
|
$
|
—
|
|
$
|
—
|
|
$
|
1,089
|
|
|
Equity instruments
|
5
|
|
—
|
|
—
|
|
—
|
|
5
|
|
|||||
|
Derivative liabilities not designated as hedging:
|
|||||||||||||||
|
Interest rate
|
7
|
|
3,101
|
|
—
|
|
(2,428
|
)
|
680
|
|
|||||
|
Foreign exchange
|
—
|
|
5,612
|
|
—
|
|
(3,862
|
)
|
1,750
|
|
|||||
|
Equity and other contracts
|
—
|
|
136
|
|
—
|
|
(80
|
)
|
56
|
|
|||||
|
Total derivative liabilities not designated as hedging
|
7
|
|
8,849
|
|
—
|
|
(6,370
|
)
|
2,486
|
|
|||||
|
Total trading liabilities
|
985
|
|
8,965
|
|
—
|
|
(6,370
|
)
|
3,580
|
|
|||||
|
Long-term debt
(c)
|
—
|
|
363
|
|
—
|
|
—
|
|
363
|
|
|||||
|
Other liabilities – derivative liabilities designated as hedging:
|
|||||||||||||||
|
Interest rate
|
—
|
|
62
|
|
—
|
|
—
|
|
62
|
|
|||||
|
Foreign exchange
|
—
|
|
13
|
|
—
|
|
—
|
|
13
|
|
|||||
|
Total other liabilities – derivative liabilities designated as hedging
|
—
|
|
75
|
|
—
|
|
—
|
|
75
|
|
|||||
|
Subtotal liabilities of operations at fair value
|
985
|
|
9,403
|
|
—
|
|
(6,370
|
)
|
4,018
|
|
|||||
|
Percentage of liabilities of operations prior to netting
|
9
|
%
|
91
|
%
|
—
|
%
|
|||||||||
|
Liabilities of consolidated investment management funds
|
—
|
|
3
|
|
—
|
|
—
|
|
3
|
|
|||||
|
Total liabilities
|
$
|
985
|
|
$
|
9,406
|
|
$
|
—
|
|
$
|
(6,370
|
)
|
$
|
4,021
|
|
|
Percentage of total liabilities prior to netting
|
9
|
%
|
91
|
%
|
—
|
%
|
|||||||||
|
(a)
|
ASC 815, Derivatives and Hedging, permits the netting of derivative receivables and derivative payables under legally enforceable master netting agreements and permits the netting of cash collateral. Netting is applicable to derivatives not designated as hedging instruments included in trading assets or trading liabilities and derivatives designated as hedging instruments included in other assets or other liabilities. Netting is allocated to the derivative products based on the net fair value of each product.
|
|
(b)
|
Includes
$943 million
in Level 2 that was included in the former Grantor Trust.
|
|
(c)
|
Includes certain interests in securitizations.
|
|
(d)
|
Includes seed capital, private equity and other assets.
|
BNY Mellon
77
|
Notes to Consolidated Financial Statements
(continued)
|
|
Assets measured at fair value on a recurring basis at Dec. 31, 2017
|
Total carrying
value
|
|
|||||||||||||
|
(dollars in millions)
|
Level 1
|
|
Level 2
|
|
Level 3
|
|
Netting
(a)
|
|
|||||||
|
Available-for-sale securities:
|
|||||||||||||||
|
U.S. Treasury
|
$
|
15,263
|
|
$
|
—
|
|
$
|
—
|
|
$
|
—
|
|
$
|
15,263
|
|
|
U.S. government agencies
|
—
|
|
908
|
|
—
|
|
—
|
|
908
|
|
|||||
|
Sovereign debt/sovereign guaranteed
|
9,919
|
|
2,638
|
|
—
|
|
—
|
|
12,557
|
|
|||||
|
State and political subdivisions
|
—
|
|
2,957
|
|
—
|
|
—
|
|
2,957
|
|
|||||
|
Agency RMBS
|
—
|
|
23,819
|
|
—
|
|
—
|
|
23,819
|
|
|||||
|
Non-agency RMBS
(b)
|
—
|
|
1,578
|
|
—
|
|
—
|
|
1,578
|
|
|||||
|
Other RMBS
|
—
|
|
149
|
|
—
|
|
—
|
|
149
|
|
|||||
|
Non-agency commercial MBS
|
—
|
|
1,360
|
|
—
|
|
—
|
|
1,360
|
|
|||||
|
Agency commercial MBS
|
—
|
|
8,762
|
|
—
|
|
—
|
|
8,762
|
|
|||||
|
CLOs
|
—
|
|
2,909
|
|
—
|
|
—
|
|
2,909
|
|
|||||
|
Other asset-backed securities
|
—
|
|
1,043
|
|
—
|
|
—
|
|
1,043
|
|
|||||
|
Money market funds
(c)
|
963
|
|
—
|
|
—
|
|
—
|
|
963
|
|
|||||
|
Corporate bonds
|
—
|
|
1,255
|
|
—
|
|
—
|
|
1,255
|
|
|||||
|
Other debt securities
|
—
|
|
3,491
|
|
—
|
|
—
|
|
3,491
|
|
|||||
|
Foreign covered bonds
|
—
|
|
2,529
|
|
—
|
|
—
|
|
2,529
|
|
|||||
|
Total available-for-sale securities
|
26,145
|
|
53,398
|
|
—
|
|
—
|
|
79,543
|
|
|||||
|
Trading assets:
|
|||||||||||||||
|
Debt and equity instruments
(c)
|
1,344
|
|
1,910
|
|
—
|
|
—
|
|
3,254
|
|
|||||
|
Derivative assets not designated as hedging:
|
|||||||||||||||
|
Interest rate
|
9
|
|
6,430
|
|
—
|
|
(5,075
|
)
|
1,364
|
|
|||||
|
Foreign exchange
|
—
|
|
5,104
|
|
—
|
|
(3,720
|
)
|
1,384
|
|
|||||
|
Equity and other contracts
|
—
|
|
70
|
|
—
|
|
(50
|
)
|
20
|
|
|||||
|
Total derivative assets not designated as hedging
|
9
|
|
11,604
|
|
—
|
|
(8,845
|
)
|
2,768
|
|
|||||
|
Total trading assets
|
1,353
|
|
13,514
|
|
—
|
|
(8,845
|
)
|
6,022
|
|
|||||
|
Other assets
:
|
|||||||||||||||
|
Derivative assets designated as hedging:
|
|||||||||||||||
|
Interest rate
|
—
|
|
278
|
|
—
|
|
—
|
|
278
|
|
|||||
|
Foreign exchange
|
—
|
|
45
|
|
—
|
|
—
|
|
45
|
|
|||||
|
Total derivative assets designated as hedging
|
—
|
|
323
|
|
—
|
|
—
|
|
323
|
|
|||||
|
Other assets
(d)
|
144
|
|
170
|
|
—
|
|
—
|
|
314
|
|
|||||
|
Other assets measured at NAV
(d)
|
154
|
|
|||||||||||||
|
Total other assets
|
144
|
|
493
|
|
—
|
|
—
|
|
791
|
|
|||||
|
Subtotal assets of operations at fair value
|
27,642
|
|
67,405
|
|
—
|
|
(8,845
|
)
|
86,356
|
|
|||||
|
Percentage of assets of operations prior to netting
|
29
|
%
|
71
|
%
|
—
|
%
|
|||||||||
|
Assets of consolidated investment management funds
|
322
|
|
409
|
|
—
|
|
—
|
|
731
|
|
|||||
|
Total assets
|
$
|
27,964
|
|
$
|
67,814
|
|
$
|
—
|
|
$
|
(8,845
|
)
|
$
|
87,087
|
|
|
Percentage of total assets prior to netting
|
29
|
%
|
71
|
%
|
—
|
%
|
|||||||||
78
BNY Mellon
|
Notes to Consolidated Financial Statements
(continued)
|
|
Liabilities measured at fair value on a recurring basis at Dec. 31, 2017
|
Total carrying
value
|
|
|||||||||||||
|
(dollars in millions)
|
Level 1
|
|
Level 2
|
|
Level 3
|
|
Netting
(a)
|
|
|||||||
|
Trading liabilities:
|
|||||||||||||||
|
Debt and equity instruments
|
$
|
1,128
|
|
$
|
80
|
|
$
|
—
|
|
$
|
—
|
|
$
|
1,208
|
|
|
Derivative liabilities not designated as hedging:
|
|||||||||||||||
|
Interest rate
|
4
|
|
6,349
|
|
—
|
|
(5,495
|
)
|
858
|
|
|||||
|
Foreign exchange
|
—
|
|
5,067
|
|
—
|
|
(3,221
|
)
|
1,846
|
|
|||||
|
Equity and other contracts
|
—
|
|
153
|
|
—
|
|
(81
|
)
|
72
|
|
|||||
|
Total derivative liabilities not designated as hedging
|
4
|
|
11,569
|
|
—
|
|
(8,797
|
)
|
2,776
|
|
|||||
|
Total trading liabilities
|
1,132
|
|
11,649
|
|
—
|
|
(8,797
|
)
|
3,984
|
|
|||||
|
Long-term debt (
c
)
|
—
|
|
367
|
|
—
|
|
—
|
|
367
|
|
|||||
|
Other liabilities – derivative liabilities designated as hedging:
|
|||||||||||||||
|
Interest rate
|
—
|
|
534
|
|
—
|
|
—
|
|
534
|
|
|||||
|
Foreign exchange
|
—
|
|
266
|
|
—
|
|
—
|
|
266
|
|
|||||
|
Total other liabilities – derivative liabilities designated as hedging
|
—
|
|
800
|
|
—
|
|
—
|
|
800
|
|
|||||
|
Subtotal liabilities of operations at fair value
|
1,132
|
|
12,816
|
|
—
|
|
(8,797
|
)
|
5,151
|
|
|||||
|
Percentage of liabilities of operations prior to netting
|
8
|
%
|
92
|
%
|
—
|
%
|
|||||||||
|
Liabilities of consolidated investment management funds
|
1
|
|
1
|
|
—
|
|
—
|
|
2
|
|
|||||
|
Total liabilities
|
$
|
1,133
|
|
$
|
12,817
|
|
$
|
—
|
|
$
|
(8,797
|
)
|
$
|
5,153
|
|
|
Percentage of total liabilities prior to netting
|
8
|
%
|
92
|
%
|
—
|
%
|
|||||||||
|
(a)
|
ASC 815, Derivatives and Hedging, permits the netting of derivative receivables and derivative payables under legally enforceable master netting agreements and permits the netting of cash collateral. Netting is applicable to derivatives not designated as hedging instruments included in trading assets or trading liabilities and derivatives designated as hedging instruments included in other assets or other liabilities. Netting is allocated to the derivative products based on the net fair value of each product.
|
|
(b)
|
Includes
$1,091 million
in Level 2 that was included in the former Grantor Trust.
|
|
(c)
|
Includes certain interests in securitizations.
|
|
(d)
|
Includes private equity investments and seed capital.
|
BNY Mellon
79
|
Notes to Consolidated Financial Statements
(continued)
|
|
Details of certain available-for-sale securities measured at fair value on a recurring basis
|
June 30, 2018
|
Dec. 31, 2017
|
|||||||||||||||||||||||
|
Total
carrying
value
(b)
|
|
Ratings
(a)
|
Total
carrying value
|
|
Ratings
(a)
|
||||||||||||||||||||
|
AAA/
AA-
|
|
A+/
A-
|
|
BBB+/
BBB-
|
|
BB+ and
lower
|
|
AAA/
AA-
|
|
A+/
A-
|
|
BBB+/
BBB-
|
|
BB+ and
lower
|
|
||||||||||
|
(dollars in millions)
|
(b)
|
||||||||||||||||||||||||
|
Non-agency RMBS
(c)
, originated in:
|
|||||||||||||||||||||||||
|
2007
|
$
|
355
|
|
15
|
%
|
2
|
%
|
4
|
%
|
79
|
%
|
$
|
419
|
|
13
|
%
|
3
|
%
|
—
|
%
|
84
|
%
|
|||
|
2006
|
412
|
|
—
|
|
17
|
|
1
|
|
82
|
|
467
|
|
—
|
|
17
|
|
—
|
|
83
|
|
|||||
|
2005
|
454
|
|
6
|
|
1
|
|
5
|
|
88
|
|
509
|
|
6
|
|
2
|
|
6
|
|
86
|
|
|||||
|
2004 and earlier
|
286
|
|
3
|
|
5
|
|
31
|
|
61
|
|
332
|
|
3
|
|
2
|
|
31
|
|
64
|
|
|||||
|
Total non-agency RMBS
|
$
|
1,507
|
|
6
|
%
|
7
|
%
|
8
|
%
|
79
|
%
|
$
|
1,727
|
|
(d)
|
6
|
%
|
6
|
%
|
8
|
%
|
80
|
%
|
||
|
Non-agency commercial MBS, originated in:
|
|||||||||||||||||||||||||
|
2009-2017
|
$
|
1,331
|
|
96
|
%
|
4
|
%
|
—
|
%
|
—
|
%
|
$
|
1,309
|
|
94
|
%
|
6
|
%
|
—
|
%
|
—
|
%
|
|||
|
2005
|
47
|
|
100
|
|
—
|
|
—
|
|
—
|
|
51
|
|
100
|
|
—
|
|
—
|
|
—
|
|
|||||
|
Total non-agency commercial MBS
|
$
|
1,378
|
|
96
|
%
|
4
|
%
|
—
|
%
|
—
|
%
|
$
|
1,360
|
|
94
|
%
|
6
|
%
|
—
|
%
|
—
|
%
|
|||
|
Foreign covered bonds:
|
|||||||||||||||||||||||||
|
Canada
|
$
|
1,619
|
|
100
|
%
|
—
|
%
|
—
|
%
|
—
|
%
|
$
|
1,659
|
|
100
|
%
|
—
|
%
|
—
|
%
|
—
|
%
|
|||
|
United Kingdom
|
450
|
|
100
|
|
—
|
|
—
|
|
—
|
|
103
|
|
100
|
|
—
|
|
—
|
|
—
|
|
|||||
|
Australia
|
330
|
|
100
|
|
—
|
|
—
|
|
—
|
|
265
|
|
100
|
|
—
|
|
—
|
|
—
|
|
|||||
|
Sweden
|
193
|
|
100
|
|
—
|
|
—
|
|
—
|
|
136
|
|
100
|
|
—
|
|
—
|
|
—
|
|
|||||
|
Other
|
301
|
|
100
|
|
—
|
|
—
|
|
—
|
|
366
|
|
100
|
|
—
|
|
—
|
|
—
|
|
|||||
|
Total foreign covered bonds
|
$
|
2,893
|
|
100
|
%
|
—
|
%
|
—
|
%
|
—
|
%
|
$
|
2,529
|
|
100
|
%
|
—
|
%
|
—
|
%
|
—
|
%
|
|||
|
Sovereign debt/sovereign guaranteed:
|
|||||||||||||||||||||||||
|
United Kingdom
|
$
|
3,044
|
|
100
|
%
|
—
|
%
|
—
|
%
|
—
|
%
|
$
|
3,052
|
|
100
|
%
|
—
|
%
|
—
|
%
|
—
|
%
|
|||
|
Germany
|
1,844
|
|
100
|
|
—
|
|
—
|
|
—
|
|
1,586
|
|
100
|
|
—
|
|
—
|
|
—
|
|
|||||
|
France
|
1,809
|
|
100
|
|
—
|
|
—
|
|
—
|
|
2,046
|
|
100
|
|
—
|
|
—
|
|
—
|
|
|||||
|
Spain
|
1,549
|
|
—
|
|
—
|
|
100
|
|
—
|
|
1,635
|
|
—
|
|
—
|
|
100
|
|
—
|
|
|||||
|
Italy
|
986
|
|
—
|
|
—
|
|
100
|
|
—
|
|
1,292
|
|
—
|
|
—
|
|
100
|
|
—
|
|
|||||
|
Netherlands
|
899
|
|
100
|
|
—
|
|
—
|
|
—
|
|
1,027
|
|
100
|
|
—
|
|
—
|
|
—
|
|
|||||
|
Ireland
|
804
|
|
—
|
|
100
|
|
—
|
|
—
|
|
843
|
|
—
|
|
100
|
|
—
|
|
—
|
|
|||||
|
Belgium
|
317
|
|
100
|
|
—
|
|
—
|
|
—
|
|
803
|
|
100
|
|
—
|
|
—
|
|
—
|
|
|||||
|
Other
(e)
|
834
|
|
86
|
|
—
|
|
—
|
|
14
|
|
273
|
|
50
|
|
—
|
|
—
|
|
50
|
|
|||||
|
Total sovereign debt/sovereign guaranteed
|
$
|
12,086
|
|
71
|
%
|
7
|
%
|
21
|
%
|
1
|
%
|
$
|
12,557
|
|
69
|
%
|
7
|
%
|
23
|
%
|
1
|
%
|
|||
|
(a)
|
Represents ratings by S&P or the equivalent.
|
|
(b)
|
At
June 30, 2018
and
Dec. 31, 2017
, sovereign debt/sovereign guaranteed securities were included in Level 1 and Level 2 in the valuation hierarchy. All other assets in the table are Level 2 assets in the valuation hierarchy.
|
|
(c)
|
Includes
$943 million
at
June 30, 2018
and
$1,091 million
at
Dec. 31, 2017
that were included in the former Grantor Trust.
|
|
(d)
|
Includes other RMBS.
|
|
(e)
|
Includes non-investment grade sovereign debt/sovereign guaranteed securities related to Brazil of
$116 million
at
June 30, 2018
and
$136 million
at
Dec. 31, 2017
.
|
Changes in Level 3 fair value measurements
Our classification of a financial instrument in Level 3 of the valuation hierarchy is based on the significance of the unobservable factors to the overall fair value measurement. However, these instruments generally include other observable components that are actively quoted or validated to third-party sources as well as the unobservable parameters in our valuation methodologies. We also manage the risks of Level 3 financial instruments using securities and derivatives that are Level 1 or Level 2 instruments.
The Company has a Level 3 Pricing Committee which evaluates the valuation techniques used in determining the fair value of Level 3 assets and liabilities.
There were
no
financial instruments recorded at fair value on a recurring basis classified in Level 3 of the
valuation hierarchy in the
first six months of 2018
and the
first six months of 2017
.
Assets and liabilities measured at fair value on a nonrecurring basis
Under certain circumstances, we make adjustments to fair value our assets, liabilities and unfunded lending-related commitments although they are not measured at fair value on an ongoing basis. Examples would be the recording of an impairment of an asset and non-readily marketable equity securities carried at cost with upward or downward adjustments.
The following tables present the financial instruments carried on the consolidated balance sheet by caption and level in the fair value hierarchy as of
June 30, 2018
and
Dec. 31, 2017
, for which a nonrecurring change in fair value has been recorded during the quarters ended
June 30, 2018
and
Dec. 31, 2017
.
80
BNY Mellon
|
Notes to Consolidated Financial Statements
(continued)
|
|
Assets measured at fair value on a nonrecurring basis at June 30, 2018
|
Total
carrying
value
|
|
|||||||||||
|
(in millions)
|
Level 1
|
|
Level 2
|
|
Level 3
|
|
|||||||
|
Loans
(a)
|
$
|
—
|
|
$
|
67
|
|
$
|
5
|
|
$
|
72
|
|
|
|
Other assets
(b)
|
—
|
|
26
|
|
—
|
|
26
|
|
|||||
|
Total assets at fair value on a nonrecurring basis
|
$
|
—
|
|
$
|
93
|
|
$
|
5
|
|
$
|
98
|
|
|
|
Assets measured at fair value on a nonrecurring basis at Dec. 31, 2017
|
Total
carrying
value
|
|
|||||||||||
|
(in millions)
|
Level 1
|
|
Level 2
|
|
Level 3
|
|
|||||||
|
Loans
(a)
|
$
|
—
|
|
$
|
73
|
|
$
|
6
|
|
$
|
79
|
|
|
|
Other assets
(b)
|
—
|
|
4
|
|
—
|
|
4
|
|
|||||
|
Total assets at fair value on a nonrecurring basis
|
$
|
—
|
|
$
|
77
|
|
$
|
6
|
|
$
|
83
|
|
|
|
(a)
|
During the quarters ended
June 30, 2018
and
Dec. 31, 2017
, the fair value of these loans decreased less than
$1 million
and less than
$1 million
, respectively, based on the fair value of the underlying collateral based on guidance in ASC 310, Receivables, with an offset to the allowance for credit losses.
|
|
(b)
|
Includes other assets received in satisfaction of debt.
|
Estimated fair value of financial instruments
The following tables present the estimated fair value and the carrying amount of financial instruments not carried at fair value on the consolidated balance sheet at
June 30, 2018
and
Dec. 31, 2017
, by caption on the consolidated balance sheet and by the valuation hierarchy. See Note 18 of the Notes to Consolidated Financial Statements in our 2017 Annual Report for additional information regarding the financial instruments within the scope of this disclosure, and the methods and significant assumptions used to estimate their fair value.
|
Summary of financial instruments
|
June 30, 2018
|
||||||||||||||
|
(in millions)
|
Level 1
|
|
Level 2
|
|
Level 3
|
|
Total
estimated
fair value
|
|
Carrying
amount
|
|
|||||
|
Assets:
|
|||||||||||||||
|
Interest-bearing deposits with the Federal Reserve and other central banks
|
$
|
—
|
|
$
|
75,116
|
|
$
|
—
|
|
$
|
75,116
|
|
$
|
75,116
|
|
|
Interest-bearing deposits with banks
|
—
|
|
16,155
|
|
—
|
|
16,155
|
|
16,134
|
|
|||||
|
Federal funds sold and securities purchased under resale agreements
|
—
|
|
26,494
|
|
—
|
|
26,494
|
|
26,494
|
|
|||||
|
Securities held-to-maturity
|
5,948
|
|
28,240
|
|
—
|
|
34,188
|
|
35,141
|
|
|||||
|
Loans
(a)
|
—
|
|
56,412
|
|
—
|
|
56,412
|
|
56,334
|
|
|||||
|
Other financial assets
|
5,361
|
|
1,353
|
|
—
|
|
6,714
|
|
6,714
|
|
|||||
|
Total
|
$
|
11,309
|
|
$
|
203,770
|
|
$
|
—
|
|
$
|
215,079
|
|
$
|
215,933
|
|
|
Liabilities:
|
|||||||||||||||
|
Noninterest-bearing deposits
|
$
|
—
|
|
$
|
75,463
|
|
$
|
—
|
|
$
|
75,463
|
|
$
|
75,463
|
|
|
Interest-bearing deposits
|
—
|
|
152,843
|
|
—
|
|
152,843
|
|
155,097
|
|
|||||
|
Federal funds purchased and securities sold under repurchase agreements
|
—
|
|
13,200
|
|
—
|
|
13,200
|
|
13,200
|
|
|||||
|
Payables to customers and broker-dealers
|
—
|
|
19,123
|
|
—
|
|
19,123
|
|
19,123
|
|
|||||
|
Commercial paper
|
—
|
|
2,508
|
|
—
|
|
2,508
|
|
2,508
|
|
|||||
|
Borrowings
|
—
|
|
3,006
|
|
—
|
|
3,006
|
|
3,006
|
|
|||||
|
Long-term debt
|
—
|
|
27,403
|
|
—
|
|
27,403
|
|
27,897
|
|
|||||
|
Total
|
$
|
—
|
|
$
|
293,546
|
|
$
|
—
|
|
$
|
293,546
|
|
$
|
296,294
|
|
|
(a)
|
Does not include the leasing portfolio.
|
BNY Mellon
81
|
Notes to Consolidated Financial Statements
(continued)
|
|
Summary of financial instruments
|
Dec. 31, 2017
|
||||||||||||||
|
(in millions)
|
Level 1
|
|
Level 2
|
|
Level 3
|
|
Total estimated
fair value |
|
Carrying
amount |
|
|||||
|
Assets:
|
|||||||||||||||
|
Interest-bearing deposits with the Federal Reserve and other central banks
|
$
|
—
|
|
$
|
91,510
|
|
$
|
—
|
|
$
|
91,510
|
|
$
|
91,510
|
|
|
Interest-bearing deposits with banks
|
—
|
|
11,982
|
|
—
|
|
11,982
|
|
11,979
|
|
|||||
|
Federal funds sold and securities purchased under resale agreements
|
—
|
|
28,135
|
|
—
|
|
28,135
|
|
28,135
|
|
|||||
|
Securities held-to-maturity
|
11,365
|
|
29,147
|
|
—
|
|
40,512
|
|
40,827
|
|
|||||
|
Loans
(a)
|
—
|
|
60,219
|
|
—
|
|
60,219
|
|
60,082
|
|
|||||
|
Other financial assets
|
5,382
|
|
1,244
|
|
—
|
|
6,626
|
|
6,626
|
|
|||||
|
Total
|
$
|
16,747
|
|
$
|
222,237
|
|
$
|
—
|
|
$
|
238,984
|
|
$
|
239,159
|
|
|
Liabilities:
|
|||||||||||||||
|
Noninterest-bearing deposits
|
$
|
—
|
|
$
|
82,716
|
|
$
|
—
|
|
$
|
82,716
|
|
$
|
82,716
|
|
|
Interest-bearing deposits
|
—
|
|
160,042
|
|
—
|
|
160,042
|
|
161,606
|
|
|||||
|
Federal funds purchased and securities sold under repurchase agreements
|
—
|
|
15,163
|
|
—
|
|
15,163
|
|
15,163
|
|
|||||
|
Payables to customers and broker-dealers
|
—
|
|
20,184
|
|
—
|
|
20,184
|
|
20,184
|
|
|||||
|
Commercial paper
|
—
|
|
3,075
|
|
—
|
|
3,075
|
|
3,075
|
|
|||||
|
Borrowings
|
—
|
|
2,931
|
|
—
|
|
2,931
|
|
2,931
|
|
|||||
|
Long-term debt
|
—
|
|
27,789
|
|
—
|
|
27,789
|
|
27,612
|
|
|||||
|
Total
|
$
|
—
|
|
$
|
311,900
|
|
$
|
—
|
|
$
|
311,900
|
|
$
|
313,287
|
|
|
(a)
|
Does not include the leasing portfolio.
|
The table below summarizes the carrying amount of the hedged financial instruments, the notional amount of the hedge and the unrealized gain (loss) (estimated fair value) of the derivatives.
|
Hedged financial instruments
|
Carrying
amount
|
|
Notional amount of hedge
|
|
||||||||
|
Unrealized
(a)
|
||||||||||||
|
(in millions)
|
Gain
|
|
(Loss)
|
|
||||||||
|
June 30, 2018
|
||||||||||||
|
Securities available-for-sale
|
$
|
16,308
|
|
$
|
16,756
|
|
$
|
60
|
|
$
|
(62
|
)
|
|
Long-term debt
|
23,460
|
|
24,100
|
|
—
|
|
—
|
|
||||
|
Dec. 31, 2017
|
||||||||||||
|
Securities available-for-sale
|
$
|
12,307
|
|
$
|
12,365
|
|
$
|
102
|
|
$
|
(301
|
)
|
|
Long-term debt
|
23,821
|
|
23,950
|
|
175
|
|
(233
|
)
|
||||
|
(a)
|
Unrealized gain/loss amounts reflect the fact that certain of the derivatives are cleared and settled through central clearing counterparties where cash collateral received and paid is deemed a settlement of the derivative.
|
Note 16–Fair value option
We elected fair value as an alternative measurement for selected financial assets and liabilities. The following table presents the assets and liabilities of consolidated investment management funds, at fair value.
|
Assets and liabilities of consolidated investment management funds, at fair value
|
||||||
|
June 30, 2018
|
|
Dec. 31, 2017
|
|
|||
|
(in millions)
|
||||||
|
Assets of consolidated investment management funds:
|
||||||
|
Trading assets
|
$
|
175
|
|
$
|
516
|
|
|
Other assets
|
253
|
|
215
|
|
||
|
Total assets of consolidated investment management funds
|
$
|
428
|
|
$
|
731
|
|
|
Liabilities of consolidated investment management funds:
|
||||||
|
Other liabilities
|
$
|
3
|
|
$
|
2
|
|
|
Total liabilities of consolidated investment management funds
|
$
|
3
|
|
$
|
2
|
|
82
BNY Mellon
|
Notes to Consolidated Financial Statements
(continued)
|
BNY Mellon values the assets and liabilities of its consolidated investment management funds using quoted prices for identical assets or liabilities in active markets or observable inputs such as quoted prices for similar assets or liabilities. Quoted prices for either identical or similar assets or liabilities in inactive markets may also be used. Accordingly, fair value best reflects the interests BNY Mellon holds in the economic performance of the consolidated investment management funds. Changes in the value of the assets and liabilities are recorded in the consolidated income statement as investment income of consolidated investment management funds and in the interest of investment management fund note holders, respectively.
We have elected the fair value option on
$240 million
of long-term debt. The fair value of this long-term debt was
$363 million
at
June 30, 2018
and
$367 million
at
Dec. 31, 2017
. The long-term debt is valued using observable market inputs and is included in Level 2 of the valuation hierarchy.
The following table presents the change in fair value of long-term debt recorded in foreign exchange and other trading revenue in the consolidated income statement.
|
Foreign exchange and other trading revenue
(a)
|
|||||||||||||||
|
(in millions)
|
2Q18
|
|
1Q18
|
|
2Q17
|
|
YTD18
|
|
YTD17
|
|
|||||
|
Long-term debt
|
$
|
—
|
|
$
|
4
|
|
$
|
(4
|
)
|
$
|
4
|
|
$
|
(5
|
)
|
|
(a)
|
The change in fair value is approximately offset by an economic hedge included in foreign exchange and other trading revenue.
|
Note 17–Derivative instruments
We use derivatives to manage exposure to market risk, including interest rate risk, equity price risk and foreign currency risk, as well as credit risk. Our trading activities are focused on acting as a market-maker for our customers and facilitating customer trades in compliance with the Volcker Rule.
The notional amounts for derivative financial instruments express the dollar volume of the transactions; however, credit risk is much smaller. We perform credit reviews and enter into netting agreements and collateral arrangements to minimize the credit risk of derivative financial instruments. We enter into offsetting positions to reduce exposure to foreign currency, interest rate and equity price risk.
Use of derivative financial instruments involves reliance on counterparties. Failure of a counterparty to honor its obligation under a derivative contract is a risk we assume whenever we engage in a derivative contract. There were
no
counterparty default losses recorded in the
second quarter of 2018
or the
second quarter of 2017
.
Hedging derivatives
We utilize interest rate swap agreements to manage our exposure to interest rate fluctuations. We enter into fair value hedges as an interest rate risk management strategy to reduce fair value variability by converting certain fixed rate interest payments associated with available-for-sale securities, deposits and long-term debt to LIBOR.
The available-for-sale securities hedged consist of U.S. Treasury bonds, agency and non-agency commercial MBS, sovereign debt, corporate bonds and covered bonds that had original maturities of
30
years or less at initial purchase. At
June 30, 2018
,
$16.6 billion
face amount of available-for-sale securities were hedged with interest rate swaps designated as fair value hedges that had notional values of
$16.6 billion
.
The fixed rate long-term debt instruments hedged generally have original maturities of
five
to
30
years. We issue both callable and non-callable debt. The debt is hedged with “receive fixed rate, pay variable rate” swaps. At
June 30, 2018
,
$24.1 billion
par value of debt was hedged with interest rate swaps that had notional values of
$24.1 billion
.
In addition, we utilize forward foreign exchange contracts as hedges to mitigate foreign exchange exposures. We use forward foreign exchange contracts as cash flow hedges to convert certain forecasted non-U.S. dollar revenue and expenses into U.S. dollars. We use forward foreign exchange contracts with maturities of
12 months
or less as cash flow hedges to hedge our foreign exchange exposure to Indian rupee, British pound, Hong Kong dollar, Singapore dollar, Polish zloty and Canadian dollar revenue and expense transactions in entities that have the U.S. dollar as their functional currency. As of
June 30, 2018
, the hedged forecasted foreign currency transactions and designated forward foreign exchange contract hedges were
$269 million
(notional), with a pre-tax loss of
$9 million
recorded in accumulated other comprehensive income. This
BNY Mellon
83
|
Notes to Consolidated Financial Statements
(continued)
|
loss will be reclassified to earnings over the next
12 months
.
Forward foreign exchange contracts are also used to hedge the value of our net investments in foreign subsidiaries. These forward foreign exchange contracts have maturities of less than
one year
. The derivatives employed are designated as hedges of changes in value of our foreign investments due to exchange rates. Changes in the value of the forward foreign exchange contracts offset the changes in value of the foreign investments due to changes in foreign exchange rates. The change in fair market value of these forward foreign exchange contracts is deferred and reported within foreign currency translation
adjustments in shareholders’ equity, net of tax. At
June 30, 2018
, forward foreign exchange contracts with notional amounts totaling
$7.5 billion
were designated as hedges.
In addition to forward foreign exchange contracts, we also designate non-derivative financial instruments as hedges of our net investments in foreign subsidiaries. Those non-derivative financial instruments designated as hedges of our net investments in foreign subsidiaries were all long-term liabilities of BNY Mellon in various currencies, and, at
June 30, 2018
, had a combined U.S. dollar equivalent value of
$178 million
.
The following table presents the gains (losses) related to our hedging derivative portfolio recognized in the income statement.
|
Income statement impact of fair value and cash flow hedges
|
||||||||||||||||||
|
(in millions)
|
Location of
gains (losses)
|
2Q18
|
|
1Q18
|
|
2Q17
|
|
YTD18
|
|
YTD17
|
|
|||||||
|
Fair value hedges of available-for-sale securities
|
||||||||||||||||||
|
Derivative
|
Interest income
|
$
|
136
|
|
$
|
397
|
|
$
|
(103
|
)
|
$
|
533
|
|
$
|
(21
|
)
|
||
|
Hedged item
|
Interest income
|
(133
|
)
|
(383
|
)
|
89
|
|
(516
|
)
|
8
|
|
|||||||
|
Fair value hedges of long-term debt
|
||||||||||||||||||
|
Derivative
|
Interest expense
|
(131
|
)
|
(378
|
)
|
105
|
|
(509
|
)
|
33
|
|
|||||||
|
Hedged item
|
Interest expense
|
129
|
|
377
|
|
(98
|
)
|
506
|
|
(31
|
)
|
|||||||
|
Cash flow hedges of forecasted FX exposures
|
||||||||||||||||||
|
Gain reclassified from OCI into income
|
Trading revenue
|
—
|
|
—
|
|
—
|
|
—
|
|
3
|
|
|||||||
|
(Loss) gain reclassified from OCI into income
|
Other revenue
|
(1
|
)
|
4
|
|
—
|
|
3
|
|
—
|
|
|||||||
|
Gain (loss) reclassified from OCI into income
|
Salary expense
|
2
|
|
6
|
|
(9
|
)
|
8
|
|
(13
|
)
|
|||||||
|
Gains (losses) recognized in the consolidated income statement due to fair value and cash flow hedging relationships
|
$
|
2
|
|
$
|
23
|
|
$
|
(16
|
)
|
$
|
25
|
|
$
|
(21
|
)
|
|||
The following table presents the impact of hedging derivatives used in net investment hedging relationships in the income statement.
|
Impact of derivative instruments used in net investment hedging relationships in the income statement
|
||||||||||||||||||||||||||||||||
|
(in millions)
|
||||||||||||||||||||||||||||||||
|
Derivatives in net investment hedging relationships
|
Gain or (loss) recognized in accumulated OCI on derivatives
|
Location of gain or (loss) reclassified from accumulated OCI into income
|
Gain or (loss) reclassified from accumulated OCI into income
|
|||||||||||||||||||||||||||||
|
2Q18
|
|
1Q18
|
|
2Q17
|
|
YTD18
|
|
YTD17
|
|
2Q18
|
|
1Q18
|
|
2Q17
|
|
YTD18
|
|
YTD17
|
|
|||||||||||||
|
FX contracts
|
$
|
429
|
|
$
|
(158
|
)
|
$
|
(274
|
)
|
$
|
271
|
|
$
|
(370
|
)
|
Net interest revenue
|
$
|
—
|
|
$
|
—
|
|
$
|
—
|
|
$
|
—
|
|
$
|
—
|
|
|
The following table presents information on the hedged items in fair value hedging relationships.
|
Hedged items in fair value hedging relationships at June 30, 2018
|
Carrying amount of hedged asset or liability
|
Hedge accounting basis adjustment (decrease)
|
|||||||
|
(in millions)
|
|||||||||
|
Available-for-sale securities
|
$
|
16,308
|
|
$
|
(375
|
)
|
|||
|
Long-term debt
|
23,460
|
|
(640
|
)
|
(a)
|
||||
|
(a)
|
Includes
$14 million
of basis adjustment (reduction) on long-term debt associated with terminated hedges, whereby the long-term debt instrument has been subsequently re-designated in new hedge relationships existing as of the balance sheet date.
|
84
BNY Mellon
|
Notes to Consolidated Financial Statements
(continued)
|
The following table summarizes the notional amount and credit exposure of our total derivative portfolio at
June 30, 2018
and
Dec. 31, 2017
.
|
Impact of derivative instruments on the balance sheet
|
Notional value
|
Asset derivatives
fair value
|
Liability derivatives
fair value
|
|||||||||||||||||
|
(in millions)
|
June 30, 2018
|
|
Dec. 31, 2017
|
|
June 30, 2018
|
|
Dec. 31, 2017
|
|
June 30, 2018
|
|
Dec. 31, 2017
|
|
||||||||
|
Derivatives designated as hedging instruments:
(a)(b)
|
||||||||||||||||||||
|
Interest rate contracts
|
$
|
40,856
|
|
$
|
36,315
|
|
$
|
60
|
|
$
|
278
|
|
$
|
62
|
|
$
|
534
|
|
||
|
Foreign exchange contracts
|
7,811
|
|
8,923
|
|
253
|
|
45
|
|
13
|
|
266
|
|
||||||||
|
Total derivatives designated as hedging instruments
|
|
|
$
|
313
|
|
$
|
323
|
|
$
|
75
|
|
$
|
800
|
|
||||||
|
Derivatives not designated as hedging instruments:
(b)(c)
|
||||||||||||||||||||
|
Interest rate contracts
|
$
|
257,199
|
|
$
|
267,485
|
|
$
|
3,586
|
|
$
|
6,439
|
|
$
|
3,108
|
|
$
|
6,353
|
|
||
|
Foreign exchange contracts
|
728,861
|
|
767,999
|
|
5,082
|
|
5,104
|
|
5,612
|
|
5,067
|
|
||||||||
|
Equity contracts
|
1,142
|
|
1,698
|
|
78
|
|
70
|
|
133
|
|
149
|
|
||||||||
|
Credit contracts
|
180
|
|
180
|
|
—
|
|
—
|
|
3
|
|
4
|
|
||||||||
|
Total derivatives not designated as hedging instruments
|
$
|
8,746
|
|
$
|
11,613
|
|
$
|
8,856
|
|
$
|
11,573
|
|
||||||||
|
Total derivatives fair value
(d)
|
$
|
9,059
|
|
$
|
11,936
|
|
$
|
8,931
|
|
$
|
12,373
|
|
||||||||
|
Effect of master netting agreements
(e)
|
(5,871
|
)
|
(8,845
|
)
|
(6,370
|
)
|
(8,797
|
)
|
||||||||||||
|
Fair value after effect of master netting agreements
|
$
|
3,188
|
|
$
|
3,091
|
|
$
|
2,561
|
|
$
|
3,576
|
|
||||||||
|
(a)
|
The fair value of asset derivatives and liability derivatives designated as hedging instruments is recorded as other assets and other liabilities, respectively, on the balance sheet.
|
|
(b)
|
Pursuant to a rule change at a clearing organization in 2018, cash collateral exchanged is deemed a settlement of the derivative each day. The impact of the change reduced the gross fair value of derivative asset and liabilities and a corresponding decrease in effect of master netting agreements, with no impact to the consolidated balance sheet.
|
|
(c)
|
The fair value of asset derivatives and liability derivatives not designated as hedging instruments is recorded as trading assets and trading liabilities, respectively, on the balance sheet.
|
|
(d)
|
Fair values are on a gross basis, before consideration of master netting agreements, as required by ASC 815, Derivatives and Hedging.
|
|
(e)
|
Effect of master netting agreements includes cash collateral received and paid of
$740 million
and
$1,239 million
, respectively, at
June 30, 2018
, and
$925 million
and
$877 million
, respectively, at
Dec. 31, 2017
.
|
Trading activities (including trading derivatives)
We manage trading risk through a system of position limits, a VaR methodology based on historical simulation and other market sensitivity measures. Risk is monitored and reported to senior management by a separate unit, independent from trading, on a daily basis. Based on certain assumptions, the VaR methodology is designed to capture the potential overnight pre-tax dollar loss from adverse changes in fair values of all trading positions. The calculation assumes a
one
-day holding period, utilizes a
99%
confidence level and incorporates non-linear product characteristics. The VaR model is one of several statistical models used to develop economic capital results, which are allocated to lines of business for computing risk-adjusted performance.
VaR methodology does not evaluate risk attributable to extraordinary financial, economic or other occurrences. As a result, the risk assessment process includes a number of stress scenarios based upon the risk factors in the portfolio and management’s assessment of market conditions. Additional stress scenarios based upon historical market events are also
performed. Stress tests may incorporate the impact of reduced market liquidity and the breakdown of historically observed correlations and extreme scenarios. VaR and other statistical measures, stress testing and sensitivity analysis are incorporated in other risk management materials.
The following table presents our foreign exchange and other trading revenue.
|
Foreign exchange and other trading revenue
|
|||||||||||||||
|
(in millions)
|
2Q18
|
|
1Q18
|
|
2Q17
|
|
YTD18
|
|
YTD17
|
|
|||||
|
Foreign exchange
|
$
|
171
|
|
$
|
183
|
|
$
|
151
|
|
$
|
354
|
|
$
|
305
|
|
|
Other trading revenue
|
16
|
|
26
|
|
14
|
|
42
|
|
24
|
|
|||||
|
Total foreign exchange and other trading revenue
|
$
|
187
|
|
$
|
209
|
|
$
|
165
|
|
$
|
396
|
|
$
|
329
|
|
Foreign exchange revenue includes income from purchasing and selling foreign currencies and currency forwards, futures and options. Other trading revenue reflects results from trading in cash instruments including fixed income and equity securities and non-foreign exchange derivatives.
BNY Mellon
85
|
Notes to Consolidated Financial Statements
(continued)
|
Counterparty credit risk and collateral
We assess credit risk of our counterparties through regular examination of their financial statements, confidential communication with the management of those counterparties and regular monitoring of publicly available credit rating information. This and other information is used to develop proprietary credit rating metrics used to assess credit quality.
Collateral requirements are determined after a comprehensive review of the credit quality of each counterparty. Collateral is generally held or pledged in the form of cash and/or highly liquid government securities. Collateral requirements are monitored and adjusted daily.
Additional disclosures concerning derivative financial instruments are provided in Note 15 of the Notes to Consolidated Financial Statements.
Disclosure of contingent features in OTC derivative instruments
Certain OTC derivative contracts and/or collateral agreements contain credit-risk contingent features triggered upon a rating downgrade in which the counterparty has the right to request additional collateral or the right to terminate the contracts in a net liability position.
The following table shows the aggregate fair value of OTC derivative contracts in net liability positions that contained credit-risk contingent features and the value of collateral that has been posted.
|
(in millions)
|
June 30, 2018
|
|
Dec. 31, 2017
|
|
||
|
Aggregate fair value of OTC derivatives in net liability positions
(a)
|
$
|
2,861
|
|
$
|
2,393
|
|
|
Collateral posted
|
$
|
3,183
|
|
$
|
2,115
|
|
|
(a)
|
Before consideration of cash collateral.
|
The aggregate fair value of OTC derivative contracts containing credit-risk contingent features can fluctuate from quarter to quarter due to changes in market conditions, composition of counterparty trades, new business or changes to the contingent features.
The Bank of New York Mellon, our largest banking subsidiary, enters into the substantial majority of our OTC derivative contracts and/or collateral agreements. As such, the contingent features may be triggered if The Bank of New York Mellon’s long-term issuer rating was downgraded.
The following table shows the fair value of contracts falling under early termination provisions that were in net liability positions for three key ratings triggers.
|
Potential close-out exposures (fair value)
(a)
|
||||||
|
(in millions)
|
June 30, 2018
|
|
Dec. 31, 2017
|
|
||
|
If The Bank of New York Mellon’s rating changed to:
(b)
|
||||||
|
A3/A-
|
$
|
35
|
|
$
|
92
|
|
|
Baa2/BBB
|
$
|
282
|
|
$
|
748
|
|
|
Ba1/BB+
|
$
|
1,327
|
|
$
|
2,007
|
|
|
(a)
|
The amounts represent potential total close-out values if The Bank of New York Mellon’s long-term issuer rating were to immediately drop to the indicated levels, and do not reflect collateral posted.
|
|
(b)
|
Represents rating by Moody’s/S&P.
|
If The Bank of New York Mellon’s debt rating had fallen below investment grade on June 30, 2018 and Dec. 31, 2017, existing collateral arrangements would have required us to post additional collateral of
$115 million
and
$102 million
, respectively.
86
BNY Mellon
|
Notes to Consolidated Financial Statements
(continued)
|
The following tables present derivative instruments and financial instruments that are either subject to an enforceable netting agreement or offset by collateral arrangements. There were no derivative instruments or financial instruments subject to a legally enforceable netting agreement for which we are not currently netting.
|
Offsetting of derivative assets and financial assets at June 30, 2018
|
|||||||||||||||||||
|
Gross assets recognized
|
|
Gross amounts offset in the balance sheet
|
|
Net assets recognized in the balance sheet
|
|
Gross amounts not offset in the balance sheet
|
|||||||||||||
|
(in millions)
|
(a)
|
Financial instruments
|
|
Cash collateral received
|
|
Net amount
|
|
||||||||||||
|
Derivatives subject to netting arrangements:
|
|||||||||||||||||||
|
Interest rate contracts
|
$
|
2,783
|
|
$
|
2,322
|
|
$
|
461
|
|
$
|
157
|
|
$
|
—
|
|
$
|
304
|
|
|
|
Foreign exchange contracts
|
4,621
|
|
3,495
|
|
1,126
|
|
52
|
|
—
|
|
1,074
|
|
|||||||
|
Equity and other contracts
|
74
|
|
54
|
|
20
|
|
—
|
|
—
|
|
20
|
|
|||||||
|
Total derivatives subject to netting arrangements
|
7,478
|
|
5,871
|
|
1,607
|
|
209
|
|
—
|
|
1,398
|
|
|||||||
|
Total derivatives not subject to netting arrangements
|
1,581
|
|
—
|
|
1,581
|
|
—
|
|
—
|
|
1,581
|
|
|||||||
|
Total derivatives
|
9,059
|
|
5,871
|
|
3,188
|
|
209
|
|
—
|
|
2,979
|
|
|||||||
|
Reverse repurchase agreements
|
51,949
|
|
36,766
|
|
(b)
|
15,183
|
|
15,142
|
|
—
|
|
41
|
|
||||||
|
Securities borrowing
|
11,303
|
|
—
|
|
11,303
|
|
10,974
|
|
—
|
|
329
|
|
|||||||
|
Total
|
$
|
72,311
|
|
$
|
42,637
|
|
$
|
29,674
|
|
$
|
26,325
|
|
$
|
—
|
|
$
|
3,349
|
|
|
|
Offsetting of derivative assets and financial assets at Dec. 31, 2017
|
|||||||||||||||||||
|
Gross assets recognized
|
|
Gross amounts offset in the balance sheet
|
|
Net assets recognized
in the
balance sheet
|
|
Gross amounts not offset in the balance sheet
|
|||||||||||||
|
(in millions)
|
(a)
|
Financial instruments
|
|
Cash collateral received
|
|
Net amount
|
|
||||||||||||
|
Derivatives subject to netting arrangements:
|
|||||||||||||||||||
|
Interest rate contracts
|
$
|
5,915
|
|
$
|
5,075
|
|
$
|
840
|
|
$
|
178
|
|
$
|
—
|
|
$
|
662
|
|
|
|
Foreign exchange contracts
|
4,666
|
|
3,720
|
|
946
|
|
116
|
|
—
|
|
830
|
|
|||||||
|
Equity and other contracts
|
67
|
|
50
|
|
17
|
|
—
|
|
—
|
|
17
|
|
|||||||
|
Total derivatives subject to netting arrangements
|
10,648
|
|
8,845
|
|
1,803
|
|
294
|
|
—
|
|
1,509
|
|
|||||||
|
Total derivatives not subject to netting arrangements
|
1,288
|
|
—
|
|
1,288
|
|
—
|
|
—
|
|
1,288
|
|
|||||||
|
Total derivatives
|
11,936
|
|
8,845
|
|
3,091
|
|
294
|
|
—
|
|
2,797
|
|
|||||||
|
Reverse repurchase agreements
|
42,784
|
|
25,848
|
|
(b)
|
16,936
|
|
16,923
|
|
—
|
|
13
|
|
||||||
|
Securities borrowing
|
11,199
|
|
—
|
|
11,199
|
|
10,858
|
|
—
|
|
341
|
|
|||||||
|
Total
|
$
|
65,919
|
|
$
|
34,693
|
|
$
|
31,226
|
|
$
|
28,075
|
|
$
|
—
|
|
$
|
3,151
|
|
|
|
(a)
|
Includes the effect of netting agreements and net cash collateral received. The offset related to the OTC derivatives was allocated to the various types of derivatives based on the net positions.
|
|
(b)
|
Offsetting of reverse repurchase agreements relates to our involvement in the Fixed Income Clearing Corporation, where we settle government securities transactions on a net basis for payment and delivery through the Fedwire system.
|
|
Offsetting of derivative liabilities and financial liabilities at June 30, 2018
|
Net liabilities recognized in the balance sheet
|
|
|||||||||||||||||
|
Gross liabilities recognized
|
|
Gross amounts offset in the balance sheet
|
|
Gross amounts not offset in the balance sheet
|
|||||||||||||||
|
(in millions)
|
(a)
|
Financial instruments
|
|
Cash collateral pledged
|
|
Net amount
|
|
||||||||||||
|
Derivatives subject to netting arrangements:
|
|||||||||||||||||||
|
Interest rate contracts
|
$
|
3,114
|
|
$
|
2,428
|
|
$
|
686
|
|
$
|
610
|
|
$
|
—
|
|
$
|
76
|
|
|
|
Foreign exchange contracts
|
5,026
|
|
3,862
|
|
1,164
|
|
351
|
|
—
|
|
813
|
|
|||||||
|
Equity and other contracts
|
125
|
|
80
|
|
45
|
|
44
|
|
—
|
|
1
|
|
|||||||
|
Total derivatives subject to netting arrangements
|
8,265
|
|
6,370
|
|
1,895
|
|
1,005
|
|
—
|
|
890
|
|
|||||||
|
Total derivatives not subject to netting arrangements
|
666
|
|
—
|
|
666
|
|
—
|
|
—
|
|
666
|
|
|||||||
|
Total derivatives
|
8,931
|
|
6,370
|
|
2,561
|
|
1,005
|
|
—
|
|
1,556
|
|
|||||||
|
Repurchase agreements
|
45,316
|
|
36,766
|
|
(b)
|
8,550
|
|
8,550
|
|
—
|
|
—
|
|
||||||
|
Securities lending
|
1,706
|
|
—
|
|
1,706
|
|
1,627
|
|
—
|
|
79
|
|
|||||||
|
Total
|
$
|
55,953
|
|
$
|
43,136
|
|
$
|
12,817
|
|
$
|
11,182
|
|
$
|
—
|
|
$
|
1,635
|
|
|
BNY Mellon
87
|
Notes to Consolidated Financial Statements
(continued)
|
|
Offsetting of derivative liabilities and financial liabilities at Dec. 31, 2017
|
Net liabilities recognized
in the
balance sheet
|
|
|||||||||||||||||
|
Gross liabilities recognized
|
|
Gross amounts offset in the balance sheet
|
|
Gross amounts not offset in the balance sheet
|
|||||||||||||||
|
(in millions)
|
(a)
|
Financial instruments
|
|
Cash collateral pledged
|
|
Net amount
|
|
||||||||||||
|
Derivatives subject to netting arrangements:
|
|||||||||||||||||||
|
Interest rate contracts
|
$
|
6,810
|
|
$
|
5,495
|
|
$
|
1,315
|
|
$
|
1,222
|
|
$
|
—
|
|
$
|
93
|
|
|
|
Foreign exchange contracts
|
4,765
|
|
3,221
|
|
1,544
|
|
177
|
|
—
|
|
1,367
|
|
|||||||
|
Equity and other contracts
|
143
|
|
81
|
|
62
|
|
58
|
|
—
|
|
4
|
|
|||||||
|
Total derivatives subject to netting arrangements
|
11,718
|
|
8,797
|
|
2,921
|
|
1,457
|
|
—
|
|
1,464
|
|
|||||||
|
Total derivatives not subject to netting arrangements
|
655
|
|
—
|
|
655
|
|
—
|
|
—
|
|
655
|
|
|||||||
|
Total derivatives
|
12,373
|
|
8,797
|
|
3,576
|
|
1,457
|
|
—
|
|
2,119
|
|
|||||||
|
Repurchase agreements
|
33,908
|
|
25,848
|
|
(b)
|
8,060
|
|
8,059
|
|
—
|
|
1
|
|
||||||
|
Securities lending
|
2,186
|
|
—
|
|
2,186
|
|
2,091
|
|
—
|
|
95
|
|
|||||||
|
Total
|
$
|
48,467
|
|
$
|
34,645
|
|
$
|
13,822
|
|
$
|
11,607
|
|
$
|
—
|
|
$
|
2,215
|
|
|
|
(a)
|
Includes the effect of netting agreements and net cash collateral paid. The offset related to the OTC derivatives was allocated to the various types of derivatives based on the net positions.
|
|
(b)
|
Offsetting of repurchase agreements relates to our involvement in the Fixed Income Clearing Corporation, where we settle government securities transactions on a net basis for payment and delivery through the Fedwire system.
|
Secured borrowings
The following table presents the contract value of repurchase agreements and securities lending transactions accounted for as secured borrowings by the type of collateral provided to counterparties.
|
Repurchase agreements and securities lending transactions accounted for as secured borrowings
|
|||||||||||||||||||||||||
|
June 30, 2018
|
Dec. 31, 2017
|
||||||||||||||||||||||||
|
Remaining contractual maturity
|
Total
|
|
Remaining contractual maturity
|
Total
|
|
||||||||||||||||||||
|
(in millions)
|
Overnight and continuous
|
|
Up to 30 days
|
|
30 days or more
|
|
Overnight and continuous
|
|
Up to 30 days
|
|
30 days or more
|
|
|||||||||||||
|
Repurchase agreements:
|
|||||||||||||||||||||||||
|
U.S. Treasury
|
$
|
37,761
|
|
$
|
1
|
|
$
|
—
|
|
$
|
37,762
|
|
$
|
26,883
|
|
$
|
11
|
|
$
|
—
|
|
$
|
26,894
|
|
|
|
U.S. government agencies
|
493
|
|
113
|
|
—
|
|
606
|
|
570
|
|
180
|
|
—
|
|
750
|
|
|||||||||
|
Agency RMBS
|
2,503
|
|
186
|
|
18
|
|
2,707
|
|
2,574
|
|
109
|
|
—
|
|
2,683
|
|
|||||||||
|
Corporate bonds
|
716
|
|
—
|
|
1,368
|
|
2,084
|
|
373
|
|
—
|
|
1,052
|
|
1,425
|
|
|||||||||
|
Other debt securities
|
315
|
|
—
|
|
913
|
|
1,228
|
|
253
|
|
—
|
|
731
|
|
984
|
|
|||||||||
|
Equity securities
|
428
|
|
—
|
|
501
|
|
929
|
|
655
|
|
—
|
|
517
|
|
1,172
|
|
|||||||||
|
Total
|
$
|
42,216
|
|
$
|
300
|
|
$
|
2,800
|
|
$
|
45,316
|
|
$
|
31,308
|
|
$
|
300
|
|
$
|
2,300
|
|
$
|
33,908
|
|
|
|
Securities lending:
|
|||||||||||||||||||||||||
|
U.S. government agencies
|
$
|
39
|
|
$
|
—
|
|
$
|
—
|
|
$
|
39
|
|
$
|
72
|
|
$
|
—
|
|
$
|
—
|
|
$
|
72
|
|
|
|
Other debt securities
|
434
|
|
—
|
|
—
|
|
434
|
|
316
|
|
—
|
|
—
|
|
316
|
|
|||||||||
|
Equity securities
|
1,233
|
|
—
|
|
—
|
|
1,233
|
|
1,798
|
|
—
|
|
—
|
|
1,798
|
|
|||||||||
|
Total
|
$
|
1,706
|
|
$
|
—
|
|
$
|
—
|
|
$
|
1,706
|
|
$
|
2,186
|
|
$
|
—
|
|
$
|
—
|
|
$
|
2,186
|
|
|
|
Total borrowings
|
$
|
43,922
|
|
$
|
300
|
|
$
|
2,800
|
|
$
|
47,022
|
|
$
|
33,494
|
|
$
|
300
|
|
$
|
2,300
|
|
$
|
36,094
|
|
|
BNY Mellon’s repurchase agreements and securities lending transactions primarily encounter risk associated with liquidity. We are required to pledge collateral based on predetermined terms within the agreements. If we were to experience a decline in the fair value of the collateral pledged for these transactions, we could be required to provide
additional collateral to the counterparty, therefore decreasing the amount of assets available for other liquidity needs that may arise. BNY Mellon also offers tri-party collateral agency services in the tri-party repo market where we are exposed to credit risk. In order to mitigate this risk, we require dealers to fully secure intraday credit.
88
BNY Mellon
|
Notes to Consolidated Financial Statements
(continued)
|
Note 18–Commitments and contingent liabilities
Off-balance sheet arrangements
In the normal course of business, various commitments and contingent liabilities are outstanding that are not reflected in the accompanying consolidated balance sheets.
Our significant trading and off-balance sheet risks are securities, foreign currency and interest rate risk management products, commercial lending commitments, letters of credit and securities lending indemnifications. We assume these risks to reduce interest rate and foreign currency risks, to provide customers with the ability to meet credit and liquidity needs and to hedge foreign currency and interest rate risks. These items involve, to varying degrees, credit, foreign currency and interest rate risks not recognized on the balance sheet. Our off-balance sheet risks are managed and monitored in manners similar to those used for on-balance sheet risks.
The following table presents a summary of our off-balance sheet credit risks.
|
Off-balance sheet credit risks
|
June 30, 2018
|
|
Dec. 31, 2017
|
|
||
|
(in millions)
|
||||||
|
Lending commitments
|
$
|
49,633
|
|
$
|
51,467
|
|
|
Standby letters of credit
(a)
|
3,055
|
|
3,531
|
|
||
|
Commercial letters of credit
|
114
|
|
122
|
|
||
|
Securities lending indemnifications
(b)(c)
|
465,013
|
|
432,084
|
|
||
|
(a)
|
Net of participations totaling
$581 million
at
June 30, 2018
and
$672 million
at
Dec. 31, 2017
.
|
|
(b)
|
Excludes the
indemnification for securities for which BNY Mellon acts as an agent on behalf of CIBC Mellon clients,
which totaled
$68 billion
at
June 30, 2018
and
$69 billion
at
Dec. 31, 2017
.
|
|
(c)
|
Includes cash collateral, invested in indemnified repurchase agreements, held by us as securities lending agent of
$40 billion
at
June 30, 2018
and
$33 billion
at
Dec. 31, 2017
.
|
The total potential loss on undrawn lending commitments, standby and commercial letters of credit, and securities lending indemnifications is equal to the total notional amount if drawn upon, which does not consider the value of any collateral.
Since many of the lending commitments are expected to expire without being drawn upon, the total amount does not necessarily represent future cash requirements. A summary of lending commitment maturities is as follows:
$28.9 billion
in less than one
year,
$20.6 billion
in one to five years and
$123 million
over five years.
SBLCs principally support obligations of corporate clients and were collateralized with cash and securities of
$138 million
at
June 30, 2018
and
$160 million
at
Dec. 31, 2017
. At
June 30, 2018
,
$2.2 billion
of the SBLCs will expire within one year and
$889 million
in one to five years.
We must recognize, at the inception of an SBLC and foreign and other guarantees, a liability for the fair value of the obligation undertaken in issuing the guarantee. The fair value of the liability, which was recorded with a corresponding asset in other assets, was estimated as the present value of contractual customer fees. The estimated liability for losses related to SBLCs and foreign and other guarantees, if any, is included in the allowance for lending-related commitments. The allowance for lending-related commitments was
$109 million
at
June 30, 2018
and
$102 million
at
Dec. 31, 2017
.
Payment/performance risk of SBLCs is monitored using both historical performance and internal ratings criteria. BNY Mellon’s historical experience is that SBLCs typically expire without being funded. SBLCs below investment grade are monitored closely for payment/performance risk. The table below shows SBLCs by investment grade:
|
Standby letters of credit
|
June 30, 2018
|
|
Dec. 31, 2017
|
|
|
|
||||
|
Investment grade
|
87
|
%
|
84
|
%
|
|
Non-investment grade
|
13
|
%
|
16
|
%
|
A commercial letter of credit is normally a short-term instrument used to finance a commercial contract for the shipment of goods from a seller to a buyer. Although the commercial letter of credit is contingent upon the satisfaction of specified conditions, it represents a credit exposure if the buyer defaults on the underlying transaction. As a result, the total contractual amounts do not necessarily represent future cash requirements. Commercial letters of credit totaled
$114 million
at
June 30, 2018
and
$122 million
at
Dec. 31, 2017
.
We expect many of the lending commitments and letters of credit to expire without the need to advance any cash. The revenue associated with guarantees frequently depends on the credit rating of the obligor
BNY Mellon
89
|
Notes to Consolidated Financial Statements
(continued)
|
and the structure of the transaction, including collateral, if any.
A securities lending transaction is a fully collateralized transaction in which the owner of a security agrees to lend the security (typically through an agent, in our case, The Bank of New York Mellon), to a borrower, usually a broker-dealer or bank, on an open, overnight or term basis, under the terms of a prearranged contract.
We typically lend securities with indemnification against borrower default. We generally require the borrower to provide collateral with a minimum value of
102%
of the fair value of the securities borrowed, which is monitored on a daily basis, thus reducing credit risk. Market risk can also arise in securities lending transactions. These risks are controlled through policies limiting the level of risk that can be undertaken. Securities lending transactions are generally entered into only with highly rated counterparties.
Securities lending indemnifications were secured by collateral of
$487 billion
at
June 30, 2018
and
$451 billion
at
Dec. 31, 2017
.
CIBC Mellon, a joint venture between BNY Mellon and the Canadian Imperial Bank of Commerce (“CIBC”), engages in securities lending activities. CIBC Mellon, BNY Mellon and CIBC jointly and severally indemnify securities lenders against specific types of borrower default. At
June 30, 2018
and
Dec. 31, 2017
,
$68 billion
and
$69 billion
, respectively,
of borrowings at CIBC Mellon, for which BNY Mellon acts as agent on behalf of CIBC Mellon clients, were secured by collateral of
$72 billion
and
$73 billion
, respectively.
If, upon a default, a borrower’s collateral was not sufficient to cover its related obligations, certain losses related to the indemnification could be covered by the indemnitors.
Industry concentrations
We have significant industry concentrations related to credit exposure at
June 30, 2018
. The tables below present our credit exposure in the financial institutions and commercial portfolios.
|
Financial institutions
portfolio exposure
(in billions)
|
June 30, 2018
|
||||||||
|
Loans
|
|
Unfunded
commitments
|
|
Total
exposure
|
|
||||
|
Securities industry
|
$
|
3.4
|
|
$
|
18.8
|
|
$
|
22.2
|
|
|
Asset managers
|
1.4
|
|
6.3
|
|
7.7
|
|
|||
|
Banks
|
6.0
|
|
1.2
|
|
7.2
|
|
|||
|
Insurance
|
0.1
|
|
3.3
|
|
3.4
|
|
|||
|
Government
|
0.1
|
|
0.7
|
|
0.8
|
|
|||
|
Other
|
0.8
|
|
1.3
|
|
2.1
|
|
|||
|
Total
|
$
|
11.8
|
|
$
|
31.6
|
|
$
|
43.4
|
|
|
Commercial portfolio
exposure
(in billions)
|
June 30, 2018
|
||||||||
|
Loans
|
|
Unfunded
commitments
|
|
Total
exposure
|
|
||||
|
Manufacturing
|
$
|
1.2
|
|
$
|
5.4
|
|
$
|
6.6
|
|
|
Services and other
|
0.7
|
|
5.5
|
|
6.2
|
|
|||
|
Energy and utilities
|
0.4
|
|
4.6
|
|
5.0
|
|
|||
|
Media and telecom
|
0.2
|
|
1.1
|
|
1.3
|
|
|||
|
Total
|
$
|
2.5
|
|
$
|
16.6
|
|
$
|
19.1
|
|
Major concentrations in securities lending are primarily to broker-dealers and are generally collateralized with cash and/or securities.
Exposure for certain administrative errors
In connection with certain offshore tax-exempt funds that we manage, we may be liable to the funds for certain administrative errors. The errors relate to the resident status of such funds, potentially exposing the Company to a tax liability related to the funds’ earnings. The Company is in discussions with tax authorities regarding the funds. We believe we are appropriately accrued and the additional reasonably possible exposure is not significant.
Indemnification arrangements
We have provided standard representations for underwriting agreements, acquisition and divestiture agreements, sales of loans and commitments, and other similar types of arrangements and customary indemnification for claims and legal proceedings
related to providing financial services that are not otherwise included above. Insurance has been purchased to mitigate certain of these risks. Generally, there are no stated or notional amounts included in these indemnifications and the contingencies triggering the obligation for indemnification are not expected to occur. Furthermore, often counterparties to these transactions provide us with comparable indemnifications. We are unable to develop an estimate of the maximum payout under these
90
BNY Mellon
|
Notes to Consolidated Financial Statements
(continued)
|
indemnifications for several reasons. In addition to the lack of a stated or notional amount in a majority of such indemnifications, we are unable to predict the nature of events that would trigger indemnification or the level of indemnification for a certain event. We believe, however, that the possibility that we will have to make any material payments for these indemnifications is remote. At
June 30, 2018
and
Dec. 31, 2017
, we have not recorded any material liabilities under these arrangements.
Clearing and settlement exchanges
We are a noncontrolling equity investor in, and/or member of, several industry clearing or settlement exchanges through which foreign exchange, securities, derivatives or other transactions settle. Certain of these industry clearing and settlement exchanges require their members to guarantee their obligations and liabilities and/or to provide liquidity support in the event other members do not honor their obligations. We believe the likelihood that a clearing or settlement exchange (of which we are a member) would become insolvent is remote. Additionally, certain settlement exchanges have implemented loss allocation policies that enable the exchange to allocate settlement losses to the members of the exchange. It is not possible to quantify such mark-to-market loss until the loss occurs. Any ancillary costs that occur as a result of any mark-to-market loss cannot be quantified.
In addition, we also sponsor clients as members on clearing and settlement exchanges and guarantee their obligations.
At
June 30, 2018
and
Dec. 31, 2017
, we have not recorded any material liabilities under these arrangements.
Legal proceedings
In the ordinary course of business, BNY Mellon and its subsidiaries are routinely named as defendants in or made parties to pending and potential legal actions. We also are subject to governmental and regulatory examinations, information-gathering requests, investigations and proceedings (both formal and informal). Claims for significant monetary damages are often asserted in many of these legal actions, while claims for disgorgement, restitution, penalties and/or other remedial actions or sanctions may be sought in governmental and regulatory matters. It is inherently difficult to predict the eventual outcomes of such matters given their complexity and the particular facts and circumstances at issue in each of
these matters. However, on the basis of our current knowledge and understanding, we do not believe that judgments, settlements or orders, if any, arising from these matters (either individually or in the aggregate, after giving effect to applicable reserves and insurance coverage) will have a material adverse effect on the consolidated financial position or liquidity of BNY Mellon, although they could have a material effect on net income in a given period.
In view of the inherent unpredictability of outcomes in litigation and governmental and regulatory matters, particularly where (i) the damages sought are substantial or indeterminate, (ii) the proceedings are in the early stages, or (iii) the matters involve novel legal theories or a large number of parties, as a matter of course there is considerable uncertainty surrounding the timing or ultimate resolution of litigation and governmental and regulatory matters, including a possible eventual loss, fine, penalty or business impact, if any, associated with each such matter. In accordance with applicable accounting guidance, BNY Mellon establishes accruals for litigation and governmental and regulatory matters when those matters proceed to a stage where they present loss contingencies that are both probable and reasonably estimable. In such cases, there may be a possible exposure to loss in excess of any amounts accrued. BNY Mellon will continue to monitor such matters for developments that could affect the amount of the accrual, and will adjust the accrual amount as appropriate. If the loss contingency in question is not both probable and reasonably estimable, BNY Mellon does not establish an accrual and the matter will continue to be monitored for any developments that would make the loss contingency both probable and reasonably estimable. BNY Mellon believes that its accruals for legal proceedings are appropriate and, in the aggregate, are not material to the consolidated financial position of BNY Mellon, although future accruals could have a material effect on net income in a given period.
For certain of those matters described here for which a loss contingency may, in the future, be reasonably possible (whether in excess of a related accrued liability or where there is no accrued liability), BNY Mellon is currently unable to estimate a range of reasonably possible loss.
For those matters described here where BNY Mellon is able to estimate a reasonably possible loss, the aggregate range of such reasonably possible loss is up to
$940 million
in
BNY Mellon
91
|
Notes to Consolidated Financial Statements
(continued)
|
excess of the accrued liability (if any) related to those matters.
The following describes certain judicial, regulatory and arbitration proceedings involving BNY Mellon:
Mortgage-Securitization Trusts Proceedings
The Bank of New York Mellon has been named as a defendant in a number of legal actions brought by MBS investors alleging that the trustee has expansive duties under the governing agreements, including the duty to investigate and pursue breach of representation and warranty claims against other parties to the MBS transactions. These actions include a lawsuit brought in New York State court on June 18, 2014, and later re-filed in federal court, by a group of institutional investors who purport to sue on behalf of
249
MBS trusts.
Matters Related to R. Allen Stanford
In late December 2005, Pershing LLC (“Pershing”) became a clearing firm for Stanford Group Co. (“SGC”), a registered broker-dealer that was part of a group of entities ultimately controlled by R. Allen Stanford (“Stanford”). Stanford International Bank (“SIB”), also controlled by Stanford, issued certificates of deposit (“CDs”). Some investors allegedly wired funds from their SGC accounts to purchase CDs. In 2009, the SEC charged Stanford with operating a Ponzi scheme in connection with the sale of CDs, and SGC was placed into receivership. Alleged purchasers of CDs have filed
15
lawsuits against Pershing that are pending in Texas, including
two
putative class actions. The purchasers allege that Pershing, as SGC’s clearing firm, assisted Stanford in a fraudulent scheme and assert contractual, statutory and common law claims. On July 12, 2018, a federal district court dismissed
six
of the individual lawsuits. A series of FINRA arbitration proceedings also have been initiated by alleged purchasers asserting similar claims.
Brazilian Postalis Litigation
BNY Mellon Servicos Financeiros DTVM S.A. (“DTVM”), a subsidiary that provides a number of asset services in Brazil, acts as administrator for certain investment funds in which the exclusive investor is a public pension fund for postal workers called Postalis-Instituto de Seguridade Social dos Correios e Telégrafos (“Postalis”). On Aug. 22, 2014, Postalis sued DTVM in Rio de Janeiro, Brazil for losses related to a Postalis investment fund for which DTVM serves as fund administrator. Postalis alleges
that DTVM failed to properly perform alleged duties, including duties to conduct due diligence of and exert control over the fund manager, Atlântica Administração de Recursos (“Atlântica”), and Atlântica’s investments. On March 12, 2015, Postalis filed a lawsuit in Rio de Janeiro against DTVM and BNY Mellon Administração de Ativos Ltda. (“Ativos”) alleging failure to properly perform alleged duties relating to another fund of which DTVM is administrator and Ativos is investment manager. On Dec. 14, 2015, Associacão dos Profissionais dos Correiros (“ADCAP”), a Brazilian postal workers association, filed a lawsuit in São Paulo against DTVM and other defendants alleging that DTVM improperly contributed to investment losses in the Postalis portfolio. On March 20, 2017, the lawsuit was dismissed without prejudice, and ADCAP has appealed that decision. On Dec. 17, 2015, Postalis filed
three
additional lawsuits in Rio de Janeiro against DTVM and Ativos alleging failure to properly perform alleged duties and liabilities for losses with respect to investments in several other funds. On Feb. 4, 2016, Postalis filed another lawsuit in Brasilia against DTVM, Ativos and BNY Mellon Alocação de Patrimônio Ltda., an investment management subsidiary, alleging failure to properly perform duties and liability for losses with respect to investments in various other funds of which the defendants were administrator and/or manager. The lawsuit was transferred to São Paulo and then returned to Brasilia. On Jan. 16, 2018, the Brazilian Federal Prosecution Service (“MPF”) filed a civil lawsuit in São Paulo against DTVM alleging liability for Postalis losses based on alleged failures by DTVM to properly perform certain duties while acting as administrator to certain funds in which Postalis invested or controller of Postalis’s own investment portfolio. On April 18, 2018, the court dismissed the lawsuit without prejudice, and the MPF has appealed that decision.
Depositary Receipt Litigation
Between late December 2015 and February 2016,
four
putative class action lawsuits were filed against BNY Mellon asserting claims relating to BNY Mellon’s foreign exchange pricing when converting dividends and other distributions from non-U.S. companies in its role as depositary bank to Depositary Receipt issuers. The claims are for breach of contract and violations of ERISA. The lawsuits have been consolidated into
two
suits that are pending in federal court in the Southern District of New York.
92
BNY Mellon
|
Notes to Consolidated Financial Statements
(continued)
|
Brazilian Silverado Litigation
DTVM acts as administrator for the Fundo de Investimento em Direitos Creditórios Multisetorial Silverado Maximum (“Silverado Maximum Fund”), which invests in commercial credit receivables. On June 2, 2016, the Silverado Maximum Fund sued DTVM in its capacity as administrator, along with Deutsche Bank S.A. - Banco Alemão in its capacity as custodian and Silverado Gestão e Investimentos Ltda. in its capacity as investment manager. The Fund alleges that each of the defendants failed to fulfill its respective duty, and caused losses to the Fund for which the defendants are jointly and severally liable.
Depositary Receipt Pre-Release Inquiry
In March 2014, the Staff of the U.S. Securities and Exchange Commission’s Enforcement Division (the “Staff”) commenced an investigation into certain issuers of American Depositary Receipts (“ADRs”), including BNY Mellon, for the period of 2011 to 2015. The Staff has issued several requests to BNY Mellon for information relating to the pre-release of ADRs. In May 2017, BNY Mellon began discussions with the Staff about a possible resolution of the investigation. BNY Mellon has fully cooperated with this matter and negotiations are ongoing.
Note 19–Lines of business
We have an internal information system that produces performance data along product and service lines for our
two
principal businesses and the Other segment.
Business accounting principles
Our business data has been determined on an internal management basis of accounting, rather than the generally accepted accounting principles used for consolidated financial reporting. These measurement principles are designed so that reported results of the businesses will track their economic performance.
Business results are subject to reclassification when organizational changes are made. There were no significant organizational changes in the second
quarter of 2018
. The results are also subject to refinements in revenue and expense allocation methodologies, which are typically reflected on a prospective basis.
The accounting policies of the businesses are the same as those described in Note 1 of the Notes to Consolidated Financial Statements in our 2017 Annual Report.
BNY Mellon
93
|
Notes to Consolidated Financial Statements
(continued)
|
The primary products and services and types of revenue for our
two
principal businesses and a description of the Other segment are presented below.
|
Investment Services business
|
||||
|
Line of business
|
Primary products and services
|
Primary types of revenue
|
||
|
Asset Servicing
|
Custody, accounting, ETF services, middle-office solutions, transfer agency, services for private equity and real estate funds, foreign exchange, securities lending, liquidity/lending services, prime brokerage and data analytics
|
- Asset servicing fees (includes securities lending revenue)
- Foreign exchange revenue
- Net interest revenue
- Financing-related fees
|
||
|
Pershing
|
Clearing and custody, investment, wealth and retirement solutions, technology and enterprise data management, trading services and prime brokerage
|
- Clearing services fees
- Net interest revenue |
||
|
Issuer Services
|
Corporate Trust (trustee, administration and agency services and reporting and transparency) and Depositary Receipts (issuer services and support for brokers and investors)
|
- Issuer services fees
- Net interest revenue
- Foreign exchange revenue
|
||
|
Treasury Services
|
Integrated cash management solutions including payments, foreign exchange, liquidity management, receivables processing and payables management and trade finance and processing
|
- Treasury services fees
- Net interest revenue |
||
|
Clearance and Collateral Management
|
U.S. government clearing, global collateral management and tri-party repo
|
- Asset servicing fees
- Net interest revenue
|
||
|
Investment Management business
|
||||
|
Line of business
|
Primary products and services
|
Primary types of revenue
|
||
|
Asset Management
|
Diversified investment management strategies and distribution of investment products
|
- Investment management fees
- Performance fees - Distribution and servicing fees |
||
|
Wealth Management
|
Investment management, custody, wealth and estate planning and private banking services
|
- Investment management fees
- Net interest revenue |
||
|
Other segment
|
Description
|
Primary types of revenue
|
||
|
Includes leasing portfolio, corporate treasury activities, including our securities portfolio, derivatives and other trading activity, corporate and bank-owned life insurance, renewable energy investments and business exits
|
- Net interest revenue
- Investment and other income
- Net gain (loss) on securities
- Other trading revenue
|
|||
94
BNY Mellon
|
Notes to Consolidated Financial Statements
(continued)
|
The results of our businesses are presented and analyzed on an internal management reporting basis.
|
•
|
Revenue amounts reflect fee and other revenue generated by each business. Fee and other revenue transferred between businesses under revenue transfer agreements is included within other revenue in each business.
|
|
•
|
Revenues and expenses associated with specific client bases are included in those businesses. For example, foreign exchange activity associated with clients using custody products is included in Investment Services.
|
|
•
|
Net interest revenue is allocated to businesses based on the yields on the assets and liabilities generated by each business. We employ a funds transfer pricing system that matches funds with the specific assets and liabilities of each business based on their interest sensitivity and maturity characteristics.
|
|
•
|
The provision for credit losses associated with the respective credit portfolios is reflected in each business segment.
|
|
•
|
Incentives expense related to restricted stock is allocated to the businesses.
|
|
•
|
Support and other indirect expenses are allocated to businesses based on internally developed methodologies.
|
|
•
|
Recurring FDIC expense is allocated to the businesses based on average deposits generated within each business.
|
|
•
|
Litigation expense is generally recorded in the business in which the charge occurs.
|
|
•
|
Management of the securities portfolio is a shared service contained in the Other segment. As a result, gains and losses associated with the valuation of the securities portfolio are included in the Other segment.
|
|
•
|
Client deposits serve as the primary funding source for our securities portfolio. We typically allocate all interest revenue to the businesses generating the deposits. Accordingly, accretion related to the portion of the securities portfolio restructured in 2009 has been included in the results of the businesses.
|
|
•
|
Balance sheet assets and liabilities and their related income or expense are specifically assigned to each business. Businesses with a net liability position have been allocated assets.
|
|
•
|
Goodwill and intangible assets are reflected within individual businesses.
|
The following consolidating schedules present the contribution of our businesses to our overall profitability.
|
For the quarter ended June 30, 2018
|
Investment
Services |
|
Investment
Management |
|
Other
|
|
Consolidated
|
|
||||||||
|
(dollars in millions)
|
||||||||||||||||
|
Total fee and other revenue
|
$
|
2,233
|
|
$
|
941
|
|
(a)
|
$
|
41
|
|
$
|
3,215
|
|
(a)
|
||
|
Net interest revenue (expense)
|
874
|
|
77
|
|
(35
|
)
|
916
|
|
||||||||
|
Total revenue
|
3,107
|
|
1,018
|
|
(a)
|
6
|
|
4,131
|
|
(a)
|
||||||
|
Provision for credit losses
|
1
|
|
2
|
|
(6
|
)
|
(3
|
)
|
||||||||
|
Noninterest expense
|
1,967
|
|
697
|
|
81
|
|
2,745
|
|
(b)
|
|||||||
|
Income (loss) before taxes
|
$
|
1,139
|
|
$
|
319
|
|
(a)
|
$
|
(69
|
)
|
$
|
1,389
|
|
(a)(b)
|
||
|
Pre-tax operating margin
(c)
|
37
|
%
|
31
|
%
|
N/M
|
|
34
|
%
|
||||||||
|
Average assets
|
$
|
264,387
|
|
$
|
31,504
|
|
$
|
50,437
|
|
$
|
346,328
|
|
||||
|
(a)
|
Both total fee and other revenue and total revenue include net income from consolidated investment management funds of
$5 million
, representing
$12 million
of income and noncontrolling interests of
$7 million
. Income before taxes is net of noncontrolling interests of
$7 million
.
|
|
(b)
|
Noninterest expense includes a loss attributable to noncontrolling interests of
$2 million
related to other consolidated subsidiaries.
|
|
(c)
|
Income before taxes divided by total revenue.
|
N/M - Not meaningful.
BNY Mellon
95
|
Notes to Consolidated Financial Statements
(continued)
|
|
For the quarter ended March 31, 2018
|
Investment
Services |
|
Investment
Management |
|
Other
|
|
Consolidated
|
|
||||||||
|
(dollars in millions)
|
||||||||||||||||
|
Total fee and other revenue
|
$
|
2,250
|
|
$
|
1,012
|
|
(a)
|
$
|
8
|
|
$
|
3,270
|
|
(a)
|
||
|
Net interest revenue (expense)
|
844
|
|
76
|
|
(1
|
)
|
919
|
|
||||||||
|
Total revenue
|
3,094
|
|
1,088
|
|
(a)
|
7
|
|
4,189
|
|
(a)
|
||||||
|
Provision for credit losses
|
(7
|
)
|
2
|
|
—
|
|
(5
|
)
|
||||||||
|
Noninterest expense
|
1,949
|
|
705
|
|
87
|
|
2,741
|
|
(b)
|
|||||||
|
Income (loss) before taxes
|
$
|
1,152
|
|
$
|
381
|
|
(a)
|
$
|
(80
|
)
|
$
|
1,453
|
|
(a)(b)
|
||
|
Pre-tax operating margin
(c)
|
37
|
%
|
35
|
%
|
N/M
|
|
35
|
%
|
||||||||
|
Average assets
|
$
|
278,095
|
|
$
|
31,963
|
|
$
|
48,117
|
|
$
|
358,175
|
|
||||
|
(a)
|
Both total fee and other revenue and total revenue include net income from consolidated investment management funds of less than
$1 million
, representing
$11 million
of losses and a loss attributable to noncontrolling interests of
$11 million
. Income before taxes is net of a loss attributable to noncontrolling interests of
$11 million
.
|
|
(b)
|
Noninterest expense includes income attributable to noncontrolling interests of
$2 million
related to other consolidated subsidiaries.
|
|
(c)
|
Income before taxes divided by total revenue.
|
N/M - Not meaningful.
|
For the quarter ended June 30, 2017
|
Investment
Services |
|
Investment
Management |
|
Other
|
|
Consolidated
|
|
||||||||
|
(dollars in millions)
|
||||||||||||||||
|
Total fee and other revenue
|
$
|
2,115
|
|
$
|
899
|
|
(a)
|
$
|
113
|
|
$
|
3,127
|
|
(a)
|
||
|
Net interest revenue (expense)
|
761
|
|
87
|
|
(22
|
)
|
826
|
|
||||||||
|
Total revenue
|
2,876
|
|
986
|
|
(a)
|
91
|
|
3,953
|
|
(a)
|
||||||
|
Provision for credit losses
|
(3
|
)
|
—
|
|
(4
|
)
|
(7
|
)
|
||||||||
|
Noninterest expense
|
1,927
|
|
698
|
|
28
|
|
2,653
|
|
(b)
|
|||||||
|
Income before taxes
|
$
|
952
|
|
$
|
288
|
|
(a)
|
$
|
67
|
|
$
|
1,307
|
|
(a)(b)
|
||
|
Pre-tax operating margin
(c)
|
33
|
%
|
29
|
%
|
N/M
|
|
33
|
%
|
||||||||
|
Average assets
|
$
|
254,724
|
|
$
|
31,355
|
|
$
|
56,436
|
|
$
|
342,515
|
|
||||
|
(a)
|
Both total fee and other revenue and total revenue include net income from consolidated investment management funds of
$7 million
, representing
$10 million
of income and noncontrolling interests of
$3 million
. Income before taxes is net of noncontrolling interests of
$3 million
.
|
|
(b)
|
Noninterest expense includes a loss attributable to noncontrolling interests of
$2 million
related to other consolidated subsidiaries.
|
|
(c)
|
Income before taxes divided by total revenue.
|
N/M - Not meaningful.
|
For the six months ended June 30, 2018
|
Investment
Services |
|
Investment
Management |
|
Other
|
|
Consolidated
|
|
||||||||
|
(dollars in millions)
|
||||||||||||||||
|
Total fee and other revenue
|
$
|
4,483
|
|
$
|
1,953
|
|
(a)
|
$
|
49
|
|
$
|
6,485
|
|
(a)
|
||
|
Net interest revenue (expense)
|
1,718
|
|
153
|
|
(36
|
)
|
1,835
|
|
||||||||
|
Total revenue
|
6,201
|
|
2,106
|
|
(a)
|
13
|
|
8,320
|
|
(a)
|
||||||
|
Provision for credit losses
|
(6
|
)
|
4
|
|
(6
|
)
|
(8
|
)
|
||||||||
|
Noninterest expense
|
3,916
|
|
1,402
|
|
168
|
|
5,486
|
|
||||||||
|
Income (loss) before taxes
|
$
|
2,291
|
|
$
|
700
|
|
(a)
|
$
|
(149
|
)
|
$
|
2,842
|
|
(a)
|
||
|
Pre-tax operating margin
(b)
|
37
|
%
|
33
|
%
|
N/M
|
|
34
|
%
|
||||||||
|
Average assets
|
$
|
271,203
|
|
$
|
31,732
|
|
$
|
49,284
|
|
$
|
352,219
|
|
||||
|
(a)
|
Both total fee and other revenue and total revenue include net income from consolidated investment management funds of
$5 million
, representing
$1 million
of income and a loss attributable to noncontrolling interests of
$4 million
. Income before taxes is net of a loss attributable to noncontrolling interests of
$4 million
.
|
|
(b)
|
Income before taxes divided by total revenue.
|
N/M - Not meaningful.
96
BNY Mellon
|
Notes to Consolidated Financial Statements
(continued)
|
|
For the six months ended June 30, 2017
|
Investment
Services |
|
Investment
Management |
|
Other
|
|
Consolidated
|
|
||||||||
|
(dollars in millions)
|
||||||||||||||||
|
Total fee and other revenue
|
$
|
4,199
|
|
$
|
1,776
|
|
(a)
|
$
|
185
|
|
$
|
6,160
|
|
(a)
|
||
|
Net interest revenue (expense)
|
1,468
|
|
173
|
|
(23
|
)
|
1,618
|
|
||||||||
|
Total revenue
|
5,667
|
|
1,949
|
|
(a)
|
162
|
|
7,778
|
|
(a)
|
||||||
|
Provision for credit losses
|
(3
|
)
|
3
|
|
(12
|
)
|
(12
|
)
|
||||||||
|
Noninterest expense
|
3,776
|
|
1,381
|
|
135
|
|
5,292
|
|
(b)
|
|||||||
|
Income before taxes
|
$
|
1,894
|
|
$
|
565
|
|
(a)
|
$
|
39
|
|
$
|
2,498
|
|
(a)(b)
|
||
|
Pre-tax operating margin
(c)
|
33
|
%
|
29
|
%
|
N/M
|
|
32
|
%
|
||||||||
|
Average assets
|
$
|
253,031
|
|
$
|
31,212
|
|
$
|
55,132
|
|
$
|
339,375
|
|
||||
|
(a)
|
Both total fee and other revenue and total revenue include net income from consolidated investment management funds of
$22 million
, representing
$43 million
of income and noncontrolling interests of
$21 million
. Income before taxes is net of noncontrolling interests of
$21 million
.
|
|
(b)
|
Noninterest expense includes a loss attributable to noncontrolling interest of
$5 million
related to other consolidated subsidiaries.
|
|
(c)
|
Income before taxes divided by total revenue.
|
N/M - Not meaningful.
Note 20–Supplemental information to the Consolidated Statement of Cash Flows
Non-cash investing and financing transactions that, appropriately, are not reflected in the consolidated statement of cash flows are listed below.
|
Non-cash investing and financing transactions
|
Six months ended June 30,
|
||||||
|
(in millions)
|
2018
|
|
2017
|
|
|||
|
Transfers from loans to other assets for other real estate owned
|
$
|
2
|
|
$
|
2
|
|
|
|
Change in assets of consolidated VIEs
|
303
|
|
529
|
|
|||
|
Change in liabilities of consolidated VIEs
|
1
|
|
293
|
|
|||
|
Change in nonredeemable noncontrolling interests of consolidated investment management funds
|
264
|
|
275
|
|
|||
|
Securities purchased not settled
|
400
|
|
853
|
|
|||
|
Securities sold not settled
|
—
|
|
1
|
|
|||
|
Securities matured not settled
|
25
|
|
—
|
|
|||
|
Available-for-sale securities transferred to trading assets
|
963
|
|
—
|
|
|||
|
Held-to-maturity securities transferred to available-for-sale
|
1,087
|
|
—
|
|
|||
|
Premises and equipment/capitalized software funded by capital lease obligations
|
15
|
|
345
|
|
|||
BNY Mellon
97
|
Item 4. Controls and Procedures
|
Disclosure controls and procedures
Our management, including the Chief Executive Officer and Chief Financial Officer, with participation by the members of the Disclosure Committee, has responsibility for ensuring that there is an adequate and effective process for establishing, maintaining, and evaluating disclosure controls and procedures that are designed to ensure that information required to be disclosed by us in our SEC reports is timely recorded, processed, summarized and reported and that information required to be disclosed by BNY Mellon is accumulated and communicated to BNY Mellon’s management to allow timely decisions regarding the required disclosure. In addition, our ethics hotline can also be used by employees and others for the anonymous communication of concerns about financial controls or reporting matters. There are inherent limitations to the effectiveness of any system of disclosure controls and procedures, including the possibility of human error and the circumvention or overriding of the controls and procedures. Accordingly, even effective disclosure controls and procedures can only provide reasonable assurance of achieving their control objectives.
As of the end of the period covered by this report, an evaluation was carried out under the supervision and with the participation of our management, including the Chief Executive Officer and Chief Financial Officer, of the effectiveness of our disclosure controls and procedures as defined in Rule 13a-15(e) under the Securities Exchange Act of 1934, as amended (the “Exchange Act”). Based on that evaluation, the Chief Executive Officer and Chief Financial Officer concluded that our disclosure controls and procedures were effective.
Changes in internal control over financial reporting
In the ordinary course of business, we may routinely modify, upgrade or enhance our internal controls and procedures for financial reporting. There have not been any changes in our internal control over financial reporting as defined in Rule 13a-15(f) of the Exchange Act during the
second quarter of 2018
that have materially affected, or are reasonably likely to materially affect, our internal control over financial reporting.
98
BNY Mellon
|
Forward-looking Statements
|
Some statements in this document are forward-looking. These include all statements about the usefulness of Non-GAAP measures, the future results of BNY Mellon, our businesses, financial, liquidity and capital condition, results of operations, liquidity, risk and capital management and processes, goals, strategies, outlook, objectives, expectations (including those regarding our performance results, expenses, seasonality in our businesses, impacts of currency fluctuations, impacts of trends on our businesses, regulatory, technology, market, economic or accounting developments, legal proceedings and other contingencies), effective tax rate, estimates (including those regarding expenses, losses inherent in our credit portfolios, capital ratios and the tax benefit related to U.S. tax legislation), intentions (including those regarding our real estate strategy, capital returns and investment in technology), targets, opportunities and initiatives.
In this report, any other report, any press release or any written or oral statement that BNY Mellon or its executives may make, words, such as “estimate,” “forecast,” “project,” “anticipate,” “likely,” “target,” “expect,” “intend,” “continue,” “seek,” “believe,” “plan,” “goal,” “could,” “should,” “would,” “may,” “might,” “will,” “strategy,” “synergies,” “opportunities,” “trends,” “future” and words of similar meaning, may signify forward-looking statements.
Actual results may differ materially from those expressed or implied as a result of a number of factors, including those discussed in the “Risk Factors” section of our 2017 Annual Report and this Form 10-Q, such as: a communications or technology disruption or failure that results in a loss of information or impacts our ability to provide services to our clients may materially adversely affect our business, financial condition and results of operations; a cybersecurity incident, or a failure to protect our computer systems, networks and information and our clients’ information against cybersecurity threats, could result in a loss of information, adversely impact our ability to conduct our businesses, and damage our reputation and cause losses; our business may be materially adversely affected by operational risk; failure to satisfy regulatory standards, including “well capitalized” and “well managed” status or capital adequacy and liquidity rules more generally, could result in limitations on our activities and adversely affect our business and financial condition; we are subject to
extensive government rulemaking, regulation and supervision; these rules and regulations have, and in the future may, compel us to change how we manage our businesses, which could have a material adverse effect on our business, financial condition and results of operations; rules and regulations have increased our compliance and operational risk and costs; our risk management framework may not be effective in mitigating risk and reducing the potential for losses;
a
failure or circumvention of our controls and procedures could have a material adverse effect on our business, reputation, results of operations and financial condition; if our resolution plan is determined not to be credible or not to facilitate an orderly resolution under the U.S. Bankruptcy Code, our business, reputation, results of operations and financial condition could be materially negatively impacted; the application of our Title I preferred resolution strategy or resolution under the Title II orderly liquidation authority could adversely affect our liquidity and financial condition and our security holders; regulatory or enforcement actions or litigation could materially adversely affect our results of operations or harm our businesses or reputation; our businesses may be negatively affected by adverse events, publicity, government scrutiny or other reputational harm; acts of terrorism, natural disasters, pandemics, global conflicts and other geopolitical events may have a negative impact on our business and operations; we are dependent on fee-based business for a substantial majority of our revenue and our fee-based revenues could be adversely affected by slowing in market activity, weak financial markets, underperformance and/or negative trends in savings rates or in investment preferences; weakness and volatility in financial markets and the economy generally may materially adversely affect our business, results of operations and financial condition; the United Kingdom’s referendum decision to leave the EU has had and may continue to have negative effects on global economic conditions, global financial markets, and our business and results of operations; changes in interest rates and yield curves could have a material adverse effect on our profitability; we may experience write-downs of securities that we own and other losses related to volatile and illiquid market conditions, reducing our earnings and impacting our financial condition; ongoing concerns about the financial stability of certain countries, new barriers to global trade or a breakup of the EU or Eurozone could have a material adverse effect on our business and results of operations; our FX revenue may be adversely affected
BNY Mellon
99
|
Forward-looking Statements
(continued)
|
by decreases in market volatility and the cross-border investment activity of our clients; the failure or perceived weakness of any of our significant counterparties, many of whom are major financial institutions and sovereign entities, and our assumption of credit and counterparty risk, could expose us to loss and adversely affect our business; our business, financial condition and results of operations could be adversely affected if we do not effectively manage our liquidity; any material reduction in our credit ratings or the credit ratings of our principal bank subsidiaries, The Bank of New York Mellon or BNY Mellon, N.A., could increase the cost of funding and borrowing to us and our rated subsidiaries and have a material adverse effect on our results of operations and financial condition and on the value of the securities we issue; we could incur losses if our allowance for credit losses, including loan and lending related commitments reserves, is inadequate; new lines of business, new products and services or transformational or strategic project initiatives may subject us to additional risks, and the failure to implement these initiatives could affect our results of operations; we are subject to competition in all aspects of our business, which could negatively affect our ability to maintain or increase our profitability; our business may be adversely affected if we are unable to attract and retain employees; our strategic transactions present risks and uncertainties and could have an adverse effect on our business, results of operations and financial condition; tax law changes, including the recent enactment of the Tax Act, or challenges to our tax positions with respect to historical transactions may adversely affect our net income, effective tax rate and our overall results of
operations and financial condition; our ability to return capital to shareholders is subject to the discretion of our board of directors and may be limited by U.S. banking laws and regulations, including those governing capital and the approval of our capital plan, applicable provisions of Delaware law or our failure to pay full and timely dividends on our preferred stock; changes in the method pursuant to which the LIBOR and other benchmark rates are determined could adversely impact our business and results of operations; the Parent is a non-operating holding company, and as a result, is dependent on dividends from its subsidiaries and extensions of credit from its IHC to meet its obligations, including with respect to its securities, and to provide funds for share repurchases and payment of dividends to its stockholders; changes in accounting standards governing the preparation of our financial statements and future events could have a material impact on our reported financial condition, results of operations, cash flows and other financial data.
Investors should consider all risk factors discussed in our 2017 Annual Report and any subsequent reports filed with the SEC by BNY Mellon pursuant to the Exchange Act. All forward-looking statements speak only as of the date on which such statements are made, and BNY Mellon undertakes no obligation to update any statement to reflect events or circumstances after the date on which such forward-looking statement is made or to reflect the occurrence of unanticipated events. The contents of BNY Mellon’s website or any other websites referenced herein are not part of this report.
100
BNY Mellon
|
Part II - Other Information
|
Item 1.
Legal Proceedings.
The information required by this Item is set forth in the “Legal proceedings” section in Note 18 of the Notes to Consolidated Financial Statements, which portion is incorporated herein by reference in response to this item.
Item 2.
Unregistered Sales of Equity Securities and Use of Proceeds.
|
(c)
|
The following table discloses repurchases of our common stock made in the
second quarter of 2018
. All of the Company’s preferred stock outstanding has preference over the Company’s common stock with respect to the payment of dividends.
|
Issuer purchases of equity securities
|
Share repurchases - second quarter of 2018
|
Total shares repurchased as part of a publicly announced plan or program
|
|
Maximum approximate dollar value of shares that may yet be purchased under the publicly announced plans or programs at June 30, 2018
|
|||||||||||
|
(dollars in millions, except per share information; common shares in thousands)
|
Total shares
repurchased |
|
Average price
per share |
|
||||||||||
|
April 2018
|
3,811
|
|
$
|
55.32
|
|
3,811
|
|
$
|
444
|
|
||||
|
May 2018
|
5,667
|
|
56.32
|
|
5,667
|
|
125
|
|
||||||
|
June 2018
|
2,174
|
|
55.69
|
|
2,174
|
|
4
|
|
||||||
|
Second quarter of 2018
(a)
|
11,652
|
|
$
|
55.88
|
|
11,652
|
|
$
|
2,400
|
|
(b)
|
|||
|
(a)
|
Includes
22 thousand
shares repurchased at a purchase price of
$1 million
from employees, primarily in connection with the employees’ payment of taxes upon the vesting of restricted stock. The average price per share of open market purchases was
$55.88
.
|
|
(b)
|
Represents the maximum value of the shares authorized to be repurchased through the second quarter of 2019, including employee benefit plan repurchases, in connection with the Federal Reserve’s non-objection to our 2018 capital plan.
|
On June 28, 2017, in connection with the Federal Reserve’s non-objection to our 2017 capital plan, BNY Mellon announced a share repurchase plan providing for the repurchase of up to $2.6 billion of common stock and up to an additional $500 million of common stock contingent on a prior issuance of $500 million of noncumulative perpetual preferred stock. The 2017 capital plan began in the third quarter of 2017 and continued through the second quarter of 2018.
In June 2018, in connection with the Federal Reserve’s non-objection to our 2018 capital plan, BNY Mellon announced a share repurchase plan providing for the repurchase of up to $2.4 billion of common stock starting in the third quarter of 2018 and continuing through the second quarter of 2019. This new share repurchase plan replaces all previously authorized share repurchase plans.
Share repurchases may be executed through repurchase plans designed to comply with Rule 10b5-1 and through derivative, accelerated share repurchase and other structured transactions. The timing and exact amount of any common stock repurchases will depend on various factors, including market conditions and the common stock trading price; the Company’s capital position, liquidity and financial performance; alternative uses of capital; and legal and regulatory considerations.
Item 6.
Exhibits.
The list of exhibits required to be filed as exhibits to this report appears below.
BNY Mellon
101
|
Index to Exhibits
|
|
Exhibit No.
|
Description
|
Method of Filing
|
||
|
3.1
|
Previously filed as Exhibit 3.1 to the Company’s Current Report on Form 8-K (File No. 000-52710) as filed with the Commission on July 2, 2007, and incorporated herein by reference.
|
|||
|
3.2
|
Previously filed as Exhibit 4.1 to the Company’s Current Report on Form 8-K (File No. 000-52710) as filed with the Commission on July 5, 2007, and incorporated herein by reference.
|
|||
|
3.3
|
Previously filed as Exhibit 3.2 to the Company’s Registration Statement on Form 8A12B (File No. 001-35651) as filed with the Commission on Sept. 14, 2012, and incorporated herein by reference.
|
|||
|
3.4
|
Previously filed as Exhibit 3.1 to the Company’s Current Report on Form 8-K (File No. 001-35651) as filed with the Commission on May 16, 2013, and incorporated herein by reference.
|
|||
|
3.5
|
|
Previously filed as Exhibit 3.1 to the Company’s Current Report on Form 8-K (File No. 001-35651) as filed with the Commission on April 28, 2015, and incorporated herein by reference.
|
||
|
3.6
|
Previously filed as Exhibit 3.1 to the Company’s Current Report on Form 8-K (File No. 001-35651) as filed with the Commission on Aug. 1, 2016, and incorporated herein by reference.
|
|||
|
3.7
|
Previously filed as Exhibit 3.1 to the Company’s Current Report on Form 8-K (File No. 001-35651) as filed with the Commission on Feb. 13, 2018, and incorporated herein by reference.
|
|||
|
4.1
|
None of the instruments defining the rights of holders of long-term debt of the Parent or any of its subsidiaries represented long-term debt in excess of 10% of the total assets of the Company as of June 30, 2018. The Company hereby agrees to furnish to the Commission, upon request, a copy of any such instrument.
|
N/A
|
||
102
BNY Mellon
|
Index to Exhibits
(continued)
|
|
Exhibit No.
|
Description
|
Method of Filing
|
||
|
10.1
|
*
|
Filed herewith.
|
||
|
10.2
|
*
|
Filed herewith.
|
||
|
12.1
|
Filed herewith.
|
|||
|
31.1
|
Filed herewith.
|
|||
|
31.2
|
Filed herewith.
|
|||
|
32.1
|
Furnished herewith.
|
|||
|
32.2
|
Furnished herewith.
|
|||
|
101.INS
|
XBRL Instance Document.
|
Filed herewith.
|
||
|
101.SCH
|
XBRL Taxonomy Extension Schema Document.
|
Filed herewith.
|
||
|
101.CAL
|
XBRL Taxonomy Extension Calculation Linkbase Document.
|
Filed herewith.
|
||
|
101.DEF
|
XBRL Taxonomy Extension Definition Linkbase Document.
|
Filed herewith.
|
||
|
101.LAB
|
XBRL Taxonomy Extension Label Linkbase Document.
|
Filed herewith.
|
||
|
101.PRE
|
XBRL Taxonomy Extension Presentation Linkbase Document.
|
Filed herewith.
|
||
* Management contract or compensatory plan, contract or arrangement.
BNY Mellon
103
SIGNATURE
Pursuant to the requirements of the Securities Exchange Act of 1934, the registrant has duly caused this report to be signed on its behalf by the undersigned thereunto duly authorized.
|
THE BANK OF NEW YORK MELLON CORPORATION
|
|
|
(Registrant)
|
|
|
Date: August 3, 2018
|
By:
|
/s/ Kurtis R. Kurimsky
|
|
|
Kurtis R. Kurimsky
|
|||
|
Corporate Controller
|
|||
|
(Duly Authorized Officer and
|
|||
|
Principal Accounting Officer of
|
|||
|
the Registrant)
|
|||
104
BNY Mellon
TABLE OF CONTENTS
Part I - Financial InformationNote 5 Of The Notes To Consolidated Financial StatementsItem 1. Financial Statements The Bank Of New York Mellon Corporation (and Its Subsidiaries)Item 1. Financial StatementsNote 1 Basis Of PresentationNote 2 Accounting Changes and New Accounting GuidanceNote 3 Acquisitions and DispositionsNote 4 SecuritiesNote 5 Loans and Asset QualityNote 6 Goodwill and Intangible AssetsNote 7 Other AssetsNote 8 Contract RevenueNote 9 Net Interest RevenueNote 10 Employee Benefit PlansNote 11 Income TaxesNote 12 Variable Interest Entities and SecuritizationNote 13 Preferred StockNote 14 Other Comprehensive Income (loss)Note 15 Fair Value MeasurementNote 16 Fair Value OptionNote 17 Derivative InstrumentsNote 18 Commitments and Contingent LiabilitiesNote 19 Lines Of BusinessNote 20 Supplemental Information To The Consolidated Statement Of Cash FlowsItem 4. Controls and ProceduresPart II - Other InformationItem 1. Legal ProceedingsItem 2. Unregistered Sales Of Equity Securities and Use Of ProceedsItem 6. Exhibits