BROOKDALE SENIOR LIVING INC.
10-Ks and 10-Qs
|
|
|
|
|
|
|
|
|
|
|
|
|
|
|
|
|
|
|
|
|
|
|
|
|
|
|
|
|
|
|
|
|
|
|
|
|
|
|
|
|
|
|
|
|
|
|
UNITED STATES
SECURITIES AND EXCHANGE COMMISSION
Washington, D.C. 20549
Form 10-K
|
[X]
|
ANNUAL REPORT PURSUANT TO SECTION 13 OR 15(d) OF THE SECURITIES EXCHANGE ACT OF 1934
|
For the fiscal year ended
December 31, 2017
or
|
[ ]
|
TRANSITION REPORT PURSUANT TO SECTION 13 OR 15(d) OF THE SECURITIES EXCHANGE ACT OF 1934
|
Commission File Number 001-32641
BROOKDALE SENIOR LIVING INC.
(Exact name of registrant as specified in its charter)
|
Delaware
(State or Other Jurisdiction of
Incorporation or Organization)
|
|
20-3068069
(I.R.S. Employer
Identification No.)
|
111 Westwood Place, Suite 400
Brentwood, Tennessee 37027
(Address of Principal Executive Offices)
|
(Registrant's telephone number including area code)
|
(615) 221-2250
|
SECURITIES REGISTERED PURSUANT TO SECTION 12(b) OF THE ACT:
|
Title of Each Class
Common Stock, $0.01 Par Value Per Share
|
|
Name of Each Exchange on Which Registered
New York Stock Exchange
|
SECURITIES REGISTERED PURSUANT TO SECTION 12(g) OF THE ACT:
None
Indicate by check mark if the registrant is a well-known seasoned issuer, as defined in Rule 405 of the Securities Act. Yes [X] No [ ]
Indicate by check mark if the registrant is not required to file reports pursuant to Section 13 or Section 15(d) of the Act. Yes [ ] No [X]
Indicate by check mark whether the registrant: (1) has filed all reports required to be filed by Section 13 or 15(d) of the Securities Exchange Act of 1934 during the preceding 12 months (or for such shorter period that the registrant was required to file such reports), and (2) has been subject to such filing requirements for the past 90 days. Yes [X] No [ ]
Indicate by check mark whether the registrant has submitted electronically and posted on its corporate Web site, if any, every Interactive Data File required to be submitted and posted pursuant to Rule 405 of Regulation S-T (§ 232.405 of this chapter) during the preceding 12 months (or for such shorter period that the registrant was required to submit and post such files). Yes [X] No [ ]
Indicate by check mark if disclosure of delinquent filers pursuant to Item 405 of Regulation S-K (§229.405 of this chapter) is not contained herein, and will not be contained, to the best of registrant's knowledge, in definitive proxy or information statements incorporated by reference in Part III of this Form 10-K or any amendment to this Form 10-K. [ ]
Indicate by check mark whether the registrant is a large accelerated filer, an accelerated filer, a non-accelerated filer, a smaller reporting company, or emerging growth company. See the definitions of "large accelerated filer," "accelerated filer," "smaller reporting company," and "emerging growth company" in Rule 12b-2 of the Exchange Act.
|
Large accelerated filer [X]
|
Accelerated filer [ ]
|
|
|
|
|
Non-accelerated filer [ ] (Do not check if a smaller reporting company)
|
Smaller reporting company [ ]
|
|
Emerging growth company [ ]
|
|
If an emerging growth company, indicate by check mark if the registrant has elected not to use the extended transition period for complying with any new or revised accounting standards provided pursuant to Section 13(a) of the Exchange Act. [ ]
Indicate by check mark whether the registrant is a shell company (as defined in Rule 12b-2 of the Act). Yes [ ] No [X]
The aggregate market value of common stock held by non-affiliates of the registrant on June 30,
2017
, the last business day of the registrant's most recently completed second fiscal quarter, was approximately
$2.8 billion
. The market value calculation was determined using a per share price of
$14.71
, the price at which the registrant's common stock was last sold on the New York Stock Exchange on such date. For purposes of this calculation only, shares held by non-affiliates excludes only those shares beneficially owned by the registrant's executive officers, directors and stockholders owning 10% or more of the Company's outstanding common stock.
As of
February 20, 2018
,
186,572,921
shares of the registrant's common stock,
$0.01
par value, were outstanding (excluding unvested restricted shares).
DOCUMENTS INCORPORATED BY REFERENCE
Certain sections of the registrant's Definitive Proxy Statement relating to its
2018
Annual Meeting of Stockholders, or an amendment to this Form 10-K, to be filed with the SEC within 120 days of December 31, 2017, are incorporated by reference into Part III of this Annual Report on Form 10-K.
TABLE OF CONTENTS
BROOKDALE SENIOR LIVING INC.
FORM 10-K
FOR THE YEAR ENDED DECEMBER 31,
2017
|
|
|
PAGE
|
|
|
|
|
|
PART I
|
|
|
|
|
|
|
|
Item 1
|
||
|
Item 1A
|
||
|
Item 1B
|
||
|
Item 2
|
||
|
Item 3
|
||
|
Item 4
|
||
|
|
|
|
|
PART II
|
|
|
|
|
|
|
|
Item 5
|
||
|
Item 6
|
||
|
Item 7
|
||
|
Item 7A
|
||
|
Item 8
|
||
|
Item 9
|
||
|
Item 9A
|
||
|
Item 9B
|
||
|
|
|
|
|
PART III
|
|
|
|
|
|
|
|
Item 10
|
||
|
Item 11
|
||
|
Item 12
|
||
|
Item 13
|
||
|
Item 14
|
||
|
|
|
|
|
PART IV
|
|
|
|
|
|
|
|
Item 15
|
||
|
Item 16
|
|
|
3
SAFE HARBOR STATEMENT UNDER THE PRIVATE SECURITIES LITIGATION REFORM ACT OF 1995
Certain statements in this Annual Report on Form 10-K may constitute forward-looking statements within the meaning of the Private Securities Litigation Reform Act of 1995. These forward-looking statements are subject to various risks and uncertainties and include all statements that are not historical statements of fact and those regarding our intent, belief or expectations, including, but not limited to, statements relating to our redefined strategy, including initiatives undertaken to execute on our strategic priorities and their intended effect on our results; our operational, sales, marketing and branding initiatives; our expectations regarding the economy, the senior living industry, senior housing construction, supply and competition, occupancy and pricing and the demand for senior housing; our expectations regarding our revenue, cash flow, operating income, expenses, capital expenditures, including expected levels and reimbursements and the timing thereof, expansion, redevelopment and repositioning opportunities, including Program Max opportunities, and their projected costs, cost savings and synergies, and our liquidity and leverage; our plans and expectations with respect to acquisition, disposition, development, lease restructuring and termination, financing, re-financing and venture transactions and opportunities (including assets held for sale, the pending transactions with HCP, Inc. and our plans to market in 2018 and sell approximately 30 owned communities), including the timing thereof and their effects on our results; our expectations regarding taxes, capital deployment and returns on invested capital, Adjusted EBITDA and Adjusted Free Cash Flow (as those terms are defined in this Annual Report on Form 10-K); our expectations regarding returns to stockholders, our share repurchase program and the payment of dividends; our ability to secure financing or repay, replace or extend existing debt at or prior to maturity; our ability to remain in compliance with all of our debt and lease agreements (including the financial covenants contained therein); our expectations regarding changes in government reimbursement programs and their effect on our results; our plans to expand our offering of ancillary services; and our ability to anticipate, manage and address industry trends and their effect on our business. Forward-looking statements are generally identifiable by use of forward-looking terminology such as "may," "will," "should," "could," "would," "potential," "intend," "expect," "endeavor," "seek," "anticipate," "estimate," "overestimate," "underestimate," "believe," "project," "predict," "continue," "plan," "target" or other similar words or expressions. These forward looking statements are based on certain assumptions and expectations, and our ability to predict results or the actual effect of future plans or strategies is inherently uncertain. Although we believe that expectations reflected in any forward-looking statements are based on reasonable assumptions, we can give no assurance that our expectations will be attained and actual results and performance could differ materially from those projected. Factors which could have a material adverse effect on our operations and future prospects or which could cause events or circumstances to differ from the forward-looking statements include, but are not limited to, the risk associated with the current global economic situation and its impact upon capital markets and liquidity; changes in governmental reimbursement programs; the risk of overbuilding, new supply and new competition; our inability to extend (or refinance) debt (including our credit and letter of credit facilities and our outstanding convertible notes) as it matures; the risk that we may not be able to satisfy the conditions precedent to exercising the extension options associated with certain of our debt agreements; events which adversely affect the ability of seniors to afford our resident fees or entrance fees; the conditions of housing markets in certain geographic areas; our ability to generate sufficient cash flow to cover required interest and long-term lease payments and to fund our planned capital projects; risks related to the implementation of our redefined strategy, including initiatives undertaken to execute on our strategic priorities and their effect on our results; the effect of our indebtedness and long-term leases on our liquidity; the effect of our non-compliance with any of our debt or lease agreements (including the financial covenants contained therein) and the risk of lenders or lessors declaring a cross default in the event of our non-compliance with any such agreements; the risk of loss of property pursuant to our mortgage debt and long-term lease obligations; the possibilities that changes in the capital markets, including changes in interest rates and/or credit spreads, or other factors could make financing more expensive or unavailable to us; our determination from time to time to purchase any shares under our share repurchase program; our ability to fund any repurchases; our ability to effectively manage our growth; our ability to maintain consistent quality control; delays in obtaining regulatory approvals; the risk that we may not be able to expand, redevelop and reposition our communities in accordance with our plans; our ability to complete acquisition, disposition, lease restructuring and termination, financing, re-financing and venture transactions (including assets held for sale, the pending transactions with HCP, Inc. and our plans to market in 2018 and sell approximately 30 owned communities) on agreed upon terms or at all, including in respect of the satisfaction of closing conditions, the risk that regulatory approvals are not obtained or are subject to unanticipated conditions, and uncertainties as to the timing of closing, and our ability to identify and pursue any such opportunities in the future; our ability to successfully integrate acquisitions; competition for the acquisition of assets; our ability to obtain additional capital on terms acceptable to us; a decrease in the overall demand for senior housing; our vulnerability to economic downturns; acts of nature in certain geographic areas; terminations of our resident agreements and vacancies in the living spaces we lease; early terminations or non-renewal of management agreements; increased competition for skilled personnel; increased wage pressure and union activity; departure of our key officers and potential disruption caused by changes in management; increases in market interest rates; environmental contamination at any of our communities; failure to comply with existing environmental laws; an adverse determination or resolution of complaints filed against us; the cost and difficulty of complying with increasing and evolving regulation; unanticipated costs to comply with legislative or regulatory developments, including requirements to obtain emergency power generators for our communities; as well as other risks detailed from time to time in our filings with the Securities and Exchange Commission, including those set forth under "Item 1A. Risk Factors" contained in this Annual Report on Form 10-K. When considering forward-looking statements, you should keep in mind the risk factors and other cautionary statements in such SEC filings. Readers are cautioned not to place undue reliance on any of these forward-looking statements, which reflect our
4
management's views as of the date of this Annual Report on Form 10-K. We cannot guarantee future results, levels of activity, performance or achievements, and we expressly disclaim any obligation to release publicly any updates or revisions to any forward-looking statements contained in this Annual Report on Form 10-K to reflect any change in our expectations with regard thereto or change in events, conditions or circumstances on which any statement is based.
5
|
Item 1.
|
Business.
|
Unless otherwise specified, references to "Brookdale," "we," "us," "our" or "the Company" in this Annual Report on Form 10-K mean Brookdale Senior Living Inc. together with its consolidated subsidiaries.
Overview
Our Business
As of
December 31, 2017
, we are the largest operator of senior living communities in the United States based on total capacity, with
1,023
communities in
46
states and the ability to serve approximately
101,000
residents. We offer our residents access to a full continuum of services across the most attractive sectors of the senior living industry. We operate independent living, assisted living and dementia-care communities and continuing care retirement centers ("CCRCs"). Through our ancillary services programs, we also offer a range of home health, hospice and outpatient therapy services to residents of many of our communities and to seniors living outside of our communities.
As of
December 31, 2017
, we owned or leased
794
communities (
66,641
units) and provided management services with respect to
229
communities (
33,941
units) for third parties or unconsolidated ventures in which we have an ownership interest. As of such date, we operated
129
retirement center communities (
24,476
units),
822
assisted living communities (
56,718
units) and
72
CCRCs (
19,388
units). The majority of our units are located in campus settings or communities containing multiple services, including CCRCs. As of
December 31, 2017
, our ancillary services platform included networks in
28
states with the ability to provide home health services to
63.7%
of our units, hospice services to
21.7%
of our units, and outpatient therapy to
17.0%
of our units. During the year ended
December 31, 2017
, we generated
82.1%
of our resident fee revenues from private pay customers and
15.2%
from government reimbursement programs (primarily Medicare). For the year ended
December 31, 2017
,
39.5%
of our resident and management fee revenues were generated from owned communities,
46.9%
from leased communities,
11.6%
from our ancillary services business and
2.0%
from communities we operate on behalf of third parties or unconsolidated ventures.
We believe that we operate in the most attractive sectors of the senior living industry, and our goal is to be the first choice in senior living by being the nation’s most trusted and effective senior living provider and employer. Our community and service offerings combine housing, health care, hospitality and ancillary services. Our senior living communities offer residents a supportive home-like setting, assistance with activities of daily living ("ADL") such as eating, bathing, dressing, toileting and transferring/walking and, in certain communities, licensed skilled nursing services. We also provide ancillary services, including home health, hospice and outpatient therapy services to residents of many of our communities and to seniors living outside of our communities. By providing residents with a range of service options as their needs change, we provide greater continuity of care, enabling seniors to "age-in-place," which we believe enables them to maintain residency with us for a longer period of time. The ability of residents to age-in-place is also beneficial to our residents and their families who are concerned with care decisions for their elderly relatives. With our platform of a range of community and service offerings, we believe that we are positioned to take advantage of favorable demographic trends over time.
Leadership and Redefined Strategy
On February 22, 2018, we announced that Lucinda M. Baier, our Chief Financial Officer, has been appointed as our President and Chief Executive Officer and as a member of our Board of Directors effective February 28, 2018, at which time T. Andrew Smith will step down from such roles. We further announced that Bryan Richardson, our Executive Vice President and Chief Administrative Officer, will leave his employment effective March 9, 2018. Ms. Baier will continue to serve as our principal financial officer while we conduct a search for her replacement, and we do not currently intend to replace Mr. Richardson’s position.
For 2018, we have re-evaluated and redefined our strategic priorities, which are now focused on our three primary stakeholders: our stockholders, our associates, and, always at our foundation, our residents, patients and their families. Through our redefined strategy, we intend to provide attractive long-term returns to our stockholders; attract, engage, develop and retain the best associates; and continue to earn the trust and endorsements of our residents, patients and their families.
|
•
|
Stockholders
. Our stockholders’ continued investment in us allows us to advance our mission to our residents and their families. Therefore we believe we must balance our mission with an emphasis on margin. With this strategic priority, we intend to take actions to provide long-term returns to our stockholders by focusing on growing RevPAR, Adjusted EBITDA and Adjusted Free Cash Flow.
|
6
|
•
|
Associates
. Brookdale’s culture is based on servant leadership, and our associates are the key to attracting and caring for residents and creating value for all of our stakeholders. Through this strategic priority, we intend to create a compelling value proposition for our associates in the areas of compensation, leadership, career growth and meaningful work. In 2017, we took the first corrective steps by investing in community leaders, and in 2018 we plan to extend this plan deeper in the communities.
|
|
•
|
Residents, Patients and Their Families
. Brookdale continues to be driven by its mission—to enrich the lives of those we serve with compassion, respect, excellence and integrity—and we believe this continued focus is essential to create value for all of our stakeholders. This strategic priority includes enhancing our organizational alignment to foster an environment where our associates can focus on providing valued, high quality care and personalized service. We intend to win locally through our targeted sales and marketing efforts by differentiating our community and service offerings based on quality, a portfolio of choices, and personalized service delivered by caring associates.
|
As part of our redefined strategy, we plan to continue to evaluate and, where opportunities arise, pursue lease restructurings, development and acquisition opportunities, including selectively acquiring existing operating companies, senior living communities and ancillary services companies. Any such restructurings or acquisitions may be pursued on our own, or through our investments in ventures. In addition, we intend to continue to evaluate our owned and leased community portfolios for opportunities to dispose of owned communities and terminate leases. We plan to market in 2018 and sell approximately 30 owned communities (in addition to assets held for sale as of December 31, 2017), which we believe will generate more than $250 million of proceeds, net of associated debt and transaction costs.
We believe that our successful execution on these strategic priorities will allow us to achieve our goal to be the first choice in senior living by being the nation’s most trusted and effective senior living provider and employer.
2016 - 2017 Portfolio Optimization Update
During 2016 and 2017, we engaged in an initiative to optimize our community portfolio through disposing of owned and leased communities, restructuring leases, and investing in our Program Max initiative in order to simplify and streamline our business, to increase the quality and durability of our cash flow, to improve our liquidity, and to reduce our debt and lease leverage. During the period from January 1, 2016 through December 31, 2017, we completed dispositions, through sales and lease terminations, of
165
communities. During 2017, we also amended and restated triple-net leases covering substantially all of the communities we lease from HCP, Inc. (“HCP”) into a master lease and invested
$8.8 million
on Program Max projects, net of
$8.1 million
of third party lessor reimbursements.
During 2018, we expect to close on the dispositions of
15
owned communities (
1,508
units) classified as held for sale as of December 31, 2017, the terminations of our triple-net leases on
33
communities (
3,123
units), the terminations of management agreements on
37
communities (
5,522
units) and our acquisitions of
six
communities that we currently lease or manage (
995
units). In addition, we plan to market in 2018 and sell approximately 30 owned communities.
The closings of the expected sales of assets are subject (where applicable) to our successful marketing of such assets on terms acceptable to us. Further, the closings of the various pending transactions and expected sales of assets are, or will be, subject to the satisfaction of various closing conditions, including (where applicable) the receipt of regulatory approvals. However, there can be no assurance that the transactions will close or, if they do, when the actual closings will occur.
See “Item 7. Management’s Discussion and Analysis of Financial Condition and Results of Operations” for a summary of the foregoing completed and pending transactions and their impact on our results of operations.
The Senior Living Industry
The senior living industry has undergone dramatic growth in the last twenty years, marked by the emergence of the assisted living segment in the mid-1990s, and it remains highly fragmented and characterized by numerous local and regional operators. We are one of a limited number of large operators that provide a broad range of community locations and service level offerings at varying price levels.
Beginning in 2007, the industry was affected negatively by the downturn in the general economy, which resulted in a near halt in construction of new units. The industry experienced a slow recovery in occupancy and rate growth beginning in 2010 according to the National Investment Center for the Seniors Housing & Care Industry ("NIC"). In more recent years, as the economy and senior living industry have improved, the industry has attracted increased investment resulting in increased development of new senior housing supply. According to NIC data, industry occupancy increased modestly through 2015, as the pace of absorption outpaced inventory growth slightly. Starting in 2016, NIC data showed that industry occupancy began to decrease as a result of
7
new openings, and based on projections of NIC, industry occupancy is expected to be flat through 2018. During 2016 and 2017, we experienced an elevated rate of competitive new openings, with significant new competition opening in several of our markets, which adversely affected our occupancy, revenues, and results of operations. We continue to address such competition through pricing initiatives based on the competitive market, current in-place rents and occupancy; focusing on operations, including ensuring high customer satisfaction, protecting key leadership potions and actively engaging district and regional management in community operations; local and national marketing efforts, including leveraging our industry leading name through enhanced digital, direct mail and local community outreach; and community segmentation through which we evaluate current community position relative to competition and reposition if necessary (e.g., price, services, amenities and programming). We expect the elevated rate of competitive new openings and pressures on our occupancy and rate growth to continue through 2018.
We believe that a number of trends will contribute to the continued growth of the senior living industry in coming years. The primary market of the senior living industry is individuals age
75
and older. According to United States Census data, that group is projected to be the fastest growing age cohort over the next twenty years. As a result of scientific and medical breakthroughs over the past 30 years, seniors are living longer. Due to demographic trends, and continuing advances in science, nutrition and healthcare, the senior population will continue to grow, and we expect the demand for senior living services to continue to increase in future years.
We believe the senior living industry has been and will continue to be impacted by several other trends. Increased longevity results in increasing frailty in seniors, soaring rates of dementia among the elderly, and a growing burden of chronic illness and chronic conditions. As a result of increased mobility in society, a reduction of average family size and increased number of two-wage earner couples, families struggle to provide care for seniors and look for alternatives outside of their family for their care. There is a growing consumer awareness among seniors and their families concerning the types of services provided by senior living operators, which has further contributed to the demand for senior living services. Also, the current prospective senior customer possesses greater financial resources than in the past, which makes it more likely that they are able to afford to live in market-rate senior housing.
Challenges in our industry include increased state and local regulation of the assisted living and skilled nursing sectors, which has led to an increase in the cost of doing business. The regulatory environment continues to intensify in the number and types of laws and regulations affecting us, accompanied by increased enforcement activity by state and local officials. In addition, like other companies, our financial results may be negatively impacted by increasing employment costs including salaries, wages and benefits, such as health care benefit coverage, for our employees. Increases in the costs of food, utilities, insurance, and real estate taxes may also have a negative impact on our financial results.
In addition, there continue to be various federal and state legislative and regulatory proposals to implement cost containment measures that would limit payments to healthcare providers in the future. We cannot predict what action, if any, Congress will take on reimbursement policies of the Medicare or Medicaid programs or what future rule changes the Centers for Medicare & Medicaid Services ("CMS") will implement. Changes in the reimbursement rates or methods or timing of government reimbursement programs could adversely affect our revenues, results of operations and cash flow.
Our History
We were formed as a Delaware corporation in June 2005 for the purpose of combining two leading senior living operating companies, Brookdale Living Communities, Inc. ("BLC") and Alterra Healthcare Corporation ("Alterra"). BLC and Alterra had been operating independently since 1986 and 1981, respectively. On November 22, 2005, we completed our initial public offering of common stock, and on July 25, 2006, we acquired American Retirement Corporation ("ARC"), another leading senior living provider that had been operating independently since 1978. On September 1, 2011, we completed the acquisition of Horizon Bay, the then-ninth largest operator of senior living communities in the United States.
On July 31, 2014, we completed the acquisition by merger of Emeritus Corporation, a Washington corporation, pursuant to which a wholly-owned subsidiary of ours merged with and into Emeritus, with Emeritus continuing as the surviving corporation and a wholly-owned subsidiary of ours. At the time of the merger, Emeritus was the second largest operator of senior living communities in the United States.
Our Communities and Service Offerings
We offer a variety of senior living housing and service alternatives in communities located across the United States. Our communities consist of retirement center communities, assisted living communities, rental CCRCs and entry fee CCRCs. We manage certain of our communities for third parties or unconsolidated ventures in which we have an ownership interest pursuant to management
8
agreements. In addition, through our ancillary services programs, we provide home health, hospice and outpatient therapy services to residents of many of our communities and to seniors living outside of our communities.
Retirement Centers
Our retirement center communities are primarily designed for middle to upper income seniors generally age 75 and older who desire an upscale residential environment providing the highest quality of service. The majority of our retirement center communities consist of both independent and assisted living units in a single community, which allows residents to "age-in-place" by providing them with a continuum of senior independent and assisted living services. While the number varies depending upon the particular community, as of
December 31, 2017
approximately
79.0%
of all of the units at our retirement center communities are independent living units, with the balance of units licensed for assisted living.
Our retirement center communities are large multi-story buildings averaging
190
units with extensive common areas and amenities. Residents may choose from studio, one-bedroom and two-bedroom units, depending upon the specific community. Each retirement center community provides residents with basic services such as meal service, 24-hour emergency response, housekeeping, concierge services, transportation and recreational activities. Most of these communities also offer custom tailored supplemental care services at an additional charge, which may include medication reminders, check-in services and escort and companion services.
In addition to the basic services, our retirement center communities that include assisted living also provide residents with supplemental care service options to provide assistance with ADLs. The levels of care provided to residents vary from community to community depending, among other things, upon the licensing requirements and healthcare regulations of the state in which the community is located.
Residents in our retirement center communities are able to maintain their residency for an extended period of time due to the range of service options available to residents (not including skilled nursing) as their needs change. Residents with cognitive or physical frailties and higher level service needs are accommodated with supplemental services in their own units or, in certain communities, are cared for in a more structured and supervised environment on a separate wing or floor. These communities also generally have a dedicated assisted living staff, including nurses at the majority of communities, and separate assisted living dining rooms and activity areas.
Retirement center communities that we own or lease are included in our Retirement Centers segment, and retirement center communities for which we provide management services for third parties or unconsolidated ventures in which we have an ownership interest are included in our Management Services segment. As of
December 31, 2017
, our Retirement Center segment consisted of
84
retirement center communities with
15,042
units, representing
15.0%
of our total senior living capacity, and
45
retirement center communities with
9,434
units were included in our Management Services segment, representing
9.4%
of our total senior living capacity. In the aggregate, these retirement center communities represented
24.3%
of our total senior living capacity.
Assisted Living
Our assisted living communities offer housing and 24-hour assistance with ADLs to mid-acuity frail and elderly residents. Our assisted living communities include both freestanding, multi-story communities with more than 50 beds, and smaller, freestanding single story communities with less than 50 beds. Depending upon the specific location, the community may include (i) private studio, one-bedroom and one-bedroom deluxe apartments, or (ii) individual rooms for one or two residents in wings or "neighborhoods" scaled to a single-family home, which includes a living room, dining room, patio or enclosed porch, laundry room and personal care area, as well as a caregiver work station.
We also operate memory care communities, which are freestanding assisted living communities specially designed for residents with Alzheimer's disease and other dementias requiring the attention, personal care and services needed to help cognitively impaired residents maintain a higher quality of life. Our memory care communities have from
14
to
69
beds and some are part of a campus setting which includes a freestanding assisted living community.
All residents at our assisted living and memory care communities receive the basic care level, which includes ongoing health assessments, three meals per day and snacks, coordination of special diets planned by a registered dietitian, assistance with coordination of physician care, social and recreational activities, housekeeping and personal laundry services. In some locations we offer our residents exercise programs and programs designed to address issues associated with early stages of Alzheimer's and other forms of dementia. In addition, we offer at additional cost, higher levels of personal care services to residents at these communities who are very physically frail or experiencing early stages of Alzheimer's disease or other dementia and who require more frequent or intensive physical assistance or increased personal care and supervision due to cognitive impairments.
9
As a result of their progressive decline in cognitive abilities, residents at our memory care communities typically require higher levels of personal care and services and therefore pay higher monthly service fees. Specialized services include assistance with ADLs, behavior management and an activities program, the goal of which is to provide a normalized environment that supports residents' remaining functional abilities. Whenever possible, residents participate in all facets of daily life at the residence, such as assisting with meals, laundry and housekeeping.
Assisted living communities (including memory care communities) that we own or lease are included in our Assisted Living segment, and assisted living communities for which we provide management services for third parties or unconsolidated ventures in which we have an ownership interest are included in our Management Services segment. As of
December 31, 2017
, our Assisted Living segment consisted of
682
assisted living communities with
44,773
units, representing
44.5%
of our total senior living capacity, and
140
assisted living communities with
11,945
units were included in our Management Services segment, representing
11.9%
of our total senior living capacity. In the aggregate, these assisted living communities represented
56.4%
of our total senior living capacity.
As of
December 31, 2017
, we provide memory care services at
527
of our communities, aggregating
13,164
memory care units across our segments. These communities include
118
freestanding memory care communities with
4,575
units included in our Assisted Living segment.
CCRCs-Rental
Our CCRCs are large communities that offer a variety of living arrangements and services to accommodate all levels of physical ability and health. Most of our CCRCs have independent living, assisted living and skilled nursing available on one campus or within the immediate market, and some also include Alzheimer's and dementia care service areas.
CCRCs that we own or lease are included in our CCRCs-Rental segment, and CCRCs for which we provide management services for third parties or unconsolidated ventures in which we have an ownership interest are included in our Management Services segment. As of
December 31, 2017
, our CCRCs-Rental segment included
28
CCRCs with
6,826
units, representing
6.8%
of our total senior living capacity, and
44
CCRCs with
12,562
units were included in our Management Services segment, representing
12.4%
of our total senior living capacity. In the aggregate, these CCRCs represented
19.3%
of our total senior living capacity.
Twenty
of our CCRCs, of which
18
are included in the Management Services segment, allow for residents in the independent living apartment units to pay a one-time upfront entrance fee, typically $100,000 to $400,000 or more, which is partially refundable in certain circumstances. We refer to these communities as entry fee CCRCs. The amount of the entrance fee varies depending upon the type and size of the dwelling unit, the type of contract plan selected, whether the contract contains a lifecare benefit (i.e., a healthcare discount) for the resident, the amount and timing of the refund, and other variables. These agreements are subject to regulations in various states. In addition to their initial entrance fee, residents under all of our entrance fee agreements also pay a monthly service fee, which entitles them to the use of certain amenities and services. Since entrance fees are paid upon initial occupancy, the monthly fees are generally less than fees at a comparable rental community. The refundable portion of a resident's entrance fee is generally refundable within a certain number of months or days following contract termination or upon the sale of the unit, or in some agreements, upon the resale of a comparable unit or 12 months after the resident vacates the unit. In addition, some entrance fee agreements entitle the resident to a refund of the original entrance fee paid plus a percentage of the appreciation of the unit upon resale. As of
December 31, 2017
, our CCRCs-Rental segment included
two
entry fee CCRCs with
543
units, representing less than
0.5%
of our total senior living capacity, and
18
entry fee CCRCs with
7,876
units were included in our Management Services segment, representing
7.8%
of our total senior living capacity.
Brookdale Ancillary Services
Through our ancillary services programs, we currently provide home health, hospice and outpatient therapy services, as well as education and wellness programs, to residents of many of our communities and to seniors living outside of our communities. The home health services we provide include skilled nursing, physical therapy, occupational therapy, speech language pathology, home health aide services, and social services as needed. Our hospice services include clinical and skilled care, as well as spiritual and emotional counseling. Our outpatient therapy services include physical therapy, occupational therapy and speech language pathology services and other specialized therapy. The majority of our home health, hospice and outpatient therapy services are reimbursed by government reimbursement programs, primarily Medicare, and non-covered services are paid directly by residents from private pay sources. Our education and wellness programs focus on wellness and physical fitness to allow residents to maintain maximum independence. These services provide many continuing education opportunities for seniors and their families through health fairs, seminars, and other consultative interactions. We believe that our ancillary services offerings are unique in
10
the senior living industry and that we have a significant advantage over our competitors with respect to providing ancillary services because of our established infrastructure, scale and experience.
Our Brookdale Ancillary Services segment includes the home health, hospice and outpatient therapy services provided to residents of many of our communities and to seniors living outside of our communities. The Brookdale Ancillary Services segment does not include skilled nursing or inpatient therapy services provided in our skilled nursing units, which are included in the CCRCs-Rental segment. During the three months ended December 31, 2016, we significantly reduced the number of outpatient therapy clinics located in our communities as lower reimbursement rates and lower utilization made the business less attractive.
Management Services
We operate certain of our communities pursuant to management agreements. In some of these cases, the community is owned by third parties and, in other cases, the community is owned in an unconsolidated venture in which we have an ownership interest. Under the management agreements for these communities, we receive management fees as well as reimbursed expenses, which represent the reimbursement of certain expenses we incur on behalf of the owners.
The majority of our management agreements are long-term agreements. In most cases, either party to the agreements may terminate upon the occurrence of an event of default caused by the other party. In addition, in some cases, subject to our rights, if any, to cure deficiencies, community owners may terminate us as manager if any licenses or certificates necessary for operation are revoked, if we do not satisfy certain designated performance thresholds or if the community is sold to an unrelated third party (in which case we may be entitled to receive a contractual termination fee). Also, in some instances, a community owner may terminate the management agreement relating to a particular community if we are in default under other management agreements relating to other communities owned by the same owner or its affiliates. Certain of our management agreements, both with unconsolidated ventures and with entities owned by third parties, provide that an event of default under the debt instruments applicable to the ventures or the entities owned by third parties that is caused by us may also be considered an event of default by us under the relevant management agreement, giving the non-Brookdale party to the management agreement the right to pursue the remedies provided for in the management agreement, potentially including termination of the management agreement. Further, in the event of default on a loan, the lender may have the ability to terminate us as manager. With respect to communities held in unconsolidated ventures, in some cases, the management agreement can be terminated in connection with the sale by the venture partner of its interest in the venture or the sale of properties by the venture.
During the year ended
December 31, 2017
, approximately
73.9%
of our management fees revenue was derived from services provided to unconsolidated ventures in which HCP held an interest, including
29.1%
of our management fees revenue derived from services provided to our unconsolidated CCRC venture in which we share control with HCP. Early termination or non-renewal of, or renewal on less-favorable terms, of our management agreements (including our management agreements with such unconsolidated ventures) could cause a loss in revenues and could negatively impact our results of operations and cash flows.
As of
December 31, 2017
, the
229
communities and
33,941
units in our Management Services segment represented
33.7%
of our total senior living capacity. As of that date, we operated
61
communities, representing
8,222
units, for third parties and
168
communities, representing
25,719
units, for unconsolidated ventures in which we have an ownership interest. As of
December 31, 2017
, these communities consisted of
45
retirement center communities (
9,434
units),
140
assisted living communities (
11,945
units) and
44
CCRCs (
12,562
units).
Competitive Strengths
We believe our nationwide network of senior living communities and ancillary services networks are well positioned to benefit from the growth and increasing demand in the industry. Some of our most significant competitive strengths are:
|
•
|
Skilled management team with extensive experience
. Our senior management team and our Board of Directors have extensive experience in the senior living, healthcare and real estate industries, including the acquisition, operation and management of a broad range of senior living assets.
|
|
•
|
Geographically diverse, high-quality, purpose-built communities
. As of
December 31, 2017
, we are the largest operator of senior living communities in the United States based on total capacity, with
1,023
communities in
46
states and the ability to serve approximately
101,000
residents.
|
|
•
|
Ability to provide a broad spectrum of care
. Given our diverse mix of retirement centers, assisted living communities and CCRCs, as well as our ancillary services offerings, we are able to meet a wide range of our customers' needs. We believe that
|
11
we are one of the few companies in the senior living industry with this capability and the only company that does so at scale on a national basis. We believe that our multiple product offerings create marketing synergies and cross-selling opportunities.
|
•
|
The size of our business allows us to realize cost and operating efficiencies
. The size of our business allows us to realize cost savings and economies of scale in the procurement of goods and services. Our scale also allows us to achieve increased efficiencies with respect to various corporate functions. We intend to utilize our expertise and size to capitalize on economies of scale resulting from our national platform. Our geographic footprint and centralized infrastructure provide us with a significant operational advantage over local and regional operators of senior living communities. In connection with our formation transactions and our acquisitions, we negotiated new contracts for food, insurance and other goods and services. In addition, we have and will continue to consolidate corporate functions such as accounting, finance, human resources, legal, information technology and marketing.
|
|
•
|
Significant experience in providing ancillary services
. Through our ancillary services programs, we provide a range of home health, hospice, outpatient therapy, education, wellness and other ancillary services to residents of certain of our communities and to seniors outside our communities, which we believe is a distinct competitive difference. We have significant experience in providing these ancillary services and expect to receive additional revenues as we expand our ancillary service offerings to additional communities and to seniors outside of our communities.
|
Segments
As of
December 31, 2017
, we had
five
reportable segments: Retirement Centers; Assisted Living; CCRCs-Rental; Brookdale Ancillary Services and Management Services. These segments were determined based on the way that our chief operating decision maker organizes our business activities for making operating decisions, assessing performance, developing strategy and allocating capital resources.
Operating results and financial metrics from our
five
business segments are discussed further in "Item 7. Management's Discussion and Analysis of Financial Condition and Results of Operations" and Note 19 to our consolidated financial statements included in this Annual Report on Form 10-K.
Operations
Operations Overview
We have implemented intensive standards, policies and procedures and systems, including detailed staff manuals and training materials, which we believe have contributed to high levels of customer service. Further, we believe our centralized support infrastructure allows our community-based leaders and personnel to focus on resident care and family connections. Our operating procedures include securing national vendor contracts to obtain lower pricing for certain services such as food, supplies and insurance, implementing effective budgeting and financial controls at each community, and establishing standardized training and operations procedures. We have also established company-wide policies and procedures relating to, among other things: resident care; community design and community operations; billing and collections; accounts payable; finance and accounting; risk management; development of employee training materials and programs; marketing activities; the hiring and training of management and other community-based personnel; compliance with applicable local and state regulatory requirements; and implementation of our acquisition, development and leasing plans.
Consolidated Corporate Operations Support
We have developed a centralized support infrastructure and services platform, which provides us with a significant operational advantage over local and regional operators of senior living communities. The size of our business also allows us to achieve increased efficiencies with respect to various corporate functions such as human resources, finance, accounting, legal, information technology and marketing. We are also able to realize cost efficiencies in the purchasing of food, supplies, insurance, benefits, and other goods and services. In addition, we have established centralized operations groups to support all of our product lines and communities in areas such as training, regulatory affairs, asset management, dining and procurement.
Community Staffing and Training
Each community has an Executive Director responsible for the overall day-to-day operations of the community, including quality of care and service, social services and financial performance. Each Executive Director receives specialized training from us. In addition, a portion of each Executive Director's compensation is directly tied to the operating performance of the community and key care and service quality measures. We continue to take actions intended to simplify the role of our Executive Directors to
12
allow them to focus on our residents and their families and our associates. We believe that the quality of our communities, coupled with our competitive compensation philosophy, has enabled us to attract high-quality, professional community Executive Directors.
Depending upon the size of the community, each Executive Director is supported by a community staff member (health and wellness director or nursing director) who is directly responsible for day-to-day care of residents and community marketing and sales staff with regional support to oversee the community's sales, marketing and community outreach programs. Other key positions supporting each community may include individuals responsible for food service, healthcare services, activities, housekeeping, and maintenance.
We believe that quality of care and operating efficiency can be maximized by direct resident and staff contact. Employees involved in resident care, including the administrative staff, are trained in the support and care needs of the residents and emergency response techniques. We have adopted formal training and evaluation procedures to help ensure quality care for our residents. We have extensive policy and procedure manuals and hold frequent training sessions for management and staff at each site.
Quality Assurance
We maintain quality assurance programs at each of our communities through our corporate and regional staff. Our quality assurance programs are designed to achieve a high degree of resident and family member satisfaction with the care and services that we provide. Our quality control measures include, among other things, community inspections conducted by corporate staff on a regular basis. These inspections cover the appearance of the exterior and grounds; the appearance and cleanliness of the interior; the professionalism and friendliness of staff; quality of resident care (including assisted living services, nursing care, therapy and home health programs); the quality of activities and the dining program; observance of residents in their daily living activities; and compliance with government regulations. Our quality control measures also include the survey of residents and family members on a regular basis to monitor their perception of the quality of services provided to residents.
In order to foster a sense of community as well as to respond to residents' needs and desires, at many of our communities, we have established a resident council or other resident advisory committee that meets monthly with the Executive Director of the community. Separate resident committees also exist at many of these communities for food service, activities, marketing and hospitality. These committees promote resident involvement and satisfaction and enable community management to be more responsive to the residents' needs and desires.
Marketing and Sales
Our marketing efforts are intended to create awareness of our Brookdale brand, our communities, our products and our services among potential residents and their family members and among referral sources, including hospital discharge planners, physicians, clergy, area agencies for the elderly, skilled nursing facilities, home health agencies and social workers. Our marketing staff develops overall strategies for promoting our communities and monitors the success of our multi-layered marketing efforts, including outreach programs. In addition to direct contacts with prospective referral sources, we also rely on internet inquiries, contact centers, print advertising, e-mail and digital marketing, social media, direct mail, signage and special events, health fairs and community receptions. Certain resident referral programs have been established and promoted within the limitations of federal and state laws at many communities.
We will continue to leverage our brand recognition while pursuing a multi-layered marketing approach. We have also launched and embedded a new sales model, Network Selling, aimed at optimizing the customer experience as they consider the many options that we provide in markets and care-levels. With this new sales model, a lead sales associate in many of our markets will be responsible for better coordinating our sales efforts among our communities within a given market. Additionally, we have begun segmenting our communities to align their operating standards with their optimal market position. These community segmentation efforts are intended to identify optimal levels of price, service offerings, amenities and programs to be offered based on local demand and supply so that we can adjust our operating standards to create differentiated value to meet the needs of our customers.
Competition
The senior living industry is highly competitive. We compete with numerous organizations that provide similar senior living alternatives, such as home health care agencies, community-based service programs, retirement communities, convalescent centers and other senior living providers. In addition, over the last several years there has been an increase in the construction of new senior housing assets as the industry has attracted increased investment. During the year ended December 31, 2016, NIC data showed that industry occupancy began to decrease as a result of new openings, and based on projections of NIC, industry occupancy is expected to be flat through 2018. During 2016 and 2017, we experienced an elevated rate of competitive new openings, with significant new competition opening in several of our markets, which adversely affected our occupancy, revenues, and results of
13
operations. We expect the elevated rate of competitive new openings and pressures on our occupancy and rate growth to continue through 2018. In general, regulatory and other barriers to competitive entry in the retirement center and assisted living sectors of the senior living industry are not substantial. Consequently, we may encounter competition that could limit our ability to attract residents or expand our business, which could have a material adverse effect on our occupancy, revenues, results of operations and cash flows. Our major publicly-traded competitors that operate senior living communities are Five Star Quality Care, Inc. and Capital Senior Living Corporation. Our major private competitors include Holiday Retirement, Life Care Services, LLC, and Sunrise Senior Living, LLC, as well as a large number of not-for-profit entities.
Although our focus in the near term will be executing on our refined strategy, we plan to continue to evaluate and, where opportunities arise, selectively purchase existing operating companies, senior living communities, including those that we currently lease or manage, and ancillary services companies. The market for acquiring and/or operating senior living communities is highly competitive, and some of our present and potential senior living competitors have, or may obtain, greater financial resources than us and may have a lower cost of capital. In addition, several publicly-traded and non-traded real estate investment trusts, or REITs, and private equity firms have similar asset acquisition objectives as we do, along with greater financial resources and/or lower costs of capital than we are able to obtain. Partially as a result of tax law changes enacted through RIDEA, we now compete more directly with the various publicly-traded healthcare REITs for the acquisition of senior housing properties. The largest three of these publicly-traded healthcare REITs measured on equity market capitalization include HCP, Inc., Ventas, Inc. and Welltower, Inc.
Customers
Our target retirement center residents are senior citizens age
75
and older who desire or need a more supportive living environment. A number of our retirement center residents relocate to one of our communities in order to be in a metropolitan area that is closer to their adult children.
Our target assisted living residents are predominantly senior citizens age 80 and older who require daily assistance with two or more ADLs. Residents typically enter an assisted living community due to a relatively immediate need for services that might have been triggered by a medical event or need.
Our target CCRC residents are senior citizens who are seeking a community that offers a variety of services and a continuum of care so that they can "age-in-place." These residents generally first enter the community as a resident of an independent living unit and may later move into an assisted living or skilled nursing area as their needs change.
Seasonality
Our seniors housing business has typically experienced some seasonality, which we experience in certain regions more than others, due to weather patterns, geography and higher incidence and severity of illnesses during winter months. Although our seasonal pattern varies from year to year, our average monthly occupancy generally begins to decline sequentially during the fourth quarter of the year, and we generally expect average monthly occupancy to begin to increase during the second quarter each year.
Employees
As of
December 31, 2017
, we had approximately
49,500
full-time employees and approximately
26,100
part-time employees, of which
566
work in our Brentwood, Tennessee (a suburb of Nashville) headquarters office,
610
work in our Milwaukee, Wisconsin office and
981
work in our smaller regional support offices and a variety of field-based management positions. We currently consider our relationship with our employees to be good.
Government Regulation
Medicare and Medicaid Programs
We rely on reimbursement from government programs, including the Medicare program and, to a lesser extent, Medicaid programs, for a portion of our revenues. Reimbursements from Medicare and Medicaid represented
12.6%
and
2.7%
, respectively, of our total resident fee revenues for the year ended December 31, 2017. During the period, Medicare reimbursements represented
86.3%
of our Ancillary Services segment revenue, and Medicare and Medicaid reimbursements represented
23.1%
of our CCRCs-Rental segment revenue.
Medicare is a federal program that provides certain hospital and medical insurance benefits to persons age 65 and over and certain disabled persons. We receive revenue for our home health, hospice, skilled nursing and outpatient therapy services from Medicare.
14
Medicaid is a medical assistance program administered by each state, funded with federal and state funds pursuant to which healthcare benefits are available to certain indigent or disabled patients. We receive reimbursements under Medicaid (including state Medicaid waiver programs) for many of our assisted living communities.
These government reimbursement programs are highly regulated, involve significant administrative discretion, and are subject to frequent and substantial legislative, administrative and interpretive changes, which may significantly affect reimbursement rates and the methods and timing of payments made under these programs. Continuing efforts of government to contain healthcare costs could materially and adversely affect us, and reimbursement levels may not remain at levels comparable to present levels or may not be sufficient to cover the costs allocable to patients eligible for reimbursement. During 2016, we significantly reduced the number of our outpatient therapy clinics located in our communities due, in part, to lower reimbursement rates making the business less attractive.
Medicare reimbursement for home health and skilled nursing services is subject to fixed payments under the Medicare prospective payment systems. In accordance with Medicare laws, CMS makes annual adjustments to Medicare payment rates in many prospective payment systems under what is commonly known as a “market basket update.” Each year, the Medicare Payment Advisory Commission (“MedPAC”), a commission chartered by Congress to advise it on Medicare payment issues, recommends payment policies to Congress for a variety of Medicare payment systems. Congress is not obligated to adopt MedPAC recommendations and based on previous years, there can be no assurance that Congress will adopt MedPAC’s recommendations in any given year.
Medicaid reimbursement rates for many of our assisted living communities also are based upon fixed payment systems. Generally, these rates are adjusted annually for inflation. However, those adjustments may not reflect actual increases of the cost of providing healthcare services. In addition, Medicaid reimbursement can be impacted negatively by state budgetary pressures, which may lead to reduced reimbursement or delays in receiving payments.
Audits and Investigations
As a result of our participation in the Medicare and Medicaid programs, we are subject to various government reviews, audits and investigations to verify our compliance with these programs and applicable laws and regulations. CMS has engaged a number of third party firms, including Recovery Audit Contractors (RAC), Zone Program Integrity Contractors (ZPIC), and Unified Program Integrity Contractors (UPIC) to conduct extensive reviews of claims data to evaluate the appropriateness of billings submitted for payment. Audit contractors may identify overpayments based on coverage requirements, billing and coding rules or other risk areas. In addition to identifying overpayments, audit contractors can refer suspected violations of law to government enforcement authorities. An adverse determination of government reviews, audits and investigations may result in citations, sanctions and other criminal or civil fines and penalties, the refund of overpayments, payment suspensions, or termination of participation in Medicare and Medicaid programs. Our costs to respond to and defend any such audits, reviews and investigations may be significant and are likely to increase in the current enforcement environment, and any resulting sanctions or criminal, civil or regulatory penalties could have a material adverse effect on our business, financial condition, results of operations and cash flow.
The Patient Protection and Affordable Care Act and the Healthcare Education and Reconciliation Act
To help fund the expansion of health care coverage to previously uninsured people, the Patient Protection and Affordable Care Act and the Healthcare Education and Reconciliation Act of 2010 (collectively, the “Affordable Care Act”), which became law in 2010, provides for certain reforms to the health care delivery and payment system aimed at increasing quality and reducing costs.
As it relates to our business, the Affordable Care Act provides for reductions to the annual market basket payment updates for home health and hospice agencies and additional annual “productivity adjustment” reductions to the annual market basket payment update as determined by CMS for skilled nursing facilities (beginning in federal fiscal year 2012), home health agencies (beginning in federal fiscal year 2015), and hospice agencies (beginning in federal fiscal year 2013). These reductions have, and could in the future, result in lower reimbursement than the previous year. The Affordable Care Act also provides for new transparency, reporting, and certification requirements for skilled nursing facilities.
Furthermore, the Affordable Care Act mandates changes to home health and hospice benefits under Medicare. For home health, the Affordable Care Act mandates creation of a value-based purchasing program, development of quality measures, a decrease in home health reimbursement beginning with federal fiscal year 2014 that is being phased-in over a four-year period, a reduction in the outlier cap, and reinstatement of a 3% add-on payment for home health services delivered to residents in rural areas on or after April 1, 2010 and before January 1, 2016. In addition, the Affordable Care Act requires the Secretary of HHS to test different models for delivery of care, some of which would involve home health services. It also requires the Secretary to establish a national
15
pilot program for integrated care for patients with certain conditions, bundling payment for acute hospital care, physician services, outpatient hospital services, and post-acute care services, which would include home health. The Affordable Care Act further directed the Secretary of HHS to rebase payments for home health, which resulted in a decrease in home health reimbursement that began in 2014 and is being phased-in over a four-year period. The Secretary is also required to conduct a study to evaluate costs and quality of care among efficient home health agencies regarding access to care and treating Medicare beneficiaries with varying severity levels of illness and to provide a report to Congress.
Potential efforts in the Congress to alter, amend, repeal or replace the Affordable Care Act, or to fail to fund various aspects of the Affordable Care Act, create additional uncertainty about the ultimate impact of the Affordable Care Act on us and the healthcare industry. The healthcare reforms and changes resulting from the Affordable Care Act, as well as other similar healthcare reforms, including any potential change in the nature of services we provide, the methods or amount of payment we receive for such services, and the underlying regulatory environment, could adversely affect our business, revenues, results of operations and cash flows.
The Medicare Access and CHIP Reauthorization Act of 2015
The Medicare Access and CHIP Reauthorization Act of 2015 (“MACRA”) became law in 2015. The legislation, among other things, permanently replaced the sustainable growth rate formula previously used to determine updates to Medicare fee schedule payments with quality and value measurements and participation in alternate payment models; extended the Medicare Part B outpatient therapy cap exception process until December 31, 2017; extended the 3% add-on payment for home health services delivered to residents in rural areas until December 31, 2017; and set payment updates for post-acute providers at 1% after other adjustments required by the Affordable Care Act for 2018. As a result of changes to reimbursement due to the Affordable Care Act and MACRA, our home health reimbursement decreased by 3.2% for the year ended December 31, 2017, compared to the prior year, and we expect our home health reimbursement to decrease by 0.8% for the year ended December 31, 2018. As part of federal budget legislation that became law on February 9, 2018, the Medicare Part B cap on outpatient therapy services was permanently repealed effective January 1, 2018.
The Improving Medicare Post-Acute Care Transformation Act of 2014
The Improving Medicare Post-Acute Care Transformation Act of 2014 (the “IMPACT Act”), which became law in 2014, requires standardized assessment data for quality improvement, payment, and discharge planning purposes across the spectrum of post-acute care, including home health, hospice and skilled nursing. The IMPACT Act will require such agencies and facilities to begin reporting standardized patient assessment data, new quality measures, and resource use measures. Failure to report such data when required would subject an agency or facility to a two percent reduction in market basket prices then in effect. The IMPACT Act further requires HHS and MedPAC to study, and report to Congress by 2022 regarding, alternative post-acute care payment models, including payment based upon individual patient characteristics and not care setting.
Home Health Pre-Claim Review Demonstration
In 2016, CMS announced that it would implement a 3-year Medicare pre-claim review demonstration for home health services in the states of Illinois, Florida, Texas, Michigan and Massachusetts. We derive a significant portion of our home health revenue from these states. The pre-claim review is a process through which a request for provisional affirmation of coverage is submitted for review before a final claim is submitted for payment. CMS began the pre-claim review demonstration in Illinois in August 2016. Effective in April 2017, CMS paused for an indefinite period the demonstration in Illinois and the implementation of the demonstration in the other states. The pre-claim review demonstration resulted in increased administrative costs and reimbursement delays for our Illinois home health agency. If CMS were to restart implementation of the pre-claim review process, it could adversely affect our revenue, results of operations and cash flows.
Industry Regulation
The regulatory environment surrounding the senior living industry continues to intensify in the number and type of laws and regulations affecting it. In addition, federal, state and local officials are increasingly focusing their efforts on enforcement of these laws and regulations. This is particularly true for large for-profit, multi-community providers like us. Some of the laws and regulations that impact our industry include: state and local laws impacting licensure, protecting consumers against deceptive practices, and generally affecting the communities' management of property and equipment and how we otherwise conduct our operations, such as fire, health and safety laws and regulations and privacy laws; federal and state laws governing Medicare and Medicaid, which regulate allowable costs, pricing, quality of services, quality of care, food service, resident rights (including abuse and neglect) and fraud; federal and state residents' rights statutes and regulations; Anti-Kickback and physicians referral ("Stark") laws; and safety and health standards set by the Occupational Safety and Health Administration. We are unable to predict
16
the future course of federal, state and local legislation or regulation. Changes in the regulatory framework could have a material adverse effect on our business.
Many senior living communities are also subject to regulation and licensing by state and local health and social service agencies and other regulatory authorities. Although requirements vary from state to state, these requirements may address, among others, the following: personnel education, training and records; community services; staffing; physical plant specifications; furnishing of resident units; food and housekeeping services; emergency evacuation plans; emergency power generator requirements; professional licensing and certification of staff; and resident rights and responsibilities. In several of the states there are different levels of care that can be provided based on the level of licensure. In addition, in several of the states in which we operate or intend to operate, assisted living communities, home health agencies and/or skilled nursing facilities require a certificate of need before the community can be opened or the services at an existing community can be expanded. Senior living communities may also be subject to state and/or local building, zoning, fire and food service codes and must be in compliance with these local codes before licensing or certification may be granted. These laws and regulatory requirements could affect our ability to expand into new markets and to expand our services and communities in existing markets.
Unannounced surveys or inspections may occur annually or bi-annually, or following a regulator's receipt of a complaint about the provider. From time to time in the ordinary course of business, we receive survey reports from state regulatory bodies resulting from such inspections or surveys. Most inspection deficiencies are resolved through a plan of corrective action relating to the community's operations, but the reviewing agency may have the authority to take further action against a licensed or certified community, which could result in the imposition of fines, imposition of a provisional or conditional license, suspension or revocation of a license, suspension or denial of admissions, loss of certification as a provider under federal reimbursement programs or imposition of other sanctions, including criminal penalties. Loss, suspension or modification of a license may also cause us to default under our debt and lease documents and/or trigger cross-defaults. Sanctions may be taken against providers or facilities without regard to the providers' or facilities' history of compliance. We may also expend considerable resources to respond to federal and state investigations or other enforcement action under applicable laws or regulations. To date, none of the deficiency reports received by us has resulted in a suspension, fine or other disposition that has had a material adverse effect on our revenues. However, any future substantial failure to comply with any applicable legal and regulatory requirements could result in a material adverse effect to our business as a whole. In addition, states Attorneys General vigorously enforce consumer protection laws as those laws relate to the senior living industry. State Medicaid Fraud and Abuse Units may also investigate assisted living communities even if the community or any of its residents do not receive federal or state funds.
Regulation of the senior living industry is evolving at least partly because of the growing interests of a variety of advocacy organizations and political movements attempting to standardize regulations for certain segments of the industry, particularly assisted living. Our operations could suffer if future regulatory developments, such as federal assisted living laws and regulations, as well as mandatory increases in the scope and severity of deficiencies determined by survey or inspection officials or increase the number of citations that can result in civil or criminal penalties. Certain current state laws and regulations allow enforcement officials to make determinations on whether the care provided by one or more of our communities exceeds the level of care for which the community is licensed. Furthermore, certain states may allow citations in one community to impact other communities in the state. Revocation or suspension of a license, or a citation, at a given community could therefore impact our ability to obtain new licenses or to renew existing licenses at other communities, which may also cause us to be in default under our loan or lease agreements and trigger cross-defaults or may also trigger defaults under certain of our credit agreements, or adversely affect our ability to operate and/or obtain financing in the future. If a state were to find that one community's citation will impact another of our communities, this will also increase costs and result in increased surveillance by the state survey agency. If regulatory requirements increase, whether through enactment of new laws or regulations or changes in the enforcement of existing rules, including increased enforcement brought about by advocacy groups, in addition to federal and state regulators, our operations could be adversely affected. In addition, any adverse finding by survey and inspection officials may serve as the basis for false claims lawsuits by private plaintiffs and may lead to investigations under federal and state laws, which may result in civil and/or criminal penalties against the community or individual.
There are various extremely complex federal and state laws governing a wide array of referrals, relationships and arrangements and prohibiting fraud by health care providers, including those in the senior living industry, and governmental agencies are devoting increasing attention and resources to such anti-fraud initiatives. The Health Insurance Portability and Accountability Act of 1996, or HIPAA, and the Balanced Budget Act of 1997 expanded the penalties for health care fraud. In addition, with respect to our participation in federal health care reimbursement programs, the government or private individuals acting on behalf of the government may bring an action under the False Claims Act alleging that a health care provider has defrauded the government and seek treble damages for false claims and the payment of additional monetary civil penalties. The False Claims Act allows a private individual with knowledge of fraud to bring a claim on behalf of the federal government and earn a percentage of the federal government's recovery. Because of these incentives, so-called "whistleblower" suits have become more frequent.
17
Additionally, since we operate communities that participate in federal and/or state health care reimbursement programs, we are subject to federal and state laws that prohibit anyone from presenting, or causing to be presented, claims for reimbursement which are false, fraudulent or are for items or services that were not provided as claimed. Similar state laws vary from state to state. Violation of any of these laws can result in loss of licensure, citations, sanctions and other criminal or civil fines and penalties, the refund of overpayments, payment suspensions, or termination of participation in Medicare and Medicaid programs, which may also cause us to default under our debt and lease documents and/or trigger cross-defaults.
We are also subject to certain federal and state laws that regulate financial arrangements by health care providers, such as the Federal Anti-Kickback Law, the Stark laws and certain state referral laws. The Federal Anti-Kickback Law makes it unlawful for any person to offer or pay (or to solicit or receive) "any remuneration ... directly or indirectly, overtly or covertly, in cash or in kind" for referring or recommending for purchase any item or service which is eligible for payment under the Medicare and/or Medicaid programs. Authorities have interpreted this statute very broadly to apply to many practices and relationships between health care providers and sources of patient referral. If we were to violate the Federal Anti-Kickback Law, we may face criminal penalties and civil sanctions, including fines and possible exclusion from government reimbursement programs, which may also cause us to default under our leases and loan agreements and/or trigger cross-defaults. Adverse consequences may also result if we violate federal Stark laws related to certain Medicare and Medicaid physician referrals. While we endeavor to comply with all laws that regulate the licensure and operation of our senior living communities, it is difficult to predict how our revenues could be affected if we were subject to an action alleging such violations.
We are also subject to federal and state laws designed to protect the confidentiality of patient health information. The United States Department of Health and Human Services has issued rules pursuant to HIPAA relating to the privacy of such information. Rules that became effective in 2003 govern our use and disclosure of health information at certain HIPAA covered communities. We established procedures to comply with HIPAA privacy requirements at these communities. We were required to be in compliance with the HIPAA rule establishing administrative, physical and technical security standards for health information by 2005. To the best of our knowledge, we are in compliance with these rules.
Environmental Matters
Under various federal, state and local environmental laws, a current or previous owner or operator of real property, such as us, may be held liable in certain circumstances for the costs of investigation, removal or remediation of certain hazardous or toxic substances, including, among others, petroleum and materials containing asbestos, that could be located on, in, at or under a property, regardless of how such materials came to be located there. Additionally, such an owner or operator of real property may incur costs relating to the release of hazardous or toxic substances, including government fines and payments for personal injuries or damage to adjacent property. The cost of any required investigation, remediation, removal, mitigation, compliance, fines or personal or property damages and our liability therefore could exceed the property's value and/or our assets' value. In addition, the presence of such substances, or the failure to properly dispose of or remediate the damage caused by such substances, may adversely affect our ability to sell such property, to attract additional residents and retain existing residents, to borrow using such property as collateral or to develop or redevelop such property. In addition, such laws impose liability for investigation, remediation, removal and mitigation costs on persons who disposed of or arranged for the disposal of hazardous substances at third-party sites. Such laws and regulations often impose liability without regard to whether the owner or operator knew of, or was responsible for, the presence, release or disposal of such substances as well as without regard to whether such release or disposal was in compliance with law at the time it occurred. Moreover, the imposition of such liability upon us could be joint and several, which means we could be required to pay for the cost of cleaning up contamination caused by others who have become insolvent or otherwise judgment proof. We do not believe that we have incurred such liabilities that would have a material adverse effect on our business, financial condition and results of operations.
Our operations are subject to regulation under various federal, state and local environmental laws, including those relating to: the handling, storage, transportation, treatment and disposal of medical waste products generated at our communities; identification and warning of the presence of asbestos-containing materials in buildings, as well as removal of such materials; the presence of other substances in the indoor environment; and protection of the environment and natural resources in connection with development or construction of our properties.
Some of our communities generate infectious or other hazardous medical waste due to the illness or physical condition of the residents, including, for example, blood-contaminated bandages, swabs and other medical waste products and incontinence products of those residents diagnosed with an infectious disease. The management of infectious medical waste, including its handling, storage, transportation, treatment and disposal, is subject to regulation under various federal, state and local environmental laws. These environmental laws set forth the management requirements for such waste, as well as related permit, record-keeping, notice and reporting obligations. Each of our communities has an agreement with a waste management company for the proper disposal of all infectious medical waste. The use of such waste management companies does not immunize us from alleged violations of
18
such medical waste laws for operations for which we are responsible even if carried out by such waste management companies, nor does it immunize us from third-party claims for the cost to cleanup disposal sites at which such wastes have been disposed. Any finding that we are not in compliance with environmental laws could adversely affect our business, financial condition, results of operations and cash flow.
Federal regulations require building owners and those exercising control over a building's management to identify and warn, via signs and labels, their employees and certain other employers operating in the building of potential hazards posed by workplace exposure to installed asbestos-containing materials and potential asbestos-containing materials in their buildings. The regulations also set forth employee training, record-keeping requirements and sampling protocols pertaining to asbestos-containing materials and potential asbestos-containing materials. Significant fines can be assessed for violation of these regulations. Building owners and those exercising control over a building's management may be subject to an increased risk of personal injury lawsuits by workers and others exposed to asbestos-containing materials and potential asbestos-containing materials. The regulations may affect the value of a building containing asbestos-containing materials and potential asbestos-containing materials in which we have invested. Federal, state and local laws and regulations also govern the removal, encapsulation, disturbance, handling and/or disposal of asbestos-containing materials and potential asbestos-containing materials when such materials are in poor condition or in the event of construction, remodeling, renovation or demolition of a building. Such laws may impose liability for improper handling or a release to the environment of asbestos-containing materials and potential asbestos-containing materials and may provide for fines to, and for third parties to seek recovery from, owners or operators of real properties for personal injury or improper work exposure associated with asbestos-containing materials and potential asbestos-containing materials.
The presence of mold, lead-based paint, contaminants in drinking water, radon and/or other substances at any of the communities we own or may acquire may lead to the incurrence of costs for remediation, mitigation or the implementation of an operations and maintenance plan. Furthermore, the presence of mold, lead-based paint, contaminants in drinking water, radon and/or other substances at any of the communities we own or may acquire may present a risk that third parties will seek recovery from the owners, operators or tenants of such properties for personal injury or property damage. In some circumstances, areas affected by mold may be unusable for periods of time for repairs, and even after successful remediation, the known prior presence of extensive mold could adversely affect the ability of a community to retain or attract residents and could adversely affect a community's market value.
We believe that we are in material compliance with applicable environmental laws.
We are unable to predict the future course of federal, state and local environmental regulation and legislation. Changes in the environmental regulatory framework (including legislative or regulatory efforts designed to address climate change, such as the proposed "cap and trade" legislation) could have a material adverse effect on our business. In addition, because environmental laws vary from state to state, expansion of our operations to states where we do not currently operate may subject us to additional restrictions on the manner in which we operate our communities.
Available Information
Our Annual Report on Form 10-K, Quarterly Reports on Form 10-Q, Current Reports on Form 8-K, and amendments to these reports, are available free of charge through our web site as soon as reasonably practicable after we electronically file such material with, or furnish it to, the Securities and Exchange Commission, at the following address: www.brookdale.com. The information within, or that can be accessed through, the web site is not part of this report.
We have posted our Corporate Governance Guidelines, Code of Business Conduct and Ethics and the charters of our Audit, Compensation, Investment and Nominating and Corporate Governance Committees on our web site at www.brookdale.com. In addition, our Code of Ethics for Chief Executive and Senior Financial Officers, which applies to our President and Chief Executive Officer, Chief Financial Officer, Chief Accounting Officer, Treasurer and Controller is also available on our website. Our corporate governance materials are available in print free of charge to any stockholder upon request to our Corporate Secretary, Brookdale Senior Living Inc., 111 Westwood Place, Suite 400, Brentwood, Tennessee 37027.
|
Item 1A.
|
Risk Factors.
|
Risks Related to Our Business
Due to the dependency of our revenues on private pay sources, events which adversely affect the ability of seniors to afford our resident fees or entrance fees (including downturns in the economy, housing market, consumer confidence or the equity markets and unemployment among resident family members) could cause our occupancy, revenues, results of operations and cash flow to decline.
19
Costs to seniors associated with independent and assisted living services are not generally reimbursable under government reimbursement programs such as Medicare and Medicaid. Only seniors with income or assets meeting or exceeding the comparable median in the regions where our communities are located typically can afford to pay our monthly resident fees. Economic downturns, softness in the housing market, higher levels of unemployment among resident family members, lower levels of consumer confidence, stock market volatility and/or changes in demographics could adversely affect the ability of seniors to afford our resident fees or entrance fees. If we are unable to retain and/or attract seniors with sufficient income, assets or other resources required to pay the fees associated with independent and assisted living services and other service offerings, our occupancy, revenues, results of operations and cash flow could decline.
Changes in the reimbursement rates or methods or timing of payment from government reimbursement programs, including the Medicare and Medicaid programs, or the implementation of other measures to reduce reimbursement for our senior living and ancillary services could adversely affect our revenues, results of operations and cash flow.
We rely on reimbursement from government programs, including Medicare and Medicaid, for a portion of our revenues, and we cannot provide assurance that reimbursement levels will not decrease in the future, which could adversely affect our revenues, results of operations and cash flow. Reimbursements from Medicare and Medicaid represented 12.6% and 2.7%, respectively, of our total resident fee revenues for the year ended December 31, 2017. During such period, Medicare reimbursements represented 86.3% of our Ancillary Services segment revenue, and Medicare and Medicaid reimbursements represented 23.1% of our CCRCs-Rental segment revenue. See “Item 1. Business—Government Regulation” for more information regarding these programs, including the impact of recent legislation on such programs.
Congress continues to discuss deficit and medical spending reduction measures, leading to a high degree of uncertainty regarding potential reforms to government reimbursement programs, including Medicare and Medicaid. These discussions, along with other recent reforms and continuing efforts to reform government reimbursement programs, both as part of the Affordable Care Act and otherwise, could result in major changes in the healthcare delivery and reimbursement systems on both the national and state levels. Weak economic conditions also could adversely affect federal and state budgets, which could result in attempts to reduce or eliminate payments for federal and state reimbursement programs, including Medicare and Medicaid.
Though we cannot predict what reform proposals will be adopted or finally implemented, healthcare reform and regulations may have a material adverse effect on our business, financial position, results of operations, and cash flow through, among other things, decreasing funds available for our services or increasing our operating costs. Continuing efforts of government to contain healthcare costs could materially and adversely affect us, and reimbursement levels may not remain at levels comparable to present levels or may not be sufficient to cover the costs allocable to patients eligible for reimbursement. During 2016, we significantly reduced the number of our outpatient therapy clinics located in our communities due, in part, to lower reimbursement rates making the business less attractive.
The impact of ongoing health care reform efforts on our business cannot accurately be predicted.
The health care industry in the United States is subject to fundamental changes due to ongoing health care reform efforts and related political, economic and regulatory influences. Notably, the Affordable Care Act resulted in expanded health care coverage to millions of previously uninsured people beginning in 2014 and has resulted in significant changes to the United States health care system. To help fund this expansion, the Affordable Care Act outlines certain reductions for Medicare reimbursed services, including skilled nursing, home health, hospice and outpatient therapy services, as well as certain other changes to Medicare payment methodologies. This comprehensive health care legislation has resulted and will continue to result in extensive rulemaking by regulatory authorities, and also may be altered, amended, repealed or replaced. It is difficult to predict the full impact of the Affordable Care Act due to the complexity of the law and implementing regulations, as well our inability to foresee how CMS and other participants in the health care industry will respond to the choices available to them under the law. We also cannot accurately predict whether any new or pending legislative proposals will be adopted or, if adopted, what effect, if any, these proposals would have on our business. Similarly, while we can anticipate that some of the rulemaking that will be promulgated by regulatory authorities will affect us and the manner in which we are reimbursed by the federal reimbursement programs, we cannot accurately predict today the impact of those regulations on our business. The provisions of the legislation and other regulations implementing the provisions of the Affordable Care Act or any amended or replacement legislation may increase our costs, decrease our revenues, expose us to expanded liability or require us to revise the ways in which we conduct our business.
In addition to its impact on the delivery and payment for health care, the Affordable Care Act and the implementing regulations have resulted and may continue to result in increases to our costs to provide health care benefits to our employees. We also may be required to make additional employee-related changes to our business as a result of provisions in the Affordable Care Act or
20
any amended or replacement legislation impacting the provision of health insurance by employers, which could result in additional expense and adversely affect our results of operations and cash flow.
Overbuilding and increased competition may adversely affect our occupancy, revenues, results of operations and cash flow.
The senior living industry is highly competitive. We compete with numerous other companies that provide long-term care alternatives such as home healthcare agencies, community-based service programs, retirement communities, convalescent centers and other senior living and ancillary services providers, including not-for-profit entities. In general, regulatory and other barriers to competitive entry in the independent living and assisted living sectors of the senior living industry are not substantial. In addition, over the last several years there has been an increase in the construction of new senior housing assets. During 2016 and 2017, we experienced an elevated rate of competitive new openings, with significant new competition opening in several of our markets, which adversely affected our occupancy, revenues and results of operations. We expect this elevated rate of competitive new openings and pressures on our occupancy and rate growth to continue through 2018, although we cannot provide assurance that the elevated rate of new openings will subside according to our expectations since the senior living industry may become more competitive in the future. Such new competition that we have encountered or may encounter could limit our ability to attract new residents, raise or maintain resident fees or expand our business, which could have a material adverse effect on our occupancy, revenues, results of operations and cash flow.
Disruptions in the financial markets could affect our ability to obtain financing or to extend or refinance debt as it matures, which could negatively impact our liquidity, financial condition and the market price of our common stock.
The United States stock and credit markets have experienced significant price volatility, dislocations and liquidity disruptions, which have caused market prices of many stocks to fluctuate substantially and the spreads on prospective debt financings to widen considerably. These circumstances have materially impacted liquidity in the financial markets, making terms for certain financings less attractive, and in some cases resulted in the unavailability of financing. Uncertainty in the stock and credit markets may negatively impact our ability to access additional financing (including any refinancing or extension of our existing debt) on reasonable terms, which may negatively affect our liquidity, financial condition and the market price of our common stock.
As of
December 31, 2017
, we had three principal corporate-level debt obligations: our
$400.0 million
secured credit facility, our
$316.3 million
2.75%
convertible senior notes due
June 15, 2018
, and our separate unsecured letter of credit facilities providing for up to
$64.5 million
of letters of credit in the aggregate. If we are unable to extend (or refinance, as applicable) any of our debt or credit or letter of credit facilities prior to their scheduled maturity dates, our liquidity and financial condition could be adversely impacted. In addition, even if we are able to extend or refinance our other maturing debt or credit or letter of credit facilities, the terms of the new financing may not be as favorable to us as the terms of the existing financing.
A prolonged downturn in the financial markets may cause us to seek alternative sources of potentially less attractive financing, and may require us to further adjust our business plan accordingly. These events also may make it more difficult or costly for us to raise capital, including through the issuance of common stock. Disruptions in the financial markets could have an adverse effect on us and our business. If we are not able to obtain additional financing on favorable terms, we also may have to forego, delay or abandon some or all of our planned capital expenditures or any lease restructuring, development or acquisition opportunities that we identify, which could adversely affect our revenues, results of operations and cash flow.
General economic factors could adversely affect our financial performance and other aspects of our business.
General economic conditions, such as inflation, commodity costs, fuel and other energy costs, costs of labor, insurance and healthcare, interest rates, and tax rates, affect our facility operating, facility lease, general and administrative and other expenses, and we have no control or limited ability to control such factors. In addition, current global economic conditions and uncertainties, the potential for failures or realignments of financial institutions, and the related impact on available credit may affect us and our business partners, landlords, counterparties and residents or prospective residents in an adverse manner including, but not limited to, reducing access to liquid funds or credit, increasing the cost of credit, limiting our ability to manage interest rate risk, increasing the risk that certain of our business partners, landlords or counterparties would be unable to fulfill their obligations to us, and other impacts which we are unable to fully anticipate.
If we are unable to generate sufficient cash flow to cover required interest and lease payments, this would result in defaults of the related debt or leases and cross-defaults under our other debt or lease documents, which would adversely affect our capital structure, financial condition, results of operations and cash flow.
We have significant indebtedness and lease obligations, and we intend to continue financing our communities through mortgage financing, long-term leases and other types of financing, including borrowings under our line of credit and future credit facilities
21
we may obtain. We cannot give any assurance that we will generate sufficient cash flow from operations to cover required interest, principal and lease payments. Any non-payment or other default under our financing arrangements could, subject to cure provisions, cause the lender to foreclose upon the community or communities securing such indebtedness or, in the case of a lease, cause the lessor to terminate the lease, each with a consequent loss of revenue and asset value to us. Furthermore, in some cases, indebtedness is secured by both a mortgage on a community (or communities) and a guaranty by us and/or one or more of our subsidiaries. In the event of a default under one of these scenarios, the lender could avoid judicial procedures required to foreclose on real property by declaring all amounts outstanding under the guaranty immediately due and payable, and requiring the respective guarantor to fulfill its obligations to make such payments. The realization of any of these scenarios would have an adverse effect on our financial condition and capital structure. Additionally, a foreclosure on any of our properties could cause us to recognize taxable income, even if we did not receive any cash proceeds in connection with such foreclosure. Further, because many of our outstanding debt and lease documents contain cross-default and cross-collateralization provisions, a default by us related to one community could affect a significant number of our communities and their corresponding financing arrangements and leases. In the event of such a default, we may not be able to obtain a waiver from the lender or lessor on terms acceptable or favorable to us, or at all, which would have a negative impact on our capital structure and financial condition.
Our indebtedness and long-term leases could adversely affect our liquidity and our ability to operate our business.
Our level of indebtedness and our long-term leases could adversely affect our future operations and/or impact our stockholders for several reasons, including, without limitation:
|
•
|
We may have little or no cash flow apart from cash flow that is dedicated to the payment of any interest, principal or amortization required with respect to outstanding indebtedness and lease payments with respect to our long-term leases;
|
|
•
|
Increases in our outstanding indebtedness, leverage and long-term leases will increase our vulnerability to adverse changes in general economic and industry conditions, as well as to competitive pressure;
|
|
•
|
Increases in our outstanding indebtedness may limit our ability to obtain additional financing for working capital, capital expenditures, expansions, repositionings, new developments, acquisitions, general corporate and other purposes; and
|
|
•
|
Our ability to pay dividends to our stockholders may be limited.
|
Our ability to make payments of principal and interest on our indebtedness and to make lease payments on our leases depends upon our future cash flow performance, which will be subject to general economic conditions, industry cycles and financial, business and other factors affecting our operations, many of which are beyond our control. Our business might not continue to generate cash flow at or above current levels. If we are unable to generate sufficient cash flow from operations in the future to service our debt or to make lease payments on our leases, we may be required, among other things, to seek additional financing in the debt or equity markets, refinance or restructure all or a portion of our indebtedness or leases, sell selected assets, reduce or delay planned capital expenditures or delay or abandon desirable acquisitions. These measures might not be sufficient to enable us to service our debt or to make lease payments on our leases. The failure to make required payments on our debt or leases could result in an adverse effect on our future ability to generate revenues and our results of operations and cash flow. Any contemplated financing, refinancing, restructuring, or sale of assets might not be available on economically favorable terms to us. In addition, certain of our debt agreements contain extension options. If we are not able to satisfy the conditions precedent to exercising these extension options our liquidity and financial condition could be negatively impacted.
Our debt and lease documents contain financial and other covenants, including covenants that limit or restrict our operations and activities (including our ability to borrow additional funds and engage in certain transactions without consent of the applicable lender or lessor), and any default under such documents could result in the acceleration of our indebtedness and cash lease obligations, the foreclosure of our mortgaged communities, the termination of our leasehold interests, and/or cross-defaults under our other debt or lease documents, any of which could materially and adversely impact our capital structure, financial condition, results of operations, cash flow and liquidity and interfere with our ability to pursue our strategy.
Certain of our debt and lease documents contain restrictions and financial covenants, such as those requiring us to maintain prescribed minimum net worth and stockholders’ equity levels and debt service and lease coverage ratios, and requiring us not to exceed prescribed leverage ratios, in each case on a consolidated, portfolio-wide, multi-community, single-community and/or entity basis. Net worth is generally calculated as stockholders' equity as calculated in accordance with GAAP, and in certain circumstances, reduced by intangible assets or liabilities or increased by deferred gains from sale-leaseback transactions and deferred entrance fee revenue. The debt service and lease coverage ratios are generally calculated as revenues less operating expenses, including an implied management fee and a reserve for capital expenditures, divided by the debt (principal and interest)
22
or lease payment. In some cases, the calculation of the applicable financial covenants (such as the calculation of our coverage ratio for the applicable portfolio for a particular period) requires interpretation of complex debt and lease provisions. A landlord has advised us that it asserts that the manner in which we have calculated compliance with a financial covenant under master leases scheduled to expire in stages over the next approximately two and one-half years that cover a total of nine communities is incorrect. We disagree with the landlord. In the event that it is ultimately determined that our method of calculating such compliance was erroneous, it is possible that the recalculation could result in our failure to be in compliance with such covenant. We have reviewed the applicable lease provisions with outside counsel and remain confident that we have been, and continue to be, in compliance with the applicable requirements of the leases. In addition, our debt and lease documents generally contain non-financial covenants, such as those requiring us to comply with Medicare or Medicaid provider requirements.
Our failure to comply with applicable covenants could constitute an event of default under the applicable debt or lease documents. Many of our debt and lease documents contain cross-default provisions so that a default under one of these instruments could cause a default under other debt and lease documents (including documents with other lenders and lessors).
These restrictions and covenants may interfere with our ability to obtain financing or to engage in other business activities, which may inhibit our ability to pursue our strategy. In addition, certain of our outstanding indebtedness and leases limit or restrict, among other things, our ability and our subsidiaries' ability to borrow additional funds, engage in a change in control transaction, dispose of all or substantially all of our or their assets, or engage in mergers or other business combinations without consent of the applicable lender or lessor. In certain circumstances, the consent of the applicable lender or lessor may be based on the lender’s or lessor’s sole discretion. Our inability to obtain the consent of applicable lenders and landlords in connection with our pursuit of any such transactions may forestall our ability to consummate such transactions. Furthermore, the costs of obtaining such consents may reduce the value that our stockholders may realize in any such transactions.
The substantial majority of our lease arrangements are structured as master leases. Under a master lease, numerous communities are leased through an indivisible lease. Due to the nature of such master leases, it is difficult to restructure the composition of our leased portfolios or economic terms of the leases without the consent of the applicable landlord. In addition, an event of default related to an individual property or limited number of properties within a master lease portfolio would result in a default on the entire master lease portfolio.
Furthermore, our debt and leases are secured by our communities and, in certain cases, a guaranty by us and/or one or more of our subsidiaries. Therefore, if an event of default has occurred under any of our debt or lease documents, subject to cure provisions in certain instances, the respective lender or lessor would have the right to declare all the related outstanding amounts of indebtedness or cash lease obligations immediately due and payable, to foreclose on our mortgaged communities, to terminate our leasehold interests, to foreclose on other collateral securing the indebtedness and leases, to discontinue our operation of leased communities and/or to pursue other remedies available to such lender or lessor. Further, an event of default could trigger cross-default provisions in our other debt and lease documents (including documents with other lenders or lessors). We cannot provide assurance that we would be able to pay the debt or lease obligations if they became due upon acceleration following an event of default.
In addition, certain of our master leases and management agreements contain radius restrictions, which limit our ability to own, develop or acquire new communities within a specified distance from certain existing communities covered by such agreements. These radius restrictions could negatively affect our ability to expand or develop or acquire senior housing communities and operating companies.
Mortgage debt and lease obligations expose us to increased risk of loss of property, which could harm our ability to generate future revenues and could have an adverse tax effect.
Mortgage debt and lease obligations increase our risk of loss because defaults on indebtedness secured by properties or pursuant to the terms of the lease may result in foreclosure actions initiated by lenders or lessors and ultimately our loss of the property securing any loans for which we are in default or cause the lessor to terminate the lease. For tax purposes, a foreclosure of any of our properties would be treated as a sale of the property for a purchase price equal to the outstanding balance of the debt secured by the mortgage. If the outstanding balance of the debt secured by the mortgage exceeds our tax basis in the property, we would recognize taxable income on foreclosure, but would not receive any cash proceeds, which could negatively impact our results of operations and cash flow. Further, our mortgage debt and leases generally contain cross-default and cross-collateralization provisions and a default on one community could affect a significant number of our communities, financing arrangements and leases.
In addition, our leases generally provide for renewal or extension options and, in certain cases, purchase options. These options generally are based upon prescribed formulas but, in certain cases, may be at fair market value. We expect to renew, extend or exercise purchase options with respect to our leases in the normal course of business; however, there can be no assurance that
23
these rights will be exercised in the future or that we will be able to satisfy the conditions precedent to exercising any such renewal, extension or purchase options. Furthermore, the terms of any such options that are based on fair market value are inherently uncertain and could be unacceptable or unfavorable to us depending on the circumstances at the time of exercise. If we are not able to renew or extend our existing leases, or purchase the communities subject to such leases, at or prior to the end of the existing lease terms, or if the terms of such options are unfavorable or unacceptable to us, our business, results of operations and cash flow could be adversely affected.
Increases in market interest rates could significantly increase the costs of our unhedged debt and lease obligations, which could adversely affect our results of operations and cash flow.
Our unhedged floating-rate debt and lease payment obligations and any unhedged floating-rate debt incurred in the future, exposes us to interest rate risk. Therefore, increases in prevailing interest rates could increase our payment obligations, which would negatively impact our results of operations and cash flow.
Increases in the cost and availability of labor, including increased competition for or a shortage of skilled personnel, increased wage pressures or increased union activity, could have an adverse effect on our business, results of operations and cash flow.
Our success depends on our ability to retain and attract skilled management personnel who are responsible for the day-to-day operations of each of our communities. Each community has an Executive Director responsible for the overall day-to-day operations of the community, including quality of care and service, social services and financial performance. Depending upon the size of the community, each Executive Director is supported by a community staff member (health and wellness director or nursing director) who is directly responsible for day-to-day care of residents and community sales/marketing staff with regional support to oversee the community's sales, marketing and community outreach programs. Other key positions supporting each community may include individuals responsible for food service, healthcare services, activities, housekeeping and maintenance.
We compete with various health care service providers, including other senior living providers, in retaining and attracting qualified and skilled personnel. Increased competition for or a shortage of nurses, therapists or other trained personnel, or general inflationary pressures may require that we enhance our pay and benefits package to compete effectively for such personnel. In addition, we have experienced and may continue to experience wage pressures due to minimum wage increases mandated by state and local laws and the increase to the salary thresholds for overtime exemptions under the Fair Labor Standards Act, which were adopted by the Department of Labor in May 2016. The changes to the thresholds for overtime exemptions were to be effective December 1, 2016, but were struck down by a United States District Court in 2017, prior to their implementation. The Department of Labor appealed the District Court’s decision and then moved to stay the case pending further rule-making efforts. It is unclear what rule changes adopted by the Department of Labor ultimately will become effective. If such rule changes result in higher operating costs, we may not be able to offset such added costs resulting from competitive, inflationary or regulatory pressures by increasing the rates we charge to our residents or our service charges, which would negatively impact our results of operations and cash flow.
Turnover rates and the magnitude of the shortage of nurses, therapists or other trained personnel varies substantially from market to market. If we fail to attract and retain qualified and skilled personnel, our ability to conduct our business operations effectively, our overall operating results and cash flow could be harmed.
In addition, efforts by labor unions to unionize any of our community personnel could divert management attention, lead to increases in our labor costs and/or reduce our flexibility with respect to certain workplace rules. New election rules promulgated by the National Labor Relations Board went into effect in April 2015 and substantially changed - and expedited - the union election process, thereby limiting the time available for us to attempt to persuade employees to vote against representation. If we experience an increase in organizing activity, if onerous collective bargaining agreement terms are imposed upon us, or if we otherwise experience an increase in our staffing and labor costs, our results of operations and cash flow would be negatively affected.
We have a history of losses and we may not be able to achieve profitability.
We have incurred net losses in every year since our formation in June 2005. Given our history of losses, there can be no assurance that we will be able to achieve and/or maintain profitability in the future. If we do not effectively manage our cash flow and business operations going forward or otherwise achieve profitability, our stock price could be adversely affected.
Pending and future disposition transactions are subject to closing conditions, including the receipt of regulatory approvals, likely will result in reductions to our revenue and may result in reductions to our results of operations and cash flow.
During 2018, we expect to close on the dispositions of 15 owned communities classified as held for sale as of December 31, 2017, the terminations of our triple-net leases on 33 communities and the pending terminations of management agreements on 37
24
communities. In addition, we plan to market in 2018 and sell approximately 30 owned communities, and we plan to continue to evaluate our owned and leased community portfolios for opportunities to dispose of owned communities and terminate leases, and to evaluate and, where opportunities arise, pursue lease restructurings (which may take the form of non-renewal of leases, negotiation of revised lease terms, termination of leases in favor of venture structures in which we would have an interest and, to a lesser degree, the purchase of the leased communities). The closing of any such dispositions, or those we identify in the future, generally are subject to closing conditions, including the receipt of regulatory approvals, and we cannot provide assurance that any such transactions will close or, if they do, when the actual closings will occur. The sales price for pending or future dispositions may not meet our expectations due to the underlying performance of such communities or conditions beyond our control, and we may be required to take impairment charges in connection with such sales if the carrying amounts of such assets exceed the proposed sales prices, which could adversely affect our financial condition and results of operations. Further, we cannot provide assurance that we will be successful in identifying and pursuing disposition opportunities on terms that are acceptable to us, or at all. We may be required to pay significant amounts to restructure leases and we may be required to take charges in connection with restructuring of leases, which could adversely affect our financial condition and results of operations.
Completion of the dispositions of communities through sales or lease terminations, including pending transactions and those we enter into in the future, likely will result in reductions to our revenue and may result in reductions to our results of operations and cash flow. Further, if we are unable to reduce our general and administrative expense with respect to completed dispositions and lease terminations in accordance with our expectations, we may not realize the expected benefits of such transactions, which could negatively impact our anticipated results of operations and cash flow.
We may need additional capital to fund our operations, to execute on our strategy and to pursue any lease restructuring, development or acquisition opportunities, and we may not be able to obtain it on terms acceptable to us, or at all.
Execution on our strategy may require additional capital, particularly if we were to identify and pursue lease restructuring, development or acquisition opportunities. Financing may not be available to us or may be available to us only on terms that are not favorable. In addition, certain of our outstanding indebtedness and long-term leases restrict, among other things, our ability to incur additional debt. If we are unable to raise additional funds or obtain them on terms acceptable to us, we may have to delay or abandon some or all of our plans or opportunities. Further, if additional funds are raised through the issuance of additional equity securities, the percentage ownership of our stockholders would be diluted. Any newly issued equity securities may have rights, preferences or privileges senior to those of our common stock.
We are heavily dependent on mortgage financing provided by Federal National Mortgage Association ("Fannie Mae") and Federal Home Loan Mortgage Corporation ("Freddie Mac") (collectively, the "Agency Lenders"). The Agency Lenders are currently operating under a conservatorship begun in 2008, conducting business under the direction of the Federal Housing Finance Agency. Reform efforts related to the Agency Lenders may make such financing sources less available or unavailable in the future and may cause us to seek alternative sources of potentially less attractive financing. There can be no assurance that such alternative sources will be available.
If we are unable to expand, renovate, reposition or redevelop our communities in accordance with our plans, our anticipated revenues, results of operations and cash flow could be adversely affected.
We are currently working on projects that will expand, renovate, reposition or redevelop a number of our existing senior living communities. These projects are in various stages of development and are subject to a number of factors over which we have little or no control. These factors include the necessity of arranging separate leases, mortgage loans or other financings to provide the capital required to complete these projects; difficulties or delays in obtaining zoning, land use, building, occupancy, licensing, certificate of need and other required governmental permits and approvals; failure to complete construction of the projects on budget and on schedule; failure of third-party contractors and subcontractors to perform under their contracts; shortages of labor or materials that could delay projects or make them more expensive; adverse weather conditions that could delay completion of projects; increased costs resulting from general economic conditions or increases in the cost of materials; and increased costs as a result of changes in laws and regulations. We cannot provide assurance that we will elect to undertake or complete all of our proposed expansion, renovation, repositioning and redevelopment projects, or that we will not experience delays in completing those projects. In addition, we may incur substantial costs prior to achieving stabilized occupancy for each such project and cannot assure you that these costs will not be greater than we have anticipated. We also cannot provide assurance that any of our expansion, renovation, repositioning or redevelopment projects will be economically successful. Our failure to achieve our expansion, renovation, repositioning and redevelopment plans could adversely impact our anticipated revenues, results of operations and cash flow.
We may encounter difficulties in acquiring communities at attractive prices or integrating acquisitions with our operations, which may adversely affect our financial condition, results of operations and cash flow.
25
We will continue to selectively target strategic acquisitions as opportunities arise. To the extent we do identify and complete any future acquisition opportunities, the process of identifying potential acquisition candidates, completing acquisition transactions and integrating acquired communities or businesses into our existing operations may result in unforeseen operating difficulties, divert managerial attention or require significant financial or other resources. These acquisitions and other future acquisitions may require us to incur additional indebtedness and contingent liabilities, and may result in unforeseen expenses or compliance issues, which may adversely affect our revenue growth, results of operations and cash flow. Moreover, any future acquisitions may not generate any additional income for us or provide any benefit to our business. In addition, we may not be able to locate and acquire communities or businesses at attractive prices in locations that are compatible with our strategy or that competition for the acquisition of communities will not increase. Finally, when we are able to locate communities and enter into definitive agreements to acquire or lease them, we cannot provide assurance that the transactions will be completed. Failure to complete transactions after we have entered into definitive agreements may result in significant expenses to us.
Unforeseen costs associated with acquisitions could negatively affect our results of operations and cash flow.
We plan to continue to selectively target strategic acquisitions of operating companies, senior living communities and ancillary services companies as opportunities arise. Despite our extensive underwriting and due diligence procedures, operating companies and communities that we have previously acquired or may acquire in the future may generate unexpectedly low or no returns or may not meet a risk profile that our investors find acceptable. In addition, we might encounter unanticipated difficulties and expenditures relating to any of the acquired operating companies and communities, including contingent liabilities, or newly acquired communities or operating companies might require significant management attention that would otherwise be devoted to our ongoing business. For example, a community may require capital expenditures in excess of budgeted amounts, or it may experience management turnover that is higher than we project. These costs may negatively affect our future results of operations and cash flow.
Competition for the acquisition of strategic assets from buyers with greater financial resources or lower costs of capital than us or that have lower return expectations than we do could limit our ability to compete for strategic acquisitions and therefore to grow our business effectively.
Several publicly-traded and non-traded real estate investment trusts, or REITs, and private equity firms have similar asset acquisition objectives as we do, along with greater financial resources and/or lower costs of capital than we are able to obtain. This may increase competition for acquisitions that would be suitable to us. There is significant competition among potential acquirers in the senior living industry, including publicly-traded and non-traded REITs and private equity firms, and there can be no assurance that we will be able to successfully complete acquisitions, which could limit our ability to grow our business. Partially as a result of tax law changes enacted through RIDEA, we now compete more directly with the various publicly-traded healthcare REITs for the acquisition of senior housing properties.
Delays in obtaining regulatory approvals could hinder our plans to expand our ancillary services programs, which could negatively impact our anticipated revenues, results of operations and cash flow.
We plan to expand our offering of ancillary services, including home health and hospice, to additional markets. In the current environment, it is difficult to obtain certain required regulatory approvals. Delays in obtaining required regulatory approvals could impede our ability to expand to additional markets in accordance with our plans, which could negatively impact our anticipated revenues, results of operations and cash flow.
Our investment in our entrance fee CCRC venture with HCP is susceptible to risks associated with the lifecare benefits offered to the residents of the venture's lifecare entrance fee communities, and we are also susceptible to such risks for our owned and/or operated entrance fee CCRCs.
As of
December 31, 2017
, we managed lifecare entrance fee communities as part of our entrance fee CCRC venture with HCP, and we owned and/or operated other lifecare communities. Residents of these communities typically receive a limited lifecare benefit and pay an upfront entrance fee upon occupancy, of which a portion is generally refundable, with an additional monthly service fee while living in the community. This limited lifecare benefit is typically a certain number of free days in the community's health center during the resident's lifetime and/or a discounted rate for such services. The lifecare benefit varies based upon the extent to which the resident's entrance fee is refundable. The pricing of entrance fees, refundability provisions, monthly service fees, and lifecare benefits are determined utilizing actuarial projections of the expected morbidity and mortality of the resident population. In the event the entrance fees and monthly service payments established for these communities are not sufficient to cover the cost of lifecare benefits granted to residents, our interest in the results of operations and cash flow of these communities and the venture could be adversely affected.
26
Residents of these entrance fee communities are guaranteed a living unit and nursing care at the community during their lifetime, even if the resident exhausts his or her financial resources and becomes unable to satisfy his or her obligations to the community. In addition, in the event a resident requires nursing care and there is insufficient capacity for the resident in the nursing facility at the community where the resident lives, the community must contract with a third party to provide such care. Although we screen potential residents to ensure that they have adequate assets, income, and reimbursements from government programs and third parties to pay their obligations to the entrance fee communities during their lifetime, we cannot assure you that such assets, income, and reimbursements will be sufficient in all cases. If insufficient, we or the entrance fee CCRC venture, as applicable, would have rights of set-off against the refundable portions of the residents' deposits, and would also seek available reimbursement under Medicaid or other available programs. To the extent that the financial resources of some of the residents are not sufficient to pay for the cost of facilities and services provided to them, or in the event that these communities must pay third parties to provide nursing care to residents of these communities, our interest in the results of operations and cash flow of these communities and the venture would be adversely affected.
Early termination or non-renewal of our management agreements could cause a loss in revenues and negatively impact our results of operations and cash flow.
We operate certain of our communities pursuant to management agreements. In some of these cases, the controlling financial interest in the community is held by third parties and, in other cases, the community is owned by an unconsolidated venture in which we have an ownership interest. As of
December 31, 2017
, we managed
229
communities, representing approximately
33.7%
of our capacity, for third parties or unconsolidated ventures. The majority of our management agreements are long-term agreements. In most cases, either party to the agreements may terminate upon the occurrence of an event of default caused by the other party. In addition, in some cases, subject to our rights, if any, to cure deficiencies, community owners may terminate us as manager if any licenses or certificates necessary for operation are revoked, if we do not satisfy certain designated performance thresholds or if the community is sold to an unrelated third party (in which case we may be entitled to receive a contractual termination fee). Also, in some instances, a community owner may terminate the management agreement relating to a particular community if we are in default under other management agreements relating to other communities owned by the same owner or its affiliates. Certain of our management agreements, both with unconsolidated ventures and with entities owned by third parties, provide that an event of default under the debt instruments applicable to the ventures or the entities owned by third parties that is caused by us may also be considered an event of default by us under the relevant management agreement, giving the non-Brookdale party to the management agreement the right to pursue the remedies provided for in the management agreement, potentially including termination of the management agreement. Further, in the event of default on a loan, the lender may have the ability to terminate us as manager. With respect to communities held in unconsolidated ventures, in some cases, the management agreement can be terminated in connection with the sale by the venture partner of its interest in the venture or the sale of properties by the venture. Early termination of our management agreements or non-renewal or renewal on less-favorable terms could cause a loss in revenues and could negatively impact our results of operations and cash flow.
The geographic concentration of our communities could leave us vulnerable to an economic downturn, regulatory changes or acts of nature in those areas, which could negatively impact our revenues, results of operations and cash flow.
We have a high concentration of communities in various geographic areas, including the states of California, Florida and Texas. As a result of this concentration, the conditions of local economies and real estate markets, changes in governmental rules and regulations, particularly with respect to assisted living communities, acts of nature and other factors that may result in a decrease in demand for senior living services in these states could have an adverse effect on our revenues, results of operations and cash flow. In addition, given the location of our communities, we are particularly susceptible to revenue loss, cost increase or damage caused by severe weather conditions or natural disasters such as hurricanes, wildfires, earthquakes or tornados. Any significant loss due to a natural disaster may not be covered by insurance and may lead to an increase in the cost of insurance.
Termination of our resident agreements and vacancies in the living spaces we lease could adversely affect our occupancy, revenues, results of operations and cash flow.
State regulations governing assisted living communities require written resident agreements with each resident. Several of these regulations also require that each resident have the right to terminate the resident agreement for any reason on reasonable notice. Consistent with these regulations, many of our assisted living resident agreements allow residents to terminate their agreements upon 0 to 30 days' notice. Unlike typical apartment leasing or independent living arrangements that involve lease agreements with specified leasing periods of up to a year or longer, in many instances we cannot contract with our assisted living residents to stay in those living spaces for longer periods of time. Our retirement center resident agreements generally provide for termination of the lease upon death or allow a resident to terminate his or her lease upon the need for a higher level of care not provided at the community. If multiple residents terminate their resident agreements at or around the same time, our occupancy, revenues, results
27
of operations and cash flow could be adversely affected. In addition, because of the demographics of our typical residents, including age and health, resident turnover rates in our communities are difficult to predict. As a result, the living spaces we lease may be unoccupied for a period of time, which could adversely affect our occupancy, revenues, results of operations and cash flow.
The inability of seniors to sell real estate may delay their moving into our communities, which could negatively impact our occupancy rates, revenues, results of operations and cash flow.
Downturns in the housing markets could adversely affect the ability (or perceived ability) of seniors to afford our resident fees and entrance fees as our customers frequently use the proceeds from the sale of their homes to cover the cost of our fees. Specifically, if seniors have a difficult time selling their homes or their homes' values decrease, these difficulties could impact their ability to relocate into our communities or finance their stays at our communities with private resources. If national or local housing markets experience protracted volatility, our occupancy rates, revenues, results of operations and cash flow could be negatively impacted.
The transition of management or unexpected departure of our key officers could harm our business.
We have recently undergone changes in our senior management, may in the future experience further changes in our management, and are dependent on the efforts of our executive officers. The transition of management, the unforeseen loss or limited availability of the services of any of our executive officers, or our inability to recruit and retain qualified personnel in the future, could, at least temporarily, have an adverse effect on our business, results of operations and financial condition and be negatively perceived in the capital markets.
Our execution of our redefined strategy may not be successful, and initiatives undertaken to execute on our strategic priorities may adversely affect our business, financial condition, results of operations, cash flow and the price of our common stock.
The success of our redefined strategy depends on our ability to successfully identify and implement initiatives to execute on our strategic priorities, as well as factors outside of our control. Such initiatives may not be successful in achieving our expectations or may require more time and resources than expected to implement. There can be no assurance that our redefined strategy or initiatives undertaken to execute on our strategic priorities will be successful and, as a result, such initiatives may adversely affect our business, financial condition, results of operations, cash flow and the price of our common stock.
Environmental contamination at any of our communities could result in substantial liabilities to us, which may exceed the value of the underlying assets and which could materially and adversely affect our financial condition, results of operations and cash flow.
Under various federal, state and local environmental laws, a current or previous owner or operator of real property, such as us, may be held liable in certain circumstances for the costs of investigation, removal or remediation of, or related to the release of, certain hazardous or toxic substances, that could be located on, in, at or under a property, regardless of how such materials came to be located there. The cost of any required investigation, remediation, removal, mitigation, compliance, fines or personal or property damages and our liability therefore could exceed the property's value and/or our assets' value. In addition, the presence of such substances, or the failure to properly dispose of or remediate the damage caused by such substances, may adversely affect our ability to sell such property, to attract additional residents and retain existing residents, to borrow using such property as collateral or to develop or redevelop such property. In addition, such laws impose liability, which may be joint and several, for investigation, remediation, removal and mitigation costs on persons who disposed of or arranged for the disposal of hazardous substances at third party sites. Such laws and regulations often impose liability without regard to whether the owner or operator knew of, or was responsible for, the presence, release or disposal of such substances as well as without regard to whether such release or disposal was in compliance with law at the time it occurred. Although we do not believe that we have incurred such liabilities as would have a material adverse effect on our business, financial condition and results of operations, we could be subject to substantial future liability for environmental contamination that we have no knowledge about as of the date of this report and/or for which we may not be at fault.
Failure to comply with existing environmental laws could result in increased expenditures, litigation and potential loss to our business and in our asset value, which would have an adverse effect on our financial condition, results of operations and cash flow.
Our operations are subject to regulation under various federal, state and local environmental laws, including those relating to: the handling, storage, transportation, treatment and disposal of medical waste products generated at our communities; identification and warning of the presence of asbestos-containing materials in buildings, as well as removal of such materials; the presence of other substances in the indoor environment; and protection of the environment and natural resources in connection with development or construction of our properties.
28
Some of our communities generate infectious or other hazardous medical waste due to the illness or physical condition of the residents. Each of our communities has an agreement with a waste management company for the proper disposal of all infectious medical waste, but the use of such waste management companies does not immunize us from alleged violations of such laws for operations for which we are responsible even if carried out by such waste management companies, nor does it immunize us from third-party claims for the cost to cleanup disposal sites at which such wastes have been disposed.
Federal regulations require building owners and those exercising control over a building's management to identify and warn their employees and certain other employers operating in the building of potential hazards posed by workplace exposure to installed asbestos-containing materials and potential asbestos-containing materials in their buildings. Significant fines can be assessed for violation of these regulations. Building owners and those exercising control over a building's management may be subject to an increased risk of personal injury lawsuits. Federal, state and local laws and regulations also govern the removal, encapsulation, disturbance, handling and/or disposal of asbestos-containing materials and potential asbestos-containing materials when such materials are in poor condition or in the event of construction, remodeling, renovation or demolition of a building. Such laws may impose liability for improper handling or a release to the environment of asbestos-containing materials and potential asbestos-containing materials and may provide for fines to, and for third parties to seek recovery from, owners or operators of real properties for personal injury or improper work exposure associated with asbestos-containing materials and potential asbestos-containing materials.
The presence of mold, lead-based paint, contaminants in drinking water, radon and/or other substances at any of the communities we own or may acquire may lead to the incurrence of costs for remediation, mitigation or the implementation of an operations and maintenance plan and may result in third party litigation for personal injury or property damage. Furthermore, in some circumstances, areas affected by mold may be unusable for periods of time for repairs, and even after successful remediation, the known prior presence of extensive mold could adversely affect the ability of a community to retain or attract residents and could adversely affect a community's market value.
Although we believe that we are currently in material compliance with applicable environmental laws, if we fail to comply with such laws in the future, we would face increased expenditures both in terms of fines and remediation of the underlying problem(s), potential litigation relating to exposure to such materials, and potential decrease in value to our business and in the value of our underlying assets. Therefore, our failure to comply with existing environmental laws would have an adverse effect on our financial condition, results of operations and cash flow.
We are unable to predict the future course of federal, state and local environmental regulation and legislation. Changes in the environmental regulatory framework (including legislative or regulatory efforts designed to address climate change, such as the proposed "cap and trade" legislation) could have a material adverse effect on our business. In addition, because environmental laws vary from state to state, expansion of our operations to states where we do not currently operate may subject us to additional restrictions on the manner in which we operate our communities.
Risks Related to Pending Litigation
Complaints filed against us could, if adversely determined, subject us to a material loss.
We have been and are currently involved in litigation and claims, including putative class action claims from time to time, incidental to the conduct of our business which are generally comparable to other companies in the senior living and healthcare industries. Certain claims and lawsuits allege large damage amounts and may require significant costs to defend and resolve. Similarly, the senior living and healthcare industries are continuously subject to scrutiny by governmental regulators, which could result in litigation related to regulatory compliance matters. As a result, we maintain general liability and professional liability insurance policies in amounts and with coverage and deductibles we believe are adequate, based on the nature and risks of our business, historical experience and industry standards. Our current policies are written on a claims-made basis and provide for deductibles for each claim. Accordingly, we are, in effect, self-insured for claims that are less than the deductible amounts and for claims or portions of claims that are not covered by such policies. If we experience a greater number of losses than we anticipate, or if certain claims are not ultimately covered by insurance, our results of operations and financial condition could be adversely affected.
Risks Related to Our Industry
We face periodic and routine reviews, audits and investigations under our contracts with government agencies, and these audits could have adverse findings that may negatively impact our business, financial condition, results of operations and cash flow.
29
As a result of our participation in the Medicare and Medicaid programs, we are subject to various government reviews, audits and investigations to verify our compliance with these programs and applicable laws and regulations. CMS has engaged a number of third party firms, including Recovery Audit Contractors (RAC), Zone Program Integrity Contractors (ZPIC), and Unified Program Integrity Contractors (UPIC), to conduct extensive reviews of claims data to evaluate the appropriateness of billings submitted for payment. Audit contractors may identify overpayments based on coverage requirements, billing and coding rules or other risk areas. In addition to identifying overpayments, audit contractors can refer suspected violations of law to government enforcement authorities. An adverse determination of government reviews, audits and investigations may result in citations, sanctions and other criminal or civil fines and penalties, the refund of overpayments, payment suspensions, termination of participation in Medicare and Medicaid programs, and/or damage to the Company's business reputation. Our costs to respond to and defend any such audits, reviews and investigations may be significant and are likely to increase in the current enforcement environment, and any resulting sanctions or criminal, civil or regulatory penalties could have a material adverse effect on our business, financial condition, results of operations and cash flow.
The cost and difficulty of complying with increasing and evolving regulation and enforcement could have an adverse effect on our business, results of operations and cash flow.
The regulatory environment surrounding the senior living industry continues to evolve and intensify in the amount and type of laws and regulations affecting it, many of which vary from state to state. In addition, many senior living communities are subject to regulation and licensing by state and local health and social service agencies and other regulatory authorities. In several of the states there are different levels of care that can be provided based on the level of licensure. In addition, in several of the states in which we operate or intend to operate, assisted living communities, home health agencies and/or skilled nursing facilities require a certificate of need before the community can be opened or the services at an existing community can be expanded. These requirements, and the increased enforcement thereof, could affect our ability to expand into new markets, to expand our services and communities in existing markets and, if any of our presently licensed communities were to operate outside of its licensing authority, may subject us to penalties including closure of the community. See “Item 1. Business—Government Regulation” for more information regarding regulation and enforcement in our industry.
Federal, state and local officials are increasingly focusing their efforts on enforcement of these laws and regulations. This is particularly true for large for-profit, multi-community providers like us. Future regulatory developments as well as mandatory increases in the scope and severity of deficiencies determined by survey or inspection officials could cause our operations to suffer. We are unable to predict the future course of federal, state and local legislation or regulation. If regulatory requirements increase, whether through enactment of new laws or regulations or changes in the enforcement of existing rules, our business, results of operations and cash flow could be adversely affected.
The intensified regulatory and enforcement environment impacts providers like us because of the increase in the number of inspections or surveys by governmental authorities and consequent citations for failure to comply with regulatory requirements. We also expend considerable resources to respond to federal and state investigations or other enforcement action. From time to time in the ordinary course of business, we receive deficiency reports from state and federal regulatory bodies resulting from such inspections or surveys. Although most inspection deficiencies are resolved through a plan of corrective action, the reviewing agency may have the authority to take further action against a licensed or certified facility, which could result in the imposition of fines, imposition of a provisional or conditional license, suspension or revocation of a license, suspension or denial of admissions, loss of certification as a provider under federal reimbursement programs or imposition of other sanctions, including criminal penalties. Furthermore, certain states may allow citations in one community to impact other communities in the state. Revocation of a license at a given community could therefore impact our ability to obtain new licenses or to renew existing licenses at other communities, which may also cause us to default under our debt and lease documents and/or trigger cross-defaults. The failure to comply with applicable legal and regulatory requirements could result in a material adverse effect to our business as a whole.
There are various extremely complex federal and state laws governing a wide array of referral relationships and arrangements and prohibiting fraud by health care providers, including those in the senior living industry, and governmental agencies are devoting increasing attention and resources to such anti-fraud initiatives. Some examples are the Health Insurance Portability and Accountability Act of 1996, or HIPAA, the Balanced Budget Act of 1997, and the False Claims Act, which gives private individuals the ability to bring an action on behalf of the federal government. The violation of any of these laws or regulations may result in the imposition of fines or other penalties that could increase our costs and otherwise jeopardize our business. Under the Deficit Reduction Act of 2005, or DRA 2005, every entity that receives at least $5.0 million annually in Medicaid payments must have established written policies for all employees, contractors or agents, providing detailed information about false claims, false statements and whistleblower protections under certain federal laws, including the federal False Claims Act, and similar state laws. Failure to comply with this compliance requirement may potentially give rise to potential liability. DRA 2005 also creates an incentive for states to enact false claims laws that are comparable to the federal False Claims Act.
30
Additionally, since we provide services and operate communities that participate in federal and/or state health care reimbursement programs, we are subject to federal and state laws that prohibit anyone from presenting, or causing to be presented, claims for reimbursement which are false, fraudulent or are for items or services that were not provided as claimed. Similar state laws vary from state to state. Violation of any of these laws can result in loss of licensure, citations, sanctions and other criminal or civil fines and penalties, the refund of overpayments, payment suspensions, or termination of participation in Medicare and Medicaid programs, which may also cause us to default under our debt and lease documents and/or trigger cross-defaults.
We are also subject to certain federal and state laws that regulate financial arrangements by health care providers, such as the Federal Anti-Kickback Law, the Stark laws and certain state referral laws. Authorities have interpreted the Federal Anti-Kickback Law very broadly to apply to many practices and relationships between health care providers and sources of patient referral. If we were to violate the Federal Anti-Kickback Law, we may face criminal penalties and civil sanctions, including fines and possible exclusion from government reimbursement programs, which may also cause us to default under our debt and lease documents and/or trigger cross-defaults. Adverse consequences may also result if we violate federal Stark laws related to certain Medicare and Medicaid physician referrals. While we endeavor to comply with all laws that regulate the licensure and operation of our business, it is difficult to predict how our revenues could be affected if we were subject to an action alleging such violations.
Compliance with the Americans with Disabilities Act, Fair Housing Act and fire, safety and other regulations may require us to make unanticipated expenditures, which could increase our costs and therefore adversely affect our results of operations and financial condition.
Certain of our communities, or portions thereof, are subject to compliance with the Americans with Disabilities Act, or ADA. The ADA has separate compliance requirements for "public accommodations" and "commercial properties," but generally requires that buildings be made accessible to people with disabilities. Compliance with ADA requirements could require removal of access barriers and non-compliance could result in imposition of government fines or an award of damages to private litigants.
We must also comply with the Fair Housing Act, which prohibits us from discriminating against individuals on certain bases in any of our practices if it would cause such individuals to face barriers in gaining residency in any of our communities. Additionally, the Fair Housing Act and other state laws require that we advertise our services in such a way that we promote diversity and not limit it. We may be required, among other things, to change our marketing techniques to comply with these requirements.
In addition, we are required to operate our communities in compliance with applicable fire and safety regulations, building codes and other land use regulations and food licensing or certification requirements as they may be adopted by governmental agencies and bodies from time to time. Like other health care facilities, senior living communities are subject to periodic survey or inspection by governmental authorities to assess and assure compliance with regulatory requirements. Surveys occur on a regular (often annual or bi-annual) schedule, and special surveys may result from a specific complaint filed by a resident, a family member or one of our competitors. We may be required to make substantial capital expenditures to comply with those requirements.
Following Hurricane Irma in 2017, the State of Florida issued an emergency order requiring skilled nursing homes and assisted living communities to obtain generators and fuel necessary to sustain operations and maintain comfortable temperatures in the event of a power outage. The emergency order has been overturned and there are legislative and regulatory rulemaking actions in process to address generator requirements. We may be required to make substantial capital expenditures to comply with any legislative or administrative generator requirements ultimately adopted in Florida.
The increased costs and capital expenditures that we may incur in order to comply with any of the above would result in a negative effect on our results of operations and financial condition.
Significant legal actions and liability claims against us in excess of insurance limits could subject us to increased operating costs and substantial uninsured liabilities, which may adversely affect our financial condition and results of operations.
The senior living and healthcare services businesses entail an inherent risk of liability, particularly given the demographics of our residents, including age and health, and the services we provide. In recent years, we, as well as other participants in our industry, have been subject to an increasing number of claims and lawsuits alleging that our services have resulted in resident injury or other adverse effects. Many of these lawsuits involve large damage claims and significant legal costs. Many states continue to consider tort reform and how it will apply to the senior living industry. We may continue to be faced with the threat of large jury verdicts in jurisdictions that do not find favor with large senior living or healthcare providers. We maintain liability insurance policies in amounts and with the coverage and deductibles we believe are adequate based on the nature and risks of our business, historical experience and industry standards. We have formed a wholly-owned "captive" insurance company for the purpose of insuring certain portions of our risk retention under our general and professional liability insurance programs. There can be no guarantee that we will not have any claims that exceed our policy limits in the future.
31
If a successful claim is made against us and it is not covered by our insurance or exceeds the policy limits, our financial condition and results of operations could be materially and adversely affected. In some states, state law may prohibit or limit insurance coverage for the risk of punitive damages arising from professional liability and general liability claims and/or litigation. As a result, we may be liable for punitive damage awards in these states that either are not covered or are in excess of our insurance policy limits. Also, the above deductibles, or self-insured retention, are accrued based on an actuarial projection of future liabilities. If these projections are inaccurate and if there are an unexpectedly large number of successful claims that result in liabilities in excess of our self-insured retention, our operating results could be negatively affected. Claims against us, regardless of their merit or eventual outcome, also could have a material adverse effect on our ability to attract residents or expand our business and could require our management to devote time to matters unrelated to the day-to-day operation of our business. We also have to renew our policies every year and negotiate acceptable terms for coverage, exposing us to the volatility of the insurance markets, including the possibility of rate increases. There can be no assurance that we will be able to obtain liability insurance in the future or, if available, that such coverage will be available on acceptable terms.
Risks Related to Our Organization and Structure
Anti-takeover provisions in our amended and restated certificate of incorporation and our amended and restated by-laws may discourage, delay or prevent a merger or acquisition that investors may consider favorable or prevent the removal of our current board of directors and management.
Certain provisions of our amended and restated certificate of incorporation and our amended and restated by-laws may discourage, delay or prevent a merger or acquisition that investors may consider favorable or prevent the removal of our current board of directors and management. We have a number of anti-takeover devices in place that will hinder takeover attempts, including:
|
•
|
a staggered board of directors consisting of three classes of directors, each of whom serve three-year terms;
|
|
•
|
removal of directors only for cause, and only with the affirmative vote of at least 80% of the voting interest of stockholders entitled to vote;
|
|
•
|
blank-check preferred stock;
|
|
•
|
provisions preventing stockholders from calling special meetings or acting by written consent;
|
|
•
|
advance notice requirements for stockholders with respect to director nominations and actions to be taken at annual meetings; and
|
|
•
|
no provision in our amended and restated certificate of incorporation for cumulative voting in the election of directors, which means that the holders of a majority of the outstanding shares of our common stock can elect all the directors standing for election.
|
Additionally, our amended and restated certificate of incorporation provides that Section 203 of the Delaware General Corporation Law, which restricts certain business combinations with interested stockholders in certain situations, will not apply to us.
We are a holding company with no operations and rely on our operating subsidiaries to provide us with funds necessary to meet our financial obligations.
We are a holding company with no material direct operations. Our principal assets are the equity interests we directly or indirectly hold in our operating subsidiaries. As a result, we are dependent on loans, distributions and other payments from our subsidiaries to generate the funds necessary to meet our financial obligations. Our subsidiaries are legally distinct from us and have no obligation to make funds available to us.
Risks Related to Our Common Stock
The market price and trading volume of our common stock may be volatile, which could result in rapid and substantial losses for our stockholders.
The market price of our common stock may be highly volatile and could be subject to wide fluctuations. In addition, the trading volume in our common stock may fluctuate and cause significant price variations to occur. If the market price of our common stock declines significantly, stockholders may be unable to resell their shares at or above their purchase price. The market price
32
of our common stock may fluctuate or decline significantly in the future. Some of the factors that could negatively affect our share price or result in fluctuations in the price or trading volume of our common stock include:
|
•
|
variations in our quarterly results of operations and cash flow;
|
|
•
|
changes in our operating performance and liquidity guidance;
|
|
•
|
the contents of published research reports about us or the senior living industry or the failure of securities analysts to cover our common stock;
|
|
•
|
additions or departures of key management personnel;
|
|
•
|
any increased indebtedness we may incur or lease obligations we may enter into in the future;
|
|
•
|
actions by institutional stockholders;
|
|
•
|
changes in market valuations of similar companies;
|
|
•
|
announcements by us or our competitors of significant contracts, acquisitions, strategic partnerships, joint ventures or capital commitments;
|
|
•
|
speculation or reports by the press or investment community with respect to us or the senior living industry in general;
|
|
•
|
proxy contests or other shareholder activism;
|
|
•
|
increases in market interest rates that may lead purchasers of our shares to demand a higher yield;
|
|
•
|
downturns in the real estate market or changes in market valuations of senior living communities;
|
|
•
|
changes or proposed changes in laws or regulations affecting the senior living industry or enforcement of these laws and regulations, or announcements relating to these matters; and
|
|
•
|
general market and economic conditions.
|
Future offerings of debt or equity securities by us may adversely affect the market price of our common stock.
In the future, we may attempt to increase our capital resources by offering additional debt or equity securities, including commercial paper, medium-term notes, senior or subordinated notes, convertible securities, series of preferred shares or shares of our common stock. Upon liquidation, holders of our debt securities and preferred stock, and lenders with respect to other borrowings, would receive a distribution of our available assets prior to the holders of our common stock. Additional equity offerings may dilute the economic and voting rights of our existing stockholders or reduce the market price of our common stock, or both. Shares of our preferred stock, if issued, could have a preference with respect to liquidating distributions or a preference with respect to dividend payments that could limit our ability to pay dividends to the holders of our common stock. Because our decision to issue securities in any future offering will depend on market conditions and other factors beyond our control, we cannot predict or estimate the amount, timing or nature of our future offerings. Thus, holders of our common stock bear the risk of our future offerings reducing the market price of our common stock and diluting their shareholdings in us.
We may issue all of the shares of our common stock that are authorized but unissued (and not otherwise reserved for issuance under our stock incentive or purchase plans or pursuant to the conversion or exercise features of our convertible senior notes and warrants) without any action or approval by our stockholders. We may issue shares of common stock in connection with acquisitions of existing operating companies, senior living communities and ancillary services companies. Any shares issued in connection with our acquisitions or otherwise would dilute the holdings of our current stockholders.
The market price of our common stock could be negatively affected by sales of substantial amounts of our common stock in the public markets.
At
December 31, 2017
, approximately
186.5 million
shares of our common stock were outstanding (excluding unvested restricted shares). All of the shares of our common stock are freely transferable, except for any shares held by our "affiliates," as that term is defined in Rule 144 under the Securities Act of 1933, as amended, or the Securities Act, or any shares otherwise subject to the limitations of Rule 144.
33
In addition, as of
December 31, 2017
, approximately
4.8 million
shares of restricted common stock were outstanding under our 2014 Omnibus Incentive Plan and our Omnibus Stock Incentive Plan, and we had availability to issue approximately
11.3 million
additional shares under our 2014 Omnibus Incentive Plan, our Associate Stock Purchase Plan, and our Director Stock Purchase Plan. The shares of our common stock issued or issuable pursuant to these plans are or will be registered under the Securities Act, and once any restrictions imposed on the shares and options granted under these plans expire, such shares of common stock will be available for sale into the public markets.
Our ability to use net operating loss carryovers to reduce future tax payments will be limited.
Section 382 of the Internal Revenue code contains rules that limit the ability of a company that undergoes an ownership change, which is generally any change in ownership of 50% of its stock over a three-year period, to utilize its net operating loss carryforward and certain built-in losses recognized in years after the ownership change. These rules generally operate by focusing on ownership changes involving stockholders owning directly or indirectly 5% or more of the stock of a company and any change in ownership arising from a new issuance of stock by the company. We have determined that an ownership change occurred within the second quarter of 2010, and, therefore, losses carried into the change period have been subject to an annual limitation. The annual limitation is equal to the product of the applicable long term tax exempt rate and the value of our stock immediately before the ownership change, adjusted for certain items. The annual limitation may be increased by certain built-in gains existing at the time of change. The acquisition of Emeritus Corporation also resulted in an ownership change and created an annual limitation on Emeritus' net operating losses. Such annual limitations may result in our being unable to utilize all of our net operating loss carryforwards generated in tax years prior to 2018 before their expiration.
|
Item 1B.
|
Unresolved Staff Comments.
|
None.
|
Item 2.
|
Properties.
|
Communities
As of
December 31, 2017
, we operated
1,023
communities across
46
states, with the capacity to serve approximately
101,000
residents. Of the communities we operated as of
December 31, 2017
, we owned
360
, we leased
434
pursuant to operating, capital and financing leases, and
229
were managed by us for third parties or unconsolidated ventures in which we have an ownership interest. Substantially all of our owned communities are subject to mortgages.
The following table sets forth certain information regarding our communities as of
December 31, 2017
. Occupancy data includes the impact of managed communities.
|
|
|
Ownership Status
|
||||||||||||||||
|
State
|
Units
|
Occupancy
|
Owned
|
Leased
|
Managed
|
Total
|
||||||||||||
|
Florida
|
15,967
|
|
83
|
%
|
49
|
|
38
|
|
36
|
|
123
|
|
||||||
|
Texas
|
13,557
|
|
85
|
%
|
61
|
|
24
|
|
39
|
|
124
|
|
||||||
|
California
|
10,598
|
|
84
|
%
|
26
|
|
42
|
|
21
|
|
89
|
|
||||||
|
Washington
|
4,666
|
|
89
|
%
|
14
|
|
32
|
|
5
|
|
51
|
|
||||||
|
Colorado
|
4,513
|
|
84
|
%
|
11
|
|
15
|
|
13
|
|
39
|
|
||||||
|
Ohio
|
3,973
|
|
84
|
%
|
23
|
|
19
|
|
5
|
|
47
|
|
||||||
|
Illinois
|
3,674
|
|
88
|
%
|
2
|
|
10
|
|
6
|
|
18
|
|
||||||
|
North Carolina
|
3,626
|
|
86
|
%
|
7
|
|
51
|
|
1
|
|
59
|
|
||||||
|
Arizona
|
3,455
|
|
87
|
%
|
14
|
|
14
|
|
6
|
|
34
|
|
||||||
|
Oregon
|
3,189
|
|
90
|
%
|
8
|
|
20
|
|
15
|
|
43
|
|
||||||
|
Virginia
|
2,497
|
|
86
|
%
|
7
|
|
6
|
|
4
|
|
17
|
|
||||||
|
New York
|
2,462
|
|
82
|
%
|
17
|
|
10
|
|
6
|
|
33
|
|
||||||
|
Michigan
|
2,123
|
|
86
|
%
|
9
|
|
23
|
|
1
|
|
33
|
|
||||||
|
Tennessee
|
1,816
|
|
91
|
%
|
13
|
|
11
|
|
3
|
|
27
|
|
||||||
|
Georgia
|
1,566
|
|
90
|
%
|
5
|
|
8
|
|
8
|
|
21
|
|
||||||
|
Kansas
|
1,549
|
|
86
|
%
|
8
|
|
12
|
|
2
|
|
22
|
|
||||||
34
|
|
|
Ownership Status
|
||||||||||||||||
|
State
|
Units
|
Occupancy
|
Owned
|
Leased
|
Managed
|
Total
|
||||||||||||
|
South Carolina
|
1,544
|
|
80
|
%
|
4
|
|
11
|
|
7
|
|
22
|
|
||||||
|
New Jersey
|
1,411
|
|
88
|
%
|
7
|
|
8
|
|
1
|
|
16
|
|
||||||
|
Massachusetts
|
1,379
|
|
80
|
%
|
3
|
|
5
|
|
3
|
|
11
|
|
||||||
|
Oklahoma
|
1,377
|
|
86
|
%
|
4
|
|
17
|
|
5
|
|
26
|
|
||||||
|
Alabama
|
1,270
|
|
90
|
%
|
7
|
|
2
|
|
1
|
|
10
|
|
||||||
|
Pennsylvania
|
1,203
|
|
89
|
%
|
7
|
|
3
|
|
1
|
|
11
|
|
||||||
|
Rhode Island
|
1,147
|
|
83
|
%
|
1
|
|
2
|
|
6
|
|
9
|
|
||||||
|
Missouri
|
1,083
|
|
89
|
%
|
2
|
|
—
|
|
3
|
|
5
|
|
||||||
|
Indiana
|
1,080
|
|
79
|
%
|
4
|
|
8
|
|
1
|
|
13
|
|
||||||
|
Connecticut
|
977
|
|
68
|
%
|
2
|
|
6
|
|
2
|
|
10
|
|
||||||
|
Kentucky
|
895
|
|
80
|
%
|
1
|
|
2
|
|
3
|
|
6
|
|
||||||
|
Minnesota
|
836
|
|
78
|
%
|
2
|
|
12
|
|
2
|
|
16
|
|
||||||
|
Wisconsin
|
812
|
|
86
|
%
|
6
|
|
7
|
|
3
|
|
16
|
|
||||||
|
New Mexico
|
792
|
|
68
|
%
|
2
|
|
1
|
|
4
|
|
7
|
|
||||||
|
Mississippi
|
644
|
|
83
|
%
|
5
|
|
3
|
|
—
|
|
8
|
|
||||||
|
Maryland
|
614
|
|
88
|
%
|
2
|
|
2
|
|
3
|
|
7
|
|
||||||
|
Louisiana
|
609
|
|
85
|
%
|
6
|
|
1
|
|
—
|
|
7
|
|
||||||
|
Idaho
|
605
|
|
88
|
%
|
7
|
|
1
|
|
—
|
|
8
|
|
||||||
|
Nevada
|
604
|
|
87
|
%
|
4
|
|
2
|
|
1
|
|
7
|
|
||||||
|
Arkansas
|
494
|
|
92
|
%
|
4
|
|
—
|
|
1
|
|
5
|
|
||||||
|
Nebraska
|
455
|
|
84
|
%
|
—
|
|
—
|
|
5
|
|
5
|
|
||||||
|
Utah
|
368
|
|
78
|
%
|
—
|
|
1
|
|
3
|
|
4
|
|
||||||
|
Montana
|
238
|
|
94
|
%
|
1
|
|
1
|
|
1
|
|
3
|
|
||||||
|
West Virginia
|
220
|
|
97
|
%
|
1
|
|
1
|
|
—
|
|
2
|
|
||||||
|
Delaware
|
199
|
|
83
|
%
|
2
|
|
1
|
|
—
|
|
3
|
|
||||||
|
Wyoming
|
113
|
|
86
|
%
|
—
|
|
1
|
|
1
|
|
2
|
|
||||||
|
Iowa
|
106
|
|
65
|
%
|
—
|
|
—
|
|
1
|
|
1
|
|
||||||
|
Vermont
|
101
|
|
99
|
%
|
1
|
|
—
|
|
—
|
|
1
|
|
||||||
|
New Hampshire
|
90
|
|
90
|
%
|
1
|
|
—
|
|
—
|
|
1
|
|
||||||
|
North Dakota
|
85
|
|
73
|
%
|
—
|
|
1
|
|
—
|
|
1
|
|
||||||
|
Total
|
100,582
|
|
85
|
%
|
360
|
|
434
|
|
229
|
|
1,023
|
|
||||||
Corporate Offices
Our main corporate offices are leased, including our
143,065
square foot headquarters facility in Brentwood, Tennessee (a suburb of Nashville) and our
184,122
square foot shared service facility in Milwaukee, Wisconsin. We also lease smaller regional support offices in Chicago and Tampa.
|
Item 3.
|
Legal Proceedings.
|
The information contained in Note 18 to the consolidated financial statements contained in Part II, Item 8 of this Annual Report on Form 10-K is incorporated herein by reference.
|
Item 4.
|
Mine Safety Disclosures.
|
Not applicable.
35
|
Item 5.
|
Market for Registrant's Common Equity, Related Stockholder Matters and Issuer Purchases of Equity Securities.
|
Market Information
Our common stock is traded on the New York Stock Exchange, or the NYSE, under the symbol "BKD". The following table sets forth the range of high and low sales prices of our common stock for each quarter for the last two fiscal years.
|
|
Fiscal 2017
|
||||||
|
|
High
|
Low
|
|||||
|
First Quarter
|
$
|
16.31
|
|
$
|
11.69
|
|
|
|
Second Quarter
|
$
|
15.66
|
|
$
|
12.55
|
|
|
|
Third Quarter
|
$
|
14.92
|
|
$
|
10.57
|
|
|
|
Fourth Quarter
|
$
|
11.09
|
|
$
|
8.78
|
|
|
|
|
Fiscal 2016
|
||||||
|
|
High
|
Low
|
|||||
|
First Quarter
|
$
|
19.71
|
|
$
|
11.28
|
|
|
|
Second Quarter
|
$
|
19.42
|
|
$
|
14.43
|
|
|
|
Third Quarter
|
$
|
18.62
|
|
$
|
14.75
|
|
|
|
Fourth Quarter
|
$
|
17.70
|
|
$
|
10.65
|
|
|
The closing sale price of our common stock as reported on the NYSE on
February 20, 2018
was
$8.90
per share. As of that date, there were approximately
367
holders of record of our common stock.
Dividend Policy
On December 30, 2008, our Board of Directors voted to suspend our quarterly cash dividend indefinitely and no dividends were declared since that time. Although we anticipate that, in the longer-term, we may pay regular quarterly dividends to the holders of our common stock, over the near term we anticipate deploying capital to reduce our debt and lease leverage, to make strategic and cost effective capital expenditure investments and to grow our business. Accordingly, we do not expect to pay cash dividends on our common stock for the foreseeable future.
Our ability to pay and maintain cash dividends in the future will be based on many factors, including then-existing contractual restrictions or limitations, our ability to execute our strategy, our ability to negotiate favorable lease and other contractual terms, anticipated operating expense levels, the level of demand for our units, occupancy rates, entrance fee sales results, the rates we charge, our liquidity position and actual results that may vary substantially from estimates. Some of the factors are beyond our control and a change in any such factor could affect our ability to pay or maintain dividends. We can give no assurance as to our ability to pay or maintain dividends in the future. As we have done in the past, we may also pay dividends in the future that exceed our net income for the relevant period as calculated in accordance with U.S. GAAP.
Share Price Performance Graph
The following graph compares the five-year cumulative total return for Brookdale common stock with the comparable cumulative return of the S&P 500 index and the S&P Health Care Index. The graph assumes that a person invested $100 in Brookdale stock and each of the indices on December 31, 2012 and that dividends are reinvested. The comparisons in this graph are not intended to forecast or be indicative of possible future performance of Brookdale shares or such indices.
36
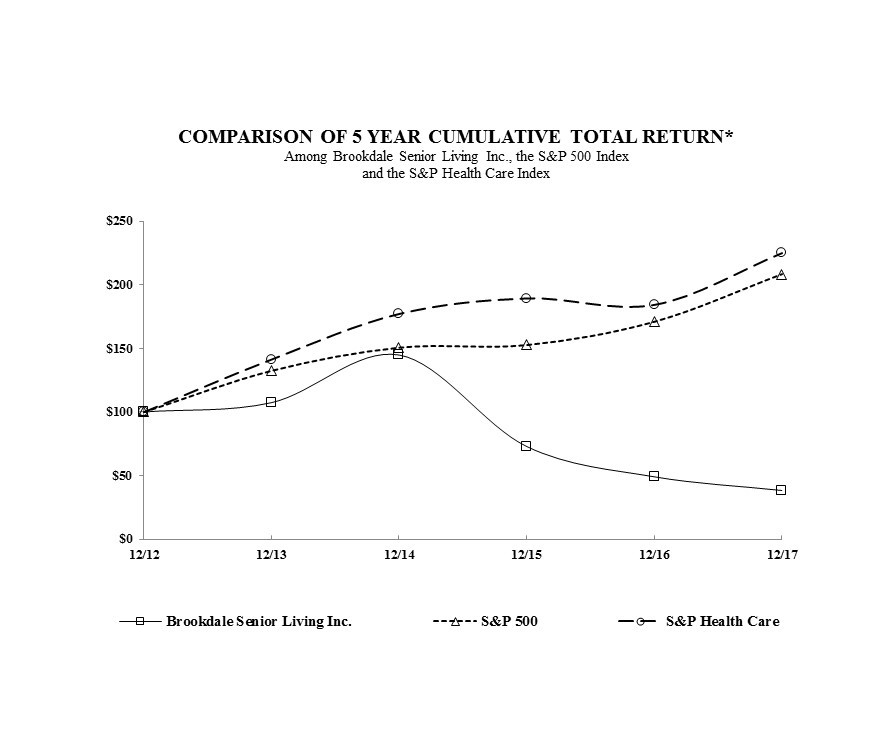
|
|
12/12
|
|
12/13
|
|
12/14
|
|
12/15
|
|
12/16
|
|
12/17
|
|
|||||
|
Brookdale Senior Living Inc.
|
100.00
|
|
107.35
|
|
144.83
|
|
72.91
|
|
49.05
|
|
38.31
|
|
|||||
|
S&P 500
|
100.00
|
|
132.39
|
|
150.51
|
|
152.59
|
|
170.84
|
|
208.14
|
|
|||||
|
S&P Health Care
|
100.00
|
|
141.46
|
|
177.30
|
|
189.52
|
|
184.42
|
|
225.13
|
|
|||||
The performance graph and related information shall not be deemed to be filed as part of this Annual Report on Form 10-K and do not constitute soliciting material and shall not be deemed filed or incorporated by reference into any other filing by the Company under the Securities Act or the Exchange Act, except to the extent that the Company specifically incorporates it by reference into such filing.
Recent Sales of Unregistered Securities
None.
37
Purchases of Equity Securities by the Issuer and Affiliated Purchasers
The following table contains information regarding purchases of our common stock made during the quarter ended
December 31, 2017
by or on behalf of the Company or any ''affiliated purchaser,'' as defined by Rule 10b-18(a)(3) of the Exchange Act:
|
Period
|
Total
Number of
Shares
Purchased (1)
|
Average
Price Paid
per Share ($)
|
Total Number of
Shares Purchased as
Part of Publicly
Announced Plans
or Programs (2)
|
Approximate Dollar Value of
Shares that May Yet Be
Purchased Under the
Plans or Programs ($ in thousands) (2)
|
|||||||
|
10/1/2017 - 10/31/2017
|
—
|
|
—
|
|
—
|
|
90,360
|
|
|||
|
11/1/2017 - 11/30/2017
|
16,331
|
|
10.42
|
|
—
|
|
90,360
|
|
|||
|
12/1/2017 - 12/31/2017
|
4,907
|
|
10.52
|
|
—
|
|
90,360
|
|
|||
|
Total
|
21,238
|
|
10.44
|
|
—
|
|
|||||
|
(1)
|
Shares purchased include shares withheld to satisfy tax liabilities due upon the vesting of restricted stock: November
2017
—
16,331
shares; and December
2017
—
4,907
shares. The average price paid per share for such share withholding is based on the closing price per share on the vesting date of the restricted stock or, if such date is not a trading day, the trading day immediately prior to such vesting date.
|
|
(2)
|
On November 1, 2016, the Company announced that its Board of Directors had approved a new share repurchase program that authorizes the Company to purchase up to
$100.0 million
in the aggregate of its common stock. The share repurchase program is intended to be implemented through purchases made from time to time using a variety of methods, which may include open market purchases, privately negotiated transactions or block trades, or by any combination of such methods, in accordance with applicable insider trading and other securities laws and regulations. The size, scope and timing of any purchases will be based on business, market and other conditions and factors, including price, regulatory and contractual requirements, and capital availability. The repurchase program does not obligate the Company to acquire any particular amount of common stock and the program may be suspended, modified or discontinued at any time at the Company's discretion without prior notice. Shares of stock repurchased under the program will be held as treasury shares. No shares were purchased pursuant to the repurchase program during the quarter ended
December 31, 2017
, and approximately
$90.4 million
remained available under the repurchase program as of
December 31, 2017
.
|
|
Item 6.
|
Selected Financial Data.
|
This selected financial data should be read in conjunction with the information contained in "Item 7. Management's Discussion and Analysis of Financial Condition and Results of Operations" and our historical consolidated financial statements and related notes included in "Item 8. Financial Statements and Supplementary Data." Our historical statement of operations data and balance sheet data as of and for each of the years in the five-year period ended
December 31, 2017
have been derived from our audited financial statements. The results of operations for any particular period are not necessarily indicative of results for any future period.
Our results reflect our acquisition through merger of Emeritus Corporation subsequent to July 31, 2014, the closing date of the transaction. At the closing of the transaction, the size of our consolidated portfolio increased by 493 communities (44,349 units). On August 29, 2014, we completed several transactions with HCP, including our entering into an unconsolidated venture (the "CCRC Venture") with HCP in which we obtained a 51% ownership interest and to which we contributed all but two of our legacy Brookdale entry fee CCRCs, our entering into an unconsolidated venture (the "HCP 49 Venture") with HCP in which we obtained a 20% ownership interest and to which HCP contributed 49 communities leased and historically operated by Emeritus, and our amending and restating the terms of certain existing triple-net leases between us and HCP (including those acquired in the Emeritus merger). Our results reflect our previously existing ownership, lease and/or management interests through August 29, 2014, and reflect our venture and management interests and amended lease terms subsequent to such date.
We completed dispositions, through sales and lease terminations, of
108
communities (
10,325
units) and
57
communities (
4,039
units) during the years ended December 31, 2017 and 2016, respectively. See Note 4 to the consolidated financial statements for more information regarding our disposition activity.
During the year ended December 31, 2017, we recorded
$409.8 million
of non-cash impairment charges. The impairment charges included
$205.0 million
of goodwill within the Assisted Living segment,
$164.4 million
of property, plant and equipment and
38
leasehold intangibles for certain communities,
$25.8 million
related to investments in unconsolidated ventures, and
$14.6 million
of intangible assets for health care licenses within the Brookdale Ancillary Services segment. During the year ended December 31, 2016, we recorded impairment charges of
$248.5 million
, primarily for property, plant and equipment and leasehold intangibles for certain communities. See Note 5 to the consolidated financial statements for more information regarding our impairment charges.
|
(dollars in thousands, except per share and other operating data)
|
For the Years Ended December 31,
|
||||||||||||||||||
|
2017
|
2016
|
2015
|
2014
|
2013
|
|||||||||||||||
|
Total revenue
|
$
|
4,747,116
|
|
$
|
4,976,980
|
|
$
|
4,960,608
|
|
$
|
3,831,706
|
|
$
|
2,891,966
|
|
||||
|
Facility operating expense
|
2,602,155
|
|
2,799,402
|
|
2,788,862
|
|
2,210,368
|
|
1,671,945
|
|
|||||||||
|
General and administrative expense
|
255,446
|
|
313,409
|
|
370,579
|
|
280,267
|
|
180,627
|
|
|||||||||
|
Transaction costs
|
22,573
|
|
3,990
|
|
8,252
|
|
66,949
|
|
3,921
|
|
|||||||||
|
Facility lease expense
|
339,721
|
|
373,635
|
|
367,574
|
|
323,830
|
|
276,729
|
|
|||||||||
|
Depreciation and amortization
|
482,077
|
|
520,402
|
|
733,165
|
|
537,035
|
|
268,757
|
|
|||||||||
|
Goodwill and asset impairment
|
409,782
|
|
248,515
|
|
57,941
|
|
9,992
|
|
12,891
|
|
|||||||||
|
Loss on facility lease termination
|
14,276
|
|
11,113
|
|
76,143
|
|
—
|
|
—
|
|
|||||||||
|
Costs incurred on behalf of managed communities
|
891,131
|
|
737,597
|
|
723,298
|
|
488,170
|
|
345,808
|
|
|||||||||
|
Total operating expense
|
5,017,161
|
|
5,008,063
|
|
5,125,814
|
|
3,916,611
|
|
2,760,678
|
|
|||||||||
|
Income (loss) from operations
|
(270,045
|
)
|
(31,083
|
)
|
(165,206
|
)
|
(84,905
|
)
|
131,288
|
|
|||||||||
|
Interest income
|
4,623
|
|
2,933
|
|
1,603
|
|
1,343
|
|
1,339
|
|
|||||||||
|
Interest expense
|
(326,154
|
)
|
(385,617
|
)
|
(388,764
|
)
|
(248,188
|
)
|
(137,399
|
)
|
|||||||||
|
Debt modification and extinguishment costs
|
(12,409
|
)
|
(9,170
|
)
|
(7,020
|
)
|
(6,387
|
)
|
(1,265
|
)
|
|||||||||
|
Equity in earnings (loss) earnings of unconsolidated ventures
|
(14,827
|
)
|
1,660
|
|
(804
|
)
|
171
|
|
1,484
|
|
|||||||||
|
Gain on sale of assets, net
|
19,273
|
|
7,218
|
|
1,270
|
|
446
|
|
972
|
|
|||||||||
|
Other non-operating income
|
11,418
|
|
14,801
|
|
8,557
|
|
6,789
|
|
1,753
|
|
|||||||||
|
Loss before income taxes
|
(588,121
|
)
|
(399,258
|
)
|
(550,364
|
)
|
(330,731
|
)
|
(1,828
|
)
|
|||||||||
|
Benefit (provision) for income taxes
|
16,515
|
|
(5,378
|
)
|
92,209
|
|
181,305
|
|
(1,756
|
)
|
|||||||||
|
Net income (loss)
|
(571,606
|
)
|
(404,636
|
)
|
(458,155
|
)
|
(149,426
|
)
|
(3,584
|
)
|
|||||||||
|
Net (income) loss attributable to noncontrolling interest
|
187
|
|
239
|
|
678
|
|
436
|
|
—
|
|
|||||||||
|
Net income (loss) attributable to Brookdale Senior Living Inc. common stockholders
|
$
|
(571,419
|
)
|
$
|
(404,397
|
)
|
$
|
(457,477
|
)
|
$
|
(148,990
|
)
|
$
|
(3,584
|
)
|
||||
|
Basic and diluted net income (loss) per share attributable to Brookdale Senior Living Inc. common stockholders
|
$
|
(3.07
|
)
|
$
|
(2.18
|
)
|
$
|
(2.48
|
)
|
$
|
(1.01
|
)
|
$
|
(0.03
|
)
|
||||
|
Weighted average shares of common stock used in computing basic and diluted net income (loss) per share
|
186,155
|
|
185,653
|
|
184,333
|
|
148,185
|
|
123,671
|
|
|||||||||
|
Other Operating Data:
|
|
|
|
|
|
|
|
|
|
|
|||||||||
|
Total number of communities (at end of period)
|
1,023
|
|
1,055
|
|
1,123
|
|
1,143
|
|
649
|
|
|||||||||
|
Total units operated
(1)
|
|
|
|
|
|
|
|
|
|||||||||||
|
Period end
|
100,582
|
|
102,768
|
|
107,786
|
|
110,219
|
|
66,832
|
|
|||||||||
|
Weighted average
|
101,779
|
|
106,122
|
|
109,342
|
|
84,299
|
|
66,173
|
|
|||||||||
|
RevPAR
(2)
|
$
|
3,890
|
|
$
|
3,845
|
|
$
|
3,742
|
|
$
|
2,663
|
|
$
|
3,372
|
|
||||
|
Owned/leased communities occupancy rate (weighted average)
|
85.0
|
%
|
86.0
|
%
|
86.8
|
%
|
88.3
|
%
|
88.7
|
%
|
|||||||||
|
RevPOR
(3)
|
$
|
4,578
|
|
$
|
4,468
|
|
$
|
4,310
|
|
$
|
4,357
|
|
$
|
4,383
|
|
||||
39
|
|
As of December 31,
|
||||||||||||||||||
|
(in millions)
|
2017
|
2016
|
2015
|
2014
|
2013
|
||||||||||||||
|
Cash and cash equivalents
|
$
|
222.6
|
|
$
|
216.4
|
|
$
|
88.0
|
|
$
|
104.1
|
|
$
|
58.5
|
|
||||
|
Marketable securities
|
$
|
291.8
|
|
$
|
—
|
|
$
|
—
|
|
$
|
—
|
|
$
|
—
|
|
||||
|
Total assets
|
$
|
7,675.4
|
|
$
|
9,217.7
|
|
$
|
10,048.6
|
|
$
|
10,417.5
|
|
$
|
4,695.6
|
|
||||
|
Total long-term debt and line of credit
|
$
|
3,870.7
|
|
$
|
3,559.6
|
|
$
|
3,942.8
|
|
$
|
3,597.0
|
|
$
|
2,342.3
|
|
||||
|
Total capital and financing lease obligations
|
$
|
1,271.6
|
|
$
|
2,485.5
|
|
$
|
2,489.6
|
|
$
|
2,649.2
|
|
$
|
299.8
|
|
||||
|
Total equity
|
$
|
1,530.3
|
|
$
|
2,077.7
|
|
$
|
2,458.7
|
|
$
|
2,882.2
|
|
$
|
1,020.9
|
|
||||
|
(1)
|
Weighted average units operated represents the average units operated during the period.
|
|
(2)
|
RevPAR, or average monthly senior housing resident fee revenues per available unit, is defined by the Company as resident fee revenues, excluding Brookdale Ancillary Services segment revenue and entrance fee amortization, for the corresponding portfolio for the period, divided by the weighted average number of available units in the corresponding portfolio for the period, divided by the number of months in the period.
|
|
(3)
|
RevPOR, or average monthly senior housing resident fee revenues per occupied unit, is defined by the Company as resident fee revenues, excluding Brookdale Ancillary Services segment revenue and entrance fee amortization, for the corresponding portfolio for the period divided by the weighted average number of occupied units in the corresponding portfolio for the period, divided by the number of months in the period.
|
|
Item 7.
|
Management's Discussion and Analysis of Financial Condition and Results of Operations.
|
This discussion and analysis should be read in conjunction with the information contained in "Item 6. Selected Financial Data" and our historical consolidated financial statements and related notes included in "Item 8. Financial Statements and Supplementary Data." In addition to historical information, this discussion and analysis may contain forward-looking statements that involve risks, uncertainties and assumptions, which could cause actual results to differ materially from management's expectations. Please see additional risks and uncertainties described in "Safe Harbor Statement Under the Private Securities Litigation Reform Act of 1995" for more information. Factors that could cause such differences include those described in this section and "Item 1A. Risk Factors" of this Annual Report on Form 10-K.
Executive Overview and Recent Developments
As of
December 31, 2017
, we are the largest operator of senior living communities in the United States based on total capacity, with
1,023
communities in
46
states and the ability to serve approximately
101,000
residents. We offer our residents access to a full continuum of services across the most attractive sectors of the senior living industry. We operate independent living, assisted living and dementia-care communities and continuing care retirement centers ("CCRCs"). Through our ancillary services programs, we also offer a range of home health, hospice and outpatient therapy services to residents of many of our communities and to seniors living outside of our communities.
As of
December 31, 2017
, we owned or leased
794
communities (
66,641
units) and provided management services with respect to
229
communities (
33,941
units) for third parties or unconsolidated ventures in which we have an ownership interest. As of
December 31, 2017
, we operated
129
retirement center communities (
24,476
units),
822
assisted living communities (
56,718
units) and
72
CCRCs (
19,388
units). The majority of our units are located in campus settings or communities containing multiple services, including CCRCs. As of
December 31, 2017
, our ancillary services platform included networks in
28
states with the ability to provide home health services to
63.7%
of our units, hospice services to
21.7%
of our units, and outpatient therapy to
17.0%
of our units. During the year ended
December 31, 2017
, we generated
82.1%
of our resident fee revenues from private pay customers and
15.2%
from government reimbursement programs (primarily Medicare). For the year ended
December 31, 2017
,
39.5%
of our resident and management fee revenues were generated from owned communities,
46.9%
from leased communities,
11.6%
from our ancillary services business and
2.0%
from communities we operate on behalf of third parties or unconsolidated ventures.
We believe that we operate in the most attractive sectors of the senior living industry, and our goal is to be the first choice in senior living by being the nation’s most trusted and effective senior living provider and employer. Our community and service offerings combine housing, health care, hospitality, and ancillary services. Our senior living communities offer residents a supportive home-like setting, assistance with activities of daily living (ADL) such as eating, bathing, dressing, toileting and transferring/walking
40
and, in certain communities, licensed skilled nursing services. We also provide ancillary services, including home health, hospice and outpatient therapy services to residents of many of our communities and to seniors living outside of our communities. By providing residents with a range of service options as their needs change, we provide greater continuity of care, enabling seniors to "age-in-place," which we believe enables them to maintain residency with us for a longer period of time. The ability of residents to age-in-place is also beneficial to our residents and their families who are concerned with care decisions for their elderly relatives. With our platform of a range of community and service offerings, we believe that we are positioned to take advantage of favorable demographic trends over time.
Leadership and Our Strategy
On February 22, 2018, we announced that Lucinda M. Baier, our Chief Financial Officer, has been appointed as our President and Chief Executive Officer and as a member of our Board of Directors effective February 28, 2018, at which time T. Andrew Smith will step down from such roles. We further announced that Bryan Richardson, our Executive Vice President and Chief Administrative Officer, will leave his employment effective March 9, 2018. Ms. Baier will continue to serve as our principal financial officer while we conduct a search for her replacement, and we do not currently intend to replace Mr. Richardson’s position.
For 2018, we have re-evaluated and redefined our strategic priorities, which are now focused on our three primary stakeholders: our stockholders, our associates, and, always at our foundation, our residents, patients and their families. Through our redefined strategy, we intend to provide attractive long-term returns to our stockholders; attract, engage, develop and retain the best associates; and continue to earn the trust and endorsements of our residents, patients and their families.
|
•
|
Stockholders
. Our stockholders’ continued investment in us allows us to advance our mission to our residents and their families. Therefore we believe we must balance our mission with an emphasis on margin. With this strategic priority, we intend to take actions to provide long-term returns to our stockholders by focusing on growing RevPAR, Adjusted EBITDA and Adjusted Free Cash Flow.
|
|
•
|
Associates
. Brookdale’s culture is based on servant leadership, and our associates are the key to attracting and caring for residents and creating value for all of our stakeholders. Through this strategic priority, we intend to create a compelling value proposition for our associates in the areas of compensation, leadership, career growth and meaningful work. In 2017, we took the first corrective steps by investing in community leaders, and in 2018 we plan to extend this plan deeper in the communities.
|
|
•
|
Residents, Patients and Their Families
. Brookdale continues to be driven by its mission—to enrich the lives of those we serve with compassion, respect, excellence and integrity—and we believe this continued focus is essential to create value for all of our stakeholders. This strategic priority includes enhancing our organizational alignment to foster an environment where our associates can focus on providing valued, high quality care and personalized service. We intend to win locally through our targeted sales and marketing efforts by differentiating our community and service offerings based on quality, a portfolio of choices, and personalized service delivered by caring associates.
|
We believe that our successful execution on these strategic priorities will allow us to achieve our goal to be the first choice in senior living by being the nation’s most trusted and effective senior living provider and employer.
As part of our redefined strategy, we plan to continue to evaluate and, where opportunities arise, pursue lease restructurings, development and acquisition opportunities, including selectively acquiring existing operating companies, senior living communities, and ancillary services companies. Any such restructurings or acquisitions may be pursued on our own, or through investments in ventures. In addition, we intend to continue to evaluate our owned and leased community portfolios for opportunities to dispose of owned communities and terminate leases. We plan to market in 2018 and sell approximately 30 owned communities (in addition to assets held for sale as of December 31, 2017), which we believe will generate more than $250 million of proceeds, net of associated debt and transaction costs.
2016 - 2017 Portfolio Optimization Update
During 2016 and 2017, we engaged in an initiative to optimize our community portfolio through disposing of owned and leased communities, restructuring leases, and investing in our Program Max initiative in order to simplify and streamline our business, to increase the quality and durability of our cash flow, to improve our liquidity, and to reduce our debt and lease leverage. During the period from January 1, 2016 through
December 31, 2017
, we completed dispositions, through sales and lease terminations, of
165
communities. During 2017, we also amended and restated triple-net leases covering substantially all of the communities we lease from HCP, Inc. (“HCP”) into a master lease and invested
$8.8 million
on Program Max projects, net of
$8.1 million
of third party lessor reimbursements.
41
During 2018, we expect to close on the dispositions of
15
owned communities (
1,508
units) classified as held for sale as of December 31, 2017, the terminations of our triple-net leases on
33
communities (
3,123
units), the terminations of management agreements on
37
communities (
5,522
units), and our acquisitions of
six
communities that we currently lease or manage (
995
units). In addition, we plan to market in 2018 and sell approximately 30 owned communities.
The closings of the expected sales of assets are subject (where applicable) to our successful marketing of such assets on terms acceptable to us. Further, the closings of the various pending transactions and expected sales of assets are, or will be, subject to the satisfaction of various closing conditions, including (where applicable) the receipt of regulatory approvals. However, there can be no assurance that the transactions will close or, if they do, when the actual closings will occur.
A summary of the foregoing completed and pending transactions (other than our planned marketing and sale of approximately 30 owned communities), and their impact on our results of operations, are below.
Summary of Impact of Dispositions
The following table sets forth, for the periods indicated, the amounts included within our consolidated financial data for the
165
communities that we disposed through sales and lease terminations for the years ended
December 31, 2017
and 2016 through the respective disposition dates:
|
Year Ended December 31, 2017
|
|||||||||||
|
(in thousands)
|
Actual Results
|
Amounts Attributable to Completed Dispositions
|
Actual Results Less Amounts Attributable to Completed Dispositions
|
||||||||
|
Resident fees
|
|||||||||||
|
Retirement Centers
|
$
|
654,196
|
|
$
|
26,519
|
|
$
|
627,677
|
|
||
|
Assisted Living
|
2,210,688
|
|
97,889
|
|
2,112,799
|
|
|||||
|
CCRCs-Rental
|
468,994
|
|
48,148
|
|
420,846
|
|
|||||
|
Senior housing resident fees
|
3,333,878
|
|
172,556
|
|
3,161,322
|
|
|||||
|
Facility operating expense
|
|||||||||||
|
Retirement Centers
|
382,779
|
|
17,859
|
|
364,920
|
|
|||||
|
Assisted Living
|
1,461,630
|
|
76,258
|
|
1,385,372
|
|
|||||
|
CCRCs-Rental
|
362,832
|
|
40,920
|
|
321,912
|
|
|||||
|
Senior housing facility operating expense
|
2,207,241
|
|
135,037
|
|
2,072,204
|
|
|||||
|
Cash lease payments
|
$
|
552,903
|
|
$
|
39,338
|
|
$
|
513,565
|
|
||
42
|
Year Ended December 31, 2016
|
|||||||||||
|
(in thousands)
|
Actual Results
|
Amounts Attributable to Completed Dispositions
|
Actual Results Less Amounts Attributable to Completed Dispositions
|
||||||||
|
Resident fees
|
|||||||||||
|
Retirement Centers
|
$
|
679,503
|
|
$
|
63,761
|
|
$
|
615,742
|
|
||
|
Assisted Living
|
2,419,459
|
|
310,258
|
|
2,109,201
|
|
|||||
|
CCRCs-Rental
|
592,826
|
|
169,297
|
|
423,529
|
|
|||||
|
Senior housing resident fees
|
3,691,788
|
|
543,316
|
|
3,148,472
|
|
|||||
|
Facility operating expense
|
|||||||||||
|
Retirement Centers
|
384,973
|
|
40,056
|
|
344,917
|
|
|||||
|
Assisted Living
|
1,542,642
|
|
231,373
|
|
1,311,269
|
|
|||||
|
CCRCs-Rental
|
459,417
|
|
141,653
|
|
317,764
|
|
|||||
|
Senior housing facility operating expense
|
2,387,032
|
|
413,082
|
|
1,973,950
|
|
|||||
|
Cash lease payments
|
$
|
622,886
|
|
$
|
131,363
|
|
$
|
491,523
|
|
||
The following table sets forth the number of communities and units disposed of during the years ended
December 31, 2017
and
2016
:
|
Years Ended December 31,
|
|||||
|
2017
|
2016
|
||||
|
Number of communities
|
|||||
|
Retirement Centers
|
10
|
|
2
|
|
|
|
Assisted Living
|
86
|
|
52
|
|
|
|
CCRCs-Rental
|
12
|
|
3
|
|
|
|
Total
|
108
|
|
57
|
|
|
|
Total units
|
|||||
|
Retirement Centers
|
2,078
|
|
206
|
|
|
|
Assisted Living
|
5,858
|
|
2,954
|
|
|
|
CCRCs-Rental
|
2,389
|
|
879
|
|
|
|
Total
|
10,325
|
|
4,039
|
|
|
43
The results of operations of the
33
communities for which lease terminations are expected to close in 2018 and of the
15
communities held for sale as of
December 31, 2017
are reported in the following segments within the consolidated financial statements: Assisted Living (
39
communities;
3,229
units), Retirement Centers (
five
communities;
783
units), and CCRCs-Rental (
four
communities;
619
units). The following table sets forth the amounts included within our consolidated financial data for these
48
communities for the year ended
December 31, 2017
:
|
(in thousands)
|
Amounts Attributable to Planned Dispositions
|
||
|
Resident fees
|
|||
|
Retirement Centers
|
$
|
28,948
|
|
|
Assisted Living
|
136,796
|
|
|
|
CCRCs - Rental
|
27,627
|
|
|
|
Senior housing resident fees
|
193,371
|
|
|
|
Facility operating expense
|
|||
|
Retirement Centers
|
17,980
|
|
|
|
Assisted Living
|
92,575
|
|
|
|
CCRCs-Rental
|
27,816
|
|
|
|
Senior housing facility operating expense
|
138,371
|
|
|
|
Cash lease payments
|
$
|
48,311
|
|
2017 HCP Agreements
On November 2, 2017, we announced that we had entered into a definitive agreement for a multi-part transaction with HCP. As part of such transaction, we entered into an Amended and Restated Master Lease and Security Agreement (“Master Lease”) with HCP effective as of November 1, 2017. The components of the multi-part transaction include:
|
•
|
Master Lease.
We and HCP amended and restated triple-net leases covering substantially all of the communities we leased from HCP as of November 1, 2017 into the Master Lease. We will acquire
two
communities (
208
units) for an aggregate purchase price of
$35.4 million
, upon which time the
two
communities will be removed from the Master Lease. In addition,
33
communities (
3,123
units) will be removed from the Master Lease on or before November 1, 2018. However, if HCP has not transitioned operations and/or management of such communities to a third party prior to such date, we will continue to operate the foregoing
33
communities on an interim basis and such communities will, from and after such time, be reported in the Management Services segment. In addition to such
35
communities, we continue to lease
43
communities pursuant to the terms of the Master Lease, which have the same lease rates and expiration and renewal terms as the applicable prior instruments, except that effective January 1, 2018, we received a
$2.5 million
annual rent reduction for
two
communities. The Master Lease also provides that we may engage in certain change in control and other transactions without the need to obtain HCP's consent, subject to the satisfaction of certain conditions.
|
|
•
|
RIDEA Ventures Restructuring.
Pursuant to the multi-part agreement, HCP agreed to acquire our
10%
ownership interest in two of our existing unconsolidated ventures with HCP for
$94.7 million
. We provided management services to
59
communities (
9,585
units) on behalf of the
two
unconsolidated ventures as of November 1, 2017. We will acquire
four
of such communities (787 units) for an aggregate purchase price of
$239.5 million
and will retain management of
18
of such communities (
3,276
units). The amended and restated management agreements for such
18
communities have a term set to expire in 2030, subject to certain early termination rights. In addition, HCP will be entitled to sell or transition operations and/or management of
37
of such communities (
5,522
units).
|
We expect to fund our acquisition of the
six
communities with the proceeds from the sale of our unconsolidated venture interests, cash on hand, non-recourse mortgage financing on the acquired communities and refinancing of certain other communities.
During December 2017, HCP completed its acquisition of our ownership interest in one of the unconsolidated ventures. In January 2018, we completed the acquisition of one community from HCP. We expect the disposition of our ownership interest in the second unconsolidated venture and our acquisition of the remaining five communities to occur during the next three months, and expect the terminations of our triple-net leases on
33
communities and management agreements on
37
communities to occur in stages throughout 2018.
44
As a result of such transactions, during 2017 we recognized a $7.2 million gain on sale upon completion of our sale of our ownership interest in one of the unconsolidated ventures, reduced our lease liabilities by $9.7 million, recognized a $9.7 million deferred revenue liability, and reduced the carrying value of capital lease obligations and assets under capital leases by $145.6 million. The terminations of our triple-net lease obligations for 33 communities in 2018 may result in our recording a gain in fiscal 2018, primarily for 20 communities which were previously subject to sale-leaseback transactions in which we were deemed to have continuing involvement for accounting purposes. See Note 4 to the consolidated financial statements contained in "Item 8. Financial Statements and Supplementary Data" for more information.
2016 HCP Agreements
On November 1, 2016, we announced that we had entered into agreements to, among other things, terminate triple-net leases with respect to
97
communities that we leased from HCP,
four
of which were contributed to an existing unconsolidated venture in which we hold an equity interest and
64
of which were acquired by the Blackstone Venture described below. In addition to the formation of the Blackstone Venture, the transactions included the following components with respect to
33
communities:
|
•
|
We and HCP agreed to terminate triple-net leases with respect to
eight
communities (
867
units). HCP agreed to contribute immediately thereafter
four
of such communities, consisting of
527
units, to an existing unconsolidated venture with HCP in which we have a 10% equity interest. During the three months ended December 31, 2016, the triple-net leases with respect to
seven
communities (
773
units) were terminated and HCP contributed
four
of the communities to the existing unconsolidated venture. The triple-net lease with respect to the remaining community was terminated during January 2017.
|
|
•
|
We and HCP agreed to terminate triple-net leases with respect to
25
communities (2,031 units). During the year ended December 31, 2017, our triple-net lease obligations with respect to such communities were terminated. Following such terminations we continue to operate certain of these communities on an interim basis, and such communities are reported in the Management Services segment from and after termination of such triple-net lease obligations.
|
As a result of such transactions, during 2017 we derecognized the $145.3 million carrying value of the assets under financing leases and the $156.7 million carrying value of financing lease obligations for 21 communities which were previously subject to sale-leaseback transactions in which we were deemed to have continuing involvement for accounting purposes, and recorded an $11.4 million gain on sale of assets. See Note 4 to the consolidated financial statements contained in "Item 8. Financial Statements and Supplementary Data" for more information.
Formation of Venture with Blackstone during 2017
On March 29, 2017, we and affiliates of Blackstone Real Estate Advisors VIII L.P. (collectively, "Blackstone") formed a venture (the "Blackstone Venture") that acquired
64
senior housing communities for a purchase price of $1.1 billion. We had previously leased the
64
communities from HCP under long-term lease agreements with a remaining average lease term of approximately
12
years. At the closing, the Blackstone Venture purchased the
64
-community portfolio from HCP subject to the existing leases, and we contributed our leasehold interests for
62
communities and a total of
$179.2 million
in cash to purchase a
15%
equity interest in the Blackstone Venture, terminate leases, and fund our share of closing costs. As of the formation date, we continued to operate
two
of the communities under lease agreements and began managing
60
of the communities on behalf of the venture under a management agreement with the venture. The
two
remaining leases will be terminated, pending certain regulatory and other conditions, at which point we will manage the communities.
Two
of the communities are managed by a third party for the venture. As a result of such transactions, during 2017 we recorded a $19.7 million charge within goodwill and asset impairment expense and recorded a provision for income taxes to establish an additional $85.0 million of valuation allowance against our federal and state net operating loss carryforwards and tax credits as we expect these carryforwards and credits will not be utilized prior to expiration. See Note 4 to the consolidated financial statements contained in "Item 8. Financial Statements and Supplementary Data" for more information.
Dispositions of Owned Communities and Other Lease Terminations during 2017
During the year ended
December 31, 2017
, we completed the sale of three communities (311 units) for net cash proceeds of $8.2 million, and we terminated leases for 17 communities (2,076 units) otherwise than in connection with the transactions with HCP and Blackstone described above. As a result of such lease terminations, during 2017 we recognized $14.3 million of net loss on facility lease termination, primarily from the write-off of assets subject to terminated lease agreements. See Note 4 to the consolidated financial statements contained in "Item 8. Financial Statements and Supplementary Data" for more information.
45
Assets Held for Sale as of December 31, 2017
As of
December 31, 2017
,
$106.4 million
was recorded as assets held for sale and
$30.1 million
of mortgage debt was included in the current portion of long-term debt within the consolidated balance sheet with respect to the
15
communities held for sale as of such date. This debt will either be repaid with the proceeds from the sales or be assumed by the prospective purchasers. The results of operations of the
15
communities are reported in the following segments within the consolidated financial statements: Assisted Living (
12
communities;
1,050
units) and CCRCs-Rental (
three
communities;
458
units). The
15
communities had resident fee revenue of
$49.5 million
and
$51.5 million
and facility operating expenses of
$43.8 million
and
$44.6 million
for the years ended
December 31, 2017
and
2016
, respectively.
Program Max Initiative
During fiscal
2017
, we also made progress on our Program Max initiative under which we expand, renovate, redevelop and reposition certain of our existing communities where economically advantageous. For the year ended December 31,
2017
, we invested $
8.8 million
on Program Max projects, net of $
8.1 million
of third party lessor reimbursements, which included the completion of
six
expansion or conversion projects which resulted in
103
additional units. We currently have
11
Program Max projects that have been approved, most of which have begun construction and are expected to generate
70
net new units.
Liquidity
During year ended
December 31, 2017
, we increased our liquidity position by
$288.6 million
to
$872.6 million
as of
December 31, 2017
compared to
$584.0 million
as of
December 31, 2016
. Total liquidity of
$872.6 million
as of
December 31, 2017
included
$222.6 million
of unrestricted cash and cash equivalents (excluding cash and escrow deposits-restricted and lease security deposits of
$103.2 million
in the aggregate),
$291.8 million
of marketable securities, and
$358.2 million
of availability on our secured credit facility. During the year ended December 31, 2017, we obtained $430.4 million of net proceeds from non-recourse mortgage financing and refinancing transactions.
Tax Reform
On December 22, 2017, the President signed the Tax Cuts and Jobs Act (“Tax Act”) into law. The Tax Act reformed the United States corporate income tax code, including a reduction to the federal corporate income tax rate from 35% to 21% effective January 1, 2018. The Tax Act also eliminated alternative minimum tax (AMT) and the 20-year carryforward limitation for net operating losses incurred after December 31, 2017, and imposes a limit on the usage of net operating losses incurred after such date equal to 80% of taxable income in any given year. The 80% usage limit will not have an economic impact on the Company until its current net operating losses are either utilized or expired. In addition, the Tax Act limits the annual deductibility of a corporation's net interest expense unless it elects to be exempt from such deductibility limitation under the real property trade or business exception. The Company's consolidated statement of operations for the tax year ended December 31, 2017 reflects a benefit of $114.7 million related to the impact of the Tax Act. Reasonable estimates for our state and local provision were made based on our analysis of tax reform. These provisional amounts may be adjusted in future periods during 2018 when additional information is obtained. Additional information that may affect our provisional amounts would include further clarification and guidance on how the Internal Revenue Service will implement tax reform and further clarification and guidance on how state taxing authorities will implement tax reform and the related effect on our state and local income tax returns, state and local net operating losses and corresponding valuation allowances. See Note 16 to the consolidated financial statements contained in "Item 8. Financial Statements and Supplementary Data" for more information regarding the tax act.
Competitive Developments
During 2016 and 2017, we experienced an elevated rate of new openings, with significant new competition opening in several of our markets, which adversely affected our occupancy, revenues, and results of operations. We continue to address such competition through pricing initiatives based on the competitive market, current in-place rents and occupancy; focusing on operations, including ensuring high customer satisfaction, protecting key leadership positions and actively engaging district and regional management in community operations; local and national marketing efforts, including leveraging our industry leading name through enhanced digital, direct mail and local community outreach; and community segmentation through which we evaluate current community position relative to competition and reposition if necessary (e.g., price, services, amenities and programming). We expect the elevated rate of new openings and pressures on our occupancy and rate growth to continue through 2018.
46
Summary of Operating Results
The table below presents a summary of our operating results and certain other financial metrics for the years ended December 31,
2017
and
2016
and the amount and percentage of increase or decrease of each applicable item.
|
|
Years Ended
December 31,
|
Increase
(Decrease) |
||||||||||||
|
(in millions)
|
2017
|
2016
|
Amount
|
Percent
|
||||||||||
|
Total revenues
|
$
|
4,747.1
|
|
$
|
4,977.0
|
|
$
|
(229.9
|
)
|
(4.6
|
)%
|
|||
|
Facility operating expense
|
$
|
2,602.2
|
|
$
|
2,799.4
|
|
$
|
(197.2
|
)
|
(7.0
|
)%
|
|||
|
Net income (loss)
|
$
|
(571.6
|
)
|
$
|
(404.6
|
)
|
$
|
167.0
|
|
41.3
|
%
|
|||
|
Net income (loss) attributable to Brookdale Senior Living Inc. common stockholders
|
$
|
(571.4
|
)
|
$
|
(404.4
|
)
|
$
|
167.0
|
|
41.3
|
%
|
|||
|
Adjusted EBITDA
(1)
|
$
|
638.6
|
|
$
|
770.8
|
|
$
|
(132.2
|
)
|
(17.2
|
)%
|
|||
|
Net cash provided by operating activities
|
$
|
366.7
|
|
$
|
365.7
|
|
$
|
1.0
|
|
0.3
|
%
|
|||
|
Adjusted Free Cash Flow
(1)
|
$
|
97.6
|
|
$
|
153.8
|
|
$
|
(56.2
|
)
|
(36.5
|
)%
|
|||
|
(1)
|
Adjusted EBITDA and Adjusted Free Cash Flow are non-GAAP financial measures we use to assess our operating performance and liquidity. We changed our definition and calculation of Adjusted EBITDA when we reported results for the second quarter of 2016. Prior period amounts of Adjusted EBITDA included in this Annual Report on Form 10-K have been recast to conform to the new definition. See "Non-GAAP Financial Measures" below for important information regarding both measures, including a description of the changes to the definition of Adjusted EBITDA.
|
During
2017
, total revenues were
$4.7 billion
, a decrease of
$229.9 million
, or
4.6%
, over our total revenues for the prior year. Resident fees for
2017
decreased
$388.5 million
, or
9.3%
, from the prior year. Management fees increased
$5.1 million
, or
7.2%
, from the prior year, and reimbursed costs incurred on behalf of managed communities increased
$153.5 million
, or
20.8%
. The decrease in resident fees during
2017
was primarily due to disposition activity, through sales and lease terminations, since the beginning of the prior year. The decrease in resident fees was partially offset by a
2.5%
increase in senior housing average monthly revenue per occupied unit (RevPOR) compared to the prior year.
During
2017
, facility operating expenses were
$2.6 billion
, a decrease of
$197.2 million
, or
7.0%
, as compared to the prior year. The decrease in facility operating expenses was primarily due to the impact of disposition activity, through sales and lease terminations, since the beginning of the prior year. Facility operating expenses increased
$69.1 million
, or
3.7%
, at the
766
communities we owned or leased during both full years. The increase in facility operating expenses at the communities we operated during both full years was primarily due to an increase in salaries and wages arising from wage rate increases and an increase in insurance expense related to positive changes in the estimates of general liability and professional liability and workers compensation expenses in the year ended December 31, 2016.
Net income (loss) attributable to Brookdale Senior Living Inc. common stockholders for the year ended December 31,
2017
was
$(571.4) million
, compared to net income (loss) attributable to Brookdale Senior Living Inc. common stockholders of
$(404.4) million
for the prior year. Net income (loss) for the year was
$(571.6) million
, an increase of
41.3%
compared to net income (loss) of
$(404.6) million
for the prior year. During the year ended December 31,
2017
, our Adjusted EBITDA decreased by
17.2%
when compared to the year ended December 31,
2016
. Adjusted EBITDA includes transaction and strategic project costs of
$25.4 million
for the year ended December 31,
2017
and integration, transaction, transaction-related and strategic project costs of
$54.2 million
for the year ended December 31,
2016
.
During the year ended December 31,
2017
, net cash provided by operating activities increased
0.3%
to
$366.7 million
over our net cash provided by operating activities for the year ended December 31,
2016
. During the year ended December 31,
2017
, our Adjusted Free Cash Flow was
$97.6 million
, a decrease of
36.5%
when compared to the year ended December 31,
2016
.
47
Consolidated Results of Operations
Comparison of Year Ended December 31,
2017
and
2016
The following table sets forth, for the periods indicated, statement of operations items and the amount and percentage of change of these items. The results of operations for any particular period are not necessarily indicative of results for any future period. The following data should be read in conjunction with our consolidated financial statements and the related notes, which are included in "Item 8. Financial Statements and Supplementary Data."
As of
December 31, 2017
our total operations included
1,023
communities with a capacity to serve approximately
101,000
residents.
48
|
(dollars in thousands, except Total RevPAR, RevPAR and RevPOR)
|
Years Ended
December 31,
|
Increase
(Decrease)
|
||||||||||||
|
|
2017
|
2016
|
Amount
|
Percent
(6)
|
||||||||||
|
Statement of Operations Data:
|
|
|
|
|
||||||||||
|
Revenue
|
|
|
|
|
||||||||||
|
Resident fees
|
|
|
|
|
||||||||||
|
Retirement Centers
|
$
|
654,196
|
|
$
|
679,503
|
|
$
|
(25,307
|
)
|
(3.7
|
)%
|
|||
|
Assisted Living
|
2,210,688
|
|
2,419,459
|
|
(208,771
|
)
|
(8.6
|
)%
|
||||||
|
CCRCs-Rental
|
468,994
|
|
592,826
|
|
(123,832
|
)
|
(20.9
|
)%
|
||||||
|
Brookdale Ancillary Services
|
446,262
|
|
476,833
|
|
(30,571
|
)
|
(6.4
|
)%
|
||||||
|
Total resident fees
|
3,780,140
|
|
4,168,621
|
|
(388,481
|
)
|
(9.3
|
)%
|
||||||
|
Management services
(1)
|
966,976
|
|
808,359
|
|
158,617
|
|
19.6
|
%
|
||||||
|
Total revenue
|
4,747,116
|
|
4,976,980
|
|
(229,864
|
)
|
(4.6
|
)%
|
||||||
|
Expense
|
|
|
|
|
|
|
|
|
||||||
|
Facility operating expense
|
|
|
|
|
|
|
|
|
||||||
|
Retirement Centers
|
382,779
|
|
384,973
|
|
(2,194
|
)
|
(0.6
|
)%
|
||||||
|
Assisted Living
|
1,461,630
|
|
1,542,642
|
|
(81,012
|
)
|
(5.3
|
)%
|
||||||
|
CCRCs-Rental
|
362,832
|
|
459,417
|
|
(96,585
|
)
|
(21.0
|
)%
|
||||||
|
Brookdale Ancillary Services
|
394,914
|
|
412,370
|
|
(17,456
|
)
|
(4.2
|
)%
|
||||||
|
Total facility operating expense
|
2,602,155
|
|
2,799,402
|
|
(197,247
|
)
|
(7.0
|
)%
|
||||||
|
General and administrative expense
|
255,446
|
|
313,409
|
|
(57,963
|
)
|
(18.5
|
)%
|
||||||
|
Transaction costs
|
22,573
|
|
3,990
|
|
18,583
|
|
NM
|
|
||||||
|
Facility lease expense
|
339,721
|
|
373,635
|
|
(33,914
|
)
|
(9.1
|
)%
|
||||||
|
Depreciation and amortization
|
482,077
|
|
520,402
|
|
(38,325
|
)
|
(7.4
|
)%
|
||||||
|
Goodwill and asset impairment
|
409,782
|
|
248,515
|
|
161,267
|
|
64.9
|
%
|
||||||
|
Loss on facility lease termination
|
14,276
|
|
11,113
|
|
3,163
|
|
28.5
|
%
|
||||||
|
Costs incurred on behalf of managed communities
|
891,131
|
|
737,597
|
|
153,534
|
|
20.8
|
%
|
||||||
|
Total operating expense
|
5,017,161
|
|
5,008,063
|
|
9,098
|
|
0.2
|
%
|
||||||
|
Income (loss) from operations
|
(270,045
|
)
|
(31,083
|
)
|
(238,962
|
)
|
NM
|
|
||||||
|
Interest income
|
4,623
|
|
2,933
|
|
1,690
|
|
57.6
|
%
|
||||||
|
Interest expense
|
(326,154
|
)
|
(385,617
|
)
|
(59,463
|
)
|
(15.4
|
)%
|
||||||
|
Debt modification and extinguishment costs
|
(12,409
|
)
|
(9,170
|
)
|
3,239
|
|
35.3
|
%
|
||||||
|
Equity in earnings (loss) of unconsolidated ventures
|
(14,827
|
)
|
1,660
|
|
(16,487
|
)
|
NM
|
|
||||||
|
Gain on sale of assets, net
|
19,273
|
|
7,218
|
|
12,055
|
|
167.0
|
%
|
||||||
|
Other non-operating income
|
11,418
|
|
14,801
|
|
(3,383
|
)
|
(22.9
|
)%
|
||||||
|
Income (loss) before income taxes
|
(588,121
|
)
|
(399,258
|
)
|
188,863
|
|
47.3
|
%
|
||||||
|
Benefit (provision) for income taxes
|
16,515
|
|
(5,378
|
)
|
21,893
|
|
NM
|
|
||||||
|
Net income (loss)
|
(571,606
|
)
|
(404,636
|
)
|
166,970
|
|
41.3
|
%
|
||||||
|
Net (income) loss attributable to noncontrolling interest
|
187
|
|
239
|
|
(52
|
)
|
(21.8
|
)%
|
||||||
|
Net income (loss) attributable to Brookdale Senior Living Inc. common stockholders
|
$
|
(571,419
|
)
|
$
|
(404,397
|
)
|
$
|
167,022
|
|
41.3
|
%
|
|||
49
|
Years Ended
December 31,
|
Increase
(Decrease)
|
|||||||||||||
|
|
2017
|
2016
|
Amount
|
Percent
(6)
|
||||||||||
|
Selected Operating and Other Data:
|
|
|
|
|
||||||||||
|
Total number of communities operated (period end)
|
1,023
|
|
1,055
|
|
(32
|
)
|
(3.0
|
)%
|
||||||
|
Total units operated
(2)
|
|
|
|
|
|
|
||||||||
|
Period end
|
100,582
|
|
102,768
|
|
(2,186
|
)
|
(2.1
|
)%
|
||||||
|
Weighted average
|
101,779
|
|
106,122
|
|
(4,343
|
)
|
(4.1
|
)%
|
||||||
|
Owned/leased communities units
(2)
|
|
|
|
|
|
|
||||||||
|
Period end
|
66,641
|
|
77,135
|
|
(10,494
|
)
|
(13.6
|
)%
|
||||||
|
Weighted average
|
71,365
|
|
79,932
|
|
(8,567
|
)
|
(10.7
|
)%
|
||||||
|
Total RevPAR
(3)
|
$
|
4,411
|
|
$
|
4,342
|
|
$
|
69
|
|
1.6
|
%
|
|||
|
RevPAR
(4)
|
$
|
3,890
|
|
$
|
3,845
|
|
45
|
|
1.2
|
%
|
||||
|
Owned/leased communities occupancy rate (weighted average)
|
85.0
|
%
|
86.0
|
%
|
(1.0
|
)%
|
(1.2
|
)%
|
||||||
|
RevPOR
(5)
|
$
|
4,578
|
|
$
|
4,468
|
|
$
|
110
|
|
2.5
|
%
|
|||
|
Selected Segment Operating and Other Data:
|
||||||||||||||
|
Retirement Centers
|
|
|
|
|
||||||||||
|
Number of communities (period end)
|
84
|
|
93
|
|
(9
|
)
|
(9.7
|
)%
|
||||||
|
Total units
(2)
|
|
|
|
|
|
|
||||||||
|
Period end
|
15,042
|
|
17,017
|
|
(1,975
|
)
|
(11.6
|
)%
|
||||||
|
Weighted average
|
16,124
|
|
17,103
|
|
(979
|
)
|
(5.7
|
)%
|
||||||
|
RevPAR
(4)
|
3,381
|
|
3,311
|
|
70
|
|
2.1
|
%
|
||||||
|
Occupancy rate (weighted average)
|
87.7
|
%
|
89.0
|
%
|
(1.3
|
)%
|
(1.5
|
)%
|
||||||
|
RevPOR
(5)
|
$
|
3,854
|
|
$
|
3,720
|
|
$
|
134
|
|
3.6
|
%
|
|||
|
Assisted Living
|
|
|
|
|
|
|
|
|
||||||
|
Number of communities (period end)
|
682
|
|
768
|
|
(86
|
)
|
(11.2
|
)%
|
||||||
|
Total units
(2)
|
|
|
|
|
|
|
||||||||
|
Period end
|
44,773
|
|
50,682
|
|
(5,909
|
)
|
(11.7
|
)%
|
||||||
|
Weighted average
|
47,523
|
|
52,777
|
|
(5,254
|
)
|
(10.0
|
)%
|
||||||
|
RevPAR
(4)
|
3,877
|
|
3,820
|
|
57
|
|
1.5
|
%
|
||||||
|
Occupancy rate (weighted average)
|
84.3
|
%
|
85.5
|
%
|
(1.2
|
)%
|
(1.4
|
)%
|
||||||
|
RevPOR
(5)
|
$
|
4,597
|
|
$
|
4,468
|
|
$
|
129
|
|
2.9
|
%
|
|||
|
CCRCs-Rental
|
|
|
|
|
|
|
||||||||
|
Number of communities (period end)
|
28
|
|
41
|
|
(13
|
)
|
(31.7
|
)%
|
||||||
|
Total units
(2)
|
|
|
|
|
|
|
||||||||
|
Period end
|
6,826
|
|
9,436
|
|
(2,610
|
)
|
(27.7
|
)%
|
||||||
|
Weighted average
|
7,718
|
|
10,052
|
|
(2,334
|
)
|
(23.2
|
)%
|
||||||
|
RevPAR
(4)
|
5,032
|
|
4,880
|
|
152
|
|
3.1
|
%
|
||||||
|
Occupancy rate (weighted average)
|
83.1
|
%
|
83.8
|
%
|
(0.7
|
)%
|
(0.8
|
)%
|
||||||
|
RevPOR
(5)
|
$
|
6,059
|
|
$
|
5,824
|
|
$
|
235
|
|
4.0
|
%
|
|||
|
Management Services
|
|
|
|
|
||||||||||
|
Number of communities (period end)
|
229
|
|
153
|
|
76
|
|
49.7
|
%
|
||||||
|
Total units
(2)
|
|
|
|
|
|
|
||||||||
|
Period end
|
33,941
|
|
25,633
|
|
8,308
|
|
32.4
|
%
|
||||||
|
Weighted average
|
30,414
|
|
26,190
|
|
4,224
|
|
16.1
|
%
|
||||||
|
Occupancy rate (weighted average)
|
85.0
|
%
|
87.0
|
%
|
(2.0
|
)%
|
(2.3
|
)%
|
||||||
50
|
Brookdale Ancillary Services
|
|
|
|
|
|
|
|
|
||||||
|
Home Health average daily census
|
15,092
|
|
15,067
|
|
25
|
|
0.2
|
%
|
||||||
|
Hospice average daily census
|
1,096
|
|
767
|
|
329
|
|
42.9
|
%
|
||||||
|
Outpatient Therapy treatment codes
|
744,924
|
|
1,713,733
|
|
(968,809
|
)
|
(56.5
|
)%
|
||||||
|
(1)
|
Management services segment revenue includes management fees and reimbursements for which we are the primary obligor of costs incurred on behalf of managed communities.
|
|
(2)
|
Weighted average units operated represents the average units operated during the period.
|
|
(3)
|
Total RevPAR, or average monthly resident fee revenues per available unit, is defined by the Company as resident fee revenues, excluding entrance fee amortization, for the corresponding portfolio for the period, divided by the weighted average number of available units in the corresponding portfolio for the period, divided by the number of months in the period.
|
|
(4)
|
RevPAR, or average monthly senior housing resident fee revenues per available unit, is defined by the Company as resident fee revenues, excluding Brookdale Ancillary Services segment revenue and entrance fee amortization, for the corresponding portfolio for the period, divided by the weighted average number of available units in the corresponding portfolio for the period, divided by the number of months in the period.
|
|
(5)
|
RevPOR, or average monthly senior housing resident fee revenues per occupied unit, is defined by the Company as resident fee revenues, excluding Brookdale Ancillary Services segment revenue and entrance fee amortization, for the corresponding portfolio for the period, divided by the weighted average number of occupied units in the corresponding portfolio for the period, divided by the number of months in the period.
|
|
(6)
|
NM - Not meaningful
|
Resident Fees
Resident fee revenue decreased
$388.5 million
, or
9.3%
, compared to the prior year primarily due to disposition activity, through sales and lease terminations, since the beginning of the prior year. Weighted average occupancy decreased
130
basis points at the
766
communities we owned or leased during both full periods, which reflects the impact of new competition in our markets. Additionally, Brookdale Ancillary Services segment revenue decreased
$30.6 million
, or
6.4%
, primarily due to a decrease in volume for outpatient therapy services and a decrease in reimbursement rates for home health services. The
165
communities disposed of subsequent to the beginning of the prior year (including the
62
communities for which the financial results were deconsolidated from our financial statements prospectively upon formation of the Blackstone Venture on March 29, 2017) generated
$172.6 million
of revenue during the current year period compared to
$543.3 million
of revenue in the prior year period. The decrease in resident fee revenue was partially offset by a 2.5% increase in RevPOR. Total RevPAR for the consolidated portfolio also increased by
1.6%
compared to the prior year.
Retirement Centers segment revenue decreased
$25.3 million
, or
3.7%
, primarily due to the impact of dispositions of
12
communities since the beginning of the prior year, which generated
$26.5 million
of revenue during the current year compared to
$63.8 million
of revenue in the prior year. Retirement Centers segment revenue at the communities we operated during both full years was
$571.7 million
during the current year, an increase of
$2.2 million
, or
0.4%
, over the prior year, primarily due to a
1.8%
increase in RevPOR at these communities, partially offset by a
120
basis point decrease in weighted average occupancy at these communities.
Assisted Living segment revenue decreased
$208.8 million
, or
8.6%
, primarily due to the impact of dispositions of
138
communities since the beginning of the prior year, which generated
$97.9 million
of revenue during the current year compared to
$310.3 million
of revenue in the prior year. Assisted Living segment revenue at the communities we operated during both full years was
$2,043.8 million
during the current year, a decrease of
$0.9 million
over the prior year, primarily due to a
140
basis point decrease in weighted average occupancy at these communities, partially offset by a
1.8%
increase in RevPOR at these communities.
CCRCs-Rental segment revenue decreased
$123.8 million
, or
20.9%
, primarily due to the impact of dispositions of
15
communities since the beginning of the prior year, which generated
$48.1 million
of revenue during the current year period compared to
$169.3 million
of revenue in the prior year period. CCRCs-Rental segment revenue at the communities we operated during both full years was
$368.2 million
during the current year, an increase of
$4.9 million
, or
1.4%
, over the prior year, primarily due to a
1.7%
51
increase in RevPOR at these communities, partially offset by a
30
basis point decrease in weighted average occupancy at these communities.
Brookdale Ancillary Services segment revenue decreased
$30.6 million
, or
6.4%
, primarily due to a decrease in volume for outpatient therapy services and a decrease in reimbursement rates for home health services. During the three months ended December 31, 2016, we significantly reduced the number of outpatient therapy clinics located in our communities as lower reimbursement rates and lower utilization made the business less attractive. These decreases we partially offset by an increase in volume for hospice services. Despite an increase over the prior year period, our home health average daily census was negatively impacted by interruptions to service by Hurricane Irma in Florida. For home health in 2017, CMS implemented a net 0.7% reimbursement reduction, consisting of a 2.8% market basket inflation increase, less a 0.3% productivity reduction, a 2.3% rebasing adjustment, and a 0.9% reduction to account for industry wide case-mix growth. As a result, our home health reimbursement was reduced by approximately 3.2% compared to the prior year period. For home health in 2018, CMS has implemented a net 0.4% reimbursement reduction, consisting of a 1.0% market basket inflation increase, less a 0.9% reduction to account for industry wide case-mix growth, and the sunset of the rural add-on provision. As a result, we expect our home health reimbursement to be reduced by approximately 0.8% in 2018 compared to 2017.
Management Services Revenue
Management Services segment revenue, including management fees and reimbursed costs incurred on behalf of managed communities, increased
$158.6 million
, or
19.6%
, over the prior year primarily due to our entry into management agreements with the Blackstone Venture. Management fees of $75.8 million for 2017 include $5.6 million of management fees attributable to communities for which our management agreements were terminated in 2017 and $13.6 million of management fees attributable to communities for which we expect the terminations of our management agreement to occur in stages throughout 2018.
Facility Operating Expense
Facility operating expense decreased
$197.2 million
, or
7.0%
, over the prior year. Facility operating expense in the current year includes $7.3 million of costs related to our response to Hurricanes Harvey and Irma. The decrease in facility operating expense is primarily due to disposition activity, through sales and lease terminations, of
165
communities since the beginning of the prior year period, which incurred
$135.0 million
of facility operating expenses during the current year compared to
$413.1 million
of facility operating expenses in the prior year. Additionally, Brookdale Ancillary Services segment facility operating expenses decreased
$17.5 million
, or
4.2%
, primarily due to a decrease in volume for outpatient therapy services. These decreases were partially offset by an increase in salaries and wages arising from wage rate increases at the communities we operated during both full years and a $23.3 million increase in insurance expense related to positive changes in the prior year to estimates in general liability and professional liability and workers compensation expenses.
Retirement Centers segment facility operating expenses decreased
$2.2 million
, or
0.6%
, primarily driven by the impact of dispositions of
12
communities since the beginning of the prior year, which incurred
$17.9 million
of facility operating expenses during the current year compared to
$40.1 million
of facility operating expenses in the prior year. This decrease was partially offset by an increase in salaries and wages arising from wage rate increases. Retirement Centers segment facility operating expenses, excluding costs related to hurricanes, at the communities we operated during both full years were
$327.8 million
, an increase of
$11.0 million
, or
3.5%
, over the prior year.
Assisted Living segment facility operating expenses decreased
$81.0 million
, or
5.3%
, primarily driven by the impact of dispositions of
138
communities since the beginning of the prior year, which incurred
$76.3 million
of facility operating expenses in the current year compared to
$231.4 million
of facility operating expenses in the prior year. This decrease was partially offset by an increase in salaries and wages arising from wage rate increases at the communities we operated during both full years and a $21.0 million increase in insurance expense related to positive changes in the prior year to estimates in general liability and professional liability and workers compensation expenses. Assisted Living segment facility operating expenses, excluding costs related to hurricanes, at the communities we operated during both full years were
$1,330.2 million
, an increase of
$54.9 million
, or
4.3%
, over the prior year.
CCRCs-Rental segment facility operating expenses decreased
$96.6 million
, or
21.0%
, primarily driven by the impact of dispositions of
15
communities since the beginning of the prior year, which incurred
$40.9 million
of facility operating expenses in the current year compared to
$141.7 million
of facility operating expenses in the prior year. CCRCs-Rental segment facility operating expenses, excluding costs related to hurricanes, at the communities we operated during both full periods were
$280.2 million
, an increase of
$3.2 million
, or
1.2%
, over the prior year.
52
Brookdale Ancillary Services segment operating expenses decreased
$17.5 million
, or
4.2%
, primarily due to a decrease in volume for outpatient therapy services. During the three months ended December 31, 2016, we significantly reduced the number of outpatient therapy clinics located in our communities as lower reimbursement rates and lower utilization made the business less attractive.
General and Administrative Expense
General and administrative expense decreased
$58.0 million
, or
18.5%
, over the prior year primarily due to a
$47.4 million
decrease in integration, transaction-related and strategic project costs. Strategic project costs were
$2.8 million
during the current year compared to integration, transaction-related and strategic project costs of
$50.2 million
in the prior year. Integration costs for 2016 include transition costs associated with organizational restructuring (such as severance and retention payments and recruiting expenses), third party consulting expenses directly related to the integration of acquired communities (in areas such as cost savings and synergy realization, branding and technology and systems work), and internal costs such as training, travel and labor, reflecting time spent by Company personnel on integration activities and projects. Transaction-related costs for 2016 include third-party costs directly related to acquisition and disposition activity, community financing and leasing activity and corporate capital structure assessment activities (including stockholder relations advisory matters), and are primarily comprised of legal, finance, consulting, professional fees and other third party costs. Strategic project costs for 2016 include costs associated with strategic projects related to refining our strategy, building out enterprise-wide capabilities (including EMR roll-out projects) and reducing costs and achieving synergies by capitalizing on scale. Additionally, a reduction in corporate associate headcount resulted in decreased salaries and wage expenses in the current year.
Transaction Costs
Transaction costs increased
$18.6 million
. Transaction costs in the current year were primarily direct costs related to the formation of the Blackstone Venture and our assessment of options and alternatives to enhance stockholder value. Transaction costs in the prior year were primarily direct costs related to community disposition activity.
Facility Lease Expense
Facility lease expense decreased
$33.9 million
, or
9.1%
, primarily due to lease termination activity since the beginning of the prior year.
Depreciation and Amortization
Depreciation and amortization expense decreased
$38.3 million
, or
7.4%
, primarily due to disposition activity, through sales and lease terminations, since the beginning of the prior year period.
Goodwill and Asset Impairment
During the year ended
December 31, 2017
, we recorded
$409.8 million
of non-cash impairment charges. The impairment charges included
$205.0 million
of goodwill within the Assisted Living segment,
$164.4 million
of property, plant and equipment and leasehold intangibles for certain communities, primarily in the Assisted Living segment, $25.8 million related to investments in unconsolidated ventures, and
$14.6 million
of intangible assets for health care licenses within the Brookdale Ancillary Services segment.
During the three months ended September 30, 2017, we identified qualitative indicators of impairment of our goodwill, including a significant decline in our stock price and market capitalization for a sustained period since the last testing date, significant underperformance relative to historical and projected operating results, and an increased competitive environment in the senior living industry. As a result, we performed an interim quantitative goodwill impairment test as of September 30, 2017, which included a comparison of the estimated fair value of each reporting unit to which the goodwill has been assigned with the reporting unit's carrying value. In estimating the fair value of the reporting units for purposes of the quantitative goodwill impairment test, we utilized an income approach, which included future cash flow projections that are developed internally. Based on the results of the quantitative goodwill impairment test, we determined that the carrying amount of our Assisted Living segment exceeded its estimated fair value by $205.0 million as of September 30, 2017. As a result, we recorded a non-cash impairment charge of $205.0 million to goodwill within the Assisted Living segment for the three months ended September 30, 2017.
During the year ended December 31, 2017, we evaluated property, plant and equipment and leasehold intangibles for impairment and identified properties with a carrying amount of the assets in excess of the estimated future undiscounted net cash flows expected to be generated by the assets. We compared the estimated fair value of the assets to their carrying value for these identified properties
53
and recorded an impairment charge for the excess of carrying value over fair value. As a result, we recorded property, plant and equipment and leasehold intangibles non-cash impairment charges of $164.4 million for the year ended December 31, 2017, including $137.8 million within the Assisted Living segment.
During the year ended December 31,
2017
, we identified indicators of impairment for our investments in unconsolidated ventures. We compared the estimated fair value of investments in unconsolidated ventures to their carrying value for these identified investments and recorded a $25.9 million impairment charge for the excess of carrying value over fair value.
Additionally, during the three months ended September 30, 2017, we identified indicators of impairment for our home health care licenses in Florida, including significant underperformance relative to historical and projected operating results, decreases in reimbursement rates from Medicare for home health care services, an increased competitive environment in the home health care industry, and disruption from the impact of Hurricane Irma. We performed an interim quantitative impairment test as of September 30, 2017 on the health care licenses. Based on the results of the quantitative impairment test, we determined that the carrying amount of certain of our home health care licenses in Florida exceeded their estimated fair value by $13.7 million as of September 30, 2017. As a result, we recorded $13.7 million of impairment charges for health care licenses within the Brookdale Ancillary Services segment for the three months ended September 30, 2017.
Estimating the fair values of our goodwill and other assets requires management to use significant estimates, assumptions and judgments regarding future circumstances and events that are unpredictable and inherently uncertain. Future circumstances and events may result in outcomes that are different from these estimates, assumptions and judgments, which could result in future impairments to our goodwill and other assets.
During the year ended December 31, 2016, we recorded impairment charges of $248.5 million. We recorded property, plant and equipment and leasehold intangibles impairment charges of $166.2 million for the year ended December 31, 2016, primarily due to lower than expected operating performance at certain properties and to reflect the amount by which the carrying values of assets exceeded their estimated fair value. We recorded $15.8 million of impairment charges related to communities identified as assets held for sale, primarily due to excess of carrying value, including allocated goodwill, over the estimated selling price less costs to dispose. We recorded $36.8 million of impairment charges related to investments in unconsolidated ventures, primarily due to lower than expected operating performance at the communities owned by the unconsolidated ventures and these charges reflect the amount by which the carrying values of the investments exceeded their estimated fair value. Additionally, we recorded $28.2 million and $1.5 million of impairment charges related to community purchase options and health care licenses, respectively. These impairment charges are primarily due to lower than expected operating performance at the communities subject to the community purchase options and reflect the amount by which the carrying values of the community purchase options exceeded their estimated fair value.
See "Critical Accounting Policies and Estimates" below and Note 5 to the consolidated financial statements contained in "Item 8. Financial Statements and Supplementary Data" for more information about our evaluations of goodwill and other assets for impairment and the related impairment charges.
Loss on Facility Lease Termination
Loss on facility lease termination increased
$3.2 million
, or
28.5%
, primarily due to increased lease termination activity.
Costs Incurred on Behalf of Managed Communities
Costs incurred on behalf of managed communities increased
$153.5 million
, or
20.8%
, primarily due to our entry into management agreements with the Blackstone Venture.
Interest Expense
Interest expense decreased by
$59.5 million
, or
15.4%
, primarily due to lease termination activity since the beginning of the prior year.
Equity in Earnings (Loss) of Unconsolidated Ventures
Equity in earnings (loss) of unconsolidated ventures decreased by
$16.5 million
over the prior year. Equity in loss of unconsolidated ventures of
$14.8 million
in the current year includes losses for the Blackstone Venture, which was formed subsequent to the prior year, and the impact of additional interest expense incurred as a result of non-recourse mortgage financing obtained by the CCRC Venture subsequent to the prior year period.
54
Gain on Sale of Assets, Net
Gain on sale of assets, net increased
$12.1 million
, or
167.0%
, primarily due to an $11.4 million gain on sale of assets recognized during the year ended December 31, 2017 for the termination of financing lease obligations for 21 communities which were previously subject to sale-leaseback transactions in which the Company was deemed to have continuing involvement for accounting purposes.
Other Non-operating Income
Other non-operating income decreased by
$3.4 million
, or
22.9%
, primarily due to decreased insurance recoveries for property losses.
Income Taxes
On December 22, 2017, the President signed into law the Tax Act, a bill reforming the US corporate income tax code which, among other reforms, will reduce our federal corporate tax rate from
35%
to
21%
. The rate reduction will take effect on January 1, 2018. The carrying value of our deferred tax assets and liabilities is determined by the enacted federal corporate income tax rate. Consequently, any changes in the federal corporate income tax rate will impact the carrying value of our net deferred tax liability position subsequent to the enactment date. Under the new federal corporate income tax rate of
21%
, net deferred income tax assets will decrease by
$108.1 million
and our valuation allowance will decrease by
$172.2 million
. In addition to the impact of the federal corporate income tax rate, the change in corporate tax law reduces our valuation allowance by an additional
$50.6 million
. The net effect of the tax reform enactment on our consolidated financial statements was a benefit of
$114.7 million
which has been reflected in our consolidated statement of operations for the year ended December 31, 2017. Reasonable estimates for our state and local provision were made based on our analysis of tax reform. These provisional amounts may be adjusted in future periods during 2018 when additional information is obtained. Additional information that may affect our provisional amounts would include further clarification and guidance on how the Internal Revenue Service will implement tax reform and further clarification and guidance on how state taxing authorities will implement tax reform and the related effect on our state and local income tax returns, state and local net operating losses and corresponding valuation allowances. See Note 16 to the consolidated financial statements contained in "Item 8. Financial Statements and Supplementary Data" for more information regarding the tax act.
For the year ended December 31, 2017 we recorded an aggregate deferred federal, state and local tax benefit of $15.3 million, which consists of a $148.9 million benefit as a result of the operating loss for the year, which was partially offset by a $110.4 million expense related to revaluation of our net deferred tax assets and liabilities under the Tax Act. Further offsetting the aggregate deferred benefit was an increase in the valuation allowance of
$246.0 million
before consideration of the Tax Act. The impact of the Tax Act resulted in a reduction of our valuation allowance of
$222.8 million
, with a
$172.2 million
reduction due to rate and
$50.6 million
reduction primarily as a result of the changes anticipated to the use of net operating losses generated after December 31, 2017. We evaluate our deferred tax assets each quarter to determine if a valuation allowance is required based on whether it is more likely than not that some portion of the deferred tax asset would not be realized. Our valuation allowance as of December 31, 2017 and 2016 was
$336.1 million
and
$264.3 million
, respectively, as described in Note 16 to the consolidated financial statements.
We recorded interest charges related to our tax contingency reserve for cash tax positions for the years ended December 31, 2017 and 2016 which are included in provision for income tax for the period. Tax returns for years
2013
through
2016
are subject to future examination by tax authorities. In addition, the net operating losses from prior years are subject to adjustment under examination.
Comparison of Year Ended December 31, 2016 and 2015
The following table sets forth, for the periods indicated, statement of operations items and the amount and percentage of change of these items. The results of operations for any particular period are not necessarily indicative of results for any future period. The following data should be read in conjunction with our consolidated financial statements and the related notes, which are included in "Item 8. Financial Statements and Supplementary Data."
As of December 31, 2016 our total operations included 1,055 communities with a capacity to serve approximately 103,000 residents.
55
|
(dollars in thousands, except Total RevPAR and RevPOR)
|
Years Ended
December 31,
|
Increase
(Decrease)
|
||||||||||||
|
|
2016
|
2015
|
Amount
|
Percent
(6)
|
||||||||||
|
Statement of Operations Data:
|
|
|
|
|
||||||||||
|
Revenue
|
|
|
|
|
||||||||||
|
Resident fees
|
|
|
|
|
||||||||||
|
Retirement Centers
|
$
|
679,503
|
|
$
|
657,940
|
|
$
|
21,563
|
|
3.3
|
%
|
|||
|
Assisted Living
|
2,419,459
|
|
2,445,457
|
|
(25,998
|
)
|
(1.1
|
)%
|
||||||
|
CCRCs-Rental
|
592,826
|
|
604,572
|
|
(11,746
|
)
|
(1.9
|
)%
|
||||||
|
Brookdale Ancillary Services
|
476,833
|
|
469,158
|
|
7,675
|
|
1.6
|
%
|
||||||
|
Total resident fees
|
4,168,621
|
|
4,177,127
|
|
(8,506
|
)
|
(0.2
|
)%
|
||||||
|
Management services
(1)
|
808,359
|
|
783,481
|
|
24,878
|
|
3.2
|
%
|
||||||
|
Total revenue
|
4,976,980
|
|
4,960,608
|
|
16,372
|
|
0.3
|
%
|
||||||
|
Expense
|
|
|
|
|
|
|
|
|
||||||
|
Facility operating expense
|
|
|
|
|
|
|
|
|
||||||
|
Retirement Centers
|
384,973
|
|
372,683
|
|
12,290
|
|
3.3
|
%
|
||||||
|
Assisted Living
|
1,542,642
|
|
1,568,154
|
|
(25,512
|
)
|
(1.6
|
)%
|
||||||
|
CCRCs-Rental
|
459,417
|
|
454,077
|
|
5,340
|
|
1.2
|
%
|
||||||
|
Brookdale Ancillary Services
|
412,370
|
|
393,948
|
|
18,422
|
|
4.7
|
%
|
||||||
|
Total facility operating expense
|
2,799,402
|
|
2,788,862
|
|
10,540
|
|
0.4
|
%
|
||||||
|
General and administrative expense
|
313,409
|
|
370,579
|
|
(57,170
|
)
|
(15.4
|
)%
|
||||||
|
Transaction costs
|
3,990
|
|
8,252
|
|
(4,262
|
)
|
(51.6
|
)%
|
||||||
|
Facility lease expense
|
373,635
|
|
367,574
|
|
6,061
|
|
1.6
|
%
|
||||||
|
Depreciation and amortization
|
520,402
|
|
733,165
|
|
(212,763
|
)
|
(29.0
|
)%
|
||||||
|
Asset impairment
|
248,515
|
|
57,941
|
|
190,574
|
|
NM
|
|
||||||
|
Loss on facility lease termination
|
11,113
|
|
76,143
|
|
(65,030
|
)
|
(85.4
|
)%
|
||||||
|
Costs incurred on behalf of managed communities
|
737,597
|
|
723,298
|
|
14,299
|
|
2.0
|
%
|
||||||
|
Total operating expense
|
5,008,063
|
|
5,125,814
|
|
(117,751
|
)
|
(2.3
|
)%
|
||||||
|
Income (loss) from operations
|
(31,083
|
)
|
(165,206
|
)
|
(134,123
|
)
|
(81.2
|
)%
|
||||||
|
Interest income
|
2,933
|
|
1,603
|
|
1,330
|
|
83.0
|
%
|
||||||
|
Interest expense
|
(385,617
|
)
|
(388,764
|
)
|
(3,147
|
)
|
(0.8
|
)%
|
||||||
|
Debt modification and extinguishment costs
|
(9,170
|
)
|
(7,020
|
)
|
2,150
|
|
30.6
|
%
|
||||||
|
Equity in earnings (loss) of unconsolidated ventures
|
1,660
|
|
(804
|
)
|
2,464
|
|
NM
|
|
||||||
|
Gain on sale of assets, net
|
7,218
|
|
1,270
|
|
5,948
|
|
NM
|
|
||||||
|
Other non-operating income
|
14,801
|
|
8,557
|
|
6,244
|
|
73.0
|
%
|
||||||
|
Income (loss) before income taxes
|
(399,258
|
)
|
(550,364
|
)
|
(151,106
|
)
|
(27.5
|
)%
|
||||||
|
(Provision) benefit for income taxes
|
(5,378
|
)
|
92,209
|
|
(97,587
|
)
|
(105.8
|
)%
|
||||||
|
Net income (loss)
|
(404,636
|
)
|
(458,155
|
)
|
(53,519
|
)
|
(11.7
|
)%
|
||||||
|
Net (income) loss attributable to noncontrolling interest
|
239
|
|
678
|
|
(439
|
)
|
(64.7
|
)%
|
||||||
|
Net income (loss) attributable to Brookdale Senior Living Inc. common stockholders
|
$
|
(404,397
|
)
|
$
|
(457,477
|
)
|
$
|
(53,080
|
)
|
(11.6
|
)%
|
|||
56
|
(dollars in thousands, except Total RevPAR, RevPAR and RevPOR)
|
Years Ended
December 31,
|
Increase
(Decrease)
|
||||||||||||
|
|
2016
|
2015
|
Amount
|
Percent
(6)
|
||||||||||
|
Selected Operating and Other Data:
|
|
|
|
|
||||||||||
|
Total number of communities operated (period end)
|
1,055
|
|
1,123
|
|
(68
|
)
|
(6.1
|
)%
|
||||||
|
Total units operated
(2)
|
|
|
|
|
|
|
|
|
||||||
|
Period end
|
102,768
|
|
107,786
|
|
(5,018
|
)
|
(4.7
|
)%
|
||||||
|
Weighted average
|
106,122
|
|
109,342
|
|
(3,220
|
)
|
(2.9
|
)%
|
||||||
|
Owned/leased communities units
(2)
|
|
|
|
|
|
|
|
|
||||||
|
Period end
|
77,135
|
|
80,917
|
|
(3,782
|
)
|
(4.7
|
)%
|
||||||
|
Weighted average
|
79,932
|
|
82,508
|
|
(2,576
|
)
|
(3.1
|
)%
|
||||||
|
Total RevPAR
(3)
|
$
|
4,342
|
|
$
|
4,216
|
|
$
|
126
|
|
3.0
|
%
|
|||
|
RevPAR
(4)
|
$
|
3,845
|
|
$
|
3,742
|
|
$
|
103
|
|
2.7
|
%
|
|||
|
Owned/leased communities occupancy rate (weighted average)
|
86.0
|
%
|
86.8
|
%
|
(0.8
|
)%
|
(0.9
|
)%
|
||||||
|
RevPOR
(5)
|
$
|
4,468
|
|
$
|
4,310
|
|
$
|
158
|
|
3.7
|
%
|
|||
|
Selected Segment Operating and Other Data:
|
||||||||||||||
|
Retirement Centers
|
|
|
|
|
||||||||||
|
Number of communities (period end)
|
93
|
|
95
|
|
(2
|
)
|
(2.1
|
)%
|
||||||
|
Total units
(2)
|
|
|
|
|
|
|
|
|
||||||
|
Period end
|
17,017
|
|
17,093
|
|
(76
|
)
|
(0.4
|
)%
|
||||||
|
Weighted average
|
17,103
|
|
17,308
|
|
(205
|
)
|
(1.2
|
)%
|
||||||
|
RevPAR
(4)
|
3,311
|
|
3,168
|
|
143
|
|
4.5
|
%
|
||||||
|
Occupancy rate (weighted average)
|
89.0
|
%
|
88.8
|
%
|
0.2
|
%
|
0.2
|
%
|
||||||
|
RevPOR
(5)
|
$
|
3,720
|
|
$
|
3,570
|
|
$
|
150
|
|
4.2
|
%
|
|||
|
Assisted Living
|
|
|
|
|
|
|
|
|
||||||
|
Number of communities (period end)
|
768
|
|
820
|
|
(52
|
)
|
(6.3
|
)%
|
||||||
|
Total units
(2)
|
|
|
|
|
|
|
|
|
||||||
|
Period end
|
50,682
|
|
53,500
|
|
(2,818
|
)
|
(5.3
|
)%
|
||||||
|
Weighted average
|
52,777
|
|
54,714
|
|
(1,937
|
)
|
(3.5
|
)%
|
||||||
|
RevPAR
(4)
|
3,820
|
|
3,725
|
|
95
|
|
2.6
|
%
|
||||||
|
Occupancy rate (weighted average)
|
85.5
|
%
|
86.7
|
%
|
(1.2
|
)%
|
(1.4
|
)%
|
||||||
|
RevPOR
(5)
|
$
|
4,468
|
|
$
|
4,297
|
|
$
|
171
|
|
4.0
|
%
|
|||
|
CCRCs-Rental
|
|
|
|
|
|
|
|
|
||||||
|
Number of communities (period end)
|
41
|
|
44
|
|
(3
|
)
|
(6.8
|
)%
|
||||||
|
Total units
(2)
|
|
|
|
|
|
|
|
|
||||||
|
Period end
|
9,436
|
|
10,324
|
|
(888
|
)
|
(8.6
|
)%
|
||||||
|
Weighted average
|
10,052
|
|
10,486
|
|
(434
|
)
|
(4.1
|
)%
|
||||||
|
RevPAR
(4)
|
4,880
|
|
4,779
|
|
101
|
|
2.1
|
%
|
||||||
|
Occupancy rate (weighted average)
|
83.8
|
%
|
84.4
|
%
|
(0.6
|
)%
|
(0.7
|
)%
|
||||||
|
RevPOR
(5)
|
$
|
5,824
|
|
$
|
5,668
|
|
$
|
156
|
|
2.8
|
%
|
|||
|
Management Services
|
|
|
|
|
|
|
|
|
||||||
|
Number of communities (period end)
|
153
|
|
164
|
|
(11
|
)
|
(6.7
|
)%
|
||||||
|
Total units
(2)
|
|
|
|
|
|
|
|
|
||||||
|
Period end
|
25,633
|
|
26,869
|
|
(1,236
|
)
|
(4.6
|
)%
|
||||||
|
Weighted average
|
26,190
|
|
26,834
|
|
(644
|
)
|
(2.4
|
)%
|
||||||
|
Occupancy rate (weighted average)
|
87.0
|
%
|
86.0
|
%
|
1.0
|
%
|
1.2
|
%
|
||||||
57
|
Brookdale Ancillary Services
|
|
|
|
|
|
|
|
|
||||||
|
Home Health average daily census
|
15,067
|
|
13,814
|
|
1,253
|
|
9.1
|
%
|
||||||
|
Hospice average daily census
|
767
|
|
474
|
|
293
|
|
61.8
|
%
|
||||||
|
Outpatient Therapy treatment codes
|
1,713,733
|
|
2,506,203
|
|
(792,470
|
)
|
(31.6
|
)%
|
||||||
|
(1)
|
Management services segment revenue includes management fees and reimbursements for which we are the primary obligor of costs incurred on behalf of managed communities.
|
|
(2)
|
Weighted average units operated represents the average units operated during the period.
|
|
(3)
|
Total RevPAR, or average monthly resident fee revenues per available unit, is defined by the Company as resident fee revenues, excluding entrance fee amortization, for the corresponding portfolio for the period, divided by the weighted average number of available units in the corresponding portfolio for the period, divided by the number of months in the period.
|
|
(4)
|
RevPAR, or average monthly senior housing resident fee revenues per available unit, is defined by the Company as resident fee revenues, excluding Brookdale Ancillary Services segment revenue and entrance fee amortization, for the corresponding portfolio for the period, divided by the weighted average number of available units in the corresponding portfolio for the period, divided by the number of months in the period.
|
|
(5)
|
RevPOR, or average monthly senior housing resident fee revenues per occupied unit, is defined by the Company as resident fee revenues, excluding Brookdale Ancillary Services segment revenue and entrance fee amortization, for the corresponding portfolio for the period, divided by the weighted average number of occupied units in the corresponding portfolio for the period, divided by the number of months in the period.
|
|
(6)
|
NM - Not meaningful
|
Resident Fees
Resident fee revenue decreased $8.5 million, or 0.2%, compared to the prior year primarily due to disposition activity, through sales and lease terminations, since the beginning of the prior year and a 130 basis point decrease in occupancy at the 876 communities we owned or leased during both full periods. The decrease in resident fees was partially offset by a 3.1% increase in RevPOR at these communities compared to the prior year. Total RevPAR for the consolidated portfolio also increased by 3.0% compared to the prior year. The 81 communities disposed of subsequent to the beginning of the prior year generated $126.2 million of revenue during 2016 compared to $202.0 million of revenue in the prior year.
Retirement Centers segment revenue increased $21.6 million, or 3.3%, primarily due to a 3.1% increase in RevPOR at the communities we owned or leased during both full years. Subsequent to the beginning of the prior year, the Company disposed of six communities, which generated $7.2 million of revenue during 2016 compared to $12.5 million of revenue in the prior year.
Assisted Living segment revenue decreased $26.0 million, or 1.1%, primarily due to the impact of disposition activity since the beginning of the prior period as well as a 170 basis point decrease in occupancy at the communities we operated during both full periods. The decrease was partially offset by a 3.4% increase in RevPOR at the communities we operated during both full years. Subsequent to the beginning of the prior year, the Company disposed of 71 communities, which generated $90.8 million of revenue during 2016 compared to $148.6 million of revenue in the prior year.
CCRCs-Rental segment revenue decreased $11.7 million, or 1.9%, primarily due to the impact of disposition activity since the beginning of the prior year as well as a 110 basis point decrease in occupancy at the communities we operated during both full years. The decrease was partially offset by a 2.2% increase in RevPOR at the communities we operated during both full years. Subsequent to the beginning of the prior year, the Company disposed of four communities, which generated $28.2 million of revenue in 2016 compared to $40.9 million of revenue in the prior year.
Brookdale Ancillary Services segment revenue increased $7.7 million, or 1.6%, primarily due to an increase in home health average daily census and the roll-out of our home health and hospice services to additional units subsequent to the beginning of the prior year period, partially offset by a decrease in therapy service volume. During the three months ended December 31, 2016, we significantly reduced the number of outpatient therapy clinics located in our communities as lower reimbursement rates and lower
58
utilization made the business less attractive. Despite an increase over the prior year period, our home health average daily census was negatively impacted by the loss of a number of associates to a new competitor in several of our Florida markets.
Management Services Revenue
Management Services segment revenue, including management fees and reimbursed costs incurred on behalf of managed communities, increased $24.9 million, or 3.2%, primarily due to additional costs incurred on behalf of managed communities resulting from increases in salaries and wages and other facility operating expenses at the communities operated in both full periods and an increase in incentive fees earned under the terms of our management agreements.
Facility Operating Expense
Facility operating expense increased $10.5 million, or 0.4%, over the prior year primarily due to a $46.5 million increase in salaries and wages due to wage rate increases at the 876 communities we owned or leased during both full periods and $18.4 million of expense increases for our ancillary services in connection with higher home health and hospice average daily census. This increase was partially offset by disposition activity, through sales and lease terminations, since the beginning of the prior year and a $35.4 million decrease in insurance expense from changes in estimates due to general liability and professional liability and workers compensation claims experience. The 81 communities disposed of subsequent to the beginning of the prior year, either through sales or lease terminations, incurred $99.6 million of facility operating expenses during 2016 compared to $164.5 million of facility operating expenses in the prior year.
Retirement Centers segment facility operating expenses increased $12.3 million, or 3.3%, primarily driven by an increase in salaries and wages arising from wage rate increases. The communities disposed of subsequent to the beginning of the prior year incurred $4.2 million of facility operating expenses during 2016 compared to $8.8 million of facility operating expenses in the prior year.
Assisted Living segment facility operating expenses decreased $25.5 million, or 1.6%, primarily driven by the impact of disposition activity since the beginning of the prior year period and a decrease in insurance expense from changes in estimates due to general liability and professional liability and workers compensation claims experience. The 71 communities disposed of subsequent to the beginning of the prior year incurred $71.6 million of facility operating expenses during 2016 compared to $121.1 million of facility operating expenses in the prior year. The decrease was partially offset by increases in salaries and wages due to wage rate increases.
CCRCs-Rental segment facility operating expenses increased $5.3 million, or 1.2%, primarily driven by increases in salaries and wages due to wage rate increases. Disposition activity since the beginning of the prior year partially offset this increase. The four communities disposed of subsequent to the beginning of the prior year incurred $23.8 million of facility operating expenses during 2016 compared to $34.7 million of facility operating expenses in the prior year.
Brookdale Ancillary Services segment operating expenses increased $18.4 million, or 4.7%, primarily due to expense increases in connection with higher home health and hospice average daily census and increased salaries and wage expense due to wage rate increases.
General and Administrative Expense
General and administrative expense decreased $57.2 million, or 15.4%, over the prior year primarily due to a $61.5 million decrease in integration, transaction-related and strategic project costs. Integration costs include transition costs associated with the Emeritus merger and organizational restructuring (such as severance and retention payments and recruiting expenses), third party consulting expenses directly related to the integration of Emeritus (in areas such as cost savings and synergy realization, branding and technology and systems work), and internal costs such as training, travel and labor, reflecting time spent by Company personnel on integration activities and projects. Transaction-related costs include third party costs directly related to the acquisition of Emeritus, other acquisition and disposition activity, community financing and leasing activity and corporate capital structure assessment activities (including shareholder relations advisory matters), and are primarily comprised of legal, finance, consulting, professional fees and other third party costs. Strategic project costs include costs associated with strategic projects related to refining our strategy, building out enterprise-wide capabilities for the post-merger platform (including EMR roll-out project) and reducing costs and achieving synergies by capitalizing on scale. This decrease was partially offset by an increase in salaries and wages due to wage rate increases.
59
Transaction Costs
Transaction costs decreased $4.3 million, or 51.6%. Transaction costs in the prior year period were primarily related to direct costs related to acquisition and community leasing activity. Transaction costs in 2016 were primarily related to direct costs related to community disposition activity, through sales and lease terminations.
Facility Lease Expense
Facility lease expense increased $6.1 million, or 1.6%, primarily due to annual rent increases, including the impact of variable rent increases.
Depreciation and Amortization
Depreciation and amortization expense decreased $212.8 million, or 29.0%, primarily due to disposition activity subsequent to the beginning of the prior year and amortization of in-place lease intangibles acquired as part of our acquisition of Emeritus reaching full amortization subsequent to the beginning of the prior year.
Asset Impairment
During the year ended December 31, 2016, we recorded impairment charges of $248.5 million. We recorded property, plant and equipment and leasehold intangibles impairment charges of $166.2 million for the year ended December 31, 2016, primarily due to lower than expected operating performance at certain properties and to reflect the amount by which the carrying values of assets exceeded their estimated fair value. We recorded $15.8 million of impairment charges related to communities identified as assets held for sale, primarily due to excess of carrying value, including allocated goodwill, over the estimated selling price less costs to dispose. We recorded $36.8 million of impairment charges related to investments in unconsolidated ventures, primarily due to lower than expected operating performance at the communities owned by the unconsolidated ventures and these charges reflect the amount by which the carrying values of the investments exceeded their estimated fair value. Additionally, we recorded $28.2 million and $1.5 million of impairment charges related to community purchase options and health care licenses, respectively. These impairment charges are primarily due to lower than expected operating performance at the communities subject to the community purchase options and reflect the amount by which the carrying values of the community purchase options exceeded their estimated fair value. During 2015, we sold 17 communities for an aggregate selling price of $82.9 million and recorded $18.4 million of impairment charges related to the communities sold, inclusive of the allocation of $8.1 million of goodwill to the disposed communities. During 2015, we recorded $15.2 million of impairment charges related to 17 communities identified as held for sale as of December 31, 2015, inclusive of the allocation of $12.2 million of goodwill to the disposal groups. Additionally, during 2015, we recorded $23.4 million of impairment charges for property, plant and equipment and leasehold intangibles for communities to be held and used. These impairment charges are primarily due to lower than expected operating performance of the underlying communities.
See "Critical Accounting Policies and Estimates" below and Note 5 to the consolidated financial statements contained in "Item 8. Financial Statements and Supplementary Data" for more information about our evaluations of goodwill and other assets for impairment and the related impairment charges.
Loss on Facility Lease Termination
Loss on facility lease termination decreased $65.0 million, or 85.4%. A loss on facility lease termination of $76.1 million was recognized during 2015 for the difference between the amount paid to acquire the underlying real estate associated with 15 communities that were previously leased and the estimated fair value of the communities, net of the deferred lease liabilities previously recognized.
Gain on Sale of Assets, Net
Gain on sale of assets, net increased $5.9 million, or 468.3%, primarily due to increased community disposition activity during the current year.
Costs Incurred on Behalf of Managed Communities
Costs incurred on behalf of managed communities increased $14.3 million, or 2.0%, primarily due to additional costs incurred on behalf of managed communities resulting from increases in salaries and wages and other facility operating expenses at the communities operated in both full years.
60
Interest Expense
Interest expense decreased by $3.1 million, or 0.8%, primarily due to lower interest expense on capital and financing leases.
Other Non-operating Income
Other non-operating income increased by $6.2 million, or 73.0%, primarily due to increased insurance recoveries for property losses.
Income Taxes
The difference in our effective tax rates for the years ended December 31, 2016 and 2015 was primarily due to recording a valuation allowance against our deferred tax assets during the year ended December 31, 2016, the negative tax benefit on the vesting of restricted stock, a direct result of the Company's lower stock price in 2016, and the non-deductible write-off of goodwill in 2016. We recorded an aggregate deferred federal, state and local tax benefit of $139.6 million as a result of the operating loss for the year ended December 31, 2016, which was offset by an increase in the valuation allowance of $142.9 million. We evaluate our deferred tax assets each quarter to determine if a valuation allowance is required based on whether it is more likely than not that some portion of the deferred tax asset would not be realized. Our valuation allowance as of December 31, 2016 and December 31, 2015 was $264.3 million and $121.6 million, respectively.
We recorded interest charges related to our tax contingency reserve for cash tax positions for the years ended December 31, 2016 and 2015 which are included in provision for income tax for the period.
Liquidity and Capital Resources
The following is a summary of cash flows from operating, investing and financing activities, as reflected in the consolidated statements of cash flows:
|
|
Year Ended
December 31,
|
Increase
(Decrease) |
||||||||||||
|
(in thousands)
|
2017
|
2016
|
Amount
|
Percent
|
||||||||||
|
Net cash provided by operating activities
|
$
|
366,664
|
|
$
|
365,732
|
|
$
|
932
|
|
0.3
|
%
|
|||
|
Net cash (used in) provided by investing activities
|
(601,307
|
)
|
176,825
|
|
(778,132
|
)
|
NM
|
|
||||||
|
Net cash provided by (used in) financing activities
|
240,893
|
|
(414,189
|
)
|
655,082
|
|
NM
|
|
||||||
|
Net increase in cash and cash equivalents
|
6,250
|
|
128,368
|
|
(122,118
|
)
|
(95.1
|
)%
|
||||||
|
Cash and cash equivalents at beginning of year
|
216,397
|
|
88,029
|
|
128,368
|
|
NM
|
|
||||||
|
Cash and cash equivalents at end of year
|
$
|
222,647
|
|
$
|
216,397
|
|
$
|
6,250
|
|
2.9
|
%
|
|||
The increase in net cash provided by operating activities of
$0.9 million
was attributable primarily to
$62.1 million
of integration, transaction, transaction-related and strategic project costs in the prior year compared to
$37.1 million
of transaction, strategic project, and debt modification and extinguishment costs in 2017. The increase was partially offset by the impact of disposition activity, through sales and lease terminations, since the beginning of the prior year and an increase in facility operating expenses at the communities operated during both full years.
The change in net cash (used in) provided by investing activities of
$778.1 million
was primarily attributable to purchases of marketable securities during the current year, our contribution of
$179.2 million
in connection with the formation of the Blackstone Venture during the current year, and a decrease in net proceeds from the sale of assets. The increase was partially offset by reduced acquisition and capital expenditure activity.
The change in net cash provided by (used in) financing activities was primarily attributable to $437.2 million of net proceeds from financing and refinancing activities completed during the current year and net repayments of
$310.0 million
on our secured credit facility during the prior year.
61
Our principal sources of liquidity have historically been from:
|
•
|
cash balances on hand, cash equivalents and marketable securities;
|
|
•
|
cash flows from operations;
|
|
•
|
proceeds from our credit facilities;
|
|
•
|
funds generated through unconsolidated venture arrangements;
|
|
•
|
proceeds from mortgage financing, refinancing of various assets or sale-leaseback transactions;
|
|
•
|
funds raised in the debt or equity markets; and
|
|
•
|
proceeds from the disposition of assets.
|
Over the longer-term, we expect to continue to fund our business through these principal sources of liquidity.
Our liquidity requirements have historically arisen from:
|
•
|
working capital;
|
|
•
|
operating costs such as employee compensation and related benefits, severance costs, general and administrative expense and supply costs;
|
|
•
|
debt service and lease payments;
|
|
•
|
acquisition consideration and transaction and integration costs;
|
|
•
|
capital expenditures and improvements, including the expansion, renovation, redevelopment and repositioning of our current communities and the development of new communities;
|
|
•
|
cash collateral required to be posted in connection with our financial instruments and insurance programs;
|
|
•
|
purchases of common stock under our share repurchase authorizations;
|
|
•
|
other corporate initiatives (including integration, information systems, branding and other strategic projects); and
|
|
•
|
prior to 2009, dividend payments.
|
Over the near-term, we expect that our liquidity requirements will primarily arise from:
|
•
|
working capital;
|
|
•
|
operating costs such as employee compensation and related benefits, severance costs, general and administrative expense and supply costs;
|
|
•
|
debt service, including repayment of the
$316.3 million
outstanding principal amount of our
2.75%
convertible senior notes due
June 15, 2018
, and lease payments;
|
|
•
|
acquisition consideration and transaction costs, including the acquisition of six communities pursuant to agreements with HCP;
|
|
•
|
capital expenditures and improvements, including the expansion, renovation, redevelopment and repositioning of our existing communities;
|
|
•
|
cash funding needs of our unconsolidated ventures for operating, capital expenditure and financing needs;
|
|
•
|
cash collateral required to be posted in connection with our financial instruments and insurance programs;
|
|
•
|
purchases of common stock under our share repurchase authorization; and
|
|
•
|
other corporate initiatives (including information systems and other strategic projects).
|
We are highly leveraged and have significant debt and lease obligations. As of
December 31, 2017
, we have three principal corporate-level debt obligations: our
$400.0 million
secured credit facility, our
$316.3 million
outstanding principal amount of
2.75%
convertible senior notes due
June 15, 2018
, and our separate unsecured letter of credit facilities providing for up to
$64.5 million
of letters of credit in the aggregate. The remainder of our indebtedness is generally comprised of approximately
$3.5 billion
of non-recourse property-level mortgage financings as of
December 31, 2017
.
As of
December 31, 2017
, we had
$3.9 billion
of debt outstanding, excluding capital and financing lease obligations, at a weighted-average interest rate of
4.8%
(calculated using an imputed interest rate of
7.5%
for our
2.75%
convertible senior notes due
June 15, 2018
). No balance was drawn on our secured credit facility as of
December 31, 2017
. As of
December 31, 2017
, we had
$1.3 billion
of capital and financing lease obligations, and
$106.2 million
of letters of credit had been issued under our secured credit facility and separate unsecured letter of credit facilities. For the year ending December 31, 2018 we will be required to make approximately
$150.4 million
and
$369.2 million
of cash payments in connection with our existing capital and financing leases and our operating leases, respectively.
During the year ended
December 31, 2017
, we increased our liquidity position by
$288.6 million
to
$872.6 million
as of
December 31, 2017
, compared to
$584.0 million
as of
December 31, 2016
. Total liquidity as of
December 31, 2017
included
$222.6 million
of unrestricted cash and cash equivalents (excluding cash and escrow deposits-restricted and lease security deposits
62
of
$103.2 million
in the aggregate),
$291.8 million
of marketable securities, and
$358.2 million
of availability on our secured credit facility. We plan to market in 2018 and sell approximately 30 owned communities, which we believe will generate more than $250 million of proceeds, net of associated debt and transaction costs. However, the closings of the expected sales of assets are subject to our successful marketing of such assets on terms acceptable to us and will be subject to the satisfaction of various closing conditions, including (where applicable) the receipt of regulatory approvals. There can be no assurance that the transactions will close or, if they do, when the actual closings will occur.
In June 2017, we obtained a
$54.7 million
non-recourse addition and borrow-up loan, secured by first mortgages on
seven
communities. The loan bears interest at a fixed rate of
4.69%
and matures on
March 1, 2022
. Proceeds from the loan added to our liquidity.
In July 2017, we completed the refinancing of two existing loan portfolios secured by the non-recourse first mortgage on
22
communities. The
$221.3 million
of proceeds from the refinancing were primarily utilized to pay off
$188.1 million
and
$13.6 million
of mortgage debt maturing in
April 2018
and
January 2021
, respectively. The mortgage facility has a
10
year term, and
70%
of the principal amount bears interest at a fixed rate of
4.81%
and the remaining
30%
of the principal amount bears interest at a variable rate of 30-day LIBOR plus a margin of
244
basis points.
In August 2017, we obtained $
975.0 million
of loans secured by the non-recourse first mortgages on
51
communities.
Sixty percent
of the principal amount bears interest at a fixed rate, with one half of such amount bearing interest at
4.43%
and maturing in
2024
and the other one half bearing interest at
4.47%
and maturing in
2027
.
Forty percent
of the principal amount bears interest at a variable rate equal to the 30-day LIBOR plus a margin of
241.5
basis points and matures in
2027
. The
$975.0 million
of proceeds from the refinancing were primarily utilized to repay
$389.9 million
and
$228.9 million
of outstanding mortgage debt scheduled to mature in
August 2018
and
May 2023
, respectively. The net proceeds from the refinancing activity added to our liquidity.
As of
December 31, 2017
, we had
$193.9 million
of negative working capital. Due to the nature of our business, it is not unusual to operate in the position of negative working capital because we collect revenues much more quickly, often in advance, than we are required to pay obligations, and we have historically refinanced or extended maturities of debt obligations as they become current liabilities. Our operations result in a very low level of current assets primarily stemming from our deployment of cash to pay down long-term liabilities, to fund capital expenditures, in connection with our portfolio optimization initiative, and to pursue strategic business development opportunities. As of
December 31, 2017
, the current portion of long-term debt was
$495.4 million
, which includes the carrying amount of our
2.75%
convertible senior notes due
June 15, 2018
, the carrying amount of
$43.3 million
of mortgage debt due in
May 2018
and
$30.1 million
of mortgage debt related to
15
communities classified as held for sale as of
December 31, 2017
. We estimate that we will have sufficient liquidity to settle the outstanding principal amount of
$316.3 million
of the convertible notes in cash at maturity.
Our capital expenditures are comprised of community-level, corporate and development capital expenditures. Community-level capital expenditures include recurring expenditures (routine maintenance of communities over $1,500 per occurrence, including for unit turnovers (subject to a $500 floor)) and community renovations, apartment upgrades and other major building infrastructure projects. Corporate and other capital expenditures include those for information technology systems and equipment, the expansion of our support platform and ancillary services programs, and the remediation or replacement of assets as a result of casualty losses. Development capital expenditures include community expansions and major community redevelopment and repositioning projects, including our Program Max initiative, and the development of new communities.
Through our Program Max initiative, we intend to expand, renovate, redevelop and reposition certain of our communities where economically advantageous. Certain of our communities may benefit from additions and expansions or from adding a new level of service for residents to meet the evolving needs of our customers. These Program Max projects include converting space from one level of care to another, reconfiguration of existing units, the addition of services that are not currently present or physical plant modifications. We currently have
11
Program Max projects that have been approved, most of which have begun construction and are expected to generate
70
net new units.
63
The following table summarizes our actual
2017
capital expenditures for our consolidated communities:
|
(in millions)
|
Actual 2017
|
||
|
Community-level capital expenditures, net
(1)
|
$
|
151.6
|
|
|
Corporate and other
(2)
|
34.9
|
|
|
|
Non-development capital expenditures, net
(3)
|
186.5
|
|
|
|
Development capital expenditures, net
(4)
|
8.8
|
|
|
|
Total capital expenditures, net
|
$
|
195.3
|
|
|
(1)
|
Amount shown for the year ended
December 31, 2017
is the amount invested, net of lessor reimbursements of
$18.1 million
.
|
|
(2)
|
Amount shown for the year ended
December 31, 2017
includes $5.5 million of remediation costs at our communities resulting from Hurricanes Harvey and Irma. Amounts exclude reimbursement from our property and casualty insurance policies of approximately $9.6 million for 2017.
|
|
(3)
|
Amounts are included in Adjusted Free Cash Flow.
|
|
(4)
|
Amount shown for the year ended
December 31, 2017
is the amount invested, net of lessor reimbursements of
$8.1 million
.
|
During 2018, we expect our aggregate level of capital expenditures will be generally consistent with our aggregate 2017 capital expenditures. Following Hurricane Irma in 2017, the State of Florida issued an emergency order requiring skilled nursing homes and assisted living communities to obtain generators and fuel necessary to sustain operations and maintain comfortable temperatures in the event of a power outage. The emergency order has been overturned and there are legislative and regulatory rulemaking actions in process to address generator requirements. We may be required to make substantial capital expenditures in addition to our expectations for 2018 to comply with any legislative or administrative generator requirements ultimately adopted in Florida. We anticipate that our 2018 capital expenditures will be funded from cash on hand, cash flows from operations, and, if necessary, amounts drawn on our secured credit facility.
Execution on our strategy and any identified lease restructuring, development or acquisition opportunities may require additional capital. We expect to continue to assess our financing alternatives periodically and access the capital markets opportunistically. If our existing resources are insufficient to satisfy our liquidity requirements, or if we enter into an acquisition or strategic arrangement with another company, we may need to sell additional equity or debt securities. Any such sale of additional equity securities will dilute the percentage ownership of our existing stockholders, and we cannot be certain that additional public or private financing will be available in amounts or on terms acceptable to us, if at all. Any newly issued equity securities may have rights, preferences or privileges senior to those of our common stock. If we are unable to raise additional funds or obtain them on terms acceptable to us, we may have to forego, delay or abandon lease restructuring, development or acquisition opportunities that we identify.
We currently estimate that our existing cash flows from operations, together with cash on hand, amounts available under our secured credit facility and proceeds from anticipated dispositions of owned communities and financings and refinancings of various assets, will be sufficient to fund our liquidity needs for at least the next 12 months, assuming a relatively stable macroeconomic environment.
Our actual liquidity and capital funding requirements depend on numerous factors, including our operating results, our actual level of capital expenditures, general economic conditions and the cost of capital. Volatility in the credit and financial markets may have an adverse impact on our liquidity by making it more difficult for us to obtain financing or refinancing. Shortfalls in cash flows from operating results or other principal sources of liquidity may have an adverse impact on our ability to maintain capital spending levels, to execute on our strategy or to pursue lease restructuring, development or acquisitions that we may identify. In order to continue some of these activities at historical or planned levels, we may incur additional indebtedness or lease financing to provide additional funding. There can be no assurance that any such additional financing will be available or on terms that are acceptable to us.
64
Indebtedness
As of
December 31, 2017
, we have three principal corporate-level debt obligations: our
$400.0 million
secured credit facility, our
$316.3 million
2.75%
convertible senior notes due
June 15, 2018
, and our separate unsecured letter of credit facilities providing for up to
$64.5 million
of letters of credit in the aggregate. The remainder of our indebtedness is generally comprised of approximately
$3.5 billion
of non-recourse property-level mortgage financings as of
December 31, 2017
.
Credit Facilities
On December 19, 2014, we entered into a Fourth Amended and Restated Credit Agreement with General Electric Capital Corporation (which has since assigned its interest to Capital One Financial Corporation), as administrative agent, lender and swingline lender, and the other lenders from time to time parties thereto. The agreement currently provides for a total commitment amount of
$400.0 million
, comprised of a
$400.0 million
revolving credit facility (with a
$50.0 million
sublimit for letters of credit and a
$50.0 million
swingline feature to permit same day borrowing) and an option to increase the revolving credit facility by an additional
$250.0 million
, subject to obtaining commitments for the amount of such increase from acceptable lenders. The maturity date is
January 3, 2020
and amounts drawn under the facility bear interest at 90-day LIBOR plus an applicable margin from a range of 2.50% to 3.50%. The applicable margin varies based on the percentage of the total commitment drawn, with a 2.50% margin at utilization equal to or lower than 35%, a 3.25% margin at utilization greater than 35% but less than or equal to 50%, and a 3.50% margin at utilization greater than 50%. The quarterly commitment fee on the unused portion of the facility is 0.25% per annum when the outstanding amount of obligations (including revolving credit, swingline and term loans and letter of credit obligations) is greater than or equal to 50% of the total commitment amount or 0.35% per annum when such outstanding amount is less than 50% of the total commitment amount.
Amounts drawn on the facility may be used to finance acquisitions, fund working capital and capital expenditures and for other general corporate purposes.
The facility is secured by first priority mortgages on certain of our communities. In addition, the agreement permits us to pledge the equity interests in subsidiaries that own other communities (rather than mortgaging such communities), provided that loan availability from pledged assets cannot exceed 10% of loan availability from mortgaged assets. The availability under the line will vary from time to time as it is based on borrowing base calculations related to the appraised value and performance of the communities securing the facility.
The agreement contains typical affirmative and negative covenants, including financial covenants with respect to minimum consolidated fixed charge coverage and minimum consolidated tangible net worth. A violation of any of these covenants could result in a default under the credit agreement, which would result in termination of all commitments under the agreement and all amounts owing under the agreement becoming immediately due and payable and could trigger cross-default provisions in our other outstanding debt and lease agreements.
As of
December 31, 2017
, no borrowings were outstanding on the revolving credit facility and $
41.8 million
of letters of credit were outstanding, resulting in
$358.2 million
of availability on our secured credit facility. We also had separate unsecured letter of credit facilities of up to
$64.5 million
in the aggregate as of
December 31, 2017
. Letters of credit totaling $
64.4 million
had been issued under these separate facilities as of that date.
As of
December 31, 2017
, we are in compliance with the financial covenants of our outstanding credit facilities.
Convertible Debt
In June 2011, we completed a registered offering of
$316.3 million
aggregate principal amount of
2.75%
convertible senior notes due
June 15, 2018
(the "Notes"). As of
December 31, 2017
, the
$309.9 million
carrying value of the Notes was included in the current portion of long-term debt within the consolidated balance sheet. It is our current intent and policy to settle the principal amount of the Notes (or, if less, the amount of the conversion obligation) in cash upon conversion.
The Notes are senior unsecured obligations and rank equally in right of payment to all of our other senior unsecured debt, if any. The Notes will be senior in right of payment to any of our debt which is subordinated by its terms to the Notes (if any). The Notes are also structurally subordinated to all debt and other liabilities and commitments (including trade payables) of our subsidiaries. The Notes are also effectively subordinated to our secured debt to the extent of the assets securing such debt.
65
The Notes bear interest at
2.75%
per annum, payable semi-annually in cash. The Notes are convertible at an initial conversion rate of
34.1006
shares of Company common stock per
$1,000
principal amount of Notes (equivalent to an initial conversion price of approximately
$29.325
per share), subject to adjustment. On and after March 15, 2018, until the close of business on the second scheduled trading day immediately preceding the maturity date, holders may convert their Notes at any time. In addition, Holders may convert their Notes at their option under the following circumstances: (i) during any fiscal quarter if the last reported sale price of the Company's common stock for at least
20
trading days (whether or not consecutive) during a period of
30
consecutive trading days ending on the last trading day of the preceding fiscal quarter is greater than or equal to
130%
of the applicable conversion price on the last day of such preceding fiscal quarter; (ii) during the
five
business day period after any
five
consecutive trading day period (the "measurement period"), in which the trading price per
$1,000
principal amount of notes for each trading day of that measurement period was less than
98%
of the product of the last reported sale price of the Company's common stock and the applicable conversion rate on each such day; or (iii) upon the occurrence of specified corporate events. As of
December 31, 2017
, the Notes are not convertible. Unconverted Notes mature at par on
June 15, 2018
.
In addition, following certain corporate transactions, we will increase the conversion rate for a holder who elects to convert in connection with such transaction by a number of additional shares of common stock as set forth in the supplemental indenture governing the Notes.
In connection with the offering of the Notes, in June 2011, the Company entered into convertible note hedge transactions (the "Convertible Note Hedges") with certain financial institutions (the "Hedge Counterparties"). The Convertible Note Hedges cover, subject to customary anti-dilution adjustments,
10,784,315
shares of common stock. The Company also entered into warrant transactions with the Hedge Counterparties whereby the Company sold to the Hedge Counterparties warrants to acquire, subject to customary anti-dilution adjustments, up to
10,784,315
shares of common stock (the "Sold Warrant Transactions"). The warrants have a strike price of
$40.25
per share, subject to customary anti-dilution adjustments.
The Convertible Note Hedges are expected to reduce the potential dilution with respect to common stock upon conversion of the Notes in the event that the price per share of common stock at the time of exercise is greater than the strike price of the Convertible Note Hedges, which corresponds to the initial conversion price of the Notes and is similarly subject to customary anti-dilution adjustments. If, however, the price per share of common stock exceeds the strike price of the Sold Warrant Transactions when they expire, there would be additional dilution from the issuance of common stock pursuant to the warrants.
The Convertible Note Hedges and Sold Warrant Transactions are separate transactions (in each case entered into by us and the Hedge Counterparties), are not part of the terms of the Notes and will not affect the holders' rights under the Notes. Holders of the Notes do not have any rights with respect to the Convertible Note Hedges or the Sold Warrant Transactions.
These hedging transactions had a net cost of approximately
$31.9 million
, which was paid from the proceeds of the Notes and recorded as a reduction of additional paid-in capital. The Company has contractual rights, and, at execution of the related agreements, had the ability to settle its obligations under the conversion features of the Notes, the Convertible Note Hedges and Sold Warrant Transactions, with the Company's common stock. Accordingly, these transactions are accounted for as equity, with no subsequent adjustment for changes in the value of these obligations.
Long-Term Leases
As of
December 31, 2017
, we have
434
communities under long-term leases (
290
operating leases and
144
capital and financing leases). The substantial majority of our lease arrangements are structured as master leases. Under a master lease, numerous communities are leased through an indivisible lease. The Company typically guarantees the performance and lease payment obligations of its subsidiary leases under master leases. Due to the nature of such master leases, it is difficult to restructure the composition of our leased portfolios or economic terms of the leases without the consent of the applicable landlord. In addition, an event of default related to an individual property or limited number of properties within a master lease portfolio would result in a default on the entire master lease portfolio.
The leases relating to these communities are generally fixed rate leases with annual escalators that are either fixed or tied to changes in leased property revenue or the consumer price index. We are responsible for all operating costs, including repairs, property taxes and insurance. The initial lease terms primarily vary from
10
to
20
years and generally include renewal options ranging from
5
to
15
years. The remaining base lease terms vary from less than
one
year to
15
years and generally provide for renewal or extension options and in some instances, purchase options.
The community leases contain other customary terms, which may include assignment and change of control restrictions, maintenance and capital expenditure obligations, termination provisions and financial covenants, such as those requiring the Company to maintain prescribed minimum net worth and stockholders’ equity levels and lease coverage ratios, as further described
66
below. In addition, our lease documents generally contain non-financial covenants, such as those requiring us to comply with Medicare or Medicaid provider requirements. Certain leases contain cure provisions, which generally allow us to post an additional lease security deposit if the required covenant is not met.
In addition, certain of our master leases and management agreements contain radius restrictions, which limit our ability to own, develop or acquire new communities within a specified distance from certain existing communities covered by such agreements. These radius restrictions could negatively affect our ability to expand or develop or acquire senior housing communities and operating companies.
For the year ended
December 31, 2017
, our cash lease payments for our capital and financing leases and our operating leases were
$187.8 million
and
$365.1 million
, respectively. For the year ending
December 31,
2018, we will be required to make approximately
$150.4 million
and
$369.2 million
of cash lease payments in connection with our existing capital and financing leases and our operating leases, respectively.
Debt and Lease Covenants
Certain of our debt and lease documents contain restrictions and financial covenants, such as those requiring us to maintain prescribed minimum net worth and stockholders’ equity levels and debt service and lease coverage ratios, and requiring us not to exceed prescribed leverage ratios, in each case on a consolidated, portfolio-wide, multi-community, single-community and/or entity basis. Net worth is generally calculated as stockholders' equity as calculated in accordance with GAAP, and in certain circumstances, reduced by intangible assets or liabilities or increased by deferred gains from sale-leaseback transactions and deferred entrance fee revenue. The debt service and lease coverage ratios are generally calculated as revenues less operating expenses, including an implied management fee and a reserve for capital expenditures, divided by the debt (principal and interest) or lease payment. In some cases, the calculation of the applicable financial covenants (such as the calculation of our coverage ratio for the applicable portfolio for a particular period) requires interpretation of complex debt and lease provisions. A landlord has advised us that it asserts that the manner in which we have calculated compliance with a financial covenant under master leases scheduled to expire in stages over the next approximately two and one-half years that cover a total of nine communities is incorrect. We disagree with the landlord. In the event that it is ultimately determined that our method of calculating such compliance was erroneous, it is possible that the recalculation could result in our failure to be in compliance with such covenant. We have reviewed the applicable lease provisions with outside counsel and remain confident that we have been, and continue to be, in compliance with the applicable requirements of the leases. In addition, our debt and lease documents generally contain non-financial covenants, such as those requiring us to comply with Medicare or Medicaid provider requirements.
Our failure to comply with applicable covenants could constitute an event of default under the applicable debt or lease documents. Many of our debt and lease documents contain cross-default provisions so that a default under one of these instruments could cause a default under other debt and lease documents (including documents with other lenders and lessors).
Furthermore, our debt and leases are secured by our communities and, in certain cases, a guaranty by us and/or one or more of our subsidiaries. Therefore, if an event of default has occurred under any of our debt or lease documents, subject to cure provisions in certain instances, the respective lender or lessor would have the right to declare all the related outstanding amounts of indebtedness or cash lease obligations immediately due and payable, to foreclose on our mortgaged communities, to terminate our leasehold interests, to foreclose on other collateral securing the indebtedness and leases, to discontinue our operation of leased communities and/or to pursue other remedies available to such lender or lessor. Further, an event of default could trigger cross-default provisions in our other debt and lease documents (including documents with other lenders or lessors). We cannot provide assurance that we would be able to pay the debt or lease obligations if they became due upon acceleration following an event of default.
As of December 31, 2017, we are in compliance with the financial covenants of our outstanding debt agreements and long-term leases.
Derivative Instruments
In the normal course of business, we have entered into certain interest rate protection agreements to effectively manage the risk above certain interest rates for a portion of our variable rate debt. As of
December 31, 2017
, we have
$813.4 million
in aggregate notional amount of interest rate caps and
$1.3 billion
of variable rate debt, excluding our capital and financing lease obligations, that is not subject to any cap or swap agreements.
67
Contractual Commitments
The following table presents a summary of our material indebtedness, including the related interest payments, lease and other contractual commitments, as of
December 31, 2017
.
|
|
Payments Due during the Year Ending December 31,
|
||||||||||||||||||||||||||
|
(in millions)
|
Total
|
2018
|
2019
|
2020
|
2021
|
2022
|
Thereafter
|
||||||||||||||||||||
|
|
|||||||||||||||||||||||||||
|
Contractual Obligations:
|
|
|
|
|
|
|
|||||||||||||||||||||
|
Long-term debt and line of credit obligations
(1)
|
$
|
4,799.0
|
|
$
|
672.1
|
|
$
|
481.3
|
|
$
|
618.5
|
|
$
|
448.5
|
|
$
|
433.3
|
|
$
|
2,145.3
|
|
||||||
|
Capital and financing lease obligations
(2)
|
1,975.3
|
|
576.4
|
|
137.0
|
|
78.3
|
|
61.8
|
|
62.6
|
|
1,059.2
|
|
|||||||||||||
|
Operating lease obligations
(2)
|
2,578.2
|
|
369.2
|
|
348.0
|
|
307.8
|
|
266.3
|
|
247.1
|
|
1,039.8
|
|
|||||||||||||
|
Refundable entrance fee obligations
(3)
|
8.9
|
|
0.4
|
|
0.4
|
|
0.4
|
|
0.4
|
|
0.4
|
|
6.9
|
|
|||||||||||||
|
Total contractual obligations
|
$
|
9,361.4
|
|
$
|
1,618.1
|
|
$
|
966.7
|
|
$
|
1,005.0
|
|
$
|
777.0
|
|
$
|
743.4
|
|
$
|
4,251.2
|
|
||||||
|
Total commercial construction commitments
|
$
|
38.5
|
|
$
|
34.0
|
|
$
|
4.5
|
|
$
|
—
|
|
$
|
—
|
|
$
|
—
|
|
$
|
—
|
|
||||||
|
(1)
|
Includes line of credit and contractual interest for all fixed-rate obligations and assumes interest on variable rate instruments at the
December 31, 2017
rate. Long-term debt obligation payments in 2018 include the following debt instruments: (i) our
$316.3 million
outstanding principal amount of
2.75%
convertible senior notes due
June 15, 2018
, (ii)
$30.1 million
of debt on assets held for sale, and (iii)
$34.7 million
of demand notes payable to the unconsolidated CCRC Venture, which we utilize in certain states in lieu of cash reserves.
|
|
(2)
|
Reflects future cash payments after giving effect to non-contingent lease escalators and assumes payments on variable rate instruments at the
December 31, 2017
rate. Additionally, the contractual obligation amounts include the residual value for financing lease obligations. The amount for the year ending December 31, 2018 includes the $374.5 million carrying value of the financing lease obligations for 20 communities for which the leases have been amended to expire on or before November 1, 2018.
|
|
(3)
|
Future refunds of entrance fees are estimated based on historical payment trends. These refund obligations are generally offset by proceeds received from resale of the vacated apartment units. Historically, proceeds from resales of entrance fee units each year generally offset refunds paid and generate excess cash to us.
|
The foregoing amounts exclude outstanding letters of credit of
$106.2 million
as of
December 31, 2017
.
In connection with the multi-part transaction with HCP entered into in 2017, we agreed to acquire six communities for an aggregate purchase price of $274.9 million in 2018. We expect to fund our acquisition of the
six
communities with the proceeds from the sale of our unconsolidated venture interests, cash on hand, non-recourse mortgage financing on the acquired communities and refinancing of certain other communities.
Impacts of Inflation
Resident fees from the communities we own or lease and management fees from communities we manage for third parties or unconsolidated ventures in which we have an ownership interest are our primary sources of revenue. These revenues are affected by the amount of monthly resident fee rates and community occupancy rates. The rates charged are highly dependent on local market conditions and the competitive environment in which our communities operate. Substantially all of our retirement center, assisted living, and CCRC residency agreements allow for adjustments in the monthly fee payable not less frequently than every 12 or 13 months which enables us to seek increases in monthly fees due to inflation, increased levels of care or other factors. Any pricing increase would be subject to market and competitive conditions and could result in a decrease in occupancy in the communities. We believe, however, that our ability to periodically adjust the monthly fee serves to reduce the adverse effect of inflation. In addition, employee compensation expense is a principal element of facility operating costs and is also dependent upon
68
local market conditions. There can be no assurance that resident fees will increase or that costs will not increase due to inflation or other causes.
As of
December 31, 2017
, approximately
$1.3 billion
of our indebtedness, excluding our secured credit facility, bears interest at floating rates. We have mitigated our exposure to floating rates by using interest rate caps under our debt arrangements. Inflation, and its impact on floating interest rates, could affect the amount of interest payments due on our secured credit facility and other variable rate debt instruments.
Off-Balance Sheet Arrangements
As of
December 31, 2017
, we do not have an interest in any "off-balance sheet arrangements" (as defined in Item 303(a)(4) of Regulation S-K) that have or are reasonably likely to have a current or future effect on our financial condition, changes in financial condition, revenues or expenses, results of operations, liquidity, capital expenditures or capital resources that is material to investors.
We own interests in certain unconsolidated ventures as described under Note 6 to the consolidated financial statements. Except in limited circumstances, our risk of loss is limited to our investment in each venture. We also own interests in certain other unconsolidated ventures that are not considered variable interest entities. The equity method of accounting has been applied in the accompanying financial statements with respect to our investment in unconsolidated ventures.
Critical Accounting Policies and Estimates
The preparation of our financial statements in conformity with accounting principles generally accepted in the United States, or GAAP, requires us to make estimates and judgments that affect our reported amounts of assets and liabilities, revenues and expenses. We consider an accounting estimate to be critical if it requires assumptions to be made that were uncertain at the time the estimate was made and changes in the estimate, or different estimates that could have been selected, could have a material impact on our consolidated results of operations or financial condition. We have identified the following critical accounting policies that affect significant estimates and judgments.
Self-Insurance Liability Accruals
We are subject to various legal proceedings and claims that arise in the ordinary course of our business. Although we maintain general liability and professional liability insurance policies for our owned, leased and managed communities under a master insurance program, our current policies provide for deductibles for each and every claim. As a result, we are effectively self-insured for claims that are less than the deductible amounts. In addition, we maintain a high-deductible workers compensation program. Third-party insurers are responsible for claim costs above program deductibles and retentions.
The cost of our employee health and dental benefits, net of employee contributions, is shared by us and our communities based on the respective number of participants working directly either at our corporate offices or at the communities. Cash received is used to pay the actual costs of administering the program which include paid claims, third-party administrative fees, network provider fees, communication costs, and other related administrative costs incurred by us. Claims are paid as they are submitted to the plan administrator.
Outstanding losses and expenses for general liability and professional liability and workers compensation are estimated based on the recommendations of independent actuaries and management's estimates. We review the adequacy of our accruals related to these liabilities on an ongoing basis, using historical claims, actuarial valuations, third-party administrator estimates, consultants, advice from legal counsel and industry data, and adjust accruals periodically. Estimated costs related to these self-insurance programs are accrued based on known claims and projected claims incurred but not yet reported. Subsequent changes in actual experience are monitored and estimates are updated as information becomes available.
Income Taxes
We account for income taxes under the provisions of Accounting Standards Codification ("ASC") 740,
Income Taxes
. Under this method, deferred tax assets and liabilities are determined based on the difference between the financial statement and tax bases of assets and liabilities using tax rates in effect for the year in which the differences are expected to affect taxable income. Valuation allowances are established when necessary to reduce deferred tax assets to the amounts that are expected to be realized. As of
December 31, 2017
and
2016
, we have a valuation allowance against deferred tax assets of approximately
$336.1 million
and
$264.3 million
, respectively. When we determine that it is more likely than not that we will be able to realize our deferred tax assets in the future in excess of our net recorded amount, an adjustment to the deferred tax asset would be made and reflected in income. This determination will be made by considering various factors, including the reversal and timing of existing temporary
69
differences, tax planning strategies and estimates of future taxable income exclusive of the reversal of temporary differences, although we are currently precluded under GAAP from considering estimates of future taxable income in our analysis due to our cumulative historical operating losses.
Lease Accounting
We determine whether to account for our leases as either operating, capital, or financing leases depending on the underlying terms. As of
December 31, 2017
, we operated
434
communities under long-term leases with operating, capital and financing lease obligations. The determination of this classification is complex and in certain situations requires a significant level of judgment. Our classification criteria is based on estimates regarding the fair value of the leased communities, minimum lease payments, effective cost of funds, the economic life of the community and certain other terms in the lease agreements. Communities under operating leases are accounted for in our consolidated statements of operations as lease expenses for actual rent paid plus or minus straight-line adjustments for fixed or estimated minimum lease escalators as well as amortization of above/below market rents and deferred gains. For communities under capital and financing lease obligation arrangements, a liability is established on our balance sheets and a corresponding long-term asset is recorded. Lease payments are allocated between principal and interest on the remaining base lease obligations. For capital lease assets, the asset is depreciated over the remaining lease term unless there is a bargain purchase option in which case the asset is depreciated over the useful life. For financing lease assets, the asset is depreciated over the useful life of the asset. In addition, we amortize leasehold improvements purchased during the term of the lease over the shorter of their economic life or the lease term. Sale-leaseback transactions are recorded as lease financing obligations when the transactions include a form of continuing involvement, such as purchase options.
Allowance for Doubtful Accounts and Contractual Adjustments
Accounts receivable are reported net of an allowance for doubtful accounts, to represent our estimate of the amount that ultimately will be realized in cash. The allowance for doubtful accounts was
$23.1 million
and
$27.0 million
as of
December 31, 2017
and
2016
, respectively. The adequacy of our allowance for doubtful accounts is reviewed on an ongoing basis, using historical payment trends, write-off experience, analyses of receivable portfolios by payor source and aging of receivables, as well as a review of specific accounts, and adjustments are made to the allowance as necessary. Recent changes in legislation are not expected to have a material impact on the collectability of our accounts receivable; however, changes in economic conditions could have an impact on the collection of existing receivable balances or future allowance calculations.
Approximately
82.1%
of our resident fee revenues for each of the years ended
December 31, 2017
and
2016
were derived from private pay customers and
17.9%
of our resident fee revenues for each of the years ended
December 31, 2017
and
2016
were derived from services covered by various third-party payor programs, including Medicare and Medicaid. Billings for services under third-party payor programs are recorded net of estimated retroactive adjustments, if any, under reimbursement programs. Revenue related to these billings is recorded on an estimated basis in the period the related services are rendered and adjusted in future periods or as final settlements are determined. We accrue contractual or cost related adjustments from Medicare or Medicaid when assessed (without regard to when the assessment is paid or withheld), even if we have not agreed to or are appealing the assessment. Subsequent positive or negative adjustments to these accrued amounts are recorded in net revenues when known.
Goodwill Impairment
As of
December 31, 2017
and
2016
, we had goodwill balances of
$505.8 million
and
$705.5 million
, respectively. Goodwill recorded in connection with business combinations is allocated to the respective reporting unit and included in our application of the provisions of ASC 350,
Intangibles – Goodwill and Other
("ASC 350").
We test goodwill for impairment annually during our fourth quarter, or whenever indicators of impairment arise. Factors we consider important in our analysis of whether an indicator of impairment exists include a significant decline in our stock price or market capitalization for a sustained period since the last testing date, significant underperformance relative to historical or projected future operating results and significant negative industry or economic trends. We first assess qualitative factors to determine whether it is necessary to perform a quantitative goodwill impairment test. The quantitative goodwill impairment test is based upon a comparison of the estimated fair value of the reporting unit to which the goodwill has been assigned with the reporting unit's carrying value. We are not required to calculate the fair value of a reporting unit unless we determine, based on a qualitative assessment, that it is more likely than not that its fair value is less than its carrying amount. The fair values used in the quantitative goodwill impairment test are estimated based upon discounted future cash flow projections for the reporting unit. These cash flow projections are based upon a number of estimates and assumptions such as revenue and expense growth rates, capitalization rates and discount rates. We also consider market based measures such as earnings multiples in our analysis of estimated fair values of our reporting units. If the quantitative goodwill impairment test results in a reporting unit's carrying amount exceeding its estimated
70
fair value, an impairment charge will be recorded based on the difference, with the impairment charge limited to the amount of goodwill allocated to the reporting unit.
In estimating the fair value of our reporting units for purposes of our quantitative goodwill impairment testing, we utilize the income approach, which includes future cash flow projections that are developed internally. Any estimates of future cash flow projections necessarily involve predicting unknown future circumstances and events and require significant management judgments and estimates. In arriving at our cash flow projections, we consider our historic operating results, approved budgets and business plans, future demographic factors, expected growth rates, and other factors. In using the income approach to estimate the fair value of reporting units for purposes of our goodwill impairment testing, we make certain key assumptions. Those assumptions include future revenues, facility operating expenses, and cash flows, including sales proceeds that we would receive upon a sale of the communities using estimated capitalization rates. We corroborate the estimated capitalization rates we use in these calculations with capitalization rates observable from recent market transactions. Future cash flows are discounted at a rate that is consistent with a weighted average cost of capital from a market participant perspective. The weighted average cost of capital is an estimate of the overall after-tax rate of return required by equity and debt holders of a business enterprise. We also consider market based measures such as earnings multiples in our analysis of estimated fair values of our reporting units.
During the three months ended September 30, 2017, we identified qualitative indicators of impairment of our goodwill, including a significant decline in our stock price and market capitalization for a sustained period since the last testing date, significant underperformance relative to historical and projected operating results, and an increased competitive environment in the senior living industry. Based upon our qualitative assessment, we performed an interim quantitative goodwill impairment test as of September 30, 2017, which included a comparison of the estimated fair value of each reporting unit to which the goodwill has been assigned with the reporting unit's carrying value. Based on the results of the quantitative goodwill impairment test, we determined that the carrying amount of our Assisted Living reporting unit exceeded its estimated fair value by $205.0 million as of September 30, 2017. As a result, we recorded a non-cash impairment charge of $205.0 million to goodwill within the Assisted Living operating segment for the three months ended September 30, 2017. As of September 30, 2017, we concluded that there was no impairment of goodwill for the Retirement Centers and Brookdale Ancillary Services reporting units. Based on the results of the quantitative goodwill impairment test, we determined that the estimated fair value of our Brookdale Ancillary Services reporting unit exceeded its carrying value by approximately 19%. As of
December 31, 2017
, our estimated fair values of our reporting units exceeded their carrying values and we concluded that there was no impairment of goodwill. Goodwill allocated to our Assisted Living and Brookdale Ancillary Services reporting units is approximately
$351.7 million
and
$126.8 million
, respectively, as of
December 31, 2017
.
Determining the fair value of a reporting unit involves the use of significant estimates and assumptions, which we believe to be reasonable, that are unpredictable and inherently uncertain. These estimates and assumptions include revenue growth rates and operating margins used to calculate projected future cash flows and risk-adjusted discount rates. Future events may indicate differences from management's current judgments and estimates which could, in turn, result in future impairments. Future events that may result in impairment charges include increases in interest rates, which could impact capitalization and discount rates, differences in the projected occupancy rates and changes in the cost structure of existing communities. Significant adverse changes in our future revenues and/or operating margins, significant changes in the market for senior housing or the valuation of the real estate of senior living communities, as well as other events and circumstances, including but not limited to increased competition and changing economic or market conditions, including market control premiums, could result in changes in fair value and the determination that additional goodwill is impaired.
Our impairment loss assessment contains uncertainties because it requires us to apply judgment to estimate whether there has been a decline in the fair value of our reporting units, including estimating future cash flows, and if necessary, the fair value of our assets and liabilities. As we periodically perform this assessment, changes in our estimates and assumptions may cause us to realize material impairment charges in the future. Although we make every reasonable effort to ensure the accuracy of our estimate of the fair value of our reporting units, future changes in the assumptions used to make these estimates could result in the recording of an impairment loss.
Property, Plant and Equipment and Leasehold Intangibles Impairment
As of
December 31, 2017
and
2016
, our long-lived assets were comprised primarily of
$5.9 billion
and
$7.4 billion
of net property, plant and equipment and leasehold intangibles, respectively. In accounting for our property, plant and equipment and leasehold intangibles, we apply the provisions of ASC 360,
Property, Plant and Equipment
. Acquisitions are accounted for using the purchase method of accounting and the purchase prices are assigned to acquired assets and liabilities based on their estimated fair values.
We test property, plant and equipment and leasehold intangibles for recoverability annually during our fourth quarter or whenever changes in circumstances indicate the carrying value may not be recoverable. Recoverability of an asset is estimated by comparing
71
its carrying value to the future net undiscounted cash flows expected to be generated by the asset, calculated utilizing the lowest level of identifiable cash flows. If this comparison indicates that the carrying value of an asset is not recoverable, we are required to recognize an impairment loss. The impairment loss is measured by the amount by which the carrying amount of the asset exceeds its estimated fair value. When an impairment loss is recognized for assets to be held and used, the carrying amount of those assets is permanently adjusted and depreciated over its remaining useful life.
In estimating the recoverability of property, plant and equipment and leasehold intangibles for purposes of our impairment testing, we utilize future cash flow projections that are developed internally. Any estimates of future cash flow projections necessarily involve predicting unknown future circumstances and events and require significant management judgments and estimates. In arriving at our cash flow projections, we consider our historic operating results, approved budgets and business plans, future demographic factors, expected growth rates, and other factors. In estimating the future cash flows of asset groups for purposes of our property, plant and equipment and leasehold intangibles impairment test, we make certain key assumptions. Those assumptions include future revenues, facility operating expenses, and cash flows, including sales proceeds that we would receive upon a sale of the communities using estimated capitalization rates. We corroborate the estimated capitalization rates we use in these calculations with capitalization rates observable from recent market transactions.
Determining the future cash flows of an asset group involves the use of significant estimates and assumptions, which we believe to be reasonable, that are unpredictable and inherently uncertain. These estimates and assumptions include revenue growth rates and operating margins used to calculate projected future cash flows. Future events may indicate differences from management's current judgments and estimates which could, in turn, result in future impairments. Future events that may result in impairment charges include increases in interest rates, which could impact capitalization rates, differences in the projected occupancy rates and changes in the cost structure of existing communities. Significant adverse changes in our future revenues and/or operating margins, significant changes in the market for senior housing or the valuation of the real estate of senior living communities, as well as other events and circumstances, including but not limited to increased competition and changing economic or market conditions, could result in changes in estimated future cash flows and the determination that additional assets are impaired.
During
2017
,
2016
and
2015
we evaluated long-lived depreciable assets and determined in each year that the undiscounted cash flows exceeded the carrying value of these assets for all except a small number of communities. Estimated fair values were determined for these certain properties and we recorded asset impairment charges of
$164.4 million
,
$166.2 million
and
$23.4 million
for
2017
,
2016
and
2015
, respectively, for property, plant and equipment and leasehold intangibles. These impairment charges are primarily due to our decision to dispose of assets, either through sales or lease terminations, or lower than expected performance of the underlying communities and equal the amount by which the carrying values of the assets exceed the estimated fair value.
Our impairment loss assessment contains uncertainties because it requires us to apply judgment to estimate whether there has been a decline in the fair value of our assets, including estimating future cash flows, and if necessary, the fair value of our assets. As we periodically perform this assessment, changes in our estimates and assumptions may cause us to realize material impairment charges in the future. Although we make every reasonable effort to ensure the accuracy of our estimate of the future cash flows of assets, future changes in the assumptions used to make these estimates could result in the recording of an impairment loss.
Investment in Unconsolidated Ventures
Investments in affiliated companies that we do not control, but in which we have the ability to exercise significant influence over governance and operation, are accounted for by using the equity method. The initial carrying value of investments in unconsolidated ventures is based on the amount paid to purchase the investment interest or the carrying value of assets contributed to the unconsolidated ventures. The Company's reported share of earnings of an unconsolidated venture is adjusted for the impact, if any, of basis differences between its carrying value of the equity investment and its share of the venture's underlying assets.
Distributions received from an investee are recognized as a reduction in the carrying amount of the investment. If distributions are received from an investee that would reduce the carrying amount of an equity method investment below zero, we evaluate the facts and circumstances of the dividends to determine the appropriate accounting for the excess distribution, including an evaluation of the source of the proceeds and implicit or explicit commitments to fund the investee. The excess distribution is either recorded as a gain on investment, or in instances where the source of proceeds is from financing activities or we have a significant commitment to fund the investee, the excess distribution would result in an equity method liability and we would continue to record our share of the investee's earnings and losses.
We evaluate realization of investments in ventures accounted for using the equity method if circumstances indicate that the investment is other than temporarily impaired. A current fair value of an investment that is less than its carrying amount may indicate a loss in value of the investment. If we determine that an equity method investment is other than temporarily impaired,
72
it is recorded at its fair value with an impairment charge recognized in asset impairment expense for the difference between its carrying amount and fair value.
Litigation
Litigation is inherently uncertain and the outcome of individual litigation matters is not predictable with assurance. As described in Note 18 to the consolidated financial statements, we are involved in various legal actions and claims incidental to the conduct of our business which are comparable to other companies in the senior living and healthcare industries. We have established loss provisions for matters in which losses are probable and can be reasonably estimated. In other instances, we may not be able to make a reasonable estimate of any liability because of uncertainties related to the outcome and/or the amount or range of losses. Changes in our current estimates, due to unanticipated events or otherwise, could have a material impact on our financial condition and results of operations.
New Accounting Pronouncements
See Note 2 to the consolidated financial statements contained in "Item 8. Financial Statements and Supplementary Data" for a discussion of new accounting pronouncements.
Non-GAAP Financial Measures
This Annual Report on Form 10-K contains financial measures utilized by management to evaluate our operating performance and liquidity that are not calculated in accordance with U.S. generally accepted accounting principles ("GAAP"). Each of these measures, Adjusted EBITDA and Adjusted Free Cash Flow, should not be considered in isolation from or as superior to or as a substitute for net income (loss), income (loss) from operations, net cash provided by (used in) operating activities, or other financial measures determined in accordance with GAAP. We use these non-GAAP financial measures to supplement our GAAP results in order to provide a more complete understanding of the factors and trends affecting our business.
We strongly urge you to review the reconciliations of Adjusted EBITDA from our net income (loss), our Adjusted Free Cash Flow from our net cash provided by (used in) operating activities, and our proportionate share of Adjusted Free Cash Flow of unconsolidated ventures from such ventures' net cash provided by (used in) operating activities, along with our consolidated financial statements included herein. We also strongly urge you not to rely on any single financial measure to evaluate our business. We caution investors that amounts presented in accordance with our definitions of Adjusted EBITDA and Adjusted Free Cash Flow may not be comparable to similar measures disclosed by other companies, because not all companies calculate these non-GAAP measures in the same manner.
Adjusted EBITDA
Definition of Adjusted EBITDA
We define Adjusted EBITDA as net income (loss) before: provision (benefit) for income taxes; non-operating (income) expense items; depreciation and amortization (including non-cash impairment charges); (gain) loss on sale or acquisition of communities (including gain (loss) on facility lease termination); straight-line lease expense (income), net of amortization of (above) below market rents; amortization of deferred gain; non-cash stock-based compensation expense; and change in future service obligation.
We changed our definition and calculation of Adjusted EBITDA when we reported results for the second quarter of 2016, including our Quarterly Report on Form 10-Q filed on August 9, 2016. Prior period amounts of Adjusted EBITDA presented herein have been recast to conform to the new definition. The current definition of Adjusted EBITDA reflects the removal of the following adjustments to our net income (loss) that were used in the former definition: the addition of our proportionate share of CFFO of unconsolidated ventures and our entrance fee receipts, net of refunds, and the subtraction of our amortization of entrance fees.
Management's Use of Adjusted EBITDA
We use Adjusted EBITDA to assess our overall operating performance. We believe this non-GAAP measure, as we have defined it, is helpful in identifying trends in our day-to-day performance because the items excluded have little or no significance on our day-to-day operations. This measure provides an assessment of controllable expenses and affords management the ability to make decisions which are expected to facilitate meeting current operating goals as well as achieve optimal operating performance. It provides an indicator for management to determine if adjustments to current spending decisions are needed.
73
Adjusted EBITDA provides us with a measure of operating performance, independent of items that are beyond the control of management in the short-term, such as the change in the liability for the obligation to provide future services under existing lifecare contracts, depreciation and amortization (including non-cash impairment charges), straight-line lease expense (income), taxation and interest expense associated with our capital structure. This metric measures our operating performance based on operational factors that management can impact in the short-term, namely revenues and the cost structure or expenses of the organization. Adjusted EBITDA is one of the metrics used by senior management and the board of directors to review the operating performance of the business on a regular basis. We believe that Adjusted EBITDA is also used by research analysts and investors to evaluate the performance of and value companies in our industry.
Limitations of Adjusted EBITDA
Adjusted EBITDA has limitations as an analytical tool. Material limitations in making the adjustments to our net income (loss) to calculate Adjusted EBITDA, and using this non-GAAP financial measure as compared to GAAP net income (loss), include:
|
•
|
the cash portion of interest expense, income tax (benefit) provision and non-recurring charges related to gain (loss) on sale of communities (or facility lease termination) and extinguishment of debt activities generally represent charges (gains), which may significantly affect our operating results; and
|
|
•
|
depreciation and amortization and asset impairment represent the wear and tear and/or reduction in value of our communities and other assets, which affects the services we provide to residents and may be indicative of future needs for capital expenditures.
|
We believe Adjusted EBITDA is useful to investors in evaluating our operating performance because it is helpful in identifying trends in our day-to-day performance since the items excluded have little or no significance to our day-to-day operations and it provides an assessment of our revenue and expense management.
The table below reconciles Adjusted EBITDA from net income (loss).
|
|
Years Ended December 31,
|
||||||||||
|
(in thousands)
|
2017
|
2016
|
2015
|
||||||||
|
Net income (loss)
|
$
|
(571,606
|
)
|
$
|
(404,636
|
)
|
$
|
(458,155
|
)
|
||
|
(Benefit) provision for income taxes
|
(16,515
|
)
|
5,378
|
|
(92,209
|
)
|
|||||
|
Equity in loss (earnings) of unconsolidated ventures
|
14,827
|
|
(1,660
|
)
|
804
|
|
|||||
|
Debt modification and extinguishment costs
|
12,409
|
|
9,170
|
|
7,020
|
|
|||||
|
Gain on sale of assets
|
(19,273
|
)
|
(7,218
|
)
|
(1,270
|
)
|
|||||
|
Other non-operating income
|
(11,418
|
)
|
(14,801
|
)
|
(8,557
|
)
|
|||||
|
Interest expense
|
326,154
|
|
385,617
|
|
388,764
|
|
|||||
|
Interest income
|
(4,623
|
)
|
(2,933
|
)
|
(1,603
|
)
|
|||||
|
Income (loss) from operations
|
(270,045
|
)
|
(31,083
|
)
|
(165,206
|
)
|
|||||
|
Depreciation and amortization
|
482,077
|
|
520,402
|
|
733,165
|
|
|||||
|
Goodwill and asset impairment
|
409,782
|
|
248,515
|
|
57,941
|
|
|||||
|
Loss on facility lease termination
|
14,276
|
|
11,113
|
|
76,143
|
|
|||||
|
Straight-line lease (income) expense
|
(14,313
|
)
|
767
|
|
6,956
|
|
|||||
|
Amortization of (above) below market lease, net
|
(6,677
|
)
|
(6,864
|
)
|
(7,158
|
)
|
|||||
|
Amortization of deferred gain
|
(4,366
|
)
|
(4,372
|
)
|
(4,372
|
)
|
|||||
|
Non-cash stock-based compensation expense
|
27,832
|
|
32,285
|
|
31,651
|
|
|||||
|
Change in future service obligation
|
—
|
|
—
|
|
(941
|
)
|
|||||
|
Adjusted EBITDA
(1)
|
$
|
638,566
|
|
$
|
770,763
|
|
$
|
728,179
|
|
||
|
(1)
|
The calculation of Adjusted EBITDA includes transaction and strategic project costs of
$25.4 million
for the year ended December 31,
2017
and integration, transaction, transaction-related and strategic project costs of
$54.2 million
and
$116.8 million
for the years ended December 31,
2016
and
2015
, respectively. Integration costs include transition costs associated with organizational restructuring (such as severance and retention payments and recruiting expenses), third party consulting expenses directly related to the integration of acquired communities (in areas such as cost savings and synergy realization,
|
74
branding and technology and systems work), and internal costs such as training, travel and labor, reflecting time spent by Company personnel on integration activities and projects. Transaction and transaction-related costs include third party costs directly related to acquisition and disposition activity, community financing and leasing activity, our assessment of options and alternatives to enhance stockholder value, and corporate capital structure assessment activities (including stockholder relations advisory matters), and are primarily comprised of legal, finance, consulting, professional fees and other third party costs. Strategic project costs include costs associated with certain strategic projects related to refining our strategy, building out enterprise-wide capabilities for the post-merger platform (including the EMR roll-out project) and reducing costs and achieving synergies by capitalizing on scale.
Adjusted Free Cash Flow
Definition of Adjusted Free Cash Flow
We define Adjusted Free Cash Flow as net cash provided by (used in) operating activities before: changes in operating assets and liabilities; gain (loss) on facility lease termination; and distributions from unconsolidated ventures from cumulative share of net earnings; plus: proceeds from refundable entrance fees, net of refunds; and property insurance proceeds; less: lease financing debt amortization and Non-Development CapEx. Non-Development CapEx is comprised of corporate and community-level capital expenditures, including those related to maintenance, renovations, upgrades and other major building infrastructure projects for our communities. Non-Development CapEx does not include capital expenditures for community expansions and major community redevelopment and repositioning projects, including our Program Max initiative, and the development of new communities. Amounts of Non-Development CapEx are presented net of lessor reimbursements received or anticipated to be received in the calculation of Adjusted Free Cash Flow.
Our proportionate share of Adjusted Free Cash Flow of unconsolidated ventures is calculated based on our equity ownership percentage and in a manner consistent with the definition of Adjusted Free Cash Flow for our consolidated entities. Our investments in our unconsolidated ventures are accounted for under the equity method of accounting and, therefore, our proportionate share of Adjusted Free Cash Flow of unconsolidated ventures does not represent cash available to our consolidated business except to the extent it is distributed to us.
Accounting Standards Update 2016-15,
Statement of Cash Flows - Classification of Certain Cash Receipts and Cash Payments
("ASU 2016-15") is effective for the Company on January 1, 2018 and will be applied retrospectively for all periods presented. Among other things, ASU 2016-15 provides that debt prepayment and extinguishment costs will be classified within financing activities. We have identified
$11.7 million
and
$7.9 million
of cash paid for debt modification and extinguishment costs for the years ended December 31, 2017 and 2016, respectively, which we have determined will be retrospectively classified as cash flows from financing activities and will result in an increase to the amount of net cash provided by operating activities for such years. We do not anticipate changing our definition of Adjusted Free Cash Flow as a result of our adoption of ASU 2016-15. As a result, we anticipate that in future presentations of Adjusted Free Cash Flow that accompany 2018 financial results, the amount of Adjusted Free Cash Flow for the years ended December 31, 2017 and 2016 will be increased by
$11.7 million
and
$7.9 million
, respectively.
Management's Use of Adjusted Free Cash Flow
We use Adjusted Free Cash Flow to assess our overall liquidity. This measure provides an assessment of controllable expenses and affords management the ability to make decisions which are expected to facilitate meeting current financial and liquidity goals as well as to achieve optimal financial performance. It provides an indicator for management to determine if adjustments to current spending decisions are needed.
Adjusted Free Cash Flow measures our liquidity based on operational factors that management can impact in the short-term, namely the cost structure or expenses of the organization. Adjusted Free Cash Flow is one of the metrics used by our senior management and board of directors (i) to review our ability to service our outstanding indebtedness, including our credit facilities, (ii) to review our ability to pay dividends to stockholders or engage in share repurchases, (iii) to review our ability to make capital expenditures, (iv) for other corporate planning purposes and/or (v) in making compensation determinations for certain of our associates (including our named executive officers).
Limitations of Adjusted Free Cash Flow
Adjusted Free Cash Flow has limitations as an analytical tool. Material limitations in making the adjustments to our net cash provided by (used in) operating activities to calculate Adjusted Free Cash Flow and using this non-GAAP financial measure as compared to GAAP net cash provided by (used in) operating activities, include:
75
|
•
|
Adjusted Free Cash Flow does not represent cash available for dividends or discretionary expenditures, since we have mandatory debt service requirements and other non-discretionary expenditures not reflected in this measure; and
|
|
•
|
the cash portion of non-recurring charges related to gain (loss) on lease termination and extinguishment of debt activities generally represent charges (gains), which may significantly affect our financial results.
|
In addition, our proportionate share of Adjusted Free Cash Flow of unconsolidated ventures has limitations as an analytical tool because such measure does not represent cash available directly for use by our consolidated business except to the extent actually distributed to us, and we do not have control, or we share control in determining, the timing and amount of distributions from our unconsolidated ventures and, therefore, we may never receive such cash.
We believe Adjusted Free Cash Flow is useful to investors because it assists their ability to meaningfully evaluate (1) our ability to service our outstanding indebtedness, including our credit facilities and capital and financing leases, (2) our ability to pay dividends to stockholders or engage in share repurchases, (3) our ability to make capital expenditures, and (4) the underlying value of our assets, including our interests in real estate.
We believe presentation of our proportionate share of Adjusted Free Cash Flow of unconsolidated ventures is useful to investors since such measure reflects the cash generated by the operating activities of the unconsolidated ventures for the reporting period and, to the extent such cash is not distributed to us, it generally represents cash used or to be used by the ventures for the repayment of debt, investing in expansions or acquisitions, reserve requirements, or other corporate uses by such ventures, and such uses reduce our potential need to make capital contributions to the ventures of our proportionate share of cash needed for such items.
The table below reconciles our Adjusted Free Cash Flow from our net cash provided by (used in) operating activities.
|
|
Years Ended December 31,
|
||||||||||
|
(in thousands)
|
2017
|
2016
|
2015
|
||||||||
|
Net cash provided by operating activities
|
$
|
366,664
|
|
$
|
365,732
|
|
$
|
292,366
|
|
||
|
Net cash (used in) provided by investing activities
|
(601,307
|
)
|
176,825
|
|
(568,977
|
)
|
|||||
|
Net cash provided by (used in) financing activities
|
240,893
|
|
(414,189
|
)
|
260,557
|
|
|||||
|
Net increase (decrease) in cash and cash equivalents
|
$
|
6,250
|
|
$
|
128,368
|
|
$
|
(16,054
|
)
|
||
|
Net cash provided by operating activities
|
$
|
366,664
|
|
$
|
365,732
|
|
$
|
292,366
|
|
||
|
Changes in operating assets and liabilities
|
(15,851
|
)
|
76,252
|
|
11,312
|
|
|||||
|
Proceeds from refundable entrance fees, net of refunds
|
(2,179
|
)
|
(901
|
)
|
(2,472
|
)
|
|||||
|
Lease financing debt amortization
|
(64,906
|
)
|
(63,267
|
)
|
(56,922
|
)
|
|||||
|
Loss on facility lease termination
|
—
|
|
11,113
|
|
76,143
|
|
|||||
|
Distributions from unconsolidated ventures from cumulative share of net earnings
|
(8,258
|
)
|
(23,544
|
)
|
(7,825
|
)
|
|||||
|
Non-development capital expenditures, net
|
(186,467
|
)
|
(220,767
|
)
|
(324,479
|
)
|
|||||
|
Property insurance proceeds
|
8,550
|
|
9,137
|
|
3,175
|
|
|||||
|
Adjusted Free Cash Flow
|
$
|
97,553
|
|
$
|
153,755
|
|
$
|
(8,702
|
)
|
||
76
The table below reconciles our proportionate share of Adjusted Free Cash Flow of unconsolidated ventures from net cash provided by (used in) operating activities of such unconsolidated ventures. For purposes of this presentation, amounts for each line item represent the aggregate amounts of such line items for all of our unconsolidated ventures.
|
|
Years Ended December 31,
|
||||||||||
|
(in thousands)
|
2017
|
2016
|
2015
|
||||||||
|
Net cash provided by operating activities
|
$
|
269,755
|
|
$
|
198,524
|
|
$
|
180,266
|
|
||
|
Net cash used in investing activities
|
(1,267,525
|
)
|
(118,935
|
)
|
(1,218,101
|
)
|
|||||
|
Net cash provided by (used by) financing activities
|
1,031,064
|
|
(88,262
|
)
|
1,028,562
|
|
|||||
|
Net increase (decrease) in cash and cash equivalents
|
$
|
33,294
|
|
$
|
(8,673
|
)
|
$
|
(9,273
|
)
|
||
|
Net cash provided by operating activities
|
$
|
269,755
|
|
$
|
198,524
|
|
$
|
180,266
|
|
||
|
Changes in operating assets and liabilities
|
(13,184
|
)
|
(2,508
|
)
|
(7,634
|
)
|
|||||
|
Proceeds from refundable entrance fees, net of refunds
|
(17,366
|
)
|
(7,675
|
)
|
(4,844
|
)
|
|||||
|
Non-development capital expenditures, net
|
(100,621
|
)
|
(98,305
|
)
|
(121,895
|
)
|
|||||
|
Property insurance proceeds
|
2,425
|
|
—
|
|
—
|
|
|||||
|
Adjusted Free Cash Flow of unconsolidated ventures
|
$
|
141,009
|
|
$
|
90,036
|
|
$
|
45,893
|
|
||
|
Brookdale weighted average ownership percentage
|
25.1
|
%
|
36.2
|
%
|
49.0
|
%
|
|||||
|
Brookdale's proportionate share of Adjusted Free Cash Flow of unconsolidated ventures
|
$
|
35,416
|
|
$
|
32,630
|
|
$
|
22,470
|
|
||
|
Item 7A.
|
Quantitative and Qualitative Disclosures About Market Risk.
|
We had cash and cash equivalents and marketable securities of
$514.4 million
as of
December 31, 2017
, which consisted primarily of cash, money market funds, commercial paper and corporate bonds. Our interest income on cash equivalents and marketable securities is affected by changes in interest rates, market and credit risks. However, our commercial paper and corporate bond securities have maturities averaging six months and changes in the value of these securities would not be expected to have a material impact on our liquidity or results of operations.
We are subject to market risks from changes in interest rates charged on our credit facilities, other floating-rate indebtedness and lease payments subject to floating rates. The impact on earnings and the value of our long-term debt and lease payments are subject to change as a result of movements in market rates and prices. As of
December 31, 2017
, we had approximately
$2.5 billion
of long-term fixed rate debt,
$1.3 billion
of long-term variable rate debt and
$1.3 billion
of capital and financing lease obligations. As of
December 31, 2017
, our total fixed-rate debt and variable-rate debt outstanding had a weighted-average interest rate of
4.8%
(calculated using an imputed interest rate of
7.5%
for our
$316.3 million
2.75%
convertible senior notes due
June 15, 2018
).
We enter into certain interest rate cap agreements with major financial institutions to effectively manage our risk above certain interest rates on variable rate debt. As of
December 31, 2017
,
$2.5 billion
, or
65.5%
, of our long-term debt, excluding our capital and financing lease obligations, has fixed rates. As of
December 31, 2017
,
$534.3 million
, or
13.8%
, of our long-term debt, excluding capital and financing lease obligations, is subject to interest rate cap agreements. The remaining
$799.9 million
, or
20.7%
, of our debt is variable rate debt, not subject to any interest rate cap or swap agreements. A change in interest rates would have impacted our annual interest expense related to all outstanding variable rate debt, excluding our capital and financing lease obligations, as follows (after consideration of hedging instruments currently in place): a 100 basis point increase in interest rates would have an impact of
$13.7 million
, a 500 basis point increase in interest rates would have an impact of
$57.1 million
and a 1,000 basis point increase in interest rates would have an impact of
$98.0 million
.
77
|
Item 8.
|
Financial Statements and Supplementary Data.
|
BROOKDALE SENIOR LIVING INC.
INDEX TO FINANCIAL STATEMENTS
|
|
PAGE
|
78
Report of Independent Registered Public Accounting Firm
The Board of Directors and Stockholders of Brookdale Senior Living Inc.
Opinion on the Financial Statements
We have audited the accompanying consolidated balance sheets of Brookdale Senior Living Inc. (the Company) as of December 31, 2017 and 2016, the related consolidated statements of operations, equity, and cash flows for each of the three years in the period ended December 31, 2017, and the related notes and financial statement schedule included in the Index at Item 15 (collectively referred to as the consolidated financial statements). In our opinion, the consolidated financial statements present fairly, in all material respects, the financial position of the Company at December 31, 2017 and 2016, and the results of its operations and its cash flows for each of the three years in the period ended December 31, 2017, in conformity with U.S. generally accepted accounting principles.
We also have audited, in accordance with the standards of the Public Company Accounting Oversight Board (United States) (PCAOB), the Company's internal control over financial reporting as of December 31, 2017, based on criteria established in Internal Control-Integrated Framework issued by the Committee of Sponsoring Organizations of the Treadway Commission (2013 framework), and our report dated
February 22, 2018
expressed an unqualified opinion thereon.
Basis for Opinion
These financial statements are the responsibility of the Company's management. Our responsibility is to express an opinion on the Company’s financial statements based on our audits. We are a public accounting firm registered with the PCAOB and are required to be independent with respect to the Company in accordance with the U.S. federal securities laws and the applicable rules and regulations of the Securities and Exchange Commission and the PCAOB.
We conducted our audits in accordance with the standards of the PCAOB. Those standards require that we plan and perform the audit to obtain reasonable assurance about whether the financial statements are free of material misstatement, whether due to error or fraud. Our audits included performing procedures to assess the risks of material misstatement of the financial statements, whether due to error or fraud, and performing procedures that respond to those risks. Such procedures included examining, on a test basis, evidence regarding the amounts and disclosures in the financial statements. Our audits also included evaluating the accounting principles used and significant estimates made by management, as well as evaluating the overall presentation of the financial statements. We believe that our audits provide a reasonable basis for our opinion.
/s/ Ernst & Young LLP
We have served as the Company’s auditor since 1993
Chicago, Illinois
February 22, 2018
79
Report of Independent Registered Public Accounting Firm
The Board of Directors and Stockholders of Brookdale Senior Living Inc.
Opinion on Internal Control over Financial Reporting
We have audited Brookdale Senior Living Inc.’s (the Company) internal control over financial reporting as of December 31, 2017, based on criteria established in Internal Control-Integrated Framework issued by the Committee of Sponsoring Organizations of the Treadway Commission (2013 framework) (the COSO criteria). In our opinion, the Company maintained, in all material respects, effective internal control over financial reporting as of December 31, 2017, based on the COSO criteria.
We also have audited, in accordance with the standards of the Public Company Accounting Oversight Board (United States) (PCAOB), the consolidated balance sheets of the Company as of December 31, 2017 and 2016, the related consolidated statements of operations, equity, and cash flows for each of the three years in the period ended December 31, 2017, and the related notes and financial statement schedule included in the Index at Item 15 and our report dated
February 22, 2018
expressed an unqualified opinion thereon.
Basis for Opinion
The Company’s management is responsible for maintaining effective internal control over financial reporting and for its assessment of the effectiveness of internal control over financial reporting included in the accompanying Management’s Assessment of Internal Control over Financial Reporting. Our responsibility is to express an opinion on the Company’s internal control over financial reporting based on our audit. We are a public accounting firm registered with the PCAOB and are required to be independent with respect to the Company in accordance with the U.S. federal securities laws and the applicable rules and regulations of the Securities and Exchange Commission and the PCAOB.
We conducted our audit in accordance with the standards of the PCAOB. Those standards require that we plan and perform the audit to obtain reasonable assurance about whether effective internal control over financial reporting was maintained in all material respects.
Our audit included obtaining an understanding of internal control over financial reporting, assessing the risk that a material weakness exists, testing and evaluating the design and operating effectiveness of internal control based on the assessed risk, and performing such other procedures as we considered necessary in the circumstances. We believe that our audit provides a reasonable basis for our opinion.
Definition and Limitation of Internal Control over Financial Reporting
A company’s internal control over financial reporting is a process designed to provide reasonable assurance regarding the reliability of financial reporting and the preparation of financial statements for external purposes in accordance with generally accepted accounting principles. A company’s internal control over financial reporting includes those policies and procedures that (1) pertain to the maintenance of records that, in reasonable detail, accurately and fairly reflect the transactions and dispositions of the assets of the company; (2) provide reasonable assurance that transactions are recorded as necessary to permit preparation of financial statements in accordance with generally accepted accounting principles, and that receipts and expenditures of the company are being made only in accordance with authorizations of management and directors of the company; and (3) provide reasonable assurance regarding prevention or timely detection of unauthorized acquisition, use, or disposition of the company’s assets that could have a material effect on the financial statements.
Because of its inherent limitations, internal control over financial reporting may not prevent or detect misstatements. Also, projections of any evaluation of effectiveness to future periods are subject to the risk that controls may become inadequate because of changes in conditions, or that the degree of compliance with the policies or procedures may deteriorate.
/s/ Ernst & Young LLP
Chicago, Illinois
February 22, 2018
80
BROOKDALE SENIOR LIVING INC.
(In thousands, except stock amounts)
|
|
December 31,
|
||||||
|
|
2017
|
2016
|
|||||
|
Assets
|
|
|
|||||
|
Current assets
|
|
|
|
||||
|
Cash and cash equivalents
|
$
|
222,647
|
|
$
|
216,397
|
|
|
|
Marketable securities
|
291,796
|
|
—
|
|
|||
|
Cash and escrow deposits – restricted
|
37,189
|
|
32,864
|
|
|||
|
Accounts receivable, net
|
128,961
|
|
141,705
|
|
|||
|
Assets held for sale
|
106,435
|
|
97,843
|
|
|||
|
Prepaid expenses and other current assets, net
|
114,844
|
|
130,695
|
|
|||
|
Total current assets
|
901,872
|
|
619,504
|
|
|||
|
Property, plant and equipment and leasehold intangibles, net
|
5,852,145
|
|
7,379,305
|
|
|||
|
Cash and escrow deposits – restricted
|
22,710
|
|
28,061
|
|
|||
|
Investment in unconsolidated ventures
|
129,794
|
|
167,826
|
|
|||
|
Goodwill
|
505,783
|
|
705,476
|
|
|||
|
Other intangible assets, net
|
67,977
|
|
83,007
|
|
|||
|
Other assets, net
|
195,168
|
|
234,508
|
|
|||
|
Total assets
|
$
|
7,675,449
|
|
$
|
9,217,687
|
|
|
|
Liabilities and Equity
|
|
|
|
|
|||
|
Current liabilities
|
|
|
|
|
|||
|
Current portion of long-term debt
|
$
|
495,413
|
|
$
|
145,649
|
|
|
|
Current portion of capital and financing lease obligations
|
107,088
|
|
69,606
|
|
|||
|
Trade accounts payable
|
91,825
|
|
77,356
|
|
|||
|
Accrued expenses
|
329,966
|
|
328,037
|
|
|||
|
Refundable entrance fees and deferred revenue
|
68,358
|
|
106,946
|
|
|||
|
Tenant security deposits
|
3,126
|
|
3,548
|
|
|||
|
Total current liabilities
|
1,095,776
|
|
731,142
|
|
|||
|
Long-term debt, less current portion
|
3,375,324
|
|
3,413,998
|
|
|||
|
Capital and financing lease obligations, less current portion
|
1,164,466
|
|
2,415,914
|
|
|||
|
Deferred liabilities
|
224,304
|
|
267,364
|
|
|||
|
Deferred tax liability
|
70,644
|
|
80,646
|
|
|||
|
Other liabilities
|
214,644
|
|
230,891
|
|
|||
|
Total liabilities
|
6,145,158
|
|
7,139,955
|
|
|||
|
Preferred stock, $0.01 par value, 50,000,000 shares authorized at December 31, 2017 and December 31, 2016; no shares issued and outstanding
|
—
|
|
—
|
|
|||
|
Common stock, $0.01 par value, 400,000,000 shares authorized at December 31, 2017 and December 31, 2016; 194,454,329 and 193,224,082 shares issued and 191,275,928 and 190,045,681 shares outstanding (including 4,770,097 and 4,608,187 unvested restricted shares), respectively
|
1,913
|
|
1,900
|
|
|||
|
Additional paid-in-capital
|
4,126,549
|
|
4,102,397
|
|
|||
|
Treasury stock, at cost; 3,178,401 shares at December 31, 2017 and December 31, 2016
|
(56,440
|
)
|
(56,440
|
)
|
|||
|
Accumulated deficit
|
(2,541,294
|
)
|
(1,969,875
|
)
|
|||
|
Total Brookdale Senior Living Inc. stockholders' equity
|
1,530,728
|
|
2,077,982
|
|
|||
|
Noncontrolling interest
|
(437
|
)
|
(250
|
)
|
|||
|
Total equity
|
1,530,291
|
|
2,077,732
|
|
|||
|
Total liabilities and equity
|
$
|
7,675,449
|
|
$
|
9,217,687
|
|
|
See accompanying notes to consolidated financial statements.
81
BROOKDALE SENIOR LIVING INC.
(In thousands, except per share data)
|
|
For the Years Ended December 31,
|
||||||||||
|
|
2017
|
2016
|
2015
|
||||||||
|
Revenue
|
|
|
|
||||||||
|
Resident fees
|
$
|
3,780,140
|
|
$
|
4,168,621
|
|
$
|
4,177,127
|
|
||
|
Management fees
|
75,845
|
|
70,762
|
|
60,183
|
|
|||||
|
Reimbursed costs incurred on behalf of managed communities
|
891,131
|
|
737,597
|
|
723,298
|
|
|||||
|
Total revenue
|
4,747,116
|
|
4,976,980
|
|
4,960,608
|
|
|||||
|
Expense
|
|
|
|
|
|||||||
|
Facility operating expense (excluding depreciation and amortization of $430,288, $469,388 and $684,448, respectively)
|
2,602,155
|
|
2,799,402
|
|
2,788,862
|
|
|||||
|
General and administrative expense (including non-cash stock-based compensation expense of $27,832, $32,285 and $31,651, respectively)
|
255,446
|
|
313,409
|
|
370,579
|
|
|||||
|
Transaction costs
|
22,573
|
|
3,990
|
|
8,252
|
|
|||||
|
Facility lease expense
|
339,721
|
|
373,635
|
|
367,574
|
|
|||||
|
Depreciation and amortization
|
482,077
|
|
520,402
|
|
733,165
|
|
|||||
|
Goodwill and asset impairment
|
409,782
|
|
248,515
|
|
57,941
|
|
|||||
|
Loss on facility lease termination
|
14,276
|
|
11,113
|
|
76,143
|
|
|||||
|
Costs incurred on behalf of managed communities
|
891,131
|
|
737,597
|
|
723,298
|
|
|||||
|
Total operating expense
|
5,017,161
|
|
5,008,063
|
|
5,125,814
|
|
|||||
|
Income (loss) from operations
|
(270,045
|
)
|
(31,083
|
)
|
(165,206
|
)
|
|||||
|
Interest income
|
4,623
|
|
2,933
|
|
1,603
|
|
|||||
|
Interest expense:
|
|
|
|
|
|||||||
|
Debt
|
(172,635
|
)
|
(174,027
|
)
|
(173,484
|
)
|
|||||
|
Capital and financing lease obligations
|
(140,664
|
)
|
(202,012
|
)
|
(211,132
|
)
|
|||||
|
Amortization of deferred financing costs and debt premium (discount)
|
(12,681
|
)
|
(9,400
|
)
|
(3,351
|
)
|
|||||
|
Change in fair value of derivatives
|
(174
|
)
|
(178
|
)
|
(797
|
)
|
|||||
|
Debt modification and extinguishment costs
|
(12,409
|
)
|
(9,170
|
)
|
(7,020
|
)
|
|||||
|
Equity in earnings (loss) of unconsolidated ventures
|
(14,827
|
)
|
1,660
|
|
(804
|
)
|
|||||
|
Gain on sale of assets, net
|
19,273
|
|
7,218
|
|
1,270
|
|
|||||
|
Other non-operating income
|
11,418
|
|
14,801
|
|
8,557
|
|
|||||
|
Income (loss) before income taxes
|
(588,121
|
)
|
(399,258
|
)
|
(550,364
|
)
|
|||||
|
Benefit (provision) for income taxes
|
16,515
|
|
(5,378
|
)
|
92,209
|
|
|||||
|
Net income (loss)
|
(571,606
|
)
|
(404,636
|
)
|
(458,155
|
)
|
|||||
|
Net (income) loss attributable to noncontrolling interest
|
187
|
|
239
|
|
678
|
|
|||||
|
Net income (loss) attributable to Brookdale Senior Living Inc. common stockholders
|
$
|
(571,419
|
)
|
$
|
(404,397
|
)
|
$
|
(457,477
|
)
|
||
|
Basic and diluted net income (loss) per share attributable to Brookdale Senior Living Inc. common stockholders
|
$
|
(3.07
|
)
|
$
|
(2.18
|
)
|
$
|
(2.48
|
)
|
||
|
Weighted average shares used in computing basic and diluted net loss per share
|
186,155
|
|
185,653
|
|
184,333
|
|
|||||
See accompanying notes to consolidated financial statements.
82
BROOKDALE SENIOR LIVING INC.
CONSOLIDATED STATEMENTS OF EQUITY
For the Years Ended
December 31, 2017
,
2016
and
2015
(In thousands)
|
|
Common Stock
|
|
|
|
|
|
|
|||||||||||||||||||||||
|
|
Shares
|
Amount
|
Additional
Paid-In- Capital |
Treasury
Stock |
Accumulated
Deficit |
Stockholders' Equity
|
Noncontrolling Interest
|
Total Equity
|
||||||||||||||||||||||
|
Balances at January 1, 2015
|
187,038
|
|
$
|
1,870
|
|
$
|
4,034,655
|
|
$
|
(46,800
|
)
|
$
|
(1,108,001
|
)
|
$
|
2,881,724
|
|
$
|
517
|
|
$
|
2,882,241
|
|
|||||||
|
Compensation expense related to restricted stock grants
|
—
|
|
—
|
|
31,651
|
|
—
|
|
—
|
|
31,651
|
|
—
|
|
31,651
|
|
||||||||||||||
|
Net income (loss)
|
—
|
|
—
|
|
—
|
|
—
|
|
(457,477
|
)
|
(457,477
|
)
|
(678
|
)
|
(458,155
|
)
|
||||||||||||||
|
Issuance of common stock under Associate Stock Purchase Plan
|
122
|
|
1
|
|
2,869
|
|
—
|
|
—
|
|
2,870
|
|
—
|
|
2,870
|
|
||||||||||||||
|
Restricted stock, net
|
1,179
|
|
12
|
|
(12
|
)
|
—
|
|
—
|
|
—
|
|
—
|
|
—
|
|
||||||||||||||
|
Other
|
—
|
|
—
|
|
120
|
|
—
|
|
—
|
|
120
|
|
—
|
|
120
|
|
||||||||||||||
|
Balances at December 31, 2015
|
188,339
|
|
1,883
|
|
4,069,283
|
|
(46,800
|
)
|
(1,565,478
|
)
|
2,458,888
|
|
(161
|
)
|
2,458,727
|
|
||||||||||||||
|
Compensation expense related to restricted stock grants
|
—
|
|
—
|
|
32,285
|
|
—
|
|
—
|
|
32,285
|
|
—
|
|
32,285
|
|
||||||||||||||
|
Net income (loss)
|
—
|
|
—
|
|
—
|
|
—
|
|
(404,397
|
)
|
(404,397
|
)
|
(239
|
)
|
(404,636
|
)
|
||||||||||||||
|
Issuance of common stock under Associate Stock Purchase Plan
|
172
|
|
2
|
|
2,347
|
|
—
|
|
—
|
|
2,349
|
|
—
|
|
2,349
|
|
||||||||||||||
|
Restricted stock, net
|
2,396
|
|
24
|
|
(24
|
)
|
—
|
|
—
|
|
—
|
|
—
|
|
—
|
|
||||||||||||||
|
Purchase of treasury stock
|
(750
|
)
|
(8
|
)
|
8
|
|
(9,640
|
)
|
—
|
|
(9,640
|
)
|
—
|
|
(9,640
|
)
|
||||||||||||||
|
Shares withheld for employee taxes
|
(111
|
)
|
(1
|
)
|
(1,639
|
)
|
—
|
|
—
|
|
(1,640
|
)
|
—
|
|
(1,640
|
)
|
||||||||||||||
|
Other
|
—
|
|
—
|
|
137
|
|
—
|
|
—
|
|
137
|
|
150
|
|
287
|
|
||||||||||||||
|
Balances at December 31, 2016
|
190,046
|
|
1,900
|
|
4,102,397
|
|
(56,440
|
)
|
(1,969,875
|
)
|
2,077,982
|
|
(250
|
)
|
2,077,732
|
|
||||||||||||||
|
Compensation expense related to restricted stock grants
|
—
|
|
—
|
|
27,832
|
|
—
|
|
—
|
|
27,832
|
|
—
|
|
27,832
|
|
||||||||||||||
|
Net income (loss)
|
—
|
|
—
|
|
—
|
|
—
|
|
(571,419
|
)
|
(571,419
|
)
|
(187
|
)
|
(571,606
|
)
|
||||||||||||||
|
Issuance of common stock under Associate Stock Purchase Plan
|
181
|
|
2
|
|
2,039
|
|
—
|
|
—
|
|
2,041
|
|
—
|
|
2,041
|
|
||||||||||||||
|
Restricted stock, net
|
1,421
|
|
14
|
|
(14
|
)
|
—
|
|
—
|
|
—
|
|
—
|
|
—
|
|
||||||||||||||
|
Shares withheld for employee taxes
|
(372
|
)
|
(3
|
)
|
(5,886
|
)
|
—
|
|
—
|
|
(5,889
|
)
|
—
|
|
(5,889
|
)
|
||||||||||||||
|
Other
|
—
|
|
—
|
|
181
|
|
—
|
|
—
|
|
181
|
|
—
|
|
181
|
|
||||||||||||||
|
Balances at December 31, 2017
|
191,276
|
|
$
|
1,913
|
|
$
|
4,126,549
|
|
$
|
(56,440
|
)
|
$
|
(2,541,294
|
)
|
$
|
1,530,728
|
|
$
|
(437
|
)
|
$
|
1,530,291
|
|
|||||||
See accompanying notes to consolidated financial statements.
83
BROOKDALE SENIOR LIVING INC.
(In thousands)
|
|
For the Years Ended December 31,
|
||||||||||
|
|
2017
|
2016
|
2015
|
||||||||
|
Cash Flows from Operating Activities
|
|||||||||||
|
Net income (loss)
|
$
|
(571,606
|
)
|
$
|
(404,636
|
)
|
$
|
(458,155
|
)
|
||
|
Adjustments to reconcile net income (loss) to net cash provided by operating activities:
|
|
|
|
|
|||||||
|
Loss on extinguishment of debt, net
|
714
|
|
1,251
|
|
121
|
|
|||||
|
Depreciation and amortization, net
|
494,758
|
|
529,802
|
|
736,516
|
|
|||||
|
Goodwill and asset impairment
|
409,782
|
|
248,515
|
|
57,941
|
|
|||||
|
Equity in loss (earnings) of unconsolidated ventures
|
14,827
|
|
(1,660
|
)
|
804
|
|
|||||
|
Distributions from unconsolidated ventures from cumulative share of net earnings
|
8,258
|
|
23,544
|
|
7,825
|
|
|||||
|
Amortization of deferred gain
|
(4,366
|
)
|
(4,372
|
)
|
(4,372
|
)
|
|||||
|
Amortization of entrance fees
|
(2,901
|
)
|
(4,195
|
)
|
(3,204
|
)
|
|||||
|
Proceeds from deferred entrance fee revenue
|
5,712
|
|
13,980
|
|
11,113
|
|
|||||
|
Deferred income tax (benefit) provision
|
(15,309
|
)
|
3,248
|
|
(95,261
|
)
|
|||||
|
Straight-line lease (income) expense
|
(14,313
|
)
|
767
|
|
6,956
|
|
|||||
|
Change in fair value of derivatives
|
174
|
|
178
|
|
797
|
|
|||||
|
Gain on sale of assets, net
|
(19,273
|
)
|
(7,218
|
)
|
(1,270
|
)
|
|||||
|
Loss on facility lease termination
|
14,276
|
|
—
|
|
—
|
|
|||||
|
Non-cash stock-based compensation expense
|
27,832
|
|
32,285
|
|
31,651
|
|
|||||
|
Non-cash interest expense on financing lease obligations
|
17,744
|
|
26,496
|
|
23,472
|
|
|||||
|
Amortization of (above) below market lease, net
|
(6,677
|
)
|
(6,864
|
)
|
(7,158
|
)
|
|||||
|
Other
|
(8,819
|
)
|
(9,137
|
)
|
(4,098
|
)
|
|||||
|
Changes in operating assets and liabilities:
|
|
|
|||||||||
|
Accounts receivable, net
|
12,747
|
|
1,581
|
|
5,608
|
|
|||||
|
Prepaid expenses and other assets, net
|
21,970
|
|
2,954
|
|
51,079
|
|
|||||
|
Accounts payable and accrued expenses
|
(4,527
|
)
|
(83,248
|
)
|
(60,564
|
)
|
|||||
|
Tenant refundable fees and security deposits
|
(422
|
)
|
(839
|
)
|
(524
|
)
|
|||||
|
Deferred revenue
|
(13,917
|
)
|
3,300
|
|
(6,911
|
)
|
|||||
|
Net cash provided by operating activities
|
366,664
|
|
365,732
|
|
292,366
|
|
|||||
|
Cash Flows from Investing Activities
|
|
|
|
|
|||||||
|
Change in lease security deposits and lease acquisition deposits, net
|
(2,113
|
)
|
(2,225
|
)
|
10,866
|
|
|||||
|
Change in cash and escrow deposits — restricted
|
1,026
|
|
5,027
|
|
29,286
|
|
|||||
|
Purchase of marketable securities, net
|
(291,187
|
)
|
—
|
|
—
|
|
|||||
|
Additions to property, plant and equipment and leasehold intangibles, net
|
(213,887
|
)
|
(333,647
|
)
|
(411,051
|
)
|
|||||
|
Acquisition of assets, net of related payables and cash received
|
(5,196
|
)
|
(12,157
|
)
|
(191,216
|
)
|
|||||
|
Investment in unconsolidated ventures
|
(199,017
|
)
|
(13,377
|
)
|
(69,297
|
)
|
|||||
|
Distributions received from unconsolidated ventures
|
29,035
|
|
218,973
|
|
9,054
|
|
|||||
|
Proceeds from sale of assets, net
|
70,507
|
|
297,932
|
|
49,226
|
|
|||||
|
Property insurance proceeds
|
8,550
|
|
9,137
|
|
3,157
|
|
|||||
|
Other
|
975
|
|
7,162
|
|
998
|
|
|||||
|
Net cash (used in) provided by investing activities
|
(601,307
|
)
|
176,825
|
|
(568,977
|
)
|
|||||
|
Cash Flows from Financing Activities
|
|
|
|
|
|||||||
|
Proceeds from debt
|
1,307,205
|
|
387,348
|
|
585,650
|
|
|||||
|
Repayment of debt and capital and financing lease obligations
|
(1,054,161
|
)
|
(469,309
|
)
|
(485,762
|
)
|
|||||
|
Proceeds from line of credit
|
100,000
|
|
1,276,500
|
|
1,175,000
|
|
|||||
|
Repayment of line of credit
|
(100,000
|
)
|
(1,586,500
|
)
|
(965,000
|
)
|
|||||
|
Purchase of treasury stock
|
—
|
|
(9,640
|
)
|
—
|
|
|||||
|
Payment of financing costs, net of related payables
|
(5,574
|
)
|
(2,938
|
)
|
(32,622
|
)
|
|||||
|
Proceeds from refundable entrance fees, net of refunds
|
(2,179
|
)
|
(901
|
)
|
(2,472
|
)
|
|||||
|
Cash portion of loss on extinguishment of debt
|
—
|
|
—
|
|
(44
|
)
|
|||||
|
Payment on lease termination
|
(552
|
)
|
(9,250
|
)
|
(17,000
|
)
|
|||||
|
Payments of employee taxes for withheld shares
|
(5,889
|
)
|
(1,640
|
)
|
—
|
|
|||||
|
Other
|
2,043
|
|
2,141
|
|
2,807
|
|
|||||
|
Net cash provided by (used in) financing activities
|
240,893
|
|
(414,189
|
)
|
260,557
|
|
|||||
|
Net increase (decrease) in cash and cash equivalents
|
6,250
|
|
128,368
|
|
(16,054
|
)
|
|||||
|
Cash and cash equivalents at beginning of year
|
216,397
|
|
88,029
|
|
104,083
|
|
|||||
|
Cash and cash equivalents at end of year
|
$
|
222,647
|
|
$
|
216,397
|
|
$
|
88,029
|
|
||
See accompanying notes to consolidated financial statements.
84
BROOKDALE SENIOR LIVING INC.
NOTES TO CONSOLIDATED FINANCIAL STATEMENTS
1. Description of Business
Brookdale Senior Living Inc. ("Brookdale" or the "Company") is the leading operator of senior living communities throughout the United States. The Company is committed to providing senior living solutions primarily within properties that are designed, purpose-built and operated to provide quality service, care and living accommodations for residents. The Company operates independent living, assisted living and dementia-care communities and continuing care retirement centers ("CCRCs"). Through its ancillary services programs, the Company also offers a range of home health, hospice, and outpatient therapy services to residents of many of its communities and to seniors living outside its communities.
2. Summary of Significant Accounting Policies
The consolidated financial statements have been prepared on the accrual basis of accounting in accordance with U.S. generally accepted accounting principles ("GAAP"). The significant accounting policies are summarized below:
Principles of Consolidation
The consolidated financial statements include the accounts of Brookdale and its consolidated subsidiaries. All significant intercompany balances and transactions have been eliminated. Investments in affiliated companies that the Company does not control, but has the ability to exercise significant influence over governance and operations, are accounted for by the equity method. The ownership interest of consolidated entities not wholly-owned by the Company are presented as noncontrolling interests in the accompanying consolidated financial statements. Noncontrolling interest represents the share of consolidated entities owned by third parties. Noncontrolling interest is adjusted for the noncontrolling holder's share of additional contributions, distributions and the proportionate share of the net income or loss of each respective entity.
The Company continually evaluates its potential variable interest entity ("VIE") relationships under certain criteria as provided for in Financial Accounting Standards Board ("FASB") Accounting Standards Codification ("ASC") 810,
Consolidation
("ASC 810"). ASC 810 broadly defines a VIE as an entity with one or more of the following characteristics: (a) the total equity investment at risk is insufficient to finance the entity's activities without additional subordinated financial support; (b) as a group, the holders of the equity investment at risk lack (i) the ability to make decisions about the entity's activities through voting or similar rights, (ii) the obligation to absorb the expected losses of the entity, or (iii) the right to receive the expected residual returns of the entity; or (c) the equity investors have voting rights that are not proportional to their economic interests, and substantially all of the entity's activities either involve, or are conducted on behalf of, an investor that has disproportionately few voting rights. The Company performs this analysis on an ongoing basis and consolidates any VIEs for which the Company is determined to be the primary beneficiary, as determined by the Company's power to direct the VIE's activities and the obligation to absorb its losses or the right to receive its benefits, which are potentially significant to the VIE. Refer to Note 6 for more information about the Company's VIE relationships.
Use of Estimates
The preparation of the consolidated financial statements and related disclosures in conformity with GAAP requires management to make estimates and assumptions that affect the amounts reported in the consolidated financial statements and accompanying notes. Estimates are used for, but not limited to, revenue, goodwill and asset impairments, self-insurance reserves, performance-based compensation, the allowance for doubtful accounts, depreciation and amortization, income taxes and other contingencies. Although these estimates are based on management's best knowledge of current events and actions that the Company may undertake in the future, actual results may differ from the original estimates.
Revenue Recognition
Resident Fees
Resident fee revenue is recorded when services are rendered and consists of fees for basic housing and certain support services and fees associated with additional services such as assisted living care, skilled nursing care, ancillary services and personalized health services. Residency agreements are generally for a term of
30 days
to
one year
, with resident fees billed monthly in advance. Revenue for certain skilled nursing services and ancillary services is recognized as services are provided, and such fees are billed monthly in arrears.
85
Certain of the Company's communities have residency agreements which require the resident to pay an upfront entrance fee prior to moving into the community. The non-refundable portion of the entrance fee is recorded as deferred revenue and amortized over the estimated stay of the resident based on an actuarial valuation. The refundable portion of a resident's entrance fee is generally refundable within a certain number of months or days following contract termination or upon the resale of the unit. The refundable portion of the fee is not amortized and is included in refundable entrance fees. All refundable amounts due to residents at any time in the future are classified as current liabilities.
Management Fees
The Company manages certain communities under contracts which provide periodic management fee payments to the Company. Management fees are generally determined by an agreed upon percentage of gross revenues (as defined) and are recorded monthly. Certain management contracts also provide for an annual incentive fee to be paid to the Company upon achievement of certain metrics identified in the contract. Incentive fee revenue is recorded at the conclusion of the contract year at the amount due pursuant to the contractual arrangements.
Reimbursed Costs Incurred on Behalf of Managed Communities
The Company manages certain communities under contracts which provide periodic management fee payments to the Company plus reimbursements of certain operating expenses. Where the Company is the primary obligor with respect to any such operating expenses, the Company recognizes revenue when the goods have been delivered or the service has been rendered and the Company is due reimbursement. Such revenue is included in "reimbursed costs incurred on behalf of managed communities" on the consolidated statements of operations. The related costs are included in "costs incurred on behalf of managed communities" on the consolidated statements of operations.
Purchase Accounting
In determining the allocation of the purchase price of companies and communities to net tangible and identified intangible assets acquired and liabilities assumed, the Company makes estimates of fair value using information obtained as a result of pre-acquisition due diligence, marketing, leasing activities and/or independent appraisals. The Company assigns the purchase prices for companies or communities to assets acquired and liabilities assumed based on their determined fair values in accordance with the provisions of ASC 805,
Business Combinations
("ASC 805"). The determination of fair value involves the use of significant judgment and estimation.
Working capital assets acquired and working capital liabilities assumed are valued on a carryover/cost basis which approximates fair value.
Property, plant and equipment are valued utilizing either a discounted cash flow projection of future revenue and costs, and capitalization and discount rates, using current market conditions or a direct capitalization method. The Company allocates the fair values of buildings acquired on an as-if-vacant basis and depreciates the building values over the estimated remaining lives of the buildings, not to exceed 40 years. The Company determines the allocated values of other fixed assets, such as site improvements and furniture, fixtures and equipment, based upon the replacement cost and depreciates such values over the assets' estimated remaining useful lives as determined at the applicable acquisition date. The Company determines the value of land either by considering the sales prices of similar properties in recent transactions or based on internal analysis of recently acquired and existing comparable properties within its portfolio.
In connection with a business combination, the Company may assume rights and obligations under certain lease agreements pursuant to which the Company becomes the lessee of a given property. The Company assumes the lease classification previously determined by the prior lessee absent a modification in the assumed lease agreement. The Company assesses assumed operating leases, including ground leases, to determine whether the lease terms are favorable or unfavorable to the Company given current market conditions on the acquisition date. To the extent the lease terms are favorable or unfavorable relative to market conditions on the acquisition date, the Company recognizes an intangible asset or liability at fair value. The Company amortizes any acquired lease-related intangibles to facility lease expense over the remaining life of the associated lease plus any assumed bargain renewal periods.
The fair value of acquired lease-related intangibles associated with the relationship with the Company's residents, if any, reflects the estimated value of in-place leases as represented by the cost to obtain residents and an estimated absorption period to reflect the value of the rent and recovery costs foregone during a reasonable lease-up period as if the acquired space was vacant. The Company amortizes any acquired in-place lease intangibles to depreciation and amortization expense over the average remaining length of stay of the residents, which is evaluated on an acquisition by acquisition basis but is generally estimated at 12 months.
86
The Company estimates the fair value of purchase option intangible assets by discounting the difference between the applicable property's acquisition date fair value and the stated or anticipated future option price.
The Company estimates the fair value of trade names using a royalty rate methodology and amortizes that value over the estimated useful life of the trade name.
Management contracts and other acquired contracts are valued at a multiple of management fees and operating income or are valued utilizing discounted cash flow projections that assume estimated future revenues and costs over the remaining contract term. The assets are then amortized over the estimated term of the agreement.
The Company calculates the fair value of acquired long-term debt by discounting the remaining contractual cash flows of each instrument at the current market rate for those borrowings, which the Company approximates based on the rate at which the Company would expect to incur a replacement instrument on the date of acquisition, and recognizes any fair value adjustments related to long-term debt as effective yield adjustments over the remaining term of the instrument.
Capital lease assets are valued by the Company as a right-to-use asset. Financing lease assets are valued as if the Company owns the assets and thus are recorded at fair value. Capital and financing lease obligations are valued based on the present value of the estimated lease payments applying a discount rate equal to the Company's estimated incremental borrowing rate at the date of acquisition. Additionally, the valuation of financing lease obligations reflects a residual value component.
Pre-acquisition contingencies are valued when considered probable and reasonably estimable, and estimated legal fees are accrued for in accordance with the Company's existing policy. Self-insurance reserves including incurred but not reported liabilities are estimated by actuary analyses.
A deferred tax asset or liability is recognized at statutory rates for the difference between the book and tax bases of the acquired assets and liabilities.
The excess of the fair value of liabilities assumed and common stock issued and cash paid over the fair value of identifiable assets acquired is allocated to goodwill, which is not amortized by the Company.
Deferred Financing Costs
Third-party fees and costs incurred to obtain long-term debt are recorded as a direct adjustment to the carrying value of debt and amortized on a straight-line basis, which approximates the effective yield method, over the term of the related debt. Unamortized deferred financing fees are written-off if the associated debt is retired before the maturity date. Upon the refinancing of mortgage debt or amendment of the line of credit, unamortized deferred financing fees and additional financing costs incurred are accounted for in accordance with ASC 470-50,
Debt Modifications and Extinguishments
.
Stock-Based Compensation
The Company follows ASC 718,
Compensation – Stock Compensation
(“ASC 718”)
in accounting for its share-based payments. This guidance requires measurement of the cost of employee services received in exchange for stock compensation based on the grant-date fair value of the employee stock awards. This cost is recognized as compensation expense ratably over the employee’s requisite service period. Incremental compensation costs arising from subsequent modifications of awards after the grant date are recognized when incurred.
Certain of the Company’s employee stock awards vest only upon the achievement of performance targets. ASC 718 requires recognition of compensation cost only when achievement of performance conditions is considered probable. Consequently, the Company’s determination of the amount of stock compensation expense requires judgment in estimating the probability of achievement of these performance targets.
For all share-based awards with graded vesting other than awards with performance-based vesting conditions, the Company records compensation expense for the entire award on a straight-line basis (or, if applicable, on the accelerated method) over the requisite service period. For graded-vesting awards with performance-based vesting conditions, total compensation expense is recognized over the requisite service period for each separately vesting tranche of the award as if the award is, in substance, multiple awards once the performance target is deemed probable of achievement. Performance goals are evaluated quarterly. If such goals are not ultimately met or it is not probable the goals will be achieved, no compensation expense is recognized and any previously recognized compensation expense is reversed.
87
On January 1, 2017, the Company adopted Accounting Standards Update ("ASU") 2016-09,
Compensation – Stock Compensation: Improvements to Employee Share-Based Payment Accounting
("ASU 2016-09")
and changed its policy from estimating forfeitures to recording forfeitures when they occur. The Company’s adoption of ASU 2016-09 did not have a material impact on its consolidated financial statements.
Income Taxes
Income taxes are accounted for under the asset and liability approach which requires recognition of deferred tax assets and liabilities for the differences between the financial reporting and tax basis of assets and liabilities. A valuation allowance reduces deferred tax assets when it is more likely than not that some portion or all of the deferred tax assets will not be realized.
Fair Value of Financial Instruments
ASC 820,
Fair Value Measurements and Disclosures
establishes a three-level valuation hierarchy for disclosure of fair value measurements. The valuation hierarchy is based upon the transparency of inputs to the valuation of an asset or liability as of the measurement date. Categorization within the valuation hierarchy is based upon the lowest level of input that is significant to the fair value measurement. The three levels are defined as follows:
Level 1 – Inputs to the valuation methodology are quoted prices (unadjusted) for identical assets or liabilities in active markets.
Level 2 – Inputs to the valuation methodology include quoted prices for similar assets and liabilities in active markets, and inputs that are observable for the asset or liability, either directly or indirectly, for substantially the full term of the financial instrument.
Level 3 – Inputs to the valuation methodology are unobservable and significant to the fair value measurement.
Cash and cash equivalents, marketable securities, and cash and escrow deposits – restricted are reflected in the accompanying consolidated balance sheets at amounts considered by management to reasonably approximate fair value due to the short maturity.
Cash and Cash Equivalents
The Company defines cash and cash equivalents as cash and investments with maturities of 90 days or less when purchased.
Marketable Securities
Investments in commercial paper and corporate bond instruments with original maturities of greater than three months are classified as marketable securities.
Cash and Escrow Deposits – Restricted
Cash and escrow deposits – restricted consist principally of deposits required by certain lenders and lessors pursuant to the applicable agreement and consist of the following:
|
|
December 31,
|
||||||
|
(in thousands)
|
2017
|
2016
|
|||||
|
Current:
|
|
|
|
|
|||
|
Real estate tax and property insurance escrows
|
$
|
21,603
|
|
$
|
19,671
|
|
|
|
Replacement reserve escrows
|
10,960
|
|
6,970
|
|
|||
|
Resident deposits
|
678
|
|
764
|
|
|||
|
Other
|
3,948
|
|
5,459
|
|
|||
|
Subtotal
|
37,189
|
|
32,864
|
|
|||
|
Long term:
|
|
|
|
|
|||
|
Insurance deposits
|
12,364
|
|
12,941
|
|
|||
|
CCRC escrows
|
8,526
|
|
13,301
|
|
|||
|
Debt service reserve
|
1,820
|
|
1,819
|
|
|||
|
Subtotal
|
22,710
|
|
28,061
|
|
|||
|
Total
|
$
|
59,899
|
|
$
|
60,925
|
|
|
88
Accounts Receivable, net
Accounts receivable are reported net of an allowance for doubtful accounts, to represent the Company's estimate of the amount that ultimately will be realized in cash. The allowance for doubtful accounts was
$23.1 million
and
$27.0 million
as of
December 31, 2017
and
2016
, respectively. The adequacy of the Company's allowance for doubtful accounts is reviewed on an ongoing basis, using historical payment trends, write-off experience, analyses of receivable portfolios by payor source and aging of receivables, as well as a review of specific accounts, and adjustments are made to the allowance as necessary.
Billings for services under third-party payor programs are recorded net of estimated retroactive adjustments, if any, under reimbursement programs. Retroactive adjustments are accrued on an estimated basis in the period the related services are rendered and adjusted in future periods or as final settlements are determined. Contractual or cost related adjustments from Medicare or Medicaid are accrued when assessed (without regard to when the assessment is paid or withheld). Subsequent adjustments to these accrued amounts are recorded in net revenues when known.
Assets Held for Sale
The Company designates communities as held for sale when it is probable that the properties will be sold within one year. The Company records these assets on the consolidated balance sheet at the lesser of the carrying value and fair value less estimated selling costs. If the carrying value is greater than the fair value less the estimated selling costs, the Company records an impairment charge. The Company allocates a portion of the goodwill of a reporting unit to the disposal if the disposal constitutes a business. The Company determines the fair value of the communities based primarily on purchase and sale agreements from prospective purchasers (Level 2 input). The Company evaluates the fair value of the assets held for sale each period to determine if it has changed. The long-lived assets are not depreciated while classified as held for sale.
Property, Plant and Equipment and Leasehold Intangibles
Property, plant and equipment and leasehold intangibles, which include amounts recorded under capital and financing leases, are recorded at cost. Depreciation and amortization is computed using the straight-line method over the estimated useful lives of the assets, which are as follows:
|
Asset Category
|
|
Estimated
Useful Life
(in years)
|
|
Buildings and improvements
|
|
40
|
|
Furniture and equipment
|
|
3 – 7
|
|
Resident lease intangibles
|
|
1 – 3
|
Expenditures for ordinary maintenance and repairs are expensed to operations as incurred. Renovations and improvements, which improve and/or extend the useful life of the asset, are capitalized and depreciated over their estimated useful life or if the renovations or improvements are made with respect to communities subject to an operating lease, over the shorter of the estimated useful life of the renovations or improvements, or the term of the operating lease. Assets under capital and financing leases and leasehold improvements are depreciated over the shorter of the estimated useful life of the assets or the term of the lease. Facility operating expense excludes depreciation and amortization directly attributable to the operation of the facility.
Long-lived assets are reviewed for impairment whenever events or changes in circumstances indicate that the carrying amount of an asset may not be recoverable. Recoverability of long-lived assets held for use are assessed by a comparison of the carrying amount of the asset to the estimated future undiscounted net cash flows expected to be generated by the asset, calculated utilizing the lowest level of identifiable cash flows. If estimated future undiscounted net cash flows are less than the carrying amount of the asset then the fair value of the asset is estimated. The impairment expense is determined by comparing the estimated fair value of the asset to its carrying value, with any amount in excess of fair value recognized as an expense in the current period. Undiscounted cash flow projections and estimates of fair value amounts are based on a number of assumptions such as revenue and expense growth rates, estimated holding periods and estimated capitalization rates (Level 3).
Investment in Unconsolidated Ventures
In accordance with ASC 810,
Consolidation,
the general partner or managing member of a venture consolidates the venture unless the limited partners or other members have either (1) the substantive ability to dissolve the venture or otherwise remove the general
89
partner or managing member without cause or (2) substantive participating rights in significant decisions of the venture, including authorizing operating and capital decisions of the venture, including budgets, in the ordinary course of business. The Company has reviewed all ventures where it is the general partner or managing member and has determined that in all cases the limited partners or other members have substantive participating rights such as those set forth above and, therefore, none of these ventures are consolidated.
The initial carrying value of investments in unconsolidated ventures is based on the amount paid to purchase the investment interest or the carrying value of assets contributed to the unconsolidated ventures. The Company's reported share of earnings of an unconsolidated venture is adjusted for the impact, if any, of basis differences between its carrying value of the equity investment and its share of the venture's underlying assets.
Distributions received from an investee are recognized as a reduction in the carrying amount of the investment. If distributions are received from an investee that would reduce the carrying amount of an equity method investment below zero, the Company evaluates the facts and circumstances of the dividends to determine the appropriate accounting for the excess distribution, including an evaluation of the source of the proceeds and implicit or explicit commitments to fund the investee. The excess distribution is either recorded as a gain on investment, or in instances where the source of proceeds is from financing activities or the Company has a significant commitment to fund the investee, the excess distribution would result in an equity method liability and the Company would continue to record its share of the investee's earnings and losses. When the Company does not have a significant requirement to contribute additional capital over and above the original capital commitment and the carrying value of the investment in unconsolidated venture is reduced to zero, the Company discontinues applying the equity method of accounting unless the venture has an expectation of an imminent return to profitability. If the venture subsequently reports net income, the equity method of accounting is resumed only after the Company's share of that net income equals the share of net losses not recognized during the period the equity method was suspended.
The Company evaluates realization of its investment in ventures accounted for using the equity method if circumstances indicate that the Company's investment is other than temporarily impaired. A current fair value of an investment that is less than its carrying amount may indicate a loss in value of the investment. If the Company determines that an equity method investment is other than temporarily impaired, it is recorded at its fair value with an impairment charge recognized in asset impairment expense for the difference between its carrying amount and fair value.
Goodwill and Intangible Assets
The Company follows ASC 350,
Goodwill and Other Intangible Assets
, and tests goodwill for impairment annually during the fourth quarter or whenever indicators of impairment arise. Factors the Company considers important in its analysis of whether an indicator of impairment exists include a significant decline in the Company's stock price or market capitalization for a sustained period since the last testing date, significant underperformance relative to historical or projected future operating results and significant negative industry or economic trends. The Company first assesses qualitative factors to determine whether it is necessary to perform a quantitative goodwill impairment test. The quantitative goodwill impairment test is based upon a comparison of the estimated fair value of the reporting unit to which the goodwill has been assigned with the reporting unit's carrying value. The Company is not required to calculate the fair value of a reporting unit unless the Company determines, based on a qualitative assessment, that it is more likely than not that its fair value of a reporting unit is less than its carrying amount. The fair values used in the quantitative goodwill impairment test are estimated based upon discounted future cash flow projections for the reporting unit. These cash flow projections are based upon a number of estimates and assumptions such as revenue and expense growth rates, capitalization rates and discount rates. If the quantitative goodwill impairment test results in a reporting unit's carrying amount exceeding its estimated fair value, an impairment charge will be recorded based on the difference in accordance with ASU 2017-04,
Intangibles - Goodwill and Other
, with the impairment charge limited to the amount of goodwill allocated to the reporting unit.
Acquired intangible assets are initially valued at fair market value using generally accepted valuation methods appropriate for the type of intangible asset. Intangible assets with definite lives are amortized over their estimated useful lives and all intangible assets are reviewed for impairment if indicators of impairment arise. The evaluation of impairment for definite-lived intangibles is based upon a comparison of the carrying amount of the asset to the estimated future undiscounted net cash flows expected to be generated by the asset. If estimated future undiscounted net cash flows are less than the carrying amount of the asset, then the fair value of the asset is estimated. The impairment expense is determined by comparing the estimated fair value of the intangible asset to its carrying value, with any shortfall from fair value recognized as an expense in the current period.
Indefinite-lived intangible assets are not amortized but are tested for impairment annually during the fourth quarter or more frequently as required. The impairment test consists of a comparison of the estimated fair value of the indefinite-lived intangible asset with its carrying value. If the carrying amount exceeds its fair value, an impairment loss is recognized for that difference.
90
Amortization of the Company's definite-lived intangible assets is computed using the straight-line method over the estimated useful lives of the assets, which are as follows:
|
Asset Category
|
|
Estimated
Useful Life
(in years)
|
|
Trade names
|
|
2 – 5
|
|
Other
|
|
3 – 9
|
Convertible Debt Instruments
Convertible debt instruments are accounted for under ASC 470-20,
Debt – Debt
with Conversion and Other Options
. This guidance requires the issuer of certain convertible debt instruments that may be settled in cash (or other assets) on conversion, including partial cash settlement, to separately account for the liability (debt) and equity (conversion option) components of the instruments in a manner that reflects the issuer's estimated non-convertible debt borrowing rate.
Self-Insurance Liability Accruals
The Company is subject to various legal proceedings and claims that arise in the ordinary course of its business. Although the Company maintains general liability and professional liability insurance policies for its owned, leased and managed communities under a master insurance program, the Company's current policies provide for deductibles for each and every claim. As a result, the Company is, in effect, self-insured for claims that are less than the deductible amounts. In addition, the Company maintains a high deductible workers compensation program and a self-insured employee medical program.
The Company reviews the adequacy of its accruals related to these liabilities on an ongoing basis, using historical claims, actuarial valuations, third-party administrator estimates, consultants, advice from legal counsel and industry data, and adjusts accruals periodically. Estimated costs related to these self-insurance programs are accrued based on known claims and projected claims incurred but not yet reported. Subsequent changes in actual experience are monitored, and estimates are updated as information becomes available.
During the years ended
December 31, 2017
and
2016
, the Company reduced its estimate for the amount of expected losses for general liability and professional liability and workers compensation claims, based on recent historical claims experience. The reduction in these accrued reserves decreased facility operating expense by
$9.9 million
and
$35.4 million
for the years ended
December 31, 2017
and
2016
, respectively.
Lease Accounting
The Company, as lessee, makes a determination with respect to each of its community leases as to whether each should be accounted for as an operating lease or capital lease. The classification criteria is based on estimates regarding the fair value of the leased community, minimum lease payments, effective cost of funds, the economic life of the community and certain other terms in the lease agreements. In a business combination, the Company assumes the lease classification previously determined by the prior lessee absent a modification, as determined by ASC 840,
Leases
("ASC 840"), in the assumed lease agreement. Payments made under operating leases are accounted for in the Company's consolidated statements of operations as lease expense for actual rent paid plus or minus a straight-line adjustment for estimated minimum lease escalators and amortization of deferred gains in situations where sale-leaseback transactions have occurred.
For capital and financing lease obligation arrangements, a liability is established on the Company's consolidated balance sheet representing the present value of the future minimum lease payments and a residual value for financing leases and a corresponding long-term asset is recorded in property, plant and equipment and leasehold intangibles in the consolidated balance sheet. For capital lease assets, the asset is depreciated over the remaining lease term unless there is a bargain purchase option in which case the asset is depreciated over the useful life. For financing lease assets, the asset is depreciated over the useful life of the asset. Leasehold improvements purchased during the term of the lease are amortized over the shorter of their economic life or the lease term.
All of the Company's leases contain fixed or formula-based rent escalators. To the extent that the escalator increases are tied to a fixed index or rate, lease payments are accounted for on a straight-line basis over the life of the lease. In addition, all rent-free or rent holiday periods are recognized in lease expense on a straight-line basis over the lease term, including the rent holiday period.
91
Sale-leaseback accounting is applied to transactions in which an owned community is sold and leased back from the buyer if certain continuing involvement criteria are met. Under sale-leaseback accounting, the Company removes the community and related liabilities from the consolidated balance sheet. Gain on the sale is deferred and recognized as a reduction of facility lease expense for operating leases and a reduction of interest expense for capital leases. In cases of sale‑leaseback transactions in which the Company has continuing involvement, other than normal leasing activities, the Company does not record the sale until such involvement terminates.
For leases in which the Company is involved with the construction of a building, the Company accounts for the leases during the construction period under the provisions of ASC 840. If the Company concludes that it has substantively all of the risks of ownership during construction of a leased property and therefore is deemed the owner of the project for accounting purposes, it records an asset and related financing obligation for the amount of total project costs related to construction in progress. Once construction is complete, the Company considers the requirements under ASC Subtopic 840-40. If the arrangement qualifies for sale-leaseback accounting, the Company removes the assets and related liabilities from the consolidated balance sheet. If the arrangement does not qualify for sale-leaseback accounting, the Company continues to amortize the financing obligation and depreciate the assets over the lease term.
Treasury Stock
The Company accounts for treasury stock under the cost method and includes treasury stock as a component of stockholders' equity.
New Accounting Pronouncements
In January 2017, the FASB issued ASU 2017-04,
Intangibles – Goodwill and Other: Simplifying the Test for Goodwill Impairment
("ASU 2017-04"). ASU 2017-04 removes Step 2 from the goodwill impairment test. Under ASU 2017-04, if a reporting unit's carrying amount exceeds its fair value, an impairment charge will be recorded based on the difference, with the impairment charge limited to the amount of goodwill allocated to the reporting unit. The Company adopted ASU 2017-04 on a prospective basis on January 1, 2017. The Company applied the adoption of ASU 2017-04 to its goodwill analysis performed during the year ended December 31, 2017.
In January 2017, the FASB issued ASU 2017-01,
Business Combinations: Clarifying the Definition of a Business
("ASU 2017-01"). ASU 2017-01 clarifies the definition of a business to assist companies in determining whether transactions should be accounted for as an asset acquisition or a business combination. Under ASU 2017-01, if substantially all of the fair value of the assets acquired is concentrated in a single identifiable asset or a group of similar identifiable assets, the set is not a business and the transaction is accounted for as an asset acquisition. Transaction costs associated with asset acquisitions are capitalized while those associated with business combinations are expensed as incurred. The amendments are effective on a prospective basis for the Company's fiscal year beginning January 1, 2018. Upon adoption, the changes to the definition of a business may result in future acquisitions of real estate, communities or senior housing operating companies being accounted for as asset acquisitions with acquisition costs capitalized or a component of carrying value.
In November 2016, the FASB issued ASU 2016-18,
Statement of Cash Flows: Restricted Cash, a consensus of the FASB Emerging Issues Task Force
("ASU 2016-18"). ASU 2016-18 intends to address the diversity in practice that exists in the classification and presentation of changes in restricted cash on the statement of cash flows. The amendments require that a statement of cash flows explain the change during the period in the total of cash, cash equivalents, and amounts generally described as restricted cash or restricted cash equivalents. The changes required by ASU 2016-18 must be applied retrospectively to all periods presented. ASU 2016-18 is effective for the Company on January 1, 2018. The Company has determined that the inclusion of the change in cash and escrow deposits restricted within the retrospective presentation of the statements of cash flows will result in a
$1.0 million
increase to the amount of net cash used in investing activities for the year ended December 31, 2017 and a
$5.0 million
decrease to the amount of net cash provided by investing activities for the year ended December 31, 2016.
In August 2016, the FASB issued ASU 2016-15,
Statement of Cash Flows – Classification of Certain Cash Receipts and Cash Payments
("ASU 2016-15"). ASU 2016-15 clarifies how cash receipts and cash payments in certain transactions are presented in the statement of cash flows. Among other clarifications on the classification of certain transactions within the statement of cash flows, the amendments in ASU 2016-15 provide that debt prepayment and extinguishment costs will be classified within financing activities within the statement of cash flows. ASU 2016-15 is effective for the Company on January 1, 2018. Upon adoption, the changes in classification within the statement of cash flows must be applied retrospectively to all periods presented. The Company has identified
$11.7 million
and
$7.9 million
of cash paid for debt modification and extinguishment costs for the years ended December 31, 2017 and 2016, respectively. The Company has determined that the retrospective application will result in an
$11.7 million
increase to the amount of net cash provided by operating activities and an
$11.7 million
decrease to the amount of net cash
92
provided by financing activities for the year ended December 31, 2017 and a
$7.9 million
increase to the amount of net cash provided by operating activities and a
$7.9 million
increase to the amount of net cash used in financing activities for the year ended December 31, 2016.
In June 2016, the FASB issued ASU 2016-13,
Financial Instruments – Credit Losses: Measurement of Credit Losses on Financial Instruments
("ASU 2016-13"). ASU 2016-13 replaces the current incurred loss impairment methodology for credit losses with a methodology that reflects expected credit losses and requires consideration of a broader range of reasonable and supportable information to inform credit loss estimates. ASU 2016-13 is effective for fiscal years, and interim periods within those fiscal years, beginning after December 15, 2019, with early adoption permitted for fiscal years beginning after December 15, 2018. The Company is currently evaluating the impact the adoption of ASU 2016-13 will have on its consolidated financial statements and disclosures.
In March 2016, the FASB issued ASU 2016-09, which is intended to simplify the accounting for share-based payment transactions, including the accounting for income taxes and forfeitures, as well as the classification of awards and classification on the statement of cash flows. The Company adopted ASU 2016-09 on January 1, 2017 and changed its accounting policy from estimating forfeitures to recording forfeitures when they occur. The Company’s adoption of ASU 2016-09 did not have a material impact on its consolidated financial statements. There was no income tax impact on the Company’s consolidated statement of operations for the year ended December 31, 2017 from the adoption of ASU 2016-09 as the Company is in a net operating loss position and any excess tax benefits require a full valuation allowance. See Note 16 for more information about the Company's deferred income taxes. The changes have been applied using the modified retrospective approach in accordance with ASU 2016-09 and prior periods have not been restated.
In February 2016, the FASB issued ASU 2016-02,
Leases
("ASU 2016-02"). ASU 2016-02 amends the existing accounting principles for the recognition, measurement, presentation and disclosure of leases for both lessees and lessors. ASU 2016-02 requires a lessee to recognize a right-of-use asset and a lease liability on the balance sheet for most leases. Additionally, ASU 2016-02 makes targeted changes to lessor accounting. ASU 2016-02 is effective for fiscal years, and interim periods within those fiscal years, beginning after December 15, 2018, and early adoption is permitted. For the year ended December 31, 2017, the Company made cash lease payments of
$365.1 million
for long-term community leases accounted for as operating leases under ASC 840. The Company anticipates that the adoption of ASU 2016-02 will result in the recognition of material lease liabilities and right-of use assets on the consolidated balance sheet for these community operating leases. The Company continues to evaluate the impact that the adoption of ASU 2016-02 will have on its consolidated financial statements and disclosures.
In May 2014, the FASB issued ASU 2014-09,
Revenue from Contracts with Customers
("ASU 2014-09"). ASU 2014-09 affects any entity that either enters into contracts with customers to transfer goods or services or enters into contracts for the transfer of nonfinancial assets. The five step model defined by ASU 2014-09 requires the Company to (i) identify the contracts with the customer, (ii) identify the performance obligations in the contract, (iii) determine the transaction price, (iv) allocate the transaction price to the performance obligations in the contract and (v) recognize revenue when each performance obligation is satisfied. Revenue is recognized when promised goods or services are transferred to the customer in an amount that reflects the consideration expected in exchange for those goods or services. Additionally, ASU 2014-09 requires enhanced disclosure of revenue arrangements. ASU 2014-09 may be applied retrospectively to each prior period (full retrospective) or retrospectively with the cumulative effect recognized as of the date of initial application (modified retrospective). ASU 2014-09, as amended, is effective for the Company's fiscal year beginning January 1, 2018, and the Company will adopt the new standard under the modified retrospective approach. Under the modified retrospective approach, the guidance is applied to the most current period presented, recognizing the cumulative effect of the adoption change as an adjustment to beginning retained earnings. The Company has determined that the adoption of ASU 2014-09 will not result in an adjustment to beginning retained earnings for the Company and will not result in a significant change to the amount and timing of the recognition of resident fee revenue. The Company has determined that there will not be any significant change to the annual amount of revenue recognized for management fees under the Company’s management agreements, however, the Company will recognize an estimated amount of incentive fee revenue earlier during the annual contract period. The Company has determined that there will be a change to the amounts presented for revenue recognized for reimbursed costs incurred on behalf of managed communities and reimbursed costs incurred on behalf of managed communities with no net impact to the amount of income from operations.
Additionally, real estate sales are within the scope of ASU 2014-09, as amended by ASU 2017-05,
Other Income – Gains and Losses from the Derecognition of Nonfinancial Assets
("ASU 2017-05"). ASU 2017-05 clarifies the scope of subtopic 610-20,
Other Income - Gains and Losses from Derecognition of Nonfinancial Assets,
and adds guidance for partial sales of nonfinancial assets. Under ASU 2014-09 and ASU 2017-05, the income recognition for real estate sales is largely based on the transfer of control versus continuing involvement under the current guidance. As a result, more transactions may qualify as sales of real estate and gains or losses may be recognized sooner. Upon adoption, the Company will apply the five step revenue model to all future sales of real estate.
93
Reclassifications
Certain prior period amounts have been reclassified to conform to the current financial statement presentation, with no effect on the Company's consolidated financial position or results of operations.
3. Earnings Per Share
Basic earnings per share ("EPS") is calculated by dividing net income by the weighted average number of shares of common stock outstanding. Diluted EPS includes the components of basic EPS and also gives effect to dilutive common stock equivalents. For purposes of calculating basic and diluted earnings per share, vested restricted stock awards are considered outstanding. Under the treasury stock method, diluted EPS reflects the potential dilution that could occur if securities or other instruments that are convertible into common stock were exercised or could result in the issuance of common stock. Potentially dilutive common stock equivalents include unvested restricted stock, restricted stock units and convertible debt instruments and warrants.
During the years ended
December 31, 2017
,
2016
and
2015
, the Company reported a consolidated net loss. As a result of the net loss, unvested restricted stock, restricted stock units and convertible debt instruments and warrants were antidilutive for each year and were not included in the computation of diluted weighted average shares. The weighted average restricted stock and restricted stock units excluded from the calculations of diluted net loss per share were
5.2 million
,
4.3 million
and
3.7 million
for the years ended
December 31, 2017
,
2016
and
2015
, respectively.
The calculation of diluted weighted average shares excludes the impact of conversion of the outstanding principal amount of
$316.3 million
of the Company's
2.75%
convertible senior notes due
June 15, 2018
. As of
December 31, 2017
,
2016
and
2015
, the maximum number of shares issuable upon conversion of the notes is approximately
13.8 million
(after giving effect to additional make-whole shares issuable upon conversion in connection with the occurrence of certain events); however it is the Company's current intent and policy to settle the principal amount of the notes in cash upon conversion. The maximum number of shares issuable upon conversion of the notes in excess of the amount of principal that would be settled in cash is approximately
3.0 million
. In addition, the calculation of diluted weighted average shares excludes the impact of the exercise of warrants to acquire the Company's common stock. As of
December 31, 2017
,
2016
and
2015
, the number of shares issuable upon exercise of the warrants was approximately
10.8 million
. See Note 9 for more information about the
2.75%
convertible notes and warrants.
4. Acquisitions, Dispositions and Other Significant Transactions
The Company completed dispositions, through sales and lease terminations, of
165
communities during the period from January 1, 2016 through
December 31, 2017
. The Company's consolidated financial statements include resident fee revenue of
$172.6 million
,
$543.3 million
, and
$572.1 million
, facility operating expenses of
$135.0 million
,
$413.1 million
, and
$434.9 million
, and cash lease payments of
$39.3 million
,
$131.4 million
and
$129.5 million
for the
165
communities for the years ended
December 31, 2017
,
2016
, and
2015
respectively.
The foregoing transactions, and the Company's assets held for sale as of
December 31, 2017
are described below. The closings of the various pending transactions and expected sales of assets are subject to the satisfaction of various closing conditions, including (where applicable) the receipt of regulatory approvals. However, there can be no assurance that the transactions will close or, if they do, when the actual closings will occur.
2017 HCP Agreements
On November 2, 2017, the Company announced that it had entered into a definitive agreement for a multi-part transaction with HCP. As part of such transaction, the Company entered into an Amended and Restated Master Lease and Security Agreement (“Master Lease”) with HCP effective as of November 1, 2017. The components of the multi-part transaction include:
|
•
|
Master Lease.
The Company and HCP amended and restated triple-net leases covering substantially all of the communities the Company leased from HCP as of November 1, 2017 into the Master Lease. The Company will acquire
two
communities for an aggregate purchase price of
$35.4 million
, upon which time the
two
communities will be removed from the Master Lease. In addition,
33
communities will be removed from the Master Lease on or before November 1, 2018. However, if HCP has not transitioned operations and/or management of such communities to a third party prior to such date, the Company will continue to operate the foregoing
33
communities on an interim basis and such communities will, from and after such time, be reported in the Management Services segment. In addition to such
35
communities, the Company continues to lease
43
communities pursuant to the terms of the Master Lease, which have the same lease rates and expiration and renewal terms as the applicable prior instruments, except that effective January 1, 2018, the Company
|
94
received a
$2.5 million
annual rent reduction for
two
communities. The Master Lease also provides that the Company may engage in certain change in control and other transactions without the need to obtain HCP's consent, subject to the satisfaction of certain conditions.
|
•
|
RIDEA Ventures Restructuring.
Pursuant to the multi-part agreement, HCP agreed to acquire the Company's
10%
ownership interest in
two
of the Company's existing unconsolidated ventures with HCP for
$94.7 million
. The Company provided management services to
59
communities on behalf of the
two
unconsolidated ventures as of November 1, 2017. The Company will acquire
four
of such communities for an aggregate purchase price of
$239.5 million
and will retain management of
18
of such communities. The amended and restated management agreements for such
18
communities have a term set to expire in
2030
, subject to certain early termination rights. In addition, HCP will be entitled to sell or transition operations and/or management of
37
of such communities.
|
The Company expects to fund its acquisition of the
six
communities with the proceeds from the sale of its unconsolidated venture interests, cash on hand, non-recourse mortgage financing on the acquired communities and refinancing of certain other communities.
During December 2017, HCP completed its acquisition of the Company’s ownership interest in
one
of the unconsolidated ventures for
$32.1 million
and the Company recognized a
$7.2 million
gain on sale. The disposition of the ownership interest in the second unconsolidated venture in 2018 is anticipated to also result in the Company recording a gain in fiscal 2018 for accounting purposes. In January 2018, the Company completed its acquisition of one community from HCP. The Company expects the disposition of its ownership interest in the second unconsolidated venture and its acquisition of the remaining five communities at their estimated fair value to occur during the next three months, and expects the terminations of its triple-net leases and management agreements on
70
communities to occur in stages throughout 2018.
The Company obtained future annual cash rent reductions and waived management termination fees in the multi-part transaction. As a result, the Company reduced its lease liabilities by
$9.7 million
for the future annual cash rent reductions and recognized a
$9.7 million
deferred revenue liability for the consideration received from HCP in advance of the termination of the management agreements for the
37
communities.
As a result of the modification of the remaining lease term for communities subject to capital leases, the Company reduced the carrying value of capital lease obligations and assets under capital leases by
$145.6 million
in 2017. The transactions related to the terminations of the leases for
33
communities in 2018 for accounting purposes are anticipated to result in the Company recording a gain in fiscal 2018 for the amount by which the carrying value of the operating and capital and financing lease obligations for the
33
communities exceed the carrying value of the Company's assets and liabilities under operating and capital and financing leases at the lease termination date. As of December 31, 2017, the
$395.0 million
carrying value of the lease obligations for the
33
communities exceed the
$347.0 million
carrying value of the assets under operating and capital and financing leases by approximately
$48.0 million
, primarily for
20
communities which were previously subject to sale-leaseback transactions in which the Company was deemed to have continuing involvement for accounting purposes.
The results of operations for the
33
communities to be disposed through lease terminations are reported within the following segments within the consolidated financial statements: Retirement Centers (
five
communities), Assisted Living (
27
communities), and CCRCs-Rental (
one
community). With respect to such
33
communities and the
37
managed communities for which the Company's management will be terminated, the Company's consolidated financial statements include resident fee revenue of
$143.9 million
and
$151.7 million
, management fees of
$10.1 million
and
$11.8 million
, facility operating expenses of
$94.5 million
and
$92.6 million
, and cash lease payments of
$48.3 million
and
$44.8 million
for the years ended
December 31, 2017
and
2016
, respectively.
2016 HCP Agreements
On November 1, 2016, the Company announced that it had entered into agreements to, among other things, terminate triple-net leases with respect to
97
communities that it leased from HCP,
four
of which were contributed to an existing unconsolidated venture in which the Company holds an equity interest and
64
of which were acquired by the Blackstone Venture described below. In addition to the formation of the Blackstone Venture, the transactions included the following components with respect to
33
communities:
|
•
|
The Company and HCP agreed to terminate triple-net leases with respect to
eight
communities. HCP agreed to contribute immediately thereafter
four
of such communities to an existing unconsolidated venture with HCP in which the Company has a
10%
equity interest. During the three months ended December 31, 2016, the triple-net leases with respect to
seven
communities were terminated and HCP contributed
four
of the communities to the existing unconsolidated venture. The triple-net lease with respect to the remaining community was terminated during January 2017. The results of operations
|
95
of the
eight
communities are reported in the following segments within the consolidated financial statements through the respective disposition dates: Assisted Living (
six
communities), Retirement Centers (
one
community) and CCRCs-Rental (
one
community).
|
•
|
The Company and HCP agreed to terminate triple-net leases with respect to
25
communities. During the year ended
December 31, 2017
, the Company's triple-net lease obligations with respect to
25
communities were terminated. Following such terminations the Company continues to operate certain of these communities on an interim basis, and such communities are reported in the Management Services segment from and after termination of such triple-net lease obligations. The results and financial position of the
25
communities for which leases were terminated were deconsolidated from the Company prospectively upon termination of the triple-net lease obligations. The Company derecognized the
$145.3 million
carrying value of the assets under financing leases and the
$156.7 million
carrying value of financing lease obligations for
21
communities which were previously subject to sale-leaseback transactions in which the Company was deemed to have continuing involvement. For accounting purposes, the Company recognized a sale for these
21
communities and recorded an
$11.4 million
gain within gain on sale of assets for the year ended December 31, 2017.
|
Formation of Venture with Blackstone during 2017
On March 29, 2017, the Company and affiliates of Blackstone Real Estate Advisors VIII L.P. (collectively, "Blackstone") formed a venture (the “Blackstone Venture”) that acquired
64
senior housing communities for a purchase price of
$1.1 billion
. The Company had previously leased the
64
communities from HCP under long-term lease agreements with a remaining average lease term of approximately
12
years. At the closing, the Blackstone Venture purchased the
64
-community portfolio from HCP subject to the existing leases, and the Company contributed its leasehold interests for
62
communities and a total of
$179.2 million
in cash to purchase a
15%
equity interest in the Blackstone Venture, terminate leases, and fund its share of closing costs. As of the formation date, the Company continued to operate
two
of the communities under lease agreements and began managing
60
of the communities on behalf of the venture under a management agreement with the venture. The
two
remaining leases will be terminated, pending certain regulatory and other conditions, at which point the Company will manage the communities.
Two
of the communities are managed by a third party for the venture.
The results and financial position of the
62
communities for which leases were terminated were deconsolidated from the Company prospectively upon formation of the Blackstone Venture. The results of operations of such
62
communities were reported in the following segments within the consolidated financial statements through the formation date: Assisted Living (
47
communities), Retirement Centers (
eight
communities) and CCRCs-Rental (
seven
communities). The Company's interest in the venture is accounted for under the equity method of accounting. Under the terms of the venture agreement, the Company may be entitled to distributions which are less than or in excess of the Company's
15%
equity interest based upon specified performance criteria.
Initially, the Company determined that the contributed carrying value of the Company's investment in the Blackstone Venture was
$66.8 million
, representing the amount by which the
$179.2 million
cash contribution exceeded the carrying value of the Company's liabilities under operating, capital and financing leases contributed by the Company net of the carrying value of the assets under such operating, capital and financing leases. However, the Company estimated the fair value of its
15%
equity interest in the Blackstone Venture at inception to be
$47.1 million
. As a result, the Company recorded a
$19.7 million
charge within asset impairment expense for the three months ended March 31, 2017 for the amount of the contributed carrying value in excess of the estimated fair value of the Company's investment.
Additionally, these transactions related to the Blackstone Venture required the Company to record a significant increase to the Company's existing tax valuation allowance, after considering the change in the Company's future reversal of estimated timing differences resulting from these transactions, primarily due to removing the deferred positions related to the contributed leases. During the three months ended March, 31, 2017, the Company recorded a provision for income taxes to establish an additional
$85.0 million
of valuation allowance against its federal and state net operating loss carryforwards and tax credits as the Company anticipates these carryforwards and credits will not be utilized prior to expiration. See Note 16 for more information about the Company's deferred income taxes.
Dispositions of Owned Communities and Other Lease Terminations during 2017
During the year ended
December 31, 2017
, the Company completed the sale of
three
communities for net cash proceeds of
$8.2 million
and the Company terminated leases for
17
communities otherwise than in connection with the transactions with Blackstone and HCP described above. The Company recognized
$14.3 million
of net loss on facility lease termination for the year ended
December 31, 2017
, primarily from the write-off of assets subject to terminated lease agreements. The results of operations of the
17
communities are reported in the following segments within the consolidated financial statements through the respective termination dates: Retirement Centers (
two
communities), Assisted Living (
14
communities), and CCRCs-Rental (
one
community).
96
Assets Held for Sale as of December 31, 2017
As of
December 31, 2017
,
$106.4 million
was recorded as assets held for sale and
$30.1 million
of mortgage debt was included in the current portion of long-term debt within the consolidated balance sheet with respect to the
15
communities held for sale as of such date. This debt will either be repaid with the proceeds from the sales or be assumed by the prospective purchasers. The results of operations of the
15
communities are reported in the following segments within the consolidated financial statements: Assisted Living (
12
communities) and CCRCs-Rental (
three
communities). The
15
communities had resident fee revenue of
$49.5 million
and
$51.5 million
and facility operating expenses of
$43.8 million
and
$44.6 million
for the years ended
December 31, 2017
and
2016
, respectively.
Dispositions of Owned Communities during 2016
During the three months ended March 31, 2016, the Company sold
seven
of the
17
communities held for sale as of December 31, 2015 for an aggregate sales price of
$46.7 million
. The results of operations of these communities are reported in the Assisted Living and CCRCs-Rental segments within the consolidated financial statements through the respective disposition dates. The remaining
10
communities were classified as held for sale as of December 31, 2016.
During the three months ended June 30, 2016, the Company entered into an agreement with a third party to sell a
12
-state portfolio of
44
owned communities for an aggregate sales price of
$252.5 million
. During the three months ended September 30, 2016, the Company sold
32
of these communities for an aggregate sales price of
$177.5 million
. During the three months ended December 31, 2016, the Company sold
nine
of these communities for an aggregate sales price of
$47.7 million
. The results of operations of these
41
communities are reported within the Assisted Living segment within the consolidated financial statements through the respective disposition dates. During the three months ended December 31, 2016, the agreement was amended to remove
one
community from the portfolio, and the aggregate sales price of the portfolio was decreased by
$4.7 million
. The remaining
two
communities within the portfolio were classified as held for sale as of December 31, 2016.
During 2016, the Company identified
seven
additional owned communities as held for sale. During the three months ended December 31, 2016, the Company sold
three
of these communities for an aggregate sales price of
$33.0 million
. The results of operations of these
three
communities are reported in the Assisted Living, CCRCs-Rental and Retirement Center segments through the respective disposition dates. The remaining
four
communities were classified as held for sale as of December 31, 2016. During the year ended December 31, 2016, the Company recognized
$15.8 million
of impairment expense related to communities identified as assets held for sale, primarily due to the excess of carrying value, including
$28.6 million
of allocated goodwill, over the estimated selling price less costs to dispose.
Community Acquisitions during 2015
On December 29, 2014, the Company agreed to purchase the fee simple interest of
nine
communities previously leased to the Company for an aggregate purchase price of
$60.0 million
. On December 31, 2014, the Company paid the full purchase price of
$51.4 million
of cash as a deposit for the purchase of
eight
of the
nine
communities, and the Company took title to these
eight
communities at the closing on January 1, 2015. On May 1, 2015, the Company acquired the ninth community and paid the remainder of the purchase price of
$8.6 million
of cash. The results of operations of these communities are reported in the Assisted Living and CCRCs-Rental segments within the consolidated financial statements.
In February 2015, the Company acquired the underlying real estate associated with
15
communities that were previously leased for an aggregate purchase price of
$268.6 million
. The results of operations of these communities are reported in the Retirement Centers, Assisted Living, and CCRCs-Rental segments within the consolidated financial statements for the year ended December 31, 2015. The Company financed the transaction with cash on hand, amounts drawn on the secured credit facility and
$20.0 million
of seller financing. The
$20.0 million
note has a
five
year term and bears interest at a fixed rate of
8.0%
. The fair value of the communities acquired was determined to approximate
$187.2 million
. The fair values of the property, plant and equipment of the acquired communities were determined utilizing a direct capitalization method considering stabilized facility operating income and market capitalization rates. These fair value measurements were based on current market conditions as of the acquisition date and are considered Level 3 measurements within the fair value hierarchy. The range of capitalization rates utilized was
6.25%
to
8.75%
, depending upon the property type, geographical location, and the quality of the respective community. The Company recorded the difference between the amount paid and the estimated fair value of the communities acquired (
$76.1 million
) as a loss on facility lease termination on the consolidated statement of operations for the year ended December 31, 2015, which includes the reversal of
$5.3 million
of deferred lease liabilities associated with the termination of the operating lease agreements. The payment for the termination of the lease agreements has been included within net cash provided by operating activities within the consolidated statement of cash flows for the year ended December 31, 2015.
97
In October 2015, the Company acquired the underlying real estate associated with
five
communities that were previously leased for an aggregate purchase price of
$78.4 million
. The results of operations of these communities are reported in the Assisted Living segment. The Company financed the transaction with seller-financing.
Dispositions of Owned Communities during 2015
During the year ended December 31, 2015, the Company sold
17
communities for an aggregate selling price of
$82.9 million
. The results of operations of the communities are reported in the Retirement Centers, Assisted Living, and CCRCs-Rental segments within the consolidated financial statements through the respective disposition dates. As of December 31, 2015, the Company identified
17
communities as held for sale. As of December 31, 2015,
$110.6 million
was recorded as assets held for sale and
$60.8 million
of mortgage debt related to communities held for sale was included in the current portion of long-term debt within the Company's consolidated balance sheet. During the year ended December 31, 2015, the Company recognized
$18.4 million
of impairment expense related to communities sold in 2015 and
$15.2 million
of impairment expense related to communities identified as assets held for sale as of December 31, 2015, primarily due to the excess of carrying value, including
$8.1 million
of allocated goodwill, over the estimated selling price less costs to dispose.
5. Fair Value Measurements
Marketable Securities
As of
December 31, 2017
, marketable securities of
$291.8 million
are stated at fair value based on valuations provided by third-party pricing services and are classified within Level 2 of the valuation hierarchy. The Company recognized gains of
$0.6 million
for marketable securities within interest income on the Company's consolidated statements of operations.
Interest Rate Derivatives
The Company's derivative assets include interest rate caps that effectively manage the risk above certain interest rates for a portion of the Company's variable rate debt. The derivative positions are valued using models developed internally by the respective counterparty that use as their basis readily available observable market parameters (such as forward yield curves) and are classified within Level 2 of the valuation hierarchy. The Company considers the credit risk of its counterparties when evaluating the fair value of its derivatives. The following table summarizes the Company's interest rate cap instruments as of
December 31, 2017
:
|
(in thousands)
|
|||
|
Current notional balance
|
$
|
813,434
|
|
|
Weighted average fixed cap rate
|
4.67
|
%
|
|
|
Earliest maturity date
|
2018
|
|
|
|
Latest maturity date
|
2022
|
|
|
|
Estimated asset fair value (included in other assets, net at December 31, 2017)
|
$
|
38
|
|
|
Estimated asset fair value (included in other assets, net at December 31, 2016)
|
$
|
127
|
|
Debt
The Company estimates the fair value of its debt using a discounted cash flow analysis based upon the Company's current borrowing rate for debt with similar maturities and collateral securing the indebtedness. The Company had outstanding debt (excluding capital and financing lease obligations) with a carrying value of approximately
$3.9 billion
and
$3.6 billion
as of
December 31, 2017
and
2016
, respectively. Fair value of the debt approximates carrying value in all periods. The Company's fair value of debt disclosure is classified within Level 2 of the valuation hierarchy.
98
Goodwill and Asset Impairment Expense
The following is a summary of the goodwill and asset impairment expense.
|
|
For the Years Ended December 31,
|
||||||||||
|
(in millions)
|
2017
|
2016
|
2015
|
||||||||
|
Goodwill (Note 8)
|
$
|
205.0
|
|
$
|
—
|
|
$
|
—
|
|
||
|
Property, plant and equipment and leasehold intangibles, net (Note 7)
|
164.4
|
|
166.2
|
|
23.4
|
|
|||||
|
Investment in unconsolidated ventures (Note 6)
|
25.8
|
|
36.8
|
|
—
|
|
|||||
|
Other intangible assets, net (Note 8)
|
14.6
|
|
29.7
|
|
0.9
|
|
|||||
|
Assets held for sale (Note 4)
|
—
|
|
15.8
|
|
33.6
|
|
|||||
|
Goodwill and asset impairment
|
$
|
409.8
|
|
$
|
248.5
|
|
$
|
57.9
|
|
||
Goodwill
The Company follows ASC 350,
Goodwill and Other Intangible Assets
, and tests goodwill for impairment annually during the fourth quarter or whenever indicators of impairment arise. Factors the Company considers important in its analysis of whether an indicator of impairment exists include a significant decline in the Company's stock price or market capitalization for a sustained period since the last testing date, significant underperformance relative to historical or projected future operating results and significant negative industry or economic trends. The Company first assesses qualitative factors to determine whether it is necessary to perform a quantitative goodwill impairment test. The quantitative goodwill impairment test is based upon a comparison of the estimated fair value of the reporting unit to which the goodwill has been assigned with the reporting unit's carrying value. The Company is not required to calculate the fair value of a reporting unit unless the Company determines, based on a qualitative assessment, that it is more likely than not that its fair value of a reporting unit is less than its carrying amount. The fair values used in the quantitative goodwill impairment test are estimated based upon discounted future cash flow projections for the reporting unit. These cash flow projections are based upon a number of estimates and assumptions such as revenue and expense growth rates, capitalization rates and discount rates. The Company also considers market based measures such as earnings multiples in its analysis of estimated fair values of its reporting units. If the quantitative goodwill impairment test results in a reporting unit's carrying amount exceeding its estimated fair value, an impairment charge will be recorded based on the difference in accordance with ASU 2017-04, with the impairment charge limited to the amount of goodwill allocated to the reporting unit.
During the three months ended September 30, 2017, the Company identified qualitative indicators of impairment, including a significant decline in the Company's stock price and market capitalization for a sustained period since the last testing date, significant underperformance relative to historical and projected operating results, and an increased competitive environment in the senior living industry. Based upon the Company's qualitative assessment, the Company performed a quantitative goodwill impairment test as of September 30, 2017, which included a comparison of the estimated fair value of each reporting unit to which the goodwill has been assigned with the reporting unit's carrying value.
In estimating the fair value of the reporting units for purposes of the quantitative goodwill impairment test, the Company utilized an income approach, which included future cash flow projections that are developed internally. Any estimates of future cash flow projections necessarily involve predicting unknown future circumstances and events and require significant management judgments and estimates. In arriving at the cash flow projections, the Company considered its historic operating results, approved budgets and business plans, future demographic factors, expected growth rates, and other factors. In using the income approach to estimate the fair value of reporting units for purposes of its goodwill impairment test, the Company made certain key assumptions. Those assumptions include future revenues, facility operating expenses, and cash flows, including sales proceeds that the Company would receive upon a sale of the communities using estimated capitalization rates, all of which are considered Level 3 inputs in accordance with ASC 820. The Company corroborated the estimated capitalization rates used in these calculations with capitalization rates observable from recent market transactions. Future cash flows are discounted at a rate that is consistent with a weighted average cost of capital from a market participant perspective. The weighted average cost of capital is an estimate of the overall after-tax rate of return required by equity and debt holders of a business enterprise. The Company also considered market based measures such as earnings multiples in its analysis of estimated fair values of its reporting units.
Based on the results of the Company's quantitative goodwill impairment test, the Company determined that the carrying amount of the Company's Assisted Living reporting unit exceeded its estimated fair value by
$205.0 million
as of September 30, 2017. As a result, the Company recorded a non-cash impairment charge of
$205.0 million
to goodwill within the Assisted Living operating segment for the three months ended September 30, 2017. Based on the results of the Company's quantitative goodwill impairment test, the Company determined that the estimated fair value of both the Company's Retirement Centers and Brookdale Ancillary
99
Services reporting units exceeded their respective carrying values as of September 30, 2017. The Company concluded that goodwill for all reporting units was not impaired as of October 1, 2017 (the Company's annual measurement date) and as of December 31, 2017.
Determining the fair value of the Company’s reporting units involves the use of significant estimates and assumptions, which the Company believes to be reasonable, that are unpredictable and inherently uncertain. These estimates and assumptions include revenue growth rates and operating margins used to calculate projected future cash flows and risk-adjusted discount rates. Future events may indicate differences from management's current judgments and estimates which could, in turn, result in future impairments. Future events that may result in impairment charges include increases in interest rates, which could impact capitalization and discount rates, differences in the projected occupancy rates and changes in the cost structure of existing communities. Significant adverse changes in the Company’s future revenues and/or operating margins, significant changes in the market for senior housing or the valuation of the real estate of senior living communities, as well as other events and circumstances, including but not limited to increased competition and changing economic or market conditions, including market control premiums, could result in changes in fair value and the determination that additional goodwill is impaired.
Property, Plant and Equipment and Leasehold Intangibles
During the years ended
December 31, 2017
,
2016
and
2015
, the Company evaluated property, plant and equipment and leasehold intangibles for impairment and identified properties with a carrying amount of the assets in excess of the estimated future undiscounted net cash flows expected to be generated by the assets. The Company compared the estimated fair value of the assets to their carrying value for these identified properties and recorded an impairment charge for the excess of carrying value over fair value. The Company recorded property, plant and equipment and leasehold intangibles non-cash impairment charges in its operating results of
$164.4 million
,
$166.2 million
, and
$23.4 million
for the years ended December 31, 2017, 2016, and 2015, respectively, primarily within the Assisted Living segment.
The fair values of the property, plant and equipment of these communities were determined utilizing a direct capitalization method considering stabilized facility operating income and market capitalization rates. These fair value measurements are considered Level 3 measurements within the fair value hierarchy. The range of capitalization rates utilized was
6.5%
to
9.0%
, depending upon the property type, geographical location, and the quality of the respective community. The Company corroborated the estimated fair values with a sales comparison approach with information observable from recent market transactions. These impairment charges are primarily due to lower than expected operating performance at these properties and reflect the amount by which the carrying values of the assets exceeded their estimated fair value.
Investment in Unconsolidated Ventures
The Company evaluates realization of its investment in ventures accounted for using the equity method if circumstances indicate that the Company's investment is other than temporarily impaired. During the years ended December 31,
2017
, and 2016, the Company recorded
$25.8 million
and
$36.8 million
, respectively, of non-cash impairment charges related to investments in unconsolidated ventures. These impairment charges are primarily due to lower than expected operating performance at the communities owned by the unconsolidated ventures and reflect the amount by which the carrying values of the investments exceeded their estimated fair value. Refer to Note 4 for more information about the impairment of the Blackstone Venture during 2017.
Other Intangible Assets
Indefinite-lived intangible assets are tested for impairment annually during the fourth quarter or whenever indicators of impairment arise. The impairment test consists of a comparison of the estimated fair value of the indefinite-lived intangible asset with its carrying value. If the carrying amount exceeds its fair value, an impairment loss is recognized for that difference. Health care licenses were determined to be indefinite-lived intangible assets and are not subject to amortization.
During the third quarter of 2017, the Company identified indicators of impairment for the Company’s home health care licenses in Florida, including significant underperformance relative to historical and projected operating results, decreases in reimbursement rates from Medicare for home health care services, an increased competitive environment in the home health care industry, and disruption from the impact of Hurricane Irma. The Company performed a quantitative impairment test as of September 30, 2017, which included a comparison of the estimated fair value of the Company’s home health care licenses to the carrying value. In estimating the fair value of the home health licenses for purposes of the quantitative impairment test, the Company utilized an income approach, which included future cash flow projections that are developed internally. Any estimates of future cash flow projections necessarily involve predicting unknown future circumstances and events and require significant management judgments and estimates. In arriving at the cash flow projections, the Company considered its historic operating results, approved budgets
100
and business plans, future demographic factors, expected growth rates, and other factors, all of which are considered Level 3 inputs in accordance with ASC 820.
Based on the results of the Company's quantitative impairment test, the Company determined that the carrying amount of certain of the Company's home health care licenses in Florida exceeded their estimated fair value by
$13.7 million
as of September 30, 2017. As a result, the Company recorded a non-cash impairment charge of
$13.7 million
to intangible assets within the Brookdale Ancillary Services segment for the three months ended September 30, 2017.
During 2016, the Company recorded
$28.2 million
of non-cash impairment charges related to community purchase options. These impairment charges are primarily due to lower than expected operating performance at the communities subject to the community purchase options and reflect the amount by which the carrying values of the community purchase options exceeded their estimated fair value. The fair values of the community purchase options were determined utilizing a direct capitalization method considering stabilized facility operating income and market capitalization rates for the underlying property subject to the community purchase option. These fair value measurements are considered Level 3 measurements within the fair value hierarchy. These impairment charges are primarily due to lower than expected operating performance at these properties and reflect the amount by which the carrying values of the assets exceeded their estimated fair value.
Assets Held for Sale
During the year ended
December 31, 2017
, the Company did
not
record impairment expense related to communities identified as held for sale. During the years ended December 31,
2016
and
2015
, the Company recorded
$15.8 million
and
$33.6 million
, respectively, of non-cash impairment charges related to communities identified as held for sale, inclusive of the allocation of goodwill to the disposed communities. These impairment charges are primarily due to the excess of carrying value, including allocated goodwill, over the estimated selling price less costs to dispose. Refer to Note 4 for more information about the Company's community dispositions and assets held for sale.
6. Variable Interest Entities and Investment in Unconsolidated Ventures
Variable Interest Entities
As of
December 31, 2017
, the Company has equity interests in unconsolidated VIEs. The Company has determined that it does not have the power to direct the activities of the VIEs that most significantly impact the VIEs' economic performance and is not the primary beneficiary of these VIEs in accordance with ASC 810. The Company's interests in the VIEs are, therefore, accounted for under the equity method of accounting.
The Company holds a
51%
equity interest, and HCP owns a
49%
interest, in a venture that owns and operates entry fee CCRCs (the "CCRC Venture"). The CCRC Venture's opco has been identified as a VIE. The equity members of the CCRC Venture's opco share certain operating rights, and the Company acts as manager to the CCRC Venture opco. However, the Company does not consolidate this VIE because it does not have the ability to control the activities that most significantly impact this VIE's economic performance. The assets of the CCRC Venture opco primarily consist of the CCRCs that it owns and leases, resident fees receivable, notes receivable and cash and cash equivalents. The obligations of the CCRC Venture opco primarily consist of community lease obligations, mortgage debt, accounts payable, accrued expenses and refundable entrance fees.
The Company holds an equity ownership interest in each of the propco and opco of
two
ventures ("RIDEA Ventures") that operate senior housing communities in a RIDEA structure. As of
December 31, 2017
, the Company's equity ownership interest is
10%
for each of the RIDEA Ventures. The RIDEA Ventures have been identified as VIEs. The equity members of the RIDEA Ventures share certain operating rights, and the Company acts as manager to the opcos of the RIDEA Ventures. However, the Company does not consolidate these VIEs because it does not have the ability to control the activities that most significantly impact the economic performance of these VIEs. The assets of the RIDEA Ventures primarily consist of the senior housing communities that the RIDEA Ventures own, resident fees receivable, and cash and cash equivalents. The obligations of the RIDEA Ventures primarily consist of notes payable, accounts payable and accrued expenses.
The Company holds a
15%
equity ownership interest in the Blackstone Venture. The Blackstone Venture has been identified as a VIE due to the Company lacking substantive participation rights in the management of the venture and the Company lacking kick-out rights over the managing member. The equity members of the Blackstone Venture share certain operating rights and the Company acts as manager to
60
communities owned by the Blackstone Venture. However, the Company does not consolidate this VIE because it does not have the ability to control the activities that most significantly impact the economic performance of the VIE. The assets of the Blackstone Venture primarily consist of senior housing communities, resident fees receivable and cash and cash equivalents. The assets of the Blackstone Venture primarily consist of senior housing communities, resident fees receivable
101
and cash and cash equivalents. The obligations of the Blackstone Venture primarily consist of long-term mortgage debt, accounts payable and accrued expenses. In addition to
$636.2 million
of long-term mortgage debt, the Blackstone Venture initially obtained
$66.8 million
of mortgage debt that was payable in 2017. In the event that refinancing proceeds for the
$66.8 million
of mortgage debt were insufficient to repay the debt principal amount, the Company may have been required to lend the amount of the shortfall, up to
$12.0 million
, to the Blackstone Venture. In June 2017, the Blackstone Venture completed the refinancing of the
$66.8 million
mortgage debt payable in 2017 and the Company was not required to lend any amounts to the Blackstone Venture. As of
December 31, 2017
, the Company leases
two
communities from the Blackstone Venture with annual lease payments of approximately
$2.6 million
. Under the terms of the lease agreements, the Company may be required to purchase the
two
leased communities for an amount equal to the greater of the fair market value of the communities or
$33.8 million
if there is an event of default under the lease agreement. See Note 4 for more information about the Company's entry into the Blackstone Venture.
The carrying value and classification of the related assets, liabilities and maximum exposure to loss as a result of the Company's involvement with these VIEs are summarized below as of
December 31, 2017
(in millions):
|
VIE Type
|
Asset Type
|
Maximum Exposure
to Loss |
Carrying Amount
|
|||||
|
CCRC Venture opco
|
Investment in unconsolidated ventures
|
$
|
29.6
|
|
$
|
29.6
|
|
|
|
RIDEA Ventures
|
Investment in unconsolidated ventures
|
$
|
41.3
|
|
$
|
41.3
|
|
|
|
Blackstone Venture
|
Investment in unconsolidated ventures
|
$
|
37.1
|
|
$
|
37.1
|
|
|
As of
December 31, 2017
, the Company is not required to provide financial support, through a liquidity arrangement or otherwise, to its unconsolidated VIEs.
Investment in Unconsolidated Ventures
The Company owns interests in the following ventures that are accounted for under the equity method as of
December 31, 2017
:
|
Venture
|
Ownership Percentage
|
|
CCRC Venture
|
51%
|
|
BKD-HCN Venture opco and propco
|
20%
|
|
Blackstone Venture
|
15%
|
|
HCP 49 Venture
|
10%
|
|
S-H Twenty-One Venture opco and propco
|
10%
|
Combined summarized financial information of the unconsolidated ventures accounted for under the equity method.
|
(in millions)
|
For the Years Ended December 31,
|
||||||||||
|
Statement of Operations Information
|
2017
|
2016
|
2015
|
||||||||
|
Resident fee revenue
|
$
|
1,354
|
|
$
|
1,133
|
|
$
|
964
|
|
||
|
Facility operating expenses
|
(946
|
)
|
(779
|
)
|
(679
|
)
|
|||||
|
Net income (loss)
|
$
|
(81
|
)
|
$
|
(4
|
)
|
$
|
(18
|
)
|
||
|
(in millions)
|
As of December 31,
|
||||||
|
Balance Sheet Information
|
2017
|
2016
|
|||||
|
Current assets
|
$
|
164
|
|
$
|
128
|
|
|
|
Noncurrent assets
|
4,050
|
|
3,932
|
|
|||
|
Current liabilities
|
672
|
|
1,153
|
|
|||
|
Noncurrent liabilities
|
$
|
2,813
|
|
$
|
2,215
|
|
|
During the year ended
December 31, 2016
, the CCRC Venture obtained non-recourse mortgage financing on certain communities and received proceeds of
$434.5 million
. The CCRC Venture distributed the net proceeds to its investors and the Company received proceeds of
$221.6 million
. As a result of the distribution, the Company's carrying value of its equity method investment in the
102
CCRC Venture propco was reduced below zero and the Company has recorded a
$49.5 million
and
$60.2 million
equity method liability within other liabilities within the consolidated balance sheet as of
December 31, 2017
and
2016
, respectively.
In January 2017, the Company completed the sale of a
10%
ownership interest in the HCP 49 Venture for
$26.8 million
of net cash proceeds. The Company retained a
10%
ownership interest in the HCP 49 Venture.
In December 2017, the Company completed the sale of certain of its ownership interests in unconsolidated ventures for
$36.0 million
of net cash proceeds and recognized a
$9.4 million
gain within gain on sale of assets for the year ended December 31, 2017.
Refer to Note 5 for information on impairment expense for investment in unconsolidated ventures.
7. Property, Plant and Equipment and Leasehold Intangibles, Net
As of
December 31, 2017
and
2016
, net property, plant and equipment and leasehold intangibles, which include assets under capital and financing leases, consisted of the following:
|
As of December 31,
|
|||||||
|
(in thousands)
|
2017
|
2016
|
|||||
|
Land
|
$
|
449,295
|
|
$
|
455,307
|
|
|
|
Buildings and improvements
|
4,923,621
|
|
5,053,204
|
|
|||
|
Leasehold improvements
|
124,850
|
|
126,325
|
|
|||
|
Furniture and equipment
|
1,006,889
|
|
974,516
|
|
|||
|
Resident and leasehold operating intangibles
|
594,748
|
|
705,000
|
|
|||
|
Construction in progress
|
74,678
|
|
69,803
|
|
|||
|
Assets under capital and financing leases
|
1,742,384
|
|
2,879,996
|
|
|||
|
|
8,916,465
|
|
10,264,151
|
|
|||
|
Accumulated depreciation and amortization
|
(3,064,320
|
)
|
(2,884,846
|
)
|
|||
|
Property, plant and equipment and leasehold intangibles, net
|
$
|
5,852,145
|
|
$
|
7,379,305
|
|
|
Long-lived assets with definite useful lives are depreciated or amortized on a straight-line basis over their estimated useful lives (or, in certain cases, the shorter of their estimated useful lives or the lease term) and are tested for impairment whenever indicators of impairment arise. Refer to Note 5 for information on impairment expense for property, plant and equipment and leasehold intangibles.
For the years ended
December 31, 2017
,
2016
and
2015
, the Company recognized depreciation and amortization expense on its property, plant and equipment and leasehold intangibles of
$479.4 million
,
$514.2 million
and
$721.0 million
, respectively.
Future amortization expense for resident and leasehold operating intangibles is estimated to be as follows (in thousands):
|
Year Ending December 31,
|
Future
Amortization
|
||
|
2018
|
$
|
5,938
|
|
|
2019
|
5,197
|
|
|
|
2020
|
4,144
|
|
|
|
2021
|
2,748
|
|
|
|
2022
|
1,758
|
|
|
|
Thereafter
|
8,200
|
|
|
|
Total
|
$
|
27,985
|
|
103
8. Goodwill and Other Intangible Assets, Net
The following is a summary of the carrying amount of goodwill presented on an operating segment basis.
|
|
December 31, 2017
|
||||||||||||||
|
(in thousands)
|
Gross
Carrying Amount |
Dispositions and Other
Reductions |
Accumulated Impairment
|
Net
|
|||||||||||
|
Retirement Centers
|
$
|
28,141
|
|
$
|
(820
|
)
|
$
|
—
|
|
$
|
27,321
|
|
|||
|
Assisted Living
|
605,469
|
|
(48,817
|
)
|
(205,000
|
)
|
351,652
|
|
|||||||
|
Brookdale Ancillary Services
|
126,810
|
|
—
|
|
—
|
|
126,810
|
|
|||||||
|
Total
|
$
|
760,420
|
|
$
|
(49,637
|
)
|
$
|
(205,000
|
)
|
$
|
505,783
|
|
|||
|
|
December 31, 2016
|
||||||||||||||
|
(in thousands)
|
Gross
Carrying Amount |
Dispositions and Other
Reductions |
Accumulated Impairment
|
Net
|
|||||||||||
|
Retirement Centers
|
$
|
28,141
|
|
$
|
(820
|
)
|
$
|
—
|
|
$
|
27,321
|
|
|||
|
Assisted Living
|
600,162
|
|
(48,817
|
)
|
—
|
|
551,345
|
|
|||||||
|
Brookdale Ancillary Services
|
126,810
|
|
—
|
|
—
|
|
126,810
|
|
|||||||
|
Total
|
$
|
755,113
|
|
$
|
(49,637
|
)
|
$
|
—
|
|
$
|
705,476
|
|
|||
The following is a summary of other intangible assets.
|
|
December 31, 2017
|
December 31, 2016
|
|||||||||||||||||||||
|
(in thousands)
|
Gross
Carrying Amount |
Accumulated
Amortization |
Net
|
Gross
Carrying Amount |
Accumulated
Amortization |
Net
|
|||||||||||||||||
|
Community purchase options
|
$
|
9,533
|
|
$
|
—
|
|
$
|
9,533
|
|
$
|
4,738
|
|
$
|
—
|
|
$
|
4,738
|
|
|||||
|
Health care licenses
|
50,927
|
|
—
|
|
50,927
|
|
65,126
|
|
—
|
|
65,126
|
|
|||||||||||
|
Trade names
|
27,800
|
|
(23,714
|
)
|
4,086
|
|
27,800
|
|
(21,135
|
)
|
6,665
|
|
|||||||||||
|
Management contracts
|
11,360
|
|
(7,929
|
)
|
3,431
|
|
13,531
|
|
(7,053
|
)
|
6,478
|
|
|||||||||||
|
Total
|
$
|
99,620
|
|
$
|
(31,643
|
)
|
$
|
67,977
|
|
$
|
111,195
|
|
$
|
(28,188
|
)
|
$
|
83,007
|
|
|||||
Amortization expense related to definite-lived intangible assets for the years ended
December 31, 2017
,
2016
and
2015
was
$5.6 million
,
$9.2 million
and
$12.2 million
, respectively. Health care licenses were determined to be indefinite-lived intangible assets and are not subject to amortization. The community purchase options are not amortized, but will be added to the cost basis of the related communities if the option is exercised, and will then be depreciated over the estimated useful life of the community. The Company is amortizing the trade names and management contract intangibles assets over their estimated weighted average useful lives of
three years
and
nine years
, respectively. Refer to Note 5 for information on impairment expense for goodwill and other intangible assets.
Future amortization expense for intangible assets with definite lives is estimated to be as follows (in thousands):
|
Year Ending December 31,
|
Future
Amortization |
||
|
2018
|
$
|
3,180
|
|
|
2019
|
2,101
|
|
|
|
2020
|
596
|
|
|
|
2021
|
596
|
|
|
|
2022
|
596
|
|
|
|
Thereafter
|
448
|
|
|
|
Total
|
$
|
7,517
|
|
104
9. Debt
Long-term Debt and Capital and Financing Lease Obligations
Long-term debt and capital and financing lease obligations consist of the following:
|
|
December 31,
|
||||||
|
(in thousands)
|
2017
|
2016
|
|||||
|
Mortgage notes payable due 2018 through 2047; weighted average interest rate of 4.59% in 2017, less debt discount and deferred financing costs of $16.6 million and $4.5 million in 2017 and 2016, respectively (weighted average interest rate of 4.50% in 2016)
|
$
|
3,497,762
|
|
$
|
3,184,229
|
|
|
|
Capital and financing lease obligations payable through 2032; weighted average interest rate of 6.75% in 2017 (weighted average interest rate of 8.08% in 2016)
|
1,271,554
|
|
2,485,520
|
|
|||
|
Convertible notes payable in aggregate principal amount of $316.3 million, less debt discount and deferred financing costs of $6.4 million and $20.9 million in 2017 and 2016, respectively, interest at 2.75% per annum, due June 15, 2018
|
309,853
|
|
295,397
|
|
|||
|
Construction financing (weighted average interest rate of 8.00% in 2016)
|
—
|
|
3,644
|
|
|||
|
Other notes payable, weighted average interest rate of 5.98% in 2017 (weighted average interest rate of 5.33% in 2016) and maturity dates ranging from 2020 to 2021
|
63,122
|
|
76,377
|
|
|||
|
Total long-term debt and capital and financing lease obligations
|
5,142,291
|
|
6,045,167
|
|
|||
|
Less current portion
|
602,501
|
|
215,255
|
|
|||
|
Total long-term debt and capital and financing lease obligations, less current portion
|
$
|
4,539,790
|
|
$
|
5,829,912
|
|
|
As of
December 31, 2017
and
2016
, the current portion of long-term debt within the Company's consolidated financial statements includes
$30.1 million
and
$60.5 million
, respectively, of mortgage notes payable secured by assets held for sale. This debt will either be assumed by the prospective purchasers or be repaid with the proceeds from the sales. Refer to Note 4 for more information about the Company's assets held for sale.
The annual aggregate scheduled maturities of long-term debt and capital and financing lease obligations outstanding as of
December 31, 2017
are as follows (in thousands):
|
Year Ending December 31,
|
Long-term
Debt |
Capital and
Financing Lease Obligations |
Total
|
||||||||
|
2018
|
$
|
501,622
|
|
$
|
576,388
|
|
$
|
1,078,010
|
|
||
|
2019
|
328,515
|
|
137,047
|
|
465,562
|
|
|||||
|
2020
|
488,311
|
|
78,288
|
|
566,599
|
|
|||||
|
2021
|
338,632
|
|
61,841
|
|
400,473
|
|
|||||
|
2022
|
343,859
|
|
62,590
|
|
406,449
|
|
|||||
|
Thereafter
|
1,892,752
|
|
1,059,106
|
|
2,951,858
|
|
|||||
|
Total obligations
|
3,893,691
|
|
1,975,260
|
|
5,868,951
|
|
|||||
|
Less amount representing debt discount and deferred financing costs, net
|
(22,954
|
)
|
—
|
|
(22,954
|
)
|
|||||
|
Less amount representing interest (weighted average interest rate of 6.75%)
|
—
|
|
(703,706
|
)
|
(703,706
|
)
|
|||||
|
Total
|
$
|
3,870,737
|
|
$
|
1,271,554
|
|
$
|
5,142,291
|
|
||
The aggregate scheduled maturities of capital and financing lease obligations for the year ending December 31, 2018 include the
$374.5 million
carrying value of the financing lease obligations for
20
communities which were previously subject to sale-leaseback transactions in which the Company was deemed to have continuing involvement for accounting purposes. As described in Note 4, the leases for these communities have been amended to expire on or before November 1, 2018.
Credit Facilities
On December 19, 2014, the Company entered into a Fourth Amended and Restated Credit Agreement with General Electric Capital Corporation (which has since assigned its interest to Capital One Financial Corporation), as administrative agent, lender and
105
swingline lender, and the other lenders from time to time parties thereto. The agreement currently provides for a total commitment amount of
$400.0 million
, comprised of a
$400.0 million
revolving credit facility (with a
$50.0 million
sublimit for letters of credit and a
$50.0 million
swingline feature to permit same day borrowing) and an option to increase the revolving credit facility by an additional
$250.0 million
, subject to obtaining commitments for the amount of such increase from acceptable lenders. The maturity date is
January 3, 2020
, and amounts drawn under the facility bear interest at 90-day LIBOR plus an applicable margin from a range of
2.50%
to
3.50%
. The applicable margin varies based on the percentage of the total commitment drawn, with a
2.50%
margin at utilization equal to or lower than
35%
, a
3.25%
margin at utilization greater than
35%
but less than or equal to
50%
, and a
3.50%
margin at utilization greater than
50%
. The quarterly commitment fee on the unused portion of the facility is
0.25%
per annum when the outstanding amount of obligations (including revolving credit, swingline and term loans and letter of credit obligations) is greater than or equal to
50%
of the total commitment amount or
0.35%
per annum when such outstanding amount is less than
50%
of the total commitment amount.
Amounts drawn on the facility may be used to finance acquisitions, fund working capital and capital expenditures and for other general corporate purposes.
The facility is secured by a first priority mortgage on certain of the Company's communities. In addition, the agreement permits the Company to pledge the equity interests in subsidiaries that own other communities (rather than mortgaging such communities), provided that loan availability from pledged assets cannot exceed
10%
of loan availability from mortgaged assets. The availability under the line will vary from time to time as it is based on borrowing base calculations related to the appraised value and performance of the communities securing the facility.
The agreement contains typical affirmative and negative covenants, including financial covenants with respect to minimum consolidated fixed charge coverage and minimum consolidated tangible net worth. A violation of any of these covenants could result in a default under the credit agreement, which would result in termination of all commitments under the agreement and all amounts owing under the agreement becoming immediately due and payable and could trigger cross default provisions in our other outstanding debt and lease agreements.
As of
December 31, 2017
,
no
borrowings were outstanding on the revolving credit facility and
$41.8 million
of letters of credit were outstanding under this credit facility. The Company also had separate unsecured letter of credit facilities of up to
$64.5 million
in the aggregate as of
December 31, 2017
. Letters of credit totaling
$64.4 million
had been issued under these separate facilities as of
December 31, 2017
.
2017 Financings
In June 2017, the Company obtained a
$54.7 million
non-recourse addition and borrow-up loan, secured by first mortgages on
seven
communities. The loan bears interest at a fixed rate of
4.69%
and matures on
March 1, 2022
. Proceeds from the loan added to the Company's liquidity.
In July 2017, the Company completed the refinancing of
two
existing loan portfolios secured by the non-recourse first mortgages on
22
communities. The
$221.3 million
of proceeds from the refinancing were primarily utilized to repay
$188.1 million
and
$13.6 million
of mortgage debt maturing in
April 2018
and
January 2021
, respectively. The mortgage facility has a
10
year term, and
70%
of the principal amount bears interest at a fixed rate of
4.81%
and the remaining
30%
of the principal amount bears interest at a variable rate of 30-day LIBOR plus a margin of
244
basis points.
In August 2017, the Company obtained $
975.0 million
of debt secured by the non-recourse first mortgages on
51
communities.
Sixty percent
of the principal amount bears interest at a fixed rate, with one half of such amount bearing interest at
4.43%
and maturing in
2024
and the other one half bearing interest at
4.47%
and maturing in
2027
.
Forty percent
of the principal amount bears interest at a variable rate equal to the 30-day LIBOR plus a margin of
241.5
basis points and matures in
2027
. The $
975.0 million
of proceeds from the refinancing were primarily utilized to repay $
389.9 million
and
$228.9 million
of outstanding mortgage debt scheduled to mature in
August 2018
and
May 2023
, respectively. The net proceeds from the refinancing activity added to the Company's liquidity.
During the year ended December 31, 2017, the Company recorded
$12.4 million
of debt modification and extinguishment costs on the consolidated statement of operations for that period, primarily related to third party fees directly related to debt modifications.
During 2017, the Company repaid
$78.9 million
of outstanding principal balance on four existing loan portfolios secured by the non-recourse first mortgages on
13
communities and the Nurse on Call business. The Company plans to repay debt maturing in the upcoming year, including the
$316.3 million
outstanding principal amount of convertible senior notes due
June 15, 2018
, through current liquidity, future operating cash flows, and normal-course refinancings.
106
2016 Financings
In March 2016, the Company obtained a
$100.0 million
supplemental loan, secured by first mortgages on
ten
communities. The loan bears interest at a fixed rate of
4.20%
and matures on January 1, 2023. Proceeds from the loan were utilized to pay down a portion of the outstanding balance of the secured credit facility.
In December 2016, the Company entered into a
$105.0 million
note, which bears interest at a fixed rate of
4.65%
, and a
$69.6 million
note, which bears interest at a variable rate of 1-month LIBOR plus a margin of 258 basis points. The notes are secured by first mortgages on
six
communities and mature on January 1, 2027. Proceeds from the loan were primarily utilized to repay
$164.4 million
of mortgage debt.
During the year ended
December 31, 2016
, the Company recorded
$9.2 million
of debt modification and extinguishment costs on the consolidated statement of operations for that period, primarily related to prepayment penalties for debt extinguishments.
Convertible Debt
In June 2011, the Company completed a registered offering of
$316.3 million
aggregate principal amount of
2.75%
convertible senior notes due
June 15, 2018
(the "Notes"). As of
December 31, 2017
, the
$309.9 million
carrying value of the Notes was included in the current portion of long-term debt within the consolidated balance sheet. It is the Company's current intent and policy to settle the principal amount of the Notes (or, if less, the amount of the conversion obligation) in cash upon conversion.
The Company received net proceeds of approximately
$308.2 million
after the deduction of underwriting commissions and offering expenses. The Company used a portion of the net proceeds to pay the Company's cost of the convertible note hedge transactions described below, taking into account the proceeds to the Company of the warrant transactions described below, and used the balance of the net proceeds to repay existing outstanding debt.
The Notes are senior unsecured obligations and rank equally in right of payment to all of the Company's other senior unsecured debt, if any. The Notes will be senior in right of payment to any of the Company's debt which is subordinated by its terms to the Notes (if any). The Notes are also structurally subordinated to all debt and other liabilities and commitments (including trade payables) of the Company's subsidiaries. The Notes are also effectively subordinated to the Company's secured debt to the extent of the assets securing the debt.
The Notes bear interest at
2.75%
per annum, payable semi-annually in cash. The Notes are convertible at an initial conversion rate of
34.1006
shares of Company common stock per
$1,000
principal amount of Notes (equivalent to an initial conversion price of approximately
$29.325
per share), subject to adjustment. On and after March 15, 2018, until the close of business on the second scheduled trading day immediately preceding the maturity date, holders may convert their Notes at any time. In addition, Holders may convert their Notes at their option under the following circumstances: (i) during any fiscal quarter if the last reported sale price of the Company's common stock for at least
20
trading days (whether or not consecutive) during a period of
30
consecutive trading days ending on the last trading day of the preceding fiscal quarter is greater than or equal to
130%
of the applicable conversion price on the last day of such preceding fiscal quarter; (ii) during the
five
business day period after any
five
consecutive trading day period (the "measurement period"), in which the trading price per
$1,000
principal amount of notes for each trading day of that measurement period was less than
98%
of the product of the last reported sale price of the Company's common stock and the applicable conversion rate on each such day; or (iii) upon the occurrence of specified corporate events. As of
December 31, 2017
, the Notes are not convertible. Unconverted Notes mature at par on
June 15, 2018
.
In addition, following certain corporate transactions, the Company will increase the conversion rate for a holder who elects to convert in connection with such transaction by a number of additional shares of common stock as set forth in the supplemental indenture governing the Notes.
The Notes were issued in an offering registered under the Securities Act of 1933, as amended (Securities Act).
In accordance with FASB guidance regarding the accounting for convertible debt instruments that may be settled in cash upon conversion (including partial settlement), the liability and equity components of the convertible debt are separated in a manner that will reflect the Company's non-convertible debt borrowing rate when interest expense is recognized in subsequent periods.
The Company is accreting the carrying value to the principal amount at maturity using an imputed interest rate of
7.5%
(the estimated effective borrowing rate for nonconvertible debt at the time of issuance, Level 2) over its expected life of
seven years
.
107
As of
December 31, 2017
, the "if converted" value of the Notes does not exceed their principal amount.
The interest expense associated with the Notes (excluding amortization of the associated deferred financing costs) was as follows:
|
|
For the Years Ended December 31,
|
||||||||||
|
(in thousands)
|
2017
|
2016
|
2015
|
||||||||
|
Coupon interest
|
$
|
8,697
|
|
$
|
8,697
|
|
$
|
8,697
|
|
||
|
Amortization of discount
|
13,586
|
|
12,625
|
|
11,732
|
|
|||||
|
Interest expense related to convertible notes
|
$
|
22,283
|
|
$
|
21,322
|
|
$
|
20,429
|
|
||
In connection with the offering of the Notes, in June 2011, the Company entered into convertible note hedge transactions (the "Convertible Note Hedges") with certain financial institutions (the "Hedge Counterparties"). The Convertible Note Hedges cover, subject to customary anti-dilution adjustments,
10,784,315
shares of common stock. The Company also entered into warrant transactions with the Hedge Counterparties whereby the Company sold to the Hedge Counterparties warrants to acquire, subject to customary anti-dilution adjustments, up to
10,784,315
shares of common stock (the "Sold Warrant Transactions"). The warrants have a strike price of
$40.25
per share, subject to customary anti-dilution adjustments.
The Convertible Note Hedges are expected to reduce the potential dilution with respect to common stock upon conversion of the Notes in the event that the price per share of common stock at the time of exercise is greater than the strike price of the Convertible Note Hedges, which corresponds to the initial conversion price of the Notes and is similarly subject to customary anti-dilution adjustments. If, however, the price per share of common stock exceeds the strike price of the Sold Warrant Transactions when they expire, there would be additional dilution from the issuance of common stock pursuant to the warrants.
The Convertible Note Hedges and Sold Warrant Transactions are separate transactions (in each case entered into by the Company and Hedge Counterparties), are not part of the terms of the Notes and will not affect the holders' rights under the Notes. Holders of the Notes do not have any rights with respect to the Convertible Note Hedges or the Sold Warrant Transactions.
These hedging transactions had a net cost of approximately
$31.9 million
, which was paid from the proceeds of the Notes and recorded as a reduction of additional paid-in capital. The Company has contractual rights, and, at execution of the related agreements, had the ability to settle its obligations under the conversion features of the Notes, the Convertible Note Hedges and Sold Warrant Transactions, with the Company's common stock. Accordingly, these transactions are accounted for as equity, with no subsequent adjustment for changes in the value of these obligations.
Financial Covenants
Certain of the Company’s debt documents contain restrictions and financial covenants, such as those requiring the Company to maintain prescribed minimum net worth and stockholders’ equity levels and debt service ratios, and requiring the Company not to exceed prescribed leverage ratios, in each case on a consolidated, portfolio-wide, multi-community, single-community and/or entity basis. In addition, the Company’s debt documents generally contain non-financial covenants, such as those requiring the Company to comply with Medicare or Medicaid provider requirements.
The Company’s failure to comply with applicable covenants could constitute an event of default under the applicable debt documents. Many of the Company’s debt and lease documents contain cross-default provisions so that a default under one of these instruments could cause a default under other debt and lease documents (including documents with other lenders or lessors). Furthermore, the Company’s debt is secured by its communities and, in certain cases, a guaranty by the Company and/or one or more of its subsidiaries.
As of December 31, 2017, the Company is in compliance with the financial covenants of its outstanding debt agreements.
108
10. Accrued Expenses
Accrued expenses consist of the following:
|
As of December 31,
|
|||||||
|
(in thousands)
|
2017
|
2016
|
|||||
|
Salaries and wages
|
$
|
91,784
|
|
$
|
102,025
|
|
|
|
Insurance reserves
|
63,309
|
|
71,123
|
|
|||
|
Vacation
|
40,281
|
|
42,411
|
|
|||
|
Real estate taxes
|
30,743
|
|
34,002
|
|
|||
|
Interest
|
13,745
|
|
12,948
|
|
|||
|
Lease payable
|
11,942
|
|
11,211
|
|
|||
|
Accrued utilities
|
10,807
|
|
10,582
|
|
|||
|
Taxes payable
|
2,636
|
|
2,818
|
|
|||
|
Other
|
64,719
|
|
40,917
|
|
|||
|
Total
|
$
|
329,966
|
|
$
|
328,037
|
|
|
11. Commitments and Contingencies
Facility Operating Leases
As of
December 31, 2017
, the Company operated
434
communities under long-term leases (
290
operating leases and
144
capital and financing leases). The substantial majority of the Company's lease arrangements are structured as master leases. Under a master lease, numerous communities are leased through an indivisible lease. The Company typically guarantees the performance and lease payment obligations of its subsidiary leases under the master leases. Due to the nature of such master leases, it is difficult to restructure the composition of such leased portfolios or economic terms of the leases without the consent of the applicable landlord. In addition, an event of default related to an individual property or limited number of properties within a master lease portfolio would result in a default on the entire master lease portfolio.
The leases relating to these communities are generally fixed rate leases with annual escalators that are either fixed or tied to changes in leased property revenue or the consumer price index. The Company is responsible for all operating costs, including repairs, property taxes and insurance. The initial lease terms primarily vary from
10
to
20
years and generally include renewal options ranging from
5
to
15
years. The remaining base lease terms vary from less than
one
year to
15
years and generally provide for renewal or extension options and in some instances, purchase options.
The community leases contain other customary terms, which may include assignment and change of control restrictions, maintenance and capital expenditure obligations, termination provisions and financial covenants, such as those requiring the Company to maintain prescribed minimum net worth and stockholders’ equity levels and lease coverage ratios, in each case on a consolidated, portfolio-wide, multi-community, single-community and/or entity basis. In addition, the Company’s lease documents generally contain non-financial covenants, such as those requiring the Company to comply with Medicare or Medicaid provider requirements.
The Company’s failure to comply with applicable covenants could constitute an event of default under the applicable lease documents. Many of the Company’s debt and lease documents contain cross-default provisions so that a default under one of these instruments could cause a default under other debt and lease documents (including documents with other lenders and lessors). Certain leases contain cure provisions, which generally allow the Company to post an additional lease security deposit if the required covenant is not met. Furthermore, the Company’s leases are secured by its communities and, in certain cases, a guaranty by the Company and/or one or more of its subsidiaries.
As of December 31, 2017, the Company is in compliance with the financial covenants of its long-term leases.
109
A summary of facility lease expense and the impact of straight-line adjustment and amortization of (above) below market rents and deferred gains are as follows:
|
For the Years Ended December 31,
|
|||||||||||
|
(in thousands)
|
2017
|
2016
|
2015
|
||||||||
|
Cash basis payment - operating leases
|
$
|
365,077
|
|
$
|
384,104
|
|
$
|
372,148
|
|
||
|
Straight-line lease (income) expense
|
(14,313
|
)
|
767
|
|
6,956
|
|
|||||
|
Amortization of (above) below market lease, net
|
(6,677
|
)
|
(6,864
|
)
|
(7,158
|
)
|
|||||
|
Amortization of deferred gain
|
(4,366
|
)
|
(4,372
|
)
|
(4,372
|
)
|
|||||
|
Facility lease expense
|
$
|
339,721
|
|
$
|
373,635
|
|
$
|
367,574
|
|
||
The aggregate amounts of future minimum operating lease payments, including community and office leases, as of
December 31, 2017
are as follows (in thousands):
|
Year Ending December 31,
|
Operating
Leases |
||
|
2018
|
$
|
369,169
|
|
|
2019
|
348,038
|
|
|
|
2020
|
307,795
|
|
|
|
2021
|
266,296
|
|
|
|
2022
|
247,099
|
|
|
|
Thereafter
|
1,039,804
|
|
|
|
Total
|
$
|
2,578,201
|
|
Other
The Company has employment or letter agreements with certain officers of the Company and has adopted policies to which certain officers of the Company are eligible to participate, which grant these employees the right to receive a portion or multiple of their base salary, pro-rata bonus, bonus and/or continuation of certain benefits, for a defined period of time, in the event of certain terminations of the officers' employment, as described in those agreements and policies.
12. Self-Insurance
The Company obtains various insurance coverages from commercial carriers at stated amounts as defined in the applicable policy. Losses related to deductible amounts are accrued based on the Company's estimate of expected losses plus incurred but not reported claims.
As of
December 31, 2017
and
2016
, the Company accrued reserves of
$165.0 million
and
$184.0 million
, respectively, for these programs of which
$101.7 million
and
$112.9 million
is classified as long-term liabilities as of
December 31, 2017
and
2016
, respectively. As of
December 31, 2017
and
2016
, the Company accrued
$17.5 million
and
$22.8 million
, respectively, of estimated amounts receivable from the insurance companies under these insurance programs. During the years ended
December 31, 2017
and
2016
, the Company recorded a
$9.9 million
and
$35.4 million
decrease in insurance expense from changes in estimates, respectively, due to general liability and professional liability and workers compensation claims experience.
The Company has secured self-insured retention risk under workers' compensation programs with cash deposits of
$12.7 million
and
$12.4 million
as of
December 31, 2017
and
2016
, respectively. Letters of credit securing the programs aggregated
$71.8 million
and
$59.5 million
as of
December 31, 2017
and
2016
, respectively. In addition, the Company also had deposits of
$33.9 million
and
$37.4 million
as of
December 31, 2017
and
2016
, respectively, to fund claims paid under a high deductible, collateralized insurance policy.
110
13. Retirement Plans
The Company maintains a 401(k) Retirement Savings Plan for all employees that meet minimum employment criteria. The plan provides that the participants may defer eligible compensation subject to certain Internal Revenue Code maximum amounts. The Company makes matching contributions in amounts equal to
25.0%
of the employee's contribution to the plan, up to a maximum of
4.0%
of compensation. An additional matching contribution of
12.5%
, subject to the same limit on compensation, may be made at the discretion of the Company, based upon the Company's performance. For the years ended
December 31, 2017
,
2016
and
2015
, the Company's expense to the plan was
$10.1 million
,
$8.2 million
and
$6.6 million
, respectively.
14. Stock-Based Compensation
The following table sets forth information about the Company's restricted stock awards (excluding restricted stock units):
|
(share amounts in thousands, except for value per share)
|
Number of Shares
|
Weighted
Average Grant Date Fair Value |
||||
|
Outstanding on January 1, 2015
|
3,552
|
|
$
|
25.70
|
|
|
|
Granted
|
1,698
|
|
32.75
|
|
||
|
Vested
|
(1,275
|
)
|
23.55
|
|
||
|
Cancelled/forfeited
|
(521
|
)
|
18.68
|
|
||
|
Outstanding on December 31, 2015
|
3,454
|
|
28.80
|
|
||
|
Granted
|
3,141
|
|
14.56
|
|
||
|
Vested
|
(1,242
|
)
|
26.79
|
|
||
|
Cancelled/forfeited
|
(745
|
)
|
24.75
|
|
||
|
Outstanding on December 31, 2016
|
4,608
|
|
20.29
|
|
||
|
Granted
|
2,569
|
|
14.65
|
|
||
|
Vested
|
(1,276
|
)
|
22.20
|
|
||
|
Cancelled/forfeited
|
(1,131
|
)
|
18.95
|
|
||
|
Outstanding on December 31, 2017
|
4,770
|
|
$
|
17.13
|
|
|
As of
December 31, 2017
, there was
$47.5 million
of total unrecognized compensation cost related to outstanding, unvested share-based compensation awards. That cost is expected to be recognized over a weighted-average period of
2.4
years and is based on grant date fair value.
During
2017
, grants of restricted shares under the Company's 2014 Omnibus Incentive Plan were as follows:
|
(share amounts in thousands, except for value per share)
|
Shares Granted
|
Value Per Share
|
Total Value
|
|||||||
|
Three months ended March 31, 2017
|
2,392
|
|
$
|
14.84
|
|
$
|
35,497
|
|
||
|
Three months ended June 30, 2017
|
71
|
|
$
|
13.11
|
|
$
|
937
|
|
||
|
Three months ended September 30, 2017
|
67
|
|
$
|
13.19
|
|
$
|
889
|
|
||
|
Three months ended December 31, 2017
|
39
|
|
$
|
9.84
|
|
$
|
377
|
|
||
The Company has an employee stock purchase plan for all eligible employees. Under the plan, eligible employees of the Company can purchase shares of the Company's common stock on a quarterly basis at a discounted price through accumulated payroll deductions. Each eligible employee may elect to deduct up to
15%
of his or her base pay, not to exceed
200
shares, each quarter. Subject to certain limitations specified in the plan, on the last trading date of each calendar quarter, the amount deducted from each participant's pay over the course of the quarter will be used to purchase whole shares of the Company's common stock at a purchase price equal to
90%
of the closing market price on the New York Stock Exchange on that date. The Company reserved
1,800,000
shares of common stock for issuance under the plan. The impact on the Company's consolidated financial statements is not material.
111
15. Share Repurchase Program
On November 1, 2016, the Company announced that its Board of Directors had approved a share repurchase program that authorizes the Company to purchase up to
$100.0 million
in the aggregate of the Company's common stock, which replaced the prior authorization approved by the Board in 2011 that had remaining availability of approximately
$82.4 million
at the time of termination. Purchases may be made from time to time using a variety of methods, which may include open market purchases, privately negotiated transactions or block trades, or by any combination of these methods, in accordance with applicable insider trading and other securities laws and regulations.
The size, scope and timing of any purchases will be based on business, market and other conditions and factors, including price, regulatory and contractual requirements or consents, and capital availability. The repurchase program does not obligate the Company to acquire any particular amount of common stock and the program may be suspended, modified or discontinued at any time at the Company's discretion without prior notice. Shares of stock repurchased under the program will be held as treasury shares.
No
shares were purchased pursuant to this authorization during the year ended
December 31, 2017
. During the year ended
December 31, 2016
, the Company repurchased
750,000
shares at a weighted average price paid per share of
$12.83
, for an aggregate purchase price of approximately
$9.6 million
. As of
December 31, 2017
, approximately
$90.4 million
remains available under the share repurchase authorization.
16. Income Taxes
The benefit (provision) for income taxes is comprised of the following:
|
|
For the Years Ended December 31,
|
||||||||||
|
(in thousands)
|
2017
|
2016
|
2015
|
||||||||
|
Federal:
|
|
|
|
||||||||
|
Current
|
$
|
2,200
|
|
$
|
(12
|
)
|
$
|
49
|
|
||
|
Deferred
|
15,310
|
|
(3,248
|
)
|
95,259
|
|
|||||
|
Total Federal
|
17,510
|
|
(3,260
|
)
|
95,308
|
|
|||||
|
State:
|
|
|
|
|
|
|
|||||
|
Current
|
(995
|
)
|
(2,118
|
)
|
(3,099
|
)
|
|||||
|
Deferred (included in Federal above)
|
—
|
|
—
|
|
—
|
|
|||||
|
Total State
|
(995
|
)
|
(2,118
|
)
|
(3,099
|
)
|
|||||
|
Total
|
$
|
16,515
|
|
$
|
(5,378
|
)
|
$
|
92,209
|
|
||
A reconciliation of the benefit (provision) for income taxes to the amount computed at the U.S. Federal statutory rate of
35%
is as follows:
|
|
For the Years Ended December 31,
|
||||||||||
|
(in thousands)
|
2017
|
2016
|
2015
|
||||||||
|
Tax benefit at U.S. statutory rate
|
$
|
205,777
|
|
$
|
139,657
|
|
$
|
192,390
|
|
||
|
Impact of the Tax Act
|
114,716
|
|
—
|
|
—
|
|
|||||
|
State taxes, net of federal income tax
|
24,891
|
|
11,788
|
|
18,323
|
|
|||||
|
Tax credits
|
1,908
|
|
6,163
|
|
3,937
|
|
|||||
|
Valuation allowance
|
(246,037
|
)
|
(142,862
|
)
|
(111,797
|
)
|
|||||
|
Goodwill impairment
|
(78,515
|
)
|
(10,789
|
)
|
(7,856
|
)
|
|||||
|
Stock compensation
|
(4,093
|
)
|
(5,716
|
)
|
—
|
|
|||||
|
Other, net
|
(851
|
)
|
(1,831
|
)
|
(1,626
|
)
|
|||||
|
Meals and entertainment
|
(726
|
)
|
(868
|
)
|
(1,090
|
)
|
|||||
|
Return to provision
|
(555
|
)
|
(920
|
)
|
(72
|
)
|
|||||
|
Total
|
$
|
16,515
|
|
$
|
(5,378
|
)
|
$
|
92,209
|
|
||
112
Significant components of the Company's deferred tax assets and liabilities are as follows:
|
As of December 31,
|
|||||||
|
(in thousands)
|
2017
|
2016
|
|||||
|
Deferred income tax assets:
|
|
|
|||||
|
Capital and financing lease obligations
|
$
|
264,255
|
|
$
|
862,038
|
|
|
|
Operating loss carryforwards
|
288,469
|
|
319,948
|
|
|||
|
Accrued expenses
|
66,123
|
|
109,283
|
|
|||
|
Deferred lease liability
|
52,869
|
|
93,358
|
|
|||
|
Tax credits
|
49,556
|
|
49,550
|
|
|||
|
Intangible assets
|
14,493
|
|
20,272
|
|
|||
|
Deferred gain on sale leaseback
|
1,844
|
|
4,233
|
|
|||
|
Prepaid revenue
|
1,825
|
|
2,626
|
|
|||
|
Investment in unconsolidated ventures
|
2,861
|
|
—
|
|
|||
|
Other
|
660
|
|
—
|
|
|||
|
Total gross deferred income tax asset
|
742,955
|
|
1,461,308
|
|
|||
|
Valuation allowance
|
(336,087
|
)
|
(264,305
|
)
|
|||
|
Net deferred income tax assets
|
406,868
|
|
1,197,003
|
|
|||
|
Deferred income tax liabilities:
|
|
|
|
|
|||
|
Property, plant and equipment
|
(477,512
|
)
|
(1,209,595
|
)
|
|||
|
Investment in unconsolidated ventures
|
—
|
|
(66,678
|
)
|
|||
|
Other
|
—
|
|
(1,376
|
)
|
|||
|
Total gross deferred income tax liability
|
(477,512
|
)
|
(1,277,649
|
)
|
|||
|
Net deferred tax liability
|
$
|
(70,644
|
)
|
$
|
(80,646
|
)
|
|
On December 22, 2017, the President signed into law the Tax Cuts and Jobs Act (“Tax Act”), a bill reforming the US corporate income tax code which will reduce the Company’s federal corporate tax rate from
35%
to
21%
. The rate reduction will take effect on January 1, 2018. For accounting purposes, however, the carrying value of the Company's deferred tax assets is determined by the enacted federal corporate income tax rate. Consequently, the changes in the federal corporate income tax rate have impacted the carrying value of the Company's net deferred tax liability position as of
December 31, 2017
as such date is subsequent to the enactment date. Under the new corporate income tax rate of
21%
, the Company's net deferred income tax assets and valuation allowance have decreased. In addition to the impact of the federal corporate income tax rate, the change in corporate tax law reduces the Company's valuation allowance and reduces its deferred tax assets related to Alternative Minimum Tax ("AMT") credits to cash or future receivable. Under the Tax Act, AMT is eliminated for corporations and AMT credits can be monetized thereafter. The overall net effect of the Tax Act on the Company's consolidated financial statements was a benefit of
$114.7 million
for the year ended December 31, 2017.
A summary of the effect of the Tax Act is as follows:
|
|
For the Year Ended
|
||
|
(in thousands)
|
December 31, 2017
|
||
|
Rate change - decrease in net deferred tax assets
|
$
|
108,070
|
|
|
Rate change - decrease in valuation allowance
|
(172,235
|
)
|
|
|
Impact on net operating loss usage
|
(50,551
|
)
|
|
|
Reduction of deferred tax asset - AMT credits
|
2,361
|
|
|
|
Total impact of the Tax Act on the Company's deferred taxes position
|
(112,355
|
)
|
|
|
Realization of AMT credits
|
(2,361
|
)
|
|
|
Net impact of the Tax Act on the Company's effect tax rate
|
$
|
(114,716
|
)
|
In addition to the aforementioned impacts to the Company's consolidated financial statements as of
December 31, 2017
, the Tax Act will have other impacts on the Company in the future. The Company's federal net operating losses that have been incurred
113
prior to
December 31, 2017
will continue to have a 20-year carryforward limitation applied and will need to be evaluated for recoverability in the future as such. For net operating losses created after
December 31, 2017
, the net operating losses will have an indefinite life, but usage will be limited to 80% of taxable income in any given year. The Company has estimated the impact of the Tax Act on state income taxes reflected in its income tax benefit for the year ended December 31, 2017. Reasonable estimates for the Company’s state and local provision were made based on the Company's analysis of tax reform. These provisional amounts may be adjusted in future periods during 2018 when additional information is obtained. Additional information that may affect the Company's provisional amounts would include further clarification and guidance on how the Internal Revenue Service will implement tax reform and further clarification and guidance on how state taxing authorities will implement tax reform and the related effect on our state and local income tax returns, state and local net operating losses and corresponding valuation allowances.
As of
December 31, 2017
and
2016
, the Company had federal net operating loss carryforwards of approximately
$1.2 billion
and
$1.0 billion
, respectively, which are available to offset future taxable income through
2037
. The Company determined that a valuation allowance was required after consideration of the Company's estimated future reversal of existing timing differences as of
December 31, 2017
and
2016
. For the year ended
December 31, 2017
, the Company recorded a provision of approximately
$71.8 million
(including the impact from Tax Act) to reflect the required valuation allowance of
$336.1 million
as of
December 31, 2017
. The valuation allowance reflects that the Company's net operating losses will begin to expire in
2024
.
A summary of the change in the Company's valuation allowance is as follows:
|
|
For the Year Ended
|
||
|
(in thousands)
|
December 31, 2017
|
||
|
Increase in valuation allowance before consideration of the Tax Act
|
$
|
246,037
|
|
|
Increase due to the adoption of ASU 2016-09
|
48,531
|
|
|
|
Total increase in valuation allowance
|
294,568
|
|
|
|
Tax Act rate change - decrease in valuation allowance
|
(172,235
|
)
|
|
|
Impact on net operating loss usage
|
(50,551
|
)
|
|
|
Total decrease in valuation allowance due to Tax Act
|
(222,786
|
)
|
|
|
Total increase in valuation allowance
|
$
|
71,782
|
|
For the year ended December 31, 2016, the Company determined that a valuation allowance was required due to the loss before income taxes, combined with the Company's estimated reversal of future timing differences as of December 31, 2016. As a result, the Company recorded a valuation allowance of
$264.3 million
as of December 31, 2016.
The Company has recorded valuation allowances of
$286.6 million
and
$218.1 million
as of
December 31, 2017
and
2016
, respectively, against its federal and state net operating losses, as the Company anticipates these losses will not be utilized prior to expiration. The Company also recorded a valuation allowance against federal and state credits of
$49.5 million
and
$49.6 million
as of
December 31, 2017
and
2016
, respectively.
As of
December 31, 2017
and
2016
, the Company had gross tax affected unrecognized tax benefits of
$18.5 million
and
$29.1 million
, respectively, which, if recognized, would result in an income tax benefit recorded in the consolidated statement of operations. Interest and penalties related to these tax positions are classified as tax expense in the Company's consolidated financial statements. Total interest and penalties reserved is
$0.1 million
as of
December 31, 2017
and
2016
. As of
December 31, 2017
, the Company's tax returns for years
2013
through
2016
are subject to future examination by tax authorities. In addition, the net operating losses from prior years are subject to adjustment under examination. The Company does not expect that unrecognized tax benefits for tax positions taken with respect to
2017
and prior years will significantly change in
2018
.
114
A reconciliation of the unrecognized tax benefits is as follows:
|
|
For the Years Ended December 31,
|
||||||
|
(in thousands)
|
2017
|
2016
|
|||||
|
Balance at January 1,
|
$
|
29,160
|
|
$
|
30,236
|
|
|
|
Additions for tax positions related to the current year
|
184
|
|
—
|
|
|||
|
Additions for tax positions related to prior years
|
—
|
|
30
|
|
|||
|
Reductions for the Impact of the Tax Act
|
(10,859
|
)
|
—
|
|
|||
|
Reductions for tax positions related to prior years
|
(24
|
)
|
(1,106
|
)
|
|||
|
Balance at December 31,
|
$
|
18,461
|
|
$
|
29,160
|
|
|
17. Supplemental Disclosure of Cash Flow Information
|
(in thousands)
|
For the Years Ended December 31,
|
||||||||||
|
Supplemental Disclosure of Cash Flow Information:
|
2017
|
2016
|
2015
|
||||||||
|
Interest paid
|
$
|
294,758
|
|
$
|
349,535
|
|
$
|
360,960
|
|
||
|
Income taxes paid, net of refunds
|
$
|
1,038
|
|
$
|
2,047
|
|
$
|
2,952
|
|
||
|
Additions to property, plant and equipment and leasehold intangibles, net:
|
|
|
|
|
|||||||
|
Property, plant and equipment and leasehold intangibles, net
|
$
|
221,476
|
|
$
|
300,113
|
|
$
|
448,682
|
|
||
|
Accounts payable
|
(7,589
|
)
|
33,534
|
|
(37,631
|
)
|
|||||
|
Net cash paid
|
$
|
213,887
|
|
$
|
333,647
|
|
$
|
411,051
|
|
||
|
Acquisition of assets, net of related payables:
|
|
|
|
|
|||||||
|
Prepaid expenses and other assets
|
$
|
—
|
|
$
|
—
|
|
$
|
(53,405
|
)
|
||
|
Property, plant and equipment and leasehold intangibles, net
|
—
|
|
19,457
|
|
198,558
|
|
|||||
|
Other intangible assets, net
|
5,196
|
|
(7,300
|
)
|
(7,294
|
)
|
|||||
|
Long-term debt
|
—
|
|
—
|
|
(101,558
|
)
|
|||||
|
Capital and financing lease obligations
|
—
|
|
—
|
|
155,230
|
|
|||||
|
Other liabilities
|
—
|
|
—
|
|
(315
|
)
|
|||||
|
Net cash paid
|
$
|
5,196
|
|
$
|
12,157
|
|
$
|
191,216
|
|
||
|
Proceeds from sale of assets, net:
|
|
|
|
|
|||||||
|
Prepaid expenses and other assets
|
$
|
(17,072
|
)
|
$
|
(4,543
|
)
|
$
|
25,780
|
|
||
|
Assets held for sale
|
(20,952
|
)
|
(289,452
|
)
|
—
|
|
|||||
|
Property, plant and equipment and leasehold intangibles, net
|
(155,723
|
)
|
—
|
|
(82,953
|
)
|
|||||
|
Investments in unconsolidated ventures
|
(52,548
|
)
|
—
|
|
—
|
|
|||||
|
Other liabilities
|
(1,058
|
)
|
3,281
|
|
(960
|
)
|
|||||
|
Long-term debt
|
8,547
|
|
—
|
|
—
|
|
|||||
|
Capital and financing lease obligations
|
157,963
|
|
—
|
|
8,907
|
|
|||||
|
Refundable entrance fees and deferred revenue
|
30,771
|
|
—
|
|
—
|
|
|||||
|
Gain on sale of assets, net
|
(19,273
|
)
|
(7,218
|
)
|
—
|
|
|||||
|
(Gain) loss on lease termination
|
(1,162
|
)
|
—
|
|
—
|
|
|||||
|
Net cash received
|
$
|
(70,507
|
)
|
$
|
(297,932
|
)
|
$
|
(49,226
|
)
|
||
115
|
Formation of the Blackstone Venture:
|
|||||||||||
|
Prepaid expenses and other assets
|
$
|
(8,173
|
)
|
$
|
—
|
|
$
|
—
|
|
||
|
Property, plant and equipment and leasehold intangibles, net
|
(768,897
|
)
|
—
|
|
—
|
|
|||||
|
Investments in unconsolidated ventures
|
66,816
|
|
—
|
|
—
|
|
|||||
|
Capital and financing lease obligations
|
879,959
|
|
—
|
|
—
|
|
|||||
|
Deferred liabilities
|
7,504
|
|
—
|
|
—
|
|
|||||
|
Other liabilities
|
1,998
|
|
—
|
|
—
|
|
|||||
|
Net cash paid
|
$
|
179,207
|
|
$
|
—
|
|
$
|
—
|
|
||
|
Supplemental Schedule of Non-cash Operating, Investing and Financing Activities:
|
|||||||||||
|
Assets designated as held for sale:
|
|
|
|||||||||
|
Prepaid expenses and other assets
|
$
|
199
|
|
$
|
(3,195
|
)
|
$
|
—
|
|
||
|
Assets held for sale
|
(29,544
|
)
|
278,675
|
|
110,620
|
|
|||||
|
Property, plant and equipment and leasehold intangibles, net
|
29,345
|
|
(262,711
|
)
|
(113,592
|
)
|
|||||
|
Goodwill
|
—
|
|
(28,568
|
)
|
(12,200
|
)
|
|||||
|
Asset impairment
|
—
|
|
15,799
|
|
15,172
|
|
|||||
|
Net
|
$
|
—
|
|
$
|
—
|
|
$
|
—
|
|
||
|
Amendments to leases:
|
|||||||||||
|
Property, plant and equipment and leasehold intangibles, net
|
$
|
(145,645
|
)
|
$
|
—
|
|
$
|
26,644
|
|
||
|
Other intangible assets, net
|
—
|
|
—
|
|
(5,202
|
)
|
|||||
|
Capital and financing lease obligations
|
147,886
|
|
—
|
|
(23,738
|
)
|
|||||
|
Deferred liabilities
|
7,447
|
|
—
|
|
—
|
|
|||||
|
Other liabilities
|
(9,688
|
)
|
—
|
|
2,296
|
|
|||||
|
Net
|
$
|
—
|
|
$
|
—
|
|
$
|
—
|
|
||
|
Contribution to CCRC Venture:
|
|||||||||||
|
Property, plant and equipment and leasehold intangibles, net
|
$
|
—
|
|
$
|
—
|
|
$
|
(25,717
|
)
|
||
|
Investment in unconsolidated ventures
|
—
|
|
—
|
|
7,422
|
|
|||||
|
Long-term debt
|
—
|
|
—
|
|
18,295
|
|
|||||
|
Net
|
$
|
—
|
|
$
|
—
|
|
$
|
—
|
|
||
18. Litigation
The Company has been and is currently involved in litigation and claims, including putative class action claims from time to time, incidental to the conduct of its business which are generally comparable to other companies in the senior living and healthcare industries. Certain claims and lawsuits allege large damage amounts and may require significant costs to defend and resolve. As a result, the Company maintains general liability and professional liability insurance policies in amounts and with coverage and deductibles the Company believes are adequate, based on the nature and risks of its business, historical experience and industry standards. The Company's current policies provide for deductibles for each claim. Accordingly, the Company is, in effect, self-insured for claims that are less than the deductible amounts and for claims or portions of claims that are not covered by such policies.
Similarly, the senior living and healthcare industries are continuously subject to scrutiny by governmental regulators, which could result in litigation related to regulatory compliance matters. In addition, as a result of the Company's participation in the Medicare and Medicaid programs, the Company is subject to various governmental reviews, audits and investigations, including but not limited to audits under various government programs, such as the Recovery Audit Contractors (RAC), Zone Program Integrity Contractors (ZPIC), and Unified Program Integrity Contractors (UPIC) programs. The costs to respond to and defend such reviews, audits and investigations may be significant, and an adverse determination could result in citations, sanctions and other criminal or civil fines and penalties, the refund of overpayments, payment suspensions, termination of participation in Medicare and Medicaid programs, and/or damage to the Company's business reputation.
116
19. Segment Information
As of
December 31, 2017
the Company has
five
reportable segments: Retirement Centers; Assisted Living; CCRCs-Rental; Brookdale Ancillary Services; and Management Services. Operating segments are defined as components of an enterprise that engage in business activities from which it may earn revenues and incur expenses; for which separate financial information is available; and whose operating results are regularly reviewed by the chief operating decision maker to assess the performance of the individual segment and make decisions about resources to be allocated to the segment.
Retirement Centers
. The Company's Retirement Centers segment includes owned or leased communities that are primarily designed for middle to upper income seniors generally age
75
and older who desire an upscale residential environment providing the highest quality of service. The majority of the Company's retirement center communities consist of both independent living and assisted living units in a single community, which allows residents to "age-in-place" by providing them with a continuum of senior independent and assisted living services.
Assisted Living.
The Company's Assisted Living segment includes owned or leased communities that offer housing and 24-hour assistance with activities of daily life to mid-acuity frail and elderly residents. Assisted living communities include both freestanding, multi-story communities and freestanding, single story communities. The Company also operates memory care communities, which are freestanding assisted living communities specially designed for residents with Alzheimer's disease and other dementias.
CCRCs-Rental.
The Company's CCRCs-Rental segment includes large owned or leased communities that offer a variety of living arrangements and services to accommodate all levels of physical ability and health. Most of the Company's CCRCs have independent living, assisted living and skilled nursing available on one campus or within the immediate market, and some also include memory care and Alzheimer's units.
Brookdale Ancillary Services
. The Company's Brookdale Ancillary Services segment includes the home health, hospice and outpatient therapy services, as well as education and wellness programs, provided to residents of many of the Company's communities and to seniors living outside of the Company's communities. The Brookdale Ancillary Services segment does not include the inpatient therapy services provided in the Company's skilled nursing units, which are included in the Company's CCRCs-Rental segment.
Management Services.
The Company's Management Services segment includes communities operated by the Company pursuant to management agreements. In some of the cases, the controlling financial interest in the community is held by third parties and, in other cases, the community is owned in a venture structure in which the Company has an ownership interest. Under the management agreements for these communities, the Company receives management fees as well as reimbursed expenses, which represent the reimbursement of expenses it incurs on behalf of the owners.
The accounting policies of the Company's reportable segments are the same as those described in the summary of significant accounting policies in Note 2.
The following table sets forth selected segment financial and operating data:
|
|
For the Years Ended December 31,
|
||||||||||
|
(in thousands)
|
2017
|
2016
|
2015
|
||||||||
|
Revenue:
|
|
|
|
||||||||
|
Retirement Centers
(1)
|
$
|
654,196
|
|
$
|
679,503
|
|
$
|
657,940
|
|
||
|
Assisted Living
(1)
|
2,210,688
|
|
2,419,459
|
|
2,445,457
|
|
|||||
|
CCRCs-Rental
(1)
|
468,994
|
|
592,826
|
|
604,572
|
|
|||||
|
Brookdale Ancillary Services
(1)
|
446,262
|
|
476,833
|
|
469,158
|
|
|||||
|
Management Services
(2)
|
966,976
|
|
808,359
|
|
783,481
|
|
|||||
|
|
$
|
4,747,116
|
|
$
|
4,976,980
|
|
$
|
4,960,608
|
|
||
|
Segment Operating Income
(3)
:
|
|
|
|
|
|
|
|||||
|
Retirement Centers
|
$
|
271,417
|
|
$
|
294,530
|
|
$
|
285,257
|
|
||
|
Assisted Living
|
749,058
|
|
876,817
|
|
877,303
|
|
|||||
|
CCRCs-Rental
|
106,162
|
|
133,409
|
|
150,495
|
|
|||||
117
|
Brookdale Ancillary Services
|
51,348
|
|
64,463
|
|
75,210
|
|
|||||
|
Management Services
|
75,845
|
|
70,762
|
|
60,183
|
|
|||||
|
|
1,253,830
|
|
1,439,981
|
|
1,448,448
|
|
|||||
|
General and administrative (including non-cash stock-based compensation expense)
|
255,446
|
|
313,409
|
|
370,579
|
|
|||||
|
Transaction costs
|
22,573
|
|
3,990
|
|
8,252
|
|
|||||
|
Facility lease expense:
|
|
|
|
|
|
|
|||||
|
Retirement Centers
|
117,131
|
|
120,272
|
|
114,738
|
|
|||||
|
Assisted Living
|
185,971
|
|
193,670
|
|
197,452
|
|
|||||
|
CCRCs-Rental
|
29,464
|
|
51,727
|
|
47,937
|
|
|||||
|
Brookdale Ancillary Services
|
—
|
|
—
|
|
—
|
|
|||||
|
Corporate and Management Services
|
7,155
|
|
7,966
|
|
7,447
|
|
|||||
|
Depreciation and amortization:
|
|
|
|
|
|
|
|||||
|
Retirement Centers
|
95,226
|
|
94,049
|
|
104,063
|
|
|||||
|
Assisted Living
|
290,344
|
|
308,639
|
|
489,933
|
|
|||||
|
CCRCs-Rental
|
44,294
|
|
66,431
|
|
87,754
|
|
|||||
|
Brookdale Ancillary Services
|
3,723
|
|
4,075
|
|
7,451
|
|
|||||
|
Corporate and Management Services
|
48,490
|
|
47,208
|
|
43,964
|
|
|||||
|
Goodwill and asset impairment:
|
|||||||||||
|
Retirement Centers
|
2,968
|
|
31,384
|
|
209
|
|
|||||
|
Assisted Living
|
342,788
|
|
132,389
|
|
46,179
|
|
|||||
|
CCRCs-Rental
|
18,083
|
|
46,329
|
|
10,654
|
|
|||||
|
Brookdale Ancillary Services
|
14,599
|
|
1,596
|
|
899
|
|
|||||
|
Corporate and Management Services
|
31,344
|
|
36,817
|
|
—
|
|
|||||
|
Loss on facility lease termination
|
14,276
|
|
11,113
|
|
76,143
|
|
|||||
|
Income (loss) from operations
|
$
|
(270,045
|
)
|
$
|
(31,083
|
)
|
$
|
(165,206
|
)
|
||
|
Total interest expense:
|
|
|
|
|
|
|
|||||
|
Retirement Centers
|
$
|
55,436
|
|
$
|
56,827
|
|
$
|
58,397
|
|
||
|
Assisted Living
|
207,861
|
|
249,449
|
|
250,116
|
|
|||||
|
CCRCs-Rental
|
27,665
|
|
39,824
|
|
39,502
|
|
|||||
|
Brookdale Ancillary Services
|
892
|
|
1,461
|
|
1,354
|
|
|||||
|
Corporate and Management Services
|
34,300
|
|
38,056
|
|
39,395
|
|
|||||
|
|
$
|
326,154
|
|
$
|
385,617
|
|
$
|
388,764
|
|
||
|
Total capital expenditures for property, plant and equipment, and leasehold intangibles:
|
|
|
|
|
|
|
|||||
|
Retirement Centers
|
$
|
47,309
|
|
$
|
59,978
|
|
$
|
161,986
|
|
||
|
Assisted Living
|
119,717
|
|
156,732
|
|
220,893
|
|
|||||
|
CCRCs-Rental
|
24,297
|
|
37,800
|
|
54,864
|
|
|||||
|
Brookdale Ancillary Services
|
755
|
|
1,576
|
|
4,061
|
|
|||||
|
Corporate and Management Services
|
29,398
|
|
44,027
|
|
6,878
|
|
|||||
|
|
$
|
221,476
|
|
$
|
300,113
|
|
$
|
448,682
|
|
||
118
|
|
As of December 31,
|
||||||
|
(in thousands)
|
2017
|
2016
|
|||||
|
Total assets:
|
|
|
|||||
|
Retirement Centers
|
$
|
1,266,076
|
|
$
|
1,452,546
|
|
|
|
Assisted Living
|
4,535,114
|
|
5,831,434
|
|
|||
|
CCRCs-Rental
|
667,234
|
|
935,389
|
|
|||
|
Brookdale Ancillary Services
|
257,257
|
|
280,530
|
|
|||
|
Corporate and Management Services
|
949,768
|
|
717,788
|
|
|||
|
|
$
|
7,675,449
|
|
$
|
9,217,687
|
|
|
|
(1)
|
All revenue is earned from external third parties in the United States.
|
|
(2)
|
Management services segment revenue includes reimbursements for which the Company is the primary obligor of costs incurred on behalf of managed communities.
|
|
(3)
|
Segment operating income is defined as segment revenues less segment facility operating expenses (excluding depreciation and amortization) and costs incurred on behalf of managed communities.
|
20. Quarterly Results of Operations (Unaudited)
The following is a summary of quarterly results of operations for each of the fiscal quarters in
2017
and
2016
:
|
|
For the Quarters Ended
|
||||||||||||||
|
(in thousands, except per share amounts)
|
March 31,
2017 |
June 30,
2017 |
September 30,
2017 |
December 31,
2017 |
|||||||||||
|
Revenues
|
$
|
1,216,766
|
|
$
|
1,186,472
|
|
$
|
1,177,988
|
|
$
|
1,165,890
|
|
|||
|
Goodwill and asset impairment
|
20,706
|
|
1,559
|
|
368,551
|
|
18,966
|
|
|||||||
|
Income (loss) from operations
|
48,126
|
|
30,174
|
|
(350,970
|
)
|
2,625
|
|
|||||||
|
Income (loss) before income taxes
|
(42,333
|
)
|
(49,072
|
)
|
(445,147
|
)
|
(51,569
|
)
|
|||||||
|
Net income (loss)
|
(126,361
|
)
|
(46,337
|
)
|
(413,929
|
)
|
15,021
|
|
|||||||
|
Net income (loss) attributable to Brookdale Senior Living Inc. common stockholders
|
(126,304
|
)
|
(46,287
|
)
|
(413,885
|
)
|
15,057
|
|
|||||||
|
Weighted average basic and diluted income (loss) per share
|
$
|
(0.68
|
)
|
$
|
(0.25
|
)
|
$
|
(2.22
|
)
|
$
|
0.08
|
|
|||
|
|
For the Quarters Ended
|
||||||||||||||
|
(in thousands, except per share amounts)
|
March 31,
2016 |
June 30,
2016 |
September 30,
2016 |
December 31,
2016 |
|||||||||||
|
Revenues
|
$
|
1,263,156
|
|
$
|
1,258,830
|
|
$
|
1,246,126
|
|
$
|
1,208,868
|
|
|||
|
Goodwill and asset impairment
|
3,375
|
|
4,152
|
|
19,111
|
|
221,877
|
|
|||||||
|
Income (loss) from operations
|
41,354
|
|
58,287
|
|
47,645
|
|
(178,369
|
)
|
|||||||
|
Income (loss) before income taxes
|
(47,152
|
)
|
(35,368
|
)
|
(47,569
|
)
|
(269,169
|
)
|
|||||||
|
Net income (loss)
|
(48,817
|
)
|
(35,491
|
)
|
(51,728
|
)
|
(268,600
|
)
|
|||||||
|
Net income (loss) attributable to Brookdale Senior Living Inc. common stockholders
|
(48,775
|
)
|
(35,450
|
)
|
(51,685
|
)
|
(268,487
|
)
|
|||||||
|
Weighted average basic and diluted income (loss) per share
|
$
|
(0.26
|
)
|
$
|
(0.19
|
)
|
$
|
(0.28
|
)
|
$
|
(1.45
|
)
|
|||
21. Subsequent Events
In February 2018, the Company determined that it plans to market in 2018 and sell approximately
30
owned communities. The closings of such sales of assets are subject to the Company’s successful marketing of such assets on terms acceptable to the
119
Company. Further, the closings of the expected sales of such assets will be subject to the satisfaction of various closing conditions, including (where applicable) the receipt of regulatory approvals. However, there can be no assurance that the transactions will close or, if they do, when the actual closings will occur.
120
SCHEDULE II
VALUATION AND QUALIFYING ACCOUNTS
December 31, 2017
(In thousands)
|
|
|
Additions
|
|
|
|
|
|||||||||||||
|
Description
|
Balance at
beginning of period |
Charged to
costs and expenses |
|
Charged
to other accounts |
|
Deductions
|
|
Balance at
end of period |
|||||||||||
|
Allowance for Doubtful Accounts:
|
|
|
|
|
|
|
|
|
|||||||||||
|
Year ended December 31, 2015
|
$
|
26,501
|
|
$
|
25,132
|
|
|
$
|
2,135
|
|
|
$
|
(27,298
|
)
|
$
|
26,470
|
|
||
|
Year ended December 31, 2016
|
$
|
26,470
|
|
$
|
30,632
|
|
|
$
|
2,680
|
|
|
$
|
(32,738
|
)
|
$
|
27,044
|
|
||
|
Year ended December 31, 2017
|
$
|
27,044
|
|
$
|
25,370
|
|
|
$
|
555
|
|
|
$
|
(29,857
|
)
|
$
|
23,112
|
|
||
|
Deferred Tax Valuation Allowance:
|
|
|
|
|
|
|
|
|
|
|
|
||||||||
|
Year ended December 31, 2015
|
$
|
9,213
|
|
$
|
111,797
|
|
(1)
|
$
|
592
|
|
(1)
|
$
|
—
|
|
|
$
|
121,602
|
|
|
|
Year ended December 31, 2016
|
$
|
121,602
|
|
$
|
142,862
|
|
(2)
|
$
|
—
|
|
$
|
(159
|
)
|
|
$
|
264,305
|
|
||
|
Year ended December 31, 2017
|
$
|
264,305
|
|
$
|
71,782
|
|
(3)
|
$
|
—
|
|
|
$
|
—
|
|
|
$
|
336,087
|
|
|
(1) Adjustment to valuation allowance for federal and state net operating losses and federal credits of
$81,968
and
$30,421
, respectively.
(2) Adjustment to valuation allowance for federal and state net operating losses and federal credits of
$128,931
and
$13,931
, respectively.
(3) Additional valuation allowance for federal and state net operating losses of
$294,568
and a reduction of
$222,786
resulting from the Tax Cuts and Jobs Act.
121
|
Item 9.
|
Changes in and Disagreements with Accountants on Accounting and Financial Disclosure.
|
None.
|
Item 9A.
|
Controls and Procedures.
|
Evaluation of Disclosure Controls and Procedures
The Company maintains disclosure controls and procedures (as defined under Rules 13a-15(e) and 15d-15(e) of the Securities Exchange Act of 1934, as amended). Our management, under the supervision of and with the participation of our Chief Executive Officer and Chief Financial Officer, has evaluated the effectiveness of our disclosure controls and procedures. Based on such evaluation, our Chief Executive Officer and Chief Financial Officer each concluded that, as of
December 31, 2017
, our disclosure controls and procedures were effective.
Management's Assessment of Internal Control over Financial Reporting
Our management is responsible for establishing and maintaining adequate internal control over financial reporting, as defined in Exchange Act Rule 13a-15(f). Under the supervision and with the participation of our management, including our Chief Executive Officer and Chief Financial Officer, we conducted an evaluation of the effectiveness of our internal control over financial reporting based on the framework in Internal Control—Integrated Framework issued by the Committee of Sponsoring Organizations of the Treadway Commission (2013 framework). Because of its inherent limitations, internal control over financial reporting may not prevent or detect misstatements. Therefore, even those systems determined to be effective can only provide reasonable assurance with respect to financial statement preparation and presentation.
Based on the Company's evaluation, management concluded that our internal control over financial reporting was effective as of
December 31, 2017
. Management reviewed the results of their assessment with our Audit Committee. The effectiveness of our internal control over financial reporting as of
December 31, 2017
has been audited by Ernst & Young LLP, the independent registered public accounting firm that audited our consolidated financial statements included in this Annual Report on Form 10-K, as stated in their report which is included in Item 8 of this Annual Report on Form 10-K and incorporated herein by reference.
Internal Control Over Financial Reporting
There has not been any change in our internal control over financial reporting (as such term is defined in Rules 13a-15(f) and 15d-15(f) under the Exchange Act) during the fiscal quarter ended
December 31, 2017
that has materially affected, or is reasonably likely to materially affect, our internal control over financial reporting.
|
Item 9B.
|
Other Information.
|
None.
122
|
Item 10.
|
Directors, Executive Officers and Corporate Governance.
|
To the extent not set forth herein, the information required by this item is incorporated by reference from the discussions under the headings "Proposal 1—Election of Directors," "Executive Officers" and "Section 16(a) Beneficial Ownership Reporting Compliance" in our Definitive Proxy Statement for the
2018
Annual Meeting of Stockholders or in an amendment to this Annual Report on Form 10-K, to be filed with the SEC within 120 days of December 31, 2017.
Our Board of Directors has adopted a Code of Business Conduct and Ethics that applies to all employees, directors and officers, including our principal executive officer, our principal financial officer, our principal accounting officer or controller, or persons performing similar functions, as well as a Code of Ethics for Chief Executive and Senior Financial Officers, which applies to our President and Chief Executive Officer, Chief Financial Officer, Chief Accounting Officer, Treasurer and Controller, both of which are available on our website at www.brookdale.com. Any amendment to, or waiver from, a provision of such codes of ethics granted to a principal executive officer, principal financial officer, principal accounting officer or controller, or person performing similar functions, or to any executive officer or director, will be posted on our website.
|
Item 11.
|
Executive Compensation.
|
The information required by this item is incorporated by reference from the discussions under the headings "Compensation of Directors" and "Compensation of Executive Officers" in our Definitive Proxy Statement for the
2018
Annual Meeting of Stockholders or in an amendment to this Annual Report on Form 10-K, to be filed with the SEC within 120 days of December 31, 2017.
|
Item 12.
|
Security Ownership of Certain Beneficial Owners and Management and Related Stockholder Matters.
|
To the extent not set forth herein, the information required by this item regarding security ownership of certain beneficial owners and management is incorporated by reference from the discussion under the heading "Security Ownership of Certain Beneficial Owners and Management" in our Definitive Proxy Statement for the
2018
Annual Meeting of Stockholders or in an amendment to this Annual Report on Form 10-K, to be filed with the SEC within 120 days of December 31, 2017.
The following table provides certain information as of
December 31, 2017
with respect to our equity compensation plans (after giving effect to shares issued and/or vesting on such date):
Equity Compensation Plan Information
|
|
Number of securities to be issued upon exercise of outstanding options, warrants and rights
|
|
Weighted-average exercise price of outstanding options, warrants and rights
|
|
Number of securities remaining available for future issuance under equity compensation plans (excluding securities reflected in column (a))
|
||
|
Plan category
|
(a)
(1)
|
(b)
|
(c)
(2)
|
||||
|
Equity compensation plans approved by security holders
|
|
—
|
|
—
|
|
11,236,601
|
|
|
Equity compensation plans not approved by security holders
(3)
|
|
—
|
|
—
|
|
52,380
|
|
|
Total
|
|
—
|
|
—
|
|
11,288,981
|
|
|
(1)
|
As of
December 31, 2017
, an aggregate of
4,605,849
shares of unvested restricted stock and
15,547
vested restricted stock units were outstanding under our 2014 Omnibus Incentive Plan, and an aggregate of
164,248
shares of unvested restricted stock and
6,850
vested restricted stock units were outstanding under our Omnibus Stock Incentive Plan. Such shares of restricted stock and restricted stock units are not reflected in the table above. Our 2014 Omnibus Incentive Plan allows awards to be made in the form of stock options, stock appreciation rights, restricted shares, restricted stock units, unrestricted shares, performance awards and other stock-based awards.
|
123
|
(2)
|
The number of shares remaining available for future issuance under equity compensation plans approved by security holders consists of
10,394,670
shares remaining available for future issuance under our 2014 Omnibus Incentive Plan and
841,931
shares remaining available for future issuance under our Associate Stock Purchase Plan.
|
|
(3)
|
Represents shares remaining available for future issuance under our Director Stock Purchase Plan. Under the existing compensation program for the members of our Board of Directors, each non-employee director has the opportunity to elect to receive either immediately vested shares or restricted stock units in lieu of up to 50% of his or her quarterly cash compensation. Any immediately vested shares that are elected to be received will be issued pursuant to the Director Stock Purchase Plan. Under the director compensation program, all cash amounts are payable quarterly in arrears, with payments to be made on April 1, July 1, October 1 and January 1. Any immediately vested shares that a director elects to receive under the Director Stock Purchase Plan will be issued at the same time that cash payments are made. The number of shares to be issued will be based on the closing price of our common stock on the date of issuance (i.e., April 1, July 1, October 1 and January 1), or if such date is not a trading date, on the previous trading day's closing price. Fractional amounts will be paid in cash. The Board of Directors initially reserved 100,000 shares of our common stock for issuance under the Director Stock Purchase Plan.
|
|
Item 13.
|
Certain Relationships and Related Transactions, and Director Independence.
|
The information required by this item is incorporated by reference from the discussions under the headings "Certain Relationships and Related Transactions" and "Director Independence" in our Definitive Proxy Statement for the
2018
Annual Meeting of Stockholders or in an amendment to this Annual Report on Form 10-K, to be filed with the SEC within 120 days of December 31, 2017.
|
Item 14.
|
Principal Accounting Fees and Services.
|
The information required by this item is incorporated by reference from the discussion under the heading "Proposal 2—Ratification of Appointment of Ernst & Young LLP as Independent Registered Public Accounting Firm" in our Definitive Proxy Statement for the
2018
Annual Meeting of Stockholders or in an amendment to this Annual Report on Form 10-K, to be filed with the SEC within 120 days of December 31, 2017.
124
The following documents are filed as part of this report:
|
1)
|
|
2)
|
Exhibits:
|
|
Exhibit No.
|
|
Description
|
|
3.1
|
|
|
|
3.2
|
|
|
|
3.3
|
|
|
|
4.1
|
|
|
|
4.2
|
|
|
|
4.3
|
|
|
|
4.4
|
|
|
|
10.1.1
|
||
|
10.1.2
|
||
|
10.2
|
|
|
|
10.3
|
|
|
125
|
10.4
|
|
|
|
10.5
|
|
|
|
10.6
|
|
|
|
10.7
|
|
|
|
10.8
|
|
|
|
10.9
|
|
|
|
10.10
|
|
|
|
10.11
|
|
|
|
10.12
|
|
|
|
10.13
|
|
|
|
10.14
|
|
|
|
10.15
|
|
|
|
10.16.1
|
|
|
|
10.16.2
|
|
|
|
10.17
|
|
|
|
10.18
|
|
|
|
10.19
|
|
|
|
10.20
|
|
|
|
10.21
|
|
|
|
10.22
|
|
|
126
|
10.23
|
|
|
|
10.24
|
|
|
|
10.25
|
|
|
|
10.26
|
|
|
|
10.27
|
|
|
|
10.28
|
|
|
|
10.29
|
|
|
|
10.30
|
|
|
|
10.31
|
||
|
10.32
|
||
|
10.33
|
||
|
10.34
|
|
|
|
10.35
|
|
|
|
10.36
|
|
|
|
10.37
|
|
|
|
10.38
|
|
|
|
10.39
|
|
|
|
10.40.1
|
|
|
|
10.40.2
|
|
|
|
10.41.1
|
|
|
127
|
10.41.2
|
|
|
|
10.41.3
|
|
|
|
10.41.4
|
||
|
10.42.1
|
|
|
|
10.42.2
|
|
|
|
10.43
|
|
|
|
10.44
|
|
|
|
10.45
|
|
|
|
10.46
|
||
|
21
|
|
|
|
23
|
|
|
|
31.1
|
|
|
|
31.2
|
|
|
|
32
|
|
|
|
101.INS
|
|
XBRL Instance Document.
|
|
101.SCH
|
|
XBRL Taxonomy Extension Schema Document.
|
|
101.CAL
|
|
XBRL Taxonomy Extension Calculation Linkbase Document.
|
|
101.DEF
|
|
XBRL Taxonomy Extension Definition Linkbase Document.
|
|
101.LAB
|
|
XBRL Taxonomy Extension Label Linkbase Document.
|
|
101.PRE
|
|
XBRL Taxonomy Extension Presentation Linkbase Document.
|
|
*
|
Management Contract or Compensatory Plan
|
|
†
|
Portions of this exhibit have been omitted pursuant to a request for confidential treatment with the SEC.
|
None.
128
SIGNATURES
Pursuant to the requirements of Section 13 or 15(d) of the Securities Exchange Act of 1934, the registrant has duly caused this report to be signed on its behalf by the undersigned, thereunto duly authorized.
|
|
BROOKDALE SENIOR LIVING INC.
|
||
|
|
|
|
|
|
|
By:
|
/s/ T. Andrew Smith
|
|
|
|
Name:
|
T. Andrew Smith
|
|
|
|
Title:
|
President and Chief Executive Officer
|
|
|
|
Date:
|
February 22, 2018
|
|
Pursuant to the requirements of the Securities Exchange Act of 1934, this Report has been signed below by the following persons on behalf of the registrant and in the capacities and on the dates indicated.
|
Signature
|
Title
|
Date
|
||
|
|
|
|
||
|
/s/ T. Andrew Smith
|
President, Chief Executive Officer and Director
|
February 22, 2018
|
||
|
T. Andrew Smith
|
(Principal Executive Officer)
|
|
||
|
|
|
|
||
|
/s/ Lucinda M. Baier
|
Chief Financial Officer
|
February 22, 2018
|
||
|
Lucinda M. Baier
|
(Principal Financial Officer)
|
|
||
|
|
|
|
||
|
/s/ Dawn L. Kussow
|
Senior Vice President and Chief Accounting Officer
|
February 22, 2018
|
||
|
Dawn L. Kussow
|
(Principal Accounting Officer)
|
|
||
|
|
|
|
||
|
/s/ Marcus E. Bromley
|
Director
|
February 22, 2018
|
||
|
Marcus E. Bromley
|
|
|
||
|
|
|
|
||
|
/s/ Frank M. Bumstead
|
Director
|
February 22, 2018
|
||
|
Frank M. Bumstead
|
|
|
||
|
|
|
|
||
|
/s/ Jackie M. Clegg
|
Director
|
February 22, 2018
|
||
|
Jackie M. Clegg
|
|
|
||
|
|
|
|
||
|
/s/ Daniel A. Decker
|
Director
|
February 22, 2018
|
||
|
Daniel A. Decker
|
|
|
||
|
/s/ Jeffrey R. Leeds
|
Director
|
February 22, 2018
|
||
|
Jeffrey R. Leeds
|
|
|
||
|
|
|
|
||
|
/s/ James R. Seward
|
Director
|
February 22, 2018
|
||
|
James R. Seward
|
|
|
||
|
|
|
|
||
|
/s/ Lee S. Wielansky
|
Director
|
February 22, 2018
|
||
|
Lee S. Wielansky
|
|
|
||
129
TABLE OF CONTENTS
Part IItem 1. BusinessItem 1A. Risk FactorsItem 1B. Unresolved Staff CommentsItem 2. PropertiesItem 3. Legal ProceedingsItem 4. Mine Safety DisclosuresPart IIItem 5. Market For Registrant's Common Equity, Related Stockholder Matters and Issuer Purchases Of Equity SecuritiesItem 6. Selected Financial DataItem 7. Management's Discussion and Analysis Of Financial Condition and Results Of OperationsItem 7A. Quantitative and Qualitative Disclosures About Market RiskItem 8. Financial Statements and Supplementary DataItem 9. Changes in and Disagreements with Accountants on Accounting and Financial DisclosureItem 9A. Controls and ProceduresItem 9B. Other InformationPart IIIItem 10. Directors, Executive Officers and Corporate GovernanceItem 11. Executive CompensationItem 12. Security Ownership Of Certain Beneficial Owners and Management and Related Stockholder MattersItem 13. Certain Relationships and Related Transactions, and Director IndependenceItem 14. Principal Accounting Fees and ServicesPart IVItem 15. Exhibits, Financial Statement SchedulesItem 16. Form 10-k Summary