BUCKLE INC
10-Ks and 10-Qs
|
|
|
|
|
|
|
|
|
|
|
|
|
|
|
|
|
|
|
|
|
|
|
|
|
|
|
|
|
|
|
|
|
|
|
|
|
|
|
|
|
|
|
|
|
|
|
|
|
|
|
|
|
|
|
|
|
|
|
UNITED STATES
SECURITIES AND EXCHANGE COMMISSION
WASHINGTON, D.C. 20549
FORM 10-K
x
ANNUAL REPORT PURSUANT TO SECTION 13 OR 15(d) OF
THE SECURITIES EXCHANGE ACT OF 1934
For the Fiscal Year Ended
February 1, 2014
o
TRANSITION REPORT PURSUANT TO SECTION 13 OR 15(d) OF
THE SECURITIES EXCHANGE ACT OF 1934
For the Transition Period from ____________ to ____________
Commission File Number: 001-12951
THE BUCKLE, INC.
(Exact name of Registrant as specified in its charter)
|
Nebraska
|
47-0366193
|
|
(State or other jurisdiction of incorporation or organization)
|
(I.R.S. Employer Identification No.)
|
2407 West 24th Street, Kearney, Nebraska 68845-4915
(Address of principal executive offices) (Zip Code)
Registrant's telephone number, including area code:
(308) 236-8491
Securities registered pursuant to Section 12(b) of the Act:
|
Title of class
|
Name of Each Exchange on Which Registered
|
|
Common Stock, $.01 par value
|
New York Stock Exchange
|
Securities registered pursuant to Section 12(g) of the Act: None
Indicate by check mark if the registrant is a well-known seasoned issuer, as defined in Rule 405 of the Securities Act. Yes
þ
No
o
Indicate by check mark if the registrant is not required to file reports pursuant to Section 13 or 15(d) of the Act. Yes
o
No
þ
Indicate by check mark whether the registrant (1) has filed all reports required to be filed by Section 13 or 15(d) of the Securities Exchange Act of 1934 during the preceding 12 months (or for such shorter period that the Registrant was required to file such reports) and (2) has been subject to such filing requirements for the past 90 days. Yes
þ
No
o
Indicate by check mark whether the registrant has submitted electronically and posted on its corporate Web site, if any, every Interactive Data File required to be submitted and posted pursuant to Rule 405 of Regulation S-T during the preceding 12 months (or for a shorter period that the registrant was required to submit and post such files). Yes
þ
No
o
Indicate by check mark if disclosure of delinquent filers pursuant to Item 405 of Regulation S-K is not contained herein, and will not be contained, to the best of the Registrant’s knowledge, in definitive proxy or information statements incorporated by reference in Part III of this Form 10-K or any amendment to this Form 10-K
o
.
Indicate by check mark whether the registrant is a large accelerated filer, accelerated filer, non-accelerated filer, or smaller reporting company. (See definition of “large accelerated filer,” “accelerated filer,” and “smaller reporting company” in Rule 12b-2 of the Exchange Act). Check one.
þ
Large accelerated filer;
o
Accelerated filer;
o
Non-accelerated filer;
o
Smaller Reporting Company
Indicate by check mark whether the registrant is a shell company (as defined in Rule 12b-2 of the Act). Yes
o
No
þ
The aggregate market value (based on the closing price of the New York Stock Exchange) of the common stock of the registrant held by non-affiliates of the registrant was $1,587,093,025 on August 3, 2013. For purposes of this response, executive officers and directors are deemed to be the affiliates of the Registrant and the holdings by non-affiliates was computed as 27,814,459 shares.
The number of shares outstanding of the Registrant's Common Stock, as of
March 21, 2014
, was
48,374,802
.
DOCUMENTS INCORPORATED BY REFERENCE
Portions of the definitive Proxy Statement for the registrant’s
2014
Annual Meeting of Shareholders to be held May 27, 2014 are incorporated by reference in Part III.
THE BUCKLE, INC.
FORM 10-K
February 1, 2014
Table of Contents
|
|
|
Pages
|
|
Part I
|
||
|
|
|
|
|
Part II
|
||
|
Part III
|
||
|
Part IV
|
||
2
The Buckle, Inc. (the "Company") is a retailer of medium to better-priced casual apparel, footwear, and accessories for fashion-conscious young men and women. As of
February 1, 2014
, the Company operated
450
retail stores in
43
states throughout the continental United States under the names "Buckle" and "The Buckle." The Company markets a wide selection of mostly brand name casual apparel including denims, other casual bottoms, tops, sportswear, outerwear, accessories, and footwear. The Company emphasizes personalized attention to its customers and provides customer services such as free hemming, free gift-wrapping, easy layaways, the Buckle private label credit card, and a frequent shopper program. Most stores are located in regional, high-traffic shopping malls and lifestyle centers, and this is the Company's strategy for future expansion. The majority of the Company's central office functions, including purchasing, pricing, accounting, advertising, and distribution, are controlled from its headquarters and distribution center in Kearney, Nebraska. The Company’s men’s buying team and a portion of its marketing team are located in Overland Park, Kansas.
Incorporated in Nebraska in 1948, the Company commenced business under the name Mills Clothing, Inc., a conventional men's clothing store with only one location. In 1967, a second store, under the trade name Brass Buckle, was purchased. In the early 1970s, the store image changed to that of a jeans store with a wide selection of denims and shirts. The first branch store was opened in Columbus, Nebraska, in 1976. In 1977, the Company began selling young women's apparel and opened its first mall store. The Company changed its corporate name to The Buckle, Inc. on April 23, 1991. The Company has experienced significant growth over the past ten years, growing from 316 stores at the start of fiscal 2004 to
450
stores at the end of fiscal
2013
. All references herein to fiscal
2013
refer to the 52-week period ended
February 1, 2014
. Fiscal
2012
refers to the 53-week period ended
February 2, 2013
and fiscal
2011
refers to the 52-week period ended
January 28, 2012
. All references herein to the “Company”, “Buckle”, “we”, “us”, or similar terms refer to The Buckle, Inc. and its subsidiary.
The Company's principal executive offices are located at 2407 West 24th Street, Kearney, Nebraska 68845. The Company's telephone number is (308) 236-8491. The Company publishes its corporate web site at
www.buckle.com
.
Available Information
The Company’s annual reports on Form 10-K, along with all other reports and amendments filed with or furnished to the Securities and Exchange Commission, are publicly available free of charge on the Investor Information section of the Company’s website at
www.buckle.com
as soon as reasonably practicable after the Company files such materials with, or furnishes them to, the Securities and Exchange Commission. The Company’s corporate governance policies, ethics code, and Board of Directors’ committee charters are also posted within this section of the website. The information on the Company’s website is not part of this or any other report The Buckle, Inc. files with, or furnishes to, the Securities and Exchange Commission.
Marketing and Merchandising
The Company's marketing and merchandising strategy is designed to create customer loyalty by offering a wide selection of key brand name and private label merchandise and providing a broad range of value-added services. The Company believes it provides a unique specialty apparel store experience with merchandise designed to appeal to the fashion-conscious 15 to 30-year old. The merchandise mix includes denims, casual bottoms, tops, sportswear, outerwear, accessories, and footwear. Denim is a significant contributor to total sales (
45.3%
of fiscal
2013
net sales) and is a key to the Company's merchandising strategy. The Company believes it attracts customers with its wide selection of branded and private label denim and a wide variety of fits, finishes, and styles. Tops are also significant contributors to total sales (
30.2%
of fiscal
2013
net sales). The Company strives to provide a continually changing selection of the latest casual fashions.
3
The percentage of net sales over the past three fiscal years of the Company's major product lines are set forth in the following table:
|
Fiscal Years Ended
|
||||||||
|
Merchandise Group
|
February 1,
2014 |
February 2,
2013 |
January 28,
2012 |
|||||
|
Denims
|
45.3
|
%
|
46.4
|
%
|
46.6
|
%
|
||
|
Tops (including sweaters)
|
30.2
|
|
30.9
|
|
32.1
|
|
||
|
Accessories
|
8.5
|
|
8.4
|
|
8.2
|
|
||
|
Sportswear/fashions
|
6.0
|
|
5.7
|
|
5.1
|
|
||
|
Footwear
|
5.8
|
|
5.3
|
|
4.9
|
|
||
|
Outerwear
|
2.3
|
|
2.2
|
|
2.3
|
|
||
|
Casual bottoms
|
0.9
|
|
0.8
|
|
0.6
|
|
||
|
Other
|
1.0
|
|
0.3
|
|
0.2
|
|
||
|
100.0
|
%
|
100.0
|
%
|
100.0
|
%
|
|||
Brand name merchandise accounted for approximately 66% of the Company's sales during fiscal
2013
. The remaining balance is comprised of private label merchandise. The Company's merchandisers continually work with manufacturers and vendors to produce brand name merchandise that they believe is exclusive in terms of color, style, and fit. While the brands offered by the Company change to meet current customer preferences, the Company currently offers denims from brands such as Big Star, Big Star Vintage, Miss Me, Rock Revival, Silver Jeans, and Buffalo Jeans. Other key brands include Hurley, Billabong, Roxy, Affliction, American Fighter, Sinful, Obey, Roar, RVCA, Salvage, Society, Fox, Oakley, Bench, Corral, Reef, and Fossil. The Company expects that brand name merchandise will continue to constitute the majority of sales.
Management believes the Company provides a unique store environment by maintaining a high level of personalized service and by offering a wide selection of fashionable, quality merchandise. The Company believes it is essential to create an enjoyable shopping environment and, in order to fulfill this mission, it employs highly motivated employees who provide personal attention to customers. Each salesperson is educated to help create a complete look for the customer by helping them find the best fits and showing merchandise as coordinating outfits. The Company also incorporates specialized services such as free hemming, free gift wrapping, layaways, a frequent shopper card, the Buckle private label credit card, and a special order system that allows stores to obtain specifically requested merchandise from other Company stores or from the Company's online order fulfillment center. Customers are encouraged to use the Company's layaway plan, which allows customers to make a partial payment on merchandise that is then held by the store until the balance is paid. For the past three fiscal years, an average of between approximately 4% to 5% of net sales have been made on a layaway basis, which is recorded as revenue upon delivery of the merchandise to the customer.
Merchandising and pricing decisions are made centrally; however, the Company's distribution system allows for variation in the mix of merchandise distributed to each store. This allows individual store inventories to be tailored to reflect differences in customer buying patterns at various locations. In addition, to assure a continually fresh look in its stores, the Company ships new merchandise daily to most stores. The Company also has a transfer program that shifts certain merchandise to locations where it is selling best. This distribution and transfer system helps to maintain customer satisfaction by providing in-stock popular items and reducing the need to markdown slow-moving merchandise at a particular location. The Company believes the reduced markdowns justify the incremental distribution costs associated with the transfer system. The Company does not hold store-wide off-price sales at anytime.
The Company continually evaluates its store design as part of the overall shopping experience and feels the fiscal 2002 design continues to be well received by both guests and developers. This store design contains warm wood fixtures and floors, real brick finishes, and an appealing ceiling and lighting layout that creates a comfortable environment for the guest to shop. The Company has been able to modify the store design for specialized venues including lifestyle centers and larger mall fronts. The signature Buckle-B icon and red color are used throughout the store on fixtures, graphic images, and print materials to reinforce the brand identity. To enhance selling and product presentation, the Company continues to update the fixtures in its stores. New tables and fixtures have been added to the Company’s signature store design in each of the last several fiscal years. The new tables and fixtures were also rolled out to select existing stores to update their looks as well.
4
Marketing and Advertising
In fiscal
2013
, the Company spent $11.1 million, or 1.0% of net sales, on seasonal marketing campaigns, advertising, promotions, online marketing, and in-store point-of-sale materials. Seasonal image and promotional signage is presented in store window displays and on merchandising presentations throughout the store to complement the product and reinforce the brand's image. Promotions such as sweepstakes, gift with purchase offers, and special events are offered to enhance the guest’s shopping experience. Seasonal image guides, featuring current fashion trends and product selection, are distributed in the stores, at special events, and in new markets. Buckle partners with key merchandise vendors on joint advertising and promotional opportunities that expand the marketing reach and position Buckle as the destination store for these specialty branded fashions.
The Company also offers programs to build and strengthen its relationship with loyal guests. Two different programs work to achieve these goals. The Company continues to support its frequent shopper program (the Buckle Primo Card), a rewards program designed to build customer loyalty that is available to all guests. In addition, private label credit card guests receive even more benefits when they use their Buckle Card. The continued growth of the B-Rewards incentive program rewards loyal cardholders with a B-Rewards gift card at the end of each rewards period and invites them back into the store. The Company extends other exclusive benefits to active Buckle cardholders such as special bonus B-Rewards periods, targeted mailings, and exclusive gift with purchase offers. The Company also provides a special Buckle Black cardholder program for its most loyal Buckle Card guests. These accountholders must purchase at least $500 using their regular account in a 12 month period to qualify for the Buckle Black card. These guests receive an exclusively designed card and enjoy additional benefits including free ground shipping on special orders and online purchases. The Buckle Card marketing program is partially funded by Comenity Bank, a third-party bank that owns the Buckle Card accounts
.
The Company publishes a corporate web site at www.buckle.com. The Company’s web site serves as a second retail touch-point for cross-channel marketing, reaching a growing online audience. Buckle.com is an e-Commerce enabled channel with an interactive, entertaining, informative, and brand building environment where guests can shop, enter sweepstakes, fill out a wish list, find out about career opportunities, and read the Company’s latest financial news. The Company maintains an opt-in email database. National email campaigns are sent bi-monthly and targeted weekly messages are sent notifying guests of the latest store promotions and product offerings. Search engine and affiliate marketing programs are managed to increase online and in-store traffic as well as conversion rates. Buckle’s online store was launched April 26, 1999 as a marketing tool, to extend the Company’s brand beyond the physical locations. The Company launched a redesigned Buckle.com on August 31, 2011, which featured enhanced screen resolution, the addition of product ratings and reviews, and improved site navigation and performance, and has continued to make smaller updates and enhancements since that time to improve both the performance of the site and the overall shopping experience.
Store Operations
The Company has an Executive Vice President of Stores, a Vice President of Sales, 18 district managers, and 69 area managers. Certain district managers and all area managers also serve as manager of their home base store. In general, each store has one manager, one or two assistant managers, one to three additional full-time salespeople, and up to 20 part-time salespeople. Most stores have peak levels of staff during the back-to-school and Christmas seasons. Almost every location also employs an alterations person.
The Company places great importance on educating quality personnel. In addition to sharing career opportunities with current Buckle employees, the Company also recruits interns and management trainees from college campuses. A majority of the Company’s store managers, all of its area and district managers, and most of its executive management team are former salespeople, including President and CEO, Dennis H. Nelson, and Chairman, Daniel J. Hirschfeld. Recognizing talent and promoting managers from within allows the Company to build a strong foundation for management.
Store managers receive compensation in the form of a base salary and incentive bonuses. District and area managers also receive added incentives based upon the performance of stores in their district/area. Store managers perform sales training for new employees at the store level.
5
The Company has established a comprehensive program stressing the prevention and control of shrinkage losses. Steps taken to reduce shrinkage include monitoring cash refunds, voids, inappropriate discounts, employee sales, and returns-to-vendor. The Company also has electronic article surveillance systems in all of the Company’s stores as well as surveillance camera systems in approximately 99% of the stores. As a result, the Company achieved a merchandise shrinkage rate of 0.5% of net sales in fiscal
2013
, 0.4% of net sales in fiscal
2012
, and 0.4% of net sales fiscal
2011
.
The average store is approximately 5,000 square feet (of which the Company estimates an average of approximately 80% is selling space), and stores range in size from 2,900 square feet to 8,475 square feet.
Purchasing and Distribution
The Company has an experienced buying team. The buying team is led by the Senior Vice President of Women’s Merchandising and Senior Vice President of Men’s Merchandising, who have over 67 years of combined experience with the Company. The experience and leadership within the buying team contributes significantly to the Company’s success by enabling the buying team to react quickly to changes in fashion and by providing extensive knowledge of sources for both branded and private label goods.
The Company purchases products from manufacturers within the United States as well as from agents who source goods from foreign manufacturers. The Company's merchandising team shops and monitors fashion to stay abreast of the latest trends. The Company continually monitors styles, quality, and delivery schedules. The Company has not experienced any material difficulties with merchandise manufactured in foreign countries. The Company does not have long-term or exclusive contracts with any brand name manufacturer, private label manufacturer, or supplier. The Company plans its private label production with private label vendors three to six months in advance of product delivery. The Company requires its vendors to sign and adhere to its Code of Conduct and Standards of Engagement, which addresses adherence to legal requirements regarding employment practices and health, safety, and environmental regulations.
In fiscal
2013
, Miss Me/Rock Revival accounted for 25.3% of the Company’s net sales and Axis Denim (which produces private label denim for the Company) accounted for 12.5% of net sales. No other vendor accounted for more than 10% of the Company’s net sales. Other current significant vendors include Big Star, Big Star Vintage, Silver Jeans, Buffalo Jeans, Hurley, Billabong, Roxy, Affliction, American Fighter, Sinful, Obey, Roar, RVCA, Salvage, Society, Fox, Oakley, Bench, Corral, Reef, and Fossil. The Company continually strives to offer brands that are currently popular with its customers and, therefore, the Company's suppliers and purchases from specific vendors may vary significantly from year to year.
Buckle stores generally carry the same merchandise, with quantity and seasonal variations based upon historical sales data, climate, and perceived local customer demand. The Company uses a centralized receiving and distribution center located in Kearney, Nebraska. Merchandise is received daily in Kearney where it is sorted, tagged with bar-coded tickets (unless the vendor UPC code is used or the merchandise is pre-ticketed), and packaged for distribution to individual stores primarily via United Parcel Service. The Company's goal is to ship the majority of its merchandise out to the stores within one to two business days of receipt. This system allows stores to receive new merchandise almost daily, creating excitement within the store and providing customers with a reason to shop often.
The Company has developed an effective computerized system for tracking merchandise from the time it is checked in at the Company's distribution center until it arrives at the stores and is sold to a customer. The system's function is to ensure that store shipments are delivered accurately and promptly, to account for inventory, and to assist in allocating merchandise among stores. Management can track, on a daily basis, which merchandise is selling at specific locations and direct transfers of merchandise from one store to another as necessary. This allows stores to carry a reduced inventory while at the same time satisfying customer demand.
6
To reduce inter-store shipping costs and provide timely restocking of in-season merchandise, the Company warehouses a portion of initial shipments for later distribution. Sales reports are then used to replenish, on a basis of one to three times each week, those stores that are experiencing the greatest success selling specific styles, colors, and sizes of merchandise. This system is also designed to prevent an over-crowded look in the stores at the beginning of a season.
During fiscal 2010, the Company completed construction of a new 240,000 square foot distribution center in Kearney, Nebraska. The Company transitioned to the new distribution center in September 2010 and the new facility is now the Company’s only operating store distribution center. The Company also owns a facility in Kearney, Nebraska that serves as its corporate headquarters and houses its online fulfillment and customer service center.
Store Locations and Expansion Strategies
As of March 14, 2014, the Company operated 450 stores in 43 states. The existing stores are in 4 downtown locations, 9 strip centers, 49 lifestyle centers, and 388 shopping malls. The Company anticipates opening approximately 17 new stores in fiscal
2014
. For fiscal
2014
, 12 of the new stores are expected to be located in higher traffic shopping malls and 5 new stores are expected to be located in lifestyle centers. The following table lists the location of existing stores as of March 14, 2014:
|
Location of Stores
|
||||||||||
|
State
|
Number of Stores
|
State
|
Number of Stores
|
State
|
Number of Stores
|
|||||
|
Alabama
|
8
|
Massachusetts
|
1
|
Oregon
|
6
|
|||||
|
Arizona
|
12
|
Michigan
|
19
|
Pennsylvania
|
10
|
|||||
|
Arkansas
|
6
|
Minnesota
|
12
|
Rhode Island
|
1
|
|||||
|
California
|
18
|
Mississippi
|
5
|
South Carolina
|
3
|
|||||
|
Colorado
|
13
|
Missouri
|
15
|
South Dakota
|
3
|
|||||
|
Florida
|
23
|
Montana
|
5
|
Tennessee
|
12
|
|||||
|
Georgia
|
9
|
Nebraska
|
13
|
Texas
|
50
|
|||||
|
Idaho
|
6
|
Nevada
|
4
|
Utah
|
10
|
|||||
|
Illinois
|
18
|
New Jersey
|
2
|
Virginia
|
6
|
|||||
|
Indiana
|
14
|
New Mexico
|
5
|
Washington
|
14
|
|||||
|
Iowa
|
17
|
New York
|
4
|
West Virginia
|
5
|
|||||
|
Kansas
|
17
|
North Carolina
|
11
|
Wisconsin
|
13
|
|||||
|
Kentucky
|
6
|
North Dakota
|
4
|
Wyoming
|
2
|
|||||
|
Louisiana
|
10
|
Ohio
|
22
|
|||||||
|
Maryland
|
3
|
Oklahoma
|
13
|
Total
|
450
|
|||||
Buckle has grown significantly over the past ten years, with the number of stores increasing from 316 at the beginning of fiscal 2004 to
450
at the end of fiscal
2013
. The Company's plan is to continue expansion by developing the geographic regions it currently serves and by expanding into contiguous markets. The Company intends to open new stores only when management believes there is a reasonable expectation of satisfactory results.
7
The following table sets forth information regarding store openings and closings from the beginning of fiscal 2004 through the end of fiscal
2013
:
|
Total Number of Stores Per Year
|
||||||||
|
Fiscal
Year
|
Open at start
of year
|
Opened in Current Year
|
Closed in Current Year
|
Open at end
of year
|
||||
|
2004
|
316
|
13
|
2
|
327
|
||||
|
2005
|
327
|
15
|
4
|
338
|
||||
|
2006
|
338
|
17
|
5
|
350
|
||||
|
2007
|
350
|
20
|
2
|
368
|
||||
|
2008
|
368
|
21
|
2
|
387
|
||||
|
2009
|
387
|
20
|
6
|
401
|
||||
|
2010
|
401
|
21
|
2
|
420
|
||||
|
2011
|
420
|
13
|
2
|
431
|
||||
|
2012
|
431
|
10
|
1
|
440
|
||||
|
2013
|
440
|
13
|
3
|
450
|
||||
The Company's criteria used when considering a particular location for expansion include:
|
•
|
Market area, including proximity to existing markets to capitalize on name recognition;
|
|
•
|
Trade area population (number, average age, and college population);
|
|
•
|
Economic vitality of market area;
|
|
•
|
Mall location, anchor tenants, tenant mix, and average sales per square foot;
|
|
•
|
Available location within a mall, square footage, storefront width, and facility of using the current store design;
|
|
•
|
Availability of experienced management personnel for the market;
|
|
•
|
Cost of rent, including minimum rent, common area, and extra charges;
|
|
•
|
Estimated construction costs, including landlord charge backs and tenant allowances.
|
The Company generally seeks sites of 4,250 to 5,000 square feet for its stores. The projected cost of opening a store is approximately $0.9 million, including construction costs of approximately $0.7 million (prior to any construction allowance received) and inventory costs of approximately $0.2 million, net of accounts payable.
The Company anticipates opening approximately 17 new stores during fiscal
2014
and completing approximately 17 full remodels. The construction costs for a full remodel are comparable to those of a new store. The Company also plans to complete several smaller store remodeling projects during fiscal
2014
. The Company anticipates capital spending of approximately $48.0 to $53.0 million during fiscal
2014
, which includes primarily new store and store remodeling projects, IT investments, and the construction of a new office building as a part of the Company's home office campus in Kearney, Nebraska.
The Company plans to expand in
2014
by opening stores in existing markets and by opening a store in Anchorage, Alaska (its first in the state of Alaska). The Company believes that, given the time required for training personnel, staffing a store, and developing adequate district and area managers, its current management infrastructure is sufficient to support its currently planned rate of growth.
The Company's ability to expand in the future will depend, in part, on general business conditions, the ability to find suitable malls with acceptable sites on satisfactory terms, the availability of financing, and the readiness of trained store managers. There can be no assurance that the Company's expansion plans will be fulfilled in whole or in part, or that leases under negotiation for planned new sites will be obtained on terms favorable to the Company.
8
Management Information Systems
The Company's management information systems ("MIS") and electronic data processing systems ("EDP") consist of a full range of retail, financial, and merchandising systems, including purchasing, inventory distribution and control, sales reporting, accounts payable, and merchandise management.
The system includes PC based
point-of-sale ("POS") registers in each store. The registers trickle transactions to a central server using a virtual private network for collection of comprehensive data, including complete item-level sales information and employee time clocking. The transactions are then swept into the central computer (IBM iSeries). Price updates are sent daily for the price lookup (“PLU”) file maintained within the POS registers.
Each weekday morning, the Company initiates an electronic "sweep" of the individual store bank accounts to the Company's primary concentration account. This allows the Company to meet its obligations with a minimum of borrowing and invest cash on a timely basis.
Management monitors the performance of each of its stores on a continual basis. Daily information is used to evaluate inventory, determine markdowns, analyze profitability, and assist management in the scheduling and compensation of employees.
The PLU system allows management to control merchandise pricing centrally, permitting faster and more accurate processing of sales at the store and the monitoring of specific inventory items to confirm that centralized pricing decisions are carried out in each of the stores. Management is able to direct all price changes, including promotional, clearance, and markdowns on a central basis and estimate the financial impact of such changes.
The virtual private network for communication with the stores also supports the Company’s intranet site. The intranet allows stores to view various types of information from the corporate office. Stores also have access to a variety of tools such as a product search with pictures, product availability, special order functions, inventory management, scheduling, performance tracking, printable forms, links to transmit various requests and information to the corporate office, training videos, email, and information/guidelines from each of the departments at the corporate office. The Company’s network is also structured so that it can support additional functionality such as digital video monitoring and digital music content programming at each store location.
The Company is committed to the ongoing review of its MIS and EDP systems to maintain productive, timely information and effective controls. This review includes testing of new products and systems to assure that the Company is aware of technological developments. Most important, continual feedback is sought from every level of the Company to assure that information provided is pertinent to all aspects of the Company's operations.
Employees
As of
February 1, 2014
, the Company had approximately 8,800 employees - approximately 2,400 of whom were full-time. The Company has an experienced management team and substantially all of the management team, from store managers through senior management, began work for the Company on the sales floor. The Company experiences high turnover of store and distribution center employees, primarily due to the number of part-time employees. However, the Company has not experienced significant difficulty in hiring qualified personnel. Of the total employees, approximately 680 are employed at the corporate headquarters and in the distribution center. None of the Company's employees are represented by a union. Management believes that employee relations are good.
The Company provides medical, dental, vision, and life insurance, short-term and long-term disability plans, as well as a 401(k) and a section 125 cafeteria plan for eligible employees. An employee must be at least 20 years of age and work a minimum of 1,000 hours during the plan year to be eligible for the 401(k) plan. To be eligible for the plans, other than the 401(k) plan, an employee must have worked for the Company for 98 days or more, and his or her normal workweek must be 35 hours or more. As of
February 1, 2014
, 1,618 employees participated in the medical plan, 1,620 in the dental plan, 1,171 in the vision plan, 2,459 in the life insurance plan, 540 in the supplemental life insurance plan, 837 in the long-term disability plan, 489 in the short-term disability plan, and 1,776 in the cafeteria plan. With respect to the medical, dental, and life insurance plans, the Company pays 80% of the employee's expected premium cost plus 40% of the expected cost of dependent coverage under the health plan. In addition, all employees receive discounts on Company merchandise.
9
Competition
The men's and women's apparel industries are highly competitive with fashion, selection, quality, price, location, store environment, and service being the principal competitive factors. While the Company believes it is able to compete favorably with other merchandisers, including department stores and specialty retailers, with respect to each of these factors, the Company believes it competes mainly on the basis of customer service and merchandise selection.
In the men's merchandise area, the Company competes primarily with specialty retailers such as Abercrombie & Fitch, American Eagle Outfitters, Gap, Hollister, Pacific Sunwear, Tilly’s, and Zumiez. The men's market also competes with certain department stores, such as Dillards, Macy’s, Bon-Ton stores, Nordstrom, and certain local or regional department stores and small specialty stores, as well as with mail order and internet retailers.
In the women's merchandise area, the Company competes primarily with specialty retailers such as Abercrombie & Fitch, American Eagle Outfitters, Charlotte Russe, Express, Forever 21, Gap, Hollister, H&M, Maurices, Pacific Sunwear, Tilly's, Vanity, and Wet Seal. The women's market also competes with department stores, such as Dillards, Macy’s, Bon-Ton stores, Nordstrom, and certain local or regional department stores and small specialty stores, as well as with mail order and internet retailers.
Many of the Company's competitors are considerably larger and have substantially greater financial, marketing, and other resources than the Company, and there is no assurance that the Company will be able to compete successfully with them in the future. Furthermore, while the Company believes it competes effectively for favorable site locations and lease terms, competition for prime locations within a mall is intense.
Trademarks
“BUCKLE”, “THE BUCKLE”, “BUCKLE BLACK”, “BKE”, “BKE BOUTIQUE”, “BKE SOLE”, “DAYTRIP”, “RECLAIM”, “B BELIEVES”, “GIMMICKS”, “BEST OF THE BLUES”, "BKE RED", "BEST BRANDS", "FAVORITE JEANS", "BKE SPORT", "BKE LOUNGE", and “B” icon are federally registered trademarks of the Company. The Company believes the strength of its trademarks is of considerable value to its business, and its trademarks are important to its marketing efforts. The Company intends to protect and promote its trademarks as management deems appropriate.
Executive Officers of the Company
The Executive Officers of the Company are listed below, together with brief accounts of their experience and certain other information.
Daniel J. Hirschfeld, age 72.
Mr. Hirschfeld is Chairman of the Board of the Company. He has served as Chairman of the Board since April 19, 1991. Prior to that time, Mr. Hirschfeld served as President and Chief Executive Officer. Mr. Hirschfeld has been involved in all aspects of the Company's business, including the development of the Company's management information systems.
Dennis H. Nelson, age 64.
Mr. Nelson is President and Chief Executive Officer and a Director of the Company. He has held the titles of President and Director since April 19, 1991. Mr. Nelson was elected Chief Executive Officer on March 17, 1997. Mr. Nelson began his career with the Company in 1970 as a part-time salesman while he was attending Kearney State College (now the University of Nebraska - Kearney). While attending college, he became involved in merchandising and sales supervision for the Company. Upon graduation from college in 1973, Mr. Nelson became a full-time employee of the Company and he has worked in all phases of the Company's operations since that date. Prior to his election as President and Chief Operating Officer on April 19, 1991, Mr. Nelson performed all of the functions normally associated with those positions.
Karen B. Rhoads, age 55.
Ms. Rhoads is Senior Vice President of Finance and Chief Financial Officer and a Director of the Company. Ms. Rhoads was elected a Director on April 19, 1991. She was appointed Senior Vice President of Finance and Chief Financial Officer on March 6, 2014, after having served as Vice President of Finance and Chief Financial Officer since 1991. She worked in the corporate office while attending Kearney State College (now the University of Nebraska - Kearney) and later worked part-time on the sales floor. Ms. Rhoads practiced as a CPA for 6 1/2 years, during which time she began working on tax and accounting matters for the Company as a client. She has been employed with Buckle since November 1987.
10
Brett P. Milkie, age 54
. Mr. Milkie is Senior Vice President of Leasing. He was appointed to this position on March 6, 2014, after having served as Vice President of Leasing since May 1996. Mr. Milkie was a leasing agent for a national retail mall developer for 6 years prior to joining the Company in January 1992 as Director of Leasing.
Kari G. Smith, age 50
. Ms. Smith is Executive Vice President of Stores. She was appointed to this position on February 13, 2014, after having served as Vice President of Sales since May 2001. Ms. Smith joined the Company in May 1978 as a part-time salesperson. Later she became store manager in Great Bend, Kansas and then began working with other stores as an area manager. Ms. Smith has continued to develop her involvement with the sales management team, helping with manager meetings and the development of new store managers, as well as providing support for store managers, area managers, and district managers.
Patricia K. Whisler, age 57
. Ms. Whisler is Senior Vice President of Women’s Merchandising. She was appointed to this position on March 6, 2014, after having served as Vice President of Women's Merchandising since May 2001. Ms. Whisler joined the Company in February 1976 as a part-time salesperson and later became manager of a Buckle store before returning to the corporate office in 1983 to work as part of the growing merchandising team.
Robert M. Carlberg, age 50.
Mr. Carlberg is Senior Vice President of Men’s Merchandising. He was appointed to this position on March 6, 2014, after having served as Vice President of Men's Merchandising since December 2006. Mr. Carlberg started with the Company as a salesperson and also worked as a store manager and as an area and district leader while being involved and traveling with the men’s merchandising team. He has been full-time with the merchandising team since January 2001.
Kyle L. Hanson, age 49
. Ms. Hanson is Vice President, General Counsel, and Corporate Secretary. She was appointed to this position on March 6, 2014, after having served as General Counsel and Corporate Secretary since May 2001. Ms. Hanson joined the Company in May 1998 as General Counsel. She also worked for the Company as a part-time salesperson while attending Kearney State College (now the University of Nebraska - Kearney). Ms. Hanson was previously First Vice President and Trial Attorney for Mutual of Omaha Companies for 2 years and an attorney with the Kutak Rock law firm in Omaha from 1990 to 1996.
Michelle Hoffman, age 52.
Ms. Hoffman is Vice President of Sales. She was appointed to this position on March 6, 2014. Ms. Hoffman has been employed by the Company since 1979 and has served in various roles of increasing responsibility on the sales team since that time; including salesperson, Store Manager, District Manager, and most recently Regional Manager since 2008.
Thomas B. Heacock, age 36
. Mr. Heacock is Treasurer and Corporate Controller. He has held this position since March 21, 2011. Mr. Heacock has been employed by the Company since October 2003 and has served as Corporate Controller since February 2007. Prior to joining the Company, he was employed by Ernst & Young, LLP. Mr. Heacock is the son-in-law of Dennis H. Nelson, who serves as President and Chief Executive Officer and a Director of The Buckle, Inc.
Cautionary Statement Pursuant to the Private Securities Litigation Reform Act of 1995 and Risk Factors
Certain statements herein, including anticipated store openings, trends in or expectations regarding the Company’s revenue and net earnings growth, comparable store sales growth, cash flow requirements, and capital expenditures, all constitute “forward-looking statements” within the meaning of the Private Securities Litigation Reform Act of 1995. Such statements are based on currently available operating, financial, and competitive information and are subject to various risks and uncertainties. Actual future results and trends may differ materially depending on a variety of factors, including, but not limited to, changes in product mix, changes in fashion trends and/or pricing, competitive factors, general economic conditions, economic conditions in the retail apparel industry, successful execution of internal performance and expansion plans, and other risks detailed herein and in The Buckle, Inc.’s other filings with the Securities and Exchange Commission.
A forward-looking statement is neither a prediction nor a guarantee of future events or circumstances, and those future events or circumstances may not occur. Users should not place undue reliance on the forward-looking statements, which are accurate only as of the date of this report. The Company is under no obligation to update or revise any forward-looking statements, whether as a result of new information, future events, or otherwise. In management’s judgment, the following are material risk factors:
11
Dependence on Merchandising/Fashion Sensitivity
. The Company’s success is largely dependent upon its ability to gauge the fashion tastes of its customers and to provide merchandise that satisfies customer demand in a timely manner. The Company’s failure to anticipate, identify, or react appropriately and timely to the changes in fashion trends would reduce the Company’s net sales and profitability. Misjudgments or unanticipated fashion changes could have a negative impact on the Company’s image with its customers, which would also reduce the Company’s net sales and profitability.
Dependence on Private Label Merchandise
. Sales from private label merchandise accounted for approximately 34% of net sales for both fiscal
2013
and fiscal
2012
. The Company may increase or decrease the percentage of net sales from private label merchandise in the future. The Company’s private label products generally earn a higher margin than branded products. Thus, reductions in the private label mix would decrease the Company’s merchandise margins and, as a result, reduce net earnings.
Fluctuations in Comparable Store Net Sales Results
. The Company’s comparable store net sales results have fluctuated in the past and are expected to continue to fluctuate in the future. A variety of factors affect comparable store sales results, including changes in fashion trends, changes in the Company’s merchandise mix, calendar shifts of holiday periods, actions by competitors, weather conditions, and general economic conditions. As a result of these or other factors, the Company’s future comparable store sales could decrease, reducing overall net sales and profitability.
Ability to Continue Expansion and Management of Growth
. The Company’s continued growth depends on its ability to open and operate stores on a profitable basis and management’s ability to manage planned expansion. During fiscal
2014
, the Company plans to open 17 new stores. This expansion is dependent upon factors such as the ability to locate and obtain favorable store sites, negotiate acceptable lease terms, obtain necessary merchandise, and hire and train qualified management and other employees. There may be factors outside of the Company’s control that affect the ability to expand, including general economic conditions. There is no assurance that the Company will be able to achieve its planned expansion or that such expansion will be profitable. If the Company fails to manage its store growth, there would be less growth in the Company’s net sales from new stores and less growth in profitability. If the Company opens unprofitable store locations, there could be a reduction in net earnings, even with the resulting growth in the Company’s net sales.
Reliance on Key Personnel
. The continued success of the Company is dependent to a significant degree on the continued service of key personnel, including senior management. The loss of a member of senior management could create additional expense in covering their position as well as cause a reduction in net sales, thus reducing net earnings. The Company’s success in the future will also be dependent upon the Company’s ability to attract and retain qualified personnel. The Company’s failure to attract and retain qualified personnel could reduce the number of new stores the Company could open in a year which would cause net sales to decline, could create additional operating expenses, and could reduce overall profitability for the Company.
Dependence on a Single Distribution Facility and Third-Party Carriers
. The distribution function for all of the Company’s stores is handled from a single facility in Kearney, Nebraska. Any significant interruption in the operation of the distribution facility due to natural disasters, system failures, or other unforeseen causes would impede the distribution of merchandise to the stores, causing a decline in store inventory, a reduction in store sales, and a reduction in Company profitability. Interruptions in service by common carriers could also delay shipment of goods to Company store locations. Additionally, there can be no assurance that the current facilities will be adequate to support the Company’s future growth.
Reliance on Foreign Sources of Production.
The Company purchases a portion of its private label merchandise through sourcing agents in foreign markets. In addition, some of the Company’s domestic vendors manufacture goods overseas. The Company does not have any long-term merchandise supply contracts and its imports are subject to existing or potential duties, tariffs, and quotas. The Company faces a variety of risks associated with doing business overseas including competition for facilities and quotas, political instability, possible new legislation relating to imports that could limit the quantity of merchandise that may be imported, imposition of duties, taxes, and other charges on imports, and local business practice and political issues which may result in adverse publicity. The Company’s inability to rely on foreign sources of production due to these or other causes could reduce the amount of inventory the Company is able to purchase, hold up the timing on the receipt of new merchandise, and reduce merchandise margins if comparable inventory is purchased from branded sources. Any or all of these changes would cause a decrease in the Company’s net sales and net earnings.
12
Dependence upon Maintaining Sales and Profit Growth in the Highly Competitive Retail Apparel Industry
. The specialty retail industry is highly competitive. The Company competes primarily on the basis of fashion, selection, quality, price, location, service, and store environment. The Company faces a variety of competitive challenges, including:
•
Anticipating and responding timely to changing customer demands and preferences;
|
•
|
Effectively marketing both branded and private label merchandise to consumers in several diverse market segments and maintaining favorable brand recognition;
|
|
•
|
Providing unique, high-quality merchandise in styles, colors, and sizes that appeal to consumers;
|
•
Sourcing merchandise efficiently;
•
Competitively pricing merchandise and creating customer perception of value;
|
•
|
Monitoring increased labor costs, including increases in health care benefits and worker’s compensation and unemployment insurance costs.
|
There is no assurance that the Company will be able to compete successfully in the future.
Reliance on Consumer Spending Trends
. The continued success of the Company depends, in part, upon numerous factors that impact the levels of individual disposable income and thus, consumer spending. Factors include the political environment, economic conditions, employment, consumer debt, interest rates, inflation, and consumer confidence. A decline in consumer spending, for any reason, could have an adverse effect on the Company’s net sales, gross profits, and results from operations.
Modifications and/or Upgrades to Information Technology Systems May Disrupt Operations
. The Company relies upon its various information systems to manage its operations and regularly evaluates its information technology in order for management to identify investment opportunities for maintaining, modifying, upgrading, or replacing these systems. There are inherent risks associated with replacing or changing these systems. Any delays, errors in capturing data, or difficulties in transitioning to these or other new systems, or in integrating these systems with the Company’s current systems, or any other disruptions affecting the Company’s information systems, could have a material adverse impact on the Company’s business.
Reliance on increasingly complex information systems for management of its distribution, sales, and other functions
. If the Company’s information systems fail to perform these functions adequately or if the Company experiences an interruption in their operation, including a breach in cyber security, its business and results of operations could suffer. All of the Company’s major operations, including distribution, sales, and accounting, are dependent upon the Company’s complex information systems. The Company’s information systems are vulnerable to damage or interruption from:
|
•
|
Earthquake, fire, flood, tornado, and other natural disasters;
|
|
•
|
Power loss, computer systems failure, Internet and telecommunications or data network failure;
|
|
•
|
Hackers, computer viruses, software bugs, or glitches.
|
Any damage or significant disruption in the operation of such systems, or the failure of the Company’s information systems to perform as expected, could disrupt the Company’s business, result in decreased sales, increased overhead costs, excess inventory, or product shortages and otherwise adversely affect the Company’s operations, financial performance, and financial condition.
Unauthorized access to, or accidental disclosure of, consumer personally-identifiable information that the Company collects may result in significant expenses and negatively impact our reputation and business.
There is growing concern over the security of personal information transmitted over the Internet, consumer identity theft, and user privacy. While the Company has implemented security measures, the Company’s computer systems may be susceptible to electronic or physical computer break-ins, viruses, and other disruptions and security breaches. Any perceived or actual unauthorized disclosure of personally-identifiable information regarding visitors to the Company’s websites or otherwise, whether through a breach of the Company’s network by an unauthorized party, employee theft, misuse, or error, or otherwise, could harm the Company’s reputation, impair the Company’s ability to attract and retain customers, or subject the Company to claims or litigation arising from damages suffered by consumers, and adversely affect the Company’s operations, financial performance, and financial condition.
13
Market/Liquidity Risk Related to the Company’s Investments.
In prior years, the Company invested a portion of its investments in auction-rate securities (“ARS”), including auction-rate preferred securities (“ARPS”) that were converted to preferred stock. As of
February 1, 2014
and
February 2, 2013
,
$9.6 million
and
$10.9 million
, respectively, of investments were in ARS and preferred securities. ARS have a long-term stated maturity, but are reset through a “dutch auction” process that occurs every 7 to 49 days, depending on the terms of the individual security. Since February 2008, a significant number of auctions related to these securities failed, meaning that there was not enough demand to sell the entire issue at auction. The failed auctions have limited the liquidity of the Company’s investments in ARS, and the Company believes that certain of the underlying issuers of its ARS are currently at risk. Further auction failures could have a material impact on the Company’s earnings; however, the Company does not believe further auction failures would have a material impact on its ability to fund its business.
The Company reviews impairments to determine the classification of potential impairments as either “temporary” or “other-than-temporary.” A temporary impairment results in an unrealized loss being recorded in other comprehensive income. An impairment that is considered other-than-temporary would be recognized as a loss in the consolidated statements of income. The Company considers various factors in reviewing impairments, including the length of time and extent to which the fair value has been less than the Company’s cost basis, the financial condition and near-term prospects of the issuer, and the Company’s intent and ability to hold the investments for a period of time sufficient to allow for any anticipated recovery in market value. The Company believes it has the ability and maintains its intent to hold its investments until recovery of market value occurs or until the ultimate maturity of the investments.
The Company’s investments in ARS and preferred securities are reported at fair market value, and as of
February 1, 2014
, the reported investment amount is net of a
$1.3 million
temporary impairment to account for the impairment of certain securities from their stated par value. The Company reported the
$1.3 million
temporary impairment, net of tax, as an “accumulated other comprehensive loss” of
$0.8 million
in stockholders’ equity as of
February 1, 2014
. The Company has accounted for the impairment as temporary, as it currently believes that these ARS can be successfully redeemed or liquidated in the future at par value plus accrued interest. The Company reviews all investments for other-than-temporary impairment ("OTTI") at least quarterly or as indicators of impairment exist. Indicators of impairment include the duration and severity of the decline in market value. In addition, the Company considers qualitative factors including, but not limited to, the financial condition of the investee, the credit rating of the investee, and the current and expected market and industry conditions in which the investee operates. Given current market conditions in the ARS market, the Company may incur additional temporary impairment or OTTI in the future if market conditions persist and the Company is unable to recover the cost of its investments in ARS.
Interest Rate Risk.
To the extent that the Company borrows under its line of credit facility, the Company would be exposed to market risk related to changes in interest rates. As of
February 1, 2014
, no borrowings were outstanding under the line of credit facility. The Company is not a party to any derivative financial instruments. Additionally, the Company is exposed to market risk related to interest rate risk on the cash and investments in interest-bearing securities. These investments have carrying values that are subject to interest rate changes that could impact earnings to the extent that the Company did not hold the investments to maturity. If there are changes in interest rates, those changes would also affect the investment income the Company earns on its cash and investments. For each one-quarter percent decline in the interest/dividend rate earned on cash and investments (approximately a 50% change in the rate earned), the Company’s net income would decrease approximately $0.3 million or less than $0.01 per share. This amount could vary based upon the number of shares of the Company’s stock outstanding and the level of cash and investments held by the Company.
The Company cautions that the risk factors described above could cause actual results to vary materially from those anticipated in any forward-looking statements made by or on behalf of the Company. Management cannot assess the impact of each factor on the Company’s business or the extent to which any factor, or combination of factors, may cause actual results to vary from those contained in forward-looking statements.
None.
14
All of the store locations operated by the Company are leased facilities. Most of the Company's stores have lease terms of approximately ten years and generally do not contain renewal options. In the past, the Company has not experienced problems renewing its leases, although no assurance can be given that the Company can renew existing leases on favorable terms. The Company seeks to negotiate extensions on leases for stores undergoing remodeling to provide terms of approximately ten years after completion of remodeling. Consent of the landlord generally is required to remodel or change the name under which the Company does business. The Company has not experienced problems in obtaining such consent in the past. Most leases provide for a fixed minimum rental cost plus an additional rental cost based upon a set percentage of sales beyond a specified breakpoint, plus common area and other charges. The current terms of the Company's leases, including automatic renewal options, expiring on or before January 31
st
of each year is as follows:
|
Year
|
Number of expiring leases
|
|
|
2015
|
64
|
|
|
2016
|
50
|
|
|
2017
|
51
|
|
|
2018
|
44
|
|
|
2019
|
54
|
|
|
2020
|
49
|
|
|
2021
|
47
|
|
|
2022 and later
|
91
|
|
|
Total
|
450
|
|
The corporate headquarters and online fulfillment center for the Company are located within a facility purchased by the Company in 1988, which is located in Kearney, Nebraska. The building currently provides approximately 261,200 square feet of space, which includes approximately 82,200 square feet related to the Company’s 2005 addition. The Company also owns a 40,000 square foot building with warehouse and office space near the corporate headquarters. This building houses the Company’s screenprinting operations. The Company acquired the lease, with favorable terms, on the land the building is built upon. The lease is currently in the third of ten five-year renewal options, which expires on October 31, 2016. During fiscal 2010, the Company completed construction of a new 240,000 square foot distribution center in Kearney, Nebraska. The Company transitioned to the new distribution center in September 2010 and the new facility is now the Company’s only operating store distribution center. The Company also recently broke ground on a new 80,000 square foot building that will provide additional office space as a part of its home office campus in Kearney, Nebraska. The Company started initial site preparation during the fourth quarter of fiscal 2013 and expects that construction of the building will be completed before the end of fiscal 2014.
From time to time, the Company is involved in litigation relating to claims arising out of its operations in the normal course of business. As of the date of this form, the Company was not engaged in legal proceedings that are expected, individually or in the aggregate, to have a material effect on the Company.
Not applicable.
15
The Company’s common stock trades on the New York Stock Exchange under the symbol BKE. Prior to the Company’s initial public offering on May 6, 1992, there was no public market for the Company’s common stock.
Dividend Payments
During fiscal 2011, the Company paid cash dividends of $0.20 per share in each of the four quarters and also paid a special cash dividend of $2.25 per share in the third quarter. During fiscal 2012, the Company paid cash dividends of $0.20 per share in each of the four quarters and also paid a special cash dividend of $4.50 per share in the fourth quarter. During fiscal 2013, the Company paid cash dividends of $0.20 per share in each of the first three quarters and $0.22 per share in the fourth quarter and also paid a special cash dividend of $1.20 per share in the fourth quarter. The Company plans to continue its quarterly dividends during fiscal
2014
.
Issuer Purchases of Equity Securities
The following table sets forth information concerning purchases made by the Company of its common stock for each of the months in the fiscal quarter ended
February 1, 2014
:
|
Total Number
of Shares
Purchased
|
Average Price Paid Per Share
|
Total Number of
Shares Purchased
as Part of Publicly
Announced Plans
|
Approximate
Number of Shares Yet To Be Purchased Under
Publicly Announced Plans
|
|||||
|
Nov. 3, 2013 to Nov. 30, 2013
|
—
|
—
|
—
|
543,900
|
|
|||
|
Dec. 1, 2013 to Jan. 4, 2014
|
—
|
—
|
—
|
543,900
|
|
|||
|
Jan. 5, 2014 to Feb. 1, 2014
|
—
|
—
|
—
|
543,900
|
|
|||
|
—
|
—
|
—
|
||||||
The Board of Directors authorized a 1,000,000 share repurchase plan on November 20, 2008. The Company has 543,900 shares remaining to complete this authorization.
16
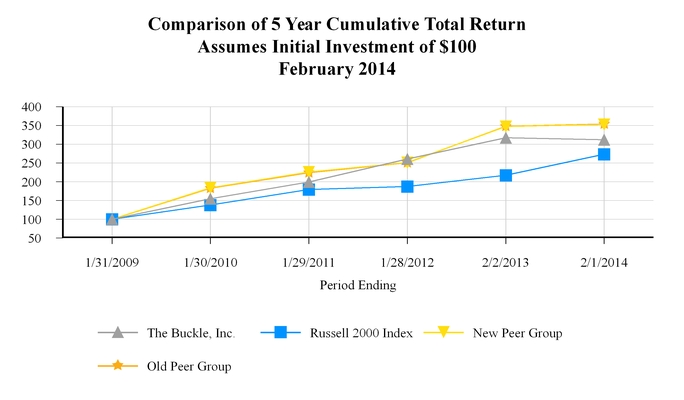
Stock Price Performance Graph
The graph below compares the cumulative total return on common shares of the Company for the last five fiscal years with the cumulative total return on the Russell 2000 Stock Index and a peer group of Retail Trade Stocks:
|
Total Return Analysis
|
1/31/2009
|
|
1/30/2010
|
|
1/29/2011
|
|
1/28/2012
|
|
2/2/2013
|
|
2/1/2014
|
||||||
|
|
|
|
|||||||||||||||
|
The Buckle , Inc.
|
100.00
|
|
154.89
|
|
199.05
|
|
260.50
|
|
317.32
|
|
|
311.80
|
|
||||
|
New Peer Group
|
100.00
|
|
184.24
|
|
225.78
|
|
251.17
|
|
347.44
|
|
|
352.43
|
|
||||
|
Old Peer Group
|
100.00
|
|
182.74
|
|
224.12
|
|
250.72
|
|
347.80
|
|
353.99
|
|
|||||
|
Russell 2000 Index
|
100.00
|
|
137.73
|
|
179.52
|
|
187.45
|
|
217.07
|
|
|
272.99
|
|
||||
In addition to the Company, the New Peer Group included in the above performance graph includes the following retail company stocks: AEO, ANF, ARO, GPS, LB, PSUN, TLYS, URBN, WTSLA, and ZUMZ. In addition to the Company, the Old Peer Group includes the following retail company stocks: AEO, ANF, ARO, GPS, HOTT, LB, PSUN, URBN, WTSLA, and ZUMZ. The Company replaced HOTT with TLYS, as HOTT is no longer publicly traded, and believes the New Peer Group provides a meaningful comparison in terms of comparable products, revenue composition, and size.
17
The following table lists the Company’s quarterly market range for fiscal years
2013
,
2012
, and
2011
, as reported by the New York Stock Exchange:
|
Fiscal Years Ended
|
|||||||||||||||||||||||
|
February 1, 2014
|
February 2, 2013
|
January 28, 2012
|
|||||||||||||||||||||
|
Quarter
|
High
|
Low
|
High
|
Low
|
High
|
Low
|
|||||||||||||||||
|
First
|
$
|
49.28
|
|
$
|
43.09
|
|
$
|
50.00
|
|
$
|
42.75
|
|
$
|
46.38
|
|
$
|
34.51
|
|
|||||
|
Second
|
57.39
|
|
48.56
|
|
47.49
|
|
36.33
|
|
47.97
|
|
38.54
|
|
|||||||||||
|
Third
|
57.68
|
|
46.26
|
|
47.80
|
|
36.80
|
|
45.89
|
|
33.97
|
|
|||||||||||
|
Fourth
|
53.57
|
|
43.45
|
|
51.74
|
|
41.50
|
|
45.98
|
|
36.58
|
|
|||||||||||
The number of record holders of the Company’s common stock as of March 21, 2014 was 460. Based upon information from the principal market makers, the Company believes there are more than 25,000 beneficial owners. The closing price of the Company’s common stock on March 21, 2014 was $46.98.
Additional information required by this item appears in the Notes to Consolidated Financial Statements under Footnote J "Stock-Based Compensation" on
pages 45 to 47
of this report and is incorporated by reference.
18
|
SELECTED FINANCIAL DATA
|
||||||||||||||||||||
|
(Amounts in Thousands Except Share, Per Share Amounts, and Selected Operating Data)
|
||||||||||||||||||||
|
Fiscal Years Ended
|
||||||||||||||||||||
|
February 1,
2014 |
February 2,
2013 (d) |
January 28,
2012 |
January 29,
2011 |
January 30,
2010 |
||||||||||||||||
|
Income Statement Data
|
||||||||||||||||||||
|
Net sales
|
$
|
1,128,001
|
|
$
|
1,124,007
|
|
$
|
1,062,946
|
|
$
|
949,838
|
|
$
|
898,287
|
|
|||||
|
Cost of sales (including buying, distribution, and occupancy costs)
|
628,856
|
|
624,692
|
|
594,291
|
|
530,709
|
|
497,668
|
|
||||||||||
|
Gross profit
|
499,145
|
|
499,315
|
|
468,655
|
|
419,129
|
|
400,619
|
|
||||||||||
|
Selling expenses
|
206,893
|
|
201,963
|
|
195,294
|
|
177,610
|
|
168,741
|
|
||||||||||
|
General and administrative expenses
|
35,258
|
|
39,177
|
|
37,041
|
|
30,752
|
|
32,416
|
|
||||||||||
|
Income from operations
|
256,994
|
|
258,175
|
|
236,320
|
|
210,767
|
|
199,462
|
|
||||||||||
|
Other income, net
|
3,462
|
|
3,524
|
|
4,161
|
|
3,911
|
|
4,665
|
|
||||||||||
|
Income before income taxes
|
260,456
|
|
261,699
|
|
240,481
|
|
214,678
|
|
204,127
|
|
||||||||||
|
Provision for income taxes
|
97,872
|
|
97,394
|
|
89,025
|
|
79,996
|
|
76,824
|
|
||||||||||
|
Net income
|
$
|
162,584
|
|
$
|
164,305
|
|
$
|
151,456
|
|
$
|
134,682
|
|
$
|
127,303
|
|
|||||
|
Basic earnings per share
|
$
|
3.41
|
|
$
|
3.47
|
|
$
|
3.23
|
|
$
|
2.92
|
|
$
|
2.79
|
|
|||||
|
Diluted earnings per share
|
$
|
3.39
|
|
$
|
3.44
|
|
$
|
3.20
|
|
$
|
2.86
|
|
$
|
2.73
|
|
|||||
|
Dividends declared per share (a)
|
$
|
2.02
|
|
$
|
5.30
|
|
$
|
3.05
|
|
$
|
3.30
|
|
$
|
2.60
|
|
|||||
|
Selected Operating Data
|
||||||||||||||||||||
|
Stores open at end of period
|
450
|
|
440
|
|
431
|
|
420
|
|
401
|
|
||||||||||
|
Average sales per square foot
|
$
|
461
|
|
$
|
475
|
|
$
|
462
|
|
$
|
428
|
|
$
|
428
|
|
|||||
|
Average sales per store (000's)
|
$
|
2,318
|
|
$
|
2,380
|
|
$
|
2,314
|
|
$
|
2,133
|
|
$
|
2,129
|
|
|||||
|
Comparable store sales change (b)
|
—
|
%
|
2.1
|
%
|
8.4
|
%
|
1.2
|
%
|
7.8
|
%
|
||||||||||
|
Balance Sheet Data (c)
|
||||||||||||||||||||
|
Working capital
|
$
|
218,756
|
|
$
|
147,917
|
|
$
|
210,296
|
|
$
|
160,663
|
|
$
|
172,779
|
|
|||||
|
Long-term investments
|
$
|
43,436
|
|
$
|
35,735
|
|
$
|
39,985
|
|
$
|
66,162
|
|
$
|
72,770
|
|
|||||
|
Total assets
|
$
|
546,293
|
|
$
|
477,974
|
|
$
|
531,539
|
|
$
|
494,844
|
|
$
|
488,903
|
|
|||||
|
Long-term debt
|
$
|
—
|
|
$
|
—
|
|
$
|
—
|
|
$
|
—
|
|
$
|
—
|
|
|||||
|
Stockholders' equity
|
$
|
361,930
|
|
$
|
289,649
|
|
$
|
363,147
|
|
$
|
345,665
|
|
$
|
354,259
|
|
|||||
|
(a)
|
During fiscal 2009, cash dividends were $0.20 per share in each of the four quarters. The Company also paid a special cash dividend of $1.80 per share in the third quarter of fiscal 2009. During fiscal 2010, cash dividends were $0.20 per share in each of the four quarters. In addition, the Company paid a special cash dividend of $2.50 per share in the fourth quarter of fiscal 2010. During fiscal 2011, cash dividends were $0.20 per share in each of the four quarters. The Company also paid a special cash dividend of $2.25 per share in the third quarter of fiscal 2011. During fiscal 2012, cash dividends were $0.20 per share in each of the four quarters. The Company also paid a special cash dividend of $4.50 per share in the fourth quarter of fiscal 2012. During fiscal 2013, cash dividends were $0.20 per share in each of the first three quarters and $0.22 per share in the fourth quarter. The Company also paid a special cash dividend of $1.20 per share in the fourth quarter of fiscal 2013.
|
|
(b)
|
Stores are deemed to be comparable stores if they were open in the prior year on the first day of the fiscal period presented. Stores which have been remodeled, expanded, and/or relocated, but would otherwise be included as comparable stores, are not excluded from the comparable store sales calculation. Online sales are excluded from comparable store sales.
|
|
(c)
|
At the end of the period.
|
|
(d)
|
Consists of 53 weeks.
|
19
The following discussion should be read in conjunction with the consolidated financial statements and notes thereto of the Company included in this Form 10-K. The following is management’s discussion and analysis of certain significant factors which have affected the Company’s financial condition and results of operations during the periods included in the accompanying consolidated financial statements included in this Form 10-K.
EXECUTIVE OVERVIEW
Company management considers the following items to be key performance indicators in evaluating Company performance.
Comparable Store Sales
– Stores are deemed to be comparable stores if they were open in the prior year on the first day of the fiscal period being presented. Stores which have been remodeled, expanded, and/or relocated, but would otherwise be included as comparable stores, are not excluded from the comparable store sales calculation. Online sales are excluded from comparable store sales. Management considers comparable store sales to be an important indicator of current Company performance, helping leverage certain fixed costs when results are positive. Negative comparable store sales results could reduce net sales and have a negative impact on operating leverage, thus reducing net earnings.
Net Merchandise Margins
– Management evaluates the components of merchandise margin including initial markup and the amount of markdowns during a period. Any inability to obtain acceptable levels of initial markups or any significant increase in the Company’s use of markdowns could have an adverse effect on the Company’s gross margin and results of operations.
Operating Margin
– Operating margin is a good indicator for management of the Company’s success. Operating margin can be positively or negatively affected by comparable store sales, merchandise margins, occupancy costs, and the Company’s ability to control operating costs.
Cash Flow and Liquidity (working capital)
– Management reviews current cash and short-term investments along with cash flow from operating, investing, and financing activities to determine the Company’s short-term cash needs for operations and expansion. The Company believes that existing cash, short-term investments, and cash flow from operations will be sufficient to fund current and long-term anticipated capital expenditures and working capital requirements for the next several years.
20
RESULTS OF OPERATIONS
The following table sets forth certain financial data expressed as a percentage of net sales and the percentage change in the dollar amount of such items compared to the prior period:
|
Percentage of Net Sales
|
|
Percentage Increase
|
||||||||||||
|
For Fiscal Years Ended
|
(Decrease)
|
|||||||||||||
|
|
February 1, 2014
|
February 2, 2013
|
January 28, 2012
|
|
Fiscal Year 2012 to 2013
|
Fiscal Year 2011 to 2012
|
||||||||
|
Net sales
|
100.0
|
%
|
100.0
|
%
|
100.0
|
%
|
|
0.4
|
%
|
5.7
|
%
|
|||
|
Cost of sales (including buying, distribution, and occupancy costs)
|
55.8
|
%
|
55.6
|
%
|
55.9
|
%
|
|
0.7
|
%
|
5.1
|
%
|
|||
|
Gross profit
|
44.2
|
%
|
44.4
|
%
|
44.1
|
%
|
|
—
|
%
|
6.5
|
%
|
|||
|
Selling expenses
|
18.3
|
%
|
18.0
|
%
|
18.4
|
%
|
|
2.4
|
%
|
3.4
|
%
|
|||
|
General and administrative expenses
|
3.1
|
%
|
3.5
|
%
|
3.5
|
%
|
|
(10.0
|
)%
|
5.8
|
%
|
|||
|
Income from operations
|
22.8
|
%
|
22.9
|
%
|
22.2
|
%
|
|
(0.5
|
)%
|
9.2
|
%
|
|||
|
Other income, net
|
0.3
|
%
|
0.3
|
%
|
0.4
|
%
|
|
(1.7
|
)%
|
(15.3
|
)%
|
|||
|
Income before income taxes
|
23.1
|
%
|
23.2
|
%
|
22.6
|
%
|
|
(0.5
|
)%
|
8.8
|
%
|
|||
|
Provision for income taxes
|
8.7
|
%
|
8.6
|
%
|
8.4
|
%
|
|
0.5
|
%
|
9.4
|
%
|
|||
|
Net income
|
14.4
|
%
|
14.6
|
%
|
14.2
|
%
|
|
(1.0
|
)%
|
8.5
|
%
|
|||
Fiscal 2013 Compared to Fiscal 2012
Net sales for the 52-week fiscal year ended
February 1, 2014
, increased
0.4%
to
$1.128 billion
from net sales of
$1.124 billion
for the 53-week fiscal year ended
February 2, 2013
. Comparable store net sales for the fiscal year were flat in comparison to the 52-week period ended February 2, 2013. Comparable store sales for the year were the result of a 3.7% increase in the average number of units sold per transaction, partially offset by a 1.0% reduction in the average retail price price of merchandise sold and a 2.6% reduction in the number of transactions at comparable stores during the year. Sales growth for the fiscal year was attributable to the inclusion of a full year of operating results for the
10
new stores opened during fiscal
2012
, to the opening of
13
new stores during fiscal
2013
, and to growth in online sales; partially offset by one less week of sales due to the fact that fiscal 2013 was a 52-week year and fiscal 2012 was a 53-week fiscal year. Online sales for the fiscal year (which are not included in comparable store sales) increased 5.3% to $89.0 million. Average sales per square foot for fiscal
2013
decreased 2.8% from $475 to $461. Total square footage as of
February 1, 2014
was 2.271 million compared to 2.208 million as of
February 2, 2013
.
The Company’s average retail price per piece of merchandise sold decreased $0.51, or 1.0%, during fiscal
2013
compared to fiscal
2012
. This $0.51 decrease was primarily attributable to the following changes (with their corresponding effect on the overall average price per piece): a shift in the merchandise mix (-$0.35), a 7.9% reduction in average woven shirt price points (-$0.29), a 3.5% reduction in average accessory price points (-$0.16), and a reduction in average price points in certain other merchandise categories (-$0.09); which were partially offset by a 15.0% increase in average footwear price points ($0.38). These changes are primarily a reflection of merchandise shifts in terms of brands and product styles, fabrics, details, and finishes.
Gross profit after buying, distribution, and occupancy costs decreased $0.2 million from
$499.3 million
in fiscal
2012
to
$499.1 million
in fiscal
2013
. As a percentage of net sales, gross profit decreased to
44.2%
in fiscal
2013
compared to
44.4%
in fiscal
2012
. The decrease was driven by deleveraged occupancy, buying, and distribution expenses resulting from flat comparable store sales and one fewer week in fiscal
2013
compared to fiscal
2012
(0.55%, as a percentage of net sales), which was partially offset by an improvement in merchandise margins (0.25%, as a percentage of net sales) and a reduction in expense related to the incentive bonus accrual (0.10%, as a percentage of net sales). Merchandise shrinkage was 0.5% of net sales for fiscal
2013
compared to 0.4% for fiscal
2012
.
21
Selling expenses increased from
$202.0 million
in fiscal
2012
to
$206.9 million
in fiscal
2013
, a
2.4%
increase. Selling expenses as a percentage of net sales increased from
18.0%
in fiscal
2012
to
18.3%
in fiscal
2013
. The increase was primarily attributable to increases in store payroll expense (0.30%, as a percentage of net sales), health insurance claims expense (0.15%, as a percentage of net sales), and certain other selling expenses (0.05%, as a percentage of net sales), which were partially offset by a reduction in expense related to the incentive bonus accrual (0.20%, as a percentage of net sales).
General and administrative expenses decreased from
$39.2 million
in fiscal
2012
to
$35.3 million
in fiscal
2013
, a
10.0%
decrease. As a percentage of net sales, general and administrative expenses were
3.5%
for fiscal
2012
and
3.1%
for fiscal
2013
. Reductions in equity compensation expense (0.30%, as a percentage of net sales) and expense related to the incentive bonus accrual (0.25%, as a percentage of net sales) were partially offset by increases in certain other general and administrative expenses (0.15%, as a percentage of net sales).
As a result of the above changes, the Company’s income from operations decreased $1.2 million to
$257.0 million
for fiscal
2013
, a decrease of
0.5%
compared to fiscal
2012
. Income from operations was
22.8%
as a percentage of net sales in fiscal
2013
compared to
22.9%
as a percentage of net sales in fiscal
2012
.
Other income was
$3.5 million
in both fiscal
2012
and fiscal
2013
. The Company’s other income is derived primarily from investment income related to the Company’s cash and investments.
Income tax expense as a percentage of pre-tax income was 37.6% in fiscal
2013
compared to 37.2% in fiscal
2012
, bringing net income to
$162.6 million
in fiscal
2013
versus
$164.3 million
in fiscal
2012
, a decrease of
1.0%
.
Fiscal 2012 Compared to Fiscal 2011
Net sales for the 53-week fiscal year ended February 2, 2013, increased 5.7% to $1.124 billion from net sales of $1.063 billion for the 52-week fiscal year ended January 28, 2012. Comparable store net sales for the 53-week fiscal year increased by $20.6 million, or 2.1%, in comparison to the 53-week period ended February 4, 2012. The comparable store sales increase was due to a 4.8% increase in the average retail price of merchandise sold during the year, which was partially offset by a 0.5% decrease in the average number of units sold per transaction and a 2.3% decrease in the number of transactions at comparable stores during the year. Sales growth for the fiscal year was also attributable to the inclusion of a full year of operating results for the 13 new stores opened during fiscal 2011, to the opening of 10 new stores during fiscal 2012, to growth in online sales, and to the inclusion of an extra week of sales due to the fact that fiscal 2012 was a 53-week year. Online sales for the year (which are not included in comparable store sales) increased 8.4% to $84.5 million, while the 53
rd
week in fiscal 2012 contributed an estimated $16.1 million in net sales. Average sales per square foot for fiscal 2012 increased 2.7% from $462 to $475. Total square footage as of February 2, 2013 was 2.208 million compared to 2.156 million as of January 28, 2012.
The Company’s average retail price per piece of merchandise sold increased $2.29, or 4.8%, during fiscal 2012 compared to fiscal 2011. This $2.29 increase was primarily attributable to the following changes (with their corresponding effect on the overall average price per piece): a shift in the merchandise mix ($0.97), a 13.9% increase in average footwear price points ($0.32), a 7.6% increase in average accessory price points ($0.30), a 1.3% increase in average denim price points ($0.29), a 9.8% increase in average active apparel price points ($0.23), and a 2.0% increase in average knit shirt price points ($0.22); which were partially offset by reduced average price points in certain other merchandise categories ($0.04). These changes are primarily a reflection of merchandise shifts in terms of brands and product styles, fabrics, details, and finishes.
Gross profit after buying, distribution, and occupancy costs increased $30.7 million in fiscal 2012 to $499.3 million, a 6.5% increase. As a percentage of net sales, gross profit increased to 44.4% in fiscal 2012 compared to 44.1% in fiscal 2011. An improvement in merchandise margins (0.25%, as a percentage of net sales) and a reduction in expense related to the incentive bonus accrual (0.10%, as a percentage of net sales) were partially offset by increases in certain other occupancy, buying, and distribution expenses (0.05%, as a percentage of net sales). Merchandise shrinkage was 0.4% of net sales for both fiscal 2011 and fiscal 2012.
Selling expenses increased from $195.3 million in fiscal 2011 to $202.0 million in fiscal 2012, a 3.4% increase. Selling expenses as a percentage of net sales decreased from 18.4% in fiscal 2011 to 18.0% in fiscal 2012. The reduction was primarily attributable to decreases in expense related to bankcard fees (0.20%, as a percentage of net sales), internet order fulfillment (0.15%, as a percentage of net sales), and certain other selling expenses (0.05%, as a percentage of net sales).
22
General and administrative expenses increased from $37.0 million in fiscal 2011 to $39.2 million in fiscal 2012, a 5.8% increase. As a percentage of net sales, general and administrative expenses were 3.5% for both fiscal 2011 and fiscal 2012. A reduction in expense related to the incentive bonus accrual (0.30%, as a percentage of net sales) was offset by increases in equity compensation expense (0.15%, as a percentage of net sales) and vacation pay expense (0.15%, as a percentage of net sales).
As a result of the above changes, the Company’s income from operations increased $21.9 million to $258.2 million for fiscal 2012, a 9.2% increase compared to fiscal 2011. Income from operations was 22.9% as a percentage of net sales in fiscal 2012 compared to 22.2% as a percentage of net sales in fiscal 2011.
Other income decreased from $4.2 million in fiscal 2011 to $3.5 million in fiscal 2012. The Company’s other income is derived primarily from interest and dividends received on the Company’s cash and investments.
Income tax expense as a percentage of pre-tax income was 37.2% in fiscal 2012 compared to 37.0% in fiscal 2011, bringing net income to $164.3 million in fiscal 2012 versus $151.5 million in fiscal 2011, an increase of 8.5%.
LIQUIDITY AND CAPITAL RESOURCES
As of
February 1, 2014
, the Company had working capital of
$218.8 million
, including
$164.9 million
of cash and cash equivalents and
$20.2 million
of short-term investments. The Company’s cash receipts are generated from retail sales and from investment income, and the Company's primary ongoing cash requirements are for inventory, payroll, occupancy costs, dividend payments, new store expansion, remodeling, and other capital expenditures. Historically, the Company’s primary source of working capital has been cash flow from operations. During fiscal
2013
,
2012
, and
2011
the Company's cash flow from operations was
$174.0 million
,
$220.9 million
, and
$209.3 million
, respectively.
During fiscal
2013
,
2012
, and
2011
, the Company invested $21.0 million, $27.8 million, and $32.5 million, respectively, in new store construction, store renovation, and store technology upgrades. The Company spent $7.8 million, $2.5 million, and $4.1 million in fiscal
2013
,
2012
, and
2011
, respectively, in capital expenditures for the corporate headquarters and distribution facility. Capital spending for the corporate headquarters and distribution center during fiscal 2013 includes $5.4 million for the purchase of a new corporate airplane as a replacement for a plane that was sold by the Company in the fourth quarter of fiscal 2012.
During fiscal
2014
, the Company anticipates completing approximately 34 store construction projects, including approximately 17 new stores and approximately 17 stores to be remodeled and/or relocated. The average cost of opening a new store during fiscal
2013
was approximately $0.9 million, including construction costs of approximately $0.7 million and inventory costs of approximately $0.2 million, net of payables. Management estimates that total capital expenditures during fiscal
2014
will be approximately $48.0 to $53.0 million, which includes primarily new store and store remodeling projects, IT investments, and the construction of a new office building as a part of the Company's home office campus in Kearney, Nebraska. The Company believes that existing cash and cash equivalents, investments, and cash flow from operations will be sufficient to fund current and long-term anticipated capital expenditures and working capital requirements for the next several years. The Company has had a consistent record of generating positive cash flow each year and, as of
February 1, 2014
, had total cash and investments of
$228.5 million
, including
$43.4 million
of long-term investments. The Company does not currently have plans for any merger or acquisition, and has fairly consistent plans for new store expansion and remodels. Based upon past results and current plans, management does not anticipate any large swings in the Company’s need for cash in the upcoming years.
Future conditions, however, may reduce the availability of funds based upon factors such as a decrease in demand for the Company’s product, change in product mix, competitive factors, and general economic conditions as well as other risks and uncertainties which would reduce the Company’s sales, net profitability, and cash flows. Also, the Company’s acceleration in store openings and/or remodels, or entering into a merger, acquisition, or other financial related transaction could reduce the amount of cash available for further capital expenditures and working capital requirements.
The Company has available an unsecured line of credit of $25.0 million with Wells Fargo Bank, N.A. for operating needs and letters of credit. The line of credit provides that outstanding letters of credit cannot exceed $20.0 million. Borrowings under the line of credit provide for interest to be paid at a rate based on LIBOR. The Company has, from time to time, borrowed against these lines of credit. There were no borrowings during fiscal
2013
,
2012
, and
2011
. The Company had no bank borrowings as of
February 1, 2014
and was in compliance with the terms and conditions of the line of credit agreement.
23
Dividend payments
- During fiscal
2013
, the Company paid total cash dividends of
$97.1 million
as follows: $0.20 per share in each of the first three quarters, $0.22 per share in the fourth quarter, and a special cash dividend of $1.20 per share in the fourth quarter. During fiscal
2012
, the Company paid total cash dividends of
$254.6 million
as follows: $0.20 per share in each of the four quarters and a special cash dividend of $4.50 per share in the fourth quarter. During fiscal
2011
, the Company paid total cash dividends of
$144.6 million
as follows: $0.20 per share in each of the four quarters and a special cash dividend of $2.25 per share in the third quarter. The Company plans to continue its quarterly dividends in fiscal
2014
.
Stock repurchase plan
- The Company did not repurchase any shares of its common stock during fiscal 2013 or fiscal 2012. During fiscal 2011, the Company repurchased 8,600 shares of its common stock at a cost of $0.3 million. The Company’s current 1,000,000 share repurchase plan was approved by the Board of Directors on November 20, 2008. As of
February 1, 2014
, 543,900 shares remained available for repurchase under the plan.
Auction-Rate Securities
- As of
February 1, 2014
, total cash and investments included
$9.6 million
of auction-rate securities (“ARS”), which compares to
$10.9 million
of ARS and preferred securities as of
February 2, 2013
. Of the
$9.6 million
in ARS as of
February 1, 2014
, all were classified in long-term investments. ARS have a long-term stated maturity, but are reset through a “dutch auction” process that occurs every 7 to 49 days, depending on the terms of the individual security. During February 2008, a significant number of auctions related to these securities failed, meaning that there was not enough demand to sell the entire issue at auction. The failed auctions have limited the current liquidity of the Company’s investments in ARS and the Company has reason to believe that certain of the underlying issuers of its ARS are currently at risk. The Company does not anticipate, however, that further auction failures will have a material impact on the Company’s ability to fund its business.
ARS and preferred securities are reported at fair market value, and as of
February 1, 2014
, the reported investment amount is net of a
$1.3 million
temporary impairment to account for the impairment of certain securities from their stated par value. The Company reported the
$1.3 million
temporary impairment, net of tax, as an “accumulated other comprehensive loss” of
$0.8 million
in stockholders’ equity as of
February 1, 2014
. The Company has accounted for the impairment as temporary, as it currently believes that these ARS can be successfully redeemed or liquidated in the future at par value plus accrued interest. During fiscal
2013
, the Company was able to successfully liquidate ARS and preferred securities with a par value of
$4.1 million
.
The Company reviews all investments for other-than-temporary impairment (“OTTI”) at least quarterly or as indicators of impairment exist. The value and liquidity of ARS held by the Company may be affected by continued auction-rate failures, the credit quality of each security, the amount and timing of interest payments, the amount and timing of future principal payments, and the probability of full repayment of the principal. Additional indicators of impairment include the duration and severity of the decline in market value. The interest rates on these investments will be determined by the terms of each individual ARS. The material risks associated with the ARS held by the Company include those stated above as well as the current economic environment, downgrading of credit ratings on investments held, and the volatility of the entities backing each of the issues. In addition, the Company considers qualitative factors including, but not limited to, the financial condition of the investee, the credit rating of the investee, and the current and expected market and industry conditions in which the investee operates. The Company believes it has the ability and intent to hold these investments until recovery of market value occurs or until the ultimate maturity of the investments.
24
CRITICAL ACCOUNTING POLICIES AND ESTIMATES
Management’s Discussion and Analysis of Financial Condition and Results of Operations are based upon The Buckle, Inc.’s consolidated financial statements, which have been prepared in accordance with accounting principles generally accepted in the United States of America. The preparation of these consolidated financial statements requires that management make estimates and judgments that affect the reported amounts of assets and liabilities, the disclosure of contingent assets and liabilities at the financial statement date, and the reported amounts of sales and expenses during the reporting period. The Company regularly evaluates its estimates, including those related to inventory, investments, incentive bonuses, and income taxes. Management bases its estimates on past experience and on various other factors that are thought to be reasonable under the circumstances, the results of which form the basis for making judgments about the carrying values of assets and liabilities that are not readily apparent from other sources. Actual results may differ from these estimates under different assumptions or conditions. Management believes that the estimates and judgments used in preparing these consolidated financial statements were the most appropriate at that time. Presented below are those critical accounting policies that management believes require subjective and/or complex judgments that could potentially affect reported results of operations.
|
1.
|
Revenue Recognition.
Retail store sales are recorded upon the purchase of merchandise by customers. Online sales are recorded when merchandise is delivered to the customer, with the time of delivery being based on estimated shipping time from the Company’s distribution center to the customer. Shipping fees charged to customers are included in revenue and shipping costs are included in selling expenses. The Company recognizes revenue from sales made under its layaway program upon delivery of the merchandise to the customer. Revenue is not recorded when gift cards and gift certificates are sold, but rather when a card or certificate is redeemed for merchandise. A current liability for unredeemed gift cards and certificates is recorded at the time the card or certificate is purchased. The liability recorded for unredeemed gift certificates and gift cards was
$23.1 million
and
$22.2 million
as of
February 1, 2014
and
February 2, 2013
, respectively. The amounts of the gift certificate and gift card liabilities are determined using the outstanding balances from the prior three and four years of issuance, respectively. The Company records breakage as other income when the probability of redemption, which is based on historical redemption patterns, is remote. Breakage reported for the fiscal years ended
February 1, 2014
,
February 2, 2013
, and
January 28, 2012
was
$1.1 million
,
$0.8 million
, and
$0.7 million
, respectively.
|
The Company establishes a liability for estimated merchandise returns based upon the historical average sales return percentage. Customer returns could potentially exceed the historical average, thus reducing future net sales results and potentially reducing future net earnings. The accrued liability for reserve for sales returns was
$0.8 million
as of
February 1, 2014
and
$0.9 million
as of
February 2, 2013
. Sales tax collected from customers is excluded from revenue and is included as part of “accrued store operating expenses” on the Company's consolidated balance sheets.
|
2.
|
Inventory
. Inventory is valued at the lower of cost or market. Cost is determined using an average cost method that approximates the first-in, first-out (FIFO) method. Management makes adjustments to inventory and cost of goods sold, based upon estimates, to account for merchandise obsolescence and markdowns that could affect market value, based on assumptions using calculations applied to current inventory levels within each different markdown level. Management also reviews the levels of inventory in each markdown group and the overall aging of the inventory versus the estimated future demand for such product and the current market conditions. Such judgments could vary significantly from actual results, either favorably or unfavorably, due to fluctuations in future economic conditions, industry trends, consumer demand, and the competitive retail environment. Such changes in market conditions could negatively impact the sale of markdown inventory, causing further markdowns or inventory obsolescence, resulting in increased cost of goods sold from write-offs and reducing the Company’s net earnings. The adjustment to inventory for markdowns and/or obsolescence was
$7.4 million
as of
February 1, 2014
and
$6.3 million
as of
February 2, 2013
, respectively. The Company is not aware of any events, conditions, or changes in demand or price that would indicate that its inventory valuation may not be materially accurate at this time.
|
|
3.
|
Income Taxes
. The Company records a deferred tax asset and liability for expected future tax consequences resulting from temporary differences between financial reporting and tax bases of assets and liabilities. The Company considers future taxable income and ongoing tax planning in assessing the value of its deferred tax assets. If the Company determines that it is more than likely that these assets will not be realized, the Company would reduce the value of these assets to their expected realizable value, thereby decreasing net income. Estimating the value of these assets is based upon the Company’s judgment. If the Company subsequently determined that the deferred tax assets, which had been written down, would be realized in the future, such value would be increased. Adjustment would be made to increase net income in the period such determination was made. As of
February 1, 2014
and
February 2, 2013
, respectively, the Company’s non-current deferred tax liability includes a $0.9 million and $0.2 million valuation allowance recorded to reduce the value of the Company’s capital loss carryforward to its expected realizable amount prior to expiration.
|
25
|
4.
|
Operating Leases
. The Company leases retail stores under operating leases. Most lease agreements contain tenant improvement allowances, rent holidays, rent escalation clauses, and/or contingent rent provisions. For purposes of recognizing lease incentives and minimum rental expense on a straight-line basis over the terms of the leases, the Company uses the date of initial possession to begin amortization, which is generally when the Company enters the space and begins to make improvements in preparation of intended use. For tenant improvement allowances and rent holidays, the Company records a deferred rent liability on the consolidated balance sheets and amortizes the deferred rent over the terms of the leases as reductions to rent expense on the consolidated statements of income.
|
For scheduled rent escalation clauses during the lease terms or for rental payments commencing at a date other than the date of initial occupancy, the Company records minimum rental expense on a straight-line basis over the terms of the leases on the consolidated statements of income. Certain leases provide for contingent rents, which are determined as a percentage of gross sales in excess of specified levels. The Company records a contingent rent liability on the consolidated balance sheets and the corresponding rent expense when specified levels have been achieved or are reasonably probable to be achieved.
|
5.
|
Investments
. As more fully described in Liquidity and Capital Resources on
pages 23 to 24
and in Note B to the consolidated financial statements on
pages 38 to 39, i
n prior years the Company invested a portion of its investments in auction-rate securities (“ARS”) and preferred securities. These investments are classified as available-for-sale securities and are reported at fair market values of
$9.6 million
and
$10.9 million
as of
February 1, 2014
and
February 2, 2013
, respectively
|
The Company reviews impairment to determine the classification of potential impairments as either temporary or other-than-temporary. A temporary impairment results in an unrealized loss being recorded in other comprehensive income. An impairment that is considered other-than-temporary would be recognized in net income. The Company considers various factors in reviewing impairment, including the duration and severity of the decline in market value. In addition, the Company considers qualitative factors including, but not limited to, the financial condition of the investee, the credit rating of the investee, the current and expected market and industry conditions in which the investee operates, and the Company’s intent and ability to hold the investments for a period of time sufficient to allow for any anticipated recovery in market value. The Company believes it has the ability and maintains its intent to hold these investments until recovery of market value occurs or until the ultimate maturity of the investments.
The Company determined the fair value of ARS using Level 1 inputs for known or anticipated subsequent redemptions at par value, Level 2 inputs using observable inputs, and Level 3 using unobservable inputs, where the following criteria were considered in estimating fair value:
|
•
|
Pricing was provided by the custodian or third party broker for ARS;
|
|
•
|
Sales of similar securities;
|
|
•
|
Quoted prices for similar securities in active markets;
|
|
•
|
Quoted prices for publicly traded preferred securities;
|
|
•
|
Quoted prices for similar assets in markets that are not active - including markets where there are few transactions for the asset, the prices are not current, or price quotations vary substantially either over time or among market makers, or in which little information is released publicly;
|
|
•
|
Pricing was provided by a third-party valuation consultant (using Level 3 inputs).
|
In addition, the Company considers other factors including, but not limited to, the financial condition of the investee, the credit rating, insurance, guarantees, collateral, cash flows, and the current and expected market and industry conditions in which the investee operates. Management believes it has used information that was reasonably obtainable in order to complete its valuation process and determine if the Company’s investments in ARS had incurred any temporary and/or other-than-temporary impairment as of
February 1, 2014
.
The Company has concluded that certain of its ARS represent Level 3 valuation and should be valued using a discounted cash flow analysis. The assumptions used in preparing the discounted cash flow model include estimates for interest rates, timing and amount of cash flows, and expected holding periods of the ARS. As of
February 1, 2014
, the unobservable inputs used by the Company and its independent third-party valuation consultant in valuing its Level 3 investments in ARS included:
|
•
|
Durations until redemption ranging from
3.1
to
5.7
years, with a weighted average of
4.9
years.
|
|
•
|
Discount rates ranging from
3.93%
to
4.93%
, with a weighted average of
4.56%
.
|
26
OFF-BALANCE SHEET ARRANGEMENTS, CONTRACTUAL OBLIGATIONS, AND COMMERCIAL COMMITMENTS
As referenced in the tables below, the Company has contractual obligations and commercial commitments that may affect the financial condition of the Company. Based on management’s review of the terms and conditions of its contractual obligations and commercial commitments, there is no known trend, demand, commitment, event, or uncertainty that is reasonably likely to occur which would have a material effect on the Company’s financial condition, results of operations, or cash flows.
In addition, the commercial obligations and commitments made by the Company are customary transactions which are similar to those of other comparable retail companies. The operating lease obligations shown in the table below represent future cash payments to landlords required to fulfill the Company’s minimum rent requirements. Such amounts are actual cash requirements by year and are not reported net of any tenant improvement allowances received from landlords.
The following table identifies the material obligations and commitments as of
February 1, 2014
:
|
|
Payments Due by Period
|
||||||||||||||||||
|
Contractual obligations (dollar amounts in thousands):
|
Total
|
Less than 1
year
|
1-3 years
|
4-5 years
|
After 5
years
|
||||||||||||||
|
Purchase obligations
|
$
|
11,127
|
|
$
|
8,893
|
|
$
|
2,060
|
|
$
|
174
|
|
$
|
—
|
|
||||
|
Deferred compensation
|
12,797
|
|
—
|
|
—
|
|
—
|
|
12,797
|
|
|||||||||
|
Operating leases
|
351,721
|
|
62,915
|
|
110,373
|
|
88,854
|
|
89,579
|
|
|||||||||
|
Total contractual obligations
|
$
|
375,645
|
|
$
|
71,808
|
|
$
|
112,433
|
|
$
|
89,028
|
|
$
|
102,376
|
|
||||
The Company has available an unsecured line of credit of $25.0 million, of which $20.0 million is available for letters of credit, which is excluded from the preceding table. Certain merchandise purchase orders require that the Company open letters of credit. When the Company takes possession of the merchandise, it releases payment on the letters of credit. The amounts of outstanding letters of credit reported reflect the open letters of credit on merchandise ordered, but not yet received or funded. The Company believes it has sufficient credit available to open letters of credit for merchandise purchases. There were no bank borrowings during fiscal
2013
,
2012
and
2011
. The Company had outstanding letters of credit totaling $3.2 million as of both
February 1, 2014
and
February 2, 2013
. The Company has no other off-balance sheet arrangements.
SEASONALITY AND INFLATION
The Company's business is seasonal, with the holiday season (from approximately November 15 to December 30) and the back-to-school season (from approximately July 15 to September 1) historically contributing the greatest volume of net sales. For fiscal years
2013
,
2012
, and
2011
, the holiday and back-to-school seasons accounted for approximately 35% of the Company's fiscal year net sales. Although the operations of the Company are influenced by general economic conditions, the Company does not believe that inflation has had a material effect on the results of operations during the past three fiscal years. Quarterly results may vary significantly depending on a variety of factors including the timing and amount of sales and costs associated with the opening of new stores, the timing and level of markdowns, the timing of store closings, the remodeling of existing stores, competitive factors, and general economic conditions.
RELATED PARTY TRANSACTIONS
Included in other assets is a note receivable of $1.2 million as of
February 1, 2014
and $1.1 million as of
February 2, 2013
, from a life insurance trust fund controlled by the Company’s Chairman. The note was created over three years, beginning in July 1994, when the Company paid life insurance premiums of $0.2 million each year for the Chairman on a personal policy. The note accrues interest at 5% of the principal balance per year and is to be paid from the life insurance proceeds. The note is secured by a life insurance policy on the Chairman.
27
RECENTLY ISSUED ACCOUNTING PRONOUNCEMENTS
In February 2013, the FASB issued ASU No. 2013-02,
Reporting of Amounts Reclassified Out of Accumulated Other Comprehensive Income
, which adds additional disclosure requirements for items reclassified out of accumulated other comprehensive income. The additional disclosure requirements are effective for interim and annual reporting periods beginning after December 15, 2012. The adoption of ASU 2013-02 did not have a material impact on the Company’s financial position or results of operations, as there were no such reclassifications during the periods presented in this Form 10-K.
FORWARD LOOKING STATEMENTS
Information in this report, other than historical information, may be considered to be forward-looking statements within the meaning of the Private Securities Litigation Reform Act of 1995 (the “1995 Act”). Such statements are made in good faith by the Company pursuant to the safe-harbor provisions of the 1995 Act. In connection with these safe-harbor provisions, this management’s discussion and analysis contains certain forward-looking statements, which reflect management’s current views and estimates of future economic conditions, Company performance, and financial results. The statements are based on many assumptions and factors that could cause future results to differ materially. Such factors include, but are not limited to, changes in product mix, changes in fashion trends, competitive factors, and general economic conditions, economic conditions in the retail apparel industry, as well as other risks and uncertainties inherent in the Company’s business and the retail industry in general. Any changes in these factors could result in significantly different results for the Company. The Company further cautions that the forward-looking information contained herein is not exhaustive or exclusive. The Company does not undertake to update any forward-looking statements, which may be made from time to time by or on behalf of the Company.
Interest Rate Risk
- To the extent that the Company borrows under its line of credit facility, the Company would be exposed to market risk related to changes in interest rates. As of
February 1, 2014
, no borrowings were outstanding under the line of credit facility. The Company is not a party to any derivative financial instruments. Additionally, the Company is exposed to market risk related to interest rate risk on the cash and investments in interest-bearing securities. These investments have carrying values that are subject to interest rate changes that could impact earnings to the extent that the Company did not hold the investments to maturity. If there are changes in interest rates, those changes would also affect the investment income the Company earns on its cash and investments. For each one-quarter percent decline in the interest/dividend rate earned on cash and investments (approximately a 50% change in the rate earned), the Company’s net income would decrease approximately $0.3 million, or less than $0.01 per share. This amount could vary based upon the number of shares of the Company’s stock outstanding and the level of cash and investments held by the Company.
Other Market Risk
– At
February 1, 2014
, the Company held
$11.0 million
, at par value, of investments in auction-rate securities (“ARS”). The Company concluded that a
$1.3 million
temporary impairment existed related to these securities as of
February 1, 2014
. Given current market conditions in the ARS market, the Company may incur additional temporary or other-than-temporary impairment in the future if market conditions persist and the Company is unable to recover the cost of its investments in ARS.
28
REPORT OF INDEPENDENT REGISTERED PUBLIC ACCOUNTING FIRM
To the Board of Directors and Stockholders of
The Buckle, Inc.
Kearney, Nebraska
We have audited the accompanying consolidated balance sheets of The Buckle, Inc. and subsidiary (the “Company”) as of February 1, 2014 and February 2, 2013, and the related consolidated statements of income, comprehensive income, stockholders’ equity, and cash flows for each of the three fiscal years in the period ended February 1, 2014. Our audits also included the financial statement schedule listed in the Index at Item 15. These financial statements and financial statement schedule are the responsibility of the Company’s management. Our responsibility is to express an opinion on the financial statements and financial statement schedule based on our audits.
We conducted our audits in accordance with the standards of the Public Company Accounting Oversight Board (United States). Those standards require that we plan and perform the audit to obtain reasonable assurance about whether the financial statements are free of material misstatement. An audit includes examining, on a test basis, evidence supporting the amounts and disclosures in the financial statements. An audit also includes assessing the accounting principles used and significant estimates made by management, as well as evaluating the overall financial statement presentation. We believe that our audits provide a reasonable basis for our opinion.
In our opinion, such consolidated financial statements present fairly, in all material respects, the financial position of The Buckle, Inc. and subsidiary as of February 1, 2014 and February 2, 2013, and the results of their operations and their cash flows for each of the three fiscal years in the period ended February 1, 2014, in conformity with accounting principles generally accepted in the United States of America. Also, in our opinion, such financial statement schedule, when considered in relation to the basic consolidated financial statements taken as a whole, presents fairly, in all material respects, the information set forth therein.
We have also audited, in accordance with the standards of the Public Company Accounting Oversight Board (United States), the Company’s internal control over financial reporting as of February 1, 2014, based on the criteria established in
Internal Control - Integrated Framework (1992)
issued by the Committee of Sponsoring Organizations of the Treadway Commission and our report dated April 2, 2014 expressed an unqualified opinion on the Company’s internal control over financial reporting.
/s/ Deloitte & Touche LLP
DELOITTE & TOUCHE LLP
Omaha, Nebraska
April 2, 2014
29
THE BUCKLE, INC.
(Amounts in Thousands Except Share and Per Share Amounts)
|
ASSETS
|
February 1,
2014 |
February 2,
2013 |
|||||
|
|
|
||||||
|
CURRENT ASSETS:
|
|
|
|||||
|
Cash and cash equivalents
|
$
|
164,868
|
|
$
|
117,608
|
|
|
|
Short-term investments (Notes A, B, and C)
|
20,197
|
|
26,414
|
|
|||
|
Receivables
|
4,318
|
|
3,470
|
|
|||
|
Inventory
|
124,141
|
|
103,853
|
|
|||
|
Prepaid expenses and other assets (Note F)
|
28,613
|
|
25,528
|
|
|||
|
Total current assets
|
342,137
|
|
276,873
|
|
|||
|
|
|
|
|
||||
|
PROPERTY AND EQUIPMENT (Note D)
|
393,656
|
|
373,286
|
|
|||
|
Less accumulated depreciation and amortization
|
(235,087
|
)
|
(210,183
|
)
|
|||
|
158,569
|
|
163,103
|
|
||||
|
|
|
|
|
|
|||
|
LONG-TERM INVESTMENTS (Notes A, B, and C)
|
43,436
|
|
35,735
|
|
|||
|
OTHER ASSETS (Note G)
|
2,151
|
|
2,263
|
|
|||
|
|
|
|
|
||||
|
|
$
|
546,293
|
|
$
|
477,974
|
|
|
|
|
|
|
|
||||
|
LIABILITIES AND STOCKHOLDERS’ EQUITY
|
|
|
|
|
|||
|
|
|
|
|
||||
|
CURRENT LIABILITIES:
|
|
|
|
|
|||
|
Accounts payable
|
$
|
37,147
|
|
$
|
34,124
|
|
|
|
Accrued employee compensation
|
36,933
|
|
42,183
|
|
|||
|
Accrued store operating expenses
|
9,983
|
|
10,121
|
|
|||
|
Gift certificates redeemable
|
23,131
|
|
22,221
|
|
|||
|
Income taxes payable
|
16,187
|
|
20,307
|
|
|||
|
Total current liabilities
|
123,381
|
|
128,956
|
|
|||
|
|
|
|
|
||||
|
DEFERRED COMPENSATION (Note I)
|
12,797
|
|
10,600
|
|
|||
|
DEFERRED RENT LIABILITY
|
37,564
|
|
36,947
|
|
|||
|
OTHER LIABILITIES (Note F)
|
10,621
|
|
11,822
|
|
|||
|
Total liabilities
|
184,363
|
|
188,325
|
|
|||
|
|
|
|
|
||||
|
COMMITMENTS (Notes E and H)
|
|
|
|
|
|||
|
|
|
|
|
||||
|
STOCKHOLDERS’ EQUITY (Note J):
|
|
|
|
|
|||
|
Common stock, authorized 100,000,000 shares of $.01 par value; 48,336,392 and 48,059,269 shares issued and outstanding at February 1, 2014 and February 2, 2013, respectively
|
483
|
|
481
|
|
|||
|
Additional paid-in capital
|
124,134
|
|
117,391
|
|
|||
|
Retained earnings
|
238,151
|
|
172,711
|
|
|||
|
Accumulated other comprehensive loss
|
(838
|
)
|
(934
|
)
|
|||
|
Total stockholders’ equity
|
361,930
|
|
289,649
|
|
|||
|
|
|
|
|
||||
|
|
$
|
546,293
|
|
$
|
477,974
|
|
|
See notes to consolidated financial statements.
30
THE BUCKLE, INC.
(Amounts in Thousands Except Per Share Amounts)
|
|
Fiscal Years Ended
|
||||||||||
|
|
February 1,
2014 |
|
February 2,
2013 |
January 28,
2012 |
|||||||
|
|
|
|
|
|
|||||||
|
SALES, Net of returns and allowances of $108,851, $106,612, and $95,476, respectively
|
$
|
1,128,001
|
|
|
$
|
1,124,007
|
|
$
|
1,062,946
|
|
|
|
|
|
|
|
|
|
||||||
|
COST OF SALES (Including buying, distribution, and occupancy costs)
|
628,856
|
|
|
624,692
|
|
594,291
|
|
||||
|
|
|
|
|
|
|
||||||
|
Gross profit
|
499,145
|
|
|
499,315
|
|
468,655
|
|
||||
|
|
|
|
|
|
|
||||||
|
OPERATING EXPENSES:
|
|
|
|
|
|
||||||
|
Selling
|
206,893
|
|
|
201,963
|
|
195,294
|
|
||||
|
General and administrative
|
35,258
|
|
|
39,177
|
|
37,041
|
|
||||
|
|
242,151
|
|
|
241,140
|
|
232,335
|
|
||||
|
|
|
|
|
|
|
||||||
|
INCOME FROM OPERATIONS
|
256,994
|
|
|
258,175
|
|
236,320
|
|
||||
|
|
|
|
|
|
|
||||||
|
OTHER INCOME, Net (Note A)
|
3,462
|
|
|
3,524
|
|
4,161
|
|
||||
|
|
|
|
|
|
|
||||||
|
INCOME BEFORE INCOME TAXES
|
260,456
|
|
|
261,699
|
|
240,481
|
|
||||
|
|
|
|
|
|
|
||||||
|
PROVISION FOR INCOME TAXES (Note F)
|
97,872
|
|
|
97,394
|
|
89,025
|
|
||||
|
|
|
|
|
|
|
||||||
|
NET INCOME
|
$
|
162,584
|
|
|
$
|
164,305
|
|
$
|
151,456
|
|
|
|
|
|
|
|
|
|
||||||
|
|
|
|
|
|
|
||||||
|
EARNINGS PER SHARE (Note K):
|
|
|
|
|
|
||||||
|
Basic
|
$
|
3.41
|
|
$
|
3.47
|
|
$
|
3.23
|
|
||
|
|
|||||||||||
|
Diluted
|
$
|
3.39
|
|
$
|
3.44
|
|
$
|
3.20
|
|
||
See notes to consolidated financial statements.
31
THE BUCKLE, INC.
CONSOLIDATED STATEMENTS OF COMPREHENSIVE INCOME
(Amounts in Thousands)
|
|
Fiscal Years Ended
|
||||||||||
|
|
February 1,
2014 |
February 2,
2013 |
January 28,
2012 |
||||||||
|
NET INCOME
|
$
|
162,584
|
|
$
|
164,305
|
|
$
|
151,456
|
|
||
|
OTHER COMPREHENSIVE INCOME, NET OF TAX:
|
|
|
|
|
|||||||
|
Change in unrealized loss on investments, net of tax of $56, $(138), and $(17), respectively
|
96
|
|
(235
|
)
|
(28
|
)
|
|||||
|
Other comprehensive income
|
96
|
|
(235
|
)
|
(28
|
)
|
|||||
|
COMPREHENSIVE INCOME
|
$
|
162,680
|
|
$
|
164,070
|
|
$
|
151,428
|
|
||
See notes to consolidated financial statements.
32
THE BUCKLE, INC.
CONSOLIDATED STATEMENTS OF STOCKHOLDERS' EQUITY
(Amounts in Thousands Except Share and Per Share Amounts)
|
|
Number
of Shares
|
Common
Stock
|
Additional
Paid-in
Capital
|
Retained
Earnings
|
Accumulated
Other
Comprehensive
Loss
|
Total
|
|||||||||||||||||
|
BALANCE, January 29, 2011
|
47,127,926
|
|
$
|
471
|
|
$
|
89,719
|
|
$
|
256,146
|
|
$
|
(671
|
)
|
$
|
345,665
|
|
||||||
|
Net income
|
—
|
|
—
|
|
—
|
|
151,456
|
|
—
|
|
151,456
|
|
|||||||||||
|
Dividends paid on common stock, ($3.05 per share)
|
—
|
|
—
|
|
—
|
|
(144,563
|
)
|
—
|
|
(144,563
|
)
|
|||||||||||
|
Common stock issued on exercise of stock options
|
184,368
|
|
2
|
|
827
|
|
—
|
|
—
|
|
829
|
|
|||||||||||
|
Issuance of non-vested stock, net of forfeitures
|
128,395
|
|
1
|
|
(1
|
)
|
—
|
|
—
|
|
—
|
|
|||||||||||
|
Amortization of non-vested stock grants, net of forfeitures
|
—
|
|
—
|
|
6,403
|
|
—
|
|
—
|
|
6,403
|
|
|||||||||||
|
Common stock purchased and retired
|
(8,600
|
)
|
—
|
|
(296
|
)
|
—
|
|
—
|
|
(296
|
)
|
|||||||||||
|
Income tax benefit related to exercise of stock options
|
—
|
|
—
|
|
3,681
|
|
—
|
|
—
|
|
3,681
|
|
|||||||||||
|
Change in unrealized loss on investments, net of tax
|
—
|
|
—
|
|
—
|
|
—
|
|
(28
|
)
|
(28
|
)
|
|||||||||||
|
BALANCE, January 28, 2012
|
47,432,089
|
|
$
|
474
|
|
$
|
100,333
|
|
$
|
263,039
|
|
$
|
(699
|
)
|
$
|
363,147
|
|
||||||
|
Net income
|
—
|
|
—
|
|
—
|
|
164,305
|
|
—
|
|
164,305
|
|
|||||||||||
|
Dividends paid on common stock, ($5.30 per share)
|
—
|
|
—
|
|
—
|
|
(254,633
|
)
|
—
|
|
(254,633
|
)
|
|||||||||||
|
Common stock issued on exercise of stock options
|
377,520
|
|
4
|
|
842
|
|
—
|
|
—
|
|
846
|
|
|||||||||||
|
Issuance of non-vested stock, net of forfeitures
|
249,660
|
|
3
|
|
(3
|
)
|
—
|
|
—
|
|
—
|
|
|||||||||||
|
Amortization of non-vested stock grants, net of forfeitures
|
—
|
|
—
|
|
8,388
|
|
—
|
|
—
|
|
8,388
|
|
|||||||||||
|
Income tax benefit related to exercise of stock options
|
—
|
|
—
|
|
7,831
|
|
—
|
|
—
|
|
7,831
|
|
|||||||||||
|
Change in unrealized loss on investments, net of tax
|
—
|
|
—
|
|
—
|
|
—
|
|
(235
|
)
|
(235
|
)
|
|||||||||||
|
|
|||||||||||||||||||||||
|
BALANCE, February 2, 2013
|
48,059,269
|
|
$
|
481
|
|
$
|
117,391
|
|
$
|
172,711
|
|
$
|
(934
|
)
|
$
|
289,649
|
|
||||||
|
Net income
|
—
|
|
—
|
|
—
|
|
162,584
|
|
—
|
|
162,584
|
|
|||||||||||
|
Dividends paid on common stock, ($2.02 per share)
|
—
|
|
—
|
|
—
|
|
(97,144
|
)
|
—
|
|
(97,144
|
)
|
|||||||||||
|
Common stock issued on exercise of stock options
|
25,555
|
|
—
|
|
—
|
|
—
|
|
—
|
|
—
|
|
|||||||||||
|
Issuance of non-vested stock, net of forfeitures
|
251,568
|
|
2
|
|
(2
|
)
|
—
|
|
—
|
|
—
|
|
|||||||||||
|
Amortization of non-vested stock grants, net of forfeitures
|
—
|
|
—
|
|
5,066
|
|
—
|
|
—
|
|
5,066
|
|
|||||||||||
|
Income tax benefit related to exercise of stock options
|
—
|
|
—
|
|
1,679
|
|
—
|
|
—
|
|
1,679
|
|
|||||||||||
|
Change in unrealized loss on investments, net of tax
|
—
|
|
—
|
|
—
|
|
—
|
|
96
|
|
96
|
|
|||||||||||
|
BALANCE, February 1, 2014
|
48,336,392
|
|
$
|
483
|
|
$
|
124,134
|
|
$
|
238,151
|
|
$
|
(838
|
)
|
$
|
361,930
|
|
||||||
See notes to consolidated financial statements.
33
THE BUCKLE, INC.
(Amounts in Thousands)
|
|
Fiscal Years Ended
|
||||||||||
|
|
February 1,
2014 |
February 2,
2013 |
January 28,
2012 |
||||||||
|
CASH FLOWS FROM OPERATING ACTIVITIES:
|
|
|
|||||||||
|
Net income
|
$
|
162,584
|
|
$
|
164,305
|
|
$
|
151,456
|
|
||
|
Adjustments to reconcile net income to net cash flows from operating activities:
|
|
|
|
|
|||||||
|
Depreciation and amortization
|
32,631
|
|
33,834
|
|
32,769
|
|
|||||
|
Amortization of non-vested stock grants, net of forfeitures
|
5,066
|
|
8,388
|
|
6,403
|
|
|||||
|
Deferred income taxes
|
(2,086
|
)
|
(1,939
|
)
|
5,417
|
|
|||||
|
Other
|
988
|
|
1,528
|
|
859
|
|
|||||
|
Changes in operating assets and liabilities:
|
|
|
|
|
|||||||
|
Receivables
|
(989
|
)
|
596
|
|
1,232
|
|
|||||
|
Inventory
|
(20,288
|
)
|
356
|
|
(15,616
|
)
|
|||||
|
Prepaid expenses and other assets
|
(2,255
|
)
|
(10,281
|
)
|
321
|
|
|||||
|
Accounts payable
|
2,738
|
|
6,534
|
|
(2,883
|
)
|
|||||
|
Accrued employee compensation
|
(5,250
|
)
|
(671
|
)
|
6,836
|
|
|||||
|
Accrued store operating expenses
|
(138
|
)
|
(1,004
|
)
|
1,472
|
|
|||||
|
Gift certificates redeemable
|
910
|
|
1,935
|
|
3,073
|
|
|||||
|
Income taxes payable
|
(2,699
|
)
|
14,897
|
|
18,007
|
|
|||||
|
Deferred rent liabilities and deferred compensation
|
2,814
|
|
2,463
|
|
(73
|
)
|
|||||
|
Net cash flows from operating activities
|
174,026
|
|
220,941
|
|
209,273
|
|
|||||
|
CASH FLOWS FROM INVESTING ACTIVITIES:
|
|
|
|
|
|||||||
|
Purchases of property and equipment
|
(28,811
|
)
|
(30,297
|
)
|
(36,627
|
)
|
|||||
|
Proceeds from sale of property and equipment
|
11
|
|
1,140
|
|
9
|
|
|||||
|
Change in other assets
|
112
|
|
130
|
|
19
|
|
|||||
|
Purchases of investments
|
(32,314
|
)
|
(29,933
|
)
|
(14,099
|
)
|
|||||
|
Proceeds from sales/maturities of investments
|
30,981
|
|
37,294
|
|
33,125
|
|
|||||
|
Net cash flows from investing activities
|
(30,021
|
)
|
(21,666
|
)
|
(17,573
|
)
|
|||||
|
CASH FLOWS FROM FINANCING ACTIVITIES:
|
|
|
|
|
|||||||
|
Proceeds from the exercise of stock options
|
—
|
|
846
|
|
829
|
|
|||||
|
Excess tax benefit from stock option exercises
|
399
|
|
5,609
|
|
2,371
|
|
|||||
|
Purchases of common stock
|
—
|
|
—
|
|
(296
|
)
|
|||||
|
Payment of dividends
|
(97,144
|
)
|
(254,633
|
)
|
(144,563
|
)
|
|||||
|
Net cash flows from financing activities
|
(96,745
|
)
|
(248,178
|
)
|
(141,659
|
)
|
|||||
|
NET INCREASE (DECREASE) IN CASH AND CASH EQUIVALENTS
|
47,260
|
|
(48,903
|
)
|
50,041
|
|
|||||
|
CASH AND CASH EQUIVALENTS, Beginning of year
|
117,608
|
|
166,511
|
|
116,470
|
|
|||||
|
CASH AND CASH EQUIVALENTS, End of year
|
$
|
164,868
|
|
$
|
117,608
|
|
$
|
166,511
|
|
||
See notes to consolidated financial statements.
34
THE BUCKLE, INC.
NOTES TO CONSOLIDATED FINANCIAL STATEMENTS
(Dollar Amounts in Thousands Except Share and Per Share Amounts)
|
A.
|
SUMMARY OF SIGNIFICANT ACCOUNTING POLICIES
|
Fiscal Year
- The Buckle, Inc. (the “Company”) has its fiscal year end on the Saturday nearest January 31. All references in these consolidated financial statements to fiscal years are to the calendar year in which the fiscal year begins. Fiscal
2013
represents the 52-week period ended
February 1, 2014
, fiscal
2012
represents the 53-week period ended
February 2, 2013
, and fiscal
2011
represents the 52-week period ended
January 28, 2012
.
Nature of Operations
- The Company is a retailer of medium to better-priced casual apparel, footwear, and accessories for fashion-conscious young men and women operating
450
stores located in
43
states throughout the continental United States as of
February 1, 2014
.
During fiscal
2013
, the Company opened
13
new stores, substantially renovated
8
stores, and closed
3
stores. During fiscal
2012
, the Company opened
10
new stores, substantially renovated
21
stores, and closed
1
store. During fiscal
2011
, the Company opened
13
new stores, substantially renovated
24
stores, and closed
2
stores.
Principles of Consolidation -
The consolidated financial statements include the accounts of The Buckle, Inc. and its wholly-owned subsidiary. All intercompany accounts and transactions have been eliminated in consolidation.
Revenue Recognition
- Retail store sales are recorded upon the purchase of merchandise by customers. Online sales are recorded when merchandise is delivered to the customer, with the time of delivery being based on estimated shipping time from the Company’s distribution center to the customer. Shipping fees charged to customers are included in revenue and shipping costs are included in selling expenses. Shipping costs were
$6,223
,
$6,477
, and
$7,618
during fiscal
2013
,
2012
, and
2011
, respectively. Merchandise returns are estimated based upon the historical average sales return percentage and accrued at the end of the period. The reserve for merchandise returns was
$750
and
$853
as of
February 1, 2014
and
February 2, 2013
, respectively. The Company recognizes revenue from sales made under its layaway program upon delivery of the merchandise to the customer.
The Company records the sale of gift cards and gift certificates as a current liability and recognizes a sale when a customer redeems the gift card or gift certificate. The amount of the gift certificate liability is determined using the outstanding balances from the prior
three years
of issuance and the gift card liability is determined using the outstanding balances from the prior
four years
of issuance. The Company records breakage as other income when the probability of redemption, which is based on historical redemption patterns, is remote. Breakage reported for the fiscal years ended
February 1, 2014
,
February 2, 2013
, and
January 28, 2012
was
$1,146
,
$755
, and
$701
, respectively. The Company recognizes a current liability for the down payment and subsequent installment payments made when merchandise is placed on layaway and recognizes layaways as a sale at the time the customer makes final payment and picks up the merchandise.
Cash and Cash Equivalents
- The Company considers all highly liquid debt instruments with an original maturity of three months or less when purchased to be cash equivalents.
Investments
- Investments classified as short-term investments include securities with a maturity of greater than three months and less than one year, and a portion of the Company’s investments in auction-rate securities (“ARS”), which are available-for-sale securities. Available-for-sale securities are reported at fair value, with unrealized gains and losses excluded from earnings and reported as a separate component of stockholders’ equity (net of the effect of income taxes), using the specific identification method, until they are sold. The Company reviews impairments to determine the classification of potential impairments as either “temporary” or “other-than-temporary.” A temporary impairment results in an unrealized loss being recorded in other comprehensive income. Impairments that are considered other-than-temporary are recognized as a loss in the consolidated statements of income. The Company considers various factors in reviewing impairments, including the length of time and extent to which the fair value has been less than the Company’s cost basis, the financial condition and near-term prospects of the issuer, and the Company’s intent and ability to hold the investments for a period of time sufficient to allow for any anticipated recovery in market value. Held-to-maturity securities are carried at amortized cost. The Company believes it has the ability and maintains its intent to hold these investments until recovery of market value occurs or until the ultimate maturity of the investments. Trading securities are reported at fair value, with unrealized gains and losses included in earnings, using the specific identification method.
35
Inventory
- Inventory is stated at the lower of cost or market. Cost is determined using the average cost method. Management makes adjustments to inventory and cost of goods sold to account for merchandise obsolescence and markdowns based on assumptions using calculations applied to current inventory levels by department within each different markdown level. Management also reviews the levels of inventory in each markdown group, and the overall aging of inventory, versus the estimated future demand for such product and the current market conditions. The calculation for estimated markdowns and/or obsolescence reduced the Company’s inventory valuation by
$7,415
and
$6,286
as of
February 1, 2014
and
February 2, 2013
, respectively. The amount charged (credited) to cost of goods sold, resulting from adjustments for estimated markdowns and/or obsolescence, was
$1,129
,
$1,382
, and
$(183)
, for fiscal years
2013
,
2012
, and
2011
, respectively.
Property and Equipment
- Property and equipment are stated on the basis of historical cost. Depreciation is provided using a combination of accelerated and straight-line methods based upon the estimated useful lives of the assets. The majority of property and equipment have useful lives of
five
to
ten
years with the exception of buildings, which have estimated useful lives of
31.5
to
39
years. Leasehold improvements are stated on the basis of historical cost and are amortized over the shorter of the life of the lease or the estimated economic life of the assets. When circumstances indicate the carrying values of long-lived assets may be impaired, an evaluation is performed on current net book value amounts. Judgments made by the Company related to the expected useful lives of property and equipment and the ability to realize cash flows in excess of carrying amounts of such assets are affected by factors such as changes in economic conditions and changes in operating performance. As the Company assesses the expected cash flows and carrying amounts of long-lived assets, adjustments are made to such carrying values.
Pre-Opening Expenses
- Costs related to opening new stores are expensed as incurred.
Advertising Costs
- Advertising costs are expensed as incurred and were
$11,088
,
$10,214
and
$8,865
for fiscal years
2013
,
2012
, and
2011
, respectively.
Health Care Costs
-The Company is self-funded for health and dental claims up to
$200
per individual per plan year. The Company’s plan covers eligible employees, and management makes estimates at period end to record a reserve for unpaid claims based upon historical claims information. The accrued liability as a reserve for unpaid health care claims was
$875
and
$675
as of
February 1, 2014
and
February 2, 2013
, respectively.
Operating Leases
- The Company leases retail stores under operating leases. Most lease agreements contain tenant improvement allowances, rent holidays, rent escalation clauses, and/or contingent rent provisions. For purposes of recognizing lease incentives and minimum rental expenses on a straight-line basis over the terms of the leases, the Company uses the date of initial possession to begin expensing rent, which is generally when the Company enters the space and begins to make improvements in preparation of intended use.
For tenant improvement allowances and rent holidays, the Company records a deferred rent liability on the consolidated balance sheets and amortizes the deferred rent over the terms of the leases as reductions to rent expense on the consolidated statements of income.
For scheduled rent escalation clauses during the lease terms or for rental payments commencing at a date other than the date of initial occupancy, the Company records minimum rental expenses on a straight-line basis over the terms of the leases on the consolidated statements of income. Certain leases provide for contingent rents, which are determined as a percentage of gross sales in excess of specified levels. The Company records a contingent rent liability in “accrued store operating expenses” on the consolidated balance sheets and the corresponding rent expense when specified levels have been achieved or are reasonably probable to be achieved.
Other Income
- The Company’s other income is derived primarily from interest and dividends received on cash and investments.
36
Income Taxes -
The Company records a deferred tax asset and liability for expected future tax consequences resulting from temporary differences between financial reporting and tax bases of assets and liabilities. The Company considers future taxable income and ongoing tax planning in assessing the value of its deferred tax assets. If the judgment of the Company’s management determines that it is more than likely that these assets will not be realized, the Company would reduce the value of these assets to their expected realizable value, thereby decreasing net income. If the Company subsequently determined that the deferred tax assets, which had been written down, would be realized in the future, such value would be increased, thus increasing net income in the period such determination was made. The Company records tax benefits only for tax positions that are more than likely to be sustained upon examination by tax authorities. The amount recognized is measured as the largest amount of benefit that is greater than
50%
likely to be realized upon ultimate settlement. Unrecognized tax benefits are tax benefits claimed in the Company’s tax returns that do not meet these recognition and measurement standards.
Financial Instruments and Credit Risk Concentrations
- Financial instruments, which potentially subject the Company to concentrations of credit risk, are primarily cash, investments, and accounts receivable. The Company’s investments are primarily in tax-free municipal bonds, auction-rate securities, corporate bonds, or U.S. Treasury securities with short-term maturities. The majority of the Company’s cash and cash equivalents are held by Wells Fargo Bank, N.A. This amount, as well as cash and investments held by certain other financial institutions, exceed federally insured limits.
Of the Company’s
$228,501
in total cash and investments as of
February 1, 2014
,
$9,644
was comprised of investments in auction-rate securities (“ARS”). ARS have a long-term stated maturity, but are reset through a “dutch auction” process that occurs every
7
to
49
days, depending on the terms of the individual security. Until February 2008, the ARS market was highly liquid. During February 2008, however, a significant number of auctions related to these securities failed, meaning that there was not enough demand to sell the entire issue at auction. The failed auctions have limited the current liquidity of certain of the Company’s investments in ARS and the Company has reason to believe that certain of the underlying issuers of its ARS are currently at risk. The Company does not, however, anticipate that further auction failures will have a material impact on the Company’s ability to fund its business.
Concentrations of credit risk with respect to accounts receivable are limited due to the nature of the Company’s receivables, which include primarily employee receivables that can be offset against future compensation. The Company’s financial instruments have a fair value approximating the carrying value.
Earnings Per Share
- Basic earnings per share data are based on the weighted average outstanding common shares during the period. Diluted earnings per share data are based on the weighted average outstanding common shares and the effect of all dilutive potential common shares, including stock options.
Use of Estimates
- The preparation of consolidated financial statements in conformity with accounting principles generally accepted in the United States of America requires management to make estimates and assumptions that affect the reported amounts of certain assets and liabilities, the disclosure of contingent assets and liabilities at the date of the financial statements, and the reported amounts of revenues and expenses during the reporting period. Actual results could differ from these estimates.
Recently Issued Accounting Pronouncements
- In February 2013, the FASB issued ASU No. 2013-02,
Reporting of Amounts Reclassified Out of Accumulated Other Comprehensive Income
, which adds additional disclosure requirements for items reclassified out of accumulated other comprehensive income. The additional disclosure requirements are effective for interim and annual reporting periods beginning after December 15, 2012. The adoption of ASU 2013-02 did not have a material impact on the Company’s financial position or results of operations, as there were no such reclassifications during the periods presented in this Form 10-K.
Supplemental Cash Flow Information
- The Company had non-cash investing activities during fiscal years
2013
,
2012
, and
2011
of
$(285)
,
$(174)
, and
$3,190
, respectively. The non-cash investing activity relates to the change in the balance of unpaid purchases of property, plant, and equipment included in accounts payable as of the end of the year. The liability for unpaid purchases of property, plant, and equipment included in accounts payable was
$1,304
,
$1,019
, and
$845
as of
February 1, 2014
,
February 2, 2013
, and
January 28, 2012
, respectively. Amounts reported as unpaid purchases are recorded as cash outflows from investing activities for purchases of property, plant, and equipment in the consolidated statement of cash flows in the period they are paid.
Additional cash flow information for the Company includes cash paid for income taxes during fiscal years
2013
,
2012
, and
2011
of
$102,259
,
$78,828
, and
$63,230
, respectively.
37
|
B.
|
INVESTMENTS
|
The following is a summary of investments as of
February 1, 2014
:
|
Amortized
Cost or
Par Value
|
Gross
Unrealized
Gains
|
Gross
Unrealized
Losses
|
Other-than-
Temporary
Impairment
|
Estimated
Fair
Value
|
|||||||||||||||
|
Available-for-Sale Securities:
|
|
|
|
|
|
||||||||||||||
|
Auction-rate securities
|
$
|
10,975
|
|
$
|
—
|
|
$
|
(1,331
|
)
|
$
|
—
|
|
$
|
9,644
|
|
||||
|
Held-to-Maturity Securities:
|
|
|
|
|
|
|
|
|
|
||||||||||
|
State and municipal bonds
|
$
|
41,192
|
|
$
|
210
|
|
$
|
(2
|
)
|
$
|
—
|
|
$
|
41,400
|
|
||||
|
Trading Securities:
|
|
|
|
|
|
|
|
|
|
|
|||||||||
|
Mutual funds
|
$
|
11,769
|
|
$
|
1,028
|
|
$
|
—
|
|
$
|
—
|
|
$
|
12,797
|
|
||||
The following is a summary of investments as of
February 2, 2013
:
|
Amortized
Cost or
Par Value
|
Gross
Unrealized
Gains
|
Gross
Unrealized
Losses
|
Other-than-
Temporary
Impairment
|
Estimated
Fair
Value
|
|||||||||||||||
|
Available-for-Sale Securities:
|
|
|
|
|
|
||||||||||||||
|
Auction-rate securities
|
$
|
13,075
|
|
$
|
—
|
|
$
|
(1,482
|
)
|
$
|
(725
|
)
|
$
|
10,868
|
|
||||
|
Preferred stock
|
2,000
|
|
—
|
|
—
|
|
(1,974
|
)
|
26
|
|
|||||||||
|
|
$
|
15,075
|
|
$
|
—
|
|
$
|
(1,482
|
)
|
$
|
(2,699
|
)
|
$
|
10,894
|
|
||||
|
Held-to-Maturity Securities:
|
|
|
|
|
|
|
|
|
|
||||||||||
|
State and municipal bonds
|
$
|
40,155
|
|
$
|
108
|
|
$
|
(15
|
)
|
$
|
—
|
|
$
|
40,248
|
|
||||
|
Certificates of deposit
|
500
|
|
4
|
|
—
|
|
—
|
|
504
|
|
|||||||||
|
|
$
|
40,655
|
|
$
|
112
|
|
$
|
(15
|
)
|
$
|
—
|
|
$
|
40,752
|
|
||||
|
Trading Securities:
|
|
|
|
|
|
|
|
|
|
|
|||||||||
|
Mutual funds
|
$
|
10,257
|
|
$
|
343
|
|
$
|
—
|
|
$
|
—
|
|
$
|
10,600
|
|
||||
The auction-rate securities were invested as follows as of
February 1, 2014
:
|
Nature
|
Underlying Collateral
|
Par Value
|
||||
|
Municipal revenue bonds
|
100% insured by AAA/AA/A-rated bond insurers
|
$
|
7,975
|
|
||
|
Municipal bond funds
|
Fixed income instruments within issuers' money market funds
|
50
|
|
|||
|
Student loan bonds
|
Student loans guaranteed by state entities
|
2,950
|
|
|||
|
Total par value
|
|
$
|
10,975
|
|
||
As of
February 1, 2014
, the Company’s auction-rate securities portfolio was
74%
AA/Aa-rated and
26%
A-rated.
38
The amortized cost and fair value of debt securities by contractual maturity as of
February 1, 2014
is as follows:
|
Amortized
Cost
|
Fair
Value
|
||||||
|
Held-to-Maturity Securities
|
|
|
|||||
|
Less than 1 year
|
$
|
20,197
|
|
$
|
20,221
|
|
|
|
1 - 5 years
|
20,995
|
|
21,179
|
|
|||
|
|
$
|
41,192
|
|
$
|
41,400
|
|
|
At
February 1, 2014
and
February 2, 2013
,
$9,644
and
$10,869
of available-for-sale securities and
$20,995
and
$14,266
of held-to-maturity securities are classified in long-term investments. Trading securities are held in a Rabbi Trust, intended to fund the Company’s deferred compensation plan, and are classified in long-term investments.
The Company’s investments in auction-rate securities (“ARS”) and preferred securities are classified as available-for-sale and reported at fair market value. As of
February 1, 2014
, the reported investment amount is net of
$1,331
of temporary impairment to account for the impairment of certain securities from their stated par value. The
$1,331
temporary impairment is reported, net of tax, as an “accumulated other comprehensive loss” of
$838
in stockholders’ equity as of
February 1, 2014
. For the investments considered temporarily impaired, all of which have been in loss positions for over a year, the Company believes that these ARS can be successfully redeemed or liquidated in the future at par value plus accrued interest. The Company believes it has the ability and maintains its intent to hold these investments until such recovery of market value occurs; therefore, the Company believes the current lack of liquidity has created the temporary impairment in valuation and has classified the investments in long-term investments.
As of
February 1, 2014
, the Company had
$10,975
invested in ARS, at par value, which is reported at its estimated fair value of
$9,644
. As of
February 2, 2013
, the Company had
$13,075
invested in ARS and
$2,000
invested in preferred securities, which were reported at their estimated fair value of
$10,868
and
$26
, respectively. ARS have a long-term stated maturity, but are reset through a “dutch auction” process that occurs every
7
to
49
days, depending on the terms of the individual security. Until February 2008, the ARS market was highly liquid. During February 2008, however, a significant number of auctions related to these securities failed, meaning that there was not enough demand to sell the entire issue at auction. The failed auctions have limited the current liquidity of certain of the Company’s investments in ARS and the Company has reason to believe that certain of the underlying issuers of its ARS are currently at risk. The Company does not, however, anticipate that further auction failures will have a material impact on the Company’s ability to fund its business. During fiscal years
2013
,
2012
, and
2011
, the Company was able to successfully liquidate ARS and preferred securities with a par value of
$4,100
,
$2,900
, and
$5,750
, respectively. The Company reviews all investments for other-than-temporary impairment ("OTTI") at least quarterly or as indicators of impairment exist. Indicators of impairment include the duration and severity of decline in market value. In addition, the Company considers qualitative factors including, but not limited to, the financial condition of the investee, the credit rating of the investee, and the current and expected market and industry conditions in which the investee operates.
As of
February 1, 2014
, all of the Company’s investments in ARS were classified in long-term investments. As of
February 2, 2013
,
$25
of the Company’s investments in ARS and preferred securities was classified in short-term investments (due to a known upcoming redemption at par value) and
$10,869
was classified in long-term investments.
39
|
C.
|
FAIR VALUE MEASUREMENTS
|
Fair value is the price that would be received to sell an asset or paid to transfer a liability in an orderly transaction between market participants at the measurement date. Financial assets and liabilities measured and reported at fair value are classified and disclosed in one of the following categories:
|
•
|
Level 1 – Quoted market prices in active markets for identical assets or liabilities. Short-term and long-term investments with active markets or known redemption values are reported at fair value utilizing Level 1 inputs.
|
|
•
|
Level 2 – Observable market-based inputs (either directly or indirectly) such as quoted prices for similar assets or liabilities, quoted prices in markets that are not active, or other inputs that are observable or inputs that are corroborated by market data.
|
|
•
|
Level 3 – Unobservable inputs that are not corroborated by market data and are projections, estimates, or interpretations that are supported by little or no market activity and are significant to the fair value of the assets. The Company has concluded that certain of its ARS represent Level 3 valuation and should be valued using a discounted cash flow analysis. The assumptions used in preparing the discounted cash flow model include estimates for interest rates, timing and amount of cash flows, and expected holding periods of the ARS. As of
February 1, 2014
, the unobservable inputs used by the Company and its independent third-party valuation consultant in valuing its Level 3 investments in ARS included:
|
|
◦
|
Durations until redemption ranging from
3.1
to
5.7
years, with a weighted average of
4.9
years.
|
|
◦
|
Discount rates ranging from
3.93%
to
4.93%
, with a weighted average of
4.56%
.
|
As of
February 1, 2014
and
February 2, 2013
, the Company held certain assets that are required to be measured at fair value on a recurring basis including available-for-sale and trading securities. The Company’s available-for-sale securities include its investments in ARS, as further described in Note B. The failed auctions, beginning in February 2008, related to certain of the Company’s investments in ARS have limited the availability of quoted market prices. The Company has determined the fair value of its ARS using Level 1 inputs for known or anticipated subsequent redemptions at par value, Level 2 inputs using observable inputs, and Level 3 using unobservable inputs where the following criteria were considered in estimating fair value:
|
•
|
Pricing was provided by the custodian or third-party broker for ARS;
|
|
•
|
Sales of similar securities;
|
|
•
|
Quoted prices for similar securities in active markets;
|
|
•
|
Quoted prices for publicly traded preferred securities;
|
|
•
|
Quoted prices for similar assets in markets that are not active - including markets where there are few transactions for the asset, the prices are not current, or price quotations vary substantially either over time or among market makers, or in which little information is released publicly;
|
|
•
|
Pricing was provided by a third-party valuation consultant (using Level 3 inputs).
|
In addition, the Company considers other factors including, but not limited to, the financial condition of the investee, the credit rating, insurance, guarantees, collateral, cash flows, and the current and expected market and industry conditions in which the investee operates. Management believes it has used information that was reasonably obtainable in order to complete its valuation process and determine if the Company’s investments in ARS had incurred any temporary and/or other-than-temporary impairment as of
February 1, 2014
and
February 2, 2013
.
40
Future fluctuations in fair value of ARS that the Company judges to be temporary, including any recoveries of previous write-downs, would be recorded as an adjustment to “accumulated other comprehensive loss.” The value and liquidity of ARS held by the Company may be affected by continued auction-rate failures, the credit quality of each security, the amount and timing of interest payments, the amount and timing of future principal payments, and the probability of full repayment of the principal. Additional indicators of impairment include the duration and severity of the decline in market value. The interest rates on these investments will be determined by the terms of each individual ARS. The material risks associated with the ARS held by the Company include those stated above as well as the current economic environment, downgrading of credit ratings on investments held, and the volatility of the entities backing each of the issues.
The Company’s financial assets measured at fair value on a recurring basis are as follows:
|
|
Fair Value Measurements at Reporting Date Using
|
||||||||||||||
|
Quoted Prices in
Active Markets
for Identical
Assets
|
Significant
Observable
Inputs
|
Significant
Unobservable
Inputs
|
|||||||||||||
|
February 1, 2014
|
(Level 1)
|
(Level 2)
|
(Level 3)
|
Total
|
|||||||||||
|
Available-for-sale securities:
|
|
|
|
|
|||||||||||
|
Auction-rate securities
|
$
|
—
|
|
$
|
177
|
|
$
|
9,467
|
|
$
|
9,644
|
|
|||
|
Trading securities (including mutual funds)
|
12,797
|
|
—
|
|
—
|
|
12,797
|
|
|||||||
|
Totals
|
$
|
12,797
|
|
$
|
177
|
|
$
|
9,467
|
|
$
|
22,441
|
|
|||
|
|
Fair Value Measurements at Reporting Date Using
|
||||||||||||||
|
Quoted Prices in
Active Markets
for Identical
Assets
|
Significant
Observable
Inputs
|
Significant
Unobservable
Inputs
|
|||||||||||||
|
February 2, 2013
|
(Level 1)
|
(Level 2)
|
(Level 3)
|
Total
|
|||||||||||
|
Available-for-sale securities:
|
|
|
|
|
|||||||||||
|
Auction-rate securities
|
$
|
—
|
|
$
|
178
|
|
$
|
10,690
|
|
$
|
10,868
|
|
|||
|
Preferred stock
|
26
|
|
—
|
|
—
|
|
26
|
|
|||||||
|
Trading securities (including mutual funds)
|
10,600
|
|
—
|
|
—
|
|
10,600
|
|
|||||||
|
Totals
|
$
|
10,626
|
|
$
|
178
|
|
$
|
10,690
|
|
$
|
21,494
|
|
|||
Securities included in Level 1 represent securities which have a known or anticipated upcoming redemption as of the reporting date and those that have publicly traded quoted prices. ARS included in Level 2 represent securities which have not experienced a successful auction subsequent to the end of fiscal 2007. The fair market value for these securities was determined by applying a discount to par value based on auction prices for similar securities and by utilizing a discounted cash flow model, using market-based inputs, to determine fair value. The Company used a discounted cash flow model to value its Level 3 investments, using estimates regarding recovery periods, yield, and liquidity. The assumptions used are subjective based upon management’s judgment and views on current market conditions, and resulted in
$1,308
of the Company’s recorded temporary impairment as of
February 1, 2014
. The use of different assumptions would result in a different valuation and related temporary impairment charge.
41
Changes in the fair value of the Company’s financial assets measured at fair value on a recurring basis are as follows:
|
|
Fifty-two Weeks Ended February 1, 2014
|
||||||||||||||
|
|
Fair Value Measurements Using Significant Unobservable Inputs (Level 3)
|
||||||||||||||
|
|
Available-for-Sale Securities
|
Trading Securities
|
|
||||||||||||
|
Auction-rate
Securities
|
Preferred
Stock
|
Mutual
Funds
|
Total
|
||||||||||||
|
Balance, beginning of year
|
$
|
10,690
|
|
$
|
—
|
|
$
|
—
|
|
$
|
10,690
|
|
|||
|
Total gains and losses:
|
|
|
|
|
|
|
|
|
|||||||
|
Included in other comprehensive income
|
152
|
|
—
|
|
—
|
|
152
|
|
|||||||
|
Purchases, Issuances, Sales, and Settlements:
|
|
|
|
|
|
|
|
|
|||||||
|
Sales
|
(1,375
|
)
|
—
|
|
—
|
|
(1,375
|
)
|
|||||||
|
Balance, end of year
|
$
|
9,467
|
|
$
|
—
|
|
$
|
—
|
|
$
|
9,467
|
|
|||
|
|
Fifty-three Weeks Ended February 2, 2013
|
||||||||||||||
|
|
Fair Value Measurements Using Significant Unobservable Inputs (Level 3)
|
||||||||||||||
|
|
Available-for-Sale Securities
|
Trading Securities
|
|
||||||||||||
|
Auction-rate
Securities
|
Preferred
Stock
|
Mutual
Funds
|
Total
|
||||||||||||
|
Balance, beginning of year
|
$
|
11,220
|
|
$
|
—
|
|
$
|
—
|
|
$
|
11,220
|
|
|||
|
Total gains and losses:
|
|
|
|
|
|
|
|
|
|||||||
|
Included in other comprehensive income
|
(480
|
)
|
—
|
|
—
|
|
(480
|
)
|
|||||||
|
Purchases, Issuances, Sales, and Settlements:
|
|
|
|
|
|
|
|
|
|||||||
|
Sales
|
(50
|
)
|
—
|
|
—
|
|
(50
|
)
|
|||||||
|
Balance, end of year
|
$
|
10,690
|
|
$
|
—
|
|
$
|
—
|
|
$
|
10,690
|
|
|||
There were no transfers of securities between Levels 1, 2, or 3 during the
fiscal years
ended
February 1, 2014
or
February 2, 2013
. The Company’s policy is to recognize transfers in and transfers out as of the beginning of the reporting period in which the transfer occurred.
The carrying value of cash equivalents approximates fair value due to the low level of risk these assets present and their relatively liquid nature, particularly given their short maturities. The Company also holds certain financial instruments that are not carried at fair value on the consolidated balance sheets, including held-to-maturity securities. Held-to-maturity securities consist of state and municipal bonds, corporate bonds, and certificates of deposit. The fair values of these debt securities are based on quoted market prices and yields for the same or similar securities, which the Company determined to be Level 2 inputs. As of
February 1, 2014
, the fair value of held-to-maturity securities was
$41,400
compared to the carrying amount of
$41,192
. As of
February 2, 2013
, the fair value of held-to-maturity securities was
$40,752
compared to the carrying amount of
$40,655
.
The carrying values of receivables, accounts payable, accrued expenses and other current liabilities approximates fair value because of their short-term nature. From time to time, the Company measures certain assets at fair value on a non-recurring basis, specifically long-lived assets evaluated for impairment. These are typically store specific assets, which are reviewed for impairment when circumstances indicate impairment may exist due to the questionable recoverability of the carrying values of long-lived assets. If expected future cash flows related to a store’s assets are less than their carrying value, an impairment loss would be recognized for the difference between the carrying value and the estimated fair value of the store's assets. The fair value of the store's assets is estimated utilizing an income-based approach based on the expected cash flows over the remaining life of the store's lease. The amount of impairment related to long-lived assets was immaterial as of both
February 1, 2014
and
February 2, 2013
, respectively.
42
|
D.
|
PROPERTY AND EQUIPMENT
|
|
February 1,
2014 |
February 2,
2013 |
||||||
|
Land
|
$
|
2,165
|
|
$
|
2,165
|
|
|
|
Building and improvements
|
28,006
|
|
28,055
|
|
|||
|
Office equipment
|
9,357
|
|
8,265
|
|
|||
|
Transportation equipment
|
20,782
|
|
15,445
|
|
|||
|
Leasehold improvements
|
146,655
|
|
141,165
|
|
|||
|
Furniture and fixtures
|
157,771
|
|
149,836
|
|
|||
|
Shipping/receiving equipment
|
26,392
|
|
25,847
|
|
|||
|
Screenprinting equipment
|
111
|
|
111
|
|
|||
|
Construction-in-progress
|
2,417
|
|
2,397
|
|
|||
|
$
|
393,656
|
|
$
|
373,286
|
|
||
|
E.
|
FINANCING ARRANGEMENTS
|
The Company has available an unsecured line of credit of
$25,000
with Wells Fargo Bank, N.A. for operating needs and letters of credit. The line of credit provides that outstanding letters of credit cannot exceed
$20,000
.
Borrowings under the line of credit provide for interest to be paid at a rate based on LIBOR.
The Company has, from time to time, borrowed against these lines during periods of peak inventory build-up. There were no bank borrowings as of
February 1, 2014
and
February 2, 2013
. There were no bank borrowings during fiscal
2013
,
2012
, and
2011
. The Company had outstanding letters of credit totaling
$3,226
and
$3,243
as of
February 1, 2014
and
February 2, 2013
, respectively. The line of credit is scheduled to expire on
July 31, 2015
.
|
F.
|
INCOME TAXES
|
The provision for income taxes consists of:
|
Fiscal Years Ended
|
|||||||||||
|
February 1,
2014 |
February 2,
2013 |
January 28,
2012 |
|||||||||
|
Current income tax expense:
|
|||||||||||
|
Federal
|
$
|
89,198
|
|
$
|
88,265
|
|
$
|
73,880
|
|
||
|
State
|
10,760
|
|
11,068
|
|
9,728
|
|
|||||
|
Deferred income tax expense
|
(2,086
|
)
|
(1,939
|
)
|
5,417
|
|
|||||
|
Total
|
$
|
97,872
|
|
$
|
97,394
|
|
$
|
89,025
|
|
||
Total income tax expense for the year varies from the amount which would be provided by applying the statutory income tax rate to earnings before income taxes. The primary reasons for this difference (expressed as a percent of pre-tax income) are as follows:
|
Fiscal Years Ended
|
||||||||
|
February 1,
2014 |
February 2,
2013 |
January 28,
2012 |
||||||
|
Statutory rate
|
35.0
|
%
|
35.0
|
%
|
35.0
|
%
|
||
|
State income tax effect
|
2.7
|
|
2.8
|
|
2.7
|
|
||
|
Tax exempt interest income
|
(0.1
|
)
|
(0.1
|
)
|
(0.2
|
)
|
||
|
Other
|
—
|
|
(0.5
|
)
|
(0.5
|
)
|
||
|
Effective tax rate
|
37.6
|
%
|
37.2
|
%
|
37.0
|
%
|
||
43
Deferred income tax assets and liabilities are comprised of the following:
|
February 1,
2014 |
February 2,
2013 |
||||||
|
Deferred income tax assets (liabilities):
|
|||||||
|
Inventory
|
$
|
5,020
|
|
$
|
4,260
|
|
|
|
Stock-based compensation
|
4,012
|
|
4,595
|
|
|||
|
Accrued compensation
|
4,903
|
|
4,121
|
|
|||
|
Accrued store operating costs
|
655
|
|
733
|
|
|||
|
Realized and unrealized loss on securities
|
1,264
|
|
1,843
|
|
|||
|
Gift certificates redeemable
|
1,311
|
|
1,060
|
|
|||
|
Allowance for doubtful accounts
|
4
|
|
3
|
|
|||
|
Deferred rent liability
|
13,899
|
|
13,670
|
|
|||
|
Property and equipment
|
(31,411
|
)
|
(33,390
|
)
|
|||
|
Less: Valuation allowance
|
(925
|
)
|
(194
|
)
|
|||
|
Net deferred income tax asset (liability)
|
$
|
(1,268
|
)
|
$
|
(3,299
|
)
|
|
As of
February 1, 2014
and
February 2, 2013
, respectively, the net current deferred income tax assets of
$9,353
and
$8,523
are classified in “prepaid expenses and other assets.” As of
February 1, 2014
and
February 2, 2013
, respectively, the net non-current deferred income tax liabilities of
$10,621
and
$11,822
are classified in “other liabilities.” There are no unrecognized tax benefits recorded in the Company’s consolidated financial statements as of
February 1, 2014
or
February 2, 2013
. The Company has no open examinations with the Internal Revenue Service and fiscal years
2010
, 2011, 2012 and
2013
remain subject to examination by the Internal Revenue Service as well as state taxing authorities.
Valuation allowances are recorded to reduce the value of deferred tax assets to the amount that is more likely than not to be realized. As of
February 1, 2014
, the Company had
$1,152
in deferred tax assets for capital loss carryforwards, which expire in periods from fiscal 2014 through fiscal 2019, and a related valuation allowance of
$(925)
. As of
February 2, 2013
, the Company had a deferred tax asset of
$423
for capital loss carryforwards and a related valuation allowance of
$(194)
.
|
G.
|
RELATED PARTY TRANSACTIONS
|
Included in other assets is a note receivable of
$1,155
as of
February 1, 2014
and
$1,125
as of
February 2, 2013
, respectively, from a life insurance trust fund controlled by the Company’s Chairman. The note was created over
three years
, beginning in July 1994, when the Company paid life insurance premiums of
$200
each year for the Chairman on a personal policy. The note accrues interest at
5%
of the principal balance per year and is to be paid from the life insurance proceeds. The note is secured by a life insurance policy on the Chairman.
|
H.
|
COMMITMENTS
|
Leases
- The Company conducts its operations in leased facilities under numerous non-cancelable operating leases expiring at various dates through fiscal 2024. Most of the Company’s stores have lease terms of approximately ten years and generally do not contain renewal options. Most lease agreements contain tenant improvement allowances, rent holidays, rent escalation clauses, and/or contingent rent provisions. For purposes of recognizing lease incentives and minimum rental expenses on a straight-line basis over the terms of the leases, the Company uses the date of initial possession to begin amortization, which is generally when the Company enters the space and begins to make improvements in preparation of intended use. For tenant improvement allowances and rent holidays, the Company records a deferred rent liability on the consolidated balance sheets and amortizes the deferred rent over the terms of the leases as reductions to rent expense on the consolidated statements of income. For scheduled rent escalation clauses during the lease terms or for rental payments commencing at a date other than the date of initial occupancy, the Company records minimum rental expenses on a straight-line basis over the terms of the leases on the consolidated statements of income. Certain leases provide for contingent rents, which are determined as a percentage of gross sales in excess of specified levels. The Company records a contingent rent liability on the consolidated balance sheets and the corresponding rent expense when specified levels have been achieved or are reasonably probable to be achieved. Operating lease base rental expense for fiscal
2013
,
2012
, and
2011
was
$61,640
,
$58,683
, and
$54,626
, respectively. Most of the rental payments are based on a minimum annual rental plus a percentage of sales in excess of a specified amount. Percentage rents for fiscal
2013
,
2012
, and
2011
were
$5,080
,
$5,163
, and
$5,256
, respectively.
44
Total future minimum rental commitments under these operating leases with remaining lease terms in excess of one year as of
February 1, 2014
are as follows:
|
Minimum Rental
|
|||
|
Fiscal Year
|
Commitments
|
||
|
2014
|
$
|
62,915
|
|
|
2015
|
57,745
|
|
|
|
2016
|
52,628
|
|
|
|
2017
|
47,617
|
|
|
|
2018
|
41,237
|
|
|
|
Thereafter
|
89,579
|
|
|
|
Total minimum rental commitments
|
$
|
351,721
|
|
Litigation
- From time to time, the Company is involved in litigation relating to claims arising out of its operations in the normal course of business. As of the date of these consolidated financial statements, the Company was not engaged in any legal proceedings that are expected, individually or in the aggregate, to have a material effect on the Company.
|
I.
|
EMPLOYEE BENEFITS
|
The Company has a 401(k) profit sharing plan covering all eligible employees who elect to participate. Contributions to the plan are based upon the amount of the employees’ deferrals and the employer’s discretionary matching formula. The Company may contribute to the plan at its discretion.
The total expense under the profit sharing plan was
$1,166
,
$1,059
, and
$791
for fiscal years
2013
,
2012
, and
2011
, respectively.
The Buckle, Inc. Deferred Compensation Plan covers the Company’s executive officers. The plan is funded by participant contributions and a specified annual Company matching contribution not to exceed
6%
of the participant’s compensation. The Company’s contributions were
$326
,
$429
, and
$235
for fiscal years
2013
,
2012
, and
2011
, respectively.
|
J.
|
STOCK-BASED COMPENSATION
|
The Company has several stock option plans which allow for granting of stock options to employees, executives, and directors. The options are in the form of non-qualified stock options and are granted with an exercise price equal to the market value of the Company’s common stock on the date of grant. The options generally expire
ten years
from the date of grant. The Company also has a restricted stock plan that allows for the granting of non-vested shares of common stock to employees and executives and a restricted stock plan that allows for the granting of non-vested shares of common stock to non-employee directors.
As of
February 1, 2014
,
635,315
shares were available for grant under the various stock option plans, of which
447,457
shares were available for grant to executive officers. Also as of
February 1, 2014
,
1,139,296
shares were available for grant under the Company’s various restricted stock plans, of which
1,114,172
shares were available for grant to executive officers.
Compensation expense was recognized during fiscal
2013
,
2012
, and
2011
for equity-based grants, based on the grant date fair value of the awards. The fair value of grants of non-vested common stock awards is the stock price on the date of grant.
45
Information regarding the impact of compensation expense related to grants of non-vested shares of common stock is as follows:
|
|
Fiscal Years Ended
|
||||||||||
|
|
February 1, 2014
|
February 2, 2013
|
January 28, 2012
|
||||||||
|
Stock-based compensation expense, before tax
|
$
|
5,066
|
|
$
|
8,388
|
|
$
|
6,403
|
|
||
|
Stock-based compensation expense, after tax
|
$
|
3,192
|
|
$
|
5,284
|
|
$
|
4,034
|
|
||
FASB ASC 718 requires the benefits of tax deductions in excess of the compensation cost recognized for stock options exercised during the period to be classified as financing cash inflows. This amount is shown as “excess tax benefit from stock option exercises” on the consolidated statements of cash flows. For fiscal
2013
,
2012
, and
2011
, the excess tax benefit realized from exercised stock options was
$399
,
$5,609
, and
$2,371
, respectively.
The Company paid a special cash dividend in each of the past three fiscal years. On
September 19, 2011
, the Board of Directors authorized a
$2.25
per share special cash dividend to be paid on
October 27, 2011
to shareholders of record at the close of business on
October 14, 2011
. On
November 5, 2012
, the Board of Directors authorized a
$4.50
per share special cash dividend to be paid on
December 21, 2012
to shareholders of record at the close of business on
December 7, 2012
. On
December 9, 2013
, the Board of Directors authorized a
$1.20
per share special cash dividend to be paid on
January 27, 2014
to shareholders of record at the close of business on
January 15, 2014
. To preserve the intrinsic value for option holders, the Board also approved on each occasion, pursuant to the terms of the Company’s various stock option plans, a proportional adjustment to both the exercise price and the number of shares covered by each award for all outstanding stock options. This adjustment did not result in any incremental compensation expense.
A summary of the Company’s stock-based compensation activity related to stock options for the fiscal year ended
February 1, 2014
is as follows:
|
Shares
|
Weighted
Average
Exercise
Price
|
Weighted
Average
Remaining
Contractual
Life
|
Aggregate
Intrinsic
Value
|
||||||||||
|
Outstanding - beginning of year
|
42,808
|
|
$
|
1.79
|
|
|
|
|
|||||
|
Granted
|
—
|
|
—
|
|
|
|
|
||||||
|
Other (1)
|
334
|
|
0.05
|
|
|||||||||
|
Expired/forfeited
|
(496
|
)
|
0.01
|
|
|
|
|
||||||
|
Exercised
|
(25,555
|
)
|
0.01
|
|
|
|
|
||||||
|
Outstanding - end of year
|
17,091
|
|
$
|
4.12
|
|
1.27
|
years
|
$
|
687
|
|
|||
|
Exercisable - end of year
|
17,091
|
|
$
|
4.12
|
|
1.27
|
years
|
$
|
687
|
|
|||
|
(1)
|
An adjustment was made to the exercise price and number of options outstanding for the special cash dividend paid during January 2014. "Other" represents additional options issues as a result of this adjustment in the fourth quarter of fiscal 2013.
|
No
stock options were granted during fiscal
2013
,
2012
, and
2011
. The total intrinsic value of options exercised during fiscal
2013
,
2012
, and
2011
was
$1,244
,
$17,386
, and
$7,218
, respectively. As of
February 1, 2014
, there was
no
unrecognized compensation expense as all outstanding stock options were vested.
46
Non-vested shares of common stock granted during each of the past three fiscal years were granted pursuant to the Company’s 2005 Restricted Stock Plan and the Company’s 2008 Director Restricted Stock Plan. Shares granted under the 2005 Plan typically vest over a period of
four years
, only upon certification by the Compensation Committee of the Board of Directors that the Company has achieved its pre-established performance targets for the fiscal year. Shares granted under the 2008 Director Plan vest
25%
on the date of grant and then in equal portions on each of the first three anniversaries of the date of grant.
A summary of the Company’s stock-based compensation activity related to grants of non-vested shares of common stock for the fiscal year ended
February 1, 2014
is as follows:
|
Shares
|
Weighted Average
Grant Date
Fair Value
|
|||||
|
Non-Vested - beginning of year
|
419,261
|
|
$
|
39.52
|
|
|
|
Granted
|
254,400
|
|
47.03
|
|
||
|
Forfeited
|
(2,832
|
)
|
40.49
|
|
||
|
Vested
|
(207,030
|
)
|
38.28
|
|
||
|
Non-Vested - end of year
|
463,799
|
|
$
|
44.19
|
|
|
As of
February 1, 2014
, there was
$3,241
of unrecognized compensation expense related to grants of non-vested shares. It is expected that this expense will be recognized over a weighted average period of approximately
1.5 years
. The total fair value of shares vested during fiscal
2013
,
2012
, and
2011
was
$9,329
,
$10,199
, and
$7,527
respectively.
|
K.
|
EARNINGS PER SHARE
|
The following table provides reconciliation between basic and diluted earnings per share:
|
|
Fiscal Years Ended
|
|||||||||||||||||||||||||||||||
|
|
February 1, 2014
|
|
February 2, 2013
|
January 28, 2012
|
||||||||||||||||||||||||||||
|
|
Income
|
|
Weighted
Average
Shares
|
|
Per Share
Amount
|
|
Income
|
|
Weighted
Average
Shares
|
|
Per Share
Amount
|
Income
|
Weighted
Average Shares |
Per Share
Amount |
||||||||||||||||||
|
Basic EPS
|
$
|
162,584
|
|
|
47,744
|
|
|
$
|
3.41
|
|
|
$
|
164,305
|
|
|
47,383
|
|
|
$
|
3.47
|
|
$
|
151,456
|
|
46,859
|
|
$
|
3.23
|
|
|||
|
Effect of Dilutive Securities
|
|
|
|
|
|
|
|
|
|
|
|
|
|
|
|
|||||||||||||||||
|
Stock options and non-vested shares
|
—
|
|
|
232
|
|
|
(0.02
|
)
|
|
—
|
|
|
327
|
|
|
(0.03
|
)
|
—
|
|
500
|
|
(0.03
|
)
|
|||||||||
|
Diluted EPS
|
$
|
162,584
|
|
|
47,976
|
|
|
$
|
3.39
|
|
|
$
|
164,305
|
|
|
47,710
|
|
|
$
|
3.44
|
|
$
|
151,456
|
|
47,359
|
|
$
|
3.20
|
|
|||
No stock options were deemed anti-dilutive and excluded from the computation of diluted earnings per share for fiscal
2013
,
2012
or
2011
.
47
|
L.
|
SEGMENT INFORMATION
|
The Company is a retailer of medium to better priced casual apparel, footwear, and accessories. The Company operates its business as
one
reportable segment. The Company operated
450
stores located in
43
states throughout the continental United States as of
February 1, 2014
.
The following is information regarding the Company’s major product lines, stated as a percentage of the Company’s net sales:
|
|
Fiscal Years Ended
|
|||||||
|
Merchandise Group
|
February 1, 2014
|
February 2, 2013
|
January 28, 2012
|
|||||
|
Denims
|
45.3
|
%
|
46.4
|
%
|
46.6
|
%
|
||
|
Tops (including sweaters)
|
30.2
|
|
30.9
|
|
32.1
|
|
||
|
Accessories
|
8.5
|
|
8.4
|
|
8.2
|
|
||
|
Sportswear/Fashions
|
6.0
|
|
5.7
|
|
5.1
|
|
||
|
Footwear
|
5.8
|
|
5.3
|
|
4.9
|
|
||
|
Outerwear
|
2.3
|
|
2.2
|
|
2.3
|
|
||
|
Casual bottoms
|
0.9
|
|
0.8
|
|
0.6
|
|
||
|
Other
|
1.0
|
|
0.3
|
|
0.2
|
|
||
|
|
100.0
|
%
|
100.0
|
%
|
100.0
|
%
|
||
|
M.
|
SELECTED QUARTERLY FINANCIAL DATA (UNAUDITED)
|
Selected unaudited quarterly financial information for fiscal
2013
and
2012
are as follows:
|
Quarter
|
|||||||||||||||
|
Fiscal 2013
|
First
|
Second
|
Third
|
Fourth
|
|||||||||||
|
Net sales
|
$
|
269,712
|
|
$
|
232,529
|
|
$
|
286,761
|
|
$
|
338,999
|
|
|||
|
Gross profit
|
$
|
117,007
|
|
$
|
94,487
|
|
$
|
126,225
|
|
$
|
161,426
|
|
|||
|
Net income
|
$
|
37,552
|
|
$
|
25,144
|
|
$
|
40,584
|
|
$
|
59,304
|
|
|||
|
Basic earnings per share
|
$
|
0.79
|
|
$
|
0.53
|
|
$
|
0.85
|
|
$
|
1.24
|
|
|||
|
Diluted earnings per share
|
$
|
0.78
|
|
$
|
0.52
|
|
$
|
0.85
|
|
$
|
1.23
|
|
|||
|
Quarter
|
|||||||||||||||
|
Fiscal 2012
|
First
|
Second
|
Third
|
Fourth
|
|||||||||||
|
Net sales
|
$
|
263,762
|
|
$
|
215,483
|
|
$
|
284,147
|
|
$
|
360,615
|
|
|||
|
Gross profit
|
$
|
114,195
|
|
$
|
86,503
|
|
$
|
125,415
|
|
$
|
173,202
|
|
|||
|
Net income
|
$
|
37,809
|
|
$
|
23,223
|
|
$
|
41,917
|
|
$
|
61,356
|
|
|||
|
Basic earnings per share
|
$
|
0.80
|
|
$
|
0.49
|
|
$
|
0.89
|
|
$
|
1.29
|
|
|||
|
Diluted earnings per share
|
$
|
0.79
|
|
$
|
0.49
|
|
$
|
0.88
|
|
$
|
1.28
|
|
|||
Basic and diluted shares outstanding are computed independently for each of the quarters presented and, therefore, may not sum to the totals for the year. Each of the quarters presented is a 13-week quarter with the exception of the fourth quarter of fiscal 2012, which was a 14-week quarter ending the Company's 53-week fiscal year.
48
None.
The Company maintains a system of disclosure controls and procedures that are designed to provide reasonable assurance that material information, which is required to be timely disclosed, is accumulated and communicated to management in a timely manner. An evaluation of the effectiveness of the design and operation of the Company’s disclosure controls and procedures (as defined in Rules 13a-15(e) of the Securities Exchange Act of 1934 (the “Exchange Act”)) was performed as of the end of the period covered by this report. This evaluation was performed under the supervision and with the participation of the Company’s Chief Executive Officer and Chief Financial Officer. Based upon that evaluation, the Chief Executive Officer and Chief Financial Officer concluded that the Company’s disclosure controls and procedures as of the end of the period covered by this report were effective to provide reasonable assurance that information required to be disclosed by the Company in the Company’s reports that it files or submits under the Exchange Act is accumulated and communicated to management, including its Chief Executive Officer and Chief Financial Officer, as appropriate, to allow timely decisions regarding required disclosure and are effective to provide reasonable assurance that such information is recorded, processed, summarized, and reported within the time periods specified by the SEC’s rules and forms.
Change in Internal Control Over Financial Reporting -
There were no changes in the Company's internal control over financial reporting that occurred during the Company's last fiscal quarter that have materially affected, or are reasonably likely to materially affect, the Company's internal control over financial reporting.
Management’s Report on Internal Control Over Financial Reporting
- Management of the Company is responsible for establishing and maintaining adequate internal control over financial reporting as defined in Rules 13a-15(f) and 15d-15(f) under the Securities Exchange Act of 1934. The Company’s internal control over financial reporting is designed to provide reasonable assurance regarding the reliability of financial reporting and the preparation of financial statements for external purposes in accordance with accounting principles generally accepted in the United State of America (“GAAP”).
All internal control systems, no matter how well designed, have inherent limitations. Therefore, even those systems determined to be effective can provide only reasonable assurance with respect to financial statement preparation and presentation. Because of its inherent limitations, internal control over financial reporting may not prevent or detect misstatements.
Management has assessed the effectiveness of the Company’s internal control over financial reporting as of
February 1, 2014
, based on the criteria set forth by the Committee of Sponsoring Organizations (“COSO”) of the Treadway Commission in their
Internal Control-Integrated Framework (1992)
. In making its assessment of internal control over financial reporting, management has concluded that the Company’s internal control over financial reporting was effective as of
February 1, 2014
.
The Company’s independent registered public accounting firm, Deloitte & Touche LLP, has audited the effectiveness of the Company’s internal control over financial reporting. Their report appears herein.
49
REPORT OF INDEPENDENT REGISTERED PUBLIC ACCOUNTING FIRM
To the Board of Directors and Stockholders of
The Buckle, Inc.
Kearney, Nebraska
We have audited the internal control over financial reporting of The Buckle, Inc. and subsidiary (the “Company”) as of February 1, 2014, based on criteria established in
Internal Control
-
Integrated Framework (1992)
issued by the Committee of Sponsoring Organizations of the Treadway Commission. The Company’s management is responsible for maintaining effective internal control over financial reporting and for its assessment of the effectiveness of internal control over financial reporting, included in the accompanying
Management’s Report on Internal Control Over Financial Reporting
. Our responsibility is to express an opinion on the Company’s internal control over financial reporting based on our audit.
We conducted our audit in accordance with the standards of the Public Company Accounting Oversight Board (United States). Those standards require that we plan and perform the audit to obtain reasonable assurance about whether effective internal control over financial reporting was maintained in all material respects. Our audit included obtaining an understanding of internal control over financial reporting, assessing the risk that a material weakness exists, testing and evaluating the design and operating effectiveness of internal control based on the assessed risk, and performing such other procedures as we considered necessary in the circumstances. We believe that our audit provides a reasonable basis for our opinion.
A company’s internal control over financial reporting is a process designed by, or under the supervision of, the company’s principal executive and principal financial officers, or persons performing similar functions, and effected by the company’s board of directors, management, and other personnel to provide reasonable assurance regarding the reliability of financial reporting and the preparation of financial statements for external purposes in accordance with generally accepted accounting principles. A company’s internal control over financial reporting includes those policies and procedures that (1) pertain to the maintenance of records that, in reasonable detail, accurately and fairly reflect the transactions and dispositions of the assets of the company; (2) provide reasonable assurance that transactions are recorded as necessary to permit preparation of financial statements in accordance with generally accepted accounting principles, and that receipts and expenditures of the company are being made only in accordance with authorizations of management and directors of the company; and (3) provide reasonable assurance regarding prevention or timely detection of unauthorized acquisition, use, or disposition of the company’s assets that could have a material effect on the financial statements.
Because of the inherent limitations of internal control over financial reporting, including the possibility of collusion or improper management override of controls, material misstatements due to error or fraud may not be prevented or detected on a timely basis. Also, projections of any evaluation of the effectiveness of the internal control over financial reporting to future periods are subject to the risk that the controls may become inadequate because of changes in conditions, or that the degree of compliance with the policies or procedures may deteriorate.
In our opinion, the Company maintained, in all material respects, effective internal control over financial reporting as of February 1, 2014, based on the criteria established in
Internal Control
-
Integrated Framework (1992)
issued by the Committee of Sponsoring Organizations of the Treadway Commission.
We have also audited, in accordance with the standards of the Public Company Accounting Oversight Board (United States), the consolidated financial statements and financial statement schedule as of and for the fiscal year ended February 1, 2014 of the Company and our report dated April 2, 2014 expressed an unqualified opinion on those financial statements and financial statement schedule.
/s/ Deloitte & Touche LLP
DELOITTE & TOUCHE LLP
Omaha, Nebraska
April 2, 2014
50
As required by Section 303A of the New York Stock Exchange’s Corporate Governance Standards, the Company’s Chief Executive Officer submitted a certification to the New York Stock Exchange in fiscal
2013
that he was not aware of any violation by the Company of the New York Stock Exchange’s Corporate Governance Standards as of the date of the certificat
ion, July 1, 2013.
The information required by this item appears under the captions "Executive Officers of the Company" appearing on
pages 10 and 11 o
f this report and "Election of Directors" in the Company's Proxy Statement for its
2014
Annual Shareholders' Meeting and is incorporated by reference.
The information required by this item appears under the following captions in the Company's Proxy Statement for its
2014
Annual Shareholders' Meeting and is incorporated by reference: “Executive Compensation,” “Director Compensation” (included under the “Election of Directors” section), and “Report of the Audit Committee.”
The information required by this item appears under the captions "Beneficial Ownership of Common Stock" and “Election of Directors” in the Company's Proxy Statement for its
2014
Annual Shareholders' Meeting and in the Notes to Consolidated Financial Statements under Footnote J on
pages 45 to 47 of
this report and is incorporated by reference.
The information required by this item appears under the captions “Independence” and “Related Party Transactions” (included under the “Election of Directors” section) in the Company's Proxy Statement for its
2014
Annual Shareholders' Meeting and is incorporated by reference.
Information regarding the fees billed by our independent registered public accounting firm and the nature of services comprising the fees for each of the two most recent fiscal years is set forth under the caption “Ratification of Independent Registered Public Accounting Firm” in the Company’s Proxy Statement for its
2014
Annual Shareholders' Meeting and is incorporated by reference.
(a) Financial Statement Schedule
Valuation and Qualifying Account. This schedule is on
page 53.
All other schedules are omitted because they are not applicable or the required information is presented in the consolidated financial statements or notes thereto.
(b) Exhibits
See index to exhibits on
pages 54 and 55.
51
SIGNATURES
Pursuant to the requirements of Section 13 or 15(d) of the Securities Exchange Act of 1934, the Registrant has duly caused this report to be signed on its behalf by the undersigned thereunto duly authorized.
|
THE BUCKLE, INC.
|
|||
|
Date:
|
April 2, 2014
|
By:
|
/s/ DENNIS H. NELSON
|
|
|
|
|
DENNIS H. NELSON,
|
|
|
|
|
President and CEO
|
|
(principal executive officer)
|
|||
|
Date:
|
April 2, 2014
|
By:
|
/s/ KAREN B. RHOADS
|
|
|
|
|
KAREN B. RHOADS,
|
|
|
|
|
Senior Vice President of Finance and CFO
|
|
|
|
|
(principal accounting officer)
|
Pursuant to the requirements of the Securities Exchange Act of 1934, this report has been signed by the following persons on behalf of the registrant and in the capacities indicated on the 2nd day of April, 2014.
|
/s/ DANIEL J. HIRSCHFELD
|
/s/ BILL L. FAIRFIELD
|
|
|
Daniel J. Hirschfeld
|
Bill L. Fairfield
|
|
|
Chairman of the Board and Director
|
Director
|
|
|
/s/ DENNIS H. NELSON
|
/s/ BRUCE L. HOBERMAN
|
|
|
Dennis H. Nelson
|
Bruce L. Hoberman
|
|
|
President and Chief Executive Officer
|
Director
|
|
|
and Director
|
||
|
/s/ KAREN B. RHOADS
|
/s/ MICHAEL E. HUSS
|
|
|
Karen B. Rhoads
|
Michael E. Huss
|
|
|
Senior Vice President of Finance and
|
Director
|
|
|
Principal Accounting Officer and Director
|
||
|
/s/ JOHN P. PEETZ
|
/s/ JAMES E. SHADA
|
|
|
John P. Peetz, III
|
James E. Shada
|
|
|
Director
|
Director
|
|
|
/s/ ROBERT E. CAMPBELL
|
||
|
Robert E. Campbell
|
||
|
Director
|
||
52
SCHEDULE II - Valuation and Qualifying Accounts
(Amounts in Thousands)
|
|
Allowance for Doubtful Accounts
|
Reserve for Sales Returns
|
Valuation Allowance - Deferred Tax Assets
|
||||||||
|
|
|
||||||||||
|
Balance, January 29, 2011
|
$
|
40
|
|
$
|
731
|
|
$
|
241
|
|
||
|
|
|
||||||||||
|
Amounts charged to costs and expenses
|
356
|
|
—
|
|
—
|
|
|||||
|
Amounts charged to other accounts
|
—
|
|
95,476
|
|
—
|
|
|||||
|
Deductions
|
(378
|
)
|
(95,375
|
)
|
(47
|
)
|
|||||
|
|
|
||||||||||
|
Balance, January 28, 2012
|
$
|
18
|
|
$
|
832
|
|
$
|
194
|
|
||
|
|
|
||||||||||
|
Amounts charged to costs and expenses
|
591
|
|
—
|
|
—
|
|
|||||
|
Amounts charged to other accounts
|
—
|
|
106,612
|
|
—
|
|
|||||
|
Deductions
|
(601
|
)
|
(106,591
|
)
|
—
|
|
|||||
|
|
|
||||||||||
|
Balance, February 2, 2013
|
$
|
8
|
|
$
|
853
|
|
$
|
194
|
|
||
|
|
|
||||||||||
|
Amounts charged to costs and expenses
|
729
|
|
—
|
|
731
|
|
|||||
|
Amounts charged to other accounts
|
—
|
|
108,851
|
|
—
|
|
|||||
|
Deductions
|
(726
|
)
|
(108,954
|
)
|
—
|
|
|||||
|
|
|
||||||||||
|
Balance, February 1, 2014
|
$
|
11
|
|
$
|
750
|
|
$
|
925
|
|
||
53
INDEX TO EXHIBITS
|
Exhibits
|
Page Number or Incorporation by Reference to
|
|||
|
(3)
|
Articles of Incorporation and By-Laws.
|
|||
|
(3.1)
|
Articles of Incorporation of The Buckle, Inc. as amended
|
Exhibit 3.1 to Form S-1 No. 33-46294
|
||
|
(3.1.1)
|
Amendment to the Articles of Incorporation of The Buckle, Inc.
|
|||
|
(3.2)
|
By-Laws of The Buckle, Inc.
|
Exhibit 3.2 to Form S-1 No. 33-46294
|
||
|
(4)
|
Instruments defining the rights of security holders, including indentures
|
|||
|
(4.1)
|
See Exhibits 3.1 and 3.2 for provisions of the Articles of Incorporation and By-laws of the Registrant defining rights of holders of Common Stock of the registrant
|
|||
|
(4.2)
|
Form of stock certificate for Common Stock
|
Exhibit 4.1 to Form S-1 No. 33-46294
|
||
|
(9)
|
Not applicable
|
|||
|
(10)
|
Material Contracts
|
|||
|
(10.1)
|
Amended and Restated Non-Qualified Deferred Compensation Plan (*)
|
Exhibit 10.6 and 10.6.1 to Form 10-K filed for the fiscal year ended January 28, 2012
|
||
|
(10.2)
|
Revolving Line of Credit Note and First Amendment to Credit Agreement, dated June 8, 2012 between The Buckle, Inc. and Buckle Brands, Inc. and Wells Fargo Bank, N.A. for a $25.0 million line of credit
|
Exhibit 10.1 to Form 10-Q filed for the fiscal quarter ended July 28, 2012
|
||
|
(10.3)
|
1993 Director Stock Option Plan Amended and Restated (*)
|
Exhibit B to Proxy Statement for Annual Meeting held June 2, 2006
|
||
|
(10.4)
|
1997 Executive Stock Option Plan (*)
|
Exhibit B to Proxy Statement for Annual Meeting held May 28, 1998
|
||
|
(10.5)
|
1998 Restricted Stock Plan (*)
|
Exhibit C to Proxy Statement for Annual Meeting held May 28, 1998
|
||
|
(10.6)
|
2005 Restricted Stock Plan Amended and Restated (*)
|
Exhibit B to Proxy Statement for Annual Meeting held May 31, 2013
|
||
|
(10.7)
|
2008 Director Restricted Stock Plan (*)
|
Exhibit B to Proxy Statement For Annual Meeting held May 28, 2008
|
||
|
(10.8)
|
2012 Management Incentive Plan (*)
|
Exhibit A to Proxy Statement for Annual Meeting held June 1, 2012
|
||
|
(10.9)
|
2013 Management Incentive Plan (*)
|
Exhibit A to Proxy Statement for Annual Meeting held May 31, 2013
|
||
|
(10.10)
|
Summary of Named Executive Officer Compensation
|
Incorporated by reference from the section titled "Executive Compensation and Other Information" in Proxy Statement for Annual Meeting to be held May 27, 2014
|
||
|
(10.11)
|
Summary of Non-Employee Director Compensation
|
Incorporated by reference from the section titled "Director Compensation" in Proxy Statement for Annual Meeting to be held May 27, 2014
|
||
54
|
Exhibits
|
Page Number or Incorporation by Reference to
|
|||
|
(11)
|
Not applicable
|
|||
|
(12)
|
Not applicable
|
|||
|
(13)
|
Not applicable
|
|||
|
(14)
|
Not applicable
|
|||
|
(16)
|
Not applicable
|
|||
|
(18)
|
Not applicable
|
|||
|
(21)
|
List of Subsidiaries
|
|||
|
(23)
|
Consent of Deloitte & Touche LLP
|
|||
|
(31a)
|
Certification Pursuant to Rule 13a-14(a) or 15d-14(a) Under the Securities Exchange Act of 1934, as Adopted Pursuant to Section 302 of the Sarbanes-Oxley Act of 2002.
|
|||
|
(31b)
|
Certification Pursuant to Rule 13a-14(a) or 15d-14(a) Under the Securities Exchange Act of 1934, as Adopted Pursuant to Section 302 of the Sarbanes-Oxley Act of 2002.
|
|||
|
(32)
|
Certifications Pursuant to 18 U.S.C. Section 1350, as Adopted Pursuant to Section 906 of the Sarbanes-Oxley Act of 2002.
|
|||
|
(101)
|
Includes the following materials from The Buckle, Inc.’s Annual Report on Form 10-K for the fiscal year ended February 1, 2014, formatted in XBRL (eXtensible Business Reporting Language): (i) Consolidated Balance Sheets; (ii) Consolidated Statements of Income; (iii) Consolidated Statements of Comprehensive Income; (iv) Consolidated Statements of Stockholders’ Equity; (v) Consolidated Statements of Cash Flows; and (vi) Notes to Consolidated Financial Statements, tagged as blocks of text and in detail.
|
|||
|
(*)
|
Denotes management contract or compensatory plan or arrangement.
|
|||
55
TABLE OF CONTENTS
Part IItem 1 - BusinessItem 1A - Risk FactorsItem 1B - Unresolved Staff CommentsItem 2 - PropertiesItem 3 - Legal ProceedingsItem 4 - Mine Safety DisclosuresPart IIItem 5 - Market For Registrant's Common Equity, Related Shareholder Matters, and Issuer Purchases Of Equity SecuritiesItem 6 - Selected Financial DataItem 7 - Management's Discussion and Analysis Of Financial Condition and Results Of OperationsItem 7A Quantitative and Qualitative Disclosures About Market RiskItem 8 - Financial Statements and Supplementary DataItem 9 - Changes in and Disagreements with Accountants on Accounting and Financial DisclosureItem 9A Controls and ProceduresItem 9B - Other InformationPart IIIItem 10 - Directors, Executive Officers, and Corporate GovernanceItem 11 - Executive CompensationItem 12 - Security Ownership Of Certain Beneficial Owners and Management and Related Stockholder MattersItem 13 - Certain Relationships and Related Transactions and Director IndependenceItem 14 - Principal Accountant Fees and ServicesPart IVItem 15 - Exhibits and Financial Statement Schedule