BANKUNITED, INC.
10-Ks and 10-Qs
|
|
|
|
|
|
|
|
|
|
|
|
|
|
|
|
|
|
|
|
|
|
|
|
|
|
|
|
|
|
|
|
|
|
|
|
|
|
|
|
|
|
|
|
|
|
|
|
|
|
UNITED STATES
SECURITIES AND EXCHANGE COMMISSION
Washington, D.C. 20549
FORM 10-K
ANNUAL REPORT PURSUANT TO SECTION 13 OR 15(d) OF THE
SECURITIES EXCHANGE ACT OF 1934
FOR THE FISCAL YEAR ENDED DECEMBER 31, 2016
Commission file number: 001-35039
BankUnited, Inc.
(Exact name of registrant as specified in its charter)
|
Delaware
(State or other jurisdiction of
incorporation or organization)
|
|
27-0162450
(I.R.S. Employer
Identification No.)
|
|
14817 Oak Lane, Miami Lakes, FL
(Address of principal executive offices)
|
|
33016
(Zip Code)
|
(305) 569-2000
(Registrant's telephone number, including area code)
Securities registered pursuant to Section 12(b) of the Act:
|
Title of each class
|
|
Name of each exchange on which registered
|
|
Common Stock, $0.01 par value
|
|
New York Stock Exchange
|
Securities registered pursuant to Section 12(g) of the Act:
None
Indicate by check mark if the registrant is a well-known seasoned issuer, as defined in Rule 405 of the Securities Act. Yes
ý
No
o
Indicate by check mark if the registrant is not required to file reports pursuant to Section 13 or Section 15(d) of the Act. Yes
o
No
ý
Indicate by check mark whether the registrant (1) has filed all reports required to be filed by Section 13 or 15(d) of the Securities Exchange Act of 1934 during the preceding 12 months (or for such shorter period that the registrant was required to file such reports), and (2) has been subject to such filing requirements for the past 90 days. Yes
ý
No
o
Indicate by check mark whether the registrant has submitted electronically and posted on its corporate Website, if any, every Interactive Data File required to be submitted and posted pursuant to Rule 405 of Regulation S-T (§232.405 of this chapter) during the preceding 12 months (or for such shorter period that the registrant was required to submit and post such files). Yes
ý
No
o
Indicate by check mark if disclosure of delinquent filers pursuant to Item 405 of Regulation S-K is not contained herein, and will not be contained, to the best of the registrant's knowledge, in definitive proxy or information statements incorporated by reference in Part III of this Form 10-K or any amendment to this Form 10-K.
ý
Indicate by check mark whether the registrant is a large accelerated filer, an accelerated filer, a non-accelerated filer, or a "smaller reporting company."
|
Large accelerated filer
ý
|
|
Accelerated filer
o
|
|
Non-accelerated filer
o
(Do not check if a
smaller reporting company)
|
|
Smaller reporting company
o
|
Indicate by check mark whether the registrant is a shell company (as defined in Rule 12b-2 of the Act). Yes
o
No
ý
The aggregate market value of the voting and non-voting common stock held by non-affiliates of the registrant on June 30, 2016 was
3,141,474,775
.
The number of outstanding shares of the registrant's common stock, $0.01 par value, as of
February 24, 2017
, was
106,299,139
.
DOCUMENTS INCORPORATED BY REFERENCE:
Portions of the registrant's definitive proxy statement for the 2017 annual meeting of stockholders are incorporated by reference in this Annual Report on Form 10-K in response to Part II. Item 5 and Part III. Items 10, 11, 12, 13 and 14.
BANKUNITED, INC.
Form 10-K
For the Year Ended
December 31, 2016
TABLE OF CONTENTS
|
|
|
Page
|
|
|
||
|
|
||
i
GLOSSARY OF DEFINED TERMS
The following acronyms and terms may be used throughout this Form 10-K, including the consolidated financial statements and related notes.
|
ACI
|
Loans acquired with evidence of deterioration in credit quality since origination (Acquired Credit Impaired)
|
|
|
ALCO
|
Asset/Liability Committee
|
|
|
ALLL
|
Allowance for loan and lease losses
|
|
|
AOCI
|
Accumulated other comprehensive income
|
|
|
ARM
|
Adjustable rate mortgage
|
|
|
ASC
|
Accounting Standards Codification
|
|
|
ASU
|
Accounting Standards Update
|
|
|
ATM
|
Automated teller machine
|
|
|
BHC Act
|
Bank Holding Company Act of 1956
|
|
|
BHC
|
Bank holding company
|
|
|
BKU
|
BankUnited, Inc.
|
|
|
BankUnited
|
BankUnited, National Association
|
|
|
The Bank
|
BankUnited, National Association
|
|
|
Bridge
|
Bridge Funding Group, Inc.
|
|
|
CDO
|
Collateralized debt obligation
|
|
|
CET1
|
Common Equity Tier 1 capital
|
|
|
CECL
|
Current expected credit losses
|
|
|
CFPB
|
Consumer Financial Protection Bureau
|
|
|
CFTC
|
Commodity Futures Trading Commission
|
|
|
CMOs
|
Collateralized mortgage obligations
|
|
|
Commercial Shared-Loss Agreement
|
A commercial and other loans shared-loss agreement entered into with the FDIC in connection with the FSB Acquisition
|
|
|
Covered assets
|
Assets covered under the Loss Sharing Agreements
|
|
|
Covered loans
|
Loans covered under the Loss Sharing Agreements
|
|
|
CRA
|
Community Reinvestment Act
|
|
|
DIF
|
Deposit insurance fund
|
|
|
Dodd-Frank Act
|
Dodd-Frank Wall Street Reform and Consumer Protection Act of 2010
|
|
|
EPS
|
Earnings per common share
|
|
|
EVE
|
Economic value of equity
|
|
|
Failed Bank
|
BankUnited, FSB
|
|
|
FASB
|
Financial Accounting Standards Board
|
|
|
FDIA
|
Federal Deposit Insurance Act
|
|
|
FDIC
|
Federal Deposit Insurance Corporation
|
|
|
FHLB
|
Federal Home Loan Bank
|
|
|
FICO
|
Fair Isaac Corporation (credit score)
|
|
|
FRB
|
Federal Reserve Bank
|
|
|
FSB Acquisition
|
Acquisition of substantially all of the assets and assumption of all of the non-brokered deposits and substantially all of the other liabilities of BankUnited, FSB from the FDIC on May 21, 2009
|
|
|
GAAP
|
U.S. generally accepted accounting principles
|
|
|
GDP
|
Gross Domestic Product
|
|
|
GLB Act
|
The Gramm-Leach-Bliley Financial Modernization Act of 1999
|
|
|
HAMP
|
Home Affordable Modification Program
|
|
ii
|
IPO
|
Initial public offering
|
|
|
IRS
|
Internal Revenue Service
|
|
|
ISDA
|
International Swaps and Derivatives Association
|
|
|
LCR
|
Liquidity coverage ratio
|
|
|
LIBOR
|
London InterBank Offered Rate
|
|
|
Loss Sharing Agreements
|
Two loss sharing agreements entered into with the FDIC in connection with the FSB Acquisition
|
|
|
LTV
|
Loan-to-value
|
|
|
MBS
|
Mortgage-backed securities
|
|
|
MSA
|
Metropolitan Statistical Area
|
|
|
MSRs
|
Mortgage servicing rights
|
|
|
New Loans
|
Loans originated or purchased since the FSB Acquisition
|
|
|
Non-ACI
|
Loans acquired without evidence of deterioration in credit quality since origination
|
|
|
OCC
|
Office of the Comptroller of the Currency
|
|
|
OFAC
|
U.S. Department of the Treasury's Office of Foreign Assets Control
|
|
|
OREO
|
Other real estate owned
|
|
|
OTTI
|
Other-than-temporary impairment
|
|
|
Proxy Statement
|
Definitive proxy statement for the Company's 2017 annual meeting of stockholders
|
|
|
PSU
|
Performance Share Unit
|
|
|
Pinnacle
|
Pinnacle Public Finance, Inc.
|
|
|
QRMs
|
Qualified residential mortgages
|
|
|
Re-Remics
|
Resecuritized real estate mortgage investment conduits
|
|
|
RSU
|
Restricted Share Unit
|
|
|
SAR
|
Share Appreciation Right
|
|
|
SBA
|
U.S. Small Business Administration
|
|
|
SBF
|
Small Business Finance Unit
|
|
|
SEC
|
Securities and Exchange Commission
|
|
|
SIFIs
|
Systemically important financial institutions
|
|
|
Single Family Shared-Loss Agreement
|
A single-family loan shared-loss agreement entered into with the FDIC in connection with the FSB Acquisition
|
|
|
TDR
|
Troubled-debt restructuring
|
|
|
Tri-State
|
New York, New Jersey and Connecticut
|
|
|
UPB
|
Unpaid principal balance
|
|
|
USDA
|
U.S. Department of Agriculture
|
|
|
VIEs
|
Variable interest entities
|
|
|
2010 Plan
|
2010 Omnibus Equity Incentive Plan
|
|
|
2014 Plan
|
2014 Omnibus Equity Incentive Plan
|
|
|
401(k) Plan
|
BankUnited 401(k) Plan
|
|
iii
Forward-Looking Statements
This Annual Report on Form 10-K contains forward-looking statements within the meaning of the Private Securities Litigation Reform Act of 1995. Words such as "anticipate," "expect," "intend," "plan," "believe," "seek," "estimate," "project," "predict," "will" and similar expressions identify forward-looking statements.
These forward-looking statements are based on management's current views with respect to future results, and are subject to risks and uncertainties. Forward-looking statements are based on beliefs and assumptions made by management using currently available information, such as market and industry materials, historical performance and current financial trends. These statements are only predictions and are not guarantees of future performance. The inclusion of forward-looking statements should not be regarded as a representation by the Company that the future plans, estimates or expectations contemplated by a forward-looking statement will be achieved. Forward-looking statements are subject to various risks and uncertainties and assumptions, including those relating to the Company's operations, financial results, financial condition, business prospects, growth strategy and liquidity. If one or more of these or other risks or uncertainties materialize, or if the Company's underlying assumptions prove to be incorrect, the Company's actual results could differ materially from those contemplated by a forward-looking statement. These risks and uncertainties include, without limitation:
|
•
|
the impact of conditions in the financial markets and economic conditions generally;
|
|
•
|
credit risk, relating to our portfolios of loans, leases and investments overall, as well as loans and leases exposed to specific industry conditions;
|
|
•
|
real estate market conditions and other risks related to holding loans secured by real estate or real estate received in satisfaction of loans;
|
|
•
|
an inability to successfully execute our fundamental growth strategy;
|
|
•
|
geographic concentration of the Company's markets in Florida and the New York metropolitan area;
|
|
•
|
natural or man-made disasters;
|
|
•
|
risks related to the regulation of our industry;
|
|
•
|
inadequate allowance for credit losses;
|
|
•
|
interest rate risk;
|
|
•
|
liquidity risk;
|
|
•
|
loss of executive officers or key personnel;
|
|
•
|
competition;
|
|
•
|
dependence on information technology and third party service providers and the risk of systems failures, interruptions or breaches of security;
|
|
•
|
failure to comply with the terms of the Company's Loss Sharing Agreements (as defined below) with the FDIC (as defined below);
|
|
•
|
inadequate or inaccurate forecasting tools and models;
|
|
•
|
ineffective risk management or internal controls;
|
|
•
|
a variety of operational, compliance and legal risks; and
|
|
•
|
the selection and application of accounting methods and related assumptions and estimates.
|
Additional factors are set forth in the Company's filings with the Securities and Exchange Commission, or the SEC, including this Annual Report on Form 10-K.
Forward-looking statements speak only as of the date on which they are made. The Company expressly disclaims any obligation to update or revise any forward-looking statement, whether as a result of new information, future events or otherwise, except as required by law.
As used herein, the terms the "Company," "we," "us," and "our" refer to BankUnited, Inc. and its subsidiaries unless the context otherwise requires.
iv
Overview
BankUnited, Inc., with total consolidated assets of
$27.9 billion
at
December 31, 2016
, is a bank holding company with one wholly-owned subsidiary, BankUnited, collectively, the Company. BankUnited, a national banking association headquartered in Miami Lakes, Florida, provides a full range of banking services to individual and corporate customers through
94
banking centers located in 15 Florida counties and
6
banking centers in the New York metropolitan area. The Bank also provides certain commercial lending and deposit products on a national platform. The Company has built, primarily through organic growth, a premier commercially focused regional bank with a long-term value oriented business model serving primarily small and medium sized businesses. We endeavor to provide, through our experienced lending and relationship banking teams, personalized customer service and offer a full range of traditional banking products and services to both our commercial and retail customers.
BankUnited, Inc. was organized by a management team led by our Chairman, John A. Kanas and was initially capitalized with $945.0 million by a group of investors. On May 21, 2009, BankUnited acquired substantially all of the assets and assumed all of the non-brokered deposits and substantially all other liabilities of BankUnited, FSB, from the FDIC in the FSB Acquisition. On February 2, 2011, we completed the IPO of our common stock.
The FSB Acquisition and the Loss Sharing Agreements
On May 21, 2009, BankUnited entered into the "Purchase and Assumption Agreement" with the FDIC, Receiver of the Failed Bank, to acquire substantially all of the assets and assume all of the non-brokered deposits and substantially all other liabilities of the Failed Bank.
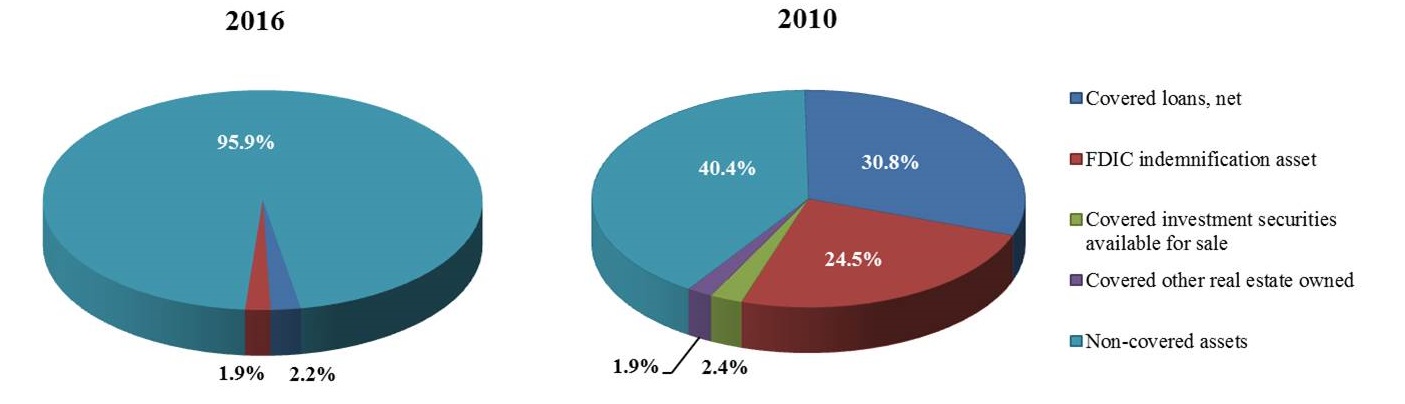
Concurrently with the FSB Acquisition, the Bank entered into two loss sharing agreements with the FDIC. The Loss Sharing Agreements cover certain legacy assets, including the entire legacy loan portfolio and OREO and certain purchased investment securities. We refer to assets covered by the Loss Sharing Agreements as covered assets or, in certain cases, covered loans. The Loss Sharing Agreements do not apply to subsequently acquired, purchased or originated assets. At
December 31, 2016
, the covered assets, consisting of residential loans and OREO, had an aggregate carrying value of
$619 million
. The total UPB of the covered assets at
December 31, 2016
was
$1.5 billion
. The carrying value of the related FDIC indemnification asset at
December 31, 2016
was
$516 million
.
The following charts illustrate the percentage of total assets represented by covered assets and the FDIC indemnification asset at
December 31, 2016
and 2010, reflecting the change in balance sheet composition over time:
Pursuant to the terms of the Loss Sharing Agreements, the covered assets are subject to a stated loss threshold whereby the FDIC will reimburse the Bank for 80% of losses up to a $4.0 billion stated threshold and 95% of losses in excess of the $4.0 billion stated threshold, calculated, in each case, based on UPB plus certain interest and expenses. The Bank will reimburse the FDIC for its share of recoveries with respect to losses for which the FDIC paid the Bank a reimbursement under the Loss Sharing Agreements. The FDIC's obligation to reimburse the Company for losses with respect to the covered assets began with the first dollar of loss incurred. We have received reimbursements of
$2.7 billion
for claims submitted to the FDIC under the Loss Sharing Agreements as of
December 31, 2016
.
1
The Loss Sharing agreements consist of the Single Family Shared-Loss Agreement and the Commercial Shared-Loss Agreement. The Single Family Shared-Loss Agreement provides for FDIC loss sharing and the Bank's reimbursement for recoveries to the FDIC for ten years from May 21, 2009, or through May 21, 2019, for single family residential and home equity loans and related OREO. The Commercial Shared-Loss Agreement provided for FDIC loss sharing for five years from May 21, 2009, or through May 21, 2014, and provides for the Bank's reimbursement for recoveries to the FDIC for eight years from May 21, 2009, or through May 21, 2017, for all other covered assets.
Under the terms of the Purchase and Assumption Agreement with the FDIC, the Bank may sell up to 2.5% of the covered loans based on the UPB at the date of the FSB Acquisition, or approximately $280.0 million, on an annual basis without prior consent of the FDIC. Any losses incurred from such loan sales are covered under the Loss Sharing Agreements. Any loan sale in excess of the annual threshold requires approval from the FDIC to be eligible for loss share coverage. However, if the Bank seeks to sell residential loans in excess of the agreed 2.5% threshold in the nine months prior to the stated termination date of loss share coverage (May 21, 2019) and the FDIC refuses to consent, then the Single Family Shared-Loss Agreement will be extended for two years only with respect to the loans requested to be included in such sales. The Bank will have the right to sell all or any portion of such loans without FDIC consent at any time within the nine months prior to the respective extended termination date, and any losses incurred will be covered under the Single Family Shared-Loss Agreement. If exercised, this final sale mechanism ensures no residual credit risk in our covered loan portfolio that would otherwise arise from credit losses occurring after the termination date of the Single Family Shared-Loss Agreement.
Loss sharing pursuant to the Commercial Shared-Loss Agreement terminated on May 21, 2014. In accordance with the terms of the Commercial Shared-Loss Agreement, the Bank requested and received approval from the FDIC to sell certain covered commercial and consumer loans and commercial OREO in 2014. See the section entitled "Management's Discussion and Analysis of Financial Condition and Results of Operations—Results of Operations—Termination of the Commercial Shared-Loss Agreement" and Note 5 to the consolidated financial statements for further discussion.
Our Market Areas
Our primary banking markets are Florida and the Tri-State market of New York, New Jersey and Connecticut. We believe both represent long-term attractive banking markets. In Florida, our largest concentration is in the Miami metropolitan statistical area; however, we are also focused on developing business in other markets in which we have a presence, such as the Broward, Palm Beach, Orlando, Tampa and Jacksonville markets. We operate several national commercial lending platforms, purchase residential loans on a national basis through established correspondent channels and have a national commercial deposit business.
According to estimates from the United States Census Bureau and SNL Financial, from 2010 to 2016, Florida added over 1.9 million new residents, the third most of any U.S. state, and, in 2016, had a total population of 20.7 million and a median household annual income of $
49,639
. The Florida unemployment rate decreased to 4.7% at
December 31, 2016
. The Case-Shiller home price index for Florida reflected a year over year increase of 7% at September 30, 2016. According to CoStar Commercial Repeat-Sale Indices, commercial real estate values in the South region reflected a year over year increase of 7% at September 30, 2016. According to a report published in December, 2016 by the University of Central Florida, personal income in Florida will grow by 3.4% in 2016 and is expected to average 4.0% growth from 2016 to 2019 while Florida's Real Gross State Product is forecast to expand at an average annual rate of 3.7% from 2016 to 2019.
We had
six
banking centers in metropolitan New York at
December 31, 2016
including four in Manhattan, one in Long Island and one in Brooklyn. According to SNL Financial, at June 30, 2016, the Tri-State area had approximately $1.9 trillion in deposits, with the majority of the market concentrated in the New York metropolitan area. The New York unemployment rate decreased to 4.5% at
December 31, 2016
. According to CoStar Commercial Repeat-Sale Indices, commercial real estate values in the Northeast region reflected a year over year increase of 6.0% at September 30, 2016. The size and economic health of the Tri-State market, coupled with the management team's experience in this market, make us well positioned to continue our expansion and growth.
Through two commercial lending subsidiaries of BankUnited, we engage in equipment, franchise and municipal finance on a national basis. The Bank also originates small business loans through programs sponsored by the SBA and to a lesser extent the USDA and provides mortgage warehouse finance on a national basis. We refer to our commercial lending subsidiaries, our small business finance unit, our mortgage warehouse lending operations and our residential loan purchase program as national platforms.
2
Products and Services
Lending and Leasing
General
—Our primary lending focus is to serve small and middle-market businesses and their executives with a variety of financial products and services, while maintaining a disciplined credit culture.
We offer a full array of lending products that cater to our customers' needs including small business loans, commercial real estate loans, equipment loans and leases, term loans, formula-based loans, municipal and non-profit loans and leases, commercial and mortgage warehouse lines of credit, letters of credit and consumer loans. We also purchase performing residential loans through established correspondent channels on a national basis.
We have attracted and invested in experienced lending teams from competing institutions in our Florida, Tri-State and national markets, resulting in significant growth in our new loan portfolio. At
December 31, 2016
, our loan portfolio included
$18.7 billion
in loans originated or purchased since the FSB Acquisition, or new loans, including
$15.2 billion
in commercial and commercial real estate loans and
$3.5 billion
in residential loans. Continued loan growth in both the Florida and Tri-State markets and across our national lending and leasing platforms is a core component of our current business strategy.
Commercial loans
—Our commercial loans, which are generally made to growing companies and middle-market businesses, include equipment loans, secured and unsecured lines of credit, formula-based loans, mortgage warehouse lines, taxi medallion loans, letters of credit, SBA product offerings and business acquisition finance credit facilities.
Commercial real estate loans
—We offer term financing for the acquisition or refinancing of properties, primarily rental apartments, mixed-use commercial properties, industrial properties, warehouses, retail shopping centers, free-standing single-tenant buildings, office buildings and hotels. Other products that we provide include real estate secured lines of credit, acquisition, development and construction loan facilities and construction financing. We make commercial real estate loans secured by both owner-occupied and non-owner occupied properties. Construction lending is not a primary area of focus for us; construction and land loans comprised
1.6%
of the loan portfolio at
December 31, 2016
.
National Commercial Lending Platforms
—Through the Bank's two commercial lending subsidiaries, we provide municipal, equipment and franchise financing on a national basis. Pinnacle, headquartered in Scottsdale, Arizona, provides financing to state and local governmental entities directly and through vendor programs and alliances. Pinnacle offers a full array of financing structures on a national basis including equipment lease purchase agreements and direct (private placement) bond refundings and loan agreements. Bridge offers small and middle market business equipment leases and loans utilizing loan, direct finance lease and operating lease structures through its equipment finance division. Bridge offers franchise equipment, acquisition and expansion finance through its franchise division. Bridge is headquartered in Baltimore, Maryland. In 2015, we acquired SBF, enabling us to expand our small business lending platform on a national basis. SBF offers an array of SBA, and to a lesser extent, USDA products. We typically sell the government guaranteed portion of the loans SBF originates, and retain the unguaranteed portion in portfolio. We also engage in mortgage warehouse lending on a national basis.
Residential mortgages
—The new residential loan portfolio is primarily comprised of loans purchased on a national basis through select correspondent channels. This national purchase program allows us to diversify our loan portfolio, both by product type and geographically. Prior to 2016, we originated mortgage loans in Florida and New York for portfolio and for sale into the secondary market. In January 2016, we terminated our retail mortgage origination business line. Residential loans purchased are primarily closed-end, first lien jumbo mortgages for the purchase or re-finance of owner occupied property. We do not originate or purchase negatively amortizing or sub-prime residential loans.
Home equity loans and lines of credit are not a significant component of the new loan portfolio.
Consumer loans
—We offer consumer loans to our customers for personal, family and household purposes, including auto, boat and personal installment loans. At
December 31, 2016
, consumer loans were not a material component of our loan portfolio.
Loan servicing
—We have acquired mortgage servicing portfolios and have retained servicing on residential loans originated and sold into the secondary market. At
December 31, 2016
, we serviced residential mortgage loans with a UPB of
$1.6 billion
. We anticipate growing this business at a moderate pace, depending on market conditions, to take advantage of existing mortgage servicing capacity.
We service SBA loans originated and sold into the secondary market by SBF. We anticipate that this servicing business will expand as SBF originations grow. At
December 31, 2016
, we serviced
$488 million
of SBA loans.
The balance of servicing assets was not material to the Company's consolidated financial statements at
December 31, 2016
.
3
Credit Policy and Procedures
The Company's credit culture, policy and procedures enhance the long term value of the Company to its customers, employees, stockholders and communities.
Since lending represents risk exposure, our Board of Directors, its duly appointed committees and certain Bank-level committees seek to ensure that the Company maintains strong credit quality. BankUnited, Inc. and the Bank have established asset oversight committees to administer the loan portfolio and monitor and manage credit risk. These committees include: (i) the Enterprise Risk Management Committee, (ii) the Credit Risk Management Committee, (iii) the Asset Recovery Committee, (iv) the Criticized Asset Committee and (v) the Residential Credit Risk Management Committee. These committees meet at least quarterly.
The credit approval process provides for prompt and thorough underwriting and approval or decline of loan requests. The approval method used is a hierarchy of individual lending authorities for new credits and renewals. The Credit Risk Management Committee approves authorities for lending and credit personnel, which are ultimately submitted to our Board for ratification. Lending authorities are based on position, capability and experience of the individuals filling these positions. Authorities are periodically reviewed and updated.
BankUnited has established in-house borrower lending limits which are significantly lower than its legal lending limit of approximately
$404 million
at
December 31, 2016
. In-house lending limit at
December 31, 2016
ranged from $75 million to $100 million based on total credit exposure of a borrower. These limits are reviewed periodically by the Credit Risk Management Committee and approved annually by the Board of Directors.
Deposits
We offer traditional deposit products including checking accounts, money market deposit accounts, savings accounts and certificates of deposit with a variety of terms and rates. Our deposits are insured by the FDIC up to statutory limits. Demand deposit balances are concentrated in commercial and small business accounts. Our service fee schedule and rates are competitive with other financial institutions in our markets.
Investment Securities
The primary objectives of our investment policy are to provide liquidity, provide a suitable balance of high credit and diversified quality assets to the consolidated balance sheet, manage interest rate risk exposure, and generate acceptable returns given the Company's established risk parameters.
The investment policy is reviewed annually by our Board of Directors. Overall investment goals are established by our Board, Chief Executive Officer, Chief Financial Officer, and members of the ALCO. The Board has delegated the responsibility of monitoring our investment activities to ALCO. Day-to-day activities pertaining to the investment portfolio are conducted within the Company's Treasury division under the supervision of the Chief Financial Officer.
Risk Management and Oversight
Our Board of Directors oversees our risk management process, including the company-wide approach to risk management, carried out by our management. Our Board approves the Company's business plans and the policies that set standards for the nature and level of risk the Company is willing to assume. The Board receives reports on the Company's management of critical risks and the effectiveness of risk management systems. While our full Board maintains the ultimate oversight responsibility for the risk management process, its committees, including the audit and risk committee, the compensation committee and the nominating and corporate governance committee, oversee risk in certain specified areas.
Our Board has assigned responsibility to our Chief Risk Officer for maintaining a risk management framework to identify, manage and mitigate risks to the achievement of our strategic goals and objectives and ensure we operate in a safe and sound manner in accordance with the Board approved policies. We have invested significant resources to establish a robust enterprise-wide risk management framework to support the planned growth of our Company. Our framework is consistent with common industry practices and regulatory guidance and is appropriate to our size, growth trajectory and the complexity of our business activities. Significant elements include a Risk Appetite Statement and risk metrics approved by the Board, ongoing identification and assessments of risk, executive management level risk committees to oversee compliance with the Board approved risk policies and adherence to risk limits, and ongoing testing and reporting by independent internal audit, credit review, and regulatory compliance groups. Executive level oversight of the risk management framework is provided by the Enterprise Risk Management Committee which is chaired by the Chief Risk Officer and attended by the senior executives of the Company. Reporting to the Enterprise Risk Management Committee are sub-committees dedicated to guiding and
4
overseeing management of critical categories of risk, including the Credit Risk Management, Asset/Liability, Compliance Risk Management, Operational Risk Management, Corporate Disclosure, and Loss Share Compliance committees.
Marketing and Distribution
We conduct our banking business through
94
banking centers located in 15 Florida counties as well as
6
banking centers in the New York metropolitan area as of
December 31, 2016
. Our distribution network also includes 97 ATMs, fully integrated on-line banking, mobile banking and a telephone banking service. We target growing companies and commercial and middle-market businesses, as well as individual consumers.
In order to market our products, we use local television, radio, digital, print and direct mail advertising as well as a variety of promotional activities.
Competition
Our markets are highly competitive. Our markets contain not only a large number of community and regional banks, but also a significant presence of the country's largest commercial banks. We compete with other state, national and international financial institutions located in our market areas as well as savings associations, savings banks and credit unions for deposits and loans. In addition, we compete with financial intermediaries such as consumer finance companies, mortgage banking companies, insurance companies, securities firms, mutual funds and several government agencies as well as major retailers, all actively engaged in providing various types of loans and other financial services. Our largest banking competitors in the Florida market include Bank of America, BB&T, BBVA Compass, HSBC, JPMorgan Chase, PNC, Regions Bank, Santander, Sabadell, SunTrust Banks, TD Bank and Wells Fargo and a number of community banks. In the Tri-State market, we also compete with, in addition to the national and international financial institutions listed, Capital One, Signature Bank, New York Community Bank, Valley National Bank, M&T Bank and numerous community banks.
Interest rates on both loans and deposits and prices of fee-based services are significant competitive factors among financial institutions generally. Other important competitive factors include convenience, quality of customer service, availability of on-line, mobile and remote banking products, community reputation, continuity of personnel and services, and, in the case of larger commercial customers, relative lending limits and ability to offer sophisticated cash management and other commercial banking services. While we continue to provide competitive interest rates on both depository and lending products, we believe that we can compete most successfully by focusing on the financial needs of growing companies and their executives and commercial and middle-market businesses, offering them a broad range of personalized services and sophisticated cash management tools tailored to their businesses.
Regulation and Supervision
The U.S. banking industry is highly regulated under federal and state law. These regulations affect the operations of BankUnited, Inc. and its subsidiaries.
Statutes, regulations and policies limit the activities in which we may engage and the conduct of our permitted activities and establish capital requirements with which we must comply. The regulatory framework is intended primarily for the protection of depositors, borrowers, customers and clients, the FDIC insurance funds and the banking system as a whole, and not for the protection of our stockholders or creditors. In many cases, the applicable regulatory authorities have broad enforcement power over bank holding companies, banks and their subsidiaries, including the power to impose substantial fines and other penalties for violations of laws and regulations. Further, the regulatory system imposes reporting and information collection obligations. We incur significant costs relating to compliance with these laws and regulations. Banking statutes, regulations and policies are continually under review by federal and state legislatures and regulatory agencies, and a change in them, including changes in how they are interpreted or implemented, could have a material adverse effect on our business. It is not clear what impact, if any, the recent change in the U.S. presidential administration will have on the laws, regulations and policies affecting the supervision of banking organizations.
The material statutory and regulatory requirements that are applicable to us are summarized below. The description below is not intended to summarize all laws and regulations applicable to us.
Bank and Bank Holding Company Regulation
BankUnited is a national bank. As a national bank organized under the National Bank Act, BankUnited is subject to ongoing and comprehensive supervision, regulation, examination and enforcement by the OCC. BankUnited is subject to certain commitments made to the OCC, in conjunction with its conversion to a national bank in 2012, regarding its business and capital plans.
5
Any entity that directly or indirectly controls a bank must be approved by the Federal Reserve Board under the BHC Act to become a BHC. BHCs are subject to regulation, inspection, examination, supervision and enforcement by the Federal Reserve Board under the BHC Act. The Federal Reserve Board's jurisdiction also extends to any company that is directly or indirectly controlled by a BHC.
BankUnited, Inc., which controls BankUnited, is a BHC and, as such, is subject to ongoing and comprehensive supervision, regulation, examination and enforcement by the Federal Reserve Board.
FDIC Deposit Insurance
The FDIC is an independent federal agency that insures the deposits of federally insured depository institutions up to applicable limits. The FDIC also has certain regulatory, examination and enforcement powers with respect to FDIC-insured institutions. The deposits of BankUnited are insured by the FDIC up to applicable limits. As a general matter, the maximum deposit insurance amount is $250,000 per depositor.
Broad Supervision, Examination and Enforcement Powers
A principal objective of the U.S. bank regulatory system is to protect depositors by ensuring the financial safety and soundness of banking organizations. To that end, the banking regulators have broad regulatory, examination and enforcement authority. The regulators regularly examine the operations of banking organizations. In addition, banking organizations are subject to periodic reporting requirements.
The regulators have various remedies available if they determine that the financial condition, capital resources, asset quality, earnings prospects, management, liquidity or other aspects of a banking organization's operations are unsatisfactory. The regulators may also take action if they determine that the banking organization or its management is violating or has violated any law or regulation. The regulators have the power to, among other things:
|
•
|
enjoin "unsafe or unsound" practices;
|
|
•
|
require affirmative actions to correct any violation or practice;
|
|
•
|
issue administrative orders that can be judicially enforced;
|
|
•
|
direct increases in capital;
|
|
•
|
direct the sale of subsidiaries or other assets;
|
|
•
|
limit dividends and distributions;
|
|
•
|
restrict growth;
|
|
•
|
assess civil monetary penalties;
|
|
•
|
remove officers and directors; and
|
|
•
|
terminate deposit insurance.
|
The FDIC may terminate a depository institution's deposit insurance upon a finding that the institution's financial condition is unsafe or unsound or that the institution has engaged in unsafe or unsound practices or has violated any applicable rule, regulation, order or condition enacted or imposed by the institution's regulatory agency. Engaging in unsafe or unsound practices or failing to comply with applicable laws, regulations and supervisory agreements could subject BankUnited, Inc., the Bank and their subsidiaries or their officers, directors and institution-affiliated parties to the remedies described above and other sanctions.
The Dodd-Frank Act
The Dodd-Frank Act has had a broad impact on the financial services industry. The Dodd-Frank Act imposes significant regulatory and compliance requirements on banking organizations, particularly those with $10 billion or more in total consolidated assets, such as BankUnited, Inc. Although the Dodd-Frank Act has been in effect for several years, the ultimate effect of the Dodd-Frank Act and its implementing regulations on the financial services industry in general, and on us in particular, remains uncertain, especially in the current political environment.
6
The following is a brief description of certain provisions of the Dodd-Frank Act that are most relevant to BankUnited, Inc. and its banking subsidiary.
|
•
|
Source of strength
. The Dodd-Frank Act and Federal Reserve Board policy require all companies, including BHCs, that directly or indirectly control an insured depository institution to serve as a source of strength for the institution. Under this requirement, BankUnited, Inc. in the future could be required to provide financial assistance to BankUnited should it experience financial distress. Such support may be required at times when, absent this statutory and Federal Reserve Policy requirement, a BHC may not be inclined to provide it.
|
|
•
|
Limitation on federal preemption
. The Dodd-Frank Act significantly reduces the ability of national banks to rely on federal preemption of state consumer financial laws. Although the OCC, as the primary regulator of national banks, will have the ability to make preemption determinations where certain conditions are met, the broad rollback of federal preemption has the potential to create a patchwork of federal and state compliance obligations. This could, in turn, result in significant new regulatory requirements applicable to BankUnited, with potentially significant changes in our operations and increases in our compliance costs. It could also result in uncertainty concerning compliance, with attendant regulatory and litigation risks.
|
|
•
|
Company-Run Stress Testing
. Under Section 165(i) of the Dodd-Frank Act and the stress testing rules of the Federal Reserve Board and OCC, each BHC and national bank with more than $10 billion and less than $50 billion in total consolidated assets must annually conduct a company-run stress test to estimate the potential impact of three scenarios provided by the agencies on its regulatory capital ratios and certain other financial metrics. BankUnited, Inc. and the Bank are required to publicly disclose a summary of the results of these forward looking, company-run stress tests that assesses the impact of hypothetical macroeconomic baseline, adverse and severely adverse economic scenarios. In
2017
, BankUnited, Inc. and the Bank will submit the results of their company-run stress test to the Federal Reserve Board and OCC by July 31 and will publish a public summary of the results between October 15 and October 30.
|
|
•
|
Mortgage loan origination and risk retention
. The Dodd-Frank Act imposes new standards for mortgage loan originations on all lenders, including banking organizations, by requiring that lenders be able to substantiate they have made a good faith determination of a borrower's ability to repay a mortgage. The ability to repay requirement mandates specific factors that a lender must consider in evaluating a borrower's ability to repay. In 2013, federal regulators released the "qualified mortgage" rule. The qualified mortgage rule is intended to clarify the application of the Dodd-Frank Act requirement that mortgage lenders have a reasonable belief that borrowers have the ability to repay their mortgages. For mortgages meeting the regulatory definition of qualified mortgages, lenders generally enjoy a safe harbor with respect to compliance with the ability to repay rules. Generally, to be considered qualified mortgages, loans must meet all requirements set forth in the ability to repay rules and have debt-to-income ratios and closing costs not exceeding specified levels. Any prepayment penalties must fall within defined constraints. Loans meeting the regulatory definition of higher priced loans, or those with balloon, negative amortization or interest-only features do not meet the definition of qualified mortgages. While lenders are permitted to originate mortgages that do not meet the definition of qualified mortgages, the burden of demonstrating compliance with the ability to repay rules with respect to such mortgages is greater, possibly impeding a lender's ability to foreclose on such mortgages. Any loans that we make outside of the “qualified mortgage” criteria could expose us to an increased risk of liability and reduce or delay our ability to foreclose on the underlying property. The CFPB’s “qualified mortgage” rule could limit our ability or desire to make certain types of loans or loans to certain borrowers, or could make it more expensive or time consuming to make these loans. Any decreases in loan origination volume or increases in compliance and foreclosure costs caused by the rule could negatively affect our business, operating results and financial condition.
|
|
•
|
Expanded FDIC resolution authority.
While insured depository institutions have long been subject to the FDIC's resolution process, the Dodd-Frank Act creates a new mechanism for the FDIC to conduct the orderly liquidation of certain "covered financial companies," including bank and thrift holding companies and systemically significant non-bank financial companies. Upon certain findings being made, the FDIC may be appointed receiver for a covered financial company, and would conduct an orderly liquidation of the entity. The FDIC liquidation process is modeled on the existing FDIA bank resolution process, and generally gives the FDIC more discretion than in the traditional bankruptcy context. The FDIC has issued final rules implementing the orderly liquidation authority.
|
|
•
|
CFPB.
The Dodd-Frank Act created a new independent CFPB. The CFPB is tasked with establishing and implementing rules and regulations under certain federal consumer protection laws with respect to the conduct of providers of certain consumer financial products and services. The CFPB has rulemaking authority over many of the statutes governing products and services offered to bank and thrift consumers. For banking organizations with assets of $10 billion or more, such as BankUnited, Inc. and the Bank, the CFPB has exclusive rule making and examination, and primary enforcement authority under federal consumer financial law. In addition, the Dodd-Frank Act permits states to adopt consumer protection laws and regulations that are stricter than those regulations promulgated by the
|
7
CFPB. Compliance with any such new regulations could increase our cost of operations and could necessitate changes to certain of our business practices.
|
•
|
Deposit insurance.
The Dodd-Frank Act made permanent the general $250,000 deposit insurance limit for insured deposits. Amendments to the FDIA also revised the assessment base against which an insured depository institution's deposit insurance premiums paid to the DIF of the FDIC are calculated. Under the amendments, the assessment base is the institution's average consolidated total assets less its average tangible equity. Additionally, the Dodd-Frank Act made changes to the minimum designated reserve ratio of the DIF, increasing the minimum from 1.15 percent to 1.35 percent of the estimated amount of total insured deposits, and eliminating the requirement that the FDIC pay dividends to depository institutions when the reserve ratio exceeds certain thresholds.
|
|
•
|
Transactions with affiliates and insiders.
The Dodd-Frank Act generally enhanced the restrictions on transactions with affiliates under Section 23A and 23B of the Federal Reserve Act, including an expansion of the definition of "covered transactions" and clarification regarding the amount of time for which collateral requirements regarding covered credit transactions must be satisfied. Insider transaction limitations are expanded through the strengthening of loan restrictions to insiders and the expansion of the types of transactions subject to the various limits, including derivatives transactions, repurchase agreements, reverse repurchase agreements and securities lending or borrowing transactions. Restrictions are also placed on certain asset sales to and from an insider to an institution, including requirements that such sales be on market terms and, in certain circumstances, approved by the institution's board of directors.
|
|
•
|
Enhanced lending limits.
The Dodd-Frank Act strengthens the existing limits on a depository institution's credit exposure to one borrower. The OCC published a final rule in 2013 amending its existing lending limits to incorporate changes made by the Dodd-Frank Act. The Dodd-Frank Act and the final rule amend the OCC's lending limit regulation to include credit exposures arising from derivative transactions and repurchase agreements, reverse repurchase agreements, securities lending transactions, and securities borrowing transactions. The final rule exempts certain types of transactions, and outlines the methods that banks can choose from to measure credit exposures of derivative transactions and securities financing transactions. In most cases, a bank may choose which method it will use; the OCC, however, may specify that a bank use a particular method for safety and soundness reasons.
|
|
•
|
Corporate governance.
The Dodd-Frank Act addresses many investor protection, corporate governance and executive compensation matters that affect most U.S. publicly traded companies, including BankUnited, Inc. The Dodd-Frank Act (1) grants stockholders of U.S. publicly traded companies an advisory vote on executive compensation; (2) enhances independence requirements for compensation committee members; (3) requires companies listed on national securities exchanges to adopt incentive-based compensation claw-back policies for executive officers; and (4) provides the SEC with authority to adopt proxy access rules that would allow stockholders of publicly traded companies to nominate candidates for election as a director and have those nominees included in a company's proxy materials.
|
|
•
|
Interchange Fees.
The Dodd-Frank Act gave the Federal Reserve Board the authority to establish rules regarding interchange fees charged for electronic debit transactions by a payment card issuer that, together with its affiliates, has assets of $10 billion or more and to enforce a new statutory requirement that such fees be reasonable and proportional to the actual cost of a transaction to the issuer. The Federal Reserve Board has adopted rules under this provision that limit the swipe fees that a debit card issuer can charge a merchant for a transaction to the sum of 21 cents and five basis points times the value of the transaction, plus up to one cent for fraud prevention costs.
|
The requirements of the Dodd-Frank Act are in the process of being implemented over time. Although much of the rulemaking associated with the Dodd-Frank Act has been finalized, other regulations and requirements are expected to be implemented over the course of the next several years.
The Volcker Rule
In 2013, five U.S. financial regulators, including the Federal Reserve Board and the OCC, adopted a final rule implementing the so-called "Volcker Rule." The Volcker Rule was created by Section 619 of the Dodd-Frank Act and generally prohibits "banking entities" from engaging in "proprietary trading" and making investments and conducting certain other activities with "covered funds."
Although the final rule provides some tiering of compliance and reporting obligations based on size, the fundamental prohibitions of the Volcker Rule apply to banking entities of any size, including BankUnited, Inc. and BankUnited. Banking entities with total assets of $10 billion or more that engage in activities subject to the Volcker Rule will be required to establish a six-element compliance program to address the prohibitions of, and exemptions from, the Volcker Rule. The final rule became effective April 1, 2014; however, at the time the agencies released the final Volcker Rule, the Federal Reserve Board announced
8
an extension of the conformance period for all banking entities until July 21, 2015. The Federal Reserve Board has granted additional extensions to July 21, 2017, for certain “legacy covered fund” investments and relationships entered into by banking entities prior to December 31, 2013.
In response to industry questions regarding the final Volcker Rule, the OCC, Federal Reserve Board, the FDIC, the SEC, and the CFTC issued a clarifying interim final rule on January 14, 2014, permitting banking entities to retain interests in certain CDOs backed by trust preferred securities if the CDO meets certain requirements.
Notice and Approval Requirements Related to Control
Banking laws impose notice, approval, and ongoing regulatory requirements on any stockholder or other party that seeks to acquire direct or indirect "control" of an FDIC-insured depository institution. These laws include the BHC Act, the Change in Bank Control Act, and the Home Owners' Loan Act. Among other things, these laws require regulatory filings by individuals or companies that seek to acquire direct or indirect "control" of an FDIC-insured depository institution. The determination of whether an investor "controls" a depository institution is based on all of the facts and circumstances surrounding the investment. As a general matter, a party is deemed to control a depository institution or other company if the party owns or controls 25% or more of any class of voting stock. Subject to rebuttal, a party may be presumed to control a depository institution or other company if the investor owns or controls 10% or more of any class of voting stock. Ownership by affiliated parties, or parties acting in concert, is typically aggregated for these purposes. If a party's ownership of BankUnited, Inc. were to exceed certain thresholds, the investor could be deemed to "control" the Company for regulatory purposes. This could subject the investor to regulatory filings or other regulatory consequences.
In addition, except under limited circumstances, BHCs are prohibited from acquiring, without prior approval:
|
•
|
control of any other bank or BHC or all or substantially all the assets thereof; or
|
|
•
|
more than 5% of the voting shares of a bank or BHC which is not already a subsidiary.
|
Permissible Activities and Investments
Banking laws generally restrict the ability of BankUnited, Inc. to engage in activities other than those determined by the Federal Reserve Board to be so closely related to banking as to be a proper incident thereto. The GLB Act expanded the scope of permissible activities for a BHC that qualifies as a financial holding company. Under the regulations implementing the GLB Act, a financial holding company may engage in additional activities that are financial in nature or incidental or complementary to a financial activity. Those activities include, among other activities, certain insurance and securities activities. Under the Dodd-Frank Act, BHCs and their subsidiaries must be well-capitalized and well-managed in order for the BHC and its nonbank affiliates to engage in the expanded financial activities permissible only for a financial holding company. BankUnited, Inc. is not a financial holding company.
In addition, as a general matter, the establishment or acquisition by BankUnited, Inc. of a non-bank entity, or the initiation of a non-banking activity, requires prior regulatory approval. In approving acquisitions or the addition of activities, the Federal Reserve Board considers, among other things, whether the acquisition or the additional activities can reasonably be expected to produce benefits to the public, such as greater convenience, increased competition or gains in efficiency, that outweigh such possible adverse effects as undue concentration of resources, decreased or unfair competition, conflicts of interest or unsound banking practices.
Regulatory Capital Requirements and Capital Adequacy
The federal bank regulators view capital levels as important indicators of an institution's financial soundness. As a general matter, FDIC-insured depository institutions and their holding companies are required to maintain minimum capital relative to the amount and types of assets they hold. The final supervisory determination on an institution's capital adequacy is based on the regulator's assessment of numerous factors. Both BankUnited, Inc. and BankUnited are subject to regulatory capital requirements.
The Federal Reserve Board has established risk-based and leverage capital guidelines for BHCs, including BankUnited, Inc. The OCC has established substantially similar risk-based and leverage capital guidelines applicable to national banks, including BankUnited. The risk-based capital guidelines in place prior to January 1, 2015, commonly referred to as Basel I, were based upon the 1988 capital accord of the International Basel Committee on Banking Supervision ("Basel Committee"), a committee of central banks and bank supervisors, as implemented by the U.S. federal banking agencies. Revised capital guidelines became effective on January 1, 2015, based on the final framework for strengthening international capital and liquidity regulation, released by the Basel Committee in 2010, referred to as "Basel III." The Basel III calibration and phase-in arrangements were subject to individual adoption by member nations, including the United States.
9
In July 2013, the federal banking agencies published final rules implementing the Basel III framework and certain provisions of the Dodd-Frank Act (the "Basel III Capital Rules"). While some provisions are tailored to larger institutions, the Basel III Capital Rules generally apply to all U.S. banking organizations, including BankUnited, Inc. and BankUnited.
Among other things, the Basel III Capital Rules: (i) introduce a new capital measure entitled "Common Equity Tier 1" ("CET1"); (ii) specify that tier 1 capital consist of CET1 and additional instruments satisfying specified requirements that permit inclusion in tier 1 capital; (iii) define CET1 narrowly by requiring that most deductions or adjustments to regulatory capital measures be made to CET1 and not to the other components of capital; and (iv) expand the scope of the deductions or adjustments from capital as compared to the existing regulations.
Under the Basel III Capital Rules, banking organizations that do not meet the definition of an advanced approaches institution were provided a one-time option in their initial regulatory financial report filed after January 1, 2015 to remove certain components of accumulated other comprehensive income from the computation of common equity regulatory capital. BankUnited, Inc. and BankUnited made such elections.
The Basel III Capital Rules also implement stricter eligibility requirements for regulatory capital instruments intended to disallow the inclusion of all non-exempt issuances of trust preferred securities and cumulative perpetual preferred stock from tier 1 capital. The Basel III Capital Rules provide additional constraints on the inclusion of minority interests, mortgage servicing assets, deferred tax assets and certain investments in the capital of unconsolidated financial institutions in tier 1 capital, as well as applying stricter risk weighting rules to these assets.
The Basel III Capital Rules provide for the following minimum capital to risk-weighted assets ratios:
|
(i)
|
4.5% based upon CET1;
|
|
(ii)
|
6.0% based upon tier 1 capital; and
|
|
(iii)
|
8.0% based upon total regulatory capital.
|
A minimum leverage ratio (tier 1 capital as a percentage of average total assets) of 4.0% is also required under the Basel III Capital Rules. The Basel III Capital Rules additionally require institutions to retain a capital conservation buffer of 2.5% above these required minimum capital ratio levels, to be phased in at annual increments of 0.625% that began in 2016. Banking organizations that fail to maintain the minimum required capital conservation buffer could face restrictions on capital distributions or discretionary bonus payments to executive officers, with distributions and discretionary bonus payments being completely prohibited if no capital conservation buffer exists, or in the event of the following: (i) the banking organization's capital conservation buffer was below 2.5% (or the minimum amount required) at the beginning of a quarter; and (ii) its cumulative net income for the most recent quarterly period plus the preceding four calendar quarters is less than its cumulative capital distributions (as well as associated tax effects not already reflected in net income) during the same measurement period.
The Basel III Capital Rules also provide stricter rules related to the risk weighting of past due and certain commercial real estate loans, as well as on some equity investment exposures, and replace the existing credit rating approach for determining the risk weighting of securitization exposures with an alternative approach.
Finally, the Basel III Capital Rules amend the thresholds under the "prompt corrective action" framework enforced with respect to the Bank by the OCC to reflect both (i) the generally heightened requirements for regulatory capital ratios as well as (ii) the introduction of the CET1 capital measure.
The enactment of the Basel III Capital Rules increased the required capital levels of BankUnited, Inc. and BankUnited. The Basel III Capital Rules became effective as applied to BankUnited, Inc. and BankUnited on January 1, 2015, with a phase in period from January 1, 2015 through January 1, 2019.
Liquidity Coverage Ratio
The Basel III Capital Rules adopted in July 2013 did not address the proposed LCR called for by the Basel Committee's Basel III framework. On September 3, 2014, the Federal Reserve Board finalized a rule implementing a LCR requirement in the United States for larger banking organizations. Neither BankUnited, Inc. nor BankUnited are subject to the LCR requirement.
10
Prompt Corrective Action
Under the FDIA, the federal bank regulatory agencies must take "prompt corrective action" against undercapitalized U.S. depository institutions. U.S. depository institutions are assigned one of five capital categories: "well capitalized," "adequately capitalized," "undercapitalized," "significantly undercapitalized," and "critically undercapitalized," and are subjected to differential regulation corresponding to the capital category within which the institution falls. As of
December 31, 2016
, a depository institution was deemed to be "well capitalized" if the banking institution had a total risk-based capital ratio of 10.0% or greater, a tier 1 risk-based capital ratio of 8.0% or greater, a CET1 risk-based capital ratio of 6.5% and a leverage ratio of 5.0% or greater, and the institution was not subject to an order, written agreement, capital directive, or prompt corrective action directive to meet and maintain a specific level for any capital measure. Under certain circumstances, a well-capitalized, adequately-capitalized or undercapitalized institution may be treated as if the institution were in the next lower capital category. A banking institution that is undercapitalized is required to submit a capital restoration plan. Failure to meet capital guidelines could subject the institution to a variety of enforcement remedies by federal bank regulatory agencies, including: termination of deposit insurance by the FDIC, restrictions on certain business activities, and appointment of the FDIC as conservator or receiver. As of
December 31, 2016
, BankUnited, Inc. and BankUnited were well capitalized.
Regulatory Limits on Dividends and Distributions
Federal law currently imposes limitations upon certain capital distributions by national banks, such as certain cash dividends, payments to repurchase or otherwise acquire its shares, payments to stockholders of another institution in a cash-out merger and other distributions charged against capital. The Federal Reserve Board and OCC regulate all capital distributions by BankUnited directly or indirectly to BankUnited, Inc., including dividend payments.
BankUnited may not pay dividends to BankUnited, Inc. if, after paying those dividends, it would fail to meet the required minimum levels under risk-based capital guidelines and the minimum leverage capital ratio requirements, or in the event the OCC notified BankUnited that it was in need of more than normal supervision. Under the FDIA, an insured depository institution such as BankUnited is prohibited from making capital distributions, including the payment of dividends, if, after making such distribution, the institution would become "undercapitalized." Payment of dividends by BankUnited also may be restricted at any time at the discretion of the appropriate regulator if it deems the payment to constitute an unsafe and unsound banking practice.
BankUnited is subject to supervisory limits on its ability to declare or pay a dividend or reduce its capital unless certain conditions are satisfied.
In addition, it is the policy of the Federal Reserve Board that BHCs should pay cash dividends on common stock only out of income available over the past year and only if prospective earnings retention is consistent with the organization’s expected future needs and financial condition. The policy provides that BHCs should not maintain a level of cash dividends that undermines the BHC’s ability to serve as a source of strength to its banking subsidiaries.
Reserve Requirements
Pursuant to regulations of the Federal Reserve Board, all banking organizations are required to maintain average daily reserves at mandated ratios against their transaction accounts. In addition, reserves must be maintained on certain non-personal time deposits. These reserves must be maintained in the form of vault cash or in an account at a Federal Reserve Bank.
Limits on Transactions with Affiliates and Insiders
Insured depository institutions are subject to restrictions on their ability to conduct transactions with affiliates and other related parties. Section 23A of the Federal Reserve Act imposes quantitative limits, qualitative requirements, and collateral requirements on certain transactions by an insured depository institution with, or for the benefit of, its affiliates. Transactions covered by Section 23A include loans, extensions of credit, investment in securities issued by an affiliate, and acquisitions of assets from an affiliate. Section 23B of the Federal Reserve Act requires that most types of transactions by an insured depository institution with, or for the benefit of, an affiliate be on terms at least as favorable to the insured depository institution as if the transaction were conducted with an unaffiliated third party.
As noted above, the Dodd-Frank Act generally enhances the restrictions on transactions with affiliates under Section 23A and 23B of the Federal Reserve Act, including an expansion of the definition of "covered transactions" and a clarification regarding the amount of time for which collateral requirements regarding covered credit transactions must be satisfied. The ability of the Federal Reserve Board to grant exemptions from these restrictions is also narrowed by the Dodd-Frank Act, including by requiring coordination with other bank regulators.
11
The Federal Reserve Board's Regulation O and OCC regulations impose restrictions and procedural requirements in connection with the extension of credit by an insured depository institution to directors, executive officers, principal stockholders and their related interests.
Examination Fees
The OCC currently charges fees to recover the costs of examining national banks, processing applications and other filings, and covering direct and indirect expenses in regulating national banks. The Dodd-Frank Act provides various agencies with the authority to assess additional supervision fees.
Deposit Insurance Assessments
FDIC-insured depository institutions are required to pay deposit insurance assessments to the FDIC. The amount of a particular institution's deposit insurance assessment is based on that institution's risk classification under an FDIC risk-based assessment system. An institution's risk classification is assigned based on its capital levels and the level of supervisory concern the institution poses to the regulators. Deposit insurance assessments fund the DIF. As noted above, the Dodd-Frank Act changed the way an insured depository institution's deposit insurance premiums are calculated and increased the minimum for the DIF reserve ratio from 1.15% to 1.35%. The Dodd-Frank Act also made banks with $10 billion or more in total assets responsible for the increase. Effective in the third quarter of 2016, regular assessment rates for all banks were reduced; however, banks with total assets of $10 billion or more began paying an assessment surcharge equal to 4.5 cents per $100 of their assessment base in excess of $10 billion. The surcharge will continue until such time the DIF reserve ratio exceeds 1.35%. Future changes to our risk classification or to the method for calculating premiums generally may impact assessment rates, which could impact the profitability of our operations.
Depositor Preference
The FDIA provides that, in the event of the "liquidation or other resolution" of an insured depository institution, the claims of depositors of the institution (including the claims of the FDIC as subrogee of insured depositors) and certain claims for administrative expenses of the FDIC as a receiver will have priority over other general unsecured claims against the institution. If we invest in or acquire an insured depository institution that fails, insured and uninsured depositors, along with the FDIC, will have priority in payment ahead of unsecured, non-deposit creditors, including us, with respect to any extensions of credit they have made to such insured depository institution.
Federal Reserve System and Federal Home Loan Bank System
As a national bank, BankUnited is required to hold shares of capital stock in a Federal Reserve Bank. BankUnited holds capital stock in the Federal Reserve Bank of Atlanta. As a member of the Federal Reserve System, BankUnited has access to the Federal Reserve discount window lending and payment clearing systems.
BankUnited is a member of the Federal Home Loan Bank of Atlanta. Each FHLB provides a central credit facility primarily for its member institutions as well as other entities involved in home mortgage lending. Any advances from a FHLB must be secured by specified types of collateral. As a member of the FHLB, BankUnited is required to acquire and hold shares of capital stock in the FHLB of Atlanta. BankUnited is in compliance with this requirement.
Anti-Money Laundering and OFAC
Under federal law, financial institutions must maintain anti-money laundering programs that include established internal policies, procedures, and controls; a designated compliance officer; an ongoing employee training program; and testing of the program by an independent audit function. Financial institutions are also prohibited from entering into specified financial transactions and account relationships and must meet enhanced standards for due diligence and customer identification in their dealings with non-U.S. financial institutions and non-U.S. customers. Financial institutions must take reasonable steps to conduct enhanced scrutiny of account relationships to guard against money laundering and to report any suspicious transactions, and law enforcement authorities have been granted increased access to financial information maintained by financial institutions. Bank regulators routinely examine institutions for compliance with these obligations and they must consider an institution's compliance in connection with the regulatory review of applications, including applications for banking mergers and acquisitions. The regulatory authorities have imposed "cease and desist" orders and civil money penalty sanctions against institutions found to be violating these obligations.
The U.S. Department of the Treasury's OFAC is responsible for helping to insure that U.S. entities do not engage in transactions with certain prohibited parties, as defined by various Executive Orders and Acts of Congress. OFAC publishes lists of persons, organizations, and countries suspected of aiding, harboring or engaging in terrorist acts, known as Specially
12
Designated Nationals and Blocked Persons. If BankUnited, Inc. or BankUnited finds a name on any transaction, account or wire transfer that is on an OFAC list, BankUnited, Inc. or BankUnited must freeze or block such account or transaction, file a suspicious activity report and notify the appropriate authorities.
Consumer Laws and Regulations
Banking organizations are subject to numerous laws and regulations intended to protect consumers. These laws include, among others:
|
•
|
Truth in Lending Act;
|
|
•
|
Truth in Savings Act;
|
|
•
|
Electronic Funds Transfer Act;
|
|
•
|
Expedited Funds Availability Act;
|
|
•
|
Equal Credit Opportunity Act;
|
|
•
|
Fair and Accurate Credit Transactions Act;
|
|
•
|
Fair Housing Act;
|
|
•
|
Fair Credit Reporting Act;
|
|
•
|
Fair Debt Collection Act;
|
|
•
|
Gramm-Leach-Bliley Act;
|
|
•
|
Home Mortgage Disclosure Act;
|
|
•
|
Right to Financial Privacy Act;
|
|
•
|
Real Estate Settlement Procedures Act;
|
|
•
|
laws regarding unfair and deceptive acts and practices; and
|
|
•
|
usury laws.
|
Many states and local jurisdictions have consumer protection laws analogous, and in addition to, those listed above. These federal, state and local laws regulate the manner in which financial institutions deal with customers when taking deposits, making loans, or conducting other types of transactions. Failure to comply with these laws and regulations could give rise to regulatory sanctions, customer rescission rights, action by state and local attorneys general, and civil or criminal liability. The creation of the CFPB by the Dodd-Frank Act has led to enhanced enforcement of consumer financial protection laws.
The Community Reinvestment Act
The CRA is intended to encourage banks to help meet the credit needs of their service areas, including low and moderate-income neighborhoods, consistent with safe and sound operations. The bank regulators examine and assign each bank a public CRA rating.
The CRA requires bank regulators to take into account the bank's record in meeting the needs of its service area when considering an application by a bank to establish or relocate a branch or to conduct certain mergers or acquisitions. The Federal Reserve Board is required to consider the CRA records of a BHC's controlled banks when considering an application by the BHC to acquire a banking organization or to merge with another BHC. When BankUnited, Inc. or BankUnited applies for regulatory approval to make certain investments, the regulators will consider the CRA record of target institutions and BankUnited, Inc.'s depository institution subsidiaries. An unsatisfactory CRA record could substantially delay approval or result in denial of an application. The regulatory agency's assessment of the institution's record is made available to the public. Following its most recent CRA examination in September 2015, BankUnited received an overall rating of "Satisfactory."
Employees
At
December 31, 2016
, we employed 1,622 full-time employees and 84 part-time employees. None of our employees are parties to a collective bargaining agreement. We believe that our relations with our employees are good.
13
Available Information
Our website address is www.bankunited.com. Our electronic filings with the SEC (including all Annual Reports on Form 10-K, Quarterly Reports on Form 10-Q, Current Reports on Form 8-K, and if applicable, amendments to those reports) are available free of charge on the website as soon as reasonably practicable after they are electronically filed with, or furnished to, the SEC. The information posted on our website is not incorporated into this Annual Report. In addition, the SEC maintains a website that contains reports and other information filed with the SEC. The website can be accessed at http://www.sec.gov.
14
Risks Related to Our Business
Our business may be adversely affected by conditions in the financial markets and economic conditions generally.
Deterioration in business or economic conditions generally, or more specifically in the principal markets in which we do business, could have one or more of the following adverse effects on our business, financial condition and results of operations:
|
•
|
A decrease in demand for our loan and deposit products;
|
|
•
|
An increase in delinquencies and defaults by borrowers or counterparties;
|
|
•
|
A decrease in the value of our assets;
|
|
•
|
A decrease in our earnings;
|
|
•
|
A decrease in liquidity; and
|
|
•
|
A decrease in our ability to access the capital markets.
|
Our enterprise risk management framework may not be effective in mitigating the risks to which we are subject, or in reducing the potential for losses in connection with such risks.
Our enterprise risk management framework is designed to identify and minimize or mitigate the risks to which we are subject, as well as any losses stemming from such risks. Although we seek to identify, measure, monitor, report, and control our exposure to such risks, and employ a broad and diversified set of risk monitoring and mitigation techniques in the process, those techniques are inherently limited in their ability to anticipate the existence or development of risks that are currently unknown and unanticipated. The ineffectiveness of our enterprise risk management framework in mitigating the impact of known risks or the emergence of previously unknown or unanticipated risks may result in our incurring losses in the future that could adversely impact our financial condition and results of operations.
Our business is highly susceptible to credit risk on our non-covered assets.
As a lender, we are exposed to the risk that our customers will be unable to repay their loans according to their terms and that the collateral securing the payment of their loans, if any, may be insufficient to ensure repayment. Credit losses are inherent in the business of making loans. We are also subject to credit risk that is embedded in our securities portfolio. Our credit standards, procedures and policies may not prevent us from incurring substantial credit losses, particularly if economic or market conditions deteriorate. It is difficult to determine the many ways in which a decline in economic or market conditions may impact the credit quality of our assets. The Loss Sharing Agreements only cover a small percentage of assets, and credit losses on assets not covered by the Loss Sharing Agreements could have a material adverse effect on our operating results.
Our allowance for loan and lease losses may not be adequate to cover actual credit losses.
We maintain an allowance for loan and lease losses ("ALLL") that represents management's estimate of probable losses inherent in our credit portfolio. This estimate requires management to make significant assumptions and involves a high degree of judgment, which is inherently subjective, particularly as our non-covered loan portfolio has not yet developed an observable loss trend through a full credit cycle. Management considers numerous factors in determining the amount of the ALLL, including, but not limited to, historical loss severities and net charge-off rates of BankUnited and other comparable financial institutions, internal risk ratings, loss forecasts, collateral values, delinquency rates, the level of non-performing, criticized, classified and restructured loans in the portfolio, product mix, underwriting and credit administration policies and practices, portfolio trends, concentrations, industry conditions, economic trends and other factors considered by management to have an impact on the ability of borrowers to repay their loans. The effects of any decreases in expected cash flows on covered loans are also considered in the establishment of the ALLL.
15
If management's assumptions and judgments prove to be incorrect, our current allowance may be insufficient and we may be required to increase our ALLL. In addition, regulatory authorities periodically review our ALLL and may require us to increase our provision for loan losses or recognize further loan charge-offs, based on judgments different than those of our management. Adverse economic conditions could make management's estimate even more complex and difficult to determine. Any increase in our ALLL will result in a decrease in net income and capital and could have a material adverse effect on our financial condition and results of operations. See Item 7 "Management's Discussion and Analysis of Financial Condition and Results of Operations—Analysis of the Allowance for Loan and Lease Losses" and "Management's Discussion and Analysis of Financial Condition and Results of Operations—Critical Accounting Policies and Estimates—Allowance for Loan and Lease Losses."
We depend on the accuracy and completeness of information about clients and counterparties.
In deciding whether to extend credit or enter into other transactions with clients and counterparties, we may rely on information furnished by or on behalf of clients and counterparties, including financial statements and other financial information. We also may rely on representations of clients and counterparties as to the accuracy and completeness of that information and, with respect to financial statements, on reports of independent auditors.
Our business is susceptible to interest rate risk.
Our business and financial performance are impacted by market interest rates and movements in those rates. Since a high percentage of our assets and liabilities are interest bearing or otherwise sensitive in value to changes in interest rates, changes in rates, in the shape of the yield curve or in spreads between different types of rates can have a material impact on our results of operations and the values of our assets and liabilities. Changes in the value of investment securities available for sale and certain derivatives directly impact equity through adjustments of accumulated other comprehensive income and changes in the values of certain other assets and liabilities may directly or indirectly impact earnings. Interest rates are highly sensitive to many factors over which we have no control and which we may not be able to anticipate adequately, including general economic conditions and the monetary and tax policies of various governmental bodies, particularly the Federal Reserve Board.
Our earnings and cash flows depend to a great extent upon the level of our net interest income. Net interest income is the difference between the interest income we earn on loans, investments and other interest earning assets, and the interest we pay on interest bearing liabilities, such as deposits and borrowings. The recent persistent low level of market interest rates has limited our ability to add higher yielding assets to the balance sheet. If this prolonged period of low rates continues beyond current forecasts or interest rates increase more slowly than expected, it may exacerbate downward pressure on our net interest margin and have a negative impact on our net interest income in the future. Changes in interest rates can increase or decrease our net interest income, because different types of assets and liabilities may react differently, and at different times, to market interest rate changes. When interest bearing liabilities mature or reprice more quickly than interest earning assets in a period of rising rates, an increase in interest rates could reduce net interest income. When interest earning assets mature or reprice more quickly than interest bearing liabilities, falling interest rates could reduce net interest income. Additionally, an increase in interest rates may, among other things, reduce the demand for loans and our deposit products, decrease loan repayment rates and negatively affect borrowers' ability to meet their obligations. A decrease in the general level of interest rates may affect us through, among other things, increased prepayments on our loan and mortgage-backed securities portfolios and increased competition for deposits. A flattening or inversion of the yield curve or a negative interest rate environment in the United States could create downward pressure on our net interest margin.
We attempt to manage interest rate risk by adjusting the rates, maturity, repricing, mix and balances of the different types of interest-earning assets and interest bearing liabilities and through the use of hedging instruments; however, interest rate risk management techniques are not precise, and we may not be able to successfully manage our interest rate risk. Our ability to manage interest rate risk could be negatively impacted by longer fixed rate terms on loans being added to our portfolio or by unpredictable behavior of depositors in various interest rate environments. A rapid or unanticipated increase or decrease in interest rates, changes in the shape of the yield curve or in spreads between rates could have an adverse effect on our net interest margin and results of operations.
A failure to maintain adequate liquidity could adversely affect our financial condition and results of operations.
Effective liquidity management is essential for the operation of our business. We require sufficient liquidity to meet customer loan requests, customer deposit maturities and withdrawals and other cash commitments under both normal operating conditions and under extraordinary or unpredictable circumstances causing industry or general financial market stress. Our access to funding sources in amounts adequate to finance our activities on terms that are acceptable to us could be impaired by factors that affect us specifically or the financial services industry or economy generally. Factors that could detrimentally impact our access to liquidity sources include a downturn in economic conditions in the geographic markets in which our
16
operations are concentrated or in the financial or credit markets in general. Our access to liquidity in the form of deposits may also be affected by the liquidity needs of our depositors and by competition for deposits in our primary markets. A substantial portion of our liabilities consist of deposit accounts that are payable on demand or upon several days' notice, while by comparison, the majority of our assets are loans, which cannot be called or sold in the same time frame. Although we have historically been able to replace maturing deposits and borrowings as necessary, we might not be able to replace such funds in the future. A failure to maintain adequate liquidity could materially and adversely affect our business, results of operations or financial condition.
We may not be successful in executing our fundamental growth strategy.
Organic growth of our business is an essential component of our business strategy. Commercial and consumer banking in our primary markets is highly competitive. Our ability to achieve organic growth is also dependent on economic conditions in our primary markets. There is no guarantee that we will be able to successfully or profitably execute our organic growth strategy.
While acquisitions have not historically been a primary contributor to our growth, we opportunistically consider potential acquisitions of financial institutions and complementary non-bank businesses. There are risks that may inhibit our ability to successfully execute such acquisitions. We compete with other financial institutions for acquisition opportunities and there are a limited number of candidates that meet our acquisition criteria. Consequently, we may not be able to identify suitable candidates for acquisitions.
If we do identify suitable candidates, there is no assurance that we will be able to obtain the required regulatory approvals in order to acquire them. If we do succeed in consummating future acquisitions, acquisitions involve risks that the acquired businesses may not achieve anticipated revenue, earnings, synergies or cash flows or that the other strategic benefits of the acquisitions may not be realized. There may also be unforeseen liabilities relating to the acquired businesses or arising out of the acquisitions, asset quality problems of the acquired entities, difficulty operating in markets in which we have had no or only limited experience and other conditions not within our control, such as adverse personnel relations, loss of customers because of change in identity, and deterioration in local economic conditions.
In addition, the process of integrating acquired entities will divert significant management time and resources. We may not be able to integrate successfully or operate profitably any financial institutions or complementary businesses we may acquire. We may experience disruption and incur unexpected expenses in integrating acquisitions. Any acquisitions we do make may not enhance our cash flows, business, financial condition, results of operations or prospects and may have an adverse effect on our results of operations, particularly during periods in which the acquisitions are being integrated into our operations.
Lastly, our growth plans are dependent on the availability of capital and funding. Our ability to raise capital through the sale of stock or debt securities may be affected by market conditions, economic conditions or regulatory changes. There is no assurance that sufficient capital or funding will be available in the future, upon acceptable terms or at all.
Failure to comply with the terms of our Loss Sharing Agreements with the FDIC may result in significant losses.
A significant portion of BankUnited's revenue continues to be derived from the covered assets. The Loss Sharing Agreements with the FDIC provide that a significant portion of losses related to the covered assets will be borne by the FDIC. Under the Loss Sharing Agreements, we are obligated to comply with certain loan servicing standards, including requirements to participate in government-sponsored loan modification programs. As these standards continue to evolve, we may experience difficulties in complying with the requirements of the Loss Sharing Agreements, which could result in covered assets losing some or all of their coverage. BankUnited's compliance with the terms of the Loss Sharing Agreements is subject to audit by the FDIC through its designated agent. The required terms of the agreements are extensive and failure to comply with any of the guidelines could result in a specific asset or group of assets losing their loss sharing coverage. See "Item 1. Business—The FSB Acquisition."
The geographic concentration of our markets in Florida and the New York metropolitan area makes our business highly susceptible to local economic conditions.
Unlike some larger financial institutions that are more geographically diversified, our operations are concentrated in Florida and the New York metropolitan area. Additionally, a significant portion of our loans secured by real estate are secured by commercial and residential properties in these geographic regions. Accordingly, the ability of our borrowers to repay their loans, and the value of the collateral securing such loans, may be significantly affected by economic conditions in these regions or by changes in the local real estate markets. Disruption or deterioration in economic conditions in the markets we serve could result in one or more of the following:
17
|
•
|
an increase in loan delinquencies;
|
|
•
|
an increase in problem assets and foreclosures;
|
|
•
|
a decrease in the demand for our products and services; or
|
|
•
|
a decrease in the value of collateral for loans, especially real estate, in turn reducing customers' borrowing power, the value of assets associated with problem loans and collateral coverage.
|
Hurricanes and other weather-related events, as well as man-made disasters, could cause a disruption in our operations or other consequences that could have an adverse impact on our results of operations.
The occurrence of a hurricane or other natural disaster to which our markets are susceptible or a man-made catastrophe or terrorist activity could disrupt our operations, result in damage to our properties, reduce or destroy the value of collateral and negatively affect the local economies in which we operate, which could have a material adverse effect on our results of operations.
Since we engage in lending secured by real estate and may be forced to foreclose on the collateral property and own the underlying real estate, we may be subject to the increased costs and risks associated with the ownership of commercial or residential real property, which could have an adverse effect on our business or results of operations.
A significant portion of our loan portfolio is secured by residential or commercial real property. During the ordinary course of business, we may foreclose on and take title to properties securing certain loans, in which case, we are exposed to the risks inherent in the ownership of real estate. The amount that we, as a mortgagee, may realize after a default is dependent upon factors outside of our control, including:
|
•
|
general or local economic conditions;
|
|
•
|
environmental cleanup liability;
|
|
•
|
neighborhood values;
|
|
•
|
interest rates;
|
|
•
|
commercial real estate rental and vacancy rates;
|
|
•
|
real estate tax rates;
|
|
•
|
operating expenses of the mortgaged properties;
|
|
•
|
supply of and demand for properties;
|
|
•
|
ability to obtain and maintain adequate occupancy of the properties;
|
|
•
|
zoning laws;
|
|
•
|
governmental rules, regulations and fiscal policies; and
|
|
•
|
hurricanes or other natural or man-made disasters.
|
These same factors may impact the ability of borrowers to repay their obligations that are secured by real property.
The credit quality of our loan portfolio and results of operations are affected by residential and commercial real estate values and the level of residential and commercial real estate sales and rental activity.
A material portion of our loans are secured by residential or commercial real estate. The ability of our borrowers to repay their obligations and our financial results may therefore be adversely affected by changes in real estate values. Commercial real estate valuations in particular are highly subjective, as they are based on many assumptions. Such valuations can be significantly affected over relatively short periods of time by changes in business climate, economic conditions, occupancy rates, the level of rents, interest rates and, in many cases, the results of operations of businesses and other occupants of the real property. The properties securing income-producing investor real estate loans may not be fully leased at the origination of the loan. A borrower's ability to repay these loans is dependent upon stabilization of the properties and additional leasing through the life of the loan or the borrower's successful operation of a business. Weak economic conditions may impair a borrower's business operations, lead to elevated vacancy rates or lease turnover, slow the execution of new leases or result in falling rents. These factors could result in further deterioration in the fundamentals underlying the commercial real estate market and the
18
deterioration in value of some of our loans. Similarly, residential real estate valuations can be impacted by housing trends, the availability of financing at reasonable interest rates, the level of supply of available housing, governmental policy regarding housing and housing finance and general economic conditions affecting consumers.
We make credit and reserve decisions based on current real estate values, the current conditions of borrowers, properties or projects and our expectations for the future. If real estate values or fundamentals underlying the commercial and residential real estate markets decline, we could experience higher delinquencies and charge-offs beyond that provided for in the ALLL.
Our portfolio of loans secured by taxi medallions is exposed to fluctuations in the demand for taxi services and valuation of the underlying collateral.
We have a portfolio of loans secured by taxi medallions, substantially all of which are in New York City. The introduction of application-based mobile ride services, such as Uber, has caused a more competitive landscape for these services, resulting in reduced ridership and utilization of taxis and a reduction in the pool of drivers willing to drive taxis. Consequently, the reduced income generated from the operation of taxi medallions has caused significant declines in the market value of medallions, increased defaults on loans secured by taxi medallions and an increase in TDRs, due to borrowers' inability to repay these loans at maturity. Management has provided for estimated losses incurred through
December 31, 2016
; however, further declines in demand for taxi services or further deterioration in the value of medallions may result in higher delinquencies, additional TDRs and losses beyond that provided for in the ALLL.
Our portfolio of assets under operating lease is exposed to fluctuations in the demand for and valuation of the underlying assets.
Our equipment leasing business is exposed to asset risk resulting from ownership of the equipment on operating lease. Asset risk arises from fluctuations in supply and demand for the underlying leased equipment. We are exposed to the risk that, at the end of the lease term or in the event of early termination, the value of the asset will be lower than expected, resulting in reduced future lease income over the remaining life of the asset or a lower sale value. Demand for and the valuation of the leased equipment is sensitive to shifts in general and industry specific economic and market trends, governmental regulations and changes in trade flows from specific events such as natural or man-made disasters. A significant portion of our equipment under operating lease consists of rail cars used directly or indirectly in oil and gas drilling activities. Although we regularly monitor the value of the underlying assets and the potential impact of declines in oil and natural gas prices on the value of railcars on operating lease, there is no assurance that the value of these assets will not be adversely impacted by conditions in the energy industry.
Our reported financial results depend on management's selection and application of accounting policies and methods and related assumptions and estimates.
Our accounting policies and estimates are fundamental to our reported financial condition and results of operations. Management is required to make difficult, complex or subjective judgments in selecting and applying many of these accounting policies. In some cases, management must select an accounting policy or method from two or more alternatives, any of which may be reasonable under the circumstances, yet may result in us reporting materially different results than would have been reported under a different alternative.
From time to time, the Financial Accounting Standards Board and SEC may change the financial accounting and reporting standards that govern the preparation of our financial statements. These changes can be difficult to predict and can materially impact how we record and report our financial condition and results of operations. In some cases, we could be required to apply a new or revised standard retrospectively, resulting in a restatement of prior period financial statements. See Note 1 to the consolidated financial statements for more information about pending accounting pronouncements that may have a material impact on our reported financial results.
Our internal controls may be ineffective.
Management regularly monitors, evaluates and updates our internal controls over financial reporting, disclosure controls and procedures, and corporate governance policies and procedures. Any system of controls, however well designed and operated, can provide only reasonable, not absolute, assurances that the objectives of the controls are met. Any failure or circumvention of our controls and procedures or failure to comply with regulations related to controls and procedures could have a material adverse effect on our financial condition and results of operations.
19
We depend on our executive officers and key personnel to continue the implementation of our long-term business strategy and could be harmed by the loss of their services.
We believe that our continued growth and future success will depend in large part on the skills of our senior management team. We believe our senior management team possesses valuable knowledge about and experience in the banking industry and that their knowledge and relationships could be difficult to replicate. The composition of our senior management team and our other key personnel may change over time. For example, effective December 31, 2016, John A. Kanas retired from his role as President and Chief Executive Officer of the Company, and effective January 1, 2017, Rajinder P. Singh was appointed President and Chief Executive Officer of the Company. Although certain key members of our senior management team have entered into employment agreements with us, they may not complete the terms of their employment agreements or renew them upon expiration. Other members of our senior management team are not subject to employment agreements. Our success also depends on the experience of other key personnel and on their relationships with the customers and communities they serve. The loss of service of one or more of our executive officers or key personnel, or the inability to recruit and retain qualified personnel in the future, could have an adverse effect on our business, financial condition or operating results.
We face significant competition from other financial institutions and financial services providers, which may adversely impact our growth or profitability.
The primary markets we currently serve are Florida and the New York metropolitan area. Consumer and commercial banking in these markets is highly competitive. Our markets contain not only a large number of community and regional banks, but also a significant presence of the country's largest commercial banks. We compete with other state and national financial institutions located in Florida, New York and adjoining states as well as savings and loan associations, savings banks and credit unions for deposits and loans. In addition, we compete with financial intermediaries, such as consumer finance companies, marketplace lenders, mortgage banking companies, insurance companies, securities firms, mutual funds and several government agencies as well as major retailers, all actively engaged in providing various types of loans and other financial services.
The financial services industry could become even more competitive as a result of legislative, regulatory and technological changes and continued consolidation. Banks, securities firms and insurance companies can merge under the umbrella of a financial holding company, which can offer virtually any type of financial service, including banking, securities underwriting, insurance (both agency and underwriting) and merchant banking. Increased competition among financial services companies may adversely affect our ability to market our products and services. Also, technology has lowered barriers to entry and made it possible for banks to compete in our market without a retail footprint by offering competitive rates, as well as non-banks, including online providers, to offer products and services traditionally provided by banks. Many of our competitors have fewer regulatory constraints and may have lower cost structures. Additionally, due to their size, many competitors may offer a broader range of products and services as well as better pricing for certain products and services than we can.
Our ability to compete successfully depends on a number of factors, including:
|
•
|
the ability to develop, maintain and build upon long-term customer relationships based on quality service, high ethical standards and safe and sound banking practices;
|
|
•
|
the ability to attract and retain qualified employees to operate our business effectively;
|
|
•
|
the ability to expand our market position;
|
|
•
|
the scope, relevance and pricing of products and services offered to meet customer needs and demands;
|
|
•
|
the rate at which we introduce new products and services relative to our competitors;
|
|
•
|
customer satisfaction with our level of service; and
|
|
•
|
industry and general economic trends.
|
Failure to perform in any of these areas could significantly weaken our competitive position, which could adversely affect our growth and profitability, which, in turn, could harm our business, financial condition and results of operations.
The inability of BankUnited, Inc. to receive dividends from its subsidiary bank could have a material adverse effect on the ability of BankUnited, Inc. to make payments on its debt or pay cash dividends to its shareholders.
BankUnited, Inc. is a separate and distinct legal entity from the Bank, and a substantial portion of its revenue consists of dividends from the Bank. These dividends are the primary funding source for the dividends paid by BankUnited, Inc. on its common stock and the interest and principal payments on its debt. Various federal and state laws and regulations limit the
20
amount of dividends that a bank may pay to its parent company. In addition, our right to participate in a distribution of assets upon the liquidation or reorganization of a subsidiary may be subject to the prior claims of the subsidiary’s depositors and other creditors. If the Bank is unable to pay dividends, BankUnited, Inc. might not be able to service its debt, pay its obligations, or pay dividends on its common stock.
We rely on analytical and forecasting models that may prove to be inadequate or inaccurate, which could adversely impact the effectiveness of our strategic planning and our results of operations.
The processes we use to forecast future performance and estimate expected credit losses, the effects of changing interest rates, sources and uses of liquidity, cash flows from the covered assets, real estate values, and economic indicators such as unemployment on our financial condition and results of operations depend upon the use of analytical and forecasting tools and models. These tools and models reflect assumptions that may not be accurate, particularly in times of market stress or other unforeseen circumstances. Furthermore, even if our assumptions are accurate predictors of future performance, the tools and models they are based on may prove to be inadequate or inaccurate because of other flaws in their design or implementation. If these tools prove to be inadequate or inaccurate, our strategic planning processes, earnings and capital may be adversely impacted.
Changes in taxes and other assessments may adversely affect us.
The legislatures and taxing authorities in the tax jurisdictions in which we operate regularly enact reforms to the tax and other assessment regimes to which we and our customers are subject. Such reforms include changes in the rate of assessments. The effects of these changes and any other changes that result from enactment of additional tax reforms cannot be quantified and there can be no assurance that any such reforms would not have an adverse effect upon our business.
Tax laws are complex and subject to different interpretations by the taxpayer and relevant governmental taxing authorities, which are sometimes subject to prolonged evaluation periods until a final resolution is reached. In establishing a provision for income tax expense and filing returns, the Company must make judgments and interpretations about the application of these inherently complex tax laws. If the judgments, estimates and assumptions the Company uses in preparing its tax returns are subsequently found to be incorrect, there could be a material effect on our results of operations.
Operational Risks
We are subject to a variety of operational, legal and compliance risks, including the risk of fraud or theft by employees or outsiders, which may adversely affect our business and results of operations.
We are exposed to many types of operational risks, including legal and compliance risk, the risk of fraud or theft by employees or outsiders and operational errors, including clerical or record-keeping errors or those resulting from faulty or disabled computer or telecommunications systems. The occurrence of any of these events could cause us to suffer financial loss, face regulatory action and suffer damage to our reputation.
Because the nature of the financial services business involves a high volume of transactions, certain errors may be repeated or compounded before they are discovered and successfully rectified. Our necessary dependence upon automated systems to record and process transactions and our large transaction volume may further increase the risk that technical flaws or employee tampering or manipulation of those systems will result in losses that are difficult to detect. We also may be subject to disruptions of our operating systems arising from events that are wholly or partially beyond our control which may give rise to disruption of service to customers and to financial loss or liability. The occurrence of any of these events could result in a diminished ability to operate our business as well as potential liability to customers and counterparties, reputational damage and regulatory intervention, which could adversely affect our business, financial condition or results of operations.
We are dependent on our information technology and telecommunications systems. Systems failures or interruptions could have an adverse effect on our financial condition and results of operations.
Our business is highly dependent on the successful and uninterrupted functioning of our information technology and telecommunications systems. We rely on these systems to process new and renewal loans, gather deposits, provide customer service, facilitate collections and share data across our organization. The failure of these systems could interrupt our operations. Because our information technology and telecommunications systems interface with and depend on third-party systems, we could experience service denials if demand for such services exceeds capacity or such third-party systems fail or experience interruptions. If sustained or repeated, a system failure or service denial could result in a deterioration of our ability to process new and renewal loans, gather deposits and provide customer service, compromise our ability to operate effectively, damage our reputation, result in a loss of customer business, and/or subject us to additional regulatory scrutiny and possible financial liability, any of which could have a material adverse effect on our financial condition and results of operations.
21
We are dependent on third-party service providers for certain aspects of our business infrastructure and information and telecommunications systems.
We rely on third parties to provide key components of our business infrastructure and major systems including, but not limited to, core banking systems such as loan servicing and deposit transaction processing systems, our electronic funds transfer transaction processing, cash management and online banking services. While we select and monitor the performance of third party vendors carefully, we do not control their actions. Any problems caused by these third parties, including those resulting from disruptions in communication services provided by a vendor, failure of a vendor to handle current or higher volumes, failure of a vendor to provide services for any reason or poor performance of services, or the termination of a third-party software license or service agreement on which any of these systems is based, could adversely affect our ability to deliver products and services to our customers and otherwise conduct our business. In many cases, our operations rely heavily on the secure processing, storage and transmission of information and the monitoring of a large number of transactions on a minute-by-minute basis, and even a short interruption in service could have significant consequences. Financial or operational difficulties of a third party vendor could also adversely affect our operations if those difficulties interfere with the vendor's ability to serve us effectively or at all. Replacing these third party vendors could also create significant delay and expense. Accordingly, use of such third parties creates an unavoidable inherent risk to our business operations.
Failure
by us or third parties to detect or prevent a breach in information security or to protect customer privacy could have an adverse effect on our business.
In the normal course of our business, we collect, process and retain sensitive and confidential client and customer information. Despite the security measures we have in place, our facilities and systems may be vulnerable to cyber-attacks, security breaches, acts of vandalism, computer viruses, misplaced or lost data, programming and / or human errors, or other similar events, especially because, in the case of any intentional breaches, the techniques used change frequently or are not recognized until launched, and cyber-attacks can originate from a wide variety of sources, including third parties.
We provide our customers the ability to bank remotely, including online, via mobile devices and over the telephone. The secure transmission of confidential information over the Internet and other remote channels is a critical element of remote banking. Our network could be vulnerable to unauthorized access, computer viruses, phishing schemes and other security breaches. In addition to cyber-attacks or other security breaches involving the theft of sensitive and confidential information, hackers recently have engaged in attacks against large financial institutions, particularly denial of service attacks, designed to disrupt key business services such as customer-facing web sites. We may be required to spend significant capital and other resources to protect against the threat of security breaches and computer viruses, or to alleviate problems caused by security breaches or viruses. Any cyber-attack or other security breach involving the misappropriation, loss or other unauthorized disclosure of confidential customer information could severely damage our reputation, erode confidence in the security of our systems, products and services, expose us to the risk of litigation and liability, disrupt our operations and have a material adverse effect on our business.
In addition, we interact with and rely on financial counterparties for whom we process transactions and rely on other third parties, as noted above. Each of these third parties may be targets of the same types of fraudulent activity, computer break-ins and other cyber security breaches described above. The cyber security measures that they maintain to mitigate the risk of such activity may be different from our own, and in many cases we do not have any control over the types of security measures they may choose to implement. We may also incur costs as a result of data or security breaches of third parties with whom we do not have a significant direct relationship. As a result of financial entities and technology systems becoming more interdependent and complex, a cyber incident, information breach or loss, or technology failure that compromises the systems or data of one or more financial entities could have a material impact on counterparties or other market participants, including us. We have taken measures to implement safeguards to support our operations, but our ability to conduct business may be adversely affected by any significant disruptions to us or to third parties with whom we interact.
Failure to keep pace with technological changes could have a material adverse impact on our ability to compete for loans and deposits, and therefore on our financial condition and results of operations.
Financial products and services have become increasingly technology-driven. To some degree, our ability to meet the needs of our customers competitively, and in a cost-efficient manner, is dependent on our ability to keep pace with technological advances and to invest in new technology as it becomes available. Many of our larger competitors have greater resources to invest in technology than we do and may be better equipped to market new technology-driven products and services. The widespread adoption of new technologies, including internet services and payment systems, could require us to incur substantial expenditures to modify or adapt our existing products and services.
22
The soundness of other financial institutions, particularly our financial institution counterparties, could adversely affect us.
Our ability to engage in routine funding and other transactions could be adversely affected by the stability and actions of other financial services institutions. Financial services institutions are interrelated as a result of trading, clearing, servicing, counterparty and other relationships. We have exposure to an increasing number of financial institutions and counterparties. These counterparties include institutions that may be exposed to various risks over which we have little or no control.
Adverse developments affecting the overall strength and soundness of the financial services industry as a whole and third parties with whom we have important relationships could have a negative impact on our business even if we are not subject to the same adverse developments.
Reputational risks could affect our results.
Our ability to originate new business and maintain existing customer relationships is highly dependent upon customer and other external perceptions of our business practices. Adverse perceptions regarding our business practices could damage our reputation in both the customer and funding markets, leading to difficulties in generating and maintaining accounts as well as in financing them. Negative public opinion can result from our actual or alleged conduct in any number of activities, including lending practices, corporate governance and acquisitions and from actions taken by government regulators and community organizations in response to those activities. Adverse developments with respect to external perceptions regarding the practices of our competitors, or our industry as a whole, or the general economic climate may also adversely impact our reputation. These perceptions about us could cause our business to be negatively affected and exacerbate the other risks that we face. In addition, adverse reputational impacts on third parties with whom we have important relationships may adversely impact our reputation. Adverse reputational impacts or events may also increase our litigation risk. We carefully monitor internal and external developments for areas of potential reputational risk and have established governance structures to assist in evaluating such risks in our business practices and decisions.
Risks Relating to the Regulation of Our Industry
We operate in a highly regulated environment and the laws and regulations that govern our operations, corporate governance, executive compensation and accounting principles, or changes in them, or our failure to comply with them, may adversely affect us.
We are subject to extensive regulation, supervision, and legal requirements that govern almost all aspects of our operations. Intended to protect customers, depositors, the DIF, and the overall financial stability of the United States, these laws and regulations, among other matters, prescribe minimum capital requirements, impose limitations on the business activities in which we can engage, limit the dividend or distributions that BankUnited can pay to BankUnited, Inc., restrict the ability of institutions to guarantee our debt, and impose specific accounting requirements on us. Compliance with laws and regulations can be difficult and costly, and changes to laws and regulations often impose additional compliance costs. In addition, federal banking agencies, including the OCC and Federal Reserve Board, periodically conduct examinations of our business, including compliance with laws and regulations. Our failure to comply with these laws and regulations, even if the failure follows good faith effort or reflects a difference in interpretation, could subject us to restrictions on our business activities, fines, remedial actions, administrative orders and other penalties, any of which could adversely affect our results of operations and capital base.
Further, federal, state and local legislators and regulators regularly introduce measures or take actions that would modify the regulatory requirements applicable to banks, their holding companies and other financial institutions. Changes in laws, regulations or regulatory policies could adversely affect the operating environment for the Company in substantial and unpredictable ways, increase our cost of doing business, impose new restrictions on the way in which we conduct our operations or add significant operational constraints that might impair our profitability. We cannot predict whether new legislation will be enacted and, if enacted, the effect that it, or any implementing regulations, would have on our business, financial condition or results of operations.
The ongoing implementation of the Dodd-Frank Wall Street Reform and Consumer Protection Act of 2010 may have a material adverse effect on our operations.
The Dodd-Frank Act imposes significant regulatory and compliance changes. There remains uncertainty surrounding the manner in which certain provisions of the Dodd-Frank Act will ultimately be interpreted and implemented by the various regulatory agencies, particularly given the current political environment, and the full extent of the impact of the requirements on our operations is still unclear. The changes resulting from the Dodd-Frank Act, including the Volcker Rule and rules and regulations established by the CFPB, may impact the profitability of our business activities, require changes to certain of our business practices, require the development of new compliance infrastructure, impose upon us more stringent capital and
23
liquidity requirements or otherwise adversely affect our business. These changes may also require us to invest significant management attention and resources to evaluate and make any changes necessary to comply with new statutory and regulatory requirements. Failure to comply with the new requirements or with any future changes in laws or regulations may negatively impact our results of operations and financial condition. In addition, the Trump administration has issued an executive order directing the review of existing financial regulations and indicated in public statements that the Dodd-Frank Act will be under scrutiny and that some of the provisions of the Dodd-Frank Act and rules promulgated thereunder may be revised, repealed or amended, creating uncertainty regarding changes to the Dodd-Frank Act that could apply to us in the future. For a more detailed description of the Dodd-Frank Act, see Item 1 "Business—Regulation and Supervision—The Dodd-Frank Act."
Failure to comply with the business plan filed with the OCC could have an adverse effect on our ability to execute our business strategy.
In conjunction with the conversion of its charter to that of a national bank, BankUnited was required to file a business plan with the OCC, and is required to update the business plan annually. Failure to comply with the business plan could subject the Bank to regulatory actions that could impede our ability to execute our business strategy. The provisions of the business plan restrict our ability to engage in business activities outside of those contemplated in the business plan or to expand the level of our growth beyond that contemplated in the business plan without regulatory non-objection.
Recently expressed regulatory concerns about commercial real estate lending concentrations could adversely impact our commercial real estate lending business.
The recent regulatory focus on commercial real estate lending concentrations may impact the pace of growth of our commercial real estate loan portfolio. Additionally, uncertainty has been created regarding potential changes to regulatory expectations and guidance related to sound risk management practices for financial institutions with concentrations in commercial real estate lending, which may lead to an increase in the cost of compliance.
Our ability to expand through acquisition or de novo branching requires regulatory approvals, and failure to obtain them may restrict our growth.
We may identify opportunities to complement and expand our business by pursuing strategic acquisitions of financial institutions and other complementary businesses. We must generally receive federal regulatory approval before we can acquire an institution or business. In determining whether to approve a proposed acquisition, federal banking regulators will consider, among other factors, the effect of the acquisition on competition, our financial condition, our future prospects, and the impact of the proposal on U.S. financial stability. The regulators also review current and projected capital ratios and levels, the competence, experience, and integrity of management and its record of compliance with laws and regulations, the convenience and needs of the communities to be served (including the acquiring institution's record of compliance under the CRA) and the effectiveness of the acquiring institution in combating money laundering activities. Such regulatory approvals may not be granted on terms that are acceptable to us, or at all. We may also be required to sell or close branches as a condition to receiving regulatory approval, which condition may not be acceptable to us or, if acceptable to us, may reduce the benefit of any acquisition.
In addition to the acquisition of existing financial institutions, as opportunities arise, we may continue
de novo
branching as a part of our internal growth strategy and possibly enter into new markets through
de novo
branching.
De novo
branching and any acquisition carries with it numerous risks, including the inability to obtain all required regulatory approvals. The failure to obtain these regulatory approvals for potential future strategic acquisitions and
de novo
branches may impact our business plans and restrict our growth.
Financial institutions, such as BankUnited, face a risk of noncompliance and enforcement action with the Bank Secrecy Act and other anti-money laundering statutes and regulations.
The federal Bank Secrecy Act, the USA PATRIOT Act, and other laws and regulations require financial institutions, among other duties, to institute and maintain an effective anti-money laundering program and file suspicious activity and currency transaction reports as appropriate. The federal Financial Crimes Enforcement Network, established by the U.S. Treasury Department to administer the Bank Secrecy Act, is authorized to impose significant civil money penalties for violations of those requirements, and has engaged in coordinated enforcement efforts with the individual federal banking regulators, as well as the U.S. Department of Justice, Drug Enforcement Administration, and Internal Revenue Service. There is also increased scrutiny of compliance with the sanctions programs and rules administered and enforced by the U.S. Treasury Department's Office of Foreign Assets Control.
In order to comply with regulations, guidelines and examination procedures in this area, we dedicate significant resources to the ongoing execution of our anti-money laundering program, continuously monitor and enhance as necessary our policies
24
and procedures and maintain a robust automated anti-money laundering software solution. If our policies, procedures and systems are deemed deficient or the policies, procedures and systems of financial institutions that we may acquire in the future are deemed deficient, we could be subject to liability, including fines and regulatory actions such as restrictions on our ability to pay dividends and the necessity to obtain regulatory approvals to proceed with certain aspects of our business plan, including our expansion plans.
We are subject to the CRA and fair lending laws, and failure to comply with these laws could lead to material penalties.
The CRA, the Equal Credit Opportunity Act, the Fair Housing Act and other fair lending laws and regulations impose nondiscriminatory lending requirements on financial institutions. The Department of Justice and other federal agencies are responsible for enforcing these laws and regulations. A successful challenge to an institution's performance under the CRA or fair lending laws and regulations could result in a wide variety of sanctions, including the required payment of damages and civil money penalties, injunctive relief, imposition of restrictions on mergers and acquisitions activity, and restrictions on expansion activity. Private parties may also have the ability to challenge an institution's performance under fair lending laws in private class action litigation.
The FDIC's restoration plan and any future related increased assessments could adversely affect our earnings.
As a result of economic conditions and the enactment of the Dodd-Frank Act, the FDIC increased the deposit insurance assessment rates and thus raised deposit premiums for insured depository institutions. If the current level of deposit premiums are insufficient for the DIF to meet its funding requirements in the future, further special assessments or increases in deposit insurance premiums may be required. We are generally unable to control the amount of premiums that we are required to pay for FDIC insurance. If there are additional bank or financial institution failures in the future, we may be required to pay FDIC premiums higher than current levels. Any future additional assessments or increases in FDIC insurance premiums may adversely affect our results of operations.
We are subject to laws regarding the privacy, information security and protection of personal information and any violation of these laws or another incident involving personal, confidential or proprietary information of individuals could damage our reputation and otherwise adversely affect our operations and financial condition.
Our business requires the collection and retention of large volumes of customer data, including personally identifiable information in various information systems that we maintain and in those maintained by third parties with whom we contract to provide data services. We are subject to complex and evolving laws and regulations governing the privacy and protection of personal information of individuals (including customers, employees, suppliers and other third parties). For example, our business is subject to the Gramm-Leach-Bliley Act which, among other things: (i) imposes certain limitations on our ability to share nonpublic personal information about our customers with nonaffiliated third parties; (ii) requires that we provide certain disclosures to customers about our information collection, sharing and security practices and afford customers the right to “opt out” of any information sharing by us with nonaffiliated third parties (with certain exceptions); and (iii) requires that we develop, implement and maintain a written comprehensive information security program containing appropriate safeguards based on our size and complexity, the nature and scope of our activities, and the sensitivity of customer information we process, as well as plans for responding to data security breaches. Various state and federal banking regulators and states have also enacted data security breach notification requirements with varying levels of individual, consumer, regulatory or law enforcement notification in certain circumstances in the event of a security breach. Ensuring that our collection, use, transfer and storage of personal information complies with all applicable laws and regulations can increase our costs. Furthermore, we may not be able to ensure that all of our customers, suppliers, counterparties and other third parties have appropriate controls in place to protect the confidentiality of the information that they exchange with us, particularly where such information is transmitted by electronic means. If personal, confidential or proprietary information of customers or others were to be mishandled or misused, we could be exposed to litigation or regulatory sanctions under personal information laws and regulations. Concerns regarding the effectiveness of our measures to safeguard personal information, or even the perception that such measures are inadequate, could cause us to lose customers or potential customers for our products and services and thereby reduce our revenues. Accordingly, any failure or perceived failure to comply with applicable privacy or data protection laws and regulations may subject us to inquiries, examinations and investigations that could result in requirements to modify or cease certain operations or practices or in significant liabilities, fines or penalties, and could damage our reputation and otherwise adversely affect our operations and financial condition.
Unfavorable results from ongoing stress analyses may adversely affect our ability to retain customers or compete for new business opportunities.
Under the Dodd-Frank Act, the Company is required to annually conduct a company-run stress test to estimate the potential impact of three macroeconomic scenarios provided by the Federal Reserve on our regulatory capital ratios and certain other financial metrics. The Company is required to publicly disclose a summary of the results of these forward looking, company-
25
run stress tests that assess the impact of hypothetical macroeconomic baseline, adverse and severely adverse economic scenarios provided by the Federal Reserve Board. The stress testing and capital planning processes may, among other things, require us to limit any dividend or other capital distributions we may make to stockholders or increase our capital levels, modify our business and growth strategies or decrease our exposure to various asset classes, any of which could have a material adverse effect on our financial condition or results of operations.
Although the stress tests are not meant to assess our current condition, our customers may misinterpret and adversely react to the results of these stress tests. Any potential misinterpretations and adverse reactions could limit our ability to attract and retain customers or to effectively compete for new business opportunities. The inability to attract and retain customers or effectively compete for new business may adversely affect our business, financial condition or results of operations.
None.
At
December 31, 2016
, BankUnited leased 139,572 square feet of office and operations space in Miami Lakes, Florida. This space includes our principal executive offices and operations center. At
December 31, 2016
, we provided banking services at
94
banking center locations in
15
Florida counties. Of the
94
banking center properties, we leased 308,976 square feet in 89 locations and owned 22,838 square feet in 5 locations. Additionally, we leased 32,395 square feet of office space and 5,580 square feet of warehouse space.
At
December 31, 2016
, BankUnited leased 25,306 square feet of banking services space in New York City at 5 locations and 2,000 square feet of banking services space in Melville, New York at 1 location. We also leased 76,035 square feet of office space in New York in 7 locations, of which 10,048 square feet have been subleased.
At
December 31, 2016
, we leased 10,619 square feet of office and operations space in Baltimore, Maryland to house Bridge and 5,572 square feet of office and operations space in Scottsdale, Arizona to house Pinnacle. We also leased 11,201 square feet of office and operations space in various states used by SBF.
We believe that our facilities are in good condition and are adequate to meet our operating needs for the foreseeable future.
The Company is involved as plaintiff or defendant in various legal actions arising in the normal course of business. In the opinion of management, based upon advice of legal counsel, the likelihood is remote that the impact of these proceedings, either individually or in the aggregate, would be material to the Company’s consolidated financial position, results of operations or cash flows.
None.
26
|
Item 5.
|
Market for Registrant's Common Equity, Related Stockholder Matters and Issuer Purchases of Equity Securities
|
Market Information and Holders of Record
Shares of our common stock began trading on the NYSE under the symbol "BKU" on January 28, 2011. The last sale price of our common stock on the NYSE on
February 24, 2017
was
$39.89
per share.
The following table shows the high and low sales prices for our common stock for the periods indicated, as reported by the NYSE:
|
|
2016
|
2015
|
|||||||||||||
|
|
High
|
Low
|
High
|
Low
|
|||||||||||
|
1st Quarter
|
$
|
35.94
|
|
$
|
29.72
|
|
$
|
33.69
|
|
$
|
26.69
|
|
|||
|
2nd Quarter
|
$
|
36.28
|
|
$
|
27.85
|
|
$
|
36.95
|
|
$
|
32.13
|
|
|||
|
3rd Quarter
|
$
|
33.06
|
|
$
|
28.64
|
|
$
|
37.92
|
|
$
|
33.07
|
|
|||
|
4th Quarter
|
$
|
38.47
|
|
$
|
28.13
|
|
$
|
39.97
|
|
$
|
34.05
|
|
|||
As of
February 24, 2017
, there were
527
stockholders of record of our common stock.
Equity Compensation Plan Information
The information set forth under the caption "Equity Compensation Plan Information" in our definitive proxy statement for the Company's 2017 annual meeting of stockholders (the "Proxy Statement") is incorporated herein by reference.
Dividend Policy
The Company declared a quarterly dividend of $0.21 per share on its common stock for each of the four quarters of
2016
and
2015
resulting in total dividends for
2016
and
2015
of
$90.0 million
and $89.4 million, respectively, or $0.84 per common share for each of the years ended December 31,
2016
and
2015
. Dividends from the Bank are the principal source of funds for the payment of dividends on our common stock. The Bank is subject to certain restrictions that may limit its ability to pay dividends to us. See "Business—Regulation and Supervision—Regulatory Limits on Dividends and Distributions". The quarterly dividends on our common stock are subject to the discretion of our board of directors and dependent on, among other things, our financial condition, results of operations, capital requirements, restrictions contained in financing instruments and other factors that our board of directors may deem relevant.
27
Stock Performance Graph
The graph set forth below compares the cumulative total stockholder return on an initial investment of $100 in our common stock between January 28, 2011 (the day shares of our common stock began trading) and December 31,
2016
, with the comparative cumulative total return of such amount on the S&P 500 Index and the S&P 500 Bank Index over the same period. Reinvestment of all dividends is assumed to have been made in our common stock. The graph assumes our closing sales price on January 28, 2011 of $28.40 per share as the initial value of our common stock.
The comparisons shown in the graph below are based upon historical data. We caution that the stock price performance shown in the graph below is not necessarily indicative of, nor is it intended to forecast, the potential future performance of our common stock.
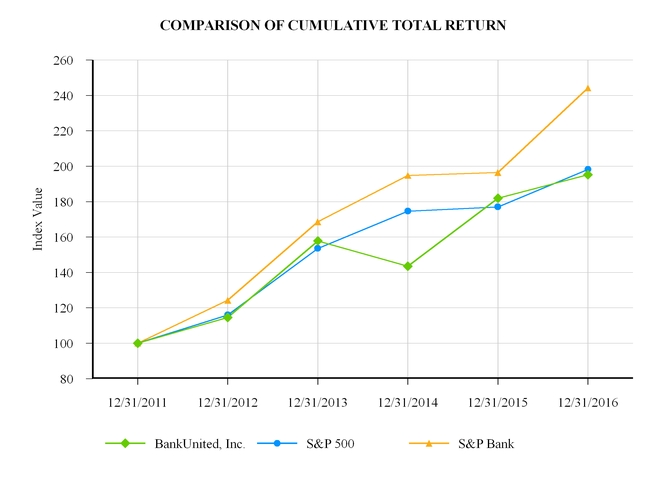
|
Index
|
12/31/2011
|
|
12/31/2012
|
|
12/31/2013
|
|
12/31/2014
|
|
12/31/2015
|
|
12/31/2016
|
|
|
BankUnited, Inc.
|
100.00
|
|
114.52
|
|
157.82
|
|
143.52
|
|
181.92
|
|
195.22
|
|
|
S&P 500
|
100.00
|
|
116.00
|
|
153.57
|
|
174.60
|
|
177.01
|
|
198.18
|
|
|
S&P Bank
|
100.00
|
|
124.23
|
|
168.61
|
|
194.76
|
|
196.42
|
|
244.17
|
|
Recent Sales of Unregistered Securities
None.
Purchases of Equity Securities by the Issuer and Affiliated Purchasers
None.
28
You should read the selected consolidated financial data set forth below in conjunction with "Item 7. Management's Discussion and Analysis of Financial Condition and Results of Operations," and the audited consolidated financial statements and the related notes thereto included elsewhere in this Form 10-K. The selected consolidated financial data set forth below is derived from our audited consolidated financial statements.
|
|
At December 31,
|
||||||||||||||||||
|
|
2016
|
2015
|
2014
|
2013
|
2012
|
||||||||||||||
|
|
(dollars in thousands)
|
||||||||||||||||||
|
|
|
|
|
|
|
|
|
|
|||||||||||
|
Cash and cash equivalents
|
$
|
448,313
|
|
$
|
267,500
|
|
$
|
187,517
|
|
$
|
252,749
|
|
$
|
495,353
|
|
||||
|
Investment securities available for sale, at fair value
|
6,073,584
|
|
4,859,539
|
|
4,585,694
|
|
3,637,124
|
|
4,172,412
|
|
|||||||||
|
Investment securities held to maturity
|
10,000
|
|
10,000
|
|
—
|
|
—
|
|
—
|
|
|||||||||
|
Loans, net
|
19,242,441
|
|
16,510,775
|
|
12,319,227
|
|
8,983,884
|
|
5,512,618
|
|
|||||||||
|
FDIC indemnification asset
|
515,933
|
|
739,880
|
|
974,704
|
|
1,205,117
|
|
1,457,570
|
|
|||||||||
|
Total assets
|
27,880,151
|
|
23,883,467
|
|
19,210,529
|
|
15,046,649
|
|
12,375,953
|
|
|||||||||
|
Deposits
|
19,490,890
|
|
16,938,501
|
|
13,511,755
|
|
10,532,428
|
|
8,538,073
|
|
|||||||||
|
Federal Home Loan Bank advances
|
5,239,348
|
|
4,008,464
|
|
3,307,932
|
|
2,412,050
|
|
1,916,919
|
|
|||||||||
|
Notes and other borrowings
|
402,809
|
|
402,545
|
|
10,627
|
|
2,263
|
|
8,175
|
|
|||||||||
|
Total liabilities
|
25,461,722
|
|
21,639,569
|
|
17,157,995
|
|
13,117,951
|
|
10,569,273
|
|
|||||||||
|
Total stockholder's equity
|
2,418,429
|
|
2,243,898
|
|
2,052,534
|
|
1,928,698
|
|
1,806,680
|
|
|||||||||
|
Covered assets
|
616,600
|
|
813,525
|
|
1,053,317
|
|
1,730,182
|
|
2,149,009
|
|
|||||||||
29
|
|
Years Ended December 31,
|
||||||||||||||||||
|
|
2016
|
2015
|
2014
|
2013
|
2012
|
||||||||||||||
|
|
(dollars in thousands, except per share data)
|
||||||||||||||||||
|
|
|
|
|
|
|
|
|
|
|||||||||||
|
Interest income
|
$
|
1,059,217
|
|
$
|
880,816
|
|
$
|
783,744
|
|
$
|
738,821
|
|
$
|
720,856
|
|
||||
|
Interest expense
|
188,832
|
|
135,164
|
|
106,651
|
|
92,611
|
|
123,269
|
|
|||||||||
|
Net interest income
|
870,385
|
|
745,652
|
|
677,093
|
|
646,210
|
|
597,587
|
|
|||||||||
|
Provision for loan losses
|
50,911
|
|
44,311
|
|
41,505
|
|
31,964
|
|
18,896
|
|
|||||||||
|
Net interest income after provision for loan losses
|
819,474
|
|
701,341
|
|
635,588
|
|
614,246
|
|
578,691
|
|
|||||||||
|
Non-interest income
|
106,417
|
|
102,224
|
|
84,165
|
|
68,049
|
|
73,941
|
|
|||||||||
|
Non-interest expense
|
590,447
|
|
506,672
|
|
426,503
|
|
364,293
|
|
307,767
|
|
|||||||||
|
Income before income taxes
|
335,444
|
|
296,893
|
|
293,250
|
|
318,002
|
|
344,865
|
|
|||||||||
|
Provision for income taxes
(1)
|
109,703
|
|
45,233
|
|
89,035
|
|
109,066
|
|
133,605
|
|
|||||||||
|
Net income
|
$
|
225,741
|
|
$
|
251,660
|
|
$
|
204,215
|
|
$
|
208,936
|
|
$
|
211,260
|
|
||||
|
Share Data:
|
|
|
|
|
|
|
|||||||||||||
|
Earnings per common share, basic
|
$
|
2.11
|
|
$
|
2.37
|
|
$
|
1.95
|
|
$
|
2.03
|
|
$
|
2.05
|
|
||||
|
Earnings per common share, diluted
|
$
|
2.09
|
|
$
|
2.35
|
|
$
|
1.95
|
|
$
|
2.01
|
|
$
|
2.05
|
|
||||
|
Cash dividends declared per common share
|
$
|
0.84
|
|
$
|
0.84
|
|
$
|
0.84
|
|
$
|
0.84
|
|
$
|
0.72
|
|
||||
|
Dividend payout ratio
|
40.19
|
%
|
35.75
|
%
|
43.06
|
%
|
41.73
|
%
|
35.13
|
%
|
|||||||||
|
Other Data (unaudited):
|
|
|
|
|
|
|
|||||||||||||
|
Financial ratios
|
|
|
|
|
|
|
|||||||||||||
|
Return on average assets
|
0.87
|
%
|
1.18
|
%
|
1.21
|
%
|
1.55
|
%
|
1.71
|
%
|
|||||||||
|
Return on average common equity
|
9.64
|
%
|
11.62
|
%
|
10.13
|
%
|
11.16
|
%
|
12.45
|
%
|
|||||||||
|
Yield on earning assets
(2)
|
4.51
|
%
|
4.64
|
%
|
5.33
|
%
|
6.54
|
%
|
7.28
|
%
|
|||||||||
|
Cost of interest bearing liabilities
|
0.93
|
%
|
0.84
|
%
|
0.87
|
%
|
0.94
|
%
|
1.33
|
%
|
|||||||||
|
Equity to assets ratio
|
8.67
|
%
|
9.40
|
%
|
10.68
|
%
|
12.82
|
%
|
14.60
|
%
|
|||||||||
|
Interest rate spread
(2)
|
3.58
|
%
|
3.80
|
%
|
4.46
|
%
|
5.60
|
%
|
5.95
|
%
|
|||||||||
|
Net interest margin
(2)
|
3.73
|
%
|
3.94
|
%
|
4.61
|
%
|
5.73
|
%
|
6.05
|
%
|
|||||||||
|
Loan to deposit ratio
(3)
|
99.72
|
%
|
98.50
|
%
|
91.89
|
%
|
85.96
|
%
|
65.28
|
%
|
|||||||||
|
Tangible book value per common share
|
$
|
22.47
|
|
$
|
20.90
|
|
$
|
19.52
|
|
$
|
18.41
|
|
$
|
17.71
|
|
||||
|
Asset quality ratios
|
|
|
|
|
|
|
|||||||||||||
|
Non-performing loans to total loans
(3) (4)
|
0.70
|
%
|
0.44
|
%
|
0.32
|
%
|
0.39
|
%
|
0.62
|
%
|
|||||||||
|
Non-performing assets to total assets
(5)
|
0.53
|
%
|
0.35
|
%
|
0.28
|
%
|
0.51
|
%
|
0.89
|
%
|
|||||||||
|
Non-performing non-covered assets to total assets
(5) (6)
|
0.51
|
%
|
0.26
|
%
|
0.17
|
%
|
0.16
|
%
|
0.13
|
%
|
|||||||||
|
ALLL to total loans
|
0.79
|
%
|
0.76
|
%
|
0.77
|
%
|
0.77
|
%
|
1.06
|
%
|
|||||||||
|
ALLL to non-performing loans
(4)
|
112.55
|
%
|
172.23
|
%
|
239.24
|
%
|
195.52
|
%
|
171.21
|
%
|
|||||||||
|
Non-covered ALLL to non-covered non-performing loans
(4)
|
113.68
|
%
|
199.82
|
%
|
275.47
|
%
|
246.73
|
%
|
256.65
|
%
|
|||||||||
|
Net charge-offs to average loans
|
0.13
|
%
|
0.10
|
%
|
0.15
|
%
|
0.31
|
%
|
0.17
|
%
|
|||||||||
|
Non-covered net charge-offs to average non-covered loans
|
0.13
|
%
|
0.09
|
%
|
0.08
|
%
|
0.34
|
%
|
0.09
|
%
|
|||||||||
30
|
|
At December 31,
|
|||||||||||||
|
|
2016
|
2015
|
2014
|
2013
|
2012
|
|||||||||
|
Capital ratios
|
|
|
|
|
|
|
|
|
||||||
|
Tier 1 leverage
|
8.41
|
%
|
9.35
|
%
|
10.70
|
%
|
12.42
|
%
|
13.16
|
%
|
||||
|
CET1 risk-based capital
|
11.63
|
%
|
12.58
|
%
|
N/A
|
|
N/A
|
|
N/A
|
|
||||
|
Tier 1 risk-based capital
|
11.63
|
%
|
12.58
|
%
|
15.45
|
%
|
21.06
|
%
|
33.60
|
%
|
||||
|
Total risk-based capital
|
12.45
|
%
|
13.36
|
%
|
16.27
|
%
|
21.93
|
%
|
34.88
|
%
|
||||
|
(1)
|
Includes a discrete income tax benefit of
$49.3 million
recognized during the year ended December 31, 2015.
|
|
(2)
|
On a tax-equivalent basis.
|
|
(3)
|
Total loans include premiums, discounts, deferred fees and costs and loans held for sale.
|
|
(4)
|
We define non-performing loans to include non-accrual loans, loans, other than ACI loans, that are past due 90 days or more and still accruing and certain loans modified in troubled debt restructurings. Contractually delinquent ACI loans on which interest continues to be accreted are excluded from non-performing loans. Effective January 1, 2016, we are no longer reporting accruing TDRs as non-performing.
|
|
(5)
|
Non-performing assets include non-performing loans, OREO and other repossessed assets.
|
|
(6)
|
Ratio for non-covered assets is calculated as non-performing non-covered assets to total assets.
|
31
The following discussion and analysis is intended to assist readers in understanding the consolidated financial condition and results of operations of BankUnited, Inc. and its subsidiary (the "Company", "we", "us" and "our") and should be read in conjunction with the consolidated financial statements, accompanying footnotes and supplemental financial data included herein. In addition to historical information, this discussion contains forward-looking statements that involve risks, uncertainties and assumptions that could cause actual results to differ materially from management's expectations. Factors that could cause such differences are discussed in the sections entitled "Forward-looking Statements" and "Risk Factors." We assume no obligation to update any of these forward-looking statements.
Overview
Performance Highlights
In evaluating our financial performance, we consider the level of and trends in net interest income, the net interest margin, levels and composition of non-interest income and non-interest expense, performance ratios such as the return on average assets and return on average equity and asset quality ratios, particularly for the non-covered portfolio, including the ratio of non-performing loans to total loans, non-performing assets to total assets, and portfolio delinquency and charge-off trends. We consider growth in earning assets and deposits, trends in funding mix and cost of funds. We analyze these ratios and trends against our own historical performance, our budgeted performance and the financial condition and performance of comparable financial institutions.
Performance highlights include:
|
•
|
Net income for the
year ended December 31, 2016
was
$225.7 million
, or
$2.09
per diluted share, compared to
$251.7 million
, or
$2.35
per diluted share for the
year ended December 31, 2015
. Earnings for
2016
generated a return on average stockholders' equity of
9.64%
and a return on average assets of
0.87%
.
|
|
•
|
Earnings for the
year ended December 31, 2015
benefited from a discrete income tax benefit of
$49.3 million
. Non-interest expense for
2015
included $1.3 million in professional fees related to this tax benefit. Excluding the impact of this discrete income tax benefit and related professional fees, net income for
2015
was
$203.1 million
, diluted earnings per share was
$1.90
, return on average stockholders' equity was 9.38% and return on average assets was 0.95%.
|
|
•
|
Net interest income for the
year ended December 31, 2016
was
$870.4 million
, an increase of
$124.7 million
over the prior year. The net interest margin, calculated on a tax-equivalent basis, decreased to
3.73%
for
2016
from
3.94%
for
2015
. The origination of new loans at current market yields lower than those on loans acquired in the FSB Acquisition and the cost of the senior notes issued in November 2015 were the most significant contributors to the decline in the net interest margin. The following chart provides a comparison of net interest margin, the interest rate spread, the average yield on interest earning assets and the average rate paid on interest bearing liabilities for the years ended
December 31, 2016
and
2015
(on a tax-equivalent basis):
|
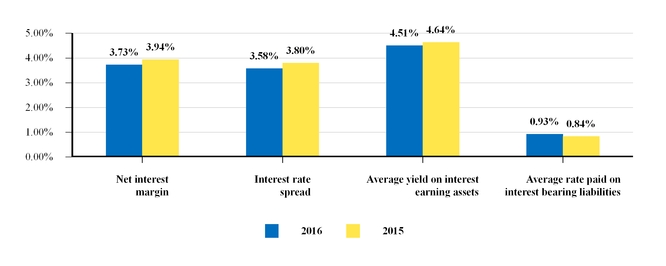
32
|
•
|
Total interest earning assets increased by
$4.2 billion
for the year ended December 31, 2016. New loans and leases, including equipment under operating lease, grew by
$3.0 billion
to
$19.3 billion
for the
year ended December 31, 2016
. New loan growth was concentrated in commercial portfolio segments, commensurate with our core business strategy. During the
year ended December 31, 2016
, new commercial loans grew by
$2.4 billion
; equipment under operating lease grew by
$56 million
; and new residential loans grew by
$546 million
. The New York region, the Florida region and our national platforms contributed
$878 million
,
$985 million
and
$1.1 billion
, respectively, to new loan growth for the
year ended December 31, 2016
. The following charts compare the composition of our loan and lease portfolio by portfolio segment and of our new loan and lease portfolio by region at
December 31, 2016
and
2015
:
|
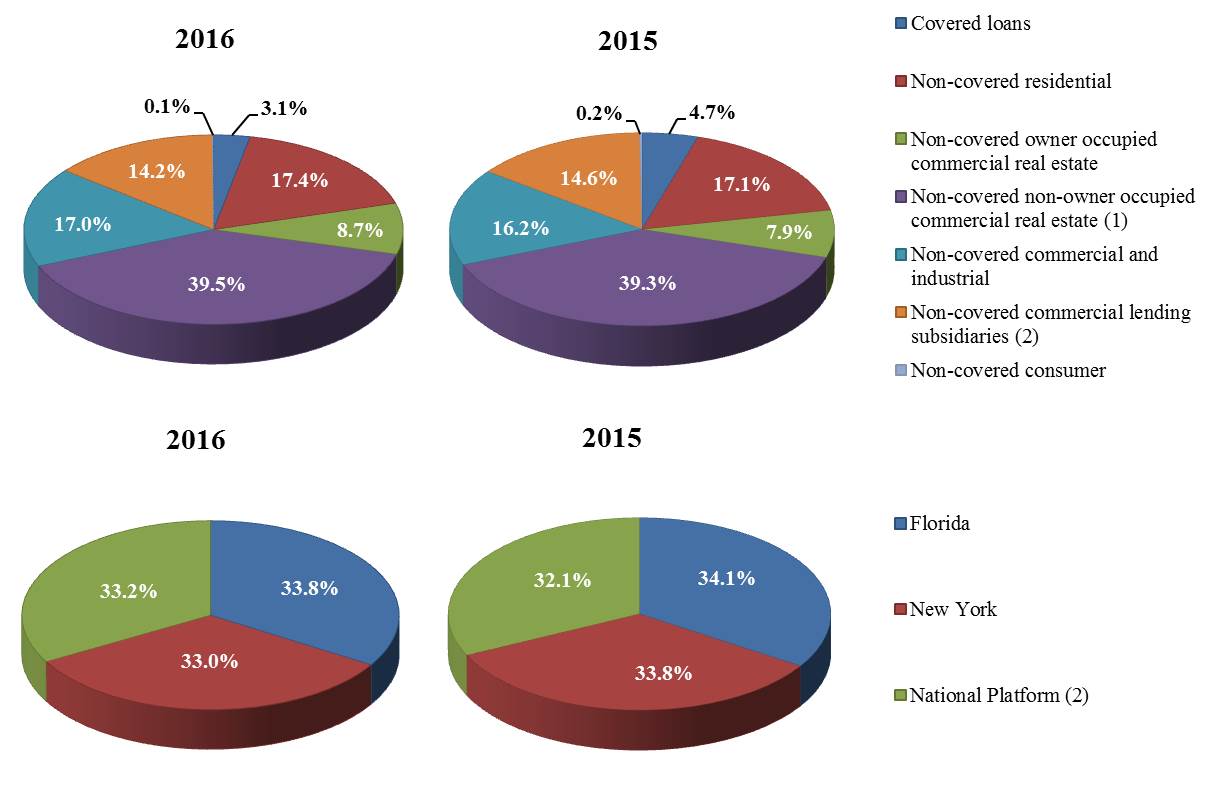
|
(1)
|
Commercial real estate loans include multifamily, non-owner occupied commercial real estate and construction and land loans.
|
|
(2)
|
Includes equipment under operating leases.
|
33
|
•
|
Asset quality remained strong. At
December 31, 2016
,
97.5%
of the new commercial loan portfolio was rated "pass" and substantially all of the new residential portfolio was current. The ratio of non-performing, non-covered loans to total non-covered loans was
0.71%
and the ratio of non-covered non-performing assets to total assets was
0.51%
at
December 31, 2016
. Non-performing taxi medallion loans comprised
0.32%
of total non-covered loans and
0.22%
of total assets at
December 31, 2016
. Credit risk related to the covered assets is significantly mitigated by the Loss Sharing Agreements. A comparison of our non-covered, non-performing assets ratio to that of our peers at
December 31, 2016
,
2015
and
2014
is presented in the chart below:
|
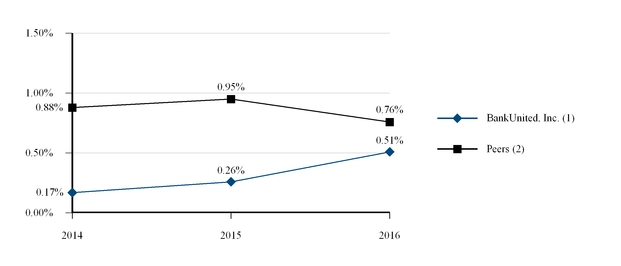
|
(1)
|
Calculated as non-covered non-performing assets as a percentage of total assets.
|
|
(2)
|
Source: SNL Financial. Peer data reflects median values for publicly traded U.S. banks and thrifts with assets between $10-50 billion.
|
|
•
|
Total deposits grew by
$2.6 billion
for the
year ended December 31, 2016
to $
19.5 billion
. The average cost of total deposits increased to
0.66%
for the
year ended December 31, 2016
from
0.61%
for
2015
. The following charts illustrate the composition of deposits at
December 31, 2016
and
2015
:
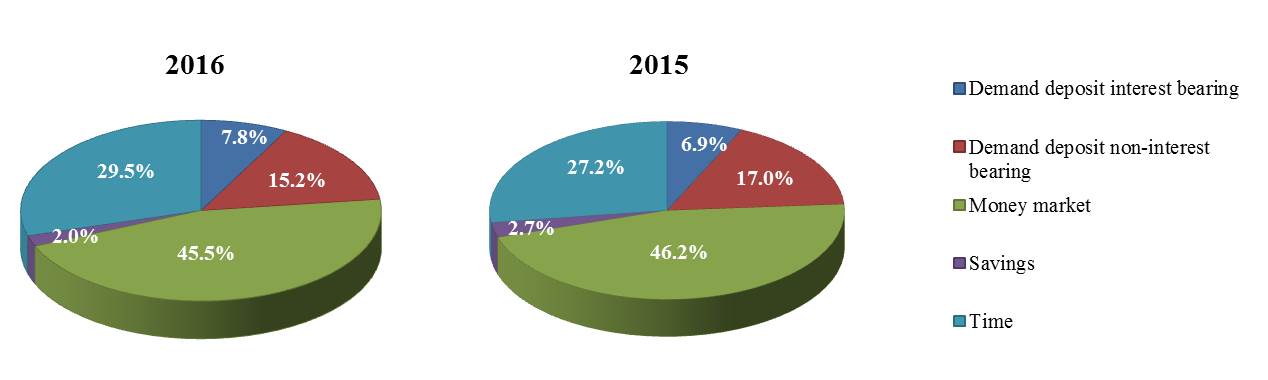
|
34
|
•
|
Tangible book value per common share increased to
$22.47
at December 31, 2016 from $20.90 at December 31, 2015.
|
|
•
|
The Company’s and the Bank's capital ratios exceeded all regulatory “well capitalized” guidelines. The charts below present the Company's and the Bank's regulatory capital ratios compared to regulatory guidelines as of
December 31, 2016
and
2015
:
|
BankUnited, Inc:
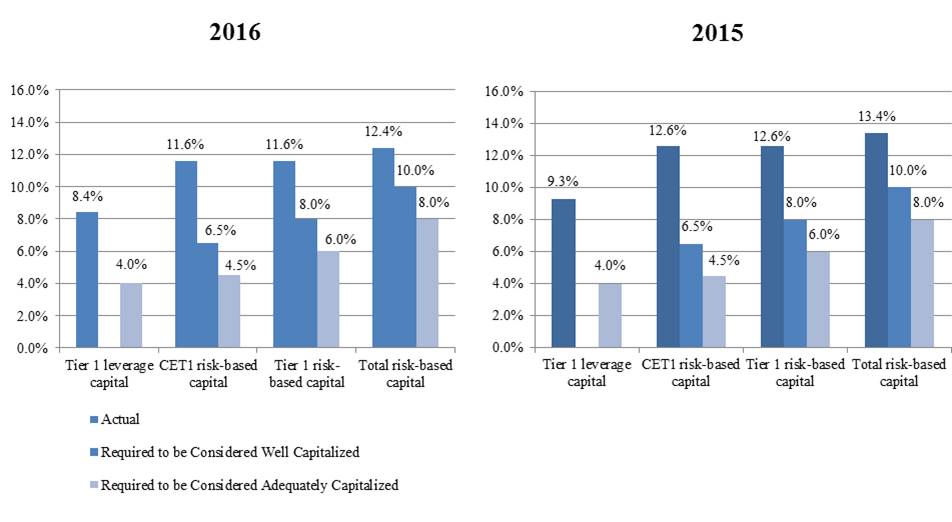
BankUnited, N.A.:

35
Strategic Priorities
Management has identified the following strategic priorities for our Company:
|
•
|
Our strategic focus emphasizes safety and soundness, long-term profitability and sustainable balance sheet growth.
|
|
•
|
Growth in core deposit relationships, further optimization of our deposit mix and management of the cost of funds, while targeting a loan to deposit ratio of under 100%. We anticipate deposit growth exceeding loan growth for 2017.
|
|
•
|
Continued organic loan growth in Florida and the Tri-State market, both of which we believe to be attractive banking markets, as well as across our national lending platforms. We seek to maintain a loan portfolio diversified across geographies and product classes, predicated on a culture of disciplined credit underwriting.
|
|
•
|
Focus on a scalable and efficient operating model.
|
|
•
|
We will opportunistically evaluate potential strategic acquisitions of financial institutions and complementary businesses.
|
Challenges confronting our Company and our industry include:
|
•
|
Competitive market conditions for both loans and deposits in our primary geographic footprint may impact our ability to execute our balance sheet growth and profitability strategy. Managing the cost of funds while growing deposits in a competitive and, potentially, rising interest rate environment presents a strategic challenge.
|
|
•
|
Originating assets in the current market interest rate environment is likely to continue to put pressure on our net interest margin, particularly as higher yielding covered assets are liquidated or mature.
|
|
•
|
Uncertainty about fiscal and monetary policy may impact our business strategy and the business and economic environment in which we operate.
|
|
•
|
Uncertainty about the regulatory environment may present challenges in the execution of our business strategy and the management of non-interest expense. For additional discussion, see "Item 1. Business—Regulation and Supervision."
|
Critical Accounting Policies and Estimates
Our consolidated financial statements are prepared in accordance with GAAP and follow general practices within the banking industry. Application of these principles requires management to make complex and subjective estimates and judgments that affect the amounts reported in the consolidated financial statements and accompanying notes. We base our estimates on historical experience and on various other assumptions that we believe to be reasonable and appropriate under current circumstances. These assumptions form the basis for our judgments about the carrying values of assets and liabilities that are not readily available from independent, objective sources. We evaluate our estimates on an ongoing basis. Use of alternative assumptions may have resulted in significantly different estimates. Actual results may differ from these estimates.
Accounting policies are an integral part of our financial statements. A thorough understanding of these accounting policies is essential when reviewing our reported results of operations and our financial position. We believe that the critical accounting policies and estimates discussed below involve a heightened level of management judgment due to the complexity, subjectivity and sensitivity involved in their application.
36
Allowance for Loan and Lease Losses
The ALLL represents management's estimate of probable loan losses inherent in the Company's loan portfolio. Determining the amount of the ALLL is considered a critical accounting estimate because of its complexity and because it requires significant judgment and estimation. Estimates that are particularly susceptible to change that may have a material impact on the amount of the ALLL include:
|
•
|
the amount and timing of expected future cash flows from ACI loans and impaired loans;
|
|
•
|
the value of underlying collateral, which impacts loss severity and certain cash flow assumptions;
|
|
•
|
the selection of proxy data used to calculate loss factors;
|
|
•
|
our evaluation of loss emergence and historical loss experience periods;
|
|
•
|
our evaluation of the risk profile of various loan portfolio segments, including internal risk ratings; and
|
|
•
|
our selection and evaluation of qualitative factors.
|
Accounting for Acquired Loans and the FDIC Indemnification Asset
A significant portion of the covered loans are residential ACI Loans. The accounting for ACI loans requires the Company to estimate the timing and amount of cash flows to be collected from these loans and to continually update estimates of the cash flows expected to be collected over the lives of the loans. Similarly, the accounting for the FDIC indemnification asset requires the Company to estimate the timing and amount of cash flows to be received from the FDIC in reimbursement for losses and expenses related to the covered loans; these estimates are directly related to estimates of cash flows to be received from the covered loans. Estimated cash flows impact the rate of accretion on covered loans and the rate of accretion or amortization on the FDIC indemnification asset as well as the amount of any ALLL to be established related to the covered loans. These cash flow estimates are considered to be critical accounting estimates because they involve significant judgment and assumptions as to their amount and timing.
Covered 1-4 single family residential and home equity loans were placed into homogenous pools at the time of the FSB Acquisition; the ongoing credit quality and performance of these loans is monitored on a pool basis and expected cash flows are estimated on a pool basis. At acquisition, the fair value of the pools was measured based on the expected cash flows to be derived from each pool. For ACI pools, the difference between total contractual payments due and the cash flows expected to be received at acquisition was recognized as non-accretable difference. The excess of expected cash flows over the recorded fair value of each ACI pool at acquisition was recognized as accretable yield. The accretable yield is accreted into interest income over the life of each pool.
We monitor the pools quarterly by updating our expected cash flows to determine whether any changes have occurred in expected cash flows that would be indicative of impairment or necessitate reclassification between non-accretable difference and accretable yield. Initial and ongoing cash flow expectations incorporate significant assumptions regarding prepayment rates, the timing of resolution of loans, the timing and amount of loan sales and related pricing, frequency of default, delinquency and loss severity, which is dependent on estimates of underlying collateral values. Changes in these assumptions could have a potentially material impact on the amount of the ALLL related to the covered loans as well as on the rate of accretion on these loans and the corresponding rate of accretion or amortization of the FDIC indemnification asset. Prepayment, delinquency, default curves and loss severity used to forecast pool cash flows are derived from roll rates generated from the historical performance of the ACI residential loan portfolio observed over the immediately preceding four quarters, or the immediately preceding twelve quarters as it relates to loss severity from loan sales.
Fair Value Measurements
The Company measures certain of its assets and liabilities at fair value on a recurring or non-recurring basis. Assets and liabilities measured at fair value on a recurring basis include investment securities available for sale, servicing rights, and derivative instruments. Assets that may be measured at fair value on a non-recurring basis include impaired loans, OREO and other repossessed assets, loans held for sale, goodwill, impaired long-lived assets, and assets acquired and liabilities assumed in business combinations. The consolidated financial statements also include disclosures about the fair value of financial instruments that are not recorded at fair value.
37
Fair value is defined as the exchange price that would be received for an asset or paid to transfer a liability in the principal or most advantageous market for the asset or liability in an orderly transaction between market participants at the measurement date. Inputs used to determine fair value measurements are prioritized into a three level hierarchy based on observability and transparency of the inputs, summarized as follows:
Level 1—observable inputs that reflect quoted prices in active markets for identical assets,
Level 2—inputs other than quoted prices in active markets that are based on observable market data, and
Level 3—unobservable inputs requiring significant management judgment or estimation.
When observable market quotes are not available, fair value is estimated using modeling techniques such as discounted cash flow analyses and option pricing models. These modeling techniques utilize assumptions that we believe market participants would use in pricing the asset or the liability.
Particularly for estimated fair values of assets and liabilities categorized within level 3 of the fair value hierarchy, the selection of different valuation techniques or underlying assumptions could result in fair value estimates that are higher or lower than the amounts recorded or disclosed in our consolidated financial statements. Considerable judgment may be involved in determining the amount that is most representative of fair value.
Because of the degree of judgment involved in selecting valuation techniques and underlying assumptions, fair value measurements are considered critical accounting estimates.
Notes 1, 4, 12 and 16 to our consolidated financial statements contain further information about fair value estimates.
Recent Accounting Pronouncements
See Note 1 to our consolidated financial statements for a discussion of recent accounting pronouncements.
Impact of Acquisition Accounting, ACI Loan Accounting and the Loss Sharing Agreements
The application of acquisition accounting, accounting for ACI loans and the provisions of the Loss Sharing Agreements have had a material impact on our financial condition and results of operations. The more significant ways in which our financial statements have been impacted are summarized below and discussed in more detail throughout this "Management's Discussion and Analysis of Financial Condition and Results of Operations":
|
•
|
Under the acquisition method of accounting, all of the assets acquired and liabilities assumed in the FSB Acquisition were initially recorded on the consolidated balance sheet at their estimated fair values as of May 21, 2009. These estimated fair values differed materially from the carrying amounts of many of the assets acquired and liabilities assumed as reflected in the financial statements of the Failed Bank immediately prior to the FSB Acquisition. In particular, the acquisition date carrying amount of investment securities, loans, the FDIC indemnification asset, goodwill, net deferred tax assets, deposit liabilities, and FHLB advances were materially impacted by acquisition accounting adjustments. The reported amounts of many of the acquired assets continue to be affected by the adjustments;
|
|
•
|
Interest income and the net interest margin reflect the impact of accretion of the fair value adjustments made to the carrying amounts of interest earning assets in conjunction with the FSB Acquisition;
|
|
•
|
The estimated fair value at which the acquired loans were initially recorded by the Company was significantly less than the UPB of the loans. No ALLL was recorded with respect to acquired loans at the FSB Acquisition date. The write-down of loans to fair value in conjunction with the application of acquisition accounting and credit protection provided by the Loss Sharing Agreements reduce the impact of any provision for loan losses related to the acquired loans on the results of operations;
|
|
•
|
Acquired investment securities were recorded at their estimated fair values at the FSB Acquisition date, significantly reducing the potential for other-than-temporary impairment charges in periods subsequent to the FSB Acquisition for the acquired securities;
|
|
•
|
An indemnification asset related to the Loss Sharing Agreements with the FDIC was recorded in conjunction with the FSB Acquisition. The Loss Sharing Agreements afford the Company significant protection against future credit losses related to covered assets, including up to 90 days of past due interest, as well as reimbursement of certain expenses;
|
|
•
|
Non-interest expense includes the effect of amortization of the indemnification asset;
|
38
|
•
|
Non-interest income includes gains and losses associated with the resolution of covered assets and the related effect of indemnification under the terms of the Loss Sharing Agreements. The impact of gains or losses related to transactions in covered assets is significantly mitigated by FDIC indemnification; and
|
|
•
|
ACI loans that are contractually delinquent may not be reflected as non-accrual loans or non-performing assets due to the accounting treatment accorded such loans under ASC section 310-30, "Loans and Debt Securities Acquired with Deteriorated Credit Quality."
|
While the impact of these factors on our reported financial results is expected to continue to decline over time, they may continue to impact the comparability of our financial performance to that of other financial institutions.
Results of Operations
Net Interest Income
Net interest income is the difference between interest earned on interest earning assets and interest incurred on interest bearing liabilities and is the primary driver of core earnings. Net interest income is impacted by the relative mix of interest earning assets and interest bearing liabilities, the ratio of interest earning assets to total assets and of interest bearing liabilities to total funding sources, movements in market interest rates, levels of non-performing assets and pricing pressure from competitors.
The mix of interest earning assets is influenced by loan demand, market and competitive conditions in our primary lending markets and by management's continual assessment of the rate of return and relative risk associated with various classes of earning assets. The mix of interest bearing liabilities is influenced by the Company's liquidity profile, management's assessment of the desire for lower cost funding sources weighed against relationships with customers and growth requirements and is impacted by competition for deposits in the Company's markets and the availability and pricing of other sources of funds.
Net interest income is also impacted by the accounting for ACI loans acquired in conjunction with the FSB Acquisition. ACI loans were initially recorded at fair value, measured based on the present value of expected cash flows. The excess of expected cash flows over carrying value, known as accretable yield, is recognized as interest income over the lives of the underlying loans. The positive impact of accretion related to ACI loans on the net interest margin and the interest rate spread is expected to continue to decline as ACI loans comprise a declining percentage of total loans. The proportion of total loans represented by ACI loans is declining as the ACI loans are resolved and new loans are added to the portfolio. ACI loans represented
3.0%
,
4.6%
and
8.0%
of total loans, including premiums, discounts and deferred fees and costs, at
December 31, 2016
,
2015
and
2014
, respectively. As this trend continues, assuming an otherwise stable interest rate environment, we would expect our net interest margin and interest rate spread to continue to decrease over the remaining term of the Loss Sharing Agreements.
Consideration received earlier than expected or in excess of expected cash flows may result in a pool of ACI residential loans becoming fully amortized and its carrying value reduced to zero even though outstanding contractual balances and expected cash flows remain related to loans in the pool. Once the carrying value of a pool is reduced to zero, any future proceeds from the remaining loans, representing further realization of accretable yield, are recognized as interest income upon receipt. The carrying value of one pool has been reduced to zero. Interest income for the year ended December 31, 2014 was impacted by proceeds from the sale of loans in this pool. The UPB of loans remaining in this pool was insignificant at
December 31, 2016
and
2015
.
The impact of ACI loan accounting on net interest income makes it difficult to compare our net interest margin and interest rate spread to those reported by other financial institutions.
39
The following table presents, for the years ended
December 31, 2016
,
2015
and
2014
, information about (i) average balances, the total dollar amount of taxable equivalent interest income from earning assets and the resultant average yields; (ii) average balances, the total dollar amount of interest expense on interest bearing liabilities and the resultant average rates; (iii) net interest income; (iv) the interest rate spread; and (v) the net interest margin. Non-accrual and restructured loans are included in the average balances presented in this table; however, interest income foregone on non-accrual loans is not included. Interest income, yields, spread and margin have been calculated on a tax-equivalent basis for loans and investment securities that are exempt from federal income taxes, at a federal tax rate of 35.0% (dollars in thousands):
|
|
2016
|
2015
|
2014
|
|||||||||||||||||||||||||||||
|
|
Average
Balance
|
Interest
(1)
|
Yield/Rate
(1)
|
Average
Balance
|
Interest
(1)
|
Yield/
Rate
(1)
|
Average
Balance
|
Interest
(1)
|
Yield/
Rate
(1)
|
|||||||||||||||||||||||
|
Assets:
|
||||||||||||||||||||||||||||||||
|
Interest earning assets:
|
|
|
|
|
|
|
|
|
|
|
|
|
||||||||||||||||||||
|
New loans
|
$
|
17,229,089
|
|
$
|
609,573
|
|
3.54
|
%
|
$
|
13,260,683
|
|
$
|
466,038
|
|
3.50
|
%
|
$
|
9,247,229
|
|
$
|
329,023
|
|
3.56
|
%
|
||||||||
|
Loans acquired in FSB acquisition
|
775,065
|
|
309,904
|
|
39.98
|
%
|
1,002,934
|
|
303,751
|
|
30.29
|
%
|
1,289,058
|
|
349,251
|
|
27.09
|
%
|
||||||||||||||
|
Total loans
|
18,004,154
|
|
919,477
|
|
5.11
|
%
|
14,263,617
|
|
769,789
|
|
5.40
|
%
|
10,536,287
|
|
678,274
|
|
6.44
|
%
|
||||||||||||||
|
Investment securities
(2)
|
5,691,617
|
|
161,385
|
|
2.84
|
%
|
4,672,032
|
|
121,221
|
|
2.59
|
%
|
3,984,543
|
|
111,471
|
|
2.80
|
%
|
||||||||||||||
|
Other interest earning assets
|
541,816
|
|
12,204
|
|
2.25
|
%
|
481,716
|
|
10,098
|
|
2.10
|
%
|
453,252
|
|
7,845
|
|
1.73
|
%
|
||||||||||||||
|
Total interest earning assets
|
24,237,587
|
|
1,093,066
|
|
4.51
|
%
|
19,417,365
|
|
901,108
|
|
4.64
|
%
|
14,974,082
|
|
797,590
|
|
5.33
|
%
|
||||||||||||||
|
Allowance for loan and lease losses
|
(139,469
|
)
|
(108,875
|
)
|
(76,606
|
)
|
||||||||||||||||||||||||||
|
Non-interest earning assets
|
1,923,298
|
|
1,985,421
|
|
1,928,564
|
|
||||||||||||||||||||||||||
|
Total assets
|
$
|
26,021,416
|
|
$
|
21,293,911
|
|
$
|
16,826,040
|
|
|||||||||||||||||||||||
|
Liabilities and Stockholders' Equity:
|
||||||||||||||||||||||||||||||||
|
Interest bearing liabilities:
|
||||||||||||||||||||||||||||||||
|
Interest bearing demand deposits
|
$
|
1,382,717
|
|
8,343
|
|
0.60
|
%
|
$
|
1,169,921
|
|
5,782
|
|
0.49
|
%
|
$
|
773,655
|
|
3,254
|
|
0.42
|
%
|
|||||||||||
|
Savings and money market deposits
|
8,361,652
|
|
51,774
|
|
0.62
|
%
|
6,849,366
|
|
37,744
|
|
0.55
|
%
|
5,092,444
|
|
25,915
|
|
0.51
|
%
|
||||||||||||||
|
Time deposits
|
5,326,630
|
|
59,656
|
|
1.12
|
%
|
4,305,857
|
|
47,625
|
|
1.11
|
%
|
3,716,611
|
|
43,792
|
|
1.18
|
%
|
||||||||||||||
|
Total interest bearing deposits
|
15,070,999
|
|
119,773
|
|
0.79
|
%
|
12,325,144
|
|
91,151
|
|
0.74
|
%
|
9,582,710
|
|
72,961
|
|
0.76
|
%
|
||||||||||||||
|
FHLB advances
|
4,801,406
|
|
47,773
|
|
0.99
|
%
|
3,706,288
|
|
40,328
|
|
1.09
|
%
|
2,613,156
|
|
32,412
|
|
1.24
|
%
|
||||||||||||||
|
Notes and other borrowings
|
403,197
|
|
21,287
|
|
5.28
|
%
|
58,791
|
|
3,685
|
|
6.27
|
%
|
10,768
|
|
1,278
|
|
11.87
|
%
|
||||||||||||||
|
Total interest bearing liabilities
|
20,275,602
|
|
188,833
|
|
0.93
|
%
|
16,090,223
|
|
135,164
|
|
0.84
|
%
|
12,206,634
|
|
106,651
|
|
0.87
|
%
|
||||||||||||||
|
Non-interest bearing demand deposits
|
2,968,192
|
|
2,732,654
|
|
2,366,621
|
|
||||||||||||||||||||||||||
|
Other non-interest bearing liabilities
|
435,645
|
|
305,519
|
|
235,930
|
|
||||||||||||||||||||||||||
|
Total liabilities
|
23,679,439
|
|
19,128,396
|
|
14,809,185
|
|
||||||||||||||||||||||||||
|
Stockholders' equity
|
2,341,977
|
|
2,165,515
|
|
2,016,855
|
|
||||||||||||||||||||||||||
|
Total liabilities and stockholders' equity
|
$
|
26,021,416
|
|
$
|
21,293,911
|
|
$
|
16,826,040
|
|
|||||||||||||||||||||||
|
Net interest income
|
$
|
904,233
|
|
$
|
765,944
|
|
$
|
690,939
|
|
|||||||||||||||||||||||
|
Interest rate spread
|
3.58
|
%
|
3.80
|
%
|
4.46
|
%
|
||||||||||||||||||||||||||
|
Net interest margin
|
3.73
|
%
|
3.94
|
%
|
4.61
|
%
|
||||||||||||||||||||||||||
|
(1)
|
On a tax-equivalent basis. The tax-equivalent adjustment for tax-exempt loans was
$23.3 million
,
$15.9 million
and
$11.0 million
, and the tax-equivalent adjustment for tax-exempt investment securities was
$10.5 million
,
$4.4 million
and
$2.8 million
, for the years ended
December 31, 2016
,
2015
and
2014
, respectively.
|
|
(2)
|
At fair value except for securities held to maturity
|
40
Increases and decreases in interest income, calculated on a tax-equivalent basis, and interest expense result from changes in average balances (volume) of interest earning assets and liabilities, as well as changes in average interest rates. The following table shows the effect that these factors had on the interest earned on our interest earning assets and the interest incurred on our interest bearing liabilities for the years indicated. The effect of changes in volume is determined by multiplying the change in volume by the previous year's average rate. Similarly, the effect of rate changes is calculated by multiplying the change in average rate by the previous year's volume. Changes applicable to both volume and rate have been allocated to volume (in thousands):
|
2016 Compared to 2015
|
2015 Compared to 2014
|
||||||||||||||||||||||
|
Change Due
to Volume
|
Change Due
to Rate
|
Increase
|
Change Due
to Volume
|
Change Due
to Rate
|
Increase
(Decrease)
|
||||||||||||||||||
|
Interest Income Attributable to:
|
|||||||||||||||||||||||
|
Loans
|
$
|
191,052
|
|
$
|
(41,364
|
)
|
$
|
149,688
|
|
$
|
201,092
|
|
$
|
(109,577
|
)
|
$
|
91,515
|
|
|||||
|
Investment securities
|
28,484
|
|
11,680
|
|
40,164
|
|
18,118
|
|
(8,368
|
)
|
9,750
|
|
|||||||||||
|
Other interest earning assets
|
1,383
|
|
723
|
|
2,106
|
|
576
|
|
1,677
|
|
2,253
|
|
|||||||||||
|
Total interest income
|
220,919
|
|
(28,961
|
)
|
191,958
|
|
219,786
|
|
(116,268
|
)
|
103,518
|
|
|||||||||||
|
Interest Expense Attributable to:
|
|||||||||||||||||||||||
|
Interest bearing demand deposits
|
1,274
|
|
1,287
|
|
2,561
|
|
1,986
|
|
542
|
|
2,528
|
|
|||||||||||
|
Savings and money market deposits
|
9,235
|
|
4,795
|
|
14,030
|
|
9,792
|
|
2,037
|
|
11,829
|
|
|||||||||||
|
Time deposits
|
11,600
|
|
431
|
|
12,031
|
|
6,435
|
|
(2,602
|
)
|
3,833
|
|
|||||||||||
|
Total interest bearing deposits
|
22,109
|
|
6,513
|
|
28,622
|
|
18,213
|
|
(23
|
)
|
18,190
|
|
|||||||||||
|
FHLB advances
|
11,151
|
|
(3,706
|
)
|
7,445
|
|
11,836
|
|
(3,920
|
)
|
7,916
|
|
|||||||||||
|
Notes and other borrowings
|
18,184
|
|
(582
|
)
|
17,602
|
|
3,010
|
|
(603
|
)
|
2,407
|
|
|||||||||||
|
Total interest expense
|
51,444
|
|
2,225
|
|
53,669
|
|
33,059
|
|
(4,546
|
)
|
28,513
|
|
|||||||||||
|
Increase (decrease) in net interest income
|
$
|
169,475
|
|
$
|
(31,186
|
)
|
$
|
138,289
|
|
$
|
186,727
|
|
$
|
(111,722
|
)
|
$
|
75,005
|
|
|||||
Year ended December 31, 2016
compared to
year ended December 31, 2015
Net interest income, calculated on a tax-equivalent basis, was
$904.2 million
for the
year ended December 31, 2016
compared to
$765.9 million
for the
year ended December 31, 2015
, an increase of
$138.3 million
. The increase in net interest income was comprised of an increase in tax-equivalent interest income of
$192.0 million
, offset by an increase in interest expense of
$53.7 million
.
The increase in tax-equivalent interest income was comprised primarily of a
$149.7 million
increase in interest income from loans and a
$40.2 million
increase in interest income from investment securities.
Increased interest income from loans was attributable to a
$3.7 billion
increase in the average balance outstanding partially offset by a
0.29%
decrease in the tax-equivalent yield to
5.11%
for the
year ended December 31, 2016
from
5.40%
for the
year ended December 31, 2015
. Offsetting factors contributing to the overall decline in the yield on loans included:
|
•
|
New loans originated at lower market rates of interest comprised a greater percentage of the portfolio for the
year ended December 31, 2016
than for
2015
. New loans represented
95.7%
of the average balance of loans outstanding for the
year ended December 31, 2016
compared to
93.0%
for the
year ended December 31, 2015
. We would expect the impact of growth of the new loan portfolio to lead to further declines in the overall yield on loans, given an otherwise stable interest rate environment.
|
|
•
|
The tax-equivalent yield on new loans increased to
3.54%
for the
year ended December 31, 2016
from
3.50%
for the
year ended December 31, 2015
.
|
|
•
|
Interest income on loans acquired in the FSB Acquisition totaled
$309.4 million
and
$303.2 million
for the years ended
December 31, 2016
and
2015
, respectively. The tax-equivalent yield on those loans increased to
39.98%
for the
year ended December 31, 2016
from
30.29%
for the
year ended December 31, 2015
. The increase in the yield on loans acquired in the FSB Acquisition resulted primarily from improvements in expected cash flows for ACI loans.
|
The average balance of investment securities increased by
$1.0 billion
for the
year ended
December 31, 2016
from the
year ended December 31, 2015
while the tax-equivalent yield increased to
2.84%
for the
year ended
December 31, 2016
from
2.59%
41
for
year ended
December 31, 2015
. The increase in tax-equivalent yield reflects (i) changes in portfolio composition, including growth in the municipal portfolio, (ii) resetting of rates on floating-rate securities following the FRB's interest rate increase in the fourth quarter of 2015 and (iii) net purchases of securities with wider spreads.
The components of the increase in interest expense for the
year ended
December 31, 2016
as compared to the
year ended
December 31, 2015
were a
$28.6 million
increase in interest expense on deposits, a
$7.4 million
increase in interest expense on FHLB advances and a
$17.6 million
increase in interest expense on notes and other borrowings, reflecting the issuance of $400 million in senior notes in November 2015.
The most significant factor contributing to the increase in interest expense on deposits was an increase of
$2.7 billion
in average interest bearing deposits. The average cost of interest bearing deposits increased by
0.05%
to
0.79%
for the
year ended
December 31, 2016
from
0.74%
for the
year ended
December 31, 2015
. This increase reflected increases in the cost of interest bearing demand deposits of
0.11%
and savings and money market deposits of
0.07%
. These cost increases were generally driven by growth of deposits in competitive markets.
The increase in interest expense on FHLB advances was driven by an increase in the average balance of
$1.1 billion
, partially offset by a decrease in the average rate paid on these borrowings. The average rate paid on FHLB advances decreased by
0.10%
to
0.99%
for the
year ended
December 31, 2016
from
1.09%
for the
year ended
December 31, 2015
. The decrease in the average rate paid was primarily driven by a contraction in maturities.
The net interest margin, calculated on a tax-equivalent basis, for the
year ended
December 31, 2016
was
3.73%
as compared to
3.94%
for the
year ended
December 31, 2015
. The interest rate spread decreased to
3.58%
for the
year ended
December 31, 2016
from
3.80%
for the
year ended
December 31, 2015
. The declines in net interest margin and interest rate spread resulted primarily from lower yields on loans and the cost of the senior notes, as discussed above. Given an otherwise stable interest rate environment, we would expect the net interest margin and interest rate spread to continue to decline as new loans originated at lower current market rates of interest continue to grow and higher yielding loans acquired in the FSB Acquisition are collected or resolved. Expected trends in the net interest margin will be impacted by changes in market interest rates, including changes in the shape of the yield curve, and by the Company's ability to manage the cost of funds while growing deposits in competitive markets.
Year ended December 31, 2015 compared to year ended December 31, 2014
Net interest income, calculated on a tax-equivalent basis, was
$765.9 million
for the
year ended
December 31, 2015
compared to
$690.9 million
for the year ended
December 31, 2014
, an increase of
$75.0 million
. The increase in net interest income was comprised of an increase in interest income of
$103.5 million
, offset by an increase in interest expense of
$28.5 million
.
The increase in tax-equivalent interest income was comprised primarily of a
$91.5 million
increase in interest income from loans and a
$9.8 million
increase in interest income from investment securities.
Increased interest income from loans was attributable to a
$3.7 billion
increase in the average balance outstanding partially offset by a
1.04%
decrease in the tax-equivalent yield to
5.40%
for the year ended
December 31, 2015
from
6.44%
for the year ended
December 31, 2014
. Offsetting factors contributing to the overall decline in the yield on loans included:
|
•
|
New loans originated at lower market rates of interest comprised a greater percentage of the portfolio for the year ended December 31, 2015 than for 2014. New loans represented 93.0% of the average balance of loans outstanding for the year ended December 31, 2015 compared to 87.8% for the year ended December 31, 2014.
|
|
•
|
The tax-equivalent yield on new loans declined to 3.50% for the year ended December 31, 2015 from 3.56% for the year ended December 31, 2014.
|
|
•
|
Interest income on loans acquired in the FSB Acquisition totaled $303.2 million and $348.6 million for the years ended December 31, 2015 and 2014, respectively. The tax-equivalent yield on those loans increased to 30.29% for the year ended December 31, 2015 from 27.09% for the year ended December 31, 2014. Increases in the yield resulting from improvements in the timing and amount of expected cash flows were partially offset by a decrease in the amount of interest income recognized in connection with the sale of ACI residential loans from the pool with a carrying value of zero. Interest income on loans included $30.9 million in proceeds from sales of loans from the zero carrying value pool for the year ended December 31, 2014. No loans were sold from the zero carrying value pool in the year ended December 31, 2015.
|
The average balance of investment securities increased by $687 million for the year ended December 31, 2015 from the year ended December 31, 2014 while the tax-equivalent yield declined to 2.59% for the year ended December 31, 2015 from
42
2.80% for year ended December 31, 2014. The decline in tax-equivalent yield reflected (i) the impact of the addition of new, relatively short duration securities at current market yields while securities purchased in a higher interest rate environment continue to amortize and (ii) adjustments resulting from changes in prepayment speeds for certain securities.
The components of the increase in interest expense for the year ended December 31, 2015 as compared to the year ended December 31, 2014 were an $18.2 million increase in interest expense on deposits, a $7.9 million increase in interest expense on FHLB advances and a $2.4 million increase in interest expense on notes and other borrowings, reflecting the senior notes issued in November 2015.
The most significant factor contributing to the increase in interest expense on deposits was an increase of $2.7 billion in average interest bearing deposits. The increase in interest expense on FHLB advances was driven by an increase in the average balance of $1.1 billion, partially offset by a decrease in the average rate paid on these borrowings. The average rate paid on FHLB advances declined by 0.15% to 1.09% for the year ended December 31, 2015 from 1.24% for the year ended December 31, 2014, reflecting the impact of the maturity of higher rate advances and the addition of new advances at lower market interest rates.
The net interest margin, calculated on a tax-equivalent basis, for the year ended December 31, 2015 was 3.94% as compared to 4.61% for the year ended December 31, 2014. The interest rate spread decreased to 3.80% for the year ended December 31, 2015 from 4.46% for the year ended December 31, 2014. The declines in net interest margin and interest rate spread resulted primarily from lower yields on loans and investment securities partly offset by a lower cost of deposits and FHLB advances, as discussed above.
Provision for Loan Losses
The provision for loan losses is the amount of expense that, based on our judgment, is required to maintain the ALLL at an adequate level to absorb probable losses inherent in the loan portfolio at the balance sheet date and that, in management’s judgment, is appropriate under GAAP. The determination of the amount of the ALLL is complex and involves a high degree of judgment and subjectivity. Our determination of the amount of the allowance and corresponding provision for loan losses considers ongoing evaluations of the credit quality of and level of credit risk inherent in various segments of the loan portfolio and of individually significant credits, levels of non-performing loans and charge-offs, historical and statistical trends and economic and other relevant factors. See “Analysis of the Allowance for Loan and Lease Losses” below for more information about how we determine the appropriate level of the allowance.
For the years ended
December 31, 2016
,
2015
and
2014
, we recorded provisions for loan losses of
$52.6 million
,
$42.1 million
and
$41.7 million
, respectively, related to new loans. The amount of the provision is impacted by loan growth, portfolio mix, historical loss rates, the level of charge-offs and specific reserves for impaired loans, and management's evaluation of qualitative factors in the determination of general reserves.
The most significant factors contributing to the increase in the provision for loan losses related to new loans for the
year ended December 31, 2016
compared to
2015
, were an (i) the increase in the provision related to taxi medallion loans, (ii) an increase in the provision related to impaired loans in other portfolio segments and (iii) an increase in the relative impact on the provision of changes in quantitative and qualitative loss factors, partially offset by the impact of lower loan growth in
2016
. See the section entitled "Analysis of the Allowance for Loan and Lease Losses" below for further discussion.
For the years ended
December 31, 2016
,
2015
and
2014
, we recorded provisions for (recovery of) loan losses of
$(1.7) million
,
$2.3 million
and
$(0.2) million
, respectively, related to covered loans. As discussed below in the section entitled "Non-interest income," the impact on our results of operations of any provision for (recovery of) loan losses on covered loans is significantly mitigated by the corresponding impact on the FDIC indemnification asset, recorded in non-interest income.
Non-Interest Income
The Company reported non-interest income of
$106.4 million
,
$102.2 million
and
$84.2 million
for the years ended
December 31, 2016
,
2015
and
2014
, respectively. Although declining in the aggregate in both absolute terms and as a percent of total non-interest income, a significant portion of our non-interest income has historically related to transactions in the covered assets. We have broken out the significant categories of non-interest income that relate to covered assets in the table below, to assist in the comparison of the amount and composition of our non-interest income with that of other financial institutions.
43
The following table presents a comparison of the categories of non-interest income for the years ended
December 31, 2016
,
2015
and
2014
(in thousands):
|
|
2016
|
2015
|
2014
|
||||||||
|
Income from resolution of covered assets, net
|
$
|
36,155
|
|
$
|
50,658
|
|
$
|
49,082
|
|
||
|
Gain (loss) on sale of covered loans, net
|
(14,470
|
)
|
34,929
|
|
20,369
|
|
|||||
|
Net loss on FDIC indemnification
|
(17,759
|
)
|
(65,942
|
)
|
(46,396
|
)
|
|||||
|
Mortgage insurance income, modification incentives and expenses reimbursed by the FDIC
|
1,100
|
|
3,770
|
|
9,476
|
|
|||||
|
Non-interest income related to the covered assets
|
5,026
|
|
23,415
|
|
32,531
|
|
|||||
|
Service charges and fees
|
19,463
|
|
17,876
|
|
16,612
|
|
|||||
|
Gain on sale of non-covered loans
|
10,064
|
|
5,704
|
|
678
|
|
|||||
|
Gain on investment securities available for sale, net
|
14,461
|
|
8,480
|
|
3,859
|
|
|||||
|
Lease financing
|
44,738
|
|
35,641
|
|
21,601
|
|
|||||
|
Other non-interest income
|
12,665
|
|
11,108
|
|
8,884
|
|
|||||
|
$
|
106,417
|
|
$
|
102,224
|
|
$
|
84,165
|
|
|||
Non-interest income related to transactions in the
covered assets
The consolidated financial statements reflect the impact of gains or losses arising from transactions in the covered assets. The balance of the FDIC indemnification asset is reduced or increased as a result of decreases or increases in cash flows expected to be received from the FDIC related to these gains or losses. When these transaction gains or losses are recorded, we also record an offsetting amount in the consolidated statement of income line item “
Net loss on FDIC indemnification
.” This line item includes the significantly mitigating impact of FDIC indemnification related to the following types of transactions in covered assets:
|
•
|
gains or losses from the resolution of covered assets;
|
|
•
|
provisions for (recoveries of) losses on covered loans;
|
|
•
|
gains or losses on the sale of covered loans; and
|
|
•
|
gains or losses on covered OREO.
|
Of these transactions, those that had the most significant impact on the Company's results of operations for the years ended
December 31, 2016
,
2015
and
2014
were gains and losses from the resolution of covered assets and gains and losses on the sale of covered loans. These transactions are discussed further below.
See Note 6 to the consolidated financial statements for further details about the components of these gains and losses associated with covered assets, along with the related additions to or reductions in the amounts recoverable from the FDIC under the Loss Sharing Agreements, as reflected in the consolidated statements of income for the years ended
December 31, 2016
,
2015
and
2014
.
Covered loans may be resolved through prepayment, short sale of the underlying collateral, foreclosure, sale of the loans or charge-off. For loans resolved through prepayment, short sale or foreclosure, the difference between consideration received in resolution of the loans and the carrying value of the loans is recorded in the consolidated statement of income line item “
Income from resolution of covered assets, net
.” Both gains and losses on individual resolutions are included in this line item. Losses from the resolution of covered loans increase the amount recoverable from the FDIC under the Loss Sharing Agreements. Gains from the resolution of covered loans reduce the amount recoverable from the FDIC under the Loss Sharing Agreements. These additions to or reductions in amounts recoverable from the FDIC related to the resolution of covered loans are recorded in non-interest income in the line item “
Net loss on FDIC indemnification
” and reflected as corresponding increases or decreases in the FDIC indemnification asset. The amount of income or loss recorded in any period will be impacted by the amount of covered loans resolved, the amount of consideration received, and our ability to accurately project cash flows from ACI loans in future periods.
44
The following table provides further detail of the components of income from resolution of covered assets, net, for the years ended
December 31, 2016
,
2015
and
2014
(in thousands):
|
|
2016
|
2015
|
2014
|
||||||||
|
Payments in full
|
$
|
37,117
|
|
$
|
47,238
|
|
$
|
47,855
|
|
||
|
Foreclosures
|
(119
|
)
|
476
|
|
(1,556
|
)
|
|||||
|
Short sales
|
(545
|
)
|
36
|
|
(388
|
)
|
|||||
|
Charge-offs
|
(542
|
)
|
(549
|
)
|
(1,016
|
)
|
|||||
|
Recoveries
|
244
|
|
3,457
|
|
4,187
|
|
|||||
|
Income from resolution of covered assets, net
|
$
|
36,155
|
|
$
|
50,658
|
|
$
|
49,082
|
|
||
The decrease in income for the
year ended December 31, 2016
compared to the
year ended December 31, 2015
resulted primarily from decreases in income from residential paid in full resolutions, reflecting decreases in both the number of resolutions and in average income per resolution.
As explained further in the section entitled "The FSB Acquisition" under Item 1, the Bank may sell up to approximately $280 million of covered loans on an annual basis without prior consent of the FDIC. Any losses incurred from such loan sales are covered under the Single Family Shared-Loss Agreement.
The following table summarizes the gain (loss) recorded on the sale of covered residential loans and the impact of related FDIC indemnification for the years ended
December 31, 2016
,
2015
and
2014
(in thousands):
|
2016
|
2015
|
2014
|
|||||||||
|
Gain (loss) on sale of covered loans
|
$
|
(14,470
|
)
|
$
|
34,929
|
|
$
|
2,398
|
|
||
|
Net gain (loss) on FDIC indemnification
|
11,615
|
|
(28,051
|
)
|
(809
|
)
|
|||||
|
Net
|
$
|
(2,855
|
)
|
$
|
6,878
|
|
$
|
1,589
|
|
||
Pricing received on the sale of covered loans may vary based on (i) market conditions, including the interest rate environment, the amount of capital seeking investment and the secondary supply of loans with a particular performance history or collateral type, (ii) the type and quality of collateral, (iii) the performance history of loans included in the sale and (iv) whether or not the loans have been modified. The differences in results of these sales for the years ended
December 31, 2016
,
2015
and
2014
related primarily to the characteristics of the loans sold and the dynamics of secondary market demand for these assets. We anticipate that we will continue to exercise our right to sell covered residential loans on a quarterly basis in the future.
Gain on sale of covered loans for the year ended December 31, 2014 also included $17,971 related to the sale of covered commercial loans. In accordance with the terms of the Commercial Shared-Loss Agreement, the Bank requested and received approval from the FDIC to sell certain covered commercial and consumer loans and commercial OREO in the first quarter of 2014. See Note 5 to the consolidated financial statements for more information about this transaction.
45
Certain OREO and foreclosure related expenses associated with covered assets are reimbursed under the terms of the Loss Sharing Agreements. Such expenses are recorded in non-interest expense when incurred, and the reimbursement is recorded in non-interest income when submitted to the FDIC, generally upon ultimate resolution of the underlying covered assets. Mortgage insurance income represents mortgage insurance proceeds received with respect to covered loans in excess of the portion of losses on those loans that is recoverable from the FDIC. Modification incentives represent amounts received from the Department of Treasury related to loans modified under HAMP, net of amounts reimbursed to the FDIC. Year over year declines in expense reimbursements, mortgage insurance income and modification incentives reflect the reduced volume of covered loan foreclosure and HAMP modification activity over the period.
Other components of non-interest income
Year over year increases in service charges and fees correspond to the growth in deposits and loans.
The increase in gain on sale of non-covered loans for the
year ended December 31, 2016
compared to
2015
and for the
year ended December 31, 2015
compared to
2014
related primarily to gains on sales of loans by SBF, which was acquired by the Company in May 2015. Such gains totaled
$9.9 million
and
$5.0 million
for the years ended
December 31, 2016
and
2015
, respectively.
Gains on investment securities available for sale for the years ended
December 31, 2016
,
2015
and
2014
related to sales of securities in the normal course of managing liquidity, portfolio duration and yield.
Income from lease financing increased to
$44.7 million
for the
year ended December 31, 2016
, compared to
$35.6 million
for the
year ended December 31, 2015
and
$21.6 million
for
year ended December 31, 2014
. The increase in income is generally consistent with the growth in the portfolio of equipment under operating lease.
Non-Interest Expense
The following table presents the components of non-interest expense for the years ended
December 31, 2016
,
2015
and
2014
(in thousands):
|
|
2016
|
2015
|
2014
|
||||||||
|
Employee compensation and benefits
|
$
|
223,011
|
|
$
|
210,104
|
|
$
|
195,218
|
|
||
|
Occupancy and equipment
|
76,003
|
|
76,024
|
|
70,520
|
|
|||||
|
Amortization of FDIC indemnification asset
|
160,091
|
|
109,411
|
|
69,470
|
|
|||||
|
Deposit insurance expense
|
17,806
|
|
14,257
|
|
9,348
|
|
|||||
|
Professional fees
|
14,249
|
|
14,185
|
|
13,178
|
|
|||||
|
Telecommunications and data processing
|
14,343
|
|
13,613
|
|
13,381
|
|
|||||
|
Depreciation of equipment under operating lease
|
31,580
|
|
18,369
|
|
8,759
|
|
|||||
|
Other non-interest expense
|
53,364
|
|
50,709
|
|
46,629
|
|
|||||
|
$
|
590,447
|
|
$
|
506,672
|
|
$
|
426,503
|
|
|||
Non-interest expense as a percentage of average assets was
2.3%
,
2.4%
and
2.5%
for the years ended
December 31, 2016
,
2015
and
2014
, respectively. Excluding amortization of the FDIC indemnification asset, non-interest expense as a percentage of average assets was
1.7%
,
1.9%
and
2.1%
for the years ended
December 31, 2016
,
2015
and
2014
, respectively. The more significant changes in the components of non-interest expense are discussed below.
Employee compensation and benefits
As is typical for financial institutions, employee compensation and benefits represents the single largest component of recurring non-interest expense. Employee compensation and benefits for the
year ended December 31, 2016
increased by
$12.9 million
compared to the
year ended December 31, 2015
. The increase for the
year ended December 31, 2016
primarily reflected general increases in salaries and the cost of benefits and changes in the composition of the employee base. Employee compensation and benefits for the
year ended December 31, 2015
increased by
$14.9 million
as compared to the
year ended December 31, 2014
. This increase reflected higher head count, particularly from the SBF acquisition in
2015
and the addition of lending and deposit gathering teams.
46
Amortization of FDIC indemnification asset
Amortization of FDIC indemnification asset totaled
$160.1 million
,
$109.4 million
and
$69.5 million
, respectively, for the years ended
December 31, 2016
,
2015
and
2014
.
The FDIC indemnification asset was initially recorded at its estimated fair value of $3.4 billion, representing the present value of estimated future cash payments from the FDIC for probable losses on covered assets. As projected cash flows from the ACI loans have increased, the yield on the loans has increased accordingly and the estimated future cash payments from the FDIC have decreased. This change in estimated cash flows is recognized prospectively, consistent with the recognition of the increased cash flows from the ACI loans. As a result, the FDIC indemnification asset is being amortized to the amount of the estimated future cash flows. For the years ended
December 31, 2016
,
2015
and
2014
, the average rate at which the FDIC indemnification asset was amortized was
25.14%
,
12.68%
, and
6.41%
, respectively.
The rate of amortization will increase if estimated future cash payments from the FDIC decrease. The amount of amortization is impacted by both the change in the amortization rate and the decrease in the average balance of the indemnification asset. As we continue to submit claims under the Loss Sharing Agreements and recognize periodic amortization, the balance of the indemnification asset will continue to decline.
See
Note 6
to the consolidated financial statements for a rollforward of the FDIC indemnification asset for the years ended
December 31, 2016
,
2015
and
2014
. Subsequent to the termination of loss sharing under the Commercial Shared-Loss Agreement in 2014, the entire balance of the FDIC indemnification asset relates to residential loans and OREO covered under the Single Family Shared-Loss Agreement. The following table presents the carrying value of the FDIC indemnification asset and the estimated future cash flows at
December 31, 2016
and
2015
(in thousands):
|
2016
|
2015
|
||||||
|
FDIC indemnification asset
|
$
|
515,933
|
|
$
|
739,880
|
|
|
|
Less expected amortization
|
(245,350
|
)
|
(342,317
|
)
|
|||
|
Amount expected to be collected from the FDIC
|
$
|
270,583
|
|
$
|
397,563
|
|
|
The amount of expected amortization reflects the impact of improvements in cash flows expected to be collected from the covered loans, as well as the impact of time value resulting from the discounting of the asset when it was initially established. This amount will be amortized to non-interest expense using the effective interest method over the period during which cash flows from the FDIC are expected to be collected, which is limited to the lesser of the contractual term of the Single Family Shared-Loss Agreement and the expected remaining life of the indemnified assets.
Deposit insurance expense
Deposit insurance expense totaled
$17.8 million
,
$14.3 million
and
$9.3 million
, respectively, for the years ended
December 31, 2016
,
2015
and
2014
. These increases primarily reflect the growth of the balance sheet and, beginning in the third quarter of
2016
, the large bank surcharge imposed by the FDIC.
Depreciation of equipment under operating lease
Depreciation of equipment under operating lease increased by
$13.2 million
for the
year ended December 31, 2016
as compared to the
year ended December 31, 2015
and by
$9.6 million
for the
year ended December 31, 2015
compared to the
year ended December 31, 2014
. These increases generally correspond to the growth in the portfolio of equipment under operating lease. Depreciation of equipment under operating lease for the
year ended December 31, 2016
also reflected impairment of
$4.1 million
related to a group of tank cars impacted by new safety regulations.
Other non-interest expense
The most significant components of other non-interest expense are advertising and promotion, costs related to lending activities and deposit generation, OREO related expenses, insurance, travel and general office expense. The
year ended December 31, 2016
was impacted by litigation accruals of $2.4 million and a $1.1 million settlement related to a payroll tax audit.
47
Income Taxes
The provision for income taxes for the years ended
December 31, 2016
,
2015
and
2014
was
$109.7 million
,
$45.2 million
and
$89.0 million
, respectively. The Company's effective tax rate was
32.7%
,
15.2%
and
30.4%
for the years ended
December 31, 2016
,
2015
and
2014
, respectively.
Significant components included in the reconciliation of the Company's effective income tax rate to the statutory federal tax rate of 35.0% included the effect of state income taxes and the impact of income not subject to federal tax for each of the years presented. The effective income tax rate for the
year ended December 31, 2015
also reflects a discrete income tax benefit of $49.3 million. The tax benefit, predicated on guidance issued by the IRS in 2015, relates to the Company's ability to claim additional tax basis in certain assets acquired in the FSB Acquisition. In addition, $6.2 million and $5.1 million of reserves for uncertain tax liabilities were released in the years ended
December 31, 2015
and
2014
, respectively, due to the lapse of the statute of limitations related thereto.
At
December 31, 2016
and
2015
the Company had net deferred tax assets of
$62.9 million
and
$105.6 million
, respectively. Based on an evaluation of both positive and negative evidence related to ultimate realization of deferred tax assets, we have concluded it is more likely than not that the deferred tax assets will be realized. Persuasive positive evidence leading to this conclusion as of
December 31, 2016
included the availability of sufficient tax loss carrybacks and future taxable income resulting from reversal of existing taxable temporary differences to assure realization of the deferred tax assets. Realization of deferred tax assets as of
December 31, 2016
is not dependent, to any significant extent, on the generation of additional future taxable income.
For more information about income taxes, see Note 11 to the consolidated financial statements.
Termination of the Commercial Shared-Loss Agreement
Loss sharing under the terms of the Bank's Commercial Shared-Loss Agreement with the FDIC terminated on May 21, 2014. At
December 31, 2016
, the Company’s loan portfolio included commercial and consumer ACI loans with a carrying value of
$47 million
, and the investment portfolio included securities with a carrying value of
$130 million
that are no longer subject to loss sharing under the terms of the Commercial Shared-Loss Agreement. As of
December 31, 2016
we bear all credit risk with respect to these assets. The Commercial Shared-Loss Agreement provides for the Bank’s continued reimbursement for recoveries, as defined, to the FDIC through May 21, 2017.
Analysis of Financial Condition
Average interest-earning assets increased
$4.8 billion
to
$24.2 billion
for the
year ended
December 31, 2016
from
$19.4 billion
for the
year ended
December 31, 2015
. This increase was driven by a
$3.7 billion
increase in the average balance of outstanding loans and a
$1.0 billion
increase in the average balance of investment securities. The increase in average loans reflected growth of
$4.0 billion
in average new loans outstanding, partially offset by a
$228 million
decrease in the average balance of loans acquired in the FSB Acquisition. Average non-interest earning assets remained relatively consistent period over period, reflecting a decrease in the FDIC indemnification asset and offsetting increases in equipment under operating lease, net and other assets. Growth in interest earning assets, resolution of covered loans and declines in the amount of the FDIC indemnification asset are trends that are expected to continue.
Average interest bearing liabilities increased
$4.2 billion
to
$20.3 billion
for the
year ended
December 31, 2016
from
$16.1 billion
for the
year ended
December 31, 2015
, due to an increase of
$2.7 billion
in average interest bearing deposits, a
$1.1 billion
increase in average FHLB advances and a
$344 million
increase in average notes and other borrowings. Average non-interest bearing deposits increased by
$236 million
. Growth in average deposits is a trend that is expected to continue.
Average stockholders' equity increased by
$176 million
, due primarily to the retention of earnings.
48
Investment Securities Available for Sale
The following table shows the amortized cost and fair value of investment securities available for sale as of
December 31, 2016
,
2015
and
2014
(in thousands):
|
2016
|
2015
|
2014
|
|||||||||||||||||||||
|
|
Amortized
Cost
|
Fair
Value
|
Amortized
Cost
|
Fair
Value
|
Amortized
Cost
|
Fair
Value
|
|||||||||||||||||
|
U.S. Treasury securities
|
$
|
4,999
|
|
$
|
5,005
|
|
$
|
4,997
|
|
$
|
4,997
|
|
$
|
54,924
|
|
$
|
54,967
|
|
|||||
|
U.S. Government agency and sponsored enterprise residential MBS
|
1,513,028
|
|
1,527,242
|
|
1,167,197
|
|
1,178,318
|
|
1,501,504
|
|
1,524,716
|
|
|||||||||||
|
U.S. Government agency and sponsored enterprise commercial MBS
|
126,754
|
|
124,586
|
|
95,997
|
|
96,814
|
|
101,089
|
|
101,858
|
|
|||||||||||
|
Re-Remics
|
—
|
|
—
|
|
88,658
|
|
89,691
|
|
179,664
|
|
183,272
|
|
|||||||||||
|
Private label residential MBS and CMOs
|
334,167
|
|
375,098
|
|
502,723
|
|
544,612
|
|
350,300
|
|
403,979
|
|
|||||||||||
|
Private label commercial MBS
|
1,180,386
|
|
1,187,624
|
|
1,219,355
|
|
1,218,740
|
|
1,156,166
|
|
1,161,485
|
|
|||||||||||
|
Single family rental real estate-backed securities
|
858,339
|
|
861,251
|
|
646,156
|
|
636,705
|
|
446,079
|
|
443,017
|
|
|||||||||||
|
Collateralized loan obligations
|
487,678
|
|
487,296
|
|
309,615
|
|
306,877
|
|
174,767
|
|
174,332
|
|
|||||||||||
|
Non-mortgage asset-backed securities
|
187,660
|
|
186,736
|
|
54,981
|
|
56,500
|
|
96,250
|
|
100,068
|
|
|||||||||||
|
Preferred stocks
|
76,180
|
|
88,203
|
|
75,742
|
|
83,209
|
|
96,294
|
|
105,442
|
|
|||||||||||
|
State and municipal obligations
|
705,884
|
|
698,546
|
|
351,456
|
|
361,753
|
|
15,317
|
|
15,702
|
|
|||||||||||
|
SBA securities
|
517,129
|
|
523,906
|
|
270,553
|
|
273,336
|
|
298,424
|
|
308,728
|
|
|||||||||||
|
Other debt securities
|
3,999
|
|
8,091
|
|
3,854
|
|
7,987
|
|
3,712
|
|
8,128
|
|
|||||||||||
|
$
|
5,996,203
|
|
$
|
6,073,584
|
|
$
|
4,791,284
|
|
$
|
4,859,539
|
|
$
|
4,474,490
|
|
$
|
4,585,694
|
|
||||||
Our investment strategy has focused on insuring adequate liquidity, adding a suitable balance of high credit quality, diversifying assets to the consolidated balance sheet, managing interest rate risk, and generating acceptable returns given our established risk parameters. We have sought to maintain liquidity by investing a significant portion of the portfolio in high quality liquid securities including U.S. Treasury securities, SBA securities and U.S. Government agency MBS. Investment grade municipal securities provide liquidity along with higher tax-equivalent yields at longer durations than the portfolio in general. We have also invested in highly rated structured products that, while somewhat less liquid, provide us with attractive yields. Relatively short effective portfolio duration helps mitigate interest rate risk arising from the currently low level of market interest rates. The weighted average expected life of the investment portfolio as of
December 31, 2016
was
5.0
years and the effective duration was
1.7
years.
As discussed above in the section entitled “Results of Operations - Termination of the Commercial Shared-Loss
Agreement”, FDIC loss sharing on investment securities acquired in the FSB Acquisition ended in May 2014. The terms of the
Commercial Shared-Loss Agreement continue to require sharing with the FDIC of any realized gains from the sale of covered
investment securities through May 2017. Securities formerly covered under the Commercial Shared-Loss Agreement include
private label residential mortgage-backed securities, trust preferred collateralized debt obligations, U.S. Government sponsored enterprise preferred stocks and corporate debt securities with an aggregate fair value of
$130 million
and gross unrealized gains of
$55 million
at
December 31, 2016
. Gross unrealized losses on this portfolio segment were de minimis at
December 31, 2016
.
49
A summary of activity in the investment securities available for sale portfolio for the year ended
December 31, 2016
follows (in thousands):
|
Balance, beginning of period
|
$
|
4,859,539
|
|
|
Purchases
|
3,058,106
|
|
|
|
Repayments
|
(726,480
|
)
|
|
|
Sales, maturities and calls
|
(1,113,522
|
)
|
|
|
Amortization of discounts and premiums, net
|
(13,186
|
)
|
|
|
Change in unrealized gains
|
9,127
|
|
|
|
Balance, end of period
|
$
|
6,073,584
|
|
The following table shows the scheduled maturities, carrying values and current yields for investment securities available for sale as of
December 31, 2016
. Scheduled maturities have been adjusted for anticipated prepayments of MBS and other pass through securities. Yields on tax-exempt securities have been calculated on a tax-equivalent basis (dollars in thousands):
|
|
Within One Year
|
After One Year
Through Five Years
|
After Five Years
Through Ten Years
|
After Ten Years
|
Total
|
|||||||||||||||||||||||||||||
|
|
Carrying
Value
|
Weighted
Average
Yield
|
Carrying
Value
|
Weighted
Average
Yield
|
Carrying
Value
|
Weighted
Average
Yield
|
Carrying
Value
|
Weighted
Average
Yield
|
Carrying
Value
|
Weighted
Average
Yield
|
||||||||||||||||||||||||
|
U.S. Treasury securities
|
$
|
5,005
|
|
0.92
|
%
|
$
|
—
|
|
—
|
%
|
$
|
—
|
|
—
|
%
|
$
|
—
|
|
—
|
%
|
$
|
5,005
|
|
0.92
|
%
|
|||||||||
|
U.S. Government agency and sponsored enterprise residential MBS
|
251,657
|
|
3.03
|
%
|
514,894
|
|
2.39
|
%
|
572,149
|
|
1.74
|
%
|
188,542
|
|
1.75
|
%
|
1,527,242
|
|
2.17
|
%
|
||||||||||||||
|
U.S. Government agency and sponsored enterprise commercial MBS
|
7,125
|
|
2.87
|
%
|
36,940
|
|
2.88
|
%
|
64,779
|
|
3.02
|
%
|
15,742
|
|
2.81
|
%
|
124,586
|
|
2.94
|
%
|
||||||||||||||
|
Re-Remics
|
—
|
|
—
|
%
|
—
|
|
—
|
%
|
—
|
|
—
|
%
|
—
|
|
—
|
%
|
—
|
|
—
|
%
|
||||||||||||||
|
Private label residential MBS and CMOs
|
87,176
|
|
5.19
|
%
|
194,698
|
|
5.30
|
%
|
69,301
|
|
6.61
|
%
|
23,923
|
|
12.37
|
%
|
375,098
|
|
5.83
|
%
|
||||||||||||||
|
Private label commercial MBS
|
128,802
|
|
3.13
|
%
|
786,596
|
|
3.31
|
%
|
268,279
|
|
3.15
|
%
|
3,947
|
|
3.08
|
%
|
1,187,624
|
|
3.25
|
%
|
||||||||||||||
|
Single family rental real estate-backed securities
|
2,121
|
|
2.73
|
%
|
835,067
|
|
2.53
|
%
|
24,063
|
|
3.70
|
%
|
—
|
|
—
|
%
|
861,251
|
|
2.56
|
%
|
||||||||||||||
|
Collateralized loan obligations
|
—
|
|
—
|
%
|
360,230
|
|
2.97
|
%
|
127,066
|
|
3.46
|
%
|
—
|
|
—
|
%
|
487,296
|
|
3.10
|
%
|
||||||||||||||
|
Non-mortgage asset-backed securities
|
11,696
|
|
3.48
|
%
|
166,171
|
|
2.85
|
%
|
8,869
|
|
4.46
|
%
|
—
|
|
—
|
%
|
186,736
|
|
2.96
|
%
|
||||||||||||||
|
State and municipal obligations
|
—
|
|
—
|
%
|
24,970
|
|
3.03
|
%
|
673,576
|
|
4.49
|
%
|
—
|
|
—
|
%
|
698,546
|
|
4.44
|
%
|
||||||||||||||
|
SBA securities
|
81,000
|
|
2.09
|
%
|
223,985
|
|
2.06
|
%
|
133,119
|
|
2.03
|
%
|
85,802
|
|
2.00
|
%
|
523,906
|
|
2.05
|
%
|
||||||||||||||
|
Other debt securities
|
—
|
|
—
|
%
|
—
|
|
—
|
%
|
—
|
|
—
|
%
|
8,091
|
|
8.49
|
%
|
8,091
|
|
8.49
|
%
|
||||||||||||||
|
$
|
574,582
|
|
3.22
|
%
|
$
|
3,143,551
|
|
2.91
|
%
|
$
|
1,941,201
|
|
3.26
|
%
|
$
|
326,047
|
|
2.50
|
%
|
5,985,381
|
|
3.03
|
%
|
|||||||||||
|
Preferred stocks with no scheduled maturity
|
|
|
|
|
|
|
|
|
|
|
|
|
|
|
|
|
88,203
|
|
8.97
|
%
|
||||||||||||||
|
Total investment securities available for sale
|
|
|
|
|
|
|
|
|
|
|
|
|
|
|
|
|
$
|
6,073,584
|
|
3.12
|
%
|
|||||||||||||
The available for sale investment securities portfolio was in a net unrealized gain position of
$77.4 million
at
December 31, 2016
with aggregate fair value equal to
101.3%
of amortized cost. Net unrealized gains included
$103.8 million
of gross unrealized gains and
$26.4 million
of gross unrealized losses. Investment securities available for sale in an unrealized loss position at
December 31, 2016
had an aggregate fair value of
$1.9 billion
. At
December 31, 2016
,
91.4%
of investment securities available for sale were backed by the U.S. Government, U.S. Government agencies or sponsored enterprises or were rated AAA or AA, based on the most recent third-party ratings. Investment securities available for sale totaling
$72 million
were rated below investment grade or not rated at
December 31, 2016
, all of which were acquired in the FSB Acquisition and substantially all of which were in unrealized gain positions at
December 31, 2016
.
We evaluate the credit quality of individual securities in the portfolio quarterly to determine whether any of the investments in unrealized loss positions are other-than-temporarily impaired. This evaluation considers, but is not necessarily limited to, the following factors, the relative significance of which varies depending on the circumstances pertinent to each individual security:
|
•
|
our intent to hold the security until maturity or for a period of time sufficient for a recovery in value;
|
50
|
•
|
whether it is more likely than not that we will be required to sell the security prior to recovery of its amortized cost basis;
|
|
•
|
the length of time and extent to which fair value has been less than amortized cost;
|
|
•
|
adverse changes in expected cash flows;
|
|
•
|
collateral values and performance;
|
|
•
|
the payment structure of the security, including levels of subordination or over-collateralization;
|
|
•
|
changes in the economic or regulatory environment;
|
|
•
|
the general market condition of the geographic area or industry of the issuer;
|
|
•
|
the issuer’s financial condition, performance and business prospects; and
|
|
•
|
changes in credit ratings.
|
The Company recognized OTTI in the amount of
$463 thousand
on two positions in one private label commercial MBS security, which was determined to be other-than-temporarily impaired during the
year ended December 31, 2016
. This security was sold prior to the end of the year. No securities were determined to be other-than-temporarily impaired during the years ended
December 31, 2015
or
2014
.
We do not intend to sell securities in significant unrealized loss positions at
December 31, 2016
. Based on an assessment of our liquidity position and internal and regulatory guidelines for permissible investments and concentrations, it is not more likely than not that we will be required to sell securities in significant unrealized loss positions prior to recovery of amortized cost basis. The severity of impairment of individual securities in the portfolio is generally not material. For fixed rate securities, unrealized losses in the portfolio at
December 31, 2016
were primarily attributable to an increase in market interest rates and widening credit spreads subsequent to the date the securities were acquired. For variable rate securities, unrealized losses were primarily due to widening credit spreads and, for certain securities, increased extension risk.
The timely repayment of principal and interest on U.S. Government agency and sponsored enterprise securities in unrealized loss positions is explicitly or implicitly guaranteed by the full faith and credit of the U.S. Government. Management performed projected cash flow analyses of the private label residential MBS and CMOs, private label commercial MBS and non-mortgage asset-backed securities in unrealized loss positions, incorporating CUSIP level assumptions consistent with the collateral characteristics of each security including collateral default rate, voluntary prepayment rate, severity and delinquency assumptions. Based on the results of this analysis, no credit losses were projected. Management's analysis of the credit characteristics of individual securities and the underlying collateral and levels of subordination for each of the single family rental real estate-backed securities and collateralized loan obligations in unrealized loss positions is not indicative of projected credit losses. Management's analysis of the state and municipal obligations in unrealized loss positions included reviewing the ratings of the securities and the results of credit surveillance performed by an independent third party. Given the expectation of timely repayment of principal and interest and the generally limited severity of impairment, the impairments were considered to be temporary.
For further discussion of our analysis of investment securities for OTTI, see
Note 4
to the consolidated financial statements.
We use third-party pricing services to assist us in estimating the fair value of investment securities. We perform a variety of procedures to ensure that we have a thorough understanding of the methodologies and assumptions used by the pricing services including obtaining and reviewing written documentation of the methods and assumptions employed, conducting interviews with valuation desk personnel and reviewing model results and detailed assumptions used to value selected securities as considered necessary. Our classification of prices within the fair value hierarchy is based on an evaluation of the nature of the significant assumptions impacting the valuation of each type of security in the portfolio. We have established a robust price challenge process that includes a review by our treasury front office of all prices provided on a monthly basis. Any price evidencing unexpected month over month fluctuations or deviations from our expectations based on recent observed trading activity and other information available in the marketplace that would impact the value of the security is challenged. Responses to the price challenges, which generally include specific information about inputs and assumptions incorporated in the valuation and their sources, are reviewed in detail. If considered necessary to resolve any discrepancies, a price will be obtained from an additional independent valuation specialist. We do not typically adjust the prices provided, other than through this established challenge process. Our primary pricing services utilize observable inputs when available, and employ unobservable inputs and proprietary models only when observable inputs are not available. As a matter of course, the services validate prices
51
by comparison to recent trading activity whenever such activity exists. Quotes obtained from the pricing services are typically non-binding.
We have also established a quarterly price validation process to assess the propriety of the pricing methodologies utilized by our primary pricing services by independently verifying the prices of a sample of securities in the portfolio. Sample sizes vary based on the type of security being priced, with higher sample sizes applied to more difficult to value security types. Verification procedures may consist of obtaining prices from an additional outside source or internal modeling, generally based on Intex. We have established acceptable percentage deviations from the price provided by the initial pricing source. If deviations fall outside the established parameters, we will obtain and evaluate more detailed information about the assumptions and inputs used by each pricing source or, if considered necessary, employ an additional valuation specialist to price the security in question. Pricing issues identified through this evaluation are addressed with the applicable pricing service and methodologies or inputs are revised as determined necessary. Depending on the results of the validation process, sample sizes may be extended for particular classes of securities. Results of the validation process are reviewed by the treasury front office and by senior management.
The majority of our investment securities are classified within level 2 of the fair value hierarchy. U.S. Treasury securities and certain preferred stocks are classified within level 1 of the hierarchy. At
December 31, 2016
and
2015
,
2.1%
and
3.0%
, respectively, of our investment securities were classified within level 3 of the fair value hierarchy. Securities classified within level 3 of the hierarchy at
December 31, 2016
included certain private label residential MBS and trust preferred securities. These securities were classified within level 3 of the hierarchy because proprietary assumptions related to voluntary prepayment rates, default probabilities, loss severities and discount rates were considered significant to the valuation. There were no transfers of investment securities between levels of the fair value hierarchy during the years ended
December 31, 2016
and
2015
.
For additional discussion of the fair values of investment securities, see
Note 16
to the consolidated financial statements.
Loans Held for Sale
Loans held for sale at
December 31, 2016
included
$41.2 million
of commercial loans originated by SBF with the intent to sell in the secondary market. Commercial loans held for sale are comprised of the portion of loans guaranteed by U.S. government agencies. Loans are generally sold with servicing retained. Servicing activity did not have a material impact on the results of operations for the years ended
December 31, 2016
,
2015
and
2014
. We anticipate growth in loan sales and servicing and related revenue from SBF in the future.
Loans
The loan portfolio comprises the Company’s primary interest-earning asset and consists of "new loans", which are loans originated or purchased subsequent to the FSB Acquisition, as well as loans acquired in the FSB Acquisition. Loans acquired in the FSB Acquisition are further segregated between ACI loans, or those acquired with evidence of deterioration in credit quality since origination and non-ACI loans, or those acquired without evidence of deterioration in credit quality since origination. Residential loans acquired in the FSB Acquisition are covered under the Single Family Shared Loss Agreement and are referred to as covered loans. Effective May, 2014, commercial and consumer loans acquired in the FSB Acquisition are no longer covered under the Loss Sharing Agreements.
52
The following tables show the composition of the loan portfolio and the breakdown of the portfolio among new loans, non-covered ACI loans, covered ACI loans and covered non-ACI loans at December 31 of the years indicated (dollars in thousands):
|
2016
|
||||||||||||||||||||||
|
|
Non-Covered Loans
|
Covered Loans
|
|
Percent of Total
|
||||||||||||||||||
|
|
New Loans
|
ACI
|
ACI
|
Non-ACI
|
Total
|
|||||||||||||||||
|
Residential:
|
|
|
|
|
|
|
|
|
|
|
|
|
||||||||||
|
1-4 single family residential
|
$
|
3,422,425
|
|
$
|
—
|
|
$
|
532,348
|
|
$
|
36,675
|
|
$
|
3,991,448
|
|
20.6
|
%
|
|||||
|
Home equity loans and lines of credit
|
1,120
|
|
—
|
|
3,894
|
|
47,629
|
|
52,643
|
|
0.3
|
%
|
||||||||||
|
|
3,423,545
|
|
—
|
|
536,242
|
|
84,304
|
|
4,044,091
|
|
20.9
|
%
|
||||||||||
|
Commercial:
|
||||||||||||||||||||||
|
Multi-family
|
3,801,864
|
|
23,109
|
|
—
|
|
—
|
|
3,824,973
|
|
19.8
|
%
|
||||||||||
|
Commercial real estate
|
||||||||||||||||||||||
|
Owner occupied
|
1,726,846
|
|
10,012
|
|
—
|
|
—
|
|
1,736,858
|
|
9.0
|
%
|
||||||||||
|
Non-owner occupied
|
3,726,260
|
|
12,975
|
|
—
|
|
—
|
|
3,739,235
|
|
19.3
|
%
|
||||||||||
|
Construction and land
|
311,436
|
|
—
|
|
—
|
|
—
|
|
311,436
|
|
1.6
|
%
|
||||||||||
|
Commercial and industrial
|
3,390,772
|
|
842
|
|
—
|
|
—
|
|
3,391,614
|
|
17.5
|
%
|
||||||||||
|
Commercial lending subsidiaries
|
2,280,685
|
|
—
|
|
—
|
|
—
|
|
2,280,685
|
|
11.8
|
%
|
||||||||||
|
|
15,237,863
|
|
46,938
|
|
—
|
|
—
|
|
15,284,801
|
|
79.0
|
%
|
||||||||||
|
Consumer
|
24,358
|
|
7
|
|
—
|
|
—
|
|
24,365
|
|
0.1
|
%
|
||||||||||
|
Total loans
|
18,685,766
|
|
46,945
|
|
536,242
|
|
84,304
|
|
19,353,257
|
|
100.0
|
%
|
||||||||||
|
Premiums, discounts and deferred fees and costs, net
|
48,641
|
|
—
|
|
—
|
|
(6,504
|
)
|
42,137
|
|
||||||||||||
|
Loans including premiums, discounts and deferred fees and costs
|
18,734,407
|
|
46,945
|
|
536,242
|
|
77,800
|
|
19,395,394
|
|
||||||||||||
|
Allowance for loan and lease losses
|
(150,853
|
)
|
—
|
|
—
|
|
(2,100
|
)
|
(152,953
|
)
|
||||||||||||
|
Loans, net
|
$
|
18,583,554
|
|
$
|
46,945
|
|
$
|
536,242
|
|
$
|
75,700
|
|
$
|
19,242,441
|
|
|||||||
53
|
2015
|
||||||||||||||||||||||
|
|
Non-Covered Loans
|
Covered Loans
|
|
Percent of Total
|
||||||||||||||||||
|
|
New Loans
|
ACI
|
ACI
|
Non-ACI
|
Total
|
|||||||||||||||||
|
Residential:
|
|
|
|
|
|
|
|
|
|
|
|
|
||||||||||
|
1-4 single family residential
|
$
|
2,883,470
|
|
$
|
—
|
|
$
|
699,039
|
|
$
|
46,110
|
|
$
|
3,628,619
|
|
21.9
|
%
|
|||||
|
Home equity loans and lines of credit
|
806
|
|
—
|
|
4,831
|
|
67,493
|
|
73,130
|
|
0.4
|
%
|
||||||||||
|
|
2,884,276
|
|
—
|
|
703,870
|
|
113,603
|
|
3,701,749
|
|
22.3
|
%
|
||||||||||
|
Commercial:
|
||||||||||||||||||||||
|
Multi-family
|
3,447,526
|
|
24,636
|
|
—
|
|
—
|
|
3,472,162
|
|
20.9
|
%
|
||||||||||
|
Commercial real estate
|
||||||||||||||||||||||
|
Owner occupied
|
1,338,184
|
|
16,567
|
|
—
|
|
—
|
|
1,354,751
|
|
8.2
|
%
|
||||||||||
|
Non-owner occupied
|
2,885,226
|
|
25,101
|
|
—
|
|
—
|
|
2,910,327
|
|
17.5
|
%
|
||||||||||
|
Construction and land
|
347,676
|
|
—
|
|
—
|
|
—
|
|
347,676
|
|
2.1
|
%
|
||||||||||
|
Commercial and industrial
|
2,769,813
|
|
1,062
|
|
—
|
|
—
|
|
2,770,875
|
|
16.7
|
%
|
||||||||||
|
Commercial lending subsidiaries
|
2,003,984
|
|
—
|
|
—
|
|
—
|
|
2,003,984
|
|
12.1
|
%
|
||||||||||
|
|
12,792,409
|
|
67,366
|
|
—
|
|
—
|
|
12,859,775
|
|
77.5
|
%
|
||||||||||
|
Consumer
|
35,173
|
|
10
|
|
—
|
|
—
|
|
35,183
|
|
0.2
|
%
|
||||||||||
|
Total loans
|
15,711,858
|
|
67,376
|
|
703,870
|
|
113,603
|
|
16,596,707
|
|
100.0
|
%
|
||||||||||
|
Premiums, discounts and deferred fees and costs, net
|
47,829
|
|
—
|
|
—
|
|
(7,933
|
)
|
39,896
|
|
||||||||||||
|
Loans including premiums, discounts and deferred fees and costs
|
15,759,687
|
|
67,376
|
|
703,870
|
|
105,670
|
|
16,636,603
|
|
||||||||||||
|
Allowance for loan and lease losses
|
(120,960
|
)
|
—
|
|
—
|
|
(4,868
|
)
|
(125,828
|
)
|
||||||||||||
|
Loans, net
|
$
|
15,638,727
|
|
$
|
67,376
|
|
$
|
703,870
|
|
$
|
100,802
|
|
$
|
16,510,775
|
|
|||||||
|
|
2014
|
|||||||||||||||||||||
|
|
Non-Covered Loans
|
Covered Loans
|
|
Percent of Total
|
||||||||||||||||||
|
|
New Loans
|
ACI
|
ACI
|
Non-ACI
|
Total
|
|||||||||||||||||
|
Residential:
|
||||||||||||||||||||||
|
1-4 single family residential
|
$
|
2,486,272
|
|
$
|
—
|
|
$
|
874,522
|
|
$
|
56,138
|
|
$
|
3,416,932
|
|
27.6
|
%
|
|||||
|
Home equity loans and lines of credit
|
1,827
|
|
—
|
|
22,657
|
|
101,142
|
|
125,626
|
|
1.0
|
%
|
||||||||||
|
2,488,099
|
|
—
|
|
897,179
|
|
157,280
|
|
3,542,558
|
|
28.6
|
%
|
|||||||||||
|
Commercial:
|
||||||||||||||||||||||
|
Multi-family
|
1,927,225
|
|
24,964
|
|
—
|
|
—
|
|
1,952,189
|
|
15.8
|
%
|
||||||||||
|
Commercial real estate
|
||||||||||||||||||||||
|
Owner occupied
|
1,008,930
|
|
34,440
|
|
—
|
|
—
|
|
1,043,370
|
|
8.4
|
%
|
||||||||||
|
Non-owner occupied
|
1,753,317
|
|
30,762
|
|
—
|
|
—
|
|
1,784,079
|
|
14.4
|
%
|
||||||||||
|
Construction and land
|
167,713
|
|
2,007
|
|
—
|
|
—
|
|
169,720
|
|
1.4
|
%
|
||||||||||
|
Commercial and industrial
|
2,402,064
|
|
1,229
|
|
—
|
|
—
|
|
2,403,293
|
|
19.4
|
%
|
||||||||||
|
Commercial lending subsidiaries
|
1,456,751
|
|
—
|
|
—
|
|
—
|
|
1,456,751
|
|
11.8
|
%
|
||||||||||
|
8,716,000
|
|
93,402
|
|
—
|
|
—
|
|
8,809,402
|
|
71.2
|
%
|
|||||||||||
|
Consumer
|
26,293
|
|
14
|
|
—
|
|
—
|
|
26,307
|
|
0.2
|
%
|
||||||||||
|
Total loans
|
11,230,392
|
|
93,416
|
|
897,179
|
|
157,280
|
|
12,378,267
|
|
100.0
|
%
|
||||||||||
|
Premiums, discounts and deferred fees and costs, net
|
47,097
|
|
—
|
|
—
|
|
(10,595
|
)
|
36,502
|
|
||||||||||||
|
Loans including premiums, discounts and deferred fees and costs
|
11,277,489
|
|
93,416
|
|
897,179
|
|
146,685
|
|
12,414,769
|
|
|
|
||||||||||
|
Allowance for loan and lease losses
|
(91,350
|
)
|
—
|
|
—
|
|
(4,192
|
)
|
(95,542
|
)
|
||||||||||||
|
Loans, net
|
$
|
11,186,139
|
|
$
|
93,416
|
|
$
|
897,179
|
|
$
|
142,493
|
|
$
|
12,319,227
|
|
|||||||
54
|
|
2013
|
|||||||||||||||||||||
|
|
Non-Covered Loans
|
Covered Loans
|
|
Percent of Total
|
||||||||||||||||||
|
|
New Loans
|
ACI
|
ACI
|
Non-ACI
|
Total
|
|||||||||||||||||
|
Residential:
|
||||||||||||||||||||||
|
1-4 single family residential
|
$
|
1,800,332
|
|
$
|
—
|
|
$
|
1,057,012
|
|
$
|
70,378
|
|
$
|
2,927,722
|
|
32.4
|
%
|
|||||
|
Home equity loans and lines of credit
|
1,535
|
|
—
|
|
39,602
|
|
127,807
|
|
168,944
|
|
1.9
|
%
|
||||||||||
|
1,801,867
|
|
—
|
|
1,096,614
|
|
198,185
|
|
3,096,666
|
|
34.3
|
%
|
|||||||||||
|
Commercial:
|
||||||||||||||||||||||
|
Multi-family
|
1,097,872
|
|
8,093
|
|
33,354
|
|
—
|
|
1,139,319
|
|
12.6
|
%
|
||||||||||
|
Commercial real estate
|
||||||||||||||||||||||
|
Owner occupied
|
712,844
|
|
5,318
|
|
49,861
|
|
689
|
|
768,712
|
|
8.5
|
%
|
||||||||||
|
Non-owner occupied
|
946,543
|
|
1,449
|
|
93,089
|
|
52
|
|
1,041,133
|
|
11.5
|
%
|
||||||||||
|
Construction and land
|
138,091
|
|
—
|
|
10,600
|
|
729
|
|
149,420
|
|
1.7
|
%
|
||||||||||
|
Commercial and industrial
|
1,651,739
|
|
—
|
|
6,050
|
|
6,234
|
|
1,664,023
|
|
18.5
|
%
|
||||||||||
|
Commercial lending subsidiaries
|
952,050
|
|
—
|
|
—
|
|
—
|
|
952,050
|
|
10.5
|
%
|
||||||||||
|
5,499,139
|
|
14,860
|
|
192,954
|
|
7,704
|
|
5,714,657
|
|
63.3
|
%
|
|||||||||||
|
Consumer
|
213,107
|
|
—
|
|
1,679
|
|
—
|
|
214,786
|
|
2.4
|
%
|
||||||||||
|
Total loans
|
7,514,113
|
|
14,860
|
|
1,291,247
|
|
205,889
|
|
9,026,109
|
|
100.0
|
%
|
||||||||||
|
Premiums, discounts and deferred fees and costs, net
|
40,748
|
|
—
|
|
—
|
|
(13,248
|
)
|
27,500
|
|
||||||||||||
|
Loans net of premiums, discounts and deferred fees and costs
|
7,554,861
|
|
14,860
|
|
1,291,247
|
|
192,641
|
|
9,053,609
|
|
||||||||||||
|
Allowance for loan and lease losses
|
(57,330
|
)
|
—
|
|
(2,893
|
)
|
(9,502
|
)
|
(69,725
|
)
|
||||||||||||
|
Loans, net
|
$
|
7,497,531
|
|
$
|
14,860
|
|
$
|
1,288,354
|
|
$
|
183,139
|
|
$
|
8,983,884
|
|
|||||||
|
|
2012
|
|||||||||||||||||||||
|
|
Non-Covered Loans
|
Covered Loans
|
|
Percent of Total
|
||||||||||||||||||
|
|
New Loans
|
ACI
|
ACI
|
Non-ACI
|
Total
|
|||||||||||||||||
|
Residential:
|
||||||||||||||||||||||
|
1-4 single family residential
|
$
|
920,713
|
|
$
|
—
|
|
$
|
1,300,109
|
|
$
|
93,438
|
|
$
|
2,314,260
|
|
41.5
|
%
|
|||||
|
Home equity loans and lines of credit
|
1,954
|
|
—
|
|
52,499
|
|
157,691
|
|
212,144
|
|
3.8
|
%
|
||||||||||
|
922,667
|
|
—
|
|
1,352,608
|
|
251,129
|
|
2,526,404
|
|
45.3
|
%
|
|||||||||||
|
Commercial:
|
||||||||||||||||||||||
|
Multi-family
|
307,183
|
|
—
|
|
56,148
|
|
716
|
|
364,047
|
|
6.5
|
%
|
||||||||||
|
Commercial real estate
|
||||||||||||||||||||||
|
Owner occupied
|
451,130
|
|
4,087
|
|
58,675
|
|
850
|
|
514,742
|
|
9.3
|
%
|
||||||||||
|
Non-owner occupied
|
343,576
|
|
—
|
|
115,057
|
|
60
|
|
458,693
|
|
8.2
|
%
|
||||||||||
|
Construction and land
|
72,361
|
|
—
|
|
18,064
|
|
829
|
|
91,254
|
|
1.6
|
%
|
||||||||||
|
Commercial and industrial
|
1,105,938
|
|
—
|
|
14,608
|
|
11,627
|
|
1,132,173
|
|
20.3
|
%
|
||||||||||
|
Commercial lending subsidiaries
|
455,033
|
|
—
|
|
—
|
|
—
|
|
455,033
|
|
8.2
|
%
|
||||||||||
|
2,735,221
|
|
4,087
|
|
262,552
|
|
14,082
|
|
3,015,942
|
|
54.1
|
%
|
|||||||||||
|
Consumer
|
33,526
|
|
—
|
|
2,239
|
|
—
|
|
35,765
|
|
0.6
|
%
|
||||||||||
|
Total loans
|
3,691,414
|
|
4,087
|
|
1,617,399
|
|
265,211
|
|
5,578,111
|
|
100.0
|
%
|
||||||||||
|
Premiums, discounts and deferred fees and costs, net
|
11,863
|
|
—
|
|
—
|
|
(18,235
|
)
|
(6,372
|
)
|
||||||||||||
|
Loans net of premiums, discounts and deferred fees and costs
|
3,703,277
|
|
4,087
|
|
1,617,399
|
|
246,976
|
|
5,571,739
|
|
||||||||||||
|
Allowance for loan and lease losses
|
(41,228
|
)
|
—
|
|
(8,019
|
)
|
(9,874
|
)
|
(59,121
|
)
|
||||||||||||
|
Loans, net
|
$
|
3,662,049
|
|
$
|
4,087
|
|
$
|
1,609,380
|
|
$
|
237,102
|
|
$
|
5,512,618
|
|
|||||||
55
The following graph shows the trend of loans acquired in the FSB Acquisition as a percentage of the total loan portfolio as of
December 31, 2016
,
2015
,
2014
,
2013
and
2012
. As indicated, loans acquired in the FSB Acquisition, the substantial majority of which are covered loans, are declining and new loans increasing as a percentage of the total portfolio as loans acquired in the FSB Acquisition are repaid or resolved and new loan originations and purchases continue. This trend is expected to continue.
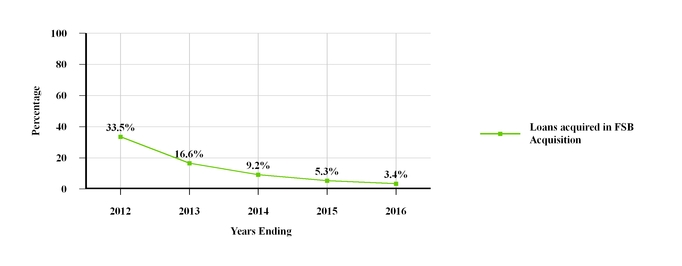
Total loans, including premiums, discounts and deferred fees and costs, increased by
$2.8 billion
to
$19.4 billion
at
December 31, 2016
, from
$16.6 billion
at
December 31, 2015
. New loans grew by
$3.0 billion
while loans acquired in the FSB Acquisition declined by
$216 million
from
December 31, 2015
to
December 31, 2016
. New residential loans grew by
$546 million
and new commercial loans grew by
$2.4 billion
during the
year ended
December 31, 2016
.
Growth in new loans, including premiums, discounts and deferred fees and costs, for the
year ended
December 31, 2016
included
$985 million
for the Florida franchise,
$878 million
for the New York franchise and
$1.1 billion
for the national platforms.
The following tables show the composition of the new loan portfolio and the breakdown among the Florida and New York franchises and national platforms at
December 31, 2016
and
2015
. Amounts include premiums, discounts and deferred fees and costs (dollars in thousands):
|
2016
|
|||||||||||||||
|
Florida
|
New York
|
National
|
Total
|
||||||||||||
|
Residential
|
$
|
231,237
|
|
$
|
224,750
|
|
$
|
3,015,482
|
|
$
|
3,471,469
|
|
|||
|
Commercial:
|
|||||||||||||||
|
Multi-family
|
497,154
|
|
3,309,411
|
|
—
|
|
3,806,565
|
|
|||||||
|
Commercial real estate
|
|||||||||||||||
|
Owner occupied
|
1,032,429
|
|
602,155
|
|
91,254
|
|
1,725,838
|
|
|||||||
|
Non-owner occupied
|
2,324,831
|
|
1,294,231
|
|
99,771
|
|
3,718,833
|
|
|||||||
|
Construction and land
|
174,494
|
|
125,983
|
|
10,436
|
|
310,913
|
|
|||||||
|
Commercial and industrial
|
2,233,551
|
|
806,660
|
|
346,085
|
|
3,386,296
|
|
|||||||
|
Commercial lending subsidiaries
|
—
|
|
—
|
|
2,290,194
|
|
2,290,194
|
|
|||||||
|
Consumer
|
22,895
|
|
1,404
|
|
—
|
|
24,299
|
|
|||||||
|
$
|
6,516,591
|
|
$
|
6,364,594
|
|
$
|
5,853,222
|
|
$
|
18,734,407
|
|
||||
|
34.8
|
%
|
34.0
|
%
|
31.2
|
%
|
100.0
|
%
|
||||||||
56
|
2015
|
|||||||||||||||
|
Florida
|
New York
|
National
|
Total
|
||||||||||||
|
Residential
|
$
|
246,751
|
|
$
|
228,741
|
|
$
|
2,449,935
|
|
$
|
2,925,427
|
|
|||
|
Commercial:
|
|||||||||||||||
|
Multi-family
|
500,400
|
|
2,951,573
|
|
—
|
|
3,451,973
|
|
|||||||
|
Commercial real estate
|
|||||||||||||||
|
Owner occupied
|
840,364
|
|
418,935
|
|
79,648
|
|
1,338,947
|
|
|||||||
|
Non-owner occupied
|
1,715,352
|
|
1,086,224
|
|
78,541
|
|
2,880,117
|
|
|||||||
|
Construction and land
|
224,259
|
|
106,973
|
|
15,739
|
|
346,971
|
|
|||||||
|
Commercial and industrial
|
1,974,179
|
|
688,691
|
|
105,658
|
|
2,768,528
|
|
|||||||
|
Commercial lending subsidiaries
|
—
|
|
—
|
|
2,012,646
|
|
2,012,646
|
|
|||||||
|
Consumer
|
29,820
|
|
5,258
|
|
—
|
|
35,078
|
|
|||||||
|
$
|
5,531,125
|
|
$
|
5,486,395
|
|
$
|
4,742,167
|
|
$
|
15,759,687
|
|
||||
|
35.1
|
%
|
34.8
|
%
|
30.1
|
%
|
100.0
|
%
|
||||||||
Residential Mortgages
Residential mortgages totaled
$4.0 billion
, or
20.9%
of total loans, at
December 31, 2016
and
$3.7 billion
, or
22.3%
of total loans, at
December 31, 2015
.
The new residential loan portfolio is primarily comprised of loans purchased on a national basis through established correspondent channels. The portfolio also includes loans originated through retail channels in our Florida and New York geographic footprint. In January 2016, we terminated our retail residential mortgage origination business. New residential mortgage loans are primarily closed-end, first lien jumbo mortgages for the purchase or re-finance of owner occupied property. The loans have terms ranging from 10 to 30 years, with either fixed or adjustable interest rates. At
December 31, 2016
,
$133 million
or
3.8%
of new residential mortgage loans were interest-only loans, substantially all of which begin amortizing 10 years after origination.
The following table presents a breakdown of the 1-4 single family residential mortgage portfolio categorized between fixed rate loans and ARMs at
December 31, 2016
and
2015
. Amounts are net of premiums, discounts and deferred fees and costs (dollars in thousands):
|
2016
|
||||||||||||||
|
New Loans
|
Covered
Loans |
Total
|
Percent of
Total |
|||||||||||
|
1 - 4 single family residential loans:
|
||||||||||||||
|
Fixed rate loans
|
$
|
1,130,914
|
|
$
|
191,676
|
|
$
|
1,322,590
|
|
32.8
|
%
|
|||
|
ARM Loans
|
2,339,435
|
|
371,477
|
|
2,710,912
|
|
67.2
|
%
|
||||||
|
$
|
3,470,349
|
|
$
|
563,153
|
|
$
|
4,033,502
|
|
100.0
|
%
|
||||
|
2015
|
||||||||||||||
|
New Loans
|
Covered
Loans |
Total
|
Percent of
Total |
|||||||||||
|
1 - 4 single family residential loans:
|
||||||||||||||
|
Fixed rate loans
|
$
|
997,580
|
|
$
|
304,632
|
|
$
|
1,302,212
|
|
35.6
|
%
|
|||
|
ARM Loans
|
1,927,041
|
|
433,665
|
|
2,360,706
|
|
64.4
|
%
|
||||||
|
$
|
2,924,621
|
|
$
|
738,297
|
|
$
|
3,662,918
|
|
100.0
|
%
|
||||
We do not originate or acquire option ARMs, “no-doc” or “reduced-doc” mortgages and do not utilize wholesale mortgage origination channels although the covered loan portfolio contains loans with these characteristics. Included in ARM loans above are payment option ARMs representing
50.2%
and
49.5%
of total covered ARM loans outstanding as of
December 31, 2016
and
2015
, respectively, based on UPB. All of the option ARMs are covered loans and the substantial majority are ACI loans. The ACI loans are accounted for in accordance with ASC 310-30; therefore, the optionality embedded in these loans does not directly impact the carrying value of the loans or the amount of interest income recognized on them. These features are
57
taken into account in quarterly updates of expected cash flows from these loans. The Company’s exposure to future losses on these mortgage loans is mitigated by the Single Family Shared-Loss Agreement.
The following charts present the distribution of the new 1-4 single family residential mortgage portfolio by interest rate terms and contractual lives at
December 31, 2016
and
2015
:
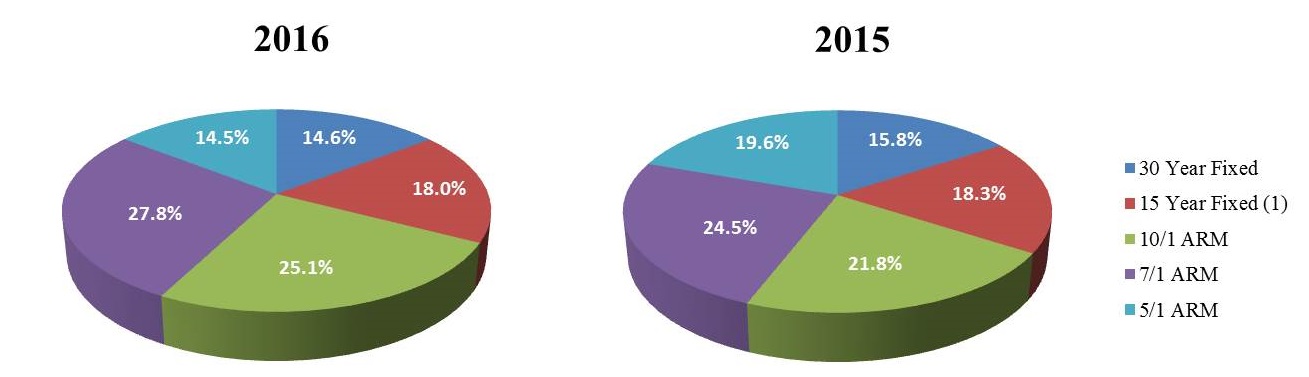
|
(1)
|
Fixed-rate loans with contractual terms of 20 years comprise less than 3% of the total at both
December 31, 2016
and
2015
, and are reported with 15 year fixed above.
|
The geographic concentration of the 1-4 single family residential portfolio is summarized as follows at
December 31, 2016
and
2015
(dollar in thousands):
|
|
2016
|
||||||||||||||||
|
|
Percent of Total
|
||||||||||||||||
|
New Loans
|
Covered Loans
|
Total
|
New Loans
|
Total Loans
|
|||||||||||||
|
California
|
$
|
904,107
|
|
$
|
37,330
|
|
$
|
941,437
|
|
26.1
|
%
|
23.3
|
%
|
||||
|
Florida
|
487,294
|
|
300,198
|
|
787,492
|
|
14.0
|
%
|
19.5
|
%
|
|||||||
|
New York
|
763,824
|
|
16,403
|
|
780,227
|
|
22.0
|
%
|
19.3
|
%
|
|||||||
|
Virginia
|
152,113
|
|
30,818
|
|
182,931
|
|
4.4
|
%
|
4.5
|
%
|
|||||||
|
Others
(1)
|
1,163,011
|
|
178,404
|
|
1,341,415
|
|
33.5
|
%
|
33.4
|
%
|
|||||||
|
|
$
|
3,470,349
|
|
$
|
563,153
|
|
$
|
4,033,502
|
|
100.0
|
%
|
100.0
|
%
|
||||
|
|
2015
|
||||||||||||||||
|
|
Percent of Total
|
||||||||||||||||
|
New Loans
|
Covered Loans
|
Total
|
New Loans
|
Total Loans
|
|||||||||||||
|
California
|
$
|
948,301
|
|
$
|
53,048
|
|
$
|
1,001,349
|
|
32.4
|
%
|
27.3
|
%
|
||||
|
Florida
|
422,638
|
|
381,897
|
|
804,535
|
|
14.5
|
%
|
22.0
|
%
|
|||||||
|
New York
|
548,181
|
|
23,326
|
|
571,507
|
|
18.7
|
%
|
15.6
|
%
|
|||||||
|
Virginia
|
87,851
|
|
40,329
|
|
128,180
|
|
3.0
|
%
|
3.5
|
%
|
|||||||
|
Others
(1)
|
917,650
|
|
239,697
|
|
1,157,347
|
|
31.4
|
%
|
31.6
|
%
|
|||||||
|
|
$
|
2,924,621
|
|
$
|
738,297
|
|
$
|
3,662,918
|
|
100.0
|
%
|
100.0
|
%
|
||||
|
(1)
|
No other state represented borrowers with more than 4.0% of 1-4 single family residential loans outstanding at
December 31, 2016
or
2015
.
|
Home equity loans and lines of credit are not significant to the new loan portfolio.
Commercial loans
The commercial portfolio segment includes loans secured by multi-family properties, loans secured by both owner-occupied and non-owner occupied commercial real estate, a limited amount of construction and land loans, commercial and industrial loans and direct financing leases.
58
Management’s loan origination strategy is heavily focused on the commercial portfolio segment, which comprised
81.6%
and
81.4%
of new loans as of
December 31, 2016
and
2015
, respectively.
Commercial real estate loans include term loans secured by owner and non-owner occupied income producing properties including rental apartments, mixed-use properties, industrial properties, retail shopping centers, free-standing single-tenant buildings, office buildings, warehouse facilities and hotels as well as real estate secured lines of credit.
The following charts present the distribution of non owner-occupied commercial real estate by product types at
December 31, 2016
and
2015
:
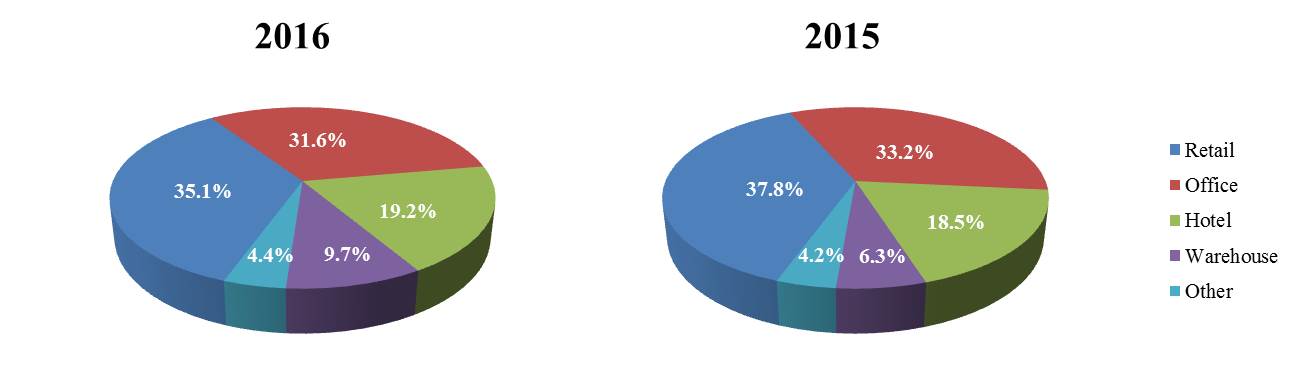
Loans secured by commercial real estate typically have shorter repayment periods and re-price more frequently than 1-4 single family residential loans but may have longer terms and re-price less frequently than commercial and industrial loans. The Company’s underwriting standards generally provide for loan terms of five to ten years, with amortization schedules of no more than thirty years. LTV ratios are typically limited to no more than 80%. Owner-occupied commercial real estate loans typically have risk profiles more closely aligned with that of commercial and industrial loans than with other types of commercial real estate loans. Construction and land loans represented only
1.6%
of the total loan portfolio at
December 31, 2016
. Construction and land loans are generally made for projects expected to stabilize within eighteen months of completion in submarkets with strong fundamentals and, to a lesser extent, for-sale residential projects to experienced developers with a strong cushion between market prices and loan basis. At
December 31, 2016
, the recorded investment in construction loans with available interest reserves totaled
$59 million
; the amount of available interest reserves totaled
$1 million
. All of these loans were rated “pass” at
December 31, 2016
.
Commercial and industrial loans are typically made to small and middle market businesses and include equipment loans, secured and unsecured working capital facilities, formula-based loans, mortgage warehouse lines, taxi medallion loans, SBA product offerings and business acquisition finance credit facilities. These loans may be structured as term loans, typically with maturities of three to seven years, or revolving lines of credit which may have multi-year maturities. Commercial loans include shared national credits totaling
$1.2 billion
at
December 31, 2016
, typically relationship based loans to borrowers in our geographic footprint.
Through its commercial lending subsidiaries, Pinnacle and Bridge, the Bank provides equipment and franchise financing on a national basis using both loan and lease structures. Pinnacle provides financing to state and local governmental entities directly and through vendor programs and alliances. Pinnacle offers a full array of financing structures including equipment lease purchase agreements and direct (private placement) bond refundings and loan agreements. Bridge has two operating divisions. The franchise finance division offers franchise acquisition, expansion and equipment financing, typically to experienced operators in well established concepts. The equipment finance division provides primarily transportation equipment financing through a variety of loan and lease structures. The Bank's SBF unit primarily originates SBA guaranteed commercial and commercial real estate loans, generally selling the guaranteed portion in the secondary market and retaining the unguaranteed portion in portfolio. The Bank engages in mortgage warehouse lending on a national basis.
59
The following table presents the recorded investment in loans and direct finance leases held for investment for each of our national commercial lending platforms at
December 31, 2016
and
2015
(in thousands):
|
2016
|
2015
|
||||||
|
Pinnacle
|
$
|
1,317,820
|
|
$
|
1,085,981
|
|
|
|
Bridge - franchise finance
|
426,661
|
|
440,375
|
|
|||
|
Bridge - transportation equipment finance
|
545,713
|
|
486,290
|
|
|||
|
SBF
|
225,241
|
|
197,953
|
|
|||
|
Mortgage warehouse lending
|
322,305
|
|
81,633
|
|
|||
|
$
|
2,837,740
|
|
$
|
2,292,232
|
|
||
The geographic concentration of the commercial loans in the national platforms is summarized as follows at
December 31, 2016
and
2015
. Amounts include premiums, discounts and deferred fees and costs (dollars in thousands):
|
2016
|
2015
|
||||||||||||
|
Florida
|
$
|
543,445
|
|
19.2
|
%
|
$
|
537,111
|
|
23.4
|
%
|
|||
|
California
|
421,480
|
|
14.9
|
%
|
188,338
|
|
8.2
|
%
|
|||||
|
Iowa
|
161,874
|
|
5.7
|
%
|
159,142
|
|
6.9
|
%
|
|||||
|
Virginia
|
138,417
|
|
4.9
|
%
|
113,486
|
|
5.0
|
%
|
|||||
|
Arizona
|
133,549
|
|
4.7
|
%
|
84,658
|
|
3.7
|
%
|
|||||
|
Texas
|
118,122
|
|
4.2
|
%
|
90,989
|
|
4.0
|
%
|
|||||
|
Nevada
|
74,821
|
|
2.6
|
%
|
101,370
|
|
4.4
|
%
|
|||||
|
All others
(1)
|
1,246,032
|
|
43.8
|
%
|
1,017,138
|
|
44.4
|
%
|
|||||
|
$
|
2,837,740
|
|
100.0
|
%
|
$
|
2,292,232
|
|
100.0
|
%
|
||||
|
(1)
|
No other state represented borrowers with more than 4.0% of loans outstanding at
December 31, 2016
or
2015
.
|
Consumer Loans
Consumer loans are comprised primarily of consumer installment financing, loans secured by certificates of deposit, unsecured personal lines of credit and demand deposit account overdrafts.
60
Loan Maturities
The following table sets forth, as of
December 31, 2016
, the maturity distribution of our non-covered loan portfolio by category, based on UPB. Commercial loans are presented by contractual maturity, including scheduled payments for amortizing loans. Contractual maturities of 1-4 single family residential loans have been adjusted for an estimated rate of voluntary prepayments on all loans, based on historical trends, current interest rates, types of loans and refinance patterns (in thousands):
|
One Year or
Less
|
After One
Through Five
Years
|
After Five
Years
|
Total
|
||||||||||||
|
Residential:
|
|||||||||||||||
|
1-4 single family residential
|
$
|
488,376
|
|
$
|
1,677,156
|
|
$
|
1,256,893
|
|
$
|
3,422,425
|
|
|||
|
Home equity loans and lines of credit
|
205
|
|
686
|
|
229
|
|
1,120
|
|
|||||||
|
488,581
|
|
1,677,842
|
|
1,257,122
|
|
3,423,545
|
|
||||||||
|
Commercial:
|
|||||||||||||||
|
Multi-family
|
338,486
|
|
3,069,500
|
|
421,235
|
|
3,829,221
|
|
|||||||
|
Commercial real estate
|
|||||||||||||||
|
Owner occupied
|
214,988
|
|
848,793
|
|
675,072
|
|
1,738,853
|
|
|||||||
|
Non-owner occupied
|
384,037
|
|
2,276,610
|
|
1,080,571
|
|
3,741,218
|
|
|||||||
|
Construction and land
|
88,329
|
|
162,097
|
|
61,455
|
|
311,881
|
|
|||||||
|
Commercial and industrial
|
1,479,861
|
|
1,794,158
|
|
117,664
|
|
3,391,683
|
|
|||||||
|
Commercial lending subsidiaries
|
648,474
|
|
912,363
|
|
719,848
|
|
2,280,685
|
|
|||||||
|
3,154,175
|
|
9,063,521
|
|
3,075,845
|
|
15,293,541
|
|
||||||||
|
Consumer
|
3,602
|
|
15,755
|
|
5,008
|
|
24,365
|
|
|||||||
|
$
|
3,646,358
|
|
$
|
10,757,118
|
|
$
|
4,337,975
|
|
$
|
18,741,451
|
|
||||
The following table shows the distribution of UPB of those loans that mature in more than one year between fixed and adjustable interest rate loans as of
December 31, 2016
(in thousands):
|
Interest Rate Type
|
|||||||||||
|
Fixed
|
Adjustable
|
Total
|
|||||||||
|
Residential:
|
|||||||||||
|
1-4 single family residential
|
$
|
941,886
|
|
$
|
1,992,163
|
|
$
|
2,934,049
|
|
||
|
Home equity loans and lines of credit
|
—
|
|
915
|
|
915
|
|
|||||
|
941,886
|
|
1,993,078
|
|
2,934,964
|
|
||||||
|
Commercial:
|
|||||||||||
|
Multi-family
|
2,985,032
|
|
505,703
|
|
3,490,735
|
|
|||||
|
Commercial real estate
|
|||||||||||
|
Owner occupied
|
1,011,988
|
|
511,877
|
|
1,523,865
|
|
|||||
|
Non-owner occupied
|
1,879,092
|
|
1,478,089
|
|
3,357,181
|
|
|||||
|
Construction and land
|
114,496
|
|
109,056
|
|
223,552
|
|
|||||
|
Commercial and industrial
|
529,150
|
|
1,382,672
|
|
1,911,822
|
|
|||||
|
Commercial lending subsidiaries
|
1,632,211
|
|
—
|
|
1,632,211
|
|
|||||
|
8,151,969
|
|
3,987,397
|
|
12,139,366
|
|
||||||
|
Consumer
|
18,671
|
|
2,092
|
|
20,763
|
|
|||||
|
$
|
9,112,526
|
|
$
|
5,982,567
|
|
$
|
15,095,093
|
|
|||
No maturity information has been provided for covered loans, which are comprised entirely of loans secured by 1-4 single family residential loans, the substantial majority of which are ACI loans accounted for in pools.
61
Asset Quality
In discussing asset quality, we distinguish between covered loans and non-covered loans. Although the risk profile of covered loans is higher than that of non-covered loans, our exposure to loss related to covered loans is significantly mitigated by the fair value basis recorded in these loans resulting from the application of acquisition accounting and by the Single Family Shared-Loss Agreement. At
December 31, 2016
, loans covered under the Single Family Shared-Loss Agreement totaled
$614 million
.
We have established a robust credit risk management framework, put in place an experienced team to lead the workout and recovery process for the commercial and commercial real estate portfolios and implemented a dedicated internal credit review function. We have an experienced resolution team in place for covered residential mortgage loans, and have implemented outsourcing arrangements with industry leading firms in certain areas such as OREO resolution.
Loan performance is monitored by our credit administration and workout and recovery departments. Generally, commercial relationships with balances in excess of defined thresholds are re-evaluated at least annually and more frequently if circumstances indicate that a change in risk rating may be warranted. The defined thresholds range from
$1 million
to
$3 million
. Additionally, commercial loans are regularly reviewed by our internal credit review department. The Company utilizes a 13 grade internal asset risk classification system as part of its efforts to monitor and maintain commercial asset quality. Loans exhibiting potential credit weaknesses that deserve management’s close attention and that if left uncorrected may result in deterioration of the repayment capacity of the borrower are categorized as special mention. These borrowers may exhibit negative financial trends or erratic financial performance, strained liquidity, marginal collateral coverage, declining industry trends or weak management. Loans with well-defined credit weaknesses that may result in a loss if the deficiencies are not corrected are assigned a risk rating of substandard. These borrowers may exhibit payment defaults, inadequate cash flows, operating losses, increasing balance sheet leverage, project cost overruns, unreasonable construction delays, exhausted interest reserves, declining collateral values, frequent overdrafts or past due real estate taxes. Loans with weaknesses so severe that collection in full is highly questionable or improbable, but because of certain reasonably specific pending factors have not been charged off, are assigned an internal risk rating of doubtful.
Residential mortgage loans and consumer loans are not individually risk rated. Delinquency status is the primary measure we use to monitor the credit quality of these loans. We also consider original LTV and FICO score to be significant indicators of credit quality for the new 1-4 single family residential portfolio.
Non-covered Loans
Commercial
The ongoing asset quality of significant commercial loans is monitored on an individual basis through our regular credit review and risk rating process. We believe internal risk rating is the best indicator of the credit quality of commercial loans. Homogenous groups of smaller balance commercial loans may be monitored collectively.
At
December 31, 2016
, new commercial loans with aggregate balances of
$72 million
,
$303 million
and
$12 million
were rated special mention, substandard and doubtful, respectively. At
December 31, 2015
, new commercial loans aggregating
$32 million
,
$198 million
and
$6 million
were rated special mention, substandard and doubtful, respectively. The balance of substandard loans at
December 31, 2016
and
2015
included
$138 million
and
$80 million
, respectively, of taxi medallion finance loans. Criticized and classified loans represented
2.5%
of the new commercial loan portfolio, of which
0.9%
related to taxi medallion loans, at
December 31, 2016
. At
December 31, 2016
, ACI commercial loans had a carrying value of
$46.9 million
. The carrying amount of ACI commercial loans that were past due, criticized or classified at
December 31, 2016
was not significant. See
Note 5
to the consolidated financial statements for more detailed information about risk rating of commercial loans.
The commercial and industrial loan portfolio includes exposure to taxi medallion finance of approximately
$179 million
at
December 31, 2016
. The estimated value of underlying taxi medallion collateral and liquidity in the market for sales of medallions, a potential secondary source of repayment, have declined in recent periods due to competitive developments in the transportation-for-hire industry. We update our analysis of the cash flow generating capacity of the operation of medallions on a regular basis using current available taxi industry data from which prospective debt service capacity is estimated. This analysis is based on an extensive data set typically made available by the New York Taxi and Limousine Commission semi-annually and assumptions that we believe to be generally conservative regarding fleet utilization and borrower expenses. Actual debt service coverage of our medallion loans may in some cases be more favorable than these cash flow capacity estimates. We also consider, if less favorable than our analysis of cash flow generating capacity, available borrower specific financial information. We update our analysis of estimated medallion valuations on a quarterly basis, based on the cash flow capacity estimates and recent medallion transfer activity. The taxi medallion portfolio had the following characteristics at
December 31, 2016
:
62
|
•
|
Approximately
98%
of the portfolio secured directly by taxi medallions was concentrated in New York City.
|
|
•
|
Loans delinquent by 30 days or more totaled
$40.8 million
or
22.8%
of the portfolio, compared to
$7.9 million
or
3.7%
of the portfolio at
December 31, 2015
. Loans delinquent by 90 days or more totaled
$29.2 million
or
16.4%
of the portfolio, compared to
$1.9 million
or
0.9%
of the portfolio at
December 31, 2015
. Loans on non-accrual status totaled
$60.7 million
at
December 31, 2016
.
|
|
•
|
At
December 31, 2016
,
$40.5 million
,
$138.0 million
and
$0.2 million
of loans were rated pass, substandard and doubtful, respectively.
|
|
•
|
Based on our updated analysis of medallion values, the weighted average estimated current LTV for loans directly secured by medallions was approximately
83%
and approximately
52.3%
of those loans had current LTV in excess of 100%.
|
|
•
|
Approximately
13.8%
of the portfolio consisted of interest only loans.
|
|
•
|
Based on our updated analysis of the estimated cash flow generating capacity of medallions, as discussed above, approximately
57.4%
of loans secured directly by taxi medallions had estimated prospective debt service coverage ratios of less than 1.00, the majority of which were current with respect to payment of principal and interest.
|
|
•
|
The portfolio included
76
loans modified in TDRs with a recorded investment of
$65.9 million
.
|
|
•
|
In the aggregate, the ALLL related to taxi medallion loans was
6.0%
of the outstanding balance at
December 31, 2016
, compared to
4.7%
at
December 31, 2015
. Charge-offs of
$11.1 million
were recognized in the
year ended December 31, 2016
related to taxi medallion loans.
|
We are no longer originating new taxi medallion loans. Our portfolio management strategies include, but are not limited to, working with borrowers experiencing temporary cash flow challenges to provide short term relief and/or extended amortization periods, pro-actively attempting to refinance loans prior to maturity, shortening amortization periods when possible with an emphasis on converting interest only loans, continuing to monitor industry data and obtain updated borrower and guarantor financial information, and identifying and closely monitoring loans with higher risk profiles. As taxi medallion loans approach maturity or are refinanced, we expect the number and amount of TDRs in this portfolio segment to increase.
Residential
New 1-4 single family residential loans past due more than 30 days totaled
$12.7 million
and
$7.0 million
at
December 31, 2016
and
2015
, respectively. The amount of these loans 90 days or more past due was
$2.1 million
and
$2.8 million
at
December 31, 2016
and
2015
, respectively.
The majority of our new residential mortgage portfolio consists of loans purchased through established correspondent channels. In general, we purchase performing jumbo mortgage loans which have FICO scores above 700, primarily are owner-occupied and full documentation, and have a current LTV of 80% or less. We perform due diligence on the purchased loans for credit, compliance, counterparty, payment history and property valuation.
The following tables show the distribution of new 1-4 single family residential loans by original FICO and LTV as of
December 31, 2016
and
2015
:
|
2016
|
|||||||||||||||
|
|
FICO
|
||||||||||||||
|
LTV
|
720 or less
|
721 - 740
|
741 - 760
|
761 or
greater |
Total
|
||||||||||
|
60% or less
|
2.5
|
%
|
3.2
|
%
|
4.7
|
%
|
21.7
|
%
|
32.1
|
%
|
|||||
|
60% - 70%
|
2.3
|
%
|
2.7
|
%
|
3.6
|
%
|
15.1
|
%
|
23.7
|
%
|
|||||
|
70% - 80%
|
3.2
|
%
|
4.3
|
%
|
8.0
|
%
|
26.1
|
%
|
41.6
|
%
|
|||||
|
More than 80%
|
0.7
|
%
|
0.3
|
%
|
0.4
|
%
|
1.2
|
%
|
2.6
|
%
|
|||||
|
|
8.7
|
%
|
10.5
|
%
|
16.7
|
%
|
64.1
|
%
|
100.0
|
%
|
|||||
63
|
2015
|
|||||||||||||||
|
|
FICO
|
||||||||||||||
|
LTV
|
720 or less
|
721 - 740
|
741 - 760
|
761 or
greater |
Total
|
||||||||||
|
60% or less
|
2.7
|
%
|
3.4
|
%
|
4.9
|
%
|
22.8
|
%
|
33.8
|
%
|
|||||
|
60% - 70%
|
2.4
|
%
|
2.7
|
%
|
3.8
|
%
|
16.4
|
%
|
25.3
|
%
|
|||||
|
70% - 80%
|
2.2
|
%
|
3.4
|
%
|
7.2
|
%
|
26.4
|
%
|
39.2
|
%
|
|||||
|
More than 80%
|
1.0
|
%
|
0.1
|
%
|
0.1
|
%
|
0.5
|
%
|
1.7
|
%
|
|||||
|
|
8.3
|
%
|
9.6
|
%
|
16.0
|
%
|
66.1
|
%
|
100.0
|
%
|
|||||
At
December 31, 2016
, the new 1-4 single family residential loan portfolio had the following characteristics: substantially all were full documentation with a weighted-average FICO score of
766
and a weighted-average LTV of
65.8%
. The majority of this portfolio was owner-occupied, with
88.3%
primary residence,
8.6%
second homes and
3.0%
investment properties. In terms of vintage,
10.2%
of the portfolio was originated pre-2013,
19.2%
in 2013,
17.2%
in
2014
,
27.3%
in
2015
and
26.1%
in
2016
.
Consumer
At
December 31, 2016
and
2015
, there were no delinquent new consumer loans.
Covered Loans
At
December 31, 2016
, residential ACI loans totaled
$536 million
and residential non-ACI loans totaled
$78 million
, including premiums, discounts and deferred fees and costs. All of these loans are covered under the Single Family Shared-Loss Agreement.
Covered residential loans were placed into homogenous pools at the time of the FSB Acquisition and the ongoing credit quality and performance of these loans is monitored on a pool basis. We monitor the pools quarterly to determine whether any changes have occurred in expected cash flows that would be indicative of impairment or necessitate reclassification between non-accretable difference and accretable yield. At
December 31, 2016
, accretable yield on residential ACI loans totaled
$659 million
and non-accretable difference related to those loans totaled
$349 million
.
At
December 31, 2016
, the recorded investment in non-ACI 1-4 single family residential loans was
$30.8 million
;
$1.4 million
or
4.5%
of these loans were 30 days or more past due and
$0.9 million
or
3.0%
of these loans were 90 days or more past due. At
December 31, 2016
, the recorded investment in ACI 1-4 single family residential loans totaled
$532.3 million
;
$32.1 million
or
6.0%
of these loans were delinquent by 30 days or more and
$15.6 million
or
2.9%
were delinquent by 90 days or more.
At
December 31, 2016
, non-ACI home equity loans and lines of credit had an aggregate recorded investment of
$47.0 million
;
$3.9 million
or
8.2%
of these loans were 30 days or more past due and
$2.1 million
or
4.4%
were 90 days or more past due. ACI home equity loans and lines of credit had a carrying amount of
$3.9 million
at
December 31, 2016
; amounts 30 days or more contractually delinquent were not significant.
64
Home equity loans and lines of credit generally provide that payment terms be reset after an initial contractual period of interest only payments, requiring the pay down of principal through balloon payments or amortization. Additional information regarding ACI and non-ACI home equity loans and lines of credit at
December 31, 2016
is summarized as follows:
|
|
ACI
|
Non-ACI
|
|||
|
Loans resetting from interest only:
|
|
|
|
|
|
|
Previously reset
|
63.0
|
%
|
45.6
|
%
|
|
|
Scheduled to reset within 12 months
|
9.4
|
%
|
11.3
|
%
|
|
|
Scheduled to reset after 12 months
|
27.6
|
%
|
43.1
|
%
|
|
|
100.0
|
%
|
100.0
|
%
|
||
|
Lien position:
|
|
|
|
|
|
|
First liens
|
11.3
|
%
|
15.4
|
%
|
|
|
Second or third liens
|
88.7
|
%
|
84.6
|
%
|
|
|
100.0
|
%
|
100.0
|
%
|
||
The Company's exposure to loss related to covered loans is significantly mitigated by the Single Family Shared-Loss Agreement and by the fair value basis recorded in these assets resulting from the application of acquisition accounting. While resets of interest only loans have contributed to an increase in default rates for the covered home equity portfolio, the impact on results of operations, after consideration of the mitigating impact of loss sharing, is not significant.
Impaired Loans and Non-Performing Assets
Non-performing assets generally consist of (i) non-accrual loans, including loans that have been modified in TDRs and placed on non-accrual status, (ii) accruing loans that are more than 90 days contractually past due as to interest or principal, excluding ACI loans, and (iii) OREO and repossessed assets. Impaired loans also typically include loans modified in TDRs that are accruing and ACI loans for which expected cash flows have been revised downward since acquisition (as adjusted for any additional cash flows expected to be collected arising from changes in estimates after acquisition). Impaired ACI loans or pools with remaining accretable yield have not been classified as non-accrual loans and we do not consider them to be non-performing assets.
The following tables summarize the Company's impaired loans and non-performing assets at December 31 of the years indicated (dollars in thousands):
|
2016
|
2015
|
2014
|
|||||||||||||||||||||||||||||||||
|
Covered
Assets |
Non-Covered
Assets |
Total
|
Covered
Assets
|
Non-Covered
Assets
|
Total
|
Covered
Assets |
Non-
Covered Assets |
Total
|
|||||||||||||||||||||||||||
|
Non-accrual loans
|
|||||||||||||||||||||||||||||||||||
|
Residential:
|
|||||||||||||||||||||||||||||||||||
|
1 - 4 single family residential
|
$
|
918
|
|
$
|
566
|
|
$
|
1,484
|
|
$
|
594
|
|
$
|
2,007
|
|
$
|
2,601
|
|
$
|
604
|
|
$
|
49
|
|
$
|
653
|
|
||||||||
|
Home equity loans and lines of credit
|
2,283
|
|
—
|
|
2,283
|
|
4,724
|
|
—
|
|
4,724
|
|
3,808
|
|
—
|
|
3,808
|
|
|||||||||||||||||
|
Total residential loans
|
3,201
|
|
566
|
|
3,767
|
|
5,318
|
|
2,007
|
|
7,325
|
|
4,412
|
|
49
|
|
4,461
|
|
|||||||||||||||||
|
Commercial:
|
|||||||||||||||||||||||||||||||||||
|
Commercial real estate
|
|
|
|
|
|||||||||||||||||||||||||||||||
|
Owner occupied
|
—
|
|
19,439
|
|
19,439
|
|
—
|
|
8,274
|
|
8,274
|
|
—
|
|
3,362
|
|
3,362
|
|
|||||||||||||||||
|
Non-owner occupied
|
—
|
|
559
|
|
559
|
|
—
|
|
—
|
|
—
|
|
—
|
|
1,326
|
|
1,326
|
|
|||||||||||||||||
|
Construction and land
|
—
|
|
1,238
|
|
1,238
|
|
—
|
|
—
|
|
—
|
|
—
|
|
209
|
|
209
|
|
|||||||||||||||||
|
Commercial and industrial
|
|
|
|
|
|||||||||||||||||||||||||||||||
|
Taxi medallion loans
|
60,660
|
|
60,660
|
|
—
|
|
2,557
|
|
2,557
|
|
—
|
|
—
|
|
—
|
|
|||||||||||||||||||
|
Other commercial and industrial
|
16,036
|
|
16,036
|
|
—
|
|
35,225
|
|
35,225
|
|
—
|
|
13,666
|
|
13,666
|
|
|||||||||||||||||||
|
Commercial lending subsidiaries
|
—
|
|
32,645
|
|
32,645
|
|
—
|
|
9,920
|
|
9,920
|
|
—
|
|
9,226
|
|
9,226
|
|
|||||||||||||||||
|
Total commercial loans
|
—
|
|
130,577
|
|
130,577
|
|
—
|
|
55,976
|
|
55,976
|
|
—
|
|
27,789
|
|
27,789
|
|
|||||||||||||||||
|
Consumer
|
—
|
|
2
|
|
2
|
|
—
|
|
7
|
|
7
|
|
173
|
|
173
|
|
|||||||||||||||||||
|
Total non-accrual loans
|
3,201
|
|
131,145
|
|
134,346
|
|
5,318
|
|
57,990
|
|
63,308
|
|
4,412
|
|
28,011
|
|
32,423
|
|
|||||||||||||||||
|
Non-ACI and new loans past due 90 days and still accruing
|
—
|
|
1,551
|
|
1,551
|
|
156
|
|
1,369
|
|
1,525
|
|
174
|
|
715
|
|
889
|
|
|||||||||||||||||
|
TDRs
(1)
|
—
|
|
—
|
|
—
|
|
7,050
|
|
1,175
|
|
8,225
|
|
2,188
|
|
4,435
|
|
6,623
|
|
|||||||||||||||||
|
Total non-performing loans
|
3,201
|
|
132,696
|
|
135,897
|
|
12,524
|
|
60,534
|
|
73,058
|
|
6,774
|
|
33,161
|
|
39,935
|
|
|||||||||||||||||
|
OREO
|
4,658
|
|
4,882
|
|
9,540
|
|
8,853
|
|
—
|
|
8,853
|
|
13,645
|
|
135
|
|
13,780
|
|
|||||||||||||||||
|
Repossessed assets
|
—
|
|
3,551
|
|
3,551
|
|
—
|
|
2,337
|
|
2,337
|
|
—
|
|
—
|
|
—
|
|
|||||||||||||||||
|
Total non-performing assets
|
7,859
|
|
141,129
|
|
148,988
|
|
21,377
|
|
62,871
|
|
84,248
|
|
20,419
|
|
33,296
|
|
53,715
|
|
|||||||||||||||||
|
Performing TDRs
|
|
|
|||||||||||||||||||||||||||||||||
|
Taxi medallion loans
|
—
|
|
36,848
|
|
36,848
|
|
—
|
|
633
|
|
633
|
|
—
|
|
—
|
|
—
|
|
|||||||||||||||||
|
Other
|
11,166
|
|
26,282
|
|
37,448
|
|
3,988
|
|
4,902
|
|
8,890
|
|
3,866
|
|
797
|
|
4,663
|
|
|||||||||||||||||
|
Total impaired loans and non-performing assets
|
$
|
19,025
|
|
$
|
204,259
|
|
$
|
223,284
|
|
$
|
25,365
|
|
$
|
68,406
|
|
$
|
93,771
|
|
$
|
24,285
|
|
$
|
34,093
|
|
$
|
58,378
|
|
||||||||
|
Non-performing loans to total loans
(2)
|
0.71
|
%
|
0.70
|
%
|
0.38
|
%
|
0.44
|
%
|
0.29
|
%
|
0.32
|
%
|
|||||||||||||||||||||||
|
Non-performing assets to total assets
(3)
|
0.51
|
%
|
0.53
|
%
|
0.26
|
%
|
0.35
|
%
|
0.17
|
%
|
0.28
|
%
|
|||||||||||||||||||||||
|
ALLL to total loans
(2)
|
0.80
|
%
|
0.79
|
%
|
0.76
|
%
|
0.76
|
%
|
0.80
|
%
|
0.77
|
%
|
|||||||||||||||||||||||
|
ALLL to non-performing loans
|
113.68
|
%
|
112.55
|
%
|
199.82
|
%
|
172.23
|
%
|
275.47
|
%
|
239.24
|
%
|
|||||||||||||||||||||||
|
Net charge-offs to average loans
|
0.13
|
%
|
0.13
|
%
|
0.09
|
%
|
0.10
|
%
|
0.08
|
%
|
0.15
|
%
|
|||||||||||||||||||||||
|
(1)
|
Effective January 1, 2016, we are no longer reporting accruing TDRs as non-performing.
|
|
(2)
|
Total loans for purposes of calculating these ratios include premiums, discounts and deferred fees and costs.
|
|
(3)
|
Ratio for non-covered assets is calculated as non-performing non-covered assets to total assets.
|
|
2013
|
2012
|
||||||||||||||||||||||
|
Covered
Assets
|
Non-Covered
Assets
|
Total
|
Covered
Assets |
Non-
Covered Assets |
Total
|
||||||||||||||||||
|
Non-accrual loans
|
|||||||||||||||||||||||
|
Residential:
|
|||||||||||||||||||||||
|
1 - 4 single family residential
|
$
|
293
|
|
$
|
194
|
|
$
|
487
|
|
$
|
2,678
|
|
$
|
155
|
|
$
|
2,833
|
|
|||||
|
Home equity loans and lines of credit
|
6,559
|
|
—
|
|
6,559
|
|
9,767
|
|
—
|
|
9,767
|
|
|||||||||||
|
Total residential loans
|
6,852
|
|
194
|
|
7,046
|
|
12,445
|
|
155
|
|
12,600
|
|
|||||||||||
|
Commercial:
|
|||||||||||||||||||||||
|
Commercial real estate
|
|||||||||||||||||||||||
|
Owner occupied
|
101
|
|
2,786
|
|
2,887
|
|
—
|
|
1,619
|
|
1,619
|
|
|||||||||||
|
Non-owner occupied
|
941
|
|
1,443
|
|
2,384
|
|
59
|
|
—
|
|
59
|
|
|||||||||||
|
Construction and land
|
—
|
|
244
|
|
244
|
|
—
|
|
278
|
|
278
|
|
|||||||||||
|
Commercial and industrial
|
2,767
|
|
16,612
|
|
19,379
|
|
4,530
|
|
11,907
|
|
16,437
|
|
|||||||||||
|
Commercial lending subsidiaries
|
—
|
|
1,370
|
|
1,370
|
|
—
|
|
1,719
|
|
1,719
|
|
|||||||||||
|
Total commercial loans
|
3,809
|
|
22,455
|
|
26,264
|
|
4,589
|
|
15,523
|
|
20,112
|
|
|||||||||||
|
Consumer
|
—
|
|
75
|
|
75
|
|
—
|
|
—
|
|
—
|
|
|||||||||||
|
Total non-accrual loans
|
10,661
|
|
22,724
|
|
33,385
|
|
17,034
|
|
15,678
|
|
32,712
|
|
|||||||||||
|
Non-ACI and new loans past due 90 days and still accruing
|
—
|
|
512
|
|
512
|
|
140
|
|
38
|
|
178
|
|
|||||||||||
|
TDRs
|
1,765
|
|
—
|
|
1,765
|
|
1,293
|
|
348
|
|
1,641
|
|
|||||||||||
|
Total non-performing loans
|
12,426
|
|
23,236
|
|
35,662
|
|
18,467
|
|
16,064
|
|
34,531
|
|
|||||||||||
|
OREO
|
39,672
|
|
898
|
|
40,570
|
|
76,022
|
|
—
|
|
76,022
|
|
|||||||||||
|
Repossessed assets
|
—
|
|
—
|
|
—
|
|
—
|
|
—
|
|
—
|
|
|||||||||||
|
Total non-performing assets
|
52,098
|
|
24,134
|
|
76,232
|
|
94,489
|
|
16,064
|
|
110,553
|
|
|||||||||||
|
Impaired ACI loans on accrual status
(1)
|
44,286
|
|
—
|
|
44,286
|
|
43,580
|
|
—
|
|
43,580
|
|
|||||||||||
|
Other impaired loans on accrual status
|
—
|
|
—
|
|
—
|
|
—
|
|
2,721
|
|
2,721
|
|
|||||||||||
|
Performing TDRs
|
3,588
|
|
1,400
|
|
4,988
|
|
2,650
|
|
4,689
|
|
7,339
|
|
|||||||||||
|
Total impaired loans and non-performing assets
|
$
|
99,972
|
|
$
|
25,534
|
|
$
|
125,506
|
|
$
|
140,719
|
|
$
|
23,474
|
|
$
|
164,193
|
|
|||||
|
Non-performing loans to total loans
(2)
|
0.31
|
%
|
0.39
|
%
|
0.43
|
%
|
0.62
|
%
|
|||||||||||||||
|
Non-performing assets to total assets
(3)
|
0.16
|
%
|
0.51
|
%
|
0.13
|
%
|
0.89
|
%
|
|||||||||||||||
|
ALLL to total loans
(2)
|
0.76
|
%
|
0.77
|
%
|
1.11
|
%
|
1.06
|
%
|
|||||||||||||||
|
ALLL to non-performing loans
|
246.73
|
%
|
195.52
|
%
|
256.65
|
%
|
171.21
|
%
|
|||||||||||||||
|
Net charge-offs to average loans
|
0.34
|
%
|
0.31
|
%
|
0.09
|
%
|
0.17
|
%
|
|||||||||||||||
|
(1)
|
Includes TDRs on accrual status.
|
|
(2)
|
Total loans for purposes of calculating these ratios include premiums, discounts and deferred fees and costs.
|
|
(3)
|
Ratio for non-covered assets is calculated as non-performing non-covered assets to total assets.
|
The primary driver of the increases in non-covered, non-performing loans and non-covered performing TDRs and of the decrease in the ratio of the ALLL to non-performing loans at
December 31, 2016
compared to
December 31, 2015
was increases in non-accrual loans and TDRs in the taxi medallion portfolio. The decrease in the ratio of the ALLL to non-performing loans was also impacted by increases in partial charge-offs.
Contractually delinquent ACI loans with remaining accretable yield are not reflected as non-accrual loans because accretion continues to be recorded in income. Accretion continues to be recorded as long as there is an expectation of future cash flows in excess of carrying amount from these loans. The carrying value of ACI loans contractually delinquent by more than 90 days but on which income was still being recognized was
$16 million
and
$22 million
at
December 31, 2016
and
2015
, respectively.
New and non-ACI commercial loans are placed on non-accrual status when (i) management has determined that full repayment of all contractual principal and interest is in doubt, or (ii) the loan is past due 90 days or more as to principal or interest unless the loan is well secured and in the process of collection. New and non-ACI residential and consumer loans are generally placed on non-accrual status when 90 days of interest is due and unpaid. When a loan is placed on non-accrual status, uncollected interest accrued is reversed and charged to interest income. Commercial loans are returned to accrual status only after all past due principal and interest has been collected and full repayment of remaining contractual principal and interest is reasonably assured. Residential loans are generally returned to accrual status when less than 90 days of interest is due and unpaid. Past due status of loans is determined based on the contractual next payment due date. Loans less than 30 days past due are reported as current.
A loan modification is considered a TDR if the Company, for economic or legal reasons related to the borrower’s financial difficulties, grants a concession to the borrower that the Company would not otherwise grant. These concessions may take the form of temporarily or permanently reduced interest rates, payment abatement periods, restructuring of payment terms, extensions of maturity at below market terms, or in some cases, partial forgiveness of principal. Under GAAP, modified ACI loans accounted for in pools are not accounted for as TDRs and are not separated from their respective pools when modified. Included in TDRs are residential loans to borrowers who have not reaffirmed their debt discharged in Chapter 7 bankruptcy.
The following table summarizes loans modified in TDRs at
December 31, 2016
(dollars in thousands):
|
Number of TDRs
|
Recorded Investment
|
Related Specific Allowance
|
|||||||||
|
Residential:
|
|||||||||||
|
Covered
|
59
|
|
$
|
12,396
|
|
$
|
529
|
|
|||
|
Non-covered
|
4
|
|
561
|
|
12
|
|
|||||
|
Commercial:
|
|||||||||||
|
Taxi medallion
|
76
|
|
65,879
|
|
2,948
|
|
|||||
|
Other
|
23
|
|
39,333
|
|
4,124
|
|
|||||
|
162
|
|
$
|
118,169
|
|
$
|
7,613
|
|
||||
Potential Problem Loans
Potential problem loans have been identified by management as those loans included in the "substandard accruing" risk rating category. These loans are typically performing, but possess specifically identified credit weaknesses that, if not remedied, may lead to a downgrade to non-accrual status and identification as impaired in the near-term. Substandard accruing new loans totaled
$184 million
, of which
$78 million
were taxi medallion loans, at
December 31, 2016
. The majority of these loans were current as to principal and interest at
December 31, 2016
.
Loss Mitigation Strategies
Criticized or classified commercial loans in excess of certain thresholds are reviewed quarterly by the Criticized Asset Committee, which determines the appropriate strategy for collection to mitigate the amount of credit losses. Criticized asset reports for each relationship are presented by the assigned relationship manager and credit officer to the Criticized Asset Committee until such time as the relationships are returned to a satisfactory credit risk rating or otherwise resolved. The Criticized Asset Committee may require the transfer of a loan to our workout and recovery department, which is tasked to effectively manage the loan with the goal of minimizing losses and expenses associated with restructure, collection and/or liquidation of collateral. Commercial loans with a risk rating of substandard; impaired loans on non-accrual status; loans modified as TDRs; or assets classified as OREO or repossessed assets are usually transferred to workout and recovery. Oversight of the workout and recovery department is provided by the Asset Recovery Committee.
We evaluate each residential loan in default to determine the most effective loss mitigation strategy, which may be modification, short sale, or foreclosure. We offer loan modifications under HAMP to eligible borrowers in the residential portfolio. HAMP is a uniform loan modification process that provides eligible borrowers with sustainable monthly mortgage payments equal to a target 31% of their gross monthly income. We have approved
4,450
permanent loan modifications through
December 31, 2016
and there are
17
trial loan modifications at
December 31, 2016
. Substantially all of these modified loans were covered ACI loans accounted for in pools. All HAMP applications were required to be submitted by December 31, 2016, the expiration date of the program, and all modifications under HAMP must be made by September 30, 2017. We began offering a new modification program in late 2016 modeled after the FNMA standard modification program.
In addition to the modification programs discussed above, we offer a proprietary Subordinate Lien Modification Program for home equity loans and lines of credit. This provides BankUnited the ability to offer a modification on loans covered under the Single Family Shared-Loss Agreement that are subordinate to either a BankUnited first lien or a first lien from another lender.
65
Analysis of the Allowance for Loan and Lease Losses
The ALLL relates to (i) new loans, (ii) estimated additional losses arising on non-ACI loans subsequent to the FSB Acquisition, and (iii) impairment recognized as a result of decreases in expected cash flows on ACI loans due to further credit deterioration. The impact of any additional provision for losses on covered loans is significantly mitigated by an increase in the FDIC indemnification asset. The determination of the amount of the ALLL is, by nature, highly complex and subjective. Future events that are inherently uncertain could result in material changes to the level of the ALLL. General economic conditions including but not limited to unemployment rates, the level of business investment and growth, real estate values, vacancy rates and rental rates in our primary market areas, the level of interest rates, and a variety of other factors that affect the ability of borrowers’ businesses to generate cash flows sufficient to service their debts will impact the future performance of the portfolio.
New and non-
ACI
Loans
Residential
Due to the lack of similarity between the risk characteristics of new loans and covered loans in the residential and home equity portfolios, management does not believe it is appropriate to use the historical performance of the covered residential mortgage portfolio as a basis for calculating the ALLL applicable to new loans. The new loan portfolio has not yet developed an observable loss trend. Therefore, the ALLL for new residential loans is based primarily on relevant proxy historical loss rates. The ALLL for new 1-4 single family residential loans is estimated using average annual loss rates on prime residential mortgage securitizations issued between 2003 and 2008 as a proxy. Based on the comparability of FICO scores and LTV ratios between loans included in those securitizations and loans in the Bank’s portfolio and the geographic diversity in the new purchased residential portfolio, we determined that prime residential mortgage securitizations provide an appropriate proxy for incurred losses in this portfolio class. A peer group 16-quarter average net charge-off rate is used to estimate the ALLL for the new home equity loan class. See further discussion of the use of peer group loss factors below. The new home equity portfolio is not a significant component of the overall loan portfolio.
Based on an analysis of historical performance, OREO and short sale losses, recent trending data and other internal and external factors, we have concluded that historical performance by portfolio class is the best indicator of incurred loss for the non-ACI 1-4 single family residential and home equity portfolio classes. For each of these portfolio classes, a quarterly roll rate matrix is calculated by delinquency bucket to measure the rate at which loans move from one delinquency bucket to the next during a given quarter. An average 16-quarter roll rate matrix is used to estimate the amount within each delinquency bucket expected to roll to 120+ days delinquent. We assume no cure for those loans that are currently 120+ days delinquent. Loss severity given default is estimated based on internal data about OREO sales and short sales from the portfolio. The ALLL calculation incorporates a 100% loss severity assumption for home equity loans that are projected to roll to default. For non-ACI residential loans, the allowance is initially calculated based on UPB. The total of UPB less the calculated allowance is then compared to the carrying amount of the loans, net of unamortized credit related fair value adjustments established at acquisition. If the calculated balance net of the allowance is less than the carrying amount, an additional allowance is established. Any increase or decrease in the allowance for non-ACI residential loans will result in a corresponding increase or decrease in the FDIC indemnification asset.
Commercial and Consumer
Since the new commercial loan portfolio is not yet seasoned enough to exhibit a loss trend, the ALLL for new commercial loans is based primarily on peer group average annual historical net charge-off rates by loan class and the Company’s internal credit risk rating system. The allowance is comprised of specific reserves for loans that are individually evaluated and determined to be impaired as well as general reserves for individually evaluated loans determined not to be impaired and loans that do not meet our established threshold for individual evaluation. Commercial relationships graded substandard or doubtful and on non-accrual status with committed credit facilities greater than or equal to $1 million are individually evaluated for impairment. For loans evaluated individually for impairment and determined to be impaired, a specific allowance is established based on the present value of expected cash flows discounted at the loan’s effective interest rate, the estimated fair value of the loan, or the estimated fair value of collateral less costs to sell. Loans modified in TDRs are also evaluated individually for impairment. We believe that loans rated special mention, substandard or doubtful that are not individually evaluated for impairment exhibit characteristics indicative of a heightened level of credit risk. Loss factors for these loans are determined by using default frequency and severity information applied at the loan level. Estimated default frequencies and severities are based on available industry data.
66
With the exception of the Pinnacle municipal finance portfolio, a four quarter loss emergence period is used in the calculation of general reserves. A twelve quarter loss emergence period is used in the calculation of general reserves for the Pinnacle portfolio.
The peer group used to calculate the average annual historical net charge-off rates that form the basis for our general reserve calculations for new commercial, home equity and consumer loans is made up of the banks included in the OCC Midsize Bank Group plus two additional banks in the New York region that management believes to be comparable based on size and nature of lending operations. The OCC Midsize Bank Group primarily includes commercial banks with total assets ranging from $10 - $50 billion and included
27
banks at
December 31, 2016
. Peer bank data is obtained from the Statistics on Depository Institutions Report published by the FDIC for the most recent quarter available. These banks, as a group, are considered by management to be comparable to BankUnited in size, nature of lending operations and loan portfolio composition. We evaluate the composition of the peer group annually, or more frequently if, in our judgment, a more frequent evaluation is necessary. The general loss factor for municipal finance receivables is based on a historical cumulative default curve for municipal obligations of credit quality comparable to those in the Company’s portfolio.
Beginning in the first quarter of 2016, we extended the loss experience period used to calculate peer group average annual net charge-off rates from 12 quarters to 16 quarters for commercial and consumer loans. We believe this extension of the look back period was appropriate at that time to capture a sufficient range of observations reflecting the performance of our loans, most of which were originated in the current economic cycle, and to reflect recent indications that the U.S. economy continues to move through the credit cycle. We believe the 16-quarter look back period to be consistent with the range of industry practice. Extending the look back period to 16 quarters resulted in an increase in the ALLL of approximately $9 million as of March 31, 2016, as compared to using a 12-quarter look back period at the same date. The framework used to determine qualitative reserves was not revised.
Our internal risk rating system comprises 13 credit grades; grades 1 through 8 are “pass” grades. The risk ratings are driven largely by debt service coverage. Peer group historical loss rates are adjusted upward for loans assigned a lower “pass” rating.
Qualitative Factors
Qualitative adjustments are made to the ALLL when, based on management’s judgment, there are internal or external factors impacting probable incurred losses not taken into account by the quantitative calculations. Potential qualitative adjustments are categorized as follows:
|
•
|
Portfolio performance trends, including trends in and the levels of delinquencies, non-performing loans and classified loans;
|
|
•
|
Changes in the nature of the portfolio and terms of the loans, specifically including the volume and nature of policy and procedural exceptions;
|
|
•
|
Portfolio growth trends;
|
|
•
|
Changes in lending policies and procedures, including credit and underwriting guidelines;
|
|
•
|
Economic factors, including unemployment rates and GDP growth rates;
|
|
•
|
Changes in the value of underlying collateral;
|
|
•
|
Quality of risk ratings, as evaluated by our independent credit review function;
|
|
•
|
Credit concentrations;
|
|
•
|
Changes in and experience levels of credit administration management and staff; and
|
|
•
|
Other factors identified by management that may impact the level of losses inherent in the portfolio, including but not limited to competition and legal and regulatory considerations.
|
ACI
Loans
For ACI loans, a valuation allowance is established when periodic evaluations of expected cash flows reflect a decrease resulting from credit related factors from the level of cash flows that were estimated to be collected at acquisition plus any additional expected cash flows arising from revisions in those estimates. We perform a quarterly analysis of expected cash flows for ACI loans.
67
Expected cash flows are estimated on a pool basis for ACI 1-4 single family residential and home equity loans. The analysis of expected pool cash flows incorporates updated pool level expected prepayment rate, default rate, delinquency level and loss severity given default assumptions. Prepayment, delinquency and default curves are derived primarily from roll rates generated from the historical performance of the portfolio over the immediately preceding four quarters. Loss severity given default assumptions are generated from the historical performance of the portfolio over the immediately preceding four quarters, while loss severity from loan sales is generated from historical performance over the immediately preceding twelve quarters. Estimates of default probability and loss severity given default also incorporate updated LTV ratios, at the loan level, based on Case-Shiller Home Price Indices for the relevant MSA. Costs and fees represent an additional component of loss on default and are projected based on historical experience over the last three years. The ACI home equity roll rates include the impact of delinquent, related senior liens and loans to borrowers who have not reaffirmed their debt discharged in Chapter 7 bankruptcy.
Based on our projected cash flow analysis, no ALLL related to 1-4 single family residential and home equity ACI pools was recorded at
December 31, 2016
or
2015
.
The primary assumptions underlying estimates of expected cash flows for ACI commercial loans are default probability and severity of loss given default. Assessments of default probability and severity are based on net realizable value analyses prepared at the individual loan level. Based on our analysis, no ALLL related to ACI commercial loans was recorded at
December 31, 2016
or
2015
.
68
The following tables provide an analysis of the ALLL, provision for loan losses and net charge-offs for the periods from
December 31,
2011
through
December 31, 2016
(in thousands):
|
New Loans
|
ACI Loans
|
Non-ACI
Loans
|
Total
|
||||||||||||
|
Balance at December 31, 2011
|
$
|
24,328
|
|
$
|
16,332
|
|
$
|
7,742
|
|
$
|
48,402
|
|
|||
|
Provision for (recovery of) loan losses:
|
19,399
|
|
(4,347
|
)
|
3,844
|
|
18,896
|
|
|||||||
|
Charge-offs:
|
|||||||||||||||
|
1 - 4 single family residential
|
—
|
|
—
|
|
(245
|
)
|
(245
|
)
|
|||||||
|
Home equity loans and lines of credit
|
—
|
|
—
|
|
(3,030
|
)
|
(3,030
|
)
|
|||||||
|
Multi-family
|
(87
|
)
|
(563
|
)
|
—
|
|
(650
|
)
|
|||||||
|
Commercial real estate
|
—
|
|
(1,482
|
)
|
—
|
|
(1,482
|
)
|
|||||||
|
Construction and land
|
(3
|
)
|
(1,183
|
)
|
—
|
|
(1,186
|
)
|
|||||||
|
Commercial loans and leases
|
(2,839
|
)
|
(738
|
)
|
(316
|
)
|
(3,893
|
)
|
|||||||
|
Total Charge-offs
|
(2,929
|
)
|
(3,966
|
)
|
(3,591
|
)
|
(10,486
|
)
|
|||||||
|
Recoveries:
|
|||||||||||||||
|
Home equity loans and lines of credit
|
—
|
|
—
|
|
29
|
|
29
|
|
|||||||
|
Multi-family
|
—
|
|
—
|
|
24
|
|
24
|
|
|||||||
|
Commercial real estate
|
—
|
|
—
|
|
347
|
|
347
|
|
|||||||
|
Commercial loans and leases
|
427
|
|
—
|
|
1,479
|
|
1,906
|
|
|||||||
|
Consumer
|
3
|
|
—
|
|
—
|
|
3
|
|
|||||||
|
Total Recoveries
|
430
|
|
—
|
|
1,879
|
|
2,309
|
|
|||||||
|
Net Charge-offs:
|
(2,499
|
)
|
(3,966
|
)
|
(1,712
|
)
|
(8,177
|
)
|
|||||||
|
Balance at December 31, 2012
|
41,228
|
|
8,019
|
|
9,874
|
|
59,121
|
|
|||||||
|
Provision for (recovery of) loan losses:
|
33,702
|
|
(2,891
|
)
|
1,153
|
|
31,964
|
|
|||||||
|
Charge-offs:
|
|||||||||||||||
|
1 - 4 single family residential
|
(10
|
)
|
—
|
|
(1,276
|
)
|
(1,286
|
)
|
|||||||
|
Home equity loans and lines of credit
|
—
|
|
—
|
|
(2,858
|
)
|
(2,858
|
)
|
|||||||
|
Commercial real estate
|
—
|
|
(1,162
|
)
|
—
|
|
(1,162
|
)
|
|||||||
|
Construction and land
|
—
|
|
(77
|
)
|
—
|
|
(77
|
)
|
|||||||
|
Commercial loans and leases
|
(17,987
|
)
|
(996
|
)
|
(171
|
)
|
(19,154
|
)
|
|||||||
|
Consumer
|
(484
|
)
|
—
|
|
—
|
|
(484
|
)
|
|||||||
|
Total Charge-offs
|
(18,481
|
)
|
(2,235
|
)
|
(4,305
|
)
|
(25,021
|
)
|
|||||||
|
Recoveries:
|
|||||||||||||||
|
Home equity loans and lines of credit
|
—
|
|
—
|
|
90
|
|
90
|
|
|||||||
|
Multi-family
|
—
|
|
—
|
|
15
|
|
15
|
|
|||||||
|
Commercial real estate
|
—
|
|
—
|
|
191
|
|
191
|
|
|||||||
|
Commercial and industrial
|
743
|
|
—
|
|
2,484
|
|
3,227
|
|
|||||||
|
Commercial lending subsidiaries
|
15
|
|
—
|
|
—
|
|
15
|
|
|||||||
|
Consumer
|
123
|
|
—
|
|
—
|
|
123
|
|
|||||||
|
Total Recoveries
|
881
|
|
—
|
|
2,780
|
|
3,661
|
|
|||||||
|
Net Charge-offs:
|
(17,600
|
)
|
(2,235
|
)
|
(1,525
|
)
|
(21,360
|
)
|
|||||||
|
Balance at December 31, 2013
|
$
|
57,330
|
|
$
|
2,893
|
|
$
|
9,502
|
|
$
|
69,725
|
|
|||
69
|
New Loans
|
ACI Loans
|
Non-ACI
Loans
|
Total
|
||||||||||||
|
Balance at December 31, 2013
|
$
|
57,330
|
|
$
|
2,893
|
|
$
|
9,502
|
|
$
|
69,725
|
|
|||
|
Provision for (recovery of) loan losses:
|
41,748
|
|
2,311
|
|
(2,554
|
)
|
41,505
|
|
|||||||
|
Charge-offs:
|
|||||||||||||||
|
1 - 4 single family residential
|
—
|
|
—
|
|
(269
|
)
|
(269
|
)
|
|||||||
|
Home equity loans and lines of credit
|
—
|
|
—
|
|
(2,737
|
)
|
(2,737
|
)
|
|||||||
|
Multi-family
|
—
|
|
(285
|
)
|
—
|
|
(285
|
)
|
|||||||
|
Commercial real estate
|
|||||||||||||||
|
Owner occupied
|
—
|
|
(356
|
)
|
—
|
|
(356
|
)
|
|||||||
|
Non-owner occupied
|
(52
|
)
|
(3,031
|
)
|
—
|
|
(3,083
|
)
|
|||||||
|
Construction and land
|
—
|
|
(635
|
)
|
(13
|
)
|
(648
|
)
|
|||||||
|
Commercial and industrial
|
(6,033
|
)
|
(573
|
)
|
(477
|
)
|
(7,083
|
)
|
|||||||
|
Commercial finance subsidiaries
|
(1,586
|
)
|
—
|
|
—
|
|
(1,586
|
)
|
|||||||
|
Consumer
|
(1,083
|
)
|
(324
|
)
|
—
|
|
(1,407
|
)
|
|||||||
|
Total Charge-offs
|
(8,754
|
)
|
(5,204
|
)
|
(3,496
|
)
|
(17,454
|
)
|
|||||||
|
Recoveries:
|
|||||||||||||||
|
Home equity loans and lines of credit
|
—
|
|
—
|
|
19
|
|
19
|
|
|||||||
|
Multi-family
|
—
|
|
—
|
|
4
|
|
4
|
|
|||||||
|
Commercial real estate
|
|||||||||||||||
|
Non-owner occupied
|
—
|
|
—
|
|
3
|
|
3
|
|
|||||||
|
Commercial and industrial
|
506
|
|
—
|
|
714
|
|
1,220
|
|
|||||||
|
Commercial lending subsidiaries
|
22
|
|
—
|
|
—
|
|
22
|
|
|||||||
|
Consumer
|
498
|
|
—
|
|
—
|
|
498
|
|
|||||||
|
Total Recoveries
|
1,026
|
|
—
|
|
740
|
|
1,766
|
|
|||||||
|
Net Charge-offs:
|
(7,728
|
)
|
(5,204
|
)
|
(2,756
|
)
|
(15,688
|
)
|
|||||||
|
Balance at December 31, 2014
|
91,350
|
|
—
|
|
4,192
|
|
95,542
|
|
|||||||
|
Provision for loan losses:
|
42,060
|
|
—
|
|
2,251
|
|
44,311
|
|
|||||||
|
Charge-offs:
|
|||||||||||||||
|
1 - 4 single family residential
|
—
|
|
—
|
|
(16
|
)
|
(16
|
)
|
|||||||
|
Home equity loans and lines of credit
|
—
|
|
—
|
|
(1,664
|
)
|
(1,664
|
)
|
|||||||
|
Commercial real estate
|
|
|
|||||||||||||
|
Owner occupied
|
(263
|
)
|
—
|
|
—
|
|
(263
|
)
|
|||||||
|
Commercial and industrial
|
(5,731
|
)
|
—
|
|
—
|
|
(5,731
|
)
|
|||||||
|
Commercial lending subsidiaries
|
(7,725
|
)
|
—
|
|
—
|
|
(7,725
|
)
|
|||||||
|
Total Charge-offs
|
(13,719
|
)
|
—
|
|
(1,680
|
)
|
(15,399
|
)
|
|||||||
|
Recoveries:
|
|||||||||||||||
|
Home equity loans and lines of credit
|
—
|
|
—
|
|
39
|
|
39
|
|
|||||||
|
Multi-family
|
—
|
|
—
|
|
4
|
|
4
|
|
|||||||
|
Commercial real estate
|
|
|
|||||||||||||
|
Non-owner occupied
|
2
|
|
—
|
|
—
|
|
2
|
|
|||||||
|
Commercial and industrial
|
1,082
|
|
—
|
|
62
|
|
1,144
|
|
|||||||
|
Commercial lending subsidiaries
|
153
|
|
—
|
|
—
|
|
153
|
|
|||||||
|
Consumer
|
32
|
|
—
|
|
—
|
|
32
|
|
|||||||
|
Total Recoveries
|
1,269
|
|
—
|
|
105
|
|
1,374
|
|
|||||||
|
Net Charge-offs:
|
(12,450
|
)
|
—
|
|
(1,575
|
)
|
(14,025
|
)
|
|||||||
|
Balance at December 31, 2015
|
$
|
120,960
|
|
$
|
—
|
|
$
|
4,868
|
|
$
|
125,828
|
|
|||
70
|
New Loans
|
ACI Loans
|
Non-ACI Loans
|
Total
|
||||||||||||
|
Balance at December 31, 2015
|
$
|
120,960
|
|
$
|
—
|
|
$
|
4,868
|
|
$
|
125,828
|
|
|||
|
Provision for (recovery of) loan losses:
|
|||||||||||||||
|
1-4 single family residential
|
(1,807
|
)
|
—
|
|
59
|
|
(1,748
|
)
|
|||||||
|
Home equity loans and lines of credit
|
3
|
|
—
|
|
(1,691
|
)
|
(1,688
|
)
|
|||||||
|
Multi-family
|
2,692
|
|
—
|
|
—
|
|
2,692
|
|
|||||||
|
Commercial real estate
|
|||||||||||||||
|
Owner occupied
|
5,568
|
|
—
|
|
—
|
|
5,568
|
|
|||||||
|
Non-owner occupied
|
9,553
|
|
—
|
|
—
|
|
9,553
|
|
|||||||
|
Construction and land
|
(670
|
)
|
—
|
|
—
|
|
(670
|
)
|
|||||||
|
Commercial and industrial
|
34,625
|
|
—
|
|
(49
|
)
|
34,576
|
|
|||||||
|
Commercial finance subsidiaries
|
2,638
|
|
—
|
|
—
|
|
2,638
|
|
|||||||
|
Consumer
|
(10
|
)
|
—
|
|
—
|
|
(10
|
)
|
|||||||
|
Total Provision
|
52,592
|
|
—
|
|
(1,681
|
)
|
50,911
|
|
|||||||
|
Charge-offs:
|
|||||||||||||||
|
1-4 single family residential
|
—
|
|
—
|
|
(442
|
)
|
(442
|
)
|
|||||||
|
Home equity loans and lines of credit
|
—
|
|
—
|
|
(774
|
)
|
(774
|
)
|
|||||||
|
Commercial real estate
|
|||||||||||||||
|
Owner occupied
|
(2,827
|
)
|
—
|
|
—
|
|
(2,827
|
)
|
|||||||
|
Non-owner occupied
|
(128
|
)
|
—
|
|
—
|
|
(128
|
)
|
|||||||
|
Construction and land
|
(93
|
)
|
—
|
|
—
|
|
(93
|
)
|
|||||||
|
Commercial and industrial
|
(20,262
|
)
|
—
|
|
—
|
|
(20,262
|
)
|
|||||||
|
Commercial lending subsidiaries
|
(2,432
|
)
|
—
|
|
—
|
|
(2,432
|
)
|
|||||||
|
Consumer
|
(152
|
)
|
—
|
|
—
|
|
(152
|
)
|
|||||||
|
Total Charge-offs
|
(25,894
|
)
|
—
|
|
(1,216
|
)
|
(27,110
|
)
|
|||||||
|
Recoveries:
|
|||||||||||||||
|
Home equity loans and lines of credit
|
—
|
|
—
|
|
80
|
|
80
|
|
|||||||
|
Commercial real estate
|
|||||||||||||||
|
Owner occupied
|
1,193
|
|
—
|
|
—
|
|
1,193
|
|
|||||||
|
Commercial and industrial
|
698
|
|
—
|
|
49
|
|
747
|
|
|||||||
|
Commercial lending subsidiaries
|
1,278
|
|
—
|
|
—
|
|
1,278
|
|
|||||||
|
Consumer
|
26
|
|
—
|
|
—
|
|
26
|
|
|||||||
|
Total Recoveries
|
3,195
|
|
—
|
|
129
|
|
3,324
|
|
|||||||
|
Net Charge-offs:
|
(22,699
|
)
|
—
|
|
(1,087
|
)
|
(23,786
|
)
|
|||||||
|
Balance at December 31, 2016
|
$
|
150,853
|
|
$
|
—
|
|
$
|
2,100
|
|
$
|
152,953
|
|
|||
71
The following tables show the distribution of the ALLL, broken out between covered and non-covered loans, as of
December 31
of the years indicated (dollars in thousands):
|
2016
|
||||||||||||||||||
|
Covered Loans
|
||||||||||||||||||
|
|
New Loans
|
ACI Loans
|
Non-ACI
Loans
|
Total
|
%
(1)
|
|||||||||||||
|
Residential:
|
|
|
|
|
|
|
|
|
|
|
||||||||
|
1 - 4 single family residential
|
$
|
9,279
|
|
$
|
—
|
|
$
|
181
|
|
$
|
9,460
|
|
20.6
|
%
|
||||
|
Home equity loans and lines of credit
|
7
|
|
—
|
|
1,919
|
|
1,926
|
|
0.3
|
%
|
||||||||
|
9,286
|
|
—
|
|
2,100
|
|
11,386
|
|
20.9
|
%
|
|||||||||
|
Commercial:
|
||||||||||||||||||
|
Multi-family
|
25,009
|
|
—
|
|
—
|
|
25,009
|
|
19.8
|
%
|
||||||||
|
Commercial real estate
|
||||||||||||||||||
|
Owner occupied
|
11,424
|
|
—
|
|
—
|
|
11,424
|
|
9.0
|
%
|
||||||||
|
Non-owner occupied
|
35,604
|
|
—
|
|
—
|
|
35,604
|
|
19.3
|
%
|
||||||||
|
Construction and land
|
2,824
|
|
—
|
|
—
|
|
2,824
|
|
1.6
|
%
|
||||||||
|
Commercial and industrial
|
48,722
|
|
—
|
|
—
|
|
48,722
|
|
17.5
|
%
|
||||||||
|
Commercial lending subsidiaries
|
17,867
|
|
—
|
|
—
|
|
17,867
|
|
11.8
|
%
|
||||||||
|
141,450
|
|
—
|
|
—
|
|
141,450
|
|
79.0
|
%
|
|||||||||
|
Consumer
|
117
|
|
—
|
|
—
|
|
117
|
|
0.1
|
%
|
||||||||
|
$
|
150,853
|
|
$
|
—
|
|
$
|
2,100
|
|
$
|
152,953
|
|
100.0
|
%
|
|||||
|
2015
|
||||||||||||||||||
|
Covered Loans
|
||||||||||||||||||
|
|
New Loans
|
ACI Loans
|
Non-ACI
Loans |
Total
|
%
(1)
|
|||||||||||||
|
Residential:
|
|
|
|
|
|
|
|
|
|
|
||||||||
|
1 - 4 single family residential
|
$
|
11,086
|
|
$
|
—
|
|
$
|
564
|
|
$
|
11,650
|
|
21.9
|
%
|
||||
|
Home equity loans and lines of credit
|
4
|
|
—
|
|
4,304
|
|
4,308
|
|
0.4
|
%
|
||||||||
|
11,090
|
|
—
|
|
4,868
|
|
15,958
|
|
22.3
|
%
|
|||||||||
|
Commercial:
|
||||||||||||||||||
|
Multi-family
|
22,317
|
|
—
|
|
—
|
|
22,317
|
|
20.9
|
%
|
||||||||
|
Commercial real estate
|
||||||||||||||||||
|
Owner occupied
|
7,490
|
|
—
|
|
—
|
|
7,490
|
|
8.2
|
%
|
||||||||
|
Non-owner occupied
|
26,179
|
|
—
|
|
—
|
|
26,179
|
|
17.5
|
%
|
||||||||
|
Construction and land
|
3,587
|
|
—
|
|
—
|
|
3,587
|
|
2.1
|
%
|
||||||||
|
Commercial and industrial
|
33,661
|
|
—
|
|
—
|
|
33,661
|
|
16.7
|
%
|
||||||||
|
Commercial lending subsidiaries
|
16,383
|
|
—
|
|
—
|
|
16,383
|
|
12.1
|
%
|
||||||||
|
109,617
|
|
—
|
|
—
|
|
109,617
|
|
77.5
|
%
|
|||||||||
|
Consumer
|
253
|
|
—
|
|
—
|
|
253
|
|
0.2
|
%
|
||||||||
|
$
|
120,960
|
|
$
|
—
|
|
$
|
4,868
|
|
$
|
125,828
|
|
100.0
|
%
|
|||||
72
|
2014
|
||||||||||||||||||
|
Covered Loans
|
||||||||||||||||||
|
New Loans
|
ACI Loans
|
Non-ACI
Loans |
Total
|
%
(1)
|
||||||||||||||
|
Residential:
|
||||||||||||||||||
|
1 - 4 single family residential
|
$
|
7,116
|
|
$
|
—
|
|
$
|
945
|
|
$
|
8,061
|
|
27.6
|
%
|
||||
|
Home equity loans and lines of credit
|
17
|
|
—
|
|
3,247
|
|
3,264
|
|
1.0
|
%
|
||||||||
|
7,133
|
|
—
|
|
4,192
|
|
11,325
|
|
28.6
|
%
|
|||||||||
|
Commercial:
|
||||||||||||||||||
|
Multi-family
|
14,970
|
|
—
|
|
—
|
|
14,970
|
|
15.8
|
%
|
||||||||
|
Commercial real estate
|
||||||||||||||||||
|
Owner occupied
|
8,273
|
|
—
|
|
—
|
|
8,273
|
|
8.4
|
%
|
||||||||
|
Non-owner occupied
|
17,615
|
|
—
|
|
—
|
|
17,615
|
|
14.4
|
%
|
||||||||
|
Construction and land
|
2,725
|
|
—
|
|
—
|
|
2,725
|
|
1.4
|
%
|
||||||||
|
Commercial and industrial
|
25,867
|
|
—
|
|
—
|
|
25,867
|
|
19.4
|
%
|
||||||||
|
Commercial lending subsidiaries
|
14,577
|
|
—
|
|
—
|
|
14,577
|
|
11.8
|
%
|
||||||||
|
84,027
|
|
—
|
|
—
|
|
84,027
|
|
71.2
|
%
|
|||||||||
|
Consumer
|
190
|
|
—
|
|
—
|
|
190
|
|
0.2
|
%
|
||||||||
|
$
|
91,350
|
|
$
|
—
|
|
$
|
4,192
|
|
$
|
95,542
|
|
100.0
|
%
|
|||||
|
2013
|
||||||||||||||||||
|
Covered Loans
|
||||||||||||||||||
|
New Loans
|
ACI Loans
|
Non-ACI
Loans |
Total
|
%
(1)
|
||||||||||||||
|
Residential:
|
||||||||||||||||||
|
1 - 4 single family residential
|
$
|
6,271
|
|
$
|
—
|
|
$
|
827
|
|
$
|
7,098
|
|
32.4
|
%
|
||||
|
Home equity loans and lines of credit
|
12
|
|
—
|
|
8,243
|
|
8,255
|
|
1.9
|
%
|
||||||||
|
6,283
|
|
—
|
|
9,070
|
|
15,353
|
|
34.3
|
%
|
|||||||||
|
Commercial:
|
||||||||||||||||||
|
Multi-family
|
3,947
|
|
323
|
|
—
|
|
4,270
|
|
12.6
|
%
|
||||||||
|
Commercial real estate
|
||||||||||||||||||
|
Owner occupied
|
6,774
|
|
369
|
|
6
|
|
7,149
|
|
8.5
|
%
|
||||||||
|
Non-owner occupied
|
4,401
|
|
1,444
|
|
8
|
|
5,853
|
|
11.5
|
%
|
||||||||
|
Construction and land
|
803
|
|
192
|
|
6
|
|
1,001
|
|
1.7
|
%
|
||||||||
|
Commercial and industrial
|
24,148
|
|
565
|
|
412
|
|
25,125
|
|
18.5
|
%
|
||||||||
|
Commercial lending subsidiaries
|
8,787
|
|
—
|
|
—
|
|
8,787
|
|
10.5
|
%
|
||||||||
|
48,860
|
|
2,893
|
|
432
|
|
52,185
|
|
63.3
|
%
|
|||||||||
|
Consumer
|
2,187
|
|
—
|
|
—
|
|
2,187
|
|
2.4
|
%
|
||||||||
|
$
|
57,330
|
|
$
|
2,893
|
|
$
|
9,502
|
|
$
|
69,725
|
|
100.0
|
%
|
|||||
73
|
2012
|
||||||||||||||||||
|
Covered Loans
|
||||||||||||||||||
|
New Loans
|
ACI Loans
|
Non-ACI
Loans
|
Total
|
%
(1)
|
||||||||||||||
|
Residential:
|
||||||||||||||||||
|
1 - 4 single family residential
|
$
|
10,074
|
|
$
|
—
|
|
$
|
984
|
|
$
|
11,058
|
|
41.5
|
%
|
||||
|
Home equity loans and lines of credit
|
19
|
|
—
|
|
8,087
|
|
8,106
|
|
3.8
|
%
|
||||||||
|
10,093
|
|
—
|
|
9,071
|
|
19,164
|
|
45.3
|
%
|
|||||||||
|
Commercial:
|
||||||||||||||||||
|
Multi-family
|
2,212
|
|
504
|
|
5
|
|
2,721
|
|
6.5
|
%
|
||||||||
|
Commercial real estate
|
7,790
|
|
5,400
|
|
31
|
|
13,221
|
|
17.5
|
%
|
||||||||
|
Construction and land
|
672
|
|
350
|
|
9
|
|
1,031
|
|
1.6
|
%
|
||||||||
|
Commercial loans and leases
|
20,047
|
|
1,765
|
|
758
|
|
22,570
|
|
28.5
|
%
|
||||||||
|
30,721
|
|
8,019
|
|
803
|
|
39,543
|
|
54.1
|
%
|
|||||||||
|
Consumer
|
414
|
|
—
|
|
—
|
|
414
|
|
0.6
|
%
|
||||||||
|
$
|
41,228
|
|
$
|
8,019
|
|
$
|
9,874
|
|
$
|
59,121
|
|
100.0
|
%
|
|||||
|
(1)
|
Represents percentage of loans receivable in each category to total loans receivable.
|
The increase in the balance of the ALLL for new loans at
December 31, 2016
as compared to
December 31, 2015
primarily reflects the impact of growth of the new loan portfolio and an increase in reserves for classified loans, including loans determined to be individually impaired. Factors influencing the change in the ALLL as related to specific loan types at
December 31, 2016
as compared to
December 31, 2015
, include:
|
•
|
A decline of
$1.8 million
for new 1-4 single family residential loans in spite of growth in the corresponding portfolio was primarily attributable to a decline in both the applicable quantitative historical loss rate and qualitative reserves. The most significant factor in the decline in qualitative reserves was a decrease in the economic factor related to GDP growth rates.
|
|
•
|
An increase of
$2.7 million
for new multi-family loans was primarily driven by the growth of the corresponding loan portfolio.
|
|
•
|
An increase of
$3.9 million
for new owner occupied commercial real estate loans reflects the growth of the corresponding loan portfolio and increases in reserves for classified loans.
|
|
•
|
A
$9.4 million
increase for new non-owner occupied commercial real estate loans was primarily attributable to the growth of the corresponding loan portfolio.
|
|
•
|
An increase of
$15.1 million
for new commercial and industrial loans was primarily driven by increases in reserves for classified and impaired loans, growth of the corresponding portfolio and an increase in the peer group based historical loss factor for this portfolio segment. The reserve for classified and impaired loans in this portfolio segment increased by $10.4 million.
|
|
•
|
A
$1.5 million
increase for commercial lending subsidiaries primarily reflects the growth of the portfolio. Increases in the peer group historical loss factor and reserves for classified and individually impaired loans were largely offset by decreases in qualitative loss factors related to GDP growth rates and portfolio growth rates.
|
|
•
|
The decrease in the reserve for non-ACI loans resulted primarily from a decline in related portfolio balances and an improvement in roll rates for the home equity segment.
|
For additional information about the ALLL, see
Note 5
to the consolidated financial statements.
74
Equipment under Operating Lease
Equipment under operating lease primarily consists of railcars leased to North American commercial end-users. The portfolio also includes non-commercial aircraft and other land transport equipment. At
December 31, 2016
, our operating lease fleet consisted of
5,169
rail cars, including hoppers, tank cars, boxcars, auto carriers, center beams and gondolas;
1,297
trailers;
34
tractors;
19
forklifts;
53
utility trucks and
3
helicopters. The largest concentrations of rail cars were
2,125
hopper cars and
1,534
tank cars, primarily used to ship sand and petroleum products, respectively, for the energy industry. Equipment with a carrying value of
$282 million
at
December 31, 2016
was leased to companies for use in the energy industry. Four of these operating lease relationships with assets under lease totaling
$61 million
were internally risk rated special mention or substandard at
December 31, 2016
.
There have been no missed payments or time off-lease related to the operating lease portfolio to date. One relationship was restructured in July 2016, with no decrease in total minimum lease payments. Impairment of
$4.1 million
was recognized in the year ended
December 31, 2016
on a group of 150 tank cars impacted by new safety regulations. No other cars in the fleet have these particular characteristics.
The primary risks inherent in the equipment leasing business are asset risk resulting from ownership of the equipment on operating lease and credit risk. Asset risk arises from fluctuations in supply and demand for the underlying leased equipment. Railcars are long-lived equipment with useful lives of approximately 35-50 years. The equipment is leased to commercial end-users with original lease terms generally ranging from 3-9 years at
December 31, 2016
. We are exposed to the risk that, at the end of the lease term, the value of the asset will be lower than expected, potentially resulting in reduced future lease income over the remaining life of the asset or a lower sale value. Asset risk may also lead to changes in depreciation as a result of changes in the residual values of the operating lease assets or through impairment of asset carrying values.
At
December 31, 2016
, the breakdown of carrying values of equipment under operating lease by the year current leases are scheduled to expire were as follows (in thousands):
|
Years Ending December 31:
|
|
|
|
|
2017
|
$
|
31,724
|
|
|
2018
|
55,035
|
|
|
|
2019
|
43,163
|
|
|
|
2020
|
105,366
|
|
|
|
2021
|
88,482
|
|
|
|
Thereafter through 2031
|
216,144
|
|
|
|
$
|
539,914
|
|
|
Asset risk is evaluated and managed by a dedicated internal staff of asset managers, managed by seasoned equipment finance professionals with a broad depth and breadth of experience in the leasing business. Additionally, we have partnered with an industry leading, experienced service provider who provides fleet management and servicing, including lease administration and reporting, a Regulation Y compliant full service maintenance program and railcar remarketing. Risk is managed by setting appropriate residual values at inception and systematic reviews of residual values based on independent appraisals, performed at least annually. Additionally, our internal management team and our external service provider closely follow the rail markets, monitoring traffic flows, supply and demand trends and the impact of new technologies and regulatory requirements. Demand for railcars is sensitive to shifts in general and industry specific economic and market trends and shifts in trade flows from specific events such as natural or man-made disasters. We seek to mitigate these risks by leasing to a stable end-user base, by maintaining a relatively young and diversified fleet of assets that are expected to maintain stronger and more stable utilization rates despite impacts from unexpected events or cyclical trends and by staggering lease maturities. We regularly monitor the impact of lower oil prices on the estimated residual value of rail cars being used in the petroleum/natural gas extraction sector.
Credit risk in the leased equipment portfolio results from the potential default of lessees, possibly driven by obligor specific or industry-wide conditions, and is economically less significant than asset risk, because in the operating lease business, there is no extension of credit to the obligor. Instead, the lessor deploys a portion of the useful life of the asset. Credit losses, if any, will manifest through reduced rental income due to missed payments, time off lease, or lower rental payments due either to a restructuring or re-leasing of the asset to another obligor. Credit risk in the operating lease portfolio is managed and monitored utilizing credit administration infrastructure, processes and procedures similar to those used to manage and monitor credit risk in the commercial loan portfolio. We also mitigate credit risk in this portfolio by leasing only to high credit quality obligors.
75
We expect our operating lease portfolio to continue to grow, and we may expand into other asset classes. We are not currently increasing our exposure to the energy sector.
Goodwill
Goodwill consists of $59 million recorded in conjunction with the FSB Acquisition, $8 million recorded in conjunction with the acquisition of two commercial lending subsidiaries in 2010 and $10 million recorded in conjunction with the SBF acquisition in May 2015. The Company has a single reporting unit. We perform goodwill impairment testing in the third quarter of each fiscal year. As of the
2016
impairment testing date, the estimated fair value of the reporting unit substantially exceeded its carrying amount; therefore, no impairment was indicated.
Deposits
A further breakdown of deposits as of
December 31, 2016
and
2015
is shown below:
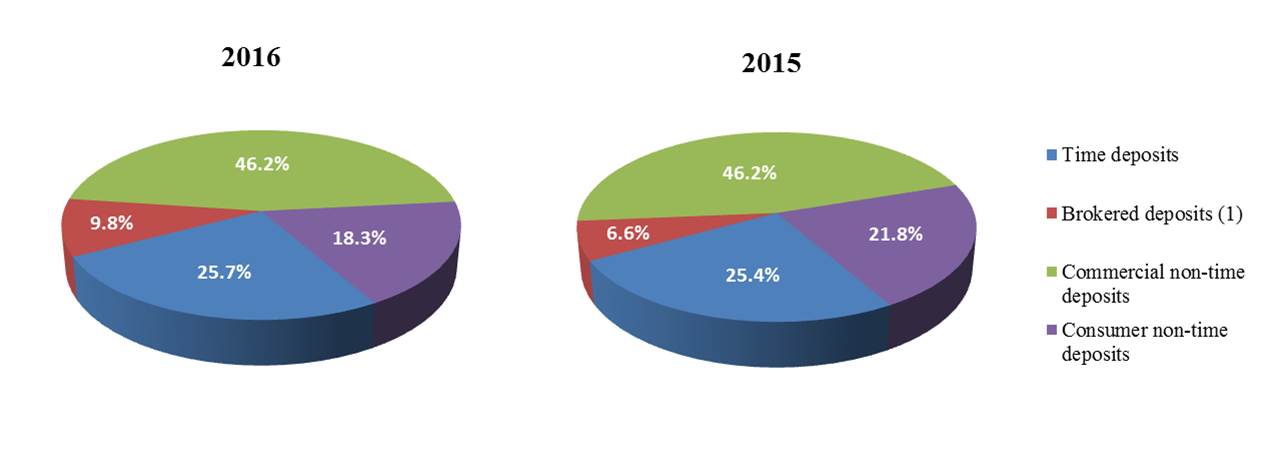
(1) Brokered deposits include certain time deposits at
December 31, 2016
and
2015
.
Average balances and rates paid on deposits were as follows for the years ended
December 31, 2016
,
2015
and
2014
(dollars in thousands):
|
|
2016
|
2015
|
2014
|
|||||||||||||||||
|
|
Average
Balance |
Average
Rate Paid
|
Average
Balance |
Average
Rate Paid |
Average
Balance
|
Average
Rate Paid
|
||||||||||||||
|
Demand deposits:
|
|
|
|
|
|
|
|
|
||||||||||||
|
Non-interest bearing
|
$
|
2,968,192
|
|
—
|
%
|
$
|
2,732,654
|
|
—
|
%
|
$
|
2,366,621
|
|
—
|
%
|
|||||
|
Interest bearing
|
1,382,717
|
|
0.60
|
%
|
1,169,921
|
|
0.49
|
%
|
773,655
|
|
0.42
|
%
|
||||||||
|
Money market
|
7,946,447
|
|
0.64
|
%
|
6,313,340
|
|
0.57
|
%
|
4,444,753
|
|
0.54
|
%
|
||||||||
|
Savings
|
415,205
|
|
0.23
|
%
|
536,026
|
|
0.32
|
%
|
647,691
|
|
0.30
|
%
|
||||||||
|
Time
|
5,326,630
|
|
1.12
|
%
|
4,305,857
|
|
1.11
|
%
|
3,716,611
|
|
1.18
|
%
|
||||||||
|
$
|
18,039,191
|
|
0.66
|
%
|
$
|
15,057,798
|
|
0.61
|
%
|
$
|
11,949,331
|
|
0.61
|
%
|
||||||
76
Total deposits at
December 31, 2016
and
2015
included
$1.9 billion
and
$1.1 billion
, respectively, of brokered deposits.
The following table shows scheduled maturities of certificates of deposit with denominations greater than or equal to $100,000 as of
December 31, 2016
(in thousands):
|
Three months or less
|
$
|
1,020,502
|
|
|
Over three through six months
|
764,346
|
|
|
|
Over six through twelve months
|
1,135,045
|
|
|
|
Over twelve months
|
938,303
|
|
|
|
$
|
3,858,196
|
|
|
FHLB Advances, Notes and Other Borrowings
In addition to deposits, we utilize FHLB advances to fund growth in interest earning assets; the advances provide us with additional flexibility in managing both term and cost of funding. FHLB advances are secured by FHLB stock, qualifying residential first mortgage, commercial real estate and home equity loans, and MBS. At
December 31, 2016
and
2015
, outstanding FHLB advances totaled
$5.2 billion
and
$4.0 billion
, respectively. The increase in outstanding FHLB advances during the
year ended December 31, 2016
corresponded to earning asset growth.
The contractual balance of FHLB advances outstanding at
December 31, 2016
is scheduled to mature as follows (in thousands):
|
Maturing in:
|
|
|
|
|
2017—31 days or less
|
$
|
1,170,000
|
|
|
2017—Over 31 days
|
3,920,000
|
|
|
|
2018
|
75,000
|
|
|
|
2020
|
75,000
|
|
|
|
Total contractual balance outstanding
|
5,240,000
|
|
|
|
Unamortized modification costs
|
(652
|
)
|
|
|
Carrying value
|
$
|
5,239,348
|
|
At
December 31, 2016
and
2015
outstanding senior notes payable and other borrowings consisted of the following ( in thousands):
|
2016
|
2015
|
||||||
|
Senior notes
|
$
|
393,092
|
|
$
|
392,326
|
|
|
|
Capital lease obligations
|
9,717
|
|
10,219
|
|
|||
|
$
|
402,809
|
|
$
|
402,545
|
|
||
Senior notes have a face amount of
$400 million
, a fixed coupon rate of
4.875%
and mature on
November 17, 2025
.
Capital Resources
Pursuant to the FDIA, the federal banking agencies have adopted regulations setting forth a five-tier system for measuring the capital adequacy of the financial institutions they supervise. At
December 31, 2016
and
2015
, BankUnited and the Company had capital levels that exceeded both the regulatory well-capitalized guidelines and all internal capital ratio targets. See Note 15 to the consolidated financial statements for more information about BankUnited and the Company's regulatory capital ratios and requirements.
Stockholders' equity increased to
$2.4 billion
at
December 31, 2016
, an increase of
$175 million
, or
7.8%
, from
December 31, 2015
, due primarily to the retention of earnings.
Since our formation, stockholders' equity has been impacted primarily by the retention of earnings, and to a lesser extent, proceeds from the issuance of common shares and changes in unrealized gains and losses, net of taxes, on investment securities available for sale and cash flow hedges. Our rate of earnings retention is derived by dividing undistributed earnings per
77
common share by earnings per common share. Our retention ratio was
59.8%
and
64.3%
for the years ended
December 31, 2016
and
2015
, respectively. We retain a high percentage of our earnings to support our planned growth.
We filed a shelf registration statement with the SEC in October 2015 that allows the Company to periodically offer and sell in one or more offerings, individually or in any combination, our common stock, preferred stock and other non-equity securities. The shelf registration provides us with flexibility in issuing capital instruments and enables us to more readily access the capital markets as needed to pursue future growth opportunities and to ensure continued compliance with regulatory capital requirements. Our ability to issue securities pursuant to the shelf registration is subject to market conditions.
Liquidity
Liquidity involves our ability to generate adequate funds to support planned interest earning asset growth, meet deposit withdrawal requests, maintain reserve requirements, conduct routine operations, pay dividends, service outstanding debt and meet other contractual obligations.
Primary sources of liquidity include cash flows from operations, cash generated by the repayment and resolution of loans acquired in the FSB Acquisition, cash payments received from the FDIC pursuant to the Residential Shared Loss Agreement, deposit growth, the available for sale securities portfolio and FHLB advances.
For the years ended
December 31, 2016
and
2015
, net cash provided by operating activities was
$307.2 million
and
$217.9 million
, respectively, compared to net cash used in operating activities of
$49.7 million
for
year ended December 31, 2014
. Accretion on ACI loans, which is reflected as a non-cash reduction in net income to arrive at operating cash flows, totaled
$303.9 million
,
$295.0 million
and
$338.9 million
for the years ended
December 31, 2016
,
2015
and
2014
, respectively. Accretable yield on ACI loans represents the excess of expected future cash flows over the carrying amount of the loans, and is recognized as interest income over the expected lives of the loans. Amounts recorded as accretion are realized in cash as individual loans are paid down or otherwise resolved; however, the timing of cash realization may differ from the timing of income recognition. These cash flows from the repayment or resolution of loans acquired in the FSB Acquisition, inclusive of amounts that have been accreted through earnings over time, are recognized as cash flows from investing activities in the consolidated statements of cash flows upon receipt. Cash generated by the repayment and resolution of loans acquired in the FSB Acquisition totaled $540.3 million, $635.1 million and $776.8 million for the years ended
December 31, 2016
,
2015
and
2014
, respectively. Cash payments from the FDIC in the form of reimbursements of losses related to the covered loans under the Loss Sharing Agreements are also characterized as investing cash flows. These reimbursements from the FDIC totaled
$46.1 million
,
$59.1 million
and
$114.9 million
for the years ended
December 31, 2016
,
2015
and
2014
, respectively. Both cash generated by the repayment and resolution of loans acquired in the FSB Acquisition and cash payments received from the FDIC have been and are expected to continue to be, although to a lesser extent in the future, consistent and relatively predictable sources of liquidity.
The percentage of assets comprised of ACI loans and percentage of interest income comprised of ACI accretion continues to decrease. As expected, cash flows from resolution of the loans acquired in the FSB Acquisition are being replaced by operating cash flows from new assets originated with those proceeds, resulting in increasing cash inflows from operating activities for the years ended
December 31, 2016
and
2015
. We anticipate that we will continue to generate cash inflows from operating activities in the future. In addition to cash provided by operating activities, the repayment and resolution of covered loans and payments under the Single Family Shared-Loss Agreement from the FDIC, BankUnited’s liquidity needs, particularly liquidity to fund growth of interest earning assets, have been and continue to be met by deposit growth and FHLB advances. The investment portfolio also provides a source of liquidity.
BankUnited has access to additional liquidity through FHLB advances, other collateralized borrowings, wholesale deposits or the sale of available for sale securities. At
December 31, 2016
, unencumbered investment securities available for sale totaled
$4.2 billion
. At
December 31, 2016
, BankUnited had available borrowing capacity at the FHLB of
$2.9 billion
, unused borrowing capacity at the FRB of
$327 million
and unused Federal funds lines of credit totaling
$70 million
. Management also has the ability to exert substantial control over the rate and timing of growth of the new loan portfolio, and resultant requirements for liquidity to fund new loans.
Continued runoff of the covered loan portfolio and FDIC indemnification asset and growth of deposits and the new loan portfolio are the most significant trends expected to impact the Bank’s liquidity in the near term.
The ALCO policy has established several measures of liquidity which are monitored monthly by the ALCO and quarterly by the Board of Directors. One primary measure of liquidity monitored by management is the 30 day total liquidity ratio, defined as (a) the sum of cash and cash equivalents, pledgeable securities and a measure of funds expected to be generated by operations over the next 30 days; divided by (b) the sum of potential deposit runoff, liabilities maturing within the 30 day timeframe and a measure of funds expected to be used in operations over the next 30 days. BankUnited’s liquidity is considered
78
acceptable if the 30 day total liquidity ratio exceeds 100%. At
December 31, 2016
, BankUnited’s 30 day total liquidity ratio was
162%
. Management also monitors a one year liquidity ratio, defined as (a) cash and cash equivalents, pledgeable securities, unused borrowing capacity at the FHLB, and loans and non-agency securities maturing within one year; divided by (b) forecasted deposit outflows and borrowings maturing within one year. Forecasted deposit outflows, excluding certificate of deposits, are based on retention rates derived from the most recent external core deposit analysis obtained by the Company. This ratio allows management to monitor liquidity over a longer time horizon. The acceptable threshold established by the ALCO for this liquidity measure is 100%. At
December 31, 2016
, BankUnited’s one year liquidity ratio was
131%
. Additional measures of liquidity regularly monitored by the ALCO include the ratio of wholesale funding to total assets, the ratio of FHLB advances to tier 1 capital plus the ALLL, a measure of available liquidity to volatile liabilities and the ratio of brokered deposits to total deposits. At
December 31, 2016
, BankUnited was within acceptable limits established by the ALCO and the Board of Directors for each of these measures.
As a holding company, BankUnited, Inc. is a corporation separate and apart from its banking subsidiary, and therefore, provides for its own liquidity. BankUnited, Inc.’s main sources of funds include management fees and dividends from the Bank, access to capital markets and, to a lesser extent, its own available for sale securities portfolio. There are regulatory limitations that affect the ability of the Bank to pay dividends to BankUnited, Inc. Management believes that such limitations will not impact our ability to meet our ongoing near-term cash obligations.
We expect that our liquidity requirements will continue to be satisfied over the next 12 months through the sources of funds described above.
Interest Rate Risk
The principal component of the Company’s risk of loss arising from adverse changes in the fair value of financial instruments, or market risk, is interest rate risk, including the risk that assets and liabilities with similar re-pricing characteristics may not reprice at the same time or to the same degree. A primary objective of the Company’s asset/liability management activities is to maximize net interest income, while maintaining acceptable levels of interest rate risk. The ALCO is responsible for establishing policies to limit exposure to interest rate risk, and to ensure procedures are established to monitor compliance with these policies. The guidelines established by the ALCO are approved at least annually by the Board of Directors.
Management believes that the simulation of net interest income in different interest rate environments provides the most meaningful measure of interest rate risk. Income simulation analysis is designed to capture not only the potential of all assets and liabilities to mature or reprice, but also the probability that they will do so. Income simulation also attends to the relative interest rate sensitivities of these items, and projects their behavior over an extended period of time. Finally, income simulation permits management to assess the probable effects on the balance sheet not only of changes in interest rates, but also of proposed strategies for responding to them.
The income simulation model analyzes interest rate sensitivity by projecting net interest income over twelve and twenty-four month periods in a most likely rate scenario based on consensus forward interest rate curves versus net interest income in alternative rate scenarios. Simulations are generated based on both static and dynamic balance sheet assumptions. Management continually reviews and refines its interest rate risk management process in response to changes in the interest rate environment and economic climate. Currently, our model projects a down 100, plus 100, plus 200 and plus 300 basis point change with rates increasing by the magnitude of the rate ramp evenly over the next 12 months as well as flattening yield curve scenarios and instantaneous rate shocks of down 100, plus 100, plus 200 and plus 300 basis points. We continually evaluate the scenarios being modeled with a view toward adapting them to changing economic conditions, expectations and trends.
79
The Company’s ALCO policy provides that net interest income sensitivity will be considered acceptable if decreases in forecast net interest income, based on a dynamic forecasted balance sheet, in specified rate shock scenarios are within specified percentages of forecast net interest income in the most likely rate scenario over the next twelve months and in the second year. The following table illustrates the acceptable limits as defined by policy and the impact on forecasted net interest income of down 100, plus 100, plus 200 and plus 300 basis point rate shock scenarios at
December 31, 2016
and
2015
:
|
Down 100
|
Plus 100
|
Plus 200
|
Plus 300
|
||||||||
|
Policy Limits:
|
|||||||||||
|
In year 1
|
(6.0
|
)%
|
(6.0
|
)%
|
(10.0
|
)%
|
(14.0
|
)%
|
|||
|
In year 2
|
(9.0
|
)%
|
(9.0
|
)%
|
(13.0
|
)%
|
(17.0
|
)%
|
|||
|
Model Results at December 31, 2016 - increase (decrease):
|
|||||||||||
|
In year 1
|
(2.0
|
)%
|
1.5
|
%
|
2.8
|
%
|
3.4
|
%
|
|||
|
In year 2
|
(3.7
|
)%
|
2.6
|
%
|
4.6
|
%
|
6.6
|
%
|
|||
|
Model Results at December 31, 2015 - increase (decrease)
(1)
:
|
|||||||||||
|
In year 1
|
N/A
|
|
2.5
|
%
|
5.2
|
%
|
7.8
|
%
|
|||
|
In year 2
|
N/A
|
|
2.1
|
%
|
4.0
|
%
|
5.9
|
%
|
|||
_____________________________________________________
(1) The Bank did not model decreasing interest rate scenarios at December 31, 2015.
Management also simulates changes in EVE in various interest rate environments. The ALCO policy has established parameters of acceptable risk that are defined in terms of the percentage change in EVE from a base scenario under six rate scenarios, derived by implementing immediate parallel movements of plus and minus 100, 200 and 300 basis points from current rates. We did not simulate decreases in interest rates greater than 100 basis points at
December 31, 2016
due to the current low rate environment. The parameters established by the ALCO stipulate that the modeled decline in EVE is considered acceptable if the decline is less than 9%, 18% and 27% in plus or minus 100, plus or minus 200 and plus or minus 300 basis point scenarios, respectively. As of
December 31, 2016
, our simulation for the Company indicated percentage changes from base EVE of 2.3%,
(4.1)%
,
(9.1)%
and
(13.8)%
in down 100, plus 100, plus 200 and plus 300 basis point scenarios, respectively.
These measures fall within an acceptable level of interest rate risk per the policies established by the ALCO and the Board of Directors. In the event the models indicate an unacceptable level of risk, the Company could undertake a number of actions that would reduce this risk, including the sale or re-positioning of a portion of its available for sale investment portfolio, restructuring of borrowings, or the use of derivatives such as interest rate swaps and caps.
Many assumptions were used by the Company to calculate the impact of changes in interest rates, including the change in rates. Actual results may not be similar to the Company’s projections due to several factors including the timing and frequency of rate changes, market conditions, changes in depositor behavior and the shape of the yield curve. Actual results may also differ due to the Company’s actions, if any, in response to changing rates and conditions.
Derivative Financial Instruments
Interest rate swaps are one of the tools we use to manage interest rate risk. These derivative instruments are used to mitigate exposure to changes in interest rates on variable rate borrowings such as FHLB advances and time deposits and to manage duration of liabilities. These interest rate swaps are designated as cash flow hedging instruments. The fair value of these instruments is included in other assets and other liabilities in our consolidated balance sheets and changes in fair value are reported in accumulated other comprehensive income. At
December 31, 2016
, outstanding interest rate swaps designated as cash flow hedges had an aggregate notional amount of
$2.0 billion
. The aggregate fair value of interest rate swaps designated as cash flow hedges included in other liabilities was
$31 million
and the aggregate fair value of interest rate swaps designated as cash flow hedges included in other assets was
$20 million
.
Interest rate swaps and caps not designated as cash flow hedges had an aggregate notional amount of
$2.2 billion
at
December 31, 2016
. The aggregate fair value of these interest rate swaps and caps included in other assets was
$31 million
and the aggregate fair value included in other liabilities was
$31 million
. These interest rate swaps and caps were entered into as accommodations to certain of our commercial borrowers.
See
Note 12
to the Consolidated Financial Statements for additional information about derivative financial instruments.
80
Off-Balance Sheet Arrangements
Commitments
We routinely enter into commitments to extend credit to our customers, including commitments to fund loans or lines of credit and commercial and standby letters of credit. The credit risk associated with these commitments is essentially the same as that involved in extending loans to customers and they are subject to our normal credit policies and approval processes. While these commitments represent contractual cash requirements, a significant portion of commitments to extend credit may expire without being drawn upon. The following table details our outstanding commitments to extend credit as of
December 31, 2016
(in thousands):
|
Commitments to fund loans
|
$
|
587,064
|
|
|
Commitments to purchase loans
|
239,111
|
|
|
|
Unfunded commitments under lines of credit
|
1,821,229
|
|
|
|
Commercial and standby letters of credit
|
84,355
|
|
|
|
$
|
2,731,759
|
|
|
Contractual Obligations
The following table contains supplemental information regarding our significant outstanding contractual obligations, including interest to be paid on FHLB advances, long-term borrowings and time deposits, as of
December 31, 2016
(in thousands):
|
|
Total
|
Less than
1 year
|
1 - 3 years
|
3 - 5 years
|
More than
5 years
|
||||||||||||||
|
FHLB advances
|
$
|
5,263,904
|
|
$
|
5,107,631
|
|
$
|
80,774
|
|
$
|
75,499
|
|
$
|
—
|
|
||||
|
4.875% Senior notes due 2025
|
575,500
|
|
19,500
|
|
39,000
|
|
39,000
|
|
478,000
|
|
|||||||||
|
Operating lease obligations
|
157,547
|
|
23,192
|
|
42,843
|
|
32,114
|
|
59,398
|
|
|||||||||
|
Time deposits
|
5,824,950
|
|
4,336,145
|
|
1,089,425
|
|
399,360
|
|
20
|
|
|||||||||
|
Capital lease obligations
|
16,344
|
|
1,738
|
|
3,677
|
|
3,929
|
|
7,000
|
|
|||||||||
|
$
|
11,838,245
|
|
$
|
9,488,206
|
|
$
|
1,255,719
|
|
$
|
549,902
|
|
$
|
544,418
|
|
|||||
Non-GAAP Financial Measures
Tangible book value per common share is a non-GAAP financial measure. Management believes this measure is relevant to understanding the capital position and performance of the Company. Disclosure of this non-GAAP financial measure also provides a meaningful base for comparability to other financial institutions. The following table reconciles the non-GAAP financial measurement of tangible book value per common share to the comparable GAAP financial measurement of book value per common share at December 31 of the years indicated (in thousands except share and per share data):
|
2016
|
2015
|
2014
|
2013
|
2012
|
|||||||||||||||
|
Total stockholders’ equity
|
$
|
2,418,429
|
|
$
|
2,243,898
|
|
$
|
2,052,534
|
|
$
|
1,928,698
|
|
$
|
1,806,680
|
|
||||
|
Less: preferred equity
|
—
|
|
—
|
|
—
|
|
—
|
|
54,158
|
|
|||||||||
|
Common stockholders' equity
|
2,418,429
|
|
2,243,898
|
|
2,052,534
|
|
1,928,698
|
|
1,752,522
|
|
|||||||||
|
Less: goodwill and other intangible assets
|
78,047
|
|
78,330
|
|
68,414
|
|
69,067
|
|
69,768
|
|
|||||||||
|
Tangible stockholders’ equity
|
$
|
2,340,382
|
|
$
|
2,165,568
|
|
$
|
1,984,120
|
|
$
|
1,859,631
|
|
$
|
1,682,754
|
|
||||
|
|
|||||||||||||||||||
|
Common shares issued and outstanding
|
104,166,945
|
|
103,626,255
|
|
101,656,702
|
|
101,013,014
|
|
95,006,729
|
|
|||||||||
|
|
|||||||||||||||||||
|
Book value per common share
|
$
|
23.22
|
|
$
|
21.65
|
|
$
|
20.19
|
|
$
|
19.09
|
|
$
|
18.45
|
|
||||
|
|
|||||||||||||||||||
|
Tangible book value per common share
|
$
|
22.47
|
|
$
|
20.90
|
|
$
|
19.52
|
|
$
|
18.41
|
|
$
|
17.71
|
|
||||
81
Net income and earnings per diluted common share excluding the impact of a discrete income tax benefit and related professional fees are non-GAAP financial measures. Management believes disclosure of these measures enhances readers' ability to compare the Company's financial performance for the
year ended December 31, 2015
to that of other years presented. The following table reconciles these non-GAAP financial measurements to the comparable GAAP financial measurements of net income and earnings per diluted share for the
year ended December 31, 2015
(in thousands, except share and per share data):
|
Net income excluding the impact of a discrete income tax benefit and related professional fees:
|
||||
|
Net income (GAAP)
|
$
|
251,660
|
|
|
|
Less discrete income tax benefit
|
(49,323
|
)
|
||
|
Add back related professional fees, net of tax of $524
|
801
|
|
||
|
Net income excluding the impact of a discrete income tax benefit and related professional fees (non-GAAP)
|
$
|
203,138
|
|
|
|
Diluted earnings per common share, excluding the impact of a discrete income tax benefit and related professional fees:
|
||||
|
Diluted earnings per common share (GAAP)
|
$
|
2.35
|
|
|
|
Impact on diluted earnings per common share of discrete income tax benefit and related professional fees (non-GAAP)
|
(0.47
|
)
|
||
|
Impact on diluted earnings per common share of discrete income tax benefit and related professional fees allocated to participating securities (non-GAAP)
|
0.02
|
|
||
|
Diluted earnings per common share, excluding the impact of a discrete income tax benefit and related professional fees (non-GAAP)
|
$
|
1.90
|
|
|
|
Impact on diluted earnings per common share of discrete income tax benefit and related professional fees:
|
||||
|
Discrete income tax benefit and related professional fees, net of tax
|
$
|
(48,522
|
)
|
|
|
Weighted average shares for diluted earnings per share (GAAP)
|
102,972,150
|
|
||
|
Impact on diluted earnings per common share of discrete income tax benefit and related professional fees (non-GAAP)
|
$
|
(0.47
|
)
|
|
|
Impact on diluted earnings per common share of discrete income tax benefit and related professional fees allocated to participating securities:
|
||||
|
Discrete income tax benefit and related professional fees, net of tax, allocated to participating securities
|
$
|
1,881
|
|
|
|
Weighted average shares for diluted earnings per share (GAAP)
|
102,972,150
|
|
||
|
Impact on diluted earnings per common share of discrete income tax benefit and related professional fees allocated to participating securities (non-GAAP)
|
$
|
0.02
|
|
|
82
|
Return on average assets excluding the impact of a discrete income tax benefit and related professional fees:
|
||||
|
Return on average assets (GAAP)
|
1.18
|
%
|
||
|
Less impact on return on average assets of discrete income tax benefit and related professional fees
|
(0.23
|
)%
|
||
|
Return on average assets excluding the impact of a discrete income tax benefit and related professional fees (non-GAAP)
|
0.95
|
%
|
||
|
Impact on return on average assets of discrete income tax benefit and related professional fees:
|
||||
|
Discrete income tax benefit and related professional fees, net of tax
|
$
|
(48,522
|
)
|
|
|
Average assets (GAAP)
|
21,293,911
|
|
||
|
Impact on return on average assets of discrete income tax benefit and related professional fees (non-GAAP)
|
(0.23
|
)%
|
||
|
Return on average stockholders' equity excluding the impact of a discrete income tax benefit and related professional fees:
|
||||
|
Return on average stockholders' equity (GAAP)
|
11.62
|
%
|
||
|
Less impact on return on average stockholders' equity of discrete income tax benefit and related professional fees
|
(2.24
|
)%
|
||
|
Return on average stockholders' equity excluding the impact of a discrete income tax benefit and related professional fees (non-GAAP)
|
9.38
|
%
|
||
|
Impact on return on average stockholders' equity of discrete income tax benefit and related professional fees:
|
||||
|
Discrete income tax benefit and related professional fees, net of tax
|
$
|
(48,522
|
)
|
|
|
Average stockholder's equity (GAAP)
|
2,165,515
|
|
||
|
Impact on return on average assets of discrete income tax benefit and related professional fees (non-GAAP)
|
(2.24
|
)%
|
||
See the section entitled “Interest Rate Risk” included in Item 7. “Management’s Discussion and Analysis of Financial Condition and Results of Operations.”
83
INDEX TO CONSOLIDATED FINANCIAL STATEMENTS
|
Page
|
|
|
BankUnited, Inc. Consolidated Financial Statements for the Years ended December 31, 2016, 2015 and 2014
|
|
F-1
MANAGEMENT'S REPORT ON INTERNAL CONTROL OVER FINANCIAL REPORTING
Management is responsible for establishing and maintaining adequate internal control over financial reporting, as such term is defined in the Securities Exchange Act of 1934 Rule 13a-15(f). The Company's internal control over financial reporting includes those policies and procedures that (i) pertain to the maintenance of records that, in reasonable detail, accurately and fairly reflect the transactions and dispositions of the assets of the Company; (ii) provide reasonable assurance that transactions are recorded as necessary to permit preparation of financial statements in accordance with generally accepted accounting principles, and that receipts and expenditures of the Company are being made only in accordance with authorizations of management and directors of the Company; and (iii) provide reasonable assurance regarding prevention or timely detection of unauthorized acquisition, use, or disposition of the Company's assets that could have a material effect on the financial statements.
Internal control over financial reporting is designed to provide reasonable assurance regarding the reliability of financial reporting and the preparation of financial statements prepared for external purposes in accordance with generally accepted accounting principles. Because of its inherent limitations, internal control over financial reporting may not prevent or detect misstatements. Also, projections of any evaluation of effectiveness to future periods are subject to the risk that controls may become inadequate because of changes in conditions, or that the degree of compliance with the policies or procedures may deteriorate.
Under the supervision and with the participation of management, including the Company's principal executive officer and principal financial officer, the Company conducted an evaluation of the effectiveness of the Company's internal control over financial reporting based on the framework in
Internal Control—Integrated Framework (2013)
issued by the Committee of Sponsoring Organizations of the Treadway Commission. Based on the Company's evaluation under the framework in Internal Control—Integrated Framework, management concluded that the Company's internal control over financial reporting was effective as of
December 31, 2016
.
The effectiveness of the Company's internal control over financial reporting as of
December 31, 2016
has been audited by KPMG LLP, an independent registered public accounting firm, as stated in their report which is included herein.
F-2
Report of Independent Registered Public Accounting Firm
The Board of Directors and Stockholders
BankUnited, Inc.:
We have audited the accompanying consolidated balance sheets of BankUnited, Inc. and subsidiaries (the Company) as of
December 31, 2016
and
2015
, and the related consolidated statements of income, comprehensive income, cash flows, and stockholders’ equity for each of the years in the three‑year period ended
December 31, 2016
. These consolidated financial statements are the responsibility of the Company’s management. Our responsibility is to express an opinion on these consolidated financial statements based on our audits.
We conducted our audits in accordance with the standards of the Public Company Accounting Oversight Board (United States). Those standards require that we plan and perform the audit to obtain reasonable assurance about whether the financial statements are free of material misstatement. An audit includes examining, on a test basis, evidence supporting the amounts and disclosures in the financial statements. An audit also includes assessing the accounting principles used and significant estimates made by management, as well as evaluating the overall financial statement presentation. We believe that our audits provide a reasonable basis for our opinion.
In our opinion, the consolidated financial statements referred to above present fairly, in all material respects, the financial position of BankUnited, Inc. and subsidiaries as of
December 31, 2016
and
2015
, and the results of their operations and their cash flows for each of the years in the three‑year period ended
December 31, 2016
, in conformity with U.S. generally accepted accounting principles.
We have also audited, in accordance with the standards of the Public Company Accounting Oversight Board (United States), the Company’s internal control over financial reporting as of
December 31, 2016
, based on criteria established in
Internal Control - Integrated Framework
(2013)
issued by the Committee of Sponsoring Organizations of the Treadway Commission, and our report dated February 27, 2017 expressed an unqualified opinion on the effectiveness of the Company’s internal control over financial reporting.
/s/KPMG LLP
February 27, 2017
Miami, Florida
Certified Public Accountants
F-3
Report of Independent Registered Public Accounting Firm
The Board of Directors and Stockholders
BankUnited, Inc.:
We have audited BankUnited, Inc. and subsidiaries’ (the Company) internal control over financial reporting as of
December 31, 2016
, based on criteria established in
Internal Control - Integrated Framework
(2013)
issued by the Committee of Sponsoring Organizations of the Treadway Commission. The Company’s management is responsible for maintaining effective internal control over financial reporting and for its assessment of the effectiveness of internal control over financial reporting, included in the accompanying Management’s Report on Internal Control over Financial Reporting. Our responsibility is to express an opinion on the Company’s internal control over financial reporting based on our audit.
We conducted our audit in accordance with the standards of the Public Company Accounting Oversight Board (United States). Those standards require that we plan and perform the audit to obtain reasonable assurance about whether effective internal control over financial reporting was maintained in all material respects. Our audit included obtaining an understanding of internal control over financial reporting, assessing the risk that a material weakness exists, and testing and evaluating the design and operating effectiveness of internal control based on the assessed risk. Our audit also included performing such other procedures as we considered necessary in the circumstances. We believe that our audit provides a reasonable basis for our opinion.
A company’s internal control over financial reporting is a process designed to provide reasonable assurance regarding the reliability of financial reporting and the preparation of financial statements for external purposes in accordance with generally accepted accounting principles. A company’s internal control over financial reporting includes those policies and procedures that (1) pertain to the maintenance of records that, in reasonable detail, accurately and fairly reflect the transactions and dispositions of the assets of the company; (2) provide reasonable assurance that transactions are recorded as necessary to permit preparation of financial statements in accordance with generally accepted accounting principles, and that receipts and expenditures of the company are being made only in accordance with authorizations of management and directors of the company; and (3) provide reasonable assurance regarding prevention or timely detection of unauthorized acquisition, use, or disposition of the company’s assets that could have a material effect on the financial statements.
Because of its inherent limitations, internal control over financial reporting may not prevent or detect misstatements. Also, projections of any evaluation of effectiveness to future periods are subject to the risk that controls may become inadequate because of changes in conditions, or that the degree of compliance with the policies or procedures may deteriorate.
In our opinion, BankUnited, Inc. and subsidiaries maintained, in all material respects, effective internal control over financial reporting as of
December 31, 2016
, based on criteria established in
Internal Control - Integrated Framework (2013)
issued by the Committee of Sponsoring Organizations of the Treadway Commission.
We also have audited, in accordance with the standards of the Public Company Accounting Oversight Board (United States), the consolidated balance sheets of the Company as of
December 31, 2016
and
2015
, and the related consolidated statements of income, comprehensive income, cash flows, and stockholders’ equity for each of the years in the three‑year period ended
December 31, 2016
, and our report dated February 27, 2017 expressed an unqualified opinion on those consolidated financial statements.
/s/KPMG LLP
February 27, 2017
Miami, Florida
Certified Public Accountants
F-4
BANKUNITED, INC. AND SUBSIDIARIES
CONSOLIDATED BALANCE SHEETS
(In thousands, except share and per share data)
|
December 31,
2016 |
December 31,
2015 |
||||||
|
ASSETS
|
|
|
|
|
|||
|
Cash and due from banks:
|
|
|
|
|
|||
|
Non-interest bearing
|
$
|
40,260
|
|
$
|
31,515
|
|
|
|
Interest bearing
|
35,413
|
|
43,619
|
|
|||
|
Interest bearing deposits at Federal Reserve Bank
|
372,640
|
|
192,366
|
|
|||
|
Cash and cash equivalents
|
448,313
|
|
267,500
|
|
|||
|
Investment securities available for sale, at fair value
|
6,073,584
|
|
4,859,539
|
|
|||
|
Investment securities held to maturity
|
10,000
|
|
10,000
|
|
|||
|
Non-marketable equity securities
|
284,272
|
|
219,997
|
|
|||
|
Loans held for sale
|
41,198
|
|
47,410
|
|
|||
|
Loans (including covered loans of $614,042 and $809,540)
|
19,395,394
|
|
16,636,603
|
|
|||
|
Allowance for loan and lease losses
|
(152,953
|
)
|
(125,828
|
)
|
|||
|
Loans, net
|
19,242,441
|
|
16,510,775
|
|
|||
|
FDIC indemnification asset
|
515,933
|
|
739,880
|
|
|||
|
Bank owned life insurance
|
239,736
|
|
225,867
|
|
|||
|
Equipment under operating lease, net
|
539,914
|
|
483,518
|
|
|||
|
Deferred tax asset, net
|
62,940
|
|
105,577
|
|
|||
|
Goodwill and other intangible assets
|
78,047
|
|
78,330
|
|
|||
|
Other assets
|
343,773
|
|
335,074
|
|
|||
|
Total assets
|
$
|
27,880,151
|
|
$
|
23,883,467
|
|
|
|
LIABILITIES AND STOCKHOLDERS’ EQUITY
|
|
|
|
|
|||
|
Liabilities:
|
|
|
|
|
|||
|
Demand deposits:
|
|
|
|
|
|||
|
Non-interest bearing
|
$
|
2,960,591
|
|
$
|
2,874,533
|
|
|
|
Interest bearing
|
1,523,064
|
|
1,167,537
|
|
|||
|
Savings and money market
|
9,251,593
|
|
8,288,340
|
|
|||
|
Time
|
5,755,642
|
|
4,608,091
|
|
|||
|
Total deposits
|
19,490,890
|
|
16,938,501
|
|
|||
|
Federal Home Loan Bank advances
|
5,239,348
|
|
4,008,464
|
|
|||
|
Notes and other borrowings
|
402,809
|
|
402,545
|
|
|||
|
Other liabilities
|
328,675
|
|
290,059
|
|
|||
|
Total liabilities
|
25,461,722
|
|
21,639,569
|
|
|||
|
Commitments and contingencies
|
|
|
|
|
|||
|
Stockholders' equity:
|
|
|
|
|
|||
|
Common stock, par value $0.01 per share, 400,000,000 shares authorized; 104,166,945 and 103,626,255 shares issued and outstanding
|
1,042
|
|
1,036
|
|
|||
|
Paid-in capital
|
1,426,459
|
|
1,406,786
|
|
|||
|
Retained earnings
|
949,681
|
|
813,894
|
|
|||
|
Accumulated other comprehensive income
|
41,247
|
|
22,182
|
|
|||
|
Total stockholders' equity
|
2,418,429
|
|
2,243,898
|
|
|||
|
Total liabilities and stockholders' equity
|
$
|
27,880,151
|
|
$
|
23,883,467
|
|
|
The accompanying notes are an integral part of these consolidated financial statements.
F-5
BANKUNITED, INC. AND SUBSIDIARIES
CONSOLIDATED STATEMENTS OF INCOME
(In thousands, except per share data)
|
|
Years Ended December 31,
|
||||||||||
|
|
2016
|
2015
|
2014
|
||||||||
|
Interest income:
|
|
|
|
|
|||||||
|
Loans
|
$
|
896,154
|
|
$
|
753,901
|
|
$
|
667,237
|
|
||
|
Investment securities
|
150,859
|
|
116,817
|
|
108,662
|
|
|||||
|
Other
|
12,204
|
|
10,098
|
|
7,845
|
|
|||||
|
Total interest income
|
1,059,217
|
|
880,816
|
|
783,744
|
|
|||||
|
Interest expense:
|
|||||||||||
|
Deposits
|
119,773
|
|
91,151
|
|
72,961
|
|
|||||
|
Borrowings
|
69,059
|
|
44,013
|
|
33,690
|
|
|||||
|
Total interest expense
|
188,832
|
|
135,164
|
|
106,651
|
|
|||||
|
Net interest income before provision for loan losses
|
870,385
|
|
745,652
|
|
677,093
|
|
|||||
|
Provision for (recovery of) loan losses (including $(1,681), $2,251 and $(243) for covered loans)
|
50,911
|
|
44,311
|
|
41,505
|
|
|||||
|
Net interest income after provision for loan losses
|
819,474
|
|
701,341
|
|
635,588
|
|
|||||
|
Non-interest income:
|
|||||||||||
|
Income from resolution of covered assets, net
|
36,155
|
|
50,658
|
|
49,082
|
|
|||||
|
Net loss on FDIC indemnification
|
(17,759
|
)
|
(65,942
|
)
|
(46,396
|
)
|
|||||
|
Service charges and fees
|
19,463
|
|
17,876
|
|
16,612
|
|
|||||
|
Gain (loss) on sale of loans, net (including gain (loss) related to covered loans of $(14,470) $34,929 and $20,369)
|
(4,406
|
)
|
40,633
|
|
21,047
|
|
|||||
|
Gain on investment securities available for sale, net
|
14,461
|
|
8,480
|
|
3,859
|
|
|||||
|
Lease financing
|
44,738
|
|
35,641
|
|
21,601
|
|
|||||
|
Other non-interest income
|
13,765
|
|
14,878
|
|
18,360
|
|
|||||
|
Total non-interest income
|
106,417
|
|
102,224
|
|
84,165
|
|
|||||
|
Non-interest expense:
|
|||||||||||
|
Employee compensation and benefits
|
223,011
|
|
210,104
|
|
195,218
|
|
|||||
|
Occupancy and equipment
|
76,003
|
|
76,024
|
|
70,520
|
|
|||||
|
Amortization of FDIC indemnification asset
|
160,091
|
|
109,411
|
|
69,470
|
|
|||||
|
Deposit insurance expense
|
17,806
|
|
14,257
|
|
9,348
|
|
|||||
|
Professional fees
|
14,249
|
|
14,185
|
|
13,178
|
|
|||||
|
Telecommunications and data processing
|
14,343
|
|
13,613
|
|
13,381
|
|
|||||
|
Depreciation of equipment under operating lease
|
31,580
|
|
18,369
|
|
8,759
|
|
|||||
|
Other non-interest expense
|
53,364
|
|
50,709
|
|
46,629
|
|
|||||
|
Total non-interest expense
|
590,447
|
|
506,672
|
|
426,503
|
|
|||||
|
Income before income taxes
|
335,444
|
|
296,893
|
|
293,250
|
|
|||||
|
Provision for income taxes
|
109,703
|
|
45,233
|
|
89,035
|
|
|||||
|
Net income
|
$
|
225,741
|
|
$
|
251,660
|
|
$
|
204,215
|
|
||
|
Earnings per common share, basic (see Note 2)
|
$
|
2.11
|
|
$
|
2.37
|
|
$
|
1.95
|
|
||
|
Earnings per common share, diluted (see Note 2)
|
$
|
2.09
|
|
$
|
2.35
|
|
$
|
1.95
|
|
||
|
Cash dividends declared per common share
|
$
|
0.84
|
|
$
|
0.84
|
|
$
|
0.84
|
|
||
The accompanying notes are an integral part of these consolidated financial statements.
F-6
BANKUNITED, INC. AND SUBSIDIARIES
CONSOLIDATED STATEMENTS OF COMPREHENSIVE INCOME
(In thousands)
|
|
Years Ended December 31,
|
||||||||||
|
|
2016
|
2015
|
2014
|
||||||||
|
Net income
|
$
|
225,741
|
|
$
|
251,660
|
|
$
|
204,215
|
|
||
|
Other comprehensive income (loss), net of tax:
|
|
|
|||||||||
|
Unrealized gains on investment securities available for sale:
|
|
|
|||||||||
|
Net unrealized holding gain (loss) arising during the period
|
14,271
|
|
(21,657
|
)
|
1,939
|
|
|||||
|
Reclassification adjustment for net securities gains realized in income
|
(8,749
|
)
|
(5,130
|
)
|
(2,370
|
)
|
|||||
|
Net change in unrealized gains on securities available for sale
|
5,522
|
|
(26,787
|
)
|
(431
|
)
|
|||||
|
Unrealized losses on derivative instruments:
|
|
|
|||||||||
|
Net unrealized holding gain (loss) arising during the period
|
3,766
|
|
(13,403
|
)
|
(27,080
|
)
|
|||||
|
Reclassification adjustment for net losses realized in income
|
9,777
|
|
16,020
|
|
16,383
|
|
|||||
|
Net change in unrealized losses on derivative instruments
|
13,543
|
|
2,617
|
|
(10,697
|
)
|
|||||
|
Other comprehensive income (loss)
|
19,065
|
|
(24,170
|
)
|
(11,128
|
)
|
|||||
|
Comprehensive income
|
$
|
244,806
|
|
$
|
227,490
|
|
$
|
193,087
|
|
||
The accompanying notes are an integral part of these consolidated financial statements.
F-7
BANKUNITED, INC. AND SUBSIDIARIES
(In thousands)
|
|
Years Ended December 31,
|
||||||||||
|
|
2016
|
2015
|
2014
|
||||||||
|
Cash flows from operating activities:
|
|
|
|
|
|||||||
|
Net income
|
$
|
225,741
|
|
$
|
251,660
|
|
$
|
204,215
|
|
||
|
Adjustments to reconcile net income to net cash provided by (used in) operating activities:
|
|||||||||||
|
Amortization and accretion, net
|
(113,979
|
)
|
(164,376
|
)
|
(258,433
|
)
|
|||||
|
Provision for loan losses
|
50,911
|
|
44,311
|
|
41,505
|
|
|||||
|
Income from resolution of covered assets, net
|
(36,155
|
)
|
(50,658
|
)
|
(49,082
|
)
|
|||||
|
Net loss on FDIC indemnification
|
17,759
|
|
65,942
|
|
46,396
|
|
|||||
|
(Gain) loss on sale of loans, net
|
4,406
|
|
(40,633
|
)
|
(21,047
|
)
|
|||||
|
Increase in cash surrender value of bank owned life insurance
|
(3,469
|
)
|
(3,102
|
)
|
(3,009
|
)
|
|||||
|
Gain on investment securities available for sale, net
|
(14,461
|
)
|
(8,480
|
)
|
(3,859
|
)
|
|||||
|
Equity based compensation
|
18,032
|
|
16,027
|
|
15,551
|
|
|||||
|
Depreciation and amortization
|
56,444
|
|
43,390
|
|
31,552
|
|
|||||
|
Deferred income taxes
|
30,189
|
|
29,471
|
|
(39,577
|
)
|
|||||
|
Proceeds from sale of loans held for sale
|
163,088
|
|
169,139
|
|
22,387
|
|
|||||
|
Loans originated for sale, net of repayments
|
(148,195
|
)
|
(130,819
|
)
|
(23,088
|
)
|
|||||
|
Realized tax benefits from dividend equivalents and equity based compensation
|
(1,340
|
)
|
(1,593
|
)
|
(2,123
|
)
|
|||||
|
Other:
|
|||||||||||
|
(Increase) decrease in other assets
|
24,840
|
|
(34,315
|
)
|
(35,326
|
)
|
|||||
|
Increase in other liabilities
|
33,359
|
|
31,922
|
|
24,192
|
|
|||||
|
Net cash provided by (used in) operating activities
|
307,170
|
|
217,886
|
|
(49,746
|
)
|
|||||
|
Cash flows from investing activities:
|
|
|
|
|
|||||||
|
Net cash paid in business combination
|
—
|
|
(277,553
|
)
|
—
|
|
|||||
|
Purchase of investment securities
|
(3,058,106
|
)
|
(2,093,508
|
)
|
(1,549,649
|
)
|
|||||
|
Proceeds from repayments and calls of investment securities available for sale
|
724,666
|
|
537,992
|
|
362,552
|
|
|||||
|
Proceeds from sale of investment securities available for sale
|
1,127,983
|
|
1,114,020
|
|
355,798
|
|
|||||
|
Purchase of non-marketable equity securities
|
(255,100
|
)
|
(141,599
|
)
|
(82,800
|
)
|
|||||
|
Proceeds from redemption of non-marketable equity securities
|
190,825
|
|
113,276
|
|
43,192
|
|
|||||
|
Purchases of loans
|
(1,266,097
|
)
|
(787,834
|
)
|
(955,995
|
)
|
|||||
|
Loan originations, repayments and resolutions, net
|
(1,394,916
|
)
|
(3,128,701
|
)
|
(2,617,273
|
)
|
|||||
|
Proceeds from sale of loans, net
|
171,367
|
|
207,425
|
|
624,362
|
|
|||||
|
Decrease in FDIC indemnification asset for claims filed
|
46,083
|
|
59,139
|
|
114,916
|
|
|||||
|
Acquisition of equipment under operating lease, net
|
(87,976
|
)
|
(187,329
|
)
|
(126,834
|
)
|
|||||
|
Other investing activities
|
(24,960
|
)
|
(24,020
|
)
|
23,924
|
|
|||||
|
Net cash used in investing activities
|
(3,826,231
|
)
|
(4,608,692
|
)
|
(3,807,807
|
)
|
|||||
|
(Continued)
|
|
||||||||||
The accompanying notes are an integral part of these consolidated financial statements.
F-8
BANKUNITED, INC. AND SUBSIDIARIES
CONSOLIDATED STATEMENTS OF CASH FLOWS (Continued)
(In thousands)
|
Years Ended December 31,
|
|||||||||||
|
2016
|
2015
|
2014
|
|||||||||
|
Cash flows from financing activities:
|
|
|
|
|
|||||||
|
Net increase in deposits
|
2,552,389
|
|
3,426,755
|
|
2,979,340
|
|
|||||
|
Additions to Federal Home Loan Bank advances
|
4,025,000
|
|
3,180,000
|
|
2,760,000
|
|
|||||
|
Repayments of Federal Home Loan Bank advances
|
(2,795,000
|
)
|
(2,480,350
|
)
|
(1,865,000
|
)
|
|||||
|
Proceeds from issuance of notes, net
|
—
|
|
392,252
|
|
—
|
|
|||||
|
Dividends paid
|
(89,824
|
)
|
(88,981
|
)
|
(87,716
|
)
|
|||||
|
Exercise of stock options
|
791
|
|
35,647
|
|
926
|
|
|||||
|
Other financing activities
|
6,518
|
|
5,466
|
|
4,771
|
|
|||||
|
Net cash provided by financing activities
|
3,699,874
|
|
4,470,789
|
|
3,792,321
|
|
|||||
|
Net increase (decrease) in cash and cash equivalents
|
180,813
|
|
79,983
|
|
(65,232
|
)
|
|||||
|
Cash and cash equivalents, beginning of period
|
267,500
|
|
187,517
|
|
252,749
|
|
|||||
|
Cash and cash equivalents, end of period
|
$
|
448,313
|
|
$
|
267,500
|
|
$
|
187,517
|
|
||
|
Supplemental disclosure of cash flow information:
|
|||||||||||
|
Interest paid
|
$
|
186,525
|
|
$
|
130,963
|
|
$
|
105,386
|
|
||
|
Income taxes paid, net
|
$
|
16,464
|
|
$
|
29,346
|
|
$
|
129,987
|
|
||
|
Supplemental schedule of non-cash investing and financing activities:
|
|||||||||||
|
Transfers from loans to other real estate owned and other repossessed assets
|
$
|
17,045
|
|
$
|
17,541
|
|
$
|
26,564
|
|
||
|
Disbursement of loan proceeds from escrow
|
$
|
—
|
|
$
|
—
|
|
$
|
52,500
|
|
||
|
Dividends declared, not paid
|
$
|
22,510
|
|
$
|
22,380
|
|
$
|
21,968
|
|
||
|
Unsettled purchases of investment securities available for sale
|
$
|
—
|
|
$
|
—
|
|
$
|
124,767
|
|
||
|
Acquisition of assets under capital lease
|
$
|
—
|
|
$
|
—
|
|
$
|
9,035
|
|
||
|
Obligations incurred in acquisition of affordable housing limited partnerships
|
$
|
12,750
|
|
$
|
57,139
|
|
$
|
—
|
|
||
The accompanying notes are an integral part of these consolidated financial statements.
F-9
BANKUNITED, INC. AND SUBSIDIARIES
CONSOLIDATED STATEMENTS OF STOCKHOLDERS’ EQUITY
(In thousands, except share data)
|
|
Common
Shares
Outstanding
|
Common
Stock
|
Paid-in
Capital
|
Retained
Earnings
|
Accumulated
Other
Comprehensive
Income
|
Total
Stockholders’
Equity
|
||||||||||||||||
|
Balance at December 31, 2013
|
101,013,014
|
|
$
|
1,010
|
|
$
|
1,334,945
|
|
$
|
535,263
|
|
$
|
57,480
|
|
$
|
1,928,698
|
|
|||||
|
Comprehensive income
|
—
|
|
—
|
|
—
|
|
204,215
|
|
(11,128
|
)
|
193,087
|
|
||||||||||
|
Dividends
|
—
|
|
—
|
|
—
|
|
(87,851
|
)
|
—
|
|
(87,851
|
)
|
||||||||||
|
Equity based compensation
|
699,529
|
|
7
|
|
15,544
|
|
—
|
|
—
|
|
15,551
|
|
||||||||||
|
Forfeiture of unvested shares
|
(111,264
|
)
|
(1
|
)
|
1
|
|
—
|
|
—
|
|
—
|
|
||||||||||
|
Exercise of stock options
|
55,423
|
|
1
|
|
925
|
|
—
|
|
—
|
|
926
|
|
||||||||||
|
Tax benefits from dividend equivalents and equity based compensation
|
—
|
|
—
|
|
2,123
|
|
—
|
|
—
|
|
2,123
|
|
||||||||||
|
Balance at December 31, 2014
|
101,656,702
|
|
1,017
|
|
1,353,538
|
|
651,627
|
|
46,352
|
|
2,052,534
|
|
||||||||||
|
Comprehensive income
|
—
|
|
—
|
|
—
|
|
251,660
|
|
(24,170
|
)
|
227,490
|
|
||||||||||
|
Dividends
|
—
|
|
—
|
|
—
|
|
(89,393
|
)
|
—
|
|
(89,393
|
)
|
||||||||||
|
Equity based compensation
|
664,928
|
|
7
|
|
16,020
|
|
—
|
|
—
|
|
16,027
|
|
||||||||||
|
Forfeiture of unvested shares
|
(59,270
|
)
|
(1
|
)
|
1
|
|
—
|
|
—
|
|
—
|
|
||||||||||
|
Exercise of stock options
|
1,363,895
|
|
13
|
|
35,634
|
|
—
|
|
—
|
|
35,647
|
|
||||||||||
|
Tax benefits from dividend equivalents and equity based compensation
|
—
|
|
—
|
|
1,593
|
|
—
|
|
—
|
|
1,593
|
|
||||||||||
|
Balance at December 31, 2015
|
103,626,255
|
|
1,036
|
|
1,406,786
|
|
813,894
|
|
22,182
|
|
2,243,898
|
|
||||||||||
|
Comprehensive income
|
—
|
|
—
|
|
—
|
|
225,741
|
|
19,065
|
|
244,806
|
|
||||||||||
|
Dividends
|
—
|
|
—
|
|
—
|
|
(89,954
|
)
|
—
|
|
(89,954
|
)
|
||||||||||
|
Equity based compensation
|
635,989
|
|
7
|
|
17,541
|
|
—
|
|
—
|
|
17,548
|
|
||||||||||
|
Forfeiture of unvested shares
|
(143,278
|
)
|
(1
|
)
|
1
|
|
—
|
|
—
|
|
—
|
|
||||||||||
|
Exercise of stock options
|
47,979
|
|
—
|
|
791
|
|
—
|
|
—
|
|
791
|
|
||||||||||
|
Tax benefits from dividend equivalents and equity based compensation
|
—
|
|
—
|
|
1,340
|
|
—
|
|
—
|
|
1,340
|
|
||||||||||
|
Balance at December 31, 2016
|
104,166,945
|
|
$
|
1,042
|
|
$
|
1,426,459
|
|
$
|
949,681
|
|
$
|
41,247
|
|
$
|
2,418,429
|
|
|||||
The accompanying notes are an integral part of these consolidated financial statements.
F-10
BANKUNITED, INC. AND SUBSIDIARIES
NOTES TO CONSOLIDATED FINANCIAL STATEMENTS
December 31, 2016
BankUnited, Inc. is a national bank holding company with
one
wholly-owned subsidiary, BankUnited, collectively, the Company. BankUnited, a national banking association headquartered in Miami Lakes, Florida, provides a full range of banking and related services to individual and corporate customers through
94
banking centers located in
15
Florida counties and
6
banking centers located in the New York metropolitan area at
December 31, 2016
. The Bank also offers certain commercial lending and deposit products through national platforms.
In connection with the FSB Acquisition, BankUnited entered into
two
loss sharing agreements with the FDIC. The Loss Sharing Agreements consist of the Single Family Shared-Loss Agreement and the Commercial Shared-Loss Agreement. Assets covered by the Loss Sharing Agreements are referred to as covered assets or, in certain cases, covered loans. The Single Family Shared-Loss Agreement provides for FDIC loss sharing and the Bank’s reimbursement for recoveries to the FDIC through May 21, 2019 for single family residential loans and OREO. Loss sharing under the Commercial Shared-Loss Agreement terminated on May 21, 2014. The Commercial Shared-Loss Agreement continues to provide for the Bank’s reimbursement of recoveries to the FDIC through May 21, 2017 for all other covered assets, including commercial real estate, commercial and industrial and consumer loans, certain investment securities and commercial OREO. Gains realized on the sale of formerly covered investment securities are included in recoveries subject to reimbursement. Pursuant to the terms of the Loss Sharing Agreements, the covered assets are subject to a stated loss threshold whereby the FDIC will reimburse BankUnited for
80%
of losses related to the covered assets up to
$4.0 billion
and
95%
of losses in excess of this amount, beginning with the first dollar of loss incurred.
The consolidated financial statements have been prepared in accordance with GAAP and prevailing practices in the banking industry.
The Company has a single reportable segment.
Accounting Estimates
In preparing the consolidated financial statements, management is required to make estimates and assumptions that affect the reported amounts of assets, liabilities, revenues, and expenses and disclosures of contingent assets and liabilities. Actual results could differ significantly from these estimates.
Significant estimates include the ALLL, the amount and timing of expected cash flows from covered assets and the FDIC indemnification asset, and the fair values of investment securities and other financial instruments. Management has used information provided by third party valuation specialists to assist in the determination of the fair values of investment securities.
Significant estimates were also made in the determination of the fair values of assets acquired and liabilities assumed in the FSB Acquisition, the most significant of which related to loans acquired with evidence of deterioration in credit quality since origination, the FDIC indemnification asset and certain investment securities.
Principles of Consolidation
The consolidated financial statements include the accounts of BankUnited, Inc. and its wholly-owned subsidiary, BankUnited. All significant intercompany balances and transactions have been eliminated in consolidation. VIEs are consolidated if the Company is the primary beneficiary, i.e., has (i) the power to direct the activities of the VIE that most significantly impact the VIE's economic performance and (ii) the obligation to absorb losses or the right to receive benefits that could potentially be significant to the VIE. The Company has variable interests in affordable housing limited partnerships that are not required to be consolidated because the Company is not the primary beneficiary.
Fair Value Measurements
Certain of the Company's assets and liabilities are reflected in the financial statements at fair value on either a recurring or non-recurring basis. Investment securities available for sale, servicing rights and derivative instruments are measured at fair value on a recurring basis. Assets measured at fair value or fair value less cost to sell on a non-recurring basis may include collateral dependent impaired loans, OREO and other repossessed assets, loans held for sale, goodwill, impaired long-lived assets and assets acquired and liabilities assumed in business combinations. These non-recurring fair value measurements
F-11
BANKUNITED, INC. AND SUBSIDIARIES
NOTES TO CONSOLIDATED FINANCIAL STATEMENTS
December 31, 2016
typically involve the application of acquisition accounting, lower-of-cost-or-market accounting or the measurement of impairment of certain assets.
Fair value is defined as the exchange price that would be received for an asset or paid to transfer a liability in the principal or most advantageous market for the asset or liability in an orderly transaction between market participants at the measurement date. GAAP establishes a hierarchy that prioritizes inputs used to determine fair value measurements into three levels based on the observability and transparency of the inputs:
|
•
|
Level 1 inputs are unadjusted quoted prices in active markets that are accessible at the measurement date for identical assets or liabilities.
|
|
•
|
Level 2 inputs are observable inputs other than level 1 inputs, including quoted prices for similar assets and liabilities, quoted prices for identical assets and liabilities in less active markets and other inputs that can be corroborated by observable market data.
|
|
•
|
Level 3 inputs are unobservable inputs supported by limited or no market activity or data and inputs requiring significant management judgment or estimation.
|
The fair value hierarchy requires the Company to maximize the use of observable inputs and minimize the use of unobservable inputs in estimating fair value. Unobservable inputs are utilized in determining fair value measurements only to the extent that observable inputs are unavailable. The need to use unobservable inputs generally results from a lack of market liquidity and diminished observability of actual trades or assumptions that would otherwise be available to value a particular asset or liability.
Transfers between levels of the fair value hierarchy are recorded as of the end of the reporting period.
Cash and Cash Equivalents
Cash and cash equivalents include cash and due from banks, both interest bearing and non-interest bearing, amounts on deposit at the Federal Reserve Bank and federal funds sold. Cash equivalents have original maturities of
three months
or less. For purposes of reporting cash flows, cash receipts and payments pertaining to FHLB advances with original maturities of
three months
or less are reported net.
Investment Securities
Debt securities that the Company has the positive intent and ability to hold to maturity are classified as held to maturity and reported at amortized cost. Debt securities that the Company may not have the intent to hold to maturity and marketable equity securities are classified as available for sale at the time of acquisition and carried at fair value with unrealized gains and losses, net of tax, excluded from earnings and reported in AOCI, a separate component of stockholders' equity. Securities classified as available for sale may be used as part of the Company's asset/liability management strategy and may be sold in response to liquidity needs, regulatory changes or changes in interest rates, prepayment risk or other market factors. The Company does not maintain a trading portfolio. Purchase premiums and discounts on debt securities are amortized as adjustments to yield over the expected lives of the securities using the level yield method. Realized gains and losses from sales of securities are recorded on the trade date and are determined using the specific identification method.
The Company reviews investment securities for OTTI at least quarterly. An investment security is impaired if its fair value is lower than its amortized cost basis. The Company considers many factors in determining whether a decline in fair value below amortized cost represents OTTI, including, but not limited to:
|
•
|
the Company's intent to hold the security until maturity or for a period of time sufficient for a recovery in value;
|
|
•
|
whether it is more likely than not that the Company will be required to sell the security prior to recovery of its amortized cost basis;
|
|
•
|
the length of time and extent to which fair value has been less than amortized cost;
|
|
•
|
adverse changes in expected cash flows;
|
|
•
|
collateral values and performance;
|
F-12
BANKUNITED, INC. AND SUBSIDIARIES
NOTES TO CONSOLIDATED FINANCIAL STATEMENTS
December 31, 2016
|
•
|
the payment structure of the security including levels of subordination or over-collateralization;
|
|
•
|
changes in the economic or regulatory environment;
|
|
•
|
the general market condition of the geographic area or industry of the issuer;
|
|
•
|
the issuer's financial condition, performance and business prospects; and
|
|
•
|
changes in credit ratings.
|
The relative importance assigned to each of these factors varies depending on the facts and circumstances pertinent to the individual security being evaluated.
The Company recognizes OTTI of a debt security for which there has been a decline in fair value below amortized cost if (i) management intends to sell the security, (ii) it is more likely than not that the Company will be required to sell the security before recovery of its amortized cost basis, or (iii) the Company does not expect to recover the entire amortized cost basis of the security. If the Company intends to sell the security, or if it is more likely than not it will be required to sell the security before recovery, an OTTI write-down is recognized in earnings equal to the entire difference between the amortized cost basis and fair value of the security. Otherwise, the amount by which amortized cost exceeds the fair value of a debt security that is considered to be other-than-temporarily impaired is separated into a component representing the credit loss, which is recognized in earnings, and a component related to all other factors, which is recognized in other comprehensive income. The measurement of the credit loss component is equal to the difference between the debt security's amortized cost basis and the present value of its expected future cash flows discounted at the security's effective yield.
The evaluation of OTTI of marketable equity securities focuses on whether evidence supports recovery of the unrealized loss within a timeframe consistent with temporary impairment. The entire amount by which cost basis exceeds the fair value of an equity security that is considered to be other-than-temporarily impaired is recognized in earnings.
Non-marketable Equity Securities
The Bank, as a member of the FRB system and the FHLB, is required to maintain investments in the stock of the FRB and FHLB. No market exists for this stock, and the investment can be liquidated only through redemption by the respective institutions, at the discretion of and subject to conditions imposed by those institutions. The stock has no readily determinable fair value and is carried at cost. Historically, stock redemptions have been at par value, which equals the Company's carrying value. The Company monitors its investment in FHLB stock for impairment through review of recent financial results of the FHLB, including capital adequacy and liquidity position, dividend payment history, redemption history and information from credit agencies. The Company has not identified any indicators of impairment of FHLB stock.
Loans Held for Sale
Residential mortgage loans and the guaranteed portion of SBA and USDA loans originated with the intent to sell are carried at the lower of cost or fair value, determined in the aggregate by loan type. A valuation allowance is established through a charge to earnings if the aggregate fair value of such loans is lower than their cost. Gains or losses recognized upon sale are determined on the specific identification basis. The Company terminated its residential mortgage origination business in 2016 and is no longer originating residential mortgage loans for sale.
Loans not originated or otherwise acquired with the intent to sell are transferred into the held for sale classification at the lower of carrying amount or fair value when they are specifically identified for sale and a formal plan exists to sell them. Acquired credit impaired loans accounted for in pools are removed from the pools at their carrying amounts when they are sold.
Loans
The Company's loan portfolio contains 1-4 single family residential first mortgages, home equity loans and lines of credit, multi-family, owner and non-owner occupied commercial real estate, construction and land, commercial and industrial and consumer loans, mortgage warehouse lines of credit and direct financing leases. A portion of the Company's loan portfolio consists of loans acquired from the FDIC in the FSB Acquisition, the substantial majority of which are covered under the Single Family Shared-Loss Agreement. Loans covered under the Single Family Shared-Loss Agreement are referred to as covered loans. The Company segregates its loan portfolio between covered and non-covered loans. Non-covered loans include new
F-13
BANKUNITED, INC. AND SUBSIDIARIES
NOTES TO CONSOLIDATED FINANCIAL STATEMENTS
December 31, 2016
loans and loans acquired in the FSB Acquisition for which loss share coverage has terminated. Loans acquired in the FSB Acquisition are further segregated between ACI loans and non-ACI loans.
New Loans
New loans are those originated or purchased by the Company since the FSB Acquisition. New loans are carried at UPB, net of premiums, discounts, unearned income, deferred loan origination fees and costs, and the ALLL.
Interest income on new loans is accrued based on the principal amount outstanding. Non-refundable loan origination fees, net of direct costs of originating or acquiring loans, as well as purchase premiums and discounts, are deferred and recognized as adjustments to yield over the contractual lives of the related loans using the level yield method.
Direct Financing Leases
Direct financing leases are carried at the aggregate of lease payments receivable and estimated residual value of the leased property, if applicable, less unearned income. Interest income on direct financing leases is recognized over the term of the leases to achieve a constant periodic rate of return on the outstanding investment. Initial direct costs are deferred and amortized over the lease term as a reduction to interest income using the effective interest method.
ACI Loans
ACI loans are those for which, at acquisition, management determined it probable that the Company would be unable to collect all contractual principal and interest payments due. These loans were recorded at estimated fair value at the time of the FSB Acquisition, measured as the present value of all cash flows expected to be received, discounted at an appropriately risk-adjusted discount rate. Initial cash flow expectations incorporated significant assumptions regarding prepayment rates, frequency of default and loss severity.
The difference between total contractually required payments on ACI loans and the cash flows expected to be received represents non-accretable difference. The excess of all cash flows expected to be received over the Company's recorded investment in the loans represents accretable yield and is recognized as interest income on a level-yield basis over the expected life of the loans.
The Company aggregated ACI 1-4 single family residential mortgage loans and home equity loans and lines of credit with similar risk characteristics into homogenous pools at acquisition. A composite interest rate and composite expectations of future cash flows are used in accounting for each pool. These loans were aggregated into pools based on the following characteristics:
|
•
|
delinquency status;
|
|
•
|
product type, in particular, amortizing as opposed to option ARMs;
|
|
•
|
loan-to-value ratio; and
|
|
•
|
borrower FICO score.
|
Loans that do not have similar risk characteristics, primarily commercial and commercial real estate loans, are accounted for on an individual loan basis using interest rates and expectations of cash flows for each loan.
The Company is required to develop reasonable expectations about the timing and amount of cash flows to be collected related to ACI loans and to continue to update those estimates over the lives of the loans. Expected cash flows from ACI loans are updated quarterly. If it is probable that the Company will be unable to collect all the cash flows expected from a loan or pool at acquisition plus additional cash flows expected to be collected arising from changes in estimates after acquisition, the loan or pool is considered impaired and a valuation allowance is established by a charge to the provision for loan losses. If there is an increase in expected cash flows from a loan or pool, the Company first reduces any valuation allowance previously established by the amount of the increase in the present value of expected cash flows, and then recalculates the amount of accretable yield for that loan or pool. The adjustment of accretable yield due to an increase in expected cash flows, as well as changes in expected cash flows due to changes in interest rate indices and changes in prepayment assumptions is accounted for prospectively as a change in yield. Additional cash flows expected to be collected are transferred from non-accretable difference to accretable yield and the amount of periodic accretion is adjusted accordingly over the remaining life of the loan or pool.
F-14
BANKUNITED, INC. AND SUBSIDIARIES
NOTES TO CONSOLIDATED FINANCIAL STATEMENTS
December 31, 2016
The Company may resolve an ACI loan either through a sale of the loan, by working with the customer and obtaining partial or full repayment, by short sale of the collateral, or by foreclosure. When a loan accounted for in a pool is resolved, it is removed from the pool at its allocated carrying amount. In the event of a sale of the loan, the Company recognizes a gain or loss on sale based on the difference between the sales proceeds and the carrying amount of the loan. For loans resolved through pre-payment or short sale of the collateral, the Company recognizes the difference between the amount of the payment received and the carrying amount of the loan in the income statement line item "Income from resolution of covered assets, net". For loans resolved through foreclosure, the difference between the fair value of the collateral obtained through foreclosure less estimated cost to sell and the carrying amount of the loan is recognized in the income statement line item "Income from resolution of covered assets, net". Any remaining accretable discount related to loans not accounted for in pools that are resolved by full or partial pre-payment, short sale or foreclosure is recognized in interest income at the time of resolution, to the extent collected.
Payments received earlier than expected or in excess of expected cash flows from sales or other resolutions may result in the carrying value of a pool being reduced to zero even though outstanding contractual balances and expected cash flows remain related to loans in the pool. Once the carrying value of a pool is reduced to zero, any future proceeds, which may include cash or real estate acquired in foreclosure, from the remaining loans, representing further realization of accretable yield, are recognized as interest income upon receipt.
Non-ACI Loans
Loans acquired without evidence of deterioration in credit quality since origination were initially recorded at estimated fair value on the acquisition date. Non-ACI 1-4 single family residential mortgage loans and home equity loans and lines of credit with similar risk characteristics were aggregated into pools for accounting purposes at acquisition. Non-ACI loans are carried at the principal amount outstanding, adjusted for unamortized acquisition date fair value adjustments and the ALLL. Interest income is accrued based on the UPB and, with the exception of home equity loans and lines of credit, acquisition date fair value adjustments are amortized using the level-yield method over the expected lives of the related loans. For non-ACI 1-4 family residential mortgage loans accounted for in pools, prepayment estimates are used in determining the periodic amortization of acquisition date fair value adjustments. Acquisition date fair value adjustments related to revolving home equity loans and lines of credit are amortized on a straight-line basis.
Non-accrual Loans
New commercial loans are placed on non-accrual status when (i) management has determined that full repayment of all contractual principal and interest is in doubt, or (ii) the loan is past due
90 days
or more as to principal or interest unless the loan is well secured and in the process of collection. New and non-ACI residential and consumer loans are generally placed on non-accrual status when
90 days
of interest is due and unpaid. When a loan is placed on non-accrual status, uncollected interest accrued is reversed and charged to interest income.
Payments received on nonaccrual commercial loans are applied as a reduction of principal. Interest payments are recognized as income on a cash basis on nonaccrual residential loans.
Commercial loans are returned to accrual status only after all past due principal and interest has been collected and full repayment of remaining contractual principal and interest is reasonably assured. Residential and consumer loans are returned to accrual status when there is no longer
90 days
of interest due and unpaid. Past due status of loans is determined based on the contractual next payment due date. Loans less than
30 days
past due are reported as current.
Contractually delinquent ACI loans are not classified as non-accrual as long as discount continues to be accreted on the loans or pools.
Impaired Loans
New and non-ACI loans are considered impaired when, based on current information and events, it is probable that the Company will be unable to collect the scheduled payments of principal or interest when due, according to the contractual terms of the loan agreements. Commercial relationships with committed balances greater than or equal to
$1 million
that have internal risk ratings of substandard or doubtful and are on non-accrual status are individually evaluated for impairment. The likelihood of loss related to loans assigned internal risk ratings of substandard or doubtful is considered elevated due to their identified credit weaknesses. Factors considered by management in evaluating impairment include payment status, financial condition of the borrower, collateral value, and other factors impacting the probability of collecting scheduled principal and interest payments when due.
F-15
BANKUNITED, INC. AND SUBSIDIARIES
NOTES TO CONSOLIDATED FINANCIAL STATEMENTS
December 31, 2016
An ACI pool or loan is considered to be impaired when it is probable that the Company will be unable to collect all the cash flows expected at acquisition, plus additional cash flows expected to be collected arising from changes in estimates after acquisition. 1-4 single family residential and home equity ACI loans accounted for in pools are evaluated collectively for impairment on a pool by pool basis based on expected pool cash flows. Commercial ACI loans are individually evaluated for impairment based on expected cash flows from the individual loans. Discount continues to be accreted on ACI loans or pools as long as there are expected future cash flows in excess of the current carrying amount of the loans or pools.
Troubled Debt Restructurings
In certain situations due to economic or legal reasons related to a borrower's financial difficulties, the Company may grant a concession to the borrower for other than an insignificant period of time that it would not otherwise consider. At that time, except for ACI loans accounted for in pools, the related loan is classified as a TDR and considered impaired. The concessions granted may include rate reductions, principal forgiveness, payment forbearance, extensions of maturity at rates of interest below that commensurate with the risk profile of the loans, modification of payment terms and other actions intended to minimize economic loss. A TDR is generally placed on non-accrual status at the time of the modification unless the borrower has no history of missed payments for
six months
prior to the restructuring. If the borrower performs pursuant to the modified loan terms for at least
six months
and the remaining loan balance is considered collectible, the loan is returned to accrual status. Modified ACI loans accounted for in pools are not accounted for as TDRs, are not separated from the pools and are not classified as impaired loans.
Allowance for Loan and Lease Losses
The ALLL represents the amount considered adequate by management to absorb probable losses inherent in the loan portfolio at the balance sheet date. The ALLL relates to (i) new loans, (ii) estimated additional losses arising on non-ACI loans subsequent to the FSB Acquisition and (iii) impairment recognized as a result of decreases in expected cash flows on ACI loans due to further credit deterioration since acquisition. The ALLL consists of both specific and general components. The ALLL is established as losses are estimated to have occurred through a provision charged to earnings. Individual loans are charged off against the ALLL when management determines them to be uncollectible.
An assessment of collateral value is made at no later than
120 days
delinquency for new open- and closed-end loans secured by residential real estate and any outstanding loan balance in excess of fair value less cost to sell is charged off at no later than
180 days
delinquency. Additionally, any outstanding balance in excess of fair value of collateral less cost to sell is charged off (i) within
60 days
of receipt of notification of filing from the bankruptcy court, (ii) within
60 days
of determination of loss if all borrowers are deceased or (iii) within
90 days
of discovery of fraudulent activity. Non-ACI loans secured by residential real estate are generally charged off at final resolution which is consistent with the terms of the Single Family Shared-Loss Agreement. Consumer loans are typically charged off at
120 days
delinquency. Commercial loans are charged off when management deems them to be uncollectible. Subsequent recoveries are credited to the ALLL.
New and Non-ACI Loans
The new residential and home equity portfolio segments have not yet developed an observable loss trend. Due to several factors, there is a lack of similarity between the risk characteristics of new loans and covered loans in the residential and home equity portfolios. Those factors include elimination of wholesale origination channels, elimination of Alt-A and no document loans, enhancements to real estate appraisal policies, elimination of option ARMs and tightening of underwriting policies. Therefore, management does not believe it is appropriate to use the historical performance of the covered residential loans as a basis for calculating the ALLL applicable to the new loans. The ALLL for new 1-4 single family residential loans is based on average annual loss rates on prime residential mortgage securitizations issued between 2003 and 2008. Loans included in these securitizations have credit characteristics, such as LTV and FICO scores, considered by management to be comparable to characteristics of loans in the new 1-4 single family residential portfolio. The ALLL for new home equity loans is based on peer group average historical loss rates as described further below.
Calculated loss frequency and severity percentages are applied to the UPB of non-ACI 1-4 single family residential mortgages and home equity loans and lines of credit to calculate the ALLL. Based on an analysis of historical portfolio performance, OREO and short sale data, and other internal and external factors, management has concluded that historical performance by portfolio class is the best indicator of incurred loss for the non-ACI 1-4 single family residential and home equity portfolio classes. For each of these portfolio classes, a quarterly roll rate matrix is used to measure the rate at which loans move from one delinquency bucket to the next during a given quarter. An average 16-quarter roll rate matrix is used to
F-16
BANKUNITED, INC. AND SUBSIDIARIES
NOTES TO CONSOLIDATED FINANCIAL STATEMENTS
December 31, 2016
estimate the amount within each delinquency bucket expected to roll to
120
+ days delinquent within a four quarter loss emergence period. Loss severity given default is estimated based on internal data about short sales and OREO sales. The ALLL calculation incorporates a
100%
loss severity assumption for home equity loans and lines of credit projected to roll to
120 days
delinquency.
The credit quality of loans in the residential portfolio segment may be impacted by fluctuations in home values, unemployment, general economic conditions, borrowers' financial circumstances and fluctuations in interest rates.
The new commercial loan portfolio has not exhibited an observable loss trend. The credit quality of loans in this portfolio segment is impacted by general and industry specific economic conditions and other factors that may influence debt service coverage generated by the borrowers' businesses as well as fluctuations in the value of real estate and other collateral. For loans evaluated individually for impairment and determined to be impaired, a specific allowance is established based on the present value of expected cash flows discounted at the loan's effective interest rate, the estimated fair value of the loan, or for collateral dependent loans, the estimated fair value of collateral less costs to sell. Loans not individually determined to be impaired are grouped based on common risk characteristics. The ALLL for these portfolio segments is based primarily on peer group average historical loss rates and the Bank's internal credit risk rating system, using a
four
-quarter loss emergence period and a
16
-quarter loss experience period. The ALLL for municipal loans and lease receivables is based on a cumulative municipal default curve for obligations of credit quality comparable to those in the Company's portfolio, using a
12
-quarter loss emergence period.
Beginning in the first quarter of 2016, the loss experience period used to calculate historical average net charge-off rates was extended from 12 quarters to 16 quarters for commercial and consumer loans. We believe this extension of the look back period was appropriate at that time to capture a sufficient range of observations reflecting the performance of our loans, most of which were originated in the current economic cycle, and to reflect recent indications that the U.S. economy continues to move through the credit cycle. Extending the look back period to 16 quarters resulted in an increase in the ALLL of approximately
$9 million
as of March 31, 2016, as compared to using a 12-quarter look back period at the same date.
The peer group used to calculate average annual historical net charge-off rates that form the basis for the Bank's general reserves for new commercial, home equity and consumer loans is a group of
27
banks made up of the banks included in the OCC Midsize Bank Group and
two
additional banks in the New York region that management believes to be comparable based on size and nature of lending operations.
Qualitative adjustments are made to the ALLL when, based on management's judgment and experience, there are internal or external factors impacting incurred losses not taken into account by the quantitative calculations. Management has categorized potential qualitative adjustments into the following categories:
|
•
|
Portfolio performance trends, including trends in and the levels of delinquencies, non-performing loans and classified loans;
|
|
•
|
Changes in the nature of the portfolio and terms of the loans, specifically including the volume and nature of policy and procedural exceptions;
|
|
•
|
Portfolio growth trends;
|
|
•
|
Changes in lending policies and procedures, including credit and underwriting guidelines;
|
|
•
|
Economic factors, including unemployment rates and GDP growth rates;
|
|
•
|
Changes in the value of underlying collateral;
|
|
•
|
Quality of risk ratings, as evaluated by our independent credit review function;
|
|
•
|
Credit concentrations;
|
|
•
|
Changes in and experience levels of credit administration management and staff; and
|
|
•
|
Other factors identified by management that may impact the level of losses inherent in the portfolio, including but not limited to competition and legal and regulatory requirements.
|
F-17
BANKUNITED, INC. AND SUBSIDIARIES
NOTES TO CONSOLIDATED FINANCIAL STATEMENTS
December 31, 2016
ACI Loans
A specific valuation allowance related to an ACI loan or pool is established when quarterly evaluations of expected cash flows indicate it is probable that the Company will be unable to collect all of the cash flows expected at acquisition plus any additional cash flows expected to be collected arising from changes in estimate after acquisition. The amount of any necessary valuation allowance is measured by comparing the carrying value of the loan or pool to the updated net present value of expected cash flows for the loan or pool. In calculating the present value of expected cash flows for this purpose, changes in cash flows related to credit related factors are isolated from those related to changes in interest rate indices or prepayment assumptions. Alternatively, an improvement in the expected cash flows related to ACI loans results in a reduction of any previously established specific allowance with a corresponding credit to the provision for loan losses. A charge-off is taken for an individual ACI commercial loan when it is deemed probable that the loan will be resolved for an amount less than its carrying value.
Expected cash flows are estimated on a pool basis for ACI 1-4 single family residential and home equity loans. The analysis of expected pool cash flows incorporates updated pool level expected prepayment rate, default rate, delinquency level and loss severity given default assumptions. Prepayment, delinquency and default curves are derived primarily from roll rates generated from the historical performance of the portfolio over the immediately preceding four quarters. Loss severity given default for loans not projected to resolve through sale is generated from the historical performance of the portfolio over the immediately preceding four quarters, while loss severity from loan sales is generated from historical performance over the immediately preceding twelve quarters. Estimates of default probability and loss severity also incorporate updated LTV ratios, at the loan level, based on Case-Shiller Home Price Indices for the relevant MSA. Costs and fees represent an additional component of loss on default and are projected using the Bank's actual experience over the preceding twelve quarters.
The primary assumptions underlying estimates of expected cash flows for commercial ACI loans are default probability and severity of loss given default. Generally, updated cash flow assumptions are based primarily on net realizable value analyses prepared at the individual loan level. These analyses incorporate information about loan performance, collateral values, the financial condition of the borrower and other available information that may impact sources of repayment.
Reserve for Unfunded Commitments
The reserve for unfunded commitments represents the estimated probable losses related to unfunded lending commitments. The reserve is calculated in a manner similar to the general reserve for new loans, while also considering the timing and likelihood that the available credit will be utilized as well as the exposure upon default. The reserve for unfunded commitments is presented within other liabilities on the consolidated balance sheets, distinct from the ALLL, and adjustments to the reserve for unfunded commitments are included in other non-interest expense in the consolidated statements of income.
FDIC Indemnification Asset
The FDIC indemnification asset was initially recorded at the time of the FSB Acquisition at fair value, measured as the present value of the estimated cash payments expected from the FDIC for probable losses on covered assets. The FDIC indemnification asset is measured separately from the related covered assets. It is not contractually embedded in the covered assets and it is not transferable with the covered assets should the Company choose to dispose of them.
Impairment of expected cash flows from covered assets results in an increase in cash flows expected to be collected from the FDIC. These increased expected cash flows from the FDIC are recognized as increases in the FDIC indemnification asset and as non-interest income in the same period that the impairment of the covered assets is recognized in the provision for loan losses. Increases in expected cash flows from covered assets result in decreases in cash flows expected to be collected from the FDIC. These decreases in expected cash flows from the FDIC are recognized immediately in earnings to the extent that they relate to a reversal of a previously recorded valuation allowance related to the covered assets. Any remaining decreases in cash flows expected to be collected from the FDIC are recognized prospectively through an adjustment of the rate of accretion or amortization on the FDIC indemnification asset, consistent with the approach taken to recognize increases in expected cash flows on the covered assets. Amortization of the FDIC indemnification asset results from circumstances in which, due to improvement in expected cash flows from the covered assets, expected cash flows from the FDIC are less than the carrying value of the FDIC indemnification asset. Accretion or amortization of the FDIC indemnification asset is recognized in earnings using the effective interest method over the period during which cash flows from the FDIC are expected to be collected, which is limited to the lesser of the contractual term of the indemnification agreement and the remaining life of the indemnified assets.
F-18
BANKUNITED, INC. AND SUBSIDIARIES
NOTES TO CONSOLIDATED FINANCIAL STATEMENTS
December 31, 2016
Gains and losses from resolution of ACI loans are included in the income statement line item "Income from resolution of covered assets, net." These gains and losses represent the difference between the expected losses from ACI loans and consideration actually received in satisfaction of such loans that were resolved either by payment in full, foreclosure or short sale. The Company may also realize gains or losses on the sale or impairment of covered loans, covered investment securities or covered OREO. When the Company recognizes gains or losses related to the resolution, sale or impairment of covered assets in earnings, corresponding changes in the estimated amount recoverable from the FDIC under the Loss Sharing Agreements are reflected in the consolidated financial statements as increases or decreases in the FDIC indemnification asset and in the consolidated statement of income line item "
Net loss on FDIC indemnification
."
Bank Owned Life Insurance
Bank owned life insurance is carried at the amount that could be realized under the contract at the balance sheet date, which is typically cash surrender value. Changes in cash surrender value are recorded in non-interest income.
Equipment Under Operating Lease
Equipment under operating lease is carried at cost less accumulated depreciation and is depreciated to estimated residual value using the straight-line method over the lease term. Estimated residual values are re-evaluated at least annually, based primarily on current residual value appraisals. Rental revenue is recognized on a straight-line basis over the contractual term of the lease.
A review for impairment of equipment under operating lease is performed at least annually or when events or changes in circumstances indicate that the carrying amount of long-lived assets may not be recoverable. Impairment of assets is determined by comparing the carrying amount to future undiscounted net cash flows expected to be generated. If an asset is impaired, the measure of impairment is the amount by which the carrying amount exceeds the fair value of the asset.
Goodwill
Goodwill of
$78 million
at both
December 31, 2016
and
2015
represents the excess of consideration transferred in business combinations over the fair value of net tangible and identifiable intangible assets acquired. Goodwill is not amortized, but is tested for impairment annually or more frequently if events or circumstances indicate that impairment may have occurred. The Company performs its annual goodwill impairment test in the third fiscal quarter. The Company has a single reporting unit. The impairment test compares the estimated fair value of the reporting unit to its carrying amount. If the fair value of the reporting unit exceeds its carrying amount, no impairment is indicated. If the fair value of the reporting unit is less than its carrying amount, impairment of goodwill is measured as the excess of the carrying amount of goodwill over its implied fair value. The estimated fair value of the reporting unit is based on the market capitalization of the Company's common stock. The estimated fair value of the reporting unit at each impairment testing date substantially exceeded its carrying amount; therefore, no impairment of goodwill was indicated.
Foreclosed Property and Repossessed Assets
Foreclosed property and repossessed assets consists of real estate assets acquired through, or in lieu of, loan foreclosure and personal property acquired through repossession. Such assets are included in other assets in the accompanying consolidated balance sheets. These assets are held for sale and are initially recorded at estimated fair value less costs to sell, establishing a new cost basis. Subsequent to acquisition, periodic valuations are performed and the assets are carried at the lower of the carrying amount at the date of acquisition or estimated fair value less cost to sell. Significant property improvements are capitalized to the extent that the resulting carrying value does not exceed fair value less cost to sell. Legal fees, maintenance, taxes, insurance and other direct costs of holding and maintaining these assets are expensed as incurred.
F-19
BANKUNITED, INC. AND SUBSIDIARIES
NOTES TO CONSOLIDATED FINANCIAL STATEMENTS
December 31, 2016
Premises and Equipment
Premises and equipment are carried at cost less accumulated depreciation and amortization and are included in other assets in the accompanying consolidated balance sheets. Depreciation is calculated using the straight-line method over the estimated useful lives of the assets. The lives of improvements to existing buildings are based on the lesser of the estimated remaining lives of the buildings or the estimated useful lives of the improvements. Leasehold improvements are amortized over the shorter of the expected terms of the leases at inception, considering options to extend that are reasonably assured, or their useful lives. Direct costs of materials and services associated with developing or obtaining and implementing internal use computer software incurred during the application and development stage are capitalized and amortized over the estimated useful lives of the software. The estimated useful lives of premises and equipment are as follows:
|
•
|
buildings and improvements -
30 years
;
|
|
•
|
leasehold improvements -
5
to
20 years
;
|
|
•
|
furniture, fixtures and equipment -
5
to
7 years
;
|
|
•
|
computer equipment -
3
to
5 years
; and
|
|
•
|
software and software licensing rights -
3
to
5 years
.
|
Loan Servicing Rights
Loan servicing rights are
measured at fair value, with changes in fair value subsequent to acquisition recognized in earnings.
Prior to January 1, 2016, residential MSRs were measured using the amortization method subsequent to acquisition. This change in accounting policy had no impact on opening retained earnings at January 1, 2016.
Loan servicing rights are included in other assets in the accompanying consolidated balance sheets. Servicing fee income is recorded net of changes in fair value in other non-interest income. Neither the loan servicing rights nor related income have had a material impact on the Company's financial statements to date.
Investments in Affordable Housing Limited Partnerships
The Company has acquired investments in limited partnerships that
manage or invest in qualified affordable housing projects and
provide the Company with low-income housing tax credits and other tax benefits. These investments are included in other assets in the accompanying consolidated balance sheets. The Company accounts for investments in qualified affordable housing projects using the proportional amortization method if certain criteria are met. Under the proportional amortization method, the initial cost of the investment is amortized in proportion to the tax credits and other tax benefits received and the amortization is recognized in the income statement as a component of income tax expense.
The investments are evaluated for impairment when events or changes in circumstances indicate that it is more likely than not that the carrying amount of the investment will not be realized.
Income Taxes
The Company accounts for income taxes using the asset and liability method. Deferred tax assets and liabilities are determined based on differences between the financial reporting and tax bases of assets and liabilities using enacted tax rates in effect for periods in which the differences are expected to reverse. The effect of changes in tax rates on deferred tax assets and liabilities are recognized in income in the period that includes the enactment date. A valuation allowance is established for deferred tax assets when management determines that it is more likely than not that some portion or all of a deferred tax asset will not be realized. In making such determinations, the Company considers all available positive and negative evidence that may impact the realization of deferred tax assets. These considerations include the amount of taxable income generated in statutory carryback periods, future reversals of existing taxable temporary differences, projected future taxable income and available tax planning strategies.
The Company recognizes tax benefits from uncertain tax positions when it is more likely than not that the related tax positions will be sustained upon examination, including resolutions of any related appeals or litigation processes, based on the technical merits of the tax positions. An uncertain tax position is a position taken in a previously filed tax return or a position expected to be taken in a future tax return that is not based on clear and unambiguous tax law. The Company measures tax benefits related to uncertain tax positions based on the largest benefit that has a greater than
50%
likelihood of being realized
F-20
BANKUNITED, INC. AND SUBSIDIARIES
NOTES TO CONSOLIDATED FINANCIAL STATEMENTS
December 31, 2016
upon settlement. If the initial assessment fails to result in recognition of a tax benefit, the Company subsequently recognizes a tax benefit if (i) there are changes in tax law or case law that raise the likelihood of prevailing on the technical merits of the position to more-likely-than-not, (ii) the statute of limitations expires, or (iii) there is a completion of an examination resulting in a settlement of that tax year or position with the appropriate agency. The Company recognizes interest and penalties related to uncertain tax positions in the provision for income taxes.
Equity Based Compensation
The Company periodically grants unvested or restricted shares of common stock and other share-based awards to key employees. Compensation cost is measured based on the estimated fair value of the awards at the grant date and is recognized in earnings on a straight-line basis over the requisite service period for each award. Compensation cost related to awards that embody performance conditions is recognized when it is probable that the performance conditions will be achieved.
The fair value of unvested shares is based on the closing market price of the Company's common stock at the date of grant. The value of shares granted with post-vesting restrictions as to transferability is reduced by a discount for lack of marketability. Market conditions embedded in awards are reflected in the grant-date fair value of the awards.
Derivative Financial Instruments and Hedging Activities
Interest rate derivative contracts
The Company uses interest rate derivative contracts, such as swaps, caps, floors and collars, in the normal course of business to meet the financial needs of its customers and to manage exposure to changes in interest rates. Interest rate contracts are recorded as assets or liabilities in the consolidated balance sheets at fair value. Interest rate swaps that are used as a risk management tool to hedge the Company's exposure to changes in interest rates have been designated as cash flow hedging instruments. The effective portion of the gain or loss on interest rate swaps designated and qualifying as cash flow hedging instruments is initially reported as a component of other comprehensive income and subsequently reclassified into earnings in the same period in which the hedged transaction affects earnings. The ineffective portion of the gain or loss on these derivative instruments, if any, is recognized currently in earnings. Hedge effectiveness is assessed using the hypothetical derivative method. Assessments of hedge effectiveness and measurements of hedge ineffectiveness are performed quarterly.
The Company discontinues hedge accounting prospectively when it is determined that the derivative is no longer effective in offsetting changes in the cash flows of the hedged item, the derivative expires or is sold, terminated, or exercised, management determines that the designation of the derivative as a hedging instrument is no longer appropriate or the occurrence of the forecasted transaction is no longer probable. When hedge accounting is discontinued, any subsequent changes in fair value of the derivative are recognized in earnings. The cumulative unrealized gain or loss related to a discontinued cash flow hedge continues to be reported in AOCI unless it is probable that the forecasted transaction will not occur by the end of the originally specified time period, in which case the cumulative unrealized gain or loss reported in AOCI is reclassified into earnings immediately.
Cash flows resulting from derivative financial instruments that are accounted for as hedges are classified in the cash flow statement in the same category as the cash flows from the hedged items.
Changes in the fair value of interest rate contracts not designated as, or not qualifying as, hedging instruments are recognized currently in earnings.
Transfers of Financial Assets
Transfers of financial assets are accounted for as sales when control over the assets has been surrendered. A gain or loss is recognized in earnings upon completion of the sale based on the difference between the sales proceeds and the carrying value of the assets. Control over the transferred assets is deemed to have been surrendered when: (i) the assets have been legally isolated from the Company, (ii) the transferee obtains the right (free of conditions that constrain it from taking advantage of that right) to pledge or exchange the transferred assets, and (iii) the Company does not maintain effective control over the transferred assets through an agreement to repurchase them before their maturity or the ability to unilaterally cause the holder to return specific assets.
F-21
BANKUNITED, INC. AND SUBSIDIARIES
NOTES TO CONSOLIDATED FINANCIAL STATEMENTS
December 31, 2016
Advertising Costs
Advertising costs are expensed as incurred.
Earnings per Common Share
Basic earnings per common share is calculated by dividing income allocated to common stockholders for basic earnings per common share by the weighted average number of common shares outstanding for the period, reduced by average unvested stock awards. Unvested stock awards with non-forfeitable rights to dividends or dividend equivalents, whether paid or unpaid, and stand-alone dividend participation rights are considered participating securities and are included in the computation of basic earnings per common share using the two class method whereby net income is allocated between common stock and participating securities. In periods of a net loss, no allocation is made to participating securities as they are not contractually required to fund net losses. Diluted earnings per common share is computed by dividing income allocated to common stockholders for basic earnings per common share, adjusted for earnings reallocated from participating securities, by the weighted average number of common shares outstanding for the period increased for the dilutive effect of unexercised stock options, warrants and unvested stock awards using the treasury stock method. Contingently issuable shares are included in the calculation of earnings per common share as if the end of the respective period was the end of the contingency period.
Reclassifications
Certain amounts presented for prior periods have been reclassified to conform to the current period presentation.
Recent Accounting Pronouncements
In May 2014, the FASB issued ASU No. 2014-09,
Revenue from Contracts with Customers (Topic 606),
which will supersede the revenue recognition requirements in Topic 605,
Revenue Recognition
, and most industry-specific revenue recognition guidance throughout the Accounting Standards Codification. The amendments in this update affect any entity that either enters into contracts with customers to transfer goods or services or enters into contracts for the transfer of non-financial assets unless those contracts, including leases and insurance contracts, are within the scope of other standards. The amendments establish a core principle requiring the recognition of revenue to depict the transfer of goods or services to customers in an amount reflecting the consideration to which the entity expects to be entitled in exchange for such goods or services. The amendments also require expanded disclosures concerning the nature, amount, timing and uncertainty of revenues and cash flows arising from contracts with customers. Financial instruments and lease contracts are generally outside the scope of the ASU as are revenues that are in the scope of ASC 860 "Transfers and Servicing", ASC 460 "Guarantees" and ASC 815 "Derivatives and Hedging". Although management has not completed its evaluation of the impact of adoption of this ASU, substantially all of the Company's revenues have historically been generated from activities that are outside the scope of the ASU. Therefore, management does not expect adoption to have a material impact on the Company's consolidated financial position, results of operations or cash flows. Service charges on deposit accounts, which totaled approximately
$13 million
for the year ended December 31, 2016 is the most significant category of revenue identified as within the scope of the ASU; however, management does not expect the amount and timing of recognition of such revenue to be materially impacted by adoption. The FASB has issued subsequent ASUs to clarify certain aspects of ASU 2014-09, without changing the core principle of the guidance and to defer the effective date of ASU 2014-09 to annual periods and interim periods within fiscal years beginning after December 15, 2017. Entities should apply the amendments in this ASU retrospectively to each prior reporting period presented incorporating certain practical expedients, or retrospectively with the cumulative effect of initially applying the ASU recognized at the date of initial application.
In January 2016, the FASB issued ASU No. 2016-01,
Financial Instruments - Overall (Subtopic 825-10): Recognition and Measurement of Financial Assets and Financial Liabilities.
The amendments in the ASU that are expected to be most applicable to the Company 1) eliminate the available for sale classification for equity securities and require investments in equity securities (except those accounted for under the equity method of accounting or those that result in consolidation of the investee) to be measured at fair value with changes in fair value recognized in net income, provided that equity investments that do not have readily determinable fair values may be re-measured at fair value upon occurrence of an observable price change or recognition of impairment, 2) eliminate the requirement to disclose the method(s) and significant assumptions used to estimate the fair value that is required to be disclosed for financial instruments measured at amortized cost on the balance sheet, and 3) require public business entities to use the exit price notion when measuring the fair value of financial instruments for disclosure purposes. The amendments also clarify that an entity should evaluate the need for a valuation allowance on a deferred tax asset
F-22
BANKUNITED, INC. AND SUBSIDIARIES
NOTES TO CONSOLIDATED FINANCIAL STATEMENTS
December 31, 2016
related to available for sale securities in combination with the entity's other deferred tax assets, which is consistent with the Company's current practice. The amendments in this ASU are effective for the Company for interim and annual periods in fiscal years beginning after December 15, 2017 and will be adopted by means of a cumulative-effect adjustment to the balance sheet, except for amendments related to equity securities without readily determinable fair values, which will be applied prospectively. Although management has not completed its evaluation of the impact of adoption of this ASU, adoption is not expected to have any impact on the Company's consolidated financial position or cash flows. Equity investments for which fair value changes will be recognized in earnings after adoption totaled
$88 million
and had unrealized gains of
$12.0 million
at
December 31, 2016
. Adoption of the ASU will impact the Company's disclosures about the fair value of financial instruments.
In February 2016, the FASB issued ASU No. 2016-02,
Leases (Topic 842).
The amendments in this ASU require a lessee to recognize in the statement of financial position a liability to make lease payments and a right-of-use asset representing its right to use the underlying asset for lease terms longer than one year. Accounting applied by lessors is largely unchanged by this ASU. The amendments in this ASU are effective for the Company for interim and annual periods in fiscal years beginning after December 15, 2018. Early adoption is permitted, however, the Company does not intend to early adopt this ASU. Lessees and lessors are required to apply the provisions of the ASU at the beginning of the earliest period presented using a modified retrospective approach. Management has not completed its evaluation of the impact of adoption of this ASU, however, the most significant impact is expected to be the recognition, as lessee, of new right-of-use assets and lease liabilities on the consolidated balance sheet for real estate leases currently classified as operating leases.
In March 2016, the FASB issued ASU No. 2016-06,
Derivatives and Hedging (Topic 815):
Contingent Put and Call Options in Debt Instruments.
The amendments in this ASU clarify the requirements for assessing whether contingent call (put) options that can accelerate the payment of principal on debt instruments are clearly and closely related to their debt hosts. A company performing the assessment under these amendments is required to assess the embedded call (put) options solely in accordance with a four-step decision sequence, without also considering whether the contingency is related to interest rates or credit risks. The amendments in this ASU are effective for the Company for interim and annual periods in fiscal years beginning after December 15, 2016 and are required to be applied on a modified retrospective basis to existing debt instruments as of the beginning of the fiscal year for which the amendments are effective .The adoption of this ASU is not expected impact the Company's consolidated financial position, results of operations, or cash flows.
In March 2016, the FASB issued ASU No. 2016-09,
Compensation - Stock Compensation (Topic 718): Improvements to Employee Share-Based Payment Accounting
. The amendments in this ASU simplify several aspects of the accounting for share-based payment transactions. The amendments provide that a) excess tax benefits and deficiencies be recognized as income tax expense or benefit in the income statement as opposed to additional paid-in-capital; b) excess tax benefits be recognized regardless of whether the benefit reduces taxes payable in the current period; c) excess tax benefits and deficiencies be classified with other income tax cash flows as operating activities in the statement of cash flows; d) an entity may make an entity-wide election to either estimate the number of awards that are expected to vest or account for forfeitures as they occur; e) the threshold to qualify for equity classification permits partial settlement in cash for withholding purposes up to the maximum, rather than at the minimum, statutory tax rate in applicable jurisdictions; and f) cash paid by an employer when directly withholding shares be classified as a financing activity in the statement of cash flows. The amendments in this ASU are effective for the Company for interim and annual periods in fiscal years beginning after December 15, 2016. The a
mendment requiring recognition of excess tax benefits and deficiencies in the income statement will be applied prospectively. Amendments related to the presentation of excess tax benefits and deficiencies and employee taxes paid when shares are withheld to meet minimum statutory withholding requirements
in the statement of cash flows
will be applied retrospectively. Amendments related to the timing of recognition of excess tax benefits, minimum statutory withholding requirements and forfeitures are required to be adopted using a modified retrospective transition method. The Company has elected to continue its current practice of estimating the number of awards expected to vest in determining the amount of compensation cost to be recognized related to share based payment transactions.
The adoption of this ASU is not expected to materially impact the Company's consolidated financial position or results of operations. Adoption will impact the classification of certain share based payment transactions in the Consolidated Statements of Cash Flows, but is not expected to materially impact the presentation of the Company's cash flows.
In June 2016, the FASB issued ASU No. 2016-13,
Financial Instruments - Credit Losses (Topic 326); Measurement of Credit Losses on Financial Instruments.
The ASU introduces new guidance which makes substantive changes to the accounting for credit losses. The ASU introduces the CECL model which applies to financial assets subject to credit losses and measured at amortized cost, as well as certain off-balance sheet credit exposures. This includes loans, loan commitments, standby letters of credit, net investments in leases recognized by a lessor and held-to-maturity debt securities. The CECL model requires an entity
F-23
BANKUNITED, INC. AND SUBSIDIARIES
NOTES TO CONSOLIDATED FINANCIAL STATEMENTS
December 31, 2016
to estimate credit losses expected over the life of an exposure, considering information about historical events, current conditions and reasonable and supportable forecasts. The ASU also modifies the current OTTI model for available for sale debt securities requiring an estimate of expected credit losses only when the fair value of an available for sale debt security is below its amortized cost. Credit losses on available for sale debt securities will be limited to the difference between the security's amortized cost basis and its fair value. The ASU also provides for a simplified accounting model for purchased financial assets with more than insignificant credit deterioration since their origination. The amendments in this ASU are effective for the Company for interim and annual periods in fiscal years beginning after December 15, 2019. Management has not yet completed its evaluation of the impact of adoption of this ASU, however, adoption is likely to lead to significant changes in the methods employed in estimating the ALLL and it is possible that the impact will be material to the Company's consolidated financial position and results of operations.
In August 2016, the FASB issued ASU No. 2016-15,
Statement of Cash Flows (Topic 230): Classification of Certain Cash Receipts and Cash Payments.
The amendments in this ASU provide guidance on eight specific cash flow classification issues where there has been diversity in practice. The guidance in the ASU that is expected to be most applicable to the Company requires: (1) cash payments for debt prepayment or extinguishment costs to be classified as cash outflows for financing activities, (2) proceeds from settlement of insurance claims to be classified on the basis of the nature of the loss and (3) cash proceeds from settlement of bank-owned life insurance policies to be classified as cash flows from investing activities. Cash payments for premiums on bank-owned life insurance may be classified as cash flows for investing activities, operating activities or a combination thereof. The amendments in this ASU are effective for the Company for interim and annual periods in fiscal years beginning after December 15, 2017 and will be applied retrospectively to each period presented. The provisions of this ASU are generally consistent with the Company's current practice and adoption is not expected to materially impact the Company's consolidated cash flows.
In January 2017, the FASB issued
ASU No. 2017-04,
Intangibles—Goodwill and Other (Topic 350): Simplifying the Test for Goodwill Impairment,
an amendment to simplify the subsequent quantitative measurement of goodwill by eliminating step two from the goodwill impairment test. As amended, an entity will recognize an impairment charge for the amount by which the carrying amount of a reporting unit exceeds its
fair value, not to exceed the total amount of goodwill allocated to the reporting unit. An entity still has the option to perform the qualitative test for a reporting unit to determine if the quantitative impairment test is necessary. This amendment is effective for annual or interim goodwill impairment tests in fiscal years beginning after December 15, 2019. Entities should apply the amendment prospectively. Early adoption is permitted, including in an interim period, for impairment tests performed after January 1, 2017. The Company intends to early adopt this ASU for impairment tests performed after January 1, 2017. While it is not possible to determine the future relationship of the carrying amount of a reporting unit to its fair value, the Company currently has a single reporting unit and historically, the fair value of that reporting unit has substantially exceeded its carrying amount.
F-24
BANKUNITED, INC. AND SUBSIDIARIES
NOTES TO CONSOLIDATED FINANCIAL STATEMENTS
December 31, 2016
The computation of basic and diluted earnings per common share is presented below for the years ended
December 31, 2016
,
2015
and
2014
(in thousands, except share and per share data):
|
c
|
2016
|
|
2015
|
2014
|
|||||||
|
Basic earnings per common share:
|
|
|
|||||||||
|
Numerator:
|
|
|
|||||||||
|
Net income
|
$
|
225,741
|
|
$
|
251,660
|
|
$
|
204,215
|
|
||
|
Distributed and undistributed earnings allocated to participating securities
|
(8,760
|
)
|
(9,742
|
)
|
(7,991
|
)
|
|||||
|
Income allocated to common stockholders for basic earnings per common share
|
$
|
216,981
|
|
$
|
241,918
|
|
$
|
196,224
|
|
||
|
Denominator:
|
|||||||||||
|
Weighted average common shares outstanding
|
104,097,182
|
|
103,187,530
|
|
101,574,076
|
|
|||||
|
Less average unvested stock awards
|
(1,157,378
|
)
|
(1,128,416
|
)
|
(1,117,869
|
)
|
|||||
|
Weighted average shares for basic earnings per common share
|
102,939,804
|
|
102,059,114
|
|
100,456,207
|
|
|||||
|
Basic earnings per common share
|
$
|
2.11
|
|
$
|
2.37
|
|
$
|
1.95
|
|
||
|
Diluted earnings per common share:
|
|||||||||||
|
Numerator:
|
|||||||||||
|
Income allocated to common stockholders for basic earnings per common share
|
$
|
216,981
|
|
$
|
241,918
|
|
$
|
196,224
|
|
||
|
Adjustment for earnings reallocated from participating securities
|
62
|
|
54
|
|
16
|
|
|||||
|
Income used in calculating diluted earnings per common share
|
$
|
217,043
|
|
$
|
241,972
|
|
$
|
196,240
|
|
||
|
Denominator:
|
|||||||||||
|
Weighted average shares for basic earnings per common share
|
102,939,804
|
|
102,059,114
|
|
100,456,207
|
|
|||||
|
Dilutive effect of stock options
|
716,366
|
|
913,036
|
|
139,606
|
|
|||||
|
Weighted average shares for diluted earnings per common share
|
103,656,170
|
|
102,972,150
|
|
100,595,813
|
|
|||||
|
Diluted earnings per common share
|
$
|
2.09
|
|
$
|
2.35
|
|
$
|
1.95
|
|
||
Included in participating securities above are unvested shares and
3,023,314
dividend equivalent rights outstanding at
December 31, 2016
that were issued in conjunction with the IPO of the Company's common stock. These dividend equivalent rights expire in 2021 and participate in dividends on a one-for-one basis.
The following potentially dilutive securities were outstanding at
December 31, 2016
,
2015
and
2014
, but excluded from the calculation of diluted earnings per common share for the periods indicated because their inclusion would have been anti-dilutive:
|
|
2016
|
2015
|
2014
|
|||||
|
Unvested shares and share units
|
1,303,208
|
|
1,040,385
|
|
881,693
|
|
||
|
Stock options and warrants
|
1,850,279
|
|
1,851,376
|
|
6,386,424
|
|
||
F-25
BANKUNITED, INC. AND SUBSIDIARIES
NOTES TO CONSOLIDATED FINANCIAL STATEMENTS
December 31, 2016
On May 1, 2015, BankUnited completed the acquisition of SBF from CertusHoldings, Inc. in an asset purchase transaction for a cash purchase price of
$278 million
. SBF's primary business activity is to originate loans under programs administered by the SBA. The SBF acquisition has allowed BankUnited to expand its small business lending platform on a national basis.
BankUnited acquired the SBF loan portfolio, as well as substantially all of SBF's operating assets, and assumed certain of its operating liabilities. The acquisition of SBF was determined to be a business combination and was accounted for using the acquisition method of accounting; accordingly, the assets acquired and liabilities assumed were recorded at their estimated fair values at the acquisition date.
The following table summarizes the estimated fair values of assets acquired and liabilities assumed (in thousands):
|
Assets:
|
||||
|
Loans held for investment
|
$
|
173,809
|
|
|
|
Loans held for sale
|
82,143
|
|
||
|
Servicing rights
|
10,418
|
|
||
|
Other assets
|
4,397
|
|
||
|
Total assets
|
270,767
|
|
||
|
Total liabilities
|
3,620
|
|
||
|
Estimated fair value of net assets acquired
|
267,147
|
|
||
|
Consideration issued
|
277,553
|
|
||
|
Excess of consideration issued over fair value of net assets acquired
|
$
|
10,406
|
|
|
F-26
BANKUNITED, INC. AND SUBSIDIARIES
NOTES TO CONSOLIDATED FINANCIAL STATEMENTS
December 31, 2016
Investment securities available for sale consisted of the following at
December 31, 2016
and
2015
(in thousands):
|
2016
|
|||||||||||||||
|
|
Amortized Cost
|
Gross Unrealized
|
Fair Value
|
||||||||||||
|
|
Gains
|
Losses
|
|||||||||||||
|
U.S. Treasury securities
|
$
|
4,999
|
|
$
|
6
|
|
$
|
—
|
|
$
|
5,005
|
|
|||
|
U.S. Government agency and sponsored enterprise residential MBS
|
1,513,028
|
|
15,922
|
|
(1,708
|
)
|
1,527,242
|
|
|||||||
|
U.S. Government agency and sponsored enterprise commercial MBS
|
126,754
|
|
670
|
|
(2,838
|
)
|
124,586
|
|
|||||||
|
Private label residential MBS and CMOs
|
334,167
|
|
42,939
|
|
(2,008
|
)
|
375,098
|
|
|||||||
|
Private label commercial MBS
|
1,180,386
|
|
9,623
|
|
(2,385
|
)
|
1,187,624
|
|
|||||||
|
Single family rental real estate-backed securities
|
858,339
|
|
4,748
|
|
(1,836
|
)
|
861,251
|
|
|||||||
|
Collateralized loan obligations
|
487,678
|
|
868
|
|
(1,250
|
)
|
487,296
|
|
|||||||
|
Non-mortgage asset-backed securities
|
187,660
|
|
2,002
|
|
(2,926
|
)
|
186,736
|
|
|||||||
|
Preferred stocks
|
76,180
|
|
12,027
|
|
(4
|
)
|
88,203
|
|
|||||||
|
State and municipal obligations
|
705,884
|
|
3,711
|
|
(11,049
|
)
|
698,546
|
|
|||||||
|
SBA securities
|
517,129
|
|
7,198
|
|
(421
|
)
|
523,906
|
|
|||||||
|
Other debt securities
|
3,999
|
|
4,092
|
|
—
|
|
8,091
|
|
|||||||
|
|
$
|
5,996,203
|
|
$
|
103,806
|
|
$
|
(26,425
|
)
|
$
|
6,073,584
|
|
|||
|
2015
|
|||||||||||||||
|
|
Amortized Cost
|
Gross Unrealized
|
Fair Value
|
||||||||||||
|
|
Gains
|
Losses
|
|||||||||||||
|
U.S. Treasury securities
|
$
|
4,997
|
|
$
|
—
|
|
$
|
—
|
|
$
|
4,997
|
|
|||
|
U.S. Government agency and sponsored enterprise residential MBS
|
1,167,197
|
|
15,376
|
|
(4,255
|
)
|
1,178,318
|
|
|||||||
|
U.S. Government agency and sponsored enterprise commercial MBS
|
95,997
|
|
944
|
|
(127
|
)
|
96,814
|
|
|||||||
|
Re-Remics
|
88,658
|
|
1,138
|
|
(105
|
)
|
89,691
|
|
|||||||
|
Private label residential MBS and CMOs
|
502,723
|
|
44,822
|
|
(2,933
|
)
|
544,612
|
|
|||||||
|
Private label commercial MBS
|
1,219,355
|
|
5,533
|
|
(6,148
|
)
|
1,218,740
|
|
|||||||
|
Single family rental real estate-backed securities
|
646,156
|
|
284
|
|
(9,735
|
)
|
636,705
|
|
|||||||
|
Collateralized loan obligations
|
309,615
|
|
—
|
|
(2,738
|
)
|
306,877
|
|
|||||||
|
Non-mortgage asset-backed securities
|
54,981
|
|
1,519
|
|
—
|
|
56,500
|
|
|||||||
|
Preferred stocks
|
75,742
|
|
7,467
|
|
—
|
|
83,209
|
|
|||||||
|
State and municipal obligations
|
351,456
|
|
10,297
|
|
—
|
|
361,753
|
|
|||||||
|
SBA securities
|
270,553
|
|
3,343
|
|
(560
|
)
|
273,336
|
|
|||||||
|
Other debt securities
|
3,854
|
|
4,133
|
|
—
|
|
7,987
|
|
|||||||
|
|
$
|
4,791,284
|
|
$
|
94,856
|
|
$
|
(26,601
|
)
|
$
|
4,859,539
|
|
|||
Investment securities held to maturity at
December 31, 2016
and
2015
consisted of
one
State of Israel bond with a carrying value of
$10 million
. Fair value approximated carrying value at
December 31, 2016
and
2015
. The bond matures in 2024.
F-27
BANKUNITED, INC. AND SUBSIDIARIES
NOTES TO CONSOLIDATED FINANCIAL STATEMENTS
December 31, 2016
At
December 31, 2016
, contractual maturities of investment securities available for sale, adjusted for anticipated prepayments of mortgage-backed and other pass-through securities, were as follows (in thousands):
|
Amortized Cost
|
Fair Value
|
||||||
|
Due in one year or less
|
$
|
561,441
|
|
$
|
574,582
|
|
|
|
Due after one year through five years
|
3,113,496
|
|
3,143,551
|
|
|||
|
Due after five years through ten years
|
1,933,476
|
|
1,941,201
|
|
|||
|
Due after ten years
|
311,610
|
|
326,047
|
|
|||
|
Preferred stocks with no stated maturity
|
76,180
|
|
88,203
|
|
|||
|
|
$
|
5,996,203
|
|
$
|
6,073,584
|
|
|
Based on the Company’s proprietary assumptions, the estimated weighted average life of the investment portfolio as of
December 31, 2016
was
5.0
years. The effective duration of the investment portfolio as of
December 31, 2016
was
1.7
years. The model results are based on assumptions that may differ from actual results.
The carrying value of securities pledged as collateral for FHLB advances, public deposits, interest rate swaps and to secure borrowing capacity at the FRB totaled
$1.8 billion
and
$1.5 billion
at
December 31, 2016
and
2015
, respectively.
The following table provides information about gains and losses on investment securities available for sale for the years ended
December 31, 2016
,
2015
and
2014
(in thousands):
|
|
2016
|
2015
|
2014
|
||||||||
|
Proceeds from sale of investment securities available for sale
|
$
|
1,127,983
|
|
$
|
1,114,020
|
|
$
|
355,798
|
|
||
|
Gross realized gains
|
$
|
14,924
|
|
$
|
8,955
|
|
$
|
4,987
|
|
||
|
Gross realized losses
|
—
|
|
(475
|
)
|
(1,128
|
)
|
|||||
|
Net realized gain
|
14,924
|
|
8,480
|
|
3,859
|
|
|||||
|
OTTI
|
(463
|
)
|
—
|
|
—
|
|
|||||
|
Gain on investment securities available for sale, net
|
$
|
14,461
|
|
$
|
8,480
|
|
$
|
3,859
|
|
||
During the
year ended December 31, 2016
, OTTI was recognized on
two
positions in one private label commercial MBS. These positions were in unrealized loss positions at
September 30, 2016
and the Company sold the security before the end of the year.
F-28
BANKUNITED, INC. AND SUBSIDIARIES
NOTES TO CONSOLIDATED FINANCIAL STATEMENTS
December 31, 2016
The following tables present the aggregate fair value and the aggregate amount by which amortized cost exceeded fair value for investment securities in unrealized loss positions, aggregated by investment category and length of time that individual securities had been in continuous unrealized loss positions at
December 31, 2016
and
2015
(in thousands):
|
2016
|
|||||||||||||||||||||||
|
|
Less than 12 Months
|
12 Months or Greater
|
Total
|
||||||||||||||||||||
|
|
Fair Value
|
Unrealized Losses
|
Fair Value
|
Unrealized Losses
|
Fair Value
|
Unrealized Losses
|
|||||||||||||||||
|
U.S. Government agency and sponsored enterprise residential MBS
|
$
|
191,463
|
|
$
|
(628
|
)
|
$
|
112,391
|
|
$
|
(1,080
|
)
|
$
|
303,854
|
|
$
|
(1,708
|
)
|
|||||
|
U.S. Government agency and sponsored enterprise commercial MBS
|
89,437
|
|
(2,838
|
)
|
—
|
|
—
|
|
89,437
|
|
(2,838
|
)
|
|||||||||||
|
Private label residential MBS and CMOs
|
122,142
|
|
(1,680
|
)
|
8,074
|
|
(328
|
)
|
130,216
|
|
(2,008
|
)
|
|||||||||||
|
Private label commercial MBS
|
169,535
|
|
(2,370
|
)
|
24,985
|
|
(15
|
)
|
194,520
|
|
(2,385
|
)
|
|||||||||||
|
Single family rental real estate-backed securities
|
139,867
|
|
(842
|
)
|
176,057
|
|
(994
|
)
|
315,924
|
|
(1,836
|
)
|
|||||||||||
|
Collateralized loan obligations
|
69,598
|
|
(402
|
)
|
173,983
|
|
(848
|
)
|
243,581
|
|
(1,250
|
)
|
|||||||||||
|
Non-mortgage asset-backed securities
|
139,477
|
|
(2,926
|
)
|
—
|
|
—
|
|
139,477
|
|
(2,926
|
)
|
|||||||||||
|
Preferred stocks
|
10,087
|
|
(4
|
)
|
—
|
|
—
|
|
10,087
|
|
(4
|
)
|
|||||||||||
|
State and municipal obligations
|
448,180
|
|
(11,049
|
)
|
—
|
|
—
|
|
448,180
|
|
(11,049
|
)
|
|||||||||||
|
SBA securities
|
4,204
|
|
(13
|
)
|
20,076
|
|
(408
|
)
|
24,280
|
|
(421
|
)
|
|||||||||||
|
|
$
|
1,383,990
|
|
$
|
(22,752
|
)
|
$
|
515,566
|
|
$
|
(3,673
|
)
|
$
|
1,899,556
|
|
$
|
(26,425
|
)
|
|||||
|
2015
|
|||||||||||||||||||||||
|
|
Less than 12 Months
|
12 Months or Greater
|
Total
|
||||||||||||||||||||
|
|
Fair Value
|
Unrealized Losses
|
Fair Value
|
Unrealized Losses
|
Fair Value
|
Unrealized Losses
|
|||||||||||||||||
|
U.S. Government agency and sponsored enterprise residential MBS
|
$
|
321,143
|
|
$
|
(3,065
|
)
|
$
|
54,290
|
|
$
|
(1,190
|
)
|
$
|
375,433
|
|
$
|
(4,255
|
)
|
|||||
|
U.S. Government agency and sponsored enterprise commercial MBS
|
5,273
|
|
(127
|
)
|
—
|
|
—
|
|
5,273
|
|
(127
|
)
|
|||||||||||
|
Re-Remics
|
20,421
|
|
(105
|
)
|
—
|
|
—
|
|
20,421
|
|
(105
|
)
|
|||||||||||
|
Private label residential MBS and CMOs
|
289,312
|
|
(2,401
|
)
|
16,342
|
|
(532
|
)
|
305,654
|
|
(2,933
|
)
|
|||||||||||
|
Private label commercial MBS
|
739,376
|
|
(4,476
|
)
|
106,280
|
|
(1,672
|
)
|
845,656
|
|
(6,148
|
)
|
|||||||||||
|
Single family rental real estate-backed securities
|
381,033
|
|
(4,499
|
)
|
212,491
|
|
(5,236
|
)
|
593,524
|
|
(9,735
|
)
|
|||||||||||
|
Collateralized loan obligations
|
257,442
|
|
(2,173
|
)
|
49,435
|
|
(565
|
)
|
306,877
|
|
(2,738
|
)
|
|||||||||||
|
SBA securities
|
41,996
|
|
(543
|
)
|
868
|
|
(17
|
)
|
42,864
|
|
(560
|
)
|
|||||||||||
|
|
$
|
2,055,996
|
|
$
|
(17,389
|
)
|
$
|
439,706
|
|
$
|
(9,212
|
)
|
$
|
2,495,702
|
|
$
|
(26,601
|
)
|
|||||
The Company monitors its investment securities available for sale for OTTI on an individual security basis. As discussed above, OTTI was recognized on
two
positions in one private label commercial MBS during the
year ended December 31, 2016
.
No
securities were determined to be other-than-temporarily impaired during the years ended
December 31, 2015
and
2014
. The Company does not intend to sell securities that are in significant unrealized loss positions at
December 31, 2016
and it is not
F-29
BANKUNITED, INC. AND SUBSIDIARIES
NOTES TO CONSOLIDATED FINANCIAL STATEMENTS
December 31, 2016
more likely than not that the Company will be required to sell these securities before recovery of the amortized cost basis, which may be at maturity. At
December 31, 2016
,
112
securities were in unrealized loss positions. The amount of impairment related to
30
of these securities was considered insignificant, totaling approximately
$309 thousand
and no further analysis with respect to these securities was considered necessary. The basis for concluding that impairment of the remaining securities was not other-than-temporary is further described below:
U.S. Government agency and sponsored enterprise residential
MBS
and commercial MBS
At
December 31, 2016
,
eleven
U.S. Government agency and sponsored enterprise residential MBS and
five
U.S. Government agency and sponsored enterprise commercial MBS were in unrealized loss positions. For
five
fixed rate securities, the impairment was primarily attributable to an increase in medium and long-term market interest rates subsequent to the date of acquisition. For the remaining
eleven
variable rate securities, the amount of impairment was less than
2%
of amortized cost and was primarily due to increased credit spreads subsequent to acquisition. The timely payment of principal and interest on these securities is explicitly or implicitly guaranteed by the U.S. Government. Given the expectation of timely payment of principal and interest, the impairments were considered to be temporary.
Private label residential
MBS
and
CMOs
At
December 31, 2016
,
ten
private label residential MBS were in unrealized loss positions, primarily as a result of a widening of credit spreads and an increase in medium and long-term market interest rates subsequent to acquisition. The amount of impairment of each of the individual securities ranged from less than
1%
to just under
5%
of amortized cost. These securities were assessed for OTTI using credit and prepayment behavioral models that incorporate CUSIP level constant default rates, voluntary prepayment rates and loss severity and delinquency assumptions. The results of these assessments were not indicative of credit losses related to any of these securities as of
December 31, 2016
. Given the limited severity of impairment and the expectation of timely recovery of outstanding principal, the impairments were considered to be temporary.
Private label commercial
MBS
:
At
December 31, 2016
,
nine
private label commercial MBS were in unrealized loss positions. The amount of impairment of each of the individual securities was less than
3%
of amortized cost. The amount of impairment for seven of the securities falls within a normal bid/ask range. The unrealized losses were primarily attributable to increases in market interest rates since the purchase of the securities. These securities were assessed for OTTI using credit and prepayment behavioral models incorporating assumptions consistent with the collateral characteristics of each security. The results of this analysis were not indicative of expected credit losses. Given the limited severity of impairment and the expectation of timely recovery of outstanding principal, the impairments were considered to be temporary.
Single family rental real estate-backed securities:
At
December 31, 2016
,
eight
single family rental real estate-backed securities were in unrealized loss positions. The unrealized losses were primarily due to widening credit spreads, leading to increased extension risk, and to a lesser extent, increases in market interest rates since the purchase of the securities. The amount of impairment of each of the individual securities was
4%
or less of amortized cost. Management's analysis of the credit characteristics, including loan-to-value and debt service coverage ratios, and levels of subordination for each of the securities is not indicative of projected credit losses. Given the limited severity of impairment and the absence of projected credit losses, the impairments were considered to be temporary.
Collateralized loan obligations:
At
December 31, 2016
,
four
collateralized loan obligations were in unrealized loss positions, due to widening credit spreads subsequent to acquisition. The amount of impairment of each of the individual securities was less than
1%
of amortized cost. Given the limited severity of impairment, levels of subordination and the results of independent analyses of the credit quality of loans underlying the securities, the impairments were considered to be temporary.
Non-mortgage asset-backed securities:
At
December 31, 2016
,
three
non-mortgage asset-backed securities were in unrealized loss positions, due primarily to increases in market interest rates subsequent to the date of acquisition. The amount of impairment of each of the individual
F-30
BANKUNITED, INC. AND SUBSIDIARIES
NOTES TO CONSOLIDATED FINANCIAL STATEMENTS
December 31, 2016
securities was less than
3%
of amortized cost. These securities were assessed for OTTI using credit and prepayment behavioral models incorporating assumptions consistent with the collateral characteristics of each security. The results of this analysis were not indicative of expected credit losses. Given the limited severity of impairment and the expectation of timely recovery of outstanding principal, the impairments were considered to be temporary.
State and municipal obligations:
At
December 31, 2016
,
31
state and municipal obligations were in unrealized loss positions, due to increases in market interest rates. All of the securities are rated investment grade by nationally recognized statistical ratings organizations. Management's evaluation of these securities for OTTI also encompassed the review of credit scores and analysis provided by a third party firm specializing in the analysis and credit review of municipal securities. Given the absence of expected credit losses and management's ability and intent to hold the securities until recovery, the impairments were considered to be temporary.
SBA securities:
At
December 31, 2016
,
one
SBA security was in an unrealized loss position. The amount of impairment was less than
2%
of amortized cost. This security was purchased at a premium and the impairment was attributable primarily to increased prepayment speeds. The timely payment of principal and interest on this security is guaranteed by this U.S. Government agency. Given the limited severity of impairment and the expectation of timely payment of principal and interest, the impairment was considered to be temporary.
At
December 31, 2016
and
2015
, loans consisted of the following (dollars in thousands):
|
2016
|
||||||||||||||||||||||
|
|
Non-Covered Loans
|
Covered Loans
|
|
Percent of Total
|
||||||||||||||||||
|
|
New Loans
|
ACI
|
ACI
|
Non-ACI
|
Total
|
|||||||||||||||||
|
Residential:
|
|
|
|
|
|
|
|
|
|
|
|
|
||||||||||
|
1-4 single family residential
|
$
|
3,422,425
|
|
$
|
—
|
|
$
|
532,348
|
|
$
|
36,675
|
|
$
|
3,991,448
|
|
20.6
|
%
|
|||||
|
Home equity loans and lines of credit
|
1,120
|
|
—
|
|
3,894
|
|
47,629
|
|
52,643
|
|
0.3
|
%
|
||||||||||
|
|
3,423,545
|
|
—
|
|
536,242
|
|
84,304
|
|
4,044,091
|
|
20.9
|
%
|
||||||||||
|
Commercial:
|
||||||||||||||||||||||
|
Multi-family
|
3,801,864
|
|
23,109
|
|
—
|
|
—
|
|
3,824,973
|
|
19.8
|
%
|
||||||||||
|
Commercial real estate
|
||||||||||||||||||||||
|
Owner occupied
|
1,726,846
|
|
10,012
|
|
—
|
|
—
|
|
1,736,858
|
|
9.0
|
%
|
||||||||||
|
Non-owner occupied
|
3,726,260
|
|
12,975
|
|
—
|
|
—
|
|
3,739,235
|
|
19.3
|
%
|
||||||||||
|
Construction and land
|
311,436
|
|
—
|
|
—
|
|
—
|
|
311,436
|
|
1.6
|
%
|
||||||||||
|
Commercial and industrial
|
3,390,772
|
|
842
|
|
—
|
|
—
|
|
3,391,614
|
|
17.5
|
%
|
||||||||||
|
Commercial lending subsidiaries
|
2,280,685
|
|
—
|
|
—
|
|
—
|
|
2,280,685
|
|
11.8
|
%
|
||||||||||
|
|
15,237,863
|
|
46,938
|
|
—
|
|
—
|
|
15,284,801
|
|
79.0
|
%
|
||||||||||
|
Consumer
|
24,358
|
|
7
|
|
—
|
|
—
|
|
24,365
|
|
0.1
|
%
|
||||||||||
|
Total loans
|
18,685,766
|
|
46,945
|
|
536,242
|
|
84,304
|
|
19,353,257
|
|
100.0
|
%
|
||||||||||
|
Premiums, discounts and deferred fees and costs, net
|
48,641
|
|
—
|
|
—
|
|
(6,504
|
)
|
42,137
|
|
||||||||||||
|
Loans including premiums, discounts and deferred fees and costs
|
18,734,407
|
|
46,945
|
|
536,242
|
|
77,800
|
|
19,395,394
|
|
||||||||||||
|
Allowance for loan and lease losses
|
(150,853
|
)
|
—
|
|
—
|
|
(2,100
|
)
|
(152,953
|
)
|
||||||||||||
|
Loans, net
|
$
|
18,583,554
|
|
$
|
46,945
|
|
$
|
536,242
|
|
$
|
75,700
|
|
$
|
19,242,441
|
|
|||||||
F-31
BANKUNITED, INC. AND SUBSIDIARIES
NOTES TO CONSOLIDATED FINANCIAL STATEMENTS
December 31, 2016
|
2015
|
||||||||||||||||||||||
|
|
Non-Covered Loans
|
Covered Loans
|
|
Percent of Total
|
||||||||||||||||||
|
|
New Loans
|
ACI
|
ACI
|
Non-ACI
|
Total
|
|||||||||||||||||
|
Residential:
|
|
|
|
|
|
|
|
|
|
|
|
|
||||||||||
|
1-4 single family residential
|
$
|
2,883,470
|
|
$
|
—
|
|
$
|
699,039
|
|
$
|
46,110
|
|
$
|
3,628,619
|
|
21.9
|
%
|
|||||
|
Home equity loans and lines of credit
|
806
|
|
—
|
|
4,831
|
|
67,493
|
|
73,130
|
|
0.4
|
%
|
||||||||||
|
|
2,884,276
|
|
—
|
|
703,870
|
|
113,603
|
|
3,701,749
|
|
22.3
|
%
|
||||||||||
|
Commercial:
|
||||||||||||||||||||||
|
Multi-family
|
3,447,526
|
|
24,636
|
|
—
|
|
—
|
|
3,472,162
|
|
20.9
|
%
|
||||||||||
|
Commercial real estate
|
||||||||||||||||||||||
|
Owner occupied
|
1,338,184
|
|
16,567
|
|
—
|
|
—
|
|
1,354,751
|
|
8.2
|
%
|
||||||||||
|
Non-owner occupied
|
2,885,226
|
|
25,101
|
|
—
|
|
—
|
|
2,910,327
|
|
17.5
|
%
|
||||||||||
|
Construction and land
|
347,676
|
|
—
|
|
—
|
|
—
|
|
347,676
|
|
2.1
|
%
|
||||||||||
|
Commercial and industrial
|
2,769,813
|
|
1,062
|
|
—
|
|
—
|
|
2,770,875
|
|
16.7
|
%
|
||||||||||
|
Commercial lending subsidiaries
|
2,003,984
|
|
—
|
|
—
|
|
—
|
|
2,003,984
|
|
12.1
|
%
|
||||||||||
|
|
12,792,409
|
|
67,366
|
|
—
|
|
—
|
|
12,859,775
|
|
77.5
|
%
|
||||||||||
|
Consumer
|
35,173
|
|
10
|
|
—
|
|
—
|
|
35,183
|
|
0.2
|
%
|
||||||||||
|
Total loans
|
15,711,858
|
|
67,376
|
|
703,870
|
|
113,603
|
|
16,596,707
|
|
100.0
|
%
|
||||||||||
|
Premiums, discounts and deferred fees and costs, net
|
47,829
|
|
—
|
|
—
|
|
(7,933
|
)
|
39,896
|
|
||||||||||||
|
Loans including premiums, discounts and deferred fees and costs
|
15,759,687
|
|
67,376
|
|
703,870
|
|
105,670
|
|
16,636,603
|
|
||||||||||||
|
Allowance for loan and lease losses
|
(120,960
|
)
|
—
|
|
—
|
|
(4,868
|
)
|
(125,828
|
)
|
||||||||||||
|
Loans, net
|
$
|
15,638,727
|
|
$
|
67,376
|
|
$
|
703,870
|
|
$
|
100,802
|
|
$
|
16,510,775
|
|
|||||||
Through two subsidiaries, the Bank provides commercial and municipal equipment and franchise financing utilizing both loan and lease structures. At
December 31, 2016
and
2015
, the commercial lending subsidiaries portfolio included a net investment in direct financing leases of
$643 million
and
$472 million
, respectively.
The following table presents the components of the investment in direct financing leases as of
December 31, 2016
and
2015
(in thousands):
|
2016
|
2015
|
||||||
|
Total minimum lease payments to be received
|
$
|
689,631
|
|
$
|
503,692
|
|
|
|
Estimated unguaranteed residual value of leased assets
|
3,704
|
|
1,561
|
|
|||
|
Gross investment in direct financing leases
|
693,335
|
|
505,253
|
|
|||
|
Unearned income
|
(55,891
|
)
|
(37,677
|
)
|
|||
|
Initial direct costs
|
5,287
|
|
4,817
|
|
|||
|
$
|
642,731
|
|
$
|
472,393
|
|
||
F-32
BANKUNITED, INC. AND SUBSIDIARIES
NOTES TO CONSOLIDATED FINANCIAL STATEMENTS
December 31, 2016
As of
December 31, 2016
, future minimum lease payments to be received under direct financing leases were as follows (in thousands):
|
Years Ending December 31:
|
|||
|
2017
|
$
|
180,795
|
|
|
2018
|
146,097
|
|
|
|
2019
|
100,485
|
|
|
|
2020
|
72,606
|
|
|
|
2021
|
46,256
|
|
|
|
Thereafter
|
143,392
|
|
|
|
$
|
689,631
|
|
|
During the years ended
December 31, 2016
and
2015
, the Company purchased 1-4 single family residential loans totaling
$1.3 billion
and
$788 million
, respectively.
At
December 31, 2016
, the Company had pledged real estate loans with UPB of approximately
$10.2 billion
and recorded investment of approximately
$9.4 billion
as security for FHLB advances.
At
December 31, 2016
and
2015
, the UPB of ACI loans was
$1.5 billion
and
$2.0 billion
, respectively. The accretable yield on ACI loans represents the amount by which undiscounted expected future cash flows exceed recorded investment. Changes in the accretable yield on ACI loans for the years ended
December 31, 2016
,
2015
and
2014
were as follows (in thousands):
|
Balance at December 31, 2013
|
$
|
1,158,572
|
|
|
Reclassifications from non-accretable difference
|
185,604
|
|
|
|
Accretion
|
(338,864
|
)
|
|
|
Balance at December 31, 2014
|
1,005,312
|
|
|
|
Reclassifications from non-accretable difference
|
192,291
|
|
|
|
Accretion
|
(295,038
|
)
|
|
|
Balance at December 31, 2015
|
902,565
|
|
|
|
Reclassifications from non-accretable difference
|
76,751
|
|
|
|
Accretion
|
(303,931
|
)
|
|
|
Balance at December 31, 2016
|
$
|
675,385
|
|
F-33
BANKUNITED, INC. AND SUBSIDIARIES
NOTES TO CONSOLIDATED FINANCIAL STATEMENTS
December 31, 2016
Covered loan sales
During the years ended
December 31, 2016
,
2015
and
2014
, the Company sold covered residential loans to third parties on a non-recourse basis. The following table summarizes the impact of these transactions (in thousands):
|
2016
|
2015
|
2014
|
|||||||||
|
UPB of loans sold
|
$
|
241,348
|
|
$
|
249,038
|
|
$
|
269,143
|
|
||
|
Cash proceeds, net of transaction costs
|
$
|
171,367
|
|
$
|
207,425
|
|
$
|
177,560
|
|
||
|
Recorded investment in loans sold
|
185,837
|
|
172,496
|
|
144,231
|
|
|||||
|
Net pre-tax impact on earnings, excluding the impact of FDIC indemnification
|
$
|
(14,470
|
)
|
$
|
34,929
|
|
$
|
33,329
|
|
||
|
Gain (loss) on sale of covered loans, net
|
$
|
(14,470
|
)
|
$
|
34,929
|
|
$
|
2,398
|
|
||
|
Proceeds recorded in interest income
|
—
|
|
—
|
|
30,931
|
|
|||||
|
|
$
|
(14,470
|
)
|
$
|
34,929
|
|
$
|
33,329
|
|
||
|
Gain (loss) on FDIC indemnification, net
|
$
|
11,615
|
|
$
|
(28,051
|
)
|
$
|
(809
|
)
|
||
For the
year ended December 31, 2014
, covered 1-4 single family residential loans with UPB of
$50 million
were sold from a pool of ACI loans with a zero carrying value. Proceeds of the sale of loans from this pool, representing realization of accretable yield, were recorded in interest income. The gain or loss on the sale of loans from the remaining pools, representing the difference between allocated carrying amount and consideration received, was recorded in “Gain (loss) on sale of loans, net” in the accompanying consolidated statements of income.
No
loans were sold from the pool of ACI loans with a zero carrying value during the years ended
December 31, 2016
and
2015
.
During the
year ended December 31, 2014
, in accordance with the terms of the Commercial Shared-Loss Agreement, the Bank requested and received approval from the FDIC to sell certain covered commercial and consumer loans. These loans were transferred to loans held for sale at the lower of carrying value or fair value, determined at the individual loan level, upon receipt of FDIC approval and sold in 2014. The reduction of carrying value to fair value for specific loans was recognized in the provision for loan losses.
F-34
BANKUNITED, INC. AND SUBSIDIARIES
NOTES TO CONSOLIDATED FINANCIAL STATEMENTS
December 31, 2016
The following table summarizes the pre-tax impact of these sales, as reflected in the consolidated statements of income for the
year ended December 31, 2014
(in thousands):
|
Cash proceeds, net of transaction costs
|
$
|
101,023
|
|
|
Carrying value of loans transferred to loans held for sale
|
86,521
|
|
|
|
Provision for loan losses recorded upon transfer to loans held for sale
|
(3,469
|
)
|
|
|
Recorded investment in loans sold
|
83,052
|
|
|
|
Gain on sale of covered loans
|
$
|
17,971
|
|
|
Loss on FDIC indemnification
|
$
|
(2,085
|
)
|
During the
year ended December 31, 2014
, the Company terminated its indirect auto lending activities and sold indirect auto loans with a recorded investment of
$303 million
. The total impact of this transaction on pre-tax earnings was not material.
Allowance for loan and lease losses
Activity in the ALLL for the years ended
December 31, 2016
,
2015
and
2014
is summarized as follows (in thousands):
|
|
2016
|
||||||||||||||
|
|
Residential
|
Commercial
|
Consumer
|
Total
|
|||||||||||
|
Beginning balance
|
$
|
15,958
|
|
$
|
109,617
|
|
$
|
253
|
|
$
|
125,828
|
|
|||
|
Provision for (recovery of) loan losses:
|
|||||||||||||||
|
Non-ACI loans
|
(1,632
|
)
|
(49
|
)
|
—
|
|
(1,681
|
)
|
|||||||
|
New loans
|
(1,804
|
)
|
54,406
|
|
(10
|
)
|
52,592
|
|
|||||||
|
Total provision
|
(3,436
|
)
|
54,357
|
|
(10
|
)
|
50,911
|
|
|||||||
|
Charge-offs:
|
|||||||||||||||
|
Non-ACI loans
|
(1,216
|
)
|
—
|
|
—
|
|
(1,216
|
)
|
|||||||
|
New loans
|
—
|
|
(25,742
|
)
|
(152
|
)
|
(25,894
|
)
|
|||||||
|
Total charge-offs
|
(1,216
|
)
|
(25,742
|
)
|
(152
|
)
|
(27,110
|
)
|
|||||||
|
Recoveries:
|
|||||||||||||||
|
Non-ACI loans
|
80
|
|
49
|
|
—
|
|
129
|
|
|||||||
|
New loans
|
—
|
|
3,169
|
|
26
|
|
3,195
|
|
|||||||
|
Total recoveries
|
80
|
|
3,218
|
|
26
|
|
3,324
|
|
|||||||
|
Ending balance
|
$
|
11,386
|
|
$
|
141,450
|
|
$
|
117
|
|
$
|
152,953
|
|
|||
F-35
BANKUNITED, INC. AND SUBSIDIARIES
NOTES TO CONSOLIDATED FINANCIAL STATEMENTS
December 31, 2016
|
|
2015
|
||||||||||||||
|
|
Residential
|
Commercial
|
Consumer
|
Total
|
|||||||||||
|
Beginning balance
|
$
|
11,325
|
|
$
|
84,027
|
|
$
|
190
|
|
$
|
95,542
|
|
|||
|
Provision for (recovery of) loan losses:
|
|||||||||||||||
|
Non-ACI loans
|
2,317
|
|
(66
|
)
|
—
|
|
2,251
|
|
|||||||
|
New loans
|
3,957
|
|
38,072
|
|
31
|
|
42,060
|
|
|||||||
|
Total provision
|
6,274
|
|
38,006
|
|
31
|
|
44,311
|
|
|||||||
|
Charge-offs:
|
|||||||||||||||
|
Non-ACI loans
|
(1,680
|
)
|
—
|
|
—
|
|
(1,680
|
)
|
|||||||
|
New loans
|
—
|
|
(13,719
|
)
|
—
|
|
(13,719
|
)
|
|||||||
|
Total charge-offs
|
(1,680
|
)
|
(13,719
|
)
|
—
|
|
(15,399
|
)
|
|||||||
|
Recoveries:
|
|||||||||||||||
|
Non-ACI loans
|
39
|
|
66
|
|
—
|
|
105
|
|
|||||||
|
New loans
|
—
|
|
1,237
|
|
32
|
|
1,269
|
|
|||||||
|
Total recoveries
|
39
|
|
1,303
|
|
32
|
|
1,374
|
|
|||||||
|
Ending balance
|
$
|
15,958
|
|
$
|
109,617
|
|
$
|
253
|
|
$
|
125,828
|
|
|||
|
|
2014
|
||||||||||||||
|
Residential
|
Commercial
|
Consumer
|
Total
|
||||||||||||
|
Beginning balance
|
$
|
15,353
|
|
$
|
52,185
|
|
$
|
2,187
|
|
$
|
69,725
|
|
|||
|
Provision for (recovery of) loan losses:
|
|||||||||||||||
|
ACI loans
|
—
|
|
1,987
|
|
324
|
|
2,311
|
|
|||||||
|
Non-ACI loans
|
(1,891
|
)
|
(663
|
)
|
—
|
|
(2,554
|
)
|
|||||||
|
New loans
|
850
|
|
42,310
|
|
(1,412
|
)
|
41,748
|
|
|||||||
|
Total provision
|
(1,041
|
)
|
43,634
|
|
(1,088
|
)
|
41,505
|
|
|||||||
|
Charge-offs:
|
|||||||||||||||
|
ACI loans
|
—
|
|
(4,880
|
)
|
(324
|
)
|
(5,204
|
)
|
|||||||
|
Non-ACI loans
|
(3,006
|
)
|
(490
|
)
|
—
|
|
(3,496
|
)
|
|||||||
|
New loans
|
—
|
|
(7,671
|
)
|
(1,083
|
)
|
(8,754
|
)
|
|||||||
|
Total charge-offs
|
(3,006
|
)
|
(13,041
|
)
|
(1,407
|
)
|
(17,454
|
)
|
|||||||
|
Recoveries:
|
|||||||||||||||
|
Non-ACI loans
|
19
|
|
721
|
|
—
|
|
740
|
|
|||||||
|
New loans
|
—
|
|
528
|
|
498
|
|
1,026
|
|
|||||||
|
Total recoveries
|
19
|
|
1,249
|
|
498
|
|
1,766
|
|
|||||||
|
Ending balance
|
$
|
11,325
|
|
$
|
84,027
|
|
$
|
190
|
|
$
|
95,542
|
|
|||
F-36
BANKUNITED, INC. AND SUBSIDIARIES
NOTES TO CONSOLIDATED FINANCIAL STATEMENTS
December 31, 2016
The following table presents information about the balance of the ALLL and related loans as of
December 31, 2016
and
2015
(in thousands):
|
2016
|
2015
|
||||||||||||||||||||||||||||||
|
|
Residential
|
Commercial
|
Consumer
|
Total
|
Residential
|
Commercial
|
Consumer
|
Total
|
|||||||||||||||||||||||
|
Allowance for loan and lease losses:
|
|
|
|
|
|
|
|
|
|||||||||||||||||||||||
|
Ending balance
|
$
|
11,386
|
|
$
|
141,450
|
|
$
|
117
|
|
$
|
152,953
|
|
$
|
15,958
|
|
$
|
109,617
|
|
$
|
253
|
|
$
|
125,828
|
|
|||||||
|
Ending balance: non-ACI and new loans individually evaluated for impairment
|
$
|
541
|
|
$
|
19,229
|
|
$
|
—
|
|
$
|
19,770
|
|
$
|
978
|
|
$
|
5,439
|
|
$
|
—
|
|
$
|
6,417
|
|
|||||||
|
Ending balance: non-ACI and new loans collectively evaluated for impairment
|
$
|
10,845
|
|
$
|
122,221
|
|
$
|
117
|
|
$
|
133,183
|
|
$
|
14,980
|
|
$
|
104,178
|
|
$
|
253
|
|
$
|
119,411
|
|
|||||||
|
Ending balance: ACI
|
$
|
—
|
|
$
|
—
|
|
$
|
—
|
|
$
|
—
|
|
$
|
—
|
|
$
|
—
|
|
$
|
—
|
|
$
|
—
|
|
|||||||
|
Ending balance: non-ACI
|
$
|
2,100
|
|
$
|
—
|
|
$
|
—
|
|
$
|
2,100
|
|
$
|
4,868
|
|
$
|
—
|
|
$
|
—
|
|
$
|
4,868
|
|
|||||||
|
Ending balance: new loans
|
$
|
9,286
|
|
$
|
141,450
|
|
$
|
117
|
|
$
|
150,853
|
|
$
|
11,090
|
|
$
|
109,617
|
|
$
|
253
|
|
$
|
120,960
|
|
|||||||
|
Loans:
|
|||||||||||||||||||||||||||||||
|
Ending balance
|
$
|
4,085,511
|
|
$
|
15,285,577
|
|
$
|
24,306
|
|
$
|
19,395,394
|
|
$
|
3,734,967
|
|
$
|
12,866,548
|
|
$
|
35,088
|
|
$
|
16,636,603
|
|
|||||||
|
Ending balance: non-ACI and new loans individually evaluated for impairment
|
$
|
12,957
|
|
$
|
176,932
|
|
$
|
—
|
|
$
|
189,889
|
|
$
|
12,240
|
|
$
|
54,128
|
|
$
|
—
|
|
$
|
66,368
|
|
|||||||
|
Ending balance: non-ACI and new loans collectively evaluated for impairment
|
$
|
3,536,312
|
|
$
|
15,061,707
|
|
$
|
24,299
|
|
$
|
18,622,318
|
|
$
|
3,018,857
|
|
$
|
12,745,054
|
|
$
|
35,078
|
|
$
|
15,798,989
|
|
|||||||
|
Ending balance: ACI loans
|
$
|
536,242
|
|
$
|
46,938
|
|
$
|
7
|
|
$
|
583,187
|
|
$
|
703,870
|
|
$
|
67,366
|
|
$
|
10
|
|
$
|
771,246
|
|
|||||||
F-37
BANKUNITED, INC. AND SUBSIDIARIES
NOTES TO CONSOLIDATED FINANCIAL STATEMENTS
December 31, 2016
Credit quality information
The tables below present information about new and non-ACI loans identified as impaired as of
December 31, 2016
and
2015
(in thousands):
|
2016
|
2015
|
||||||||||||||||||||||
|
|
Recorded
Investment
|
UPB
|
Related
Specific
Allowance
|
Recorded
Investment
|
UPB
|
Related
Specific
Allowance
|
|||||||||||||||||
|
New loans:
|
|
|
|
|
|
|
|
|
|
|
|
|
|||||||||||
|
With no specific allowance recorded:
|
|
|
|
|
|
|
|
|
|
|
|
|
|||||||||||
|
Commercial real estate
|
|
|
|
|
|||||||||||||||||||
|
Owner occupied
|
$
|
16,009
|
|
$
|
16,023
|
|
$
|
—
|
|
$
|
6,194
|
|
$
|
6,015
|
|
$
|
—
|
|
|||||
|
Non-owner occupied
|
—
|
|
—
|
|
—
|
|
548
|
|
533
|
|
—
|
|
|||||||||||
|
Construction and land
|
1,238
|
|
1,238
|
|
—
|
|
—
|
|
—
|
|
—
|
|
|||||||||||
|
Commercial and industrial
(1)
|
24,279
|
|
24,279
|
|
—
|
|
3,561
|
|
3,559
|
|
—
|
|
|||||||||||
|
Commercial lending subsidiaries
|
10,620
|
|
10,510
|
|
—
|
|
3,839
|
|
3,821
|
|
—
|
|
|||||||||||
|
With a specific allowance recorded:
|
|||||||||||||||||||||||
|
1-4 single family residential
|
561
|
|
546
|
|
12
|
|
—
|
|
—
|
|
—
|
|
|||||||||||
|
Commercial real estate
|
|
|
|
|
|
|
|||||||||||||||||
|
Owner occupied
|
491
|
|
513
|
|
263
|
|
—
|
|
—
|
|
—
|
|
|||||||||||
|
Commercial and industrial
(1)
|
102,583
|
|
102,610
|
|
15,116
|
|
34,340
|
|
34,370
|
|
3,799
|
|
|||||||||||
|
Commercial lending subsidiaries
|
21,712
|
|
21,605
|
|
3,850
|
|
5,646
|
|
5,628
|
|
1,640
|
|
|||||||||||
|
Total:
|
|||||||||||||||||||||||
|
Residential
|
$
|
561
|
|
$
|
546
|
|
$
|
12
|
|
$
|
—
|
|
$
|
—
|
|
$
|
—
|
|
|||||
|
Commercial
|
176,932
|
|
176,778
|
|
19,229
|
|
54,128
|
|
53,926
|
|
5,439
|
|
|||||||||||
|
|
$
|
177,493
|
|
$
|
177,324
|
|
$
|
19,241
|
|
$
|
54,128
|
|
$
|
53,926
|
|
$
|
5,439
|
|
|||||
|
Non-ACI loans:
|
|
|
|
|
|
|
|||||||||||||||||
|
With no specific allowance recorded:
|
|
|
|
|
|
|
|||||||||||||||||
|
1-4 single family residential
|
$
|
1,169
|
|
$
|
1,391
|
|
$
|
—
|
|
$
|
417
|
|
$
|
490
|
|
$
|
—
|
|
|||||
|
Home equity loans and lines of credit
|
2,255
|
|
2,286
|
|
—
|
|
1,607
|
|
1,633
|
|
—
|
|
|||||||||||
|
With a specific allowance recorded:
|
|||||||||||||||||||||||
|
1-4 single family residential
|
1,272
|
|
1,514
|
|
181
|
|
3,301
|
|
3,828
|
|
570
|
|
|||||||||||
|
Home equity loans and lines of credit
|
7,700
|
|
7,804
|
|
348
|
|
6,915
|
|
7,028
|
|
408
|
|
|||||||||||
|
Total
|
$
|
12,396
|
|
$
|
12,995
|
|
$
|
529
|
|
$
|
12,240
|
|
$
|
12,979
|
|
$
|
978
|
|
|||||
__________________________________________
|
(1)
|
Impaired taxi medallion loans with a recorded investment of
$91.2 million
and
$1.3 million
, with related specific allowances of
$5.9 million
and
$0.1 million
, are included in impaired new commercial and industrial loans above at
December 31, 2016
and
2015
, respectively.
|
Impaired loans also include commercial real estate ACI loans modified in TDRs with a carrying value of
$1.3 million
and
$0.5 million
as of
December 31, 2016
and
2015
, respectively. Interest income recognized on impaired loans after impairment was not significant during the periods presented.
F-38
BANKUNITED, INC. AND SUBSIDIARIES
NOTES TO CONSOLIDATED FINANCIAL STATEMENTS
December 31, 2016
The following tables present the average recorded investment in impaired loans for the years ended
December 31, 2016
,
2015
and
2014
(in thousands):
|
|
2016
|
2015
|
2014
|
||||||||||||||||||||||||||||||||
|
|
New Loans
|
Non-ACI
Loans
|
ACI Loans
|
New Loans
|
Non-ACI
Loans
|
ACI Loans
|
New Loans
|
Non-ACI
Loans
|
ACI Loans
|
||||||||||||||||||||||||||
|
Residential:
|
|
|
|
|
|
|
|
|
|
|
|||||||||||||||||||||||||
|
1-4 single family residential
|
$
|
301
|
|
$
|
3,067
|
|
$
|
—
|
|
$
|
82
|
|
$
|
3,655
|
|
$
|
—
|
|
$
|
—
|
|
$
|
3,748
|
|
$
|
—
|
|
||||||||
|
Home equity loans and lines of credit
|
—
|
|
9,225
|
|
—
|
|
—
|
|
4,830
|
|
—
|
|
—
|
|
2,417
|
|
—
|
|
|||||||||||||||||
|
|
301
|
|
12,292
|
|
—
|
|
82
|
|
8,485
|
|
—
|
|
—
|
|
6,165
|
|
—
|
|
|||||||||||||||||
|
Commercial:
|
|||||||||||||||||||||||||||||||||||
|
Multi-family
|
—
|
|
—
|
|
—
|
|
291
|
|
—
|
|
—
|
|
—
|
|
—
|
|
696
|
|
|||||||||||||||||
|
Commercial real estate
|
|||||||||||||||||||||||||||||||||||
|
Owner occupied
|
14,332
|
|
—
|
|
313
|
|
5,117
|
|
—
|
|
—
|
|
2,949
|
|
—
|
|
529
|
|
|||||||||||||||||
|
Non-owner occupied
|
205
|
|
—
|
|
505
|
|
559
|
|
—
|
|
442
|
|
1,385
|
|
—
|
|
6,564
|
|
|||||||||||||||||
|
Construction and land
|
797
|
|
—
|
|
—
|
|
—
|
|
—
|
|
—
|
|
—
|
|
—
|
|
451
|
|
|||||||||||||||||
|
Commercial and industrial
|
85,455
|
|
—
|
|
—
|
|
35,976
|
|
—
|
|
—
|
|
15,058
|
|
399
|
|
786
|
|
|||||||||||||||||
|
Commercial lending subsidiaries
|
15,052
|
|
—
|
|
—
|
|
14,835
|
|
—
|
|
—
|
|
2,680
|
|
—
|
|
—
|
|
|||||||||||||||||
|
|
115,841
|
|
—
|
|
818
|
|
56,778
|
|
—
|
|
442
|
|
22,072
|
|
399
|
|
9,026
|
|
|||||||||||||||||
|
|
$
|
116,142
|
|
$
|
12,292
|
|
$
|
818
|
|
$
|
56,860
|
|
$
|
8,485
|
|
$
|
442
|
|
$
|
22,072
|
|
$
|
6,564
|
|
$
|
9,026
|
|
||||||||
F-39
BANKUNITED, INC. AND SUBSIDIARIES
NOTES TO CONSOLIDATED FINANCIAL STATEMENTS
December 31, 2016
The following table presents the recorded investment in new and non-ACI loans on non-accrual status as of
December 31, 2016
and
2015
(in thousands):
|
2016
|
2015
|
||||||||||||||
|
|
New
Loans
|
Non-ACI
Loans
|
New
Loans
|
Non-ACI
Loans
|
|||||||||||
|
Residential:
|
|
|
|
|
|
|
|
|
|||||||
|
1-4 single family residential
|
$
|
566
|
|
$
|
918
|
|
$
|
2,007
|
|
$
|
594
|
|
|||
|
Home equity loans and lines of credit
|
—
|
|
2,283
|
|
—
|
|
4,724
|
|
|||||||
|
|
566
|
|
3,201
|
|
2,007
|
|
5,318
|
|
|||||||
|
Commercial:
|
|
|
|
|
|||||||||||
|
Commercial real estate
|
|
|
|
|
|||||||||||
|
Owner occupied
|
19,439
|
|
—
|
|
8,274
|
|
—
|
|
|||||||
|
Non-owner occupied
|
559
|
|
—
|
|
—
|
|
—
|
|
|||||||
|
Construction and land
|
1,238
|
|
—
|
|
—
|
|
—
|
|
|||||||
|
Commercial and industrial
(1)
|
76,696
|
|
—
|
|
37,782
|
|
—
|
|
|||||||
|
Commercial lending subsidiaries
|
32,645
|
|
—
|
|
9,920
|
|
—
|
|
|||||||
|
|
130,577
|
|
—
|
|
55,976
|
|
—
|
|
|||||||
|
Consumer
|
2
|
|
—
|
|
7
|
|
—
|
|
|||||||
|
|
$
|
131,145
|
|
$
|
3,201
|
|
$
|
57,990
|
|
$
|
5,318
|
|
|||
__________________________________________
|
(1)
|
Taxi medallion loans with a carrying value of
$60.7 million
and
$2.6 million
are included in new commercial and industrial loans in non-accrual status above at
December 31, 2016
and
2015
, respectively.
|
New and non-ACI loans contractually delinquent by 90 days or more and still accruing totaled
$1.6 million
and
$1.4 million
at
December 31, 2016
and
2015
, respectively. The amount of additional interest income that would have been recognized on non-accrual loans had they performed in accordance with their contractual terms was approximately
$3.5 million
and
$2.4 million
for the years ended
December 31, 2016
and
2015
, respectively.
Management considers delinquency status to be the most meaningful indicator of the credit quality of 1-4 single family residential, home equity and consumer loans. Delinquency statistics are updated at least monthly. See "Aging of loans" below for more information on the delinquency status of loans. Original LTV and original FICO score are also important indicators of credit quality for the new 1-4 single family residential portfolio.
Internal risk ratings are considered the most meaningful indicator of credit quality for commercial loans. Internal risk ratings are a key factor in identifying loans that are individually evaluated for impairment and impact management’s estimates of loss factors used in determining the amount of the ALLL. Internal risk ratings are updated on a continuous basis. Generally, relationships with balances in excess of defined thresholds, ranging from
$1 million
to
$3 million
, are re-evaluated at least annually and more frequently if circumstances indicate that a change in risk rating may be warranted. Loans exhibiting potential credit weaknesses that deserve management’s close attention and that if left uncorrected may result in deterioration of the repayment capacity of the borrower are categorized as special mention. Loans with well-defined credit weaknesses, including payment defaults, declining collateral values, frequent overdrafts, operating losses, increasing balance sheet leverage, inadequate cash flow, project cost overruns, unreasonable construction delays, past due real estate taxes or exhausted interest reserves, are assigned an internal risk rating of substandard. A loan with a weakness so severe that collection in full is highly questionable or improbable, but because of certain reasonably specific pending factors has not been charged off, will be assigned an internal risk rating of doubtful.
F-40
BANKUNITED, INC. AND SUBSIDIARIES
NOTES TO CONSOLIDATED FINANCIAL STATEMENTS
December 31, 2016
The following tables summarize key indicators of credit quality for the Company's loans as of
December 31, 2016
and
2015
. Amounts include premiums, discounts and deferred fees and costs (in thousands):
1-4 Single Family Residential credit exposure for new loans, based on original LTV and FICO score:
|
2016
|
||||||||||||||||||||
|
|
FICO
|
|||||||||||||||||||
|
LTV
|
720 or less
|
721 - 740
|
741 - 760
|
761 or
greater
|
Total
|
|||||||||||||||
|
60% or less
|
$
|
87,035
|
|
$
|
113,401
|
|
$
|
163,668
|
|
$
|
751,291
|
|
$
|
1,115,395
|
|
|||||
|
60% - 70%
|
80,694
|
|
94,592
|
|
124,180
|
|
523,970
|
|
823,436
|
|
||||||||||
|
70% - 80%
|
110,509
|
|
148,211
|
|
276,425
|
|
907,450
|
|
1,442,595
|
|
||||||||||
|
More than 80%
|
22,115
|
|
9,058
|
|
15,470
|
|
42,280
|
|
88,923
|
|
||||||||||
|
|
$
|
300,353
|
|
$
|
365,262
|
|
$
|
579,743
|
|
$
|
2,224,991
|
|
$
|
3,470,349
|
|
|||||
|
2015
|
||||||||||||||||||||
|
|
FICO
|
|||||||||||||||||||
|
LTV
|
720 or less
|
721 - 740
|
741 - 760
|
761 or
greater
|
Total
|
|||||||||||||||
|
60% or less
|
$
|
78,836
|
|
$
|
99,094
|
|
$
|
143,864
|
|
$
|
667,420
|
|
$
|
989,214
|
|
|||||
|
60% - 70%
|
71,046
|
|
76,878
|
|
111,343
|
|
479,344
|
|
738,611
|
|
||||||||||
|
70% - 80%
|
63,380
|
|
100,271
|
|
211,299
|
|
772,646
|
|
1,147,596
|
|
||||||||||
|
More than 80%
|
28,338
|
|
3,938
|
|
3,481
|
|
13,443
|
|
49,200
|
|
||||||||||
|
|
$
|
241,600
|
|
$
|
280,181
|
|
$
|
469,987
|
|
$
|
1,932,853
|
|
$
|
2,924,621
|
|
|||||
Commercial credit exposure, based on internal risk rating:
|
2016
|
|||||||||||||||||||||||||||
|
Commercial Real Estate
|
|||||||||||||||||||||||||||
|
|
Multi-Family
|
Owner Occupied
|
Non-Owner Occupied
|
Construction
and Land
|
Commercial
and
Industrial
(1)
|
Commercial Lending Subsidiaries
|
Total
|
||||||||||||||||||||
|
New loans:
|
|
|
|
|
|
|
|
|
|
|
|
|
|||||||||||||||
|
Pass
|
$
|
3,789,003
|
|
$
|
1,663,012
|
|
$
|
3,682,308
|
|
$
|
309,675
|
|
$
|
3,152,208
|
|
$
|
2,255,444
|
|
$
|
14,851,650
|
|
||||||
|
Special mention
|
12,000
|
|
33,274
|
|
7,942
|
|
—
|
|
19,009
|
|
—
|
|
72,225
|
|
|||||||||||||
|
Substandard
|
5,562
|
|
29,552
|
|
28,583
|
|
1,238
|
|
206,739
|
|
31,572
|
|
303,246
|
|
|||||||||||||
|
Doubtful
|
—
|
|
—
|
|
—
|
|
—
|
|
8,340
|
|
3,178
|
|
11,518
|
|
|||||||||||||
|
|
$
|
3,806,565
|
|
$
|
1,725,838
|
|
$
|
3,718,833
|
|
$
|
310,913
|
|
$
|
3,386,296
|
|
$
|
2,290,194
|
|
$
|
15,238,639
|
|
||||||
|
ACI loans:
|
|||||||||||||||||||||||||||
|
Pass
|
$
|
22,819
|
|
$
|
9,187
|
|
$
|
12,623
|
|
$
|
—
|
|
$
|
842
|
|
$
|
—
|
|
$
|
45,471
|
|
||||||
|
Special mention
|
—
|
|
—
|
|
—
|
|
—
|
|
—
|
|
—
|
|
—
|
|
|||||||||||||
|
Substandard
|
290
|
|
825
|
|
352
|
|
—
|
|
—
|
|
—
|
|
1,467
|
|
|||||||||||||
|
Doubtful
|
—
|
|
—
|
|
—
|
|
—
|
|
—
|
|
—
|
|
—
|
|
|||||||||||||
|
$
|
23,109
|
|
$
|
10,012
|
|
$
|
12,975
|
|
$
|
—
|
|
$
|
842
|
|
$
|
—
|
|
$
|
46,938
|
|
|||||||
__________________________________________
|
(1)
|
Taxi medallion loans with internal risk ratings of substandard and doubtful totaled
$138.0 million
and
$0.2 million
, respectively, and are included in new commercial and industrial balances above at
December 31, 2016
.
|
F-41
BANKUNITED, INC. AND SUBSIDIARIES
NOTES TO CONSOLIDATED FINANCIAL STATEMENTS
December 31, 2016
|
2015
|
|||||||||||||||||||||||||||
|
Commercial Real Estate
|
|||||||||||||||||||||||||||
|
|
Multi-Family
|
Owner Occupied
|
Non-Owner Occupied
|
Construction
and Land
|
Commercial
and
Industrial
(1)
|
Commercial Lending Subsidiaries
|
Total
|
||||||||||||||||||||
|
New loans:
|
|
|
|
|
|
|
|
|
|
|
|
|
|||||||||||||||
|
Pass
|
$
|
3,451,571
|
|
$
|
1,317,081
|
|
$
|
2,879,135
|
|
$
|
346,795
|
|
$
|
2,587,801
|
|
$
|
1,981,068
|
|
$
|
12,563,451
|
|
||||||
|
Special mention
|
—
|
|
4,824
|
|
548
|
|
—
|
|
7,556
|
|
18,584
|
|
31,512
|
|
|||||||||||||
|
Substandard
|
402
|
|
17,042
|
|
434
|
|
176
|
|
168,875
|
|
11,018
|
|
197,947
|
|
|||||||||||||
|
Doubtful
|
—
|
|
—
|
|
—
|
|
—
|
|
4,296
|
|
1,976
|
|
6,272
|
|
|||||||||||||
|
|
$
|
3,451,973
|
|
$
|
1,338,947
|
|
|
$
|
2,880,117
|
|
|
$
|
346,971
|
|
|
$
|
2,768,528
|
|
|
$
|
2,012,646
|
|
|
$
|
12,799,182
|
|
|
|
ACI loans:
|
|||||||||||||||||||||||||||
|
Pass
|
$
|
24,338
|
|
$
|
15,708
|
|
$
|
24,857
|
|
$
|
—
|
|
$
|
1,035
|
|
$
|
—
|
|
$
|
65,938
|
|
||||||
|
Special mention
|
—
|
|
859
|
|
—
|
|
—
|
|
—
|
|
—
|
|
859
|
|
|||||||||||||
|
Substandard
|
298
|
|
—
|
|
84
|
|
—
|
|
27
|
|
—
|
|
409
|
|
|||||||||||||
|
Doubtful
|
—
|
|
—
|
|
160
|
|
—
|
|
—
|
|
—
|
|
160
|
|
|||||||||||||
|
$
|
24,636
|
|
$
|
16,567
|
|
$
|
25,101
|
|
$
|
—
|
|
$
|
1,062
|
|
$
|
—
|
|
$
|
67,366
|
|
|||||||
__________________________________________
|
(1)
|
Taxi medallion loans with internal risk ratings of substandard totaled
$80.5 million
and are included in new commercial and industrial balances above at
December 31, 2015
.
|
F-42
BANKUNITED, INC. AND SUBSIDIARIES
NOTES TO CONSOLIDATED FINANCIAL STATEMENTS
December 31, 2016
Aging of loans:
The following table presents an aging of loans as of
December 31, 2016
and
2015
. Amounts include premiums, discounts and deferred fees and costs (in thousands):
|
2016
|
2015
|
||||||||||||||||||||||||||||||||||||||
|
|
Current
|
30 - 59
Days Past
Due
|
60 - 89
Days Past
Due
|
90 Days or
More Past
Due
|
Total
|
Current
|
30 - 59
Days Past
Due
|
60 - 89
Days Past
Due
|
90 Days or
More Past
Due
|
Total
|
|||||||||||||||||||||||||||||
|
New loans:
|
|
|
|
|
|
|
|
|
|
|
|
|
|
|
|
|
|
|
|
|
|||||||||||||||||||
|
1-4 single family residential
|
$
|
3,457,606
|
|
$
|
10,355
|
|
$
|
325
|
|
$
|
2,063
|
|
$
|
3,470,349
|
|
$
|
2,917,579
|
|
$
|
3,664
|
|
$
|
552
|
|
$
|
2,826
|
|
$
|
2,924,621
|
|
|||||||||
|
Home equity loans and lines of credit
|
1,120
|
|
—
|
|
—
|
|
—
|
|
1,120
|
|
806
|
|
—
|
|
—
|
|
—
|
|
806
|
|
|||||||||||||||||||
|
Multi-family
|
3,806,565
|
|
—
|
|
—
|
|
—
|
|
3,806,565
|
|
3,451,973
|
|
—
|
|
—
|
|
—
|
|
3,451,973
|
|
|||||||||||||||||||
|
Commercial real estate
|
|
|
|||||||||||||||||||||||||||||||||||||
|
Owner occupied
|
1,716,814
|
|
1,557
|
|
797
|
|
6,670
|
|
1,725,838
|
|
1,329,131
|
|
1,433
|
|
4,784
|
|
3,599
|
|
1,338,947
|
|
|||||||||||||||||||
|
Non-owner occupied
|
3,717,666
|
|
754
|
|
—
|
|
413
|
|
3,718,833
|
|
2,878,218
|
|
1,899
|
|
—
|
|
—
|
|
2,880,117
|
|
|||||||||||||||||||
|
Construction and land
|
309,675
|
|
—
|
|
—
|
|
1,238
|
|
310,913
|
|
342,477
|
|
4,494
|
|
—
|
|
—
|
|
346,971
|
|
|||||||||||||||||||
|
Commercial and industrial
|
3,335,022
|
|
9,552
|
|
5,517
|
|
36,205
|
|
3,386,296
|
|
2,739,357
|
|
2,235
|
|
4,827
|
|
22,109
|
|
2,768,528
|
|
|||||||||||||||||||
|
Commercial lending subsidiaries
|
2,284,435
|
|
12
|
|
3,247
|
|
2,500
|
|
2,290,194
|
|
2,003,842
|
|
3,839
|
|
—
|
|
4,965
|
|
2,012,646
|
|
|||||||||||||||||||
|
Consumer
|
24,299
|
|
—
|
|
—
|
|
—
|
|
24,299
|
|
35,078
|
|
—
|
|
—
|
|
—
|
|
35,078
|
|
|||||||||||||||||||
|
|
$
|
18,653,202
|
|
$
|
22,230
|
|
$
|
9,886
|
|
$
|
49,089
|
|
$
|
18,734,407
|
|
$
|
15,698,461
|
|
$
|
17,564
|
|
$
|
10,163
|
|
$
|
33,499
|
|
$
|
15,759,687
|
|
|||||||||
|
Non-ACI loans:
|
|
|
|
|
|
|
|
|
|
|
|||||||||||||||||||||||||||||
|
1-4 single family residential
|
$
|
29,406
|
|
$
|
481
|
|
$
|
—
|
|
$
|
918
|
|
$
|
30,805
|
|
$
|
36,904
|
|
$
|
1,583
|
|
$
|
21
|
|
$
|
750
|
|
$
|
39,258
|
|
|||||||||
|
Home equity loans and lines of credit
|
43,129
|
|
1,255
|
|
534
|
|
2,077
|
|
46,995
|
|
60,760
|
|
1,090
|
|
443
|
|
4,119
|
|
66,412
|
|
|||||||||||||||||||
|
|
$
|
72,535
|
|
$
|
1,736
|
|
$
|
534
|
|
$
|
2,995
|
|
$
|
77,800
|
|
$
|
97,664
|
|
$
|
2,673
|
|
$
|
464
|
|
$
|
4,869
|
|
$
|
105,670
|
|
|||||||||
|
ACI loans:
|
|||||||||||||||||||||||||||||||||||||||
|
1-4 single family residential
|
$
|
500,272
|
|
$
|
13,524
|
|
$
|
2,990
|
|
$
|
15,562
|
|
$
|
532,348
|
|
$
|
659,726
|
|
$
|
12,714
|
|
$
|
4,988
|
|
$
|
21,611
|
|
$
|
699,039
|
|
|||||||||
|
Home equity loans and lines of credit
|
3,460
|
|
148
|
|
23
|
|
263
|
|
3,894
|
|
4,243
|
|
127
|
|
9
|
|
452
|
|
4,831
|
|
|||||||||||||||||||
|
Multi-family
|
23,109
|
|
—
|
|
—
|
|
—
|
|
23,109
|
|
24,636
|
|
—
|
|
—
|
|
—
|
|
24,636
|
|
|||||||||||||||||||
|
Commercial real estate
|
|
|
|||||||||||||||||||||||||||||||||||||
|
Owner occupied
|
10,012
|
|
—
|
|
—
|
|
—
|
|
10,012
|
|
16,567
|
|
—
|
|
—
|
|
—
|
|
16,567
|
|
|||||||||||||||||||
|
Non-owner occupied
|
12,804
|
|
—
|
|
—
|
|
171
|
|
12,975
|
|
24,941
|
|
—
|
|
160
|
|
—
|
|
25,101
|
|
|||||||||||||||||||
|
Commercial and industrial
|
842
|
|
—
|
|
—
|
|
—
|
|
842
|
|
1,041
|
|
—
|
|
21
|
|
—
|
|
1,062
|
|
|||||||||||||||||||
|
Consumer
|
7
|
|
—
|
|
—
|
|
—
|
|
7
|
|
10
|
|
—
|
|
—
|
|
—
|
|
10
|
|
|||||||||||||||||||
|
$
|
550,506
|
|
$
|
13,672
|
|
|
$
|
3,013
|
|
$
|
15,996
|
|
$
|
583,187
|
|
$
|
731,164
|
|
$
|
12,841
|
|
$
|
5,178
|
|
$
|
22,063
|
|
$
|
771,246
|
|
|||||||||
1-4 single family residential and home equity ACI loans that are contractually delinquent by more than 90 days and accounted for in pools that are on accrual status because discount continues to be accreted totaled
$16 million
and
$22 million
, at
December 31, 2016
and
2015
, respectively.
F-43
BANKUNITED, INC. AND SUBSIDIARIES
NOTES TO CONSOLIDATED FINANCIAL STATEMENTS
December 31, 2016
Loan Concentration:
At
December 31, 2016
and
2015
, 1-4 single family residential loans outstanding were to customers domiciled in the following states (dollars in thousands):
|
|
2016
|
||||||||||||||||
|
|
Percent of Total
|
||||||||||||||||
|
New Loans
|
Covered Loans
|
Total
|
New Loans
|
Total Loans
|
|||||||||||||
|
California
|
$
|
904,107
|
|
$
|
37,330
|
|
$
|
941,437
|
|
26.1
|
%
|
23.3
|
%
|
||||
|
Florida
|
487,294
|
|
300,198
|
|
787,492
|
|
14.0
|
%
|
19.5
|
%
|
|||||||
|
New York
|
763,824
|
|
16,403
|
|
780,227
|
|
22.0
|
%
|
19.3
|
%
|
|||||||
|
Virginia
|
152,113
|
|
30,818
|
|
182,931
|
|
4.4
|
%
|
4.5
|
%
|
|||||||
|
Others
|
1,163,011
|
|
178,404
|
|
1,341,415
|
|
33.5
|
%
|
33.4
|
%
|
|||||||
|
|
$
|
3,470,349
|
|
$
|
563,153
|
|
$
|
4,033,502
|
|
100.0
|
%
|
100.0
|
%
|
||||
|
|
2015
|
||||||||||||||||
|
|
Percent of Total
|
||||||||||||||||
|
New Loans
|
Covered Loans
|
Total
|
New Loans
|
Total Loans
|
|||||||||||||
|
California
|
$
|
948,301
|
|
$
|
53,048
|
|
$
|
1,001,349
|
|
32.4
|
%
|
27.3
|
%
|
||||
|
Florida
|
422,638
|
|
381,897
|
|
804,535
|
|
14.5
|
%
|
22.0
|
%
|
|||||||
|
New York
|
548,181
|
|
23,326
|
|
571,507
|
|
18.7
|
%
|
15.6
|
%
|
|||||||
|
Virginia
|
87,851
|
|
40,329
|
|
128,180
|
|
3.0
|
%
|
3.5
|
%
|
|||||||
|
Others
|
917,650
|
|
239,697
|
|
1,157,347
|
|
31.4
|
%
|
31.6
|
%
|
|||||||
|
|
$
|
2,924,621
|
|
$
|
738,297
|
|
$
|
3,662,918
|
|
100.0
|
%
|
100.0
|
%
|
||||
No other state represented borrowers with more that 4.0% of 1-4 single family residential loans outstanding at
December 31, 2016
or
2015
. At
December 31, 2016
,
43.1%
and
39.2%
, respectively, of loans in the new commercial portfolio were to borrowers in Florida and the New York tri-state area, respectively.
Foreclosure of residential real estate:
The carrying amount of foreclosed residential real estate properties included in "Other assets" in the accompanying consolidated balance sheets, all of which were covered, totaled
$5 million
and
$9 million
at
December 31, 2016
and
2015
, respectively. The recorded investment in residential mortgage loans in the process of foreclosure totaled
$8 million
and
$13 million
at
December 31, 2016
and
2015
, respectively, substantially all of which were covered loans.
F-44
BANKUNITED, INC. AND SUBSIDIARIES
NOTES TO CONSOLIDATED FINANCIAL STATEMENTS
December 31, 2016
Troubled debt restructurings:
The following tables summarize loans that were modified in TDRs during the years ended
December 31, 2016
and
2015
, as well as loans modified during the years ended
December 31, 2016
and
2015
that experienced payment defaults during the periods (dollars in thousands):
|
|
2016
|
2015
|
|||||||||||||||||||||||||
|
|
Loans Modified in TDRs
During the Period |
TDRs Experiencing Payment
Defaults During the Period |
Loans Modified in TDRs
During the Period |
TDRs Experiencing Payment
Defaults During the Period |
|||||||||||||||||||||||
|
|
Number of
TDRs |
Recorded
Investment |
Number of
TDRs |
Recorded
Investment |
Number of
TDRs |
Recorded
Investment |
Number of
TDRs |
Recorded
Investment |
|||||||||||||||||||
|
New loans:
|
|
|
|
|
|
|
|
|
|
|
|
|
|
|
|
|
|||||||||||
|
1-4 single family residential
|
2
|
|
$
|
326
|
|
—
|
|
$
|
—
|
|
—
|
|
$
|
—
|
|
—
|
|
$
|
—
|
|
|||||||
|
Commercial real estate
|
|||||||||||||||||||||||||||
|
Owner occupied commercial real estate
|
3
|
|
5,117
|
|
1
|
|
491
|
|
—
|
|
—
|
|
—
|
|
—
|
|
|||||||||||
|
Non-owner occupied
|
—
|
|
—
|
|
—
|
|
—
|
|
1
|
|
548
|
|
—
|
|
—
|
|
|||||||||||
|
Commercial and industrial
(1)
|
82
|
|
88,101
|
|
17
|
|
10,139
|
|
2
|
|
1,260
|
|
1
|
|
627
|
|
|||||||||||
|
Commercial lending subsidiaries
|
6
|
|
6,735
|
|
1
|
|
2,500
|
|
—
|
|
—
|
|
—
|
|
—
|
|
|||||||||||
|
|
93
|
|
$
|
100,279
|
|
19
|
|
$
|
13,130
|
|
3
|
|
$
|
1,808
|
|
1
|
|
$
|
627
|
|
|||||||
|
Non-ACI loans:
|
|
|
|
|
|
|
|
|
|||||||||||||||||||
|
1-4 single family residential
|
—
|
|
—
|
|
—
|
|
—
|
|
2
|
|
239
|
|
—
|
|
—
|
|
|||||||||||
|
Home equity loans and lines of credit
|
17
|
|
$
|
2,016
|
|
1
|
|
$
|
370
|
|
28
|
|
$
|
6,208
|
|
7
|
|
$
|
1,231
|
|
|||||||
|
17
|
|
$
|
2,016
|
|
1
|
|
$
|
370
|
|
30
|
|
$
|
6,447
|
|
7
|
|
$
|
1,231
|
|
||||||||
|
ACI loans:
|
|||||||||||||||||||||||||||
|
Owner occupied commercial real estate
|
1
|
|
$
|
825
|
|
—
|
|
$
|
—
|
|
1
|
|
$
|
500
|
|
—
|
|
$
|
—
|
|
|||||||
__________________________________________
|
(1)
|
Commercial and industrial loans modified in TDRs during the years ended
December 31, 2016
and
2015
included
$64.9 million
and
$1.3 million
of taxi medallion loans. All of the commercial and industrial TDRs experiencing payment defaults during the years ended
December 31, 2016
and
2015
were taxi medallion loans.
|
Loans modified in TDRs during the year ended December 31, 2014 were not significant. Modifications during the years ended
December 31, 2016
and
2015
included interest rate reductions, restructuring of the amount and timing of required periodic payments, extensions of maturity and residential modifications under the U.S. Treasury Department’s HAMP. Included in TDRs are residential loans to borrowers who have not reaffirmed their debt discharged in Chapter 7 bankruptcy. The total amount of such loans is not material. Modified ACI loans accounted for in pools are not considered TDRs, are not separated from the pools and are not classified as impaired loans.
When the Company recognizes gains or losses related to covered assets in its consolidated financial statements, changes in the estimated amount recoverable from the FDIC under the Loss Sharing Agreements with respect to those gains or losses are also reflected in the consolidated financial statements. Covered loans may be resolved through prepayment, short sale of the underlying collateral, foreclosure, sale of the loans or charge-off. For loans resolved through prepayment, short sale or foreclosure, the difference between consideration received in satisfaction of the loans and the carrying value of the loans is recognized in the consolidated statement of income line item “
Income from resolution of covered assets, net
.” Losses from the resolution of covered loans increase the amount recoverable from the FDIC under the Loss Sharing Agreements. Gains from the resolution of covered loans reduce the amount recoverable from the FDIC under the Loss Sharing Agreements. Similarly, differences in proceeds received on the sale of covered OREO and covered loans and their carrying amounts result in gains or losses and reduce or increase the amount recoverable from the FDIC under the Loss Sharing Agreements. Increases in valuation allowances or impairment charges related to covered assets also increase the amount estimated to be recoverable from the FDIC. These additions to or reductions in amounts recoverable from the FDIC related to transactions in the covered assets are recorded in the consolidated statement of income line item “
Net loss on FDIC indemnification
” and reflected as corresponding increases or decreases in the FDIC indemnification asset.
F-45
BANKUNITED, INC. AND SUBSIDIARIES
NOTES TO CONSOLIDATED FINANCIAL STATEMENTS
December 31, 2016
In addition, recoveries of previously indemnified losses on commercial loans and gains on the sale of investment securities that were previously covered under the Commercial Shared-Loss Agreement result in reimbursements due to the FDIC. These transactions are included in the tables below. Amounts payable to the FDIC resulting from these transactions are recognized in other liabilities in the accompanying consolidated balance sheets.
The following tables summarize the components of the gains and losses associated with covered assets, along with the related additions to or reductions in the amounts recoverable from the FDIC under the Loss Sharing Agreements, as reflected in the consolidated statements of income for the years ended
December 31, 2016
,
2015
and
2014
(in thousands):
|
|
2016
|
||||||||||
|
|
Transaction
Income (Loss) |
Net Loss on FDIC
Indemnification |
Net Impact
on Pre-tax Earnings |
||||||||
|
Recovery of losses on covered loans
(1)
|
$
|
1,842
|
|
$
|
(1,472
|
)
|
$
|
370
|
|
||
|
Income from resolution of covered assets, net
|
36,155
|
|
(28,946
|
)
|
7,209
|
|
|||||
|
Loss on sale of covered loans
|
(14,470
|
)
|
11,615
|
|
(2,855
|
)
|
|||||
|
Loss on covered OREO
|
(1,301
|
)
|
1,044
|
|
(257
|
)
|
|||||
|
$
|
22,226
|
|
$
|
(17,759
|
)
|
$
|
4,467
|
|
|||
|
|
2015
|
||||||||||
|
|
Transaction
Income (Loss) |
Net Loss on FDIC
Indemnification |
Net Impact
on Pre-tax Earnings |
||||||||
|
Provision for losses on covered loans
(1)
|
$
|
(2,284
|
)
|
$
|
1,826
|
|
$
|
(458
|
)
|
||
|
Income from resolution of covered assets, net
|
50,658
|
|
(40,395
|
)
|
10,263
|
|
|||||
|
Gain on sale of covered loans
|
34,929
|
|
(28,051
|
)
|
6,878
|
|
|||||
|
Loss on covered OREO
|
(1,014
|
)
|
678
|
|
(336
|
)
|
|||||
|
$
|
82,289
|
|
$
|
(65,942
|
)
|
$
|
16,347
|
|
|||
|
|
2014
|
||||||||||
|
|
Transaction
Income |
Net Loss on FDIC
Indemnification |
Net Impact
on Pre-tax Earnings |
||||||||
|
Recovery of losses on covered loans
(1)
|
$
|
33
|
|
$
|
(54
|
)
|
$
|
(21
|
)
|
||
|
Income from resolution of covered assets, net
|
49,082
|
|
(39,127
|
)
|
9,955
|
|
|||||
|
Gain on sale of covered loans
|
20,369
|
|
(5,338
|
)
|
15,031
|
|
|||||
|
Gain on covered investment securities available for sale
|
209
|
|
(167
|
)
|
42
|
|
|||||
|
Gain on covered OREO
|
2,744
|
|
(1,710
|
)
|
1,034
|
|
|||||
|
$
|
72,437
|
|
$
|
(46,396
|
)
|
$
|
26,041
|
|
|||
__________________________________________
|
(1)
|
Transaction income (loss) for the years ended
December 31, 2016
,
2015
and
2014
includes provisions (recoveries) of
$(161) thousand
,
$33 thousand
and
$210 thousand
, respectively, related to unfunded loan commitments included in other non-interest expense in the accompanying consolidated statements of income.
|
F-46
BANKUNITED, INC. AND SUBSIDIARIES
NOTES TO CONSOLIDATED FINANCIAL STATEMENTS
December 31, 2016
Changes in the FDIC indemnification asset and in the liability to the FDIC for recoveries related to assets previously covered under the Commercial Shared-Loss Agreement for the years ended
December 31, 2016
,
2015
and
2014
, were as follows (in thousands):
|
Balance at December 31, 2013
|
$
|
1,205,117
|
|
|
Amortization
|
(69,470
|
)
|
|
|
Reduction for claims filed
|
(114,916
|
)
|
|
|
Net loss on FDIC indemnification
|
(46,396
|
)
|
|
|
Balance at December 31, 2014
|
974,335
|
|
|
|
Amortization
|
(109,411
|
)
|
|
|
Reduction for claims filed
|
(59,139
|
)
|
|
|
Net loss on FDIC indemnification
|
(65,942
|
)
|
|
|
Balance at December 31, 2015
|
739,843
|
|
|
|
Amortization
|
(160,091
|
)
|
|
|
Reduction for claims filed
|
(46,083
|
)
|
|
|
Net loss on FDIC indemnification
|
(17,759
|
)
|
|
|
Balance at December 31, 2016
|
$
|
515,910
|
|
The balances at
December 31, 2016
and
2015
are reflected in the consolidated balance sheets as follows (in thousands):
|
2016
|
2015
|
||||||
|
FDIC indemnification asset
|
$
|
515,933
|
|
$
|
739,880
|
|
|
|
Other liabilities
|
(23
|
)
|
(37
|
)
|
|||
|
$
|
515,910
|
|
$
|
739,843
|
|
||
Equipment under operating lease consists of transportation equipment, primarily railcars. The components of equipment under operating lease as of
December 31, 2016
and
2015
are summarized as follows (in thousands):
|
|
2016
|
2015
|
|||||
|
Equipment under operating lease
|
$
|
589,716
|
|
$
|
509,641
|
|
|
|
Less: accumulated depreciation
|
(49,802
|
)
|
(26,123
|
)
|
|||
|
Equipment under operating lease, net
|
$
|
539,914
|
|
$
|
483,518
|
|
|
The Company recognized impairment of
$4.1 million
during the
year ended December 31, 2016
, related to a group of tank cars impacted by new safety regulations. This impairment charge is included in "
Depreciation of equipment under operating lease
" in the accompanying consolidated statements of income.
F-47
BANKUNITED, INC. AND SUBSIDIARIES
NOTES TO CONSOLIDATED FINANCIAL STATEMENTS
December 31, 2016
At
December 31, 2016
, scheduled minimum rental payments under operating leases were as follows (in thousands)
|
Years Ending December 31:
|
|
|
|
|
2017
|
$
|
46,262
|
|
|
2018
|
40,098
|
|
|
|
2019
|
37,301
|
|
|
|
2020
|
31,932
|
|
|
|
2021
|
22,311
|
|
|
|
Thereafter through 2031
|
57,199
|
|
|
|
$
|
235,103
|
|
|
Premises and equipment are included in other assets in the accompanying consolidated balance sheets and are summarized as follows as of
December 31, 2016
and
2015
(in thousands):
|
|
2016
|
2015
|
|||||
|
Buildings and improvements
|
$
|
22,470
|
|
$
|
25,739
|
|
|
|
Leasehold improvements
|
68,403
|
|
65,818
|
|
|||
|
Furniture, fixtures and equipment
|
36,094
|
|
35,711
|
|
|||
|
Computer equipment
|
18,559
|
|
16,701
|
|
|||
|
Software and software licensing rights
|
38,002
|
|
33,979
|
|
|||
|
Aircraft and automobiles
|
11,857
|
|
11,686
|
|
|||
|
195,385
|
|
189,634
|
|
||||
|
Less: accumulated depreciation
|
(104,268
|
)
|
(84,282
|
)
|
|||
|
Premises and equipment, net
|
$
|
91,117
|
|
$
|
105,352
|
|
|
Buildings and improvements includes
$11 million
related to property under capital lease at both
December 31, 2016
and
2015
.
Depreciation and amortization expense related to premises and equipment, including amortization of assets recorded under capital leases, was
$21.3 million
,
$22.9 million
and
$22.1 million
for the years ended
December 31, 2016
,
2015
and
2014
, respectively.
The Company leases branch and office facilities under operating leases, most of which contain renewal options under various terms. Total rent expense under operating leases for the years ended
December 31, 2016
,
2015
and
2014
was
$27.6 million
,
$27.1 million
, and
$25.4 million
, respectively.
F-48
BANKUNITED, INC. AND SUBSIDIARIES
NOTES TO CONSOLIDATED FINANCIAL STATEMENTS
December 31, 2016
As of
December 31, 2016
, future minimum rentals under non-cancelable operating leases with initial or remaining terms in excess of one year were as follows (in thousands):
|
Years ending December 31:
|
|
|
|
|
2017
|
$
|
23,192
|
|
|
2018
|
22,081
|
|
|
|
2019
|
20,762
|
|
|
|
2020
|
17,000
|
|
|
|
2021
|
15,114
|
|
|
|
Thereafter through 2034
|
59,398
|
|
|
|
$
|
157,547
|
|
|
The following table presents average balances and weighted average rates paid on deposits for the years ended
December 31, 2016
,
2015
and
2014
(dollars in thousands):
|
|
2016
|
2015
|
2014
|
|||||||||||||||||
|
|
Average
Balance
|
Average
Rate Paid
|
Average
Balance
|
Average
Rate Paid |
Average
Balance
|
Average
Rate Paid |
||||||||||||||
|
Demand deposits:
|
|
|
|
|
|
|
|
|
|
|
|
|
||||||||
|
Non-interest bearing
|
$
|
2,968,192
|
|
—
|
%
|
$
|
2,732,654
|
|
—
|
%
|
$
|
2,366,621
|
|
—
|
%
|
|||||
|
Interest bearing
|
1,382,717
|
|
0.60
|
%
|
1,169,921
|
|
0.49
|
%
|
773,655
|
|
0.42
|
%
|
||||||||
|
Money market
|
7,946,447
|
|
0.64
|
%
|
6,313,340
|
|
0.57
|
%
|
4,444,753
|
|
0.54
|
%
|
||||||||
|
Savings
|
415,205
|
|
0.23
|
%
|
536,026
|
|
0.32
|
%
|
647,691
|
|
0.30
|
%
|
||||||||
|
Time
|
5,326,630
|
|
1.12
|
%
|
4,305,857
|
|
1.11
|
%
|
3,716,611
|
|
1.18
|
%
|
||||||||
|
$
|
18,039,191
|
|
0.66
|
%
|
$
|
15,057,798
|
|
0.61
|
%
|
$
|
11,949,331
|
|
0.61
|
%
|
||||||
Time deposit accounts with balances of $100,000 or more totaled approximately
$3.9 billion
and
$3.5 billion
at
December 31, 2016
and
2015
, respectively. Time deposit accounts with balances of $250,000 or more totaled
$2.1 billion
and
$1.6 billion
at
December 31, 2016
and
2015
, respectively.
The following table presents maturities of time deposits as of
December 31, 2016
(in thousands):
|
Maturing in:
|
|||
|
2017
|
$
|
4,294,827
|
|
|
2018
|
932,515
|
|
|
|
2019
|
134,904
|
|
|
|
2020
|
286,541
|
|
|
|
2021
|
106,835
|
|
|
|
Thereafter through 2023
|
20
|
|
|
|
$
|
5,755,642
|
|
|
Included in deposits at
December 31, 2016
are public funds deposits of
$2.1 billion
and brokered deposits of
$1.9 billion
. Investment securities available for sale with a carrying value of
$1.2 billion
and a standby letter of credit issued by the FHLB on the Bank's behalf in the amount of
$4 million
were pledged as security for public funds deposits at
December 31, 2016
.
F-49
BANKUNITED, INC. AND SUBSIDIARIES
NOTES TO CONSOLIDATED FINANCIAL STATEMENTS
December 31, 2016
Interest expense on deposits for the years ended
December 31, 2016
,
2015
and
2014
was as follows (in thousands):
|
|
2016
|
2015
|
2014
|
||||||||
|
Interest bearing demand
|
$
|
8,343
|
|
$
|
5,782
|
|
$
|
3,254
|
|
||
|
Money market
|
50,802
|
|
36,005
|
|
23,944
|
|
|||||
|
Savings
|
972
|
|
1,739
|
|
1,971
|
|
|||||
|
Time
|
59,656
|
|
47,625
|
|
43,792
|
|
|||||
|
$
|
119,773
|
|
$
|
91,151
|
|
$
|
72,961
|
|
|||
The following table presents information about outstanding FHLB advances as of
December 31, 2016
(dollars in thousands):
|
|
Range of Interest Rates
|
|||||||||||
|
|
Weighted
Average Rate
|
|||||||||||
|
|
Amount
|
Minimum
|
Maximum
|
|||||||||
|
Maturing in:
|
|
|
|
|
|
|
|
|
||||
|
2017—31 days or less
|
$
|
1,170,000
|
|
0.49
|
%
|
0.99
|
%
|
0.63
|
%
|
|||
|
2017—Over 31 days
|
3,920,000
|
|
0.58
|
%
|
1.31
|
%
|
0.77
|
%
|
||||
|
2018
|
75,000
|
|
1.25
|
%
|
1.25
|
%
|
1.25
|
%
|
||||
|
2020
|
75,000
|
|
1.78
|
%
|
1.78
|
%
|
1.78
|
%
|
||||
|
Total contractual balance outstanding
|
5,240,000
|
|
||||||||||
|
Unamortized modification costs
|
(652
|
)
|
||||||||||
|
Carrying value
|
$
|
5,239,348
|
|
|||||||||
Deferred modification costs on FHLB advances are being amortized as adjustments to interest expense over the remaining terms of the related advances using the effective yield method. The amortization of these costs increased interest expense by
$0.9 million
during each of the years ended
December 31, 2016
,
2015
and
2014
, respectively.
The terms of the Company's security agreement with the FHLB require a specific assignment of collateral consisting of qualifying first mortgage loans, commercial real estate loans, home equity lines of credit and mortgage-backed securities with unpaid principal amounts discounted at various stipulated percentages at least equal to
100%
of outstanding FHLB advances. As of
December 31, 2016
, the Company had pledged investment securities and real estate loans with an aggregate carrying amount of approximately
$9.5 billion
as collateral for advances from the FHLB.
At
December 31, 2016
and
2015
outstanding senior notes payable and other borrowings consisted of the following (dollars in thousands):
|
|
2016
|
2015
|
|||||
|
Principal amount of 4.875% senior notes
|
$
|
400,000
|
|
$
|
400,000
|
|
|
|
Unamortized discount and debt issuance costs
|
(6,908
|
)
|
(7,674
|
)
|
|||
|
393,092
|
|
392,326
|
|
||||
|
Capital lease obligations
|
9,717
|
|
10,219
|
|
|||
|
$
|
402,809
|
|
$
|
402,545
|
|
||
The senior notes mature on
November 17, 2025
with interest payable semiannually. The notes have an effective interest rate of
5.12%
, after consideration of issuance discount and costs. The notes may be redeemed by the Company, in whole or in part, at any time prior to August 17, 2025 at the greater of a) 100% of the principal balance or b) the sum of the present values of the remaining scheduled payments of principal and interest on the securities discounted to the redemption date at the rate on a United States Treasury security with a maturity comparable to the remaining maturity of notes that would be used to price
F-50
BANKUNITED, INC. AND SUBSIDIARIES
NOTES TO CONSOLIDATED FINANCIAL STATEMENTS
December 31, 2016
new issues of corporate debt securities with a maturity comparable to the remaining maturity of the senior notes plus 40 basis points. The senior notes may be redeemed at any time after August 17, 2025 at 100% of principal plus accrued and unpaid interest.
At
December 31, 2016
, BankUnited had available borrowing capacity at the FHLB of approximately
$2.9 billion
, unused borrowing capacity at the FRB of approximately
$327 million
and unused Federal funds lines of credit with other financial institutions totaling
$70 million
.
Note 11
Income Taxes
The components of the provision for income taxes for the years ended
December 31, 2016
,
2015
and
2014
were as follows (in thousands):
|
2016
|
2015
|
2014
|
|||||||||
|
Current:
|
|||||||||||
|
Federal
|
$
|
51,806
|
|
$
|
18,230
|
|
$
|
121,063
|
|
||
|
State
|
27,708
|
|
(2,468
|
)
|
7,549
|
|
|||||
|
79,514
|
|
15,762
|
|
128,612
|
|
||||||
|
Deferred:
|
|||||||||||
|
Federal
|
35,045
|
|
20,509
|
|
(27,468
|
)
|
|||||
|
State
|
(4,856
|
)
|
8,962
|
|
(12,109
|
)
|
|||||
|
30,189
|
|
29,471
|
|
(39,577
|
)
|
||||||
|
$
|
109,703
|
|
$
|
45,233
|
|
$
|
89,035
|
|
|||
A reconciliation of expected income tax expense at the statutory federal income tax rate of 35% to the Company’s effective income tax rate for the years ended
December 31, 2016
,
2015
and
2014
follows (dollars in thousands):
|
|
2016
|
2015
|
2014
|
|||||||||||||||||
|
Amount
|
Percent
|
Amount
|
Percent
|
Amount
|
Percent
|
|||||||||||||||
|
Tax expense calculated at the statutory federal income tax rate
|
$
|
117,405
|
|
35.00
|
%
|
$
|
103,912
|
|
35.00
|
%
|
$
|
102,637
|
|
35.00
|
%
|
|||||
|
Increases (decreases) resulting from:
|
||||||||||||||||||||
|
Income not subject to tax
|
(23,215
|
)
|
(6.92
|
)%
|
(14,279
|
)
|
(4.81
|
)%
|
(10,056
|
)
|
(3.43
|
)%
|
||||||||
|
State income taxes, net of federal tax benefit
|
15,894
|
|
4.74
|
%
|
12,889
|
|
4.34
|
%
|
6,259
|
|
2.13
|
%
|
||||||||
|
Uncertain tax positions - lapse of statute of limitations
|
—
|
|
—
|
%
|
(6,166
|
)
|
(2.08
|
)%
|
(5,098
|
)
|
(1.74
|
)%
|
||||||||
|
Discrete tax benefit
|
—
|
|
—
|
%
|
(49,323
|
)
|
(16.61
|
)%
|
—
|
|
—
|
%
|
||||||||
|
Other, net
|
(381
|
)
|
(0.12
|
)%
|
(1,800
|
)
|
(0.60
|
)%
|
(4,707
|
)
|
(1.60
|
)%
|
||||||||
|
|
$
|
109,703
|
|
32.70
|
%
|
$
|
45,233
|
|
15.24
|
%
|
$
|
89,035
|
|
30.36
|
%
|
|||||
A discrete income tax benefit of
$49.3 million
was recognized in the year ended December 31, 2015. The tax benefit, predicated on clarifying guidance issued by the IRS in 2015, relates to the Company's ability to claim additional tax basis in certain assets acquired in the FSB Acquisition. The additional tax basis will result in increased taxable losses or reduced taxable income upon the final disposition of those assets.
F-51
BANKUNITED, INC. AND SUBSIDIARIES
NOTES TO CONSOLIDATED FINANCIAL STATEMENTS
December 31, 2016
The components of deferred tax assets and liabilities at
December 31, 2016
and
2015
were as follows (in thousands):
|
2016
|
2015
|
||||||
|
Deferred tax assets:
|
|||||||
|
Excess of tax basis over carrying value of acquired loans
|
$
|
130,004
|
|
$
|
158,931
|
|
|
|
Allowance for loan and lease losses
|
52,670
|
|
46,875
|
|
|||
|
Acquisition costs
|
8,995
|
|
10,176
|
|
|||
|
Net operating loss and tax credit carryforwards
|
11,641
|
|
9,051
|
|
|||
|
Unrealized losses on derivatives designated as cash flow hedges
|
3,767
|
|
12,609
|
|
|||
|
Equity-based compensation
|
9,941
|
|
8,339
|
|
|||
|
Other
|
29,208
|
|
19,077
|
|
|||
|
Gross deferred tax assets
|
246,226
|
|
265,058
|
|
|||
|
Deferred tax liabilities:
|
|||||||
|
Net unrealized gains on investment securities available for sale
|
30,566
|
|
26,961
|
|
|||
|
Lease financing, due to differences in depreciation
|
145,700
|
|
118,388
|
|
|||
|
Other
|
7,020
|
|
14,132
|
|
|||
|
Gross deferred tax liabilities
|
183,286
|
|
159,481
|
|
|||
|
Net deferred tax asset
|
$
|
62,940
|
|
$
|
105,577
|
|
|
Based on the evaluation of available evidence, management has concluded that it is more likely than not that the existing deferred tax assets will be realized. The primary factors supporting this conclusion are the amount of taxable income available for carryback and the amount of future taxable income that will result from the scheduled reversal of existing deferred tax liabilities.
At
December 31, 2016
, remaining carryforwards included federal net operating loss carryforwards in the amount of
$12.3 million
, expiring from 2029 through 2032, Florida net operating loss carryfowards in the amount of
$95.2 million
, expiring from 2030 through 2035, and state tax credit carryforwards in the amount of
$8.1 million
, expiring in 2017. The Company established deferred tax assets of
$0.9 million
and
$2.9 million
, respectively, for the years ended
December 31, 2015
and
2014
related to Florida net operating losses and recognized current tax benefits of
$0.8 million
related to the usage of federal net operating losses for each of the years ended
December 31, 2016
,
2015
and
2014
.
Deferred tax benefits of
$2.0 million
and
$2.4 million
were recognized for the years ended
December 31, 2015
and
2014
related to enacted changes in state tax laws.
The Company has investments in affordable housing limited partnerships which generate federal Low Income Housing Tax Credits and other tax benefits. The balance of these investments, included in other assets in the accompanying consolidated balance sheet, was
$71 million
and
$59 million
at
December 31, 2016
and
2015
, respectively. Unfunded commitments for affordable housing investments, included in other liabilities in the accompanying consolidated balance sheet, were
$53 million
and
$52 million
at
December 31, 2016
and
2015
, respectively. The maximum exposure to loss as a result of the Company's involvement with these limited partnerships at
December 31, 2016
was approximately
$73 million
. While the Company believes the likelihood of potential losses from these investments is remote, the maximum exposure was determined by assuming a scenario where the projects completely fail and do not meet certain government compliance requirements resulting in recapture of the related tax credits. These investments did not have a significant impact on income tax expense for the years ended
December 31, 2016
and
2015
.
F-52
BANKUNITED, INC. AND SUBSIDIARIES
NOTES TO CONSOLIDATED FINANCIAL STATEMENTS
December 31, 2016
The Company has a liability for unrecognized tax benefits relating to uncertain state tax positions in several jurisdictions. A reconciliation of the beginning and ending amount of gross unrecognized tax benefits for the years ended
December 31, 2016
,
2015
and
2014
follows (in thousands):
|
2016
|
2015
|
2014
|
|||||||||
|
Balance, beginning of period
|
$
|
43,412
|
|
$
|
36,622
|
|
$
|
21,898
|
|
||
|
Additions for tax positions related to the current year
|
2,713
|
|
2,909
|
|
3,797
|
|
|||||
|
Additions for tax positions related to prior periods
|
25,168
|
|
11,618
|
|
22,089
|
|
|||||
|
Reductions due to settlements with taxing authorities
|
(200
|
)
|
(246
|
)
|
(3,807
|
)
|
|||||
|
Reductions due to lapse of the statute of limitations
|
—
|
|
(5,438
|
)
|
(4,739
|
)
|
|||||
|
71,093
|
|
45,465
|
|
39,238
|
|
||||||
|
Interest and penalties
|
1,643
|
|
(2,053
|
)
|
(2,616
|
)
|
|||||
|
Balance, end of period
|
$
|
72,736
|
|
$
|
43,412
|
|
$
|
36,622
|
|
||
As of
December 31, 2016
,
2015
and
2014
, the Company had
$45.0 million
,
$27.0 million
and
$21.3 million
of unrecognized state tax benefits, net of federal tax benefits, that if recognized would have impacted the effective tax rate. Unrecognized tax benefits related to state income tax contingencies that may decrease during the 12 months subsequent to
December 31, 2016
, as a result of settlements with taxing authorities, range from
zero
to
$41.6 million
. In the absence of such settlements, unrecognized tax benefits that may decrease during the 12 months subsequent to
December 31, 2016
as a result of the lapse in the statute of limitations total approximately
$4.3 million
.
Interest and penalties related to unrecognized tax benefits are included in the provision for income taxes in the consolidated statements of income. At
December 31, 2016
and
2015
, accrued interest and penalties included in the consolidated balance sheets, net of federal tax benefits, were
$2.5 million
and
$1.4 million
, respectively. The total amounts of interest and penalties, net of federal tax benefits, recognized through income tax expense were
$1.1 million
,
$(1.8) million
and
$(2.3) million
in 2016, 2015 and 2014, respectively.
The Company and its subsidiaries file a consolidated federal income tax return as well as combined state income tax returns where combined filings are required. Income tax returns for the tax years ended
December 31, 2016
,
2015
,
2014
and
2013
remain subject to examination in the U.S. Federal and various state tax jurisdictions. The tax years ended December 31, 2009, 2010, 2011 and 2012 remain subject to examination by certain states.
The Company uses interest rate swaps to manage interest rate risk related to liabilities that expose the Company to variability in cash flows due to changes in interest rates. The Company enters into LIBOR-based interest rate swaps that are designated as cash flow hedges with the objective of limiting the variability of interest payment cash flows resulting from changes in the benchmark interest rate LIBOR. The effective portion of changes in the fair value of interest rate swaps designated as cash flow hedging instruments is reported in AOCI and subsequently reclassified into interest expense in the same period in which the related interest on the floating-rate debt obligations affects earnings.
The Company also enters into interest rate derivative contracts with certain of its commercial borrowers to enable those borrowers to manage their exposure to interest rate fluctuations. To mitigate interest rate risk associated with these derivative contracts, the Company enters into offsetting derivative contract positions with primary dealers. These interest rate derivative contracts are not designated as hedging instruments; therefore, changes in the fair value of these derivatives are recognized immediately in earnings. The impact on earnings related to changes in fair value of these derivatives for the years ended
December 31, 2016
,
2015
and
2014
was not material.
The Company may be exposed to credit risk in the event of non-performance by the counterparties to its interest rate derivative agreements. The Company assesses the credit risk of its financial institution counterparties by monitoring publicly available credit rating and financial information. The Company manages dealer credit risk by entering into interest rate derivatives only with primary and highly rated counterparties, the use of ISDA master agreements and counterparty limits. The agreements contain bilateral collateral arrangements with the amount of collateral to be posted generally governed by the settlement value of outstanding swaps. The Company manages the risk of default by its borrower counterparties through its
F-53
BANKUNITED, INC. AND SUBSIDIARIES
NOTES TO CONSOLIDATED FINANCIAL STATEMENTS
December 31, 2016
normal loan underwriting and credit monitoring policies and procedures. The Company does not currently anticipate any losses from failure of interest rate derivative counterparties to honor their obligations.
The following tables set forth certain information concerning the Company’s interest rate contract derivative financial instruments and related hedged items at
December 31, 2016
and
2015
(dollars in thousands):
|
2016
|
|||||||||||||||||||||
|
Weighted
Average Pay Rate
|
Weighted
Average Receive Rate
|
Weighted
Average
Remaining
Life in Years
|
|||||||||||||||||||
|
|
|
Notional Amount
|
Balance Sheet Location
|
Fair Value
|
|||||||||||||||||
|
|
Hedged Item
|
Asset
|
Liability
|
||||||||||||||||||
|
Derivatives designated as cash flow hedges:
|
|
|
|
|
|
|
|
|
|
|
|
||||||||||
|
Pay-fixed interest rate swaps
|
Variability of interest cash flows on variable rate borrowings
|
1.58%
|
3-Month Libor
|
3.3
|
$
|
1,715,000
|
|
Other Assets / Other liabilities
|
$
|
19,648
|
|
$
|
(3,112
|
)
|
|||||||
|
Pay-fixed forward-starting interest rate swaps
|
Variability of interest cash flows on variable rate borrowings
|
3.43%
|
3-Month Libor
|
10.5
|
300,000
|
|
Other liabilities
|
—
|
|
(27,866
|
)
|
||||||||||
|
Derivatives not designated as hedges:
|
|
||||||||||||||||||||
|
Pay-fixed interest rate swaps
|
|
3.77%
|
Indexed to 1-month Libor
|
6.8
|
912,000
|
|
Other Assets / Other liabilities
|
9,949
|
|
(20,383
|
)
|
||||||||||
|
Pay-variable interest rate swaps
|
|
Indexed to 1-month Libor
|
3.77%
|
6.8
|
912,000
|
|
Other Assets / Other liabilities
|
20,383
|
|
(9,949
|
)
|
||||||||||
|
Interest rate caps purchased, indexed to 1-month Libor
|
2.96%
|
2.3
|
189,057
|
|
Other assets
|
252
|
|
—
|
|
||||||||||||
|
Interest rate caps sold, indexed to 1-month Libor
|
2.96%
|
2.3
|
189,057
|
|
Other liabilities
|
—
|
|
(252
|
)
|
||||||||||||
|
|
|
$
|
4,217,114
|
|
$
|
50,232
|
|
$
|
(61,562
|
)
|
|||||||||||
|
2015
|
|||||||||||||||||||||
|
Weighted
Average Pay Rate
|
Weighted
Average Receive Rate
|
Weighted
Average
Remaining
Life in Years
|
|||||||||||||||||||
|
|
|
Notional Amount
|
Balance Sheet Location
|
Fair Value
|
|||||||||||||||||
|
|
Hedged Item
|
Asset
|
Liability
|
||||||||||||||||||
|
Derivatives designated as cash flow hedges:
|
|
|
|
|
|
|
|
|
|
|
|
||||||||||
|
Pay-fixed interest rate swaps
|
Variability of interest cash flows on variable rate borrowings
|
1.62%
|
3-Month Libor
|
2.6
|
$
|
1,805,000
|
|
Other assets / Other liabilities
|
$
|
3,442
|
|
$
|
(12,347
|
)
|
|||||||
|
Pay-fixed forward-starting interest rate swaps
|
Variability of interest cash flows on variable rate borrowings
|
3.43%
|
3-Month Libor
|
11.5
|
300,000
|
|
Other liabilities
|
—
|
|
(26,274
|
)
|
||||||||||
|
Derivatives not designated as hedges:
|
|
|
|
|
|
|
|
|
|
|
|||||||||||
|
Pay-fixed interest rate swaps
|
|
4.08%
|
Indexed to 1-month Libor
|
7.0
|
663,311
|
|
Other assets / Other liabilities
|
225
|
|
(30,514
|
)
|
||||||||||
|
Pay-variable interest rate swaps
|
|
Indexed to 1-month Libor
|
4.08%
|
7.0
|
663,311
|
|
Other assets / Other liabilities
|
30,514
|
|
(225
|
)
|
||||||||||
|
Interest rate caps purchased, indexed to 1-month Libor
|
|
2.85%
|
2.2
|
139,786
|
|
Other assets
|
164
|
|
—
|
|
|||||||||||
|
Interest rate caps sold, indexed to 1-month Libor
|
2.85%
|
2.2
|
139,786
|
|
Other liabilities
|
—
|
|
(164
|
)
|
||||||||||||
|
|
|
$
|
3,711,194
|
|
$
|
34,345
|
|
$
|
(69,524
|
)
|
|||||||||||
F-54
BANKUNITED, INC. AND SUBSIDIARIES
NOTES TO CONSOLIDATED FINANCIAL STATEMENTS
December 31, 2016
During the years ended
December 31, 2016
,
2015
and
2014
, the amount of loss reclassified from AOCI into interest expense (effective portion) was
$16.2 million
,
$26.5 million
and
$26.7 million
, respectively.
During the years ended
December 31, 2016
,
2015
and
2014
,
no
derivative positions designated as cash flow hedges were discontinued and
none
of the gains and losses reported in AOCI were reclassified into earnings as a result of the discontinuance of cash flow hedges or because of the early extinguishment of debt. As of
December 31, 2016
, the amount of loss expected to be reclassified from AOCI into earnings during the next twelve months was
$8.2 million
.
Some of the Company’s ISDA master agreements with financial institution counterparties contain provisions that permit either counterparty to terminate the agreements and require settlement in the event that regulatory capital ratios fall below certain designated thresholds, upon the initiation of other defined regulatory actions or upon suspension or withdrawal of the Bank’s credit rating. Currently, there are no circumstances that would trigger these provisions of the agreements.
The Company does not offset assets and liabilities under master netting agreements for financial reporting purposes. Information on interest rate swaps subject to these agreements is as follows at
December 31, 2016
and
2015
(in thousands):
|
2016
|
|||||||||||||||||||||||
|
|
|
|
Gross Amounts Offset in Balance
Sheet |
|
Net Amounts Presented in
Balance Sheet |
|
Gross Amounts Not Offset in
Balance Sheet
|
|
|
||||||||||||||
|
|
Gross Amounts
Recognized
|
|
|
|
Derivative
Instruments
|
|
Collateral
Pledged
|
|
Net Amount
|
||||||||||||||
|
|
|
|
|
|
|
|
|
|
|
|
|
|
|
|
|
|
|
||||||
|
Derivative assets
|
$
|
29,849
|
|
$
|
—
|
|
$
|
29,849
|
|
$
|
(27,485
|
)
|
$
|
—
|
|
$
|
2,364
|
|
|||||
|
Derivative liabilities
|
(51,362
|
)
|
—
|
|
(51,362
|
)
|
27,485
|
|
23,796
|
|
(81
|
)
|
|||||||||||
|
|
$
|
(21,513
|
)
|
$
|
—
|
|
$
|
(21,513
|
)
|
$
|
—
|
|
$
|
23,796
|
|
$
|
2,283
|
|
|||||
|
2015
|
|||||||||||||||||||||||
|
|
|
Gross Amounts Offset in Balance
Sheet |
Net Amounts Presented in
Balance Sheet |
Gross Amounts Not Offset in
Balance Sheet
|
|
||||||||||||||||||
|
|
Gross Amounts
Recognized
|
Derivative
Instruments
|
Collateral
Pledged
|
Net Amount
|
|||||||||||||||||||
|
Derivative assets
|
$
|
3,830
|
|
$
|
—
|
|
$
|
3,830
|
|
$
|
(3,605
|
)
|
$
|
—
|
|
$
|
225
|
|
|||||
|
Derivative liabilities
|
(69,135
|
)
|
—
|
|
(69,135
|
)
|
3,605
|
|
65,530
|
|
—
|
|
|||||||||||
|
$
|
(65,305
|
)
|
$
|
—
|
|
$
|
(65,305
|
)
|
$
|
—
|
|
$
|
65,530
|
|
$
|
225
|
|
||||||
The difference between the amounts reported for interest rate swaps subject to master netting agreements and the total fair value of interest rate contract derivative financial instruments reported in the consolidated balance sheets is related to interest rate contracts entered into with borrowers not subject to master netting agreements.
At
December 31, 2016
, the Company had pledged investment securities available for sale with a carrying amount of
$21 million
and cash on deposit of
$32 million
as collateral for interest rate swaps in a liability position.
No
financial collateral was pledged by counterparties to the Company for interest rate swaps in an asset position. The amount of collateral required to be posted varies based on the settlement value of outstanding swaps and in some cases may include initial margin requirements.
F-55
BANKUNITED, INC. AND SUBSIDIARIES
NOTES TO CONSOLIDATED FINANCIAL STATEMENTS
December 31, 2016
Accumulated Other Comprehensive Income
Changes in AOCI are summarized as follows for the years ended
December 31, 2016
,
2015
and
2014
(in thousands):
|
|
2016
|
||||||||||
|
|
Before Tax
|
Tax Effect
|
Net of Tax
|
||||||||
|
Unrealized gains on investment securities available for sale:
|
|
|
|
|
|
|
|||||
|
Net unrealized holding gain arising during the period
|
$
|
23,588
|
|
$
|
(9,317
|
)
|
$
|
14,271
|
|
||
|
Amounts reclassified to gain on investment securities available for sale, net
|
(14,461
|
)
|
5,712
|
|
(8,749
|
)
|
|||||
|
Net change in unrealized gains on investment securities available for sale
|
9,127
|
|
(3,605
|
)
|
5,522
|
|
|||||
|
Unrealized losses on derivative instruments:
|
|||||||||||
|
Net unrealized holding gain arising during the period
|
6,225
|
|
(2,459
|
)
|
3,766
|
|
|||||
|
Amounts reclassified to interest expense on borrowings
|
16,161
|
|
(6,384
|
)
|
9,777
|
|
|||||
|
Net change in unrealized losses on derivative instruments
|
22,386
|
|
(8,843
|
)
|
13,543
|
|
|||||
|
Other comprehensive income
|
$
|
31,513
|
|
$
|
(12,448
|
)
|
$
|
19,065
|
|
||
|
|
2015
|
||||||||||
|
|
Before Tax
|
Tax Effect
|
Net of Tax
|
||||||||
|
Unrealized gains on investment securities available for sale:
|
|
|
|
|
|
|
|||||
|
Net unrealized holding loss arising during the period
|
$
|
(34,470
|
)
|
$
|
12,813
|
|
$
|
(21,657
|
)
|
||
|
Amounts reclassified to gain on investment securities available for sale, net
|
(8,480
|
)
|
3,350
|
|
(5,130
|
)
|
|||||
|
Net change in unrealized gains on investment securities available for sale
|
(42,950
|
)
|
16,163
|
|
(26,787
|
)
|
|||||
|
Unrealized losses on derivative instruments:
|
|||||||||||
|
Net unrealized holding loss arising during the period
|
(22,635
|
)
|
9,232
|
|
(13,403
|
)
|
|||||
|
Amounts reclassified to interest expense on deposits
|
4,869
|
|
(1,923
|
)
|
2,946
|
|
|||||
|
Amounts reclassified to interest expense on borrowings
|
21,610
|
|
(8,536
|
)
|
13,074
|
|
|||||
|
Net change in unrealized losses on derivative instruments
|
3,844
|
|
(1,227
|
)
|
2,617
|
|
|||||
|
Other comprehensive loss
|
$
|
(39,106
|
)
|
$
|
14,936
|
|
$
|
(24,170
|
)
|
||
|
|
2014
|
||||||||||
|
|
Before Tax
|
Tax Effect
|
Net of Tax
|
||||||||
|
Unrealized gains on investment securities available for sale:
|
|
|
|||||||||
|
Net unrealized holding gain arising during the period
|
$
|
3,134
|
|
$
|
(1,195
|
)
|
$
|
1,939
|
|
||
|
Amounts reclassified to gain on investment securities available for sale, net
|
(3,859
|
)
|
1,489
|
|
(2,370
|
)
|
|||||
|
Net change in unrealized gains on investment securities available for sale
|
(725
|
)
|
294
|
|
(431
|
)
|
|||||
|
Unrealized losses on derivative instruments:
|
|||||||||||
|
Net unrealized holding loss arising during the period
|
(44,086
|
)
|
17,006
|
|
(27,080
|
)
|
|||||
|
Amounts reclassified to interest expense on deposits
|
5,675
|
|
(2,189
|
)
|
3,486
|
|
|||||
|
Amounts reclassified to interest expense on borrowings
|
20,996
|
|
(8,099
|
)
|
12,897
|
|
|||||
|
Net change in unrealized losses on derivative instruments
|
(17,415
|
)
|
6,718
|
|
(10,697
|
)
|
|||||
|
Other comprehensive income loss
|
$
|
(18,140
|
)
|
$
|
7,012
|
|
$
|
(11,128
|
)
|
||
F-56
BANKUNITED, INC. AND SUBSIDIARIES
NOTES TO CONSOLIDATED FINANCIAL STATEMENTS
December 31, 2016
The categories of AOCI and changes therein are presented below for the years ended
December 31, 2016
,
2015
and
2014
(in thousands):
|
Unrealized Gains on
Investment Securities
Available for Sale
|
Unrealized Losses
on Derivative
Instruments
|
Total
|
|||||||||
|
Balance at December 31, 2013
|
$
|
68,753
|
|
$
|
(11,273
|
)
|
$
|
57,480
|
|
||
|
Other comprehensive loss
|
(431
|
)
|
(10,697
|
)
|
(11,128
|
)
|
|||||
|
Balance at December 31, 2014
|
$
|
68,322
|
|
$
|
(21,970
|
)
|
$
|
46,352
|
|
||
|
Other comprehensive loss
|
(26,787
|
)
|
2,617
|
|
(24,170
|
)
|
|||||
|
Balance at December 31, 2015
|
$
|
41,535
|
|
$
|
(19,353
|
)
|
$
|
22,182
|
|
||
|
Other comprehensive income
|
5,522
|
|
13,543
|
|
19,065
|
|
|||||
|
Balance at December 31, 2016
|
$
|
47,057
|
|
$
|
(5,810
|
)
|
$
|
41,247
|
|
||
Other
In conjunction with a previous acquisition, the Company issued
1,834,160
warrants to purchase its common stock. The warrants expire in November 2018 and are exercisable at an exercise price of
$9.47
, in exchange for which the holder is entitled to receive
0.0827
shares of BKU common stock and cash of
$1.73
.
Description of Equity Based Compensation Plans
In connection with the IPO of the Company's common stock in 2011, the Company adopted the 2010 Plan. In 2014, the Board of Directors and the Company's stockholders approved the 2014 Plan. The 2010 Plan and 2014 Plans are administered by the Board of Directors or a committee thereof and provide for the grant of non-qualified stock options, SARs, restricted shares, deferred shares, performance shares, unrestricted shares and other share-based awards to selected employees, directors or independent contractors of the Company and its affiliates. The number of shares of common stock authorized for award under the 2010 Plan is
7,500,000
, of which
110,139
shares remain available for issuance as of
December 31, 2016
. The number of shares of common stock available for issuance under the 2014 Plan is
4,000,000
, of which
3,378,304
shares remain available for issuance as of
December 31, 2016
. Substantially all of the shares vest in equal annual installments over a period of three years from the date of grant. Shares of common stock delivered under the plans may consist of authorized but unissued shares or previously issued shares reacquired by the Company. The term of a share option or SAR issued under the plans may not exceed ten years from the date of grant and the exercise price may not be less than the fair market value of the Company's common stock at the date of grant. Unvested awards generally become fully vested in the event of a change in control, as defined.
F-57
BANKUNITED, INC. AND SUBSIDIARIES
NOTES TO CONSOLIDATED FINANCIAL STATEMENTS
December 31, 2016
Compensation Expense Related to Equity Based Awards
The following table summarizes compensation cost related to equity based awards for the years ended
December 31, 2016
,
2015
and
2014
(in thousands):
|
2016
|
2015
|
2014
|
|||||||||
|
Compensation cost of equity based awards:
|
|||||||||||
|
Unvested and restricted share awards
|
$
|
16,885
|
|
$
|
15,573
|
|
$
|
14,474
|
|
||
|
Option awards
|
—
|
|
—
|
|
609
|
|
|||||
|
Executive share-based awards
|
1,482
|
|
294
|
|
550
|
|
|||||
|
Total compensation cost of equity based awards
|
18,367
|
|
15,867
|
|
15,633
|
|
|||||
|
Related tax benefits
|
(6,899
|
)
|
(5,965
|
)
|
(5,677
|
)
|
|||||
|
Compensation cost of equity based awards, net of tax
|
$
|
11,468
|
|
$
|
9,902
|
|
$
|
9,956
|
|
||
Share Awards
Unvested share awards
A summary of activity related to unvested share awards for the years ended
December 31, 2016
,
2015
and
2014
follows:
|
Number of Share Awards
|
Weighted Average Grant Date Fair Value
|
|||||
|
Unvested share awards outstanding, December 31, 2013
|
706,436
|
|
$
|
24.02
|
|
|
|
Granted
|
699,529
|
|
31.71
|
|
||
|
Vested
|
(465,476
|
)
|
24.22
|
|
||
|
Canceled or forfeited
|
(111,264
|
)
|
26.51
|
|
||
|
Unvested share awards outstanding, December 31, 2014
|
829,225
|
|
30.06
|
|
||
|
Granted
|
664,928
|
|
32.06
|
|
||
|
Vested
|
(394,498
|
)
|
28.72
|
|
||
|
Canceled or forfeited
|
(59,270
|
)
|
29.82
|
|
||
|
Unvested share awards outstanding, December 31, 2015
|
1,040,385
|
|
31.86
|
|
||
|
Granted
|
651,760
|
|
31.00
|
|
||
|
Vested
|
(428,167
|
)
|
31.79
|
|
||
|
Canceled or forfeited
|
(143,278
|
)
|
31.31
|
|
||
|
Unvested share awards outstanding, December 31, 2016
|
1,120,700
|
|
$
|
31.46
|
|
|
Unvested share awards are generally valued at the closing price of the Company's common stock on the date of grant. The following table summarizes the closing price of the Company's stock on the date of grant for shares granted and the aggregate grant date fair value of shares vesting during the years ended
December 31, 2016
,
2015
, and
2014
(in thousands, except per share data):
|
2016
|
2015
|
2014
|
|||||||||
|
Range of the closing price on date of grant
|
$29.78 - $33.76
|
$31.35 - $38.63
|
$30.34 - $34.04
|
||||||||
|
Aggregate grant date fair value of shares vesting
|
$
|
13,613
|
|
$
|
11,330
|
|
$
|
11,273
|
|
||
Substantially all of the shares vest in equal annual installments over a period of
three years
from the date of grant. Unvested shares participate in dividends declared on the Company's common stock on a one-for-one basis.
F-58
BANKUNITED, INC. AND SUBSIDIARIES
NOTES TO CONSOLIDATED FINANCIAL STATEMENTS
December 31, 2016
Unrecognized compensation cost for unvested share awards outstanding at
December 31, 2016
totaled
$19.4 million
, which will be recognized over a weighted average remaining period of
1.73 years
.
Executive share-based awards
Certain of the Company's executives are eligible to receive annual awards of RSUs and PSUs (collectively, the "share units"). RSUs represent a fixed number of shares and vest in equal tranches ranging from
three
to
five years
. PSUs are initially granted based on a target value. The number of PSUs that ultimately vest at the end of a three-year performance measurement period will be based on the achievement of performance criteria pre-established by the Compensation Committee of the Board of Directors. Upon vesting, the share units will be converted to common stock on a one-for-one basis, or may be settled in cash at the Company's option. The share units will accumulate dividends declared o
n the Company's common stock from the date of grant to be paid subsequent to vesting. During the
year ended December 31, 2016
,
97,852
RSUs and
57,873
PSUs were granted. The RSUs were valued at the closing price of the Company's common stock on the date of grant, ranging from
$29.85
to
$37.52
, and had an aggregate grant-date fair value of
$3.2 million
. The performance
criteria established for the PSUs granted in 2016 include both performance and market conditions. The grant-date value of the PSUs was
determined
based on
the closing price of the Company's common stock on the date of grant and a discount related to the market condition, considering the
probability
of meeting the defined performance conditions.
Certain of the Company's executives are eligible to receive unvested share awards at the end of designated performance periods. The dollar value of share awards to be granted is based on the achievement of performance criteria pre-established by the Compensation Committee. The number of shares of common stock to be awarded is variable based on the closing price of the Company's stock on the date of grant; therefore, these awards are initially classified as liability instruments in the Company's consolidated balance sheets and compensation cost is
recognized from the beginning of the performance period. The share awards vest up to
three years
from the date of grant.
Based on the closing price of the Company's common stock on the date of grant,
41,645
and
50,099
performance based share awards with aggregate values of
$1.5 million
were granted in 2015 and 2014, respectively. These shares are included in the summary of activity related to unvested share awards above.
Compensation cost related to performance based executive share-based awards is recognized during the performance period based on the probable outcome of the respective performance conditions. The total unrecognized compensation cost of
$4.7 million
for these executive share-based awards at
December 31, 2016
will be recognized over a weighted average remaining period of
3.13 years
.
Option Awards
A summary of activity related to stock option awards for the years ended
December 31, 2016
,
2015
and
2014
follows:
|
Number of
Option
Awards
|
Weighted
Average
Exercise Price
|
|||||
|
Option awards outstanding, December 31, 2013
|
5,070,939
|
|
$
|
26.38
|
|
|
|
Exercised
|
(55,423
|
)
|
16.71
|
|
||
|
Canceled or forfeited
|
(469
|
)
|
63.74
|
|
||
|
Option awards outstanding, December 31, 2014
|
5,015,047
|
|
26.49
|
|
||
|
Exercised
|
(1,363,895
|
)
|
26.14
|
|
||
|
Option awards outstanding, December 31, 2015
|
3,651,152
|
|
26.62
|
|
||
|
Exercised
|
(47,979
|
)
|
16.50
|
|
||
|
Canceled or forfeited
|
(1,097
|
)
|
63.74
|
|
||
|
Option awards outstanding and exercisable, December 31, 2016
|
3,602,076
|
|
$
|
26.74
|
|
|
The intrinsic value of options exercised during the years ended
December 31, 2016
,
2015
and
2014
was
$0.9 million
,
$8.7 million
and
$0.9 million
, respectively.
F-59
BANKUNITED, INC. AND SUBSIDIARIES
NOTES TO CONSOLIDATED FINANCIAL STATEMENTS
December 31, 2016
There were no option awards granted during the years ended
December 31, 2016
,
2015
and
2014
. Additional information about options outstanding and exercisable at
December 31, 2016
is presented in the following table:
|
Outstanding and Exercisable Options
|
|||||||||
|
Range of Exercise Prices
|
Number of
Options
|
Weighted
Average
Remaining
Contractual
Term (in
years)
|
Aggregate
Intrinsic
Value (in
thousands)
|
||||||
|
$11.14
|
23,340
|
|
2.73
|
$
|
620
|
|
|||
|
$15.94 - $19.97
|
88,395
|
|
3.38
|
1,739
|
|
||||
|
$22.18 - $22.31
|
77,117
|
|
4.33
|
1,189
|
|
||||
|
$27
|
3,397,105
|
|
4.08
|
36,315
|
|
||||
|
$63.74
|
16,119
|
|
1.93
|
—
|
|
||||
|
3,602,076
|
|
4.05
|
$
|
39,863
|
|
||||
Subsequent to
December 31, 2016
, one individual exercised
2,226,258
stock option awards at an exercise price of
$27
, resulting in an increase in paid-in capital of
$60.1 million
.
Deferred Compensation Plan
The Company has a non-qualified deferred compensation plan for a select group of key management or highly compensated employees whereby a participant, upon election, may defer a portion of eligible compensation. The deferred compensation plan provides for discretionary Company contributions. Generally, the Company has elected not to make contributions; however, for a small group of employees, the Company makes contributions equal to
100%
of the first 1% plus
70%
of the next 5% of eligible compensation deferred. The Company credits each participant's account with income based on either an annual interest rate determined by the Company's Compensation Committee or returns of selected investment portfolios, as elected by the participant. A participant's elective deferrals and interest thereon are at all times
100%
vested. Company contributions and interest thereon will become
100%
vested upon the earlier of a change in control, as defined, or the participant's death, disability, attainment of normal retirement age or the completion of two years of service. Participant deferrals and any associated earnings will be paid upon separation from service or based on a specified distribution schedule, as elected by the participant. Deferred compensation expense was
$1.5 million
,
$0.8 million
and
$0.5 million
for the years ended
December 31, 2016
,
2015
and
2014
, respectively. Deferred compensation liabilities of
$20 million
and
$12 million
were included in other liabilities in the accompanying consolidated balance sheets at
December 31, 2016
and
2015
, respectively.
BankUnited 401(k) Plan
Under the terms of the 401(k) Plan sponsored by the Company, eligible employees may contribute a portion of compensation not exceeding the limits set by law. Employees are eligible to participate in the plan after one month of service. The 401(k) Plan allows a matching employer contribution equal to
100%
of elective deferrals that do not exceed 1% of compensation, plus
70%
of elective deferrals that exceed 1% but are less than 6% of compensation. Matching contributions are fully vested after
two years
of service. For the years ended
December 31, 2016
,
2015
and
2014
, BankUnited made matching contributions to the 401(k) Plan of approximately
$5.2 million
,
$4.9 million
and
$4.5 million
, respectively.
The Company and the Bank are subject to various regulatory capital requirements administered by Federal banking agencies. Failure to meet minimum capital requirements can initiate certain mandatory—and possibly additional discretionary—actions by regulators that, if undertaken, could have a direct material effect on the Company's financial statements. Under capital adequacy guidelines and the regulatory framework for prompt corrective action, the Company and the Bank must meet specific capital guidelines that involve quantitative measures of assets, liabilities and certain off-balance-sheet items calculated pursuant to regulation. The capital amounts and classification also are subject to qualitative judgments by the regulators about components, risk weightings and other factors. Banking regulations identify five capital categories for insured depository institutions: well-capitalized, adequately capitalized, undercapitalized, significantly undercapitalized and critically
F-60
BANKUNITED, INC. AND SUBSIDIARIES
NOTES TO CONSOLIDATED FINANCIAL STATEMENTS
December 31, 2016
undercapitalized. As of
December 31, 2016
and
2015
, all capital ratios of the Company and the Bank exceeded the "well capitalized" levels under the regulatory framework for prompt corrective action. Quantitative measures established by regulation to ensure capital adequacy require the Company and the Bank to maintain minimum amounts and ratios of total, common equity tier 1 and tier 1 capital (as defined in the regulations) to risk-weighted assets (as defined), and of tier 1 capital to average tangible assets (leverage ratio).
The following tables provide information regarding regulatory capital for the Company and the Bank as of
December 31, 2016
and
2015
(dollars in thousands):
|
|
2016
|
|||||||||||||||||||
|
|
Actual
|
Required to be
Considered Well
Capitalized
|
Required to be
Considered
Adequately
Capitalized
|
|||||||||||||||||
|
|
Amount
|
Ratio
|
Amount
|
Ratio
|
Amount
|
Ratio
|
||||||||||||||
|
BankUnited, Inc.:
|
|
|
|
|
|
|
|
|
|
|
|
|
||||||||
|
Tier 1 leverage
|
$
|
2,298,450
|
|
8.41
|
%
|
N/A
(1)
|
|
N/A
(1)
|
|
$
|
1,092,921
|
|
4.00
|
%
|
||||||
|
CET1 risk-based capital
|
$
|
2,298,450
|
|
11.63
|
%
|
$
|
1,284,498
|
|
6.50
|
%
|
$
|
889,268
|
|
4.50
|
%
|
|||||
|
Tier 1 risk-based capital
|
$
|
2,298,450
|
|
11.63
|
%
|
$
|
1,580,921
|
|
8.00
|
%
|
$
|
1,185,691
|
|
6.00
|
%
|
|||||
|
Total risk based capital
|
$
|
2,459,470
|
|
12.45
|
%
|
$
|
1,976,151
|
|
10.00
|
%
|
$
|
1,580,921
|
|
8.00
|
%
|
|||||
|
BankUnited:
|
|
|
|
|
|
|
|
|
|
|
|
|
||||||||
|
Tier 1 leverage
|
$
|
2,534,402
|
|
9.30
|
%
|
$
|
1,361,959
|
|
5.00
|
%
|
$
|
1,089,567
|
|
4.00
|
%
|
|||||
|
CET1 risk-based capital
|
$
|
2,534,402
|
|
12.89
|
%
|
$
|
1,278,277
|
|
6.50
|
%
|
$
|
884,961
|
|
4.50
|
%
|
|||||
|
Tier 1 risk-based capital
|
$
|
2,534,402
|
|
12.89
|
%
|
$
|
1,573,265
|
|
8.00
|
%
|
$
|
1,179,948
|
|
6.00
|
%
|
|||||
|
Total risk based capital
|
$
|
2,694,048
|
|
13.70
|
%
|
$
|
1,966,581
|
|
10.00
|
%
|
$
|
1,573,265
|
|
8.00
|
%
|
|||||
|
|
2015
|
|||||||||||||||||||
|
|
Actual
|
Required to be
Considered Well
Capitalized
|
Required to be
Considered
Adequately
Capitalized
|
|||||||||||||||||
|
|
Amount
|
Ratio
|
Amount
|
Ratio
|
Amount
|
Ratio
|
||||||||||||||
|
BankUnited, Inc.:
|
|
|
|
|
|
|
|
|
|
|
|
|
||||||||
|
Tier 1 leverage
|
$
|
2,143,108
|
|
9.35
|
%
|
N/A
(1)
|
|
N/A
(1)
|
|
$
|
917,207
|
|
4.00
|
%
|
||||||
|
CET1 risk-based capital
|
$
|
2,143,108
|
|
12.58
|
%
|
$
|
1,107,156
|
|
6.50
|
%
|
$
|
766,492
|
|
4.50
|
%
|
|||||
|
Tier 1 risk-based capital
|
$
|
2,143,108
|
|
12.58
|
%
|
$
|
1,362,653
|
|
8.00
|
%
|
$
|
1,021,990
|
|
6.00
|
%
|
|||||
|
Total risk based capital
|
$
|
2,274,910
|
|
13.36
|
%
|
$
|
1,703,317
|
|
10.00
|
%
|
$
|
1,362,653
|
|
8.00
|
%
|
|||||
|
BankUnited:
|
|
|
|
|
|
|
|
|
|
|
|
|
||||||||
|
Tier 1 leverage
|
$
|
2,377,689
|
|
10.41
|
%
|
$
|
1,141,845
|
|
5.00
|
%
|
$
|
913,476
|
|
4.00
|
%
|
|||||
|
CET1 risk-based capital
|
$
|
2,377,689
|
|
14.04
|
%
|
$
|
1,100,455
|
|
6.50
|
%
|
$
|
761,854
|
|
4.50
|
%
|
|||||
|
Tier 1 risk-based capital
|
$
|
2,377,689
|
|
14.04
|
%
|
$
|
1,354,406
|
|
8.00
|
%
|
$
|
1,015,805
|
|
6.00
|
%
|
|||||
|
Total risk based capital
|
$
|
2,507,430
|
|
14.81
|
%
|
$
|
1,693,008
|
|
10.00
|
%
|
$
|
1,354,406
|
|
8.00
|
%
|
|||||
(1) There is no Tier 1 leverage ratio component in the definition of a well-capitalized bank holding company.
For purposes of risk based capital computations, the FDIC Indemnification asset and the covered assets are risk-weighted at
20%
due to the conditional guarantee represented by the Loss Sharing Agreements.
BankUnited is subject to various regulatory restrictions relating to the payment of dividends, including requirements to maintain capital at or above certain minimums, and to remain "well-capitalized" under the prompt corrective action regulations.
F-61
BANKUNITED, INC. AND SUBSIDIARIES
NOTES TO CONSOLIDATED FINANCIAL STATEMENTS
December 31, 2016
The Company does not expect that any of these laws, regulations or policies will materially affect the ability of BankUnited to pay dividends in the future.
Effective January 1, 2015, the Federal Reserve Board implemented the Basel III changes to the regulatory capital framework for all U.S. banking organizations, Under the revised capital rule, a capital conservation buffer is being phased in beginning in 2016. When fully phased in on January 1, 2019, the Bank and the Company will have to maintain this capital conservation buffer composed of CET1 capital equal to
2.50%
of risk-weighted assets above the amounts to be adequately capitalized, as reflected above, in order to avoid limitations on capital distributions, including dividend payments and certain discretionary bonus payments to executive officers
BankUnited is required by the Board of Governors of the Federal Reserve System to maintain reserve balances in the form of vault cash or deposits with the FRB. At
December 31, 2016
, the reserve requirement for BankUnited was
$59 million
.
Assets and liabilities measured at fair value on a recurring basis
Following is a description of the methodologies used to estimate the fair values of assets and liabilities measured at fair value on a recurring basis and the level within the fair value hierarchy in which those measurements are typically classified.
Investment securities available for sale
—Fair value measurements are based on quoted prices in active markets when available; these measurements are classified within level 1 of the fair value hierarchy. These securities typically include U.S. Treasury securities and certain preferred stocks. If quoted prices in active markets are not available, fair values are estimated using quoted prices of securities with similar characteristics, quoted prices of identical securities in less active markets, discounted cash flow techniques, or matrix pricing models. These securities are generally classified within level 2 of the fair value hierarchy and include U.S. Government agency securities, U.S. Government agency and sponsored enterprise MBS, preferred stock investments for which level 1 valuations are not available, corporate debt securities, non-mortgage asset-backed securities, single family rental real estate-backed securities, certain private label residential MBS and CMOs, Re-Remics, private label commercial MBS, collateralized loan obligations and state and municipal obligations. Pricing of these securities is generally primarily spread driven. Observable inputs that may impact the valuation of these securities include benchmark yield curves, credit spreads, reported trades, dealer quotes, bids, issuer spreads, current rating, historical constant prepayment rates, historical voluntary prepayment rates, structural and waterfall features of individual securities, published collateral data, and for certain securities, historical constant default rates and default severities. Investment securities available for sale generally classified within level 3 of the fair value hierarchy include certain private label MBS and trust preferred securities. The Company typically values these securities using third-party proprietary pricing models, primarily discounted cash flow valuation techniques, which incorporate both observable and unobservable inputs. Unobservable inputs that may impact the valuation of these securities include risk adjusted discount rates, projected prepayment rates, projected default rates and projected loss severity.
The Company uses third-party pricing services in determining fair value measurements for investment securities. To obtain an understanding of the methodologies and assumptions used, management reviews written documentation provided by the pricing services, conducts interviews with valuation desk personnel and reviews model results and detailed assumptions used to value selected securities as considered necessary. Management has established a robust price challenge process that includes a review by the treasury front office of all prices provided on a monthly basis. Any price evidencing unexpected month over month fluctuations or deviations from expectations is challenged. If considered necessary to resolve any discrepancies, a price will be obtained from an additional independent valuation source. The Company does not typically adjust the prices provided, other than through this established challenge process. The results of price challenges are subject to review by executive management. The Company has also established a quarterly process whereby prices provided by its primary pricing service for a sample of securities are validated. Any price discrepancies are resolved based on careful consideration of the assumptions and inputs employed by each of the pricing sources.
Servicing rights
—Commercial servicing rights are valued using a discounted cash flow methodology incorporating contractually specified servicing fees and market based assumptions about prepayments, discount rates, default rates and costs of servicing. Prepayment and default assumptions are based on historical industry data for loans with similar characteristics. Assumptions about costs of servicing are based on market convention. Discount rates are based on rates of return implied by observed trades of underlying loans in the secondary market. Fair value of residential MSRs is estimated using a discounted cash flow technique that incorporates market‑based assumptions including estimated prepayment speeds, contractual servicing
F-62
BANKUNITED, INC. AND SUBSIDIARIES
NOTES TO CONSOLIDATED FINANCIAL STATEMENTS
December 31, 2016
fees, cost to service, discount rates, escrow account earnings, ancillary income, and estimated defaults.
Due to the nature of the valuation inputs and the limited availability of market pricing, servicing rights are classified as level 3
.
Derivative financial instruments
—Interest rate swaps are predominantly traded in over-the-counter markets and, as such, values are determined using widely accepted discounted cash flow modeling techniques. These discounted cash flow models use projections of future cash payments and receipts that are discounted at mid-market rates. Observable inputs that may impact the valuation of these instruments include LIBOR swap rates and LIBOR forward yield curves. These fair value measurements are generally classified within level 2 of the fair value hierarchy.
The following tables present assets and liabilities measured at fair value on a recurring basis at
December 31, 2016
and
2015
(in thousands):
|
2016
|
|||||||||||||||
|
|
Level 1
|
Level 2
|
Level 3
|
Total
|
|||||||||||
|
Investment securities available for sale:
|
|
|
|
|
|
|
|
|
|||||||
|
U.S. Treasury securities
|
$
|
5,005
|
|
$
|
—
|
|
$
|
—
|
|
$
|
5,005
|
|
|||
|
U.S. Government agency and sponsored enterprise residential MBS
|
—
|
|
1,527,242
|
|
—
|
|
1,527,242
|
|
|||||||
|
U.S. Government agency and sponsored enterprise commercial MBS
|
—
|
|
124,586
|
|
—
|
|
124,586
|
|
|||||||
|
Private label residential MBS and CMOs
|
—
|
|
254,488
|
|
120,610
|
|
375,098
|
|
|||||||
|
Private label commercial MBS
|
—
|
|
1,187,624
|
|
—
|
|
1,187,624
|
|
|||||||
|
Single family rental real estate-backed securities
|
—
|
|
861,251
|
|
—
|
|
861,251
|
|
|||||||
|
Collateralized loan obligations
|
—
|
|
487,296
|
|
—
|
|
487,296
|
|
|||||||
|
Non-mortgage asset-backed securities
|
—
|
|
186,736
|
|
—
|
|
186,736
|
|
|||||||
|
Preferred stocks
|
66,676
|
|
21,527
|
|
—
|
|
88,203
|
|
|||||||
|
State and municipal obligations
|
—
|
|
698,546
|
|
—
|
|
698,546
|
|
|||||||
|
SBA securities
|
—
|
|
523,906
|
|
—
|
|
523,906
|
|
|||||||
|
Other debt securities
|
—
|
|
3,519
|
|
4,572
|
|
8,091
|
|
|||||||
|
Servicing rights
|
—
|
|
—
|
|
27,159
|
|
27,159
|
|
|||||||
|
Derivative assets
|
—
|
|
50,232
|
|
—
|
|
50,232
|
|
|||||||
|
Total assets at fair value
|
$
|
71,681
|
|
$
|
5,926,953
|
|
$
|
152,341
|
|
$
|
6,150,975
|
|
|||
|
Derivative liabilities
|
$
|
—
|
|
$
|
61,562
|
|
$
|
—
|
|
$
|
61,562
|
|
|||
|
Total liabilities at fair value
|
$
|
—
|
|
$
|
61,562
|
|
$
|
—
|
|
$
|
61,562
|
|
|||
F-63
BANKUNITED, INC. AND SUBSIDIARIES
NOTES TO CONSOLIDATED FINANCIAL STATEMENTS
December 31, 2016
|
2015
|
|||||||||||||||
|
|
Level 1
|
Level 2
|
Level 3
|
Total
|
|||||||||||
|
Investment securities available for sale:
|
|
|
|
|
|
|
|
|
|||||||
|
U.S. Treasury securities
|
$
|
4,997
|
|
$
|
—
|
|
$
|
—
|
|
$
|
4,997
|
|
|||
|
U.S. Government agency and sponsored enterprise residential MBS
|
—
|
|
1,178,318
|
|
—
|
|
1,178,318
|
|
|||||||
|
U.S. Government agency and sponsored enterprise commercial MBS
|
—
|
|
96,814
|
|
—
|
|
96,814
|
|
|||||||
|
Re-Remics
|
—
|
|
89,691
|
|
—
|
|
89,691
|
|
|||||||
|
Private label residential MBS and CMOs
|
—
|
|
403,729
|
|
140,883
|
|
544,612
|
|
|||||||
|
Private label commercial MBS
|
—
|
|
1,218,740
|
|
—
|
|
1,218,740
|
|
|||||||
|
Single family rental real estate-backed securities
|
—
|
|
636,705
|
|
—
|
|
636,705
|
|
|||||||
|
Collateralized loan obligations
|
—
|
|
306,877
|
|
—
|
|
306,877
|
|
|||||||
|
Non-mortgage asset-backed securities
|
—
|
|
56,500
|
|
—
|
|
56,500
|
|
|||||||
|
Preferred stocks
|
82,613
|
|
596
|
|
—
|
|
83,209
|
|
|||||||
|
State and municipal obligations
|
—
|
|
361,753
|
|
—
|
|
361,753
|
|
|||||||
|
SBA securities
|
—
|
|
273,336
|
|
—
|
|
273,336
|
|
|||||||
|
Other debt securities
|
—
|
|
3,455
|
|
4,532
|
|
7,987
|
|
|||||||
|
Servicing rights
|
—
|
|
—
|
|
11,548
|
|
11,548
|
|
|||||||
|
Derivative assets
|
34,345
|
|
4
|
|
34,349
|
|
|||||||||
|
Total assets at fair value
|
$
|
87,610
|
|
$
|
4,660,859
|
|
$
|
156,967
|
|
$
|
4,905,436
|
|
|||
|
Derivative liabilities
|
$
|
—
|
|
$
|
69,524
|
|
$
|
—
|
|
$
|
69,524
|
|
|||
|
Total liabilities at fair value
|
$
|
—
|
|
$
|
69,524
|
|
$
|
—
|
|
$
|
69,524
|
|
|||
There were
no
transfers of financial assets between levels of the fair value hierarchy during the years ended
December 31, 2016
and
2015
.
The following tables reconcile changes in the fair value of assets and liabilities measured at fair value on a recurring basis and classified in level 3 of the fair value hierarchy during the years ended
December 31, 2016
,
2015
and
2014
(in thousands):
|
|
2016
|
||||||||||
|
|
Private Label
Residential
MBS
|
Other Debt
Securities
|
Servicing Rights
|
||||||||
|
Balance at beginning of period
|
$
|
140,883
|
|
$
|
4,532
|
|
$
|
20,017
|
|
||
|
Gains (losses) for the period included in:
|
|||||||||||
|
Net income
|
—
|
|
—
|
|
(6,023
|
)
|
|||||
|
Other comprehensive income
|
(2,229
|
)
|
(9
|
)
|
—
|
|
|||||
|
Discount accretion
|
5,947
|
|
116
|
|
—
|
|
|||||
|
Purchases or additions
|
—
|
|
—
|
|
13,165
|
|
|||||
|
Settlements
|
(23,991
|
)
|
(67
|
)
|
—
|
|
|||||
|
Transfers into level 3
|
—
|
|
—
|
|
—
|
|
|||||
|
Transfers out of level 3
|
—
|
|
—
|
|
—
|
|
|||||
|
Balance at end of period
|
$
|
120,610
|
|
$
|
4,572
|
|
$
|
27,159
|
|
||
F-64
BANKUNITED, INC. AND SUBSIDIARIES
NOTES TO CONSOLIDATED FINANCIAL STATEMENTS
December 31, 2016
|
2015
|
|||||||||||
|
Private Label
Residential MBS |
Other Debt
Securities |
Servicing Rights
|
|||||||||
|
Balance at beginning of period
|
$
|
168,077
|
|
$
|
4,918
|
|
$
|
—
|
|
||
|
Gains (losses) for the period included in:
|
|||||||||||
|
Net income
|
—
|
|
—
|
|
(2,062
|
)
|
|||||
|
Other comprehensive income
|
(7,469
|
)
|
(434
|
)
|
—
|
|
|||||
|
Discount accretion
|
6,524
|
|
148
|
|
—
|
|
|||||
|
Purchases or additions
|
—
|
|
—
|
|
13,610
|
|
|||||
|
Settlements
|
(26,249
|
)
|
(100
|
)
|
—
|
|
|||||
|
Transfers into level 3
|
—
|
|
—
|
|
—
|
|
|||||
|
Transfers out of level 3
|
—
|
|
—
|
|
—
|
|
|||||
|
Balance at end of period
|
$
|
140,883
|
|
$
|
4,532
|
|
$
|
11,548
|
|
||
|
2014
|
|||||||
|
Private Label
Residential
MBS
|
Other Debt
Securities
|
||||||
|
Balance at beginning of period
|
$
|
199,408
|
|
$
|
4,601
|
|
|
|
Gains (losses) for the period included in:
|
|||||||
|
Net income
|
—
|
|
—
|
|
|||
|
Other comprehensive income
|
(4,890
|
)
|
235
|
|
|||
|
Discount accretion
|
8,010
|
|
173
|
|
|||
|
Sales
|
(7,787
|
)
|
—
|
|
|||
|
Settlements
|
(26,664
|
)
|
(91
|
)
|
|||
|
Transfers into level 3
|
—
|
|
—
|
|
|||
|
Transfers out of level 3
|
—
|
|
—
|
|
|||
|
Balance at end of period
|
$
|
168,077
|
|
$
|
4,918
|
|
|
The balance of servicing rights at the beginning of 2016 includes
$8.5 million
of residential MSRs, which the Company elected to measure at fair value effective January 1, 2016. Changes in the fair value of servicing rights are included in the consolidated statement of income line item “
Other non-interest income
.” Changes in fair value include changes due to discount rates and valuation assumptions, as well as other changes such as runoffs and the passage of time. The amount of unrealized losses included in earnings for the
year ended December 31, 2016
that were related to servicing rights held at
December 31, 2016
totaled approximately
$1.8 million
and were primarily due to changes in discount rates and valuation assumptions.
Securities for which fair value measurements are categorized in level 3 of the fair value hierarchy at
December 31, 2016
consisted of pooled trust preferred securities with a fair value of
$5 million
and private label residential MBS and CMOs with a fair value of
$121 million
. The trust preferred securities are not material to the Company’s financial statements. Private label residential MBS consisted of senior and mezzanine tranches collateralized by prime fixed rate and hybrid 1-4 single family residential mortgages originated before 2005, some of which contain option-arm features. Substantially all of these securities have variable rate coupons. Weighted average subordination levels at
December 31, 2016
were
17.1%
,
12.6%
and
1.6%
for investment grade, non-investment grade and option-arm securities, respectively. There were
$27 million
of option-arm securities with a subordination level of zero at
December 31, 2016
.
F-65
BANKUNITED, INC. AND SUBSIDIARIES
NOTES TO CONSOLIDATED FINANCIAL STATEMENTS
December 31, 2016
The following table provides information about the valuation techniques and unobservable inputs used in the valuation of private label residential MBS and CMOs falling within level 3 of the fair value hierarchy as of
December 31, 2016
(dollars in thousands):
|
Fair Value at
|
Valuation Technique
|
Unobservable
Input
|
Range (Weighted
Average)
|
|||||||
|
December 31, 2016
|
||||||||||
|
Investment grade
|
$
|
58,261
|
|
Discounted cash flow
|
Voluntary prepayment rate
|
2.76% - 30.73% (13.77%)
|
||||
|
Probability of default
|
0.00% - 4.09% (1.61%)
|
|||||||||
|
Loss severity
|
15.00% - 92.73% (32.82%)
|
|||||||||
|
Discount rate
|
2.92% - 6.78% (4.03%)
|
|||||||||
|
Non-investment grade
|
$
|
33,449
|
|
Discounted cash flow
|
Voluntary prepayment rate
|
0.58% - 23.97% (15.06%)
|
||||
|
Probability of default
|
0.00% - 4.61% (1.51%)
|
|||||||||
|
Loss severity
|
15.00% - 92.73% (39.83%)
|
|||||||||
|
Discount rate
|
3.10% - 24.83% (6.63%)
|
|||||||||
|
Option-arm (non-investment grade)
|
$
|
28,900
|
|
Discounted cash flow
|
Voluntary prepayment rate
|
6.19% - 6.19% (6.19%)
|
||||
|
Probability of default
|
3.21% - 3.21% (3.21%)
|
|||||||||
|
Loss severity
|
69.67% - 69.67% (69.67%)
|
|||||||||
|
Discount rate
|
4.06% - 6.66% (5.08%)
|
|||||||||
The significant unobservable inputs impacting the fair value measurement of private label residential MBS and CMOs include voluntary prepayment rates, probability of default, loss severity given default and discount rates. Generally, increases in probability of default, loss severity or discount rates would result in a lower fair value measurement. Alternatively, decreases in probability of default, loss severity or discount rates would result in a higher fair value measurement. For securities with less favorable credit characteristics, decreases in voluntary prepayment speeds may be interpreted as a deterioration in the overall credit quality of the underlying collateral and as such, lead to lower fair value measurements. The fair value measurements of those securities with higher levels of subordination will be less sensitive to changes in these unobservable inputs other than discount rates, while securities with lower levels of subordination will show a higher degree of sensitivity to changes in these unobservable inputs other than discount rates. Generally, a change in the assumption used for probability of default is accompanied by a directionally similar change in the assumption used for loss severity given default and a directionally opposite change in the assumption used for voluntary prepayment rate.
The following table provides information about the valuation techniques and significant unobservable inputs used in the valuation of servicing rights as of
December 31, 2016
(dollars in thousands):
|
Fair Value at
|
Valuation Technique
|
Unobservable
Input
|
Range (Weighted
Average)
|
|||||||
|
December 31, 2016
|
||||||||||
|
Residential MSRs
|
$
|
15,698
|
|
Discounted cash flow
|
Prepayment rate
|
4.66% - 22.27% (10.82%)
|
||||
|
Discount rate
|
9.63% - 9.70% (9.64%)
|
|||||||||
|
Commercial servicing rights
|
$
|
11,461
|
|
Discounted cash flow
|
Prepayment rate
|
0.79% - 9.50% (7.55%)
|
||||
|
Discount rate
|
8.33% - 14.08% (12.32%)
|
|||||||||
Increases in prepayment rates or discount rates would result in lower fair value measurements and decreases in prepayment rates or discount rates would result in higher fair value measurements.
Although the prepayment rate and the discount rate are not directly interrelated, they generally move in opposite directions.
Assets and liabilities measured at fair value on a non-recurring basis
Following is a description of the methodologies used to estimate the fair values of assets and liabilities that may be measured at fair value on a non-recurring basis, and the level within the fair value hierarchy in which those measurements are typically classified.
F-66
BANKUNITED, INC. AND SUBSIDIARIES
NOTES TO CONSOLIDATED FINANCIAL STATEMENTS
December 31, 2016
Impaired loans, OREO
and other repossessed assets
—The carrying amount of collateral dependent impaired loans is typically based on the fair value of the underlying collateral, which may be real estate or other business assets, less estimated costs to sell. The carrying value of OREO is initially measured based on the fair value of the real estate acquired in foreclosure and subsequently adjusted to the lower of cost or estimated fair value, less estimated cost to sell. Fair values of real estate collateral are typically based on real estate appraisals which utilize market and income approaches to valuation incorporating both observable and unobservable inputs. When current appraisals are not available, the Company may use brokers’ price opinions, home price indices or other available information about changes in real estate market conditions to adjust the latest appraised value available. These adjustments to appraised values may be subjective and involve significant management judgment. The fair value of repossessed assets or collateral consisting of other business assets is generally based on appraisals or internal analysis that use market approaches to valuation incorporating primarily unobservable inputs. Fair value measurements related to collateral dependent impaired loans, OREO and other repossessed assets are classified within level 3 of the fair value hierarchy.
Equipment under operating lease
—Fair values of equipment under operating lease are typically based upon discounted cash flow analysis, considering expected lease rates and estimated end of life residual values. These fair value measurements are classified within level 3 of the fair value hierarchy.
The following tables present the carrying value of assets for which non-recurring changes in fair value have been recorded for the years ended
December 31, 2016
,
2015
and
2014
(in thousands):
|
2016
|
|||||||||||||||||||
|
|
Level 1
|
Level 2
|
Level 3
|
Total
|
Losses from Fair Value Changes
|
||||||||||||||
|
OREO and repossessed assets
|
$
|
—
|
|
$
|
—
|
|
$
|
12,466
|
|
$
|
12,466
|
|
$
|
(1,156
|
)
|
||||
|
Impaired loans
|
$
|
—
|
|
$
|
—
|
|
$
|
78,121
|
|
$
|
78,121
|
|
$
|
(25,573
|
)
|
||||
|
Equipment under operating lease
|
$
|
—
|
|
$
|
—
|
|
$
|
8,173
|
|
$
|
8,173
|
|
$
|
(4,100
|
)
|
||||
|
2015
|
|||||||||||||||||||
|
|
Level 1
|
Level 2
|
Level 3
|
Total
|
Losses from Fair Value Changes
|
||||||||||||||
|
OREO and repossessed assets
|
$
|
—
|
|
$
|
—
|
|
$
|
7,389
|
|
$
|
7,389
|
|
$
|
(1,206
|
)
|
||||
|
Impaired loans
|
$
|
—
|
|
$
|
—
|
|
$
|
30,812
|
|
$
|
30,812
|
|
$
|
(9,865
|
)
|
||||
|
Residential MSRs
|
$
|
—
|
|
$
|
—
|
|
$
|
8,469
|
|
$
|
8,469
|
|
$
|
(15
|
)
|
||||
|
2014
|
|||||||||||||||||||
|
|
Level 1
|
Level 2
|
Level 3
|
Total
|
Gains (losses) from Fair Value Changes
|
||||||||||||||
|
OREO
|
$
|
—
|
|
$
|
—
|
|
$
|
10,606
|
|
$
|
10,606
|
|
$
|
(2,791
|
)
|
||||
|
Impaired loans
|
$
|
—
|
|
$
|
—
|
|
$
|
11,727
|
|
$
|
11,727
|
|
$
|
2,539
|
|
||||
F-67
BANKUNITED, INC. AND SUBSIDIARIES
NOTES TO CONSOLIDATED FINANCIAL STATEMENTS
December 31, 2016
The following table presents the carrying value and fair value of financial instruments and the level within the fair value hierarchy in which those measurements are classified at
December 31, 2016
and
2015
(dollars in thousands):
|
2016
|
2015
|
||||||||||||||||
|
|
Level
|
Carrying Value
|
Fair Value
|
Carrying Value
|
Fair Value
|
||||||||||||
|
Assets:
|
|
|
|
|
|
|
|
|
|
||||||||
|
Cash and cash equivalents
|
1
|
$
|
448,313
|
|
$
|
448,313
|
|
$
|
267,500
|
|
$
|
267,500
|
|
||||
|
Investment securities available for sale
|
1/2/3
|
6,073,584
|
|
6,073,584
|
|
4,859,539
|
|
4,859,539
|
|
||||||||
|
Investment securities held to maturity
|
3
|
10,000
|
|
10,000
|
|
10,000
|
|
10,000
|
|
||||||||
|
Non-marketable equity securities
|
2
|
284,272
|
|
284,272
|
|
219,997
|
|
219,997
|
|
||||||||
|
Loans held for sale
|
2
|
41,198
|
|
45,833
|
|
47,410
|
|
50,080
|
|
||||||||
|
Loans:
|
|||||||||||||||||
|
Covered
|
3
|
611,942
|
|
1,200,291
|
|
804,672
|
|
1,535,688
|
|
||||||||
|
Non-covered
|
3
|
18,630,499
|
|
18,713,495
|
|
15,706,103
|
|
15,925,405
|
|
||||||||
|
FDIC Indemnification asset
|
3
|
515,933
|
|
256,691
|
|
739,880
|
|
361,364
|
|
||||||||
|
Accrued interest receivable
|
2
|
72,305
|
|
72,305
|
|
47,654
|
|
47,654
|
|
||||||||
|
Derivative assets
|
2
|
50,232
|
|
50,232
|
|
34,349
|
|
34,349
|
|
||||||||
|
Liabilities:
|
|||||||||||||||||
|
Demand, savings and money market deposits
|
2
|
$
|
13,735,248
|
|
$
|
13,735,248
|
|
$
|
12,330,410
|
|
$
|
12,330,410
|
|
||||
|
Time deposits
|
2
|
5,755,642
|
|
5,759,787
|
|
4,608,091
|
|
4,630,572
|
|
||||||||
|
FHLB advances
|
2
|
5,239,348
|
|
5,244,188
|
|
4,008,464
|
|
4,008,621
|
|
||||||||
|
Notes and other borrowings
|
2
|
402,809
|
|
403,733
|
|
402,545
|
|
392,219
|
|
||||||||
|
Accrued interest payable
|
2
|
7,923
|
|
7,923
|
|
5,638
|
|
5,638
|
|
||||||||
|
Derivative liabilities
|
2
|
61,562
|
|
61,562
|
|
69,524
|
|
69,524
|
|
||||||||
The following methods and assumptions were used to estimate the fair value of each class of financial instruments, other than those described above:
The carrying amounts of certain financial instruments approximate fair value due to their short-term nature and generally negligible credit risk. These financial instruments include cash and cash equivalents, accrued interest receivable and accrued interest payable.
Investment securities held to maturity
Investment securities held to maturity includes one bond issued by the State of Israel, with fair value obtained from a third party pricing service.
Non-marketable equity securities
Non-marketable equity securities include FHLB and FRB stock. There is no market for these securities, which can be liquidated only by redemption by the issuer. These securities are valued at par, which has historically represented the redemption price and is therefore considered to approximate fair value.
Loans held for sale
The fair value of the portion of small business loans guaranteed by U.S. Government agencies being held for sale is estimated using pricing on recent sales of similar loans by the Company in active markets.
F-68
BANKUNITED, INC. AND SUBSIDIARIES
NOTES TO CONSOLIDATED FINANCIAL STATEMENTS
December 31, 2016
Covered loans
Fair values are estimated based on a discounted cash flow analysis. Estimates of future cash flows incorporate various factors that may include the type of loan and related collateral, estimated collateral values, estimated default probability and loss severity given default, internal risk rating, whether the interest rate is fixed or variable, term of loan and whether or not the loan is amortizing. The fair values of loans accounted for in pools are estimated on a pool basis. Other loans may be grouped based on risk characteristics and fair value estimated in the aggregate when applying discounted cash flow valuation techniques. Discount rates for residential loans are based on observable fixed income market data for products with similar credit characteristics.
Non-covered loans
Fair values of residential loans are estimated using a discounted cash flow analysis with discount rates based on yields at which similar loans are trading in the secondary market, which reflect assumptions about credit risk. Fair values of commercial and consumer loans are estimated using a discounted cash flow analysis with discount rates based on interest rates currently being offered for loans with similar terms to borrowers of similar credit quality. The ALLL related to commercial and consumer loans is considered a reasonable estimate of the required adjustment to fair value to reflect the impact of credit risk. This estimate may not represent an exit value as defined in ASC 820.
FDIC indemnification asset
The fair value of the FDIC indemnification asset has been estimated using a discounted cash flow technique incorporating assumptions about the timing and amount of future projected cash payments from the FDIC related to the resolution of covered assets. The factors that impact estimates of future cash flows are similar to those impacting estimated cash flows from covered loans. The discount rate is determined by adjusting the risk free rate to incorporate uncertainty in the estimate of the timing and amount of future cash flows and illiquidity.
Deposits
The fair value of demand deposits, savings accounts and money market deposits is the amount payable on demand at the reporting date. The fair value of time deposits is estimated using a discounted cash flow technique based on rates currently offered for deposits of similar remaining maturities.
FHLB
advances
Fair value is estimated by discounting contractual future cash flows using the current rate at which borrowings with similar terms and remaining maturities could be obtained by the Company.
Senior notes
Fair value is estimated based on quoted prices of identical securities in less active markets.
The Company issues off-balance sheet financial instruments to meet the financing needs of its customers. These financial instruments include commitments to fund loans, unfunded commitments under existing lines of credit, and commercial and standby letters of credit. These commitments expose the Company to varying degrees of credit and market risk which are essentially the same as those involved in extending loans to customers, and are subject to the same credit policies used in underwriting loans. Collateral may be obtained based on the Company’s credit evaluation of the counterparty. The Company’s maximum exposure to credit loss is represented by the contractual amount of these commitments. Unfunded commitments under lines of credit include
$11.9 million
available under non-cancellable commitments in effect at the date of the FSB Acquisition, which are covered under the Single Family Shared-Loss Agreement if prescribed conditions are met.
F-69
BANKUNITED, INC. AND SUBSIDIARIES
NOTES TO CONSOLIDATED FINANCIAL STATEMENTS
December 31, 2016
Commitments to fund loans
These are agreements to lend funds to customers as long as there is no violation of any condition established in the contract. Commitments to fund loans generally have fixed expiration dates or other termination clauses and may require payment of a fee. Many of these commitments are expected to expire without being funded and, therefore, the total commitment amounts do not necessarily represent future liquidity requirements.
Unfunded commitments under lines of credit
Unfunded commitments under lines of credit include commercial, commercial real estate, home equity and consumer lines of credit to existing customers. Some of these commitments may mature without being fully funded.
Commercial and standby letters of credit
Letters of credit are conditional commitments issued by the Company to guarantee the performance of a customer to a third party. These letters of credit are primarily issued to support trade transactions or guarantee arrangements. The credit risk involved in issuing letters of credit is essentially the same as that involved in extending loan facilities to customers.
Total lending related commitments outstanding at
December 31, 2016
were as follows (in thousands):
|
Commitments to fund loans
|
$
|
587,064
|
|
|
Commitments to purchase loans
|
239,111
|
|
|
|
Unfunded commitments under lines of credit
|
1,821,229
|
|
|
|
Commercial and standby letters of credit
|
84,355
|
|
|
|
$
|
2,731,759
|
|
|
Legal Proceedings
The Company had accrued approximately
$2.8 million
at
December 31, 2016
related to a recent jury award in an action brought against Herald National Bank, which action was commenced prior to the Company's acquisition of Herald. Subsequent to
December 31, 2016
, a settlement was reached with the plaintiffs, resulting in no additional cost to the Company.
The Company is involved as plaintiff or defendant in various other legal actions arising in the normal course of business. In the opinion of management, based upon advice of legal counsel, the likelihood is remote that the impact of these proceedings, either individually or in the aggregate, would be material to the Company’s consolidated financial position, results of operations or cash flows.
F-70
BANKUNITED, INC. AND SUBSIDIARIES
NOTES TO CONSOLIDATED FINANCIAL STATEMENTS
December 31, 2016
Condensed financial statements of BankUnited, Inc. are presented below (in thousands):
Condensed Balance Sheets
|
|
December 31, 2016
|
December 31, 2015
|
|||||
|
Assets:
|
|
|
|
|
|||
|
Cash and cash equivalents
|
$
|
87,718
|
|
$
|
82,810
|
|
|
|
Investment securities available for sale, at fair value
|
78,293
|
|
79,384
|
|
|||
|
Investment in BankUnited, N.A.
|
2,652,535
|
|
2,475,629
|
|
|||
|
Deferred tax asset, net
|
16,738
|
|
15,336
|
|
|||
|
Other assets
|
5,345
|
|
10,948
|
|
|||
|
Total assets
|
$
|
2,840,629
|
|
$
|
2,664,107
|
|
|
|
Liabilities and Stockholders' Equity:
|
|||||||
|
Notes payable
|
$
|
393,092
|
|
$
|
392,326
|
|
|
|
Other liabilities
|
29,108
|
|
27,883
|
|
|||
|
Stockholders' equity
|
2,418,429
|
|
2,243,898
|
|
|||
|
Total liabilities and stockholders' equity
|
$
|
2,840,629
|
|
$
|
2,664,107
|
|
|
Condensed Statements of Income
|
|
Years Ended December 31,
|
||||||||||
|
|
2016
|
2015
|
2014
|
||||||||
|
Income:
|
|
|
|
|
|
|
|||||
|
Interest and dividends on investment securities available for sale
|
$
|
4,280
|
|
$
|
4,866
|
|
$
|
5,560
|
|
||
|
Service fees from subsidiary
|
21,957
|
|
17,404
|
|
15,746
|
|
|||||
|
Equity in earnings of subsidiary
|
242,874
|
|
256,456
|
|
208,934
|
|
|||||
|
Other
|
—
|
|
235
|
|
—
|
|
|||||
|
Total
|
269,111
|
|
278,961
|
|
230,240
|
|
|||||
|
Expense:
|
|
|
|||||||||
|
Interest on borrowings
|
20,100
|
|
2,457
|
|
—
|
|
|||||
|
Employee compensation and benefits
|
27,143
|
|
22,099
|
|
21,388
|
|
|||||
|
Other
|
4,466
|
|
4,356
|
|
4,571
|
|
|||||
|
Total
|
51,709
|
|
28,912
|
|
25,959
|
|
|||||
|
Income before income taxes
|
217,402
|
|
250,049
|
|
204,281
|
|
|||||
|
Provision (benefit) for income taxes
|
(8,339
|
)
|
(1,611
|
)
|
66
|
|
|||||
|
Net income
|
$
|
225,741
|
|
$
|
251,660
|
|
$
|
204,215
|
|
||
F-71
BANKUNITED, INC. AND SUBSIDIARIES
NOTES TO CONSOLIDATED FINANCIAL STATEMENTS
December 31, 2016
Condensed Statements of Cash Flows
|
|
Years Ended December 31,
|
||||||||||
|
|
2016
|
2015
|
2014
|
||||||||
|
Cash flows from operating activities:
|
|
|
|
|
|
|
|||||
|
Net income
|
$
|
225,741
|
|
$
|
251,660
|
|
$
|
204,215
|
|
||
|
Adjustments to reconcile net income to net cash provided by operating activities:
|
|
|
|||||||||
|
Equity in undistributed earnings of subsidiaries
|
(157,374
|
)
|
(176,456
|
)
|
(116,934
|
)
|
|||||
|
Equity based compensation
|
18,032
|
|
16,027
|
|
15,551
|
|
|||||
|
Other
|
7,438
|
|
1,878
|
|
20,804
|
|
|||||
|
Net cash provided by operating activities
|
93,837
|
|
93,109
|
|
123,636
|
|
|||||
|
Cash flows from investing activities:
|
|
|
|||||||||
|
Capital contributions to subsidiary
|
—
|
|
(575,000
|
)
|
—
|
|
|||||
|
Purchase of investment securities available for sale
|
(20,150
|
)
|
—
|
|
—
|
|
|||||
|
Proceeds from repayments, sale, maturities and calls of investment securities available for sale
|
19,401
|
|
46,031
|
|
7,319
|
|
|||||
|
Other
|
(3
|
)
|
(285
|
)
|
(137
|
)
|
|||||
|
Net cash provided by (used in) investing activities
|
(752
|
)
|
(529,254
|
)
|
7,182
|
|
|||||
|
Cash flows from financing activities:
|
|
|
|||||||||
|
Proceeds from issuance of notes payable
|
—
|
|
392,252
|
|
—
|
|
|||||
|
Dividends paid
|
(89,824
|
)
|
(88,981
|
)
|
(87,716
|
)
|
|||||
|
Proceeds from exercise of stock options
|
791
|
|
35,647
|
|
926
|
|
|||||
|
Other
|
856
|
|
1,593
|
|
2,123
|
|
|||||
|
Net cash provided by (used in) financing activities
|
(88,177
|
)
|
340,511
|
|
(84,667
|
)
|
|||||
|
Net increase (decrease) in cash and cash equivalents
|
4,908
|
|
(95,634
|
)
|
46,151
|
|
|||||
|
Cash and cash equivalents, beginning of period
|
82,810
|
|
178,444
|
|
132,293
|
|
|||||
|
Cash and cash equivalents, end of period
|
$
|
87,718
|
|
$
|
82,810
|
|
$
|
178,444
|
|
||
|
Supplemental schedule of non-cash investing and financing activities:
|
|
|
|
|
|
|
|||||
|
Dividends declared, not paid
|
$
|
22,510
|
|
$
|
22,380
|
|
$
|
21,968
|
|
||
Dividends received by BankUnited, Inc. from the Bank totaled $
85.5 million
,
$80 million
and
$92 million
for the years ended
December 31, 2016
,
2015
, and
2014
, respectively.
F-72
BANKUNITED, INC. AND SUBSIDIARIES
NOTES TO CONSOLIDATED FINANCIAL STATEMENTS
December 31, 2016
Financial information by quarter for the years ended
December 31, 2016
and
2015
follows (in thousands, except per share data):
|
|
2016
|
||||||||||||||||||
|
|
Fourth Quarter
|
Third Quarter
|
Second Quarter
|
First Quarter
|
Total
|
||||||||||||||
|
Interest income
|
$
|
277,965
|
|
$
|
269,981
|
|
$
|
260,464
|
|
$
|
250,807
|
|
$
|
1,059,217
|
|
||||
|
Interest expense
|
50,466
|
|
48,246
|
|
46,154
|
|
43,966
|
|
188,832
|
|
|||||||||
|
Net interest income before provision for loan losses
|
227,499
|
|
221,735
|
|
214,310
|
|
206,841
|
|
870,385
|
|
|||||||||
|
Provision for loan losses
|
8,462
|
|
24,408
|
|
14,333
|
|
3,708
|
|
50,911
|
|
|||||||||
|
Net interest income after provision for loan losses
|
219,037
|
|
197,327
|
|
199,977
|
|
203,133
|
|
819,474
|
|
|||||||||
|
Non-interest income
|
29,287
|
|
25,075
|
|
28,857
|
|
23,198
|
|
106,417
|
|
|||||||||
|
Non-interest expense
|
156,223
|
|
148,004
|
|
144,112
|
|
142,108
|
|
590,447
|
|
|||||||||
|
Income before income taxes
|
92,101
|
|
74,398
|
|
84,722
|
|
84,223
|
|
335,444
|
|
|||||||||
|
Provision for income taxes
|
28,807
|
|
23,550
|
|
27,997
|
|
29,349
|
|
109,703
|
|
|||||||||
|
Net income
|
$
|
63,294
|
|
$
|
50,848
|
|
$
|
56,725
|
|
$
|
54,874
|
|
$
|
225,741
|
|
||||
|
Earnings per common share, basic
|
$
|
0.59
|
|
$
|
0.47
|
|
$
|
0.53
|
|
$
|
0.51
|
|
$
|
2.11
|
|
||||
|
Earnings per common share, diluted
|
$
|
0.59
|
|
$
|
0.47
|
|
$
|
0.52
|
|
$
|
0.51
|
|
$
|
2.09
|
|
||||
|
2015
|
|||||||||||||||||||
|
Fourth Quarter
|
Third Quarter
|
Second Quarter
|
First Quarter
|
Total
|
|||||||||||||||
|
Interest income
|
$
|
242,402
|
|
$
|
223,898
|
|
$
|
212,634
|
|
$
|
201,882
|
|
$
|
880,816
|
|
||||
|
Interest expense
|
39,407
|
|
34,947
|
|
31,656
|
|
29,154
|
|
135,164
|
|
|||||||||
|
Net interest income before provision for loan losses
|
202,995
|
|
188,951
|
|
180,978
|
|
172,728
|
|
745,652
|
|
|||||||||
|
Provision for loan losses
|
9,924
|
|
17,819
|
|
8,421
|
|
8,147
|
|
44,311
|
|
|||||||||
|
Net interest income after provision for loan losses
|
193,071
|
|
171,132
|
|
172,557
|
|
164,581
|
|
701,341
|
|
|||||||||
|
Non-interest income
|
29,252
|
|
31,173
|
|
21,058
|
|
20,741
|
|
102,224
|
|
|||||||||
|
Non-interest expense
|
136,811
|
|
132,269
|
|
123,448
|
|
114,144
|
|
506,672
|
|
|||||||||
|
Income before income taxes
|
85,512
|
|
70,036
|
|
70,167
|
|
71,178
|
|
296,893
|
|
|||||||||
|
Provision (benefit) for income taxes
|
29,249
|
|
(32,267
|
)
|
23,530
|
|
24,721
|
|
45,233
|
|
|||||||||
|
Net income
|
$
|
56,263
|
|
$
|
102,303
|
|
$
|
46,637
|
|
$
|
46,457
|
|
$
|
251,660
|
|
||||
|
Earnings per common share, basic
|
$
|
0.53
|
|
$
|
0.96
|
|
$
|
0.44
|
|
$
|
0.44
|
|
$
|
2.37
|
|
||||
|
Earnings per common share, diluted
|
$
|
0.52
|
|
$
|
0.95
|
|
$
|
0.43
|
|
$
|
0.44
|
|
$
|
2.35
|
|
||||
Earnings for the third quarter 2015 benefited from a discrete income tax benefit of
$49.3 million
related to the Company’s ability to claim additional tax basis in certain assets acquired in the FSB Acquisition.
F-73
None
Evaluation of Disclosure Controls and Procedures
As of the end of the period covered by this Annual Report on Form 10-K, we carried out an evaluation under the supervision and with the participation of our management, including the Chief Executive Officer and Chief Financial Officer, of the effectiveness of the design and operation of our disclosure controls and procedures as defined in Exchange Act Rules 13a-15(e) and 15d-15(e). Based upon that evaluation, the Chief Executive Officer and the Chief Financial Officer concluded that our disclosure controls and procedures were effective as of
December 31, 2016
.
Changes in Internal Control over Financial Reporting
None.
Management's Report on Internal Control Over Financial Reporting
Management's report set forth on page F-2 is incorporated herein by reference.
Attestation Report of the Registered Public Accounting Firm
The effectiveness of the Company's internal control over financial reporting as of
December 31, 2016
has been audited by KPMG LLP, an independent registered public accounting firm, as stated in their report, which is included in Part II, Item 8 of this Form 10-K on page F-4.
None.
Information regarding the directors and executive officers of BankUnited, Inc. and information regarding Section 16(a) compliance, the Audit and Risk Committee, the Company's code of ethics, background of the directors and director nominations appearing under the captions "Section 16(a) Beneficial Ownership Reporting Compliance," "Committees of the Board of Directors," "Corporate Governance Guidelines, Code of Conduct and Code of Ethics," "Director Nominating Process and Diversity" and "Election of Directors" in the Company's Proxy Statement for the
2017
annual meeting of stockholders is hereby incorporated by reference.
Executive Compensation
For purposes of Item 402 of Regulation S-K, the "named executive officers" of BankUnited, Inc. for the fiscal year ended
December 31, 2016
are John A. Kanas, Chairman, President and Chief Executive Officer; Leslie Lunak, Chief Financial Officer; Rajinder P. Singh, Chief Operating Officer and Director; Thomas M. Cornish, President, Florida Bank of BankUnited, N.A. and Joseph Roberto, President, New York Banking Operations of BankUnited, N.A.
Information appearing under the captions "Director Compensation" and "Executive Compensation" in the
2017
Proxy Statement (other than the "Compensation Committee Report," which is deemed furnished herein by reference) is hereby incorporated by reference.
Information setting forth the security ownership of certain beneficial owners and management appearing under the caption "Beneficial Ownership of the Company's Common Stock" and information in the "Equity Compensation Plans" table appearing under the caption "Equity Compensation Plan Information" in the
2017
Proxy Statement is hereby incorporated by reference.
87
Information regarding certain related transactions appearing under the captions "Certain Related Party Relationships" and information regarding director independence appearing under the caption "Director Independence" in the
2017
Proxy Statement is hereby incorporated by reference.
Information appearing under the captions "Auditor Fees and Services" and "Policy on Audit and Risk Committee Pre-Approval of Audit and Permissible Non-Audit Services of Independent Auditors" in the
2017
Proxy Statement is hereby incorporated by reference.
88
|
(a)
|
List of documents filed as part of this report:
|
|
1)
|
Consolidated Financial Statements and Report of Independent Registered Public Accounting Firm:
|
See Index on page F-1.
|
2)
|
Financial Statement Schedules:
|
Financial statement schedules are omitted as not required or not applicable or because the information is included in the Consolidated Financial Statements or notes thereto.
|
3)
|
List of Exhibits:
|
The exhibit list in the Exhibit Index is incorporated herein by reference as the list of exhibits required as part of this report.
89
EXHIBIT INDEX
|
Exhibit
Number
|
Description
|
Location
|
|||
|
2.1a
|
|
Purchase and Assumption Agreement, dated as of May 21, 2009, among the Federal Deposit Insurance Corporation, Receiver of BankUnited, FSB, Coral Cables, Florida, the Federal Deposit Insurance Corporation and BankUnited (Single Family Shared-Loss Agreement and Commercial and Other Shared-Loss Agreement included as Exhibits 4.15A and 4.15B thereto, respectively)†
|
Exhibit 2.1a to the Registration Statement on Form S-1 of the Company filed January 18, 2011
|
||
|
2.1b
|
|
Addendum to Purchase and Assumption Agreement, dated as of May 21, 2009, by and among the Federal Deposit Insurance Corporation, Receiver of BankUnited, FSB, Coral Gables, Florida, BankUnited, and the Federal Deposit Insurance Corporation
|
Exhibit 2.1b to the Registration Statement on Form S-1 of the Company filed January 10, 2011
|
||
|
2.1c
|
|
Amendment No. 1 to the BankUnited Single Family Shared-Loss Agreement with the FDIC, dated as of November 2, 2010
|
Exhibit 2.1c to the Registration Statement on Form S-1 of the Company filed January 18, 2011
|
||
|
2.1d
|
|
Amendment No. 2 the BankUnited Single Family Shared-Loss Agreement with the FDIC, dated as of December 22, 2010
|
Exhibit 2.1d to the Registration Statement on Form S-1 of the Company filed January 18, 2011
|
||
|
3.1
|
|
Amended and Restated Certificate of Incorporation
|
Exhibit 3.1 of the Company's Annual Report on Form 10-K filed March 31, 2011
|
||
|
3.2
|
|
Amended and Restated By-Laws
|
Exhibit 3.1 to the Current Report on Form 8-K of the Company filed August 15, 2016
|
||
|
4.1
|
|
Specimen common stock certificate
|
Exhibit 4.1 to the Registration Statement on Form S-1 of the Company filed January 18, 2011
|
||
|
4.2
|
|
Indenture dated as of November 17, 2015 between BankUnited, Inc. and U.S. Bank National Association, as trustee
|
Exhibit 4.1 to the Current Report on Form 8-K of the Company filed November 17, 2015
|
||
|
4.3
|
|
First Supplemental Indenture dated as of November 17, 2015 between BankUnited, Inc. and U.S. Bank National Association, as trustee
|
Exhibit 4.2 to the Current Report on Form 8-K of the Company filed November 17, 2015
|
||
|
4.4
|
|
Form of 4.875% Senior Note due 2025 (included as part of Exhibit 4.3 above)
|
Exhibit 4.3 to the Current Report on Form 8-K of the Company filed November 17, 2015
|
||
|
10.1
|
|
BankUnited, N.A. Non-Qualified Deferred Compensation Plan
|
Exhibit 10.1b to the Annual Report on Form 10-K of the Company filed February 26, 2015
|
||
|
10.1a
|
|
Amendment to the BankUnited, N.A. Non-Qualified Deferred Compensation Plan
|
Exhibit 10.1a to the Annual Report on Form 10-K of the Company filed February 26, 2016
|
||
|
10.2
|
|
BankUnited, Inc. (formerly known as BU Financial Corporation) 2009 Stock Option Plan
|
Exhibit 10.7 to the Registration Statement on Form S-1 of the Company filed October 29, 2010
|
||
|
10.3a
|
|
BankUnited, Inc. 2010 Omnibus Equity Incentive Plan
|
Exhibit 10.8 to the Registration Statement on Form S-1 of the Company filed January 18, 2011
|
||
90
|
Exhibit
Number
|
Description
|
Location
|
|||
|
10.3b
|
|
BankUnited, Inc. 2014 Omnibus Equity Incentive Plan
|
Appendix A to the Proxy Statement on Schedule 14A of the Company filed April 11, 2014
|
||
|
10.4a
|
|
Registration Rights Agreement by and among BankUnited, Inc., John A. Kanas, Rajinder P. Singh, Douglas J. Pauls and John Bohlsen, and each of the other parties thereto
|
Exhibit 10.9 to Annual Report on Form 10-K of the Company filed March 31, 2011
|
||
|
10.4b
|
|
Amendment No. 1, dated February 29, 2012, to Registration Rights Agreement, dated February 2, 2011, by and among BankUnited, Inc., John A. Kanas, Rajinder P. Singh, Douglas J. Pauls and John Bohlsen, and each of the other parties thereto
|
Exhibit 10.3 to the Current Report on Form 8-K of the Company filed March 6, 2012
|
||
|
10.5
|
|
Form of indemnification agreement between BankUnited, Inc. and each of its directors and executive officers
|
Exhibit 10.1 to the Current Report on Form 8-K of the Company filed February 16, 2011
|
||
|
10.6
|
|
BankUnited, Inc. Policy on Incentive Compensation Arrangements
|
Exhibit 10.6 of the Company's Annual Report on Form 10-K filed February 26, 2015
|
||
|
10.7
|
|
Heritage Bank, N.A. 2008 Stock Incentive Plan
|
Exhibit 10.1 to the Registration Statement on Form S-8 of the Company filed February 29, 2012
|
||
|
10.8
|
|
Stock Warrant Agreement, dated as of November 24, 2008, by Heritage Bank, N.A. in favor of the parties listed on Exhibit A thereto
|
Exhibit 10.4 to the Current Report on Form 8-K of the Company filed March 6, 2012
|
||
|
10.9
|
|
Supplemental Warrant Agreement, dated as of February 29, 2012, by and between BankUnited, Inc. and Heritage Bank, N.A.
|
Exhibit 10.5 to the Current Report on Form 8-K of the Company filed March 6, 2012
|
||
|
10.10a
|
|
Amended and Restated Employment Agreement, dated February 2, 2016, by and between BankUnited, Inc. and John A. Kanas
|
Exhibit 10.10 to the Annual Report on Form 10-K of the Company filed February 26, 2016
|
||
|
10.10b
|
|
Amendment, dated May 6, 2016, to Amended and Restated Employment Agreement, dated February 2, 2016, by and between BankUnited, Inc. and John A. Kanas
|
Exhibit 10.1 to the Current Report on Form 8-K of the Company filed May 6, 2016
|
||
|
10.11a
|
|
Amended and Restated Employment Agreement, dated February 2, 2016, by and between BankUnited, Inc. and Rajinder P. Singh
|
Exhibit 10.11 to the Annual Report on Form 10-K of the Company filed February 26, 2016
|
||
|
10.11b
|
|
Amendment, dated May 6, 2016, to Amended and Restated Employment Agreement, dated February 2, 2016, by and between BankUnited, Inc. and Rajinder P. Singh
|
Exhibit 10.2 to the Current Report on Form 8-K of the Company filed May 6, 2016
|
||
|
10.11c
|
|
Second Amendment, dated January 4, 2017, to Amended and Restated Employment Agreement, dated February 2, 2016, as amended on May 6, 2016, by and between BankUnited, Inc. and Rajinder P. Singh
|
Exhibit 10.2 to the Current Report on Form 8-K/A of the Company filed January 4, 2017
|
||
|
10.12
|
|
Advisor and Restrictive Covenant Agreement, dated December 29, 2016, by and between BankUnited, Inc. and John A. Kanas
|
Exhibit 10.1 to the Current Report on Form 8-K of the Company filed January 3, 2017
|
||
|
10.13
|
|
Restricted Share Unit Agreement, dated December 29, 2016, by and between BankUnited, Inc. and Rajinder P. Singh
|
Exhibit 10.3 to the Current Report on Form 8-K of the Company filed January 3, 2017
|
||
91
|
Exhibit
Number
|
Description
|
Location
|
|||
|
12.1
|
|
Ratio of Earnings to Fixed Charges
|
Filed herewith
|
||
|
21.1
|
|
Subsidiaries of BankUnited, Inc.
|
Filed herewith
|
||
|
23.1
|
|
Consent of KPMG LLP
|
Filed herewith
|
||
|
31.1
|
|
Rule 13a-14(a) Certification of Chief Executive Officer of the Company in accordance with Section 302 of the Sarbanes-Oxley Act of 2002
|
Filed herewith
|
||
|
31.2
|
|
Rule 13a-14(a) Certification of Chief Financial Officer of the Company in accordance with Section 302 of the Sarbanes-Oxley Act of 2002
|
Filed herewith
|
||
|
32.1
|
|
Section 1350 Certification of Chief Executive Officer of the Company in accordance with Section 906 of the Sarbanes-Oxley Act of 2002
|
Filed herewith
|
||
|
32.2
|
|
Section 1350 Certification of Chief Financial Officer of the Company in accordance with Section 906 of the Sarbanes-Oxley Act of 2002
|
Filed herewith
|
||
|
101.INS
|
|
XBRL Instance Document
|
Filed herewith
|
||
|
101.SCH
|
|
XBRL Taxonomy Extension Schema
|
Filed herewith
|
||
|
101.CAL
|
|
XBRL Taxonomy Extension Calculation Linkbase
|
Filed herewith
|
||
|
101.DEF
|
|
XBRL Taxonomy Extension Definition Linkbase
|
Filed herewith
|
||
|
101.LAB
|
|
XBRL Taxonomy Extension Label Linkbase
|
Filed herewith
|
||
|
101.PRE
|
|
XBRL Taxonomy Extension Presentation Linkbase
|
Filed herewith
|
||
____________________________________
|
†
|
Schedules and similar attachments to the Purchase and Assumption Agreement have been omitted pursuant to Item 601(b)(2) of Regulation S-K. The registrant will furnish supplementally a copy of any omitted schedules or similar attachment to the SEC upon request.
|
92
SIGNATURES
Pursuant to the requirements of Section 13 or 15(d) of the Securities Exchange Act of 1934, the registrant has duly caused the report to be signed on its behalf by the undersigned, thereunto duly authorized.
|
|
BANKUNITED, INC.
|
||||||
|
Date:
|
February 27, 2017
|
By:
|
|
/s/ RAJINDER P. SINGH
|
|||
|
|
|
|
Name:
|
|
Rajinder P. Singh
|
||
|
|
|
|
Title:
|
|
President and Chief Executive Officer
|
||
Pursuant to the requirements of the Securities Exchange Act of 1934, this report has been signed by the following persons in the capacities and on the dates indicated.
|
Signature
|
|
Title
|
|
Date
|
|
/s/ RAJINDER P. SINGH
|
|
Chief Executive Officer (Principal Executive Officer)
|
|
February 27, 2017
|
|
Rajinder P. Singh
|
||||
|
/s/ LESLIE N. LUNAK
|
|
Chief Financial Officer (Principal Financial and Accounting Officer)
|
|
February 27, 2017
|
|
Leslie N. Lunak
|
||||
|
/s/ JOHN A. KANAS
|
|
Chairman of the Board of Directors
|
|
February 27, 2017
|
|
John A. Kanas
|
||||
|
/s/ TERE BLANCA
|
|
Director
|
|
February 27, 2017
|
|
Tere Blanca
|
||||
|
/s/ EUGENE F. DEMARK
|
|
Director
|
|
February 27, 2017
|
|
Eugene F. Demark
|
||||
|
/s/ MICHAEL J. DOWLING
|
|
Director
|
|
February 27, 2017
|
|
Michael J. Dowling
|
||||
|
/s/ DOUGLAS J. PAULS
|
|
Director
|
|
February 27, 2017
|
|
Douglas J. Pauls
|
||||
|
/s/ A. GAIL PRUDENTI
|
|
Director
|
|
February 27, 2017
|
|
A. Gail Prudenti
|
||||
|
/s/ SANJIV SOBTI
|
Director
|
|
February 27, 2017
|
|
|
Sanjiv Sobti
|
||||
|
/s/ A. ROBERT TOWBIN
|
|
Director
|
|
February 27, 2017
|
|
A. Robert Towbin
|
||||
|
/s/ LYNNE WINES
|
|
Director
|
|
February 27, 2017
|
|
Lynne Wines
|
||||
93
TABLE OF CONTENTS
Part IItem 1. BusinessItem 1A. Risk FactorsItem 1B. Unresolved Staff CommentsItem 2. PropertiesItem 3. Legal ProceedingsItem 4. Mine Safety DisclosuresPart II - Financial InformationItem 5. Market For Registrant's Common Equity, Related Stockholder Matters and Issuer Purchases Of Equity SecuritiesItem 6. Selected Consolidated Financial DataItem 7. Management's Discussion and Analysis Of Financial Condition and Results Of OperationsNote 1 To The Consolidated Financial Statements Contains A Further Discussion Of Our Significant Accounting PoliciesNote 1 To The Consolidated Financial Statements Describes The Methodology Used To Determine The AlllItem 7A. Quantitative and Qualitative Disclosures About Market RiskItem 8. Financial Statements and Supplementary DataNote 1 Basis Of Presentation and Summary Of Significant Accounting PoliciesNote 2 Earnings Per Common ShareNote 3 Acquisition ActivityNote 4 Investment SecuritiesNote 5 Loans and Allowance For Loan and Lease LossesNote 6 Fdic Indemnification AssetNote 7 Equipment Under Operating LeaseNote 8 Premises and Equipment and Lease CommitmentsNote 9 DepositsNote 10 BorrowingsNote 11 Income TaxesNote 12 Derivatives and Hedging ActivitiesNote 13 Stockholders EquityNote 14 Equity Based and Other Compensation PlansNote 15 Regulatory Requirements and RestrictionsNote 16 Fair Value MeasurementsNote 17 Commitments and ContingenciesNote 18 Condensed Financial Statements Of Bankunited, IncNote 19 Quarterly Financial Information (unaudited)Item 9. Changes in and Disagreements with Accountants on Accounting and Financial DisclosureItem 9A. Controls and ProceduresItem 9B. Other InformationPart IIIItem 10. Directors, Executive Officers and Corporate GovernanceItem 11. Executive CompensationItem 12. Security Ownership Of Certain Beneficial Owners and Management and Related Stockholder MattersItem 13. Certain Relationships and Related Transactions, and Director IndependenceItem 14. Principal Accountant Fees and ServicesPart IVItem 15. Exhibits, Financial Statement Schedules