BLACKBAUD INC
10-Ks and 10-Qs
|
|
|
|
|
|
|
|
|
|
|
|
|
|
|
|
|
|
|
|
|
|
|
|
|
|
|
|
|
|
|
|
|
|
|
|
|
|
|
|
|
|
|
|
|
|
|
|
|
|
|
|
|
|
|
|
UNITED STATES
SECURITIES AND EXCHANGE COMMISSION
Washington, D.C. 20549
FORM 10-K
|
þ
|
ANNUAL REPORT PURSUANT TO SECTION 13 OR 15(d) OF THE
SECURITIES EXCHANGE ACT OF 1934
|
|
For the Fiscal Year ended December 31, 2017
|
|
|
OR
|
|
|
¨
|
TRANSITION REPORT PURSUANT TO SECTION 13 OR 15(d) OF THE
SECURITIES EXCHANGE ACT OF 1934
|
|
For the transition period from ___________________ to ___________________.
|
|
Commission file number:
000-50600

|
||
Blackbaud, Inc.
(Exact name of registrant as specified in its charter)
|
Delaware
|
11-2617163
|
|
(State or other jurisdiction of incorporation or organization)
|
(I.R.S. Employer Identification No.)
|
2000 Daniel Island Drive
Charleston, South Carolina 29492
(Address of principal executive offices, including zip code)
(843) 216-6200
(Registrant's telephone number, including area code)
|
Securities Registered Pursuant to Section 12(b) of the Act:
|
|
|
Title of Each Class
|
Name of Each Exchange on which Registered
|
|
Common Stock, $0.001 Par Value
|
The Nasdaq Stock Market LLC
(Nasdaq Global Select Market)
|
|
Securities Registered Pursuant to Section 12(g) of the Act:
None
|
|
Indicate by check mark if the registrant is a well-known seasoned issuer, as defined in Rule 405 of the Securities Act. YES
þ
NO
¨
Indicate by check mark if the registrant is not required to file reports pursuant to Section 13 or Section 15(d) of the Act. YES
¨
NO
þ
Indicate by check mark whether the registrant (1) has filed all reports required to be filed by Section 13 or 15(d) of the Securities Exchange Act of 1934 during the preceding 12 months (or for such shorter period that the registrant was required to file such reports), and (2) has been subject to such filing requirements for the past 90 days. YES
þ
NO
¨
Indicate by check mark whether the registrant has submitted electronically and posted on its corporate Web site, if any, every Interactive Data File required to be submitted and posted pursuant to Rule 405 of Regulation S-T (Section 232.405 of this chapter) during the preceding 12 months (or for such shorter period that the registrant was required to submit and post such files). YES
þ
NO
¨
Indicate by check mark if disclosure of delinquent filers pursuant to Item 405 of Regulation S-K (Section 229.405 of this chapter) is not contained herein, and will not be contained, to the best of registrant's knowledge, in definitive proxy or information statements incorporated by reference in Part III of this Form 10-K or any amendment to this Form 10-K.
¨
Indicate by check mark whether the registrant is a large accelerated filer, an accelerated filer, a non-accelerated filer, a smaller reporting company, or an emerging growth company. See the definitions of “large accelerated filer,” “accelerated filer,” “smaller reporting company,” and "emerging growth company" in Rule 12b-2 of the Exchange Act.
|
Large accelerated filer
þ
|
Accelerated filer
|
¨
|
|
Non-accelerated filer
¨
(Do not check if a smaller reporting company)
|
Smaller reporting company
|
¨
|
|
Emerging growth company
|
¨
|
|
If an emerging growth company, indicate by check mark if the registrant has elected not to use the extended transition period for complying with any new or revised financial accounting standards provided pursuant to Section 13(a) of the Exchange Act.
¨
Indicate by check mark whether registrant is a shell company (as defined in Rule 12b-2 of the Exchange Act). YES
¨
NO
þ
The aggregate market value of the registrant's common stock held by non-affiliates of the registrant on
June 30, 2017
(based on the closing sale price of
$85.75
on that date) was approximately
$2,727,937,653
. Common stock held by each officer and director and by each person known to the registrant who owned 10% or more of the outstanding common stock have been excluded in that such persons may be deemed to be affiliates. This determination of affiliate status is not necessarily a conclusive determination for other purposes.
The number of shares of the registrant’s common stock outstanding as of
February 5, 2018
was
48,078,048
.
DOCUMENTS INCORPORATED BY REFERENCE
Portions of the registrant's definitive Proxy Statement for the
2018
Annual Meeting of Stockholders currently scheduled to be held
June 12, 2018
are incorporated by reference into Part III hereof. Such definitive Proxy Statement will be filed with the Securities and Exchange Commission no later than 120 days after the conclusion of the registrant's fiscal year ended
December 31, 2017
.
TABLE OF CONTENTS
|
|
|
|
|
|
||
|
Item 12.
|
Security ownership of certain beneficial owners and management and related stockholder matters
|
|
|
Item 13.
|
Certain relationships and related transactions, and director independence
|
|
|
Item 14.
|
Principal accountant fees and services
|
|
|
2017 Form 10-K
|
|
1
|

|
CAUTIONARY STATEMENT REGARDING FORWARD-LOOKING STATEMENTS
|
|
This Annual Report on Form 10-K, including the documents incorporated herein by reference, contains forward-looking statements that anticipate results based on our estimates, assumptions and plans that are subject to uncertainty. These "forward-looking statements" are made subject to the safe-harbor provisions of the Private Securities Litigation Reform Act of 1995, Section 27A of the Securities Act of 1933, as amended, and Section 21E of the Securities Exchange Act of 1934, as amended. Forward-looking statements consist of, among other things, trend analyses, statements regarding future events, future financial performance, our anticipated growth, the effect of general economic and market conditions, our business strategy and our plan to build and grow our business, our operating results, our ability to successfully integrate acquired businesses and technologies, the effect of foreign currency exchange rate and interest rate fluctuations on our financial results, the impact of expensing stock-based compensation, the sufficiency of our capital resources, our ability to meet our ongoing debt and obligations as they become due, the degree of our data security procedures, and potential litigation involving us, all of which are based on current expectations, estimates, and forecasts, and the beliefs and assumptions of our management. Words such as “believes,” “seeks,” “expects,” “may,” “might,” “should,” “intends,” “could,” “would,” “likely,” “will,” “targets,” “plans,” “anticipates,” “aims,” “projects,” “estimates,” or any variations of such words and similar expressions are also intended to identify such forward-looking statements. These forward-looking statements are subject to risks, uncertainties and assumptions that are difficult to predict. Accordingly, they should not be viewed as assurances of future performance, and actual results may differ materially and adversely from those expressed in any forward-looking statements.
Important factors that could cause actual results to differ materially from our expectations expressed in forward-looking statements include, but are not limited to, those summarized under “Item 1A. Risk factors” and elsewhere in this report and in our other SEC filings. Forward-looking statements represent our management's beliefs and assumptions only as of the date of this Annual Report on Form 10-K. We undertake no obligation to update or revise any forward-looking statements, or to update the reasons actual results could differ materially from those anticipated in any forward-looking statements, whether as a result of new information, future events or otherwise.
|
2
|
|
2017 Form 10-K
|
|
|
|
|
Description of Business
We are the world’s leading cloud software company powering social good. Serving the entire social good community—nonprofits, foundations, corporations, education institutions, healthcare institutions and individual change agents—Blackbaud connects and empowers organizations to increase their impact through software, services, expertise, and data intelligence. Blackbaud brings more than three decades of leadership to this sector: since originally incorporating in New York in 1981 and later reincorporating as a South Carolina corporation in 1991 and as a Delaware corporation in 2004, our tailored portfolio of software and services has grown to support the unique needs of vertical markets, with solutions for fundraising and constituent relationship management ("CRM"), marketing, advocacy, accounting, peer-to-peer fundraising, corporate social responsibility ("CSR"), school management, ticketing, grantmaking, financial management, payment processing and analytics. Our solutions are designed to meet the needs of virtually all types of organizations in the social good community, from major global institutions to local soup kitchens. At the end of
2017
, we had
over
40,000
customers located in over
50
countries. We are deeply proud to play a part in our customers’ successes in their missions to cure diseases, advance education, preserve and share arts and culture, help animals, support those in need and more.
Market Overview
The philanthropic industry is significant, and our addressable market is substantial and growing
In the U.S. alone, there were approximately 1.6 million nonprofit organizations registered with the Internal Revenue Service in 2016, which includes nonprofit organizations, education institutions and healthcare institutions. Worldwide, there are millions more organizations in this space. Corporations and foundations are also active participants in the social good community, and billions of individuals will donate funds, volunteer their time, advocate for a cause or otherwise engage with social good organizations. According to Giving USA, donations made to U.S. nonprofit organizations in 2016 were $390 billion, amounting to 2.1% of U.S. GDP, a 2.7% increase from 2015. The average annual rate of change in total giving dollars over the last 40 years was 6.7%.
Our estimated current total addressable market ("TAM") is $8.2 billion. This includes an expansion into new and near adjacencies in 2017 from our acquisitions of AcademicWorks, Inc. ("AcademicWorks") which supports scholarship management, within the education market, and Giving Limited ("JustGiving"), which supports personal crowdfunding capabilities for individuals.
Traditional methods of fundraising and organizational management are often costly and inefficient
Many nonprofits use manual methods or stand-alone software applications not specifically designed for fundraising and organizational management for institutions like theirs. Such methods are often costly and inefficient because of the difficulties in effectively collecting, sharing, and using donation-related information. Furthermore, general purpose software applications frequently have limited functionality and do not efficiently integrate multiple databases. Some nonprofit organizations have developed proprietary software, but doing so is expensive, requiring on-site technical personnel for development, implementation and maintenance.
|
2017 Form 10-K
|
|
3
|
The nonprofit industry faces particular operational challenges
Nonprofit organizations, educational institutions and healthcare institutions must efficiently:
|
•
|
Solicit funds and build relationships with major donors;
|
|
•
|
Garner small cash contributions from numerous contributors;
|
|
•
|
Manage and develop complex relationships with large numbers of constituents;
|
|
•
|
Advocate for policies and behaviors that advance their cause or institution;
|
|
•
|
Communicate their accomplishments and the importance of their mission online and offline;
|
|
•
|
Comply with complex accounting, tax and reporting requirements that differ from those for traditional businesses;
|
|
•
|
Solicit cash and in-kind contributions from businesses to help raise money or deliver products and services;
|
|
•
|
Provide a wide array of programs and services to individual constituents and beneficiaries; and
|
|
•
|
Improve the data collection and information sharing capabilities of their employees, volunteers and donors by creating and providing distributed access to centralized databases.
|
Because of these challenges, we believe nonprofits, healthcare institutions and educational institutions can benefit from software applications and services specifically designed to serve their particular needs and workflows to grow revenue, work effectively and accomplish their missions.
Corporations, grant making institutions and foundations also face unique challenges
Corporations, grant making institutions and foundations, face their own unique challenges, including the need to:
|
•
|
Quantify and improve the impact of their grants;
|
|
•
|
Cultivate better relationships with grantees;
|
|
•
|
Achieve better internal collaboration and alignment with board members, reviewers and other stakeholders;
|
|
•
|
Illustrate the impact of their corporate philanthropy efforts to the communities they serve;
|
|
•
|
Engage employees in meaningful volunteering, giving and other activities;
|
|
•
|
Ensure that their philanthropic efforts align with their business initiatives;
|
|
•
|
Manage all of a foundation's activities, including fundraising and accounting;
|
|
•
|
Expand the reach of their fundraising efforts; and
|
|
•
|
Cultivate new and existing donors.
|
Strategy
Our objective is to maintain and extend our position as a leading provider of cloud software and services for the global social good community, supporting their missions from fundraising to delivering outcomes. Our key strategies for achieving this objective are to:
Delight our customers
We intend to make our customers' experience with us effective, efficient and satisfying from their initial interest in our solutions and services through their decision to purchase, engage with customer support and utilize solution enhancements. We continue to focus on initiatives aimed at improving the consistency and quality of user experience across the offerings we provide to our customers. We continue to evolve the manner in which we package and sell our offerings to provide high quality and value combined with flexibility to meet the different needs of our existing and prospective customers. For example, we have increased the number of our cloud solutions sold under a subscription pricing model, which can make it easier for customers to purchase our solutions. In addition, we are continuing to integrate value-adding capabilities such as payment services, analytics and business intelligence into our suite of solutions to better address our customers' needs
|
4
|
|
2017 Form 10-K
|
with comprehensive offerings. We will continue to focus on providing the highest level of solution support, enhancing our existing solutions and developing new solutions and services designed to help our customers to be more effective and achieve their missions.
Execute on our Four-Point Growth Strategy
During 2017, we continued to execute on our four-point growth strategy targeted to drive an extended period of solution and service innovation, quality enhancement, increasing operating efficiency and financial performance:
|
1.
|
Integrated and Open Solutions in the Cloud
|
We will continue to transition our business to predominantly serve customers through a subscription-based cloud delivery model, enabling lower cost of entry, greater scalability and lower total cost of ownership to our customers. There is a concerted effort underway to optimize our portfolio of solutions and integrate powerful capabilities — such as built-in data, analytics, payment services and tailored user-specific experiences — to bring even greater value and performance to our customers.
During 2017, we introduced SKY AI™ and SKY Analytics™, the intelligence engine behind the growing number of insights integrated into Blackbaud cloud software solutions, powered by artificial intelligence including machine learning, cognitive technology, predictive analytics and other advanced technologies. With SKY AI and SKY Analytics, we are enabling data-driven decisions by pairing one of the industry's largest data sets with an advanced set of integrated AI capabilities, ultimately having greater impact on our customers and their missions. For example, Affluence Insight, a new donor management segmentation tool enables the identification of annual, mid-level and major gift prospects. It offers the ability to use AI-powered analytics to identify high-value donor prospects and predict a prospect's likelihood to give. These embedded intelligence capabilities are one outcome of Blackbaud's Intelligence for Good™ approach — combining AI, Analytics and big data and expertise to drive insight for our customers across our solution portfolio.
We also made several portfolio announcements during 2017, ranging from solution integrations, to new capabilities for existing solutions, to new solution introductions.
|
2.
|
Drive Sales Effectiveness
|
We are making investments to increase the effectiveness of our sales organization, with a focus on enabling our expanding sales teams with the talent, processes and tools to accelerate our revenue growth and improve effectiveness. In 2017, we created a new Senior Vice President of Global Sales position to lead sales effectiveness across the organization. We continued to make investments in our sales, marketing and customer success organizations and improved our market coverage by deploying these resources into key markets, while bifurcating sales to focus on either finding new customers or cultivating existing customers. In addition, we are continuing to optimize our go-to-market sales strategies such as offering solutions and services tailored to the needs of customers operating within vertical markets including K-12 private schools, foundations, higher education and healthcare institutions, among others. Our sales teams are now fully running and managed on a common sales operating model. This includes common procedures, training, key operating metrics, compensation plans and reporting, which is driving increased productivity.
|
3.
|
Expand TAM into Near Adjacencies with Acquisitions and Product Investments
|
We will continue to evaluate compelling opportunities to acquire companies and acquire or build technologies and services. We will be guided by our acquisition criteria for considering attractive assets that expand our total addressable market ("TAM"), provide entry into new and near adjacencies, accelerate our shift to the cloud, accelerate revenue growth, are accretive to margins and present synergistic opportunities.
In 2017, we launched Blackbaud Labs as a means to incubate new ideas and foster our strong culture of innovation and creativity, with the sole focus of bringing new capabilities to market organically. We also announced the promotion of our new Senior Vice President of Corporate Strategy and Business Development, who led the effort for many of our acquisitions, including AcademicWorks and JustGiving.
|
2017 Form 10-K
|
|
5
|
|
4.
|
Improve Operating Efficiency
|
We have largely completed the installations of best-in-breed back-office solutions that consolidate and standardize our business operations utilizing scalable tools and systems. Our focus is now shifting towards optimizing those systems, as well as operational excellence and quality initiatives focused on streamlining processes to gain efficiency and scalability. Our organizational model, which we have evolved over the last few years, is largely complete and allows us to gain efficiency and consistency in how we execute. We have centralized our operations, including marketing, sustained engineering, product management, finance, customer support, customer success and professional services, which allows us to better manage the entire customer experience.
During 2017, in an effort to improve operating efficiency and further our organizational objectives, we also initiated a plan to relocate some of our existing offices to highly modern and more collaborative workspaces with short-term financial commitments. These workspaces are also more centrally located for our employees and closer to our customers.
Attract Top Talent and Actively Engage Employee Base
Our customer's passion is our purpose, and we have incredible customers whose missions make the world a better place for all of us. Driven by this purpose, our employees come to work every day knowing they can make a real difference with our customers, and thus the world. Collaboration, innovation and high standards are core to our culture and help enable the great work we do. We strive to hire the best employees and provide a workplace where their talents and potential are realized. Our employees' engagement is a focus of every leader at Blackbaud, and we continually work to understand what matters and to make our workplace better. We believe people with a passion for purpose can join our team and have a unique career experience. Our leaders are committed to our employees' personal and career development and continually work to improve the training and tools provided to their teams.
Build our Reputation as an Industry Thought Leader
In our 36 years of experience in the philanthropic market, we have gained significant insight into the market and industry segments in which we operate. We produce a wide range of thought leadership materials, including blogs, monthly indices and white papers, which provide insights and guidance to the social good community. We also participate in a number of industry forums where we exchange views and engage with industry and governmental leaders. Our annual user conference,
bbcon
™, is used in part as a forum to offer thought leadership to our customers, as are other market specific user conferences such as our annual K-12 conference. We intend to expand these activities and further build our reputation as a thought leader within the industry. Additionally, the Blackbaud Institute for Philanthropic Impact brings together the best minds in philanthropy to develop and share leading-edge research and insight that accelerates the impact of the social good community. The research and reports the Blackbaud Institute produces serve to strengthen the social good community as a whole.
Operating Structure
Change in Reportable Segments
Prior to the fourth quarter of 2017, our three market groups, the General Markets Group ("GMG"), the Enterprise Markets Group ("EMG"), and the International Markets Group ("IMG"), represented our three operating and reportable segments. As is discussed above, we have centralized our business operations over the last few years to allow us to gain productivity, efficiency and scalability. Areas of our operations we have centralized, include, but are not limited to, marketing, finance, sales excellence, human resources, corporate IT, legal and contracting, real estate and facilities, research and development, customer support, customer success, product management, professional services and training services. With our organizational model now largely complete, we made changes to our internal reporting structure in the fourth quarter of 2017 to better support and assess the operations of our business going forward. As a result, commencing with the fourth quarter of 2017, a measure of profitability is no longer available at the market group level and our chief operating decision maker now uses consolidated financial information to make operating decisions, assess financial performance and allocate resources. Our chief operating decision maker is our chief executive officer ("CEO"). We assessed the resulting effect on our operating segments, reportable segments, as well as our reporting units for annual goodwill impairment testing, and determined that we now have one operating segment, one reportable segment and one reporting unit. We have restated prior period financial information contained in this Annual Report on Form 10-K to reflect this change.
|
6
|
|
2017 Form 10-K
|
Solutions and Services
We offer a full spectrum of cloud and on-premises solutions, as well as a resource network that empowers and connects organizations of all sizes. The Blackbaud portfolio is tailored to the unique needs of vertical markets, with solutions for fundraising and CRM, marketing, advocacy, peer-to-peer fundraising, corporate social responsibility, school management, ticketing, grantmaking, financial management, payment processing and analytics. We offer the social good community complete solutions to advance their missions with the market-leading CRM system and online engagement platforms, backed by our analytic services, which deliver insights powered by the world's most robust philanthropic data set. In most cases, the core of our solution portfolio centers around a CRM system, which seamlessly integrates with other applications to help our customers conduct activities vital to advancing their missions, such as managing finances, analyzing prospects and market data, effectively communicating with current and prospective supporters and promoting their cause online and offline. Our solutions can be combined with a range of consulting, training and professional services, maintenance and technical support, as well as payment processing, analytic and business intelligence services. In addition, we offer solutions that span the full spectrum of giving activities, including CSR programs, grant management, employee involvement, foundation management and other philanthropic activities.
Our specific solutions and services include:
Fundraising and Engagement
Raiser's Edge NXT®
is our flagship smart cloud fundraising and relationship management solution. Raiser's Edge NXT is the first and only cloud fundraising and relationship management solution that is all-inclusive, fully integrated with data, analytics, payment processing and tailored user-specific experiences. Leveraging Blackbaud SKY
®
, our modern, integrated and open cloud, it is, we believe, the most advanced technology available that enables nonprofits to operate more efficiently and raise more support for their missions.
Blackbaud CRM
™ is a comprehensive, customizable fundraising and relationship management solution. It is our lead offering for enterprise-level organizations seeking a powerful, yet adaptable solution for fundraising, marketing, and program management across the engagement lifecycle, specializing in supporting sophisticated major giving, membership and high volume direct marketing programs. Blackbaud CRM helps organizations build deeper and more personalized relationships with constituents, build their brand through online engagement and multichannel communication tools, and more effectively fundraise, leveraging campaign management, business intelligence and analytics. Blackbaud CRM can be sold as an integrated solution with our enterprise online solutions to enable multi-channel marketing, online engagement and event fundraising.
Luminate® CRM
is our Salesforce-based CRM offering for nonprofits and is sold as a single integrated solution with Luminate Online. Luminate CRM is built on the Salesforce.com cloud computing application platform and offers nonprofits an extensible suite via the Salesforce App Exchange for consolidating information and business processes into one system. The core components of Luminate CRM are campaign management, constituent relations, business intelligence and analytics. When combined with Luminate Online, it provides best-in-class functionality to help nonprofits with online fundraising, peer-to-peer event fundraising, payment processing, email marketing, advocacy and website management.
eTapestry®
is a simple, cloud fundraising and donor management solution built specifically for smaller, developing nonprofits in need of a cloud solution to support basic fundraising needs. It offers nonprofit organizations a cost-effective way to manage donors, process gifts, create reports, accept online donations and communicate with constituents. This technology provides a system that is simple to maintain, efficient to operate and is intuitively easy to learn without extensive training.
everydayhero®
is an innovative, cloud crowdfundraising solution designed to meet the peer-to-peer fundraising needs of nonprofits' supporters. It is a leading donor acquisition tool, and helps nonprofits connect with a younger, more online-focused generation of donors, a first step in helping nonprofits develop long-term relationships with their supporters. Founded in Australia, where it is a market leader, everydayhero is now sold throughout Europe and the U.S. With recent integrations with fitness applications such as Strava and MapMyFitness, everydayhero continues to enhance the fundraising landscape by providing millions across the globe the chance to easily integrate fitness and philanthropy.
JustGiving™
is one of the world's leading social platforms for giving. JustGiving develops world-class technology and innovative tools to connect people with the causes they care about. By making giving more simple, social and rewarding, JustGiving helps all causes, charities and people in need to reach more people and raise more money.
|
2017 Form 10-K
|
|
7
|
Luminate Online
™, delivered in the cloud, helps our customers better understand their online supporters, make the right ask at the right time, and raise money online. It includes tools to build online fundraising campaigns as part of an organization's existing website or as a stand-alone fundraising site. Donation forms, gift processing, and tools for communicating through web pages and email give our customers the essentials for building sustainable donor relationships. Customers can also purchase additional modules including TeamRaiser, a solution within events management that allows nonprofits' constituents to create personal or team fundraising web pages and send email donation appeals in support of events such as walks, runs and rides.
Blackbaud Online Express
™ is a simple, cloud fundraising and marketing tool designed for smaller nonprofit organizations using Raiser’s Edge. It provides nonprofits with easy-to-use features and functionality such as email marketing, donation forms, event registrations, and dashboard metrics.
Blackbaud NetCommunity
™ is an online marketing and communications tool that enables organizations that utilize Raiser's Edge software to build interactive websites and manage email marketing campaigns. With Blackbaud NetCommunity, organizations can, among other things, establish online communities for social networking among constituents and also provide a platform for online giving, membership purchases and event registration. Because Blackbaud NetCommunity requires a Raiser's Edge database to operate, it can only be sold with Raiser's Edge or to existing Raiser's Edge customers.
Financial Management
Financial Edge NXT®
is the first-of-its-kind cloud accounting solution for nonprofits that is intuitive, fully integrated, and built the way nonprofits need it on our modern Blackbaud SKY cloud architecture. Financial Edge NXT is advanced technology with powerful reporting tools to help accounting teams drive transparency, stewardship, and compliance while enabling them to seamlessly manage transactions and eliminate manual processes. It seamlessly integrates with Raiser's Edge NXT to simplify gift entry processing and relates information from both systems in an informative manner to eliminate redundant tasks and manual processes. Financial Edge NXT provides nonprofit organizations with the means to help manage fiscal and fiduciary responsibility, enabling them to be more accountable to their constituents.
Grant Management
GIFTS Online®
is a cloud solution built with core functions that provide comprehensive grant making capabilities, but with many additional capabilities and features, such as visual dashboards. It has a modern user interface, is user friendly, and can be highly personalized.
FIMS
™ is a fully-integrated foundation management system that helps community foundations, faith-based organizations and education and scholarship programs manage grants, finances and donors in one centralized, comprehensive system. It features an open, customizable framework that helps community foundations manage everything from donors, gifts and investments to grants, grantees, funds and financials.
Blackbaud Outcomes
™
empowers funders and nonprofits to collaborate around their intended program outcomes and work together to achieve impact. The cloud software helps users define and measure their outcomes, allowing them to track the effectiveness of their programs, make informed decisions, better understand the impact of their social investments, and tell an impact story using ROI-focused results and a common outcomes measurement language.
K-12 Schools and Higher Education
onMessage®
is a content management system that gives schools the flexibility to build and edit webpages, with easy access to content types including photos, videos, downloads, text and more. It allows users to share material and contribute content across an entire school community.
onRecord®
makes it easy for schools to manage schedules, transcripts and GPAs. A new Student Information System that works directly with onCampus (LMS), onRecord simplifies the process of sharing student data and academic records securely.
onCampus®
is a learning management system that makes it easy to manage, connect, and share information with students, parents, and an entire school community. Developed with direct input from our customers, onCampus gives teachers the tools to meet the demands of a modern private school.
|
8
|
|
2017 Form 10-K
|
onBoard®
is an enrollment management system that simplifies a school’s admissions process. onBoard helps admissions teams and prospective families manage and track their progress, from inquiry and application through acceptance and enrollment.
Smart Tuition®
benefits schools by giving administrators better access to financial data and payment services, and by giving parents more ways to remit tuition payments. The solution helps ease the burden for administrative staff by offering invoicing, payment processing, customer service, enhanced communication with parents and later payer follow-up services.
Smart Aid
™ offers schools the ability to accept online, customized applications for financial aid and to make better financial aid decisions with a proprietary Hobbies, Interest and Lifestyles ("HIL") profile. The HIL profile provides in-depth information on an applicant, delivering to the school a way to make more informed decisions on how they distribute financial aid awards.
AcademicWorks®
is a comprehensive, integrated scholarship management platform for higher education and K-12 institutions and foundations, allowing students to apply for all awards using one intuitive and streamlined application process and eliminating many time consuming administrative tasks. This leads to improved awarding, reporting, compliance, communication and stewardship.
Arts and Cultural
Altru®
is a cloud solution that helps arts and cultural organizations consolidate admissions, membership, fundraising, merchandise, marketing and more, giving users a comprehensive view of their supporters. By helping general admissions arts and cultural organizations gain a clear, 360-degree view of their organization, it enables them to operate more efficiently, engage and cultivate patrons and supporters, streamline external and internal communication efforts, and reduce IT costs. Altru contains tools for constituent and membership management, program sales, retail sales and ticketing, volunteer management, and events management. It also has sophisticated reporting functionality and tools to manage marketing, communications and fundraising.
Corporate Social Responsibility
AngelPoints®
is an integrated CSR solution that helps corporations mobilize the collective power of their employees to make a positive impact on their people, their company, and the world. AngelPoints contains modules that help companies manage employee volunteer and giving programs.
Analytics
Our analytics offerings provide comprehensive solutions for donor acquisition, prospect research, data enrichment and performance management, enabling nonprofits to define effective campaign strategies and maximize fundraising results. These services either integrate with or are already integrated into our software solutions to give our customers a comprehensive view of their supporters and the market and provide information essential to making well-informed operating decisions.
Blackbaud’s Intelligence for Good™ is a unique, comprehensive approach through which we combine artificial intelligence, analytics, big data, and expertise in cloud-based services and other channels. This powerful approach enables social good organizations to transform data into insights.
Our analytics offerings include subscription solutions and services within the following areas:
Donor Acquisition
- Our donor acquisition solutions leverage unique data assets to create acquisition mailing lists and predictive models that identify donor populations that meet the affinity, value and response criteria of our nonprofit customers. Nonprofit organizations use our prospect lists to solicit gifts and other support.
Prospect Research
- Our prospect research solutions include: custom data modeling that delivers critical information on a prospect's likelihood to make a gift to an organization; wealth screenings that deliver detailed wealth information and giving capacity data on prospects; and web-based prospect management software that combines public data with donor information from a nonprofit's database to build a complete view of prospects for targeting and securing gifts.
Data Enrichment
- Our data enrichment solutions enhance the quality of the data in our customers' databases. These solutions include: identifying outdated address files in the database and making corrections based on United States Postal
|
2017 Form 10-K
|
|
9
|
Service data, as well as appending data by using known fields in an organization's constituent records to search and identify key demographic and contact information.
Performance Management
- Our performance management solutions create relevant and insightful reports that benchmark performance and illustrate key industry trends based on performance attributes provided by our nonprofit customers. Nonprofit organizations use our performance and industry analysis reports to assess marketing and operational effectiveness and also to influence operational planning.
Payment Services
Our solutions provide our customers payment processing capabilities that enable their donors to make donations and purchase goods and services using numerous payment options, including credit card and automated clearing house (“ACH”) checking transactions, through secure online transactions. Blackbaud Merchant Services is a value-added service integrated with our solutions that makes credit card processing simple and secure. Customers are charged one rate for credit card transactions, making Blackbaud Merchant Services a competitive option. The service also provides customers with a payment card industry (“PCI”) compliant process and streamlined bank reconciliation. As discussed above, we also provide our K-12 private school customers with student tuition payment processing services.
Customer Success
Our Customer Success organization is responsible for managing the business and technical relationship with our customers. Their mission is to develop and foster relationships within all levels of the customer organization to build more demonstrated value in our solutions and services. Customer Success Managers ("CSMs") work to proactively communicate to drive overall satisfaction and retention of our customer's business. At every point of communication, they work to collect and analyze actionable information that can be used to make their experience positive and consistent. Their goal is to partner with customers to ensure that they are fully engaged and have an advocate within Blackbaud who works to meet their needs. CSMs bring industry knowledge and expertise to the customer relationship and strive to help our customers achieve positive growth and outcomes.
Customer Support & Maintenance
Most customers that purchase our solutions also enroll in one of our support and maintenance programs. For many of our cloud-based subscription solutions, customer support is automatically included as part of the solution. Customers enrolled in the programs enjoy fast, reliable customer support, receive regular software updates, stay up-to-date with regular communication and have unlimited, around-the-clock access to support resources, including our extensive knowledgebase and forums. Customers who enroll in upgraded support and maintenance plans receive enhanced benefits such as call support priority and dedicated support resources.
Professional and Managed Services
Our expert consultants provide data conversion, implementation and customization services for each of our software solutions. These services include:
|
•
|
System implementation;
|
|
•
|
Data conversion, business process analysis and application customization;
|
|
•
|
Database merging and enrichment, and secure credit card transaction processing;
|
|
•
|
Database production activities; and
|
|
•
|
Website design services.
|
In addition, we apply our industry knowledge and experience, combined with expert knowledge of our solutions, to evaluate an organization's needs and consult on how to improve a business process.
|
10
|
|
2017 Form 10-K
|
Training
We provide a variety of onsite, instructor-led online and on-demand training services to our customers relating to the use of our solutions and application of best practices. Our instructors have extensive training in the use of our solutions and present course material that is designed to include hands-on lab exercises, as well as course materials with examples and problems to solve.
Customers
At the end of
2017
, we had
over
40,000
customers including nonprofits, foundations, corporations, education institutions, healthcare organizations and other charitable giving entities. Our largest single customer accounted for approximately
1%
of our
2017
consolidated revenue.
Sales and Marketing
The majority of our solutions and related services are sold through our direct sales force. Our direct sales force is complemented by a team of account development representatives responsible for sales lead generation and qualification. These sales and marketing professionals are primarily located throughout the United States, the United Kingdom, Canada and Australia. As of
December 31, 2017
, we had
434
direct sales employees. We plan to continue expanding our direct sales force in the Americas, Europe and Australia as our operations grow internationally and market demand increases.
We generally begin a customer relationship with the sale of one of our cloud solutions, such as Raiser's Edge NXT, and then offer additional solutions and services to the customer as the organization's needs increase.
We conduct marketing programs to create brand recognition and market awareness for our solutions and services. Our marketing efforts include participation at tradeshows, technical conferences and technology seminars, publication of technical and educational articles in industry journals and preparation of competitive analyses. Our customers and strategic partners provide references and recommendations that we often feature in our advertising and promotional activities.
We believe relationships with third parties can enhance our sales and marketing efforts. We have and will continue to establish additional relationships with companies that provide services to the nonprofit industry, such as consultants, educators, publishers, financial service providers, complementary technology providers and data providers. These companies promote or complement our nonprofit solutions and provide us access to new customers.
Corporate Philanthropy and Volunteerism
Blackbaud operates under a fundamental belief that the world would be better if good took over. The company is an active participant in the ecosystem of good, working to drive positive change both through what we do as a business and how we serve individually. We offer an array of philanthropy programs aimed at engaging our employees as agents of good, including matching gifts, competitive grants that honor excellent examples of volunteerism, employee-led grants committees, skills-based volunteerism initiatives, as well as science, technology, engineering and mathematics focused community programs. Blackbaud attracts people who are committed to service, with 86% saying our focus on nonprofits was a driver in their decision to join the company, 85% actively serving as volunteers and 25% serving on a nonprofit board or committee.
Competition
The market for software and related services in the nonprofit sector is competitive and highly fragmented. For certain areas of the market, entry barriers are low, as general tools for small businesses can usually be configured to manage the most basic marketing, contact management, and accounting needs of nonprofits. However, once basic needs are met, programs unique to nonprofits like fundraising, gift and grant management, and peer-to-peer activism require highly specialized tools that are more complex to build or customize out of general business software. Moreover, because nonprofits rely heavily on relationships with and among their supporters, integration of these systems drives value beyond mere efficiency. Hence, we believe our experience, the full spectrum of our current solutions and our ability to deliver on future solutions makes us a strong competitor. We expect to continue to see new competitors as the market matures and nonprofit organizations rely more heavily on technology to manage emerging revenue channels and increasingly complex operations.
|
2017 Form 10-K
|
|
11
|
Our competition falls into four primary categories: (1) niche products that are tailored to specialized needs; (2) vertical-specific solutions; (3) general business software that can be configured to manage some nonprofit-specific processes; and (4) consumer-oriented fundraising platforms.
Niche products are usually developed as a solution for a single problem at an organization and are adopted by similar organizations to solve a specialized need. These are typically offered by vendors who may have deep industry expertise but may not have the resources to expand beyond a specialized area. We believe we compete against these solutions by offering a set of integrated solutions rather than a single point solution, which we believe improves the overall customer experience. In addition, our open platform allows integration to specialized applications so the opportunity for disruption from these competitors is minimized.
Vertical-specific solutions are offered by competitors seeking to meet the enterprise-wide needs of a specific sub-segment of nonprofits. Typically, these solutions are offered by vendors who may offer either a point solution or integrated suite of products used by a vertical. We believe we compete successfully against these competitors through a combination of our integrated suite of offerings within verticals where we compete, offering solutions with market leading robustness as well as the scale, reach, and reputation of our organization.
General business software vendors such as Salesforce.com and Oracle, compete with us in certain areas of our business. However, they generally do not have nonprofit specific focus and, therefore, do not offer or intend to offer nonprofit-specific versions. As these products are also not easily customized, the adoption of general business software is limited to nonprofits with very basic operations and simple needs. We believe our solutions compete successfully against general business software as a nonprofit’s needs grow more complex. There is a subset of general business software competitors who have introduced nonprofit-specific versions of their products. We believe that because these products were not originally designed to support the specific needs of nonprofits, they are not yet capable of meeting market needs without significant customization. As a result, we believe we are able to compete successfully to meet nonprofit-specific requirements, often integrating with general business platforms used for their more generalized operations.
Consumer-oriented fundraising platforms such as GoFundMe and Virgin Money Giving compete with our business where consumers raise funds directly. To drive adoption of their platforms, these vendors rely on a combination of direct-to-consumer marketing, marketing to nonprofits who in turn market to their supporters, and marketing to intermediate entities such as an event sponsor who will market to participants. We believe we compete well in this market through a combination of positive brand recognition among all three of these groups and the strength of our consumer-oriented tools relative to those of the competition.
Less frequently, we compete with providers of traditional, non-automated fundraising service providers, including parties providing services in support of traditional direct mail or email campaigns, special events fundraising, peer to peer, telemarketing and personal solicitations. We believe we compete successfully against these traditional fundraising service providers, primarily because our solutions and services are more automated, more robust, more tailored to the needs of nonprofit organization and more efficient.
Research and Development
We have made substantial investments in research and development and expect to continue to do so as a part of our strategy to introduce additional innovative solutions and services. As of
December 31, 2017
, we had
669
employees working on research and development. Our research and development expenses for
2017
,
2016
and
2015
were
$89.9 million
,
$89.9 million
and
$84.6 million
, respectively. In addition, we had cash outlays for qualifying capitalized software development costs during
2017
,
2016
and
2015
of
$28.3 million
,
$26.4 million
and
$15.5 million
, respectively. We plan to continue significantly investing in the innovation of our portfolio of solutions and services.
Technology and Architecture
Our cloud technology, SKY, combines the latest in cloud platform and infrastructure, leading edge development processes, and a modern and open micro service-oriented architecture, and is the foundation for all of our next generation solutions. The first of our solutions shipped were Raiser's Edge NXT and Financial Edge NXT, but virtually all new capabilities are being developed on top of the SKY platform. One component of SKY, SKY API
®
, gives customers, partners and other application developers access to industry-standard, open, REST-based APIs and a comprehensive set of resources that enable them to integrate with or extend functionality of our solutions. Additionally, SKY UX
®
, our open-sourced user
|
12
|
|
2017 Form 10-K
|
experience framework, increases the reach of our solutions by enabling developers to create interfaces that look and feel like a Blackbaud solution. In 2017, SKY UX continued to mature with the release of version 2 which added new functionality while also increasing the performance and available tooling and testing. You'll see SKY UX in Blackbaud's next generation solutions including Raiser’s Edge NXT, Financial Edge NXT, Blackbaud Outcomes, the next generation of Luminate Online, our K-12 On Suite, and many other capabilities that are lighting up across our product portfolio. The SKY architecture enables rapid releases, scalable and high-quality services, and speedier time to market.
Each of our Luminate solutions, including Luminate Online, Luminate CRM and TeamRaiser, are cloud-based applications that are open and extensible and employ a multi-tenant architecture requiring only a web browser for customer access. Luminate Online and TeamRaiser share a common codebase and database, and are built on the Java runtime environment. Luminate CRM is built on the SalesForce.com platform.
Regardless of solution choice, our development strategies are designed to be:
|
•
|
Flexible.
Our component-based architecture is programmable and easily extended by our customers without requiring modification of the source code, ensuring that the technology can be extended to accommodate changing demands of our customers and the market.
|
|
•
|
Adaptable.
The architecture of our applications allows us to easily add features and functionality or to integrate with third-party applications in order to adapt to our customers' needs or market demands.
|
|
•
|
Scalable.
We combine a scalable architecture with the performance, capacity and load balancing of industry-standard web servers and databases used by our customers to ensure that the applications can scale to the needs of larger organizations.
|
Intellectual Property and Other Proprietary Rights
To protect our intellectual property, we rely on a combination of patent, trademark, copyright and trade secret laws in various jurisdictions, as well as employee and third-party nondisclosure agreements and confidentiality procedures. We have numerous trademarks, including “Blackbaud,” “Raiser's Edge NXT” and “Luminate.” We have applied for additional trademarks. Depending upon the jurisdiction, trademarks are valid as long as they are in use and/or their registrations are properly maintained. We currently have three active patents on our technology and have a total of three pending patent applications.
Employees
As of
December 31, 2017
, we had
3,182
employees, none of whom are represented by unions or are covered by collective bargaining agreements. We are not involved in any material disputes with any of our employees, and we believe that relations with our employees are satisfactory.
Seasonality
For a discussion of seasonal variations in our business, see “Management’s discussion and analysis of financial conditions and results of operations — Seasonality” in Item 7 in this report.
Financial Information about Geographic Areas
For information about revenues by geographic region and long-lived assets by geographic region, please see
Note 17
and
Note 16
, respectively, to our consolidated financial statements in this report. For a description of risks associated with our non-U.S. operations, please see “Risk Factors - If we do not successfully address the risks inherent in the expansion of our international operations, our business could suffer” in Item 1A in this report.
Working Capital
For a discussion of our working capital practices, see “Management’s Discussion and Analysis of Financial Conditions and Results of Operations — Liquidity and Capital Resources” in Item 7 in this report.
|
2017 Form 10-K
|
|
13
|
Available Information
Our website address is
www.blackbaud.com
. We make available, free of charge through our website, our annual report on Form 10-K, quarterly reports on Form 10-Q, current reports on Form 8-K and all amendments to those reports pursuant to Section 13(a) or 15(d) of the Exchange Act as soon as reasonably practicable after we electronically file such material with, or furnish it to, the SEC, but other information on our website is not incorporated into this report. The SEC maintains an Internet site that contains these reports at
www.sec.gov
. The public may read and copy any materials we file with the SEC at the SEC’s Public Reference Room at 100 F Street, NE, Washington, DC 20549. The public may obtain information on the operation of the Public Reference Room by calling the SEC at 1-800-SEC-0330.
Executive Officers of the Registrant
The following table sets forth information concerning our executive officers as of
February 15, 2018
:
|
Name
|
Age
|
|
Title
|
||
|
Michael P. Gianoni
|
57
|
|
President and Chief Executive Officer
|
||
|
Anthony W. Boor
|
55
|
|
Executive Vice President and Chief Financial Officer
|
||
|
Kevin W. Mooney
|
59
|
|
Executive Vice President and President, General Markets Group
|
||
|
Brian E. Boruff
|
58
|
|
Executive Vice President and President, Enterprise Markets Group
|
||
|
Jon W. Olson
|
54
|
|
Senior Vice President and General Counsel
|
||
Michael P. Gianoni
joined us as President and Chief Executive Officer in January 2014. Prior to joining us, he served as Executive Vice President and Group President, Financial Institutions at Fiserv, Inc., a global technology provider serving the financial services industry, from January 2010 to December 2013. He joined Fiserv as President of its Investment Services division in December 2007. Mr. Gianoni was Executive Vice President and General Manager of CheckFree Investment Services, which provided investment management solutions to financial services organizations, from June 2006 until December 2007 when CheckFree was acquired by Fiserv. From May 1994 to November 2005, he served as Senior Vice President of DST Systems Inc., a global provider of technology-based service solutions. Mr. Gianoni is a member of the Board of Directors of Teradata Corporation, a publicly traded global big data analytics and marketing applications company. Mr. Gianoni has served on several nonprofit boards across several segments, including relief organizations, hospitals, and higher education. He currently is a board member of the International African American Museum. He holds an AS in electrical engineering from Waterbury State Technical College, a BS with a business concentration from Charter Oak State College, and an MBA and an honorary Doctorate from the University of New Haven.
Anthony W. Boor
joined us as Executive Vice President and Chief Financial Officer in November 2011 and served as our interim President and Chief Executive Officer from August 2013 to January 2014. Prior to joining us, he served as an executive with Brightpoint, Inc., a global provider of device lifecycle services to the wireless industry, beginning in 1999, most recently as its Executive Vice President, Chief Financial Officer and Treasurer. He also served as the interim President of Europe, Middle East and Africa during Brightpoint's significant restructuring of that region. Mr. Boor served as Director of Business Operations for Brightpoint North America from August 1998 to July 1999. Prior to joining Brightpoint, Mr. Boor was employed in various financial positions with Macmillan Computer Publishing, Inc., a Viacom owned book publishing company specializing in computer hardware and software related topics, Day Dream Publishing, Inc., a publishing company specializing in calendars, posters and time management materials, Ernst & Young LLP, an accounting firm, Expo New Mexico, a state-owned fair and expo grounds and live pari-mutual horse racing venue, KPMG LLP, an accounting firm, and Ernst & Whinney LLP, an accounting firm. He holds a BS in Accounting from New Mexico State University.
Kevin W. Mooney
has served as our Executive Vice President and President, General Markets Group since January 2010. He joined us in July 2008 as our Chief Commercial Officer. Before joining Blackbaud, Mr. Mooney was a senior executive at Travelport GDS from August 2007 to May 2008. As Chief Commercial Officer of Travelport GDS, one of the world's largest providers of information services and transaction processing to the travel industry, Mr. Mooney was responsible for global sales, marketing, training, service and support activities. Prior to that he was Chief Financial Officer for Worldspan from March 2005 until it was acquired by Travelport in August 2007. Mr. Mooney has also held key executive positions in the telecommunications industry and he served as a member of the Board of Directors of Level 3 Communications, Inc., a publicly traded global managed network services company, from October 2014 to November 2017. He holds a BS in Finance from Seton Hall University, and holds an MBA in Finance from Georgia State University.
|
14
|
|
2017 Form 10-K
|
Brian E. Boruff
joined us as our Executive Vice President and President, Enterprise Markets Group in May 2015. Prior to joining us, Mr. Boruff was the Global Vice President of Products, Platforms and Solutions at Infosys, a global provider of consulting technology and next-generation services, from June 2013 until April 2015. From May 2011 until June 2013 he was a Managing Director of Accenture, a global management consulting and technology services company. From January 2009 until May 2011, Mr. Boruff was the Global Vice President of Cloud Computing and Emerging Technologies at CSC, a global provider of information technology services and solutions. Prior to that, Mr. Boruff spent 15 years at Microsoft, a platform and productivity software company, from July 1993 until September 2008 where he held various domestic and international executive roles as well as client-facing software sales and services roles. He holds a BA in Computer Science and Biochemistry from the University of Tennessee.
Jon W. Olson
joined us as Senior Vice President and General Counsel in September 2008. Mr. Olson is responsible for Blackbaud's legal activities. Prior to joining us, he was an attorney with Alcatel-Lucent USA, the U.S. subsidiary of France-based Alcatel-Lucent (now owned by Nokia Corporation) that designs, develops, and builds wireline, wireless, and converged communications networks, from July 1997 to September 2008. Prior to joining Alcatel-Lucent, Mr. Olson was employed in legal positions with MCI, Inc., a global business and residential communications company, from September 1996 to July 1997, and Unisys Corporation, a global information technology company that solves complex IT challenges at the intersection of modern and mission critical, from July 1992 to September 1996. Mr. Olson is a member of the MUSC (Medical University of South Carolina) Hollings Cancer Center Citizens Advisory Council and is on the board of the Charleston Regional Alliance for The Arts. He holds a BS from Georgetown University, a JD from Dickinson School of Law and an MBA from Seton Hall University.
Our business operations face a number of risks. These risks should be read and considered with other information provided in this report.
Our failure to compete successfully could cause our revenue or market share to decline.
Our market is highly competitive and rapidly evolving and there are limited barriers to entry for many segments of this market.
The companies we compete with and other potential competitors may have greater financial, technical and marketing resources and generate greater revenue and better name recognition than we do. Also, a large diversified software enterprise could decide to enter the market directly, including through acquisitions. Competitive pressures can adversely impact our business by limiting the prices we can charge our customers and making the adoption and renewal of our solutions more difficult.
Our competitors might also establish or strengthen cooperative relationships with resellers and third-party consulting firms or other parties with whom we have had relationships, thereby limiting our ability to promote our solutions. These competitive pressures could cause our revenue and market share to decline.
Because a significant portion of our revenue is recognized ratably over the terms of the contract, downturns in sales may not be immediately reflected in our revenue.
We recognize our maintenance and subscriptions revenue monthly over the term of the customer agreement. Most of our maintenance arrangements are for a one-year term. Our subscription arrangements are typically either for a one-year term or a three-year term. As a result, much of the revenue we report in each quarter is attributable to arrangements entered into during previous quarters. Consequently, a decline in sales to new customers, renewals by existing customers or market acceptance of our solutions in any one quarter will not necessarily be fully reflected in the revenues in that quarter and could negatively affect our revenues and profitability in future quarters.
|
2017 Form 10-K
|
|
15
|
If our customers do not renew their annual maintenance and support arrangements or subscriptions for our solutions or if they do not renew them on terms that are favorable to us, our business might suffer.
Most of our maintenance arrangements are for a one-year term. Our subscription arrangements are typically either for a one-year term or a three-year term. As the end of the annual period approaches, we seek the renewal of the agreement with the customer. Historically, maintenance and subscriptions renewals have represented a significant portion of our total revenue. Because of this characteristic of our business, if our customers choose not to renew their maintenance and support arrangements or subscriptions with us on beneficial terms or at all, our business, operating results and financial condition could be harmed. Our customers' renewal rates may decline or fluctuate as a result of a number of factors, including their level of satisfaction with our solutions and services and their ability to continue their operations and spending levels.
Defects, delays or interruptions in our cloud-based solutions and hosting services could diminish demand for these services and subject us to substantial liability.
We currently utilize data center hosting facilities to provide cloud-based solutions to some of our subscription customers and hosting services to our on-premise license customers. Any damage to, or failure of, these data center systems generally could result in interruptions in service to our customers, notwithstanding any business continuity or disaster recovery agreements that may currently be in place at these facilities. Because our cloud-based solutions and hosting service offerings are complex, and we have incorporated a variety of new computer hardware and software systems at our data centers, our services might have errors or defects that users identify after they begin using our services. This could result in unanticipated downtime for our customers and harm to our reputation and business results. Internet-based services sometimes contain undetected errors when first introduced or when new versions or enhancements are released. We have from time to time found defects in our web-based services and new errors might again be detected in the future. In addition, our customers might use our Internet-based offerings in unanticipated ways that cause a disruption in service for other customers attempting to access their data.
Because our customers use these services for important aspects of their businesses, any defects, delays or disruptions in service or other performance problems with our services could hurt our reputation and damage our customers' businesses. If that occurs, customers could elect to cancel their service, delay or withhold payment to us, not purchase from us in the future or make claims against us, which could result in an increase in our provision for doubtful accounts, an increase in collection cycles for accounts receivable or the expense and risk of litigation. Any of these could harm our business and reputation.
Material defects or errors in the software we use to deliver our services could harm our reputation, result in significant costs to us and impair our ability to sell our services.
The software applications underlying our services are inherently complex and may contain material defects or errors, particularly when first introduced or when new versions or enhancements are released. We have from time to time found defects in our software, and new errors in our existing software may be detected in the future.
After the release of our software, defects or errors may also be identified from time to time by our internal team and our customers. The costs incurred in correcting any material defects or errors in our software may be substantial and could harm our operating results. Furthermore, our customers may use our software together with solutions from other companies. As a result, when problems occur, it might be difficult to identify the source of the problem. Even when our software does not cause these problems, the existence of these errors might cause us to incur significant costs, divert the attention of our technical personnel from our solution development efforts, impact our reputation and cause significant customer relations problems.
Our failure to obtain licenses for third-party technologies could harm our business.
We expect to continue licensing technologies from third parties, including applications used in our research and development activities, technologies which are integrated into our solutions and solutions that we resell. We believe that the loss of any third-party technologies currently integrated into our solutions could have a material adverse effect on our business. Our inability in the future to obtain any third-party licenses on commercially reasonable terms, or at all, could delay future solution development until equivalent technology can be identified, licensed or developed and integrated. This inability in turn could harm our business and operating results. Our use of third-party technologies exposes us to increased risks including, but not limited to, risks associated with the integration of new technology into our solutions, the diversion of
|
16
|
|
2017 Form 10-K
|
our resources from development of our own proprietary technology and our inability to generate revenue from licensed technology sufficient to offset associated acquisition and maintenance costs.
The market for software and services for nonprofit, charitable giving and educational organizations might not grow and these organizations might not continue to adopt our solutions and services.
Many nonprofit organizations have not traditionally used integrated and comprehensive software and services for their nonprofit-specific needs. We cannot be certain that the market for such solutions and services will continue to develop and grow or that nonprofit organizations will elect to adopt our solutions and services rather than continue to use traditional, less automated methods, attempt to develop software internally, rely upon legacy software systems, or use software solutions not specifically designed for the nonprofit market. Nonprofit organizations that have already invested substantial resources in other fundraising methods or other non-integrated software solutions might be reluctant to adopt our solutions and services to supplement or replace their existing systems or methods. In addition, the implementation of one or more of our core software solutions can involve significant time and capital commitments by our customers, which they may be unwilling or unable to make. If demand for and market acceptance of our solutions and services does not increase, we might not grow our business as we expect.
A large percentage of our customers are nonprofits, foundations, educational institutions and other members of the social good community that rely on charitable donations. If charitable giving, including online giving, does not continue to grow or declines, it could limit our current and potential customers' ability to use and pay for our solutions and services, which could adversely affect our operating results and financial condition.
If we are unable, or our customers believe we are unable, to detect and prevent unauthorized use of payment card information and safeguard confidential donor data, we could be subject to financial liability, our reputation could be harmed and customers may be reluctant to use our solutions and services.
The rules of payment card associations in which we participate require that we comply with Payment Card Industry Data Security Standard ("PCI DSS") in order to preserve security of payment card data. Under PCI DSS, we are required to adopt and implement internal controls over the use, storage and security of payment card data to help prevent card fraud. Conforming our solutions and services to PCI DSS or other payment services related regulations or requirements imposed by payment networks or our customers or payment processing partners is expensive and time-consuming. However, failure to comply may subject us to fines, penalties, damages and civil liability, may impair the security of payment card data in our possession, and may harm our reputation and our business prospects, including by limiting our ability to process transactions. Currently some of our solutions are not certified as compliant with the Payment Application Data Security Standard, which is a subset of the requirements for PCI DSS. In addition, currently some of our solutions are not fully compliant with PCI DSS.
If the security of our software is breached, we fail to securely collect, store and transmit customer information, or we fail to safeguard confidential donor data, we could be exposed to liability, litigation, penalties and remedial costs and our reputation and business could suffer.
Fundamental to the use of our solutions is the secure collection, storage and transmission of confidential donor and end user data and transaction data, including in our payment services. Despite the network and application security, internal control measures, and physical security procedures we employ to safeguard our systems, we may still be vulnerable to a security breach, intrusion, loss or theft of confidential donor data and transaction data, which may harm our business, reputation and future financial results.
Like many major businesses, we are, from time to time, a target of cyber-attacks and phishing schemes, and we expect these threats to continue. Because of the numerous and evolving cybersecurity threats, including advanced and persistent cyber-attacks, phishing and social engineering schemes, used to obtain unauthorized access, disable or degrade systems have become increasingly more complex and sophisticated and may be difficult to detect for periods of time, we may not anticipate these acts or respond adequately or timely. As these threats continue to evolve and increase, we may be required to devote significant additional resources in order to modify and enhance our security controls and to identify and remediate any security vulnerabilities.
A compromise of our data security that results in customer or donor personal or payment card data being obtained by unauthorized persons could adversely affect our reputation with our customers and others, as well as our operations,
|
2017 Form 10-K
|
|
17
|
results of operations, financial condition and liquidity and could result in litigation against us or the imposition of penalties. We might be required to expend significant capital and other resources to protect further against security breaches or to rectify problems caused by any security breach, including notification under data privacy laws and regulations and expenses related to remediating our information security systems. Even though we carry cyber-technology insurance policies that may provide insurance coverage under certain circumstances, we might suffer losses as a result of a security breach that exceed the coverage available under our insurance policies or for which we do not have coverage. A security breach and any efforts we make to address such breach could also result in a disruption of our operations, particularly our online sales operations.
Further, the existence of vulnerabilities, even if they do not result in a security breach, may harm client confidence and require substantial resources to address, and we may not be able to discover or remedy such security vulnerabilities before they are exploited, which may harm our business, reputation and future financial results.
Privacy and data protection concerns, including evolving domestic and international government regulation in the area of consumer data privacy or data protection, could adversely affect our business and operating results.
The effectiveness of our software solutions relies on our customers' storage and use of data concerning their customers, including financial, personally identifying or other sensitive data. Our customers' collection and use of this data for donor profiling, data analytics or communications outreach might raise privacy and data protection concerns and negatively impact the demand for our solutions and services. For example, our custom modeling and analytical services, including ProspectPoint, WealthPoint and donorCentrics, rely heavily on processing and using of data we gather from customers and various sources. Privacy and data protection laws could restrict or add regulatory and compliance processes to our ability to market and profit from those services.
Governments in some jurisdictions have enacted or are considering enacting consumer data privacy or data protection legislation, including laws and regulations applying to the solicitation, collection, transfer, processing and use of personal data. This legislation could reduce the demand for our software solutions if we fail to design or enhance our solutions to enable our customers to comply with the privacy and data protection measures required by the legislation. Moreover, we may be exposed to liability under existing or new consumer privacy or data protection legislation. For example, we must comply with applicable provisions of the Health Insurance Portability and Accountability Act of 1996 ("HIPAA"), and might be subject to similar provisions of the Gramm-Leach-Bliley Act and related regulations. Even technical violations of these laws may result in penalties that are assessed for each non-compliant transaction.
More recently, the European Union ("EU") General Data Protection Regulation (“GDPR”), which becomes effective in May 2018, extends the scope of the EU data protection law to all companies processing data of EU residents, regardless of the company’s location. The law requires companies to meet new requirements regarding the handling of personal data, including new rights such as the portability of personal data. Although we have an extensive program underway to address GDPR requirements, our efforts to comply with GDPR and other privacy and data protections laws may entail substantial expenses, may divert resources from other initiatives and projects, and could limit the services we are able to offer. Furthermore, actions and investigations by regulatory authorities related to data security incidents and privacy violations continue to increase, which could impact us through increased costs or restrictions on our business, and noncompliance could result in significant regulatory penalties and legal liability.
If our customers or we were found to be subject to and in violation of any privacy or data protection laws or regulations, our business may be materially and adversely impacted and we and/or our customers would likely have to change our business practices. In addition, these laws and regulations could impose significant costs on our customers and us and make it more difficult for donors to make online donations.
We are in the information technology business, and our solutions and services store, retrieve, transfer, manipulate and manage our customers’ information and data. The effectiveness of our software solutions relies on our customers’ storage and use of data concerning their donors, including financial, personally identifying and other sensitive data and our business uses similar systems that require us to store and use data with respect to our customers and personnel. Our collection and our customers’ collection and use of this data might raise privacy and data protection concerns and negatively impact our business or the demand for our solutions and services. If a breach of data security were to occur, or other violation of privacy or data protection laws and regulations were to be alleged, our business may be materially and adversely impacted and solutions may be perceived as less desirable, which would negatively affect our business and operating results.
|
18
|
|
2017 Form 10-K
|
If we fail to respond to technological changes and successfully introduce new and improved solutions, our competitive position may be harmed and our business may suffer.
The introduction of solutions encompassing new technologies can render existing solutions obsolete and unmarketable. As a result, our future success will depend, in part, upon our ability to continue to enhance existing solutions and develop and introduce in a timely manner or acquire new solutions that keep pace with technological developments, satisfy increasingly sophisticated customer requirements and achieve market acceptance. If we are unable to develop or acquire on a timely and cost-effective basis new software solutions or enhancements to existing solutions or if such new solutions or enhancements do not achieve market acceptance, our business, results of operations and financial condition may be materially adversely affected.
Because competition for highly qualified personnel is intense, we might not be able to attract and retain key personnel needed to support our planned growth.
To meet our objectives successfully, we must attract and retain highly qualified personnel with specialized skill sets. If we are unable to attract suitably qualified management, there could be a material adverse impact on our business.
Further, in the past, we have used equity incentive programs as part of our overall employee compensation agreements to both attract and retain personnel. A decline in our stock price could negatively impact the value of these equity incentive and related compensation programs as retention and recruiting tools. We may need to create new or additional equity incentive programs and/or compensation packages to remain competitive, which could be dilutive to our existing stockholders and/or adversely affect our results of operations.
If we do not successfully address the risks inherent in the expansion of our international operations, our business could suffer.
We currently have non-U.S. operations primarily in Canada, the United Kingdom and Australia, and we intend to expand further into international markets. Expansion of our international operations will require a significant amount of attention from our management and substantial financial resources and might require us to add qualified management in these markets. Our direct sales model requires us to attract, retain and manage qualified sales personnel capable of selling into markets outside the United States. In some cases, our costs of sales might increase if our customers require us to sell through local distributors.
If we are unable to grow our international operations in a cost-effective and timely manner, our business and operating results could be harmed. Doing business internationally involves additional risks that could harm our operating results.
We expect that an increasing portion of our international revenues will be denominated in foreign currencies, subjecting us to fluctuations in foreign currency exchange rates. If we expand our international operations, exposures to gains and losses on foreign currency transactions may increase.
Unfavorable media coverage related to peer-to-peer fundraising campaigns on our social platforms could negatively impact our business.
Our online social giving platforms receive a high degree of media coverage for particularly news-worthy or controversial fundraising campaigns, as well as for our fee-based business model. Although our terms of service provide express limitations on the platforms' user-initiated fundraising campaigns and reserve our right to remove content that violates our terms of service, it may not always be possible to remove such content prior to it receiving attention in the media. Negative publicity related to our online social giving platforms could have an adverse effect on the size, engagement, and loyalty of our user base and could result in decreased revenue, which could adversely affect our business and financial results.
Acquisitions could prove difficult to integrate, disrupt our business, dilute stockholder value and strain our resources.
As part of our business strategy, we have made acquisitions in the past and continue to evaluate opportunities to acquire companies, technologies and/or services. The successful integration of acquired companies requires, among other things, coordination of various departments, including solution development, engineering, sales and marketing and finance, as well as integration in our system of internal controls. Acquisitions and investments involve numerous risks.
|
2017 Form 10-K
|
|
19
|
Acquisitions also frequently result in recording of goodwill and other intangible assets, which are subject to potential impairments in the future that could harm our operating results. In addition, if we finance acquisitions by issuing equity securities or securities convertible into equity securities, our existing stockholders would be diluted which, in turn, could affect the market price of our stock. Moreover, we could finance any acquisition with debt, resulting in higher leverage and interest costs. As a result, if we fail to evaluate and execute acquisitions or investments properly, we might not achieve the anticipated benefits of any such acquisition and we may incur costs in excess of what we anticipate. Furthermore, if we incur additional debt to fund acquisitions and are unable to service our debt obligation we may have a greater risk of default under our credit facility. In addition, acquisitions may cause a disruption to our ongoing business, including diversion of resources and management's attention from our existing business and a greater than expected investment of resources or operating expenses.
The success of our acquisitions will depend in part on our ability to retain their engineering, sales, marketing, development and other personnel. It is possible that these employees might decide to terminate their employment. If key employees terminate their employment, the sales, marketing or development activities of acquired companies might be adversely affected, our management's attention might be diverted from successfully integrating the acquired operations to hiring suitable replacements and, as a result, our business might suffer.
We significantly increased our leverage in connection with acquisitions.
We incurred a substantial amount of indebtedness in connection with recent acquisitions. As a result of this indebtedness, our interest payment obligations have increased. The degree to which we are leveraged could have adverse effects on our business, including the following:
|
•
|
Requiring us to dedicate a substantial portion of our cash flow from operations to payments on our indebtedness, thereby reducing the availability of our cash flow to fund working capital, capital expenditures, acquisitions, dividends and other general corporate purposes;
|
|
•
|
Limiting our flexibility in planning for, or reacting to, changes in our business and the industries in which we operate;
|
|
•
|
Restricting us from making additional strategic acquisitions or exploiting business opportunities;
|
|
•
|
Placing us at a competitive disadvantage compared to our competitors that have less debt;
|
|
•
|
Limiting our ability to borrow additional funds; and
|
|
•
|
Decreasing our ability to compete effectively or operate successfully under adverse economic and industry conditions.
|
If we incur additional debt, these risks may intensify. Our ability to meet our debt service obligations will depend upon our future performance, which will be subject to the financial, business and other factors affecting our operations, many of which are beyond our control.
Our balance sheet includes significant amounts of goodwill and intangible assets. The impairment of a significant portion of these assets could negatively affect our operating results.
As of
December 31, 2017
, we had
$530.2 million
and
$314.7 million
of goodwill and intangible assets, respectively. On at least an annual basis, we assess whether there have been impairments in the carrying value of goodwill and intangible assets. If the carrying value of an asset is determined to be impaired, then it is written down to fair value by a non-cash charge to operating earnings. Changes in circumstances that could indicate that the carrying value of goodwill or intangible assets may not be recoverable include declines in our stock price, market capitalization, cash flows and slower growth rates in our industry. We cannot accurately predict the likelihood or potential amount and timing of any impairment of goodwill or other intangible assets. An impairment of a significant portion of goodwill or intangible assets could materially and negatively affect our results of operations and financial condition.
|
20
|
|
2017 Form 10-K
|
Restrictions in our credit facility may limit our activities, including dividend payments, share repurchases and acquisitions.
Our credit facility contains restrictions, including covenants limiting our ability to incur additional debt, grant liens, make acquisitions and other investments, prepay specified debt, consolidate, merge or acquire other businesses, sell assets, pay dividends and other distributions, repurchase stock and enter into transactions with affiliates. There can be no assurance that we will be able to remain in compliance with the covenants to which we are subject in the future and, if we fail to do so, that we will be able to obtain waivers from our lenders or amend the covenants.
In the event of a default under our credit facility, we could be required to immediately repay all outstanding borrowings, which we might not be able to do. In addition, certain of our material domestic subsidiaries will be required to guarantee amounts borrowed under the credit facility, and we have pledged the shares of certain of our subsidiaries as collateral for our obligations under the credit facility. Any such default could have a material adverse effect on our ability to operate, including allowing lenders under the credit facility to enforce guarantees of our subsidiaries, if any, or exercise their rights with respect to the shares pledged as collateral.
We have recorded significant deferred tax assets, and we might never realize their full value, which would result in a charge against our earnings.
As of
December 31, 2017
, we had deferred tax assets of
$47.0 million
. Realization of our deferred tax assets is dependent upon our generating sufficient taxable income in future years to realize the tax benefit from those assets. Deferred tax assets are reviewed at least annually for realizability. A charge against our earnings would result if, based on the available evidence, it is more likely than not that some portion of the deferred tax asset will not be realized. This could be caused by, among other things, deterioration in performance, loss of key contracts, adverse market conditions, adverse changes in applicable laws or regulations, including changes that restrict the activities of or affect the solutions sold by our business and a variety of other factors. If a deferred tax asset was determined to be not realizable in a future period, the charge to earnings would be recognized as an expense in our results of operations in the period the determination is made. Additionally, if we are unable to utilize our deferred tax assets, our cash flow available to fund operations could be adversely affected.
Depending on future circumstances, it is possible that we might never realize the full value of our deferred tax assets. Any future determination of impairment of a significant portion of our deferred tax assets would have an adverse effect on our financial condition and results of operations.
Claims that we or our technologies infringe upon the intellectual property or other proprietary rights of a third party may require us to incur significant costs, enter into royalty or licensing agreements or develop or license substitute technology.
We may be subject to claims that our technologies in our solutions and services infringe upon the intellectual property or other proprietary rights of a third party. In addition, the vendors providing us with technology that we use in our own technology could become subject to similar infringement claims. Although we believe that our solutions and services do not infringe any intellectual property or other proprietary rights, we cannot be certain that our solutions and services do not, or that they will not in the future, infringe intellectual property or other proprietary rights held by others. Any claims of infringement could cause us to incur substantial costs defending against the claim, even if the claim is without merit, and could distract our management from our business. Moreover, any settlement or adverse judgment resulting from the claim could require us to pay substantial amounts, or obtain a license to continue to use the solutions and services that are the subject of the claim, and/or otherwise restrict or prohibit our use of the technology. There can be no assurance that we would be able to obtain a license on commercially reasonable terms from the third party asserting any particular claim, or that we would be able to successfully develop alternative technology on a timely basis, or that we would be able to obtain a license from another provider of suitable alternative technology to permit us to continue offering, and our customers to continue using, the solutions and services. In addition, we generally provide in our customer arrangements for certain solutions and services that we will indemnify our customers against third-party infringement claims relating to technology we provide to those customers, which could obligate us to pay damages if the solutions and services were found to be infringing. Infringement claims asserted against us, our vendors or our customers may have a material adverse effect on our business, prospects, financial condition and results of operations.
|
2017 Form 10-K
|
|
21
|
Our solutions utilize open source software, which may subject us to litigation, require us to re-engineer our solutions, or otherwise divert resources away from our development efforts.
We use open source software in connection with certain of our solutions. Such open source software is generally licensed by its authors or other third parties under open source licenses, including, for example, the GNU General Public License, the GNU Lesser General Public License, “Apache-style” licenses, “BSD-style” licenses and other open source licenses. There is little legal precedent governing the interpretation of many of the terms of some of these licenses and, therefore, the potential impact of these terms on our business is currently unable to be determined and may result in unanticipated obligations regarding our solutions and technologies. From time to time, companies that incorporate open source software into their products have faced claims challenging the ownership of open source software and/or compliance with open source license terms. Therefore, we could be subject to litigation by parties claiming ownership of open source software or noncompliance with open source licensing terms. Some open source software licenses require users who distribute open source software as part of their own software to publicly disclose all or part of the source code to such software and/or make available any derivative works of the open source code on unfavorable terms or at no cost. While we monitor our use of open source software and try to ensure that none is used in a manner that would require us to disclose the source code or that would otherwise breach the terms of an open source agreement, such use could inadvertently occur and we may be required to release proprietary source code, pay damages for breach of contract, re-engineer our applications, discontinue sales in the event re-engineering cannot be accomplished on a timely basis, or take other remedial action that may divert resources away from our development efforts, any of which could adversely affect our business.
We rely upon trademark, copyright, patent and trade secret laws to protect our proprietary rights, which might not provide us with adequate protection.
Our success and ability to compete depends to a significant degree upon the protection of our proprietary technology rights. We might not be successful in protecting our proprietary technology and our proprietary rights might not provide us with a meaningful competitive advantage. To protect our core proprietary technology, we rely on a combination of patent, trademark, copyright and trade secret laws, as well as nondisclosure agreements, each of which affords only limited protection.
Increasing and evolving domestic and international government regulation could affect our business.
Pending and enacted legislation at the state and federal levels and internationally, including those related to taxation, fundraising activities and payment processing, may also restrict further our information gathering and disclosure practices, for example, by requiring us to comply with extensive and costly registration, reporting or disclosure requirements. Any substantial increase in government regulation affecting our business, or any failure to comply with existing regulations, could require substantial investments to achieve compliance, which could adversely affect our operating results and financial condition.
Our operations might be affected by the occurrence of a natural disaster or other catastrophic event.
We depend on our principal executive offices and other facilities for the continued operation of our business. Although we have contingency plans in effect for natural disasters or other catastrophic events, these events, including terrorist attacks, computer hacker attacks and natural disasters such as hurricanes and earthquakes, could disrupt one or more of these facilities and adversely affect our operations. Our principal executive offices are located in a coastal region that has experienced hurricanes in the past. Even though we carry business interruption insurance policies and typically have provisions in our commercial contracts that protect us in certain events, we might suffer losses as a result of business interruptions that exceed the coverage available under our insurance policies or for which we do not have coverage. Any natural disaster or catastrophic event affecting us could have a significant negative impact on our operations.
None.
|
22
|
|
2017 Form 10-K
|
We lease our headquarters in Charleston, South Carolina, which consists of approximately 218,000 square feet. The lease on our Charleston headquarters expires in October 2023, and we have the option for two 5-year renewal periods. Please also see discussion about the construction of our new headquarters facility in
Note 11
to our consolidated financial statements in this report.
We also lease or have purchased the right to use additional office space in Austin, Texas; Bedford, New Hampshire; Charleston, South Carolina; Edina, Minnesota; Glasgow, Scotland; Indianapolis, Indiana; London, England; Middlesex, New Jersey; and Sydney, Australia, among other locations. We believe that our properties are in good operating condition and adequately serve our current business operations. We also anticipate that suitable additional or alternative space, including those under lease options, will be available at commercially reasonable terms for future expansion.
From time to time we may become involved in litigation relating to claims arising from our ordinary course of business. We do not believe that there are any claims or actions pending or threatened against us, the ultimate disposition of which would have a material adverse effect on us.
Not applicable.
|
2017 Form 10-K
|
|
23
|
|
|
|
|
Our common stock is trading on the Nasdaq Stock Market LLC (“Nasdaq”) under the symbol “BLKB.” The following table sets forth, for the quarterly reporting periods indicated, the high and low market prices for shares of our common stock, as reported by Nasdaq, and dividend per share information.
|
Common Stock
Market Prices
|
|||||||||
|
High
|
|
Low
|
|
Dividends Declared
|
|
||||
|
Fiscal year ended December 31, 2017
|
|||||||||
|
Fourth quarter
|
$
|
103.79
|
|
$
|
87.51
|
|
$
|
0.12
|
|
|
Third quarter
|
92.82
|
|
82.85
|
|
0.12
|
|
|||
|
Second quarter
|
90.36
|
|
75.92
|
|
0.12
|
|
|||
|
First quarter
|
77.15
|
|
62.06
|
|
0.12
|
|
|||
|
Fiscal year ended December 31, 2016
|
|||||||||
|
Fourth quarter
|
$
|
67.42
|
|
$
|
58.29
|
|
$
|
0.12
|
|
|
Third quarter
|
71.09
|
|
64.32
|
|
0.12
|
|
|||
|
Second quarter
|
68.40
|
|
58.36
|
|
0.12
|
|
|||
|
First quarter
|
65.33
|
|
50.97
|
|
0.12
|
|
|||
As of
February 5, 2018
, there were approximately
117
stockholders of record of our common stock. Because many of our shares of common stock are held by brokers and other institutions on behalf of stockholders, this number is not representative of the total number of stockholders represented by these stockholders of record. On
February 5, 2018
, the closing price of our common stock was
$90.21
.
|
24
|
|
2017 Form 10-K
|
Stock Performance Graph
The following performance graph shall not be deemed to be “soliciting material” or “filed” or incorporated by reference in future filings with the SEC, or subject to the liabilities of Section 18 of the Exchange Act except as shall be expressly set forth by specific reference in such filing. The performance graph compares the performance of our common stock to the Nasdaq Composite Index and the Nasdaq Computer and Data Processing Index. The graph covers the most recent five-year period ending
December 31, 2017
. The graph assumes that the value of the investment in our common stock and each index was $100.00 at
December 31, 2012
, and that all dividends are reinvested.
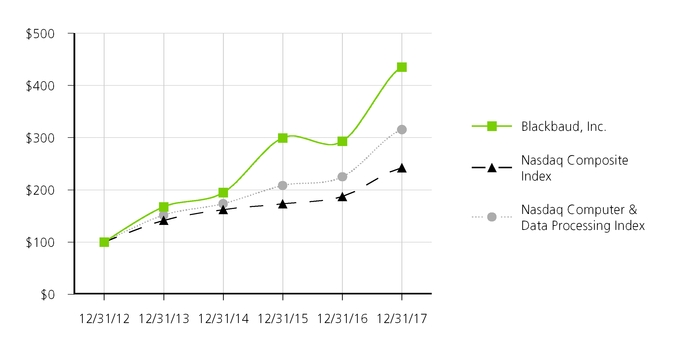
|
December 31,
|
2012
|
|
2013
|
|
2014
|
|
2015
|
|
2016
|
|
2017
|
|
|||||||||||
|
Blackbaud, Inc.
|
$
|
100.00
|
|
$
|
167.43
|
|
$
|
194.95
|
|
$
|
299.48
|
|
$
|
293.26
|
|
$
|
435.45
|
|
|||||
|
Nasdaq Composite Index
|
100.00
|
|
141.63
|
|
162.09
|
|
173.33
|
|
187.19
|
|
242.29
|
|
|||||||||||
|
Nasdaq Computer & Data Processing Index
|
100.00
|
|
151.54
|
|
173.50
|
|
208.25
|
|
224.83
|
|
315.58
|
|
|||||||||||
|
2017 Form 10-K
|
|
25
|
Common Stock Acquisitions and Repurchases
The following table provides information about shares of common stock acquired or repurchased during the three months ended
December 31, 2017
. All of these acquisitions were of common stock withheld by us to satisfy minimum tax obligations of employees due upon exercise of stock appreciation rights and vesting of restricted stock awards and units. The level of acquisition activity varies from period to period based upon the timing of grants and vesting as well as employee exercise decisions.
|
Period
|
Total
number
of shares
purchased
|
|
Average
price
paid
per
share
|
|
Total number
of shares
purchased as
publicly
announced
plans or
programs
(1)
|
|
Approximate
dollar value
of shares
that may yet
be purchased
under the
plans or programs
(in thousands)
|
|
||||||
|
Beginning balance, October 1, 2017
|
|
|
$
|
50,000
|
|
|||||||||
|
October 1, 2017 through October 31, 2017
|
16,805
|
|
$
|
94.34
|
|
—
|
|
50,000
|
|
|||||
|
November 1, 2017 through November 30, 2017
|
32,867
|
|
99.91
|
|
—
|
|
50,000
|
|
||||||
|
December 1, 2017 through December 31, 2017
|
—
|
|
—
|
|
—
|
|
50,000
|
|
||||||
|
Total
|
49,672
|
|
$
|
98.03
|
|
—
|
|
$
|
50,000
|
|
||||
|
(1)
|
In
August 2010
, our Board of Directors approved a stock repurchase program that authorized us to purchase up to
$50.0 million
of our outstanding shares of common stock. We have not made any repurchases under the program to date, and the program does not have an expiration date.
|
Dividend Policy
Our Board of Directors has adopted a dividend policy which reflects an intention to distribute to our stockholders a portion of the cash generated by our business that exceeds our operating needs and capital expenditures as regular quarterly dividends. This policy reflects our judgment that we can provide greater value to our stockholders by distributing to them a portion of the cash generated by our business.
In accordance with this dividend policy, we paid quarterly dividends at an annual rate of
$0.48
per share in
2017
and
2016
, resulting in aggregate dividend payments to stockholders of
$23.1 million
and
$22.8 million
in
2017
and
2016
, respectively. In February
2018
, our Board of Directors approved an annual dividend rate of
$0.48
per share for
2018
and we declared a first quarter dividend of
$0.12
per share payable on
March 15, 2018
, to stockholders of record on
February 28, 2018
.
Dividends on our common stock will not be cumulative. Consequently, if dividends on our common stock are not declared and/or paid at the targeted level, our stockholders will not be entitled to receive such payments in the future. We are not obligated to pay dividends, and as described more fully below, our stockholders might not receive any dividends as a result of the following factors:
|
•
|
Our credit facility limits the amount of dividends we are permitted to pay;
|
|
•
|
Our Board of Directors could decide to reduce dividends or not to pay dividends at all, at any time and for any reason;
|
|
•
|
The amount of dividends distributed is subject to state law restrictions (as discussed below); and
|
|
•
|
We might not have enough cash to pay dividends due to changes to our operating earnings, working capital requirements and anticipated cash needs.
|
|
26
|
|
2017 Form 10-K
|
Assumptions and Considerations
We estimate that the cash necessary to fund dividends on our common stock for
2018
at an annual rate of
$0.48
per share is approximately
$23.5 million
(assuming
49.0 million
shares of common stock are outstanding, net of treasury stock).
We have a stock repurchase program that authorizes us to purchase up to
$50.0 million
of our outstanding shares of common stock. The program does not have an expiration date. The shares could be purchased in a self-tender for our stock, from time to time on the open market or in privately negotiated transactions depending upon market conditions and other factors, all in accordance with the requirements of applicable law. Any open market purchases under the repurchase program will be made in compliance with Rule 10b-18 of the Securities Exchange Act of 1934 and all other applicable securities regulations. We might not purchase any shares of common stock and our Board of Directors may decide, in its absolute discretion, at any time and for any reason, to cancel the stock repurchase program.
We believe that our cash on hand and the cash flows we expect to generate from operations will be sufficient to meet our liquidity requirements through
2018
, including dividends and purchases under our stock repurchase program. See “Management’s Discussion and Analysis of Financial Conditions and Results of Operations — Liquidity and Capital Resources” in Item 7 in this report.
If our assumptions as to operating expenses, working capital requirements and capital expenditures are too low or if unexpected cash needs arise that we are not able to fund with cash on hand or with borrowings under our credit facility, we would need to either reduce or eliminate dividends. If we were to use working capital or permanent borrowings to fund dividends, we would have less cash available for future dividends and other purposes, which could negatively impact our stock price, financial condition, results of operations and ability to maintain or expand our business.
We have estimated our dividend only for
2018
, and we cannot assure our stockholders that during or following
2018
we will pay dividends at the estimated levels, or at all except with regard to dividends previously declared by the Board of Directors but not yet paid. We are not required to pay dividends and our Board of Directors may modify or revoke our dividend policy at any time. Dividend payments are within the absolute discretion of our Board of Directors and will be dependent upon many factors and future developments that could differ materially from our current expectations. Over time, our capital and other cash needs, including unexpected cash needs, will invariably change and remain subject to uncertainties, which could impact the level of any dividends we pay in the future.
We believe that our dividend policy could limit, but not preclude, our ability to pursue growth as we intend to retain sufficient cash after the distribution of dividends to permit the pursuit of growth opportunities. In order to pay dividends at the level currently anticipated under our dividend policy and to fund any substantial portion of our stock repurchase program, we could require financing or borrowings to fund any significant acquisitions or to pursue growth opportunities requiring capital significantly beyond our anticipated levels. Management will evaluate potential growth opportunities as they arise and, if our Board of Directors determines that it is in our best interest to use cash that would otherwise be available for distribution as dividends to pursue an acquisition opportunity, to materially increase capital spending or for some other purpose, the Board would be free to depart from or change our dividend policy at any time.
Restrictions on Payment of Dividends
Under Delaware law, we can only pay dividends either out of “surplus” (which is defined as total assets at fair market value minus total liabilities, minus statutory capital) or out of current or the immediately preceding year’s earnings. As of
December 31, 2017
, we had
$29.8 million
in cash and cash equivalents. In addition, we anticipate that we will have sufficient earnings in
2018
to pay dividends at the level described above. Although we believe we will have sufficient surplus and earnings to pay dividends at the anticipated levels for
2018
, our Board of Directors will seek periodically to assure itself of this sufficiency before actually declaring any dividends.
Under our credit facility, we also have restrictions on our ability to declare and pay dividends and our ability to repurchase shares of our common stock. In order to pay any cash dividends and/or repurchase shares of stock: (1) no default or event of default shall have occurred and be continuing under the credit facility, and (2) our pro forma net leverage ratio, as set forth in the credit agreement, must be 0.25 less than the net leverage ratio requirement at the time of dividend declaration or share repurchase. See “Management’s Discussion and Analysis of Financial Conditions and Results of Operations — Liquidity and Capital Resources” in Item 7 in this report.
|
2017 Form 10-K
|
|
27
|
The selected financial data set forth below should be read in conjunction with “Management’s Discussion and Analysis of Financial Condition and Results of Operations” in Item 7 in this report and our financial statements and the related notes included elsewhere in this report to fully understand factors, including our business acquisitions and dispositions, that may affect the comparability of the information presented below.
The following data, insofar as it relates to each of the years ended
December 31, 2017
,
2016
and
2015
, has been derived from the audited annual financial statements, including the consolidated balance sheets as of
December 31, 2017
and
2016
, and the related consolidated statements of comprehensive income, cash flows and stockholders’ equity for the three years ended
December 31, 2017
,
2016
and
2015
and notes thereto in Item 8 of this report. The following data, insofar as it relates to each of the years ended
December 31, 2014
and
2013
, and the consolidated balance sheets as of
December 31, 2015
,
2014
and
2013
are derived from audited financial statements not included in this report.
|
Year ending December 31,
|
|||||||||||||||||||
|
(in thousands, except per share data)
|
2017
|
|
2016
|
|
2015
|
|
2014
|
|
2013
|
|
|||||||||
|
SUMMARY OF OPERATIONS
|
|||||||||||||||||||
|
Total revenue
|
$
|
788,306
|
|
$
|
730,815
|
|
$
|
637,940
|
|
$
|
564,421
|
|
$
|
503,817
|
|
||||
|
Total cost of revenue
|
361,904
|
|
339,220
|
|
304,631
|
|
273,438
|
|
232,663
|
|
|||||||||
|
Gross profit
|
426,402
|
|
391,595
|
|
333,309
|
|
290,983
|
|
271,154
|
|
|||||||||
|
Total operating expenses
|
362,371
|
|
329,795
|
|
286,597
|
|
244,619
|
|
219,612
|
|
|||||||||
|
Income from operations
|
64,031
|
|
61,800
|
|
46,712
|
|
46,364
|
|
51,542
|
|
|||||||||
|
Net income
|
65,933
|
|
41,515
|
|
25,649
|
|
28,290
|
|
30,472
|
|
|||||||||
|
PER SHARE DATA
|
|||||||||||||||||||
|
Basic net income
|
$
|
1.41
|
|
$
|
0.90
|
|
$
|
0.56
|
|
$
|
0.63
|
|
$
|
0.68
|
|
||||
|
Diluted net income
|
1.38
|
|
0.88
|
|
0.55
|
|
0.62
|
|
0.67
|
|
|||||||||
|
Cash dividends
|
0.48
|
|
0.48
|
|
0.48
|
|
0.48
|
|
0.48
|
|
|||||||||
|
BALANCE SHEET DATA
|
|||||||||||||||||||
|
Total assets
(1)
|
$
|
1,759,426
|
|
$
|
1,310,210
|
|
$
|
1,223,336
|
|
$
|
942,503
|
|
$
|
706,025
|
|
||||
|
Deferred revenue, including current portion
|
280,099
|
|
250,940
|
|
237,335
|
|
221,274
|
|
190,574
|
|
|||||||||
|
Total debt, including current portion
(1)
|
438,224
|
|
342,393
|
|
408,087
|
|
279,891
|
|
152,323
|
|
|||||||||
|
Total long-term liabilities
(1)
|
476,520
|
|
382,549
|
|
446,450
|
|
335,583
|
|
187,799
|
|
|||||||||
|
(1)
|
As previously disclosed, on January 1, 2016, we adopted ASU 2015-03, Interest - Imputation of Interest - Simplifying the Presentation of Debt Issuance Costs, on a retrospective basis. Accordingly, we retrospectively adjusted other non-current assets and debt, net of current portion, which had the effect of reducing each of those respective line items in our consolidated balance sheets as of December 31, 2015, 2014, and 2013 by approximately $0.5 million, $0.7 million, and $0.6 million, respectively.
|
|
28
|
|
2017 Form 10-K
|
The following discussion and analysis of our financial condition and results of operations should be read in conjunction with Item 1A Risk factors and our consolidated financial statements and related notes included elsewhere in this Annual Report on Form 10-K. The following discussion and analysis presents financial information denominated in millions of dollars which can lead to differences from rounding when compared to similar information contained in the consolidated financial statements and related notes which are primarily denominated in thousands of dollars.
|
Executive Summary
|
We are the world’s leading cloud software company powering social good. Serving the entire social good community—nonprofits, foundations, corporations, education institutions, healthcare institutions and individual change agents—we connect and empower organizations and individuals to increase their impact through software, services, expertise, and data intelligence. Our portfolio is tailored to the unique needs of vertical markets, with solutions for fundraising and CRM, marketing, advocacy, peer-to-peer fundraising, corporate social responsibility, school management, ticketing, grantmaking, financial management, payment processing, and analytics. Serving the industry for more than three decades, we are headquartered in Charleston, South Carolina and have operations in the United States, Australia, Canada and the United Kingdom. As of
December 31, 2017
, we had
over
40,000
customers.
Our revenue is primarily generated from the following sources: (i) charging for the use of our software solutions in cloud-based and hosted environments; (ii) providing transaction and payment processing services; (iii) providing professional services including implementation, training, consulting, analytic, and other services; and (iv); providing software maintenance and support services.
During 2017, we continued to execute on our four-point growth strategy targeted to drive an extended period of solution and service innovation, quality enhancement, increasing operating efficiency and financial performance:
Four-Point Growth Strategy
|
1.
|
Integrated and Open Solutions in the Cloud
|
We will continue to transition our business to predominantly serve customers through a subscription-based cloud delivery model, enabling lower cost of entry, greater scalability and lower total cost of ownership to our customers. There is a concerted effort underway to optimize our portfolio of solutions and integrate powerful capabilities — such as built-in data, analytics, payment processing and tailored user-specific experiences — to bring even greater value and performance to our customers.
During 2017, we introduced SKY AI™ and SKY Analytics™, the intelligence engine behind the growing number of insights integrated into Blackbaud cloud software solutions, powered by artificial intelligence including machine learning, cognitive technology, predictive analytics and other advanced technologies. With SKY AI and SKY Analytics, we are enabling data-driven decisions by pairing one of the industry's largest data sets with an advanced set of integrated AI capabilities, ultimately having greater impact on our customers and their missions. For example, Affluence Insight, a new donor management segmentation tool enables the identification of annual, mid-level and major gift prospects. It offers the ability to use AI-powered analytics to identify high-value donor prospects and predict a prospect's likelihood to give. These embedded intelligence capabilities are one outcome of Blackbaud's Intelligence for Good™ approach — combining AI, Analytics and big data and expertise to drive insight for our customers across our solution portfolio.
We also made several portfolio announcements during 2017, ranging from solution integrations, to new capabilities for existing solutions, to new solution introductions.
|
2017 Form 10-K
|
|
29
|
|
2.
|
Drive Sales Effectiveness
|
We are making investments to increase the effectiveness of our sales organization, with a focus on enabling our expanding sales teams with the talent, processes and tools to accelerate our revenue growth and improve effectiveness. In 2017, we created a new Senior Vice President of Global Sales position to lead sales effectiveness across the organization. We continued to make investments in our sales, marketing and customer success organizations and improved our market coverage by deploying these resources into key markets, while bifurcating sales to focus on either finding new customers or cultivating existing customers. In addition, we are continuing to optimize our go-to-market sales strategies such as offering solutions and services tailored to the needs of customers operating within vertical markets including K-12 private schools, foundations, higher education and healthcare institutions, among others. Our sales teams are now fully running and managed on a common sales operating model. This includes common procedures, training, key operating metrics, compensation plans and reporting, which is driving increased productivity.
|
3.
|
Expand TAM into Near Adjacencies with Acquisitions and Product Investments
|
We will continue to evaluate compelling opportunities to acquire companies and acquire or build technologies and services. We will be guided by our acquisition criteria for considering attractive assets that expand our total addressable market ("TAM"), provide entry into new and near adjacencies, accelerate our shift to the cloud, accelerate revenue growth, are accretive to margins and present synergistic opportunities.
In 2017, we launched Blackbaud Labs as a means to incubate new ideas and foster our strong culture of innovation and creativity, with the sole focus of bringing new capabilities to market organically. We also announced the promotion of our new Senior Vice President of Corporate Strategy and Business Development, who led the effort for many of our acquisitions, including our 2017 acquisitions, AcademicWorks and JustGiving.
AcademicWorks is the market leader in scholarship management for higher education and K-12 institutions, foundations, and grant-making institutions. Their cloud platform enables students to apply for all awards at an institution using one intuitive and streamlined process, while offering schools and awarding institutions a common platform for improved awarding, reporting, compliance, communication and stewardship of those awards.
JustGiving is the United Kingdom-based online fundraising services provider, whose online social giving platform has played a powerful role in the growth of peer-to-peer fundraising. The acquisition enhances our capability to serve both individual donors and nonprofits, expanding the peer-to-peer fundraising capabilities we currently offer today through TeamRaiser and everydayhero, which are used by leading nonprofit organizations to connect their causes to the individuals who support them. JustGiving also adds personal crowdfunding to our portfolio, which is an offering we did not previously provide and a fast-growing segment of charitable giving.
Additional details regarding our acquisitions of AcademicWorks and JustGiving are provided in Note 3 to our consolidated financial statements in this report. Both AcademicWorks and JustGiving meet the acquisition criteria discussed above. We remain active in the evaluation of acquisition opportunities to broaden our portfolio, provide better integrated solutions for our customers, differentiate ourselves from the competition and improve our financial performance.
|
4.
|
Improve Operating Efficiency
|
We have largely completed the installations of best-in-breed back-office solutions that consolidate and standardize our business operations utilizing scalable tools and systems. Our focus is now shifting towards optimizing those systems, as well as operational excellence and quality initiatives focused on streamlining processes to gain efficiency and scalability. Our organizational model, which we have evolved over the last few years, is largely complete and allows us to gain efficiency and consistency in how we execute. We have centralized our operations, including marketing, sustained engineering, product management, finance, customer support, customer success and professional services, which allows us to better manage the entire customer experience.
During 2017, in an effort to improve operating efficiency and further our organizational objectives, we also initiated a plan to relocate some of our existing offices to highly modern and more collaborative workspaces with short-term financial commitments. These workspaces are also more centrally located for our employees and closer to our customers.
|
30
|
|
2017 Form 10-K
|
|
Total revenue
|
|||||||||
|
Years ended December 31,
|
|||||||||
|
(dollars in millions)
|
2017
|
|
Change
|
|
2016
|
|
|||
|
Total revenue
|
$
|
788.3
|
|
7.9
|
%
|
$
|
730.8
|
|
|
Total revenue increased by $57.5 million during
2017
, which was primarily driven by growth in subscriptions revenue as our business model continues to shift towards providing predominantly cloud-based subscription solutions. Subscriptions revenue also grew as a result of increases in the number of customers and the volume of transactions for which we process payments. Services and other revenue, as well as maintenance revenue, declined during
2017
from our continued shift in focus towards selling cloud-based subscription solutions. In general, our NXT and other cloud-based solutions require less implementation services, which we expect to continue to negatively impact services and other revenue over time. In addition, we have also used promotions and discounts for our consulting services as incentives to accelerate the migration of our existing customer base from on-premises solutions toward our cloud-based subscriptions. In the near-term, the transition to subscription-based solutions negatively impacts total revenue growth, as time-based license revenue from subscription arrangements is deferred and recognized ratably over the subscription period, typically three years at contract inception, whereas on-premises license revenue from arrangements that include perpetual licenses is recognized up-front.
|
Income from operations
|
|||||||||
|
Years ended December 31,
|
|||||||||
|
(dollars in millions)
|
2017
|
|
Change
|
|
2016
|
|
|||
|
Income from operations
|
$
|
64.0
|
|
3.6
|
%
|
$
|
61.8
|
|
|
Income from operations increased by $2.2 million during 2017, when compared to 2016. The positive impact of growth in total revenue driven by subscriptions was partially offset by investments we are making in our sales organization and customer success program and, to a lesser extent, increases in stock-based compensation of
$8.0 million
, rent expense of
$4.4 million
and employee severance costs of
$2.4 million
. A net increase of
$5.2 million
in acquisition-related expenses and integration costs also negatively impacted income from operations. The increase in stock-based compensation expense was primarily driven by an increase in the grant date fair value of our annual equity awards granted to employees during 2017, when compared to the grant date fair value of the awards granted during 2016. The increase in rent expense was primarily driven by the end in the fourth quarter of 2016 of the South Carolina state incentive payments we received as a result of locating our headquarters facility in Berkeley County, South Carolina. These amounts were recorded as a reduction of rent expense upon receipt. Also contributing to the increase in rent expense were new operating leases for equipment that we have historically purchased.
Customer retention
Subscription contracts are typically for a term of three years at contract inception with one to three-year renewals thereafter. Over time, we anticipate a decrease in maintenance contract renewals as we transition our solution portfolio and maintenance customers from a perpetual license-based model to a cloud-based subscription delivery model. We also anticipate an increase in subscription contract renewals as we continue focusing on innovation, quality and the integration of our subscription solutions which we believe will provide value-adding capabilities to better address our customers' needs. Due primarily to these factors, we believe a recurring revenue customer retention measure that combines subscription and maintenance customer contracts provides a better representation of our customers' overall behavior. During
2017
and
2016
, approximately 93% of our customers with recurring subscription or maintenance contracts were retained. As discussed above, we are investing in our customer success program, which we believe will drive increased customer retention over the long-term.
|
2017 Form 10-K
|
|
31
|
At
December 31, 2017
, our cash and cash equivalents were
$29.8 million
and the carrying amount of our debt under the 2017 Credit Facility was
$437.1 million
. Our net leverage ratio was
2.13 to 1.00
.
During
2017
, we generated
$176.3 million
in cash flow from operations, had net cash outlays of
$146.8 million
for the acquisitions of AcademicWorks and JustGiving, returned
$23.1 million
to stockholders by way of dividends and had cash outlays of
$38.6 million
for purchases of property and equipment and capitalized software development costs.
|
Results of Operations
|
Change in Reportable Segments
Prior to the fourth quarter of 2017, we operated in three business segments: (i) GMG (ii) EMG and (iii) IMG. As discussed above, we have centralized our business operations over the last few years to allow us to gain productivity, efficiency and scalability. Areas of our operations we have centralized, include, but are not limited to, marketing, finance, sales excellence, human resources, corporate IT, legal and contracting, real estate and facilities, research and development, customer support, customer success, product management, professional services and training services. With our organizational model now largely complete, we made changes to our internal reporting structure in the fourth quarter of 2017 to better support and assess the operations of our business going forward. As a result, we now have one operating and reportable segment. See
Note 2
of our consolidated financial statements in this report for additional information.
Comparison of
2017
to
2016
and
2016
to
2015
During
2017
,
2016
and
2015
, we acquired companies that provided us with strategic opportunities to expand our TAM and share of the philanthropic giving market through the integration of complementary solutions and services to serve the changing needs of our customers. The following are the companies we acquired and their respective acquisition dates:
|
•
|
Giving Limited ("JustGiving") – October 2, 2017;
|
|
•
|
AcademicWorks, Inc. ("AcademicWorks") – April 3, 2017;
|
|
•
|
Good+Geek, Inc., ("Attentive.ly") – July 11, 2016; and
|
|
•
|
Smart, LLC ("Smart Tuition") – October 2, 2015.
|
We have included the results of operations of acquired companies in our consolidated results of operations from the date of their respective acquisition. We determined that the JustGiving, AcademicWorks and Attentive.ly acquisitions were not material business combinations; therefore, revenue and earnings since the acquisition date and pro forma information are not required or presented. Because we have integrated the operations of Smart Tuition into ours, it is impracticable to determine amounts of revenue and operating costs attributable solely to this acquired company for 2017 and 2016. See
Note 3
to our consolidated financial statements in this report for a summary of these acquisitions.
|
32
|
|
2017 Form 10-K
|
Operating results
|
Subscriptions
|
|||||||||||||||
|
Years ended December 31,
|
|||||||||||||||
|
(dollars in millions)
|
2017
|
|
Change
|
|
2016
|
|
Change
|
|
2015
|
|
|||||
|
Subscriptions revenue
(1)
|
$
|
522.9
|
|
21.9
|
%
|
$
|
429.0
|
|
29.3
|
%
|
$
|
331.8
|
|
||
|
Cost of subscriptions
|
242.7
|
|
13.5
|
%
|
213.9
|
|
27.8
|
%
|
167.3
|
|
|||||
|
Subscriptions gross profit
(2)
|
$
|
280.1
|
|
30.2
|
%
|
$
|
215.1
|
|
30.8
|
%
|
$
|
164.4
|
|
||
|
Subscriptions gross margin
|
53.6
|
%
|
50.1
|
%
|
49.6
|
%
|
|||||||||
|
(1)
|
Included in subscriptions revenue for 2016 was $39.3 million attributable to the inclusion of Smart Tuition. Included in subscriptions revenue for 2015 was $8.3 million attributable to the inclusion of Smart Tuition.
|
|
(2)
|
The individual amounts for each year may not sum to subscriptions gross profit due to rounding.
|
Subscriptions revenue is comprised of revenue from charging for the use of our subscription-based software solutions, which includes providing access to cloud-based solutions and hosting services, access to certain data services and our online subscription training offerings, revenue from payment processing services, as well as variable transaction revenue associated with the use of our solutions.
We continue to experience growth in sales of our cloud-based solutions and hosting services as we meet the demand of our customers that increasingly prefer cloud-based subscription offerings, including existing customers that are migrating from on-premises solutions to our cloud-based solutions. In addition, we have experienced growth in our payment processing services from the continued shift to online giving, further integration of these services to our existing solution portfolio and the sale of these services to new and existing customers. Recurring subscription contracts are typically for a term of three years at contract inception with one to three-year renewals thereafter. We intend to continue focusing on innovation, quality and integration of our subscription solutions, which we believe will drive subscriptions revenue growth.
Cost of subscriptions is primarily comprised of compensation costs for customer support and production IT personnel, third-party contractor expenses, third-party royalty and data expenses, hosting expenses, allocated depreciation, facilities and IT support costs, amortization of intangible assets from business combinations, amortization of software development costs, transaction-based costs related to payments services including remittances of amounts due to third-parties and other costs incurred in providing support and services to our customers.
2017
vs.
2016
The increase in subscriptions revenue during 2017 when compared 2016, was primarily due to strong demand across our cloud-based solution portfolio and, to a much lesser extent, increases in the number of customers and the volume of transactions for which we process payments.
The increase in cost of subscriptions during 2017, when compared to 2016, was driven primarily by increases in transaction-based costs related to our payments services of $19.0 million, costs of third-party technology embedded in certain of our subscription solutions of $7.4 million and amortization of software development costs of $4.3 million. The increase in amortization of software development costs was primarily due to investments made on innovation, quality and the integration of our cloud-based solutions.
The increase in subscriptions gross margin when comparing 2017 to 2016 was primarily the result of the positive economics of shifting customers to our next generation cloud-based solutions as growth in subscriptions revenue outpaced the growth in related costs.
2016
vs.
2015
Excluding the incremental subscriptions revenue from Smart Tuition as discussed above, subscriptions revenue increased by $66.2 million during 2016 when compared 2015. The increase was primarily due to strong demand across our cloud-based solution portfolio and, to a lesser extent, increases in the number of customers and the volume of transactions for which we process payments.
|
2017 Form 10-K
|
|
33
|
The increase in cost of subscriptions during 2016, when compared to 2015, was slightly lower than the increase in revenue. The increase in cost of subscriptions was driven primarily by increases in transaction-based costs related to our payments services and those of Smart Tuition of $21.8 million, amortization of intangible assets from business combinations of $8.2 million, third-party contractor expenses $4.4 million, costs of third-party technology embedded in certain of our subscription solutions of $4.4 million and increases in amortization of software development costs of $3.0 million. The increase in amortization of intangible assets from business combinations was primarily due the incremental amortization of intangible assets arising from the acquisition of Smart Tuition in October 2015. The increases in third-party contract costs and amortization of software development costs were from investments made on innovation, quality and the integration of our cloud-based solutions.
The increase in subscriptions gross margin when comparing 2016 to 2015 was primarily the result of disciplined management of headcount and compensation costs as the growth in subscriptions revenue outpaced the growth in related costs.
|
34
|
|
2017 Form 10-K
|
|
Maintenance
|
|||||||||||||||
|
Years ended December 31,
|
|||||||||||||||
|
(dollars in millions)
|
2017
|
|
Change
|
|
2016
|
|
Change
|
|
2015
|
|
|||||
|
Maintenance revenue
|
$
|
128.2
|
|
(12.8
|
)%
|
$
|
146.9
|
|
(4.5
|
)%
|
$
|
153.8
|
|
||
|
Cost of maintenance
|
23.0
|
|
4.0
|
%
|
22.1
|
|
(18.4
|
)%
|
27.1
|
|
|||||
|
Maintenance gross profit
(1)
|
$
|
105.2
|
|
(15.7
|
)%
|
$
|
124.9
|
|
(1.5
|
)%
|
$
|
126.7
|
|
||
|
Maintenance gross margin
|
82.1
|
%
|
85.0
|
%
|
82.4
|
%
|
|||||||||
|
(1)
|
The individual amounts for each year may not sum to maintenance gross profit due to rounding.
|
Maintenance revenue is comprised of annual fees derived from maintenance contracts associated with new software licenses and annual renewals of existing maintenance contracts. These contracts provide customers with updates, enhancements and certain upgrades to our software solutions and online, telephone and email support. Maintenance contracts are typically renewed on an annual basis.
Cost of maintenance is primarily comprised of compensation costs for customer support personnel, third-party contractor expenses, third-party royalty costs, allocated depreciation, facilities and IT support costs, amortization of intangible assets from business combinations, amortization of software development costs and other costs incurred in providing support and services to our customers.
2017
vs.
2016
The decrease in maintenance revenue during 2017, when compared to 2016, was primarily comprised of (i) reductions in maintenance from contracts that were migrated to a cloud-based subscription or not renewed and reductions in contracts with existing customers of $30.3 million; partially offset by (ii) incremental maintenance from new customers associated with new license contracts and increases in contracts with existing customers of $10.7 million; and (iii) incremental maintenance from contractual inflationary rate adjustments of $0.9 million.
Cost of maintenance increased during 2017, when compared to 2016, primarily as a result of an increase in compensation costs of $1.0 million, driven by a refinement in the method in which we allocate customer support costs between cost of maintenance and cost of subscriptions.
Maintenance gross margin decreased during 2017, when compared to 2016, primarily due to the increase in maintenance customer support costs combined with the decline in maintenance revenue as discussed above.
2016
vs.
2015
The decrease in maintenance revenue during 2016, when compared to 2015, was primarily related to a reduction in maintenance contracts associated with our on-premises Raiser's Edge and Financial Edge solutions as customers migrated to our cloud-based NXT solutions, partially offset by increases in maintenance contracts associated with Blackbaud Enterprise CRM.
The decrease in maintenance revenue during 2016 was primarily comprised of (i) $23.2 million of reductions in maintenance from contracts that were migrated to a cloud-based subscription or not renewed and reductions in contracts with existing customers; partially offset by (ii) $15.3 million of incremental maintenance from new customers associated with new license contracts and increases in contracts with existing customers; and (iii) $1.0 million of incremental maintenance from contractual inflationary rate adjustments.
Cost of maintenance decreased during 2016, when compared to 2015, primarily as a result of a decrease in compensation costs of $4.9 million, from a shift in support headcount from maintenance towards sales, marketing and customer success expense, and a shift in the volume of customer support requests from maintenance towards subscriptions. Also contributing to the decrease in compensation costs was an improvement in the efficiency of our customer support center.
Maintenance gross margin increased during 2016, when compared to 2015, primarily due to the shift in compensation costs from maintenance as discussed above, as well as the improvement in the efficiency of our customer support center.
|
2017 Form 10-K
|
|
35
|
|
Services and other
|
|||||||||||||||
|
Years ended December 31,
|
|||||||||||||||
|
(dollars in millions)
|
2017
|
|
Change
|
|
2016
|
|
Change
|
|
2015
|
|
|||||
|
Services and other revenue
|
$
|
137.3
|
|
(11.4
|
)%
|
$
|
154.9
|
|
1.6
|
%
|
$
|
152.4
|
|
||
|
Cost of services revenue and other
|
96.2
|
|
(6.8
|
)%
|
103.2
|
|
(6.3
|
)%
|
110.2
|
|
|||||
|
Services and other gross profit
(1)
|
$
|
41.1
|
|
(20.4
|
)%
|
$
|
51.6
|
|
22.5
|
%
|
$
|
42.2
|
|
||
|
Services and other gross margin
|
29.9
|
%
|
33.3
|
%
|
27.7
|
%
|
|||||||||
|
(1)
|
The individual amounts for each year may not sum to subscriptions gross profit due to rounding.
|
Services and other revenue includes consulting, implementation, training, analytic and installation services as well as revenue from the sale of our software sold under perpetual license arrangements, fees from user conferences and third-party software referral fees. Consulting, implementation and installation services involve converting data from a customer’s existing system, system configuration, process re-engineering and assistance in file set up. Analytic services are comprised of donor prospect research, sales of lists of potential donors, benchmarking studies and data modeling services. These analytic services involve the assessment of current and prospective donor information of the customer and are performed using our proprietary analytical tools. The end product is intended to enable organizations to more effectively target their fundraising activities.
Cost of services and other is primarily comprised of compensation costs for professional services and training personnel, third-party contractor expenses, costs incurred in providing customer training, data expense incurred to perform analytic services, third-party software royalties, variable reseller commissions, costs of user conferences, allocated depreciation, facilities and IT support costs and amortization of intangible assets from business combinations.
2017
vs.
2016
Services and other revenue decreased during 2017, when compared to 2016, primarily due to a $14.4 million decrease in consulting revenue and, to a much lesser extent, declines in license fees revenue and analytics revenue. We expected the ongoing shift in our go-to-market strategy towards cloud-based subscription offerings, which, in general, require less implementation services and little to no customization services to negatively impact services and other revenue. We have also used promotions and discounts for our consulting services as incentives to accelerate the migration of our existing customer base from on-premises solutions toward our cloud-based subscriptions. The maturation of our Blackbaud Enterprise CRM solution is lessening the extent of implementation services required for that solution. In addition, we are increasingly selling our Blackbaud CRM solution as a subscription offering, which has resulted in less license fees revenue. We expect that the ongoing shift in our go-to-market strategy, as discussed above, will continue to negatively impact services and other revenue in the near-term, but the impact is expected to be more modest.
The decrease in cost of services and other during 2017, when compared to 2016, was primarily due to a decrease in compensation costs of $3.7 million, which is in line with the ongoing shift in our go-to-market strategy as discussed above.
Services and other gross margin decreased during 2017, when compared to 2016, primarily due to the declines in consulting, license fees and analytics revenue coupled with the more modest reductions in costs of services and other.
2016
vs.
2015
Services and other revenue increased modestly during 2016, when compared to 2015, primarily due to increases in deliveries of consulting and training services related to our cloud-based solutions, as well as a reduction in non-billable implementation service hours. The growth in services revenue was partially offset by a decrease in license fees revenue primarily due to the continued transition of our solution portfolio away from a perpetual license-based model.
The decrease in cost of services and other during 2016, when compared to 2015, was primarily due to a decrease in compensation costs of $4.2 million, related to utilization improvements and a reduction in non-billable implementation service hours for our Blackbaud Enterprise CRM solution.
|
36
|
|
2017 Form 10-K
|
Services gross margin increased during 2016, when compared to 2015, primarily due to increased consulting and training revenue coupled with improvements in the utilization of consulting services personnel and a reduction in non-billable implementation hours.
Operating expenses
|
Sales, marketing and customer success
|
|||||||||||||||
|
Years ended December 31,
|
|||||||||||||||
|
(dollars in millions)
|
2017
|
|
Change
|
|
2016
|
|
Change
|
|
2015
|
|
|||||
|
Sales, marketing and customer success expense
|
$
|
173.5
|
|
11.4
|
%
|
$
|
155.8
|
|
26.0
|
%
|
$
|
123.6
|
|
||
|
% of total revenue
|
22.0
|
%
|
21.3
|
%
|
19.4
|
%
|
|||||||||
Sales, marketing and customer success expense includes compensation costs, variable sales commissions, travel-related expenses, advertising and marketing materials, public relations costs and allocated depreciation, facilities and IT support costs.
2017
vs.
2016
We continue to make investments to drive sales effectiveness, which is a component of our four-point growth strategy to accelerate revenue growth. We also continue investing in our customer success organization to drive customer loyalty, retention and referrals. The increases in sales, marketing and customer success expense in dollars and as a percentage of total revenue during 2017, when compared to 2016, was primarily due to an increase in compensation costs of $12.8 million. Also contributing to the increase in sales, marketing and customer success expense was an increase in commissions expense of $2.0 million. Compensation costs increased primarily due to incremental headcount associated with the increase in direct sales, marketing, and customer success efforts of our growing operations. The increase in commissions expense was primarily driven by an increase in commissionable sales.
2016
vs.
2015
The increases in sales, marketing and customer success expense in dollars and as a percentage of total revenue during 2016, when compared to 2015, was primarily due to increases in compensation costs of $21.5 million and commissions expense of $5.6 million. Compensation costs increased primarily due to incremental headcount to support the increase in direct sales, marketing, and customer success efforts of our growing operations. The expansion of our customer success program is targeted to ensure our customers are fully realizing the value of our solutions, which we believe will drive customer loyalty and retention and will also result in increased customer referrals. The increases in commission expense were primarily driven by increases in commissionable revenue during 2016 when compared to 2015. The inclusion of Smart Tuition for the full year in 2016 also contributed to the increases in compensation costs and commissions expense.
|
2017 Form 10-K
|
|
37
|
|
Research and development
|
|||||||||||||||
|
Years ended December 31,
|
|||||||||||||||
|
(dollars in millions)
|
2017
|
|
Change
|
|
2016
|
|
Change
|
|
2015
|
|
|||||
|
Research and development expense
(1)
|
$
|
89.9
|
|
—
|
%
|
$
|
89.9
|
|
6.2
|
%
|
$
|
84.6
|
|
||
|
% of total revenue
|
11.4
|
%
|
12.3
|
%
|
13.3
|
%
|
|||||||||
|
(1)
|
Not included in research and development expense for
2017
,
2016
and
2015
were $28.0 million, $26.2 million, and $15.5 million, respectively, of qualifying costs associated with development activities that are required to be capitalized under the internal-use software accounting guidance such as those related to development of our next generation cloud-based solutions, as well as development costs associated with acquired companies. Qualifying capitalized software development costs associated with our cloud-based solutions are subsequently amortized to cost of subscriptions revenue over the related asset's estimated useful life, which generally range from three to seven years.
|
Research and development expense includes compensation costs for engineering and product management personnel, third-party contractor expenses, software development tools and other expenses related to researching and developing new solutions, upgrading and enhancing existing solutions, and allocated depreciation, facilities and IT support costs.
2017
vs.
2016
We continue to make investments to deliver integrated and open solutions in the cloud, which is a component of our four-point growth strategy to accelerate revenue growth. Research and development expense remained unchanged during 2017, when compared to 2016. During 2017, an increase in compensation costs of $1.3 million associated with our addition of specialized engineering resources to help drive our solution development efforts was offset primarily by an increase in the amount of software development costs that were capitalized of $1.9 million. As discussed above, the increases in the amounts capitalized were a result of incurring more qualifying costs associated with development activities that are required to be capitalized under the internal-use software guidance. We expect that the amount of software development costs capitalized will continue to increase modestly in the near-term as we make investments in innovation, quality and the integration of our solutions, which we believe will drive long-term revenue growth.
Research and development expense decreased as a percentage of total revenue during 2017, when compared to 2016, primarily due to productivity gains, which have allowed us to scale our business. The increases in the amounts of software development costs capitalized as discussed above also contributed to the decreases in research and development expense as a percentage of total revenue.
2016
vs.
2015
The increase in research and development expense during 2016, when compared to 2015, was primarily due to an increase in compensation costs of $13.0 million. We have added engineering headcount to drive our solution development efforts, and the inclusion of Smart Tuition added to the increases in compensation costs. Also contributing to the increase in research and development expense during 2016 was an increase in third-party contractor expenses of $1.8 million, to assist in our solution development efforts. Partially offsetting these increases during 2016 was an increase of $10.7 million in the amount of software development costs that were capitalized. As discussed above, the increase in the amount capitalized was a result of incurring more qualifying costs associated with development activities that are required to be capitalized under the internal-use software accounting guidance.
Research and development expense decreased as a percentage of total revenue during 2016, when compared to 2015, primarily due to the increase in the amount of software development costs capitalized as discussed above.
|
38
|
|
2017 Form 10-K
|
|
General and administrative
|
|||||||||||||||
|
Years ended December 31,
|
|||||||||||||||
|
(dollars in millions)
|
2017
|
|
Change
|
|
2016
|
|
Change
|
|
2015
|
|
|||||
|
General and administrative expense
|
$
|
94.9
|
|
16.6
|
%
|
$
|
81.3
|
|
6.9
|
%
|
$
|
76.1
|
|
||
|
% of total revenue
|
12.0
|
%
|
11.1
|
%
|
11.9
|
%
|
|||||||||
General and administrative expense consists primarily of compensation costs for general corporate functions, including senior management, finance, accounting, legal, human resources and corporate development, third-party professional fees, insurance, data security costs, allocated depreciation, facilities and IT support costs, acquisition-related expense and other administrative expenses.
2017
vs.
2016
The increase in general and administrative expense during 2017, when compared to 2016, was primarily due to increases in rent expense of
$4.4 million
and employee severance costs of
$2.4 million
. A net increase in acquisition-related expenses and integration costs of
$5.2 million
during 2017 also drove up general and administrative expense. The increase in rent expense was primarily driven by the end in the fourth quarter of 2016 of the South Carolina state incentive payments we received as a result of locating our headquarters facility in Berkeley County, South Carolina. These amounts were recorded as a reduction of rent expense upon receipt. Also contributing to the increase in rent expense were new operating leases for equipment that we have historically purchased.
General and administrative expense as a percentage of total revenue increased during 2017, when compared to 2016, primarily due to the incremental acquisition-related costs and rent expense discussed above.
2016
vs.
2015
The increase in general and administrative expense during 2016 was driven primarily by an increase in compensation costs of $5.1 million. Compensation costs increased primarily due to increases in stock-based compensation expense, employee benefit costs and salaries for the resources needed to support the growth of our business. The increase in stock-based compensation expense was primarily driven by an increase in the grant date fair value of our annual equity awards granted during 2016 when compared to the grant date fair value of our annual equity awards granted during 2015. The inclusion of Smart Tuition also contributed to the growth in general and administrative expense during 2016.
General and administrative expense decreased as a percentage of total revenue during 2016, when compared to the same periods in 2015, primarily due our successful integration of Smart Tuition as well as progress against our operating efficiency initiative, which allowed us to improve resource effectiveness and maintain tight control over discretionary spending.
Restructuring
During 2017, in an effort to improve operating efficiency and further our organizational objectives, we initiated a plan to relocate some of our existing offices to highly modern and more collaborative workspaces with short-term financial commitments. These workspaces are also more centrally located for our employees and closer to our customers. We are currently evaluating the total before-tax restructuring costs we expect to incur as a result of this plan through 2019. Restructuring costs expected to be incurred consist primarily of costs to terminate existing lease agreements. For the year ended
December 31, 2017
, we incurred restructuring costs of
$0.8 million
related to the termination of our lease for office space in Emeryville, CA. For additional details about our restructuring activity, see
Note 20
of our consolidated financial statements in this report.
|
2017 Form 10-K
|
|
39
|
|
Interest expense
|
|||||||||||||||
|
Years ended December 31,
|
|||||||||||||||
|
(dollars in millions)
|
2017
|
|
Change
|
|
2016
|
|
Change
|
|
2015
|
|
|||||
|
Interest expense
|
$
|
12.1
|
|
14.3
|
%
|
$
|
10.6
|
|
31.1
|
%
|
$
|
8.1
|
|
||
|
% of total revenue
|
1.5
|
%
|
1.4
|
%
|
1.3
|
%
|
|||||||||
2017
vs.
2016
Interest expense increased during 2017, when compared to 2016, primarily due to the required immediate expense recognition for certain debt issuance costs when we refinanced our credit facility in June 2017. Also contributing to the increase in interest expense during 2017 were modest increases in our weighted average effective interest rates, driven by an increasing interest rate environment during 2017. In the near term, we expect interest expense as well as interest expense as a percentage of revenue to increase as a result of our acquisition of JustGiving.
2016
vs.
2015
Interest expense increased during 2016, when compared to 2015, primarily as a result of an increase in our average daily borrowings related to our acquisition of Smart Tuition in October 2015.
Deferred revenue
The table below compares the components of deferred revenue from our consolidated balance sheets:
|
(dollars in millions)
|
Timing of recognition
|
December 31,
2017 |
|
Change
|
|
December 31,
2016 |
|
|||
|
Subscriptions
|
Over the period billed in advance, generally one year
|
$
|
185.0
|
|
28.0
|
%
|
$
|
144.6
|
|
|
|
Maintenance
|
Over the period billed in advance, generally one year
|
63.2
|
|
(17.7
|
)%
|
76.8
|
|
|||
|
Services and other
|
As services are delivered
|
31.8
|
|
7.7
|
%
|
29.5
|
|
|||
|
Total deferred revenue
(1)
|
280.1
|
|
11.6
|
%
|
250.9
|
|
||||
|
Less: Long-term portion
|
3.6
|
|
(43.4
|
)%
|
6.4
|
|
||||
|
Current portion
(1)
|
$
|
276.5
|
|
13.1
|
%
|
$
|
244.5
|
|
||
|
(1)
|
The individual amounts for each year may not sum to total deferred revenue or current portion of deferred revenue due to rounding.
|
To the extent that our customers are billed for our solutions and services in advance of delivery, we record such amounts in deferred revenue. We generally invoice our subscription and maintenance customers in annual cycles 30 days prior to the end of the contract term. Deferred revenue attributable to subscriptions increased during 2017, when compared to 2016, primarily due to an increase in subscription sales. The decrease in deferred revenue attributable to maintenance during 2017 was primarily due to the continuing shift in our go-to-market strategy towards cloud-based subscription offerings which do not require maintenance contracts.
We have acquired businesses whose net tangible assets include deferred revenue. In accordance with GAAP reporting requirements, we recorded write-downs of deferred revenue from customer arrangements predating the acquisition to fair value, which resulted in lower recorded deferred revenue as of the acquisition date than the actual amounts paid in advance for solutions and services under those customer arrangements. Therefore, our deferred revenue after an acquisition will not reflect the full amount of deferred revenue that would have been reported if the acquired deferred revenue was not written down to fair value. Further explanation of this impact is included below under the caption "Non-GAAP financial measures".
|
40
|
|
2017 Form 10-K
|
Income tax provision
Our income tax provision and effective income tax rates, including the effects of period-specific events, were:
|
|
Years ended December 31,
|
||||||||
|
(dollars in millions)
|
2017
|
|
2016
|
|
2015
|
|
|||
|
Income tax (benefit) provision
|
$
|
(11.7
|
)
|
$
|
9.4
|
|
$
|
11.3
|
|
|
Effective income tax rate
|
(21.7
|
)%
|
18.5
|
%
|
30.6
|
%
|
|||
Our effective income tax rate may fluctuate quarterly as a result of factors, including changes in tax law in jurisdictions where we conduct business, transactions entered into, changes in the geographic distribution of our earnings or losses, and our assessment of certain tax contingencies and valuation allowances.
We have deferred tax assets for federal, state, and international net operating loss carryforwards and tax credits. The federal and state net operating loss carryforwards are subject to various Internal Revenue Code limitations and applicable state tax laws. A portion of the foreign and state net operating loss carryforwards and a portion of state tax credits have a valuation reserve due to the uncertainty of realizing such carryforwards and credits in the future.
We file income tax returns in the U.S. for federal and various state jurisdictions as well as in foreign jurisdictions including Canada, the United Kingdom, Australia, and Ireland. We are generally subject to U.S. federal income tax examination for calendar tax years ending 2014 through 2017, as well as state and foreign income tax examinations for various years depending on statute of limitations of those jurisdictions.
We have taken federal and state tax positions for which it is reasonably possible that the total amount of unrecognized tax benefits may decrease within the next twelve months. The possible decrease could result from the expiration of statutes of limitations. The reasonably possible decrease at
December 31, 2017
was
$1.6 million
.
We recognize accrued interest and penalties, if any, related to unrecognized tax benefits as a component of income tax expense.
2017
vs.
2016
The
decrease
in our effective income tax rate during 2017 when compared to 2016 was primarily due to the effect of U.S. tax reform legislation signed into law on December 22, 2017 (see
Note 12
of our consolidated financial statements in this report for additional details). The $20.0 million discrete tax benefit to expense is attributable to the revaluation of the ending U.S. deferred tax assets and liabilities resulting from the reduced U.S. corporate federal income tax rate from 35% to 21% effective for tax years beginning after December 31, 2017.
The decrease in our effective income tax rate during 2017 when compared to 2016 was also attributable to a $12.5 million discrete tax benefit to expense relating to stock-based compensation items, as compared to a $7.7 million discrete tax benefit in 2016. The increase in the discrete tax benefit in 2017 relating to stock-based compensation was attributable to an increase in the market price for shares of our common stock, as reported by the Nasdaq Stock Market LLC ("Nasdaq"), as well as an increase in the number of stock awards that vested and were exercised. Most of our equity awards are granted during our first quarter and vest in subsequent years during the same quarter.
In 2018, we expect that the reduced U.S. corporate federal income tax rate as well as our stock-based compensation will continue to provide significant tax benefits to our effective income tax rate.
The total amount of unrecognized tax benefit that, if recognized, would favorably affect the effective income tax rate, was
$4.6 million
and
$2.4 million
at
December 31, 2017
and
December 31, 2016
, respectively.
2016
vs.
2015
The decrease in our effective income tax rate during 2016 when compared to 2015 was primarily due to a $7.7 million benefit to expense from the early adoption of ASU 2016-09 relating to stock-based compensation. Under ASU 2016-09, tax benefits in excess of compensation costs (windfalls) generated upon the exercise or settlement of stock awards are no
|
2017 Form 10-K
|
|
41
|
longer recognized as additional paid-in capital but are instead recognized as a reduction to income tax expense. This change in accounting for income taxes was effective for us on a prospective basis as of the beginning of the 2016 fiscal year. The decrease in our effective income tax rate was partially offset by a $1.0 million charge to expense from Section 162(m) nondeductible compensation.
Non-GAAP financial measures
The operating results analyzed below are presented on a non-GAAP basis. We use non-GAAP revenue, non-GAAP gross profit, non-GAAP gross margin, non-GAAP income from operations, non-GAAP operating margin, non-GAAP net income and non-GAAP diluted earnings per share internally in analyzing our operational performance. Accordingly, we believe these non-GAAP measures are useful to investors, as a supplement to GAAP measures, in evaluating our ongoing operational performance. While we believe these non-GAAP measures provide useful supplemental information, non-GAAP financial measures should not be considered in isolation from, or as a substitute for, financial information prepared in accordance with GAAP. In addition, these non-GAAP financial measures may not be completely comparable to similarly titled measures of other companies due to potential differences in the exact method of calculation between companies.
We have acquired businesses whose net tangible assets include deferred revenue. In accordance with GAAP reporting requirements, we recorded write-downs of deferred revenue under arrangements predating the acquisition to fair value, which resulted in lower recognized revenue than the contributed purchase price until the related obligations to provide services under such arrangements are fulfilled. Therefore, our GAAP revenues after the acquisitions will not reflect the full amount of revenue that would have been reported if the acquired deferred revenue was not written down to fair value. The non-GAAP measures described below reverse the acquisition-related deferred revenue write-downs so that the full amount of revenue booked by the acquired companies is included, which we believe provides a more accurate representation of a revenue run-rate in a given period and, therefore, will provide more meaningful comparative results in future periods.
The non-GAAP financial measures discussed below exclude the impact of certain transactions because we believe they are not directly related to our operating performance in any particular period, but are for our long-term benefit over multiple periods. We believe that these non-GAAP financial measures reflect our ongoing business in a manner that allows for meaningful period-to-period comparisons and analysis of trends in our business.
|
Years ended December 31,
|
|||||||||||||||
|
(dollars in millions)
|
2017
|
|
Change
|
|
2016
|
|
Change
|
|
2015
|
|
|||||
|
GAAP Revenue
|
$
|
788.3
|
|
7.9
|
%
|
$
|
730.8
|
|
14.6
|
%
|
$
|
637.9
|
|
||
|
Non-GAAP adjustments:
|
|||||||||||||||
|
Add: Acquisition-related deferred revenue write-down
|
2.5
|
|
(31.4
|
)%
|
3.6
|
|
(61.2
|
)%
|
9.4
|
|
|||||
|
Non-GAAP revenue
(1)
|
$
|
790.8
|
|
7.7
|
%
|
$
|
734.5
|
|
13.5
|
%
|
$
|
647.3
|
|
||
|
GAAP gross profit
|
$
|
426.4
|
|
8.9
|
%
|
$
|
391.6
|
|
17.5
|
%
|
$
|
333.3
|
|
||
|
GAAP gross margin
|
54.1
|
%
|
53.6
|
%
|
52.2
|
%
|
|||||||||
|
Non-GAAP adjustments:
|
|||||||||||||||
|
Add: Acquisition-related deferred revenue write-down
|
2.5
|
|
(31.4
|
)%
|
3.6
|
|
(61.2
|
)%
|
9.4
|
|
|||||
|
Add: Stock-based compensation expense
|
3.5
|
|
5.2
|
%
|
3.3
|
|
(5.6
|
)%
|
3.5
|
|
|||||
|
Add: Amortization of intangibles from business combinations
|
40.1
|
|
1.4
|
%
|
39.6
|
|
31.9
|
%
|
30.0
|
|
|||||
|
Add: Employee severance
|
1.0
|
|
160.2
|
%
|
0.4
|
|
(74.4
|
)%
|
1.5
|
|
|||||
|
Add: Acquisition-related integration costs
|
0.1
|
|
100.0
|
%
|
—
|
|
—
|
%
|
—
|
|
|||||
|
Subtotal
(1)
|
47.1
|
|
0.6
|
%
|
46.9
|
|
5.7
|
%
|
44.3
|
|
|||||
|
Non-GAAP gross profit
(1)
|
$
|
473.5
|
|
8.0
|
%
|
$
|
438.5
|
|
16.1
|
%
|
$
|
377.7
|
|
||
|
Non-GAAP gross margin
|
59.9
|
%
|
59.7
|
%
|
58.3
|
%
|
|||||||||
|
(1)
|
The individual amounts for each year may not sum to non-GAAP revenue, subtotal or non-GAAP gross profit due to rounding.
|
|
42
|
|
2017 Form 10-K
|
|
Years ended December 31,
|
|||||||||||||||
|
(dollars in millions, except per share amounts)
|
2017
|
|
Change
|
|
2016
|
|
Change
|
|
2015
|
|
|||||
|
GAAP income from operations
|
$
|
64.0
|
|
3.6
|
%
|
$
|
61.8
|
|
32.3
|
%
|
$
|
46.7
|
|
||
|
GAAP operating margin
|
8.1
|
%
|
|
|
8.5
|
%
|
7.3
|
%
|
|||||||
|
Non-GAAP adjustments:
|
|
|
|||||||||||||
|
Add: Acquisition-related deferred revenue write-down
|
2.5
|
|
(31.4
|
)%
|
3.6
|
|
(61.2
|
)%
|
9.4
|
|
|||||
|
Add: Stock-based compensation expense
|
40.6
|
|
24.5
|
%
|
32.6
|
|
29.3
|
%
|
25.2
|
|
|||||
|
Add: Amortization of intangibles from business combinations
|
43.4
|
|
2.3
|
%
|
42.4
|
|
31.6
|
%
|
32.2
|
|
|||||
|
Add: Employee severance
|
4.3
|
|
117.8
|
%
|
2.0
|
|
(37.1
|
)%
|
3.2
|
|
|||||
|
Add: Impairment of capitalized software development costs
|
—
|
|
—
|
%
|
—
|
|
(100.0
|
)%
|
0.2
|
|
|||||
|
Add: Acquisition-related integration costs
|
1.0
|
|
(31.9
|
)%
|
1.4
|
|
30.1
|
%
|
1.1
|
|
|||||
|
Add: Acquisition-related expenses
|
5.9
|
|
1,864.8
|
%
|
0.3
|
|
(92.3
|
)%
|
3.9
|
|
|||||
|
Add: Restructuring costs
|
0.8
|
|
100.0
|
%
|
—
|
|
—
|
%
|
—
|
|
|||||
|
Subtotal
(1)
|
98.5
|
|
19.6
|
%
|
82.4
|
|
9.5
|
%
|
75.2
|
|
|||||
|
Non-GAAP income from operations
(1)
|
$
|
162.5
|
|
12.7
|
%
|
$
|
144.2
|
|
18.2
|
%
|
$
|
122.0
|
|
||
|
Non-GAAP operating margin
|
20.6
|
%
|
|
|
19.6
|
%
|
|
|
18.8
|
%
|
|||||
|
GAAP income before provision for income taxes
|
$
|
54.2
|
|
6.4
|
%
|
$
|
50.9
|
|
37.8
|
%
|
$
|
37.0
|
|
||
|
GAAP net income
|
$
|
65.9
|
|
58.8
|
%
|
$
|
41.5
|
|
61.9
|
%
|
$
|
25.6
|
|
||
|
Shares used in computing GAAP diluted earnings per share
|
47,775,702
|
|
1.0
|
%
|
47,316,538
|
|
1.8
|
%
|
46,498,704
|
|
|||||
|
GAAP diluted earnings per share
|
$
|
1.38
|
|
56.8
|
%
|
$
|
0.88
|
|
60.0
|
%
|
$
|
0.55
|
|
||
|
Non-GAAP adjustments:
|
|||||||||||||||
|
Add: GAAP income tax (benefit) provision
|
(11.7
|
)
|
(224.7
|
)%
|
9.4
|
|
(16.7
|
)%
|
11.3
|
|
|||||
|
Add: Total Non-GAAP adjustments affecting loss from operations
|
98.5
|
|
19.6
|
%
|
82.4
|
|
9.5
|
%
|
75.2
|
|
|||||
|
Add: Loss on sale of business
|
—
|
|
—
|
%
|
—
|
|
(100.0
|
)%
|
2.0
|
|
|||||
|
Less: Gain on derivative instrument
|
(0.5
|
)
|
100.0
|
%
|
—
|
|
—
|
%
|
—
|
|
|||||
|
Add: Loss on debt extinguishment
|
0.3
|
|
100.0
|
%
|
—
|
|
—
|
%
|
—
|
|
|||||
|
Non-GAAP income before provision for income taxes
|
152.5
|
|
14.4
|
%
|
133.3
|
|
16.8
|
%
|
114.2
|
|
|||||
|
Assumed non-GAAP income tax provision
(2)
|
48.8
|
|
14.4
|
%
|
42.7
|
|
(4.2
|
)%
|
44.5
|
|
|||||
|
Non-GAAP net income
(1)
|
$
|
103.7
|
|
14.4
|
%
|
$
|
90.7
|
|
30.2
|
%
|
$
|
69.6
|
|
||
|
Shares used in computing Non-GAAP diluted earnings per share
|
47,775,702
|
|
1.0
|
%
|
47,316,538
|
|
1.8
|
%
|
46,498,704
|
|
|||||
|
Non-GAAP diluted earnings per share
|
$
|
2.17
|
|
13.0
|
%
|
$
|
1.92
|
|
28.0
|
%
|
$
|
1.50
|
|
||
|
(1)
|
The individual amounts for each year may not sum to subtotal, non-GAAP income from operations, non-GAAP income before provision for income taxes or non-GAAP net income due to rounding.
|
|
(2)
|
For the years ended December 31, 2017 and 2016, we applied a non-GAAP effective tax rate of 32.0% in our determination of non-GAAP net income. For year ended December 31, 2015, non-GAAP net income was calculated under our historical non-GAAP effective tax rate of 39.0%.
|
|
2017 Form 10-K
|
|
43
|
Beginning in 2018, we intend to update the non-GAAP tax rate we apply when calculating non-GAAP net income and non-GAAP diluted earnings per share in future periods. Since the first quarter of 2016, for the purposes of determining non-GAAP net income, we have utilized a non-GAAP tax rate of 32.0% in our calculation of the tax impact related to non-GAAP adjustments. We intend to adjust this rate to 20.0% to better reflect our periodic effective tax rate calculated in accordance with GAAP and our current expectations related to the Tax Cuts and Jobs Act, which was enacted into law on December 22, 2017 and, among other items, reduces the federal tax rate for corporations from 35.0% to 21.0% beginning in 2018. The non-GAAP tax rate utilized in future periods will be reviewed annually to determine whether it remains appropriate in consideration of our financial results including our periodic effective tax rate calculated in accordance with GAAP, our operating environment and related tax legislation in effect and other factors deemed necessary. All measures of the tax impact related to non-GAAP net income and non-GAAP diluted earnings per share included above are calculated under our historical methodologies.
2017
vs.
2016
The increases in non-GAAP income from operations and non-GAAP operating margin during 2017 when compared to 2016, were primarily due to growth in subscriptions revenue, partially offset by investments we are making in our sales organization and customer success program, and, to a lesser extent, an increase in rent expense as discussed above.
2016
vs.
2015
The increases in non-GAAP income from operations and non-GAAP operating margin during 2016 when compared to 2015, were primarily due to growth in subscriptions revenue, improvements in the utilization of consulting services personnel and a reduction in non-billable implementation service hours, partially offset by increases in transaction-based costs related to our payments services, compensation costs and investments we made in our sales organization and customer success program, as discussed above. The inclusion of Smart Tuition for the full year in 2016 contributed to the increase in subscriptions revenue as well as the increases in costs related to our payment services and compensation costs.
Non-GAAP free cash flow is defined as operating cash flow less capital expenditures, including costs required to be capitalized for software development, and capital expenditures for property and equipment.
|
Years ended December 31,
|
|||||||||||||||
|
(dollars in millions)
|
2017
|
|
Change
|
|
2016
|
|
Change
|
|
2015
|
|
|||||
|
GAAP net cash provided by operating activities
|
$
|
176.3
|
|
14.8
|
%
|
$
|
153.6
|
|
18.9
|
%
|
$
|
129.2
|
|
||
|
Less: purchase of property and equipment
|
(10.2
|
)
|
(42.3
|
)%
|
(17.7
|
)
|
(5.0
|
)%
|
(18.6
|
)
|
|||||
|
Less: capitalized software development costs
|
(28.3
|
)
|
7.5
|
%
|
(26.4
|
)
|
70.3
|
%
|
(15.5
|
)
|
|||||
|
Non-GAAP free cash flow
|
$
|
137.7
|
|
25.7
|
%
|
$
|
109.6
|
|
15.2
|
%
|
$
|
95.1
|
|
||
|
44
|
|
2017 Form 10-K
|
Non-GAAP organic revenue growth
In addition, we use non-GAAP organic revenue growth and non-GAAP organic revenue growth on a constant currency basis, non-GAAP organic subscriptions revenue growth and non-GAAP organic recurring revenue growth, in analyzing our operating performance. We believe that these non-GAAP measures are useful to investors, as a supplement to GAAP measures, for evaluating the periodic growth of our business on a consistent basis. Each of these measures of non-GAAP organic revenue growth excludes incremental acquisition-related revenue attributable to companies acquired in the current fiscal year. For companies, if any, acquired in the immediately preceding fiscal year, each of these non-GAAP organic revenue growth measures reflects presentation of full year incremental non-GAAP revenue derived from such companies as if they were combined throughout the prior period, and they include the non-GAAP revenue attributable to those companies, as if there were no acquisition-related write-downs of acquired deferred revenue to fair value as required by GAAP. In addition, each of these non-GAAP organic revenue growth measures excludes prior period revenue associated with divested businesses. The exclusion of the prior period revenue is to present the results of the divested businesses within the results of the combined company for the same period of time in both the prior and current periods. We believe this presentation provides a more comparable representation of its current business’ organic revenue growth and revenue run-rate.
2017
|
Years ended December 31,
|
|||||||||
|
(dollars in millions)
|
2017
|
|
Change
|
|
2016
|
|
|||
|
GAAP revenue
|
$
|
788.3
|
|
7.9
|
%
|
$
|
730.8
|
|
|
|
Add: Non-GAAP acquisition-related revenue
(1)
|
(13.9
|
)
|
3.6
|
|
|||||
|
Total Non-GAAP adjustments
|
(13.9
|
)
|
3.6
|
|
|||||
|
Non-GAAP revenue
(2)
|
$
|
774.4
|
|
5.4
|
%
|
$
|
734.5
|
|
|
|
Foreign currency impact on Non-GAAP revenue
(3)
|
—
|
|
—
|
|
|||||
|
Non-GAAP revenue on constant currency basis
(3)
|
$
|
774.4
|
|
5.4
|
%
|
$
|
734.5
|
|
|
|
GAAP subscriptions revenue
|
$
|
522.9
|
|
21.9
|
%
|
$
|
429.0
|
|
|
|
(Less) Add: Non-GAAP acquisition-related revenue
(1)
|
(13.1
|
)
|
3.5
|
|
|||||
|
Total Non-GAAP adjustments
|
(13.1
|
)
|
3.5
|
|
|||||
|
Non-GAAP subscriptions revenue
|
$
|
509.7
|
|
17.9
|
%
|
$
|
432.5
|
|
|
|
GAAP subscriptions revenue
|
$
|
522.9
|
|
$
|
429.0
|
|
|||
|
GAAP maintenance revenue
|
128.2
|
|
146.9
|
|
|||||
|
GAAP recurring revenue
|
$
|
651.0
|
|
13.0
|
%
|
$
|
575.9
|
|
|
|
Add: Non-GAAP acquisition-related revenue
(1)
|
(13.1
|
)
|
3.6
|
|
|||||
|
Total Non-GAAP adjustments
|
(13.1
|
)
|
3.6
|
|
|||||
|
Non-GAAP recurring revenue
|
$
|
637.9
|
|
10.1
|
%
|
$
|
579.6
|
|
|
|
(1)
|
Non-GAAP acquisition-related revenue excludes incremental acquisition-related revenue calculated in accordance with GAAP that is attributable to companies acquired in the current fiscal year. For companies acquired in the immediately preceding fiscal year, non-GAAP acquisition-related revenue reflects presentation of full-year incremental non-GAAP revenue derived from such companies, as if they were combined throughout the prior period, and it includes the current period non-GAAP revenue from the acquisition-related deferred revenue write-down attributable to those companies.
|
|
(2)
|
Non-GAAP revenue for the prior year periods presented herein will not agree to non-GAAP revenue presented in the respective prior period quarterly financial information solely due to the manner in which non-GAAP organic revenue growth is calculated.
|
|
(3)
|
To determine non-GAAP organic revenue growth on a constant currency basis, revenues from entities reporting in foreign currencies were translated to U.S. Dollars using the comparable prior period's quarterly weighted average foreign currency exchange rates. The primary foreign currencies creating the impact are the Canadian Dollar, EURO, British Pound and Australian Dollar.
|
|
2017 Form 10-K
|
|
45
|
2016
|
Years ended December 31,
|
|||||||||
|
(dollars in millions)
|
2016
|
|
Change
|
|
2015
|
|
|||
|
GAAP revenue
|
$
|
730.8
|
|
14.6
|
%
|
$
|
637.9
|
|
|
|
Add: Non-GAAP acquisition-related revenue
(1)
|
3.6
|
|
35.5
|
|
|||||
|
Less: Revenue from divested businesses
(2)
|
—
|
|
(0.6
|
)
|
|||||
|
Total Non-GAAP adjustments
|
3.6
|
|
34.9
|
|
|||||
|
Non-GAAP revenue
(3)
|
$
|
734.5
|
|
9.2
|
%
|
$
|
672.8
|
|
|
|
Foreign currency impact on Non-GAAP revenue
(4)
|
4.2
|
|
—
|
|
|||||
|
Non-GAAP revenue on constant currency basis
(4)
|
$
|
738.6
|
|
9.8
|
%
|
$
|
672.8
|
|
|
|
GAAP subscriptions revenue
|
$
|
429.0
|
|
29.3
|
%
|
$
|
331.8
|
|
|
|
(Less) Add: Non-GAAP acquisition-related revenue
(1)
|
3.5
|
|
31.2
|
|
|||||
|
Less: Revenue from divested businesses
(2)
|
—
|
|
(0.2
|
)
|
|||||
|
Total Non-GAAP adjustments
|
3.5
|
|
31.0
|
|
|||||
|
Non-GAAP subscriptions revenue
|
$
|
432.5
|
|
19.2
|
%
|
$
|
362.7
|
|
|
|
GAAP subscriptions revenue
|
$
|
429.0
|
|
$
|
331.8
|
|
|||
|
GAAP maintenance revenue
|
146.9
|
|
153.8
|
|
|||||
|
GAAP recurring revenue
|
$
|
575.9
|
|
18.6
|
%
|
$
|
485.6
|
|
|
|
(Less) Add: Non-GAAP acquisition-related revenue
(1)
|
3.6
|
|
34.5
|
|
|||||
|
Less: Revenue from divested businesses
(2)
|
—
|
|
(0.4
|
)
|
|||||
|
Total Non-GAAP adjustments
|
3.6
|
|
34.1
|
|
|||||
|
Non-GAAP recurring revenue
|
$
|
579.6
|
|
11.5
|
%
|
$
|
519.7
|
|
|
|
(1)
|
Non-GAAP acquisition-related revenue excludes incremental acquisition-related revenue calculated in accordance with GAAP that is attributable to companies acquired in the current fiscal year. For companies acquired in the immediately preceding fiscal year, non-GAAP acquisition-related revenue reflects presentation of full-year incremental non-GAAP revenue derived from such companies, as if they were combined throughout the prior period, and it includes the current period non-GAAP revenue from the acquisition-related deferred revenue write-down attributable to those companies.
|
|
(2)
|
For businesses divested in the current fiscal year, non-GAAP organic revenue growth excludes a portion of the prior year period revenue associated with businesses divested of in the current fiscal year. The exclusion of the prior period revenue is to present the results of the divested business with the results of the combined company for the same period of time in both the prior and current periods.
|
|
(3)
|
Non-GAAP revenue for the prior year periods presented herein will not agree to non-GAAP revenue presented in the respective prior period quarterly financial information solely due to the manner in which non-GAAP organic revenue growth is calculated.
|
|
(4)
|
To determine non-GAAP organic revenue growth on a constant currency basis, revenues from entities reporting in foreign currencies were translated to U.S. Dollars using the comparable prior period's quarterly weighted average foreign currency exchange rates. The primary foreign currencies creating the impact are the Canadian Dollar, EURO, British Pound and Australian Dollar.
|
Seasonality
Our revenues normally fluctuate as a result of certain seasonal variations in our business. Our transaction revenue has historically been at its lowest in the first quarter due to the timing of customer fundraising initiatives and events. Our revenue from payment processing services has historically increased during the fourth quarter due to year-end giving. Our revenue from professional services has historically been lower in the first quarter when many of those services commence and in the fourth quarter due to the holiday season. As a result of these and other factors, our total revenue has historically been lower in the first quarter than in the remainder of our fiscal year, with the third and fourth quarters historically achieving the highest total revenues. Our expenses, however, do not vary significantly as a result of these factors, but do fluctuate on a quarterly basis due to varying timing of expenditures. Our cash flow from operations normally fluctuates quarterly due to the combination of the timing of customer contract renewals including renewals associated with customers of acquired companies, delivery of professional services and occurrence of customer events, the payment of bonuses, as well as merit-based salary increases, among other factors. Historically, due to lower revenues in our first quarter, combined with the payment of bonuses from the prior year in our first quarter, our cash flow from operations has been lowest in our first quarter, and due to the timing of customer contract renewals, many of which take place at or near the beginning
|
46
|
|
2017 Form 10-K
|
of our third quarter, our cash flow from operations has been lower in our second quarter as compared to our third and fourth quarters. Partially offsetting these favorable drivers of cash flow from operations in our third and fourth quarters are merit-based salary increases, which are generally effective in April each year. In addition, deferred revenues can vary on a seasonal basis for the same reasons. These patterns may change as a result of the continued shift to online giving, growth in volume of transactions for which we process payments, or as a result of acquisitions, new market opportunities, new solution introductions or other factors. Our cash flow from financing is negatively impacted in our first quarter when most of our equity awards vest, as we pay taxes on behalf of our employees related to the settlement or exercise of equity awards.
|
Liquidity and Capital Resources
|
The following table presents selected financial information about our financial position:
|
(dollars in millions)
|
December 31,
2017 |
|
Change
|
|
December 31,
2016 |
|
|||
|
Cash and cash equivalents
|
$
|
29.8
|
|
76.5
|
%
|
$
|
16.9
|
|
|
|
Property and equipment, net
|
42.2
|
|
(16.0
|
)%
|
50.3
|
|
|||
|
Software development costs, net
|
54.1
|
|
43.9
|
%
|
37.6
|
|
|||
|
Total carrying value of debt
|
438.2
|
|
28.0
|
%
|
342.4
|
|
|||
|
Working capital
|
(181.9
|
)
|
(5.6
|
)%
|
(172.2
|
)
|
|||
|
Working capital excluding deferred revenue
|
94.6
|
|
30.8
|
%
|
72.3
|
|
|||
The following table presents selected financial information about our cash flows:
|
Years ended December 31,
|
|||||||||||||||
|
(dollars in millions)
|
2017
|
|
Change
|
|
2016
|
|
Change
|
|
2015
|
|
|||||
|
Net cash provided by operating activities
|
$
|
176.3
|
|
14.8
|
%
|
$
|
153.6
|
|
18.9
|
%
|
$
|
129.2
|
|
||
|
Net cash used in investing activities
|
(184.9
|
)
|
289.8
|
%
|
(47.4
|
)
|
(66.4
|
)%
|
(141.4
|
)
|
|||||
|
Net cash provided by (used in) financing activities
|
278.6
|
|
(3,360.5
|
)%
|
(8.5
|
)
|
(106.6
|
)%
|
129.8
|
|
|||||
Our principal sources of liquidity are operating cash flow, funds available under the 2017 Credit Facility and cash on hand. Our operating cash flow depends on continued customer renewals of our subscription, maintenance and support arrangements and market acceptance of our solutions and services. Based on current estimates of revenue and expenses, we believe that the currently available sources of funds and anticipated cash flows from operations will be adequate for at least the next twelve months to finance our operations, fund anticipated capital expenditures, meet our debt obligations and pay dividends. Dividend payments are not guaranteed and our Board of Directors may decide, in its absolute discretion, at any time and for any reason, not to declare and pay further dividends and/or repurchase our common stock. To the extent we undertake future material acquisitions, investments or unanticipated capital expenditures, we may require additional capital. In that context, we regularly evaluate opportunities to enhance our capital structure including through potential debt or equity issuances.
At
December 31, 2017
, our total cash and cash equivalents balance included approximately
$17.2 million
of cash that was held outside the U.S. While these funds may not be needed to fund our U.S. operations for at least the next twelve months, if we need these funds, we may be required to accrue and pay taxes to repatriate a portion of the funds. We currently do not intend nor anticipate a need to repatriate our cash held outside the U.S.
Operating cash flow
Throughout
2017
,
2016
and
2015
, our cash flows from operations were derived principally from: (i) our earnings from on-going operations prior to non-cash expenses such as depreciation, amortization, stock-based compensation, loss on sale of business, impairment of capitalized software development costs, amortization of deferred financing costs and debt discount and adjustments to our provision for sales returns and allowances; and (ii) changes in our working capital.
|
2017 Form 10-K
|
|
47
|
Working capital changes are composed of changes in accounts receivable, prepaid expenses and other assets, trade accounts payable, accrued expenses and other liabilities, and deferred revenue.
2017
vs.
2016
Cash flow from operations associated with working capital decreased
$5.0 million
during 2017 when compared to 2016, primarily due to:
|
•
|
an increase in prepaid taxes during 2017 related to tax planning; partially offset by
|
|
•
|
a decrease in bonus payments.
|
2016
vs.
2015
Cash flow from operations associated with working capital decreased
$7.3 million
during 2016 when compared to 2015, primarily due to:
|
•
|
an increase in current period bonus payments as a result of an increase in amounts accrued as of December 31, 2015 for over-performance against 2015 targets, as well as a change in the timing of payouts for certain bonus plans, from semi-annually to quarterly;
|
|
•
|
a larger increase in trade accounts payable during 2015 than in 2016; partially offset by
|
|
•
|
the use of and reduction in amounts prepaid for incomes taxes.
|
Investing cash flow
During 2018, we expect capital expenditures to be between approximately $45.0 million and $55.0 million, which includes purchases of property and equipment and estimated cash outlays for capitalized software development costs. Refer to the commitments and contingencies subsection below for future minimum commitments related to purchase obligations.
2017
vs.
2016
Net cash used in investing activities of
$184.9 million
increased by
$137.5 million
during 2017, when compared to 2016.
During 2017, we used net cash of
$146.8 million
for the acquisitions of AcademicWorks and JustGiving compared to $3.4 million spent on investments in acquired companies in 2016. We used
$28.3 million
of cash for software development costs, which was up modestly from cash spent during 2016, as we continue to make investments in innovation, quality and the integration of our solutions cloud-based solutions.
We also spent
$10.2 million
of cash for purchases of property and equipment during 2017, which was down
$7.5 million
from cash spent in 2016. The decrease in cash outlays for property and equipment was primarily driven by a shift toward leasing certain equipment that we have historically purchased. Cash outlays for operating leases are presented in operating cash flows.
2016
vs.
2015
Net cash used in investing activities of $47.4 million decreased by
$93.9 million
during 2016, when compared to 2015.
During 2016, we used $26.4 million of cash for software development costs, which was up $10.9 million from cash spent during 2015. The increase in cash outlays for software development costs was primarily driven by development activities related to our next generation NXT and Luminate cloud-based solutions.
We spent $17.7 million of cash for purchases of property and equipment during 2016, which was relatively consistent with the amount spent in 2015, as we continued to invest in our information technology platforms and infrastructure used in the delivery of our solutions to customers as well as various facilities upgrades.
During 2016, we used $3.9 million of cash for the acquisition of Attentive.ly and received an insignificant post-closing working capital adjustment associated with the prior year acquisition of Smart Tuition compared to $106.7 million used in 2015 for the acquisition of Smart Tuition.
|
48
|
|
2017 Form 10-K
|
Financing cash flow
2017
vs.
2016
During 2017, we had a net
increase
in borrowings of
$95.4 million
, which was used to finance our acquisition of JustGiving, compared to a net decrease in borrowings of $66.4 million in 2016. We also paid
$3.1 million
in financing costs as a result of refinancing our credit facility.
We paid
$24.0 million
to satisfy tax obligations of employees upon settlement or exercise of equity awards during 2017 compared to
$15.4 million
during 2016. The amount of taxes paid by us on the behalf of employees related to the settlement or exercise of equity awards varies from period to period based upon the timing of grants and vesting, employee exercise decisions, as well as the market price for shares of our common stock at the time of settlement. Due to a change in the timing of our annual equity award grants, most of our equity awards now vest in our first quarter. In addition, during 2017, we paid dividends of
$23.1 million
, which was relatively consistent with
2016
.
Cash flow from financing activities associated with changes in restricted cash due to customers
increased
$130.7 million
during 2017 when compared to 2016.
2016
vs.
2015
During 2016, we had a net decrease in borrowings of $66.4 million and paid dividends of $22.8 million, which was relatively consistent with the amount paid in 2015.
Cash flow from financing activities associated with changes in restricted cash due to customers increased
$61.7 million
during 2016 when compared to 2015.
2017 Credit Facility
In
June 2017
, we entered into a
five
-year
$700.0 million
senior credit facility (the "
2017 Credit Facility
). Upon closing, we drew
$300.0 million
on a term loan and
$110.0 million
in revolving credit loans, which was used to repay all amounts outstanding under our previous credit facility and for other general corporate purposes.
We have drawn on our credit facility from time to time to help us meet financial needs, such as financing for business acquisitions. At
December 31, 2017
, our available borrowing capacity under the
2017 Credit Facility
was
$254.2 million
. The
2017 Credit Facility
matures in
June 2022
.
At
December 31, 2017
, the carrying amount of our debt under the 2017 Credit Facility was
$437.1 million
. Our average daily borrowings were
$391.0 million
during
2017
.
Following is a summary of the financial covenants under our credit facility:
|
Financial Covenant
|
Requirement
|
Ratio as of December 31, 2017
|
|
Net Leverage Ratio
|
≤ 3.50 to 1.00
|
2.13 to 1.00
|
|
Interest Coverage Ratio
|
≥ 2.50 to 1.00
|
16.08 to 1.00
|
Under the
2017 Credit Facility
, we also have restrictions on our ability to declare and pay dividends and our ability to repurchase shares of our common stock. In order to pay any cash dividends and/or repurchase shares of stock: (i) no default or event of default shall have occurred and be continuing under the
2017 Credit Facility
, and (ii) our pro forma net leverage ratio, as set forth in the
2017 Credit Facility
, must be 0.25 less than the net leverage ratio requirement at the time of dividend declaration or share repurchase.
At December 31, 2017, we were in compliance with our debt covenants under the 2017 Credit Facility.
|
2017 Form 10-K
|
|
49
|
Commitments and contingencies
As of
December 31, 2017
, we had contractual obligations with future minimum commitments as follows:
|
Payments due by period
|
|||||||||||||||
|
(in millions)
|
Total
|
|
Less than 1 year
|
|
1-3 years
|
|
3-5 years
|
|
More than 5 years
|
|
|||||
|
Recorded contractual obligations:
|
|||||||||||||||
|
Debt
(1)
|
$
|
440.3
|
|
$
|
8.6
|
|
$
|
15.0
|
|
$
|
416.8
|
|
$
|
—
|
|
|
Unrecorded contractual obligations:
|
|||||||||||||||
|
Operating leases
(2)
|
189.3
|
|
22.4
|
|
39.1
|
|
33.3
|
|
94.5
|
|
|||||
|
Interest payments on debt
(3)
|
54.8
|
|
12.6
|
|
25.2
|
|
17.0
|
|
—
|
|
|||||
|
Purchase obligations
(4)
|
66.8
|
|
29.7
|
|
37.1
|
|
—
|
|
—
|
|
|||||
|
Total contractual obligations
|
$
|
751.2
|
|
$
|
73.2
|
|
$
|
116.4
|
|
$
|
467.1
|
|
$
|
94.5
|
|
|
(1)
|
Represents principal payments only, under the following assumptions: (i) that the amounts outstanding under the
2017 Credit Facility
and our other debt at
December 31, 2017
will remain outstanding until maturity, with minimum payments occurring as currently scheduled, and (ii) that there are no assumed future borrowings on the 2017 Revolving Facility for the purposes of determining minimum commitment amounts.
|
|
(2)
|
Our commitments related to operating leases have not been reduced by incentive payments and reimbursement of leasehold improvements.
|
|
(3)
|
The actual interest expense recognized in our consolidated statements of comprehensive income will depend on the amount of debt, the length of time the debt is outstanding and the interest rate, which could be different from our assumptions described in (1) above.
|
|
(4)
|
We have contractual obligations for third-party technology used in our solutions and for other service we purchase as part of our normal operations. In certain cases, these arrangements require a minimum annual purchase commitment by us.
|
The term loan under the 2017 Credit Facility and our other debt require periodic principal payments. The balance of the term loans and any amounts drawn on the revolving credit loans are due upon maturity of the
2017 Credit Facility
in
June 2022
.
The total liability for uncertain tax positions as of
December 31, 2017
and
December 31, 2016
, was
$5.2 million
and
$3.1 million
, respectively. Our accrued interest and penalties related to tax positions taken on our tax returns was
insignificant
as of
December 31, 2017
and
2016
.
In
February 2018
, our Board of Directors approved our annual dividend rate of
$0.48
per share to be made in quarterly payments. Dividends at this annual rate would aggregate to
$23.5 million
assuming
49.0 million
shares of common stock are outstanding, although dividends are not guaranteed and our Board of Directors may decide, in its absolute discretion, to change or suspend dividend payments at any time for any reason. Our ability to continue to declare and pay dividends quarterly this year and beyond might be restricted by, among other things, the terms of the
2017 Credit Facility
, general economic conditions and our ability to generate adequate operating cash flow.
On
February 6, 2018
, our Board of Directors declared a
first
quarter dividend of
$0.12
per share payable on
March 15, 2018
to stockholders of record on
February 28, 2018
.
|
Off-Balance Sheet Arrangements
|
As of
December 31, 2017
, we did not have any off-balance sheet arrangements as defined in Item 303(a)(4)(ii) of Regulation S-K promulgated by the SEC, that have or are reasonably likely to have, a current or future effect on our financial condition, changes in our financial condition, revenues or expenses, results of operations, liquidity, capital expenditures or capital resources that is material to investors.
|
50
|
|
2017 Form 10-K
|
|
Foreign Currency Exchange Rates
|
Approximately
10%
of our total revenue for
2017
was generated by operations outside the United States. We do not have significant operations in countries in which the economy is considered to be highly inflationary. Our consolidated financial statements are denominated in U.S. dollars and, accordingly, changes in the exchange rate between foreign currencies and the U.S. dollar will affect the translation of our subsidiaries’ financial results into U.S. dollars for purposes of reporting our consolidated financial results. The accumulated currency translation adjustment, recorded within other comprehensive loss as a component of stockholders’ equity, was a loss of
$1.4 million
and
$0.5 million
as of
December 31, 2017
and
December 31, 2016
, respectively.
The vast majority of our contracts are entered into by our U.S. or U.K. entities. The contracts entered into by the U.S. entity are almost always denominated in U.S. dollars or Canadian dollars, and contracts entered into by our U.K., Australian and Irish subsidiaries are generally denominated in British Pounds, Australian dollars and Euros, respectively. Historically, as the U.S. dollar weakened, foreign currency translation resulted in an increase in our revenues and expenses denominated in non-U.S. currencies. Conversely, as the U.S. dollar strengthened, foreign currency translation resulted in a decrease in our revenues and expenses denominated in non-U.S. currencies. During
2017
, foreign translation resulted in an increase in our revenues and expenses denominated in non-U.S. currencies. Though we have exposure to fluctuations in currency exchange rates, the impact has generally not been material to our consolidated results of operations or financial position. During
2017
, the fluctuation in foreign currency exchange rates had insignificant impacts on our total revenue and income from operations. We will continue monitoring such exposure and take action as appropriate. To determine the impacts on revenue (or income from operations) from fluctuations in currency exchange rates, current period revenues (or income from operations) from entities reporting in foreign currencies were translated into U.S. dollars using the comparable prior year period's weighted average foreign currency exchange rates. These impacts are non-GAAP financial information and are not in accordance with, or an alternative to, information prepared in accordance with GAAP.
|
Inflation
|
We do not believe that inflation has had a material effect on our business, financial condition or results of operations. If our costs were to become subject to significant inflationary pressures, we may not be able to fully offset such higher costs through price increases. Our inability or failure to do so could harm our business, financial condition and results of operations. In addition, if inflationary pressures impact the rate of giving to our customers, there could be adverse impacts to our business, financial condition and results of operations.
|
Critical Accounting Estimates
|
Our discussion and analysis of financial condition and results of operations are based upon our consolidated financial statements, which have been prepared in accordance with accounting principles generally accepted in the United States ("GAAP"). The preparation of these financial statements requires us to make estimates and assumptions that affect the reported amounts of assets and liabilities and disclosure of contingent assets and liabilities at the date of the financial statements, as well as the reported amounts of revenues and expenses during the reporting periods. On an ongoing basis, we reconsider and evaluate our estimates and assumptions, including those that impact revenue recognition, long-lived and intangible assets including goodwill, income taxes, and business combinations, among others.
We base our estimates on historical experience, current trends and various other assumptions that we believe to be reasonable under the circumstances, the results of which form the basis for making judgments about the carrying values of assets and liabilities that are not readily apparent from other sources. Actual results could materially differ from any of our estimates under different assumptions or conditions. Our significant accounting policies are discussed in
Note 2
of our consolidated financial statements in this report. We believe the accounting estimates listed below are the most critical to aid in fully understanding and evaluating our reported financial results, and they require our most difficult, subjective or complex judgments, resulting from the need to make estimates about the effect of matters that are inherently uncertain.
|
2017 Form 10-K
|
|
51
|
|
Revenue Recognition
|
||
|
Description
|
Judgments and Uncertainties
|
Effect if Actual Results Differ
From Assumptions
|
|
See Note 2 to our consolidated financial statements in this report for a complete discussion of our revenue recognition policies.
We recognize revenue when all of the following conditions are met:
(1) Persuasive evidence of an arrangement exists;
(2) The solutions or services have been delivered;
(3) The fee is fixed or determinable; and
(4) Collection of the resulting receivable is probable.
To the extent that our customers are billed for our solutions and services in advance of meeting each of the conditions above, we record such amounts in deferred revenue.
|
Our revenue recognition accounting methodology contains uncertainties because it requires us to make significant estimates and assumptions, and to apply judgment.
For example, for arrangements that have multiple elements and do not include software licenses, we must exercise judgment and use estimates in order to (1) determine whether and when each element has been delivered; (2) determine the fair value of each element using the selling price hierarchy of VSOE of fair value if available, third-party evidence ("TPE") if VSOE is not available, and best estimate of selling price ("BESP") if neither VSOE nor TPE is available; and (3) allocate the total price among the various elements based on the relative selling price method.
In addition, we exercise judgment in certain transactions when determining whether we should recognize revenue based on the gross amount billed to a customer (as a principal) or the net amount retained (as an agent). These judgments are based on the predominant weighting of factors identified in accounting guidance.
|
If we were to change any of these judgments or estimates, it could cause a material increase or decrease in the amount of revenue or deferred revenue that we report in a particular period.
|
|
Business Combinations
|
||
|
Description
|
Judgments and Uncertainties
|
Effect if Actual Results Differ
From Assumptions
|
|
We allocate the purchase price of an acquired business to its identifiable assets acquired and liabilities assumed at the acquisition date based upon their estimated fair values. The excess of the purchase price over the amount allocated to the assets acquired and liabilities assumed, if any, is recorded as goodwill.
We use available information to estimate fair values. We typically engage outside appraisal firms to assist in the fair value determination of long-lived and identifiable intangible assets, and any other significant assets or liabilities. We adjust the preliminary purchase price allocation, as necessary, up to one year after the acquisition closing date as we obtain new information about facts and circumstances that existed as of the closing date.
|
Our purchase price allocation methodology contains uncertainties because it requires us to make significant estimates and assumptions, and to apply judgment to estimate the fair value of assets acquired and liabilities assumed, especially with respect to long-lived and intangible assets.
Management estimates the fair value of assets acquired and liabilities assumed based on quoted market prices, the carrying value of the acquired assets and widely accepted valuation techniques, including discounted cash flows and market multiple analyses.
Critical estimates in valuing intangible assets include, but are not limited to, estimates about: future expected cash flows from customer contracts and relationships, proprietary technology and non-compete agreements; the acquired company's brand awareness and market position, the market awareness of the acquired company's branded technology solutions and services, assumptions about the period of time the brands will continue to be valuable; as well as expected costs to develop any in-process research and development into commercially viable solutions and estimated cash flows from the projects when completed, and discount rates. Our estimates of fair value are based upon assumptions we believe to be reasonable, but which are inherently uncertain and unpredictable. Assumptions may be incomplete or inaccurate, and unanticipated events and circumstances may occur.
|
If actual results are materially different than the assumptions we used to determine fair value of the assets acquired and liabilities assumed through a business combination as well as the estimated useful lives of the acquired intangible assets, it is possible that adjustments to the carrying values of such assets and liabilities will have a material impact on our financial position and results of operations.
See Note 3 to our consolidated financial statements in this report for information regarding our business acquisitions.
|
|
52
|
|
2017 Form 10-K
|
|
Income Taxes
|
||
|
Description
|
Judgments and Uncertainties
|
Effect if Actual Results Differ
From Assumptions
|
|
We make estimates and judgments in accounting for income taxes. Our income tax returns, like those of most companies, are periodically audited by domestic and foreign tax authorities.
We measure and recognize uncertain tax positions. To recognize uncertain tax positions, we must first determine if it is more likely than not that the position will be sustained upon audit. We must then measure the benefit as the largest amount that is more than 50% likely of being realized upon ultimate settlement.
We make estimates in determining tax assets and liabilities, which arise from differences in the timing of recognition of revenue and expense for tax and financial reporting purposes. We record valuation allowances to reduce our deferred tax assets to the amount expected to be realized.
|
The calculation of our income tax provision requires estimates due to transactions, credits and calculations where the ultimate tax determination is uncertain. Uncertainties arise as a consequence of the actual source of taxable income between domestic and foreign locations, the outcome of tax audits and the ultimate utilization of tax credits.
Our effective income tax rate is also affected by changes in the geographic distribution of our earnings or losses, changes in tax law in jurisdictions where we conduct business.
Significant judgment is required in the identification and measurement of uncertain tax positions. Our liability for unrecognized tax benefits contains uncertainties because management is required to make assumptions and to apply judgment to estimate the exposures associated with our various filing positions.
In assessing the adequacy of a recorded valuation allowance significant judgment is required. We consider all positive and negative evidence and a variety of factors including the scheduled reversal of deferred tax liabilities, historical and projected future taxable income, and prudent and feasible tax planning strategies.
|
Although we believe that the judgments and estimates discussed herein are reasonable, actual results could differ, and we may be exposed to losses or gains that could be material.
To the extent actual results differ from estimated amounts recorded, such differences will impact the income tax provision in the period in which the determination is made.
If we determine there is less than a 50% likelihood that we will be able to use a deferred tax asset in the future in excess of its net carrying value, then an adjustment to the deferred tax asset valuation allowance is made to increase income tax expense, thereby reducing net income in the period such determination was made.
|
|
2017 Form 10-K
|
|
53
|
|
Long-lived and Intangible Assets including Goodwill
|
||
|
Description
|
Judgments and Uncertainties
|
Effect if Actual Results Differ
From Assumptions
|
|
We review our long-lived and identifiable intangible assets for impairment when events or changes in circumstances indicate the carrying amount may not be recoverable. If such events or changes in circumstances occur, we use the undiscounted cash flow method to determine whether the asset is impaired. To the extent that the carrying value of the asset exceeds the undiscounted cash flows over the estimated remaining life of the asset, we measure the impairment using discounted cash flows.
We test goodwill for impairment at the reporting unit level annually during our fourth quarter, or more frequently if events or changes in circumstances indicate that the asset might be impaired. We had one reporting unit for our fourth quarter 2017 assessment (see Note 2 to our consolidated financial statements in this report).
We have the option to first assess qualitative factors to determine whether it is more likely than not that the fair value of a reporting unit is less than its carrying amount. To the extent the qualitative factors indicate that the fair value is likely less than the carrying amount, we compare the fair value of the reporting unit with its carrying amount.
If more than one reporting unit is identified, we estimate fair value for each reporting unit based on projected future cash flows discounted using our weighted average cost of capital. If a single reporting unit is identified, we estimate fair value using market-based methods including the use of market capitalization and consideration of a control premium. In either case, if the carrying amount exceeds its fair value, an impairment loss is recorded for the excess.
|
We use significant judgment in assessing qualitative factors to determine whether events and circumstances indicate that it is more than 50% likely that an indefinite-lived intangible asset is impaired.
When measuring impairment of an asset using discounted cash flows, we make assumptions and apply judgment in estimating future cash flows and asset fair values, including annual revenue growth rates, a terminal year growth rate and selecting a discount rate that reflects the risk inherent in future cash flows.
When the optional qualitative assessment of goodwill impairment is performed, significant judgment is required in the assessment of qualitative factors including but not limited to an evaluation of macroeconomic conditions as they relate to our business, industry and market trends, as well as the overall future financial performance of our reporting units and future opportunities in the markets in which they operate.
When using projected future cash flows for the quantitative goodwill impairment test, a number of significant assumptions and estimates are involved in estimating the fair value of each reporting unit, including revenue growth rates, operating margins, capital spending, discount rate, and working capital changes. Additionally, we make certain judgments and assumptions in allocating assets and liabilities to determine the carrying values for each of our reporting units.
|
We have not made any material changes in the accounting methodology we use to assess impairment loss during the years ended December 31, 2017, 2016 and 2015, except for the use of market-based methods, including the use of market capitalization to estimate the fair value of our one reporting unit in the fourth quarter of 2017.
No impairments to our long-lived and intangible assets including goodwill occurred during the years ended December 31, 2017 and 2016.
During the year ended December 31, 2015, we recorded insignificant impairment charges against previously capitalized software development costs. The charges reduced the carrying value of those costs to zero. The impairment charges resulted from obtaining software solutions through the acquisitions of Smart Tuition in 2015 and determining that it was no longer probable that certain computer software that was being developed would be placed into service.
We do not believe there is a reasonable likelihood that there will be a material change in the future estimates or assumptions we use to assess impairment losses. However, if actual results are not consistent with our estimates or assumptions, we may be exposed to an impairment charge that could materially adversely impact our consolidated financial position and results of operations.
In order to evaluate the sensitivity of any quantitative fair value calculations on our most recent goodwill impairment test, a hypothetical 10% decrease to the fair value of our one reporting unit was calculated. This hypothetical 10% decrease would still result in excess fair value over carrying value for the reporting unit as of October 1, 2017.
|
|
Recently Issued Accounting Pronouncements
|
For a discussion of the impact that recently issued accounting pronouncements are expected to have on our financial position and results of operations when adopted in the future, see
Note 2
of our consolidated financial statements in this report.
We have market rate sensitivity for interest rates and foreign currency exchange rates.
|
Interest Rate Risk
|
Our variable rate debt is our primary financial instrument with market risk exposure for changing interest rates. We manage our variable rate interest rate risk through a combination of short-term and long-term borrowings and the use of derivative instruments entered into for hedging purposes. Due to the nature of our debt, the materiality of the fair values of the derivative instruments and the highly liquid, short-term nature and level of our cash and cash equivalents as of
December 31, 2017
, we believe there is no material risk of exposure to changing interest rates for those positions. There were no significant changes in how we manage interest rate risk between
December 31, 2016
and
December 31, 2017
.
|
54
|
|
2017 Form 10-K
|
|
Foreign Currency Risk
|
For a discussion of our exposure to foreign currency exchange rate fluctuations, see “Management’s discussion and analysis of financial condition and results of operations — Foreign Currency Exchange Rates” in Item 7 of this report.
BLACKBAUD, INC.
Index to consolidated financial statements
|
2017 Form 10-K
|
|
55
|
REPORT OF INDEPENDENT REGISTERED PUBLIC ACCOUNTING FIRM
To the Board of Directors and Stockholders of Blackbaud, Inc.
Opinions on the Financial Statements and Internal Control over Financial Reporting
We have audited the accompanying consolidated balance sheets of Blackbaud, Inc. and its subsidiaries as of December 31, 2017 and 2016, and the related consolidated statements of comprehensive income, cash flow and stockholders’ equity for each of the three years in the period ended December 31, 2017, including the related notes (collectively referred to as the “consolidated financial statements”). We also have audited the Company's internal control over financial reporting as of December 31, 2017, based on criteria established in Internal Control - Integrated Framework (2013) issued by the Committee of Sponsoring Organizations of the Treadway Commission (COSO).
In our opinion, the consolidated financial statements referred to above present fairly, in all material respects, the financial position of the Company as of December 31, 2017 and 2016, and the results of their operations and their cash flows for each of the three years in the period ended December 31, 2017 in conformity with accounting principles generally accepted in the United States of America. Also in our opinion, the Company maintained, in all material respects, effective internal control over financial reporting as of December 31, 2017, based on criteria established in Internal Control - Integrated Framework (2013) issued by the COSO.
Change in Accounting Principle
As discussed in Note 2 to the consolidated financial statements, the Company changed the manner in which it accounts for restricted cash in 2017 and the manner in which it accounts for stock compensation in 2016.
Basis for Opinions
The Company's management is responsible for these consolidated financial statements, for maintaining effective internal control over financial reporting, and for its assessment of the effectiveness of internal control over financial reporting, included in the accompanying Management's Report on Internal Control over Financial Reporting. Our responsibility is to express opinions on the Company’s consolidated financial statements and on the Company's internal control over financial reporting based on our audits. We are a public accounting firm registered with the Public Company Accounting Oversight Board (United States) ("PCAOB") and are required to be independent with respect to the Company in accordance with the U.S. federal securities laws and the applicable rules and regulations of the Securities and Exchange Commission and the PCAOB.
We conducted our audits in accordance with the standards of the PCAOB. Those standards require that we plan and perform the audits to obtain reasonable assurance about whether the consolidated financial statements are free of material misstatement, whether due to error or fraud, and whether effective internal control over financial reporting was maintained in all material respects.
Our audits of the consolidated financial statements included performing procedures to assess the risks of material misstatement of the consolidated financial statements, whether due to error or fraud, and performing procedures that respond to those risks. Such procedures included examining, on a test basis, evidence regarding the amounts and disclosures in the consolidated financial statements. Our audits also included evaluating the accounting principles used and significant estimates made by management, as well as evaluating the overall presentation of the consolidated financial statements. Our audit of internal control over financial reporting included obtaining an understanding of internal control over financial reporting, assessing the risk that a material weakness exists, and testing and evaluating the design and operating effectiveness of internal control based on the assessed risk. Our audits also included performing such other procedures as we considered necessary in the circumstances. We believe that our audits provide a reasonable basis for our opinions.
Definition and Limitations of Internal Control over Financial Reporting
A company’s internal control over financial reporting is a process designed to provide reasonable assurance regarding the reliability of financial reporting and the preparation of financial statements for external purposes in accordance with generally accepted accounting principles. A company’s internal control over financial reporting includes those policies and procedures that (i) pertain to the maintenance of records that, in reasonable detail, accurately and fairly reflect the
|
56
|
|
2017 Form 10-K
|
transactions and dispositions of the assets of the company; (ii) provide reasonable assurance that transactions are recorded as necessary to permit preparation of financial statements in accordance with generally accepted accounting principles, and that receipts and expenditures of the company are being made only in accordance with authorizations of management and directors of the company; and (iii) provide reasonable assurance regarding prevention or timely detection of unauthorized acquisition, use, or disposition of the company’s assets that could have a material effect on the financial statements.
Because of its inherent limitations, internal control over financial reporting may not prevent or detect misstatements. Also, projections of any evaluation of effectiveness to future periods are subject to the risk that controls may become inadequate because of changes in conditions, or that the degree of compliance with the policies or procedures may deteriorate.
/
S
/ P
RICEWATERHOUSE
C
OOPERS
LLP
Raleigh, North Carolina
February 20, 2018
We have served as the Company's auditor since 2000.
|
2017 Form 10-K
|
|
57
|
Blackbaud, Inc.
Consolidated balance sheets
|
(dollars in thousands)
|
December 31,
2017 |
|
December 31,
2016 |
|
||
|
Assets
|
||||||
|
Current assets:
|
||||||
|
Cash and cash equivalents
|
$
|
29,830
|
|
$
|
16,902
|
|
|
Restricted cash due to customers
|
610,344
|
|
353,771
|
|
||
|
Accounts receivable, net of allowance of $5,141 and $3,291 at December 31, 2017 and December 31, 2016, respectively
|
96,293
|
|
88,932
|
|
||
|
Customer funds receivable
|
1,536
|
|
—
|
|
||
|
Prepaid expenses and other current assets
|
56,099
|
|
48,314
|
|
||
|
Total current assets
|
794,102
|
|
507,919
|
|
||
|
Property and equipment, net
|
42,243
|
|
50,269
|
|
||
|
Software development costs, net
|
54,098
|
|
37,582
|
|
||
|
Goodwill
|
530,249
|
|
438,240
|
|
||
|
Intangible assets, net
|
314,651
|
|
253,676
|
|
||
|
Other assets
|
24,083
|
|
22,524
|
|
||
|
Total assets
|
$
|
1,759,426
|
|
$
|
1,310,210
|
|
|
Liabilities and stockholders’ equity
|
||||||
|
Current liabilities:
|
||||||
|
Trade accounts payable
|
$
|
24,693
|
|
$
|
23,274
|
|
|
Accrued expenses and other current liabilities
|
54,399
|
|
54,196
|
|
||
|
Due to customers
|
611,880
|
|
353,771
|
|
||
|
Debt, current portion
|
8,576
|
|
4,375
|
|
||
|
Deferred revenue, current portion
|
276,456
|
|
244,500
|
|
||
|
Total current liabilities
|
976,004
|
|
680,116
|
|
||
|
Debt, net of current portion
|
429,648
|
|
338,018
|
|
||
|
Deferred tax liability
|
37,597
|
|
29,558
|
|
||
|
Deferred revenue, net of current portion
|
3,643
|
|
6,440
|
|
||
|
Other liabilities
|
5,632
|
|
8,533
|
|
||
|
Total liabilities
|
1,452,524
|
|
1,062,665
|
|
||
|
Commitments and contingencies (see Note 11)
|
|
|
||||
|
Stockholders’ equity:
|
||||||
|
Preferred stock; 20,000,000 shares authorized, none outstanding
|
—
|
|
—
|
|
||
|
Common stock, $0.001 par value; 180,000,000 shares authorized, 58,551,761 and 57,672,401 shares issued at December 31, 2017 and December 31, 2016, respectively
|
59
|
|
58
|
|
||
|
Additional paid-in capital
|
351,042
|
|
310,452
|
|
||
|
Treasury stock, at cost; 10,475,794 and 10,166,801 shares at December 31, 2017 and December 31, 2016, respectively
|
(239,199
|
)
|
(215,237
|
)
|
||
|
Accumulated other comprehensive loss
|
(649
|
)
|
(457
|
)
|
||
|
Retained earnings
|
195,649
|
|
152,729
|
|
||
|
Total stockholders’ equity
|
306,902
|
|
247,545
|
|
||
|
Total liabilities and stockholders’ equity
|
$
|
1,759,426
|
|
$
|
1,310,210
|
|
|
The accompanying notes are an integral part of these consolidated financial statements.
|
||||||
|
58
|
|
2017 Form 10-K
|
Blackbaud, Inc.
|
(dollars in thousands, except per share amounts)
|
Years ended December 31,
|
||||||||
|
2017
|
|
2016
|
|
2015
|
|
||||
|
Revenue
|
|||||||||
|
Subscriptions
|
$
|
522,865
|
|
$
|
428,987
|
|
$
|
331,759
|
|
|
Maintenance
|
128,166
|
|
146,946
|
|
153,801
|
|
|||
|
Services and other
|
137,275
|
|
154,882
|
|
152,380
|
|
|||
|
Total revenue
|
788,306
|
|
730,815
|
|
637,940
|
|
|||
|
Cost of revenue
|
|||||||||
|
Cost of subscriptions
|
242,740
|
|
213,883
|
|
167,341
|
|
|||
|
Cost of maintenance
|
22,973
|
|
22,094
|
|
27,066
|
|
|||
|
Cost of services and other
|
96,191
|
|
103,243
|
|
110,224
|
|
|||
|
Total cost of revenue
|
361,904
|
|
339,220
|
|
304,631
|
|
|||
|
Gross profit
|
426,402
|
|
391,595
|
|
333,309
|
|
|||
|
Operating expenses
|
|||||||||
|
Sales, marketing and customer success
|
173,525
|
|
155,754
|
|
123,646
|
|
|||
|
Research and development
|
89,911
|
|
89,870
|
|
84,636
|
|
|||
|
General and administrative
|
94,870
|
|
81,331
|
|
76,084
|
|
|||
|
Amortization
|
3,271
|
|
2,840
|
|
2,231
|
|
|||
|
Restructuring
|
794
|
|
—
|
|
—
|
|
|||
|
Total operating expenses
|
362,371
|
|
329,795
|
|
286,597
|
|
|||
|
Income from operations
|
64,031
|
|
61,800
|
|
46,712
|
|
|||
|
Interest expense
|
(12,097
|
)
|
(10,583
|
)
|
(8,073
|
)
|
|||
|
Other income (expense), net
|
2,260
|
|
(291
|
)
|
(1,687
|
)
|
|||
|
Income before provision for income taxes
|
54,194
|
|
50,926
|
|
36,952
|
|
|||
|
Income tax (benefit) provision
|
(11,739
|
)
|
9,411
|
|
11,303
|
|
|||
|
Net income
|
$
|
65,933
|
|
$
|
41,515
|
|
$
|
25,649
|
|
|
Earnings per share
|
|||||||||
|
Basic
|
$
|
1.41
|
|
$
|
0.90
|
|
$
|
0.56
|
|
|
Diluted
|
$
|
1.38
|
|
$
|
0.88
|
|
$
|
0.55
|
|
|
Common shares and equivalents outstanding
|
|||||||||
|
Basic weighted average shares
|
46,669,440
|
|
46,132,389
|
|
45,623,854
|
|
|||
|
Diluted weighted average shares
|
47,775,702
|
|
47,316,538
|
|
46,498,704
|
|
|||
|
Dividends per share
|
$
|
0.48
|
|
$
|
0.48
|
|
$
|
0.48
|
|
|
Other comprehensive income (loss)
|
|||||||||
|
Foreign currency translation adjustment
|
(943
|
)
|
324
|
|
62
|
|
|||
|
Unrealized gain on derivative instruments, net of tax
|
751
|
|
44
|
|
145
|
|
|||
|
Total other comprehensive (loss) income
|
(192
|
)
|
368
|
|
207
|
|
|||
|
Comprehensive income
|
$
|
65,741
|
|
$
|
41,883
|
|
$
|
25,856
|
|
|
The accompanying notes are an integral part of these consolidated financial statements.
|
|||||||||
|
2017 Form 10-K
|
|
59
|
Blackbaud, Inc.
|
|
Years ended December 31,
|
||||||||
|
(dollars in thousands)
|
2017
|
|
2016
|
|
2015
|
|
|||
|
Cash flows from operating activities
|
|||||||||
|
Net income
|
$
|
65,933
|
|
$
|
41,515
|
|
$
|
25,649
|
|
|
Adjustments to reconcile net income to net cash provided by operating activities:
|
|||||||||
|
Depreciation and amortization
|
73,948
|
|
70,491
|
|
55,997
|
|
|||
|
Provision for doubtful accounts and sales returns
|
11,686
|
|
3,730
|
|
6,825
|
|
|||
|
Stock-based compensation expense
|
40,631
|
|
32,638
|
|
25,246
|
|
|||
|
Deferred taxes
|
(14,328
|
)
|
3,033
|
|
3,165
|
|
|||
|
Loss on sale of business
|
—
|
|
—
|
|
1,976
|
|
|||
|
Impairment of capitalized software development costs
|
—
|
|
—
|
|
239
|
|
|||
|
Amortization of deferred financing costs and discount
|
838
|
|
958
|
|
899
|
|
|||
|
Other non-cash adjustments
|
504
|
|
(864
|
)
|
(197
|
)
|
|||
|
Changes in operating assets and liabilities, net of acquisition and disposal of businesses:
|
|||||||||
|
Accounts receivable
|
(15,750
|
)
|
(13,196
|
)
|
(7,593
|
)
|
|||
|
Prepaid expenses and other assets
|
(6,149
|
)
|
(2,478
|
)
|
(10,979
|
)
|
|||
|
Trade accounts payable
|
1,024
|
|
3,689
|
|
6,133
|
|
|||
|
Accrued expenses and other liabilities
|
(4,973
|
)
|
(751
|
)
|
9,255
|
|
|||
|
Deferred revenue
|
22,926
|
|
14,863
|
|
12,612
|
|
|||
|
Net cash provided by operating activities
|
176,290
|
|
153,628
|
|
129,227
|
|
|||
|
Cash flows from investing activities
|
|||||||||
|
Purchase of property and equipment
|
(10,208
|
)
|
(17,694
|
)
|
(18,633
|
)
|
|||
|
Capitalized software development costs
|
(28,345
|
)
|
(26,359
|
)
|
(15,481
|
)
|
|||
|
Purchase of net assets of acquired companies, net of cash and restricted cash acquired
|
(146,789
|
)
|
(3,377
|
)
|
(106,720
|
)
|
|||
|
Net cash used in sale of business
|
—
|
|
—
|
|
(521
|
)
|
|||
|
Purchase of derivative instruments
|
(568
|
)
|
—
|
|
—
|
|
|||
|
Proceeds from settlement of derivative instruments
|
1,030
|
|
—
|
|
—
|
|
|||
|
Net cash used in investing activities
|
(184,880
|
)
|
(47,430
|
)
|
(141,355
|
)
|
|||
|
Cash flows from financing activities
|
|||||||||
|
Proceeds from issuance of debt
|
774,500
|
|
227,200
|
|
312,300
|
|
|||
|
Payments on debt
|
(679,119
|
)
|
(293,575
|
)
|
(184,475
|
)
|
|||
|
Debt issuance costs
|
(3,085
|
)
|
—
|
|
(429
|
)
|
|||
|
Employee taxes paid for withheld shares upon equity award settlement
|
(23,962
|
)
|
(15,376
|
)
|
(9,421
|
)
|
|||
|
Proceeds from exercise of stock options
|
15
|
|
16
|
|
32
|
|
|||
|
Change in due to customers
|
226,717
|
|
96,000
|
|
34,279
|
|
|||
|
Change in customer funds receivable
|
6,644
|
|
—
|
|
—
|
|
|||
|
Dividend payments to stockholders
|
(23,069
|
)
|
(22,811
|
)
|
(22,508
|
)
|
|||
|
Net cash provided by (used in) financing activities
|
278,641
|
|
(8,546
|
)
|
129,778
|
|
|||
|
Effect of exchange rate on cash, cash equivalents, and restricted cash
|
(550
|
)
|
2,622
|
|
(2,695
|
)
|
|||
|
Net increase in cash, cash equivalents, and restricted cash
|
269,501
|
|
100,274
|
|
114,955
|
|
|||
|
Cash, cash equivalents, and restricted cash, beginning of year
|
370,673
|
|
270,399
|
|
155,444
|
|
|||
|
Cash, cash equivalents, and restricted cash, end of year
|
$
|
640,174
|
|
$
|
370,673
|
|
$
|
270,399
|
|
|
Supplemental disclosure of cash flow information
|
|||||||||
|
Cash (paid) received during the year for:
|
|||||||||
|
Interest
|
(10,614
|
)
|
(9,608
|
)
|
(7,208
|
)
|
|||
|
Taxes, net of refunds
|
(5,613
|
)
|
(1,340
|
)
|
(4,795
|
)
|
|||
|
Non-cash investing and financing activities:
|
|||||||||
|
Purchase of equipment and other assets included in accounts payable
|
(1,546
|
)
|
(3,155
|
)
|
(3,204
|
)
|
|||
|
Acquired restricted cash liabilities due to customers
|
31,644
|
|
—
|
|
81,353
|
|
|||
The following table provides a reconciliation of cash and cash equivalents and restricted cash reported within the condensed consolidated balance sheets that sum to the total of the same such amounts shown above in the consolidated statements of cash flows:
|
(dollars in thousands)
|
December 31,
2017 |
|
December 31,
2016 |
|
||
|
Cash and cash equivalents
|
$
|
29,830
|
|
$
|
16,902
|
|
|
Restricted cash due to customers
|
610,344
|
|
353,771
|
|
||
|
Total cash, cash equivalents and restricted cash in the statement of cash flows
|
$
|
640,174
|
|
$
|
370,673
|
|
|
The accompanying notes are an integral part of these consolidated financial statements.
|
||||||
|
60
|
|
2017 Form 10-K
|
Blackbaud, Inc.
Consolidated statements of stockholders' equity
|
(dollars in thousands)
|
Common stock
|
Additional
paid-in
capital
|
|
Treasury
stock
|
|
Accumulated
other
comprehensive
loss
|
|
Retained
earnings
|
|
Total stockholders' equity
|
|
|||||||||
|
Shares
|
|
Amount
|
|
|||||||||||||||||
|
Balance at December 31, 2014
|
56,048,135
|
|
$
|
56
|
|
$
|
245,674
|
|
$
|
(190,440
|
)
|
$
|
(1,032
|
)
|
$
|
131,658
|
|
$
|
185,916
|
|
|
Net income
|
—
|
|
—
|
|
—
|
|
—
|
|
—
|
|
25,649
|
|
25,649
|
|
||||||
|
Payment of dividends
|
—
|
|
—
|
|
—
|
|
—
|
|
—
|
|
(22,508
|
)
|
(22,508
|
)
|
||||||
|
Exercise of stock options and stock appreciation rights and vesting of restricted stock units
|
202,078
|
|
—
|
|
32
|
|
—
|
|
—
|
|
—
|
|
32
|
|
||||||
|
Employee taxes paid for 163,017 withheld shares upon equity award settlement
|
—
|
|
—
|
|
—
|
|
(9,421
|
)
|
—
|
|
—
|
|
(9,421
|
)
|
||||||
|
Excess tax benefits from exercise and vesting of stock-based compensation
|
—
|
|
—
|
|
5,466
|
|
—
|
|
—
|
|
—
|
|
5,466
|
|
||||||
|
Stock-based compensation
|
—
|
|
—
|
|
25,168
|
|
—
|
|
—
|
|
78
|
|
25,246
|
|
||||||
|
Restricted stock grants
|
736,252
|
|
1
|
|
—
|
|
—
|
|
—
|
|
—
|
|
1
|
|
||||||
|
Restricted stock cancellations
|
(112,648
|
)
|
—
|
|
—
|
|
—
|
|
—
|
|
—
|
|
—
|
|
||||||
|
Other comprehensive income
|
—
|
|
—
|
|
—
|
|
—
|
|
207
|
|
—
|
|
207
|
|
||||||
|
Balance at December 31, 2015
|
56,873,817
|
|
$
|
57
|
|
$
|
276,340
|
|
$
|
(199,861
|
)
|
$
|
(825
|
)
|
$
|
134,877
|
|
$
|
210,588
|
|
|
Cumulative effect of a change in accounting principle
(1)
|
—
|
|
—
|
|
1,540
|
|
—
|
|
—
|
|
(934
|
)
|
606
|
|
||||||
|
Net income
|
—
|
|
—
|
|
—
|
|
—
|
|
—
|
|
41,515
|
|
41,515
|
|
||||||
|
Payment of dividends
|
—
|
|
—
|
|
—
|
|
—
|
|
—
|
|
(22,811
|
)
|
(22,811
|
)
|
||||||
|
Exercise of stock options and stock appreciation rights and vesting of restricted stock units
|
341,418
|
|
—
|
|
16
|
|
—
|
|
—
|
|
—
|
|
16
|
|
||||||
|
Employee taxes paid for 263,730 withheld shares upon equity award settlement
|
—
|
|
—
|
|
—
|
|
(15,376
|
)
|
—
|
|
—
|
|
(15,376
|
)
|
||||||
|
Stock-based compensation
|
—
|
|
—
|
|
32,556
|
|
—
|
|
—
|
|
82
|
|
32,638
|
|
||||||
|
Restricted stock grants
|
574,309
|
|
1
|
|
—
|
|
—
|
|
—
|
|
—
|
|
1
|
|
||||||
|
Restricted stock cancellations
|
(117,143
|
)
|
—
|
|
—
|
|
—
|
|
—
|
|
—
|
|
—
|
|
||||||
|
Other comprehensive income
|
—
|
|
—
|
|
—
|
|
—
|
|
368
|
|
—
|
|
368
|
|
||||||
|
Balance at December 31, 2016
|
57,672,401
|
|
$
|
58
|
|
$
|
310,452
|
|
$
|
(215,237
|
)
|
$
|
(457
|
)
|
$
|
152,729
|
|
$
|
247,545
|
|
|
Net income
|
—
|
|
—
|
|
—
|
|
—
|
|
—
|
|
65,933
|
|
65,933
|
|
||||||
|
Payment of dividends
|
—
|
|
—
|
|
—
|
|
—
|
|
—
|
|
(23,069
|
)
|
(23,069
|
)
|
||||||
|
Exercise of stock options and stock appreciation rights and vesting of restricted stock units
|
390,291
|
|
—
|
|
15
|
|
—
|
|
—
|
|
—
|
|
15
|
|
||||||
|
Employee taxes paid for 308,993 withheld shares upon equity award settlement
|
—
|
|
—
|
|
—
|
|
(23,962
|
)
|
—
|
|
—
|
|
(23,962
|
)
|
||||||
|
Stock-based compensation
|
—
|
|
—
|
|
40,575
|
|
—
|
|
—
|
|
56
|
|
40,631
|
|
||||||
|
Restricted stock grants
|
570,208
|
|
1
|
|
—
|
|
—
|
|
—
|
|
—
|
|
1
|
|
||||||
|
Restricted stock cancellations
|
(81,139
|
)
|
—
|
|
—
|
|
—
|
|
—
|
|
—
|
|
—
|
|
||||||
|
Other comprehensive loss
|
—
|
|
—
|
|
—
|
|
—
|
|
(192
|
)
|
—
|
|
(192
|
)
|
||||||
|
Balance at December 31, 2017
|
58,551,761
|
|
$
|
59
|
|
$
|
351,042
|
|
$
|
(239,199
|
)
|
$
|
(649
|
)
|
$
|
195,649
|
|
$
|
306,902
|
|
|
(1) Includes the impact of early adopting ASU 2016-09,
Compensation - Stock Compensation (Topic 718), Improvements to Employee Share-Based Payment Accounting.
Refer to the discussion of recently adopted accounting pronouncements in Note 2 to these consolidated financial statements for additional details.
|
||||||||||||||||||||
|
The accompanying notes are an integral part of these consolidated financial statements.
|
||||||||||||||||||||
|
61
|
|
2017 Form 10-K
|
|
1. Organization
|
We are the world’s leading cloud software company powering social good. Serving the entire social good community—nonprofits, foundations, corporations, education institutions, healthcare institutions and individual change agents—we connect and empower organizations to increase their impact through software, services, expertise, and data intelligence. Our portfolio is tailored to the unique needs of vertical markets, with solutions for fundraising and CRM, marketing, advocacy, peer-to-peer fundraising, corporate social responsibility, school management, ticketing, grantmaking, financial management, payment processing, and analytics. Serving the industry for more than three decades, we are headquartered in Charleston, South Carolina and have operations in the United States, Australia, Canada and the United Kingdom. As of
December 31, 2017
, we had
over
40,000
customers.
|
2. Basis of Presentation
|
Basis of presentation
The consolidated financial statements have been prepared in accordance with accounting principles generally accepted in the United States (“GAAP”).
During the three months ended September 30, 2017, we identified prior period errors whereby amounts of current assets recorded as restricted cash due to customers and amounts of current liabilities recorded as due to customers were overstated by
$8.5 million
,
$7.2 million
and
$21.3 million
as of September 30, 2016, March 31, 2017 and June 30, 2017, respectively. There was no impact to our earnings or operating cash flows as a result of these errors. We concluded these errors were not material individually or in the aggregate to any of the prior reporting periods, and, therefore, amendments of previously filed reports were not required. However, the revisions for these corrections to the applicable prior periods are reflected in the financial information herein and will be reflected in future filings containing such financial information for such periods.
Reclassifications
Due to the insignificance of our revenue from "license fees and other," we have combined that revenue with our "services" revenue beginning in 2017. In order to provide comparability between periods presented, "services" and "license fees and other" have been combined within "services and other" in the previously reported consolidated statements of comprehensive income to conform to presentation of the current period. Similarly, "cost of services" and "cost of license fees and other" have been combined within "cost of services and other" in the previously reported consolidated statements of comprehensive income to conform to presentation of the current period.
Basis of consolidation
The consolidated financial statements include the accounts of Blackbaud, Inc. and its wholly-owned subsidiaries. All intercompany balances and transactions have been eliminated in consolidation.
Use of estimates
The preparation of financial statements in conformity with GAAP requires management to make estimates and assumptions that affect the reported amounts of assets and liabilities and disclosure of contingent assets and liabilities at the date of the financial statements, as well as the reported amounts of revenues and expenses during the reporting periods. On an ongoing basis, we reconsider and evaluate our estimates and assumptions, including those that impact revenue recognition, long-lived and intangible assets including goodwill, income taxes, business combinations, stock-based compensation, capitalization of software development costs, our allowances for sales returns and doubtful accounts, deferred sales commissions and professional services costs, valuation of derivative instruments and loss contingencies. Changes in the facts or circumstances underlying these estimates could result in material changes and actual results could materially differ from these estimates.
|
62
|
|
2017 Form 10-K
|
Reportable segment and reporting unit
The Company reports operating results and financial information in one operating and reportable segment. Prior to the fourth quarter of 2017, our three market groups represented our three operating and reportable segments. In light of the increasing centralization of our operations, including without limitation, marketing, finance, sales excellence, human resources, corporate IT, legal and contracting, real estate and facilities, research and development, customer support, customer success, product management, professional services and training services, we made changes to our internal reporting structure in the fourth quarter of 2017 to better support and assess the operations of our business going forward. As a result, commencing with the fourth quarter of 2017, a measure of profitability is no longer available at the market group level and our chief operating decision maker now uses consolidated financial information to make operating decisions, assess financial performance and allocate resources. Our chief operating decision maker is our chief executive officer ("CEO"). We assessed the resulting effect on our operating segments, reportable segments, as well as our reporting units for annual goodwill impairment testing, and determined that we now have one operating segment, one reportable segment and one reporting unit.
Summary of significant accounting policies
Revenue recognition
Our revenue is primarily generated from the following sources: (i) charging for the use of our software solutions in cloud-based and hosted environments; (ii) providing transaction and payment processing services; (iii) providing professional services including implementation, training, consulting, analytic, and other services; and (iv) providing software maintenance and support services.
We commence revenue recognition when all of the following conditions are met:
•
Persuasive evidence of an arrangement exists;
•
The solutions or services have been or are being provided to the customer;
•
The fee is fixed or determinable; and
•
Collection of the resulting receivable is probable.
Determining whether and when these criteria have been met can require significant judgment and estimates. We deem acceptance of a contract to be evidence of an arrangement. Delivery of our services occurs when the services have been performed. Delivery of our solutions occurs when the solution is shipped or made available to the customers. Our typical arrangements do not include customer acceptance provisions; however, if acceptance provisions are provided, delivery is deemed to occur upon acceptance. We consider the fee to be fixed or determinable unless the fee is subject to refund or adjustment or is not payable within our standard payment terms. Payment terms greater than
90
days are considered to be beyond our customary payment terms. Collection is deemed probable if we expect that the customer will be able to pay amounts under the arrangement as they become due. If we determine that collection is not probable, we defer revenue recognition until collection. Revenue is recognized net of actual and estimated sales returns and allowances.
We follow guidance provided in ASC 605-45,
Principal Agent Considerations
, which states that determining whether a company should recognize revenue based on the gross amount billed to a customer or the net amount retained is a matter of judgment that depends on the facts and circumstances of the arrangement and that certain factors should be considered in the evaluation.
Subscriptions
We provide software solutions to customers which are available for use in cloud-based subscription arrangements without licensing perpetual rights to the software (“cloud-based solutions”). Revenue from cloud-based solutions is recognized ratably beginning on the activation date over the term of the agreement, which generally ranges from
one
to
three
years. Any revenue related to upfront activation or set-up fees is deferred and recognized ratably over the estimated period that the customer benefits from the related cloud-based solution. Direct and incremental costs related to upfront activation or
|
2017 Form 10-K
|
|
63
|
set-up activities for cloud-based solutions are capitalized until the cloud-based solution is deployed and in use, and then expensed ratably over the estimated period that the customer benefits from the related cloud-based solution.
We offer certain payment processing services with the assistance of third-party vendors. In general, when we are the principal in a transaction based on the predominant weighting of factors identified in ASC 605-45, we record the revenue and related costs on a gross basis. Otherwise, we net the cost of revenue associated with the service against the gross amount billed to the customer and record the net amount as revenue. Revenue directly associated with processing donations for customers and our other transaction processing services is recognized when the service is provided and the amounts are determinable.
We provide hosting services to customers who have purchased perpetual rights to certain of our software solutions (“hosting services”). Revenue from hosting services, online training programs, as well as subscription-based analytic services such as data enrichment and data management services, is recognized ratably beginning on the activation date over the term of the agreement, which generally ranges from
one
to
three
years. Any related set-up fees are recognized ratably over the estimated period that the customer benefits from the related hosting service. The estimated period of benefit is evaluated on an annual basis using historical customer retention information by solution or service.
For arrangements that have multiple elements and do not include software licenses, we allocate arrangement consideration at the inception of the arrangement to those elements that qualify as separate units of accounting. The arrangement consideration is allocated to the separate units of accounting based on relative selling price method in accordance with the selling price hierarchy, which includes: (i) vendor specific objective evidence (“VSOE”) of fair value if available; (ii) third-party evidence (“TPE”) if VSOE is not available; and (iii) best estimate of selling price (“BESP”) if neither VSOE nor TPE is available. In general, we use VSOE to allocate the selling price to subscription and service deliverables.
Maintenance
We recognize revenue from maintenance services ratably over the term of the arrangement, generally
one
year at contract inception with annual renewals thereafter. Maintenance contracts are at rates that vary according to the level of the maintenance program associated with the software solution and are generally renewable annually. Maintenance contracts may also include the right to unspecified solution upgrades on an if-and-when available basis. Certain incremental support services are sold in prepaid units of time and recognized as revenue upon their usage. We determine VSOE of fair value of the various elements using different methods. VSOE of fair value for maintenance services associated with software licenses is based upon renewal rates stated in the arrangements with customers, which demonstrate a consistent relationship of maintenance pricing as a percentage of the contractual license fee.
Services
We generally bill consulting, installation and implementation services based on hourly rates plus reimbursable travel-related expenses. Revenue is recognized for these services over the period the services are delivered.
We recognize analytic services revenue from donor prospect research engagements, the sale of lists of potential donors, benchmarking studies and data modeling service engagements upon delivery. In arrangements where we provide customers the right to updated information during the contract period, revenue is recognized ratably over the contract period.
We sell fixed-rate programs, which permit customers to attend unlimited training over a specified contract period, typically
one
year, subject to certain restrictions, and revenue in those cases is recognized ratably over the contract period. Additionally, we sell training at a fixed rate for each specific class at a per attendee price or at a packaged price for several attendees, and recognize the related revenue upon the customer attending and completing training.
VSOE of fair value of professional services and other solutions and services is based on the average selling price of these same solutions and services to other customers when sold on a stand-alone basis.
Deferred revenue
To the extent that our customers are billed for the above described solutions and services in advance of delivery, we record such amounts in deferred revenue. Generally, our subscription and maintenance customers are billed
one
year in advance.
|
64
|
|
2017 Form 10-K
|
Fair value measurements
We measure certain financial assets and liabilities at fair value on a recurring basis, including derivative instruments. Fair value is defined as the price that would be received to sell an asset or paid to transfer a liability (an exit price) in an orderly transaction between market participants at the measurement date. An active market is defined as a market in which transactions for the asset or liability take place with sufficient frequency and volume to provide pricing information on an ongoing basis. We use a three-tier fair value hierarchy to measure fair value. This hierarchy prioritizes the inputs into three broad levels as follows:
|
•
|
Level 1 - Quoted prices for identical assets or liabilities in active markets;
|
|
•
|
Level 2 - Quoted prices for similar assets and liabilities in active markets, quoted prices for identical or similar assets in markets that are not active, and model-derived valuations in which all significant inputs and significant value drivers are observable in active markets; and
|
|
•
|
Level 3 - Valuations derived from valuation techniques in which one or more significant inputs are unobservable.
|
Our financial assets and liabilities are classified in their entirety within the hierarchy based on the lowest level of input that is significant to fair value measurement. Changes to a financial asset's or liability's level within the fair value hierarchy are determined as of the end of a reporting period. All methods of assessing fair value result in a general approximation of value, and such value may never actually be realized.
Derivative instruments
We generally use derivative instruments to manage interest rate risk. We view derivative instruments as risk management tools and do not use them for trading or speculative purposes. Our policy requires that derivatives used for hedging purposes be designated and effective as a hedge of the identified risk exposure at the inception of the contract. Accordingly, changes in fair value of the derivative contract must be highly correlated with changes in the fair value of the underlying hedged item at inception of the hedge and over the life of the hedge contract.
We record all derivative instruments on our consolidated balance sheets at fair value. If the derivative is designated as a cash flow hedge, the effective portions of the changes in fair value of the derivative are recorded in other comprehensive income and reclassified to earnings in a manner that matches the timing of the earnings impact of the hedged transactions. Ineffective portions of the changes in the fair value of cash flow hedges are recognized currently in earnings. See
Note 10
of these consolidated financial statements for further discussion of our derivative instruments.
Sales taxes
We present sales taxes and other taxes collected from customers and remitted to governmental authorities on a net basis and, as such, exclude them from revenues.
Cash and cash equivalents
We consider all highly liquid investments purchased with an original maturity of three months or less and cash items in transit to be cash equivalents.
Restricted cash due to customers; Customer funds receivable; Due to customers
Restricted cash due to customers consists of monies collected by us and payable to our customers, net of the associated transaction fees earned. Monies associated with amounts due to customers are segregated in separate bank accounts and used exclusively for the payment of amounts due to customers. This usage restriction is either legally or internally imposed and reflects our intention with regard to such deposits. Customer funds receivable consists of monies we expect to collect and remit to our customers.
|
2017 Form 10-K
|
|
65
|
Concentration of credit risk
Financial instruments that potentially subject us to concentrations of credit risk consist of cash and cash equivalents, restricted cash due to customers and accounts receivable. Our cash and cash equivalents and restricted cash due to customers are placed with high credit-quality financial institutions. Our accounts receivable is derived from sales to customers who primarily operate in the nonprofit sector. With respect to accounts receivable, we perform ongoing evaluations of our customers and maintain an allowance for doubtful accounts based on historical experience and our expectations of future losses. As of and for the years ended
December 31, 2017
,
2016
and
2015
, there were no significant concentrations with respect to our consolidated revenues or accounts receivable.
Property and equipment
We record property and equipment assets at cost and depreciate them over their estimated useful lives using the straight-line method. Leasehold improvements are depreciated over the lesser of the term of the lease or the estimated useful life of the asset. Upon retirement or sale, the cost of assets disposed of and the related accumulated depreciation are removed from the accounts and any resulting gain or loss is credited or charged to earnings. Repair and maintenance costs are expensed as incurred.
Construction-in-progress represents purchases of computer software and hardware associated with new internal system implementation projects which had not been placed in service at the respective balance sheet dates. We transferred these assets to the applicable property category on the date they are placed in service. There was no capitalized interest applicable to construction-in-progress for the years ended
December 31, 2017
,
2016
and
2015
.
Business combinations
We include the operating results of acquired companies as well as the net assets acquired and liabilities assumed in our consolidated financial statements from the date of acquisition. We are required to allocate the purchase price of acquired companies to the tangible and intangible assets acquired and liabilities assumed at the acquisition date based upon their estimated fair values. Goodwill as of the acquisition date represents the excess of the purchase consideration of an acquired business over the fair value of the underlying net tangible and intangible assets acquired and liabilities assumed. This allocation and valuation require management to make significant estimates and assumptions, especially with respect to long-lived and intangible assets.
Critical estimates in valuing intangible assets include, but are not limited to, estimates about: future expected cash flows from customer contracts, proprietary technology and non-compete agreements; the acquired company's brand awareness and market position, assumptions about the period of time the brand will continue to be valuable; as well as expected costs to develop any in-process research and development into commercially viable solutions and estimated cash flows from the projects when completed, and discount rates. Our estimates of fair value are based upon assumptions we believe to be reasonable, but which are inherently uncertain and unpredictable, and unanticipated events and changes in circumstances may occur.
Goodwill
Goodwill represents the purchase price in excess of the net amount assigned to assets acquired and liabilities assumed by us in a business combination. Goodwill is not amortized, but tested annually for impairment on the first day of our fourth quarter, or more frequently if indicators of potential impairment arise.
Accounting guidance permits entities to first assess qualitative factors to determine whether it is more likely than not that the fair value of a reporting unit is less than its carrying amount as a basis to determine whether it is necessary to perform the quantitative impairment test. Significant judgment is required in the assessment of qualitative factors, including but not limited to an evaluation of macroeconomic conditions as they relate to our business, industry and market trends, as well as the overall future financial performance of identified reporting units and future opportunities in the markets in which we operate.
|
66
|
|
2017 Form 10-K
|
The quantitative impairment test compares the fair values of identified reporting units with their respective carrying amounts. If the carrying amount of a reporting unit exceeds its fair value, an impairment loss is recognized in an amount equal to that excess.
As discussed above, we made changes to our internal reporting structure in the fourth quarter of 2017 to better support and assess the operations of our business going forward. As a result, we now have one operating segment, one reportable segment, and one reporting unit. As a result of the change in reporting units, we performed quantitative goodwill impairment tests immediately before and after this change in reporting units and determined that there was no impairment.
In each of
2017
,
2016
, and 2015, we performed the quantitative impairment test which indicated that the estimated fair values of the identified reporting units significantly exceeded their respective carrying values.
There was no impairment of goodwill during 2017, 2016 or 2015.
Intangible assets
We amortize finite-lived intangible assets over their estimated useful lives as follows.
|
Basis of amortization
|
Amortization
period
(in years)
|
|
|
Customer relationships
|
Straight-line and accelerated
(1)
|
8-17
|
|
Marketing assets
|
Straight-line
|
2-1
5
|
|
Acquired software and technology
|
Straight-line and accelerated
(2)
|
5-10
|
|
Non-compete agreements
|
Straight-line
|
1-5
|
|
Database
|
Straight-line
|
8
|
|
(1)
|
Certain of the customer relationships are amortized on an accelerated basis.
|
|
(2)
|
Certain of the acquired software and technology assets are amortized on an accelerated basis.
|
Indefinite-lived intangible assets consist of trade names. We evaluate the estimated useful lives and the potential for impairment of finite and indefinite-lived intangible assets on an annual basis, or more frequently if events or circumstances indicate revised estimates of useful lives may be appropriate or that the carrying amount may not be recoverable. If the carrying amount is no longer recoverable based upon the undiscounted cash flows of the asset, the amount of impairment is the difference between the carrying amount and the fair value of the asset. Substantially all of our intangible assets were acquired in business combinations.
There was no impairment of acquired intangible assets during 2017, 2016 or 2015.
Deferred financing costs
Deferred financing costs included in other assets represent the direct third-party costs of entering into the revolving (line-of-credit) portion of our credit facility in June 2017 and portions of the unamortized deferred financing costs from prior facilities. These costs are amortized ratably over the term of the credit facility as interest expense.
Stock-based compensation
We measure stock-based compensation cost at the grant date based on the fair value of the award and recognize it as expense over the requisite service period, which is the vesting period. We determine the fair value of stock options and stock appreciation rights using a Black-Scholes option pricing model, which requires us to use significant judgment to make estimates regarding the life of the award, volatility of our stock price, the risk-free interest rate and the dividend yield of our stock over the life of the award. We determine the fair value of awards that contain market conditions using a Monte Carlo simulation model. Changes to these estimates would result in different fair values of awards.
We recognize the effect of awards for which the requisite service period is not rendered when the award is forfeited (that is, we recognize the effect of forfeitures in compensation cost when they occur). Previously recognized compensation cost for an award is reversed in the period that the award is forfeited. Income tax benefits resulting from the vesting and exercise of stock-based compensation awards are recognized in the period the unit or award is vested or option or right is exercised.
|
2017 Form 10-K
|
|
67
|
Income taxes
We make estimates and judgments in accounting for income taxes. The calculation of the income tax provision requires estimates due to transactions, credits and calculations where the ultimate tax determination is uncertain. Uncertainties arise as a consequence of the actual source of taxable income between domestic and foreign locations, the outcome of tax audits and the ultimate utilization of tax credits. To the extent actual results differ from estimated amounts recorded, such differences will impact the income tax provision in the period in which the determination is made.
We make estimates in determining tax assets and liabilities, which arise from differences in the timing of recognition of revenue and expense for tax and financial statement purposes. We record valuation allowances to reduce our deferred tax assets to the amount expected to be realized. In assessing the adequacy of a recorded valuation allowance significant judgment is required. We consider all positive and negative evidence and a variety of factors including the scheduled reversal of deferred tax liabilities, historical and projected future taxable income, and prudent and feasible tax planning strategies. If we determine there is less than a 50% likelihood that we will be able to use a deferred tax asset in the future in excess of its net carrying value, then an adjustment to the deferred tax asset valuation allowance is made to increase income tax expense, thereby reducing net income in the period such determination was made.
We measure and recognize uncertain tax positions. To recognize such positions, we must first determine if it is more likely than not that the position will be sustained upon audit. We must then measure the benefit as the largest amount that is more than 50% likely of being realized upon ultimate settlement. Significant judgment is required in the identification and measurement of uncertain tax positions.
Foreign currency
Net assets recorded in a foreign currency are translated at the exchange rate on the balance sheet date. Revenue and expense items are translated using an average of monthly exchange rates. The resulting translation adjustments are recorded in accumulated other comprehensive income.
Gains and losses resulting from foreign currency transactions denominated in currency other than the functional currency are recorded at the approximate rate of exchange at the transaction date in other expense, net. For the years ended
December 31, 2017
and
2015
, we recorded insignificant net foreign currency gains. For the year ended
December 31, 2016
, we recorded an insignificant net foreign currency loss.
Research and development
Research and development costs are expensed as incurred. These costs include compensation costs for engineering and product management personnel, third-party contractor expenses, software development tools and other expenses related to researching and developing new solutions, upgrading and enhancing existing solutions, and allocated depreciation, facilities and IT support costs.
Software development costs
We incur certain costs associated with the development of internal-use software, which are primarily related to activities performed to develop our cloud-based solutions. Internal and external costs incurred in the preliminary project stage of internal-use software development are expensed as incurred. Once the software being developed has reached the application development stage, qualifying internal costs including payroll and payroll-related costs of employees who are directly associated with and devote time to the software project as well as external direct costs of materials and services are capitalized. Capitalization ceases at the point at which the developed software is substantially complete and ready for its intended use, which is typically upon completion of all substantial testing. Qualifying costs capitalized during the application development stage include those related to specific upgrades and enhancements when it is probable that those costs incurred will result in additional functionality. Overhead costs, including general and administrative costs, as well as maintenance, training and all other costs associated with post-implementation stage activities are expensed as incurred. In addition, internal costs that cannot be reasonably separated between maintenance and relatively minor upgrades and enhancements are expensed as incurred. Historically, we have also incurred and capitalized costs in connection with the development of certain of our software solutions licensed to customers on a perpetual basis, which are accounted for as
|
68
|
|
2017 Form 10-K
|
costs of software to be sold, leased or otherwise marketed; however, there were no costs capitalized related to those solutions as of
December 31, 2017
and
2016
.
Qualifying capitalized software development costs are amortized on a straight-line basis over the software asset's estimated useful life, which is generally
three
to
seven
years. We evaluate the useful lives of these assets on an annual basis and test for impairment whenever events or changes in circumstances occur that could impact the recoverability of these assets. There were no impairment charges during the years ended
December 31, 2017
and
December 31, 2016
. During the year ended December 31, 2015, we recorded
insignificant
impairment charges against previously capitalized software development costs. The charge reduced the carrying value of the certain previously capitalized software development costs to zero and are reflected in research and development expense. The impairment charge resulted from obtaining software solutions through the acquisition of Smart Tuition in 2015, and our determination that it was no longer probable that certain internal-use software that was previously being developed would be placed into service.
Sales returns and allowance for doubtful accounts
We maintain a reserve for returns and credits which is estimated based on several factors including historical experience, known credits yet to be issued, the aging of customer accounts and the nature of service level commitments. A considerable amount of judgment is required in assessing these factors. Provisions for sales returns and credits are charged against the related revenue items.
Accounts receivable are recorded at original invoice amounts less an allowance for doubtful accounts, an amount we estimate to be sufficient to provide adequate protection against losses resulting from extending credit to our customers. In judging the adequacy of the allowance for doubtful accounts, we consider multiple factors including historical bad debt experience, the general economic environment and the aging of our receivables. A considerable amount of judgment is required in assessing these factors and if any receivables were to deteriorate, an additional provision for doubtful accounts could be required. Accounts are written off after all means of collection are exhausted and recovery is considered remote. Provisions for doubtful accounts are recorded in general and administrative expense.
Below is a summary of the changes in our allowance for sales returns.
|
Years ended December 31,
(in thousands)
|
Balance at
beginning of year
|
|
Provision/
adjustment
|
|
Write-off
|
|
Balance at
end of year
|
|
||||
|
2017
|
$
|
2,704
|
|
$
|
10,511
|
|
$
|
(8,815
|
)
|
$
|
4,400
|
|
|
2016
|
4,431
|
|
3,060
|
|
(4,787
|
)
|
2,704
|
|
||||
|
2015
|
4,185
|
|
5,834
|
|
(5,588
|
)
|
4,431
|
|
||||
Below is a summary of the changes in our allowance for doubtful accounts.
|
Years ended December 31,
(in thousands)
|
Balance at
beginning of year
|
|
Provision/
adjustment
|
|
Write-off
|
|
Balance at
end of year
|
|
||||
|
2017
|
$
|
587
|
|
$
|
1,148
|
|
$
|
(994
|
)
|
$
|
741
|
|
|
2016
|
512
|
|
499
|
|
(424
|
)
|
587
|
|
||||
|
2015
|
354
|
|
699
|
|
(541
|
)
|
512
|
|
||||
Sales commissions
We pay sales commissions at the time contracts with customers are signed or shortly thereafter, depending on the size and duration of the sales contract. To the extent that these commissions relate to revenue not yet recognized, the amounts are recorded as deferred sales commission costs. Subsequently, the commissions are recognized as sales, marketing and customer success expense as the revenue is recognized.
|
2017 Form 10-K
|
|
69
|
Below is a summary of the changes in our deferred sales commission costs included in prepaid expenses and other current assets.
|
Years ended December 31,
(in thousands)
|
Balance at
beginning of year
|
|
Additions
|
|
Expense
|
|
Balance at
end of year
|
|
||||
|
2017
|
$
|
37,459
|
|
$
|
35,420
|
|
$
|
(31,465
|
)
|
$
|
41,414
|
|
|
2016
|
30,141
|
|
37,553
|
|
(30,235
|
)
|
37,459
|
|
||||
|
2015
|
22,630
|
|
55,934
|
|
(48,423
|
)
|
30,141
|
|
||||
Advertising costs
We expense advertising costs as incurred, which was
$2.4 million
,
$2.3 million
and
$2.3 million
for the years ended
December 31, 2017
,
2016
and
2015
, respectively.
Restructuring costs
Restructuring costs include charges for the costs of exit or disposal activities. The liability for costs associated with exit or disposal activities is measured initially at fair value and only recognized when the liability is incurred. For details of our restructuring activities, see
Note 20
of these consolidated financial statements.
Impairment of long-lived assets
We review long-lived assets for impairment when events change or circumstances indicate the carrying amount may not be recoverable. Events or changes in circumstances that indicate the carrying amount may not be recoverable include, but are not limited to, a significant decrease in the market value of the business or asset acquired, a significant adverse change in the extent or manner in which the business or asset acquired is used or significant adverse change in the business climate. If such events or changes in circumstances are present, the undiscounted cash flow method is used to determine whether the asset is impaired. No impairment of long-lived assets occurred in
2017
or
2016
. No impairment of long-lived assets occurred in
2015
except for the impairment of previously capitalized software development costs discussed above.
Contingencies
We are subject to the possibility of various loss contingencies in the normal course of business. We record an accrual for a contingency when it is both probable that a liability has been incurred and the amount of the loss can be reasonably estimated. Often these issues are subject to substantial uncertainties and, therefore, the probability of loss and the estimation of damages are difficult to ascertain. These assessments can involve a series of complex judgments about future events and can rely heavily on estimates and assumptions that have been deemed reasonable by us. Although we believe we have substantial defenses in these matters, we could incur judgments or enter into settlements of claims that could have a material adverse effect on our consolidated financial position, results of operations or cash flows in any particular period.
Earnings per share
We compute basic earnings per share by dividing net income available to common stockholders by the weighted average number of common shares outstanding during the period. Diluted earnings per share is computed by dividing net income available to common stockholders by the weighted average number of common shares and dilutive potential common shares outstanding during the period. Diluted earnings per share reflect the assumed exercise, settlement and vesting of all dilutive securities using the “treasury stock method” except when the effect is anti-dilutive. Potentially dilutive securities consist of shares issuable upon the exercise of stock options and stock appreciation rights and vesting of restricted stock awards and units.
|
70
|
|
2017 Form 10-K
|
Recently adopted accounting pronouncements
As previously disclosed, during the three months ended September 30, 2016 we early adopted Financial Accounting Standards Board ("FASB") Accounting Standards Update ("ASU") No. 2016-09,
Compensation - Stock Compensation (Topic 718), Improvements to Employee Share-Based Payment Accounting ("ASU 2016-09")
, which addresses, among other items, the accounting for income taxes and forfeitures, and cash flow presentation of share-based compensation. Our adoption of ASU 2016-09 required us to reflect any adjustments as of January 1, 2016, the beginning of the annual period that includes the interim period of adoption. Upon adoption, we elected to account for forfeitures as they occur using a modified retrospective transition method, which resulted in a cumulative-effect adjustment of
$0.9 million
to reduce our January 1, 2016 opening retained earnings balance. Adoption of the new standard also resulted in the recognition of excess tax benefits in our provision for income taxes rather than paid-in capital of
$7.7 million
for the year ended December 31, 2016.
In May 2017, the FASB issued ASU 2017-09,
Compensation-Stock Compensation (Topic 718) - Scope of Modification Accounting ("ASU 2017-09")
, which provides guidance about which changes to the terms or conditions of a share-based payment award require an entity to apply modification accounting in Topic 718. Under ASU 2017-09, modification accounting is required only if the fair value, the vesting conditions, or the classification of the award (as equity or liability) changes as a result of the change in terms or conditions. ASU 2017-09 is effective for all companies for annual and interim periods beginning after December 15, 2017, with early adoption permitted in any interim period for reporting periods for which financial statements have not been issued. ASU 2017-09 should be applied prospectively to an award modified on or after the adoption date. We early adopted ASU 2017-09 as of April 1, 2017. As this standard is prospective in nature, the impact to our financial statements will depend on the nature of our future award modifications.
In January 2017, the FASB issued ASU 2017-01,
Business Combinations (Topic 805) Clarifying the Definition of a Business ("ASU 2017-01")
, which provides a screen to determine when an integrated set of assets and activities is not a business. The screen requires that when substantially all of the fair value of the gross assets acquired (or disposed of) is concentrated in a single identifiable asset or a group of similar identifiable assets, the set is not a business. ASU 2017-01 is effective for annual and interim periods beginning after December 15, 2017, with early adoption permitted, and applied prospectively. We early adopted ASU 2017-01 as of July 1, 2017 and the standard did not have a material impact on our consolidated financial statements.
In January 2017, the FASB issued ASU 2017-04,
Intangibles - Goodwill and Other (Topic 350): Simplifying the Accounting for Goodwill Impairment
("ASU 2017-04")
, which removes the requirement to perform a hypothetical purchase price allocation to measure goodwill impairment. A goodwill impairment will now be the amount by which a reporting unit’s carrying value exceeds its fair value, not to exceed the carrying amount of goodwill. ASU 2017-04 is effective for annual and interim periods beginning after December 15, 2019, with early adoption permitted, and applied prospectively. We early adopted ASU 2017-04 as of July 1, 2017 and used it in our fourth quarter annual goodwill impairment testing and the standard did not have a material impact on our consolidated financial statements.
In November 2016, the FASB issued ASU 2016-18,
Statement of Cash Flows (Topic 230) - Restricted Cash ("ASU 2016-18")
, which requires entities to show the changes in the total of cash, cash equivalents, restricted cash and restricted cash equivalents in the statement of cash flows. ASU 2016-18 is effective for annual periods beginning after December 15, 2017, with early adoption is permitted. The new standard must be adopted retrospectively.
|
2017 Form 10-K
|
|
71
|
We early adopted ASU 2016-18 during the three months ended December 31, 2017. We retrospectively applied the changes in presentation to the statements of cash flows and no longer classify changes in restricted cash due to customers and due to customers as operating activities. Instead, changes in due to customers are now classified as financing activities. The prior period financial statements included in this filing have been adjusted to reflect the corrections of the immaterial errors to amounts recorded as restricted cash due to customers and due to customers (as discussed above) as well as our adoption of ASU 2016-18. The effects of those adjustments have been provided in summarized format below.
|
Consolidated statements of cash flows:
|
||||||||||||||||||||
|
Nine months ended
September 30, 2017
|
Six months ended
June 30, 2017
|
Three months ended
March 31, 2017
|
||||||||||||||||||
|
(dollars in thousands)
|
As Reported
|
|
As Adjusted
|
|
As Reported
|
|
As Adjusted
|
|
As Reported
|
|
As Adjusted
|
|
||||||||
|
Net cash (used in) provided by financing activities
|
$
|
(45,306
|
)
|
$
|
(259,550
|
)
|
$
|
15,286
|
|
$
|
(70,295
|
)
|
$
|
(6,776
|
)
|
$
|
(202,775
|
)
|
||
|
Net increase (decrease) in cash and cash equivalents and restricted cash
|
148
|
|
(214,528
|
)
|
366
|
|
(85,465
|
)
|
(3,030
|
)
|
(199,228
|
)
|
||||||||
|
Twelve months ended
December 31, 2016
|
Nine months ended
September 30, 2016
|
Twelve months ended
December 31, 2015
|
||||||||||||||||||
|
(dollars in thousands)
|
As Reported
|
|
As Adjusted
|
|
As Reported
|
|
As Adjusted
|
|
As Reported
|
|
As Adjusted
|
|
||||||||
|
Net cash used in investing activities
|
$
|
(47,430
|
)
|
$
|
(47,430
|
)
|
$
|
(37,914
|
)
|
$
|
(37,914
|
)
|
$
|
(222,707
|
)
|
$
|
(141,355
|
)
|
||
|
Net cash (used in) provided by financing activities
|
(104,546
|
)
|
(8,546
|
)
|
(61,176
|
)
|
(188,980
|
)
|
95,499
|
|
129,778
|
|
||||||||
|
Net increase (decrease) in cash and cash equivalents and restricted cash
|
1,540
|
|
100,274
|
|
1,100
|
|
(124,345
|
)
|
627
|
|
114,955
|
|
||||||||
Recently issued accounting pronouncements
In February 2016, the FASB issued ASU 2016-02,
Leases (Topic 842) ("ASU 2016-02")
. ASU 2016-02 will require lessees to record most leases on their balance sheets but recognize expenses in the income statement in a manner similar to current guidance. The updated guidance also eliminates certain real estate-specific provisions and changes the guidance on sale-leaseback transactions, initial direct costs and lease executory costs for all entities. For lessors, the standard modifies the classification criteria and the accounting for sales-type and direct financing leases. All entities will classify leases to determine how to recognize lease-related revenue and expense. Classification will continue to affect amounts that lessors record on the balance sheet. ASU 2016-02 is effective for annual periods beginning after December 15, 2018, and interim periods within those years. Early adoption is permitted. Upon adoption, entities will be required to use a modified retrospective approach for leases that exist or are entered into after the beginning of the earliest comparative period in the financial statements. The modified retrospective approach includes a number of optional practical expedients that entities may elect to apply. We expect ASU 2016-02 will impact our consolidated financial statements and are currently evaluating the extent of the impact that implementation of this standard will have on adoption.
In May 2014, the FASB issued ASU 2014-09,
Revenue from Contracts with Customers (Topic 606) ("ASU 2014-09")
. ASU 2014-09 outlines a single comprehensive model for entities to use in accounting for revenue arising from contracts with customers. The standard also provides guidance on the recognition of costs related to obtaining customer contracts. ASU 2014-09 will replace most existing revenue recognition guidance in GAAP when it becomes effective and permits the use of either the retrospective or cumulative effect transition method. ASU 2014-09 will be effective for us beginning in the first quarter of 2018, and we anticipate using the full retrospective transition method.
We are currently evaluating the impact that the adoption of ASU 2014-9 will have on our consolidated financial statements and related disclosures. As a result of our evaluation to date, we believe that the primary impact on our financial statements of adopting ASU 2016-09 will relate to the deferral of incremental commission and other costs of obtaining contracts with customers. Currently, we defer only direct and incremental commission costs to obtain a contract and generally amortize those costs over the contract term as the revenue was recognized, typically three years. Under the new standard, we will defer all incremental commission and fringe benefit costs to obtain a contract and amortize those costs in a manner that aligns with the expected period of benefit. We utilized the 'portfolio approach' practical expedient in ASC 606-10-10-4, which allows entities to apply the guidance to a portfolio of contracts with similar characteristics because the effects on the financial statements of this approach would not differ materially from applying the guidance to individual contracts. Using the 'portfolio approach' and taking into consideration our customer contracts, our technology and other factors,
|
72
|
|
2017 Form 10-K
|
we determined the expected period of benefit to be approximately five years. We generally only pay commissions for contract renewals in limited circumstances.
We also anticipate incremental disclosures, including, but not limited to, the opening and closing balances of contract assets and liabilities, revenue recognized in the reporting period that was included in the contract liability balance at the beginning of the period, and the aggregate amount of the transaction price allocated to remaining performance obligations at the end of each reporting period including when we expect to recognize that amount.
|
3. Business Combinations
|
2017 Acquisitions
JustGiving
On
October 2, 2017
, Blackbaud Global Limited (“Blackbaud Global”), a United Kingdom limited liability company and wholly-owned subsidiary of ours, acquired the entire issued share capital, including all voting equity interests, of Giving Limited, a United Kingdom private limited company doing business as “JustGiving” for an aggregate purchase price, including certain post-closing adjustments set forth in the related stock purchase agreement, of
£102.4 million
, or approximately
$137.2 million
, in cash. JustGiving is a market leading social platform for giving, and the acquisition is expected to enhance our capabilities to serve both individual donors and nonprofits, expanding the peer-to-peer fundraising capabilities we offer today. As a result of the acquisition, JustGiving has become a wholly-owned subsidiary of ours. During
2017
, we incurred acquisition-related expenses associated with the acquisition of JustGiving of
$4.2 million
, which are recorded in general and administrative expense. We financed the acquisition of JustGiving through cash on hand and borrowings of
$138.7 million
under the 2017 Credit Facility (as defined in
Note 9
of these consolidated financial statements).
The fair values assigned to the assets acquired and liabilities assumed in the table below are based on our best estimates and assumptions as of the reporting date and are considered preliminary pending finalization. The estimates and assumptions are subject to change as we obtain additional information during the measurement period, which may be up to one year from the acquisition date. The assets and liabilities, pending finalization, include the valuation of acquired finite-lived intangible assets, as well as the assumed deferred revenue and deferred income tax balances.
|
(in thousands)
|
Purchase price
allocation
|
|
|
|
Net working capital, excluding deferred revenue
|
$
|
10,496
|
|
|
Finite-lived intangible assets
|
73,184
|
|
|
|
Other long-term assets
|
4,314
|
|
|
|
Deferred tax liability
|
(7,549
|
)
|
|
|
Deferred revenue
|
(245
|
)
|
|
|
Other long-term liabilities
|
(332
|
)
|
|
|
Goodwill
|
57,341
|
|
|
|
Total purchase price
|
$
|
137,209
|
|
The estimated fair value of accounts receivable acquired approximates the contractual value of
$1.7 million
. The estimated goodwill recognized is attributable primarily to the opportunities for expected synergies from combining the operations and assembled workforce of JustGiving. Only an
insignificant
portion of the goodwill arising in the acquisition is deductible for income tax purposes.
|
2017 Form 10-K
|
|
73
|
The JustGiving acquisition resulted in the identification of the following identifiable finite-lived intangible assets:
|
Intangible assets
acquired
|
|
Weighted average
amortization
period
|
||
|
AcademicWorks
|
(in thousands)
|
|
(in years)
|
|
|
Marketing assets
|
$
|
32,000
|
|
15
|
|
Acquired technology
|
21,000
|
|
10
|
|
|
Customer relationships
|
20,000
|
|
15
|
|
|
Non-compete agreements
|
184
|
|
1
|
|
|
Total intangible assets
|
$
|
73,184
|
|
14
|
The estimated fair values of the finite-lived intangible assets were based on variations of the income approach, which estimates fair value based upon the present value of cash flows that the assets are expected to generate, and which included the relief-from-royalty method, incremental cash flow method, including the comparative (with and without) method and multi-period excess earnings method, depending on the intangible asset being valued. The method of amortization of identifiable finite-lived intangible assets is based on the expected pattern in which the estimated economic benefits of the respective assets are consumed or otherwise used up. Customer relationships and acquired technology are being amortized on an accelerated basis. Marketing assets and non-compete agreements are being amortized on a straight-line basis.
We determined that the impact of this acquisition was not material to our consolidated financial statements; therefore, revenue and earnings since the acquisition date and pro forma information are not required or presented.
AcademicWorks
On
April 3, 2017
, we acquired all of the outstanding shares of capital stock, including all voting equity interests, of AcademicWorks, Inc., a Texas corporation ("AcademicWorks"), pursuant to a stock purchase agreement. AcademicWorks is the market leader in scholarship management for higher education and K-12 institutions, foundations, and grant-making institutions. The acquisition extends our offerings for our higher education, K-12, and corporate and foundation customers. We acquired AcademicWorks for
$52.1 million
in cash, net of closing adjustments. We financed the acquisition through a draw down of a revolving credit loan under our then-existing credit facility. As a result of the acquisition, AcademicWorks has become a wholly-owned subsidiary of ours. During
2017
, we incurred
insignificant
acquisition-related expenses associated with the acquisition of AcademicWorks, which were recorded in general and administrative expense.
The fair values assigned to the assets acquired and liabilities assumed in the table below are based on our best estimates and assumptions as of the reporting date and are considered preliminary pending finalization. The estimates and assumptions are subject to change as we obtain additional information during the measurement period, which may be up to one year from the acquisition date. The assets and liabilities, pending finalization, include the valuation of acquired finite-lived intangible assets, as well as the assumed deferred revenue and deferred income tax balances.
|
(in thousands)
|
Purchase price
allocation
|
|
|
|
Net working capital, excluding deferred revenue
|
$
|
2,949
|
|
|
Property and equipment
|
290
|
|
|
|
Finite-lived intangible assets
|
30,900
|
|
|
|
Deferred revenue
|
(3,950
|
)
|
|
|
Deferred tax liability
|
(12,350
|
)
|
|
|
Goodwill
|
34,305
|
|
|
|
Total purchase price
|
$
|
52,144
|
|
|
74
|
|
2017 Form 10-K
|
The estimated fair value of accounts receivable acquired approximates the contractual value of
$1.0 million
. The estimated goodwill recognized is attributable primarily to the opportunities for expected synergies from combining the operations and assembled workforce of AcademicWorks. None of the goodwill arising in the acquisition is deductible for income tax purposes.
The AcademicWorks acquisition resulted in the identification of the following identifiable finite-lived intangible assets:
|
Intangible assets
acquired
|
|
Weighted average
amortization
period
|
||
|
AcademicWorks
|
(in thousands)
|
|
(in years)
|
|
|
Acquired technology
|
$
|
22,500
|
|
9
|
|
Customer relationships
|
8,000
|
|
15
|
|
|
Marketing assets
|
320
|
|
2
|
|
|
Non-compete agreements
|
80
|
|
3
|
|
|
Total intangible assets
|
$
|
30,900
|
|
10
|
The estimated fair values of the finite-lived intangible assets were based on variations of the income approach, which estimates fair value based upon the present value of cash flows that the assets are expected to generate, and which included the relief-from-royalty method, incremental cash flow method, including the comparative (with and without) method and multi-period excess earnings method, depending on the intangible asset being valued. The method of amortization of identifiable finite-lived intangible assets is based on the expected pattern in which the estimated economic benefits of the respective assets are consumed or otherwise used up. Customer relationships and acquired technology are being amortized on an accelerated basis. Marketing assets and non-compete agreements are being amortized on a straight-line basis.
We determined that the impact of this acquisition was not material to our consolidated financial statements; therefore, revenue and earnings since the acquisition date and pro forma information are not required or presented.
2016 Acquisition
Attentive.ly
On
July 11, 2016
, we acquired all of the outstanding equity, including all voting equity interests of Good+Geek, Inc., a Delaware corporation doing business as "Attentive.ly." Attentive.ly provides social media capabilities allowing organizations to conduct social listening, identify key influencers and drive engagement through its cloud solution. The acquisition accelerated our ability to deliver these capabilities to our customers. We acquired Attentive.ly for
$3.9 million
in cash, net of closing adjustments. As a result of the acquisition, Attentive.ly became a wholly-owned subsidiary of ours. We finalized the purchase price allocation of Attentive.ly, including the valuation of assets acquired and liabilities assumed, during the second quarter of 2017. All measurement period adjustments were insignificant. We determined that the impact of this acquisition was not material to our consolidated financial statements; therefore, revenue and earnings since the acquisition date and pro forma information are not required or presented.
2015 Acquisition
Smart Tuition
On
October 2, 2015
, we completed our acquisition of all of the outstanding equity, including all voting equity interests, of Smart, LLC (“Smart Tuition”). Smart Tuition is a leading provider of payment software and services for private schools and parents. The acquisition of Smart Tuition further expanded our offerings in the K-12 technology sector. We acquired Smart Tuition for
$187.3 million
in cash. As a result of the acquisition, Smart Tuition became a wholly-owned subsidiary of ours. Because we have integrated the operations of Smart Tuition into ours, it is impracticable to determine the revenue and operating income attributable solely to the acquired business. We financed the acquisition of Smart Tuition through cash on hand and borrowings of
$186.0 million
under our 2014 Credit Facility (as defined in
Note 9
below).
|
2017 Form 10-K
|
|
75
|
The following unaudited pro forma condensed combined consolidated results of operations assume that the acquisition of Smart Tuition occurred on January 1, 2014. This unaudited pro forma financial information does not reflect any adjustments for anticipated synergies resulting from the acquisition and should not be relied upon as being indicative of the historical results that would have been attained had the transaction been consummated as of January 1, 2014, or of the results that may occur in the future. The unaudited pro forma information reflects adjustments for amortization of intangibles related to the fair value adjustments of the assets acquired, write-down of acquired deferred revenue to fair value, additional interest expense related to the financing of the transaction and the related tax effects of the adjustments.
|
Years ended December 31,
|
|
||
|
(dollars in thousands, except per share amounts)
|
2015
|
|
|
|
Revenue
|
$
|
666,131
|
|
|
Net income
|
$
|
26,334
|
|
|
Basic earnings per share
|
$
|
0.58
|
|
|
Diluted earnings per share
|
$
|
0.57
|
|
|
4. Goodwill and Other Intangible Assets
|
The change in our goodwill during
2017
consisted of the following:
|
(dollars in thousands)
|
Total
|
|
|
|
Balance at December 31, 2016
|
$
|
438,240
|
|
|
Additions related to current year business combinations
|
91,646
|
|
|
|
Adjustments related to prior year business combination
|
(87
|
)
|
|
|
Effect of foreign currency translation
|
450
|
|
|
|
Balance at December 31, 2017
|
$
|
530,249
|
|
|
76
|
|
2017 Form 10-K
|
We have recorded intangible assets acquired in various business combinations based on their fair values at the date of acquisition. The table below sets forth the balances of each class of intangible asset and related amortization as of:
|
|
December 31,
|
|||||
|
(dollars in thousands)
|
2017
|
|
2016
|
|
||
|
Finite-lived gross carrying amount
|
||||||
|
Customer relationships
|
$
|
274,458
|
|
$
|
248,287
|
|
|
Marketing assets
|
49,661
|
|
16,187
|
|
||
|
Acquired software and technology
|
193,010
|
|
147,269
|
|
||
|
Non-compete agreements
|
2,603
|
|
3,493
|
|
||
|
Database
|
4,275
|
|
4,275
|
|
||
|
Total finite-lived gross carrying amount
|
524,007
|
|
419,511
|
|
||
|
Accumulated amortization
|
||||||
|
Customer relationships
|
(96,662
|
)
|
(77,983
|
)
|
||
|
Marketing assets
|
(12,444
|
)
|
(9,826
|
)
|
||
|
Acquired software and technology
|
(96,528
|
)
|
(74,975
|
)
|
||
|
Non-compete agreements
|
(1,125
|
)
|
(1,553
|
)
|
||
|
Database
|
(4,197
|
)
|
(4,093
|
)
|
||
|
Total accumulated amortization
|
(210,956
|
)
|
(168,430
|
)
|
||
|
Indefinite-lived gross carrying amount
|
||||||
|
Marketing assets
|
1,600
|
|
2,595
|
|
||
|
Intangible assets, net
|
$
|
314,651
|
|
$
|
253,676
|
|
Changes to the gross carrying amounts of intangible asset classes during
2017
were primarily related to our business acquisitions as described in
Note 3
of these financial statements and the effect of foreign currency translation.
Amortization expense
Amortization expense related to finite-lived intangible assets acquired in business combinations is allocated to cost of revenue on the consolidated statements of comprehensive income based on the revenue stream to which the asset contributes, except for marketing assets and non-compete agreements, for which the associated amortization expense is included in operating expenses.
The following table summarizes amortization expense of our finite-lived intangible assets:
|
|
Years ended December 31,
|
||||||||
|
(dollars in thousands)
|
2017
|
|
2016
|
|
2015
|
|
|||
|
Included in cost of revenue:
|
|||||||||
|
Cost of subscriptions
|
$
|
32,399
|
|
$
|
31,270
|
|
$
|
23,075
|
|
|
Cost of maintenance
|
5,158
|
|
5,327
|
|
4,162
|
|
|||
|
Cost of services and other
|
2,542
|
|
2,961
|
|
2,750
|
|
|||
|
Total included in cost of revenue
|
40,099
|
|
39,558
|
|
29,987
|
|
|||
|
Included in operating expenses
|
3,271
|
|
2,840
|
|
2,231
|
|
|||
|
Total amortization of intangibles from business combinations
|
$
|
43,370
|
|
$
|
42,398
|
|
$
|
32,218
|
|
|
2017 Form 10-K
|
|
77
|
The following table outlines the estimated future amortization expense for each of the next five years for our finite-lived intangible assets as of
December 31, 2017
:
|
Years ending December 31,
(dollars in thousands)
|
Amortization
expense
|
|
|
|
2018
|
$
|
46,044
|
|
|
2019
|
43,596
|
|
|
|
2020
|
35,132
|
|
|
|
2021
|
29,322
|
|
|
|
2022
|
25,540
|
|
|
|
Total
|
$
|
179,634
|
|
|
5. Earnings Per Share
|
The following table sets forth the computation of basic and diluted earnings per share:
|
|
Years ended December 31,
|
||||||||
|
(dollars in thousands, except per share amounts)
|
2017
|
|
2016
|
|
2015
|
|
|||
|
Numerator:
|
|||||||||
|
Net income
|
$
|
65,933
|
|
$
|
41,515
|
|
$
|
25,649
|
|
|
Denominator:
|
|||||||||
|
Weighted average common shares
|
46,669,440
|
|
46,132,389
|
|
45,623,854
|
|
|||
|
Add effect of dilutive securities:
|
|||||||||
|
Stock-based awards
|
1,106,262
|
|
1,184,149
|
|
874,850
|
|
|||
|
Weighted average common shares assuming dilution
|
47,775,702
|
|
47,316,538
|
|
46,498,704
|
|
|||
|
Earnings per share:
|
|||||||||
|
Basic
|
$
|
1.41
|
|
$
|
0.90
|
|
$
|
0.56
|
|
|
Diluted
|
$
|
1.38
|
|
$
|
0.88
|
|
$
|
0.55
|
|
|
Anti-dilutive shares excluded from calculations of diluted earnings per share
|
4,634
|
|
7,339
|
|
18,554
|
|
|||
|
78
|
|
2017 Form 10-K
|
|
6. Fair Value Measurements
|
Recurring fair value measurements
Financial assets and liabilities measured at fair value on a recurring basis consisted of the following, as of the dates indicated below:
|
Fair value measurement using
|
|||||||||||||||
|
(dollars in thousands)
|
Level 1
|
|
Level 2
|
|
Level 3
|
|
Total
|
|
|||||||
|
Fair value as of December 31, 2017
|
|||||||||||||||
|
Financial assets:
|
|||||||||||||||
|
Derivative instruments
|
$
|
—
|
|
$
|
1,283
|
|
$
|
—
|
|
$
|
1,283
|
|
|||
|
Total financial assets
|
$
|
—
|
|
$
|
1,283
|
|
$
|
—
|
|
$
|
1,283
|
|
|||
|
Fair value as of December 31, 2016
|
|||||||||||||||
|
Financial assets:
|
|||||||||||||||
|
Derivative instruments
|
$
|
—
|
|
$
|
206
|
|
$
|
—
|
|
$
|
206
|
|
|||
|
Total financial assets
|
$
|
—
|
|
$
|
206
|
|
$
|
—
|
|
$
|
206
|
|
|||
|
Fair value as of December 31, 2016
|
|||||||||||||||
|
Financial liabilities:
|
|||||||||||||||
|
Derivative instruments
|
$
|
—
|
|
$
|
163
|
|
$
|
—
|
|
$
|
163
|
|
|||
|
Total financial liabilities
|
$
|
—
|
|
$
|
163
|
|
$
|
—
|
|
$
|
163
|
|
|||
Our derivative instruments within the scope of ASC 815,
Derivatives and Hedging
, are required to be recorded at fair value. Our derivative instruments that are recorded at fair value include interest rate swaps, as well as foreign currency forward and option contracts.
The fair value of our interest rate swaps was based on model-driven valuations using LIBOR rates, which are observable at commonly quoted intervals. Accordingly, our interest rate swaps are classified within Level 2 of the fair value hierarchy.
Our foreign currency forward and option contracts are valued using standard calculations/models that use as their basis readily observable market parameters including, foreign currency exchange rates, volatilities, and interest rates. Therefore, our foreign currency forward and option contracts are classified within Level 2 of the fair value hierarchy.
We believe the carrying amounts of our cash and cash equivalents, donor restricted cash, accounts receivable, customer funds receivable, trade accounts payable, accrued expenses and other current liabilities and due to customers approximate their fair values at
December 31, 2017
and
December 31, 2016
, due to the immediate or short-term maturity of these instruments.
We believe the carrying amount of our debt approximates its fair value at
December 31, 2017
and
December 31, 2016
, as the debt bears interest rates that approximate market value. As LIBOR rates are observable at commonly quoted intervals, our debt is classified within Level 2 of the fair value hierarchy.
We did not transfer any assets or liabilities among the levels within the fair value hierarchy during the years ended
December 31, 2017
,
2016
and
2015
. Additionally, we did not hold any Level 3 assets or liabilities during the years ended
December 31, 2017
,
2016
and
2015
.
|
2017 Form 10-K
|
|
79
|
Non-recurring fair value measurements
Assets and liabilities that are measured at fair value on a non-recurring basis include intangible assets and goodwill which are recognized at fair value during the period in which an acquisition is completed, from updated estimates and assumptions during the measurement period, or when they are considered to be impaired. These non-recurring fair value measurements, primarily for intangible assets acquired, were based on Level 3 unobservable inputs. In the event of an impairment, we determine the fair value of the goodwill and intangible assets using a discounted cash flow approach, which contains significant unobservable inputs and therefore is considered a Level 3 fair value measurement. The unobservable inputs in the analysis generally include future cash flow projections and a discount rate.
There were no non-recurring fair value adjustments to intangible assets and goodwill during
2017
,
2016
and
2015
except for certain business combination accounting adjustments to the initial fair value estimates of the assets acquired and liabilities assumed at the acquisition date (see
Note 3
to these consolidated financial statements) from updated estimates and assumptions during the measurement period. The measurement period may be up to one year from the acquisition date. We record any measurement period adjustments to the fair value of assets acquired and liabilities assumed, with the corresponding offset to goodwill.
|
7. Property and Equipment and Software Development Costs
|
Property and equipment
Property and equipment consisted of the following, as of:
|
|
Estimated
useful life
(years)
|
|
December 31,
|
|||||
|
(dollars in thousands)
|
2017
|
|
2016
|
|
||||
|
Equipment
|
2 - 5
|
|
$
|
2,728
|
|
$
|
2,403
|
|
|
Computer hardware
|
2 - 5
|
|
76,331
|
|
81,260
|
|
||
|
Computer software
|
2 - 5
|
|
34,058
|
|
31,604
|
|
||
|
Construction in progress
|
—
|
|
3,102
|
|
2,972
|
|
||
|
Furniture and fixtures
|
3 - 1
0
|
|
7,265
|
|
7,989
|
|
||
|
Leasehold improvements
|
Lesser of lea
se term or 10 years
|
|
22,359
|
|
19,942
|
|
||
|
Total property and equipment
|
145,843
|
|
146,170
|
|
||||
|
Less: accumulated depreciation
|
(103,600
|
)
|
(95,901
|
)
|
||||
|
Property and equipment, net
|
|
$
|
42,243
|
|
$
|
50,269
|
|
|
Depreciation expense was
$17.8 million
,
$19.8 million
, and
$18.5 million
for the years ended
December 31, 2017
,
2016
and
2015
, respectively.
Property and equipment, net of depreciation, under capital leases at
December 31, 2017
and
2016
was
insignificant
.
Software development costs
Software development costs consisted of the following, as of:
|
|
Estimated
useful life
(years)
|
December 31,
|
|||||
|
(dollars in thousands)
|
2017
|
|
2016
|
|
|||
|
Software development costs
|
3 - 7
|
$
|
84,404
|
|
$
|
55,126
|
|
|
Less: accumulated amortization
|
(30,306
|
)
|
(17,544
|
)
|
|||
|
Software development costs, net
|
|
$
|
54,098
|
|
$
|
37,582
|
|
|
80
|
|
2017 Form 10-K
|
Amortization expense related to software development costs was
$12.8 million
,
$8.3 million
, and
$5.4 million
for the years ended
December 31, 2017
,
2016
and
2015
, respectively, and is included primarily in cost of subscriptions.
|
8. Consolidated Financial Statement Details
|
Prepaid expenses and other assets
|
(dollars in thousands)
|
December 31,
2017 |
|
December 31,
2016 |
|
||
|
Deferred sales commissions
|
$
|
41,414
|
|
$
|
37,459
|
|
|
Prepaid software maintenance and subscriptions
|
18,130
|
|
18,627
|
|
||
|
Taxes, prepaid and receivable
|
10,548
|
|
4,111
|
|
||
|
Prepaid insurance
|
1,310
|
|
308
|
|
||
|
Deferred professional services costs
|
681
|
|
1,722
|
|
||
|
Prepaid royalties
|
500
|
|
1,373
|
|
||
|
Deferred tax asset
|
451
|
|
2,379
|
|
||
|
Other assets
|
7,148
|
|
4,859
|
|
||
|
Total prepaid expenses and other assets
|
80,182
|
|
70,838
|
|
||
|
Less: Long-term portion
|
24,083
|
|
22,524
|
|
||
|
Prepaid expenses and other current assets
|
$
|
56,099
|
|
$
|
48,314
|
|
Accrued expenses and other liabilities
|
(dollars in thousands)
|
December 31,
2017 |
|
December 31,
2016 |
|
||
|
Accrued bonuses
|
$
|
16,743
|
|
$
|
17,468
|
|
|
Accrued commissions and salaries
|
6,943
|
|
8,832
|
|
||
|
Taxes payable
|
5,517
|
|
5,721
|
|
||
|
Deferred rent liabilities
|
4,548
|
|
4,110
|
|
||
|
Lease incentive obligations
|
4,635
|
|
5,604
|
|
||
|
Unrecognized tax benefit
|
1,972
|
|
3,295
|
|
||
|
Customer credit balances
|
4,652
|
|
5,148
|
|
||
|
Accrued subscriptions
|
1,221
|
|
2,840
|
|
||
|
Accrued vacation costs
|
2,458
|
|
2,214
|
|
||
|
Accrued health care costs
|
2,615
|
|
1,495
|
|
||
|
Other liabilities
|
8,727
|
|
6,002
|
|
||
|
Total accrued expenses and other liabilities
|
60,031
|
|
62,729
|
|
||
|
Less: Long-term portion
|
5,632
|
|
8,533
|
|
||
|
Accrued expenses and other current liabilities
|
$
|
54,399
|
|
$
|
54,196
|
|
|
2017 Form 10-K
|
|
81
|
Deferred revenue
|
(dollars in thousands)
|
December 31,
2017 |
|
December 31,
2016 |
|
||
|
Subscriptions
|
$
|
185,042
|
|
$
|
144,606
|
|
|
Maintenance
|
63,246
|
|
76,803
|
|
||
|
Services and other
|
31,811
|
|
29,531
|
|
||
|
Total deferred revenue
|
280,099
|
|
250,940
|
|
||
|
Less: Long-term portion
|
3,643
|
|
6,440
|
|
||
|
Deferred revenue, current portion
|
$
|
276,456
|
|
$
|
244,500
|
|
Other income (expense), net
|
|
Years ended December 31,
|
||||||||
|
(dollars in thousands)
|
2017
|
|
2016
|
|
2015
|
|
|||
|
Interest income
|
$
|
993
|
|
$
|
581
|
|
$
|
155
|
|
|
Loss on sale of business
|
—
|
|
—
|
|
(1,976
|
)
|
|||
|
Gain on derivative instrument
|
462
|
|
—
|
|
—
|
|
|||
|
Loss on debt extinguishment
|
(299
|
)
|
—
|
|
—
|
|
|||
|
Other income (expense), net
|
1,104
|
|
(872
|
)
|
134
|
|
|||
|
Other income (expense), net
|
$
|
2,260
|
|
$
|
(291
|
)
|
$
|
(1,687
|
)
|
|
9. Debt
|
The following table summarizes our debt balances and the related weighted average effective interest rates, which includes the effect of interest rate swap agreements.
|
Debt balance at
|
Weighted average
effective interest rate at
|
||||||||||
|
(dollars in thousands)
|
December 31,
2017 |
|
December 31,
2016 |
|
December 31,
2017 |
|
December 31,
2016 |
|
|||
|
Credit facility:
|
|||||||||||
|
Revolving credit loans
|
$
|
143,000
|
|
$
|
180,900
|
|
2.84
|
%
|
2.36
|
%
|
|
|
Term loans
|
296,250
|
|
162,969
|
|
2.64
|
%
|
2.62
|
%
|
|||
|
Other debt
|
1,076
|
|
—
|
|
4.50
|
%
|
—
|
%
|
|||
|
Total debt
|
440,326
|
|
343,869
|
|
2.71
|
%
|
2.48
|
%
|
|||
|
Less: Unamortized discount and debt issuance costs
|
2,102
|
|
1,476
|
|
|||||||
|
Less: Debt, current portion
|
8,576
|
|
4,375
|
|
3.03
|
%
|
2.50
|
%
|
|||
|
Debt, net of current portion
|
$
|
429,648
|
|
$
|
338,018
|
|
2.71
|
%
|
2.48
|
%
|
|
Financing for 2017 acquisitions
On
April 3, 2017
we acquired AcademicWorks for
$52.1 million
in cash, net of closing adjustments. We financed the acquisition with a revolving credit loan under the
2014 Credit Facility
(defined below). On
October 2, 2017
, we borrowed
$138.7 million
pursuant to a revolving credit loan under the
2017 Credit Facility
(defined below) to finance our acquisition of JustGiving.
|
82
|
|
2017 Form 10-K
|
2017 refinancing
We were previously party to a
$325.0 million
five
-year credit facility entered into during
February 2014
. The credit facility included: a dollar and a designated currency revolving credit facility with sublimits for letters of credit and swingline loans (the “
2014 Revolving Facility
”) and a delayed draw term loan (the “
2014 Term Loan
”) together, (the “
2014 Credit Facility
”).
In
June 2017
, we entered into a
five
-year
$700.0 million
senior credit facility (the “
2017 Credit Facility
”). The
2017 Credit Facility
includes a
$400.0 million
revolving credit facility (the “
2017 Revolving Facility
”) and a
$300.0 million
term loan facility (the “
2017 Term Loan
”). Upon closing we drew
$300.0 million
on a term loan and
$110.0 million
in revolving credit loans, which was used to repay all amounts outstanding under the
2014 Credit Facility
, fees and expenses incurred in connection with the
2017 Credit Facility
, and for other general corporate purposes.
Certain lenders of the
2014 Term Loan
participated in the
2017 Term Loan
and the change in the present value of our future cash flows to these lenders under the
2014 Term Loan
and under the
2017 Term Loan
was less than
10%
. Accordingly, we accounted for the refinancing event for these lenders as a debt modification. Certain lenders of the
2014 Term Loan
did not participate in the
2017 Term Loan
. Accordingly, we accounted for the refinancing event for these lenders as a debt extinguishment. Certain lenders of the
2014 Revolving Facility
participated in the
2017 Revolving Facility
and provided increased borrowing capacities. Accordingly, we accounted for the refinancing event for these lenders as a debt modification. Certain lenders of the
2014 Revolving Facility
did not participate in the
2017 Revolving Facility
. Accordingly, we accounted for the refinancing event for these lenders as a debt extinguishment.
We recorded an insignificant loss on debt extinguishment related to the write-off of debt discount and deferred financing costs for the portions of the
2014 Credit Facility
considered to be extinguished. This loss was recognized in the consolidated statements of comprehensive income within other income (expense), net.
In connection with our entry into the
2017 Credit Facility
, we paid
$3.1 million
in financing costs, of which
$1.0 million
were capitalized in other assets and, together with a portion of the unamortized deferred financing costs from the
2014 Credit Facility
and prior facilities, are being amortized into interest expense ratably over the term of the new facility. As of
December 31, 2017
, deferred financing costs totaling
$1.2 million
were included in other assets on our consolidated balance sheets. As of
December 31, 2016
, deferred financing costs included in other assets on our consolidated balance sheets were insignificant. We recorded aggregate financing costs of
$1.8 million
as a direct deduction from the carrying amount of our debt liability, which related to debt discount (fees paid to lenders) and debt issuance costs for the
2017 Term Loan
.
Summary of the
2017 Credit Facility
The
2017 Revolving Facility
includes (i) a
$50.0 million
sublimit available for the issuance of standby letters of credit, (ii) a
$50.0 million
sublimit available for swingline loans, and (iii) a
$100.0 million
sublimit available for multicurrency borrowings.
The
2017 Credit Facility
is secured by the stock and limited liability company interests of certain of our subsidiaries and any of our material domestic subsidiaries.
Amounts borrowed under the dollar tranche revolving credit loans and term loan under the
2017 Credit Facility
bear interest at a rate per annum equal to, at our option, (a) a base rate equal to the highest of (i) the prime rate announced by Bank of America, N.A., (ii) the Federal Funds Rate plus
0.50%
and (iii) the Eurocurrency Rate (which varies depending on the currency in which the loan is denominated) plus
1.00%
(the “Base Rate”), in addition to a margin of
0.00%
to
0.75%
, or (b) Eurocurrency Rate plus a margin of
1.00%
to
1.75%
.
We also pay a quarterly commitment fee on the unused portion of the
2017 Revolving Facility
from
0.15%
to
0.25%
per annum, depending on our net leverage ratio. At
December 31, 2017
, the commitment fee was
0.20%
.
The term loan under the
2017 Credit Facility
requires periodic principal payments. The balance of the term loan and any amounts drawn on the revolving credit loans are due upon maturity of the
2017 Credit Facility
in
June 2022
. We evaluate the classification of our debt as current or non-current based on the required annual maturities of the
2017 Credit Facility
.
|
2017 Form 10-K
|
|
83
|
The
2017 Credit Facility
includes financial covenants related to the net leverage ratio and interest coverage ratio, as well as restrictions on our ability to declare and pay dividends and our ability to repurchase shares of our common stock.
At December 31, 2017, we were in compliance with our debt covenants under the 2017 Credit Facility.
The
2017 Credit Facility
also includes an option to request increases in the revolving commitments and/or request additional term loans in an aggregate principal amount of up to
$200.0 million
plus an amount, if any, such that the Net Leverage Ratio shall be no greater than
3.00
to
1.00
. At
December 31, 2017
, our available borrowing capacity under the
2017 Credit Facility
was
$254.2 million
.
In September 2017, we entered into a
two
-year
$2.2 million
agreement to finance our purchase of software licenses and related services. The agreement is a non-interest-bearing note requiring annual payments, where the first payment was due in November 2017. Interest associated with the note is imputed at the rate we would incur for amounts borrowed under the 2017 Credit Facility.
As of
December 31, 2017
, the required annual maturities related to the
2017 Credit Facility
and other debt were as follows:
|
Years ending December 31,
(dollars in thousands)
|
Annual
maturities
|
|
|
|
2018
|
$
|
8,576
|
|
|
2019
|
7,500
|
|
|
|
2020
|
7,500
|
|
|
|
2021
|
7,500
|
|
|
|
2022
|
409,250
|
|
|
|
Thereafter
|
—
|
|
|
|
Total required maturities
|
$
|
440,326
|
|
|
10. Derivative Instruments
|
Cash flow hedges
We generally use derivative instruments to manage our variable interest rate risk. In
March 2014
, we entered into a new interest rate swap agreement (the "March 2014 Swap Agreement"), which effectively converts portions of our variable rate debt under our credit facility to a fixed rate for the term of the March 2014 Swap Agreement. The initial notional value of the March 2014 Swap Agreement was
$125.0 million
with an effective date beginning in
March 2014
. In
March 2017
, the notional value of the March 2014 Swap Agreement decreased to
$75.0 million
for the remaining term through
February 2018
. We designated the March 2014 Swap Agreement as a cash flow hedge at the inception of the contract.
In
October 2015
, we entered into an additional interest rate swap agreement (the "
October 2015
Swap Agreement"), which effectively converts portions of our variable rate debt under our credit facility to a fixed rate for the term of the October 2015 Swap Agreement. The notional value of the
October 2015
Swap Agreement was
$75.0 million
with an effective date beginning in
October 2015
and maturing in February 2018. We designated the
October 2015
Swap Agreement as a cash flow hedge at the inception of the contract.
In
July 2017
, we entered into an additional interest rate swap agreement (the "July 2017 Swap Agreement"), which effectively converts portions of our variable rate debt under our credit facility to a fixed rate for the term of the July 2017 Swap Agreement. The notional value of the July 2017 Swap Agreement was
$150.0 million
with an effective date beginning in
July 2017
through
July 2021
. We designated the July 2017 Swap Agreement as a cash flow hedge at the inception of the contract.
|
84
|
|
2017 Form 10-K
|
Undesignated contracts
In
June 2017
, we entered into a foreign currency option contract to hedge our exposure to currency fluctuations in connection with our acquisition of JustGiving because the purchase price was denominated in British Pounds. The notional value of the instrument was
£100.0 million
with an effective date beginning in
June 2017
and maturing in
September 2017
. We settled the foreign currency option contract in September 2017. We did not designate the foreign currency option contract as a cash flow hedge for accounting purposes since it involved a business combination. As such, changes in the fair value of this derivative were recognized in earnings. The insignificant premium paid for this option and the
$1.0 million
in proceeds from the settlement are shown within cash flows from investing activities in our consolidated statements of cash flows.
As the closing date of our acquisition of JustGiving extended beyond the settlement date of the foreign currency option contract, we entered into a foreign currency forward contract in
September 2017
with settlement in
October 2017
. The notional value of the instrument was
£103.5 million
. We did not designate the foreign currency forward contract as a cash flow hedge for accounting purposes since it involved a business combination. As such, changes in the fair value of this derivative were recognized in earnings. The insignificant premium paid for this forward contract is shown within cash flows from investing activities in our consolidated statements of cash flows.
The fair values of our derivative instruments were as follows as of:
|
Asset Derivatives
|
Liability Derivatives
|
||||||||||||||
|
(dollars in thousands)
|
Balance sheet location
|
December 31,
2017 |
|
December 31,
2016 |
|
Balance sheet location
|
December 31,
2017 |
|
December 31,
2016 |
|
|||||
|
Derivative instruments designated as hedging instruments:
|
|||||||||||||||
|
Interest rate swaps, current portion
|
Prepaid expenses
and other current assets
|
$
|
145
|
|
$
|
—
|
|
Accrued expenses
and other current liabilities
|
$
|
—
|
|
$
|
—
|
|
|
|
Interest rate swaps, long-term portion
|
Other assets
|
1,138
|
|
206
|
|
Other liabilities
|
—
|
|
163
|
|
|||||
|
Total derivative instruments designated as hedging instruments
|
$
|
1,283
|
|
$
|
206
|
|
$
|
—
|
|
$
|
163
|
|
|||
We did not have any undesignated derivative instruments as of
December 31, 2017
and
2016
.
The effects of derivative instruments in cash flow hedging relationships were as follows:
|
Gain (loss) recognized
in accumulated other
comprehensive
loss as of
|
|
Location
of gain (loss)
reclassified from
accumulated other
comprehensive
loss into income
|
Gain (loss) reclassified from accumulated
other comprehensive loss into income
|
|
|||
|
(dollars in thousands)
|
December 31,
2017 |
|
Year ended
December 31, 2017 |
|
|||
|
Interest rate swaps
|
$
|
1,283
|
|
Interest expense
|
$
|
(293
|
)
|
|
December 31,
2016 |
|
Year ended
December 31, 2016 |
|
||||
|
Interest rate swaps
|
$
|
42
|
|
Interest expense
|
$
|
(1,106
|
)
|
|
December 31,
2015 |
|
Year ended
December 31, 2015 |
|
||||
|
Interest rate swaps
|
$
|
(31
|
)
|
Interest expense
|
$
|
(1,569
|
)
|
Our policy requires that derivatives used for hedging purposes be designated and effective as a hedge of the identified risk exposure at the inception of the contract. Accumulated other comprehensive income (loss) includes unrealized gains or losses from the change in fair value measurement of our derivative instruments each reporting period and the related income tax expense or benefit. Changes in the fair value measurements of the derivative instruments and the related income tax expense or benefit are reflected as adjustments to accumulated other comprehensive income (loss) until the actual hedged expense is incurred or until the hedge is terminated at which point the unrealized gain (loss) is reclassified
|
2017 Form 10-K
|
|
85
|
from accumulated other comprehensive income (loss) to current earnings. The estimated accumulated other comprehensive income as of
December 31, 2017
that is expected to be reclassified into earnings within the next twelve months is
insignificant
. There were no ineffective portions of our interest rate swap derivatives during the years ended
December 31, 2017
,
2016
and
2015
. See
Note 14
to these consolidated financial statements for a summary of the changes in accumulated other comprehensive income (loss) by component.
We did not have any undesignated derivative instruments during
2016
and
2015
. The effects of undesignated derivative instruments during
2017
were as follows:
|
Location of gain (loss)
recognized in income on derivative
|
Gain (loss) recognized in income
|
|
||
|
(dollars in thousands)
|
Year ended
December 31, 2017 |
|
||
|
Foreign currency option contracts
|
Other income (expense), net
|
$
|
513
|
|
|
Foreign currency forward contracts
|
Other income (expense), net
|
$
|
(51
|
)
|
|
Total gain
(1)
|
$
|
462
|
|
|
|
(1)
|
The individual amounts may not sum to total gain due to rounding.
|
|
11. Commitments and Contingencies
|
Historical Leases
We lease our headquarters facility under a
15
-year lease agreement which was entered into in
October 2008
, and has
two
five
-year renewal options. The current annual base rent of the lease is
$4.3 million
, payable in equal monthly installments. The base rent escalates annually at a rate equal to the change in the consumer price index, as defined in the agreement, but not to exceed
5.5%
in any year.
We have a lease for office space in Austin, Texas which terminates on September 30, 2023, and has
two
five
-year renewal options. The current annual base rent of the lease is
$2.8 million
. The base rent escalates annually between
2%
and
4%
based on the terms of the agreement. The rent expense is recorded on a straight-line basis over the length of the lease term. At
December 31, 2017
, we had a standby letter of credit of
$1.5 million
for a security deposit for this lease.
We have provisions in our leases that entitle us to aggregate remaining leasehold improvement allowances of
$5.7 million
as of
December 31, 2017
. These amounts are being recorded as a reduction to rent expense ratably over the terms of the leases. The leasehold improvement allowances have been included in the table of operating lease commitments below as a reduction in our lease commitments ratably over the then remaining terms of the leases. The timing of the reimbursements for the actual leasehold improvements may vary from the amounts reflected in the table below.
Additionally, we have subleased a portion of our facilities under various agreements through 2023. As of
December 31, 2017
, our total minimum rentals to be received in the future under noncancelable subleases was
$6.5 million
. These amounts are also being recorded as a reduction to rent expense.
Total rent expense was
$16.1 million
,
$11.7 million
and
$10.3 million
for the years ended
December 31, 2017
,
2016
and
2015
, respectively.
The quarterly South Carolina state incentive payments we received as a result of locating our current headquarters facility in Berkeley County, South Carolina, ended in the fourth quarter of 2016. These amounts were recorded as a reduction of rent expense upon receipt and were
$2.9 million
and
$2.3 million
for the years ended
December 31, 2016
and
2015
, respectively.
Lease for New Headquarters Facility
In May 2016, we entered into a lease agreement for a new headquarters facility to be built in Charleston, South Carolina (the "New Headquarters Facility"). The landlord is responsible for the design, development and construction of the New Headquarters Facility. Construction of the New Headquarters Facility will proceed in two phases. Phase One will include a building with approximately
172,000
rentable square feet, which is expected to be completed in the first half of 2018.
|
86
|
|
2017 Form 10-K
|
The lease agreement also grants us a Phase Two option to request that the landlord construct and lease to us a second office building and related improvements. Total rent payments and leasehold improvement allowances for Phase One are estimated to be approximately
$104.2 million
and
$13.9 million
, respectively, over the life of the lease agreement, plus additional amounts for Phase Two, if applicable. The lease agreement is for a period of
twenty
years beginning on the date of substantial completion of construction by the landlord, which is estimated to be in the first half of 2018, and ending in the first half of 2038. The lease agreement provides for
four
renewal periods of
five
years each at a base rent equal to the then prevailing market rate for comparable buildings. We expect to receive quarterly South Carolina state incentive payments as a result of locating our new headquarters facility in Berkeley County, South Carolina, which will be recorded as a reduction of rent expense upon receipt.
As of
December 31, 2017
, the future minimum lease payments related to lease agreements with a remaining noncancelable term in excess of one year, net of related sublease commitments and lease incentives, were as follows:
|
Years ending December 31,
(dollars in thousands)
|
Operating
leases
(1)
|
|
|
|
2018
|
$
|
18,373
|
|
|
2019
|
17,273
|
|
|
|
2020
|
15,407
|
|
|
|
2021
|
14,697
|
|
|
|
2022
|
14,696
|
|
|
|
Thereafter
|
82,789
|
|
|
|
Total minimum lease payments
|
$
|
163,235
|
|
|
(1)
|
Our future minimum lease commitments related to operating leases do not include payments related to Phase Two of our New Headquarters Facility, as that option had not been exercised as of
December 31, 2017
.
|
Other commitments
As discussed in
Note 9
to these consolidated financial statements, the term loans under the 2017 Credit Facility require periodic principal payments. The balance of the term loans and any amounts drawn on the revolving credit loans are due upon maturity of the 2017 Credit Facility in
June 2022
.
We have contractual obligations for third-party technology used in our solutions and for other services we purchase as part of our normal operations. In certain cases, these arrangements require a minimum annual purchase commitment by us. As of
December 31, 2017
, the remaining aggregate minimum purchase commitment under these arrangements was approximately
$66.8 million
through
2021
.
Solution and service indemnifications
In the ordinary course of business, we provide certain indemnifications of varying scope to customers against claims of intellectual property infringement made by third parties arising from the use of our solutions or services. If we determine that it is probable that a loss has been incurred related to solution or service indemnifications, any such loss that could be reasonably estimated would be recognized. We have not identified any losses and, accordingly, we have not recorded a liability related to these indemnifications.
Guarantees and indemnification obligations
We enter into agreements in the ordinary course of business with, among others, customers, creditors, vendors and service providers. Pursuant to certain of these agreements we have agreed to indemnify the other party for certain matters, such as property damage, personal injury, acts or omissions of ours, or our employees, agents or representatives, or third-party claims alleging that the activities of its contractual partner pursuant to the contract infringe a patent, trademark or copyright of such third party.
|
2017 Form 10-K
|
|
87
|
Legal contingencies
We are subject to legal proceedings and claims that arise in the ordinary course of business. We make a provision for a loss contingency when it is both probable that a liability has been incurred and the amount of the loss can be reasonably estimated. These provisions are reviewed at least quarterly and adjusted to reflect the impacts of negotiations, settlements, rulings, advice of legal counsel and other information and events pertaining to a particular case. Unless otherwise specifically disclosed in this note, we have determined as of
December 31, 2017
, that no provision for liability nor disclosure is required related to any claim against us because (a) there is not a reasonable possibility that a loss exceeding amounts already recognized (if any) may be incurred with respect to such claim; (b) a reasonably possible loss or range of loss cannot be estimated; or (c) such estimate is immaterial.
All legal costs associated with litigation are expensed as incurred. Litigation is inherently unpredictable. However, we believe that we have valid defenses with respect to the legal matters pending against us. It is possible, nevertheless, that our consolidated financial position, results of operations or cash flows could be negatively affected in any particular period by an unfavorable resolution of one or more of such proceedings, claims or investigations.
|
12. Income Taxes
|
We file income tax returns in the U.S. for federal and various state jurisdictions as well as in foreign jurisdictions including Canada, the United Kingdom, Australia and Ireland. We are generally subject to U.S. federal income tax examination for calendar tax years
2014
through
2017
as well as state and foreign income tax examinations for various years depending on statutes of limitations of those jurisdictions.
On December 22, 2017, the U.S. government enacted comprehensive tax legislation commonly referred to as the Tax Cuts and Jobs Act (the “Tax Act”). The Tax Act makes broad and complex changes to the U.S. tax code, including, but not limited to, (1) reducing the U.S. federal corporate tax rate from 35% to 21%, effective January 1, 2018; (2) requiring companies to pay a one-time transition tax on certain unrepatriated earnings of foreign subsidiaries (the "Transition Tax"); (3) generally eliminating U.S. federal income taxes on dividends from foreign subsidiaries; (4) requiring a current inclusion in U.S. federal taxable income of certain earnings of controlled foreign corporations; (5) eliminating the corporate alternative minimum tax (AMT) and changing how existing AMT credits can be realized; (6) creating the base erosion anti-abuse tax (BEAT), a new minimum tax; (7) creating a new limitation on deductible interest expense; and (8) changing rules related to uses and limitations of net operating loss carryforwards created in tax years beginning after December 31, 2017.
Under GAAP, we use the asset and liability method of accounting for income taxes. Under this method, deferred tax assets and liabilities are recognized for the future tax consequences attributable to differences between the financial statement carrying amounts of existing assets and liabilities and their respective tax bases. Deferred tax assets and liabilities are measured using enacted tax rates expected to apply to taxable income in the years in which those temporary differences are expected to be recovered or settled. Due to the reduction in the federal corporate tax rate from 35% to 21%, we revalued our net deferred tax assets and deferred tax liabilities and recorded a discrete tax benefit to expense of
$20.0 million
in 2017.
The Transition Tax is a tax on previously untaxed accumulated and current earnings and profits of certain of our foreign subsidiaries. We were able to make a reasonable estimate of the Transition Tax and determined that it was insignificant.
The Tax Act eliminates the exceptions for performance-based compensation and CFO compensation from the 162(m) calculation. A transition rule allows for the grandfathering of performance-based compensation pursuant to a written binding contract in effect as of November 2, 2017. While there is negative discretion inherent in our performance-based compensation plans, it is our position that the intent is for historic contracts to be written and binding. As a result, we have not adjusted the ending deferred tax asset for the performance-based stock compensation or the bonus accrual in our 2017 tax provision.
The Tax Act includes a new provision, referred to as Global Intangible Low-Taxed Income (“GILTI”), which provides for a 10.5% tax on certain income of controlled foreign corporations. We have elected to account for GILTI as a period cost if and when occurred, rather than recognizing deferred taxes for basis differences expected to reverse. As a result of this policy election, there is no impact to our 2017 deferred tax calculation.
|
88
|
|
2017 Form 10-K
|
Our estimates of the impact of the Tax Act may change due to a number of additional considerations including, but not limited to, the issuance of additional regulations or guidance and our ongoing analysis of the new law. Any subsequent adjustment to these amounts will be recorded to tax expense in 2018 when the analysis is complete.
The following summarizes the components of income tax expense:
|
|
Years ended December 31,
|
||||||||
|
(dollars in thousands)
|
2017
|
|
2016
|
|
2015
|
|
|||
|
Current taxes:
|
|||||||||
|
U.S. Federal
|
$
|
2,632
|
|
$
|
4,655
|
|
$
|
5,890
|
|
|
U.S. State and local
|
(144
|
)
|
1,670
|
|
2,215
|
|
|||
|
International
|
101
|
|
53
|
|
33
|
|
|||
|
Total current taxes
|
2,589
|
|
6,378
|
|
8,138
|
|
|||
|
Deferred taxes:
|
|||||||||
|
U.S. Federal
|
(13,843
|
)
|
2,544
|
|
2,702
|
|
|||
|
U.S. State and local
|
398
|
|
304
|
|
585
|
|
|||
|
International
|
(883
|
)
|
185
|
|
(122
|
)
|
|||
|
Total deferred taxes
|
(14,328
|
)
|
3,033
|
|
3,165
|
|
|||
|
Total income tax provision
|
$
|
(11,739
|
)
|
$
|
9,411
|
|
$
|
11,303
|
|
The following summarizes the components of income before provision for income taxes:
|
|
Years ended December 31,
|
||||||||
|
(dollars in thousands)
|
2017
|
|
2016
|
|
2015
|
|
|||
|
U.S.
|
$
|
54,634
|
|
$
|
49,320
|
|
$
|
37,523
|
|
|
International
|
(440
|
)
|
1,606
|
|
(571
|
)
|
|||
|
Income before provision for income taxes
|
$
|
54,194
|
|
$
|
50,926
|
|
$
|
36,952
|
|
|
2017 Form 10-K
|
|
89
|
A reconciliation between the effect of applying the federal statutory rate and the effective income tax rate used to calculate our income tax provision is as follows:
|
|
Years ended December 31,
|
|||||
|
|
2017
|
|
2016
|
|
2015
|
|
|
Federal statutory rate
|
35.0
|
%
|
35.0
|
%
|
35.0
|
%
|
|
Effect of:
|
||||||
|
State income taxes, net of federal benefit
|
1.6
|
|
4.1
|
|
5.7
|
|
|
Change in federal income tax rate applied to deferred tax balances
|
(36.9
|
)
|
—
|
|
—
|
|
|
Change in state income tax rate applied to deferred tax balances
|
—
|
|
0.2
|
|
2.1
|
|
|
Fixed assets
|
—
|
|
—
|
|
(0.1
|
)
|
|
Unrecognized tax benefit
|
1.6
|
|
0.2
|
|
(1.1
|
)
|
|
State credits, net of federal benefit
|
(1.5
|
)
|
(0.1
|
)
|
6.0
|
|
|
Change in valuation reserve (primarily state credit reserves)
|
(1.1
|
)
|
(1.6
|
)
|
(8.6
|
)
|
|
Federal credits generated
|
(6.2
|
)
|
(6.2
|
)
|
(6.1
|
)
|
|
Foreign tax rate
|
0.2
|
|
(0.4
|
)
|
(0.7
|
)
|
|
Acquisition costs
|
2.4
|
|
0.1
|
|
0.1
|
|
|
Section 162(m) limitation
|
2.7
|
|
1.7
|
|
0.1
|
|
|
Loss from sale of foreign subsidiary
|
—
|
|
—
|
|
1.9
|
|
|
Domestic production activities deduction
|
—
|
|
(1.2
|
)
|
(1.8
|
)
|
|
Stock-based compensation
|
(20.3
|
)
|
(13.6
|
)
|
—
|
|
|
Other
|
0.8
|
|
0.3
|
|
(1.9
|
)
|
|
Income tax provision effective rate
|
(21.7
|
)%
|
18.5
|
%
|
30.6
|
%
|
As discussed above, due to the reduction in the federal corporate tax rate from 35% to 21%, we revalued our net deferred tax assets and deferred tax liabilities as of December 31, 2017, and recorded a discrete tax benefit to expense of
$20.0 million
in 2017.
The discrete tax benefit to expense relating to stock-based compensation items was
$12.5 million
in
2017
. We recorded a discrete tax benefit to expense relating to stock-based compensation of
$7.7 million
during the year ended
December 31, 2016
. Prior to the adoption of ASU 2016-09 in 2016, we recorded excess tax benefit from the exercise and vesting of stock-based compensation of
$5.5 million
in additional paid in capital during the year ended
December 31, 2015
.
|
90
|
|
2017 Form 10-K
|
The significant components of our deferred tax assets and liabilities were as follows:
|
|
December 31,
|
|||||
|
(dollars in thousands)
|
2017
|
|
2016
|
|
||
|
Deferred tax assets relating to:
|
||||||
|
Federal and state and foreign net operating loss carryforwards
|
$
|
13,597
|
|
$
|
12,906
|
|
|
Federal, state and foreign tax credits
|
14,389
|
|
9,924
|
|
||
|
Intangible assets
|
693
|
|
652
|
|
||
|
Stock-based compensation
|
9,611
|
|
11,480
|
|
||
|
Accrued bonuses
|
1,001
|
|
7,426
|
|
||
|
Deferred revenue
|
859
|
|
5,371
|
|
||
|
Allowance for doubtful accounts
|
1,379
|
|
1,294
|
|
||
|
Other
|
5,440
|
|
6,781
|
|
||
|
Total deferred tax assets
|
46,969
|
|
55,834
|
|
||
|
Deferred tax liabilities relating to:
|
||||||
|
Intangible assets
|
(47,997
|
)
|
(44,885
|
)
|
||
|
Fixed assets
|
(4,552
|
)
|
(9,200
|
)
|
||
|
Deferred sales commissions
|
(9,354
|
)
|
(6,347
|
)
|
||
|
Capitalized software development costs
|
(14,012
|
)
|
(14,832
|
)
|
||
|
Other
|
(995
|
)
|
(755
|
)
|
||
|
Total deferred tax liabilities
|
(76,910
|
)
|
(76,019
|
)
|
||
|
Valuation allowance
|
(7,205
|
)
|
(6,994
|
)
|
||
|
Net deferred tax liability
|
$
|
(37,146
|
)
|
$
|
(27,179
|
)
|
As of
December 31, 2017
, our federal, foreign and state net operating loss carryforwards for income tax purposes were approximately
$33.5 million
,
$31.2 million
and
$36.9 million
, respectively. The federal and state net operating loss carryforwards are subject to various Internal Revenue Code limitations and applicable state tax laws. If not utilized, the federal net operating loss carryforwards will begin to expire in 2028 and the state net operating loss carryforwards will expire over various periods beginning in 2018. Our foreign net operating loss carryforwards have an unlimited carryforward period. As of
December 31, 2017
, our foreign tax credit carryforwards for income tax purposes were insignificant. Our federal tax credit carryforwards for income tax purposes were approximately
$3.6 million
. Our state tax credit carryforwards for income tax purposes were approximately
$13.5 million
, net of federal benefit. If not utilized, the federal tax credit carryforwards will begin to expire in 2036 and the state tax credit carryforwards will begin to expire in 2018. A portion of the foreign and state net operating loss carryforwards and state credit carryforwards have a valuation reserve due to management's uncertainty regarding the future ability to use such carryforwards.
The following table illustrates the change in our deferred tax asset valuation allowance:
|
Years ended December 31,
|
Balance
at beginning
of year
|
|
Charges to
expense
|
|
Balance at
end of
year
|
|
|||
|
(dollars in thousands)
|
|||||||||
|
2017
|
$
|
6,994
|
|
$
|
211
|
|
$
|
7,205
|
|
|
2016
|
7,911
|
|
(917
|
)
|
6,994
|
|
|||
|
2015
|
11,161
|
|
(3,250
|
)
|
7,911
|
|
|||
|
2017 Form 10-K
|
|
91
|
The following table sets forth the change to our unrecognized tax benefit for the years ended
December 31, 2017
,
2016
and
2015
:
|
|
Years ended December 31,
|
||||||||
|
(dollars in thousands)
|
2017
|
|
2016
|
|
2015
|
|
|||
|
Balance at December 31, 2016
|
$
|
3,145
|
|
$
|
3,024
|
|
$
|
3,564
|
|
|
Increases from prior period positions
|
1,860
|
|
23
|
|
129
|
|
|||
|
Decreases in prior year positions
|
(238
|
)
|
(17
|
)
|
(651
|
)
|
|||
|
Increases from current period positions
|
404
|
|
358
|
|
257
|
|
|||
|
Settlements (payments)
|
—
|
|
—
|
|
(274
|
)
|
|||
|
Lapse of statute of limitations
|
(11
|
)
|
(243
|
)
|
(1
|
)
|
|||
|
Balance at December 31, 2017
|
$
|
5,160
|
|
$
|
3,145
|
|
$
|
3,024
|
|
The total amount of unrecognized tax benefit that, if recognized, would favorably affect the effective tax rate was
$4.6 million
at
December 31, 2017
. Certain prior period amounts relating to our 2014 acquisitions are covered under indemnification agreements and, therefore, we have recorded a corresponding indemnification asset. We recognize accrued interest and penalties, if any, related to unrecognized tax benefits as a component of income tax expense. The total amount of accrued interest and penalties included in the consolidated balance sheet as of
December 31, 2017
was
$0.8 million
. The total amount of accrued interest and penalties included in the consolidated balance sheet as of
December 31, 2016
was insignificant. The total amount of interest and penalties included in the consolidated statements of comprehensive income as an increase or decrease in income tax expense for
2017
,
2016
and
2015
was
insignificant
.
We have taken federal and state tax positions for which it is reasonably possible that the total amounts of unrecognized tax benefits might decrease within the next twelve months. This possible decrease could result from the expiration of statutes of limitations. The reasonably possible decrease at
December 31, 2017
was
$1.6 million
.
For our undistributed earnings of foreign subsidiaries, which we do not consider to be significant, we concluded that these earnings would be permanently reinvested in the local jurisdictions and not repatriated to the United States. Accordingly, we have not provided for U.S. state income taxes and foreign withholding taxes on those undistributed earnings of our foreign subsidiaries. If some or all of such earnings were to be remitted, the amount of taxes payable would be insignificant.
|
13. Stock-based Compensation
|
Employee stock-based compensation plans
Under the 2016 Equity and Incentive Compensation Plan (the "2016 Equity Plan"), we may grant incentive stock options, nonstatutory stock options, stock appreciation rights, restricted stock, restricted stock units, other stock awards and cash incentive awards to employees, directors and consultants. We maintain other stock-based compensation plans including the 2008 Equity Incentive Plan (the “2008 Equity Plan”), under which no additional grants may be made, and the 2009 Equity Compensation Plan for Employees from Acquired Companies, under which we may grant shares of common stock to employees pursuant to employment contracts or other arrangements entered into in connection with past and future acquisitions.
In connection with the acquisition of Kintera in July 2008, we maintain the Kintera, Inc. Amended and Restated 2003 Equity Incentive Plan, as amended (the “Kintera 2003 Plan”), which we assumed upon the acquisition of Kintera. In connection with the acquisition of Convio in May 2012, we maintain the Convio, Inc. 1999 Stock Option/Stock Issuance Plan, as amended (the “Convio 1999 Plan”) and Convio, Inc. 2009 Stock Incentive Plan, as amended (the “Convio 2009 Plan”), which we assumed upon the acquisition of Convio. Our Compensation Committee of the Board of Directors administers all of these plans and the stock-based awards are granted under terms determined by them.
|
92
|
|
2017 Form 10-K
|
The total number of authorized stock-based awards available under our plans was
5,558,809
as of
December 31, 2017
. We issue common stock from our pool of authorized stock upon exercise of stock options and stock appreciation rights, vesting of restricted stock units or upon granting of restricted stock.
Historically, we have issued four types of awards under these plans: restricted stock awards, restricted stock units, stock appreciation rights and stock options. The following table sets forth the number of awards outstanding for each award type as of:
|
|
Outstanding at December 31,
|
|||
|
Award type
|
2017
|
|
2016
|
|
|
Restricted stock awards
|
1,257,574
|
|
1,178,592
|
|
|
Restricted stock units
|
493,248
|
|
465,395
|
|
|
Stock appreciation rights
|
212,506
|
|
469,075
|
|
|
Stock options
|
2,050
|
|
3,502
|
|
The majority of the stock-based awards granted under these plans have a
10
-year contractual term. Stock appreciation rights (“SARs”) have contractual lives of
7
years. Awards granted to our executive officers and certain members of management are subject to accelerated vesting upon a change in control as defined in the employees’ retention agreement.
Expense recognition
We recognize compensation expense associated with stock options and awards with performance or market based vesting conditions on an accelerated basis over the requisite service period of the individual grantees, which generally equals the vesting period. We recognize compensation expense associated with restricted stock awards and SARs on a straight-line basis over the requisite service period of the individual grantees, which generally equals the vesting period. We recognize the effect of awards for which the requisite service period is not rendered when the award is forfeited (that is, we recognize the effect of forfeitures in compensation cost when they occur). Previously recognized compensation cost for an award is reversed in the period that the award is forfeited.
Stock-based compensation expense is allocated to cost of revenue and operating expenses on the consolidated statements of comprehensive income based on where the associated employee’s compensation is recorded. The following table summarizes stock-based compensation expense:
|
|
Years ended December 31,
|
||||||||
|
(in thousands)
|
2017
|
|
2016
|
|
2015
|
|
|||
|
Included in cost of revenue:
|
|||||||||
|
Cost of subscriptions
|
$
|
1,254
|
|
$
|
1,168
|
|
$
|
1,130
|
|
|
Cost of maintenance
|
373
|
|
508
|
|
420
|
|
|||
|
Cost of services and other
|
1,843
|
|
1,621
|
|
1,944
|
|
|||
|
Total included in cost of revenue
|
3,470
|
|
3,297
|
|
3,494
|
|
|||
|
Included in operating expenses:
|
|||||||||
|
Sales, marketing and customer success
|
6,381
|
|
3,844
|
|
2,979
|
|
|||
|
Research and development
|
7,765
|
|
6,467
|
|
4,865
|
|
|||
|
General and administrative
|
23,015
|
|
19,030
|
|
13,908
|
|
|||
|
Total included in operating expenses
|
37,161
|
|
29,341
|
|
21,752
|
|
|||
|
Total stock-based compensation expense
|
$
|
40,631
|
|
$
|
32,638
|
|
$
|
25,246
|
|
The total amount of compensation cost related to unvested awards not recognized was
$65.3 million
at
December 31, 2017
. It is expected that this amount will be recognized over a weighted average period of
1.7 years
.
|
2017 Form 10-K
|
|
93
|
Restricted stock awards
We have granted shares of common stock subject to certain restrictions under the 2016 Equity Plan and the 2008 Equity Plan. Restricted stock awards granted to employees vest in equal annual installments generally over
four
years from the grant date subject to the recipient’s continued employment with us. Restricted stock awards granted to non-employee directors vest after one year from the date of grant or, if earlier, immediately prior to the next annual election of directors, provided the non-employee director is serving as a director at that time. The fair market value of the stock at the time of the grant is amortized on a straight-line basis to expense over the period of vesting. Recipients of restricted stock awards have the right to vote such shares and receive dividends.
The following table summarizes our unvested restricted stock awards as of
December 31, 2017
, and changes during the year then ended:
|
Restricted stock awards
|
Restricted
stock awards
|
|
Weighted
average
grant-date
fair value
|
|
Weighted
average
remaining
contractual
term
(in years)
|
Aggregate
intrinsic value
(1)
(in thousands)
|
|
|||
|
Unvested at January 1, 2017
|
1,178,592
|
|
$
|
49.49
|
|
|||||
|
Granted
|
570,208
|
|
74.08
|
|
||||||
|
Vested
|
(410,087
|
)
|
47.28
|
|
||||||
|
Forfeited
|
(81,139
|
)
|
55.35
|
|
||||||
|
Unvested at December 31, 2017
|
1,257,574
|
|
61.00
|
|
8.2
|
$
|
118,828
|
|
||
|
(1)
|
The intrinsic value is calculated as the market value as of the end of the fiscal period.
|
The total fair value of restricted stock awards that vested during the years ended
December 31, 2017
,
2016
and
2015
was
$19.4 million
,
$14.5 million
and
$10.6 million
, respectively. The weighted average grant-date fair value of restricted stock awards granted during the years ended
December 31, 2016
and
2015
was
$53.59
and
$48.82
, respectively.
Restricted stock units
We have also granted restricted stock units subject to certain restrictions under the 2016 Equity Plan and the 2008 Equity Plan. Restricted stock units granted to employees vest in equal annual installments generally over
three
years from the grant date subject to the recipient’s continued employment with us. We have also granted restricted stock units for which vesting is subject to meeting certain performance and/or market conditions. Restricted stock units granted with a market condition had a fair market value assigned at the grant date based on the use of a Monte Carlo simulation model. The fair market value of the stock at the time of the grant is amortized to expense on a straight-line basis over the period of vesting except for awards with market or performance conditions, which are amortized on an accelerated basis over the period of vesting.
The following table summarizes our unvested restricted stock units as of
December 31, 2017
, and changes during the year then ended:
|
Restricted stock units
|
Restricted
stock units
|
|
Weighted
average
grant-date
fair value
|
|
Weighted
average
remaining
contractual
term
(in years)
|
Aggregate
intrinsic value
(1)
(in thousands)
|
|
|||
|
Unvested at January 1, 2017
|
465,395
|
|
$
|
47.51
|
|
|||||
|
Granted
|
247,471
|
|
72.19
|
|
||||||
|
Forfeited
|
(8,157
|
)
|
51.75
|
|
||||||
|
Vested
|
(211,461
|
)
|
44.65
|
|
||||||
|
Unvested at December 31, 2017
|
493,248
|
|
61.05
|
|
8.3
|
$
|
46,607
|
|
||
|
(1)
|
The intrinsic value is calculated as the market value as of the end of the fiscal period.
|
|
94
|
|
2017 Form 10-K
|
The total fair value of restricted stock units that vested during the years ended
December 31, 2017
,
2016
and
2015
was
$9.4 million
,
$6.7 million
, and
$3.9 million
, respectively. The weighted average grant date fair value of restricted stock units granted for the years ended
December 31, 2016
and
2015
was
$51.98
and
$45.15
, respectively.
Stock appreciation rights
We have granted SARs under the 2008 Equity Plan to certain members of management. The SARs will be settled in stock at the time of exercise and vest in equal annual installments generally over
four
years from the date of grant subject to the recipient’s continued employment with us. The number of shares issued upon the exercise of the SARs is calculated as the difference between the share price of our stock on the date of exercise and the date of grant multiplied by the number of SARs divided by the share price on the exercise date.
The following table summarizes our outstanding SARs as of
December 31, 2017
, and changes during the year then ended:
|
Stock appreciation rights
|
Stock
appreciation
rights
|
|
Weighted
average
exercise
price
|
|
Weighted
average
remaining
contractual
term
(in years)
|
Aggregate
intrinsic value
(1)
(in thousands)
|
|
|||
|
Outstanding at January 1, 2017
|
469,075
|
|
$
|
23.63
|
|
|||||
|
Exercised
|
(256,569
|
)
|
24.14
|
|
||||||
|
Outstanding at December 31, 2017
|
212,506
|
|
23.01
|
|
1.8
|
$
|
15,191
|
|
||
|
Vested and exercisable at December 31, 2017
|
212,506
|
|
23.01
|
|
1.8
|
15,191
|
|
|||
|
(1)
|
The intrinsic value is calculated as the difference between the market value as of the end of the fiscal period and the exercise price of the shares.
|
There have been no new SARs granted since 2013. The total intrinsic value of SARs exercised during the years ended
December 31, 2017
,
2016
and
2015
was
$14.2 million
,
$10.7 million
, and
$5.2 million
, respectively. The total fair value of SARs that vested during the year ended
December 31, 2017
was insignificant. The total fair value of SARs that vested during the years ended
December 31, 2016
and
2015
was
$1.0 million
, and
$1.9 million
, respectively. SARs granted with a market condition had a fair market value assigned at the grant date based on the use of a Monte Carlo simulation model. All other SARs granted had a fair market value assigned at the grant date based on the use of the Black-Scholes option pricing model.
Stock options
The following table summarizes our outstanding stock options as of
December 31, 2017
, and changes during the year then ended:
|
Stock options
|
Stock
options
|
|
Weighted
average
exercise
price
|
|
Weighted
average
remaining
contractual
term
(in years)
|
Aggregate
intrinsic value
(1)
(in thousands)
|
|
|||
|
Outstanding at January 1, 2017
|
3,502
|
|
$
|
11.25
|
|
|||||
|
Exercised
|
(1,400
|
)
|
10.99
|
|
||||||
|
Expired
|
(52
|
)
|
10.59
|
|
||||||
|
Outstanding at December 31, 2017
|
2,050
|
|
11.44
|
|
0.9
|
$
|
170
|
|
||
|
Vested and exercisable at December 31, 2017
|
2,050
|
|
11.44
|
|
0.9
|
170
|
|
|||
|
(1)
|
The intrinsic value is calculated as the difference between the market value as of the end of the fiscal period and the exercise price of the shares.
|
There have been no new stock option awards granted since 2005. The total intrinsic value of stock options exercised during the years ended
December 31, 2017
,
2016
and
2015
was insignificant. The total fair value of stock options that vested during the years ended
December 31, 2017
,
2016
and
2015
was insignificant. All outstanding stock options granted had a fair market value assigned at the grant date based on the use of the Black-Scholes option pricing model.
|
2017 Form 10-K
|
|
95
|
|
14. Stockholders' Equity
|
Preferred stock
Our Board of Directors may fix the relative rights and preferences of each series of preferred stock in a resolution of the Board of Directors.
Dividends
Our Board of Directors has adopted a dividend policy, which provides for the distribution to stockholders a portion of cash generated by us that is in excess of operational needs and capital expenditures. The
2017 Credit Facility
limits the amount of dividends payable and certain state laws restrict the amount of dividends distributed.
The following table provides information with respect to quarterly dividends paid on common stock during the year ended
December 31, 2017
.
|
Declaration Date
|
Dividend
per Share
|
|
Record Date
|
Payable Date
|
||
|
February 8, 2017
|
$
|
0.12
|
|
February 28
|
March 15
|
|
|
May 1, 2017
|
0.12
|
|
May 26
|
June 15
|
||
|
July 31, 2017
|
0.12
|
|
August 28
|
September 15
|
||
|
October 25, 2017
|
0.12
|
|
November 28
|
December 15
|
||
On
February 6, 2018
, our Board of Directors declared a
first
quarter dividend of
$0.12
per share payable on
March 15, 2018
to stockholders of record on
February 28, 2018
.
Stock repurchase program
In
August 2010
, our Board of Directors approved a stock repurchase program that authorized us to purchase up to
$50.0 million
of our outstanding shares of common stock. The program does not have an expiration date. The shares can be purchased from time to time on the open market or in privately negotiated transactions depending upon market conditions and other factors. Under the
2017 Credit Facility
, we also have restrictions on our ability to repurchase shares of our common stock.
We account for purchases of treasury stock under the cost method. The remaining amount available to purchase stock under the stock repurchase program was
$50.0 million
as of
December 31, 2017
.
|
96
|
|
2017 Form 10-K
|
Changes in accumulated other comprehensive loss by component
The changes in accumulated other comprehensive loss by component, consisted of the following:
|
Years ended December 31,
|
|||||||||
|
(in thousands)
|
2017
|
|
2016
|
|
2015
|
|
|||
|
Accumulated other comprehensive loss, beginning of period
|
$
|
(457
|
)
|
$
|
(825
|
)
|
$
|
(1,032
|
)
|
|
By component:
|
|||||||||
|
Gains and losses on cash flow hedges:
|
|||||||||
|
Accumulated other comprehensive (loss) income balance, beginning of period
|
$
|
25
|
|
$
|
(19
|
)
|
$
|
(164
|
)
|
|
Other comprehensive income (loss) before reclassifications, net of tax effects of $(374), $406 and $514
|
574
|
|
(626
|
)
|
(818
|
)
|
|||
|
Amounts reclassified from accumulated other comprehensive loss to interest expense
|
293
|
|
1,106
|
|
1,569
|
|
|||
|
Amounts reclassified from accumulated other comprehensive loss to loss on debt extinguishment and termination of derivative instruments
|
—
|
|
—
|
|
—
|
|
|||
|
Tax benefit included in provision for income taxes
|
(116
|
)
|
(436
|
)
|
(606
|
)
|
|||
|
Total amounts reclassified from accumulated other comprehensive loss
|
177
|
|
670
|
|
963
|
|
|||
|
Net current-period other comprehensive income
|
751
|
|
44
|
|
145
|
|
|||
|
Accumulated other comprehensive income balance, end of period
|
$
|
776
|
|
$
|
25
|
|
$
|
(19
|
)
|
|
Foreign currency translation adjustment:
|
|||||||||
|
Accumulated other comprehensive loss balance, beginning of period
|
$
|
(482
|
)
|
$
|
(806
|
)
|
$
|
(868
|
)
|
|
Translation adjustments
|
(943
|
)
|
324
|
|
62
|
|
|||
|
Accumulated other comprehensive loss balance, end of period
|
(1,425
|
)
|
(482
|
)
|
(806
|
)
|
|||
|
Accumulated other comprehensive loss, end of period
|
$
|
(649
|
)
|
$
|
(457
|
)
|
$
|
(825
|
)
|
|
15. Defined Contribution Plan
|
We have a defined contribution plan 401(k) (the "401K Plan") covering substantially all employees. Employees were able to contribute between
1%
and
75%
of their salaries in
2017
and
2016
and between
1%
and
30%
of their salaries in
2015
. We match
50%
of qualified employees’ contributions up to
6%
of their salary. The 401K Plan also provides for additional employer contributions to be made at our discretion. Total matching contributions to the 401K Plan for the years ended
December 31, 2017
,
2016
and
2015
were
$7.1 million
,
$7.6 million
and
$5.3 million
, respectively. There were no discretionary contributions by us to the 401K Plan in
2017
,
2016
and
2015
.
|
2017 Form 10-K
|
|
97
|
|
16. Segment Information
|
As discussed in
Note 2
of these consolidated financial statements, our chief operating decision maker is CEO. Our chief operating decision maker uses consolidated financial information to make operating decisions, assess financial performance and allocate resources. We have one operating segment and one reportable segment.
The following table presents long-lived assets by geographic region based on the location of the assets.
|
(dollars in thousands)
|
United
States
|
|
Other
Countries
|
|
Total
|
|
|||
|
Property and equipment:
|
|||||||||
|
December 31, 2017
|
$
|
39,071
|
|
$
|
3,172
|
|
$
|
42,243
|
|
|
December 31, 2016
|
47,663
|
|
2,606
|
|
50,269
|
|
|||
|
17. Disaggregation of Revenue
|
We generate a portion of our revenue from operations outside of the United States. The following table presents revenue by geographic region based on country of invoice origin.
|
(dollars in thousands)
|
United
States
|
|
Other
Countries
|
|
Total
|
|
|||
|
Revenue by geography:
|
|||||||||
|
2017
|
$
|
706,798
|
|
$
|
81,508
|
|
$
|
788,306
|
|
|
2016
|
660,339
|
|
70,476
|
|
730,815
|
|
|||
|
2015
|
570,519
|
|
67,421
|
|
637,940
|
|
|||
The General Markets Group ("GMG"), the Enterprise Markets Group ("EMG"), and the International Markets Group ("IMG") comprise our go-to-market organizations. The following is a description of each market group:
|
•
|
The GMG focuses on sales to all K-12 private schools, faith-based and arts and cultural organizations, as well as emerging and mid-sized prospects in North America;
|
|
•
|
The EMG focuses on sales to all healthcare and higher education institutions, corporations and foundations, as well as large and/or strategic prospects in North America; and
|
|
•
|
The IMG focuses on sales to all prospects and customers outside of North America.
|
The following table presents our revenue by market group:
|
(dollars in thousands)
|
GMG
|
|
EMG
|
|
IMG
|
|
Other
|
|
Total
|
|
|||||
|
Revenue by market group:
|
|||||||||||||||
|
2017
|
$
|
406,954
|
|
$
|
330,930
|
|
$
|
48,429
|
|
$
|
1,993
|
|
$
|
788,306
|
|
|
2016
|
383,319
|
|
302,968
|
|
42,539
|
|
1,989
|
|
730,815
|
|
|||||
|
2015
|
313,935
|
|
279,897
|
|
41,997
|
|
2,111
|
|
637,940
|
|
|||||
|
98
|
|
2017 Form 10-K
|
|
18. Quarterly Results (Unaudited)
|
|
(dollars in thousands, except per share data)
|
December 31,
2017 |
|
September 30,
2017 |
|
June 30,
2017 |
|
March 31,
2017 |
|
||||
|
Total revenue
|
$
|
216,977
|
|
$
|
195,513
|
|
$
|
192,195
|
|
$
|
183,621
|
|
|
Gross profit
|
114,555
|
|
108,508
|
|
105,200
|
|
98,139
|
|
||||
|
Income from operations
|
18,739
|
|
17,965
|
|
16,748
|
|
10,579
|
|
||||
|
Income before provision for income taxes
|
16,006
|
|
15,341
|
|
14,359
|
|
8,488
|
|
||||
|
Net income
|
30,709
|
|
12,548
|
|
11,165
|
|
11,511
|
|
||||
|
Earnings per share
|
||||||||||||
|
Basic
|
$
|
0.66
|
|
$
|
0.27
|
|
$
|
0.24
|
|
$
|
0.25
|
|
|
Diluted
|
0.64
|
|
0.26
|
|
0.23
|
|
0.24
|
|
||||
|
|
||||||||||||
|
(dollars in thousands, except per share data)
|
December 31,
2016 |
|
September 30,
2016 |
|
June 30,
2016 |
|
March 31,
2016 |
|
||||
|
Total revenue
|
$
|
198,305
|
|
$
|
183,063
|
|
$
|
180,191
|
|
$
|
169,256
|
|
|
Gross profit
|
105,903
|
|
99,746
|
|
96,579
|
|
89,367
|
|
||||
|
Income from operations
|
24,024
|
|
13,540
|
|
13,624
|
|
10,612
|
|
||||
|
Income before provision for income taxes
|
21,372
|
|
10,884
|
|
10,838
|
|
7,832
|
|
||||
|
Net income
|
17,284
|
|
8,934
|
|
9,060
|
|
6,237
|
|
||||
|
Earnings per share
|
||||||||||||
|
Basic
|
$
|
0.37
|
|
$
|
0.19
|
|
$
|
0.20
|
|
$
|
0.14
|
|
|
Diluted
|
0.36
|
|
0.19
|
|
0.19
|
|
0.13
|
|
||||
Note: The individual amounts for each quarter may not sum to full year totals due to rounding.
The results of operations of acquired companies are included in the consolidated results of operations from the date of their respective acquisition. See
Note 3
of these consolidated financial statements for details related to our business acquisitions.
|
19. Disposition of Business
|
On May 18, 2015, we completed the sale of RLC Customer Technology B.V. ("RLC"), a formerly wholly-owned entity based in the Netherlands, to a private software company by selling all of the issued and outstanding stock of RLC in exchange for
$0.4 million
in gross cash proceeds. We incurred an insignificant amount of legal costs associated with the disposition of this business. As part of the disposition, we derecognized
$1.4 million
of goodwill related to RLC. As a result of this disposition, we also recognized an insignificant foreign currency translation loss in our consolidated statement of comprehensive income. Overall, this transaction, including costs associated with the disposition and the recognition of an insignificant foreign currency translation gain, resulted in a
$2.0 million
loss, which was recorded in other income (expense), net in our consolidated statement of comprehensive income for the year ended December 31, 2015. The disposition of RLC did not qualify for reporting as a discontinued operation since the transaction did not represent a strategic shift in our operations.
|
2017 Form 10-K
|
|
99
|
|
20. Restructuring
|
During 2017, in an effort to improve operating efficiency and further our organizational objectives, we initiated a plan to relocate some of our existing offices to highly modern and more collaborative workspaces with short-term financial commitments. These workspaces are also more centrally located for our employees and closer to our customers. We are currently evaluating the total before-tax restructuring costs we expect to incur as a result of this plan through 2019. Restructuring costs expected to be incurred consist primarily of costs to terminate existing lease agreements. For the year ended
December 31, 2017
, we incurred restructuring costs of
$0.8 million
related to the termination of our lease for office space in Emeryville, CA.
The following table summarizes our restructuring costs as of
December 31, 2017
:
|
Total costs incurred
during the year
ended
|
|
Included in accrued
expenses and
other liabilities at
|
|
||||
|
(in thousands)
|
December 31, 2017
|
|
December 31, 2017
|
|
|||
|
By component:
|
|||||||
|
Contract termination costs
|
$
|
794
|
|
$
|
585
|
|
|
|
Total
|
$
|
794
|
|
$
|
585
|
|
|
|
2017 Form 10-K
|
|
100
|
None.
|
Evaluation of Disclosure Controls and Procedures
|
Disclosure controls and procedures (as defined in Exchange Act Rule 13a-15(e) and 15d-15(e)) are designed only to provide reasonable assurance that they will meet their objectives. As of the end of the period covered by this report, we carried out an evaluation, under the supervision and with the participation of our management, including our Chief Executive Officer (principal executive officer) and Chief Financial Officer (principal financial and accounting officer), of the effectiveness of our disclosure controls and procedures (as defined in Rule 13a-15(e) and 15d-15(e)) pursuant to Exchange Act Rule 13a-15(b). Based upon that evaluation, our Chief Executive Officer and Chief Financial Officer have concluded that our disclosure controls and procedures are effective to provide the reasonable assurance discussed above.
|
Changes in Internal Control Over Financial Reporting
|
No change in internal control over financial reporting occurred during the fiscal quarter ended
December 31, 2017
with respect to our operations that has materially affected, or is reasonably likely to materially affect, our internal control over financial reporting.
Although we do not believe it materially affected, or is reasonably likely to materially affect, our internal control over financial reporting, we note that we acquired JustGiving in the fourth quarter of 2017.
|
Management’s Report on Internal Control Over Financial Reporting
|
Our management is responsible for establishing and maintaining adequate internal control over financial reporting (as defined in Rules 13a-15(f) and 15d-15(f) under the Exchange Act). Internal control over financial reporting is a process designed to provide reasonable assurance regarding the reliability of financial reporting and the preparation of financial statements for external purposes in accordance with U.S. GAAP. Our internal control over financial reporting includes those policies and procedures that: (i) pertain to the maintenance of records that, in reasonable detail, accurately and fairly reflect the transactions and dispositions of our assets; (ii) provide reasonable assurance that transactions are recorded as necessary to permit preparation of financial statements in accordance with U.S. GAAP, and that our receipts and expenditures are being made only in accordance with authorizations of our management and directors; and (iii) provide reasonable assurance regarding prevention or timely detection of unauthorized acquisition, use, or disposition of our assets that could have a material effect on the financial statements.
Our management conducted an evaluation of the effectiveness of our internal control over financial reporting as of
December 31, 2017
, based on the framework in Internal Control - Integrated Framework issued by the Committee of Sponsoring Organizations of the Treadway Commission (2013 framework). Based on this evaluation under the Internal Control - Integrated Framework, management concluded that our internal control over financial reporting was effective as of
December 31, 2017
.
|
2017 Form 10-K
|
|
101
|
|
Attestation Report of Registered Public Accounting Firm
|
The effectiveness of our internal control over financial reporting as of
December 31, 2017
, has been audited by our independent registered public accounting firm, as stated in their attestation report, which is included in Item 8 of this Annual Report on Form 10-K.
None.
|
102
|
|
2017 Form 10-K
|
|
|
|
|
The information required by Item 10 with respect to Directors and Executive Officers is incorporated by reference from the information under the captions “Election of Directors,” “Information Regarding Meetings of the Board and Committees,” “Section 16(a) Beneficial Ownership Reporting Compliance,” and “Code of Business Conduct and Ethics and Code of Ethics,” contained in Blackbaud’s Proxy Statement for the
2018
Annual Meeting of Stockholders expected to be held on
June 12, 2018
, except for the identification of executive officers of the Registrant which is set forth in Part I of this report.
The information required by Item 11 is incorporated by reference from the information under the captions "Director Compensation," “Executive Compensation,” “Compensation Discussion and Analysis,” “Summary Compensation Table” and "CEO Pay Ratio" contained in Blackbaud’s Proxy Statement for the
2018
Annual Meeting of Stockholders expected to be held on
June 12, 2018
.
The information required by Item 12 is incorporated by reference from information under the captions “Stock Ownership” and “Equity Compensation Plan Information” contained in Blackbaud’s Proxy Statement for the
2018
Annual Meeting of Stockholders expected to be held on
June 12, 2018
.
The information required by Item 13 is incorporated by reference from the information under the captions “Transactions with Related Persons,” and “Independence of Directors” contained in Blackbaud’s Proxy Statement for the
2018
Annual Meeting of Stockholders expected to be held on
June 12, 2018
.
The information required by Item 14 is incorporated by reference from the information under the caption “Audit Committee Report,” contained in Blackbaud’s Proxy Statement for the
2018
Annual Meeting of Stockholders expected to be held on
June 12, 2018
.
|
2017 Form 10-K
|
|
103
|
|
|
|
|
(a) The following documents are included as part of the Annual Report on Form 10-K:
|
1.
|
Financial statements
|
See the "Index to consolidated financial statements" in Part II Item 8 of this report
.
|
2.
|
Financial statement schedules
|
Schedules not listed above have been omitted because the information required to be set forth therein is not applicable or is shown in the financial statements thereto.
|
3.
|
Exhibits
|
The exhibits listed below are filed or incorporated by reference as part of this report:
|
|
|
Filed In
|
|||||||||
|
Exhibit
Number
|
Description of Document
|
Registrant’s
Form
|
Dated
|
Exhibit
Number
|
|
Filed
Herewith
|
|||||
|
S-1/A
|
4/6/2004
|
2.1
|
|
||||||||
|
8-K
|
1/18/2007
|
2.2
|
|
||||||||
|
8-K
|
5/30/2008
|
2.3
|
|
||||||||
|
10-Q
|
8/7/2009
|
10.42
|
|
||||||||
|
*
|
10-Q
|
5/10/2011
|
2.3
|
|
|||||||
|
8-K
|
1/17/2012
|
2.4
|
|
||||||||
|
10-K
|
2/29/2012
|
2.7
|
|
||||||||
|
8-K
|
10/2/2014
|
10.76
|
|
||||||||
|
104
|
|
2017 Form 10-K
|
|
|
|
|
Filed In
|
||||||||
|
Exhibit
Number
|
|
Description of Document
|
Registrant’s
Form
|
Dated
|
Exhibit
Number
|
|
Filed
Herewith
|
||||
|
8-K
|
10/8/2015
|
10.78
|
|
||||||||
|
8-K
|
10/8/2015
|
10.79
|
|
||||||||
|
DEF 14A
|
4/30/2009
|
||||||||||
|
|
8-K
|
3/22/2011
|
3.4
|
|
|||||||
|
†
|
S-1/A
|
4/6/2004
|
10.6
|
|
|||||||
|
†
|
S-1/A
|
4/6/2004
|
10.8
|
|
|||||||
|
†
|
8-K
|
6/20/2006
|
10.20
|
|
|||||||
|
†
|
10-K
|
2/28/2007
|
10.26
|
|
|||||||
|
†
|
10-K
|
2/28/2007
|
10.27
|
|
|||||||
|
†
|
DEF 14A
|
4/29/2008
|
Appendix A
|
|
|||||||
|
†
|
S-8
|
8/4/2008
|
10.34
|
|
|||||||
|
†
|
S-8
|
8/4/2008
|
10.35
|
|
|||||||
|
†
|
S-8
|
8/4/2008
|
10.36
|
|
|||||||
|
†**
|
10-K/A
|
3/26/2008
|
10.2
|
|
|||||||
|
†**
|
10-K/A
|
3/26/2008
|
10.3
|
|
|||||||
|
†
|
10-Q
|
11/10/2008
|
10.37
|
|
|||||||
|
8-K
|
12/11/2008
|
10.37
|
|
||||||||
|
†
|
S-8
|
7/2/2009
|
10.41
|
|
|||||||
|
†
|
10-Q
|
11/8/2011
|
10.49
|
|
|||||||
|
†
|
10-Q
|
11/8/2011
|
10.50
|
|
|||||||
|
2017 Form 10-K
|
|
105
|
|
|
|
|
Filed In
|
||||||||
|
Exhibit
Number
|
|
Description of Document
|
Registrant’s
Form
|
Dated
|
Exhibit
Number
|
|
Filed
Herewith
|
||||
|
†
|
10-K
|
2/29/2012
|
10.55
|
|
|||||||
|
†***
|
S-1/A
|
3/19/2010
|
10.1
|
|
|||||||
|
†***
|
8-K
|
2/28/2011
|
10.1
|
|
|||||||
|
†***
|
8-K
|
2/28/2011
|
10.2
|
|
|||||||
|
†***
|
S-1
|
1/22/2010
|
10.2
|
|
|||||||
|
†
|
8-K
|
6/26/2012
|
10.59
|
|
|||||||
|
†
|
8-K
|
6/26/2012
|
10.60
|
|
|||||||
|
†
|
10-K
|
2/27/2013
|
10.65
|
|
|||||||
|
8-K
|
3/28/2013
|
10.66
|
|
||||||||
|
†
|
8-K
|
10/25/2013
|
10.70
|
|
|||||||
|
†
|
10-K
|
2/26/2014
|
10.71
|
|
|||||||
|
†
|
10-K
|
2/26/2014
|
10.72
|
|
|||||||
|
†
|
10-K
|
2/24/2016
|
10.81
|
|
|||||||
|
†
|
10-Q
|
5/4/2016
|
10.82
|
|
|||||||
|
†
|
10-Q
|
5/4/2016
|
10.83
|
|
|||||||
|
10-Q
|
8/4/2016
|
10.84
|
|
||||||||
|
†
|
DEF 14A
|
4/26/2016
|
Appendix C
|
|
|||||||
|
†
|
10-Q
|
11/10/2008
|
10.37
|
|
|||||||
|
10-Q
|
11/4/2016
|
10.87
|
|
||||||||
|
106
|
|
2017 Form 10-K
|
|
|
|
|
Filed In
|
|||||||
|
Exhibit
Number
|
|
Description of Document
|
Registrant’s
Form
|
Dated
|
Exhibit
Number
|
Filed
Herewith
|
||||
|
†
|
10-K
|
2/27/2013
|
10.65
|
|||||||
|
†
|
10-Q
|
11/10/2008
|
10.37
|
|||||||
|
8-K
|
6/5/2017
|
10.90
|
||||||||
|
8-K
|
6/5/2017
|
10.91
|
||||||||
|
10-Q
|
8/4/2017
|
10.92
|
||||||||
|
10-K
|
2/20/2018
|
10.93
|
X
|
|||||||
|
10-K
|
2/20/2018
|
10.94
|
X
|
|||||||
|
X
|
||||||||||
|
X
|
||||||||||
|
|
X
|
|||||||||
|
|
X
|
|||||||||
|
|
X
|
|||||||||
|
|
X
|
|||||||||
|
2017 Form 10-K
|
|
107
|
|
|
|
Filed In
|
||||||||
|
Exhibit
Number
|
Description of Document
|
Registrant’s
Form
|
Dated
|
Exhibit
Number
|
Filed
Herewith
|
|||||
|
101.INS
|
****
|
XBRL Instance Document
|
X
|
|||||||
|
101.SCH
|
****
|
XBRL Taxonomy Extension Schema Document
|
X
|
|||||||
|
101.CAL
|
****
|
XBRL Taxonomy Extension Calculation Linkbase Document
|
X
|
|||||||
|
101.DEF
|
****
|
XBRL Taxonomy Extension Definition Linkbase Document
|
X
|
|||||||
|
101.LAB
|
****
|
XBRL Taxonomy Extension Label Linkbase Document
|
X
|
|||||||
|
101.PRE
|
****
|
XBRL Taxonomy Extension Presentation Linkbase Document
|
X
|
|||||||
|
*
|
The registrant has applied for an extension of the confidential treatment it was previously granted with respect to portions of this exhibit. Those portions have been omitted from the exhibit and filed separately with the U.S. Securities and Exchange Commission.
|
|
**
|
The Kintera, Inc. 2000 Stock Option Plan, as amended, and form of Stock Option Agreement thereunder (“Kintera 2000 Plan Documents”) and the Kintera, Inc. Amended and Restated 2003 Equity Incentive Plan, as amended, and form of Stock Option Agreement thereunder (“Kintera 2003 Plan Documents”) were filed by Kintera in its Form 10-K/A on March 26, 2008 as Exhibits 10.2 and 10.3, respectively. We assumed the Kintera 2000 Plan Documents and Kintera 2003 Plan Documents when we acquired Kintera in July 2008. We filed the Kintera 2000 Plan Documents and Kintera 2003 Plan Documents by incorporation by reference as exhibits 10.37 and 10.38, respectively, in our Form S-8 on August 4, 2008.
|
|
***
|
The Convio, Inc. 2009 Amended and Restated Stock Incentive Plan, as amended, and forms of stock option agreements thereunder (“Convio 2009 Original Plan Documents”) and the Convio, Inc. 1999 Stock Option/Stock Issuance Plan, as amended, and forms of stock option agreements thereunder (“Convio 1999 Plan Documents”) were filed by Convio in its Forms S-1/A and S-1, filed March 19, 2010 and January 25, 2010 as exhibits 10.1 and 10.2, respectively. The Convio, Inc. Form of Nonstatutory Stock Option Notice (Double Trigger) and Convio, Inc. Form of Restricted Stock Unit Notice (Double Trigger) and Agreement were filed by Convio in its Form 8-K on February 28, 2011 as exhibits 10.1 and 10.2 (together with the Convio 2009 Original Plan Documents, the “Convio 2009 Plan Documents”). We assumed the Convio 2009 Plan Documents and Convio 1999 Plan Documents when we acquired Convio in May 2012. We filed the Convio 2009 Plan Documents and Convio 1999 Plan Documents by incorporation by reference as exhibits 10.59, 10.60, 10.61 and 10.62 in our Form S-8 on May 7, 2012.
|
|
****
|
Pursuant to Rule 406T of Regulation S-T, the XBRL related information in Exhibit 101 to this Annual Report on Form 10-K shall not be deemed “filed” for purposes of Section 18 of the Securities Exchange Act of 1934 or otherwise subject to liability of that Section, and shall not be part of any registration statement or other document filed under the Securities Act of the Exchange Act, except as shall be expressly set forth by specific reference in such filing.
|
|
†
|
Indicates management contract or compensatory plan, contract or arrangement.
|
Not applicable.
|
108
|
|
2017 Form 10-K
|
|
|
SIGNATURES
|
|
Pursuant to the requirements of Section 13 or 15(d) of the Securities Exchange Act of 1934, the Registrant has duly caused this Form 10-K to be signed on its behalf by the undersigned, thereunto duly authorized.
|
|
Blackbaud, Inc.
|
|
|
Signed:
|
February 20, 2018
|
/S/ MICHAEL P. GIANONI
|
|
|
President and Chief Executive Officer
|
|
|
(Principal Executive Officer)
|
||
Pursuant to the requirements of the Securities Exchange Act of 1934, this Form 10-K has been signed below by the following persons on behalf of the Registrant and on the dates indicated.
|
/S/ MICHAEL P. GIANONI
|
|
President, Chief Executive Officer and Director (Principal Executive Officer)
|
|
Date:
|
February 20, 2018
|
|
|
Michael P. Gianoni
|
||||||
|
/S/ ANTHONY W. BOOR
|
|
Executive Vice President and Chief Financial Officer (Principal Financial and Accounting Officer)
|
|
Date:
|
February 20, 2018
|
|
|
Anthony W. Boor
|
||||||
|
/S/ ANDREW M. LEITCH
|
|
Chairman of the Board of Directors
|
|
Date:
|
February 20, 2018
|
|
|
Andrew M. Leitch
|
||||||
|
/S/ TIMOTHY CHOU
|
|
Director
|
|
Date:
|
February 20, 2018
|
|
|
Timothy Chou
|
||||||
|
/S/ GEORGE H. ELLIS
|
|
Director
|
|
Date:
|
February 20, 2018
|
|
|
George H. Ellis
|
||||||
|
/S/ THOMAS R. ERTEL
|
|
Director
|
|
Date:
|
February 20, 2018
|
|
|
Thomas R. Ertel
|
||||||
|
/S/ SARAH E. NASH
|
|
Director
|
|
Date:
|
February 20, 2018
|
|
|
Sarah E. Nash
|
||||||
|
/S/ JOYCE M. NELSON
|
|
Director
|
|
Date:
|
February 20, 2018
|
|
|
Joyce M. Nelson
|
||||||
|
/S/ PETER J. KIGHT
|
|
Director
|
|
Date:
|
February 20, 2018
|
|
|
Peter J. Kight
|
||||||
|
2017 Form 10-K
|
|
109
|
TABLE OF CONTENTS
Part IItem 1. BusinessItem 1A. Risk FactorsItem 1B. Unresolved Staff CommentsItem 2. PropertiesItem 3. Legal ProceedingsItem 4. Mine Safety DisclosuresPart IIItem 5. Market For Registrant's Common Equity, Related Stockholder Matters and Issuer Purchases Of Equity SecuritiesPart OfItem 6. Selected Financial DataItem 7. Management's Discussion and Analysis Of Financial Condition and Results Of OperationsItem 7A. Quantitative and Qualitative Disclosures About Market RiskItem 8. Financial Statements and Supplementary DataItem 9. Changes in and Disagreements with Accountants on Accounting and Financial DisclosureItem 9A. Controls and ProceduresItem 9B. Other InformationPart IIIItem 10. Directors, Executive Officers and Corporate GovernanceItem 11. Executive CompensationItem 12. Security Ownership Of Certain Beneficial Owners and Management and Related Stockholder MattersItem 13. Certain Relationships and Related Transactions, and Director IndependenceItem 14. Principal Accountant Fees and ServicesPart IVItem 15. Exhibits and Financial Statement SchedulesItem 16. Form 10-k Summary