BLACKBAUD INC
10-Ks and 10-Qs
|
|
|
|
|
|
|
|
|
|
|
|
|
|
|
|
|
|
|
|
|
|
|
|
|
|
|
|
|
|
|
|
|
|
|
|
|
|
|
|
|
|
|
|
|
|
|
|
|
|
|
|
|
|
|
|
UNITED STATES
SECURITIES AND EXCHANGE COMMISSION
Washington, D.C. 20549
FORM
10-Q
|
|
QUARTERLY REPORT PURSUANT TO SECTION 13 OR 15(d) OF THE SECURITIES EXCHANGE ACT OF 1934 | ||||
|
For the quarterly period ended
|
|||||
or
|
|
TRANSITION REPORT PURSUANT TO SECTION 13 OR 15(d) OF THE SECURITIES EXCHANGE ACT OF 1934 | ||||
|
For the transition period from
to
.
|
|||||
Commission file number:
000-50600

|
||||||||
(Exact name of registrant as specified in its charter)
|
|
|
||||
| (State or other jurisdiction of incorporation or organization) | (I.R.S. Employer Identification No.) | ||||
(Address of principal executive offices, including zip code)
(
843
)
216-6200
(Registrant’s telephone number, including area code)
| Securities Registered Pursuant to Section 12(b) of the Act: | ||||||||
| Title of Each Class | Trading Symbol(s) | Name of Each Exchange on which Registered | ||||||
|
|
|
|
||||||
|
|
|
|
||||||
Indicate by check mark whether the registrant (1) has filed all reports required to be filed by Section 13 or 15(d) of the Securities Exchange Act of 1934 during the preceding 12 months (or for such shorter period that the registrant was required to file such reports), and (2) has been subject to such filing requirements for the past 90 days.
Indicate by check mark whether the registrant has submitted electronically every Interactive Data File required to be submitted pursuant to Rule 405 of Regulation S-T (Section 232.405 of this chapter) during the preceding 12 months (or for such shorter period that the registrant was required to submit such files).
Indicate by check mark whether the registrant is a large accelerated filer, an accelerated filer, a non-accelerated filer, a smaller reporting company, or an emerging growth company. See the definitions of “large accelerated filer,” “accelerated filer,” “smaller reporting company,” and "emerging growth company" in Rule 12b-2 of the Exchange Act.
|
|
☑ | Accelerated filer | ☐ | |||||||||||
| Non-accelerated filer | ☐ | Smaller reporting company |
|
|||||||||||
| Emerging growth company |
|
|||||||||||||
If an emerging growth company, indicate by check mark if the registrant has elected not to use the extended transition period for complying with any new or revised financial accounting standards provided pursuant to Section 13(a) of the Exchange Act.
☐
Indicate by check mark whether registrant is a shell company (as defined in Rule 12b-2 of the Exchange Act).
Yes
☐
No
☑
The number of shares of the registrant’s Common Stock outstanding as of October 31, 2022 was
53,097,427
.
TABLE OF CONTENTS
|
Third Quarter 2022 Form 10-Q
|

|
1
|
||||||
Blackbaud, Inc.

|
CAUTIONARY STATEMENT REGARDING FORWARD-LOOKING STATEMENTS | |||||||
This Quarterly Report on Form 10-Q, including the documents incorporated herein by reference, contains forward-looking statements that anticipate results based on our estimates, assumptions and plans that are subject to uncertainty. These "forward-looking statements" are made subject to the safe-harbor provisions of the Private Securities Litigation Reform Act of 1995, Section 27A of the Securities Act of 1933, as amended, and Section 21E of the Securities Exchange Act of 1934, as amended. Forward-looking statements consist of, among other things, specific and overall impacts of the COVID-19 global pandemic on our financial condition and results of operations and on the markets and communities in which we and our customers and partners operate, trend analyses, statements regarding future events, future financial performance, our anticipated growth, the effect of general economic and market conditions, our business strategy and our plan to build and grow our business, our operating results, our ability to successfully integrate acquired businesses and technologies, the effect of foreign currency exchange rate and interest rate fluctuations on our financial results, the impact of expensing stock-based compensation, the sufficiency of our capital resources, our ability to meet our ongoing debt and obligations as they become due, cybersecurity and data protection risks and related liabilities, and current or potential legal proceedings involving us, all of which are based on current expectations, estimates, and forecasts, and the beliefs and assumptions of our management. Words such as “believes,” “seeks,” “expects,” “may,” “might,” “should,” “intends,” “could,” “would,” “likely,” “will,” “targets,” “plans,” “anticipates,” “aims,” “projects,” “estimates” or any variations of such words and similar expressions are also intended to identify such forward-looking statements. These forward-looking statements are subject to risks, uncertainties and assumptions that are difficult to predict. Accordingly, they should not be viewed as assurances of future performance, and actual results may differ materially and adversely from those expressed in any forward-looking statements.
Important factors that could cause actual results to differ materially from our expectations expressed in forward-looking statements include, but are not limited to, those summarized under “Part II, Item 1A. Risk factors” and elsewhere in this report, in our Annual Report on Form 10-K for the year ended December 31, 2021 and in our other filings made with the United States Securities & Exchange Commission ("SEC"). Forward-looking statements represent our management's beliefs and assumptions only as of the date of this Quarterly Report on Form 10-Q. We undertake no obligation to update or revise any forward-looking statements, or to update the reasons actual results could differ materially from those anticipated in any forward-looking statement, whether as a result of new information, future events or otherwise.
|
2
|
|
Third Quarter 2022 Form 10-Q
|
||||||
|
|
PART I. FINANCIAL INFORMATION | |||||||
ITEM 1. FINANCIAL STATEMENTS
|
Blackbaud, Inc.
Condensed Consolidated Balance Sheets (Unaudited) |
||||||||
| (dollars in thousands) |
September 30,
2022 |
December 31,
2021 |
||||||
| Assets | ||||||||
| Current assets: | ||||||||
| Cash and cash equivalents | $ |
|
$ |
|
||||
| Restricted cash |
|
|
||||||
|
Accounts receivable, net of allowance of $
|
|
|
||||||
| Customer funds receivable |
|
|
||||||
| Prepaid expenses and other current assets |
|
|
||||||
| Total current assets |
|
|
||||||
| Property and equipment, net |
|
|
||||||
| Operating lease right-of-use assets |
|
|
||||||
| Software and content development costs, net |
|
|
||||||
| Goodwill |
|
|
||||||
| Intangible assets, net |
|
|
||||||
| Other assets |
|
|
||||||
| Total assets | $ |
|
$ |
|
||||
| Liabilities and stockholders’ equity | ||||||||
| Current liabilities: | ||||||||
| Trade accounts payable | $ |
|
$ |
|
||||
| Accrued expenses and other current liabilities |
|
|
||||||
| Due to customers |
|
|
||||||
| Debt, current portion |
|
|
||||||
| Deferred revenue, current portion |
|
|
||||||
| Total current liabilities |
|
|
||||||
| Debt, net of current portion |
|
|
||||||
| Deferred tax liability |
|
|
||||||
| Deferred revenue, net of current portion |
|
|
||||||
| Operating lease liabilities, net of current portion |
|
|
||||||
| Other liabilities |
|
|
||||||
| Total liabilities |
|
|
||||||
| Commitments and contingencies (see Note 10) |
|
|
||||||
| Stockholders’ equity: | ||||||||
|
Preferred stock;
|
|
|
||||||
|
Common stock, $
|
|
|
||||||
| Additional paid-in capital |
|
|
||||||
|
Treasury stock, at cost;
|
(
|
(
|
||||||
| Accumulated other comprehensive income |
|
|
||||||
| Retained earnings |
|
|
||||||
| Total stockholders’ equity |
|
|
||||||
| Total liabilities and stockholders’ equity | $ |
|
$ |
|
||||
| The accompanying notes are an integral part of these condensed consolidated financial statements. | ||||||||
|
Third Quarter 2022 Form 10-Q
|
|
3
|
||||||
|
Blackbaud, Inc.
Condensed Consolidated Statements of Comprehensive (Loss) Income
(Unaudited)
|
|||||||||||||||||
|
Three months ended
September 30, |
Nine months ended
September 30, |
||||||||||||||||
| (dollars in thousands, except per share amounts) | 2022 | 2021 | 2022 | 2021 | |||||||||||||
| Revenue | |||||||||||||||||
| Recurring | $ |
|
$ |
|
$ |
|
$ |
|
|||||||||
| One-time services and other |
|
|
|
|
|||||||||||||
| Total revenue |
|
|
|
|
|||||||||||||
| Cost of revenue | |||||||||||||||||
| Cost of recurring |
|
|
|
|
|||||||||||||
| Cost of one-time services and other |
|
|
|
|
|||||||||||||
| Total cost of revenue |
|
|
|
|
|||||||||||||
| Gross profit |
|
|
|
|
|||||||||||||
| Operating expenses | |||||||||||||||||
| Sales, marketing and customer success |
|
|
|
|
|||||||||||||
| Research and development |
|
|
|
|
|||||||||||||
| General and administrative |
|
|
|
|
|||||||||||||
| Amortization |
|
|
|
|
|||||||||||||
| Restructuring |
|
|
|
|
|||||||||||||
| Total operating expenses |
|
|
|
|
|||||||||||||
| (Loss) income from operations |
(
|
|
(
|
|
|||||||||||||
| Interest expense |
(
|
(
|
(
|
(
|
|||||||||||||
| Other income, net |
|
|
|
|
|||||||||||||
| (Loss) income before provision for income taxes |
(
|
|
(
|
|
|||||||||||||
| Income tax (benefit) provision |
(
|
|
(
|
|
|||||||||||||
| Net (loss) income | $ |
(
|
$ |
|
$ |
(
|
$ |
|
|||||||||
| (Loss) earnings per share | |||||||||||||||||
| Basic | $ |
(
|
$ |
|
$ |
(
|
$ |
|
|||||||||
| Diluted | $ |
(
|
$ |
|
$ |
(
|
$ |
|
|||||||||
| Common shares and equivalents outstanding | |||||||||||||||||
| Basic weighted average shares |
|
|
|
|
|||||||||||||
| Diluted weighted average shares |
|
|
|
|
|||||||||||||
| Other comprehensive (loss) income | |||||||||||||||||
| Foreign currency translation adjustment | $ |
(
|
$ |
(
|
$ |
(
|
$ |
|
|||||||||
| Unrealized gain on derivative instruments, net of tax |
|
|
|
|
|||||||||||||
| Total other comprehensive (loss) income |
(
|
(
|
(
|
|
|||||||||||||
| Comprehensive (loss) income | $ |
(
|
$ |
|
$ |
(
|
$ |
|
|||||||||
| The accompanying notes are an integral part of these condensed consolidated financial statements. | |||||||||||||||||
|
4
|
|
Third Quarter 2022 Form 10-Q
|
||||||
|
Blackbaud, Inc.
Condensed Consolidated Statements of Cash Flows (Unaudited) |
||||||||
|
Nine months ended
September 30, |
||||||||
| (dollars in thousands) | 2022 | 2021 | ||||||
| Cash flows from operating activities | ||||||||
| Net (loss) income | $ |
(
|
$ |
|
||||
| Adjustments to reconcile net (loss) income to net cash provided by operating activities: | ||||||||
| Depreciation and amortization |
|
|
||||||
| Provision for credit losses and sales returns |
|
|
||||||
| Stock-based compensation expense |
|
|
||||||
| Deferred taxes |
(
|
|
||||||
| Amortization of deferred financing costs and discount |
|
|
||||||
| Other non-cash adjustments |
|
(
|
||||||
| Changes in operating assets and liabilities, net of acquisition and disposal of businesses: | ||||||||
| Accounts receivable |
|
(
|
||||||
| Prepaid expenses and other assets |
|
(
|
||||||
| Trade accounts payable |
|
|
||||||
| Accrued expenses and other liabilities |
(
|
|
||||||
| Deferred revenue |
|
|
||||||
| Net cash provided by operating activities |
|
|
||||||
| Cash flows from investing activities | ||||||||
| Purchase of property and equipment |
(
|
(
|
||||||
| Capitalized software and content development costs |
(
|
(
|
||||||
| Purchase of net assets of acquired companies, net of cash and restricted cash acquired |
(
|
|
||||||
| Cash received in sale of business |
|
|
||||||
| Net cash used in investing activities |
(
|
(
|
||||||
| Cash flows from financing activities | ||||||||
| Proceeds from issuance of debt |
|
|
||||||
| Payments on debt |
(
|
(
|
||||||
| Stock issuance costs |
(
|
|
||||||
| Employee taxes paid for withheld shares upon equity award settlement |
(
|
(
|
||||||
| Change in due to customers |
(
|
(
|
||||||
| Change in customer funds receivable |
(
|
(
|
||||||
| Purchase of treasury stock |
|
(
|
||||||
| Net cash used in financing activities |
(
|
(
|
||||||
| Effect of exchange rate on cash, cash equivalents and restricted cash |
(
|
|
||||||
| Net decrease in cash, cash equivalents and restricted cash |
(
|
(
|
||||||
| Cash, cash equivalents and restricted cash, beginning of period |
|
|
||||||
| Cash, cash equivalents and restricted cash, end of period | $ |
|
$ |
|
||||
The following table provides a reconciliation of cash and cash equivalents and restricted cash reported within the condensed consolidated balance sheets that sum to the total of the same such amounts shown above in the condensed consolidated statements of cash flows:
| (dollars in thousands) |
September 30,
2022 |
December 31,
2021 |
||||||
| Cash and cash equivalents | $ |
|
$ |
|
||||
| Restricted cash |
|
|
||||||
| Total cash, cash equivalents and restricted cash in the statement of cash flows | $ |
|
$ |
|
||||
| The accompanying notes are an integral part of these condensed consolidated financial statements. | ||||||||
|
Third Quarter 2022 Form 10-Q
|
|
5
|
||||||
Blackbaud, Inc.
Condensed Consolidated Statements of Stockholders' Equity
(Unaudited)
| (dollars in thousands) | Common stock |
Additional
paid-in capital |
Treasury
stock |
Accumulated
other
comprehensive
loss (income)
|
Retained
earnings |
Total
stockholders' equity |
|||||||||||||||||
| Shares | Amount | ||||||||||||||||||||||
| Balance at December 31, 2021 |
|
$ |
|
$ |
|
$ |
(
|
$ |
|
$ |
|
$ |
|
||||||||||
| Net loss | — | — | — | — | — |
(
|
(
|
||||||||||||||||
|
Stock issuance costs related to purchase of EVERFI (see Note 3)
|
— | — |
(
|
— | — | — |
(
|
||||||||||||||||
|
Retirements of common stock
(1)
|
(
|
— |
(
|
— | — | — |
(
|
||||||||||||||||
| Vesting of restricted stock units |
|
— |
|
— | — | — |
|
||||||||||||||||
|
Employee taxes paid for
|
— | — | — |
(
|
— | — |
(
|
||||||||||||||||
| Stock-based compensation | — | — |
|
— | — |
|
|
||||||||||||||||
| Restricted stock grants |
|
|
— | — | — | — |
|
||||||||||||||||
| Restricted stock cancellations |
(
|
— | — | — | — | — | — | ||||||||||||||||
| Other comprehensive income | — | — | — | — |
|
— |
|
||||||||||||||||
| Balance at March 31, 2022 |
|
$ |
|
$ |
|
$ |
(
|
$ |
|
$ |
|
$ |
|
||||||||||
| Net loss | — | — | — | — | — |
(
|
(
|
||||||||||||||||
|
Stock issuance costs related to purchase of EVERFI (see Note 3)
|
— | — |
(
|
— | — | — |
(
|
||||||||||||||||
|
Retirements of common stock
(1)
|
(
|
— |
(
|
— | — | — |
(
|
||||||||||||||||
| Vesting of restricted stock units |
|
— |
|
— | — | — |
|
||||||||||||||||
|
Employee taxes paid for
|
— | — | — |
(
|
— | — |
(
|
||||||||||||||||
| Stock-based compensation | — | — |
|
— | — |
|
|
||||||||||||||||
| Restricted stock grants |
|
|
— | — | — | — |
|
||||||||||||||||
| Restricted stock cancellations |
(
|
— | — | — | — | — | — | ||||||||||||||||
| Other comprehensive loss | — | — | — | — |
(
|
— |
(
|
||||||||||||||||
| Balance at June 30, 2022 |
|
$ |
|
$ |
|
$ |
(
|
$ |
|
$ |
|
$ |
|
||||||||||
| Net loss | — | — | — | — | — |
(
|
(
|
||||||||||||||||
|
Stock issuance costs related to purchase of EVERFI (see Note 3)
|
— | — |
(
|
— | — | — |
(
|
||||||||||||||||
|
Retirements of common stock
(1)
|
(
|
— |
(
|
— | — | — |
(
|
||||||||||||||||
| Vesting of restricted stock units |
|
— |
|
— | — | — |
|
||||||||||||||||
|
Employee taxes paid for
|
— | — | — |
(
|
— | — |
(
|
||||||||||||||||
| Stock-based compensation | — | — |
|
— | — |
|
|
||||||||||||||||
| Restricted stock grants |
|
|
— | — | — | — |
|
||||||||||||||||
| Restricted stock cancellations |
(
|
— | — | — | — | — | — | ||||||||||||||||
| Other comprehensive loss | — | — | — | — |
(
|
— |
(
|
||||||||||||||||
| Balance at September 30, 2022 |
|
$ |
|
$ |
|
$ |
(
|
$ |
|
$ |
|
$ |
|
||||||||||
(1)
Represents shares retired after determining certain EVERFI's selling shareholders would be paid in cash, rather than shares of our common stock. See Note 3 for additional information regarding our acquisition of EVERFI.
|
6
|
|
Third Quarter 2022 Form 10-Q
|
||||||
Blackbaud, Inc.
Condensed Consolidated Statements of Stockholders' Equity (continued)
(Unaudited)
| (dollars in thousands) | Common stock |
Additional
paid-in capital |
Treasury
stock |
Accumulated
other
comprehensive
income (loss)
|
Retained
earnings |
Total
stockholders' equity |
|||||||||||||||||
| Shares | Amount | ||||||||||||||||||||||
| Balance at December 31, 2020 |
|
$ |
|
$ |
|
$ |
(
|
$ |
(
|
$ |
|
$ |
|
||||||||||
| Net loss | — | — | — | — | — |
(
|
(
|
||||||||||||||||
|
Purchase of
|
(
|
— | — |
(
|
|||||||||||||||||||
| Vesting of restricted stock units |
|
— |
|
— | — | — |
|
||||||||||||||||
|
Employee taxes paid for
|
— | — | — |
(
|
— | — |
(
|
||||||||||||||||
| Stock-based compensation | — | — |
|
— | — |
|
|
||||||||||||||||
| Restricted stock grants |
|
|
— | — | — | — |
|
||||||||||||||||
| Restricted stock cancellations |
(
|
— | — | — | — | — | — | ||||||||||||||||
| Other comprehensive income | — | — | — | — |
|
— |
|
||||||||||||||||
| Balance at March 31, 2021 |
|
$ |
|
$ |
|
$ |
(
|
$ |
|
$ |
|
$ |
|
||||||||||
| Net income | — | — | — | — | — |
|
|
||||||||||||||||
|
Purchase of
|
(
|
— | — |
(
|
|||||||||||||||||||
| Vesting of restricted stock units |
|
— |
|
— | — | — |
|
||||||||||||||||
|
Employee taxes paid for
|
— | — | — |
(
|
— | — |
(
|
||||||||||||||||
| Stock-based compensation | — | — |
|
— | — |
|
|
||||||||||||||||
| Restricted stock grants |
|
|
— | — | — | — |
|
||||||||||||||||
| Restricted stock cancellations |
(
|
— | — | — | — | — | — | ||||||||||||||||
| Other comprehensive income | — | — | — | — |
|
— |
|
||||||||||||||||
| Balance at June 30, 2021 |
|
$ |
|
$ |
|
$ |
(
|
$ |
|
$ |
|
$ |
|
||||||||||
| Net income | — | — | — | — | — |
|
|
||||||||||||||||
|
Purchase of
|
(
|
— | — |
(
|
|||||||||||||||||||
| Vesting of restricted stock units |
|
— |
|
— | — | — |
|
||||||||||||||||
|
Employee taxes paid for
|
— | — | — |
(
|
— | — |
(
|
||||||||||||||||
| Stock-based compensation | — | — |
|
— | — |
|
|
||||||||||||||||
| Restricted stock grants |
|
|
— | — | — | — |
|
||||||||||||||||
| Restricted stock cancellations |
(
|
— | — | — | — | — | — | ||||||||||||||||
| Other comprehensive loss | — | — | — | — |
(
|
— |
(
|
||||||||||||||||
| Balance at September 30, 2021 |
|
$ |
|
$ |
|
$ |
(
|
$ |
|
$ |
|
$ |
|
||||||||||
| The accompanying notes are an integral part of these condensed consolidated financial statements. | |||||||||||||||||||||||
|
Third Quarter 2022 Form 10-Q
|
|
7
|
||||||
| 1. Organization | ||
We are the world’s leading cloud software company powering social good. Serving the entire social good community—nonprofits, higher education institutions, K–12 schools, healthcare organizations, faith communities, arts and cultural organizations, foundations, companies and individual change agents—we connect and empower organizations to increase their impact through cloud software, services, expertise and data intelligence. Our portfolio is tailored to the unique needs of vertical markets, with solutions for fundraising and CRM, marketing, advocacy, peer-to-peer fundraising, corporate social responsibility (CSR) and environmental, social and governance (ESG), school management, ticketing, grantmaking, financial management, payment processing and analytics. Serving the industry for more than four decades, we are a remote-first company headquartered in Charleston, South Carolina, with operations in the United States, Australia, Canada, Costa Rica and the United Kingdom.
| 2. Basis of Presentation | ||
Unaudited condensed consolidated interim financial statements
The accompanying condensed consolidated interim financial statements have been prepared pursuant to the rules and regulations of the United States Securities and Exchange Commission ("SEC") for interim financial reporting. These consolidated statements are unaudited and, in the opinion of management, include all adjustments (consisting of normal recurring adjustments and accruals) necessary to state fairly the consolidated balance sheets, consolidated statements of comprehensive income, consolidated statements of cash flows and consolidated statements of stockholders’ equity, for the periods presented in accordance with accounting principles generally accepted in the United States ("U.S.") ("GAAP"). The consolidated balance sheet at December 31, 2021 has been derived from the audited consolidated financial statements at that date. Operating results and cash flows for the nine months ended September 30, 2022 are not necessarily indicative of the results that may be expected for the fiscal year ending December 31, 2022, or any other future period. Certain information and footnote disclosures normally included in annual financial statements prepared in accordance with GAAP have been omitted in accordance with the rules and regulations for interim reporting of the SEC. These condensed consolidated interim financial statements should be read in conjunction with the consolidated financial statements and notes thereto included in our Annual Report on Form 10-K for the year ended December 31, 2021, and other forms filed with the SEC from time to time.
Basis of consolidation
The condensed consolidated financial statements include the accounts of Blackbaud, Inc. and its wholly owned subsidiaries. All intercompany balances and transactions have been eliminated in consolidation.
Reportable segment
We report our operating results and financial information in one operating and reportable segment. Our chief operating decision maker uses consolidated financial information to make operating decisions, assess financial performance and allocate resources. Our chief operating decision maker is our chief executive officer.
We acquired EVERFI (as defined below) on December 31, 2021. During the third quarter of 2022, we reorganized our market groups and EVERFI is now included in the Corporate Sector market group. See Note 13 to these condensed consolidated financial statements for additional information about our market groups. This change did not impact our conclusions that we have one operating and reportable segment and one goodwill reporting unit.
|
8
|
|
Third Quarter 2022 Form 10-Q
|
||||||
Risks and uncertainties related to COVID-19
We are subject to risks and uncertainties as a result of the global COVID-19 pandemic. We believe that COVID-19 may continue to significantly impact our vertical markets and geographies, but the magnitude of the impact on our business cannot be determined at this time due to numerous uncertainties, including the duration of the outbreak, the severity of variants which may develop, travel restrictions and business closures, the effectiveness of vaccination programs and other actions taken to contain the disease and other unforeseeable consequences.
Use of estimates
The preparation of financial statements in conformity with GAAP requires management to make estimates and assumptions that affect the reported amounts of assets and liabilities and disclosure of contingent assets and liabilities at the date of the financial statements, as well as the reported amounts of revenues and expenses during the reporting periods. On an ongoing basis, we reconsider and evaluate our estimates and assumptions, including those that impact revenue recognition, long-lived and intangible assets, income taxes, business combinations, stock-based compensation, capitalization of software development costs, our allowances for credit losses and sales returns, costs of obtaining contracts, valuation of derivative instruments, loss contingencies and insurance recoveries, among others. Changes in the facts or circumstances underlying these estimates, including due to COVID-19, could result in material changes and actual results could materially differ from these estimates.
Recently adopted accounting pronouncements
In March 2020, the Financial Accounting Standards Board ("FASB") issued Accounting Standards Update ("ASU") 2020-04,
Reference Rate Reform (Topic 848): Facilitation of the Effects of Reference Rate Reform on Financial Reporting
("ASU 2020-04")
.
This update provides for optional financial reporting alternatives to reduce cost and complexity associated with accounting for contracts, hedging relationships, and other transactions affected by reference rate reform. This update applies only to contracts, hedging relationships, and other transactions that reference the London Interbank Offer Rate ("LIBOR") or other reference rates expected to be discontinued because of reference rate reform. The accommodations are available for all entities through December 31, 2022, with early adoption permitted. We adopted ASU 2020-04 prospectively as of July 1, 2022, and the adoption did not have a material impact on our consolidated financial statements.
Recently issued accounting pronouncements
There are no recently issued accounting pronouncements that we expect to have a material impact on our consolidated financial statements when adopted in the future.
Summary of significant accounting policies
There have been no material changes to our significant accounting policies described in our Annual Report on Form 10-K for the year ended December 31, 2021, filed with the SEC on March 1, 2022.
|
Third Quarter 2022 Form 10-Q
|
|
9
|
||||||
| 3. Business Combinations and Dispositions | ||
2022 Disposition
Blackbaud FIMS™ and DonorCentral® NXT
On September 9, 2022, we sold our Foundation Information Management System ("FIMS") and DonorCentral NXT solutions to Fusion Laboratories, LLC for cash proceeds of approximately $
6.4
million, subject to closing adjustments. We expect the sale of these solutions to allow us to reduce complexity and focus on innovation within our core products as we execute our strategic growth plans. During the three months ended June 30, 2022, we recognized a noncash impairment charge of $
2.0
million against certain insignificant FIMS customer relationship intangible assets that were then held for sale. The impairment charge was recorded in general and administrative expense in our condensed consolidated statements of comprehensive income. During the three and nine months ended September 30, 2022, we recognized an insignificant loss on the disposal of FIMS held for sale assets and liabilities.
2022 Acquisition
Kilter
On August 19, 2022, we acquired all of the outstanding stock of Kilter, Inc. ("Kilter"), a Delaware corporation, pursuant to an agreement and plan of merger, for approximately $
2.9
million in cash, subject to closing adjustments. The acquisition of Kilter's mobile application will allow us to expand activity-based peer-to-peer fundraising engagement, to support activity-based health and wellness initiatives for socially responsible companies, and to grow the ways individuals can connect with the causes they care about most through the activities they love. In addition to the consideration paid at closing, we may be required to pay up to a maximum of $
3.0
million in additional cash consideration if during the two-year period commencing January 1, 2023 Kilter meets certain application participation targets. A liability for the contingent consideration was recorded at its acquisition-date fair value of $
2.7
million in other liabilities in our condensed consolidated balance sheet. Any change in the fair value of the contingent liability, or any change upon final settlement, will be recognized in income from operations. Fair values were also assigned to the other assets acquired and liabilities assumed, primarily consisting of goodwill and a finite-lived developed technology intangible asset, which will be amortized over an estimated useful life of three years. The fair values are based on our best estimates and assumptions as of the reporting date and are considered preliminary pending finalization. Insignificant acquisition-related costs, which primarily consisted of legal services, were recorded as general and administrative expense during the nine months ended September 30, 2022.
2021 Acquisition
EVERFI
On December 31, 2021, we acquired all of the outstanding equity securities, including all voting equity interests, of EVERFI, Inc., a Delaware corporation ("EVERFI"), pursuant to an agreement and plan of merger. The acquisition advanced our position as a leader in the rapidly evolving ESG and CSR spaces. We acquired the equity securities for approximately $
441.8
million in cash consideration and
3,810,888
shares of our common stock, valued at approximately $
301.0
million, for an aggregate purchase price of approximately $
742.8
million, net of closing adjustments. The cash consideration and related expenses were funded primarily through cash on hand and new borrowings under the 2020 Credit Facility (as defined below). As a result of the acquisition, EVERFI has become a wholly owned subsidiary of ours. The operating results of EVERFI have been included in our consolidated financial statements from the date of acquisition. In accordance with applicable accounting rules, we determined that the impact of this acquisition was not material to our consolidated financial statements; therefore, revenue and earnings since the acquisition date and pro forma information are not required to be presented.
The fair values assigned to the assets acquired and liabilities assumed in our acquisition of EVERFI are based on our best estimates and assumptions as of the reporting date and are considered preliminary pending finalization. The estimates and assumptions are subject to change as we obtain additional information during the measurement period, which may be up to one year from the acquisition date. The assets and liabilities, pending finalization, include the valuation of intangible assets as well as the assumed deferred income tax balances. During the nine months ended September 30, 2022, we recorded insignificant measurement period adjustments to the estimated fair value of the EVERFI assets acquired and liabilities
|
10
|
|
Third Quarter 2022 Form 10-Q
|
||||||
| 4. Goodwill and Other Intangible Assets | ||
The change in goodwill during the nine months ended September 30, 2022, consisted of the following:
| (dollars in thousands) | Total | ||||
| Balance at December 31, 2021 | $ |
|
|||
|
Additions related to business combination
(1)
|
|
||||
|
Adjustments related to prior year business combination
(2)
|
(
|
||||
|
Adjustments related to dispositions
(3)
|
(
|
||||
| Effect of foreign currency translation |
(
|
||||
| Balance at September 30, 2022 | $ |
|
|||
(1)
See Note 3 to these condensed consolidated financial statements for a discussion of our acquisition of Kilter.
(3)
See Note 3 to these condensed consolidated financial statements for a summary of our disposition of Blackbaud FIMS and DonorCentral NXT.
| 5. (Loss) Earnings Per Share | ||
We compute basic (loss) earnings per share by dividing net (loss) income available to common stockholders by the weighted average number of common shares outstanding during the period. Diluted (loss) earnings per share is computed by dividing net (loss) income available to common stockholders by the weighted average number of common shares and dilutive potential common shares outstanding during the period. Diluted (loss) earnings per share reflect the assumed exercise, settlement and vesting of all dilutive securities using the “treasury stock method” except when the effect is anti-dilutive. Potentially dilutive securities consist of shares issuable upon the exercise of stock options, settlement of stock appreciation rights and vesting of restricted stock awards and units. Diluted loss per share for the three and nine months ended September 30, 2022 was the same as basic loss per share as there was a net loss in the period and inclusion of potentially dilutive securities was anti-dilutive.
The following table sets forth the computation of basic and diluted (loss) earnings per share:
|
Three months ended
September 30,
|
Nine months ended
September 30,
|
||||||||||||||||
| (dollars in thousands, except per share amounts) |
2022
|
2021
|
2022
|
2021
|
|||||||||||||
| Numerator: | |||||||||||||||||
| Net (loss) income | $ |
(
|
$ |
|
$ |
(
|
$ |
|
|||||||||
| Denominator: | |||||||||||||||||
| Weighted average common shares |
|
|
|
|
|||||||||||||
| Add effect of dilutive securities: | |||||||||||||||||
| Stock-based awards |
|
|
|
|
|||||||||||||
| Weighted average common shares assuming dilution |
|
|
|
|
|||||||||||||
| (Loss) earnings per share: | |||||||||||||||||
| Basic | $ |
(
|
$ |
|
$ |
(
|
$ |
|
|||||||||
| Diluted | $ |
(
|
$ |
|
$ |
(
|
$ |
|
|||||||||
| Anti-dilutive shares excluded from calculations of diluted (loss) earnings per share |
|
|
|
|
|||||||||||||
|
Third Quarter 2022 Form 10-Q
|
|
11
|
||||||
| 6. Fair Value Measurements | ||
We use a three-tier fair value hierarchy to measure fair value. This hierarchy prioritizes the inputs into three broad levels as follows:
•
Level 1 - Quoted prices for identical assets or liabilities in active markets;
•
Level 2 - Quoted prices for similar assets and liabilities in active markets, quoted prices for identical or similar assets in markets that are not active, and model-derived valuations in which all significant inputs and significant value drivers are observable in active markets; and
•
Level 3 - Valuations derived from valuation techniques in which one or more significant inputs are unobservable.
Recurring fair value measurements
Financial assets and liabilities that are measured at fair value on a recurring basis consisted of the following, as of the dates indicated below:
| Fair value measurement using | |||||||||||||||||||||||
| (dollars in thousands) |
Quoted Prices in Active Markets for Identical Assets and Liabilities
(Level 1) |
Significant Other Observable Inputs
(Level 2) |
Significant Unobservable Inputs
(Level 3) |
Total | |||||||||||||||||||
| Fair value as of September 30, 2022 | |||||||||||||||||||||||
|
Derivative instruments:
|
|||||||||||||||||||||||
| Interest rate swaps | $ |
|
$ |
|
$ |
|
$ |
|
|||||||||||||||
| Foreign currency forward contracts |
|
|
|
|
|||||||||||||||||||
| Total financial assets | $ |
|
$ |
|
$ |
|
$ |
|
|||||||||||||||
| Fair value as of September 30, 2022 | |||||||||||||||||||||||
| Contingent consideration obligations | $ |
|
$ |
|
$ |
|
$ |
|
|||||||||||||||
| Total financial liabilities | $ |
|
$ |
|
$ |
|
$ |
|
|||||||||||||||
| Fair value as of December 31, 2021 | |||||||||||||||||||||||
|
Derivative instruments:
|
|||||||||||||||||||||||
| Interest rate swaps | $ |
|
$ |
|
$ |
|
$ |
|
|||||||||||||||
| Total financial assets | $ |
|
$ |
|
$ |
|
$ |
|
|||||||||||||||
Our derivative instruments within the scope of Accounting Standards Codification ("ASC") 815,
Derivatives and Hedging
, are required to be recorded at fair value. Our derivative instruments that are recorded at fair value include interest rate swaps and foreign currency forward contracts. See Note 9 to these condensed consolidated financial statements for additional information about our derivative instruments.
The fair value of our interest rate swaps and foreign currency forward contracts are based on model-driven valuations using Secured Overnight Financing Rate ("SOFR") rates and foreign currency forward rates, respectively, which are observable at commonly quoted intervals. Accordingly, our interest rate swaps and foreign currency forward contracts are classified within Level 2 of the fair value hierarchy. Our financial contracts that were indexed to LIBOR were modified to reference SOFR during the three months ended September 30, 2022. These modifications did not have a significant financial impact.
|
12
|
|
Third Quarter 2022 Form 10-Q
|
||||||
Contingent consideration obligations arise from business acquisitions. The fair values are based on discounted cash flow analyses reflecting a probability-weighted assessment approach derived from the likelihood of possible achievement of specified performance measures or events and captures the contractual nature of the contingencies, commercial risk, and the time value of money. As the fair value measurements for our contingent consideration obligations contain significant unobservable inputs, they are classified within Level 3 of the fair value hierarchy. See Note 3 to these condensed consolidated financial statements for additional information about our contingent consideration obligations.
We believe the carrying amounts of our cash and cash equivalents, restricted cash, accounts receivable, trade accounts payable, accrued expenses and other current liabilities and due to customers approximate their fair values at September 30, 2022 and December 31, 2021, due to the immediate or short-term maturity of these instruments.
We believe the carrying amount of our debt approximates its fair value at September 30, 2022 and December 31, 2021, as the debt bears interest rates that approximate market value. As SOFR and LIBOR rates are observable at commonly quoted intervals, our debt under the 2020 Credit Facility (as defined below) is classified within Level 2 of the fair value hierarchy. Our fixed rate debt is also classified within Level 2 of the fair value hierarchy.
We did not transfer any assets or liabilities among the levels within the fair value hierarchy during the nine months ended September 30, 2022.
Non-recurring fair value measurements
Assets and liabilities that are measured at fair value on a non-recurring basis include long-lived assets, intangible assets, goodwill and operating lease right-of-use ("ROU") assets. These assets are recognized at fair value during the period in which an acquisition is completed or at lease commencement, from updated estimates and assumptions during the measurement period, or when they are considered to be impaired. These non-recurring fair value measurements, primarily for long-lived assets, intangible assets acquired and operating lease ROU assets, are based on Level 3 unobservable inputs. In the event of an impairment, we determine the fair value of these assets other than goodwill using a discounted cash flow approach, which contains significant unobservable inputs and, therefore, is considered a Level 3 fair value measurement. The unobservable inputs in the analysis generally include future cash flow projections and a discount rate. For goodwill impairment testing, we estimate fair value using market-based methods including the use of market capitalization and consideration of a control premium.
During the three and nine months ended September 30, 2022, we recorded noncash impairment charges of $
1.0
million against certain operating lease ROU assets and $
0.3
million against certain property and equipment assets. These impairment charges resulted primarily from our decision to cease using a portion of our leased office space, and the charges are reflected in general and administrative expense on the statements of comprehensive income.
During the nine months ended September 30, 2022, we recorded a noncash impairment charge of $
2.3
million against certain previously capitalized software development costs that reduced the carrying value of those assets to zero. The impairment charge is reflected in general and administrative expense and resulted primarily from our decision to end customer support for certain solutions.
During the nine months ended September 30, 2022, we recorded a noncash impairment charge of $
2.0
million against certain insignificant customer relationship intangible assets that were held for sale. Those assets were subsequently sold during the third quarter as part of our disposition of FIMS. See Note 3 to these condensed consolidated financial statements for additional information. The impairment charge is reflected in general and administrative expense.
There were no other non-recurring fair value adjustments during the nine months ended September 30, 2022 except for certain insignificant business combination accounting adjustments to the initial fair value estimates of assets acquired and liabilities assumed at the acquisition date from updated estimates and assumptions during the measurement period. See Note 3 to these condensed consolidated financial statements for additional information.
|
Third Quarter 2022 Form 10-Q
|
|
13
|
||||||
| 7. Consolidated Financial Statement Details | ||
Restricted cash
| (dollars in thousands) |
September 30,
2022 |
December 31,
2021 |
||||||
| Restricted cash due to customers | $ |
|
$ |
|
||||
| Letters of credit for operating leases |
|
|
||||||
|
Real estate escrow balances and other
|
|
|
||||||
| Total restricted cash | $ |
|
$ |
|
||||
Prepaid expenses and other assets
| (dollars in thousands) |
September 30,
2022 |
December 31,
2021 |
||||||
|
Costs of obtaining contracts
(1)(2)
|
$ |
|
$ |
|
||||
| Derivative instruments |
|
|
||||||
|
Prepaid software maintenance and subscriptions
(3)
|
|
|
||||||
|
Implementation costs for cloud computing arrangements, net
(4)(5)
|
|
|
||||||
|
Receivables for probable insurance recoveries
(6)(7)
|
|
|
||||||
| Prepaid insurance |
|
|
||||||
| Unbilled accounts receivable |
|
|
||||||
| Taxes, prepaid and receivable |
|
|
||||||
| Deferred tax assets |
|
|
||||||
| Other assets |
|
|
||||||
| Total prepaid expenses and other assets |
|
|
||||||
| Less: Long-term portion |
|
|
||||||
| Prepaid expenses and other current assets | $ |
|
$ |
|
||||
(1)
Amortization expense from costs of obtaining contracts was $
8.4
million and $
25.4
million for the three and nine months ended September 30, 2022, respectively, and $
8.8
million and $
26.9
million for the three and nine months ended September 30, 2021.
(2)
The current portion of costs of obtaining contracts as of September 30, 2022 and December 31, 2021 was $
28.6
million and $
30.2
million, respectively.
(3)
The current portion of prepaid software maintenance and subscriptions as of September 30, 2022 and December 31, 2021 was $
24.8
million and $
24.7
million, respectively.
(4)
These costs primarily relate to the multi-year implementations of our new global enterprise resource planning and customer relationship management systems.
(5)
Amortization expense from capitalized cloud computing implementation costs was insignificant for the three months ended September 30, 2022 and 2021, respectively, and $
1.6
million and $
1.3
million for the nine months ended September 30, 2022 and 2021, respectively. Accumulated amortization for these costs was $
4.6
million and $
3.0
million as of September 30, 2022 and December 31, 2021, respectively.
(6)
All receivables for probable insurance recoveries were classified as current.
(7)
See discussion of the Security Incident at Note 10 to these condensed consolidated financial statements.
|
14
|
|
Third Quarter 2022 Form 10-Q
|
||||||
Accrued expenses and other liabilities
| (dollars in thousands) |
September 30,
2022 |
December 31,
2021 |
||||||
|
Taxes payable
(1)
|
$ |
|
$ |
|
||||
|
Accrued legal costs
(2)
|
|
|
||||||
| Operating lease liabilities, current portion |
|
|
||||||
| Customer credit balances |
|
|
||||||
| Accrued commissions and salaries |
|
|
||||||
|
Contingent consideration liability
(3)
|
|
|
||||||
| Accrued vacation costs |
|
|
||||||
| Accrued health care costs |
|
|
||||||
| Accrued transaction-based costs related to payments services |
|
|
||||||
| Accrued bonuses |
|
|
||||||
| Unrecognized tax benefit |
|
|
||||||
|
Amounts payable to former EVERFI option holders
(4)
|
|
|
||||||
| Other liabilities |
|
|
||||||
| Total accrued expenses and other liabilities |
|
|
||||||
| Less: Long-term portion |
|
|
||||||
| Accrued expenses and other current liabilities | $ |
|
$ |
|
||||
(1)
We deferred payments of the employer's portion of Social Security taxes during 2020 under the Coronavirus, Aid, Relief and Economic Security Act, half of which was due by t
he end of calendar year 2021 with the remainder due by the end of calendar year 2022.
(2)
All accrued legal costs are classified as current.
(3)
See discussion of our acquisition of Kilter at Note 3 to these condensed consolidated financial statements.
(4)
Represents amounts that had not been paid by EVERFI to its former option holders as of December 31, 2021, solely due to the timing of the acquisition on the last day of 2021. See Note 3 to these condensed consolidated financial statements for additional information regarding our acquisition of EVERFI.
|
Three months ended
September 30,
|
Nine months ended
September 30,
|
||||||||||||||||
| (dollars in thousands) |
2022
|
2021
|
2022
|
2021
|
|||||||||||||
| Interest income | $ |
|
$ |
|
$ |
|
$ |
|
|||||||||
| Currency revaluation gains (losses) |
|
|
|
(
|
|||||||||||||
| Other income, net |
|
|
|
|
|||||||||||||
| Other income, net | $ |
|
$ |
|
$ |
|
$ |
|
|||||||||
|
Third Quarter 2022 Form 10-Q
|
|
15
|
||||||
| 8. Debt | ||
The following table summarizes our debt balances and the related weighted average effective interest rates, which includes the effect of interest rate swap agreements.
| Debt balance at |
Weighted average
effective interest rate at |
||||||||||||||||
| (dollars in thousands) |
September 30,
2022 |
December 31,
2021 |
September 30,
2022 |
December 31,
2021 |
|||||||||||||
| Credit facility: | |||||||||||||||||
| Revolving credit loans | $ |
|
$ |
|
|
% |
|
% | |||||||||
| Term loans |
|
|
|
% |
|
% | |||||||||||
| Real estate loans |
|
|
|
% |
|
% | |||||||||||
| Other debt |
|
|
|
% |
|
% | |||||||||||
| Total debt |
|
|
|
% |
|
% | |||||||||||
| Less: Unamortized discount and debt issuance costs |
|
|
|||||||||||||||
| Less: Debt, current portion |
|
|
|
% |
|
% | |||||||||||
| Debt, net of current portion | $ |
|
$ |
|
|
% |
|
% | |||||||||
2020 credit facility
In October 2020, we entered into a five-year $
900.0
million senior credit facility (the "2020 Credit Facility"). At September 30, 2022, we were in compliance with our debt covenants under the 2020 Credit Facility.
First incremental term loan
In December 2021, we entered into the First Incremental Term Loan Agreement (the "Incremental Amendment"). The Incremental Amendment amended the 2020 Credit Facility and, among other things, provided for a $
250.0
million incremental term loan (the “2021 Incremental Term Loan”).
Financing for EVERFI acquisition
On December 31, 2021, we acquired EVERFI for approximately $
441.8
million in cash consideration and
3,810,888
shares of our common stock, valued at approximately $
301.0
million, for an aggregate purchase price of approximately $
742.8
million, net of closing adjustments. We financed the cash consideration and related expenses through cash on hand and new borrowings u
nder the
2020 Credit Facility
, including
$
250.0
million
under the 2021 Incremental Term Loan.
First amendment to 2020 Credit Facility
On January 31, 2022, we entered into the First Amendment to Credit Agreement (the “Amendment”). The Amendment amended the 2020 Credit Facility to, among other things, (i) modify the definition of “Applicable Margin”, (ii) modify the net leverage ratio financial covenant to require a net leverage ratio of (A)
4.00
:1.00 or less for the fiscal quarter ended December 31, 2021 and for fiscal quarters ending thereafter through December 31, 2023 and (B)
3.75
:1.00 or less for the fiscal quarters ending March 31, 2024 and thereafter, (iii) reset the $
250.0
million fixed dollar basket with respect to the accordion feature and (iv) modify certain negative covenants to provide additional operational flexibility.
|
16
|
|
Third Quarter 2022 Form 10-Q
|
||||||
LIBOR transition amendment
On August 26, 2022, we entered into a LIBOR Transition Amendment (the "LIBOR Amendment"). The LIBOR Amendment amended the 2020 Credit Facility, as previously amended, to change the interest rate benchmark from LIBOR to SOFR, as defined in the LIBOR Amendment. The LIBOR Amendment does not change any terms of the 2020 Credit Facility unrelated to reference rate reform.
Real estate loans
In August 2020, we completed the purchase of our global headquarters facility. As part of the purchase price, we assumed the seller’s obligations under two senior secured notes with a then-aggregate outstanding principal amount of $
61.1
million (collectively, the “Real Estate Loans”). At September 30, 2022, we were in compliance with our debt covenants under the Real Estate Loans.
Other debt
From time to time, we enter into third-party financing agreements for purchases of software and related services for our internal use. Generally, the agreements are non-interest-bearing notes requiring annual payments. Interest associated with the notes is imputed at the rate we would incur for amounts borrowed under our then-existing credit facility at the inception of the notes.
The following table summarizes our currently effective financing agreements as of September 30, 2022:
| (dollars in thousands) |
Term
in Months |
Number of
Annual Payments |
First Annual
Payment Due |
Original Loan
Value |
||||||||||
| Effective dates of agreements: | ||||||||||||||
| December 2019 | 51 | 4 | January 2020 | $ |
|
|||||||||
| 9. Derivative Instruments | ||
We generally use derivative instruments to manage our interest rate and foreign currency exchange risk. We currently have derivatives classified as cash flow hedges and net investment hedges. We do not enter into any derivatives for trading or speculative purposes.
All of our derivative instruments are governed by International Swap Dealers Association, Inc. ("ISDA") master agreements with our counterparties. As of September 30, 2022 and December 31, 2021, we have presented the fair value of our derivative instruments at the gross amounts in the condensed consolidated balance sheet as the gross fair values of our derivative instruments equaled their net fair values.
Cash flow hedges
We have entered into interest rate swap agreements, which effectively convert portions of our variable rate debt under the 2020 Credit Facility to a fixed rate for the term of the swap agreements. We designated each of the interest rate swaps as cash flow hedges at the inception of the contracts. As of September 30, 2022 and December 31, 2021, the aggregate notional values of the interest rate swaps were $
435.0
million. All of the contracts have maturities on or before October 2024.
During the three months ended September 30, 2022, we entered into foreign currency forward contracts to hedge revenues denominated in the Canadian Dollar ("CAD") against changes in the exchange rate with the United States Dollar ("USD"). We designated each of the forwards as cash flow hedges at the inception of the contracts. As of September 30, 2022, the aggregate notional values of the foreign currency forward contracts designated as cash flow hedges that we held to buy USD in exchange for Canadian Dollars were $
23.6
million CAD. All of the contracts have maturities of 12 months or less. We did not have foreign currency forward contracts as of December 31, 2021.
|
Third Quarter 2022 Form 10-Q
|
|
17
|
||||||
Net investment hedges
We have entered into foreign currency forward contracts to hedge a portion of the foreign currency exposure that arises on translation of our investments denominated in British Pounds ("GBP") into USD. We designated each of these foreign currency forward contracts as net investment hedges at the inception of the contracts. As of September 30, 2022, we had £
10.7
million of foreign currency forward contracts designated as net investment hedges to reduce the volatility of the U.S. dollar value of a portion of our GBP-denominated investments.
The fair values of our derivative instruments were as follows as of:
| Asset derivatives | |||||||||||
| (dollars in thousands) | Balance sheet location |
September 30,
2022 |
December 31,
2021 |
||||||||
| Derivative instruments designated as hedging instruments: | |||||||||||
|
Foreign currency forward contracts, current portion
|
Prepaid expenses
and other current assets
|
$ |
|
$ |
|
||||||
|
Interest rate swaps, long-term
|
Other assets |
|
|
||||||||
| Total derivative instruments designated as hedging instruments | $ |
|
$ |
|
|||||||
The effects of derivative instruments in cash flow and net investment hedging relationships were as follows:
|
Gain recognized
in accumulated other
comprehensive
income as of
|
Location
of gain
reclassified from
accumulated other
comprehensive
income into
(loss) income
|
Gain (loss) reclassified from accumulated
other comprehensive income into (loss) income
|
|||||||||||||||
| (dollars in thousands) |
September 30,
2022 |
Three months ended
September 30, 2022
|
Nine months ended
September 30, 2022
|
||||||||||||||
| Cash Flow Hedges | |||||||||||||||||
| Interest rate swaps | $ |
|
Interest expense | $ |
|
$ |
|
||||||||||
| Foreign currency forward contracts | $ |
|
Revenue | $ |
|
$ |
|
||||||||||
| Net Investment Hedges | |||||||||||||||||
| Foreign currency forward contracts | $ |
|
$ |
|
$ |
|
|||||||||||
|
September 30,
2021 |
Three months ended
September 30, 2021
|
Nine months ended
September 30, 2021
|
|||||||||||||||
| Cash Flow Hedges | |||||||||||||||||
| Interest rate swaps | $ |
|
Interest expense | $ |
(
|
$ |
(
|
||||||||||
Our policy requires that derivatives used for hedging purposes be designated and effective as a hedge of the identified risk exposure at the inception of the contract. Accumulated other comprehensive income (loss) includes unrealized gains or losses from the change in fair value measurement of our derivative instruments each reporting period and the related income tax expense or benefit. Excluding net investment hedges, changes in the fair value measurements of the derivative instruments and the related income tax expense or benefit are reflected as adjustments to accumulated other comprehensive income (loss) until the actual hedged expense is incurred or until the hedge is terminated at which point the unrealized gain (loss) is reclassified from accumulated other comprehensive income (loss) to current earnings. For net investment hedges, changes in the fair value measurements of the derivative instruments and the related income tax expense or benefit are reflected as adjustments to translation adjustment, a component of accumulated other comprehensive income (loss), and recognized in earnings only when the hedged GBP investment is liquidated. The estimated accumulated other comprehensive income as of September 30, 2022 that is expected to be reclassified into earnings within the next twelve months is $
17.1
million. There were
no
ineffective portions of our interest rate swap or foreign currency forward derivatives during the nine months ended September 30, 2022 and 2021. See Note 12 to these condensed consolidated financial statements for a summary of the changes in accumulated other comprehensive income (loss) by component. We classify cash flows related to derivative instruments as operating activities in the condensed consolidated statements of cash flows.
|
18
|
|
Third Quarter 2022 Form 10-Q
|
||||||
| 10. Commitments and Contingencies | ||
Leases
We have operating leases for corporate offices, subleased offices and certain equipment and furniture. As of September 30, 2022, we had operating leases for equipment that had not yet commenced with future rent payments of $
3.0
million. These operating leases are expected to commence during 2022 with lease terms of
3
years.
The following table summarizes the components of our lease expense:
|
Three months ended
September 30,
|
Nine months ended
September 30,
|
||||||||||||||||
| (dollars in thousands) |
2022
|
2021
|
2022
|
2021
|
|||||||||||||
|
Operating lease cost
(1)
|
$ |
|
$ |
|
$ |
|
$ |
|
|||||||||
| Variable lease cost |
|
|
|
|
|||||||||||||
| Sublease income |
(
|
(
|
(
|
(
|
|||||||||||||
| Net lease cost | $ |
|
$ |
|
$ |
|
$ |
|
|||||||||
(1)
Includes short-term lease costs, which were immaterial.
Other commitments
The term loans under the 2020 Credit Facility require periodic principal payments. The balance of the term loans and any amounts drawn on the revolving credit loans are due upon maturity of the 2020 Credit Facility in October 2025. The Real Estate Loans also require periodic principal payments and the balance of the Real Estate Loans are due upon maturity in April 2038.
We have contractual obligations for third-party technology used in our solutions and for other services we purchase as part of our normal operations. In certain cases, these arrangements require a minimum annual purchase commitment by us. As of September 30, 2022, the remaining aggregate minimum purchase commitment under these arrangements was approximately $
236.0
million through 2027.
Solution and service indemnifications
In the ordinary course of business, we provide certain indemnifications of varying scope to customers against claims of intellectual property infringement made by third parties arising from the use of our solutions or services. We have not identified any losses that might be covered by these indemnifications.
Legal proceedings
We are subject to legal proceedings and claims that arise in the ordinary course of business, as well as certain other non-ordinary course proceedings, claims and investigations, as described below. We make a provision for a loss contingency when it is both probable that a material liability has been incurred and the amount of the loss can be reasonably estimated. If only a range of estimated losses can be determined, we accrue an amount within the range that, in our judgment, reflects the most likely outcome; if none of the estimates within that range is a better estimate than any other amount, we accrue the low end of the range. For proceedings in which an unfavorable outcome is reasonably possible but not probable and an estimate of the loss or range of losses arising from the proceeding can be made, we disclose such an estimate, if material. If such a loss or range of losses is not reasonably estimable, we disclose that fact. We review any such loss contingency provisions at least quarterly and adjust them to reflect the impacts of negotiations, settlements, rulings, advice of legal counsel and other information and events pertaining to a particular case. We recognize insurance recoveries, if any, when they are probable of receipt. All associated costs due to third-party service providers and consultants, including legal fees, are expensed as incurred.
|
Third Quarter 2022 Form 10-Q
|
|
19
|
||||||
Legal proceedings are inherently unpredictable. However, we believe that we have valid defenses with respect to the legal matters pending or threatened against us and intend to defend ourselves vigorously against all claims asserted. It is possible that our consolidated financial position, results of operations or cash flows could be materially negatively affected in any particular period by an unfavorable resolution of one or more of such legal proceedings.
Security incident
As previously disclosed, we are subject to risks and uncertainties as a result of a ransomware attack against us in May 2020 in which a cybercriminal removed a copy of a subset of data from our self-hosted environment (the "Security Incident"). Based on the nature of the Security Incident, our research and third party (including law enforcement) investigation, we do not believe that any data went beyond the cybercriminal, was or will be misused, or will be disseminated or otherwise made available publicly. Our investigation into the Security Incident by our cybersecurity team and third-party forensic advisors remains ongoing.
As a result of the Security Incident, we are currently subject to certain legal proceedings, claims and investigations, as discussed below, and could be the subject of additional legal proceedings, claims, inquires and investigations in the future that might result in adverse judgments, settlements, fines, penalties or other resolution. To limit our exposure to losses related to claims against us, including data breaches such as the Security Incident, we maintain $
50
million of insurance above a $
250
thousand deductible payable by us. As noted below, this coverage has reduced our fina
ncial exposure related to the Security Incident.
We recorded expenses and offsetting probable insurance recoveries related to the Security Incident as follows:
|
Three months ended
September 30,
|
Nine months ended
September 30,
|
||||||||||||||||
| (dollars in thousands) |
2022
|
2021
|
2022
|
2021
|
|||||||||||||
| Gross expense | $ |
|
$ |
|
$ |
|
$ |
|
|||||||||
| Offsetting probable insurance recoveries |
|
(
|
(
|
(
|
|||||||||||||
| Net expense | $ |
|
$ |
|
$ |
|
$ |
|
|||||||||
The following summarizes our cumulative expenses, insurance recoveries recognized and insurance recoveries paid as of:
| (dollars in thousands) |
September 30,
2022 |
December 31,
2021 |
||||||
| Cumulative gross expense | $ |
|
$ |
|
||||
| Cumulative offsetting insurance recoveries recognized |
(
|
(
|
||||||
| Cumulative net expense | $ |
|
$ |
|
||||
| Cumulative offsetting insurance recoveries paid | $ |
(
|
$ |
(
|
||||
Recorded expenses have consisted primarily of payments to third-party service providers and consultants, including legal fees, as well as settlements of customer claims and accruals for certain loss contingencies. Not included in the expenses discussed above were costs associated with enhancements to our cybersecurity program. We present expenses and insurance recoveries related to the Security Incident in general and administrative expense on our consolidated statements of comprehensive (loss) income and as operating activities on our consolidated statements of cash flows. Total costs related to the Security Incident have exceeded the limit of our insurance coverage. We expect to continue to experience significant expenses related to our response to the Security Incident, resolution of legal proceedings, claims and investigations, including those discussed below, and our efforts to further enhance our cybersecurity measures. For full year 2022, we currently expect net pre-tax expense of approximately $
30.0
million to $
35.0
million for ongoing legal fees related to the Security Incident. In line with our policy as discussed above, legal fees are expensed as incurred. For full year 2022, we currently expect net cash outlays of approximately $
15.0
million to $
25.0
million for ongoing legal fees related to the Security Incident.
|
20
|
|
Third Quarter 2022 Form 10-Q
|
||||||
As of September 30, 2022, we have recorded approximately $
5.0
million in aggregate liabilities for loss contingencies related to the Security Incident that we believe we can reasonably estimate. In accordance with our policy described above, certain of these recorded charges reflect the low end of a range of estimated losses based on our determination that no estimate within that range was better than any other amount. It is reasonably possible that actual losses in the future for those matters will be in excess of the amounts accrued, but we are unable at this time to reasonably estimate the possible additional loss. There are other Security Incident-related matters, including customer claims, customer constituent class actions and governmental investigations, for which we have not recorded a liability for a loss contingency as of September 30, 2022 because we are unable at this time to reasonably estimate the possible loss or range of loss.
Customer claims.
To date, we have received approximately
260
specific requests for reimbursement of expenses ("Customer Reimbursement Requests") and approximately
400
reservations of the right to seek expense recovery in the future from customers or their attorneys in the U.S., U.K. and Canada related to the Security Incident (none of which have as yet been filed in court). Of the Customer Reimbursement Requests received to date, approximately
190
have been fully resolved and closed. In June 2022, we also received notice of a proposed claim on behalf of a number of U.K. data subjects, which we are reviewing. In addition, insurance companies representing various customers’ interests through subrogation claims have contacted us. One insurance company has filed a subrogation claim in court. Customer and insurer subrogation claims generally seek reimbursement of their costs and expenses associated with notifying their own customers of the Security Incident and taking steps to assure that personal information has not been compromised as a result of the Security Incident. Our review of customer and subrogation claims includes analyzing individual customer contracts into which we have entered, the specific claims made and applicable law.
Customer constituent class actions.
Presently, we are a defendant in
19
putative consumer class action cases [
17
in U.S. federal courts (which have been consolidated under multi district litigation to a single federal court) and
2
in Canadian courts] alleging harm from the Security Incident. The plaintiffs in these cases, who purport to represent various classes of individual constituents of our customers, generally claim to have been harmed by alleged actions and/or omissions by us in connection with the Security Incident and assert a variety of common law and statutory claims seeking monetary damages, injunctive relief, costs and attorneys’ fees and other related relief.
Lawsuits that are putative class actions require a plaintiff to satisfy a number of procedural requirements before proceeding to trial. These requirements include, among others, demonstration to a court that the law proscribes in some manner our activities, the making of factual allegations sufficient to suggest that our activities exceeded the limits of the law and a determination by the court—known as class certification—that the law permits a group of individuals to pursue the case together as a class. If these procedural requirements are not met, the lawsuit cannot proceed as a class action and the plaintiff may lose the financial incentive to proceed with the case. Frequently, a court’s determination as to these procedural requirements is subject to appeal to a higher court. As a result of these uncertainties, we may be unable to determine the probability of loss until, or after, a court has finally determined that a plaintiff has satisfied the applicable class action procedural requirements.
Furthermore, for putative class actions, it is often not possible to reasonably estimate the possible loss or a range of loss amounts, even where we have determined that a loss is reasonably possible. Generally, class actions involve a large number of people and raise complex legal and factual issues that result in uncertainty as to their outcome and, ultimately, making it difficult for us to estimate the amount of damages that a plaintiff might successfully prove. This analysis is further complicated by the fact that the plaintiffs lack contractual privity with us.
Governmental investigations.
To date, we have received a consolidated, multi-state Civil Investigative Demand issued on behalf of
49
state Attorneys General and the District of Columbia and a separate Civil Investigative Demand from the office of the California Attorney General relating to the Security Incident. We also are subject to the following pending governmental actions:
•
an investigation by the U.S. Federal Trade Commission;
•
a formal investigation by the SEC;
•
an investigation by the U.S. Department of Health and Human Services;
•
an investigation by the Office of the Australian Information Commissioner; and
•
an investigation by the Office of the Privacy Commissioner of Canada.
|
Third Quarter 2022 Form 10-Q
|
|
21
|
||||||
We have been having discussions with the SEC Staff about potential resolution of issues arising from their investigation. While we are hopeful that we can resolve the matter on acceptable terms, there is no assurance that we will be able to resolve the matter on terms acceptable to us and the SEC.
On September 28, 2021, the Information Commissioner's Office in the United Kingdom under the U.K Data Protection Act 2018 (the "ICO") notified us that it has closed its investigation of the Security Incident. Based on its investigation and having considered our actions before, during and after the Security Incident, the ICO issued our European subsidiary a reprimand in accordance with Article 58(2)(b) of the U.K. General Data Protection Regulation ("U.K. GDPR") due to our non-compliance, in the ICO's view, with the requirements set out in Article 32 of the U.K. GDPR regarding the processing of personal data. The ICO did not impose a penalty related to the Security Incident, nor did it impose any requirements for further action by us.
On September 24, 2021, we received notice from the Spanish Data Protection Authority that it has concluded its investigation of the Security Incident, pursuant to which our European subsidiary paid a penalty of €
60,000
in relation to the alleged late notification of two Spanish data controllers regarding the Security Incident.
On January 15, 2021, we were notified by the Data Protection Commission of Ireland that it has concluded its investigation of the Security Incident without taking any action against us.
We continue to cooperate with all ongoing investigations, which include various requests for documents, policies, narratives and communications, as well as requests to interview or depose various Company-related personnel. As noted above, each of these separate governmental investigations could result in adverse judgements, settlements, fines, penalties or other resolution, the amount, scope and timing of which we are currently unable to predict, but could have a material adverse impact on our results of operations, cash flows, or financial condition.
| 11. Income Taxes | ||
Our income tax (benefit) provision and effective income tax rates, including the effects of period-specific events, were:
|
Three months ended
September 30,
|
Nine months ended
September 30,
|
||||||||||||||||
| (dollars in thousands) |
2022
|
2021
|
2022
|
2021
|
|||||||||||||
| Income tax (benefit) provision | $ |
(
|
$ |
|
$ |
(
|
$ |
|
|||||||||
| Effective income tax rate |
|
% |
|
% |
|
% |
|
% | |||||||||
During the six months ended June 30, 2022, we utilized the discrete effective tax rate method, as allowed by ASC 740-270-30-18,
Income Taxes—Interim Reporting
, to calculate our interim income tax provision. The discrete method is applied when the application of the estimated annual effective tax rate is impractical because it is not possible to reliably estimate the annual effective tax rate. The discrete method treats the year-to-date period as if it was the annual period and determines the income tax expense or benefit on that basis. We believe that, at this time, the use of this discrete method is no longer more appropriate than the annual effective tax rate method.
The decrease in our effective income tax rate for the three and nine months ended September 30, 2022 when compared to the same periods in 2021 was primarily due to the effect of year-to-date losses relative to our forecasted permanent items, including foreign-derived intangible income deduction not generated in the prior year. Furthermore, the 2022 effective income tax rate was negatively impacted by expenses attributable to stock based compensation.
|
22
|
|
Third Quarter 2022 Form 10-Q
|
||||||
| 12. Stockholders' Equity | ||
Changes in accumulated other comprehensive income (loss) by component
The changes in accumulated other comprehensive income (loss) by component, consisted of the following:
|
Three months ended
September 30,
|
Nine months ended
September 30,
|
||||||||||||||||
| (dollars in thousands) |
2022
|
2021
|
2022
|
2021
|
|||||||||||||
| Accumulated other comprehensive income (loss), beginning of period | $ |
|
$ |
|
$ |
|
$ |
(
|
|||||||||
| By component: | |||||||||||||||||
| Gains and losses on cash flow hedges: | |||||||||||||||||
| Accumulated other comprehensive income (loss) balance, beginning of period | $ |
|
$ |
|
$ |
|
$ |
(
|
|||||||||
|
Other comprehensive income (loss) before reclassifications, net of tax effects of $(
|
|
(
|
|
|
|||||||||||||
| Amounts reclassified from accumulated other comprehensive income (loss) |
(
|
|
(
|
|
|||||||||||||
| Tax expense (benefit) included in provision for income taxes |
|
(
|
|
(
|
|||||||||||||
| Total amounts reclassified from accumulated other comprehensive income (loss) |
(
|
|
(
|
|
|||||||||||||
| Net current-period other comprehensive income |
|
|
|
|
|||||||||||||
| Accumulated other comprehensive income balance, end of period | $ |
|
$ |
|
$ |
|
$ |
|
|||||||||
| Foreign currency translation adjustment: | |||||||||||||||||
| Accumulated other comprehensive (loss) income balance, beginning of period | $ |
(
|
$ |
|
$ |
|
$ |
|
|||||||||
| Translation adjustment |
(
|
(
|
(
|
|
|||||||||||||
| Accumulated other comprehensive (loss) income balance, end of period |
(
|
|
(
|
|
|||||||||||||
| Accumulated other comprehensive income, end of period | $ |
|
$ |
|
$ |
|
$ |
|
|||||||||
| 13. Revenue Recognition | ||
Transaction price allocated to the remaining performance obligations
As of September 30, 2022, approximately
$
1.0
billion
of revenue is expected to be recognized from remaining performance obligations. We expect to recognize revenue on approximately
60
%
of these remaining performance obligations over the next
12
months, with the remainder recognized thereafter.
We applied the practical expedient in ASC 606-10-50-14 and have excluded the value of unsatisfied performance obligations for (i) contracts with an original expected length of one year or less (one-time services); and (ii) contracts for which we recognize revenue at the amount to which we have the right to invoice for services performed (transactional revenue).
|
Third Quarter 2022 Form 10-Q
|
|
23
|
||||||
Contract balances
Our contract assets as of September 30, 2022 and December 31, 2021 were insignificant.
Our closing balances of deferred revenue were as follows:
| (in thousands) |
September 30,
2022 |
December 31,
2021 |
||||||
| Total deferred revenue | $ |
|
$ |
|
||||
The increase in deferred revenue during the nine months ended September 30, 2022 was primarily due to
a seasonal increase in customer contract renewals
. Historically, due to the timing of customer budget cycles, we have an increase in customer contract renewals at or near the beginning of our third quarter. Generally, our lowest balance of deferred revenue during the year is at the end of our first quarter. The amount of revenue recognized during the nine months ended September 30, 2022 that was included in the deferred reven
ue balance at the beginning of the period was approximately $
303
million. The amount of revenue recognized during the nine months ended September 30, 2022 from performance obligations satisfied in prior periods was
insignificant
.
Disaggregation of revenue
We sell our cloud solutions and related services in three primary geographical markets: to customers in the United States, to customers in the United Kingdom and to customers located in other countries.
The following table presents our revenue by geographic area based on the address of our customers:
|
Three months ended
September 30,
|
Nine months ended
September 30,
|
||||||||||||||||
| (dollars in thousands) |
2022
|
2021
|
2022
|
2021
|
|||||||||||||
| United States | $ |
|
$ |
|
$ |
|
$ |
|
|||||||||
| United Kingdom |
|
|
|
|
|||||||||||||
| Other countries |
|
|
|
|
|||||||||||||
| Total revenue | $ |
|
$ |
|
$ |
|
$ |
|
|||||||||
During the third quarter of 2022, we reorganized our market groups. The Social Sector and Corporate Sector market groups comprised our go-to-market organizations as of September 30, 2022. The following is a description of each market group as of that date:
•
The Social Sector market group focuses on sales to customers and prospects in the social sector, such as nonprofits, foundations, education institutions, healthcare organizations and other not-for-profit entities globally, and includes JustGiving from Blackbaud; and
•
The Corporate Sector market group focuses on sales to customers and prospects in the corporate sector globally, and includes EVERFI from Blackbaud and YourCause from Blackbaud.
The following table presents our revenue by market group:
|
Three months ended
September 30,
|
Nine months ended
September 30,
|
||||||||||||||||
| (dollars in thousands) |
2022
|
2021
|
2022
|
2021
|
|||||||||||||
| Social Sector | $ |
|
$ |
|
$ |
|
$ |
|
|||||||||
|
Corporate Sector
|
|
|
|
|
|||||||||||||
| Other |
|
|
(
|
|
|||||||||||||
| Total revenue | $ |
|
$ |
|
$ |
|
$ |
|
|||||||||
|
24
|
|
Third Quarter 2022 Form 10-Q
|
||||||
The following table presents our recurring revenue by type:
|
Three months ended
September 30,
|
Nine months ended
September 30,
|
||||||||||||||||
| (dollars in thousands) |
2022
|
2021
|
2022
|
2021
|
|||||||||||||
| Contractual recurring | $ |
|
$ |
|
$ |
|
$ |
|
|||||||||
| Transactional recurring |
|
|
|
|
|||||||||||||
| Total recurring revenue | $ |
|
$ |
|
$ |
|
$ |
|
|||||||||
| 14. Subsequent Events | ||
Rights Agreement
On
October 7, 2022
, our Board of Directors declared a dividend of one preferred share purchase right (a “Right”) for each of our issued and outstanding shares of common stock, which was paid to the stockholders of record at the close of business on
October 17, 2022
(the “Record Date”). Each Right entitles the registered holder, subject to the terms of the Rights Agreement (as defined below), to purchase us one one-thousandth of a share of our Series A Junior Participating Preferred Stock, par value $
0.001
per share (the “Preferred Stock”) at a price of $
313.00
, subject to certain adjustments (as adjusted from time to time, the “Exercise Price”). The description and terms of the Rights are set forth in the Stockholder Rights Agreement, dated as of
October 7, 2022
(the “Rights Agreement”), by and between us and American Stock Transfer & Trust Company, LLC.
Under the Rights Agreement, the Rights will become exercisable if an entity, person or group acquires beneficial ownership of
20
% or more of our outstanding common stock in a transaction not approved by our Board of Directors. In the event that the Rights become exercisable due to the ownership threshold being crossed, each Right will entitle its holder (other than the person, entity or group triggering the Rights Plan, whose rights will become void and will not be exercisable) to purchase additional shares of common stock having a then-current market value of twice the Exercise Price.
Each share of Preferred Stock will be entitled, when, as and if declared, to a minimum preferential per share quarterly dividend payment equal to the greater of (i) $1.00 per share and (ii) an amount equal to 1,000 times the dividend declared per share of common stock. In the event of liquidation, dissolution or winding up of the Company, the holders of the Preferred Stock will be entitled to a minimum preferential payment of the greater of (i) $1,000.00 per share (plus any accrued but unpaid dividends), and (ii) an amount equal to 1,000 times the payment made per share of common stock. Each share of Preferred Stock will have 1,000 votes, voting together with the common stock. In the event of any merger, consolidation or other transaction in which outstanding shares of common stock are converted or exchanged, each share of Preferred Stock will be entitled to receive 1,000 times the amount received per share of common stock. These Rights are protected by customary antidilution provisions.
Subject to the terms of the Rights Agreement, the Rights will expire on October 2, 2023. Additional information regarding the Rights Agreement, including a copy of the Rights Agreement, is contained in a Form 8-K filed with the SEC on October 11, 2022.
|
Third Quarter 2022 Form 10-Q
|
|
25
|
||||||
ITEM 2. MANAGEMENT'S DISCUSSION AND ANALYSIS OF FINANCIAL CONDITION AND RESULTS OF OPERATIONS
The following discussion and analysis of our financial condition and results of operations should be read in conjunction with our unaudited, condensed consolidated financial statements and related notes included elsewhere in this Quarterly Report on Form 10-Q. The following discussion and analysis presents financial information denominated in millions of dollars which can lead to differences from rounding when compared to similar information contained in the unaudited, condensed consolidated financial statements and related notes which are primarily denominated in thousands of dollars.
| Executive Summary | ||
We are the world’s leading cloud software company powering social good. Serving the entire social good community—nonprofits, higher education institutions, K–12 schools, healthcare organizations, faith communities, arts and cultural organizations, foundations, companies and individual change agents—we connect and empower organizations to increase their impact through cloud software, services, expertise and data intelligence. Our portfolio is tailored to the unique needs of vertical markets, with solutions for fundraising and CRM, marketing, advocacy, peer-to-peer fundraising, corporate social responsibility (CSR) and environmental, social and governance (ESG), school management, ticketing, grantmaking, financial management, payment processing and analytics. Serving the industry for more than four decades, we are a remote-first company headquartered in Charleston, South Carolina, with operations in the United States, Australia, Canada, Costa Rica and the United Kingdom.
Our revenue is primarily generated from the following sources: (i) charging for the use of our software solutions in cloud and hosted environments; (ii) providing payment and transactional services; (iii) providing software maintenance and support services; (iv) providing Impact-as-a-Service
™
digital educational content; and (v) providing professional services, including implementation, consulting, training, analytic and other services.
COVID-19 Impact
The economic impact of COVID-19 on the social good industry remains somewhat uncertain, although we are seeing signs of recovery in the industry.
Our end markets continue to display resilience in the post-pandemic recovery with a digital-first mindset. In February 2022, the Blackbaud Institute released its annual Charitable Giving Report, which reported that overall giving in 2021 grew 9% with the percent of giving done online up significantly from pre-pandemic levels and holding steady in the low-teens. Nearly 30% of those online donations are being made on a mobile device, which we see as a long-term positive as we equip organizations to process mobile donations and optimize mobile user interfaces.
If our existing and prospective customers remain cautious in their purchase decisions, our operating environment may continue to be challenging. Notwithstanding these conditions, we remain focused on continuing to execute our four-point strategy and strengthening our leadership position.
Four-Point Strategy
| 1 | Expand Total Addressable Market | |||||||||||||
| 2 | Lead with World Class Teams and Operations | |||||||||||||
| 3 | Delight Customers with Innovative Cloud Solutions | |||||||||||||
| 4 | Focus on Employees, Culture and ESG Initiatives | |||||||||||||
1.
Expand Total Addressable Market ("TAM")
In December 2021, we doubled our TAM when we acquired EVERFI, an industry leader in global social impact technology. Adding EVERFI advances our position as a leader in the rapidly evolving ESG and CSR spaces and offers cross-selling and upselling opportunities through complementary product offerings with YourCause® solutions. Our TAM now stands at over $20 billion, and we remain active in the evaluation of opportunities to further expand our addressable market through acquisitions and internal product development.
|
26
|
|
Third Quarter 2022 Form 10-Q
|
||||||
2.
Lead with World Class Teams and Operations
This strategy expands upon our previous strategies to drive sales effectiveness and improve operating efficiency to include improving overall company performance as measured by the Rule of 40 (see discussion of Non-GAAP Financial Measures below). Recently, we announced a series of strategic organizational updates to streamline our business operations and become even more customer centric. We created three new roles: Chief Operating Officer, Chief Commercial Officer and Executive Vice President of Corporations. We believe these new roles will: ensure consistency in our approach to the customer experience; further streamline and simplify our go-to-market efforts to maximize our outcomes as a global company; and further align our YourCause and EVERFI offerings and continue our investment in being the partner of choice for corporations focused on social responsibility and impact. Additionally, we recently
took steps to better align our workforce with our strategic priorities, including further elimination of open positions as well as the difficult decision to reduce our workforce (see additional discussion regarding our workforce reduction below).
We also appointed a new member to our board of directors, who brings over 20 years of experience in technology and cybersecurity to our board.
3.
Delight Customers with Innovative Cloud Solutions
During our recent annual user conference, bbcon, we shared how our purpose-built solutions bring together the capabilities essential to our customers in managing their data, making their teams more productive, motivating their audiences to act, and ultimately driving outcomes. During the third quarter, we also acquired Kilter, an intuitive, gamified, activity-based engagement app. We will initially pair Kilter with our Blackbaud TeamRaiser solution to serve nonprofits by expanding the ways they can engage with their supporters to prepare for their existing fundraising walks, runs and rides, and to create new types of engagement opportunities that are not tied to a specific date or place. Kilter will also provide a unique solution with YourCause CSRConnect platform for companies as employers take a more active role in supporting their employees’ health and wellness pursuits across their remote and distributed workforces.
4.
Focus on Employees, Culture and ESG Initiatives
We recently announced that we achieved carbon neutrality for 2021. This is a goal we have been striving towards and our shift to a remote-first workforce enabled us to accelerate our timeline. Since 2019, Blackbaud has reduced its global real estate footprint by 50%, energy emissions to run office space by 63% and employee commute emissions by 75%. With a multi-pronged climate strategy, Blackbaud is focused on reducing emissions, using energy efficiently and investing in environmental projects for a more sustainable future. We shared more about our ESG strategy on our Corporate Social Responsibility website during the second quarter. Our mission driven culture has been in our DNA since inception and is very attractive in a competitive labor market. We continue to foster a diverse and inclusive environment focused on employee engagement and connectedness with our remote-first workforce strategy. We have a significant role to play in driving advances in the social good space, and we are proud of the strong corporate culture we have built and continue to cultivate in today's environment.
|
Third Quarter 2022 Form 10-Q
|
|
27
|
||||||
Financial Summary
| Total revenue ($M) | Income from operations ($M) | |||||||
| YoY Growth (%) | YoY Growth (%) | |||||||

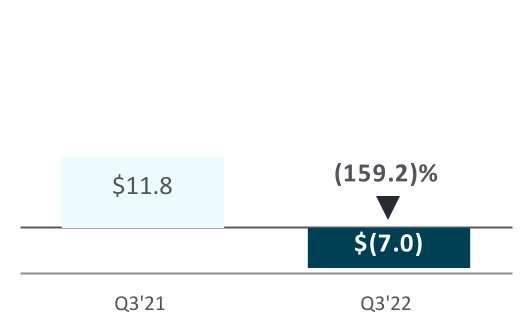
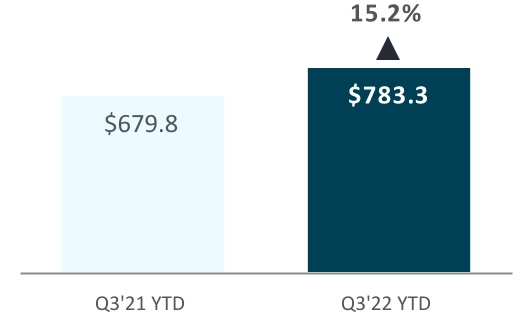
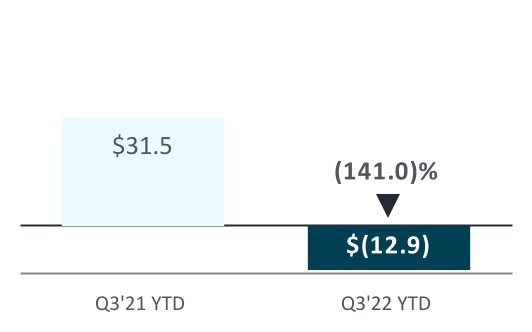
Total revenue increased by $30.1 million and $103.5 million during the three and nine months ended September 30, 2022, respectively, when compared to the same periods in 2021, driven largely by the following:
| + |
Growth in recurring revenue primarily related to:
•
increases in contractual recurring revenue of $27.7 million and $81.6 million, respectively, related to the performance of our cloud solutions, of which $23.7 million and $71.2 million, respectively, was attributable to EVERFI; partially offset by decreases in maintenance revenue as customers migrate to our cloud solutions and decreases related to fluctuations in foreign currency exchange rates of $1.3 million and $2.3 million, respectively; and
•
increases in transactional recurring revenue of $3.2 million and $22.7 million, respectively, primarily due to an increase in online charitable giving, an increase in enrollment for our Blackbaud Tuition Management solution resulting in a higher transactional volumes and, to a lesser extent, increased transactional volume as our customer's constituents have begun to return to in-person events. These increases in transactional recurring revenue were partially offset by decreases related to fluctuations in foreign currency exchange rates of $3.1 million and $5.5 million, respectively.
|
||||||||||
| - |
Decreases in one-time service and other revenue primarily related to:
•
decreases in one-time analytics revenue as analytics are generally integrated in our cloud solutions; partially offset by
•
increases in one-time consulting revenue due primarily to our acquisition of EVERFI, largely offset by a decrease in implementation and customization services, in line with our multi-year strategic shift from a license-based and one-time services business model to a cloud subscription business model. Our cloud subscription offerings generally require less implementation and customization services.
|
||||||||||
|
28
|
|
Third Quarter 2022 Form 10-Q
|
||||||
We currently expect that fluctuations in foreign currency exchange rates will have a significant negative impact on our total revenue for the full year 2022. While our year-to-date bookings for EVERFI continue to be lighter than expected, we have taken action to bolster management and fill account executive vacancies, which are now fully staffed and ramping to drive future bookings. Additionally, we currently expect one-time services and other revenue to modestly decrease during 2022 when compared to 2021, inclusive of incremental one-time revenue expected from EVERFI. We have a number of multi-year pricing initiatives underway, some to bring our pricing in line with the market while others are model changes that are expected to drive greater revenue for both us and our customers.
For additional information on the impact of foreign currency fluctuations on our financial results, see Foreign Currency Exchange Rates below on page
47
.
Income from operations decreased by $18.9 million and $44.5 million during the three and nine months ended September 30, 2022, respectively, when compared to the same periods in 2021, driven largely by the following:
| - |
Increases in compensation costs other than stock-based compensation of $20.7 million and $61.5 million, respectively, primarily due to increased employee headcount due to our acquisition of EVERFI
|
||||||||||
| - |
Increases in third-party contractor costs of $6.8 million and $21.6 million, respectively, and hosting costs of $1.0 million and $5.5 million, respectively, primarily attributable to our acquisition of EVERFI and, to a lesser extent, our continued migration of our cloud infrastructure to leading public cloud service providers and investments in cybersecurity
|
||||||||||
| - |
Increases in Security Incident-related expenses, net of insurance, of $12.8 million and $27.9 million, respectively. See "Security Incident update" below.
|
||||||||||
| - |
Increases in transaction-based costs of $2.9 million and $12.2 million, respectively, related to the increase in the volume of transactions for which we process payments
|
||||||||||
| - |
Increases in amortization of intangible assets from business combinations of $3.4 million and $10.8 million, respectively, due to our acquisition of EVERFI
|
||||||||||
| - |
Increases in infrastructure costs of $1.6 million and $5.8 million, respectively, primarily related to our acquisition of EVERFI and investments in security tools
|
||||||||||
| - |
Increases in acquisition and disposition-related costs of $2.4 million and $5.6 million, respectively, primarily related to a $2.0 million noncash impairment of certain insignificant intangible assets held for sale
|
||||||||||
| - |
Increases in marketing costs of $1.1 million and $5.0 million, respectively, primarily due to our acquisition of EVERFI
|
||||||||||
| - |
Increases in travel costs of $1.1 million and $3.7 million, respectively, due to our easing of restrictions on non-essential employee travel, which went into effect during March 2020 in response to the COVID-19 pandemic
|
||||||||||
| - |
A $2.3 million noncash impairment charge during the nine months ended September 30, 2022, against previously capitalized software development costs that reduced the carrying value of those assets to zero. The impairment charge resulted primarily from our decision to end customer support for certain solutions
|
||||||||||
| + |
Increases in total revenue, as described above
|
||||||||||
| + |
Decreases in stock-based compensation expense of $1.0 million and $5.8 million, respectively, attributable to:
•
A decrease in the grant date fair value of our annual equity awards granted to employees during 2022 compared to 2021; and
•
As a one-time response to COVID-19, replacement of our 2020 base salary merit increases with one-year time-based equity awards, which vested and were recognized as expense between May 1, 2020 and May 1, 2021.
|
||||||||||
We are continuing to make critical investments in the business in areas such as digital marketing, innovation, cybersecurity, customer success and our continued shift of cloud infrastructure to leading public cloud service providers. Our profitability through the third quarter reflects the addition of EVERFI and some of these incremental investments.
We have taken steps to better align our workforce with our strategic priorities to drive efficiencies and minimize any potential impacts from the current uncertain macroeconomic environment. This recently included further elimination of open positions as well as the decision to reduce our workforce. As a result of the workforce targeted reduction, we expect to incur between $6 million and $8 million in pre-tax employee severance costs primarily during the fourth quarter of 2022. We expect this workforce reduction and other cost actions will reduce our planned future pre-tax cost run rate by approximately $40 million
|
Third Quarter 2022 Form 10-Q
|
|
29
|
||||||
to $50 million beginning in 2023, partially offset by continued investments in cybersecurity and innovation. We see further opportunity in 2023 and beyond to scale our infrastructure costs, reduce overhead and execute pricing initiatives.
We continuously seek opportunities to optimize our portfolio of solutions to focus time and resources on innovation that will have the greatest impact for our customers and the markets we serve, and drive the highest return on investment. To that end, we will continue to simplify and rationalize our portfolio through product sunsets and divestitures of non-core businesses and technologies.
| Customer retention | ||||||||
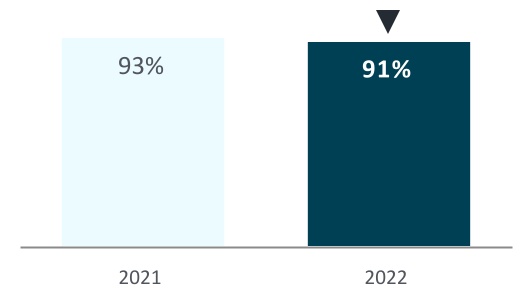
Our recurring revenue contracts are generally for a term of three years at contract inception with one to three-year renewals thereafter. We anticipate a continued decrease in maintenance contract renewals as we transition our solution portfolio and maintenance customers from a perpetual license-based model to a cloud subscription delivery model. In the long term, we also anticipate an increase in recurring subscription contract renewals as we continue focusing on innovation, quality and the integration of our cloud solutions, which we believe will provide value-adding capabilities to better address our customers' needs. Due primarily to these factors, we believe a recurring revenue customer retention measure that combines recurring subscription, maintenance and recurring service customer contracts provides a better representation of our customers' overall behavior. For the twelve
months ended September 30, 2022, approximately 91% of our customers with recurring revenue contracts were retained. This customer retention rate decreased from our rate for the full year ended December 31, 2021 and reflects our continuing efforts to rationalize our portfolio of solutions and migrate customers from legacy solutions towards our next generation solutions.
Balance sheet and cash flow
At September 30, 2022, our cash and cash equivalents were $31.4 million and the carrying amount of our debt under the 2020 Credit Facility was $795.5 million. Our net leverage ratio
was 3.10 to 1.00.
During the nine months ended September 30, 2022, we generated $189.8 million in cash from operations, had a net decrease in borrowings of $102.5 million, had aggregate cash outlays of $53.3 million for purchases of property and equipment and capitalized software and content development costs, and spent $20.9 million for our purchases of EVERFI and Kilter.
Security Incident update
As discussed in Note 10 to our unaudited, condensed consolidated financial statements included in this report, t
otal costs related to the Security Incident have exceeded the limit of our insurance coverage
. Accordingly, we expect that the Security Incident will continue to negatively impact our GAAP profitab
ility and GAAP cash flow for the foreseeable future (see discussion regarding our non-GAAP financial measures beginning on page
38
). Fo
r full year 2022, we currently expect net pre-tax expense of approximately $30 million to $35 million for ongoing legal fees related to the Security Incident. In line with our policy, legal fees are expensed as incurred. For full year 2022, we currently expect net cash outlays of approximately $15 million to $25 million for ongoing legal fees related to the Security Incident. As of September 30, 2022, we have recorded approximately $5.0 million in aggregate liabilities for a loss contingencies related to the Security Incident that we believe we can reasonably estimate. Certain of these recorded charges reflect the low end of a range of estimated losses based on our determination that no estimate within that range was better than any other amount. It is reasonably possible that actual losses in the future for those matters will be in excess of the amounts accrued, but we are unable at this time to reasonably estimate the possible additional loss. There are other Security Incident-related matters, including customer claims, customer constituent class actions and governmental investigations, for which we have not recorded a liability for a loss contingency as of September 30, 2022 because we are unable at this time to reasonably estimate the possible loss or range of loss.
|
30
|
|
Third Quarter 2022 Form 10-Q
|
||||||
| Results of Operations | ||
Comparison of the three and nine months ended September 30, 2022 and 2021
We have included the results of operations of acquired companies in our consolidated results of operations from the date of their respective acquisition. We determined that the EVERFI and Kilter acquisitions were not material to our consolidated financial statements; therefore, separate presentation of revenue and earnings since the acquisition date is not required.
Revenue and Cost of Revenue
| Recurring | ||||||||||||||
| Revenue ($M) | Cost of revenue ($M) |
Gross profit ($M)
and gross margin (%) |
||||||||||||
| YoY Growth (%) | YoY Growth (%) | |||||||||||||
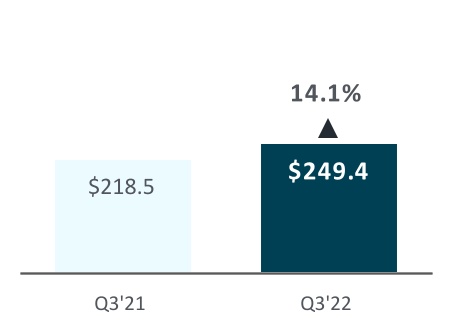
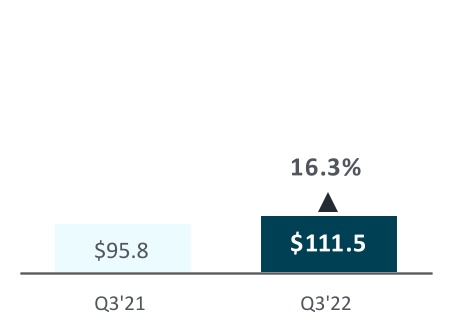
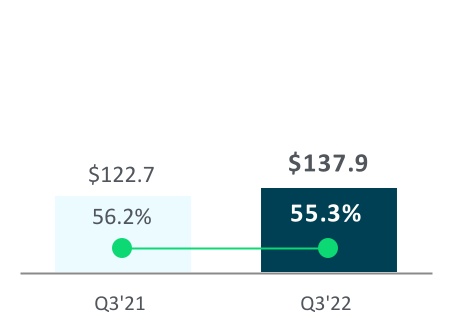
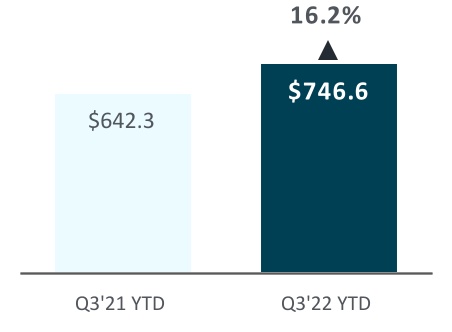
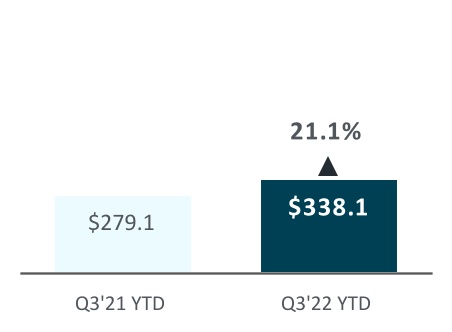
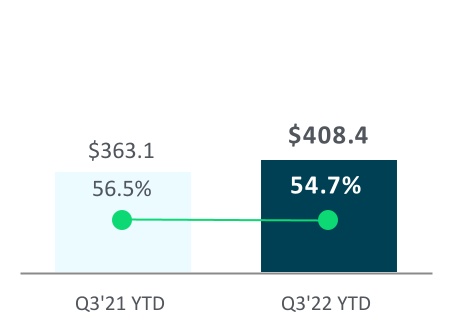
Recurring revenue is comprised of fees for the use of our subscription-based software solutions, which includes providing access to cloud solutions, Impact-as-a-Service
™
digital educational content, hosting services, payment services, online training programs, subscription-based analytic services. Recurring revenue also includes fees from maintenance services for our on-premises solutions, services included in our renewable subscription contracts, retained and managed services contracts that we expect to have a term consistent with our cloud solution contracts, and variable transaction revenue associated with the use of our solutions.
Cost of recurring revenue is primarily comprised of compensation costs for customer support and production IT personnel, hosting and data center costs, third-party contractor expenses, third-party royalty and data expenses, allocated depreciation, facilities and IT support costs, amortization of intangible assets from business combinations, amortization of software development costs, transaction-based costs related to payments services including remittances of amounts due to third-parties and other costs incurred in providing support and recurring services to our customers.
|
Third Quarter 2022 Form 10-Q
|
|
31
|
||||||
Our customers continue to prefer cloud subscription offerings with integrated analytics, training and payment services. Recurring subscription contracts are typically for a term of three years at contract inception with one to three-year renewals thereafter. We intend to continue focusing on innovation, quality and integration of our cloud solutions, which we believe will drive future revenue growth.
Recurring revenue increased by $30.9 million, or 14.1%, and $104.3 million, or 16.2%, during the three and nine months ended September 30, 2022, respectively, when compared to the same periods in 2021, driven primarily by the following:
| + |
Increases in contractual recurring revenue of $27.7 million and $81.6 million, respectively, related to the performance of our cloud solutions, of which $23.7 million and $71.2 million, respectively, was attributable to EVERFI; partially offset by decreases in maintenance revenue as customers migrate to our cloud solutions; also offsetting the increases in contractual recurring revenue were decreases related to fluctuations in foreign currency exchange rates of $1.3 million and $2.3 million, respectively
|
||||||||||
| + |
Increase in transactional recurring revenue of $3.2 million for the three months ended, September 30, 2022, primarily due to an increase in enrollment for our Blackbaud Tuition Management solution resulting in higher transactional volumes. The increase in transactional recurring revenue during the three months ended September 30, 2022, was partially offset by a decrease related to fluctuations in foreign currency exchange rates of $3.1 million
|
||||||||||
| + |
Increase in transactional recurring revenue of $22.7 million for the nine months ended September 30, 2022, primarily due to:
•
an increase in online charitable giving;
•
an increase in enrollment for our Blackbaud Tuition Management solution resulting in a higher transactional volumes; and
•
to a lesser extent, increased transactional volume as our customer's constituents have begun to return to in-person events.
The increase in transactional recurring revenue during the nine months ended September 30, 2022, was partially offset by a decrease related to fluctuations in foreign currency exchange rates of $5.5 million
|
||||||||||
For additional information on the impact of foreign currency fluctuations on our financial results, see Foreign Currency Exchange Rates below on page
47
.
Cost of recurring revenue increased by $15.7 million, or 16.3%, and $59.0 million, or 21.1%, during the three and nine months ended September 30, 2022, respectively, when compared to the same periods in 2021, driven primarily by the following:
| + |
Increases in compensation costs of $4.6 million and $17.4 million, respectively, primarily related to an increase in headcount due to our acquisition of EVERFI, and a continued shift in resources historically supporting one-time services and other towards recurring revenue
|
||||||||||
| + |
Increases in transaction-based costs of $2.9 million and $12.1 million, respectively, related to the increase in the volume of transactions for which we process payments
|
||||||||||
| + |
Increases in amortization of intangible assets from business combinations of $3.4 million and $10.5 million, respectively, due to our acquisition of EVERFI
|
||||||||||
| + |
Increase in third-party contractor and hosting costs of $7.5 million for the nine months ended September 30, 2022 as we continue to migrate our cloud infrastructure to leading public cloud service providers and make investments in security; currently, we expect our cloud infrastructure migration efforts and increased level of cybersecurity investments to continue for the foreseeable future
|
||||||||||
| + |
Increases in amortization of software development costs of $1.8 million and $4.1 million, respectively, due to our continued investments in the innovation and security of our solutions
|
||||||||||
| + |
Increase in allocated overhead costs of $3.2 million for the nine months ended September 30, 2022 related to the increased headcount discussed above
|
||||||||||
Recurring gross margin decreased by 0.9% and 1.8% for the three and nine months ended September 30, 2022, respectively, when compared to the same periods in 2021, primarily due to the increase in cost of recurring revenue outpacing the increase in recurring revenue.
|
32
|
|
Third Quarter 2022 Form 10-Q
|
||||||
| One-time services and other | ||||||||||||||
| Revenue ($M) | Cost of revenue ($M) |
Gross profit ($M)
and gross margin (%) |
||||||||||||
| YoY Growth (%) | YoY Growth (%) | |||||||||||||
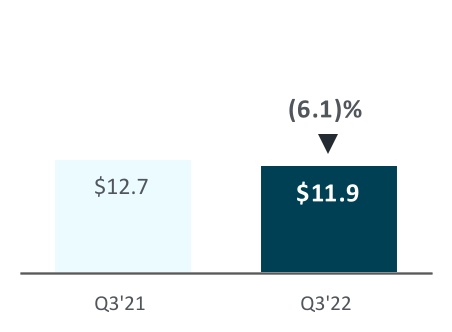
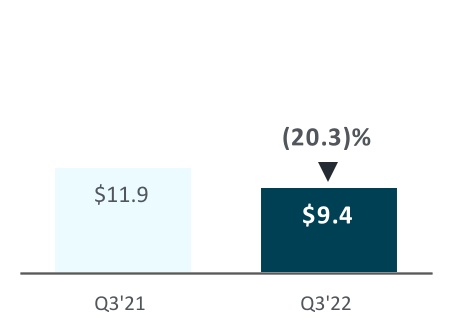
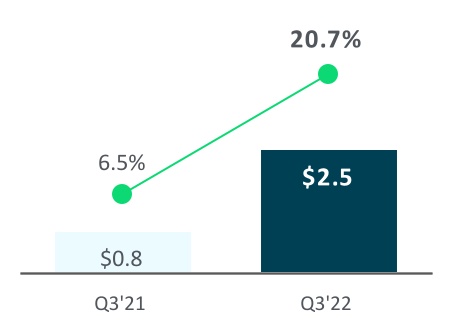
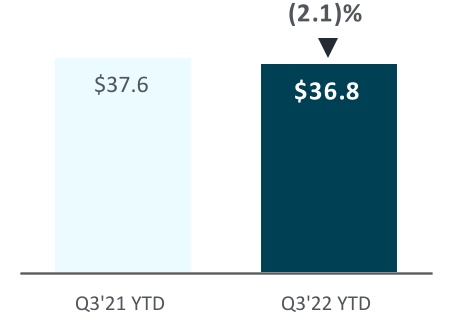
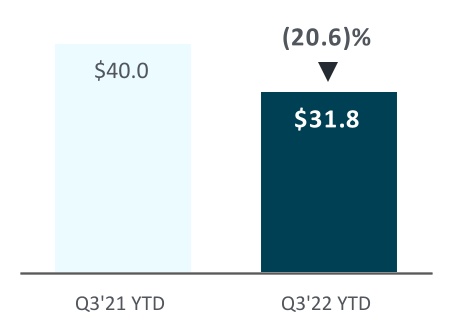
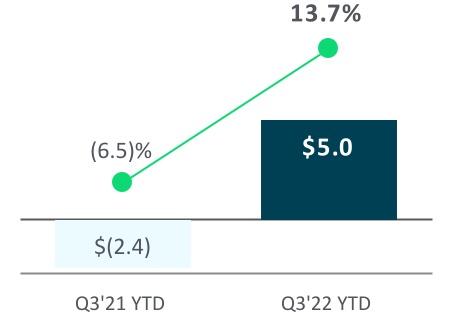
One-time services and other revenue is comprised of fees for one-time consulting, analytic and onsite training services, fees for retained and managed services contracts that we do not expect to have a term consistent with our cloud solution contracts, revenue from the sale of our software sold under perpetual license arrangements, and third-party software referral fees.
Cost of one-time services and other is primarily comprised of compensation costs for professional services and onsite training personnel, other costs incurred in providing onsite customer training, third-party contractor expenses, data expense incurred to perform one-time analytic services, third-party software royalties, allocated depreciation, facilities and IT support costs and amortization of intangible assets from business combinations.
One-time services and other revenue decreased by $0.8 million, or 6.1%, and $0.8 million, or 2.1%, during the three and nine months ended September 30, 2022, when compared to the same periods in 2021, driven primarily by the following:
| - |
Decreases in one-time analytics revenue of $0.5 million and $2.2 million, respectively, as analytics are generally integrated in our cloud solutions
|
||||||||||
| + |
Increases in one-time consulting revenue of $0.2 million and $1.9 million, respectively, primarily attributable to EVERFI, largely offset by less revenue from implementation and customization services, in line with our multi-year strategic shift from a license-based and one-time services business model to a cloud subscription business model. Our cloud subscription offerings generally require less implementation and customization services.
|
||||||||||
|
Third Quarter 2022 Form 10-Q
|
|
33
|
||||||
Cost of one-time services and other decreased by $2.4 million, or 20.3%, and $8.3 million, or 20.6%, during the three and nine months ended September 30, 2022, respectively, when compared to the same periods in 2021, driven primarily by the following:
| - |
Decreases in compensation costs of $1.4 million and $6.7 million, respectively, largely due to a continued shift in resources historically supporting one-time services and other towards recurring revenue as well as a decrease in professional services headcount
|
||||||||||
| - |
Decrease in allocated overhead costs of $1.4 million for the nine months ended September 30, 2022, primarily related to the decreased headcount discussed above
|
||||||||||
One-time services and other gross margin increased by 14.1% and 20.1% during the three and nine months ended September 30, 2022, respectively, when compared to the same periods in 2021, primarily due to the significant reductions in compensation costs discussed above.
Operating Expenses
|
Sales, marketing and
customer success ($M) |
Research and
development ($M) |
General and
administrative ($M) |
||||||||||||
| Percentages indicate expenses as a percentage of total revenue | ||||||||||||||

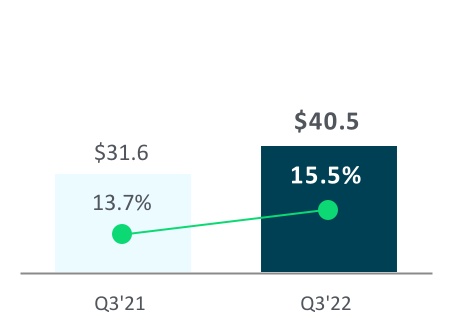
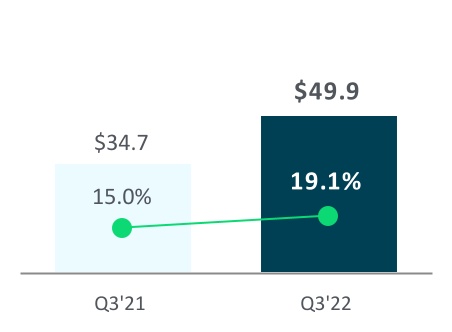
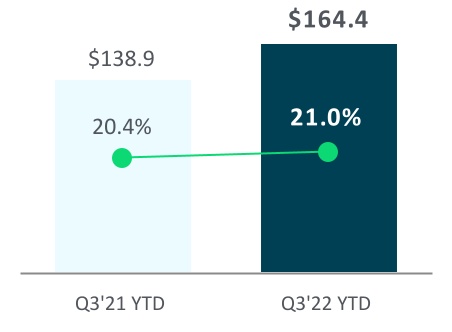
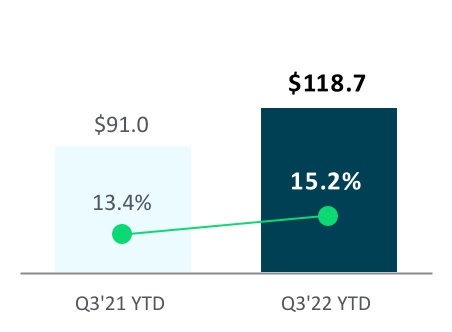
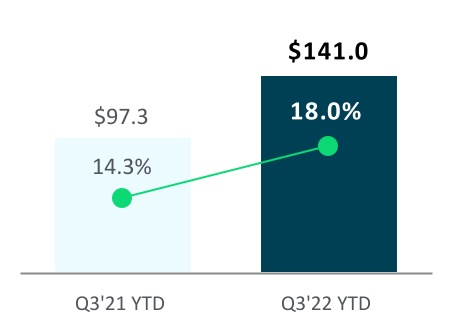
Sales, marketing and customer success
Sales, marketing and customer success expense includes compensation costs, variable sales commissions, travel-related expenses, advertising and marketing materials, public relations costs, variable reseller commissions and allocated depreciation, facilities and IT support costs.
We see a large market opportunity in the long-term and will continue to make investments to drive sales effectiveness. We have also implemented software tools to enhance our digital footprint and drive lead generation. The enhancements we are making in our go-to-market approach are expected to significantly reduce our average customer acquisition cost per customer as well as the related payback period while increasing sales velocity.
|
34
|
|
Third Quarter 2022 Form 10-Q
|
||||||
Sales, marketing and customer success expense increased by $11.7 million, or 26.2%, and $25.4 million, or 18.3%, during the three and nine months ended September 30, 2022, respectively, when compared to the same periods in 2021, primarily driven by the following:
| + |
Increases in compensation costs of $6.9 million and $14.6 million, respectively, primarily related to increased employee headcount due to our acquisition of EVERFI
|
||||||||||
| + |
Increases in third-party contractor costs of $2.5 million and $3.4 million, respectively, primarily related to strategic consulting
|
||||||||||
| + |
Increases in advertising costs of $1.1 million and $5.0 million, respectively, primarily due to our acquisition of EVERFI
|
||||||||||
| + |
Increase in travel costs of $1.6 million for the nine months ended September 30, 2022 due to our easing of restrictions on non-essential employee travel, which went into effect during March 2020 in response to the COVID-19 pandemic
|
||||||||||
| + |
Increase in software costs of $1.3 million for the nine months ended September 30, 2022 primarily related to our acquisition of EVERFI and our use of digital marketing tools
|
||||||||||
Research and development
Research and development expense includes compensation costs for engineering and product management personnel, third-party contractor expenses, software development tools and other expenses related to developing new solutions or upgrading and enhancing existing solutions that do not qualify for capitalization, and allocated depreciation, facilities and IT support costs.
We continue to make investments to delight our customers with innovative and secure cloud solutions. Research and development expenses increased by $8.9 million, or 28.1%, and $27.8 million or 30.5%, during the three and nine months ended September 30, 2022, respectively, when compared to the same periods in 2021, primarily driven by the following:
| + |
Increases in compensation costs of $7.9 million and $22.0 million, respectively, primarily related to increased employee headcount due to our acquisition of EVERFI, and to a lesser extent, our increased hiring of engineers
|
||||||||||
| + |
Increases in third-party contractor costs of $5.0 million and $16.0 million, respectively, primarily due to our acquisition of EVERFI and, to a lesser extent, an increase in our use of third-party software developers
|
||||||||||
| + |
Increase in allocated overhead costs of $2.1 million for the nine months ended September 30, 2022, primarily related to increased headcount discussed above
|
||||||||||
| - |
Increases in software development costs of $5.4 million and $14.5 million, respectively, that were required to be capitalized under GAAP, of which $5.2 million and $9.3 million was attributable to EVERFI software and content
|
||||||||||
Not included in research and development expense for the three months ended September 30, 2022 and 2021 were $15.1 million and $9.7 million, respectively, and for the nine months ended September 30, 2022 and 2021 were $43.6 million and $29.2 million, respectively, of qualifying costs associated with software and content development activities that are required to be capitalized under GAAP, such as those for our cloud solutions, as well as development costs associated with acquired companies. Qualifying capitalized development costs associated with our cloud solutions are subsequently amortized to cost
of subscriptions revenue over the related assets' estimated useful life, which generally range from three to seven years.
General and administrative
General and administrative expense consists primarily of compensation costs for general corporate functions, including senior management, finance, accounting, legal, human resources and corporate development, third-party professional fees, insurance, allocated depreciation, facilities and IT support costs, acquisition-related expenses and other administrative expenses.
|
Third Quarter 2022 Form 10-Q
|
|
35
|
||||||
General and administrative expense increased by $15.1 million or 43.6%, and $43.7 million, or 44.9%, during the three and nine months ended September 30, 2022, respectively, when compared to the same periods in 2021, primarily driven by the following:
| + |
Increases in Security Incident-related expenses, net of insurance, of $12.8 million and $27.9 million, respectively. See "Security Incident update" below on page
43
|
||||||||||
| + |
Increases in compensation costs of $1.8 million and $8.4 million, respectively, primarily related to increased employee headcount due to our acquisition of EVERFI
|
||||||||||
| + |
Increases in acquisition and disposition-related costs of $2.4 million and $5.6 million, respectively, primarily related to aggregate noncash impairment charges of $1.3 million against certain operating lease right-of-use assets and property and equipment assets resulting from our decision to cease using a portion of EVERFI's leased office space. During the nine months ended September 30, 2022, we also recorded a $2.0 million noncash impairment of certain insignificant intangible assets that were held for sale
|
||||||||||
| + |
A $2.3 million noncash impairment charge during the nine months ended September 30, 2022 against previously capitalized software development costs that reduced the carrying value of those assets to zero. The impairment charge resulted primarily from our decision to end customer support for certain solutions
|
||||||||||
| + |
Increase in rent expense of $1.7 million during the nine months ended September 30, 2022 primarily related to leases assumed from our acquisition of EVERFI
|
||||||||||
| + |
Increase in third-party contractor costs of $1.4 million during the nine months ended September 30, 2022
|
||||||||||
| + |
Increase in travel costs of $1.2 million during the nine months ended September 30, 2022 due to our easing of restrictions on non-essential employee travel, which went into effect during March 2020 in response to the COVID-19 pandemic
|
||||||||||
| - |
Increase in allocated corporate IT costs of $4.1 million during the nine months ended September 30, 2022 primarily related to investments in security tools. Depreciation, facilities and IT support costs are pooled and recorded to general and administrative expense and allocated to other lines of our condensed statements of comprehensive income based on headcount.
|
||||||||||
|
36
|
|
Third Quarter 2022 Form 10-Q
|
||||||
Interest Expense
| Interest expense ($M) | ||||||||
| Percentages indicate expenses as a percentage of total revenue | ||||||||
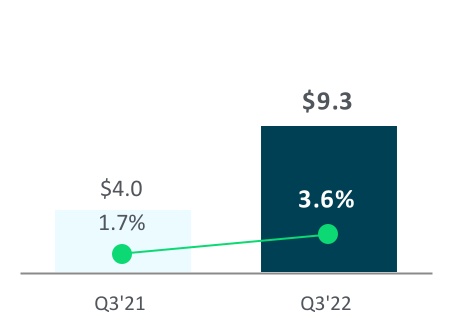
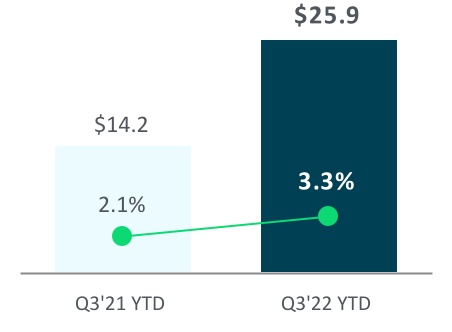
The increases in interest expense in dollars and as a percentage of total revenue during the three and nine months ended September 30, 2022, when compared to the same period in 2021, were primarily due to the new borrowings used to finance our acquisition of EVERFI. We currently expect interest expense for the full year 2022 to be approximately $34 million to $37 million although our interest expense in connection with the variable rate portion of our outstanding debt could increase in a rising interest rate environment. See Note 9 to our condensed consolidated financial statements in this report for more information regarding our derivative instruments, which we use to manage our variable interest rate risk, and Item 3. Quantitative and Qualitative Disclosures about Market Risk: Interest Rate Risk (below) for more information about our variable interest rate exposure and related risk.
Deferred Revenue
The table below compares the components of deferred revenue from our consolidated balance sheets:
| (dollars in millions) |
September 30,
2022 |
December 31,
2021 |
Change | ||||||||
|
Deferred revenue
(1)
|
$ | 396.6 | $ | 378.7 | 4.7 | % | |||||
| Less: Long-term portion | 2.9 | 4.2 | (31.2) | % | |||||||
|
Current portion
(1)
|
$ | 393.7 | $ | 374.5 | 5.1 | % | |||||
(1)
The individual amounts for each year may not sum to deferred revenue or current portion of deferred revenue due to rounding.
To the extent that our customers are billed for our solutions and services in advance of delivery, we record such amounts in deferred revenue. Our recurring revenue contracts are generally for a term of three years at contract inception, billed annually in advance, and non-cancelable. We have been for several years successfully shifting our legacy customer base away from annual renewals and moving them onto multi-year renewal contracts. We generally invoice our customers with recurring revenue contracts in annual cycles 30 days prior to the end of each one-year period.
The increase in deferred revenue during the nine months ended September 30, 2022 was primarily due to
a seasonal increase in customer contract renewals
. Historically, due to the timing of customer budget cycles, we have an increase in customer contract renewals at or near the beginning of our third quarter. Generally, our lowest balance of deferred revenue during the year is at the end of our first quarter.
|
Third Quarter 2022 Form 10-Q
|
|
37
|
||||||
Income Taxes
|
Income tax (benefit) provision ($M)
|
||||||||
| Percentages indicate effective income tax rates | ||||||||
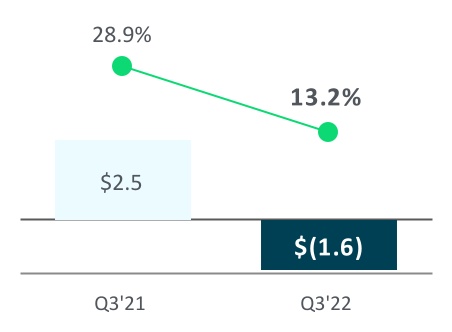
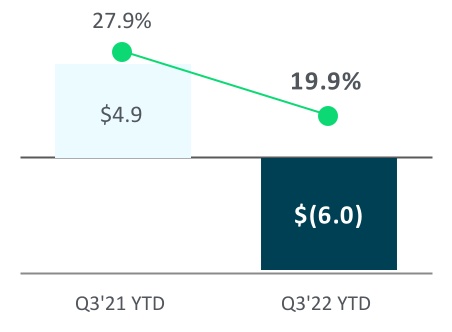
For the six months ended June 30, 2022, we utilized the discrete effective tax rate method, as allowed by ASC 740-270-30-18,
Income Taxes—Interim Reporting
, to calculate its interim income tax provision. The discrete method is applied when the application of the estimated annual effective tax rate is impractical because it is not possible to reliably estimate the annual effective tax rate. The discrete method treats the year-to-date period as if it was the annual period and determines the income tax expense or benefit on that basis. We believe that, at this time, the use of this discrete method is no longer more appropriate than the annual effective tax rate method.
The decreases in our effective income tax rate for the three and nine months ended September 30, 2022 when compared to the same periods in 2021 was primarily due to the effect of year-to-date losses relative to our forecasted permanent items, including foreign-derived intangible income deduction not generated in the prior year. Furthermore, the 2022 effective income tax rate was negatively impacted by expenses attributable to stock-based compensation.
Non-GAAP Financial Measures
The operating results analyzed below are presented on a non-GAAP basis. We use non-GAAP financial measures internally in analyzing our operational performance. Accordingly, we believe these non-GAAP measures are useful to investors, as a supplement to GAAP measures, in evaluating our ongoing operational performance. While we believe these non-GAAP measures provide useful supplemental information, non-GAAP financial measures should not be considered in isolation from, or as a substitute for, financial information prepared in accordance with GAAP. In addition, these non-GAAP financial measures may not be completely comparable to similarly titled measures of other companies due to potential differences in the exact method of calculation between companies.
The non-GAAP financial measures discussed below exclude the impact of certain transactions because we believe they are not directly related to our operating performance in any particular period, but are for our long-term benefit over multiple periods. We believe that these non-GAAP financial measures reflect our ongoing business in a manner that allows for meaningful period-to-period comparisons and analysis of trends in our business.
|
38
|
|
Third Quarter 2022 Form 10-Q
|
||||||
|
Three months ended
September 30,
|
Nine months ended
September 30,
|
||||||||||||||||||||||
| (dollars in millions, except per share amounts) |
2022
|
2021
|
Change |
2022
|
2021
|
Change | |||||||||||||||||
| GAAP Revenue | $ | 261.3 | $ | 231.2 | 13.0 | % | $ | 783.3 | $ | 679.8 | 15.2 | % | |||||||||||
| GAAP gross profit | $ | 140.4 | $ | 123.5 | 13.6 | % | $ | 413.4 | $ | 360.7 | 14.6 | % | |||||||||||
| GAAP gross margin | 53.7 | % | 53.4 | % | 52.8 | % | 53.1 | % | |||||||||||||||
| Non-GAAP adjustments: | |||||||||||||||||||||||
| Add: Stock-based compensation expense | 3.4 | 4.3 | (19.9) | % | 11.3 | 14.9 | (23.8) | % | |||||||||||||||
| Add: Amortization of intangibles from business combinations | 11.9 | 8.6 | 38.6 | % | 36.8 | 26.6 | 38.4 | % | |||||||||||||||
| Add: Employee severance | — | — | (335.7) | % | 0.3 | — | 1,100.0 | % | |||||||||||||||
|
Subtotal
(1)
|
15.3 | 12.9 | 18.8 | % | 48.5 | 41.5 | 16.8 | % | |||||||||||||||
|
Non-GAAP gross profit
(1)
|
$ | 155.7 | $ | 136.4 | 14.1 | % | $ | 461.9 | $ | 402.2 | 14.8 | % | |||||||||||
| Non-GAAP gross margin | 59.6 | % | 59.0 | % | 59.0 | % | 59.2 | % | |||||||||||||||
| GAAP (loss) income from operations | $ | (7.0) | $ | 11.8 | (159.2) | % | $ | (12.9) | $ | 31.5 | (141.0) | % | |||||||||||
| GAAP operating margin | (2.7) | % | 5.1 | % | (1.7) | % | 4.6 | % | |||||||||||||||
| Non-GAAP adjustments: | |||||||||||||||||||||||
|
Add: Stock-based compensation expense
|
27.9 | 28.9 | (3.4) | % | 83.7 | 89.5 | (6.5) | % | |||||||||||||||
|
Add: Amortization of intangibles from business combinations
|
12.6 | 9.2 | 37.2 | % | 39.1 | 28.3 | 38.2 | % | |||||||||||||||
|
Add: Employee severance
|
0.2 | 0.1 | 241.2 | % | 0.7 | 1.5 | (54.0) | % | |||||||||||||||
|
Add: Acquisition and disposition-related costs
(2)
|
2.5 | 0.1 | 4,812.0 | % | 5.7 | 0.1 | 6,943.2 | % | |||||||||||||||
|
Add: Restructuring and other real estate activities
|
— | (0.4) | (100.0) | % | 0.1 | (0.4) | (117.2) | % | |||||||||||||||
|
Add: Security Incident-related costs, net of insurance
(3)
|
13.7 | 0.9 | 1,504.9 | % | 29.2 | 1.3 | 2,109.3 | % | |||||||||||||||
|
Add: Impairment of capitalized software development costs
|
— | — | — | % | 2.3 | — | 100.0 | % | |||||||||||||||
|
Subtotal
(1)
|
56.9 | 38.6 | 47.2 | % | 160.7 | 120.3 | 33.6 | % | |||||||||||||||
|
Non-GAAP income from operations
(1)
|
$ | 49.8 | $ | 50.5 | (1.3) | % | $ | 147.7 | $ | 151.8 | (2.7) | % | |||||||||||
| Non-GAAP operating margin | 19.1 | % | 21.8 | % | 18.9 | % | 22.3 | % | |||||||||||||||
| GAAP (loss) income before provision for income taxes | $ | (11.9) | $ | 8.7 | (236.6) | % | $ | (30.1) | $ | 17.7 | (270.3) | % | |||||||||||
| GAAP net (loss) income | $ | (10.3) | $ | 6.2 | (266.8) | % | $ | (24.1) | $ | 12.8 | (289.3) | % | |||||||||||
| Shares used in computing GAAP diluted (loss) earnings per share | 51,692,152 | 48,274,072 | 7.1 | % | 51,519,340 | 48,259,956 | 6.8 | % | |||||||||||||||
| GAAP diluted (loss) earnings per share | $ | (0.20) | $ | 0.13 | (253.8) | % | $ | (0.47) | $ | 0.26 | (280.8) | % | |||||||||||
| Non-GAAP adjustments: | |||||||||||||||||||||||
| Add: GAAP income tax (benefit) provision | (1.6) | 2.5 | (162.6) | % | (6.0) | 4.9 | (221.2) | % | |||||||||||||||
| Add: Total non-GAAP adjustments affecting income from operations | 56.9 | 38.6 | 47.2 | % | 160.7 | 120.3 | 33.6 | % | |||||||||||||||
| Non-GAAP income before provision for income taxes | 45.0 | 47.3 | (5.0) | % | 130.5 | 138.0 | (5.4) | % | |||||||||||||||
|
Assumed non-GAAP income tax provision
(4)
|
9.0 | 9.5 | (5.0) | % | 26.1 | 27.6 | (5.4) | % | |||||||||||||||
|
Non-GAAP net income
(1)
|
$ | 36.0 | $ | 37.9 | (5.0) | % | $ | 104.4 | $ | 110.4 | (5.4) | % | |||||||||||
| Shares used in computing non-GAAP diluted earnings per share | 52,362,781 | 48,274,072 | 8.5 | % | 51,985,207 | 48,259,956 | 7.7 | % | |||||||||||||||
| Non-GAAP diluted earnings per share | $ | 0.69 | $ | 0.78 | (11.5) | % | $ | 2.01 | $ | 2.29 | (12.2) | % | |||||||||||
(1)
The individual amounts for each year may not sum to non-GAAP gross profit, subtotal, non-GAAP income from operations or non-GAAP net income due to rounding.
(2)
Includes a $2.0 million noncash impairment of intangible assets held for sale during the three and nine months ended September 30, 2022.
(3)
Includes Security Incident-related costs incurred during the three and nine months ended September 30, 2022 of $13.7 million and $31.1 million, respectively, net of insurance recoveries during the same periods of $— million and $1.9 million, respectively, and during the three and nine months ended September 30, 2021 of $11.4 million and $35.9 million, respectively, net of insurance recoveries during the same periods of $10.6 million and $34.6 million, respectively. Recorded expenses consisted primarily of payments to third-party service providers and consultants, including legal fees, as well as settlements of customer claims and accruals for certain loss contingencies. Not included in this adjustment were costs associated with enhancements to our cybersecurity program. For full year 2022, we currently expect net pre-tax expense of approximately $30 million to $35 million for ongoing legal fees related to the Security Incident. In line with our policy, legal fees are expensed as incurred. For full year 2022, we currently expect net cash outlays of approximately $15 million to $25 million for ongoing legal fees related to the Security Incident. There are some Security Incident-related matters for which we have not recorded a liability for a loss contingency as of September 30, 2022 because we are unable at this time to reasonably estimate the possible loss or range of loss.
(4)
We apply a non-GAAP effective tax rate of 20.0% when calculating non-GAAP net income and non-GAAP diluted earnings per share.
|
Third Quarter 2022 Form 10-Q
|
|
39
|
||||||
Non-GAAP organic revenue growth
In addition, we use non-GAAP organic revenue growth, non-GAAP organic revenue growth on a constant currency basis and non-GAAP organic recurring revenue growth, in analyzing our operating performance. We believe that these non-GAAP measures are useful to investors, as a supplement to GAAP measures, for evaluating the periodic growth of our business on a consistent basis. Each of these measures of non-GAAP organic revenue growth excludes incremental acquisition-related revenue attributable to companies acquired in the current fiscal year. For companies, if any, acquired in the immediately preceding fiscal year, each of these non-GAAP organic revenue growth measures reflects presentation of full year incremental non-GAAP revenue derived from such companies as if they were combined throughout the prior period. In addition, each of these non-GAAP organic revenue growth measures excludes prior period revenue associated with divested businesses. The exclusion of the prior period revenue is to present the results of the divested businesses within the results of the combined company for the same period of time in both the prior and current periods. We believe this presentation provides a more comparable representation of our current business’ organic revenue growth and revenue run-rate.
| (dollars in millions) |
Three months ended
September 30,
|
Nine months ended
September 30,
|
|||||||||||||||
|
2022
|
2021
|
2022
|
2021
|
||||||||||||||
| GAAP revenue | $ | 261.3 | $ | 231.2 | $ | 783.3 | $ | 679.8 | |||||||||
| GAAP revenue growth | 13.0 | % | 15.2 | % | |||||||||||||
|
Add: Non-GAAP acquisition-related revenue
(1)
|
— | 26.0 | — | 77.1 | |||||||||||||
|
Less: Non-GAAP revenue from divested businesses
(2)
|
— | (0.4) | — | (0.4) | |||||||||||||
| Total Non-GAAP adjustments | — | 25.6 | — | 76.7 | |||||||||||||
|
Non-GAAP organic revenue
(3)
|
$ | 261.3 | $ | 256.9 | $ | 783.3 | $ | 756.6 | |||||||||
| Non-GAAP organic revenue growth | 1.7 | % | 3.5 | % | |||||||||||||
|
Non-GAAP organic revenue
(3)
|
$ | 261.3 | $ | 256.9 | $ | 783.3 | $ | 756.6 | |||||||||
|
Foreign currency impact on Non-GAAP organic revenue
(4)
|
4.9 | — | 8.7 | — | |||||||||||||
|
Non-GAAP organic revenue on constant currency basis
(4)
|
$ | 266.2 | $ | 256.9 | $ | 792.1 | $ | 756.6 | |||||||||
| Non-GAAP organic revenue growth on constant currency basis | 3.6 | % | 4.7 | % | |||||||||||||
| GAAP recurring revenue | $ | 249.4 | $ | 218.5 | $ | 746.6 | $ | 642.3 | |||||||||
| GAAP recurring revenue growth | 14.1 | % | 16.2 | % | |||||||||||||
|
Add: Non-GAAP acquisition-related revenue
(1)
|
— | 22.8 | — | 68.8 | |||||||||||||
|
Less: Non-GAAP recurring revenue from divested businesses
(2)
|
— | (0.3) | — | (0.3) | |||||||||||||
| Total Non-GAAP adjustments | — | 22.5 | — | 68.4 | |||||||||||||
|
Non-GAAP organic recurring revenue
(3)
|
$ | 249.4 | $ | 241.0 | $ | 746.6 | $ | 710.7 | |||||||||
| Non-GAAP organic recurring revenue growth | 3.5 | % | 5.0 | % | |||||||||||||
|
Non-GAAP organic recurring revenue
(3)
|
$ | 249.4 | $ | 241.0 | $ | 746.6 | $ | 710.7 | |||||||||
|
Foreign currency impact on non-GAAP organic recurring revenue
(4)
|
4.4 | — | 7.8 | — | |||||||||||||
|
Non-GAAP organic recurring revenue on constant currency basis
(4)
|
$ | 253.8 | $ | 241.0 | $ | 754.4 | $ | 710.7 | |||||||||
| Non-GAAP organic recurring revenue growth on constant currency basis | 5.3 | % | 6.1 | % | |||||||||||||
(1)
Non-GAAP acquisition-related revenue excludes incremental acquisition-related revenue calculated in accordance with GAAP that is attributable to companies acquired in the current fiscal year. For companies acquired in the immediately preceding fiscal year, non-GAAP acquisition-related revenue reflects presentation of full-year incremental non-GAAP revenue derived from such companies, as if they were combined throughout the prior period.
(2)
Non-GAAP revenue from divested businesses excludes revenue associated with divested businesses. The exclusion of the prior period revenue is to present the results of the divested business with the results of the combined company for the same period of time in both the prior and current periods.
(3)
Non-GAAP organic revenue and non-GAAP organic recurring revenue for the prior year periods presented herein may not agree to non-GAAP organic revenue and non-GAAP organic recurring revenue presented in the respective prior period quarterly financial information solely due to the manner in which non-GAAP organic revenue growth and non-GAAP organic recurring revenue growth are calculated.
(4)
To determine non-GAAP organic revenue growth and non-GAAP organic recurring revenue growth on a constant currency basis, revenues from entities reporting in foreign currencies were translated to U.S. Dollars using the comparable prior period's quarterly weighted average foreign currency exchange rates. The primary foreign currencies creating the impact are the Australian Dollar, British Pound, Canadian Dollar and EURO.
|
40
|
|
Third Quarter 2022 Form 10-Q
|
||||||
Rule of 40
We previously defined Rule of 40 as non-GAAP organic revenue growth plus non-GAAP adjusted EBITDA margin. Non-GAAP adjusted EBITDA is defined as GAAP net income plus interest, net; income tax provision (benefit); depreciation; amortization of intangible assets from business combinations; amortization of software and content development costs; stock-based compensation; employee severance; acquisition and disposition-related costs; restructuring and other real estate activities; Security Incident-related costs, net of insurance; and impairment of capitalized software development costs. Beginning in the fiscal quarter ended June 30, 2022, we now also include in non-GAAP adjusted EBITDA impairment of capitalized software development costs because we believe it is not directly related to our operating performance in any particular period.
|
Three months ended
September 30,
|
Nine months ended
September 30,
|
||||||||||||||||||||||
| (dollars in millions) |
2022
|
2021
|
Change |
2022
|
2021
|
Change | |||||||||||||||||
| GAAP net (loss) income | $ | (10.3) | $ | 6.2 | (266.8) | % | $ | (24.1) | $ | 12.8 | (289.3) | % | |||||||||||
| Non-GAAP adjustments: | |||||||||||||||||||||||
| Add: Interest, net | 8.7 | 3.9 | 121.0 | % | 25.0 | 13.9 | 80.4 | % | |||||||||||||||
| Add: GAAP income tax (benefit) provision | (1.6) | 2.5 | (162.6) | % | (6.0) | 4.9 | (221.2) | % | |||||||||||||||
|
Add: Depreciation
|
3.5 | 3.1 | 12.2 | % | 10.6 | 9.5 | 12.2 | % | |||||||||||||||
| Add: Amortization of intangibles from business combinations | 12.6 | 9.2 | 37.2 | % | 39.1 | 28.3 | 38.2 | % | |||||||||||||||
|
Add: Amortization of software and content development costs
(1)
|
9.8 | 8.0 | 22.7 | % | 28.5 | 24.1 | 18.5 | % | |||||||||||||||
|
Subtotal
(2)
|
33.0 | 26.7 | 23.4 | % | 97.3 | 80.6 | 20.6 | % | |||||||||||||||
|
Non-GAAP EBITDA
(2)
|
$ | 22.6 | $ | 32.9 | (31.2) | % | $ | 73.1 | $ | 93.4 | (21.7) | % | |||||||||||
| Non-GAAP EBITDA margin | 8.7 | % | 9.3 | % | |||||||||||||||||||
| Non-GAAP adjustments: | |||||||||||||||||||||||
|
Add: Stock-based compensation expense
|
27.9 | 28.9 | (3.4) | % | 83.7 | 89.5 | (6.5) | % | |||||||||||||||
|
Add: Employee severance
|
0.2 | 0.1 | 241.2 | % | 0.7 | 1.5 | (54.0) | % | |||||||||||||||
|
Add: Acquisition and disposition-related costs
(3)
|
2.5 | 0.1 | 4,812.0 | % | 5.7 | 0.1 | 6,943.2 | % | |||||||||||||||
|
Add: Restructuring and other real estate activities
|
— | (0.4) | (100.0) | % | 0.1 | (0.4) | (117.2) | % | |||||||||||||||
|
Add: Security Incident-related costs, net of insurance
(3)
|
13.7 | 0.9 | 1,504.9 | % | 29.2 | 1.3 | 2,109.3 | % | |||||||||||||||
|
Add: Impairment of capitalized software development costs
|
— | — | — | % | 2.3 | — | 100.0 | % | |||||||||||||||
|
Subtotal
(2)
|
44.3 | 29.5 | 50.3 | % | 121.6 | 92.0 | 32.2 | % | |||||||||||||||
|
Non-GAAP Adjusted EBITDA
(2)
|
$ | 66.9 | $ | 62.4 | 7.3 | % | $ | 194.7 | $ | 185.4 | 5.0 | % | |||||||||||
| Non-GAAP Adjusted EBITDA margin | 25.6 | % | 24.9 | % | |||||||||||||||||||
|
Rule of 40
(4)
|
27.3 | % | 28.4 | % | |||||||||||||||||||
| Non-GAAP adjusted EBITDA | 66.9 | 62.4 | 7.3 | % | 194.7 | 185.4 | 5.0 | % | |||||||||||||||
|
Foreign currency impact on Non-GAAP adjusted EBITDA
(5)
|
2.8 | (1.1) | (357.5) | % | 5.0 | (3.3) | (249.6) | % | |||||||||||||||
|
Non-GAAP adjusted EBITDA on constant currency basis
(5)
|
$ | 69.8 | $ | 61.3 | 13.8 | % | $ | 199.7 | $ | 182.0 | 9.7 | % | |||||||||||
| Non-GAAP adjusted EBITDA margin on constant currency basis | 26.2 | % | 25.2 | % | |||||||||||||||||||
|
Rule of 40 on constant currency basis
(6)
|
29.8 | % | 29.9 | % | |||||||||||||||||||
(1)
Includes amortization expense related to software development costs and amortization expense from capitalized cloud computing implementation costs.
(2)
The individual amounts for each year may not sum to subtotal, non-GAAP EBITDA, non-GAAP adjusted EBITDA or non-GAAP adjusted EBITDA on a constant currency basis due to rounding.
(3)
See additional details in the reconciliation of GAAP to Non-GAAP operating income above.
(4)
Measured by non-GAAP organic revenue growth plus non-GAAP adjusted EBITDA margin. See Non-GAAP organic revenue growth table above.
(5)
To determine non-GAAP adjusted EBITDA on a constant currency basis, non-GAAP adjusted EBITDA from entities reporting in foreign currencies were translated to U.S. Dollars using the comparable prior period's quarterly weighted average foreign currency exchange rates. The primary foreign currencies creating the impact are the Australian Dollar, British Pound, Canadian Dollar and EURO.
(6)
Measured by non-GAAP organic revenue growth on constant currency basis plus non-GAAP adjusted EBITDA margin on constant currency basis. See Non-GAAP organic revenue growth table above.
|
Third Quarter 2022 Form 10-Q
|
|
41
|
||||||
Non-GAAP free cash flow and non-GAAP adjusted free cash flow
Non-GAAP free cash flow is defined as operating cash flow less capital expenditures, including costs required to be capitalized for software development, and capital expenditures for property and equipment.
Non-GAAP adjusted free cash flow is defined as operating cash flow less capital expenditures, including costs required to be capitalized for software development and capital expenditures for property and equipment, plus cash outflows, net of insurance, related to the Security Incident.
We believe non-GAAP free cash flow and non-GAAP adjusted free cash flow provides useful measures of the Company's operating performance. Non-GAAP adjusted free cash flow is not intended to represent and should not be viewed as the amount of residual cash flow available for discretionary expenditures.
|
Nine months ended
September 30,
|
|||||||||||
| (dollars in millions) |
2022
|
2021
|
Change | ||||||||
| GAAP net cash provided by operating activities | $ | 189.8 | $ | 169.8 | 11.8 | % | |||||
| Less: purchase of property and equipment | (10.5) | (8.3) | 26.2 | % | |||||||
| Less: capitalized software and content development costs | (42.8) | (29.7) | 44.2 | % | |||||||
|
Non-GAAP free cash flow
(1)
|
$ | 136.5 | $ | 131.8 | 3.6 | % | |||||
| Add: Security Incident-related cash flows, net of insurance | 9.5 | 4.5 | 109.6 | % | |||||||
|
Non-GAAP adjusted free cash flow
(1)
|
$ | 146.1 | $ | 136.3 | 7.1 | % | |||||
(1)
The individual amounts for each year may not sum to non-GAAP free cash flow or non-GAAP adjusted free cash flow due to rounding.
Seasonality
Our revenues normally fluctuate as a result of certain seasonal variations in our business. Our first quarter has historically been the seasonal low for bookings, with the second and fourth quarters historically being seasonally higher, and our bookings tend to be back-end loaded within individual quarters given our quarterly quota plans. Transactional revenue is non-contractual and less predictable given the susceptibility to certain drivers such as timing and number of events and marketing campaigns, as well as fluctuations in donation volumes and tuition payments. Our transactional revenue has historically been at its lowest in the first quarter due to the timing of customer fundraising initiatives and events. We have historically experienced seasonal highs during the fourth quarter due to year-end giving campaigns and during the second quarter when a large number of events are held. Our revenue from professional services has historically been lower in the first quarter when many of those services commence and in the fourth quarter due to the holiday season. As a result of these and other factors, our total revenue has historically been lower in the first quarter than in the remainder of our fiscal year, with the fourth quarter historically achieving the highest total revenue. Our expenses, other than transaction-based costs related to our payments services, do not vary significantly as a result of these factors, but do fluctuate on a quarterly basis due to varying timing of expenditures.
Our cash flow from operations normally fluctuates quarterly due to the combination of the timing of customer contract renewals including renewals associated with customers of acquired companies, delivery of professional services and occurrence of customer events, as well as merit-based salary increases, among other factors. Historically, due to lower revenues in our first quarter, combined with the payment of certain annual vendor contracts, our cash flow from operations has been lowest in our first quarter. Due to the timing of customer contract renewals and student enrollments, many of which take place at or near the beginning of our third quarter, our cash flow from operations has generally been lower in our second quarter as compared to our third and fourth quarters. Partially, offsetting these favorable drivers of cash flow from operations in our third and fourth quarters are base salary merit increases, which occur in July. In addition, deferred revenues can vary on a seasonal basis due to the timing of customer contract renewals and student enrollments or significant acquisitions. Our cash flow from financing is negatively impacted in our first quarter when most of our equity awards vest, as we pay taxes on behalf of our employees related to the settlement or exercise of equity awards.
These patterns may change as a result of the continued shift to online giving, growth in volume of transactions for which we process payments, large dollar customer bookings and contract renewals, or as a result of acquisitions, new market opportunities, new solution introductions, the COVID-19 pandemic or other factors.
|
42
|
|
Third Quarter 2022 Form 10-Q
|
||||||
| Liquidity and Capital Resources | ||
The following table presents selected financial information about our financial position:
| (dollars in millions) |
September 30,
2022 |
December 31,
2021 |
Change | ||||||||
| Cash and cash equivalents | $ | 31.4 | $ | 55.1 | (43.0) | % | |||||
| Property and equipment, net | 109.5 | 111.4 | (1.8) | % | |||||||
| Software and content development costs, net | 135.6 | 121.4 | 11.7 | % | |||||||
| Total carrying value of debt | 854.1 | 956.2 | (10.7) | % | |||||||
| Working capital | (323.5) | (258.7) | (25.1) | % | |||||||
The following table presents selected financial information about our cash flows:
|
Nine months ended September 30,
|
|||||||||||
| (dollars in millions) |
2022
|
2021
|
Change | ||||||||
| Net cash provided by operating activities | $ | 189.8 | $ | 169.8 | 11.8 | % | |||||
| Net cash used in investing activities | (67.8) | (38.0) | 78.4 | % | |||||||
| Net cash used in financing activities | (384.2) | (533.1) | (27.9) | % | |||||||
Our principal sources of liquidity are our operating cash flow, funds available under the 2020 Credit Facility and cash on hand. Our operating cash flow depends on continued customer renewal of our subscription and maintenance arrangements, market acceptance of our solutions and services, the volume and size of transactions for which we process payments and our customers' ability to pay. Based on current estimates of revenue and expenses, we believe that the currently available sources of funds and anticipated cash flows from operations will be adequate for at least the next twelve months to finance our operations, fund anticipated capital expenditures and meet our debt obligations. We also believe that we will be able to continue to meet our long-term cash requirements due to our anticipated cash flow from operations, solid financial position and ability to access capital from financial markets. To the extent we undertake future material acquisitions or, investments or unanticipated capital or operating expenditures, including in connection with the Security Incident, we may require additional capital. In that context, we regularly evaluate opportunities to enhance our capital structure, including through potential debt or equity issuances.
As a well-known seasoned issuer, we filed an automatic shelf registration statement for an undetermined amount of debt and equity securities with the SEC on January 14, 2022. Under this universal shelf registration statement we may offer and sell, from time to time, debt securities, common stock, preferred stock, depositary shares, warrants, stock purchase contracts and stock purchase units. Subject to certain conditions, this registration statement will be effective through January 13, 2024.
At September 30, 2022, our total cash and cash equivalents balance included approximately $15.9 million of cash that was held by operations outside the U.S. While these funds may not be needed to fund our U.S. operations for at least the next twelve months, if we need these funds, we may be required to accrue and pay taxes to repatriate the funds. We currently do not intend nor anticipate a need to repatriate our cash held outside the U.S.
Operating Cash Flow
Our cash flows from operations are derived principally from: (i) our earnings from on-going operations prior to non-cash expenses such as depreciation, amortization, stock-based compensation, deferred taxes, amortization of deferred financing costs and debt discount and adjustments to our provision for credit losses and sales returns; and (ii) changes in our working capital.
|
Third Quarter 2022 Form 10-Q
|
|
43
|
||||||
Working capital changes are composed of changes in accounts receivable, prepaid expenses and other assets, trade accounts payable, accrued expenses and other liabilities, and deferred revenue.
Net cash provided by operating activities increased by $20.0 million during the nine months ended September 30, 2022, when compared to the same period in 2021, primarily due to a $45.5 million decrease in net income adjusted for non-cash expenses and a $65.5 million increase in cash flow from operations associated with working capital.
The increase in cash flow from operations associated with working capital during the nine months ended September 30, 2022
, when compared to the same period in 2021, was primarily due to:
•
a seasonal increase in the collection of customer contract renewal billings and an increase in the collection of customer account balances from an aging improvement initiative;
•
a decrease in probable insurance recoveries related to the Security Incident as we have received payment for all of the related insurance claims;
•
an increase in taxes payable; and
•
fluctuations in the timing of vendor payments.
Workforce reduction
We have taken steps to better align our workforce with our strategic priorities to drive efficiencies and minimize any potential impacts from the current uncertain macroeconomic environment. This recently included further elimination of open positions as well as the decision to reduce our workforce. As a result of the workforce targeted reduction, we expect to incur between $6 million and $8 million in pre-tax employee severance costs primarily during the fourth quarter of 2022. We expect this workforce reduction and other cost actions will reduce our planned future pre-tax cost run rate by approximately $40 million to $50 million beginning in 2023, partially offset by continued investments in cybersecurity and innovation.
Security Incident update
As discussed in Note 10 to our unaudited, condensed consolidated financial statements included in this report, t
otal costs related to the Security Incident that we expect will be recoverable has exceeded the limit of our insurance coverage
. Accordingly, we expect that the Security Incident will continue to negatively impact our GAAP profitability and GAAP cash flow for the foreseeable future (see discussion regarding our non-GAAP financial measures beginning on page
38
). For full year 2022, we currently expect net pre-tax expense of approximately $30 million to $35 million for ongoing legal fees related to the Security Incident. In line with our policy, legal fees are expensed as incurred. For full year 2022, we currently expect net cash outlays of approximately $15 million to $25 million for ongoing legal fees related to the Security Incident. As of September 30, 2022, we have recorded approximately $5.0 million in aggregate liabilities for a loss contingencies related to the Security Incident that we believe we can reasonably estimate. Certain of these recorded charges reflect the low end of a range of estimated losses based on our determination that no estimate within that range was better than any other amount. It is reasonably possible that actual losses in the future for those matters will be in excess of the amounts accrued, but we are unable at this time to reasonably estimate the possible additional loss. There are other Security Incident-related matters, including customer claims, customer constituent class actions and governmental investigations, for which we have not recorded a liability for a loss contingency as of September 30, 2022 because we are unable at this time to reasonably estimate the possible loss or range of loss.
Investing Cash Flow
Net cash used in investing activities of $67.8 million increased by $29.8 million during the nine months ended September 30, 2022, when compared to the same period in 2021.
During the nine months ended September 30, 2022, we used $20.9 million of net cash for our acquisitions of EVERFI and Kilter, comprised primarily of (i) $17.4 million that had not been paid by EVERFI to its former option holders as of December 31, 2021, solely due to the timing of the acquisition on the last day of 2021; (ii) $2.9 million that was paid to acquire Kilter; and (iii) $2.6 million that was paid to a number of EVERFI's selling shareholders after determining they would be paid in cash, rather than shares of our common stock.
|
44
|
|
Third Quarter 2022 Form 10-Q
|
||||||
We used $42.8 million for software development costs, which was up $13.1 million from cash spent during the same period in 2021, primarily due to the inclusion of EVERFI's software and content development activities. We also spent $10.5 million of cash for purchases of property and equipment during the nine months ended September 30, 2022, which was an increase of $2.2 million when compared to the same period in 2021.
Financing Cash Flow
During the nine months ended September 30, 2022, we had a net decrease in borrowings of $102.5 million.
We paid $36.1 million to satisfy tax obligations of employees upon settlement of equity awards during the nine months ended September 30, 2022 compared to $39.0 million during the same period in 2021. The amount of taxes paid by us on behalf of employees related to the settlement of equity awards varies from period to period based upon the timing of grants and vesting, as well as the market price for shares of our common stock at the time of settlement. Most of our equity awards currently vest in our first quarter.
During the nine months ended September 30, 2022, cash flow from financing activities associated with changes in restricted cash due to customers decreased $243.1 million, compared to a decrease of $387.0 million during the same period in 2021. This line in the statement of cash flows represents the change in the amount of restricted cash held and payable by us to customers from one period to the next.
Stock repurchase program
In December 2021, our Board of Directors reauthorized and replenished our stock repurchase program that authorizes us to purchase up to $250.0 million of our outstanding shares of common stock. The program does not have an expiration date. Under the stock repurchase program, we are authorized to repurchase shares from time to time in accordance with applicable laws both on the open market, including under trading plans established pursuant to Rule 10b5-1 under the Securities Exchange Act of 1934, as amended, and in privately negotiated transactions. The timing and amount of repurchases depends on several factors, including market and business conditions, the trading price of our common stock and the nature of other investment opportunities. The repurchase program may be limited, suspended or discontinued at any time without prior notice. During the three and nine months ended September 30, 2022, we did not purchase any shares. The remaining amount available to purchase stock under the stock repurchase program was $250.0 million as of September 30, 2022.
2020 Credit Facility
Historically, we have drawn on our credit facility from time to time to help us meet financial needs, primarily due to the seasonality of our cash flows from operations and financing for business acquisitions. At September 30, 2022, our available borrowing capacity under the 2020 Credit Facility was $326.9 million. The 2020 Credit Facility matures in October 2025.
At September 30, 2022, the carrying amount of our debt under the 2020 Credit Facility was $795.5 million. Our average daily borrowings during the three and nine months ended September 30, 2022 were $834.7 million and $886.8 million, respectively.
The following is a summary of the financial covenants under the 2020 Credit Facility:
| Financial covenant | Requirement |
Ratio as of September 30, 2022
|
||||||
|
Net leverage ratio
(1)
|
≤ 4.25 to 1.00 | 3.10 to 1.00 | ||||||
| Interest coverage ratio | ≥ 2.50 to 1.00 | 9.42 to 1.00 | ||||||
(1)
Under the terms of the 2020 Credit Facility, the Net Leverage Ratio requirement may be increased by up to 0.50 provided we satisfy certain requirements, including a permitted business acquisition, and provided that the maximum Net Leverage Ratio shall not exceed 4.25 to 1.00.
Under the 2020 Credit Facility, we also have restrictions on our ability to declare and pay dividends and our ability to repurchase shares of our common stock. In order to pay any cash dividends and/or repurchase shares of stock: (i) no default or event of default shall have occurred and be continuing under the 2020 Credit Facility, and (ii) our pro forma net leverage ratio, as set forth in the 2020 Credit Facility, must be 0.25 less than the net leverage ratio requirement at the time of dividend declaration or share repurchase. At September 30, 2022, we were in compliance with our debt covenants under the 2020 Credit Facility. See Note 8 to our unaudited, condensed consolidated financial statements included in this report for additional information regarding the 2020 Credit Facility.
|
Third Quarter 2022 Form 10-Q
|
|
45
|
||||||
Commitments and Contingencies
| Payments due by period | |||||||||||
| (in millions) |
Less than
1 year |
More than
1 year |
Total
(1)
|
||||||||
| Recorded contractual obligations: | |||||||||||
| Debt | $ | 18.2 | $ | 839.3 | $ | 857.5 | |||||
| Operating leases | 10.4 | 55.4 | 65.9 | ||||||||
| Contingent consideration | — | 2.7 | 2.7 | ||||||||
| Unrecorded contractual obligations: | |||||||||||
| Purchase obligations | 55.1 | 180.9 | 236.0 | ||||||||
| Interest payments on debt | 33.2 | 102.6 | 135.9 | ||||||||
|
Total contractual obligations
(1)
|
$ | 116.9 | $ | 1,181.0 | $ | 1,297.9 | |||||
(1)
The individual amounts may not sum to the total due to rounding.
Debt
As of September 30, 2022, we had total remaining principal payments of $857.5 million. These payments represent principal payments only, under the following assumptions: (i) that the amounts outstanding under the 2020 Credit Facility, our real estate loans and our other debt at September 30, 2022 will remain outstanding until maturity, with minimum payments occurring as currently scheduled, and (ii) that there are no assumed future borrowings on the 2020 Revolving Facility for the purposes of determining minimum commitment amounts. See Note 8 to our unaudited, condensed consolidated financial statements in this report for more information.
Interest payments on debt
In addition to principal payments, as of September 30, 2022, we expect to pay interest expense over the life of our debt obligations of approximately $135.9 million. These payments represent our estimated future interest payments on debt using our debt balances and the related weighted average effective interest rates as of September 30, 2022, which includes the effect of interest rate swap agreements. The actual interest expense recognized in our consolidated statements of comprehensive income will depend on the amount of debt, the length of time the debt is outstanding and the interest rate, which could be different from our assumptions on our remaining principal payments described above.
Operating leases
As of September 30, 2022, we had remaining operating lease payments of $65.9 million. These payments have not been reduced by sublease income, incentive payments, reimbursement of leasehold improvements or the amount representing imputed interest of $11.3 million. Our operating leases are generally for corporate offices, subleased offices and certain equipment and furnit
ure. Given our remote-first workforce strategy and real estate footprint optimization efforts, as discussed above, we do not anticipate entering any new, material operating leases for offices for the foreseeable future. See Note 10 to our unaud
ited, condensed consolidated financial statements in this report for more information.
Purchase obligations
As of September 30, 2022, we had remaining purchase obligations of $236.0 million. These purchase obligations are for third-party technology used in our solutions and for other services we purchase as part of our normal operations. In certain cases, these arrangements require a minimum annual purchase commitment by us. Our purchase obligations are not recorded as liabilities on our consolidated balance sheets as of September 30, 2022, as we had not received the related services. See Note 10 to our unaudited, condensed consolidated financial statements in this report for more information.
The total liability for uncertain tax positions as of September 30, 2022 and December 31, 2021, was
$4.1 million
and
$3.7 million
, respectively. Our accrued interest and penalties related to tax positions taken on our tax returns was insignificant as of September 30, 2022 and December 31, 2021.
|
46
|
|
Third Quarter 2022 Form 10-Q
|
||||||
Contingent consideration
In connection with our acquisition of Kilter, we are obligated to pay contingent consideration upon the achievement of certain milestones. For information regarding our contingent consideration obligations, see Note 3 to our unaudited, condensed consolidated financial statements in this report.
| Foreign Currency Exchange Rates | ||
Approximately 16% of our total revenue for the nine months ended September 30, 2022 was generated from operations outside the U.S. We do not have significant operations in countries in which the economy is considered to be highly inflationary. Our consolidated financial statements are denominated in U.S. dollars and, accordingly, changes in the exchange rate between foreign currencies and the U.S. dollar will affect the translation of our subsidiaries’ financial results into U.S. dollars for purposes of reporting our consolidated financial results. The accumulated currency translation adjustment, recorded within accumulated other comprehensive income (loss) as a component of stockholders’ equity, was a loss of $22.8 million as of September 30, 2022 and income of $1.3 million as of December 31, 2021. We have entered into foreign currency forward contracts to hedge a portion of the foreign currency exposure that arises on translation of our investments denominated in British Pounds into U.S. dollars.
The vast majority of our contracts are entered into by our U.S. or U.K. entities. The contracts entered into by the U.S. entity are almost always denominated in U.S. dollars or Canadian dollars, and contracts entered into by our U.K., Australian and Irish subsidiaries are generally denominated in British Pounds, Australian dollars and Euros, respectively. Historically, as the U.S. dollar weakened, foreign currency translation resulted in an increase in our revenues and expenses denominated in non-U.S. currencies. Conversely, as the U.S. dollar strengthened, foreign currency translation resulted in a decrease in our revenue and expenses denominated in non-U.S. currencies. During the nine months ended September 30, 2022, foreign translation resulted in decreases in our revenues and expenses denominated in non-U.S. currencies. Though we have exposure to fluctuations in currency exchange rates, primarily those between the U.S. dollar and both the British Pound and Canadian dollar, the impact has generally not been material to our consolidated results of operations or financial position. However, we currently expect that fluctuations in foreign currency exchange rates will have a significant negative impact on our total revenue for the full year 2022. For the nine months ended September 30, 2022, the fluctuation in foreign currency exchange rates reduced our total revenue and our income from operations by $8.7 million and $2.2 million, respectively. We have entered into foreign currency forward contracts to hedge revenues denominated in the Canadian dollar against changes in the exchange rate with the U.S. dollar. We will continue monitoring such exposure and take action as appropriate. To determine the impacts on revenue (or income from operations) from fluctuations in currency exchange rates, current period revenues (or income from operations) from entities reporting in foreign currencies were translated into U.S. dollars using the comparable prior year period's weighted average foreign currency exchange rates. These impacts are non-GAAP financial information and are not in accordance with, or an alternative to, information prepared in accordance with GAAP.
| Critical Accounting Policies and Estimates | ||
There have been no significant changes in our critical accounting policies and estimates during the nine months ended September 30, 2022 as compared to those disclosed in “Management’s Discussion and Analysis of Financial Condition and Results of Operations” included in our Annual Report on Form 10-K for the fiscal year ended December 31, 2021.
| Recently Issued Accounting Pronouncements | ||
For a discussion of the impact that recently issued accounting pronouncements are expected to have on our financial position and results of operations when adopted in the future, see Note 2 to our unaudited, condensed consolidated financial statements in this report.
|
Third Quarter 2022 Form 10-Q
|
|
47
|
||||||
ITEM 3. QUANTITATIVE AND QUALITATIVE DISCLOSURES ABOUT MARKET RISK
We have market rate sensitivity for interest rates and foreign currency exchange rates.
| Interest Rate Risk | ||
Our variable rate debt is our primary financial instrument with market risk exposure for changing interest rates. We manage our variable rate interest rate risk through a combination of short-term and long-term borrowings and the use of derivative instruments entered into for hedging purposes. Our interest rate exposure includes SOFR rates. The Financial Conduct Authority in the U.K. has stated that it plans to phase out all tenors of LIBOR by June 2023. Our financial contracts that were indexed to LIBOR were modified to reference SOFR during the three months ended September 30, 2022. These modifications did not have a significant financial impact. Due to the nature of our debt, the materiality of the fair values of the derivative instruments and the highly liquid, short-term nature and level of our cash and cash equivalents as of September 30, 2022, we believe that the risk of exposure to changing interest rates for those positions is immaterial. There were no significant changes in how we manage interest rate risk between December 31, 2021 and September 30, 2022.
| Foreign Currency Risk | ||
For a discussion of our exposure to foreign currency exchange rate fluctuations, see “Management’s Discussion and Analysis of Financial Condition and Results of Operations — Foreign Currency Exchange Rates” in this report.
ITEM 4. CONTROLS AND PROCEDURES
| Evaluation of Disclosure Controls and Procedures | ||
Disclosure controls and procedures (as defined in Securities Exchange Act Rule 13a-15(e) and 15d-15(e)) are designed only to provide reasonable assurance that they will meet their objectives. As of the end of the period covered by this report, we carried out an evaluation, under the supervision and with the participation of our management, including our Chief Executive Officer (principal executive officer) and Chief Financial Officer (principal financial and accounting officer), of the effectiveness of our disclosure controls and procedures (as defined in Rule 13a-15(e) and 15d-15(e)) pursuant to Securities Exchange Act Rule 13a-15(b). Based upon that evaluation, our Chief Executive Officer and Chief Financial Officer have concluded that our disclosure controls and procedures are effective to provide the reasonable assurance discussed above.
| Changes in Internal Control Over Financial Reporting | ||
Although we do not believe it materially affected, or is reasonably likely to materially affect, our internal control over financial reporting, our evaluation of the effectiveness of internal control over financial reporting as of September 30, 2022 excluded EVERFI as permitted by the guidance issued by the Office of the Chief Accountant of the Securities and Exchange Commission (not to extend more than one year beyond the date of the acquisition or for more than one annual reporting period). The acquisition of EVERFI was completed on December 31, 2021. As of and for the quarter ended September 30, 2022, EVERFI's assets represented approximately 4% of our consolidated total assets and its revenue represented approximately 10% of our consolidated total revenue. We are working to integrate EVERFI into our overall internal control over financial reporting processes.
No changes in internal control over financial reporting occurred during the most recent fiscal quarter ended September 30, 2022 with respect to our operations, which have materially affected, or are reasonably likely to materially affect, our internal control over financial reporting.
|
48
|
|
Third Quarter 2022 Form 10-Q
|
||||||
|
|
PART II. OTHER INFORMATION | |||||||
ITEM 1. LEGAL PROCEEDINGS
For a discussion of our legal proceedings, see Note 10 to our unaudited, condensed consolidated financial statements in this report.
ITEM 1A. RISK FACTORS
We are supplementing Item 1A. Risk Factors in our Annual Report on Form 10-K for the year ended December 31, 2021, as filed with the Securities and Exchange Commission on March 1, 2022 (the “Annual Report”). The following risk factors should be read in conjunction with the risk factors set forth in that Annual Report.
| Operational Risks | ||
The Security Incident has had, and may continue to have, numerous adverse effects on our business, results of operations, financial condition and cash flows.
As previously disclosed, on July 16, 2020, we contacted certain customers to inform them about the Security Incident, including that in May 2020 we discovered and stopped a ransomware attack. Prior to our successfully preventing the cybercriminal from blocking our system access and fully encrypting files, and ultimately expelling them from our system with no significant disruption to our operations, the cybercriminal removed a copy of a subset of data from our self-hosted environment. Based on the nature of the incident, our research and third party (including law enforcement) investigation we believe that no data went beyond the cybercriminal, was or will be misused, or will be disseminated or otherwise made available publicly. However, our investigation into the Security Incident remains ongoing and may provide additional information.
To date, we have received approximately 260 Customer Reimbursement Requests and approximately 400 reservations of the right to seek expense recovery in the future from customers or their attorneys in the U.S., U.K. and Canada related to the Security Incident (none of which have as yet been filed in court). In June 2022, we also received notice of a proposed claim on behalf of a number of U.K. data subjects, which we are reviewing. In addition, insurance companies representing various customers’ interests through subrogation claims have contacted us, and one insurance company has filed a subrogation claim in court. Customer and insurer subrogation claims generally seek reimbursement of their costs and expenses associated with notifying their own customers of the Security Incident and taking steps to assure that personal information has not been compromised as a result of the Security Incident. In addition, presently, we are a defendant in 19 putative consumer class action cases [17 in U.S. federal courts (which have been consolidated under multi district litigation to a single federal court) and 2 in Canadian courts] alleging harm from the Security Incident. The plaintiffs in these cases, who generally purport to represent various classes of individual constituents of our customers, generally claim to have been harmed by alleged actions and/or omissions by us in connection with the Security Incident and assert a variety of common law and statutory claims seeking monetary damages, injunctive relief, costs and attorneys’ fees, and other related relief. To date, we also have received a consolidated, multi-state Civil Investigative Demand issued on behalf of 49 state Attorneys General and the District of Columbia and a separate Civil Investigative Demand from the office of the California Attorney General relating to the Security Incident. In addition, we are subject to pending governmental actions or investigations by the U.S. Federal Trade Commission, the U.S. Department of Health and Human Services, the SEC, the Office of the Australian Information Commissioner and the Office of the Privacy Commissioner of Canada. (See Note 10 to our unaudited, condensed consolidated financial statements included in this report for a more detailed description of the Security Incident and related matters.)
|
Third Quarter 2022 Form 10-Q
|
|
49
|
||||||
We may be named as a party in additional lawsuits, other claims may be asserted by or on behalf of our customers or their constituents, and we may be subject to additional governmental inquires, requests or investigations. Responding to and resolving these current and any future lawsuits, claims and/or investigations could result in material remedial and other expenses that will not be covered by insurance. For example, we have recorded approximately $5.0 million in aggregate liabilities for loss contingencies related to the Security Incident that we believe we can reasonably estimate as of September 30, 2022. Governmental authorities are likely to seek to impose undertakings, injunctive relief, consent decrees, or other civil or criminal penalties, which could, among other things, materially increase our data security costs or otherwise require us to alter how we operate our business. Although we intend to defend ourselves vigorously against the claims asserted against us, we cannot predict the potential outcomes, cost and expenses associated with current and any future claims, lawsuits, inquiries and investigations.
In addition, any legislative or regulatory changes adopted in reaction to the Security Incident or other companies’ data breaches could require us to make modifications to the operation of our business that could have an adverse effect and/or increase or accelerate our compliance costs.
Significant management time and Company resources have been, and are expected to continue to be, devoted to the Security Incident. For example, we currently expect net cash outlays of approximately $15 million to $25 million for ongoing legal fees related to the Security Incident for full year 2022. For full year 2022, we currently expect net pre-tax expense of approximately $30 million to $35 million for ongoing legal fees related to the Security Incident. Although we carry insurance against certain losses related to the Security Incident, we have exceeded the limit of that insurance coverage. As a result, we will be responsible for all expenses or other losses (including penalties, fines or other judgments) or all types of claims that may arise in connection with the Security Incident, which could materially and adversely affect our liquidity and results of operations. (See Note 10 to our unaudited, condensed consolidated financial statements included in this report.) If any such fines or penalties were great enough that we could not pay them through funds generated from operating activities and/or cause a default under the 2020 Credit Facility, we may be forced to renegotiate or obtain a waiver under the 2020 Credit Facility and/or seek additional debt or equity financing. Such renegotiation or financing may not be available on acceptable terms, or at all. In these circumstances, if we were unable to obtain sufficient financing, we may not be able to meet our obligations as they come due.
In addition, publicity or developments related to the Security Incident could in the future have a range of other adverse effects on our business or prospects, including causing or contributing to loss of customer confidence, reduced customer demand, reduced customer retention, strategic growth opportunities, and associated retention and recruiting difficulties, some or all of which could be material.
| Legal and Compliance Risks | ||
Anti-takeover provisions in our charter documents, our Stockholder Rights Agreement
(as described below, the "Rights Agreement")
and Delaware law may delay or prevent an acquisition of our Company.
Provisions of Delaware law, our certificate of incorporation and bylaws and our Rights Agreement may have the effect of delaying or preventing a change in control of our company or deterring tender offers for our common stock that other stockholders may consider in their best interests. Our certificate of incorporation authorizes “blank check” preferred stock, which could be issued by the board of directors without stockholder approval and may contain voting, liquidation, dividend and other rights superior to our common stock. Stockholder approval is not necessary to issue preferred stock in this manner. Issuance of these shares of preferred stock could have the effect of making it more difficult and more expensive for a person or group to acquire control of us, and could effectively be used as an anti-takeover device. Currently there are no shares of our preferred stock issued or outstanding. Our bylaws provide for an advance notice procedure for stockholders to nominate director candidates for election or to bring business before an annual meeting of stockholders, including proposed nominations of persons for election to our board of directors, and limit the persons who may call special meetings of stockholders.
|
50
|
|
Third Quarter 2022 Form 10-Q
|
||||||
On October 7, 2022, we declared a dividend of one preferred share purchase right (a “Right”) for each of our issued and outstanding shares of common stock. Each Right entitles the registered holder, subject to the terms of the Rights Agreement, to purchase from us one one-thousandth of a share of our Series A Junior Participating Preferred Stock, par value $0.001 per share (the “Preferred Stock”) at a price of $313.00, subject to certain adjustments (as adjusted from time to time, the “Exercise Price”). Under the Rights Agreement, the Rights will become exercisable if an entity, person or group acquires beneficial ownership of 20% or more of our outstanding common stock in a transaction not approved by our Board of Directors. In the event that the Rights become exercisable due to the ownership threshold being crossed, each Right will entitle its holder (other than the person, entity or group triggering the Rights Plan, whose rights will become void and will not be exercisable) to purchase additional shares of common stock having a then-current market value of twice the Exercise Price. Subject to the terms of the Rights Agreement, the Rights will expire on October 2, 2023. Additional information regarding the Rights Agreement is contained in a Form 8-K filed with the SEC on October 11, 2022.
The anti-takeover provisions of Delaware law and provisions in our organizational documents and the Rights Agreement may prevent our stockholders from receiving the benefit from any premium to the market price of our common stock offered by a bidder in a takeover context. Even in the absence of a takeover attempt, the existence of these provisions may adversely affect the prevailing market price of our common stock if they are viewed as discouraging takeover attempts in the future.
ITEM 2. UNREGISTERED SALES OF EQUITY SECURITIES AND USE OF PROCEEDS
| Issuer Purchases of Equity Securities | ||
The following table provides information about shares of common stock acquired or repurchased during the three months ended September 30, 2022 under the stock repurchase program then in effect, as well as common stock withheld by us to satisfy the minimum tax obligations of employees due upon vesting of restricted stock awards and units.
| Period |
Total
number
of shares
purchased
(1)
|
Average
price paid per share |
Total number
of shares
purchased as
part of
publicly
announced
plans or
programs
(2)
|
Approximate
dollar value of shares that may yet be purchased under the plans or programs (in thousands) |
|||||||||||||||||||
| Beginning balance, July 1, 2022 | $ | 250,000 | |||||||||||||||||||||
| July 1, 2022 through July 31, 2022 | — | $ | — | — | 250,000 | ||||||||||||||||||
| August 1, 2022 through August 31, 2022 | 8,218 | 55.40 | — | 250,000 | |||||||||||||||||||
| September 1, 2022 through September 30, 2022 | 42 | 45.75 | — | 250,000 | |||||||||||||||||||
| Total | 8,260 | $ | 55.36 | — | $ | 250,000 | |||||||||||||||||
(1)
Includes 8,260 shares (8,218 in August and 42 in September) withheld by us to satisfy the minimum tax obligations of employees due upon vesting of restricted stock awards and units. The level of this acquisition activity varies from period to period based upon the timing of award grants and vesting.
(2)
In December 2021, our Board of Directors reauthorized and replenished our stock repurchase program to authorize us to purchase up to $250.0 million of our outstanding shares of common stock. The program does not have an expiration date.
|
Third Quarter 2022 Form 10-Q
|
|
51
|
||||||
ITEM 6. EXHIBITS
The exhibits listed below are filed or incorporated by reference as part of this Quarterly Report on Form 10-Q:
| Filed In | ||||||||||||||||||||||||||||||||
|
Exhibit
Number |
Description of Document | Filed Herewith | Form | Exhibit Number | Filing Date | |||||||||||||||||||||||||||
| 8-K | 3.1 | 10/11/2022 | ||||||||||||||||||||||||||||||
| 8-K | 3.1 | 8/25/2022 | ||||||||||||||||||||||||||||||
| 8-K | 4.1 | 10/11/2022 | ||||||||||||||||||||||||||||||
| 8-K | 10.1 | 9/21/2022 | ||||||||||||||||||||||||||||||
| X | ||||||||||||||||||||||||||||||||
| X | ||||||||||||||||||||||||||||||||
| X | ||||||||||||||||||||||||||||||||
| X | ||||||||||||||||||||||||||||||||
| X | ||||||||||||||||||||||||||||||||
| 101.INS | Inline XBRL Instance Document - the Instance Document does not appear in the interactive data file because its XBRL tags are embedded within the Inline XBRL Document. | X | ||||||||||||||||||||||||||||||
| 101.SCH | Inline XBRL Taxonomy Extension Schema Document. | X | ||||||||||||||||||||||||||||||
| 101.CAL | Inline XBRL Taxonomy Extension Calculation Linkbase Document. | X | ||||||||||||||||||||||||||||||
| 101.DEF | Inline XBRL Taxonomy Extension Definition Linkbase Document. | X | ||||||||||||||||||||||||||||||
| 101.LAB | Inline XBRL Taxonomy Extension Label Linkbase Document. | X | ||||||||||||||||||||||||||||||
| 101.PRE | Inline XBRL Taxonomy Extension Presentation Linkbase Document. | X | ||||||||||||||||||||||||||||||
| 104 | Cover Page Interactive Data File (formatted as Inline XBRL and contained in Exhibit 101). | X | ||||||||||||||||||||||||||||||
|
52
|
|
Third Quarter 2022 Form 10-Q
|
||||||
|
|
SIGNATURES | |||||||
Pursuant to the requirements of the Securities Exchange Act of 1934, the Registrant has duly caused this Report to be signed on its behalf by the undersigned thereunto duly authorized.
| BLACKBAUD, INC. | |||||||||||
| Date: | November 3, 2022 | By: | /s/ Michael P. Gianoni | ||||||||
| Michael P. Gianoni | |||||||||||
| President and Chief Executive Officer | |||||||||||
| (Principal Executive Officer) | |||||||||||
| Date: | November 3, 2022 | By: | /s/ Anthony W. Boor | ||||||||
| Anthony W. Boor | |||||||||||
| Executive Vice President and Chief Financial Officer | |||||||||||
| (Principal Financial and Accounting Officer) | |||||||||||
|
Third Quarter 2022 Form 10-Q
|
|
53
|
||||||
TABLE OF CONTENTS
Part I. Financial InformationItem 1. Financial StatementsItem 2. Management's Discussion and Analysis Of Financial Condition and Results Of OperationsItem 3. Quantitative and Qualitative Disclosures About Market RiskItem 4. Controls and ProceduresPart II. Other InformationItem 1. Legal ProceedingsItem 1A. Risk FactorsItem 2. Unregistered Sales Of Equity Securities and Use Of ProceedsPart OfItem 6. Exhibits