UNITED STATES
SECURITIES AND EXCHANGE COMMISSION
Washington, D.C. 20549
FORM 10-Q
(Mark One)
|
☑
|
QUARTERLY REPORT PURSUANT TO SECTION 13 OR 15(d) OF THE SECURITIES
EXCHANGE ACT OF 1934
|
|
|
For the quarterly period ended September 30, 2018
|
or
|
☐
|
TRANSITION REPORT UNDER SECTION 13 OR 15(d) OF THE SECURITIES
EXCHANGE ACT OF 1934
|
|
|
For the transition period from __________________ to
__________________
|
Commission file number: 000-54887

Bright Mountain Media, Inc.
(Exact name of registrant as specified in its charter)
|
Florida
|
27-2977890
|
|
(State or other jurisdiction of incorporation or
organization)
|
(I.R.S. Employer Identification No.)
|
|
6400 Congress Avenue, Suite 2050, Boca Raton, Florida
|
33487
|
|
(Address of principal executive offices)
|
(Zip Code)
|
|
561-998-2440
|
|
(Registrant's telephone number, including area code)
|
|
not applicable
|
|
(
Former name, former address and former fiscal
year, if changed since last report)
|
Indicate by check mark whether the registrant (1)
has filed all reports required to be filed by Section 13 or 15(d)
of the Securities Exchange Act of 1934 during the preceding 12
months (or for such shorter period that the registrant was required
to file such reports), and (2) has been subject to such filing
requirements for the past 90 days.
☑
Yes
☐
No
Indicate by check
mark whether the registrant has submitted electronically every
Interactive Data File required to be submitted pursuant to Rule 405
of Regulation S-T (§232.405 of this chapter) during the
preceding 12 months (or for such shorter period that the registrant
was required to submit and post such files).
☑
Yes
☐
No
Indicate
by check mark whether the registrant is a large accelerated filer,
an accelerated filer, a non-accelerated filer, smaller reporting
company, or an emerging growth company. See the definitions of
“large accelerated filer,” “accelerated
filer,” “smaller reporting company,” and
“emerging growth company” in Rule 12b-2 of the Exchange
Act.
|
Large accelerated filer
|
☐
|
Accelerated filer
|
☐
|
|
Non-accelerated filer
|
☐
|
Smaller reporting company
|
☑
|
|
Emerging growth company
|
☑
|
|
|
If an emerging growth company, indicate by
checkmark if the registrant has elected not to use the extended
transition period for complying with any new or revised financial
accounting standards provided pursuant to Section 13(a) of the
Exchange Act.
☐
Indicate by check mark whether the registrant is a
shell company (as defined in Rule 12b-2 of the Exchange
Act)
☐
Yes
☑
No
As
of November 20, 2018 the registrant had 57,288,864 shares of its
common stock outstanding.
TABLE OF CONTENTS
|
|
|
Page No.
|
|
|
PART I - FINANCIAL INFORMATION
|
|
|
|
|
|
|
ITEM 1.
|
FINANCIAL STATEMENTS.
|
4
|
|
|
|
|
|
ITEM 2.
|
MANAGEMENT'S DISCUSSION AND ANALYSIS OF FINANCIAL CONDITION AND
RESULTS OF OPERATIONS.
|
26
|
|
|
|
|
|
ITEM 3.
|
QUANTITATIVE AND QUALITATIVE DISCLOSURES ABOUT MARKET
RISK.
|
33
|
|
|
|
|
|
ITEM 4.
|
CONTROLS AND PROCEDURES.
|
33
|
|
|
|
|
|
|
PART II - OTHER INFORMATION
|
|
|
|
|
|
|
ITEM 1.
|
LEGAL PROCEEDINGS.
|
34
|
|
|
|
|
|
ITEM 1A.
|
RISK FACTORS.
|
34
|
|
|
|
|
|
ITEM 2.
|
UNREGISTERED SALES OF EQUITY SECURITIES AND USE OF
PROCEEDS.
|
34
|
|
|
|
|
|
ITEM 3.
|
DEFAULTS UPON SENIOR SECURITIES.
|
34
|
|
|
|
|
|
ITEM 4.
|
MINE SAFETY DISCLOSURES.
|
34
|
|
|
|
|
|
ITEM 5.
|
OTHER INFORMATION.
|
35
|
|
|
|
|
|
ITEM 6.
|
EXHIBITS.
|
35
|
CAUTIONARY STATEMENT REGARDING FORWARD-LOOKING
INFORMATION
Various
statements in this report contain or may contain forward-looking
statements that are subject to known and unknown risks,
uncertainties and other factors which may cause actual results,
performance or achievements to be materially different from any
future results, performance or achievements expressed or implied by
such forward-looking statements. These forward-looking statements
were based on various factors and were derived from utilizing
numerous assumptions and other factors that could cause our actual
results to differ materially from those in the forward-looking
statements. These factors include, but are not limited
to:
●
our
history of losses and our ability to raise additional capital and
continue as a going concern;
●
our
ability to successfully integrate the operations of the Black
Helmet Apparel business;
●
our
ability to return revenues from our advertising segment to historic
levels;
●
a
failure to successfully transition to primarily advertising based
revenue model;
●
the
impact of seasonal fluctuations on our revenues;
●
once
established, our failure to detect advertising fraud;
2
●
our
dependence on our relationships with Amazon, Shopify and
PayPal;
●
our
dependence on a limited number of vendors;
●
our
dependence on our relationship with Google AdSense;
●
acquisitions
of new businesses and our ability to integrate those businesses
into our operations;
●
online
security breaches;
●
failure
to effectively promote our brand;
●
our
ability to protect our content;
●
our
ability to protect our intellectual property rights and our
proprietary content;
●
the
success of our technology development efforts;
●
additional
competition resulting from our business expansion
strategy;
●
liability
related to content which appears on our websites;
●
regulatory
risks;
●
dependence
on executive officers and certain key employees and
consultants;
●
our
ability to hire qualified personnel;
●
third
party content;
●
possible
problems with our network infrastructure;
●
the
historic illiquid nature of our common stock;
●
risks
associated with securities litigation;
●
material
weaknesses in our internal control over financial
reporting;
3
●
the
lack of cash dividends on our common stock;
●
provisions
of our charter and Florida law which may have anti-takeover
effects;
●
the
impact of diversion of management’s time and increased legal
fees as we pursue the litigation against the former owners of Daily
Engage Media.
Most of these factors are difficult to predict accurately and are
generally beyond our control. You should consider the areas of risk
described in connection with any forward-looking statements that
may be made herein. Readers are cautioned not to place undue
reliance on these forward-looking statements and readers should
carefully review this report, including the Part II, Item 2, our
Annual Report on Form 10-K for the year ended December 31, 2017, as
filed with the Securities and Exchange Commission on April 2, 2018
and our other filings with the Securities and Exchange Commission
in their entirety. Except for our ongoing obligations to disclose
material information under the Federal securities laws, we
undertake no obligation to release publicly any revisions to any
forward-looking statements, to report events or to report the
occurrence of unanticipated events. These forward-looking
statements speak only as of the date of this report, and you should
not rely on these statements without also considering the risks and
uncertainties associated with these statements and our
business.
OTHER PERTINENT INFORMATION
Unless
specifically set forth to the contrary, when used in this report
the terms “Bright Mountain”, the “Company,”
“we”, “us”, “our” and similar
terms refer to Bright Mountain Media, Inc., a Florida corporation,
and its subsidiaries. In addition, when used in this report,
“third quarter of 2018” refers to the three months
ended September 30, 2018, "third quarter of 2017" refers to the
three months ended September 30, 2017, “2018” refers to
the year ending December 31, 2018 and “2017” refers to
the year ended December 31, 2017. The information which appears on
our website at
www.brightmountainmedia.com
is not part of
this report.
4
|
|
|
||||||||||
|
|
|
|
|
|
|
|
|
|
|
||
|
|
|
|
|
|
|
|
|
|
|
||
|
BRIGHT MOUNTAIN MEDIA, INC. AND SUBSIDIARIES
|
|
||||||||||
|
|
|
||||||||||
|
|
|
|
|
|
|
|
|
|
|
||
|
|
|
September 30,
|
|
|
December 31,
|
|
|
|
|
||
|
|
|
2018
|
|
|
2017
|
|
|
|
|
||
|
|
|
(unaudited)
|
|
|
|
|
|
|
|
||
|
ASSETS
|
|
|
|
|
|
|
|
|
|
||
|
Current assets
|
|
|
|
|
|
|
|
|
|
||
|
Cash and Cash Equivalents
|
|
$
|
553,411
|
|
|
$
|
140,022
|
|
|
|
|
|
Accounts Receivable, net
|
|
|
693,253
|
|
|
|
879,770
|
|
|
|
|
|
Inventories, net
|
|
|
356,357
|
|
|
|
611,468
|
|
|
|
|
|
Prepaid Expenses and Other Current Assets,
net
|
|
|
343,833
|
|
|
|
145,732
|
|
|
|
|
|
Total current
assets
|
|
|
1,946,854
|
|
|
|
1,776,992
|
|
|
|
|
|
Property and Equipment, net
|
|
|
68,702
|
|
|
|
89,500
|
|
|
|
|
|
Website Acquisition Assets, net
|
|
|
192,535
|
|
|
|
393,417
|
|
|
|
|
|
Intangible Assets, net
|
|
|
561,023
|
|
|
|
967,774
|
|
|
|
|
|
Goodwill
|
|
|
988,926
|
|
|
|
446,426
|
|
|
|
|
|
Prepaid Services and Consulting Agreements
– Long Term
|
|
|
1,240,000
|
|
|
|
—
|
|
|
|
|
|
Other Assets
|
|
|
40,670
|
|
|
|
44,608
|
|
|
|
|
|
Total assets
|
|
$
|
5,038,710
|
|
|
$
|
3,718,717
|
|
|
|
|
|
|
|
|
0
|
|
|
|
|
|
|
|
|
|
LIABILITIES AND SHAREHOLDERS'
EQUITY
|
|
|
|
|
|
|
|
|
|
|
|
|
Current liabilities
|
|
|
|
|
|
|
|
|
|
|
|
|
Accounts Payable
|
|
$
|
628,920
|
|
|
$
|
1,172,827
|
|
|
|
|
|
Accrued Expenses
|
|
|
303,478
|
|
|
|
90,000
|
|
|
|
|
|
Accrued Interest – Related Party
|
|
|
16,550
|
|
|
|
—
|
|
|
|
|
|
Premium Finance Loan Payable
|
|
|
11,092
|
|
|
|
63,133
|
|
|
|
|
|
Deferred Rent - Short Term
|
|
|
3,097
|
|
|
|
2,468
|
|
|
|
|
|
Deferred Revenues
|
|
|
5,965
|
|
|
|
9,735
|
|
|
|
|
|
Long Term Debt, Current Portion
|
|
|
384,034
|
|
|
|
767,071
|
|
|
|
|
|
Total current
liabilities
|
|
|
1,353,136
|
|
|
|
2,105,234
|
|
|
|
|
|
|
|
|
|
|
|
|
|
|
|
|
|
|
Long term Deferred Rent
|
|
|
14,454
|
|
|
|
16,418
|
|
|
|
|
|
Long Term Debt to Related Parties, net
|
|
|
1,351,186
|
|
|
|
1,198,893
|
|
|
|
|
|
Long Term Debt, net of Current Portion
|
|
|
—
|
|
|
|
54,950
|
|
|
|
|
|
Total liabilities
|
|
|
2,718,776
|
|
|
|
3,375,495
|
|
|
|
|
|
Commitments and contingencies
|
|
|
|
|
|
|
|
|
|
|
|
|
Shareholders' Equity
|
|
|
|
|
|
|
|
|
|
|
|
|
Preferred Stock, par value $0.01, 20,000,000
shares authorized,
|
|
|
|
|
|
|
|
|
|
|
|
|
Series A, 2,000,000 shares
designated, 100,000 and
|
|
|
|
|
|
|
|
|
|
|
|
|
100,000
shares issued and outstanding
|
|
|
1,000
|
|
|
|
1,000
|
|
|
|
|
|
Series B, 1,000,000 shares
designated, 0 and
|
|
|
|
|
|
|
|
|
|
|
|
|
0 shares
issued and outstanding
|
|
|
—
|
|
|
|
—
|
|
|
|
|
|
Series C, 2,000,000 shares
designated, 0 and
|
|
|
|
|
|
|
|
|
|
|
|
|
0 shares
issued and outstanding
|
|
|
—
|
|
|
|
—
|
|
|
|
|
|
Series D, 2,000,000 shares
designated, 0 and
|
|
|
|
|
|
|
|
|
|
|
|
|
0 shares
issued and outstanding
|
|
|
—
|
|
|
|
—
|
|
|
|
|
|
Series E, 2,500,000 shares
designated,
|
|
|
|
|
|
|
|
|
|
|
|
|
2,312,500 and
1,375,000 issued and outstanding
|
|
|
23,125
|
|
|
|
13,750
|
|
|
|
|
|
Common stock, par value $0.01, 324,000,000 shares
authorized,
|
|
|
|
|
|
|
|
|
|
|
|
|
57,288,864 and 46,168,864
issued and outstanding
|
|
|
572,889
|
|
|
|
461,689
|
|
|
|
|
|
Additional Paid-In Capital
|
|
|
16,295,502
|
|
|
|
11,685,685
|
|
|
|
|
|
Accumulated Deficit
|
|
|
(14,572,582
|
)
|
|
|
(11,818,902
|
)
|
|
|
|
|
Total shareholders'
equity
|
|
|
2,319,934
|
|
|
|
343,222
|
|
|
|
|
|
Total liabilities and shareholders' equity
|
|
$
|
5,038,710
|
|
|
$
|
3,718,717
|
|
|
|
|
See accompanying notes to unaudited condensed consolidated
financial statements
5
|
BRIGHT MOUNTAIN MEDIA, INC. AND SUBSIDIARIES
|
|
||||||||||||||||||
|
|
|
||||||||||||||||||
|
(Unaudited)
|
|
||||||||||||||||||
|
|
|
|
|
|
|
|
|
|
|
|
|
|
|
|
|
||||
|
|
|
For the Three Months Ended
|
|
|
For the Nine Months Ended
|
|
|
|
|
||||||||||
|
|
|
September 30,
|
|
|
September 30,
|
|
|
|
|
||||||||||
|
|
|
2018
|
|
|
2017
|
|
|
2018
|
|
|
2017
|
|
|
|
|
||||
|
Revenues
|
|
|
|
|
|
|
|
|
|
|
|
|
|
|
|
||||
|
Advertising
|
|
$
|
185,417
|
|
|
$
|
126,098
|
|
|
$
|
1,159,751
|
|
|
$
|
329,731
|
|
|
|
|
|
Product
|
|
|
203,485
|
|
|
|
589,402
|
|
|
|
897,536
|
|
|
|
1,713,688
|
|
|
|
|
|
Total revenues
|
|
|
388,902
|
|
|
|
715,500
|
|
|
|
2,057,287
|
|
|
|
2,043,419
|
|
|
|
|
|
|
|
|
|
|
|
|
|
|
|
|
|
|
|
|
|
|
|
|
|
|
Cost of revenue
|
|
|
|
|
|
|
|
|
|
|
|
|
|
|
|
|
|
|
|
|
Advertising
|
|
|
117,175
|
|
|
|
11,669
|
|
|
|
810,744
|
|
|
|
24,031
|
|
|
|
|
|
Product
|
|
|
142,234
|
|
|
|
387,360
|
|
|
|
672,751
|
|
|
|
1,116,465
|
|
|
|
|
|
Total cost of revenue
|
|
|
259,409
|
|
|
|
399,029
|
|
|
|
1,483,495
|
|
|
|
1,140,496
|
|
|
|
|
|
Gross profit
|
|
|
129,493
|
|
|
|
316,471
|
|
|
|
573,792
|
|
|
|
902,923
|
|
|
|
|
|
|
|
|
|
|
|
|
|
|
|
|
|
|
|
|
|
|
|
|
|
|
Selling, general and administrative expenses
|
|
|
883,478
|
|
|
|
797,268
|
|
|
|
2,985,391
|
|
|
|
2,746,236
|
|
|
|
|
|
|
|
|
|
|
|
|
|
|
|
|
|
|
|
|
|
|
|
|
|
|
Loss from
operations
|
|
|
(753,985
|
)
|
|
|
(480,797
|
)
|
|
|
(2,411,599
|
)
|
|
|
(1,843,313
|
)
|
|
|
|
|
|
|
|
|
|
|
|
|
|
|
|
|
|
|
|
|
|
|
|
|
|
Other income (expense)
|
|
|
|
|
|
|
|
|
|
|
|
|
|
|
|
|
|
|
|
|
Interest income
|
|
|
1,153
|
|
|
|
232
|
|
|
|
2,169
|
|
|
|
451
|
|
|
|
|
|
Interest expense
|
|
|
(16,014
|
)
|
|
|
(5,912
|
)
|
|
|
(41,217
|
)
|
|
|
(75,663
|
)
|
|
|
|
|
Interest expense - related party
|
|
|
(101,526
|
)
|
|
|
(95,478
|
)
|
|
|
(303,033
|
)
|
|
|
(220,610
|
)
|
|
|
|
|
Total other income
(expense)
|
|
|
(116,387
|
)
|
|
|
(101,158
|
)
|
|
|
(342,081
|
)
|
|
|
(295,822
|
)
|
|
|
|
|
|
|
|
|
|
|
|
|
|
|
|
|
|
|
|
|
|
|
|
|
|
|
|
|
|
|
|
|
|
|
|
|
|
|
|
|
|
|
|
|
|
|
Net Loss
|
|
|
(870,372
|
)
|
|
|
(581,955
|
)
|
|
|
(2,753,680
|
)
|
|
|
(2,139,135
|
)
|
|
|
|
|
|
|
|
|
|
|
|
|
|
|
|
|
|
|
|
|
|
|
|
|
|
Preferred stock dividends
|
|
|
|
|
|
|
|
|
|
|
|
|
|
|
|
|
|
|
|
|
Series A and Series E preferred
stock
|
|
|
24,565
|
|
|
|
1,122
|
|
|
|
58,069
|
|
|
|
3,849
|
|
|
|
|
|
Total preferred stock
dividends
|
|
|
24,565
|
|
|
|
1,122
|
|
|
|
58,069
|
|
|
|
3,849
|
|
|
|
|
|
|
|
|
|
|
|
|
|
|
|
|
|
|
|
|
|
|
|
|
|
|
Net loss attributable to common shareholders
|
|
$
|
(894,937
|
)
|
|
$
|
(583,077
|
)
|
|
$
|
(2,811,749
|
)
|
|
$
|
(2,142,984
|
)
|
|
|
|
|
|
|
|
|
|
|
|
|
|
|
|
|
|
|
|
|
|
|
|
|
|
|
|
|
|
|
|
|
|
|
|
|
|
|
|
|
|
|
|
|
|
|
Basic and diluted net loss per share
|
|
$
|
(0.02
|
)
|
|
$
|
(0.01
|
)
|
|
$
|
(0.06
|
)
|
|
$
|
(0.05
|
)
|
|
|
|
|
|
|
|
|
|
|
|
|
|
|
|
|
|
|
|
|
|
|
|
|
|
Weighted average shares outstanding - basic and
diluted
|
|
|
51,728,049
|
|
|
|
45,126,811
|
|
|
|
49,388,322
|
|
|
|
44,973,345
|
|
|
|
|
|
|
|
|
|
|
|
|
|
|
|
|
|
|
|
|
|
|
|
|
|
See accompanying notes to unaudited condensed consolidated
financial statements
6
|
BRIGHT MOUNTAIN MEDIA, INC. AND SUBSIDIARIES
|
|
|
|
|
|||||||||||||||||||||||||||
|
CONDENSED CONSOLIDATED STATEMENTS OF CHANGES IN SHAREHOLDERS'
EQUITY
|
|
|
|
|
|||||||||||||||||||||||||||
|
For the Nine Months Ended September 30, 2018
|
|
|
|
|
|||||||||||||||||||||||||||
|
|
(Unaudited)
|
|
|
|
|
||||||||||||||||||||||||||
|
|
|
|
|
|
|
||||||||||||||||||||||||||
|
|
|
|
|
|
|
||||||||||||||||||||||||||
|
|
|
|
|
|
|
|
|
|
|
|
|
Additional
|
|
|
|
|
Total
|
|
|
|
|||||||||||
|
|
|
Preferred Stock
|
|
|
Common Stock
|
|
Paid-in
|
|
Accumulated
|
|
|
Shareholders'
|
|
|
|
||||||||||||||||
|
|
|
Shares
|
|
|
Amount
|
|
|
Shares
|
|
|
Amount
|
|
Capital
|
|
Deficit
|
|
|
Equity
|
|
|
|
||||||||||
|
Balance - December 31, 2017
|
|
|
1,475,000
|
|
|
$
|
14,750
|
|
|
|
46,168,864
|
|
|
$
|
461,689
|
|
|
$
|
11,685,685
|
|
|
$
|
(11,818,902
|
)
|
|
$
|
343,222
|
|
|
|
|
|
Common stock issued for 10% dividend payment
pursuan
t
|
|
|
|
|
|
|
|
|
|
|
|
|
|
|
|
|
|
|
|
|
|
|
|
|
|
|
|
|
|
|
|
|
to Series A preferred stock Subscription
Agreements
|
|
|
|
|
|
|
|
|
|
|
10,000
|
|
|
|
100
|
|
|
|
(100
|
)
|
|
|
—
|
|
|
|
|
|
|
|
|
|
Issuance of Series E preferred stock ($0.40/share)
|
|
|
937,500
|
|
|
|
9,375
|
|
|
|
|
|
|
|
|
|
|
|
365,625
|
|
|
|
—
|
|
|
|
375,000
|
|
|
|
|
|
Series E 10% preferred stock dividend
|
|
|
|
|
|
|
|
|
|
|
|
|
|
|
|
|
|
|
(58,069
|
)
|
|
|
—
|
|
|
|
(58,069
|
)
|
|
|
|
|
Stock option vesting expense
|
|
|
|
|
|
|
|
|
|
|
|
|
|
|
|
|
|
|
19,961
|
|
|
|
—
|
|
|
|
19,961
|
|
|
|
|
|
Unit issued for cash ($0.40/share)
|
|
|
|
|
|
|
|
|
|
|
10,100,000
|
|
|
|
101,000
|
|
|
|
3,535,000
|
|
|
|
—
|
|
|
|
3,636,000
|
|
|
|
|
|
Shares issued to Spartan Capital for prepaid consulting
contract
|
|
|
—
|
|
|
|
—
|
|
|
|
1,000,000
|
|
|
|
10,000
|
|
|
|
740,000
|
|
|
|
—
|
|
|
|
750,000
|
|
|
|
|
|
Stock issued for services
|
|
|
—
|
|
|
|
—
|
|
|
|
10,000
|
|
|
|
100
|
|
|
|
7,400
|
|
|
|
—
|
|
|
|
7,500
|
|
|
|
|
|
Net loss for the nine months ended September 30, 2018
|
|
|
—
|
|
|
|
—
|
|
|
|
—
|
|
|
|
—
|
|
|
|
—
|
|
|
|
(2,753,680
|
)
|
|
|
(2,753,680
|
)
|
|
|
|
|
Balance – September 30, 2018
|
|
|
2,412,500
|
|
|
$
|
24,125
|
|
|
|
57,288,864
|
|
|
$
|
572,889
|
|
|
$
|
16,295,502
|
|
|
$
|
(14,572,582
|
)
|
|
$
|
2,319,934
|
|
|
|
|
|
|
|
|
|
|
|
|
|
|
|
|
|
|
|
|
|
|
|
|
|
|
|
|
|
|
|
|
|
|
|
|
|
|
See accompanying notes to unaudited condensed consolidated
financial statements
|
|
|
|
|
|||||||||||||||||||||||||||
|
|
|
|
|
|
|||||||||||||||||||||||||||
7
BRIGHT MOUNTAIN MEDIA, INC. AND SUBSIDIARIES
|
|
|
For the Nine Months Ended
|
|
|||||
|
|
|
September 30,
|
|
|||||
|
|
|
2018
|
|
|
2017
|
|
||
|
Cash flows from operating activities:
|
|
|
|
|
|
|
||
|
Net
loss
|
|
$
|
(2,753,680
|
)
|
|
$
|
(2,139,135
|
)
|
|
Adjustments to
reconcile net loss to net cash used in operations:
|
|
|
|
|
|
|
|
|
|
Depreciation
|
|
|
20,661
|
|
|
|
18,925
|
|
|
Amortization
of debt discount
|
|
|
160,355
|
|
|
|
151,843
|
|
|
Amortization
of intangibles
|
|
|
262,633
|
|
|
|
227,418
|
|
|
Stock
option compensation expense
|
|
|
19,961
|
|
|
|
95,821
|
|
|
Stock
issued for services
|
|
|
7,500
|
|
|
|
25,860
|
|
|
Gain
on sale of property and equipment
|
|
|
(749
|
)
|
|
|
—
|
|
|
Provision
for bad debt
|
|
|
63,051
|
|
|
|
—
|
|
|
Changes in operating assets and liabilities:
|
|
|
|
|
|
|
|
|
|
Accounts
receivable
|
|
|
103,940
|
|
|
|
48,925
|
|
|
Inventory
|
|
|
255,111
|
|
|
|
142,550
|
|
|
Prepaid
expenses and other current assets
|
|
|
(48,101
|
)
|
|
|
61,223
|
|
|
Prepaid
Services and Consulting contracts
|
|
|
(640,000
|
)
|
|
|
|
|
|
Other
assets
|
|
|
3,938
|
|
|
|
134,903
|
|
|
Accounts
payable
|
|
|
(543,891
|
)
|
|
|
(203,673
|
)
|
|
Accrued
expense
|
|
|
15,978
|
|
|
|
39,236
|
|
|
Accrued
interest - related party
|
|
|
16,550
|
|
|
|
10,958
|
|
|
Deferred
rents
|
|
|
(1,335
|
)
|
|
|
16,692
|
|
|
Deferred revenue
|
|
|
(3,770
|
)
|
|
|
—
|
|
|
Net
cash used in operating activities
|
|
|
(3,061,848
|
)
|
|
|
(1,368,454
|
)
|
|
|
|
|
|
|
|
|
|
|
|
Cash flows from investing activities:
|
|
|
|
|
|
|
|
|
|
Purchase
of property and equipment
|
|
|
(1,213
|
)
|
|
|
(14,305
|
)
|
|
Cash
received for sale of property and equipment
|
|
|
2,100
|
|
|
|
—
|
|
|
Cash
paid for acquisition, net of cash received
|
|
|
—
|
|
|
|
(207,802
|
)
|
|
Net
cash provided by (used in) investing activities
|
|
|
887
|
|
|
|
(222,107
|
)
|
|
|
|
|
|
|
|
|
|
|
|
Cash flows from financing activities:
|
|
|
|
|
|
|
|
|
|
Proceeds
from issuance of preferred stock
|
|
|
375,000
|
|
|
|
200,000
|
|
|
Proceeds
from issuance of common stock, net of commissions
|
|
|
3,636,000
|
|
|
|
50,000
|
|
|
Repayments
on insurance premium notes payable
|
|
|
(52,041
|
)
|
|
|
(53,643
|
)
|
|
Dividend
payments
|
|
|
(54,685
|
)
|
|
|
—
|
|
|
Principal
repayment on notes payable
|
|
|
(429,924
|
)
|
|
|
(113,078
|
)
|
|
Long-term
debt - related parties
|
|
|
-
|
|
|
|
1,460,000
|
|
|
Net
cash provided by financing activities
|
|
|
3,474,350
|
|
|
|
1,543,279
|
|
|
|
|
|
|
|
|
|
|
|
|
Net increase (decrease) in cash
|
|
|
413,389
|
|
|
|
(47,282
|
)
|
|
Cash and cash equivalents at beginning of period
|
|
|
140,022
|
|
|
|
162,795
|
|
|
Cash and cash equivalents at end of period
|
|
$
|
553,411
|
|
|
$
|
115,513
|
|
|
|
|
|
|
|
|
|
|
|
|
Supplemental disclosure of cash flow information
|
|
|
|
|
|
|
|
|
|
Cash
paid for:
|
|
|
|
|
|
|
|
|
|
Interest
|
|
$
|
158,192
|
|
|
$
|
92,783
|
|
|
|
|
|
|
|
|
|
|
|
|
Non-cash investing and financing activities
|
|
|
|
|
|
|
|
|
|
Premium finance loan payable recorded as
prepaid
|
|
$
|
—
|
|
|
$
|
18,885
|
|
|
Beneficial conversion of debt discount to
additional paid in capital
|
|
$
|
—
|
|
|
$
|
615,625
|
|
|
Valuation
of common stock warrants
issued to Spartan Capital
|
|
$
|
380,409
|
|
|
$
|
—
|
|
|
Accounts receivable charged against notes
payable - Daily Engage Media
|
|
$
|
19,525
|
|
|
$
|
—
|
|
|
Common stock issued for acquisition of
Daily Engage Media
|
|
$
|
—
|
|
|
$
|
429,091
|
|
|
Notes payable issued for acquisition of
Daily Engage Media
|
|
$
|
—
|
|
|
$
|
380,000
|
|
|
Adjustment to Goodwill for undisclosed
liability assumed in the acquisition of Daily Engage
Media
|
|
$
|
197,500
|
|
|
$
|
—
|
|
|
Stock issued for prepaid services and
consulting agreements
|
|
$
|
750,000
|
|
|
$
|
—
|
|
See accompanying notes to unaudited condensed consolidated
financial statements
8
BRIGHT MOUNTAIN MEDIA, INC. AND SUBSIDIARIES
NOTES TO CONDENSED CONSOLIDATED FINANCIAL STATEMENTS
SEPTEMBER 30, 2018
(Unaudited)
Organization and Nature of Operations
Bright
Mountain Media, Inc. is a Florida corporation formed on May 20,
2010. Its wholly owned subsidiaries, Bright Mountain LLC, and The
Bright Insurance Agency, LLC, were formed as Florida limited
liability companies in May 2011. Its wholly owned subsidiary,
Bright Watches, LLC was formed as a Florida limited liability
company in December 2015, and its wholly owned subsidiary Daily
Engage Media Group LLC (“Daily Engage Media”) was
formed as a New Jersey limited liability company in February 2015.
When used herein, the terms "BMTM, the "Company," "we," "us," "our"
or "Bright Mountain" refers to Bright Mountain Media, Inc. and its
subsidiaries.
Bright
Mountain is a digital media holding company whose primary focus is
connecting brands with consumers as a full advertising services
platform. The Company’s assets include an ad network, an ad
exchange platform and 25 websites (owned and/or managed) that
provide content, services and products. In addition, the Bright
Mountain Media ad exchange network will be fully developed and
implemented in the fourth quarter of 2018. The websites are
primarily geared for a young, male audience with several that focus
on active, reserve and retired military audiences as well as law
enforcement and first responders. With the acquisition of Daily
Engage Media in September 2017, the Company has acquired the
software and expertise to scale this side of the business. Two of
our websites operate as e-commerce platforms, one of which, Bright
Watches, is non-strategic to the current direction of our
business.
In
December 2016, we acquired the assets, constituting the Black
Helmet Apparel business (“Black Helmet Apparel”), from
Sostre Enterprises, Inc. Assets acquired included various website
properties and content, social media content, inventory and other
intellectual property rights.
On
September 19, 2017, under the terms of an Amended and Restated
Membership Interest Purchase Agreement with Daily Engage Media, and
its members, the Company acquired 100% of the membership interests
of Daily Engage Media. Launched in 2015, Daily Engage Media is an
ad network that connects advertisers with approximately 200 digital
publications worldwide.
Principles of Consolidation and Basis of Presentation
The
condensed consolidated financial statements include the accounts of
the Company and all of its wholly-owned subsidiaries. All
intercompany accounts and transactions have been eliminated in the
condensed consolidated financial statements. The accompanying
unaudited financial statements for the three and nine months ended
September 30, 2018 and 2017 have been prepared in accordance with
U.S. generally accepted accounting principles (“GAAP”)
applicable to interim financial information and the requirements of
Form 10-Q and Article 8 of Regulation S-X of the SEC. Accordingly,
they do not include all of the information and disclosures required
by accounting principles generally accepted in the United States
for complete consolidated financial statements. In the opinion of
management, such condensed consolidated financial statements
include all adjustments (consisting of normal recurring accruals)
necessary for the fair presentation of the condensed consolidated
financial position and the condensed consolidated results of
operations. The condensed consolidated results of operations for
periods presented are not necessarily indicative of the results to
be expected for the full year. The condensed consolidated balance
sheet information as of December 31, 2017 was derived from the
audited consolidated financial statements included in the Company's
Annual Report on Form 10-K for the year ended December 31, 2017, as
filed with the SEC on April 2, 2018. The interim condensed
consolidated financial statements should be read in conjunction
with that report.
Reclassification
Certain
reclassifications have been made to the December 31, 2017
consolidated balance sheet to conform to the September 30, 2018
consolidated balance sheet presentation.
9
BRIGHT MOUNTAIN MEDIA, INC. AND SUBSIDIARIES
NOTES TO CONDENSED CONSOLIDATED FINANCIAL STATEMENTS
SEPTEMBER 30, 2018
(Unaudited)
NOTE 1 – NATURE OF OPERATIONS AND SUMMARY OF SIGNIFICANT
ACCOUNTING POLICIES (continued).
Use of Estimates
Our
consolidated financial statements are prepared in accordance with
GAAP. These accounting principles require management to make
certain estimates, judgments, and assumptions. We believe that the
estimates, judgments, and assumptions upon which we rely are
reasonable based upon information available to us at the time that
these estimates, judgments, and assumptions are made. These
estimates, judgments, and assumptions can affect the reported
amounts of assets and liabilities as of the date of our
consolidated financial statements as well as reported amounts of
revenue and expenses during the periods presented. Our consolidated
financial statements would be affected to the extent there are
material differences between these estimates and actual results. In
many cases, the accounting treatment of a particular transaction is
specifically dictated by GAAP and does not require management's
judgment in its application. There are also areas in which
management's judgment in selecting any available alternative would
not produce a materially different result. Significant estimates
included in the accompanying consolidated financial statements
include revenue recognition, the fair value of acquired assets for
purchase price allocation in business combinations, valuation of
inventory, valuation of intangible assets, estimates of
amortization period for intangible assets, estimates of
depreciation period for fixed assets and the valuation of
equity-based transactions.
Cash and Cash Equivalents
The
Company considers all highly liquid investments with an original
maturity of three months or less when purchased to be cash
equivalents.
Fair Value of Financial Instruments and Fair Value
Measurements
The
Company measures its financial assets and liabilities in accordance
with GAAP. For certain of our financial instruments, including
cash, accounts payable, accrued expenses, and the short-term
portion of long-term debt, the carrying amounts approximate fair
value due to their short maturities.
We adopted accounting guidance for financial and
non-financial assets and liabilities in accordance with Accounting
Standards Codification (“ASC”) 820
“
Fair
Value Measurements and Disclosures
.” This standard defines fair value,
provides guidance for measuring fair value and requires certain
disclosures. This standard does not require any new fair value
measurements, but rather applies to all other accounting
pronouncements that require or permit fair value measurements. This
guidance does not apply to measurements related to share-based
payments. This guidance discusses valuation techniques, such as the
market approach (comparable market prices), the income approach
(present value of future income or cash flow), and the cost
approach (cost to replace the service capacity of an asset or
replacement cost). The guidance utilizes a fair value hierarchy
that prioritizes the inputs to valuation techniques used to measure
fair value into three broad levels. The following is a brief
description of those three levels:
Level
1:
Observable
inputs such as quoted prices (unadjusted) in active markets for
identical assets or liabilities.
Level
2:
Inputs
other than quoted prices that are observable, either directly or
indirectly. These include quoted prices for similar assets or
liabilities in active markets and quoted prices for identical or
similar assets or liabilities in markets that are not
active.
Level
3:
Unobservable
inputs in which little or no market data exists, therefore
developed using estimates and assumptions developed by us, which
reflect those that a market participant would use.
10
BRIGHT MOUNTAIN MEDIA, INC. AND SUBSIDIARIES
NOTES TO CONDENSED CONSOLIDATED FINANCIAL STATEMENTS
SEPTEMBER 30, 2018
(Unaudited)
NOTE 1 – NATURE OF OPERATIONS AND SUMMARY OF SIGNIFICANT
ACCOUNTING POLICIES (continued).
Accounts Receivable
Accounts
receivable are recorded at fair value on the date revenue is
recognized. The Company provides allowances for doubtful accounts
for estimated losses resulting from the inability of its customers
to repay their obligation. If the financial condition of the
Company's customers were to deteriorate, resulting in an impairment
of their ability to repay, additional allowances may be required.
The Company provides for potential uncollectible accounts
receivable based on specific customer identification and historical
collection experience adjusted for existing market conditions. If
market conditions decline, actual collection experience may not
meet expectations and may result in decreased cash flows and
increased bad debt expense.
The
policy for determining past due status is based on the contractual
payment terms of each customer, which are generally net 60 or net
90 days. Once collection efforts by the Company and its collection
agency are exhausted, the determination for charging off
uncollectible receivables is made.
Inventories
Inventories
consist of finished goods and are stated at the lower of cost or
market using the first in, first out (FIFO) method. Provisions have
been made to reduce excess or obsolete inventories to their net
realizable value.
Revenue Recognition
The Company recognizes revenue on our products in
accordance with ASC 605, “
Revenue
Recognition
.” Under these
guidelines, revenue is recognized on sales transactions when all of
the following exist: persuasive evidence of an arrangement did
exist; delivery of the product or advertising has occurred; the
sales price to the buyer is fixed or determinable; and
collectability is reasonably assured. The Company has several
revenue streams generated directly from its website and specific
revenue recognition criteria for each revenue stream is as
follows:
●
Sale
of merchandise directly to consumers: The Company's product sales
are recognized either FOB shipping point or FOB destination,
dependent on the customer. Revenues are therefore recognized at
point of ownership transfer, accordingly;
●
Advertising
revenue is received directly from companies who pay the Company a
monthly fee for advertising space and;
●
Advertising
revenues are generated by users “clicking” on website
advertisements utilizing several ad network partners. Revenues are
recognized net of their fees for Company owned websites. The
Company recognizes revenue based on monthly billings of ad network
activity, with adjustments for invalid traffic.
Our
advertising revenue generated from the Daily Engage and Bright
Mountain businesses are consistent with the above section. However,
the two scenarios that arise from revenue generation and
recognition include our owned and operated website advertising
revenue which requires little to no cost of revenue, as well as
advertising on non-owned websites which creates costs to those
website owners and the Company makes a range of 18% to 20% of the
gross revenues on these contractual agreements.
11
BRIGHT MOUNTAIN MEDIA, INC. AND SUBSIDIARIES
NOTES TO CONDENSED CONSOLIDATED FINANCIAL STATEMENTS
SEPTEMBER 30, 2018
(Unaudited)
NOTE 1 – NATURE OF OPERATIONS AND SUMMARY OF SIGNIFICANT
ACCOUNTING POLICIES (continued).
Cost of Revenues
Components of costs
of revenues for the products segment include product costs,
shipping costs to customers and any inventory adjustments for
product sales. Cost of revenue for the advertising segment consists
of revenue share payments to media providers and website publishers
that are directly related to a revenue generating event. The
Company becomes obligated to make the revenue share payments in the
period the advertising impressions, click throughs, actions or
lead-based information are delivered or occur. The Daily Engage
Media portion of the advertising segment cost of revenue consists
of revenue share payments to media providers and website publishers
that are directly related to a revenue generating event. The
Company becomes obligated to make the revenue share payments in the
period the advertising impressions, click throughs, actions or
lead-based information are delivered or occur.
Shipping and Handling Costs
The
Company includes shipping and handling fees billed to customers as
revenues and shipping and handling costs for shipments to customers
as cost of revenues.
Sales Return Reserve Policy
Our
return policy generally allows our end users to return purchased
products for refund or in exchange for new products. We estimate a
reserve for sales returns, if any, and record that reserve amount
as a reduction of sales and as a sales return reserve liability.
Sales to consumers on our web site generally may be returned within
a reasonable period of time.
Property and Equipment
Property
and equipment is recorded at cost. Depreciation is computed using
the straight-line method based on the estimated useful lives of the
related assets of five to seven years for office furniture and
equipment, and five years for computer equipment. Leasehold
improvements are amortized over the lesser of the lease term or the
useful life of the improvements. Expenditures for maintenance and
repairs along with fixed assets with a purchase price below our
capitalization threshold of $500 are expensed as
incurred.
Website Development Costs
The Company accounts for its website development
costs in accordance with ASC 350-50, “
Website Development
Costs
” (“ASC
350-50”). These costs, if any, are included in intangible
assets in the accompanying consolidated financial statements or
expensed immediately if the Company cannot support recovery of
these costs from positive future cash flows.
ASC
350-50 requires the expensing of all costs of the preliminary
project stage and the training and application maintenance stage
and the capitalization of all internal or external direct costs
incurred during the application and infrastructure development
stage. Upgrades or enhancements that add functionality are
capitalized while other costs during the operating stage are
expensed as incurred. The Company amortizes the capitalized website
development costs over an estimated life of five
years.
For the
three and nine months ended September 30, 2018 and 2017, all
platform and website development costs have been
expensed.
Amortization and Impairment of Long-Lived Assets
Amortization and impairment of long-lived assets
are non-cash expenses relating primarily to intangible assets. The
Company accounts for long-lived assets in accordance with the
provisions of ASC 360-10 “
Accounting for the Impairment
or Disposal of Long-Lived Assets
.” This statement requires that long-lived
assets and certain identifiable intangibles be reviewed for
impairment whenever events or changes in circumstances indicate
that the carrying amount of an asset may not be
recoverable.
12
BRIGHT MOUNTAIN MEDIA, INC. AND SUBSIDIARIES
NOTES TO CONDENSED CONSOLIDATED FINANCIAL STATEMENTS
SEPTEMBER 30, 2018
(Unaudited)
NOTE 1 – NATURE OF OPERATIONS AND SUMMARY OF SIGNIFICANT
ACCOUNTING POLICIES (continued).
Website
acquisition costs are amortized over three years and intangible
assets are amortized over up to eight years. Recoverability of
assets to be held and used is measured by a comparison of the
carrying amount of an asset to future undiscounted net cash flows
expected to be generated by the asset. If such assets are
considered to be impaired, the impairment to be recognized is
measured by the amount by which the carrying amount of the assets
exceeds the fair value of the assets. Assets to be disposed of are
reported at the lower of the carrying amount or fair value less
costs to sell. While it is likely that we will have significant
amortization expense as we continue to acquire websites, we believe
that intangible assets represent costs incurred by the acquired
website to build value prior to acquisition and the related
amortization and impairment charges of assets, if applicable, are
not ongoing costs of doing business. Amortization expense is
included in selling, general and administrative expenses on the
accompanying condensed consolidated statement of
operations.
Stock-Based Compensation
The Company accounts for stock-based instruments
issued to employees for services in accordance with ASC 718
“
Compensation – Stock
Compensation
.” ASC 718
requires companies to recognize in the statement of operations the
grant-date fair value of stock options and other equity-based
compensation issued to employees. The value of the portion of an
employee award that is ultimately expected to vest is recognized as
an expense over the requisite service periods using the
straight-line attribution method. The Company accounts for
non-employee share-based awards in accordance with the measurement
and recognition criteria of ASC 505-50, “
Equity-Based Payments to
Non-Employees
.”
The Company uses the Black-Scholes option pricing model for
estimating the fair value of stock options. The use of the option
valuation model requires the input of the Company's stock price, as
well as highly subjective assumptions, including the expected life
of the option and the expected stock price volatility based on peer
companies. Additionally, the recognition of expense requires the
estimation of the number of awards that will ultimately vest and
the number of awards that will ultimately be forfeited. The fair
value of the Company's common stock, for purposes of determining
the grant date fair value of option, has been determined by using
the closing market price per share of common stock as quoted on the
date of grant.
Non- cash stock-based
stock option compensation is expensed over the requisite service
period and are included in selling, general and administrative
expenses on the accompanying condensed consolidated statement of
operations. The Company recorded $5,753 and $21,983 stock-based
compensation expense for the three months ended September 30, 2018
and 2017 and $19,961 and $95,821 for the nine months ended
September 30, 2018 and 2017, respectively.
Advertising, Marketing and Promotion Costs
Advertising,
marketing and promotion expenses are expensed as incurred and are
included in selling, general and administrative expenses on the
accompanying statement of operations. For the three and nine months
ended September 30, 2018 and 2017, advertising, marketing and
promotion expense was $67,976 and $66,436 and $203,863 and
$231,669, respectively.
Income Taxes
We
use the asset and liability method to account for income taxes.
Under this method, deferred income taxes are determined based on
the differences between the tax basis of assets and liabilities and
their reported amounts in the consolidated financial statements
which will result in taxable or deductible amounts in future years
and are measured using the currently enacted tax rates and laws. A
valuation allowance is provided to reduce net deferred tax assets
to the amount that, based on available evidence, is more likely
than not to be realized.
The Company follows the provisions of ASC
740-10
“
Accounting for Uncertain
Income Tax Positions.
”
When tax returns are filed, it is highly certain that some
positions taken would be sustained upon examination by the taxing
authorities, while others are subject to uncertainty about the
merits of the position taken or the amount of the position that
would be ultimately sustained. In accordance with the guidance of
ASC 740-10, the benefit of a tax position is recognized in the
financial statements
in the period during which, based on all available
evidence, management believes it is more likely than not that the
position will be
sustained upon examination, including the
resolution of appeals or litigation processes, if any. Tax
positions taken are not offset or
aggregated with other positions. Tax positions
that meet the more-likely-than-not recognition threshold are
measured as the largest
amount of tax benefit that is more than 50% likely
of being realized upon settlement with the applicable taxing
authority. The
portion of the benefits associated with tax
positions taken that exceeds the amount measured as described above
should be reflected as
a liability for
13
BRIGHT
MOUNTAIN MEDIA, INC. AND SUBSIDIARIES
NOTES TO CONDENSED CONSOLIDATED FINANCIAL STATEMENTS
SEPTEMBER 30, 2018
(Unaudited)
NOTE 1 – NATURE OF OPERATIONS AND SUMMARY OF SIGNIFICANT
ACCOUNTING POLICIES (continued).
unrecognized tax benefits in the accompanying consolidated balance
sheets along with any associated interest and penalties that
would
be payable to the taxing authorities upon
examination.
As
of September 30, 2018, tax years 2017, 2016, and 2015 remain open
for IRS audit. The Company has received no notice of audit or any
notifications from the IRS for any of the open tax
years.
Basic and Diluted Net Earnings (Loss) Per Common Share
In accordance with ASC 260-10
“
Earnings Per
Share
,” basic net
earnings (loss) per common share is computed by dividing the net
earnings (loss) for the period by the weighted average number of
common shares outstanding during the period. Diluted earnings
(loss) per share are computed using the weighted average number of
common and dilutive common stock equivalent shares outstanding
during the period. As of September 30, 2018 and 2017, there were
approximately 2,027,000 and 2,187,000 common stock equivalent
shares outstanding as stock options, respectively and 10,100,000
and 0 common stock equivalent shares outstanding from warrants to
purchase common shares, respectively, 2,412,500 and 1,475,000
common stock equivalents from the conversion of preferred stock,
respectively, and 4,300,000 common stock equivalents from the
conversion of notes payable, respectively. Equivalent shares were
not utilized, as the effect is anti-dilutive.
Segment Information
In accordance with the provisions of ASC 280-10,
“
Disclosures about Segments of
an Enterprise and Related Information
”, the Company is required to report
financial and descriptive information about its reportable
operating segments. The Company has two identifiable operating
segments based on the activities of the Company in accordance with
the ASC 280-10 The Company's two segments are product sales and
advertising as of September 30, 2018. The product sales segment
sells merchandise directly to customers thorough e-commerce
distributor portals such as Amazon and eBay, and through our
proprietary websites and our retail location. The advertising
segment is focused on producing advertising revenue generated by
users “clicking on” and/or viewing website
advertisements utilizing several ad network partners and direct
advertisers.
Recent Accounting Pronouncements
May 2014, the Financial Accounting Standards Board
(“FASB”) issued ASU 2014-09,
"Revenue from Contracts with
Customers (Topic 606)
.”
ASU 2014-09, which has been modified on several occasions, provides
new guidance designed to enhance the comparability of revenue
recognition practices across entities, industries, jurisdictions
and capital markets. The core principle of the new guidance is that
an entity recognizes revenue to depict the transfer of promised
goods or services to customers in an amount that reflects the
consideration to which the entity expects to be entitled in
exchange for those goods and services. The new guidance also
requires disclosures about the nature, amount, timing and
uncertainty of revenue and cash flows arising from contracts with
customers. We have reviewed the provisions of this ASU and
subsequent updates and evaluated the potential impact on our
results of operations, cash flows or financial condition as well as
related disclosures and management believes the impact will be
nominal. As an emerging growth company, we have elected to adopt
this guidance under the private company guidelines, which will go
into effect on January 1, 2019, retrospectively, with a cumulative
effect of initially applying ASC 606 recognized at the date of
initial application.
The
Company’s revenue recognition is based on sales for
advertising revenue with an adjustment for invalid traffic which
would be determined based on known trends and historical data. The
current historic data considers an adjustment of approximately 1 to
23% of revenues. The Company will also address future cash flow in
determining its allowance for doubtful accounts.
In July 2015, FASB issued ASU No.
2015-11
,
“Inventory (Topic 330): Simplifying the Measurement of
Inventory
”. The
amendments in this ASU do not apply to inventory that is measured
using last-in, first-out (LIFO) or the retail inventory method. The
amendments apply to all other inventory, which includes inventory
that is measured using first-in, first-out (FIFO) or average cost.
An entity should measure inventory within the scope of this Update
at the lower of cost and net realizable value. Net realizable value
is the estimated selling prices in the ordinary course of business,
less reasonably predictable costs of completion, disposal, and
transportation. Subsequent measurement is unchanged for inventory
measured using LIFO or the retail inventory
method
.
For public business entities, this ASU is
effective for fiscal years beginning after December 15, 2016,
including interim periods within those fiscal years. For all other
entities, this ASU is effective for fiscal years beginning after
December 15, 2016, and interim periods within fiscal years
beginning after December 15, 2017. The amendments in this ASU
should be applied prospectively with earlier application permitted
as of the beginning of an interim or annual reporting
period.
The adoption of ASU No. 2015-11 did not have a
material effect on our condensed consolidated financial
statements.
14
BRIGHT MOUNTAIN MEDIA, INC. AND SUBSIDIARIES
NOTES TO CONDENSED CONSOLIDATED FINANCIAL STATEMENTS
SEPTEMBER 30, 2018
(Unaudited)
In February 2016, the FASB issued ASU 2016-02
“
Leases
,” which will amend current lease accounting
to require lessees to recognize (i) a lease liability, which is a
lessee’s obligation to make lease payments arising from a
lease, measured on a discounted basis, and (ii) a right-of-use
asset, which is an asset that represents the lessee’s right
to use, or control the use of, a specified asset for the lease
term. ASU 2016-02 does not significantly change lease accounting
requirements applicable to lessors; however, certain changes were
made to align, where necessary, lessor accounting with the lessee
accounting model. This standard will be effective for fiscal years
beginning after December 15, 2018, including interim periods within
those fiscal years. We are currently reviewing the provisions of
this ASU to determine the impact on our results of operations, cash
flows or financial condition.
In April 2016, the FASB issued ASU No.
2016-15,
“Classification of
Certain Cash Receipts and Cash Payments”
ASU 2016- provides guidance regarding the
classification of certain items within the statement of cash flows.
ASU 2016-15 is effective for annual periods beginning after
December 15, 2017 with early adoption permitted. We do not believe
this ASU will have an impact on our results of operation, cash
flows, other than presentation, or financial
condition.
In June 2016, the FASB issued ASU 2016-13
“Financial
Instruments – Credit Losses”
which replaces the incurred loss model with a
current expected credit loss (“CECL”) model. The CECL
model applies to financial assets subject to credit losses and
measured at amortized cost and certain off-balance sheet exposures.
Under current U.S. GAAP, an entity reflects credit losses on
financial assets measured on an amortized cost basis only when
losses are probable and have been incurred, generally considering
only past events and current conditions in making these
determinations. ASU 2016-13 prospectively replaces this approach
with a forward-looking methodology that reflects the expected
credit losses over the lives of financial assets, starting when
such assets are first acquired. Under the revised methodology,
credit losses will be measured based on past events, current
conditions and reasonable and supportable forecasts that affect the
collectability of financial assets.
ASU 2016-13 also revises the approach to
recognizing credit losses for available-for-sale securities by
replacing the direct write-down approach with the allowance
approach and limiting the allowance to the amount at which the
security’s fair value is less than the amortized cost. In
addition, ASU 2016-13 provides that the initial allowance for
credit losses on purchased credit impaired financial assets will be
recorded as an increase to the purchase price, with subsequent
changes to the allowance recorded as a credit loss expense. ASU
2016-13 also expands disclosure requirements regarding an
entity’s assumptions, models and methods for estimating the
allowance for credit losses. The amendments of this Update are
effective for fiscal years, and interim periods within those fiscal
years, beginning after December 15, 2019. Early adoption is
permitted as of January 1, 2019. The Company is currently
evaluating the impact the adoption of this new standard will have
on its consolidated financial statement
s.
In November 2016, the FASB issued ASU
2016-18,
“Statement of Cash Flows
–Restricted Cash”
which requires entities to present the changes in
total cash, cash equivalents, restricted cash and restricted cash
equivalents in the statement of cash flows. The new guidance also
requires a reconciliation of the totals in the statement of cash
flows to the related captions in the balance sheet if restricted
cash and restricted cash equivalents are presented in a different
line item in the balance sheet. The amendments of this Update,
which should be applied using a retrospective transition method to
each period presented, are effective for fiscal years, and interim
periods within those fiscal years, beginning after December 15,
2017. Early adoption is permitted. The adoption of this standard is
not expected to have an impact on our statement of cash
flows.
In January 2017, the FASB issued 2017-04,
Intangibles -
Goodwill and Other
(Topic 350):
Simplifying the Test for Goodwill Impairment. The amendments in
this ASU simplify the subsequent measurement of goodwill by
eliminating Step 2 from the goodwill impairment test and
eliminating the requirement for a reporting unit with a zero or
negative carrying amount to perform a qualitative assessment.
Instead, under this pronouncement, an entity would perform its
annual, or interim, goodwill impairment test by comparing the fair
value of a reporting unit with its carrying amount and would
recognize an impairment change for the amount by which the carrying
amount exceeds the reporting unit’s fair value; however, the
loss recognized is not to exceed the total amount of goodwill
allocated to that reporting unit. In addition, income tax effects
will be considered, if applicable. This ASU is effective for fiscal
years, and interim periods within those fiscal years, beginning
after December 15, 2019. Early adoption is permitted. The Company
is currently evaluating the impact of this ASU on its consolidated
financial statements and related disclosures.
15
BRIGHT MOUNTAIN MEDIA, INC. AND SUBSIDIARIES
NOTES TO CONDENSED CONSOLIDATED FINANCIAL STATEMENTS
SEPTEMBER 30, 2018
(Unaudited)
The
accompanying condensed consolidated financial statements have been
prepared on a going concern basis, which contemplates the
realization of assets and the satisfaction of liabilities in the
normal course of business. The Company sustained a net loss of
($2,753,680) and used net cash in operating activities of
($3,061,848) for the nine months ended September 30, 2018. The
Company had an accumulated deficit of ($14,572,582) at September
30, 2018. These factors raise substantial doubt about the ability
of the Company to continue as a going concern. The Company's
continuation as a going concern is dependent upon its ability to
generate revenues and its ability to continue receiving investment
capital from investors and related parties to sustain its current
level of operations.
Management
plans to continue to raise additional capital through private
placements and is exploring additional avenues for future
fund-raising through both public and private sources. While we have
engaged a placement agent to assist us in raising capital, the
placement agent is acting on a best efforts basis and there are no
assurances we will be successful in raising additional capital
during the balance of 2018 through the sale of our
securities.
The
condensed consolidated financial statements do not include any
adjustments relating to the recoverability and classification of
recorded asset amounts or the amounts and classification of
liabilities that might be necessary should the Company be unable to
continue as a going concern.
On September 19, 2017 the
Company, Daily Engage Media, and the owners of the membership
interests in Daily Engage Media entered into an Amended and
Restated Membership Interest Purchase Agreement (the “Daily
Engage Purchase Agreement”) under which the Company acquired
100% of the membership interests of Daily Engage Media in exchange
for common stock, promissory notes and the satisfaction of certain
debt obligations of the acquired entity totaling approximately
$888,000.
In
accordance with ASC 805 “Business Combinations” the
measurement period for the acquisition was for one year during
which the Company reevaluated the assets acquired, liabilities
assumed and the goodwill resulting from the transaction as well as
the change in amortization as a result of changes in the
provisional amounts as if the accounting had been completed at the
acquisition date.
The
allocation of the purchase price to the assets acquired and
liabilities assumed based on management’s estimate of fair
values at the date of acquisition and as restated was as
follows:
|
|
|
|
At Acquisition
|
|
|
|
Liability Assumed
|
|
|
|
|
Adjustment
|
|
|
|
|
|
Measurement Date
|
|
|
Tangible assets acquired
|
|
$
|
361,770
|
|
|
$
|
—
|
|
|
|
$
|
—
|
|
|
|
|
$
|
361,770
|
|
|
Liabilities assumed
|
|
|
(562,006
|
)
|
|
|
(197,500
|
)
|
(1)
|
|
|
—
|
|
|
|
|
|
(759,506
|
)
|
|
Net liabilities assumed
|
|
$
|
(200,236
|
)
|
|
$
|
(197,500
|
)
|
|
|
$
|
—
|
|
|
|
|
$
|
(397,736
|
)
|
|
|
|
|
|
|
|
|
|
|
|
|
|
|
|
|
|
|
|
|
|
|
Exchange platform
|
|
$
|
50,000
|
|
|
$
|
—
|
|
|
|
$
|
(50,000
|
)
|
(2)
|
|
|
$
|
—
|
|
|
Tradename
|
|
|
150,000
|
|
|
|
—
|
|
|
|
|
(118,000
|
)
|
(2)
|
|
|
|
32,000
|
|
|
Customer relationships
|
|
|
250,000
|
|
|
|
—
|
|
|
|
|
(63,000
|
)
|
(2)
|
|
|
|
187,000
|
|
|
Non-compete agreements
|
|
|
192,000
|
|
|
|
—
|
|
|
|
|
(114,000
|
)
|
(2)
|
|
|
|
78,000
|
|
|
Unallocated purchase price
|
|
|
446,426
|
|
|
|
197,500
|
|
|
|
|
345,000
|
|
(2)
|
|
|
|
988,926
|
|
|
Total purchase price
|
|
$
|
1,088,426
|
|
|
$
|
197,500
|
|
|
|
$
|
—
|
|
|
|
|
$
|
1,285,926
|
|
(1)
During August 2018,
the Company became aware of an additional liability in the form of
a settlement of a legal claim for an unpaid vendor liability which
was not disclosed to the Company at the time of the acquisition.
The settlement claim of $197,500 is included in accrued expenses at
September 30, 2018.
(2)
A valuation was
performed at the end of the measurement period to determine the
fair value of acquired intangible assets as defined in ASC 820-10.
The valuation and corresponding measurement of assets acquired and
liabilities assumed resulted in adjustments to the provisional
amounts of intangible assets recognized at the original acquisition
date.
The
final accounting for the acquisition resulted in a decrease in
accumulated amortization and amortization expense of approximately
$61,000 as of and for the nine months ended September 30,
2018.
16
BRIGHT MOUNTAIN MEDIA, INC. AND SUBSIDIARIES
NOTES TO CONDENSED CONSOLIDATED FINANCIAL STATEMENTS
SEPTEMBER 30, 2018
(Unaudited)
Pro forma results
The
following table sets forth a summary of the unaudited pro forma
results of the Company as if the acquisition of the Daily Engage
Media, which was closed in September 2017, had taken place on the
first day of the periods presented. These combined results are not
necessarily indicative of the results that may have been achieved
had the business been acquired as of the first day of the periods
presented.
|
|
|
Three Months Ended
|
|
|
Nine Months Ended
|
|
||
|
|
|
September 30, 2017
|
|
|
September 30, 2017
|
|
||
|
Total revenue
|
|
$
|
1,076,113
|
|
|
$
|
3,442,272
|
|
|
Total expenses
|
|
|
(1,947,279
|
)
|
|
|
(5,846,274
|
)
|
|
Preferred stock dividend
|
|
|
(1,122
|
)
|
|
|
(3,849
|
)
|
|
Net loss attributable to common shareholders
|
|
$
|
(872,288
|
)
|
|
$
|
(2,407,851
|
)
|
|
Basic and diluted net loss per share
|
|
$
|
(0.02
|
)
|
|
$
|
(0.05
|
)
|
At
September 30, 2018 and December 31, 2017 inventories consisted of
the following:
|
|
|
September 30,
2018
|
|
|
December 31,
2017
|
|
||
|
Product inventory: clocks and watches
|
|
$
|
183,909
|
|
|
$
|
453,852
|
|
|
Product inventory: other inventory
|
|
|
194,896
|
|
|
|
180,064
|
|
|
Total inventory balance
|
|
|
378,805
|
|
|
|
633,916
|
|
|
Less: inventory allowance for slow moving
|
|
|
(22,448
|
)
|
|
|
(22,448
|
)
|
|
Total inventory balance, net
|
|
$
|
356,357
|
|
|
$
|
611,468
|
|
At
September 30, 2018 and December 31, 2017, prepaid expenses and
other current assets consisted of the following:
|
|
|
September 30,
2018
|
|
|
December 31,
2017
|
|
||
|
Prepaid rent
|
|
$
|
2,954
|
|
|
$
|
50,417
|
|
|
Prepaid insurance
|
|
|
15,497
|
|
|
|
92,322
|
|
|
Prepaid inventory
|
|
|
15,382
|
|
|
|
2,993
|
|
|
Prepaid services and consulting agreements, current
|
|
|
310,000
|
|
|
|
—
|
|
|
|
|
$
|
343,833
|
|
|
$
|
145,732
|
|
17
BRIGHT MOUNTAIN MEDIA, INC. AND SUBSIDIARIES
NOTES TO CONDENSED CONSOLIDATED FINANCIAL STATEMENTS
SEPTEMBER 30, 2018
(Unaudited)
At
September 30, 2018 and December 31, 2017, property and equipment
consisted of the following:
|
|
Useful Lives
|
|
September 30, 2018
|
|
|
December 31, 2017
|
|
||
|
Furniture and fixtures
|
3-5 years
|
|
$
|
78,857
|
|
|
$
|
78,994
|
|
|
Computer equipment
|
3 years
|
|
|
59,511
|
|
|
|
59,511
|
|
|
Leasehold improvements
|
5 years
|
|
|
39,384
|
|
|
|
39,384
|
|
|
Total property and equipment
|
|
|
|
177,752
|
|
|
|
177,889
|
|
|
Less: accumulated depreciation
|
|
|
|
(109,050
|
)
|
|
|
(88,389
|
)
|
|
Total property and equipment, net
|
|
|
$
|
68,702
|
|
|
$
|
89,500
|
|
Depreciation
expense for the three and nine months ended September 30, 2018 and
2017, was $7,809 and $6,777 and $20,661 and $18,925,
respectively.
At
September 30, 2018 and December 31, 2017, respectively, website
acquisitions, net consisted of the following:
|
|
|
September 30,
2018
|
|
|
December 31,
2017
|
|
||
|
Website Acquisition Assets
|
|
$
|
1,367,189
|
|
|
$
|
1,417,189
|
|
|
Less: accumulated amortization
|
|
|
(963,457
|
)
|
|
|
(812,575
|
)
|
|
Less: accumulated impairment loss
|
|
|
(211,197
|
)
|
|
|
(211,197
|
)
|
|
Website Acquisition Assets, net
|
|
$
|
192,535
|
|
|
$
|
393,417
|
|
At
September 30, 2018 and December 31, 2017, respectively, intangible
assets, net consisted of the following:
|
|
Useful Lives
|
|
September 30, 2018
|
|
|
December 31, 2017
|
|
||
|
Tradename
|
5 years
|
|
|
182,000
|
|
|
|
300,000
|
|
|
Customer relationships
|
5 years
|
|
|
439,000
|
|
|
|
502,000
|
|
|
Non-compete agreements
|
5-8 years
|
|
|
198,000
|
|
|
|
312,000
|
|
|
Total Intangible Assets
|
|
|
$
|
819,000
|
|
|
$
|
1,114,000
|
|
|
Less: accumulated amortization
|
|
|
|
(207,750
|
)
|
|
|
(95,999
|
)
|
|
Less: accumulated impairment loss
|
|
|
|
(50,227
|
)
|
|
|
(50,227
|
)
|
|
Intangible assets, net
|
|
|
$
|
561,023
|
|
|
$
|
967,774
|
|
Amortization
expense for the three and nine-month periods ending September 30,
2018 and 2017 was $49,727 and $75,876 and $262,633 and $227,418,
respectively, related to both the website acquisition costs and the
intangible assets.
The
final accounting for the acquisition of as noted in Note 3,
resulted in a decrease in accumulated amortization and amortization
expense and approximately $61,000 as of and for the nine months
ended September 30, 2018.
18
BRIGHT MOUNTAIN MEDIA, INC. AND SUBSIDIARIES
NOTES TO CONDENSED CONSOLIDATED FINANCIAL STATEMENTS
SEPTEMBER 30, 2018
(Unaudited)
The
Company has two identifiable segments as of September 30, 2018;
products and advertising. The products segment sells merchandise
directly to customers thorough e-commerce distributor portals such
as Amazon and eBay, and through our proprietary websites and retail
location. The advertising segment is focused on producing
advertising revenue generated by users “clicking on”
and/or viewing website advertisements utilizing several ad network
partners and direct advertisers and subscription revenue generated
by the sale of access to premium versions of our websites and to
career postings on one of our websites. The subscription revenues
are about 0.7% of the total advertising segment revenue. The
following information represents segment activity for the three and
nine month periods ended September 30, 2018 and 2017.
|
|
|
For the three months ended
|
|
|
For the three months ended
|
|
||||||||||||||||||
|
|
|
September 30, 2018
|
|
|
September 30, 2017
|
|
||||||||||||||||||
|
|
|
Products
|
|
|
Advertising
|
|
|
Total
|
|
|
Products
|
|
|
Advertising
|
|
|
Total
|
|
||||||
|
Revenues
|
|
$
|
203,485
|
|
|
$
|
185,417
|
|
|
$
|
388,902
|
|
|
$
|
589,402
|
|
|
$
|
126,098
|
|
|
$
|
715,500
|
|
|
Intangible amortization
|
|
$
|
21,694
|
|
|
$
|
28,033
|
|
|
$
|
49,727
|
|
|
$
|
31,267
|
|
|
$
|
44,609
|
|
|
$
|
75,876
|
|
|
Depreciation
|
|
$
|
3,025
|
|
|
$
|
4,784
|
|
|
$
|
7,809
|
|
|
$
|
6,468
|
|
|
$
|
309
|
|
|
$
|
6,777
|
|
|
Loss from operations
|
|
$
|
(328,942
|
)
|
|
$
|
(425,043
|
)
|
|
$
|
(753,985
|
)
|
|
$
|
(528,446
|
)
|
|
$
|
47,649
|
|
|
$
|
(480,797
|
)
|
|
Segment assets
|
|
$
|
1,264,661
|
|
|
$
|
3,774,049
|
|
|
$
|
5,038,710
|
|
|
$
|
1,393,662
|
|
|
$
|
2,062,153
|
|
|
$
|
3,455,815
|
|
|
Purchase of assets
|
|
$
|
1,213
|
|
|
$
|
—
|
|
|
$
|
1,213
|
|
|
$
|
—
|
|
|
$
|
207,802
|
|
|
$
|
207,802
|
|
|
|
|
For the nine months ended
|
|
|
For the nine months ended
|
|
||||||||||||||||||
|
|
|
September 30, 2018
|
|
|
September 30, 2017
|
|
||||||||||||||||||
|
|
|
Products
|
|
|
Advertising
|
|
|
Total
|
|
|
Products
|
|
|
Advertising
|
|
|
Total
|
|
||||||
|
Revenues
|
|
$
|
897,536
|
|
|
$
|
1,159,751
|
|
|
$
|
2,057,287
|
|
|
$
|
1,713,688
|
|
|
$
|
329,731
|
|
|
$
|
2,043,419
|
|
|
Intangible amortization
|
|
$
|
116,301
|
|
|
$
|
146,332
|
|
|
$
|
262,633
|
|
|
$
|
93,801
|
|
|
$
|
133,617
|
|
|
$
|
227,418
|
|
|
Depreciation
|
|
$
|
9,014
|
|
|
$
|
11,647
|
|
|
$
|
20,661
|
|
|
$
|
16,753
|
|
|
$
|
2,172
|
|
|
$
|
18,925
|
|
|
Loss from operations
|
|
$
|
(1,052,112
|
)
|
|
$
|
(1,359,487
|
)
|
|
$
|
(2,411,599
|
)
|
|
$
|
(1,373,721
|
)
|
|
$
|
(469,592
|
)
|
|
$
|
(1,843,313
|
)
|
|
Segment assets
|
|
$
|
1,264,661
|
|
|
$
|
3,774,049
|
|
|
$
|
5,038,710
|
|
|
$
|
1,393,662
|
|
|
$
|
2,062,153
|
|
|
$
|
3,455,815
|
|
|
Purchase of assets
|
|
$
|
1,213
|
|
|
|
—
|
|
|
$
|
1,213
|
|
|
$
|
14,305
|
|
|
$
|
207,802
|
|
|
$
|
222,107
|
|
Between
September 2016 and August 2017, the Company issued a series of
convertible notes payable to an executive officer and member of our
board of directors. The notes mature five years from issuance at
which time all principal and interest are payable. Interest rates
on the notes range from 6% to 12% and the notes are convertible at
any time prior to maturity at conversion prices ranging from $0.40
to 0.50 per share. The Company recognized a beneficial conversion
feature when the fair value of the underlying common stock to which
the note is convertible into was in excess of the face value of the
note. For notes payable, under this criteria, the intrinsic value
of the beneficial conversion features was recorded as a debt
discount with a corresponding amount to additional paid in capital.
The debt discount is being amortized to interest over the five-year
life of the note using the effective interest method.
The
principal balance of these notes payable was $2,035,000 at
September 30, 2018 and December 31, 2017 and discounts recognized
upon respective origination dates as a result of the beneficial
conversion feature total $1,018,125. As of September 30, 2018, and
December 31, 2017, the total convertible notes payable to related
party net of discounts was $1,351,186 and $1,198,893, respectively.
See further discussion regarding the above long-term debt to
related parties in Note 13 Subsequent Events.
19
BRIGHT MOUNTAIN MEDIA, INC. AND SUBSIDIARIES
NOTES TO CONDENSED CONSOLIDATED FINANCIAL STATEMENTS
SEPTEMBER 30, 2018
(Unaudited)
Notes Payable
On
November 30, 2016, the Company entered into a promissory note
agreement with an unaffiliated party in the principal amount of
$500,000. The note is unsecured and carries an interest rate of 10%
per annum and matured on June 30, 2018, and the parties have agreed
to extend the maturity to December 31,2018. In the event of default
of any loan provision, the lender can declare all or any portion of
the unpaid principal and interest immediately due and payable.
During the nine-month period ended September 30, 2018 the Company
made payments of $350,000, reducing the note balance to $150,000.
The Company and the lender extended the maturity date to December
31, 2018.
The Company paid $11,004 and
$43,252 interest payments for the three and nine months ended
September 30, 2018, respectively.
In connection with the acquisition of Daily Engage
Media, the Company issued promissory notes totaling $380,000. The
notes have no stated interest rate and matured on September 19,
2018 and the Company is in default pending the final outcome of the
legal matters. The balance of the notes payable at September 30,
2018 and December 31, 2017 were $200,162 and $254,687,
respectively. The Company applied payments made on behalf of the
former company for the year ended December 31, 2017 of $125,313 and
$19,525 for the nine months ended September 30, 2018. In April 2018
the Company paid principal payments of $2,500 to the four note
holders, totaling $10,000 and in July 2018, the Company paid
$25,000.
The Company repaid
$25,000 for the three months ended September 30, 2018 to one
noteholder who extended the terms of the agreement with the Company
for one year. The remaining balance will be paid over a seven-month
period. See further discussion in Note 10, under
Legal.
The Company has a note payable originating from a
prior website acquisition. At the time of the acquisition, the
Company agreed to pay $150,000, payable monthly in an amount equal
to 30% of the net revenues from the website, when collected, with
the total amount of the earn out to be paid by January 4, 2019. The
Company recorded the future monthly payments
totaling $150,000 at a present value of $117,268,
net of a discount of $32,732. The present value was calculated at a
discount rate of 12% using the estimate future revenues. The
balance of the note payable at September 30, 2018 and December 31,
2017, was $58,871 and $67,895 net of discounts of $3,637 and
$11,820 respectively.
Interest expense on notes payable was
$16,014 and $5,912 and $41,217 and
$75,663 for the three and nine-month periods ended September 30,
2018 and 2017, respectively, inclusive of amortization of the debt
discount of $2,728 and $2,728 and $8,062 and $3,637 for the three
and nine months ended September 30, 2018 and 2017,
respectively.
Interest expense on
notes payable – related party was
$101,526 and $95,478 and $303,033 and $220,610 for
the three and nine month periods ended September 30, 2018 and 2017,
respectively, inclusive of amortization of debt discount totaled
$51,293 and $49,595 and $152,293 and $116,863,
respectively.
The
Company leases its corporate offices at 6400 Congress Avenue, Suite
2050, Boca Raton, Florida 33487 under a long-term non-cancellable
lease agreement expiring on October 31, 2021. The lease terms
required base rent payments of approximately $7,260 per month for
the first twelve months commencing in September 2018, with a 3%
escalation each year. Included in other assets is a required
security deposit of $18,100. Rent is all-inclusive and includes
electricity, heat, air-conditioning, and water.
The
Company leases retail space for its product sales division at 4900
Linton Boulevard, Bay 17A, Delray Beach, FL 33445 under a two
long-term, non-cancellable lease agreement, which contain renewal
options. The leases commenced in January 2017 and are in effect for
a period of five years. Minimum base rentals total approximately
$6,000 per month, escalating 3% per year thereafter. The Company
also provided a $10,000 security deposit and prepaid $96,940 in
future rents on the facility through the funding of certain
leasehold improvements. Prepaid rent totaled $7,826 and $50,417 at
September 30, 2018 and December 31, 2017,
respectively.
The
Company leases a warehouse facility in Orlando, Florida consisting
of approximately 2,667 square feet. The lease commenced in April
2016, expiring in April 2021 with an initial base rental rate of
$1,641 per month, and escalating at approximately 3% per year
thereafter.
Rent
expense for the three and nine months ended September 30, 2018 and
2017 was $68,664 and $72,155 and $206,590 and $190,080,
respectively.
20
BRIGHT MOUNTAIN MEDIA, INC. AND SUBSIDIARIES
NOTES TO CONDENSED CONSOLIDATED FINANCIAL STATEMENTS
SEPTEMBER 30, 2018
(Unaudited)
Legal
Effective July 18,
2018 we terminated the employment agreements with each of Messrs.
Harry G. Pagoulatos and George G. Rezitis for cause. Messrs.
Pagoulatos and Rezitis had been employed by us as chief operating
officer and chief technology officer, respectively, of our Daily
Engage Media subsidiary since our acquisition of that company in
September 2017. Mr. Todd Speyer, our Vice President, Digital and a
member of our board of directors, have assumed operating
responsibilities for Daily Engage Media. While the malfeasance of
Messrs. Harry G. Pagoulatos and George G. Rezitis giving rise to
their for cause termination adversely affected our results of
operations for the third quarter, we do not expect that these
terminations will result in any material, long-term change in the
operations of Daily Engage Media.
In
connection
with the matters which lead to our termination for cause of Messrs.
Pagoulatos and Rezitis described below, in July 2018 we filed
a
Verified
Complaint for injunctive relief and damages
against Messrs. Pagoulatos and Rezitis in the Circuit Court of the
15th Judicial Circuit in and
for
Palm Beach
County, Florida (case number 502018CA008972XXXXMB) alleging their
failure, among other things, to provide us with certain login codes
and passwords as well as reporting other current information about
Daily
Engage
Media's business. That matter was
removed to the Southern District of Florida, United States District
Court and ultimately stayed and closed pending a determination of
jurisdiction by the pending New Jersey action described
below.
In
July
of 2018, Messrs. Pagoulatos and Rezitis
,
along with a
third party who had been a minority owner in Daily Engage Media
prior to our acquisition of that company, filed a Complaint in the
U.S. District Court, District of New Jersey (case
number
2:18-cv-11357-ES-SCM) against our company and
our
Chief
Executive Officer,
seeking
compensatory and punitive damages and
attorneys
'
fees
,
among other items, and
alleging
,
among other items
,
fraud and
breach of contract. We
vehemently
deny all allegations in the complaint and believe
them to be without merit. We filed a Motion to Dismiss this case
for a multitude of reasons including, but not restricted to,
failure to state a cause of action and jurisdictional and venue
arguments as the acquisition and employment agreements provides
that any dispute should be heard in either the state or local
courts of Palm Beach County, Florida. At the appropriate juncture,
we
also
intend to serve a Rule 11 Motion for Sanctions
based upon the fact that the Complaint contains frivolous arguments
or arguments with no evidentiary support.
In
connection with the Daily Engage Media acquisition, the Company
entered into three-year employment agreements with two former
members of the entity. Under these agreements, the Company is
obliged to pay base salaries of $65,000 and $70,000, respectively
to the employees with an increase to $75,000 each in the second
year of the agreement as well as bonuses to be paid at the
discretion of the board of directors. See Legal discussion for
further discussion.
As
described above, the principles of Daily Engage Media failed to
disclose an obligation of approximately $200,000. The obligation is
included in accrued expenses at September 30, 2018 and the net
assets acquired from Daily Engage Media have been adjusted as
disclosed in Note 3. A lawsuit has been filed in New York state
court to collect this obligation. We intend to vigorously defend
this motion.
From
time-to-time, we may be involved in litigation or be subject to
claims arising out of our operations or content appearing on our
websites in the normal course of business. Although the results of
litigation and claims cannot be predicted with certainty, we
currently believe that the final outcome of these ordinary course
matters will not have a material adverse effect on our business.
Regardless of the outcome, litigation can have an adverse impact on
our company because of defense and settlement costs, diversion of
management resources and other factors. See Subsequent Events Note
13 for further discussion and Part II, Item 1, Legal
Proceedings.
Other Commitments
On
September 5, 2018 the Company entered into a Master Services
Agreement with Kubient, Inc. pursuant to which it will provide its
programmatic technology platform to us on a non-exclusive basis for
the purpose of managing our programmatic business partners.
Kubient, Inc. will create a white label reporting portal for the
Company and assist us in onboarding our existing RTB (real-time
bidding) clients to the new Kubient platform. The Company did not
pay anything to Kubient, Inc. for the three and nine months ended
September 30, 2018.
Under
the terms of the two-year agreement, we agreed to pay Kubient, Inc.
a percentage of gross billable revenue for all of our RTB activity
on the platform. The initial term of the agreement automatically
renewed for additional one year term, unless terminated by either
party upon 90 days prior notice of non-renewal. The agreement may
be terminated by either party, without cause, after the first 90
days of the term upon 30-day notice to the other party. In
addition, the agreement may be terminated by either party for
breach if not cured on 30-day notice, or upon insolvency or
bankruptcy proceedings against either party, subject to cure
periods. The agreement contains customary confidentiality and
intellectual property ownership provisions.
21
BRIGHT
MOUNTAIN MEDIA, INC. AND SUBSIDIARIES
NOTES TO CONDENSED CONSOLIDATED FINANCIAL STATEMENTS
SEPTEMBER 30, 2018
(Unaudited)
Other Commitments (continued)
On
September 28, 2018 Bright Mountain Media, Inc. entered into a
non-binding letter of intent with Kubient, Inc. pursuant to which
we may acquire Kubient, Inc. in an all stock transaction.
Based in New York City,
Kubient, Inc. is a video advertising technology company which
offers a full stack programmatic platform designed to increase
publisher revenue and lower advertiser cost across the video
advertising ecosystem. The closing of the transaction is subject to
customary conditions precedent including satisfactory due diligence
by us, the execution of definitive agreements, including an
employment agreement with Mr. Paul Roberts, the Chief Executive
Officer of Kubient, Inc., and approval by the Kubient, Inc.
stockholders.
On
September 6, 2017 Bright Mountain Media, Inc. entered into a five
year Consulting Agreement with the Spartan Capital Securities, LLC
(“Spartan Capital”), a broker-dealer and member of
FINRA, which under its terms would not become effective until the
closing of the private placement in which Spartan Capital served as
placement agent as described below. The Consulting Agreement became
effective on September 28, 2018 and, accordingly, Spartan Capital
was engaged to provide advisory services including, but not limited
to advice and input with respect to raising capital, assisting us
with strategic introductions, and assisting management with
enhancing corporate and shareholder value. The consulting agreement
calls for an initial fee of $200,000 as consideration for the
termination of a prior agreement between the Company and Spartan.
The consulting agreement also calls for payments of $5,000 per
month for a term of 60 months to be prepaid upon the effective date
of the agreement. In addition, the Company issued Spartan Capital
1,000,000 shares of our common stock valued at $750,000 (the
“Consulting Shares”) in accordance with the consulting
agreement.
On
September 6, 2017 we also entered into a five-year M&A Advisory
Agreement with Spartan Capital which became effective on September
28, 2018 upon the completion of the private placement for sixty
months. Under the terms of the agreement, Spartan Capital will
provide consulting services to us related to potential mergers or
acquisitions, including candidates, valuations and transaction
terms and structures. As consideration for the M&A advisory
service we paid Spartan Capital a fee of $500,000 on the effective
date of the agreement.
The
$200,000 initial consulting fee was expensed upon payment and is
included in selling, general and administrative expenses for the
three and nine months ended September 30, 2018. Consulting fees
consisting of $300,000 in cash and $750,000 in common stock as well
as the $500,000 M&A advisory fee are considered prepaid
expenses, of which $310,000 is considered short-term and is
included in prepaid expenses and other current assets as of
September 30, 2018. These prepaid expenses will be amortized over
60 months, the term of the respective agreements.
For the 36
months from the final closing of this private placement, Spartan
Capital has certain rights of first refusal if we decide to
undertake a future private or public offering or if we decide to
engage an investment banking firm.
The
Company granted the purchasers in the offering demand and
piggy-back registration rights with respect to the shares of our
common stock included in the Units and the shares of common stock
issuable upon the exercise of the Private Placement Warrants. In
addition, the Company agreed to file a resale registration
statement within 120 days following the final closing of this
offering covering the shares of common stock issuable upon the
exercise of the Private Placement Warrants included in the Units.
If the Company should fail to timely file this resale registration
statement, then within five business days of the end of month we
will pay the holders an amount in cash, as partial liquidated
damages, equal to 2% of the aggregate purchase price paid by the
holder for each 30 days, or portion thereof, until the earlier of
the date the deficiency is cured or the expiration of six months
from filing deadline. The Company will keep any such registration
statement effective until the earlier of the date upon which all
such securities may be sold without registration under Rule 144
promulgated under the Securities Act or the date which is six
months after the expiration date of the Private Placement Warrants.
We are obligated to pay all costs associated with this registration
statement, other than selling expenses of the holders.
Additional
terms of the Private Placement Warrants include:
|
●
|
standard
anti-dilution provisions;
|
|
|
|
|
●
|
become
subject to a “cashless exercise” under certain
conditions; and
|
|
|
|
|
●
|
certain
call provisions at $0.01 per warrant if our stock trades at or
above $1.50 per share for 10 consecutive trading days with an
average daily trading volume of not less than 30,000 shares during
such 10 consecutive trading day period.
|
The
exercise price of the Placement Agent Warrants is also subject to
the proportional adjustment in the event of stock splits, stock
dividends and similar corporate events, and may be exercised on a
cashless basis. We also granted Spartan Capital piggy-back
registration rights with respect to the shares of our common stock
issuable upon the exercise of the Placement Agent
Warrants.
22
BRIGHT MOUNTAIN MEDIA, INC. AND SUBSIDIARIES
NOTES TO CONDENSED CONSOLIDATED FINANCIAL STATEMENTS
SEPTEMBER 30, 2018
(Unaudited)
Preferred Stock
The
Company has authorized 20,000,000 shares of preferred stock with a
par value of $0.01 (the "Preferred Stock"), issuable in such series
and with such designations, rights and preferences as the board of
directors may determine. The Company's board of directors has
previously designated five series of preferred stock, consisting of
10% Series A Convertible Preferred Stock ("Series A Stock"), 10%
Series B Convertible Preferred Stock ("Series B Stock"), 10% Series
C Convertible Preferred Stock ("Series C Stock"), 10% Series D
Convertible Preferred Stock ("Series D Stock") and 10% Series E
Convertible Preferred Stock ("Series E Stock"). At September 30,
2018, there were 100,000 shares of Series A Stock and 2,312,500
shares of Series E Stock issued and outstanding. There are no
shares of Series B Stock, Series C Stock or Series D Stock issued
and outstanding.
The
Series A Stock is senior to all other classes of the Company's
securities and has a stated value of $0.50 per share. Holders of
shares of Series A Stock are entitled to the payment of a 10%
dividend payable in shares of the Company’s common stock at a
rate of one share of common stock for each 10 shares of
Series A Stock, payable annually the 10th business day of
January. The shares of Series A Stock are redeemable at the
Company's option upon 20 days’ notice for an amount equal to
the amount of capital invested. In January 2018 the Company paid
10,000 shares of common stock dividends to the Series A
Stockholder of record as dividends on the Series A
Stock.
On
September 6, 2017, the board of directors designated 2,500,000
shares of Preferred Stock as Series E Stock, which such designation
was amended on September 29, 2017. Holders of shares of Series E
Stock are entitled to 10% dividends, payable monthly as may be
permitted under Florida law out of funds legally available
therefor. The shares of Series E Stock rank senior to any other
class of our equity securities, except for the Series A Stock, have
a liquidation preference of $0.40 per share and are not
redeemable.
The
remaining designations, rights and preferences of each of the
Series A Stock and Series E Stock are identical, including (i)
shares do not have voting rights, except as may be permitted under
Florida law, (ii) are convertible into shares of our common stock
at the holder's option on a one for one basis, (iii) are entitled
to a liquidation preference equal to a return of the capital
invested, and (iv) each share will automatically convert into
shares of common stock five years from the date of issuance or upon
a change in control. Both the voluntary and automatic conversion
formulas are subject to proportional adjustment in the event of
stock splits, stock dividends and similar corporate
events.
In
September 2017, Mr. W. Kip Speyer, an executive officer and member
of our board of directors, purchased an aggregate of 500,000 shares
of Series E Stock at a purchase price of $0.40 per share. The
Company used the proceeds from these sales for working
capital.
Dividends paid to Mr.
W. Kip Speyer were $20,838 and $58,069 for the three and nine
months ended September 30, 2018, respectively.
During
the nine months ended September 30, 2018 periods, Mr. W. Kip
Speyer, an executive officer and member of our board of directors,
purchased an aggregate of 937,500 shares of Series E Stock at a
purchase price of $0.40 per share. The Company used the proceeds
from these sales for working capital.
Stock issued for cash
In
August 2017 the Company issued 125,000 shares of its common stock
for $50,000 or $0.40 per share to a private investor.
Between January 2018 and September 2018, the
Company sold an aggregate of 10,100,000 units of its securities to
71
accredited investors in a private placement exempt from
registration under the Securities Act in reliance on exemptions
provided by Section 4(a)(2) and Rule 506(b) of Regulation D
resulting in gross proceeds to the
Company of $4,040,000. Each unit, which was sold at a
purchase price of $0.40, consisted of one share of common stock and
one five-year warrant to purchase one share of common stock at an
exercise price of $0.65 per share. Spartan Capital served as
placement agent for the Company in this offering. As
compensation for its services, the Company paid Spartan Capital
commissions totaling $404,000,
and issued Spartan Capital
Placement Agents Warrants to purchase an aggregate of 1,010,000
shares of our common stock, including the cash commission and
Placement Agent Warrants issued pursuant to the final closing on
September 28, 2018
included in the
Company’s condensed consolidated statement of changes in
shareholders’ equity for the nine months ended September 30,
2018
. We used $1.0 million of these proceeds from this final
closing for the payment of the fees due Spartan Capital under the
terms of the Consulting Agreement and M&A Advisory Agreement
described above, and are using the balance for general working
capital.
23
BRIGHT
MOUNTAIN MEDIA, INC. AND SUBSIDIARIES
NOTES TO CONDENSED CONSOLIDATED FINANCIAL STATEMENTS
SEPTEMBER 30, 2018
(Unaudited)
NOTE 11 – SHAREHOLDERS’ EQUITY
(continued).
Stock issued for cash (continued)
The
Company issued Spartan Capital five-year placement agent warrants
to purchase an aggregate of 1,010,000 shares of the Company's
common stock at an exercise price of $0.65 per share. During the
period January 2018 to March 2018, warrants to purchase an
aggregate of 176,250 of the Company's common stock were valued at
$95,552 using the Black-Scholes model to value the warrants based
on a risk-free rate of l 0% based on recent borrowing costs and a
volatility of 214%. The Company recorded the warrants as
professional fees in the condensed consolidated statement of
operations however management subsequently determined that based on
the services specified in the agreement, the fees incurred from the
warrant issuance were solely for the purpose of raising capital in
connection with the private placement discussed above. As a result,
the fees are considered an offering cost and should have been
reflected as a component of shareholders' equity. The net impact of
this adjustment on the interim period financials statements was not
significant.
During the second and
third
quarters of 2018, upon reviewing similar companies in our industry,
management determined that the volatility and risk-free rate
utilized was significantly higher than our peers. The Company used
a 2% risk-free interest rate and a volatility of approximately 62%
for the valuation of the warrants issued during the period. Based
on this, during the period from April 2018 to September 2018,
warrants to purchase an aggregate of 833,750 of the Company's
common stock were valued at $319,258. Management believes the
current assumptions are more in-line with our peer group and closer
to our anticipated results.
Stock issued for services
In
September 2018, the Company issued 10,000 shares of common stock to
a consultant for services rendered based on the fair value at the
date of grant, or $0.75 per share valued at $7,500.
On
January 16, 2017, the Company issued to a consultant 3,600 shares
of its common stock at $0.85 per share, or $3,060, for services
rendered. The Company valued these common shares based on the fair
value at the date of grant.
On
April 25, 2017 the Company issued 28,500 shares of its common stock
with a fair value of $22,800 on the date of issuance for
compensation to employees and officers.
As
discussed further in Note 10, the Company issued 1,000,000 shares
of common stock at $0.75 per share for consulting
services.
Stock issued for dividends
In
January 2018, the Company issued 10,000 shares of its common stock
as dividends to the holder of its Series A preferred
stock.
Stock issued for acquisition
On
September 19, 2017, the Company issued 1,100,233 shares of its
common stock with a fair value of $429,091 for the acquisition of
Daily Engage Media.
Stock
Incentive Plan and Stock Option Grants to Employees and
Directors
The
Company recorded $5,753 and $21,983 stock compensation for the
three months ended September 30, 2018 and 2017 and $19,961 and
$95,821 for the nine months ended September 30, 2018 and 2017,
respectively. The stock compensation expense has been recognized as
a component of selling, general and administrative expenses in the
accompanying unaudited condensed consolidated financial
statements.
As
of September 30, 2018, there were total unrecognized compensation
costs related to non-vested share-based compensation arrangements
of $15,844 to be recognized through August 2020. As disclosed
further in Note 10, the Company issued 1,000,000 shares of common
stock at $0.75 per share for consulting services.
24
BRIGHT
MOUNTAIN MEDIA, INC. AND SUBSIDIARIES
NOTES TO CONDENSED CONSOLIDATED FINANCIAL STATEMENTS
SEPTEMBER 30, 2018
(Unaudited)
A
summary of the Company's stock option activity during the nine
months ended September 30, 2018 is presented below:
|
|
|
Number of
Options
|
|
|
Weighted Average
Exercise
Price
|
|
|
Weighted Average
Remaining
Contractual
Term
|
|
|
Aggregate
Intrinsic
Value
|
|
||||
|
Balance Outstanding, December 31, 2017
|
|
|
2,027,000
|
|
|
$
|
0.37
|
|
|
|
5.4
|
|
|
$
|
543,626
|
|
|
Granted
|
|
|
—
|
|
|
|
—
|
|
|
|
—
|
|
|
|
—
|
|
|
Exercised
|
|
|
—
|
|
|
|
—
|
|
|
|
—
|
|
|
|
—
|
|
|
Forfeited
|
|
|
—
|
|
|
|
—
|
|
|
|
—
|
|
|
|
—
|
|
|
Expired
|
|
|
—
|
|
|
|
—
|
|
|
|
—
|
|
|
|
—
|
|
|
Balance Outstanding, September 30, 2018
|
|
|
2,027,000
|
|
|
$
|
0.37
|
|
|
|
4.7
|
|
|
$
|
704,756
|
|
|
Exercisable at September 30, 2018
|
|
|
1,834,000
|
|
|
$
|
0.38
|
|
|
|
4.4
|
|
|
$
|
693,616
|
|
Summarized
information with respect to options outstanding under the three
option plans at September 30, 2018 is as follows:
|
|
|
|
|
Options Outstanding
|
|
|
Options Exercisable
|
|
|||||||||||||||||||
|
|
Range or
Exercise Price
|
|
|
Number
Outstanding
|
|
|
Remaining
Average
Contractual Life
(In Years)
|
|
|
Weighted
Average
Exercise
Price
|
|
|
Number
Exercisable
|
|
|
Weighted
Average
Exercise
Price
|
|
|
Remaining Average
Conversion Life
(In Years)
|
|
|||||||
|
|
|
0.14 - 0.24
|
|
|
|
720,000
|
|
|
|
0.8
|
|
|
$
|
0.14
|
|
|
|
720,000
|
|
|
$
|
0.14
|
|
|
|
.09
|
|
|
|
|
0.25 - 0.49
|
|
|
|
351,000
|
|
|
|
0.8
|
|
|
$
|
0.28
|
|
|
|
351,000
|
|
|
$
|
0.28
|
|
|
|
.08
|
|
|
|
|
0.50 - 0.85
|
|
|
|
956,000
|
|
|
|
3.1
|
|
|
$
|
0.67
|
|
|
|
763,000
|
|
|
$
|
0.66
|
|
|
|
2.7
|
|
|
|
|
|
|
|
|
2,027,000
|
|
|
|
4.7
|
|
|
$
|
0.37
|
|
|
|
1,834,000
|
|
|
$
|
0.38
|
|
|
|
4.4
|
|
The
Company has historically purchased a substantial amount of its
products from two vendors; Citizens Watch Company of America, Inc.,
and Bulova Corporation. During the nine months ended September 30,
2018, purchases from Botta, Citizens, Bulova and Pierre Laurent
accounted for approximately 17%, 15%,19% and 11%, of the watch
products purchased, respectively, as compared to 57% and 19%, for
Citizens and Bulova, respectively, for the nine months ended
September 30, 2017.
Three
Black Helmet Apparel vendors have been identified as having a high
concentration. During the nine months ended September 30, 2018
purchases from Alpha Broder, Enemy Ink, and TSF Sportswear, LLC
accounted for 11%, 25%, and 18% of the Black Helmet products
purchased, respectively.
Although
we continue to add additional product vendors and we continue to
expand our product line and vendor relationships, due to continued
high concentration and reliance on these three vendors, the loss of
one of these two vendors could adversely affect the Company's
operations.
The
Company generates revenues from two segments: product sales and
advertising. The sharp increase in PayPal/eBay concentration is due
to our acquisition of the Black Helmet Apparel business in December
2016. Due to high concentration and reliance on these portals, the
loss of a working relationship with either of these two portals
could adversely affect the Company's operations. In addition,
a substantial amount of payments for our products sold are
processed through PayPal and Amazon. A disruption in PayPal or
Amazon payment processing could have an adverse effect on the
Company's operations and cash flow. During the three and nine
months ended September 30, 2018, PayPal and Amazon accounted for
23% and 8% and 55% and 22%, respectively, of our total product
sales as compared to 41% and 44% and 41% and 53% in the three and
nine months ended September 30, 2017, respectively. The Company
replaced the DriveCMS software with Shopify in May 2018 to the
Black Helmet website and the revenues attributable to this
relationship were 65% and 37% for the three and nine months ended
September 30, 2018, respectively.
25
BRIGHT
MOUNTAIN MEDIA, INC. AND SUBSIDIARIES
NOTES TO CONDENSED CONSOLIDATED FINANCIAL STATEMENTS
SEPTEMBER 30, 2018
(Unaudited)
Credit Risk
The
Company minimizes the concentration of credit risk associated with
its cash by maintaining its cash with high quality federally
insured financial institutions. However, cash balances in excess of
the FDIC insured limit of $250,000 are at risk. At September 30,
2018 one cash account had a balance of $487,079 and at December 31,
2017 the Company had no cash balances in excess of the FDIC insured
limit.
Concentration of Funding
During
the nine months ended September 30, 2018, the Company's funding was
provided primarily through the sale of 10,100,0000 units of our
securities to 71 accredited investors in a private placement exempt
from registration under the Securities Act in reliance on
exemptions provided by Section 4(a)(2) of the act and Rule 506(b)
of Regulation D, resulting in gross proceeds to us of $4,040,000.
Each Unit, which was sold at a purchase price of $0.40,
consisted of one share of common stock and one five-year warrant to
purchase one share of common stock at an exercise price of $0.65
per share. Spartan Capital served as placement agent for us
in this offering. As compensation for its services, we paid
Spartan Capital cash commissions totaling $404,000 and issued
five-year placement agent warrants to purchase an aggregate of
1,010,000 shares of our common stock at an exercise price of $0.65
per share. After payment of our offering expenses including
legal, accounting, printing and other related expenses, we are
using the net proceeds for working capital as well as payments to
Spartan Capital for finder’s fees and M&A Advisory
fees.
On
September 6, 2017 Bright Mountain Media, Inc. entered into a five
year Consulting Agreement with the Spartan Capital which under its
terms would not become effective until the closing of the maximum
offering of our securities in a private placement in which Spartan
Capital served as placement agent as described below. On September
28, 2018 the Consulting Agreement became effective and Spartan
Capital was engaged to provide such advisory services that we may
reasonably request related to general corporate matters, including,
but not limited to advice and input with respect to raising
capital, assisting us with strategic introductions, and assisting
management with enhancing corporate and shareholder value. As
compensation for these services, on the effective date of the
agreement we paid Spartan Capital $500,000. The Company issued
Spartan Capital 1,000,000 shares of the Company’s common
stock valued at $750,000 (the “Consulting Shares”)
included in prepaid expenses and other assets.
On
September 6, 2017 we also entered into a five-year M&A Advisory
Agreement with Spartan Capital which became effective on September
28, 2018 following the sale of the maximum offering in the private
placement described below. Under the terms of the agreement,
Spartan Capital will provide consulting services to us related to
potential mergers or acquisitions, including candidates, valuations
and transaction terms and structures. As compensation, we paid
Spartan Capital a fee of $500,000 on the effective date of the
agreement.
Between
January 2018 and September 2018, Mr. W. Kip Speyer, an executive
officer and member of our board of directors, purchased an
aggregate of 937,500 shares of our 10% Series E convertible
preferred stock, resulting in gross proceeds to us of $375,000. We
did not pay any commissions or finders fees, and the sales were
made to Mr. Speyer, an accredited investor, in transactions exempt
from registration under the Securities Act in reliance on
exemptions provided by Section 4(a)(2) of that act. Dividends to
Mr. W. Kip Speyer were $20,838 and $58,069 for the three and nine
months ended September 30, 2018, respectively.
On
November 5, 2018 the Company filed Articles of Amendment to our
Amended and Restated Articles of Incorporation, as amended,
which:
|
●
|
returned 1,000,000 shares of previously designated 10% Series B
Convertible Preferred Stock, 2,000,000 shares of previously
designated 10% Series C Convertible Preferred Stock and 2,000,000
shares of previously designated 10% Series D Convertible Preferred
Stock to the status of authorized but undesignated and unissued
shares of our blank check preferred stock as there were no shares
of any of these series outstanding and no intention to issue any
such shares in the future; and
|
|
|
|
|
●
|
created three new series of preferred stock, 12% Series F-1
Convertible Preferred Stock (“Series F-1”) consisting
of 2,177,233 shares, 6% Series F-2 Convertible Preferred Stock
(“Series F-2”) consisting of 1,408,867 shares, and 10%
Series F-3 Convertible Preferred Stock (“Series F-3”)
consisting of 757,917 shares.
|
26
The
Series F-1 pays dividends at the rate of 12% per annum and
automatically converts into shares of our common stock on April 10,
2022. The Series F-2 pays dividends at the rate of 6% per annum and
automatically converts into shares of our common on July 27, 2022.
The Series F-3 pays dividends at the rate of 10% per annum and
automatically converts into shares of our common stock on August
30, 2022. In the event of a liquidation or winding up of our
company, the shares have a liquidation preference of $0.50 per
share for the Series F-1, $0.50 per share for the Series F-2 and
$0.40 per share for the Series F-3.
The
designations, rights and preferences of the Series F-1, Series F-2
and Series F-3 are identical, other than the dividend rate,
liquidation preference and date of automatic conversion into shares
of our common stock. Each of the series F preferred are convertible
to one share of common stock at any time at the option of the
holder. The shares have no voting rights and are not mandatorily
redeemable. Dividends are payable monthly in arrears at their
respective stated rates.
On
November 7, 2018 the Company entered into a Note Exchange Agreement
with Mr. W. Kip Speyer, our CEO and member of our Board of
Directors, pursuant to which we exchanged our convertible notes for
three new series of preferred stock as outlined below:
|
●
|
$1,075,000
principal amount and accrued but unpaid interest due Mr. Speyer
under 12% Convertible Promissory Notes maturing between September
26, 2021 and April 10, 2022 for 2,177,233 shares of our newly
created Series F-1 Convertible Preferred Stock in full satisfaction
of those notes;
|
|
|
|
|
●
|
$660,000
principal amount and accrued but unpaid interest due Mr. Speyer
under 6% Convertible Promissory Notes maturing between April 19,
2022 and July 27, 2022 for 1,408,867 shares of our newly created
Series F-2 Convertible Preferred Stock in full satisfaction of
those notes; and
|
|
|
|
|
●
|
$300,000
principal amount and accrued but unpaid interest due Mr. Speyer
under 10% Convertible Promissory Notes maturing between August 1,
2022 and August 30, 2022 for 757,197 shares of our newly created
Series F-3 Convertible Preferred Stock in full satisfaction of
those notes.
|
The
remaining discount attributed to these notes will be recognized to
interest expense in the fourth quarter of 2018.
On
November 12, 2018 the Company issued a 10% convertible promissory
note in the amount of $30,000 that has a beneficial conversion
to a related party, to our Chief Executive Officer. The note
matures five years from issuance and is convertible at the option
of the holder into shares of common stock at any time prior to
maturity at a conversion price of $0.40 per share. A
beneficial conversion feature exists on the date a convertible note
is issued when the fair value of the underlying common stock to
which the note is convertible into is in excess of the face value
of the note.
On
October 31, 2018, the Company entered into a Finder’s
Agreement with the Spartan Capital which provides that, in
consideration for Spartan Capital introducing Kubient, Inc. to us,
Spartan Capital will be entitled to a non-refundable fee of
$160,000 which will be payable within three days after the final
closing of the full amount of the over-allotment option, and, if
the acquisition of Kubient, Inc. is completed, Spartan Capital will
be entitled to receive a number of shares of our common stock equal
to 3% of the number of shares of our common stock issued to
Kubient, Inc. or its shareholders in connection with the
acquisition. In addition, if within three years from the date of
the Finder’s
Agreement
we complete a financing transaction for which a broker-dealer
introduced to us by Spartan Capital serves as placement agent or
underwriter, we will be required to pay Spartan Capital a cash fee
equal to 2% of the aggregate proceeds raised in the financing and
issue to Spartan Capital warrants to purchase a number of shares of
our common stock equal to 2% of the number of shares of common
stock (and/or shares of common stock issuable upon exercise of
securities or upon conversion or exchange of convertible or
exchangeable securities) sold in the offering. The Finder’s
Agreement further provides that if within three years from the date
of the Finder’s Agreement we complete a merger, acquisition
or sale of stock or assets, joint venture, strategic alliance or
similar transaction (the “Alternative Transaction”),
regardless of
whether Spartan
Capital introduced the other party to the Alternative Transaction,
then Spartan Capital will be entitled to a fee equal to 3% of the
amount of the consideration paid or received by us or our
shareholders in such transaction, which fee will be payable in
shares of our common stock valued at the volume weighted average
price of our common stock for the 10 trading days preceding the
closing of the Alternative Transaction. The foregoing
notwithstanding, if Spartan Capital has not introduced the other
party to the Alternative Transaction to the Company, a fee shall
only be paid if Spartan Capital has, on a continuous basis,
provided substantive merger and acquisition support services and
advice as reasonably requested by the Company.
27
On
October 3, 2018 the Company lent Kubient, Inc. $75,000. The terms
of the unsecured note provide that it pays interest at 6% per annum
and the principal and interest is due on January 31,2019,
provided, however
, that if
the share exchange or merger as contemplated by the non-binding
letter of intent with Kubient, Inc. is consummated on or prior to
the maturity date, the outstanding principal of the note shall be
forgiven by us and the purchase price contemplated by the
non-binding letter of intent will be reduced by 100,000 shares
(i.e., $75,000 divided by $0.75 per share).
On
October 31, 2018
Mr. W. Kip Speyer, an
executive officer and member of our board of directors, purchased
an 187,500 shares of our 10% Series E convertible preferred stock,
resulting in gross proceeds to us of $75,000.
28
The
following discussion of our unaudited condensed consolidated
financial condition and results of operations for the three months
ended September 30, 2018 and 2017 should be read in conjunction
with the unaudited condensed consolidated financial statements and
the notes to those statements that are included elsewhere in this
report. Our discussion includes forward-looking statements based
upon current expectations that involve risks and uncertainties,
such as our plans, objectives, expectations and intentions. Actual
results and the timing of events could differ materially from those
anticipated in these forward-looking statements as a result of a
number of factors, including those set forth later in this report
under Part II, Item 1A. in Item 1A. Risk Factors in our Annual
Report on Form 10-K for the year ended December 31, 2017 as filed
with the Securities and Exchange Commission on April 2, 2018 (the
“2017 10-K”) and our other filings with the SEC. We use
words such as “anticipate,” “estimate,”
“plan,” “project,”
“continuing,” “ongoing,”
“expect,” “believe,” “intend,”
“may,” “will,” “should,”
“could,” and similar expressions to identify
forward-looking statements. All information in this section for the
three and nine months ended September 30, 2018 and 2017 is
unaudited and derived from the unaudited condensed consolidated
financial statements appearing elsewhere in this report; unless
otherwise noted, all information for the year ended December 31,
2017 is derived from our audited consolidated financial statements
appearing in the 2017 10-K.
Executive Overview of Third Quarter 2018 Results
Our key
user metrics and financial results for the third quarter of 2018,
which include certain charges related to our financing with Spartan
Capital, are more fully discussed and described on pages 32 and 33
and should be read in context with the disclosure on this page. The
third quarter results are as follows:
|
User metrics:
|
●
Quarterly ad
impressions delivered were approximately 285 million in the third
quarter of 2018, a 90% increase over the third quarter 2017 with
most of the increase following our acquisition of Daily Engage
Media.
●
Delivered over 57
million advertisements on our owned and managed
websites.
|
Third quarter 2018 financial results:
|
●
Advertising revenue
increased 47% in the third quarter of 2018 from the third quarter
of 2017;
●
Product
sales revenue decreased 65.5% in
the third quarter of 2018 from the third quarter of 2017 which
reflects our shift in emphasis to our advertising
segment;
●
Total
revenue decreased 45.6% when compared to the third quarter of
2017;
●
Gross
profit decreased 59.1% in the third quarter of 2018 from the third
quarter of 2017 due to adverse conditions in Daily Engage Media and
lower margins on product sales;
●
Selling, general
and administrative expenses increased 10.8% in the third quarter
2018 compared to the third quarter of 2017;
●
Loss
from operations was $753,985 for the third quarter of 2018 as
compared to $480,797 for the comparable period in
2017;
●
Net
loss attributable to common stockholders was $894,937 for the third
quarter of 2018 as compared to $583,077 for the comparable period
in 2017;
●
Adjusted EBITDA was
$(682,042) for the third quarter of 2018 as compared to $(375,929)
for the comparable period in 2017;
●
Net
cash used in operations was $3,061,848 for the first nine months of
2018 as compared to $1,368,454 for the first nine months of
2017.
29
Overview
Bright
Mountain Media is a digital media holding company for online
publications, advertising services and software primarily focused
on serving large audience segments as well as brands trying to
reach them. We do this by connecting advertisers and brands with
consumers through a full suite of advertising services that
incorporates an ad network, multiple real-time biding platforms and
25 websites (owned and managed) that provide content, services and
products. Bright Mountain Media’s owned and managed websites
primarily provide content and services to US military and veteran
audiences, as well as first responders and their families. We have
also recently begun expanding our footprint to provide advertising
services to audiences and advertisers globally
We
generate revenue
from two segments:
advertising and product sales. Advertising services generates
revenue from advertisements (ad impressions) placed on our owned
and managed sites, as well as from advertisements we place on
partner websites, for which we earn a share of the revenue. We also
generate advertising services revenue from facilitating the
real-time buying and selling of advertisements at scale between
networks of buyers, often called DSPs (Demand Side Platforms) and
sellers, often called SSPs (Supply Side Platforms). Product sales
revenues, a de-emphasized business segment. Product sales revenues,
a de-emphasized business segment, includes revenues from t
wo
of our websites that operate as e-commerce platforms, including
Bright Watches and Black Helmet, as well as Bright Watches’
retail location. As described in “Key Initiatives”
appearing later in this section, the operations of Bright Watches
is non-strategic to our current business direction.
A key component of our growth is our continued
transition to a full services advertising solutions company. Bright
Mountain advertising solutions include a multiple real-time bidding
platforms, one of which is operated by Kubient, Inc.
On
September 5, 2018, we entered into a Master Services Agreement with
Kubient, Inc., a digital media holding company whose primary focus
is connecting brands with consumers as a full advertising services
platform, pursuant to which Kubient will provide its programmatic
technology platform to us on a non-exclusive basis for the purpose
of managing our programmatic business partners. Kubient, Inc. will
create a white label reporting portal for us and assist us in
onboarding our existing RTB (real-time bidding) clients to the new
Kubient platform. Our management made the decision to engage
Kubient, Inc. to provide these services to us because we believe it
offers a superior solution. The services to be provided by Kubient,
Inc. will be integrated into the
technical and management consulting and
other related services currently being provided to our advertising
segment by a third-party contractor. In addition,
o
n September 28, 2018, we
entered into a non-binding letter of intent to acquire Kubient,
Inc., whose real-time bidding platform provides a proprietary
anti-fraud technology that protects advertisers from showing their
ads to non-human audiences.
When
fully developed Bright Mountain’s full suite of advertising
solutions will include:
●
The
ability for advertisers to login and purchase advertising space on
a variety of digital publications;
●
Leading
targeting technology, allowing advertisers to pinpoint their
marketing efforts to reach geo-targeted, specific demographics
across desktop, tablet, and mobile devices;
●
The
ability to handle any ad format, including video, display, and
native advertisements;
●
Ad
serving and self-service features for publishers and advertisers;
and
●
Server-to-server
integration with other advertiser and publisher platforms for
extremely quick transactions and ad deployments.
This
Bright Mountain Media full services advertising solution will be a
marketplace for publishers and advertisers where they will be able
to login and choose from various features to maximize their earning
potential. Advertisers will be able to set their budget and choose
where their ads will be seen using our filters or by connection
directly with publishers through our platform. Publishers will be
able to select a variety of ad units for their video, mobile,
display and native advertisements and also have the ability to
create their own unique ad formats.
As
mentioned above, in addition to our niche market of US military and
public safety sectors, we intend to broaden the scope of our
partner publishers and publisher networks to include global
audience segments across connected television, mobile devices,
tablets and desktop computers.
Key initiatives
Our
growth strategy is based upon:
●
completing and
launching the Bright Mountain Media advertising solutions
marketplace;
●
expanding our sales
through organic growth;
30
●
continuing to
pursue acquisition candidates that are strategic our business
plan;
●
evaluating expenses
attributed to our non-strategic business lines; and
●
continuing to
automate our processes and reduce overhead where possible without
impacting our customer experience
Key metrics
The
following graph summarizes our quarterly revenue growth since the
fourth quarter of 2012 thought the third quarter of
2018:
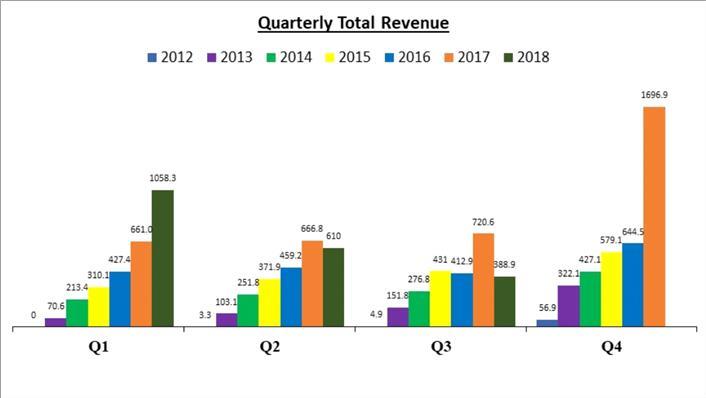
In
addition, over the past quarters (third quarter in 2017 to the
third quarter of 2018), we experienced a 90% increase in the number
of total ad impressions delivered, with most of the increase
following our acquisition of Daily Engage Media.. The change in ad
impression over the past four consecutive quarters is conveyed in
the following graph:
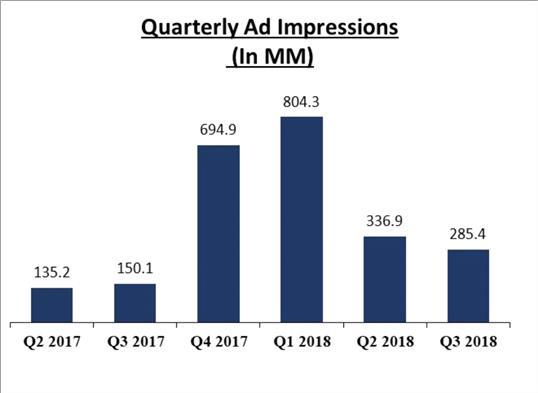
31
Results of operations
Revenue
|
|
|
For the three months ended
|
|
|
Nine months ended
|
|
||||||||||||||||||||||||||
|
|
|
September 30,
|
|
|
September 30,
|
|
||||||||||||||||||||||||||
|
|
|
2018
|
|
|
2017
|
|
|
Change
|
|
|
% Change
|
|
|
2018
|
|
|
2017
|
|
|
Change
|
|
|
% Change
|
|
||||||||
|
Advertising
|
|
$
|
185,417
|
|
|
$
|
126,098
|
|
|
$
|
59,319
|
|
|
|
47.0
|
%
|
$
|
|
1,159,751
|
|
|
$
|
329,731
|
|
|
$
|
830,020
|
|
|
|
251.7
|
%
|
|
Product
sales
|
|
|
203,485
|
|
|
|
589,402
|
|
|
|
(385,917
|
)
|
|
|
(65.5)
|
%
|
|
897,536
|
|
|
|
1,713,688
|
|
|
|
(816,152
|
)
|
|
|
(47.6
|
)%
|
|
|
Total
revenue
|
|
$
|
388,902
|
|
|
$
|
715,500
|
|
|
$
|
(326,598
|
)
|
|
|
(45.6)
|
%
|
$
|
2,057,287
|
|
|
$
|
2,043,419
|
|
|
$
|
13,868
|
|
|
|
0.7
|
%
|
|
While
our advertising revenue for the third quarter of 2018 was higher
than the comparable period in 2017, we only reported revenues from
Daily Engage Media during the 2017 period from the date of
acquisition (September 19, 2017) through September 30, 2017.
Accordingly, a quarter to quarter comparison is not as meaningful
as a comparison to the second quarter of 2018. Our advertising
revenues for the third quarter of 2018 were 36% less than the
second quarter of 2018. During the third quarter of 2018, our
advertising revenues were adversely impacted as a result of the
malfeasance of two former employees of Daily Engage Media as
described later in this report under Part II, Item 1, Legal
Proceedings. In addition to denying our company the ability to
access certain necessary information for the operation of Daily
Engage Media, these former employees established a competing
business in June 2018 and denied us the ability to contact our
customers and have been soliciting our customers. We have been
aggressively taking remedial actions, including contacting
customers on a customer by customer basis, engaging Kubient, Inc.
as described earlier in this section, and expanding the support
services provided by a third party consulting service in India.
Accordingly, while our current results of operations have been
adversely affected, we do not expect that their actions will have a
material long-term impact on our operations. In addition, the
fourth quarter of the year is historically the largest revenue
quarter for advertising. While there can be no assurances, given
the remedial actions we have taken, we expect an increase
quarter-over-quarter revenues during the remainder of
2018
Consistent
with our business model, which now focuses on our advertising
segment, revenues related to product sales decreased during 2018
from the comparable periods in 2017. In particular, the decrease in
watch sales is a result of the Company’s diminished focus on
the watch business and the focus of the Black Helmet business on
the future launch of its subscription sales program that will begin
offering “mystery” boxes to its customers. This sales
program is scheduled to be fully implemented in the fourth
quarter
Cost of Revenue and Gross Profit Margins
|
|
|
For the three months ended
|
|
|
Nine months ended
|
|
|
||||||||||||||||||||||||||||||
|
|
|
September 30,
|
|
|
September 30,
|
|
|
||||||||||||||||||||||||||||||
|
|
|
2018
|
|
|
2017
|
|
|
Change
|
|
|
% Change
|
|
|
2018
|
|
|
2017
|
|
|
Change
|
|
|
% Change
|
|
|||||||||||||
|
Advertising
|
|
$
|
117,175
|
|
|
$
|
11,669
|
|
|
$
|
105,506
|
|
|
|
904.2
|
%
|
|
$
|
810,744
|
|
|
$
|
24,031
|
|
|
$
|
786,713
|
|
|
|
3,273.7
|
%
|
|||||
|
Product
sales
|
|
|
142,234
|
|
|
|
387,360
|
|
|
|
(245,126
|
)
|
|
|
(63.3)
|
%
|
|
|
672,751
|
|
|
|
1,116,465
|
|
|
|
(443,714
|
)
|
|
|
(39.7
|
)%
|
|||||
|
Total
cost of revenue
|
|
$
|
259,409
|
|
|
$
|
399,029
|
|
|
$
|
(139,620
|
)
|
|
|
(35.0)
|
%
|
|
$
|
1,483,495
|
|
|
$
|
1,140,496
|
|
|
$
|
342,999
|
|
|
|
30.1
|
%
|
|||||
|
|
|
|
|
|
|
|
|
|
|
|
|
|
|
|
|
|
|
|
|
|
|
|
|
|
|
|
|
|
|
|
|
|
|||||
|
Advertising
revenues as a percentage of gross profit margin
|
|
|
37
|
%
|
|
|
90
|
%
|
|
|
|
|
|
|
|
|
|
|
30
|
%
|
|
|
93
|
%
|
|
|
|
|
|
|
|
|
|||||
|
Product
sales as a percentage of gross profit margin
|
|
|
30
|
%
|
|
|
32
|
%
|
|
|
|
|
|
|
|
|
|
|
25
|
%
|
|
|
35
|
%
|
|
|
|
|
|
|
|
|
|||||
Historically,
with respect to our advertising segment, we did not recognize any
cost of sales for this segment. However, as a result of the
expansion of the operations in this segment during the latter part
of the third quarter of 2017 related to the Daily Engage Media
acquisition, we now incur costs of sales associated with this
segment which includes revenue share payments to media providers
and website publishers.
Gross profit from product sales decreased in the
2018 periods compared to the same periods in 2017 as a result of
the Company’s change in the watch business model related to
the Black Helmet product line. The Company is currently selling its
previous inventory at a lower margin as it directs its resources to
its advertising segment.
32
Selling, General and Administrative Expenses
|
|
|
For the three months ended
|
|
|
For the nine months ended
|
||||||||||||||||||||||||||||||||||||||||||||||||
|
|
|
September
30,
|
|
|
September 30,
|
||||||||||||||||||||||||||||||||||||||||||||||||
|
|
|
|
|
|
|
|
|
|
|
|
|
|
|
|
|
|
|
|
|||||||||||||||||||||||||||||||||||
|
|
|
2018
|
|
2017
|
|
Change
|
|
% Change
|
|
2018
|
|
2017
|
|
|
Change
|
|
% Change
|
||||||||||||||||||||||||||||||||||||
|
Selling,
general and administrative expenses
|
|
$
|
883,478
|
|
|
$
|
797,268
|
|
|
$
|
86,210
|
|
|
|
10.8
|
%
|
|
$
|
2,985,391
|
|
|
$
|
2,746,236
|
|
|
$
|
255,028
|
|
|
|
|
8.7%
|
|
||||||||||||||||||||
|
SG&A
as a percentage of total revenues
|
|
|
231
|
%
|
|
|
111
|
%
|
|
|
|
|
|
|
|
|
|
|
146
|
%
|
|
|
134
|
%
|
|
|
|
|
|
|
|
|
|
||||||||||||||||||||
The
primary components of selling, general and administrate expenses
are attributable to period changes including salaries and wages,
services/consulting agreement amortization, non-cash stock-based
compensation, rent, website development expenses, bad debt expense
and non-cash amortization of intangibles. The higher salaries and
wages, legal fees, fees to independent contractors, bad debt and
rent expenses in the 2018 periods reflects the shift in focus to
the advertising segment during 2018 as well as increased costs
associated with remedial actions we have taken to counter the
adverse impact of the actions of the former Daily Engage Media
employees, the impact of the amortization of the contract fees paid
to Spartan Capital, and increased legal fees associated with
ongoing litigation. Website development expense increased in the
nine months ended September 30, 2018 from the comparable period in
2017 related to the development of various websites completed
during the first quarter. The website development expense for the
three-month period ended September 30, 2018 compared to the 2017
period declined, as the work was completed. Non-cash stock-based
compensation decreased in both the 2018 periods from the comparable
2017 periods, however, non-cash amortization of intangible expense
increased in both of the 2018 periods related to the intangible
assets acquired in the Daily Engage Media acquisition in September
2017. During the three and nine month periods ended September 30,
2018 expenses increased due to the amortization of $350,000 in the
third quarter of 2018 for a portion of the payments made to Spartan
Capital in September 2018 which totaled $1,750,000, including
$1,000,000 in cash and 1,000,000 shares of our common stock valued
at $750,000. The balance of this expense is being amortized over
the life of the contract and we will incur similar expenses each
quarter until fully amortized.
Selling,
general and administrative expenses are expected to continue to
increase as we execute our planned growth strategy of launching and
operating the Bright Mountain Media ad exchange network which will
include additional administrative support. Subject to the
availability of additional working capital, the Company also
intends to add administrative staff to its accounting department to
improve controls over its accounting and reporting
processes.
Total other income (expense)
Total
other income (expense) for the three and nine months ended
September 30, 2018 and 2017 of $116,388 and $101,157 and $342,081
and $295,822, respectively, primarily reflects interest expense
associated with our borrowings under a convertible note payable.
Interest under these notes, inclusive of $51,293 and $49,595 and
$152,293 and $116,863 in amortization of the related debt discount,
for the three and nine months ended September 30, 2018 and 2017,
respectively.
The Company
recorded interest expense of $16,014 and $41,217 primarily for the
three and nine months ended September 30, 2018 on a $500,000 10%
note payable issued in November 2016 which matures in December 2018
pursuant to an oral extension provided by the lender. There were no
interest payments on the $500,000 notes during 2017. At September
30, 2018 the principal balance on this note was $150,000. We expect
to satisfy this note in full by December 31, 2018.
Non-GAAP financial measure
We
report adjusted net (loss) to measure our overall results because
we believe it better reflects our net results by excluding the
impact of non-cash equity-based compensation. We use Adjusted
EBITDA to measure our operations by excluding interest and certain
additional non-cash expenses. These measures are one of the primary
metrics by which we evaluate the performance of our business, on
which our internal budgets are based. We believe the presentation
of adjusted net (loss) and Adjusted EBITDA enhances our
investors’ overall understanding of the financial performance
of our business.
We
believe that investors should have access to the same set of tools
that we use in analyzing our results. This non-GAAP measure should
be considered in addition to results prepared in accordance with
GAAP but should not be considered a substitute for or superior to
GAAP results.
We
believe these measures are useful for analysts and investors as the
measures allows a more meaningful year-to-year comparison of our
performance. The items below are excluded from the Adjusted EBITDA
measure because these items are non-cash in nature, and we believe
that by excluding these items, Adjusted EBITDA corresponds more
closely to the cash operating income/loss generated from our
business. Adjusted EBITDA has certain limitations in that it does
not consider the impact to our statement of operations of certain
expenses.
33
Non-GAAP financial measure (continued)
There
was a sharp decrease in the interest expense from 2017 to 2018
because of the change of the interest rate from 25% to 10% on the
$500,000 promissory note. During September 2018 the final closing
on the Private Placement Memorandum occurred which resulted in
payments made to Spartan Capital of $1,000,000, of which $200,000
was recognized for the periods and an additional $150,000 of
expenses were incurred for closing the capital raising activities
with Spartan Capital. The adjusted EBITDA, net of the $350,000, for
the three and nine months ended September 30 would be $(332,042)
and $(1,748,675), respectively.
The
following is an unaudited reconciliation of net (loss) to adjusted
net (loss) and Adjusted EBITDA for the periods
presented:
|
|
|
For the Three Months Ended
|
|
|
For the Nine Months Ended
|
|
||||||||||
|
|
|
September 30,
|
|
|
September 30,
|
|
||||||||||
|
Unaudited
|
|
2018
|
|
|
2017
|
|
|
2018
|
|
|
2017
|
|
||||
|
Net loss
|
|
$
|
(870,372
|
)
|
|
$
|
(581,955
|
)
|
|
$
|
(2,753,680
|
)
|
|
$
|
(2,139,135
|
)
|
|
plus:
|
|
|
|
|
|
|
|
|
|
|
|
|
|
|
|
|
|
Stock compensation expense
|
|
|
5,755
|
|
|
|
21,983
|
|
|
|
19,961
|
|
|
|
95,821
|
|
|
Stock issued for services
|
|
|
7,500
|
|
|
|
-
|
|
|
|
7,500
|
|
|
|
25,860
|
|
|
Adjusted net loss
|
|
|
(857,117
|
)
|
|
|
(559,972
|
)
|
|
|
(2,726,219
|
)
|
|
|
(2,017,454
|
)
|
|
Depreciation expense
|
|
|
7,809
|
|
|
|
6,777
|
|
|
|
20,661
|
|
|
|
18,925
|
|
|
Amortization expense
|
|
|
49,727
|
|
|
|
75,876
|
|
|
|
262,633
|
|
|
|
227,418
|
|
|
Interest expense
|
|
|
117,539
|
|
|
|
101,390
|
|
|
|
344,250
|
|
|
|
296,273
|
|
|
Adjusted EBITDA
|
|
$
|
(682,042
|
)
|
|
$
|
(375,929
|
)
|
|
$
|
(2,098,675
|
)
|
|
$
|
(1,474,838
|
)
|
Liquidity and capital resources
Liquidity
is the ability of a company to generate sufficient cash to satisfy
its needs for cash. The following table summarized total current
assets, total current liabilities and working capital (deficit) at
September 30, 2018 as compared to December 31, 2017.
|
|
|
September 30,
2018
|
|
|
December 31,
2017
|
|
||
|
Total current assets
|
|
$
|
1,946,854
|
|
|
$
|
1,776,992
|
|
|
Total current liabilities
|
|
$
|
1,353,136
|
|
|
$
|
2,105,234
|
|
|
Working capital (deficit)
|
|
$
|
593,718
|
|
|
$
|
(328,242
|
)
|
The
increase in cash and reduction in the working capital deficit is a
result of cash proceeds from the sale of equity securities in a
private placement during the nine months ended September 30, 2018.
The slight increase in our current assets is mostly reflective of
our decrease in watch inventory and accounts receivable and prepaid
expenses attributed to lower prepaid rent and insurance, offset by
the increases in the current portion of its services/consulting
contracts paid in cash and stock, with an increase in cash
balances. The decrease in our current liabilities primarily
reflects a decrease in accounts payable and premium finance loan
payable and note payables.
As
we continue our efforts to grow our business, we expect that our
monthly cash operating overhead will continue to increase as we add
personnel, although at a lesser rate, and we are not able at this
time to quantify the amount of this expected increase. In the first
quarter of 2018 we implemented policies and procedures around cash
collections to prevent the aging of accounts receivables that was
experienced in 2017. Cash collection efforts have been successful,
and we feel that we have appropriately reserved for uncollectible
amounts at September 30, 2018.
We
do not have any commitments for capital expenditures. During the
fourth quarter of 2018 we loaned Kubient, Inc. $75,000 under the
terms of a promissory note. The promissory notes payable in the
remaining aggregate amount of $175,162 to three members of Daily
Engage Media in September 2017 as partial consideration in our
acquisition of that entity, which became due in September 2018, and
has not been paid pending the settlement of, or conclusion of, the
litigation described later in this report under Part II, Item 1.
Legal Matters. The Company repaid $25,000 for the three months
ended September 30, 2018 to one noteholder who extended the terms
of the agreement with the Company for one year. The remaining
balance will be paid over a seven-month period.
Going concern and management’s liquidity plans
The
accompanying condensed consolidated financial statements have been
prepared on a going concern basis, which contemplates the
realization of assets and the satisfaction of liabilities in the
normal course of business. The Company sustained a net loss of
($2,753,680) and used net cash in operating activities of
($3,061,848) for the nine months ended September 30, 2018. The
Company had an accumulated deficit of ($14,572,582) at September
30, 2018.
34
Going concern and management’s liquidity plans
(continued)
The
report of our independent registered public accounting firm on our
audited consolidated financial statements at December 31, 2017 and
2016 and for the years then ended contains an explanatory paragraph
regarding substantial doubt of our ability to continue as a going
concern based upon our net losses, cash used in operations and
accumulated deficit. These factors, among others, raise substantial
doubt about our ability to continue as a going concern. Our
unaudited condensed consolidated financial statements do not
include any adjustments that might result from the outcome of this
uncertainty. There are no assurances we will be successful in our
efforts to generate revenues or report profitable operations or to
continue as a going concern, in which event investors would lose
their entire investment in our company.
Our
ability to fully implement the Bright Mountain Media Ad Exchange
Network and maximize the value of our assets are dependent upon our
ability to raise additional capital sufficient for our short-term
and long-term growth plans. Historically we have been dependent
upon loans and equity purchases from our Mr. W. Kip Speyer, an
executive officer and member of our board of directors, and, during
2018, sales of equity securities to accredited investors, to
provide adequate funds to meet our working capital needs. During
the nine months ended September 30, 2018 we raised $375,000 of
working capital from equity purchases by Mr. Speyer, and an
additional $4,040,000 through the sale of our securities in a
private placement. While we estimate that we need a minimum of $2.4
million in additional working capital to provide sufficient funds
to pay our operating expenses and fund our development over the
next 12 months, we believe that if we are successful the
anticipated revenues from our advertising segment will have a
significant impact on our revenues and results of operations in
future periods. While we have engaged a placement agent to assist
us in raising capital, the placement agent is acting on a best
efforts basis and there are no assurances we will be successful in
raising additional capital during the balance of 2018 through the
sale of our securities. Any delay in raising sufficient funds will
delay the implementation of our business strategy and could
adversely impact our ability to significantly increase our revenues
in future periods. In addition, if we are unable to raise the
necessary additional working capital, absent a significant increase
in our revenues, most particularly from our advertising segment, of
which there is no assurance, we will be unable to continue to grow
our company and may be forced to reduce certain operating expenses
to conserve our working capital.
Summary of cash flows
|
|
|
September 30,
2018
|
|
|
September 30,
2017
|
|
||
|
Net cash (used in) operating activities
|
|
$
|
(3,061,848
|
)
|
|
$
|
(1,368,454
|
)
|
|
Net cash provided by (used in) investing activities
|
|
$
|
887
|
|
|
$
|
(222,107
|
)
|
|
Net cash provided by financing activities
|
|
$
|
3,474,350
|
|
|
$
|
1,543,279
|
|
During
the nine months ended September 30, 2018, we used cash primarily to
fund our net loss of $2,753,680 for the period, with a reduction of
$255,111 in inventory purchases and an increase in prepaid expenses
and services/consulting agreements of $640,000 for the period
offset by a decrease in accounts receivable of $103,940 and
$543,891 of accounts payable offset by an increase in accrued
expenses of $15,978. During the nine months ended September
30, 2017, we used cash primarily to fund our net loss of $2,139,135
for the period as well as a decrease in inventory of approximately
$142,550, $134,903 of other assets, an increase of $50,194 for
accrued interest offset by lower accounts payable of $203,673.
The Company reduced inventory, other assets and payables
attributed to the acquisition of Black Helmet Apparel. The Company
increased the accrued interest expense attributed to the modified
Note discussed above.
The
decreases in net cash used in investing activities in both periods
is attributable to less fixed asset purchases in the 2018 period
and approximately $208,000 relating to the net cash paid for the
acquisition in September 2017 of Daily Engage Media.
During
the nine months ended September 30, 2018 the Company raised
$3,636,000 through a the sale of equity securities in a private
placement memorandum and $375,000 through the sale of shares of 10%
Series E convertible preferred stock to an executive officer and
member of our board of directors, and we paid cash dividends of
$51,314, primarily to Mr. Speyer on shares of this series of
preferred stock owned by him. During the nine months ended
September 30, 2017, the Company received $1,460,000 under a series
of 6%, 10% and 12%, 5-year convertible notes issued to our chief
executive officer and member of our board of directors, $200,000
for the sale of 500,000 units of Series E preferred stock to our
CEO and $50,000 sale of 125,000 shares of common stock. The Company
made repayments of $52,041 and $53,643 in insurance premium
financing notes for the nine months ended September 30, 2018 and
2017, respectively.
Critical accounting policies
The
preparation of financial statements in conformity with GAAP
requires management to make estimates and assumptions that affect
the reported amount of assets and liabilities, the disclosure of
contingent assets and liabilities and the reported amounts of
revenue and expenses during the reported periods. The more critical
accounting estimates include estimates related to revenue
recognition and accounts receivable allowances. We also have other
key accounting policies, which involve the use of estimates,
judgments and assumptions that are significant to understanding our
results, which are described in Note 1 to our unaudited condensed
consolidated financial statements appearing elsewhere in this
report.
35
Recent accounting pronouncements
The
recent accounting standards that have been issued or proposed by
the FASB or other standards-setting bodies as described in Note 1
appearing earlier in this report that do not require adoption until
a future date are not expected to have a material impact on the
financial statements upon adoption.
All
other newly issued accounting pronouncements, but not yet
effective, have been deemed either immaterial or not
applicable.
Off balance sheet arrangements
As
of the date of this report, we do not have any off-balance sheet
arrangements that have or are reasonably likely to have a current
or future effect on our financial condition, changes in financial
condition, revenues or expenses, results of operations, liquidity,
capital expenditures or capital resources that are material to
investors. The term “off-balance sheet arrangement”
generally means any transaction, agreement or other contractual
arrangement to which an entity unconsolidated with us is a party,
under which we have any obligation arising under a guarantee
contract, derivative instrument or variable interest or a retained
or contingent interest in assets transferred to such entity or
similar arrangement that serves as credit, liquidity or market risk
support for such assets.
Not
applicable for a smaller reporting company.
Evaluation of Disclosure
Controls and Procedures
. We
maintain “disclosure controls and procedures” as such
term is defined in Rule 13a-15(e) under Securities Exchange Act of
1934 (the “Exchange Act”). In designing and evaluating
our disclosure controls and procedures, our management recognized
that disclosure controls and procedures, no matter how well
conceived and operated, can provide only reasonable, not absolute,
assurance that the objectives of disclosure controls and procedures
are met. Additionally, in designing disclosure controls and
procedures, our management necessarily was required to apply its
judgment in evaluating the cost-benefit relationship of possible
disclosure controls and procedures. The design of any disclosure
controls and procedures also is based in part upon certain
assumptions about the likelihood of future events, and there can be
no assurance that any design will succeed in achieving its stated
goals under all potential future conditions.
Based
on their evaluation as of the end of the period covered by this
report, our Chief Executive Officer, who also serves as our
principal financial and accounting officer, concluded that our
disclosure controls and procedures were not effective such that the
information relating to our company, required to be disclosed in
our Securities and Exchange Commission reports (i) is recorded,
processed, summarized and reported within the time periods
specified in SEC rules and forms and (ii) is accumulated and
communicated to our management, including our Chief Executive
Officer, to allow timely decisions regarding required disclosure as
a result of continuing material weaknesses in our internal control
over financial reporting as described in our Annual Report on Form
10-K for the year ended December 31, 2017. A material weakness is a
deficiency, or combination of deficiencies, that results in more
than a remote likelihood that a material misstatement of annual or
interim financial statements will not be prevented or
detected.
We
will continue to monitor our internal control over financial
reporting on an ongoing basis and are committed to taking further
action and implementing additional enhancements or improvements, as
necessary and as funds allow. We do not, however, expect that the
material weaknesses in our disclosure controls will be remediated
until such time as we have added to our accounting and
administrative staff allowing improved internal control over
financial reporting.
Changes in Internal Control
over Financial Reporting.
There
have been no changes in our internal control over financial
reporting during our last fiscal quarter that has materially
affected, or is reasonably likely to materially affect, our
internal control over financial reporting.
36
In
connection
with the matters which lead to our termination for cause of Messrs.
Pagoulatos and Rezitis described below, in July 2018 we filed
a
Verified
Complaint for injunctive relief and damages
against Messrs. Pagoulatos and Rezitis in the Circuit Court of the
15th Judicial Circuit in and
for
Palm Beach
County, Florida (case number 502018CA008972XXXXMB) alleging their
failure, among other things, to provide us with certain login codes
and passwords as well as reporting other current information about
Daily
Engage
Media's business. That matter was
removed to the Southern District of Florida, United States District
Court and ultimately stayed and closed pending a determination of
jurisdiction by the pending New Jersey action described
below.
In
July
of 2018, Messrs. Pagoulatos and Rezitis
,
along with a
third party who had been a minority owner in Daily Engage Media
prior to our acquisition of that company, filed a Complaint in the
U.S. District Court, District of New Jersey (case
number
2:18-cv-11357-ES-SCM) against our company and
our
Chief
Executive Officer,
seeking
compensatory and punitive damages and
attorneys
'
fees
,
among other items, and
alleging
,
among other items
,
fraud and
breach of contract. We
vehemently
deny all allegations in the complaint and deem
them to be baseless at best. We filed a Motion to Dismiss this case
for a multitude of reasons including, but not restricted to,
failure to state a cause of action and jurisdictional and venue
arguments as the acquisition and employment agreements provides
that any dispute should be heard in either the state or local
courts of Palm Beach County, Florida. At the appropriate juncture,
we
also
intend to serve a Rule 11 Motion for Sanctions
based upon the fact that the Complaint contains frivolous arguments
or arguments with no evidentiary support.
As
described above and notwithstanding an audit of Daily Engage Media,
the principles of Daily Engage Media failed to disclose an
obligation of approximately $200,000. We have recognized a
liability of that amount associated with the Daily Engage Media
acquisition. A lawsuit has been filed in New York state court to
collect this obligation. We intend to vigorously defend this
motion.
We
incorporate by reference the risk factors disclosed in Part I, Item
1A of our 2017 Form 10-K subject to the new or modified risk
factors appearing below that should be read in conjunction with the
risk factors disclosed in such Form 10-K.
There are no assurances our advertising revenues will return to
historic levels in future periods.
As
described elsewhere herein, during the third quarter of 2018
revenues from our advertising segment declined approximately 30%
from our advertising revenues for the second quarter of 2018 which
is attributable to the impact of actions by Messrs. Pagoulatos and
Rezitis which have been materially adverse to the Company. While we
expect advertising revenues for the fourth quarter of 2018 to
increase from those in the third quarter of 2018, as a result of
both historically high advertising revenues during the fourth
quarter as well as remedial actions we have taken, there are no
assurances our expectations are correct. Any continued decline in
revenues from our advertising segment will materially adversely
impact our ability to continue our operations as they are presently
conducted.
In
September 2018, the Company issued 10,000 shares of common stock to
a consultant for services rendered based on the fair value at the
date of grant, or $0.75 per share valued at $7,500.
None.
Not
applicable to our company’s operations.
On
October 31, 2018, the Company entered into a Finder’s
Agreement with the Spartan Capital which provides that, in
consideration for Spartan Capital introducing Kubient, Inc. to us,
Spartan Capital will be entitled to a non-refundable fee of
$160,000 which will be payable within three days after the final
closing of the full amount of the over-allotment option, and, if
the acquisition of Kubient, Inc. is completed, Spartan Capital will
be entitled to receive a number of shares of our common stock equal
to 3% of the number of shares of our common stock issued to
Kubient, Inc. or its shareholders in connection with the
acquisition. In addition, if within three years from the date of
the Finder’s Agreement we complete a financing transaction
for which a broker-dealer introduced to us by Spartan Capital
serves as placement agent or underwriter, we will be required to
pay Spartan Capital a cash fee equal to 2% of the aggregate
proceeds raised in the financing and issue to
37
Spartan
Capital warrants to purchase a number of shares of our common stock
equal to 2% of the number of shares of common stock (and/or shares
of common stock issuable upon exercise of securities or upon
conversion or exchange of convertible or exchangeable securities)
sold in the offering. The Finder’s Agreement further provides
that if within three years from the date of the Finder’s
Agreement we complete a merger, acquisition or sale of stock or
assets, joint venture, strategic alliance or similar transaction
(the “Alternative Transaction”), regardless of whether
Spartan Capital introduced the other party to the Alternative
Transaction, then Spartan Capital will be entitled to a fee equal
to 3% of the amount of the consideration paid or received by us or
our shareholders in such transaction, which fee will be payable in
shares of our common stock valued at the volume weighted average
price of our common stock for the 10 trading days preceding the
closing of the Alternative Transaction. The foregoing
notwithstanding, if Spartan Capital has not introduced the other
party to the Alternative Transaction to the Company, a fee shall
only be paid if Spartan Capital has, on a continuous basis,
provided substantive merger and acquisition support services and
advice as reasonably requested by the Company. The foregoing
description of the terms and conditions of the Finder’s
Agreement is qualified in its entirety by reference to the
agreement which is filed as Exhibit 10 to this report.
On
October 3, 2018 we lent Kubient, Inc. $75,000. The terms of the
unsecured note provide that it pays interest at 6% per annum and
the principal and interest is due on January 31,2019,
provided, however
, that if the share
exchange or merger as contemplated by the non-binding letter of
intent with Kubient, Inc. is consummated on or prior to the
maturity date, the outstanding principal of the note shall be
forgiven by us and the purchase price contemplated by the
non-binding letter of intent will be reduced by 100,000 shares
(i.e., $75,000 divided by $0.75 per share). The foregoing
description of the terms and conditions of the note is qualified in
its entirety by reference to the agreement which is filed as
Exhibit 10 to this report
|
No.
|
|
Exhibit Description
|
|
Form
|
|
Date Filed
|
|
Number
|
|
Herewith
|
|
|
|
|
|
|
|
|
|
|
|
|
|
|
Amended
and Restated Articles of Incorporation
|
|
Form
10
|
|
3/31/13
|
|
3.3
|
|
|
|
|
|
Articles
of Amendment to the Amended and Restated Articles of
Incorporation
|
|
8-K
|
|
7/9/13
|
|
3.3
|
|
|
|
|
|
Articles
of Amendment to the Amended and Restated Articles of
Incorporation
|
|
8-K
|
|
11/16/13
|
|
3.4
|
|
|
|
|
|
Articles
of Amendment to the Amended and Restated Articles of
Incorporation
|
|
8-K
|
|
12/30/13
|
|
3.4
|
|
|
|
|
|
Articles
of Amendment to the Amended and Restated Articles of
Incorporation
|
|
10-K
|
|
3/31/14
|
|
3.5
|
|
|
|
|
|
Articles
of Amendment to the Amended and Restated Articles of
Incorporation
|
|
8-K
|
|
7/28/14
|
|
3.6
|
|
|
|
|
|
Articles
of Amendment to the Amended and Restated Articles of
Incorporation
|
|
10-K/A
|
|
4/1/15
|
|
3.5
|
|
|
|
|
|
Articles
of Amendment to the Amended and Restated Articles of
Incorporation
|
|
8-K
|
|
12/4/15
|
|
3.7
|
|
|
|
|
|
Amended
and Restated Bylaws
|
|
Form
10
|
|
3/31/13
|
|
3.2
|
|
|
|
|
3.10
|
|
Articles
of Amendment to the Amended and Restated Articles of
Incorporation
|
|
8-K
|
|
11/13/18
|
|
3.10
|
|
|
|
|
Form of
unit warrants
|
|
10-K
|
|
4/2/18
|
|
4.1
|
|
|
|
|
|
Form of
placement agent warrants
|
|
10-K
|
|
4/2/18
|
|
4.2
|
|
|
|
|
10.1
|
|
New
Lease
|
|
|
|
|
|
|
|
Filed
|
|
10.2
|
|
Finder’s
Agreement dated October 31, 2018 by and between Spartan Capital
Securities, LLC and Bright Mountain Media, Inc.
|
|
|
|
|
|
|
|
Filed
|
|
10.3
|
|
Note
Exchange Agreement dated November 7, 2018 by and between W. Kip
Speyer and Bright Mountain Media, Inc.
|
|
8-K
|
|
11/13/18
|
|
10.1
|
|
|
|
10.4
|
|
Promissory
Note dated October 3, 2018 in the principal amount of $75,000 from
Kubient, Inc.
|
|
|
|
|
|
|
|
Filed
|
|
31.1
|
|
Rule
13a-14(a)/15d-14(a) certification of Chief Executive
Officer
|
|
|
|
|
|
|
|
Filed
|
|
31.2
|
|
Rule
13a-14(a)/15d-14(a) certification of principal financial and
accounting officer
|
|
|
|
|
|
|
|
Filed
|
|
32.1
|
|
Section
1350 certification of Chief Executive Officer and principal
financial and accounting officer
|
|
|
|
|
|
|
|
Filed
|
|
101.INS
|
|
XBRL
Instance Document
|
|
|
|
|
|
|
|
Filed
|
|
101.SCH
|
|
XBRL
Taxonomy Extension Schema Document
|
|
|
|
|
|
|
|
Filed
|
|
101.CAL
|
|
XBRL
Taxonomy Extension Calculation Linkbase Document
|
|
|
|
|
|
|
|
Filed
|
|
101.DEF
|
|
XBRL Taxonomy Extension Definition Linkbase Document
|
|
|
|
|
|
|
|
Filed
|
|
101.LAB
|
|
XBRL Taxonomy Extension Label Linkbase Document
|
|
|
|
|
|
|
|
Filed
|
|
101.PRE
|
|
XBRL Taxonomy Extension Presentation Linkbase Document
|
|
|
|
|
|
|
|
Filed
|
38
SIGNATURES
Pursuant
to the requirements of the Securities Exchange Act of 1934, the
registrant has duly caused this report to be signed on its behalf
by the undersigned thereunto duly authorized.
|
|
BRIGHT MOUNTAIN MEDIA, INC.
|
|
|
|
|
|
|
November 20, 2018
|
By:
|
/s/ W. Kip Speyer
|
|
|
|
W. Kip Speyer, Chief Executive Officer,
principal financial and accounting officer
|
39
TABLE OF CONTENTS
Part 1 - Financial InformationItem 1. Financial StatementsNote 1 Nature Of Operations and Summary Of Significant Accounting PoliciesNote 1 Nature Of Operations and Summary Of Significant Accounting Policies (continued)Note 2 - Going ConcernNote 3 AcquisitionsNote 3 Acquisitions (continued)Note 4 InventoriesNote 5 Prepaid Expenses and Other Current AssetsNote 6 Property and EquipmentNote 7 Website Acquisition and Intangible AssetsNote 8 Segment InformationNote 9 Notes PayableNote 9 Notes Payable (continued)Note 10 Commitments and ContingenciesNote 10 Commitments and Contingencies (continued)Note 11 Shareholders EquityNote 11 Shareholders Equity (continued)Note 12 ConcentrationsNote 12 Concentrations (continued)Note 13 Subsequent EventsNote 13 Subsequent Events (continued)Item 2. Management's Discussion and Analysis Of Financial Condition and Results Of OperationsItem 3. Quantitative and Qualitative Disclosures About Market RiskItem 4. Controls and ProceduresPart II - Other InformationItem 1. Legal ProceedingsItem 1A. Risk FactorsItem 2. Unregistered Sales Of Equity Securities and Use Of ProceedsItem 3. Defaults Upon Senior SecuritiesItem 4. Mine Safety DisclosuresItem 5. Other InformationItem 6. Exhibits