BIONANO GENOMICS, INC
UNITED STATES
SECURITIES AND EXCHANGE COMMISSION
Washington, D.C. 20549
|
FORM 10-K
|
(Mark One)
|
x
|
ANNUAL REPORT PURSUANT TO SECTION 13 OR 15(d) OF THE SECURITIES EXCHANGE ACT OF 1934
|
For the fiscal year ended December 31, 2019
OR
|
¨
|
TRANSITION REPORT PURSUANT TO SECTION 13 OR 15(d) OF THE SECURITIES EXCHANGE ACT OF 1934 FOR THE TRANSITION PERIOD FROM TO
|
Commission File Number 001-38613
|
Bionano Genomics, Inc.
|
||
|
(Exact name of Registrant as specified in its Charter)
|
||
|
Delaware
|
26-1756290
|
|
|
(State or other jurisdiction of
incorporation or organization)
|
(I.R.S. Employer
Identification No.) |
|
|
9540 Towne Centre Drive, Suite 100,
San Diego, CA
|
92121
|
|
|
(Address of principal executive offices)
|
(Zip Code)
|
|
|
Registrant’s telephone number, including area code: (858) 888-7600
|
||
Securities registered pursuant to Section 12(b) of the Act:
|
Title of Each Class
|
Trading Symbol(s)
|
Name of Each Exchange on which Registered
|
|
Common Stock, $0.0001 par value
|
BNGO
|
The Nasdaq Stock Market, LLC
|
|
Warrants to purchase Common Stock
|
BNGOW
|
The Nasdaq Stock Market, LLC
|
Securities registered pursuant to Section 12(g) of the Act: None
Indicate by check mark if the Registrant is a well-known seasoned issuer, as defined in Rule 405 of the Securities Act. YES
¨
NO
x
Indicate by check mark if the Registrant is not required to file reports pursuant to Section 13 or 15(d) of the Act. YES
¨
NO
x
Indicate by check mark whether the Registrant: (1) has filed all reports required to be filed by Section 13 or 15(d) of the Securities Exchange Act of 1934 during the preceding 12 months (or for such shorter period that the Registrant was required to file such reports), and (2) has been subject to such filing requirements for the past 90 days. YES
x
NO
¨
Indicate by check mark whether the Registrant has submitted electronically every Interactive Data File required to be submitted pursuant to Rule 405 of Regulation S-T (§232.405 of this chapter) during the preceding 12 months (or for such shorter period that the Registrant was required to submit such files). YES
x
NO
¨
Indicate by check mark whether the registrant is a large accelerated filer, an accelerated filer, a non-accelerated filer, a smaller reporting company, or an emerging growth company. See the definitions of “large accelerated filer,” “accelerated filer,” “smaller reporting company,” and “emerging growth company” in Rule 12b-2 of the Exchange Act.
|
Large accelerated filer
|
¨
|
Accelerated filer
|
¨
|
|
Non-accelerated filer
|
x
|
Smaller reporting company
|
x
|
|
Emerging growth company
|
x
|
||
If an emerging growth company, indicate by check mark if the registrant has elected not to use the extended transition period for complying with any new or revised financial accounting standards provided pursuant to Section 13(a) of the Exchange Act.
¨
Indicate by check mark whether the Registrant is a shell company (as defined in Rule 12b-2 of the Exchange Act). YES
¨
NO
x
The aggregate market value of the voting and non-voting common equity held by non-affiliates of the registrant as of June 28, 2019 (the last business day of the registrant’s most recently completed second fiscal quarter) was approximately $26.7 million based on the closing price of the registrant’s common stock on June 28, 2019 of $2.45 per share, as reported by the Nasdaq Capital Market.
As of March 6, 2020, the Registrant had
37,752,469
shares of common stock, $0.0001 par value per share, outstanding.
Table of Contents
|
Page
|
||
|
PART I
|
||
|
Item 1.
|
||
|
Item 1A.
|
||
|
Item 1B.
|
||
|
Item 2.
|
||
|
Item 3.
|
||
|
Item 4.
|
||
|
PART II
|
||
|
Item 5.
|
||
|
Item 6.
|
||
|
Item 7.
|
||
|
Item 7A.
|
||
|
Item 8.
|
||
|
Item 9.
|
||
|
Item 9A.
|
||
|
Item 9B.
|
||
|
PART III
|
||
|
Item 10.
|
||
|
Item 11.
|
||
|
Item 12.
|
||
|
Item 13.
|
||
|
Item 14.
|
||
|
PART IV
|
||
|
Item 15.
|
||
|
Item 16.
|
||
i
As used in this Form 10-K, “Bionano,” the “Company,” “we,” “our,” and “us” refer to Bionano Genomics, Inc., a Delaware corporation.
Note Regarding Forward-Looking Statements
This Annual Report on Form 10-K, or this Annual Report, contains forward-looking statements and information within the meaning of the safe harbor provisions for the U.S. Private Securities Litigation Reform Act of 1955. All statements other than statements of historical facts contained in this Annual Report, including statements regarding our future results of operations or financial condition, business strategy and plans, and objectives of management for future operations, are forward-looking statements. In some cases, you can identify forward-looking statements because they contain words such as “anticipate,” “believe,” “contemplate,” “continue,” “could,” “estimate,” “expect,” “intend,” “may,” “plan,” “potential,” “predict,” “project,” “should,” “target,” “will” or “would” or the negative of these words or other similar terms or expressions.
We have based these forward-looking statements largely on our current expectations and projections about future events and financial trends that we believe may affect our financial condition, results of operations, business strategy and financial needs. These forward-looking statements are subject to known and unknown risks, uncertainties and assumptions, including risks described in “Risk Factors” and elsewhere in this Annual Report, regarding, among other things:
|
•
|
the size and growth potential of the markets for our products, and our ability to serve those markets;
|
|
•
|
the rate and degree of market acceptance of our products;
|
|
•
|
ability to expand our sales organization to address effectively existing and new markets that we intend to target;
|
|
•
|
impact from future regulatory, judicial, and legislative changes or developments in the U.S. and foreign countries;
|
|
•
|
ability to compete effectively in a competitive industry;
|
|
•
|
the success of competing technologies that are or may become available;
|
|
•
|
the performance of our third-party contract sales organizations, suppliers and manufacturers;
|
|
•
|
our ability to attract and retain key scientific or management personnel;
|
|
•
|
the accuracy of our estimates regarding expenses, future revenues, reimbursement rates, capital requirements and needs for additional financing;
|
|
•
|
our ability to comply with the covenants and satisfy certain conditions of our debt facility;
|
|
•
|
our ability to obtain funding for our operations; and
|
|
•
|
our ability to attract collaborators and strategic partnerships;
|
You should not rely on forward-looking statements as predictions of future events. We have based the forward-looking statements contained in this Annual Report primarily on our current expectations and projections about future events and trends that we believe may affect our business, financial condition, results of operations and prospects. The outcome of the events described in these forward-looking statements is subject to risks, uncertainties and other factors described in Part I, Item 1A Risk Factors and elsewhere in this Annual Report. Moreover, we operate in a very competitive and rapidly changing environment. New risks and uncertainties emerge from time to time, and it is not possible for us to predict all risks and uncertainties that could have an impact on the forward-looking statements contained in this Annual Report.
The results, events and circumstances reflected in the forward-looking statements may not be achieved or occur, and actual results, events or circumstances could differ materially from those described in the forward-looking statements.
In addition, statements that “we believe” and similar statements reflect our beliefs and opinions on the relevant subject. These statements are based on information available to us as of the date of this Annual Report. And while we believe that information provides a reasonable basis for these statements, that information may be limited or incomplete. Our statements should not be read to indicate that we have conducted an exhaustive inquiry into, or review of, all relevant information. These statements are inherently uncertain, and investors are cautioned not to unduly rely on these statements.
The forward-looking statements made in this Annual Report relate only to events as of the date on which the statements are made. We undertake no obligation to update any forward-looking statements made in this Annual Report to reflect events or circumstances after the date of this Annual Report or to reflect new information or the occurrence of unanticipated events, except as required by law. We may not actually achieve the plans, intentions, or expectations disclosed in our forward-looking statements, and you should not place undue reliance on our forward-looking statements. Our forward-looking statements do not reflect the potential impact of any future acquisitions, mergers, dispositions, joint ventures or investments.
1
PART I
Item 1. Business.
Overview
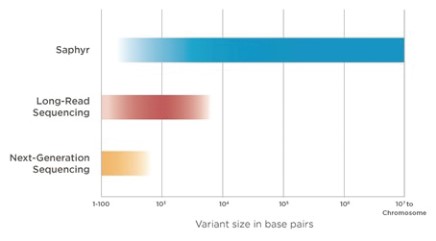
We are a genome analysis company providing tools and services based on our Saphyr® system to scientists and clinicians conducting genetic research and patient testing. We developed the Saphyr system, a platform for ultra-sensitive and ultra-specific structural variation detection, that enables researchers and clinicians to accelerate the search for new diagnostics and therapeutic targets and to streamline the evaluation of changes in chromosomes, which is known as cytogenetics. Our commercial offering includes the Saphyr system, which is comprised of an instrument, chip consumables, reagents and a suite of data analysis tools, and genome analysis services to provide access to data generated by the Saphyr system for researchers who prefer not to adopt the Saphyr system in their labs.
Structural variation refers to large-scale structural differences in the genomic DNA of one individual compared to another. Each structural variation involves the rearrangement or repetition of as few as several hundred to as many as tens of millions of DNA base pairs. Structural variations may be inherited or arise spontaneously, and many structural variations cause genetic disorders and diseases. Until our commercial launch of the Saphyr system in February 2017, and since, we believe no other products existed or exist that could more comprehensively and cost and time-efficiently detect structural variation.
Our customers include researchers and clinicians who seek to uncover and understand the biological or clinical impact of genome variation to improve the diagnosis and treatment of patients with better clinical tests and new medicines or to replace existing cytogenetic tests that are expensive, slow and labor-intense, with a modern solution designed to simplify workflow and reduce cost and that has the potential to significantly increase diagnostic yields across the industry. Our customers also include researchers in non-human segments, such as agricultural genomics, seeking to advance their understanding of how structural variation impacts industrial applications of plants and animals. We have established relationships with key opinion leaders in genomics research and clinical applications, including rare diseases and oncology, and our installed base of over 138 systems made up of Saphyr and its predecessor system, includes some of the world’s most prominent clinical, translational research, basic research, academic and government institutions as well as leading pharmaceutical and diagnostic companies. Examples include Children’s Hospital of Philadelphia, Children’s National Health System, Boston Children’s Hospital, PerkinElmer, GeneDx, Mayo Clinic, Columbia University, DuPont Pioneer, Garvan Institute of Medical Research, Genentech, McDonnell Genome Institute at Washington University, National Institutes of Health, Pennsylvania State University, Radboud University Medical Center and Salk Institute for Biological Studies.
Approximately 7,000 research use only, or RUO, high throughput sequencers are currently installed worldwide. These sequencers are developed and sold almost entirely by Illumina and are owned by an estimated 3,000 unique customers. Sequencing is very good at detecting genome differences involving just a few base pairs or single-nucleotide variations, which Saphyr cannot detect, but sequencing, including next-generation sequencing, or NGS, cannot reliably detect the larger structural variations that our Saphyr system can detect. Therefore, Saphyr is being adopted alongside this installed base of sequencers as a complement that is designed to give users the ability to see a much wider scope of genome variation than ever before.
The Saphyr system, which is for RUO, is also beginning to be adopted by cytogenetics labs that seek to use it in commercial clinical tests of its patients as a laboratory-developed test, or LDT. We estimate that approximately 2,500 cytogenetics labs exist wordwide. These labs currently rely on existing methods such as karyotyping, fluorescence in situ hybridization, or FISH, and microarrays for clinical tests and research that look at chromosomal structure, location and function in cells. Major guidelines for oncology and genetic disease clinical diagnostics recommend first-line structural variation testing by these existing methods. The organizations issuing these guidelines include, among many others, World Health Organization (WHO), National Comprehensive Cancer Network (NCCN), American College of Medical Genetics (ACMG) and American College of Obstetricians & Gynecologists (ACOG).
More than 30 medical institutions are conducting more than 20 human translational research and human clinical studies in 2019 and 2020 to assess Saphyr’s ability to detect structural variations and diagnose patients and, in certain studies, to compare those results to those produced via existing cytogenetic methods. We expect the findings from these studies, whether assessed internally or published by the institution, to help drive adoption of Saphyr beginning in 2020.
Saphyr and its predecessor system, which we collectively refer to as our system in this Annual Report, have been cited by researchers and clinicians in hundreds of publications covering structural variations in areas of high unmet medical need and research interest, such as rare and undiagnosed pediatric diseases, muscular diseases, developmental delays and disorders, prostate cancer and leukemia. Importantly, Saphyr can be used alone to provide comprehensive detection of structural variations and enable diagnostic calls without the need for sequencing or cytogenetic technology. Saphyr enables these diagnostic calls with low cost per patient, high speed and industry leading performance. Saphyr’s performance characteristics include up to 99% sensitivity, less than 2% false positive rates and accurate diagnosis with allele fraction, or the percentage of sample exhibiting the variant, as low as between 3-5%.
2
Recent Highlights
Below is a summary of selected highlights since our follow-on public offering in October 2019:
|
•
|
We announced the adoption of our Saphyr system by PerkinElmer Genomics and the University of Iowa, including their development of assays using our optical mapping technology to expand their genetic tests assessing disease-associated chromosomal abnormalities.
|
|
•
|
We announced that Novogene added the Saphyr system to their repertoire of genomics data services.
|
|
•
|
We announced the adoption of our Saphyr system by Mayo Clinic for applications in neurodegenerative disease.
|
|
•
|
We announced the adoption of our Saphyr system by GeneDx, using our system for the clinical detection of genetic variants in muscular dystrophies, developmental and reproductive disorders.
|
Industry Background
Genome analysis is the process of extracting biological information from DNA. DNA is the code that is found in all living cells and determines the characteristics and health of all living organisms. Although each organism’s DNA order is unique, all DNA is composed of the same four nucleotides that come in pairs, which are referred to as base pairs. The human genome is composed of six billion of these base pairs (three billion of which are the maternal copy and three billion of which are the paternal copy of the genome), distributed across 23 pairs of chromosomes ranging in size from approximately 50 million to approximately 250 million base pairs. Genome variation is defined as at least one base pair differing in a comparison of sequence against a reference standard and can be as large as tens of millions of base pairs.
It had long been believed by the scientific community that all problems in genome analysis could be addressed by DNA sequencing, which is a method of determining the precise order of the bases adenine (A), guanine (G), cytosine (C) and thymine (T) in a genome. Many in the industry felt that the only bottlenecks for sequencing companies to address were the cost per genome and the throughput of the sequencers. If these issues could be addressed, it was generally believed that sequencing would usher in a new wave of medical-grade genome analysis that would give rise to an abundance of highly impactful discoveries in medicine. These discoveries would lead to novel therapies and patient management pathways driven by exquisitely specific and sensitive diagnostic tests.
In recent years, however, it has become evident that sequencing is not completely fulfilling the needs of researchers and clinicians. For example, after 10 years with next-generation sequencing in use, the diagnostic yields of the leading genetic testing laboratories in the world continue to hover around only 50%, which is where they have been for at least two decades, meaning that only half of patients receive a confirmed pathogenic diagnosis. Researchers and clinicians now agree that despite major advances in the speed and cost-effectiveness of sequencing, it fails to reliably detect structural variations, which represent an entire class of genome variation.
Structural variation is one of the most biologically important aspects of the human genome. It is the underlying driver of many known human diseases, including numerous genetic disorders, inherited diseases and cancer. Structural variations occur when relatively large groups of base pairs change their existence or position in the genome relative to a normal standard. Structural variations can be as small as a few hundred base pairs or as large as tens of millions of base pairs and can be confined to one chromosome or can unfold between chromosomes. The changes can be rearrangements in location, order or orientation, and they can involve the insertion, deletion or duplication of entire blocks of base pairs. As an example of the importance of structural variations, thousands of base pairs can be rearranged and result in the ABL gene from one chromosome joining the BCR gene on an entirely different chromosome to form BCR-ABL, an oncogenic fusion gene which causes certain leukemias.
We believe the available methods to detect structural variations for research and clinical applications, other than Saphyr, are antiquated and cumbersome and can only detect a small proportion of the structural variations across an entire genome. These methods therefore have very limited utility in population research studies that seek to discover new structural variations to explain pathology. Without additional tools, researchers and clinicians cannot comprehensively study the genome, which we believe will ultimately result in the failure of genomics to deliver on its full promise of new therapies and diagnostics.
The Saphyr system provides a solution for comprehensive structural variation analysis. The Saphyr system is a proprietary, sample-to-result platform based on physical mapping of the genome, which is the process of assigning the chromosomal location, order and orientation of the functional elements of the genome. We believe that Saphyr is the only product capable of detecting structural variations at high sensitivity and specificity with a workflow that is cost-effective and time-efficient. A complete and accurate physical map of the genome enables the user to much more readily and systematically detect the structural variations that sequencing and cytogenetics technologies miss. Our mapping makes it possible for researchers and clinicians to more comprehensively detect structural variations and measure the complete scope of genome variation present in their study populations.
3
Market Opportunity
According to Research and Markets, the worldwide market for genomics products and services is expected to reach approximately $23.9 billion by 2022, up from approximately $14.7 billion in 2017, representing a compound annual growth rate of 10.2%. We believe that the market opportunity is predominantly split among three regions: North America, Europe and Asia. Within Asia, one of the fastest growing genomics markets is China, where adoption of genome analysis technology has been growing at approximately 20% per year.
The two segments of the genomics market that are driving the uptake of our product are:
|
•
|
Sequencing for Discovery Research.
In discovery research across patient cohorts, sequencing is primarily used to find single nucleotide variations responsible for disease or therapeutic response. Sequencing alone, however, is significantly limited due to its inability to reveal structural variations. Our Saphyr system has been expanding this market segment by complementing sequencing to expand the scope of genome variation that can be analyzed in a study and achieve a more comprehensive view of the genome.
|
|
•
|
Cytogenetics.
To provide a clinical diagnosis, cytogenetic tests detect known variations that are linked to specific diseases or therapeutic responses. The technologies used for detecting structural variations are expensive and involve cumbersome workflows with relatively limited ability to scale to higher volumes or more complex testing panels. Sequencers tend not to be used for cytogenetics due to their inability to reliably detect structural variations. Cytogenetics laboratories are beginning to adopt Saphyr as a more effective and efficient approach to finding the structural variations relevant to cytogenetics. For this segment, Saphyr is used alone to provide comprehensive detection of structural variations and enable diagnostic calls without the need for any sequencing or cytogenetic technology.
|
We believe that the discovery research and cytogenetics segments together comprise an addressable opportunity for us to sell up to approximately 9,500 Saphyr systems, representing a current total instrument market opportunity of approximately $2.1 billion. Importantly, we expect this market opportunity to expand at the rate of adoption of new RUO high throughput sequencers which we estimate is over 15% per year. While we do not expect the number of cytogenetics labs to increase significantly, we expect our growth in this market to be driven by conversion of traditional cytogenetics methodologies to our Saphyr system.
In addition to the instrument sales opportunity, Saphyr instruments generate recurring revenue from chip consumables that are used on a per-sample basis. We believe each Saphyr instrument has the potential to create recurring revenue in a range of approximately $60,000 to approximately $150,000 per year, suggesting a potential annual recurring revenue opportunity of approximately $0.6 billion to approximately $1.4 billion.
Therefore, we believe that our currently addressable portion of the genome analysis market is estimated to be between $2.7 billion and $3.5 billion.
Existing Technologies and Their Limitations
Existing technologies fail to adequately address the need for structural variation detection because they do not overcome the inherent complexity of the genome or they are not capable of providing a cost-effective, scalable solution to meet the increasing demands of genomics research and clinical applications.
The Genome Is Complex
Genome composition itself makes the measurement of genome structure and structural variation inherently difficult. Genome sequence is built from combinations of only the A, G, C and T nucleotides. The nucleotides have a natural pairing system in which A pairs with T and G pairs with C. Each pair of nucleotides is referred to as a base pair. In humans, the approximately six billion base pairs are distributed across 23 pairs of chromosomes. A chromosome is an organizational unit that biology has evolved to compartmentalize genomic information. One set of 23 chromosomes (three billion base pairs) is inherited from each parent. Within each chromosome, the base pairs are organized into functional elements such as genes, which code for protein production, and other elements that regulate how and when the genes are expressed for protein production.
The six billion base pairs that make up the human genome cannot be read by any existing technology in a simple linear, contiguous fashion. Due in part to only four unique nucleotides being available to write the entire genetic code, it is very common for stretches of sequence to be identical either within the same chromosome or between chromosomes. As much as two-thirds of the human genome is
4
made up of repetitive DNA sequences. This repetition tends to cause structural variations to be flanked by sequences that are identical to sequences in other parts of the genome which further complicates structural variation detection.
The Genome Orchestrates Life and Genome Structure Is Key
Genome structure is the way in which the functional elements are organized. Namely, the location on each chromosome where the gene or functional regulatory elements are found, what order and orientation they are in and how many of each element are present. This organization is an essential part of the instructions that the organism uses in every one of its cells to develop and differentiate and to react and respond to its environment over its lifetime. When this critical location, order, orientation or quantity vary, it is termed structural variation.
Even though both single nucleotide variation and structural variation are each very common, a much larger number of variant nucleotides in the average human genome are found in structural variations as compared to single nucleotide variations. A recent study showed that 30 million base pairs, on average, in the human genome are part of structural variations while only 10 million are single nucleotide variations. Most variations are inconsequential and make up the background variation responsible for the diversity of life. Over time, these variations can randomly affect genes and proteins which, through natural selection, drive diversity and evolution across species and diversity within them. Variations can also cause disease.
Relative to single nucleotide variations, structural variations are much more apt to be profoundly disruptive. They often cause a tectonic shift in the genome. These genomic shifts can have devastating effects on the health of a human. Examples where structural variations caused a disruption of genes resulting in disease include:
|
•
|
dystrophin gene variation – structural variation disrupting dystrophin production that is found in Duchenne Muscular Dystrophy;
|
|
•
|
9pminus variation – deletion found in a rare developmental syndrome in children;
|
|
•
|
TMPRSS2-ERG fusion – gene fusion found in prostate cancer;
|
|
•
|
EML4-ALK fusion – gene fusion found in lung cancer; and
|
|
•
|
BCR-ABL fusion (Philadelphia chromosome) – gene fusion found in leukemias such as chronic myelogenous leukemia, acute lymphoblastic leukemia and acute myelogenous leukemia.
|
It is important to detect these structural variations and the potentially thousands of other structural variations in each individual. Sequencing and cytogenetics simply do not elucidate comprehensive structural variations in a systematic and cost- and time-efficient manner. Most structural variations found to date that have been implicated in disease, such as those listed above, were discovered through laborious, expensive, unindustrialized and non-comprehensive methods over the course of many years. Thousands of additional important structural variations are believed to exist and are expected to be found with a systematic structural variation detection tool such as our Saphyr.
The Limitations of Sequencing
As the first complete draft of the human genome was being assembled in 2000, the belief arose that most questions in genome analysis could be addressed by sequencing. Over the course of over 15 years, sequencing proliferated across the entire genome analysis community with Illumina becoming the clear sequencing industry leader. As more sequencing data emerged, it became apparent that sequencing alone would not adequately elucidate the causes of human disease. The promise of sequencing was not fully delivered due to sequencing’s inability to address the complexities of genome composition.
Nearly all genome sequencing, including next-generation sequencing, uses a method called sequencing by synthesis. Sequencing by synthesis is an in-vitro process for synthesizing a copy of DNA, one base at a time in a way that makes it possible to measure the identity of each base as it is incorporated into the growing DNA copy. Sequencing by synthesis involves cutting genomic DNA into small pieces of a few hundred base pairs each, amplifying these pieces many times and anchoring them to a solid support where they are copied by a polymerase using fluorescently labeled bases. These copies are called sequencing reads. Illumina, which is the world leader in next-generation sequencing technology, markets systems that provide average read lengths that are 100 to 300 base pairs long. These short reads are matched by computer programs to a reference genome in a process called alignment. The reference is meant to represent the “standard” human genome in a normal, non-diseased state. It is the result of billions of dollars spent on the Human Genome Project and other initiatives begun in the late 1990s and early 2000s to put together the first complete set of human DNA code. When a patient’s genome is sequenced today, the short reads are compared against the reference as a template. Using this approach, sequencing attempts to reconstruct, or “resequence,” the genome and infer genome variations.
5
The read lengths typical for next-generation sequencing are often too short to determine the right location and orientation of a reading frame in the genome because many of the reads from one chromosome are identical to reads from either another chromosome or even another location on the same chromosome. When reads are indistinguishable from one another, computations cannot be performed to place the reads in the correct location in the genome.
The other significant limitation with next-generation sequencing is that the genome fragments used as templates in the copying process are also very short. This fragmentation is a result of the methods used for DNA isolation from the cell and the use of polymerase chain reaction, or PCR. These short lengths disconnect and destroy most of the structural information of the original genome and make next-generation sequencing unable to reliably detect genomic variations larger than a few hundred base pairs.
If the sequencing reads were accurate, on the order of hundreds of thousands of base pairs long and from templates that were even longer, they would overcome the redundancy of genome composition and every read would have a unique position in the genome. It would then be possible to assemble a structurally accurate picture of the genome. Accurate structural variation would be revealed upon comparing structurally accurate assemblies of genomes across a population to determine the structural changes that are driving the observed pathology or physiology.
The recognition of the need for greater lengths of sequence reads to determine genome structure, birthed the so-called long-read sequencing submarket. Because of the need for long-read sequencing, Pacific Biosciences of California developed a system that uses another alternative form of sequencing by synthesis, while Oxford Nanopore Technologies developed a system that uses nanopore technology. These systems provide users with average read lengths in the tens of thousands of base pairs. However, these read lengths have proven not to be long enough to reliably and comprehensively detect structural variations. Pacific Biosciences’ polymerases cannot regularly produce reads that are the necessary hundreds of thousands of base pairs in length. In addition, Oxford Nanopore’s system has difficulty reliably feeding molecules that are, on average, hundreds of thousands of base pairs in length through each nanopore. The time and cost of providing a comprehensive whole genome analysis of a patient in a clinical setting is prohibitive when using these longer-read technologies.
In summary, all existing sequencing technologies, whether short or long, do not provide a solution for integrating structural variation into patient diagnosis and management.
The Limitations of Cytogenetics
Cytogenetics is the study of chromosomal structure and how structural variations impact health. The field has historically relied on karyotyping, FISH and more recently, microarrays. These methods each can detect some structural variations, but they are all inadequate solutions for high volume and low cost genetic testing for structural variations and none is an approach that can comprehensively detect structural variations with the ultra-high sensitivity and ultra-high specificity of the Saphyr system.
Karyotyping
Karyotyping is the gross optical examination of the chromosomes using a microscope. It is a laboratory technique, modernized in the 1960s, whereby the chromosomes from one cell are stained and visualized by a pathologist or technician to investigate the total number and structure of chromosomes.
Karyotyping has many limitations. It is cell culture dependent and therefore requires live and actively dividing cells. Karyotyping has extremely low resolution and is therefore only sensitive for very large structural variations that are unambiguous to identify. Given that chromosomes are being directly viewed on a slide by a pathologist with a microscope, resolution tends to be limited to structural events that are larger than five million base pairs. When karyotyping is used to diagnose unknown genetic disease, only about 5% of karyotyping tests result in a confirmed pathogenic finding. The test is costly, and its results are subject to each pathologist’s interpretation which introduces variability in diagnostic calls and makes the methodology not amenable to automation.
FISH
FISH is a molecular cytogenetic technique that is used to detect chromosomal aberrations. FISH is based on the idea of using a specifically developed probe to detect a particular gene abnormality that is suspected to be in the genome. When the probe finds targeted variation, it binds to it and generates a fluorescent signal which is observed with a fluorescence microscope.
Several characteristics of FISH limit its productivity and efficiency for use in structural variation detection. Like karyotyping, it is cell culture dependent and therefore requires live and actively dividing cells. Also, FISH is limited to known targets and cannot be used for discovery. Every FISH test performed needs to be chosen to look for a specific genetic marker that the clinician anticipates may be found based on the clinical symptoms of the patient. In addition, the test results can be ambiguous and inconclusive, and reproducibility
6
and variability among users can be a significant issue. Like karyotyping, FISH’s diagnostic yield is very low when used to diagnose unknown genetic disease with only an estimated 7% of FISH providing a confirmed pathogenic finding. In addition, FISH is expensive, especially for the limited amount of information that it provides.
Microarrays
Chromosomal microarrays and SNP (single nucleotide polymorphism) arrays are tests consisting of slides that contain thousands of spots of DNA fragments that bind to the DNA of the sample. Microarrays detect gains and losses of specifically chosen DNA sequence and can also infer gene expression levels. Microarrays interrogate thousands of genes simultaneously that are known to be associated with presumed genetic disorders of interest to the user. Probe coverage is typically highly focused in regions of known clinical significance.
Microarrays have limited utility as a diagnostic tool as they are only useful when there are gains and losses of base pairs within the sample’s genome that are specific to the probes that are populated on the array. Microarrays are also limited in their ability to provide specific locations of gains or losses on a chromosome, or even identify on which chromosome that the gains or losses occur. In addition, microarrays have low resolution as they cannot reliably detect structural variants smaller than 50,000 base pairs. Also, the diagnostic yield of microarrays is low. Only an estimated 20% of microarray tests provide a confirmed pathogenic finding when used to diagnose unknown genetic disease.
Our Solution
Our approach to measuring genome structure and structural variation is novel and highly differentiated. Most efforts in the genomic industry to address structural variation have been based on taking sequencing by synthesis as the starting point and attempting to overcome its deficiencies to make it applicable to structural variation analysis. In contrast, the Saphyr system directly observes extremely long genomic DNA without any amplification to construct a physical map that accurately assigns the chromosomal location, order, orientation and quantity of all the genome’s functional elements. Our solution is built upon four key elements:
|
•
|
Extremely long molecules for analysis.
Structural accuracy can only come from analysis of extremely long chromosomal fragments. The Saphyr system is capable of analyzing single molecules that are on average approximately 250,000 base pairs long. Such fragments will contain enough unique sequence information that they are distinguishable from other fragments. These lengths are over 1,000 times longer than the average read length with Illumina systems and approximately 10 times longer than the average read lengths with Pacific Biosciences and Oxford Nanopore systems. Building a picture of the genome with massive building blocks overcomes the inherent challenge of genome complexity and is the key to Saphyr’s unprecedented sensitivity and specificity.
|
|
•
|
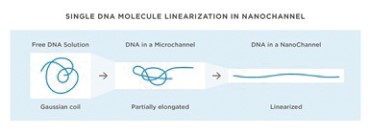
Proprietary nanotechnology for massively parallel linearization and analysis of long molecules with single molecule imaging.
Analyzing these extremely long chromosomal fragments required invention. Molecules of this size are more like balls of yarn in a test tube and must be unraveled for meaningful analysis. We invented, patented, developed and commercialized nanochannel arrays to capture them from solution and unwind and linearize them for structural variation analysis. Each molecule is imaged separately, making it possible to deconvolute complex mixtures including haplotypes and heterogeneous tumors, as shown in the graphic below.
|
|
•
|
DNA labeling chemistry specifically for physical mapping.
The detailed analysis of sequence we use is also highly unique and novel. Instead of identifying the sequence of every base pair in these long fragments, we label and detect specific sequence patterns or motifs that occur universally across every genome with an average frequency of approximately one
|
7
site for every few thousand base pairs. The key to our method entails introducing fluorescent tags at the sequence-specific site using highly specific and robust enzymatic chemistry along the extremely long fragments. These fragments, stretched out in nanochannels, are then directly imaged allowing us to measure the distance between labels with high accuracy. The pattern of labels detected on all these fragments can then be related to the pattern of sequence motif sites in a reference genome for comparison. Changes in the pattern indicate structural variation.
|
•
|
Bioinformatic tools for structural variation analysis.
Finally, our approach includes a novel bioinformatics platform that we developed from the ground-up to take advantage of the unique benefits of our solution. It comprises proprietary algorithms for the construction of a structurally accurate physical map of the genome without using a reference genome in assignment of structure. Physical maps of a test subject are then compared in cross-mapping analysis that allows our system to detect genome wide structural variation, including the most complex balanced events. Our system can do so by comparing one physical map against a common reference, or against the maps of a mother and father in the case of an afflicted child with an undiagnosed disease for example, or against maps of normal blood when studying solid tumor cancers. This comparative approach uses our proprietary database of healthy individuals to filter out the non-disease causing structural variants found in the general healthy population.
|
Our Focus Areas
Our Saphyr system serves many segments of the genomics market seeking to find and understand structural variation. We have identified focus areas where we concentrate our resources to ensure robust adoption of our system and frequent utilization of consumables. We have selected these segments because of their urgent need to detect structural variations and the significant economic opportunity they represent. Our current focus areas are human genetic diseases, including rare diseases and oncology. Our Saphyr system, which is for RUO, is being used for basic and translational research and also beginning to be adopted by cytogenetics labs that seek to use it in commercial clinical tests of its patients as an LDT.
Rare Diseases
In genetic disease, existing tools have reached a plateau where almost half of patients with genetic disease who are tested in clinical laboratories fail to receive a molecular diagnosis. In order to increase diagnostic yield, a massive increase in the understanding of the complete structure and variation of the genome is essential. We believe the various studies presented below illustrate how Saphyr is essential to achieving this objective.
Example: Undiagnosed Diseases Network Patient
The National Institutes of Health funded Undiagnosed Diseases Network, or UDN, brings together top clinical and genomics teams from several key institutes in the U.S. to study the most difficult to diagnose genetic disease patients. Through a collaboration with UCLA, Dr. Eric Vilain of Children’s National Medical Center runs all UDN patients of the UCLA cohort on Saphyr to identify pathogenic variants that go undetected using sequencing or cytogenetics in known or novel genes.
While data collection and a full analysis of the cohort is ongoing, at the American Society of Human Genetics, or ASHG, annual meeting, Dr. Vilain’s team presented preliminary results on the first 12 UDN patients and their parents analyzed with Saphyr. In each family, Saphyr detected thousands of variants of which more than 100 were rare, and typically three to seven structural variations that were new to the patient, referred to as de novo structural variations, were identified. In one case presented at ASHG, whole genome sequencing and chromosomal microarray on the DNA of a girl with developmental delay, autism, poor sleep and self-mutilation failed to identify pathogenic variants. Saphyr was able to detect a 2,500-base pair insertion inherited from the father in a gene where whole genome sequencing had picked up a random mutation inherited from the mother. Together, the two variants create a compound heterozygous mutation in a gene with a known phenotype that includes poor sleep, developmental delay and autism with self-mutilation. Large heterozygous insertions like the one presented here are seldomly detected by next-generation sequencing and are too small for microarrays. The diagnosis of this patient was only possible by the combination of next-generation sequencing and Saphyr.
Based on Dr. Vilain’s results, including a study on patients with Duchenne Muscular Dystrophy published in Genome Medicine, Saphyr targets the 40% to 70% of genetics patients who cannot be diagnosed with exome or whole genome sequencing. Saphyr has the power to replace multiple tests for genetic disorders, including microarrays, PCR tests and chromosomal cytogenetic tests. Each existing test requires a patient to visit a clinician and most often provides an inconclusive result. Dr. Vilain showed evidence that integration of Saphyr into existing diagnostic regimens can help to change the way that medicine is practiced.
Example: Rare Familial Cancer
A rare cancer, occurring in approximately one in one million people, was found in four members of a single extended family. A team at MD Anderson Cancer Center had used all standard clinical tools and whole genome sequencing on the affected family members
8
but failed to identify any causative variants. Using Saphyr data, a 38,000-base pair sequence was found in these patients in six tandem copies, while unaffected family members had a single copy of this sequence. The duplication was found to be upstream of an important gene in the pathway known to be upregulated in this rare cancer. The identification of this mutation could be useful for pre-implantation embryo analysis and targeted treatments.
Example: Repeat Expansion Disorder
In a study by Dr. Eric Wang of the University of Florida, Saphyr was able to precisely count the number of times that a sequence segment was repeated in muscle cells derived from a patient with Myotonic Dystrophy. This devastating disease is a repeat expansion disorder, caused by the extreme lengthening of short repeat array in the genome. Other diseases in this category include ALS, Huntington’s Disease, and Fragile-X disease. Current methods that do not utilize our Saphyr system cannot measure the length of such repeat arrays accurately. Saphyr’s ability to measure the normal and expanded repeat with unprecedented accuracy and detail on single molecules could help allow the development of better targeted tests and medicines.
Example: PerkinElmer
PerkinElmer, based in Atlanta, Georgia, has acquired Saphyr to initially offer an LDT designed to diagnose facioscapulohumeral muscular dystrophy (FSHD). They also plan to extend the menu of tests offered based on Saphyr to other repeat expansion disorders as well as oncology. As a result, a number of patients with a variety of birth defects and developmental disorders are being analyzed on Saphyr.
In genetic disease, the standard of care consists usually of a combination of both phenotype-dependent targeted tests, and whole-genome analysis approaches. Targeted tests can consist of Multiple Ligation Probe Amplification, or MLPA, to test for the presence or absence of specific exons, PCR amplification and Sanger sequencing of candidate genes and multiple FISH probes to pick up specific structural variants common to the expected disease. For whole genome approaches, first tier diagnostic tools include karyotyping techniques like metaphase chromosome spreads and in some cases microarrays. More recently, whole exome sequencing or whole genome sequencing are increasingly being introduced.
A future workflow in which Saphyr replaces the large majority of FISH and MLPA tests for a genetics clinic such as PerkinElmer would rely on Saphyr to detect all structural variants larger than 500 base pairs, and on next-generation sequencing to detect all single nucleotide variants and other variants smaller than 500 base pairs. Since up to numerous FISH and MLPA tests are often performed, Saphyr’s single whole genome analysis provides a cost effective solution that saves significant amounts of time, labor and analysis in lieu of such tests.
Oncology
In cancer, each patient has a unique disease with a complex pattern of genome changes. Traditional and recently-developed treatments do not attack the individual changes in each patient’s tumor. Recent personalized medicine programs aim to provide clinicians with individual treatments specifically targeting the mutations found in each patient’s cancer. For personalized cancer medicine to be successful, all variants in the cancer genome need to be detected, which is not feasible with cytogenetic or whole genome sequencing approaches. The studies presented below demonstrate that Saphyr is critical for a complete understanding of a cancer genome, which is essential to enable truly targeted treatments.
Example: Hematologic Malignancies
In a study to be published in Nature Genetics, Dr. James Broach, Director of the Penn State Institute for Personalized Medicine, presented system’s ability to detect large rearrangements in leukemia, with a strong focus on translocations. In his research, our system detected all known translocations identified with standard clinical tools and, importantly, many structural variations never before identified in cancer, plus hundreds of structural variations that could not be seen by other methodologies.
Attempts by Dr. Broach to detect translocations using next-generation sequencing were unsuccessful because of the large number of false positive translocation calls. Because of the highly repetitive nature of the human genome, many remote genomic regions have high sequence homology, and short-read sequencing often fails to correctly map reads to the correct genomic origin, leading to excessive false positive calls. The extremely long molecules that our system analyzes span long repetitive segments of sequence and can anchor sequences into the correct genomic context, leading to extremely few false positive calls.
Given the high speed, low cost, industry-leading sensitivity and high reliability of our system displayed in this study, Dr. Broach showed evidence that our system is well positioned to eventually become the primary tool for clinical detection of genomic structural variation.
9
Example: Prostate Cancer
In a study published in Oncotarget, Dr. Vanessa Hayes at the Garvan Institute of Medical Research in Australia presented a complete tumor-normal comparison from a primary prostate cancer. Dr. Hayes’ team identified 85 large somatic deletions and insertions, of which half directly impact potentially oncogenic genes or regions. Only 11% of these large structural variations were detected using high-coverage, short-read next-generation sequencing and bioinformatics analyses using a combination of the leading structural variation calling algorithms for next-generation sequencing data. Many structural variations detected with our system were flanked by repetitive sequences, making them undetectable to short-read sequencing.
In subsequent studies presented at the Advances in Genome Biology and Technology annual meeting, Dr. Hayes detected several oncogenic driver mutations in metastasized prostate cancer samples. Several of the reported mutations were variants previously found in other cancer types but never before reported in prostate cancer, and for which effective treatments are available. Existing gene panels or FISH tests performed on cancer samples only test for expected variants. Our system’s whole genome analysis approach is the only molecular method that is capable of identifying all major structural variants in a cancer genome with sufficiently high sensitivity. To make existing targeted cancer therapies more effective and to discover new ones, a complete characterization of the genome is important, making our system valuable in personalized cancer medicine.
Our Products
We develop and market the Saphyr system, a complete sample-to-result solution for structural variation analysis that empowers comprehensive genome analysis and facilitates a deeper understanding of genetic variation and function. We believe it is the only solution capable of addressing the needs for structural variation analysis because it is:
|
•
|
Highly sensitive.
We believe Saphyr is the most sensitive structural variation detector currently on the market in that it can identify structural variations that no other system can.
|
|
•
|
Highly specific.
The structural variations found by Saphyr are found by direct observation rather than inference. Saphyr has a very low false positive rate, typically less than 2%.
|
|
•
|
Cost effective.
We expect the cost per sample to continue to decline to less than $300 per sample in 2020 and less than $100 per sample in 2021.
|
|
•
|
Fast.
Saphyr generates greater than 1,920 giga base pairs of information per day, on par with some of the faster short-read sequencers in the market. For highly sensitive structural variation detection, this allows Saphyr to process six human samples per day. We expect Saphyr’s throughput to increase to 12 per day by the end of 2020. Over this same period, we expect to continuously improve the automation of sample prep and bioinformatics to help drive efficiencies of workflow.
|
Saphyr is being adopted across an extensive base of customers in world-class clinical, translational research, basic research, academic and governmental institutions as well as pharmaceutical and biotechnology companies. We began marketing the Saphyr system in February 2017. We sell through a direct sales force and support organizations in North America and Europe, and through distribution partners in the Asia-Pacific and other regions of the world. We have shipped 104 Saphyr instruments globally, of which 84 have been installed. We continually seek to expand our product offerings to meet the needs of our customers.
When customers adopt the Saphyr system, they acquire one or more instruments, chips, reagents for DNA isolation and labeling and a suite of bioinformatics tools. The chips and reagents are used on a recurring basis. We also sell them ancillary solutions such as servers, reagents and other non-proprietary components used with the system. We designed Saphyr
to accommodate performance upgrades without the need for replacement of the entire instrument. We intend for these performance enhancements to be delivered through software upgrades, purchased hardware upgrades and new chips and reagents.
10
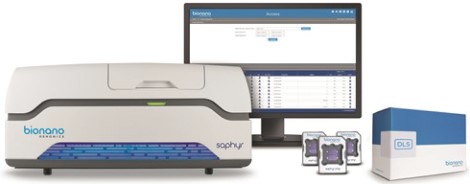
The Saphyr Instrument

The Saphyr instrument is a single-molecule imager that includes high performance optics, automated sample loading based on machine learning algorithms and computational hardware and control software. The instrument’s high-performance optics simultaneously image DNA linearized in hundreds of thousands of nanochannels. The instrument’s control interface is the user’s primary control center to design and monitor experiments as they occur in real time. The computational hardware is responsible for the secondary processing of the image data being produced on the Saphyr.
The Saphyr instrument currently analyzes two Saphyr chips, containing up to three samples each, per day with statistically relevant depth of coverage across each whole genome. The instrument configuration along with the planned improvements to the chip mentioned below are expected to enable Saphyr to process up to 12 human samples per day by the end of 2020.
The Saphyr Chip

The Saphyr Chip® is the consumable that packages the nanochannel arrays for use in genome analysis. In its current form, each Saphyr chip has three flow cells. Each flow cell contains approximately 120,000 nanochannels that are roughly 30 nanometers wide and can hold a unique sample, which enables a researcher to analyze three samples per chip per day. Two Saphyr Chips can be loaded in the Saphyr instrument and allow it to process six human samples per day. In 2020, we expect to offer protocols designed to allow more than one sample per flowcell, thereby increasing the capacity of each chip. With Saphyr’s improving data collection rates and the increased capacity of a Saphyr Chip, we expect the daily throughput of the Saphyr system to reach 9-12 samples per day.
To manufacture the arrays, we use photolithography in a semiconductor fabrication facility to print hundreds of thousands of tiny grooves on silicon wafers and then dice the wafers into individual chips. Our chips are inexpensive to manufacture and highly scalable. The fluidic environment in each channel allows individual molecules to move swiftly utilizing only the charge of DNA. Our nanochannels allow only a single linearized molecule at a time to enter a given channel while preventing the molecule from tangling or folding back on itself. Importantly, hundreds of thousands of molecules can move through hundreds of thousands of parallel nanochannels simultaneously, enabling extremely high-throughput processing on a single-molecule basis.
Saphyr Sample Prep and Labeling Kits

Our Bionano Prep Kits™ and labeling kits provide the critical reagents and protocols needed to extract and label high molecular weight, or HMW, DNA for use with the Saphyr system. These kits are optimized for performing our genome mapping applications on a variety of sample types.
Our workflow begins with the isolation of ultra-high molecular weight DNA. Our sample prep kits are optimized for isolating and purifying ultra-high molecular weight DNA in a process that is gentler than existing DNA extraction methods. The resulting purified DNA is millions of base pairs long and optimal for use with our systems. Each Bionano Prep Kit allows customers to perform five to 10 HMW DNA preps. Our kits and protocols enable the extraction of HMW DNA from a variety of sample types including soft or fibrous animal tissue, plant tissue, cell lines, bone marrow aspirates and human blood.
11
Our labeling reagents are optimized for applications on our genome mapping systems. Starting with HMW DNA purified using the appropriate Bionano Prep Kit, fluorescent labels are attached to specific sequence motifs. The result is uniquely identifiable genome-specific label patterns that enable de novo map assembly, anchoring sequencing contigs and discovery of structural variations as small as 500 base pairs to up to chromosome arm lengths.
Our newest and most powerful kit for DNA labeling, the Direct Label and Stain, or DLS, kit is a proprietary, nondestructive chemistry for sequence motif labeling of genomic DNA that improves every aspect of our genome mapping. DLS uses a single direct-labeling enzymatic reaction to attach a fluorophore to the DNA at a specific 6-base pair sequence motif, yielding approximately 16 labels per 100,000 base pairs in the human genome. After labeling, the molecules are linearized in the Saphyr chip on the Saphyr instrument and imaged. Through the isolation, labeling and linearization steps, the molecules maintain an average length of around 250,000 base pairs. The label patterns on each molecule allow them to be uniquely identified and aligned in a pair-wise comparison against all other molecules imaged from the same sample.
Data Solutions

Our data solutions offering includes a complete suite of hardware and software for end-to-end experiment management, algorithms for assembling genome maps and algorithms and databases for bioinformatics processing, all of which is driven through convenient web-based management and monitoring tools.
Bionano Access is our web-based hub for Saphyr operations. It provides all the software that our customers need for experiment management and our structural variation analysis in one place. With Bionano Access our customers can:
|
•
|
set up runs and monitor real-time data quality metrics remotely to flag potential sample quality issues early;
|
|
•
|
automatically start de novo assemblies and structural variation analysis when the desired amount of data has been collected;
|
|
•
|
detect variants with an allele fraction of 5%
|
|
•
|
visualize and manipulate maps and structural variants; and
|
|
•
|
analyze trios and clinical samples by filtering through uncommon variants to identify inherited and de novo variants, and export in a file format that is used consistently throughout the industry.
|
We have a suite of proprietary algorithms and databases that fully enable our proprietary bioinformatic and structural variation analysis pipelines. Using pairwise alignment of the single molecule images, consensus genome maps are constructed, refined, extended and merged. Molecules are then clustered into two alleles, and a diploid assembly is created to allow for heterozygous structural variation detection. Genome maps typically span entire chromosome arms in single, contiguous maps. Comparative analysis of maps reveals structural variation. Our customers use our variant annotation workflow to specifically uncover rare and sample-specific mutations. For example, to help a customer determine genomic variant frequency in a tumor, Saphyr compares the cancer sample structural calls against over 600,000 structural variations from over 160 humans with no evidence of diseases. To identify somatic mutations, the workflow can run comparisons of the tumor specimen against a control sample to determine whether the cancer mutations are present in low abundance among the control’s genome. Using this high through-put pipeline approach, we can efficiently focus on dozens of clinically significant structural candidates for further analysis.
Our hardware solution includes the Saphyr Compute Server, which provides cluster-like performance in an affordable, compact solution and the Bionano Compute Server, which expands the analytical capacity of the suite of tools. With these solutions, our customers are capable of performing multiple simultaneous analyses and sustaining continuous throughput, which allows them to spend less time waiting for data, so they can focus on investigating results. We also offer a cloud-based solution for data analysis.
12
The Saphyr System’s Industry-Leading Sensitivity and Specificity
Our Saphyr system detects structural variations that Illumina’s systems miss. As shown in the graphic below, the Garvan Institute of Medical Research generated data that we expect to be published which shows the density of structural variations found relative to the size of the structural variation found for our system (blue lines) against next-generation sequencing (Illumina; orange lines). Next-generation sequencing has a very significant deficiency in detecting structural variations. Given our system’s ability to detect structural variations, it picks up essentially where next-generation sequencing drops off, as shown below.
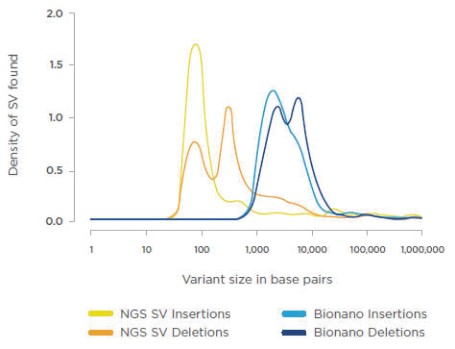
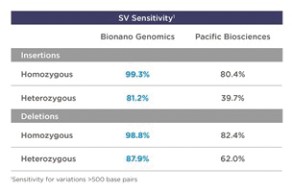
Retaining long-range contiguity throughout the genome mapping process is critical for any comprehensive study of genome structure and function, particularly for the analysis of structural variation in complex genomes. Saphyr offers unmatched sensitivity for the detection of large structural variations greater than 500 base pairs. Saphyr’s specific sensitivity percentages from recent studies are shown below:
|
•
|
99% sensitivity for homozygous insertions/deletions larger than 500 base pairs;
|
|
•
|
95% sensitivity for heterozygous insertions/deletions larger than 500 base pairs;
|
|
•
|
95% sensitivity for balanced and unbalanced translocations larger than 50,000 base pairs;
|
|
•
|
99% sensitivity for inversions larger than 30,000 base pairs;
|
|
•
|
97% sensitivity for duplications larger than 30,000 base pairs; and
|
|
•
|
97% sensitivity for copy number variants larger than 500,000 base pairs.
|
13
A study of Pacific Biosciences’ long-read sequencing’s ability to detect homozygous and heterozygous insertions and deletions was published recently. The sensitivity to detect homozygous structural variations using Pacific Biosciences was 87%, compared to 99% using Saphyr. The sensitivity to detect heterozygous structural variations using Pacific Biosciences was only 41%, which is less than half the 84% sensitivity for heterozygous structural variation detection using Saphyr. Even when the Pacific Biosciences structural variation calls were limited to insertions and deletions larger than 500 base pairs, the sensitivity for homozygous structural variations was only 81%, and for heterozygous structural variations was only 49%.
Saphyr detects duplications over 30,000 base pairs, in direct or inverse orientation, with a sensitivity of 97%. Saphyr detects 99% of inversions of that same size range. Inversions are the invisible variants and have traditionally been the hardest to detect structural events. They are balanced, without gain or loss of sequence, and unlike translocations they do not create easily visible changes in genomic context. Inversions often escape detection by traditional cytogenetic techniques. Chromosomal microarrays cannot identify balanced events, and metaphase chromosome spreads can only visualize some megabase-size inversions. Next-generation sequencing approaches tend to miss inversions because reads from inside the inversion tend to map back to the reference without any indication that the orientation of the sequence has changed. Detection of the breakpoints often fails, especially if the inversion is flanked by segmental duplications, repeat sequences or other non-unique sequences. Saphyr’s imaging of extremely long molecules overcomes these obstacles to identifying inversions.
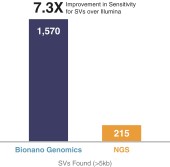
In a separate study, our system detected seven times more structural variations larger than 5,000 base pairs compared to next-generation sequencing. Dr. Pui-Yan Kwok at the University of California, San Francisco, demonstrated the robustness of our system for genome-wide discovery of structural variations in a trio from the 1000 Genomes Project. Using our system, hundreds of insertions, deletions, and inversions greater than 5,000 base pairs were uncovered amounting to 7.3 times more than the large structural variation events detected by next-generation sequencing. Importantly, many of the structural variations that were found were in regions believed to contain functional elements leading to disruption of gene function or regulation.
Our Strengths
We have established ourselves as one of the leaders in the field of genome analysis, and we believe we are the industry’s performance leader in structural variation detection. Below are our strengths that we believe will enable us to capture a significant portion of the genome analysis market and retain our leadership position in structural variation:
|
•
|
Highly differentiated technology platform enables researchers and clinicians to obtain information that cannot be had systematically and cost efficiently from traditional technologies.
Saphyr’s unique ability to systematically and cost efficiently see structural variations across the genome from 500 base pairs to tens of millions of base pairs is unique in the industry. We believe this greater insight will facilitate a paradigm shift in healthcare from an emphasis on treatment with
|
14
relatively untargeted therapies to a focus on earlier detection, more precise diagnosis and treatment with better targeted therapies.
|
•
|
Validated solution recognized industry-wide.
We have deep and expanding scientific validation. Our system has been cited in hundreds of publications, and we believe our technology is becoming a vital tool in cutting-edge life sciences research.
|
|
•
|
Validated solution for genetic testing.
Our system has been validated in a CLIA lab setting at PerkinElmer to test for facioscapulohumeral muscular dystrophy (FSHD). PerkinElmer introduced the LDT to the market in 2020.
|
|
•
|
Strong installed base of premier customers.
We have shipped 104 Saphyr instruments globally, of which 84 have been installed. Our customers include some of the world’s most prominent clinical, translational research, basic research, academic and government institutions as well as leading pharmaceutical and diagnostic companies. Examples include Children’s National Health System, Boston Children’s Hospital, PerkinElmer, GeneDx, Mayo Clinic, DuPont Pioneer, Garvan Institute of Medical Research, Genentech, Icahn School of Medicine at Mount Sinai, McDonnell Genome Institute at Washington University, National Cancer Institute, National Institutes of Health, Pennsylvania State University and Salk Institute for Biological Studies.
|
|
•
|
Attractive business model with a growing, high-margin recurring revenue component.
As we continue to grow our installed base of Saphyr systems, optimize workflows and expand our structural variation detection capabilities, we expect to rapidly increase sales of our high-margin consumables. The successful integration of our technology into our customers’ projects provides ongoing sales of assays and consumables.
|
|
•
|
Industry-leading intellectual property portfolio.
We have developed a global patent portfolio that includes 65 issued patents across 14 patent families and an exclusively licensed portfolio of patents and applications from Princeton University, which includes 34 patents across two families. This global patent portfolio has filing dates ranging from 2001 to 2019. We have robust intellectual property protection surrounding our devices, systems, and methods for macromolecular analysis. Our ideation stems from our highly active research programs and results in our patent portfolio continually expanding at a significant pace.
|
|
•
|
Highly experienced senior management team.
We are led by a dedicated and highly experienced senior management team with significant industry experience and proven ability to develop novel solutions. Each of the members of our senior management has more than 20 years of relevant experience.
|
Our Strategy
Our goal is to enable new research in genomics to allow greater insight into their role in human health in ways that have not been possible with any other current research and diagnostic technologies.
Our strategy to achieve this includes:
|
•
|
Drive adoption of Saphyr in discovery research and cytogenetics markets.
Saphyr has the potential to significantly expand the life science research market and genomics-based diagnostics market because of its unrivaled sensitivity, by enabling researchers to perform studies on structural variations that they were previously unable to perform. We believe Saphyr has the capability to enable the development of a new category of diagnostic tests and tools.
|
|
•
|
Support the publication of findings with Saphyr by our customers beyond the more than 280 papers published to date.
The annual number of publications featuring data generated by Saphyr and its predecessor system has steadily increased since 2010 when the first publication appeared. Recently, the overall number of these publications has grown significantly. For example, of the more than 280 papers published to date, approximately 80 were published in 2019 alone and 213 since 2017, the year Saphyr was launched. We will continue to support and foster our customer base to help grow the number of publications featuring our systems’ data. We believe that these publications are impactful as our customers’ studies cover structural variations in areas of high unmet medical need, such as rare and undiagnosed pediatric diseases, muscular diseases, developmental delays and disorders, prostate cancer and leukemia.
|
|
•
|
Expand gross margins through economies of scale and growing sales of consumables.
Our overall gross margin has historically been driven by our instrument gross margin as the sales of our instruments have constituted the significant majority of our total revenues to date. However, our instrument gross margin is significantly lower than our consumables gross margin. We expect our overall gross margin to expand in 2020 and beyond as:
|
|
◦
|
We further negotiate with silicon fabrication manufacturers for better contract pricing of our consumables. As our manufacturing lot volumes increase, we expect to have lower costs of goods sold. This is driven by the pass along of some of the economies of scale of contract manufacturers that mainly operate in the ultra-high-volume silicon computer chip industry.
|
15
|
◦
|
Consumables sales continue to represent the fastest growing component of overall revenues. As consumables growth continues to outpace instrument growth, we expect the proportion of our product mix which is higher gross margin to increase, thereby expanding our overall gross margin.
|
|
•
|
Continue to innovate our products and technologies.
We designed Saphyr to accommodate performance enhancements without the need for replacement of the entire instrument. For example, hardware upgrades and new consumables are made available to purchase by customers. We intend for these performance enhancements to be delivered on a regular basis. In addition, we periodically make available software upgrades to customers through download at no charge. We expect to continue developing and refining our technologies to improve the ease of use of our Saphyr system and enable our existing installed systems to meaningfully increase sample throughput and sensitivity and specificity of structural variation detection.
|
|
•
|
Partner with industry-leading companies and laboratories to accelerate adoption in clinical markets.
Establish additional collaborations with customers to help drive validating studies. Expand partnership efforts with clinical diagnostic companies to commercialize LDTs in the U.S. as well as LDTs and approved tests outside the U.S.
|
Sales and Marketing
As of December 31, 2019, our commercial team consisted of 46 individuals, including 16 salespeople, eight marketing personnel, and 22 sales support personnel, including customer solutions personnel, field service engineers and field application specialists. This commercial staff is primarily located in North America and Europe. Most of our sales support team is located at our headquarters in San Diego and some work remotely throughout the U.S., Europe and China.
We sell our products through a direct sales force in North America and Europe. Our sales strategy involves the use of a combination of sales managers and sales representatives. Our direct sales force includes nine salespeople located in the U.S. and four located in Europe. We expect to increase our sales force as we expand our business.
We sell our products through a network of distributors in the Asia-Pacific region and select other markets outside of North America and Europe. Specifically, we distribute our instruments and reagents via third-party distributors in markets such as China, Japan, South Korea, Singapore, Australia, India and South Africa. Three of our distributors are in China, one in Australia, one in Italy, one in Sweden, one in Japan and one in South Korea.
The role of our sales managers and sales representatives is to educate customers on the advantages of Saphyr and the applications that our system makes possible. The role of our field application specialists is to provide on-site training and scientific technical support to prospective and existing customers. Our field application specialists are technical experts with advanced degrees, including seven with Ph.D.s, and generally have extensive experience in academic research and core sequencing lab experience.
In addition, we maintain an applications lab team in San Diego, California composed of scientific experts who can transfer knowledge from the research and development team to the field application specialists. The applications lab team also runs foundational scientific collaborations and proof of principle studies, which help demonstrate the value of our product offering to prospective customers. This team also provides commercial services by running samples on Saphyr for researchers who do not have a Saphyr system of their own.
Our domestic and international sales force informs our current and potential customers of current product offerings, new product and new assay introductions, and technological advances in Saphyr systems, workflows, and notable research being performed by our customers or ourselves. As our primary point of contact in the marketplace, our sales force focuses on delivering a consistent marketing message and high level of customer service, while also attempting to help us better understand evolving market and customer needs.
We intend to significantly expand our sales, support, and marketing efforts in the future by expanding our direct footprint in North America and Europe as well as developing a more comprehensive support network in China where significant market opportunities exist. Additionally, we believe that there is significant opportunity in other European, South American, Asia-Pacific and Middle Eastern regions. We plan to expand into these regions via initial penetration with distributors.
Our sales and marketing efforts are targeted at key opinion leaders, laboratory directors and principal investigators at leading translational research, clinical institutions, governmental research institutions and pharmaceutical companies. In addition to our selling activities, we align with key opinion leaders at leading institutions and clinical research laboratories to help increase scientific and commercial awareness of our technology, demonstrate its benefits relative to existing technologies and accelerate its adoption. We also seek to increase awareness of our products through participation at trade shows, academic conferences, online webinars and dedicated scientific events attended by prominent users and prospective customers.
Our systems are relatively new to the life science marketplace and require a capital investment by our customers. The sales process typically involves numerous interactions and demonstrations with multiple people within an organization. Some potential customers
16
conduct in-depth evaluations of the system including having us run experiments on in-house Saphyr systems. In addition, in most countries, sales to academic or governmental institutions require participation in a tender process involving preparation of extensive documentation and a lengthy review process. Because of these factors and the budget cycles of our customers, our sales cycle, the time from initial contact with a customer to our receipt of a purchase order, can often be nine to 12 months.
Manufacturing and Supply
Our manufacturing strategy is to outsource instrument and chip manufacturing and internally develop and assemble reagent kits in our own facility.
Instruments
Our Saphyr instrument is manufactured by a third party medical device manufacturer. Nearly complete Saphyr instruments are shipped by the manufacturer to us for final assembly and quality control testing. Upon completion, we ship directly to our customers’ locations globally, or distributors’ locations in the case of certain systems sold in the Asia-Pacific region. Installation of, and training on, our products is provided by our employees in the markets where we conduct direct sales, and by distributors in those markets where we operate with distributors.
We believe this manufacturing strategy is efficient and conserves capital. However, in the event it becomes necessary to utilize a different contract manufacturer for Saphyr, we would experience additional costs, delays and difficulties in doing so, and our business could be harmed. This manufacturer actively manages obsolescence of all components in our system. This is done through their supply management process where we get notified of any parts that will become obsolete with enough lead time to identify alternatives.
Consumables
All of our chip consumables are produced by a third party manufacturer at its facility; however, we have established procedures for a replacement manufacturer if required. We complete final assembly and quality control assessments of our chips at our headquarters in San Diego.
Our reagents are sourced from a limited number of suppliers, including certain single source suppliers. Reagents include all components required to run a sample on Saphyr, such as capture and detector reagents, enzyme reagents and enzyme substrate. Although we believe that alternatives would be available, it would take time to identify and validate replacement reagents for our assay kits, which could negatively affect our ability to supply assay kits on a timely basis. Reagents are supplied through a single source supplier. This supplier requires a sufficient notification period to allow for supply continuity and the identification and technology transfer to a new supplier in the event either party wishes to terminate the relationship.
We actively manage component obsolescence by subscribing to our vendors’ end-of-life notifications. If a vendor is unable to provide sufficient notification, we keep safety stock of the component to minimize disruption to operations.
Key Agreements
License Agreement with Princeton University
In January 2004, we entered into a license agreement, or the License Agreement, with Princeton University, or Princeton. Pursuant to the License Agreement, we received a worldwide, exclusive right and license to, among other things, manufacture and market products or services utilizing patents and inventions related to our sample preparation, DNA imaging and genomic data analysis platform and other key technology.
We are obligated to pay Princeton an annual license maintenance fee in the mid-four digits, which can be reduced by royalties paid to Princeton during the preceding 12 month period. We are also obligated to make royalty payments to Princeton equal to (i) a percentage in the mid-single digits of our and any of our sub-licensees’ net sales of products covered by the License Agreement and (ii) a percentage in the low-single digits of our and any of our sub-licensees’ revenue from services covered by the License Agreement. Our royalty obligations continue on a licensed product-by-licensed product and licensed service-by-licensed service basis, in every country of the world, until the later of the last sale of a licensed product or service or the expiration of all Princeton patent rights.
The term of the License Agreement will continue until all of our royalty payment obligations have expired, unless terminated earlier. Princeton may terminate the License Agreement upon written notice in the event of our material breach of the License Agreement if such breach remains uncured for 60 days. We may terminate the License Agreement without cause upon 60 days’ advance written notice to Princeton.
17
Agreement for the Manufacture of Our Instruments
We have engaged a single third party manufacturer to produce and test our instruments on an as-ordered basis. The manufacturer of our instruments has no obligation to manufacture our instruments without a purchase order. In addition, this manufacturer has no obligation to maintain inventory in excess of any open purchase orders or materials in excess of the amount it reasonably determines will be consumed within 90 days. We are obligated to purchase any material deemed in excess pursuant to the agreement. The price we pay is determined according to a mutually agreed-upon pricing formula. We may terminate a purchase order by giving the manufacturer at least 30 days’ written notice.
Agreement for the Manufacture of Our Chip Consumables
We have engaged a single third party manufacturer to manufacture our chip consumables used in our Saphyr system and provide engineering services to us. This third party has no obligation to manufacture our chip consumables without a purchase order. The prices and fees we pay are established in our agreement with this manufacturer or determined by the manufacturer pursuant if supported by appropriate information. Our agreement with this manufacturer automatically renews for successive one year terms unless a party notifies the other party in writing at least 30 days prior to the expiration of the then-current term. We may terminate an order of the agreement at any time upon 30 days’ written notice.
Intellectual Property
Our core technology for nucleic acid research is related to methods and devices for non-sequencing based analysis of macromolecules such as nucleic acids. Using this technology, long (high-molecular weight) nucleic acids can be suitably labeled and elongated in order to ascertain structural information such as scaffold organization, copy number, and de novo analysis of genomic repeats that is not readily obtained with current sequencing-based approaches. We have secured and continue to pursue intellectual property rights globally, including rights related to analysis of nucleic acid molecules, as well as innovations in the molecular biology and bioinformatics spaces.
We have developed a global patent portfolio that includes 65 issued patents across 14 patent families and an exclusively licensed portfolio of patents and applications from Princeton University, which includes 34 patents across two families. This global patent portfolio has filing dates ranging from 2001 to 2019. The owned and licensed families contain issued patents and pending applications that relate to devices, systems, and methods for macromolecular analysis, and reflect our active and ongoing research programs. The commercial foci of these patent families are discussed below.
|
Commercial Focus
|
Number of Issued and Pending Patents
|
|
|
Nanochannel devices and systems
|
76
|
|
|
Methods of macromolecule analysis using nanochannel arrays
|
71
|
|
|
Methods of genetic detection and copy number analysis
|
28
|
|
|
Method of genomic sequence and epigenomic analysis.
|
49
|
|
|
Biomolecule isolation and processing for use in nanochannel analysis
|
3
|
|
|
Method of optimizing nanochannel analysis
|
6
|
|
|
Next-generation products
|
10
|
|
In addition to pursuing patents, we have taken steps to protect our intellectual property and proprietary technology by entering into confidentiality agreements and intellectual property assignment agreements with our employees, consultants, corporate partners and, as applicable, our advisors.
Government Regulation
Our products are currently intended for research use only, or RUO, applications, although our customers may use our products to develop their own products that are subject to regulation by the FDA. Although most products intended for RUO are not currently subject to clearance or approval by the FDA, RUO products fall under the FDA’s jurisdiction if they are used for clinical rather than research purposes. Consequently, our products are labeled “For Research Use Only.”
The FDA’s 2013 Guidance for Industry and Food and Drug Administration Staff on “Distribution of In Vitro Diagnostic Products Labeled for Research Use Only or Investigational Use Only,” or, the RUO/IUO Guidance, provides the FDA’s thinking on when IVD products are properly labeled for RUO or for IUO. The RUO/IUO Guidance explains that the FDA will review the totality of the circumstances when evaluating whether equipment and testing components are properly labeled as RUO. Merely including a labeling statement that a product is intended for research use only will not necessarily exempt the device from the FDA’s 510(k) clearance, premarket approval, or other requirements, if the circumstances surrounding the distribution of the product indicate that the manufacturer intends its product to be used for clinical diagnostic use. These circumstances may include written or verbal marketing claims or links
18
to articles regarding a product’s performance in clinical applications, a manufacturer’s provision of technical support for clinical validation or clinical applications, or solicitation of business from clinical laboratories, all of which could be considered evidence of intended uses that conflict with RUO labeling.
When marketed for clinical diagnostic use, our products will be regulated by the FDA as medical devices. The FDA defines a medical device in part as an instrument, apparatus, implement, machine, contrivance, implant, in vitro reagent, or other similar or related article which is intended for the diagnosis of disease or other conditions or in the cure, mitigation, treatment, or prevention of disease in man. FDA regulates the development, testing, manufacturing, marketing, post-market surveillance, distribution, advertising and labeling of medical devices. The FDA also requires the device to be registered by the medical device manufacturer and listed as a marketed product.
The FDA classifies medical devices into one of three classes on the basis of the intended use of the device, the risk associated with the use of the device for that indication, as determined by the FDA, and on the controls deemed by the FDA to be necessary to reasonably ensure their safety and effectiveness. Class I devices, which have the lowest level of risk associated with them, are subject to general controls. Class II devices are subject to general controls and special controls, including performance standards. Class III devices, which have the highest level of risk associated with them, are subject to general controls and premarket approval. Most Class I devices and some Class II devices are exempt from a requirement that the manufacturer submit a premarket notification, or 510(k), and receive clearance from the FDA which is otherwise a premarketing requirement for a Class II device. Class III devices may not be commercialized until a premarket approval application, or PMA, is submitted to and approved by the FDA.
510(k) Clearance Pathway
To obtain 510(k) clearance, a sponsor must submit to the FDA a premarket notification demonstrating that the device is substantially equivalent, or SE, to a device legally marketed in the U.S. for which a PMA was not required. The FDA is supposed to make a SE determination within 90 days of FDA’s receipt of the 510(k), but it often takes longer if the FDA requests additional information. Most 510(k)s do not require supporting data from clinical trials, but the FDA may request such data.
Premarket Approval Pathway
A PMA must be submitted if a new device cannot be cleared through the 510(k) process. The PMA process is generally more complex, costly and time consuming than the 510(k) process. A PMA must be supported by extensive data including, but not limited to, technical, preclinical, clinical trials, manufacturing and labeling to demonstrate to the FDA’s satisfaction the safety and effectiveness of the device for its intended use. After a PMA is sufficiently complete, the FDA will accept the application for filing and begin an in-depth review of the submitted information. By statute, the FDA has 180 days to review the accepted application, although, review of the application generally can take between one and three years. During this review period, the FDA may request additional information or clarification of information already provided. Also during the review period, an advisory panel of experts from outside the FDA may be convened to review and evaluate the application and provide recommendations to the FDA as to the approvability of the device. In addition, the FDA will conduct a preapproval inspection of the manufacturing facility to ensure compliance with its quality system regulations, or QSRs. New premarket approval applications or premarket approval application supplements are also required for product modifications that affect the safety and efficacy of the device.
Clinical Trials
Clinical trials are usually required to support a PMA and are sometimes required for a 510(k). In the U.S., if the device is determined to present a “significant risk,” the manufacturer may not begin a clinical trial until it submits an investigational device exemption application, or IDE, and obtains approval of the IDE from the FDA. These clinical trials are also subject to the review, approval and oversight of an institutional review board, or IRB, at each clinical trial site. The clinical trials must be conducted in accordance with the FDA’s IDE regulations and good clinical practices. A clinical trial may be suspended by FDA, the sponsor or an IRB at its institution at any time for various reasons, including a belief that the risks to the study participants outweigh the benefits of participation in the trial. Even if a clinical trial is completed, the results may not demonstrate the safety and efficacy of a device to the satisfaction of the FDA, or may be equivocal or otherwise not be sufficient to obtain approval of a device.
After a medical device is placed on the market, numerous regulatory requirements apply. These include among other things:
|
•
|
compliance with QSRs, which require manufacturers to follow stringent design, testing, control, documentation, record maintenance, including maintenance of complaint and related investigation files, and other quality assurance controls during the manufacturing process;
|
|
•
|
reporting of device malfunctions, serious injuries or deaths;
|
|
•
|
registration of the establishments where the devices are produced;
|
|
•
|
labeling regulations, which prohibit the promotion of products for uncleared or unapproved uses; and
|
19
|
•
|
medical device reporting obligations, which require that manufacturers investigate and report to the FDA adverse events, including deaths, or serious injuries that may have been or were caused by a medical device and malfunctions in the device that would likely cause or contribute to a death or serious injury if it were to recur.
|
Failure to comply with applicable regulatory requirements can result in enforcement action by the FDA, which may include sanctions, including but not limited to, warning letters; fines, injunctions, and civil penalties; recall or seizure of the device; operating restrictions, partial suspension or total shutdown of production; refusal to grant 510(k) clearance or PMA approvals of new devices; withdrawal of 510(k) clearance or PMA approvals; and civil or criminal prosecution. To ensure compliance with regulatory requirements, medical device manufacturers are subject to market surveillance and periodic, pre-scheduled and unannounced inspections by the FDA.
Laboratories that purchase certain of our products and perform clinical diagnostic testing are also subject to extensive regulation under the Clinical Laboratory Improvement Amendments of 1988, or CLIA, requiring clinical laboratories to meet specified standards in areas such as personnel qualifications, administration, participation in proficiency testing, patient test management, quality control, quality assurance and inspections. Adverse interpretations of current CLIA regulations or future changes in CLIA regulations could have an adverse effect on sales of any affected products. Moreover, if we decide to operate our own clinical testing laboratory, we will be required to comply with CLIA. If, in the future, we operate our own clinical laboratory to perform clinical diagnostic testing, we would become subject to the Health Insurance Portability and Accountability Act of 1996, or HIPAA, as well as additional federal and state laws that impose a variety of fraud and abuse prohibitions on healthcare providers, including clinical laboratories.
Laboratory Developed Tests
Although the FDA has statutory authority to regulate medical devices, the FDA has historically exercised its enforcement discretion and not enforced applicable provisions of the FDC Act and FDA regulations with respect to laboratory developed tests, or LDTs, which are a subset of in vitro diagnostic tests that are intended for clinical use and designed, manufactured and used entirely within a single laboratory. The FDA does not consider devices to be LDTs if they are designed or manufactured completely, or partly, outside of the laboratory that offers and uses them. We sell our Saphyr system on an RUO basis to CLIA certified cytogenetics laboratories, which may use the system to develop LDTs.
At various times since 2006, the FDA has issued documents outlining its intent to require varying levels of FDA oversight of many types of LDTs. In October 2014, the FDA issued draft guidance that sets forth a proposed risk-based regulatory framework that would apply such oversight to LDTs. The FDA has indicated that it does not intend to implement its proposed framework until the draft guidance documents are finalized. It is unclear at this time if or when the FDA will finalize its plans to end enforcement discretion for LDTs, and even then, whether the new regulatory requirements are expected to be phased-in over time. However, the FDA may decide to regulate certain LDTs on a case-by-case basis at any time. A significant change in the way that the FDA regulates any LDTs that we, our collaborators or our customers develop using our technology could affect our business. If the FDA requires laboratories to undergo premarket review and comply with other applicable FDA requirements in the future, the cost and time required to commercialize an LDT will increase substantially, and may reduce the financial incentive for laboratories to develop LDTs, which could reduce demand for our instruments and our other products. In addition, if the FDA were to change the way that it regulates LDTs to require that we undergo pre-market review or comply with other applicable FDA requirements before we can sell our instruments or our other products to clinical cytogenics laboratories, our ability to sell our instruments and other products to this addressable market would be delayed, thereby impeding our ability to penetrate this market and generate revenue from sales of our instruments and our other products.
Europe/Rest of World Government Regulation
Whether or not we obtain FDA approval for a product, we must obtain the requisite approvals from regulatory authorities in non-U.S. countries prior to the commencement of clinical trials or marketing of our product for clinical diagnostic use in those countries. The regulations in other jurisdictions vary from those in the U.S. and may be easier or more difficult to satisfy and are subject to change. For example, the European Union recently published new regulations that will result in greater regulation of medical devices and IVDs. The IVD Regulation is significantly different from the IVD Directive that it replaces in that it will ensure that the new requirements apply uniformly and on the same schedule across the member states, include a risk-based classification system and increase the requirements for conformity assessment. The conformity assessment process results in the receipt of a CE designation which has been sufficient to begin marketing many types of IVDs. That process will become more difficult and costly to complete.
Other Governmental Regulation
We are subject to laws and regulations related to the protection of the environment, the health and safety of employees and the handling, transportation and disposal of medical specimens, infectious and hazardous waste and radioactive materials. For example, the U.S. Occupational Safety and Health Administration, has established extensive requirements relating specifically to workplace safety for healthcare employers in the U.S. This includes requirements to develop and implement multi-faceted programs to protect workers from exposure to blood-borne pathogens, including preventing or minimizing any exposure through needle stick injuries. For purposes of
20
transportation, some biological materials and laboratory supplies are classified as hazardous materials and are subject to regulation by one or more of the following agencies: the U.S. Department of Transportation, the U.S. Public Health Service, the U.S. Postal Service and the International Air Transport Association. We generally use third-party vendors to dispose of regulated medical waste, hazardous waste and radioactive materials that we may use during our research.
Coverage and Reimbursement
Currently, our product is for research use only, but clinical laboratories may acquire our instrumentation through a capital purchase or capital lease and use the Saphyr and direct label stain chemistry to create their own potentially reimbursable products, such as laboratory developed tests for in vitro diagnostics. Our customers may generate revenue for these testing services by seeking the necessary approval of their product from the FDA or the Centers for Medicare & Medicaid Services, or CMS, along with coverage and reimbursement from third-party payors, including government health programs and private health plans. The ability of our customers to commercialize diagnostic tests based on our technology will depend in part on the extent to which coverage and reimbursement for these tests will be available from such third-party payors.
In the U.S., molecular testing laboratories have multiple options for reimbursement coding, but we expect that the primary codes used will be the genomic sequencing procedure codes, or GSPs. The American Medical Association, or AMA, added GSPs to its clinical laboratory fee schedule in 2015. In addition, CMS recently issued a coverage determination providing for the reimbursement of next-generation sequencing for certain cancer diagnostics using an FDA-approved in vitro diagnostic test. Private health plans often follow CMS coverage and reimbursement guidelines to a substantial degree, and it is difficult to predict what CMS will decide with respect to the coverage and reimbursement of any products our customers try to commercialize.
In Europe, coverage for molecular diagnostic testing is varied. Countries with statutory health insurance (e.g., Germany, France, The Netherlands) tend to be more progressive in technology adoption with favorable reimbursement for molecular diagnostic testing. In countries such as the United Kingdom with tax-based insurance, adoption and reimbursement for molecular diagnostic testing is not uniform and is influenced by local budgets.
Ultimately, coverage and reimbursement of new products is uncertain, and whether laboratories that use our instruments to develop their own products will attain coverage and adequate reimbursement is unknown. In the U.S., there is no uniform policy for determining coverage and reimbursement. Coverage can differ from payor to payor, and the process for determining whether a payor will provide coverage may be separate from the process for setting the reimbursement rate. In addition, the U.S. government, state legislatures and foreign governments have shown significant interest in implementing cost containment programs to limit the growth of government-paid healthcare costs, including price controls and restrictions on reimbursement.
Healthcare Reform
In the U.S. and abroad, there have been and continue to be a number of legislative initiatives to contain healthcare costs and change the way healthcare is financed. By way of example, in March 2010, the Patient Protection and Affordable Care Act, as amended by the Health Care and Education Reconciliation Act, collectively, the ACA, became law. The ACA is a sweeping law intended to broaden access to health insurance, reduce or constrain the growth of healthcare spending, enhance remedies against fraud and abuse, add new transparency requirements for the healthcare and health insurance industries, impose new taxes and fees on the health industry and impose additional health policy reforms. For example, the ACA contained a 2.3% excise tax on certain entities that manufactures or imports medical devices offered for sale in the U.S., which has been permanently eliminated as part of the 2020 spending package.
There remains judicial and Congressional challenges to certain aspects of the ACA, as well as efforts by the Trump administration to repeal or replace certain aspects of the ACA. Since January 2017, President Trump has signed two Executive Orders and other directives designed to delay the implementation of certain provisions of the ACA or otherwise circumvent some of the requirements for health insurance mandated by the ACA. Concurrently, Congress has considered legislation that would repeal or repeal and replace all or part of the ACA. While Congress has not passed comprehensive repeal legislation, it has enacted laws that modify certain provisions of the ACA, such as removing penalties, effective January 1, 2019, for not complying with the ACA's individual mandate to carry health insurance. On December 14, 2018, a Texas U.S. District Court Judge ruled that the ACA is unconstitutional in its entirety because the "individual mandate" was repealed by Congress as part of Legislation enacted in 2017 (H.R. 1, "An Act to provide for reconciliation pursuant to titles II and V of the concurrent resolution on the budget for fiscal year 2018"), informally titled the Tax Cuts and Jobs Act. Additionally, on December 18, 2019, the U.S. Court of Appeals for the 5th Circuit upheld the District Court ruling that the individual mandate was unconstitutional and remanded the case back to the District Court to determine whether the remaining provisions of the ACA are invalid as well. On March 2, 2020, the United States Supreme Court granted the petitions for writs of certiorari to review this case, and has alloted one hour for oral arguments, which are expected to occur in the fall. It is unclear how such litigation and other efforts to repeal and replace the ACA will impact the ACA.
21
Further, other legislative changes have been proposed and adopted since the ACA was enacted. For example, on April 1, 2014, the Protecting Access to Medicare Act of 2014, or PAMA, was signed into law, which, among other things, significantly altered the payment methodology under the Medicare Clinical Laboratory Fee Schedule, or CLFS. PAMA requires certain laboratories performing clinical diagnostic laboratory tests to report to CMS the amounts paid by private payors for laboratory tests. Beginning on January 1, 2018, CMS has begun using reported private payor pricing to periodically revise payment rates under the CLFS.
We expect that additional state and federal healthcare reform measures will be adopted in the future, any of which could limit the amounts that federal and state governments will pay for healthcare products and services. In addition, sales of our tests outside of the U.S. will subject us to foreign regulatory requirements, which may also change over time.
Other Healthcare Laws
Our operations are directly or indirectly, through our customers, subject to various federal and state fraud and abuse laws, including, without limitation, the federal and state anti-kickback statutes and false claims laws. These laws may impact, among other things, our sales and marketing and education programs, and our financial and business relationships with researchers who use our instruments to develop marketed products. By way of example: the federal Anti-Kickback Statute prohibits, among other things, any person or entity from, among other things, knowingly and willfully soliciting, receiving, offering or paying any remuneration, directly or indirectly, to induce, or in return for, purchasing, leasing, ordering, or arranging for or recommending the purchase, lease, or order of any good, facility, item, or service reimbursable, in whole or in part, under a federal healthcare program; and the federal false claims laws, including, without limitation the federal civil False Claims Act, prohibit, among other things, anyone from knowingly and willingly presenting, or causing to be presented for payment, to the federal government (including Medicare and Medicaid) claims for reimbursement for, among other things, drugs or services that are false or fraudulent, claims for items or services not provided as claimed, or claims for medically unnecessary items or services. The ACA, among other things, amended the intent requirement of the federal Anti-Kickback Statute to clarify that a person or entity does not need to have actual knowledge of the statute or specific intent to violate it in order to have committed a crime. In addition, the ACA clarifies that the government may assert that a claim that includes items or service resulting from a violation of the federal Anti-Kickback Statute constitutes a false or fraudulent claim for purposes of the federal civil False Claims Act.
In addition, we may be subject to HIPAA, as amended by the Health Information Technology for Economic and Clinical Health Act and their implementing regulations, which imposes certain requirements relating to the privacy, security and transmission of individually identifiable health information without appropriate authorization by entities subject to the rule, such as health plans, healthcare clearinghouses and certain healthcare providers and their business associates who create, use or disclose individually identifiable health information on their behalf. We may also be subject to state and foreign laws that govern the privacy and security of health information in some circumstances, many of which differ from each other in significant ways and often are not preempted by HIPAA, thus complicating compliance efforts.
If our operations are found to be in violation of any of these laws, we may be subject to significant penalties, including, without limitation, civil, criminal, and administrative penalties, damages, fines, disgorgement, the curtailment or restructuring of our operations, exclusion from participation in federal and state healthcare programs, additional integrity oversight and reporting obligations, imprisonment, contractual damages, and reputational harm.
Employees
As of December 31, 2019, we had 97 employees, of which 46 work in sales, sales support and marketing, 35 work in research and development, eight work in manufacturing and operations and eight work in general and administrative. As of December 31, 2019, of our 97 employees, 81 were located in the U.S. and 16 were employed outside the U.S. None of our employees are represented by a labor union or are subject to a collective bargaining agreement.
Facilities
We lease approximately 35,823 square feet of office, laboratory, and manufacturing space at our headquarters in San Diego, California. Of this, 16,457 square feet is sub-leased under an agreement that expires on December 31, 2020. As of January 1, 2021, our lease obligation will be 19,216 square feet, with the lease expiring December 31, 2025. We believe that we will need additional space as we grow our operations, but believe that suitable additional or substitute space will be available to accommodate future growth of our business. We believe that our existing office, laboratory and manufacturing space will be sufficient to meet our needs in the interim.
Corporate Information
22
We were formed in January 2003 as BioNanomatrix LLC, a Delaware limited liability company. In August 2007, we became BioNanomatrix Inc., a Delaware corporation. In October 2011, we changed our name to BioNano Genomics, Inc., and in July 2018, we changed our name to Bionano Genomics, Inc.
Our principal executive offices are located at 9540 Towne Centre Drive, Suite 100, San Diego, California 92121, and our telephone number is (858) 888-7600. Our website address is www.bionanogenomics.com. Information contained in, or that can be accessed through, our website is not incorporated by reference into this Annual Report, and you should not consider information on our website to be part of this Annual Report. Our design logo, “Bionano,” and our other registered and common law trade names, trademarks and service marks are the property of Bionano Genomics, Inc.
We are an “emerging growth company” as defined in the Jumpstart Our Business Startups Act of 2012, or the JOBS Act. We may take advantage of certain exemptions from various public company reporting requirements, including not being required to have our internal control over financial reporting audited by our independent registered public accounting firm under Section 404 of the Sarbanes-Oxley Act of 2002, reduced disclosure obligations regarding executive compensation in our periodic reports and proxy statements, and exemptions from the requirements of holding a nonbinding advisory vote on executive compensation and any golden parachute payments. We may take advantage of these exemptions for up to five years or until we are no longer an “emerging growth company,” whichever is earlier. In particular, in this Annual Report, we have provided only two years of audited financial statements and have not included all of the executive compensation related information that would be required if we were not an emerging growth company. Accordingly, the information contained herein may be different than the information you receive from other public companies in which you hold stock.
In addition, the JOBS Act provides that an emerging growth company can take advantage of an extended transition period for complying with new or revised accounting standards. This provision allows an emerging growth company to delay the adoption of new or revised accounting standards that have different transition dates for public and private companies until those standards would otherwise apply to private companies. We have elected to use this extended transition period. As a result of this election, our timeline to comply with these standards will in many cases be delayed as compared to other public companies that are not eligible to take advantage of this election or have not made this election. Therefore, our financial statements may not be comparable to those of companies that comply with the public company effective dates for these standards.
Item 1A. Risk Factors.
You should consider and read carefully all of the risks and uncertainties described below, as well as other information included in this Annual Report, including our financial statements and related notes appearing below. The risks described below are not the only ones facing us. The occurrence of any of the following risks or additional risks and uncertainties not presently known to us or that we currently believe to be immaterial could materially and adversely affect our business, financial condition or results of operations. In such case, the trading price of our securities could decline. This Annual Report also contains forward-looking statements and estimates that involve risks and uncertainties. Our actual results could differ materially from those anticipated in the forward-looking statements as a result of specific factors, including the risks and uncertainties described below.
Risks related to our financial condition and need for additional capital
We have incurred recurring net losses since we were formed and expect to incur losses in the future. We cannot be certain that we will achieve or sustain profitability.
We incurred net losses of
$29.8 million
and
$18.5 million
and cash used in operations of
$29.5 million
and
$19.9 million
for the years ended December 31, 2019 and 2018, respectively. As of December 31, 2019, we had an accumulated deficit of
$102.6 million
. We cannot predict if we will achieve sustained profitability in the near future or at all. We expect that our losses will continue for the foreseeable future as we plan to invest significant additional funds toward expansion of our commercial organization and the development of our technology. In addition, as a public company, we will incur significant legal, accounting, and other expenses that we did not incur as a private company. These increased expenses will make it harder for us to achieve and sustain future profitability. We may incur significant losses in the future for a number of reasons, many of which are beyond our control, including the other risks described in this Annual Report, the market acceptance of our products, future product development and our market penetration and margins.
Our quarterly and annual operating results and cash flows have fluctuated in the past and might continue to fluctuate, which could cause the market price of our securities to decline substantially.
Numerous factors, many of which are outside our control, may cause or contribute to significant fluctuations in our quarterly and annual operating results. These fluctuations may make financial planning and forecasting uncertain. In addition, these fluctuations may result in unanticipated decreases in our available cash, which could negatively affect our business and prospects. In addition,
23
one or more of such factors may cause our revenue or operating expenses in one period to be disproportionately higher or lower relative to the others. As a result, comparing our operating results on a period-to-period basis might not be meaningful. You should not rely on our past results as indicative of our future performance. Moreover, our stock price might be based on expectations of future performance that are unrealistic or that we might not meet and, if our revenue or operating results fall below the expectations of investors or securities analysts, the price of our securities could decline substantially.
Our operating results have varied in the past. In addition to other risk factors listed in this section, some of the important factors that may cause fluctuations in our quarterly and annual operating results include:
|
•
|
adoption of our systems and related products;
|
|
•
|
the timing of customer orders to purchase our systems;
|
|
•
|
the rate of utilization of consumables by our customers;
|
|
•
|
receipt and timing of revenue for services provided by out data solutions service;
|
|
•
|
the timing of the introduction of new systems, products, system and product enhancements and services; and
|
|
•
|
the receipt and timing of revenue from our distribution and marketing arrangements.
|
In addition, a significant portion of our operating expense is relatively fixed in nature, and planned expenditures are based in part on expectations regarding future revenue. Accordingly, unexpected revenue shortfalls could decrease our gross margins and cause significant changes in our operating results from quarter to quarter. If this occurs, the trading price of our securities could fall substantially.
We are an early, commercial-stage company and have a limited operating history, which may make it difficult to evaluate our current business and predict our future performance.
We are an early, commercial-stage company and have a limited commercial history. Our limited commercial history may make it difficult to evaluate our current business and makes predictions about our future success or viability subject to significant uncertainty. We will continue to encounter risks and difficulties frequently experienced by early, commercial-stage companies, including scaling up our infrastructure and headcount. If we do not address these risks successfully, our business will suffer.
If we are unable to maintain adequate revenue growth or do not successfully manage such growth, our business and growth prospects will be harmed.
We may not achieve substantial growth rates in future periods. Investors should not rely on our operating results for any prior periods as an indication of our future operating performance. To effectively manage our anticipated future growth, we must continue to maintain and enhance our financial, accounting, manufacturing, customer support and sales administration systems, processes and controls. Failure to effectively manage our anticipated growth could lead us to over-invest or under-invest in development, operational and administrative infrastructure; result in weaknesses in our infrastructure, systems, or controls; give rise to operational mistakes, losses, loss of customers, productivity or business opportunities; and result in loss of employees and reduced productivity of remaining employees.
Our continued growth could require significant capital expenditures and might divert financial resources from other projects such as the development of new products and services. As additional products are commercialized, we may need to incorporate new equipment, implement new technology systems, or hire new personnel with different qualifications. Failure to manage this growth or transition could result in turnaround time delays, higher product costs, declining product quality, deteriorating customer service, and slower responses to competitive challenges. A failure in any one of these areas could make it difficult for us to meet market expectations for our products, and could damage our reputation and the prospects for our business.
If our management is unable to effectively manage our anticipated growth, our expenses may increase more than expected, our revenue could decline or grow more slowly than expected and we may be unable to implement our business strategy. The quality of our products and services may suffer, which could negatively affect our reputation and harm our ability to retain and attract customers.
Our future capital needs are uncertain and we will require additional funding in the future to advance the commercialization of Saphyr and our other products, as well as continue our research and development efforts. If we fail to obtain additional funding, we will be forced to delay, reduce or eliminate our commercialization and development efforts.
Our operations have consumed substantial amounts of cash since our inception. We expect to continue to spend substantial amounts to continue the commercialization of our products as well as our research and development programs. In connection with
24
the preparation of our financial statements for the fiscal year ended
December 31, 2019
, we performed an analysis of our ability to continue as a going concern. We believe, based on our current business plan, that our existing cash and cash equivalents will be sufficient to fund our obligations through the second quarter of 2020. Our ability to execute our operating plan beyond the second quarter of 2020 depends on our ability to generate sales and obtain additional funding through equity offerings, debt financings or potential licensing and collaboration arrangements, and on our ability to maintain compliance with the terms of our debt financing agreements. For example, we will likely need to raise substantial additional capital to:
|
•
|
expand our sales and marketing efforts to further commercialize our products;
|
|
•
|
expand our research and development efforts to improve our existing products and develop and launch new products, particularly if any of our products are deemed by the U.S. Food and Drug Administration, or FDA, to be medical devices or otherwise subject to additional regulation by the FDA;
|
|
•
|
seek FDA approval to market our existing products or new products utilized for diagnostic purposes;
|
|
•
|
lease a larger facility or build out our existing facility as we continue to grow our employee headcount;
|
|
•
|
hire additional personnel;
|
|
•
|
enter into collaboration arrangements, if any, or in-license other products and technologies;
|
|
•
|
add operational, financial and management information systems; and
|
|
•
|
incur increased costs as a result of continued operation as a public company.
|
Our future funding requirements will be influenced by many factors, including:
|
•
|
market acceptance of our products;
|
|
•
|
the cost and timing of establishing additional sales, marketing and distribution capabilities;
|
|
•
|
the cost of our research and development activities;
|
|
•
|
the success of our existing distribution and marketing arrangements and our ability to enter into additional arrangements in the future; and
|
|
•
|
the effect of competing technological and market developments.
|
We cannot assure you that we will be able to obtain additional funds on acceptable terms, or at all. If we raise additional funds by issuing equity or equity-linked securities, our stockholders may experience dilution. Future debt financing, if available, may involve covenants restricting our operations or our ability to incur additional debt. Any debt or equity financing may contain terms that are not favorable to us or our stockholders. If we raise additional funds through collaboration and licensing arrangements with third parties, it may be necessary to relinquish some rights to our technologies or our products, or grant licenses on terms that are not favorable to us. If we do not have, or are not able to obtain, sufficient funds, we may have to delay development or commercialization of our products. We also may have to reduce marketing, customer support or other resources devoted to our products or cease operations. Any of these factors could have a material adverse effect on our financial condition, operating results and business. Any of the foregoing could significantly harm our business, prospects, financial condition and results of operation and could cause the price of our common stock to decline.
Changes in tax laws or regulations that are applied adversely to us or our customers may have a material adverse effect on our business, cash flow, financial condition or results of operations.
New income, sales, use or other tax laws, statutes, rules, regulations or ordinances could be enacted at any time, which could adversely affect our business operations and financial performance. Further, existing tax laws, statutes, rules, regulations or ordinances could be interpreted, changed, modified or applied adversely to us. For example, legislation enacted in 2017 informally titled the Tax Cuts and Jobs Act or (the “Tax Act”) enacted many significant changes to the U.S. tax laws. Future guidance from the Internal Revenue Service and other tax authorities with respect to the Tax Act may affect us, and certain aspects of the Tax Act could be repealed or modified in future legislation. In addition, it is uncertain if and to what extent various states will conform to the Tax Act or any newly enacted federal tax legislation. Changes in corporate tax rates, the realization of net deferred tax assets relating to our operations, the taxation of foreign earnings, and the deductibility of expenses under the Tax Act or future reform legislation could have a material impact on the value of our deferred tax assets, could result in significant one-time charges, and could increase our future U.S. tax expense.
25
Our ability to use net operating losses to offset future taxable income may be subject to limitations.
As of
December 31, 2019
, the Company has federal and state tax net operating loss carryforwards of
$176.9 million
and
$66.0 million
, respectively. The federal tax loss carryforwards of
$47.9 million
that do not expire but utilization is limited to 80% of the Company's taxable income in any given tax year based on current federal tax laws. The remaining federal tax loss carryforwards of
$129.0 million
and state tax loss carryforwards begin to expire in 2027 and 2023, respectively, unless previously utilized. As of December 31, 2019, the Company also has federal and California research credit carryforwards of
$4.9 million
and
$4.4
million, respectively. The federal research credit carryforwards begin to expire in 2027 unless previously utilized. The California research credits carry forward indefinitely.
In addition, utilization of net operating losses and research and development credit carryforwards may be subject to limitations due to ownership changes that have occurred or that could occur in the future in accordance with applicable provisions of the Internal Revenue Code of 1986, as amended, (the "Code") and corresponding provisions of state law. We may have experienced one or more ownership changes in the past and we may also experience additional ownership changes in the future as a result of subsequent changes in our stock ownership, some of which may be outside of our control. If an ownership change occurs and our ability to use our net operating loss or research and development credit carryforwards is materially limited, it would harm our future operating results by increasing our future tax obligations.
U.S. taxation of international business activities or the adoption of tax reform policies could materially impact our future financial position and results of operations.
Limitations on the ability of taxpayers to claim and utilize foreign tax credits and the deferral of certain tax deductions until earnings outside of the U.S. are repatriated to the U.S., as well as changes to U.S. tax laws that may be enacted in the future, could impact the tax treatment of future foreign earnings. Should the scale of our international business activities expand, any changes in the U.S. taxation of such activities could increase our worldwide effective tax rate and harm our future financial position and results of operations.
The terms of our debt facility place restrictions on our operating and financial flexibility, and failure to comply with covenants or to satisfy certain conditions of the agreement governing the debt facility may result in acceleration of our repayment obligations and foreclosure on our pledged assets, which could significantly harm our liquidity, financial condition, operating results, business and prospects and cause the price of our securities to decline.
On March 14, 2019, we entered into a Loan and Security Agreement, or the Innovatus LSA, with Innovatus Life Sciences Lending Fund I, LP, or Innovatus, and certain lenders, which provides for borrowings up to $25.0 million pursuant to certain term loans and an additional $5.0 million under a revolving credit line. The Innovatus LSA is secured by a lien covering substantially all of our assets, including our intellectual property. As of December 31, 2019, we borrowed approximately
$20.5 million
in term loans and
$1.5 million
under the revolving credit line under the Innovatus LSA.
The outstanding principal balance under the Innovatus LSA is secured by a lien covering substantially all of our assets, including our intellectual property. The Innovatus LSA requires us to comply with a number of covenants (affirmative and negative), including restrictive covenants that limit our ability to: incur additional indebtedness; encumber the collateral securing the loan; acquire, own or make investments; repurchase or redeem any class of stock or other equity interest; declare or pay any cash dividend or make a cash distribution on any class of stock or other equity interest; transfer a material portion of our assets; acquire other businesses; and merge or consolidate with or into any other organization or otherwise suffer a change in control, in each case subject to exceptions. Our intellectual property is also subject to customary negative covenants. The Innovatus LSA also includes standard events of default, including a provision that Innovatus could declare an event of default upon the occurrence of any event that it interprets as having a material adverse effect upon our business, operations, properties, assets, or financial condition or upon our ability to perform or pay the secured obligations under the Innovatus LSA or upon the collateral or the liens on the collateral under the agreement, thereby requiring us to repay the loan immediately, together with a prepayment fee and other applicable fees.
In connection with the audit of our 2019 financial statements, the report of our independent registered public accounting firm expressed an unqualified opinion and included an explanatory paragraph relating to substantial doubt about our ability to continue as a going concern. In the future, Innovatus may determine that the underlying circumstances resulting in the receipt of a going concern explanatory paragraph in the auditor opinion for our 2019 financial statements either on their own, or together with contemporaneous events or circumstances, such as a failure to timely secure additional funding, constitute a material adverse effect upon our business, operations, properties, assets, or financial condition or upon our ability to perform or pay the secured obligations under the Innovatus LSA.
26
If we default under the Innovatus LSA, Innovatus may accelerate all of our repayment obligations and, if we are unable to access funds to meet those obligations or to renegotiate our agreement, Innovatus could take control of our pledged assets and we could immediately cease operations. For example, we were unable to maintain compliance with certain covenants under the Innovatus LSA as of September 30, 2019 and December 31, 2019. In order to secure waivers for our breaches of these covenants, we have been required to pay consideration to Innovatus, including, with respect to our breach of our covenant as of December 31, 2019, our agreement to pay a waiver fee of $200,000 and a prepayment of $2.1 million of principal, as well as to prepay an additional $2.9 million of principal upon the earlier of April 30, 2020 or the closing of one or more equity financings during a specified period resulting in at least $15.0 million of gross proceeds to us in the aggregate, and a $100,000 prepayment fee in connection with such second repayment. There can be no assurance that we will be able to maintain compliance with our covenants in the Innovatus LSA in the future and, although we have been able to secure waivers from Innovatus to date, securing such waivers in the future may require us to divert further cash towards the repayment of debt and subject us to fees incurred in connection with the negotiation of such waivers. If we are unable to maintain compliance or obtain a waiver of any breach under the Innovatus LSA, Innovatus could declare an event of default or require us to renegotiate the Innovatus LSA on terms that may be significantly less favorable to us. If we were liquidated, Innovatus’ right to repayment would be senior to the rights of our stockholders to receive any proceeds from the liquidation. Any declaration by Innovatus of an event of default could significantly harm our liquidity, financial condition, operating results, business, and prospects and cause the price of our securities to decline.
We may incur additional indebtedness in the future. The debt instruments governing such indebtedness may contain provisions that are as, or more, restrictive than the provisions governing our existing indebtedness under the Innovatus LSA. If we are unable to repay, refinance or restructure our indebtedness when payment is due, the lenders could proceed against the collateral or force us into bankruptcy or liquidation.
Our recurring losses, negative cash flows, significant accumulated deficit, and recent non-compliance with an Innovatus LSA covenant have raised substantial doubt regarding our ability to continue as a going concern.
Since inception, we have experienced recurring operating losses, negative cash flows from operating activities, and have a significant accumulated deficit. In addition, we have breached certain covenants under the Innovatus LSA. We expect to continue to generate operating losses and consume significant cash resources for the foreseeable future and there can be no assurance as to our ability to remain in compliance with the Innovatus LSA. Without additional financing, these conditions raise substantial doubt about our ability to continue as a going concern, meaning that we may be unable to continue operations for the foreseeable future or realize assets and discharge liabilities in the ordinary course of operations. For example, in connection with the audit of our 2019 financial statements, the report of our independent registered public accounting firm included an explanatory paragraph about our ability to continue as a going concern. Similarly, future reports from our independent registered public accounting firm may also include an explanatory paragraph regarding our ability to continue as a going concern. If we seek additional financing to fund our business activities in the future and there remains substantial doubt about our ability to continue as a going concern, investors or other financing sources may be unwilling to provide additional funding on commercially reasonable terms or at all. If we are unable to obtain sufficient funding, our business, prospects, financial condition and results of operations will be materially and adversely affected and we may be unable to continue as a going concern. If we are unable to continue as a going concern, we may have to liquidate our assets and may receive less than the value at which those assets are carried on our consolidated financial statements, and it is likely that investors will lose all or a part of their investment.
Risks related to our business operations
If our products fail to achieve and sustain sufficient market acceptance, our revenue will be adversely affected.
Our success depends on our ability to develop and market products that are recognized and accepted as reliable, enabling and cost-effective. Most of the potential customers for our products already use expensive research systems in their laboratories that they have used for many years and may be reluctant to replace those systems with ours. Market acceptance of our systems will depend on many factors, including our ability to demonstrate to potential customers that our technology is an attractive alternative to existing technologies. Compared to some competing technologies, our technology is new and complex, and many potential customers have limited knowledge of, or experience with, our products. Prior to adopting our systems, some potential customers may need to devote time and effort to testing and validating our systems. Any failure of our systems to meet these customer benchmarks could result in potential customers choosing to retain their existing systems or to purchase systems other than ours. In addition, it is important that our gene mapping systems be perceived as accurate and reliable by the scientific and medical research community as a whole. Historically, a significant part of our sales and marketing efforts has been directed at demonstrating the advantages of our technology to industry leaders and encouraging such leaders to publish or present the results of their evaluation of our system. If we are unable to continue to motivate leading researchers to use our technology, or if such researchers are unable to achieve or unwilling to publish or present significant experimental results using our systems, acceptance and adoption of our systems will be slowed and our ability to increase our revenue would be adversely affected.
27
Our future success is dependent upon our ability to further penetrate our existing customer base and attract new customers.
Our current customer base is primarily composed of academic and governmental research institutions, as well as biopharmaceutical and contract research companies. Our success will depend upon our ability to respond to the evolving needs of, and increase our market share among, existing customers and additional potential customers, marketing new products as we develop them. Identifying, engaging and marketing to customers who are unfamiliar with our current products requires substantial time, expertise and expense and involves a number of risks, including:
|
•
|
our ability to attract, retain and manage the sales, marketing and service personnel necessary to expand market acceptance for our technology;
|
|
•
|
the time and cost of maintaining and growing a specialized sales, marketing and service force; and
|
|
•
|
our sales, marketing and service force may be unable to execute successful commercial activities.
|
We have utilized third parties to assist with sales, distribution and customer support in certain regions of the world. There is no guarantee, when we enter into such arrangements, that we will be successful in attracting desirable sales and distribution partners. There is also no guarantee that we will be able to enter into such arrangements on favorable terms. Any failure of our sales and marketing efforts, or those of any third-party sales and distribution partners, would adversely affect our business.
We are currently limited to “research use only” with respect to many of the materials and components used in our consumable products including our assays.
Our instruments, consumable products and assays are purchased from suppliers with a restriction that they be used for research use only, or RUO. While we have focused initially on the life sciences research market and RUO products only, part of our business strategy is to expand our product line to encompass products that are intended to be used for the diagnosis of disease and precision healthcare, either alone or in collaboration with third parties. The use of our products for any such diagnostic purposes would require that we obtain regulatory clearance or approval to market our products for those purposes and also that we acquire the materials and components used in such products from suppliers without an RUO restriction. There can be no assurance that we will be able to acquire these materials and components for use in diagnostic products on acceptable terms, if at all. If we are unable to do so, we would not be able to expand our product offerings beyond RUO, and our business and prospects would suffer.
The FDA Guidance on “Distribution of In Vitro Diagnostic Products Labeled for Research Use Only or Investigational Use Only”, or, the RUO/IUO Labeling Guidance, emphasizes that the FDA will review the totality of the circumstances when evaluating whether equipment and testing components are properly labeled as RUO. It further states that merely including a labeling statement that a product is intended for research use only will not necessarily render the device exempt from the FDA’s 510(k) clearance, PMA, or other requirements, if the circumstances surrounding the distribution of the product indicate that the manufacturer intends for its product to be offered for clinical diagnostic use. These circumstances may include written or verbal marketing claims or links to articles regarding a product’s performance in clinical applications, a manufacturer’s provision of technical support for clinical validation or clinical applications, or solicitation of business from clinical laboratories, all of which could be considered evidence of intended uses that conflict with RUO labeling. If the FDA were to determine that our RUO products were intended for use in clinical investigation, diagnosis or treatment decisions, or that express or implied clinical or diagnostic claims were made for our RUO products, those products could be considered misbranded or adulterated under the Federal Food, Drug, and Cosmetic Act. If the FDA determines that our RUO products are being marketed for clinical diagnostic use without the required PMA or 510(k) clearance, we may be required to cease marketing our products as planned, recall the products from customers, revise our marketing plans, and/or suspend or delay the commercialization of our products until we obtain the required authorization. We also may be subject to a range of enforcement actions by the FDA, including warning or untitled letters, injunctions, civil monetary penalties, criminal prosecution, and recall and/or seizure of products, as well as significant adverse publicity.
If, in the future, we choose to commercialize our products for clinical diagnostic use, we will be required to comply with the FDA’s premarket review and post-market control requirements for IVDs, as may be applicable. Complying with the FDA’s PMA and/or 510(k) clearance requirements may be expensive, time-consuming, and subject us to significant and/or unanticipated delays. Our efforts may never result in an approved PMA or 510(k) clearance for our products. Even if we obtain a PMA or 510(k) clearance, where required, such authorization may not be for the use or uses we believe are commercially attractive and/or are critical to the commercial success of our products. As a result, being subject to the FDA’s premarket review and/or post-market control requirements for our products could materially and adversely affect our business, financial condition and results of operations.
28
In the near term, our business will depend on levels of research and development spending by academic and governmental research institutions and biopharmaceutical companies, a reduction in which could limit demand for our products and adversely affect our business and operating results.
In the near term, we expect that our revenue will be derived primarily from sales of our instruments and consumables to academic and governmental research institutions, as well as biopharmaceutical and contract research companies worldwide for research applications. The demand for our products will depend in part upon the research and development budgets of these customers, which are impacted by factors beyond our control, such as:
|
•
|
changes in government programs that provide funding to research institutions and companies;
|
|
•
|
macroeconomic conditions and the political climate;
|
|
•
|
changes in the regulatory environment;
|
|
•
|
differences in budgetary cycles; and
|
|
•
|
market acceptance of relatively new technologies, such as ours.
|
For example, in March 2017, the federal government announced the intent to cut federal biomedical research funding by as much as 18%. While there has been significant opposition to these funding cuts, the uncertainty regarding the availability of research funding for potential customers may adversely affect our operating results. Our operating results may fluctuate substantially due to reductions and delays in research and development expenditures by these customers. Any decrease in customers’ budgets or expenditures, or in the size, scope or frequency of capital or operating expenditures, could materially and adversely affect our business, operating results and financial condition.
The sales cycle for our systems can be lengthy and variable, which makes it difficult for us to forecast revenue and other operating results.
The sales process for our systems generally involves numerous interactions with multiple individuals within an organization, and often includes in-depth analysis by potential customers of our technology and products and a lengthy review process. Our customers’ evaluation processes often involve a number of factors, many of which are beyond our control. As a result of these factors, the capital investment required to purchase our systems and the budget cycles of our customers, the time from initial contact with a customer to our receipt of a purchase order can vary significantly. Given the length and uncertainty of our sales cycle, we have in the past experienced, and expect to in the future experience, fluctuations in our sales on a period-to-period basis. In addition, any failure to meet customer expectations could result in customers choosing to retain their existing systems, use existing assays not requiring capital equipment or purchase systems other than ours.
Our long-term results depend upon our ability to improve existing products and introduce and market new products successfully.
Our business is dependent on the continued improvement of our existing products and our development of new products utilizing our current or other potential future technology. As we introduce new products or refine, improve or upgrade versions of existing products, we cannot predict the level of market acceptance or the amount of market share these products will achieve, if any. We cannot assure you that we will not experience material delays in the introduction of new products in the future.
Consistent with our strategy of offering new products and product refinements, we expect to continue to use a substantial amount of capital for product development and refinement. We may need additional capital for product development and refinement than is available on terms favorable to us, if at all, which could adversely affect our business, financial condition or results of operations.
We generally sell our products in industries that are characterized by rapid technological changes, frequent new product introductions and changing industry standards. If we do not develop new products and product enhancements based on technological innovation on a timely basis, our products may become obsolete over time and our revenues, cash flow, profitability and competitive position will suffer. Our success will depend on several factors, including our ability to:
|
•
|
correctly identify customer needs and preferences and predict future needs and preferences;
|
|
•
|
allocate our research and development funding to products with higher growth prospects;
|
|
•
|
anticipate and respond to our competitors’ development of new products and technological innovations;
|
|
•
|
innovate and develop new technologies and applications, and acquire or obtain rights to third-party technologies that may have valuable applications in the markets we serve;
|
|
•
|
successfully commercialize new technologies in a timely manner, price them competitively and manufacture and deliver sufficient volumes of new products of appropriate quality on time; and
|
29
|
•
|
customers' willingness to adopt new technologies.
|
In addition, if we fail to accurately predict future customer needs and preferences or fail to produce viable technologies, we may invest heavily in research and development of products that do not lead to significant revenue. Even if we successfully innovate and develop new products and product enhancements, we may incur substantial costs in doing so, and our profitability may suffer.
Our ability to develop new products based on innovation can affect our competitive position and often requires the investment of significant resources. Difficulties or delays in research, development or production of new products and services or failure to gain market acceptance of new products and technologies may reduce future revenues and adversely affect our competitive position.
If we do not successfully manage the development and launch of new products, our financial results could be adversely affected.
We face risks associated with launching new products. If we encounter development or manufacturing challenges or discover errors during our product development cycle, the product launch dates of new products may be delayed. The expenses or losses associated with unsuccessful product development or launch activities or lack of market acceptance of our new products could adversely affect our business or financial condition.
Undetected errors or defects in our products could harm our reputation, decrease market acceptance of our products or expose us to product liability claims.
Our products may contain undetected errors or defects when first introduced or as new versions or new products are released. Disruptions affecting the introduction or release of, or other performance problems with, our products may damage our customers’ businesses and could harm their and our reputation. If that occurs, we may incur significant costs, the attention of our key personnel could be diverted, or other significant customer relations problems may arise. We may also be subject to warranty and liability claims for damages related to errors or defects in our products. In addition, if we do not meet industry or quality standards, if applicable, our products may be subject to recall. A material liability claim, recall or other occurrence that harms our reputation or decreases market acceptance of our products could harm our business and operating results.
Although we do not, and cannot currently, promote the use of our products, or services based on our products, for diagnostic purposes, if our customers develop or use them for diagnostic purposes, someone could file a product liability claim alleging that one of our products contained a design or manufacturing defect that resulted in the failure to adequately perform, leading to death or injury. A product liability claim could result in substantial damages and be costly and time consuming to defend, either of which could materially harm our business or financial condition. We cannot assure investors that our product liability insurance would adequately protect our assets from the financial impact of defending a product liability claim. Any product liability claim brought against us, with or without merit, could increase our product liability insurance rates or prevent us from securing insurance coverage in the future.
Our reliance on distributors for sales of our products outside of the United States could limit or prevent us from selling our products and could impact our revenue.
We intend to continue to grow our business internationally, and to do so we must attract additional distributors and retain existing distributors to maximize the commercial opportunity for our products. There is no guarantee that we will be successful in attracting or retaining desirable sales and distribution partners or that we will be able to enter into such arrangements on favorable terms. Distributors may not commit the necessary resources to market and sell our products to the level of our expectations or may choose to favor marketing the products of our competitors. If current or future distributors do not perform adequately, or we are unable to enter into effective arrangements with distributors in particular geographic areas, we may not realize long-term international revenue growth. In addition, if our distributors fail to comply with applicable laws and ethical standards, including anti-bribery laws, this could damage our reputation and could have a significant adverse effect on our business and our revenues.
We expect to generate a substantial portion of our revenue internationally in the future and can become further subject to various risks relating to our international activities, which could adversely affect our business, operating results and financial condition.
During 2019 approximately
50%
of our product revenue was generated from customers located outside of the U.S. We believe that a substantial percentage of our future revenue will come from international sources as we expand our overseas operations and develop opportunities in additional areas. We have limited experience operating internationally and engaging in international business involves a number of difficulties and risks, including:
|
•
|
required compliance with existing and changing foreign regulatory requirements and laws;
|
|
•
|
difficulties and costs of staffing and managing foreign operations;
|
|
•
|
difficulties protecting or procuring intellectual property rights;
|
30
|
•
|
required compliance with anti-bribery laws, such as the U.S. Foreign Corrupt Practices Act, data privacy requirements, labor laws and anti-competition regulations;
|
|
•
|
export or import restrictions;
|
|
•
|
laws and business practices favoring local companies;
|
|
•
|
longer payment cycles and difficulties in enforcing agreements and collecting receivables through certain foreign legal systems;
|
|
•
|
political and economic instability; and
|
|
•
|
potentially adverse tax consequences, tariffs, customs charges, bureaucratic requirements and other trade barriers.
|
Historically, most of our revenue has been denominated in U.S. dollars. In the future, we may sell our products and services in local currency outside of the U.S. As our operations in countries outside of the U.S. grow, our results of operations and cash flows may be subject to fluctuations due to changes in foreign currency exchange rates, which could harm our business in the future. For example, if the value of the U.S. dollar increases relative to foreign currencies, in the absence of a corresponding change in local currency prices, our revenue could be adversely affected as we convert revenue from local currencies to U.S. dollars. If we dedicate significant resources to our international operations and are unable to manage these risks effectively, our business, operating results and financial condition will suffer.
Our business could be adversely affected by the effects of health epidemics, including the recent COVID-19 outbreak, in regions where we or third parties on which we rely have distribution centers, concentrations of suppliers and sales and marketing teams or other business operations. In addition, if COVID-19 becomes a worldwide pandemic, it could materially affect our operations globally, including at our headquarters in San Diego and at our clinical trial sites throughout the globe.
Our business could be adversely affected by health epidemics in regions where we have operations, concentrations of sales and marketing teams, distributors or other business operations.
Beginning in late 2019, China, as well as several other countries, experienced an outbreak of a highly contagious form of an upper respiratory infection caused by COVID-19, a novel coronavirus strain commonly referred to as coronavirus. The outbreak has severely restricted the level of economic activity in affected areas and may have an adverse impact on sales of certain of our products and services, and/or our suppliers, particularly in China and throughout Asia. The effects could include restrictions on our ability to travel to support our operations in Asia or our customers located there, disruptions in our ability to distribute products and/or a negative impact on our sales and marketing efforts in the region. For example, our management team frequently travels to China and a portion of our sales support team works remotely from China. Also, four of our distributors are located in China. For fiscal year 2019, we derived 14% of our total revenue from the Asia Pacific region and 5% of our total revenue from China. Disruption to the efforts of our management and sales support team in China and/or to the operations of our suppliers or customers and their contract manufacturers in the region would likely have a negative impact on our business, operating results and financial condition.
If the COVID-19 outbreak continues to spread, we may need to limit operations or implement limitations. There is a risk that other countries or regions may be less effective at containing COVID-19, or it may be more difficult to contain if the outbreak reaches a larger population or broader geography, in which case the risks described herein could be elevated significantly.
The ultimate impact of the COVID-19 outbreak or a similar health epidemic is highly uncertain and subject to change. We do
not yet know the full extent of potential delays or impacts on our business, our clinical trials, healthcare systems or the global economy as a whole. However, the effects could have a material impact on our operations, and we will continue to monitor the COVID-19 situation closely.
We are subject to U.S. and foreign anti-corruption and anti-money laundering laws with respect to our operations and non-compliance with such laws can subject us to criminal and/or civil liability and harm our business.
We are subject to the U.S. Foreign Corrupt Practices Act, as amended, the U.S. domestic bribery statute contained in 18 U.S.C. § 201, the U.S. Travel Act, the USA PATRIOT Act, the United Kingdom Bribery Act 2010, and other state and national anti-bribery and anti-money laundering laws in countries in which we conduct activities. Anti-corruption laws are interpreted broadly and prohibit companies and their employees and third-party intermediaries from authorizing, promising, offering, providing, soliciting, or accepting, directly or indirectly, improper payments or benefits to or from any person whether in the public or private sector for the purpose of obtaining or retaining business or securing any other improper advantage. We rely on third-party representatives, distributors, and other business partners to support sales of our products and services and our efforts to ensure regulatory compliance. In addition, as we increase our international sales and business, we may engage with additional business partners. We can be held liable for the corrupt or other illegal activities of our employees, representatives, contractors, business partners, and agents, even if we do not explicitly authorize or have actual knowledge of such activities.
31
Any violations of anti-corruption and anti-money laundering laws, or allegations of such violations, could disrupt our operations, involve significant management distraction, involve significant costs and expenses, including legal fees, and could result in a material adverse effect on our business, prospects, financial condition, or results of operations. We could also incur severe penalties, including criminal and civil penalties, disgorgement, and other remedial measures.
We are subject to governmental export and import controls that could impair our ability to compete in international markets due to licensing requirements and subject us to liability if we are not in compliance with applicable laws.
Our products are subject to export control and import laws and regulations, including the U.S. Export Administration Regulations, U.S. Customs regulations, and various economic and trade sanctions regulations administered by the U.S. Treasury Department’s Office of Foreign Assets Controls. Exports of our products must be made in compliance with these laws and regulations. If we fail to comply with these laws and regulations, we and certain of our employees could be subject to substantial civil or criminal penalties, including the possible loss of export or import privileges; fines, which may be imposed on us and responsible employees or managers; and, in extreme cases, the incarceration of responsible employees or managers.
In addition, changes in our products or changes in applicable export or import laws and regulations may create delays in the introduction and sale of our products in international markets, prevent our customers from deploying our products or, in some cases, prevent the export or import of our products to certain countries, governments or persons altogether. Any change in export or import laws and regulations, shift in the enforcement or scope of existing laws and regulations, or change in the countries, governments, persons or technologies targeted by such laws and regulations, could also result in decreased use of our products, or in our decreased ability to export or sell our products to existing or potential customers. Any decreased use of our products or limitation on our ability to export or sell our products would likely adversely affect our business, financial condition and results of operations.
If we are unable to recruit, train, retain, motivate and integrate key personnel, we may not achieve our goals.
Our future success depends on our ability to recruit, train, retain, motivate and integrate key personnel, including our recently expanded senior management team, as well as our research and development, manufacturing and sales and marketing personnel. Competition for qualified personnel is intense. Our growth depends, in particular, on attracting and retaining highly-trained sales personnel with the necessary scientific background and ability to understand our systems at a technical level to effectively identify and sell to potential new customers and develop new products. Because of the complex and technical nature of our products and the dynamic market in which we compete, any failure to attract, train, retain, motivate and integrate qualified personnel could materially harm our operating results and growth prospects.
We have limited experience in marketing and selling our products, and if we are unable to successfully commercialize our products, our business and operating results will be adversely affected.
We have limited experience marketing and selling our products. We currently sell all our products for research use only, through our direct field sales and support organizations located in North America and Europe and through a combination of our own sales force and third-party distributors in additional major markets such as Australian, China, Japan and South Korea.
The future sales of our products will depend in large part on our ability to effectively market and sell our products, successfully manage and expand our sales force, and increase the scope of our marketing efforts. We may also enter into additional distribution arrangements in the future. Because we have limited experience in marketing and selling our products, our ability to forecast demand, the infrastructure required to support such demand and the sales cycle to customers is unproven. If we do not build an efficient and effective sales force, our business and operating results will be adversely affected.
We rely on a single contract manufacturer for our systems and rely on a single contract manufacturer for our chip consumables. If either of these manufacturers should fail or not perform satisfactorily, our ability to supply these instruments would be negatively and adversely affected.
We currently rely on a single contract manufacturer to manufacture and supply all of our instruments. See “Business–Key Agreements.” In addition, we rely on a single contract manufacturer to manufacture and supply all of our chip consumables. Since our contracts with these manufacturers do not commit them to supply quantities beyond the amounts included in our purchase orders, and do not commit them to carry inventory or make available any particular quantities, these contract manufacturers may give other customers’ needs higher priority than ours, and we may not be able to obtain adequate supplies in a timely manner or on commercially reasonable terms. If either of these manufacturers were to be unable to supply instruments, our business would be harmed.
In the event it becomes necessary to utilize different contract manufacturers for our instruments or chip consumables, we would experience additional costs, delays and difficulties in doing so as a result of identifying and entering into an agreement with a new supplier as well as preparing such new supplier to meet the logistical requirements associated with manufacturing our units, and our business
32
would suffer. We may also experience additional costs and delays in the event we need access to or rights under any intellectual property of these current manufacturers.
We may experience manufacturing problems or delays that could limit the growth of our revenue or increase our losses.
We may encounter unforeseen situations that would result in delays or shortfalls in our production as well as delays or shortfalls caused by our outsourced manufacturing suppliers and by other third-party suppliers who manufacture components for our products. If we are unable to keep up with demand for our products, our revenue could be impaired, market acceptance for our products could be adversely affected and our customers might instead purchase our competitors’ products. Our inability to successfully manufacture our products would have a material adverse effect on our operating results.
We rely on a limited number of suppliers or, in some cases, one supplier, for some of our materials and components used in our consumable products, and may not be able to find replacements or immediately transition to alternative suppliers, which could have a material adverse effect on our business, financial condition, results of operations and reputation.
We rely on limited or sole suppliers for certain reagents and other materials and components that are used in our consumable products. While we periodically forecast our needs for such materials and enter into standard purchase orders with them, we do not have long-term contracts with many of these suppliers. If we were to lose such suppliers, there can be no assurance that we will be able to identify or enter into agreements with alternative suppliers on a timely basis on acceptable terms, if at all. An interruption in our operations could occur if we encounter delays or difficulties in securing these materials, or if the quality of the materials supplied do not meet our requirements, or if we cannot then obtain an acceptable substitute. The time and effort required to qualify a new supplier and ensure that the new materials provide the same or better quality results could result in significant additional costs. Any such interruption could significantly affect our business, financial condition, results of operations and reputation.
In addition, certain of the components used in our instruments are sourced from limited or sole suppliers. If we were to lose such suppliers, there can be no assurance that we will be able to identify or enter into agreements with alternative suppliers on a timely basis on acceptable terms, if at all. An interruption in our ability to sell and deliver instruments to customers could occur if we encounter delays or difficulties in securing these components, or if the quality of the components supplied do not meet specifications, or if we cannot then obtain an acceptable substitute. If any of these events occur, our business and operating results could be harmed.
If we cannot provide quality technical and applications support, we could lose customers and our business and prospects will suffer.
The placement of our products at new customer sites, the introduction of our technology into our customers’ existing laboratory workflows and ongoing customer support can be complex. Accordingly, we need highly trained technical support personnel. Hiring technical support personnel is very competitive in our industry due to the limited number of people available with the necessary scientific and technical backgrounds and ability to understand our technology at a technical level. To effectively support potential new customers and the expanding needs of current customers, we will need to substantially expand our technical support staff. If we are unable to attract, train or retain the number of highly qualified technical services personnel that our business needs, our business and prospects will suffer.
Our business could be negatively impacted by cyber security threats.
In the ordinary course of our business, we collect and store sensitive data, intellectual property and proprietary business information owned or controlled by ourselves or our customers. We face various cyber security threats, including cyber security attacks to our information technology infrastructure and attempts by others to gain access to our proprietary or sensitive information. This information encompasses a wide variety of business-critical information including research and development information, commercial information, and business and financial information. The procedures and controls we use to monitor these threats and mitigate our exposure may not be sufficient to prevent cyber security incidents. The result of these incidents could include disrupted operations, lost opportunities, misstated financial data, liability for stolen assets or information, increased costs arising from the implementation of additional security protective measures, litigation and reputational damage. Any remedial costs or other liabilities related to cyber security incidents may not be fully insured or indemnified by other means.
The life sciences research and diagnostic markets are highly competitive. If we fail to effectively compete, our business, financial condition and operating results will suffer.
We face significant competition in the life sciences research and diagnostic markets. We currently compete with both established and early stage companies that design, manufacture and market systems and consumable supplies. We believe our principal competitors in the life sciences research and genome mapping markets include Pacific Biosciences of California, Oxford Nanopore Technologies, 10x Genomics, Genomic Vision and Dovetail Genomics. In addition, there are a number of new market entrants in the process of developing novel technologies for the life sciences research, diagnostic and screening markets.
33
Many of our current competitors are either publicly traded, or are divisions of publicly-traded companies, and may enjoy a number of competitive advantages over us, including:
|
•
|
greater name and brand recognition;
|
|
•
|
substantially greater financial and human resources;
|
|
•
|
broader product lines;
|
|
•
|
larger sales forces and more established distributor networks;
|
|
•
|
substantial intellectual property portfolios;
|
|
•
|
larger and more established customer bases and relationships; and
|
|
•
|
better established, larger scale, and lower cost manufacturing capabilities.
|
We believe that the principal competitive factors in all of our target markets include:
|
•
|
cost of instruments and consumables;
|
|
•
|
accuracy, including sensitivity and specificity, and reproducibility of results;
|
|
•
|
reputation among customers;
|
|
•
|
innovation in product offerings;
|
|
•
|
flexibility and ease of use; and
|
|
•
|
compatibility with existing laboratory processes, tools and methods.
|
We cannot assure investors that our products will compete favorably or that we will be successful in the face of increasing competition from new products and technologies introduced by our existing competitors or new companies entering our markets. In addition, we cannot assure investors that our competitors do not have or will not develop products or technologies that currently or in the future will enable them to produce competitive products with greater capabilities or at lower costs than ours. Any failure to compete effectively could materially and adversely affect our business, financial condition and operating results.
Acquisitions or joint ventures could disrupt our business, cause dilution to our stockholders and otherwise harm our business.
We may acquire other businesses, products or technologies as well as pursue strategic alliances, joint ventures, technology licenses or investments in complementary businesses. We have not made any acquisitions to date, and our ability to do so successfully is unproven. Any of these transactions could be material to our financial condition and operating results and expose us to many risks, including:
|
•
|
disruption in our relationships with customers, distributors or suppliers as a result of such a transaction;
|
|
•
|
unanticipated liabilities related to acquired companies;
|
|
•
|
difficulties integrating acquired personnel, technologies and operations into our existing business;
|
|
•
|
diversion of management time and focus from operating our business to acquisition integration challenges;
|
|
•
|
increases in our expenses and reductions in our cash available for operations and other uses; and
|
|
•
|
possible write-offs or impairment charges relating to acquired businesses.
|
Foreign acquisitions involve unique risks in addition to those mentioned above, including those related to integration of operations across different cultures and languages, currency risks and the particular economic, political and regulatory risks associated with specific countries.
Also, the anticipated benefit of any acquisition may not materialize. Future acquisitions or dispositions could result in potentially dilutive issuances of our equity securities, the incurrence of debt, contingent liabilities or amortization expenses or write-offs of goodwill, any of which could harm our financial condition. We cannot predict the number, timing or size of future joint ventures or acquisitions, or the effect that any such transactions might have on our operating results.
Unfavorable global economic conditions could adversely affect our business, financial condition or results of operations.
Our results of operations could be adversely affected by general conditions in the global economy and in the global financial markets. A severe or prolonged global economic downturn could result in a variety of risks to our business, including our ability to raise additional capital when needed on acceptable terms, if at all. This is particularly true in Europe, which is undergoing a continued severe economic crisis. A weak or declining economy could also strain our suppliers, possibly resulting in supply disruption. Any of the foregoing
34
could harm our business and we cannot anticipate all of the ways in which the current economic climate and financial market conditions could adversely impact our business.
The United Kingdom’s referendum to leave the European Union or “Brexit,” has and may continue to cause disruptions to capital and currency markets worldwide. The full impact of the Brexit decision, however, remains uncertain. A process of negotiation will determine the future terms of the United Kingdom’s relationship with the European Union. During this period of negotiation, our results of operations and access to capital may be negatively affected by interest rate, exchange rate and other market and economic volatility, as well as regulatory and political uncertainty. Brexit may also have a detrimental effect on our suppliers and manufacturers, which would, in turn, adversely affect our financial condition.
Legal, political and economic uncertainty surrounding the exit of the U.K., from the European Union, or EU, may be a source of instability in international markets, create significant currency fluctuations, adversely affect our operations or intended operations in the U.K. and pose additional risks to our business, revenue, financial condition and results of operations.
Nearly 7% of our sales in fiscal year 2019 came from the United Kingdom. Following the result of a referendum in 2016, the U.K. left the EU on January 31, 2020, commonly referred to as Brexit. Pursuant to the formal withdrawal arrangements agreed between the U.K. and the EU, the U.K. will be subject to a transition period until December 31, 2020, or the Transition Period, during which EU rules will continue to apply. Negotiations between the U.K. and the EU are expected to continue in relation to the customs and trading relationship between the U.K. and the EU following the expiry of the Transition Period.
The uncertainty concerning the U.K’s legal, political and economic relationship with the EU after the Transition Period may be a source of instability in the international markets, create significant currency fluctuations, and/or otherwise adversely affect trading agreements or similar cross-border co-operation arrangements (whether economic, tax, fiscal, legal, regulatory or otherwise).
These developments, or the perception that any of them could occur, have had, and may continue to have, a significant adverse effect on global economic conditions and the stability of global financial markets, and could significantly reduce global market liquidity and limit the ability of key market participants to operate in certain financial markets. In particular, it could also lead to a period of considerable uncertainty in relation to the U.K. financial and banking markets, as well as on the regulatory process in Europe. Asset valuations, currency exchange rates and credit ratings may also be subject to increased market volatility.
If the U.K. and the EU are unable to negotiate acceptable trading and customs terms or if other EU Member States pursue withdrawal, barrier-free access between the U.K. and other EU Member States or among the European Economic Area overall could be diminished or eliminated. The long-term effects of Brexit will depend on any agreements (or lack thereof) between the U.K. and the EU and, in particular, any arrangements for the U.K. to retain access to EU markets after the Transition Period.
Such a withdrawal from the EU is unprecedented, and it is unclear how the U.K’s access to the European single market for goods, capital, services and labor within the EU, or single market, and the wider commercial, legal and regulatory environment, will impact our business. Any current or planned future operations in the U.K. as well as in other countries in the EU and European Economic Area, or EEA, could be disrupted by Brexit, particularly if there is a change in the U.K’s relationship to the single market.
Brexit has caused, and may continue to create, volatility in global stock markets and regional and global economic uncertainty particularly in the United Kingdom financial and banking markets. Weakening of economic conditions or economic uncertainties tend to harm our business. There may continue to be economic uncertainty surrounding the consequences of Brexit which could adversely impact customer confidence resulting in customers reducing their spending budgets on our solutions, which could adversely affect our business, revenue, financial condition and results of operations.
Risks related to government regulation and diagnostic product reimbursement
If the FDA determines that our products are medical devices or if we seek to market our products for clinical diagnostic or health screening use, we will be required to obtain regulatory clearance(s) or approval(s), and may be required to cease or limit sales of our then marketed products, which could materially and adversely affect our business, financial condition and results of operations. Any such regulatory process would be expensive, time-consuming and uncertain both in timing and in outcome.
We have focused initially on the life sciences research market. This includes laboratories associated with academic and governmental research institutions, as well as pharmaceutical, biotechnology and contract research companies. Accordingly, our products are labeled as “Research Use Only,” or RUO, and are not intended for diagnostic use. While we have focused initially on the life sciences research market and RUO products only, our strategy is to expand our product line to encompass products that are intended to be used for the diagnosis of disease, either alone or in collaboration with third parties (such as our collaboration with Berry Genomics). Such in-vitro diagnostic, or IVD, products will be subject to regulation by the FDA as medical devices, or comparable international agencies, including
35
requirements for regulatory clearance or approval of such products before they can be marketed. If the FDA were to determine that our products are intended for clinical use or if we decided to market our products for such use, we would be required to obtain FDA 510(k) clearance or premarket approval in order to sell our products in a manner consistent with FDA laws and regulations. Such regulatory approval processes or clearances are expensive, time-consuming and uncertain; our efforts may never result in any approved premarket approval application, or PMA, or 510(k) clearance for our products; and failure by us or a collaborator to obtain or comply with such approvals and clearances could have an adverse effect on our business, financial condition or operating results.
IVD products may be regulated as medical devices by the FDA and comparable international agencies and may require either clearance from the FDA following the 510(k) pre-market notification process or PMA from the FDA, in each case prior to marketing. If we or our collaborators are required to obtain a PMA or 510(k) clearance for products based on our technology, we or they would be subject to a substantial number of additional requirements for medical devices, including establishment registration, device listing, Quality Systems Regulations which cover the design, testing, production, control, quality assurance, labeling, packaging, servicing, sterilization (if required), and storage and shipping of medical devices (among other activities), product labeling, advertising, recordkeeping, post-market surveillance, post-approval studies, adverse event reporting, and correction and removal (recall) regulations. One or more of the products we or a collaborator may develop using our technology may also require clinical trials in order to generate the data required for PMA approval. Complying with these requirements may be time-consuming and expensive. We or our collaborators may be required to expend significant resources to ensure ongoing compliance with the FDA regulations and/or take satisfactory corrective action in response to enforcement action, which may have a material adverse effect on the ability to design, develop, and commercialize products using our technology as planned. Failure to comply with these requirements may subject us or a collaborator to a range of enforcement actions, such as warning letters, injunctions, civil monetary penalties, criminal prosecution, recall and/or seizure of products, and revocation of marketing authorization, as well as significant adverse publicity. If we or our collaborators fail to obtain, or experience significant delays in obtaining, regulatory approvals for IVD products, such products may not be able to be launched or successfully commercialized in a timely manner, or at all.
Laboratory developed tests, or LDTs, are a subset of IVD tests that are designed, manufactured and used within a single laboratory. The FDA maintains that LDTs are medical devices and has for the most part exercised enforcement discretion for most LDTs. A significant change in the way that the FDA regulates any LDTs that we, our collaborators or our customers develop using our technology could affect our business. If the FDA requires laboratories to undergo premarket review and comply with other applicable FDA requirements in the future, the cost and time required to commercialize an LDT will increase substantially, and may reduce the financial incentive for laboratories to develop LDTs, which could reduce demand for our instruments and our other products. In addition, if the FDA were to change the way that it regulates LDTs to require that we undergo pre-market review or comply with other applicable FDA requirements before we can sell our instruments or our other products to clinical cytogenics laboratories, our ability to sell our instruments and other products to this addressable market would be delayed, thereby impeding our ability to penetrate this market and generate revenue from sales of our instruments and our other products.
Failure to comply with applicable FDA requirements could subject us to misbranding or adulteration allegations under the Federal Food, Drug, and Cosmetic Act. We could be subject to a range of enforcement actions, including warning letters, injunctions, civil monetary penalties, criminal prosecution, and recall and/or seizure of products, as well as significant adverse publicity. In addition, changes to the current regulatory framework, including the imposition of additional or new regulations, could arise at any time during the development or marketing of our products, which may negatively affect our ability to obtain or maintain FDA or comparable regulatory approval of our products, if required.
Foreign jurisdictions have laws and regulations similar to those described above, which may adversely affect our ability to market our products as planned in such countries. The number and scope of these requirements are increasing. As in the U.S., the cost and time required to comply with regulatory requirements may be substantial, and there is no guarantee that we will obtain the necessary authorization(s) required to make our products commercially viable. As a result, the imposition of foreign requirements may also have a material adverse effect on the commercial viability of our operations.
We expect to rely on third parties in conducting any required future studies of diagnostic products that may be required by the FDA or other regulatory authorities, and those third parties may not perform satisfactorily.
We do not have the ability to independently conduct clinical trials or other studies that may be required to obtain FDA and other regulatory clearance or approval for future diagnostic products. Accordingly, we expect that we would rely on third parties, such as clinical investigators, consultants, and collaborators to conduct such studies if needed. Our reliance on these third parties for clinical and other development activities would reduce our control over these activities. If these third parties do not successfully carry out their contractual duties or regulatory obligations or meet expected deadlines, if the third parties need to be replaced or if the quality or accuracy of the data they obtain is compromised, we may not be able to obtain regulatory clearance or approval.
36
If diagnostic procedures that are enabled by our technology are subject to unfavorable pricing regulations or third-party payor coverage and reimbursement policies, our business could be harmed.
Currently, our product is for research use only, but clinical laboratories may acquire our instrumentation through a capital purchase or capital lease and use the Saphyr and direct label stain chemistry to create their own potentially reimbursable products, such as laboratory developed tests for in vitro diagnostics. Our customers may generate revenue for these testing services by seeking the necessary approval of their product from the FDA or the Centers for Medicare & Medicaid Services, or CMS, along with coverage and reimbursement from third-party payors, including government health programs and private health plans. The ability of our customers to commercialize diagnostic tests based on our technology will depend in part on the extent to which coverage and reimbursement for these tests will be available from such third-party payors.
In the U.S., molecular testing laboratories have multiple options for reimbursement coding, but we expect that the primary codes used will be the genomic sequencing procedure codes, or GSPs. The American Medical Association, or AMA, added GSPs to its clinical laboratory fee schedule in 2015. In addition, CMS recently issued a coverage determination providing for the reimbursement of next-generation sequencing for certain cancer diagnostics using an FDA-approved in vitro diagnostic test. Private health plans often follow CMS coverage and reimbursement guidelines to a substantial degree, and it is difficult to predict what CMS will decide with respect to the coverage and reimbursement of any products our customers try to commercialize.
In Europe, coverage for molecular diagnostic testing is varied. Countries with statutory health insurance (e.g., Germany, France, The Netherlands) tend to be more progressive in technology adoption with favorable reimbursement for molecular diagnostic testing. In countries such as the United Kingdom with tax-based insurance, adoption and reimbursement for molecular diagnostic testing is not uniform and is influenced by local budgets.
Ultimately, coverage and reimbursement of new products is uncertain, and whether laboratories that use our instruments to develop their own products will attain coverage and adequate reimbursement is unknown. In the U.S., there is no uniform policy for determining coverage and reimbursement. Coverage can differ from payor to payor, and the process for determining whether a payor will provide coverage may be separate from the process for setting the reimbursement rate. In addition, the U.S. government, state legislatures and foreign governments have shown significant interest in implementing cost containment programs to limit the growth of government-paid healthcare costs, including price controls and restrictions on reimbursement. We cannot be sure that coverage will be available for any diagnostic tests based on our technology, and, if coverage is available, the level of payments. Reimbursement may impact the demand for those tests. If coverage and reimbursement is not available or is available only to limited levels, our customers may not be able to successfully commercialize any tests for which they receive marketing authorization.
Current and future legislation may increase the difficulty and cost to obtain marketing approval of and commercialize any products based on our technology and affect the prices that may be obtained.
In March 2010, the Patient Protection and Affordable Care Act, as amended by the Health Care and Education Reconciliation Act, collectively, the ACA, became law. The ACA is a sweeping law intended to broaden access to health insurance, reduce or constrain the growth of healthcare spending, enhance remedies against fraud and abuse, add new transparency requirements for the healthcare and health insurance industries, impose new taxes and fees on the health industry and impose additional health policy reforms. For example, the ACA contained a 2.3% excise tax on certain entities that manufacture or import medical devices offered for sale in the U.S., with limited exceptions, which has been permanently eliminated as part of the 2020 spending package.
There remains judicial and Congressional challenges to certain aspects of the ACA, as well as efforts by the Trump administration to repeal or replace certain aspects of the ACA. Since January 2017, President Trump has signed two Executive Orders and other directives designed to delay the implementation of certain provisions of the ACA or otherwise circumvent some of the requirements for health insurance mandated by the ACA. Concurrently, Congress has considered legislation that would repeal or repeal and replace all or part of the ACA. While Congress has not passed comprehensive repeal legislation, it has enacted laws that modify certain provisions of the ACA such as removing penalties, starting January 1, 2019, for not complying with the ACA’s individual mandate to carry health insurance. On December 14, 2018, a Texas U.S. District Court Judge ruled that the ACA is unconstitutional in its entirety because the “individual mandate” was repealed by Congress as part of the Tax Cuts and Jobs Act. Additionally, on December 18, 2019, the U.S. Court of Appeals for the 5th Circuit upheld the District Court ruling that the individual mandate was unconstitutional and remanded the case back to the District Court to determine whether the remaining provisions of the ACA are invalid as well. On March 2, 2020, the United States Supreme Court granted the petitions for writs of certiorari to review this case, and has allotted one hour for oral arguments, which are expected to occur in the fall. It is unclear how such litigation and other efforts to repeal and replace the ACA will impact the ACA and our business.
In addition, other legislative changes have been proposed and adopted since the ACA was enacted. For example, on April 1, 2014, the Protecting Access to Medicare Act of 2014, or PAMA, was signed into law, which, among other things, significantly altered the payment methodology under the Medicare Clinical Laboratory Fee Schedule, or CLFS. PAMA requires certain laboratories performing clinical diagnostic laboratory tests to report to CMS the amounts paid by private payors for laboratory tests. Beginning January 1, 2018, CMS will use reported private payor pricing to periodically revise payment rates under the CLFS.
37
We expect that the ACA, as well as other healthcare reform measures that may be adopted in the future, may result in more rigorous coverage criteria and additional downward pressure on the price that we or our collaborators will receive for any cleared or approved product. Any reduction in payments from Medicare or other government programs may result in a similar reduction in payments from private payors. The implementation of cost containment measures or other healthcare reforms may prevent our customers from successfully commercializing any tests for which they receive approval, which could prevent us from being able to generate revenue and attain profitability.
We may be subject, directly or indirectly, to federal and state healthcare fraud and abuse laws and other federal and state laws applicable to our marketing practices. If we are unable to comply, or have not complied, with such laws, we could face substantial penalties.
Our operations are directly or indirectly, through our customers, subject to various federal and state fraud and abuse laws, including, without limitation, the federal and state anti-kickback statutes and false claims laws. These laws may impact, among other things, our sales and marketing and education programs, and our financial and business relationships with researchers who use our instruments to develop marketed products. By way of example: the federal Anti-Kickback Statute prohibits, among other things, any person or entity from, among other things, knowingly and willfully soliciting, receiving, offering or paying any remuneration, directly or indirectly, to induce, or in return for, purchasing, leasing, ordering, or arranging for or recommending the purchase, lease, or order of any good, facility, item, or service reimbursable, in whole or in part, under a federal healthcare program; and the federal false claims laws, including, without limitation the federal civil False Claims Act, prohibit, among other things, anyone from knowingly and willingly presenting, or causing to be presented for payment, to the federal government (including Medicare and Medicaid) claims for reimbursement for, among other things, drugs or services that are false or fraudulent, claims for items or services not provided as claimed, or claims for medically unnecessary items or services. The ACA, among other things, amended the intent requirement of the federal Anti-Kickback Statute to clarify that a person or entity does not need to have actual knowledge of the statute or specific intent to violate it in order to have committed a crime. In addition, the ACA clarifies that the government may assert that a claim that includes items or service resulting from a violation of the federal Anti-Kickback Statute constitutes a false or fraudulent claim for purposes of the federal civil False Claims Act.
In addition, we may be subject to the Health Insurance Portability and Accountability Act of 1996, or HIPAA, as amended by the Health Information Technology for Economic and Clinical Health Act and their implementing regulations, which imposes certain requirements relating to the privacy, security and transmission of individually identifiable health information without appropriate authorization by entities subject to the rule, such as health plans, health care clearinghouses and certain health care providers and their business associates who create, use or disclose individually identifiable health information on their behalf. We may also be subject to state and foreign laws, such as the General Data Protection Regulation (EU) 2016/679, that govern the privacy and security of health information in some circumstances, many of which differ from each other in significant ways and often are not preempted by HIPAA, thus complicating compliance efforts.
If our operations are found to be in violation of any of these laws, we may be subject to significant penalties, including, without limitation, civil, criminal, and administrative penalties, damages, fines, disgorgement, the curtailment or restructuring of our operations, exclusion from participation in federal and state healthcare programs, additional integrity oversight and reporting obligations, imprisonment, contractual damages, and reputational harm, any of which could adversely affect our ability to operate our business and our results of operations.
Additionally, sales of our instruments outside of the U.S. will subject us to similar foreign regulatory requirements.
Risks Related to Intellectual Property
If we are unable to protect our intellectual property, it may reduce our ability to maintain any technological or competitive advantage over our competitors and potential competitors, and our business may be harmed.
We rely on patent protection as well as trademark, copyright, trade secret and other intellectual property rights protection and contractual restrictions to protect our proprietary technologies, all of which provide limited protection and may not adequately protect our rights or permit us to gain or keep any competitive advantage. As of February 24, 2020, we were the assignee or assignee-applicant of 13 granted U.S. patents and approximately 9 pending U.S. patent applications. We also were the assignee-applicant of approximately 89 pending patent applications and granted patents in particular jurisdictions outside the U.S. If we fail to protect and/or maintain our intellectual property, third parties may be able to compete more effectively against us, we may lose our technological or competitive advantage, and/or we may incur substantial litigation costs in our attempts to recover or restrict use of our intellectual property.
We cannot assure investors that any of our currently pending or future patent applications will result in granted patents, and we cannot predict how long it will take for such patents to issue, if at all. It is possible that, for any of our patents that have issued or that may issue in the future, our competitors may design their products around our patented technologies. Further, we cannot assure investors that other parties will not challenge any patents granted to us, or that courts or regulatory agencies will hold our patents to be valid, enforceable, and/or infringed. We cannot guarantee investors that we will be successful in defending challenges made against our patents
38
and patent applications. Any successful third-party challenge or challenges to our patents could result in the unenforceability or invalidity of such patents, or such patents being interpreted narrowly and/or in a manner adverse to our interests. Our ability to establish or maintain a technological or competitive advantage over our competitors and/or market entrants may be diminished because of these uncertainties. For these and other reasons, our intellectual property may not provide us with any competitive advantage. For example:
|
•
|
we or our licensors might not have been the first to make the inventions claimed or disclosed by our pending patent applications or issued patents;
|
|
•
|
we or our licensors might not have been the first to file patent applications for these inventions. To determine the priority of these inventions, we may have to participate in interference proceedings or derivation proceedings declared by the U.S. Patent and Trademark Office, or the USPTO, which could result in substantial cost to us, and could possibly result in a loss or narrowing of patent rights. No assurance can be given that our patent applications or granted patents (or those of our licensors) will have priority over any other patent or patent application involved in such a proceeding, or will be held valid as an outcome of the proceeding;
|
|
•
|
other parties may independently develop similar or alternative products and technologies or duplicate any of our products and technologies, which can potentially impact our market share, revenue, and goodwill, regardless of whether intellectual property rights are successfully enforced against these other parties;
|
|
•
|
it is possible that our owned or licensed pending patent applications will not result in granted patents, and even if such pending patent applications issue as patents, they may not provide intellectual property protection of commercially viable products or product features, may not provide us with any competitive advantages, or may be challenged and invalidated by third parties, patent offices, and/or the courts;
|
|
•
|
we may be unaware of or unfamiliar with prior art and/or interpretations of prior art that could potentially impact the validity or scope of our patents or pending patent applications, or patent applications that we intend to file;
|
|
•
|
we take efforts and enter into agreements with employees, consultants, collaborators, and advisors to confirm ownership and chain of title in intellectual property rights. However, an inventorship or ownership dispute could arise that may permit one or more third parties to practice or enforce our intellectual property rights, including possible efforts to enforce rights against us;
|
|
•
|
we may elect not to maintain or pursue intellectual property rights that, at some point in time, may be considered relevant to or enforceable against a competitor;
|
|
•
|
we may not develop additional proprietary products and technologies that are patentable, or we may develop additional proprietary products and technologies that are not patentable;
|
|
•
|
the patents or other intellectual property rights of others may have an adverse effect on our business; and
|
|
•
|
we apply for patents relating to our products and technologies and uses thereof, as we deem appropriate. However, we or our representatives or their agents may fail to apply for patents on important products and technologies in a timely fashion or at all, or we or our representatives or their agents may fail to apply for patents in potentially relevant jurisdictions.
|
To the extent our intellectual property offers inadequate protection, or is found to be invalid or unenforceable, we would be exposed to a greater risk of direct or indirect competition. If our intellectual property does not provide adequate coverage of our competitors’ products, our competitive position could be adversely affected, as could our business.
Software is an important component of at least some of our products and services. To the extent such software is not protected by our patents, our dependence on trade secret protection may not provide adequate protection. In addition, the Supreme Court’s ruling
Alice Corporation Pty. Ltd. v. CLS Bank International
, has narrowed the scope of patent protection available for software in certain circumstances.
The measures that we use to protect the security of our intellectual property and other proprietary rights may not be adequate, which could result in the loss of legal protection for, and thereby diminish the value of, such intellectual property and other rights.
In addition to pursuing patents on our technology, we also rely upon trademarks, trade secrets, copyrights and unfair competition laws, as well as license agreements and other contractual provisions, to protect our intellectual property and other proprietary rights. Despite these measures, any of our intellectual property rights could be challenged, invalidated, circumvented or misappropriated. In addition, we take steps to protect our intellectual property and proprietary technology by entering into confidentiality agreements and intellectual property assignment agreements with our employees, consultants, corporate partners and, when needed, our advisors. Such agreements may not be enforceable or may not provide meaningful protection for our trade secrets and/or other proprietary information in the event of unauthorized use or disclosure or other breaches of the agreements, and we may not be able to prevent such unauthorized disclosure. Moreover, if a party having an agreement with us has an overlapping or conflicting obligation to a third party, our rights in and to certain intellectual property could be undermined. Monitoring unauthorized and inadvertent disclosure is difficult, and we do not
39
know whether the steps we have taken to prevent such disclosure are, or will be, adequate. If we were to enforce a claim that a third party had illegally obtained and was using our trade secrets, it would be expensive and time consuming, the outcome would be unpredictable, and any remedy may be inadequate. In addition, courts outside the U.S. may be less willing to protect trade secrets.
In addition, competitors could purchase our products and attempt to replicate and/or improve some or all of the competitive advantages we derive from our development efforts, willfully infringe our intellectual property rights, design their products around our protected technology or develop their own competitive technologies that fall outside of our intellectual property rights. If our intellectual property does not adequately protect our market share against competitors’ products and methods, our competitive position could be adversely affected, as could our business.
We have rights in some intellectual property that has been discovered through government funded programs and thus is subject to federal regulations such as “march-in” rights, certain reporting requirements, and a preference for U.S. industry. Compliance with such regulations may limit our exclusive rights, subject us to expenditure of resources with respect to reporting requirements, and limit our ability to contract with non-U.S. manufacturers.
Some of the intellectual property rights assigned to us and/or in-licensed to us have been generated through the use of U.S. government funding and are therefore subject to certain federal regulations. For example, all of the intellectual property rights licensed to us under our license agreement with Princeton University have been generated using U.S. government funds. As a result, the U.S. government has certain rights to intellectual property embodied in our current or future products pursuant to the Bayh-Dole Act of 1980. These U.S. government rights in certain inventions developed under a government-funded program include a non-exclusive, non-transferable, irrevocable worldwide license to use inventions for any governmental purpose. In addition, the U.S. government has the right to require us to grant exclusive, partially exclusive, or non-exclusive licenses to any of these inventions to a third party if the government determines that: (i) adequate steps have not been taken to commercialize the invention; (ii) government action is necessary to meet public health or safety needs; or (iii) government action is necessary to meet requirements for public use under federal regulations (also referred to as “march-in rights”). The U.S. government also has the right to take title to these inventions if we fail, or the applicable licensor fails, to disclose the invention to the government, elect title, and file an application to register the intellectual property within specified time limits. In addition, the U.S. government may acquire title to these inventions in any country in which a patent application is not filed within specified time limits. Intellectual property generated under a government funded program is also subject to certain reporting requirements, compliance with which may require us, or the applicable licensor, to expend substantial resources. In addition, the U.S. government requires that any products embodying the subject invention or produced through the use of the subject invention be manufactured substantially in the U.S. The manufacturing preference requirement can be waived if the owner of the intellectual property can show that reasonable but unsuccessful efforts have been made to grant licenses on similar terms to potential licensees that would be likely to manufacture substantially in the U.S. or that, under the circumstances, domestic manufacture is not commercially feasible. This preference for U.S. manufacturing may limit our ability to license the applicable patent rights on an exclusive basis under certain circumstances.
If we enter into future arrangements involving government funding, and we make inventions as a result of such funding, intellectual property rights to such discoveries may be subject to the applicable provisions of the Bayh-Dole Act. To the extent any of our current or future intellectual property is generated through the use of U.S. government funding, the provisions of the Bayh-Dole Act may similarly apply. Any exercise by the government of certain of its rights could harm our competitive position, business, financial condition, results of operations and prospects.
We depend on technology that is licensed to us by Princeton University. Any loss of our rights to this technology could prevent us from selling our products.
Some technology that relates to analysis of nucleic acids is licensed exclusively to us from Princeton University, or Princeton. We do not own the patents that underlie this license. Our rights to use this technology and employ the inventions claimed in the licensed patents are subject to the continuation of and compliance with the terms of the license. Our principal obligations under our license agreement with Princeton are as follows:
|
•
|
royalty payments;
|
|
•
|
annual maintenance fees;
|
|
•
|
using commercially reasonable efforts to develop and sell a product using the licensed technology and developing a market for such product;
|
|
•
|
paying and/or reimbursing fees related to prosecution, maintenance and enforcement of patent rights; and
|
|
•
|
providing certain reports.
|
40
If we breach any of these obligations, Princeton may have the right to terminate or modify the license, which could result in our being unable to develop, manufacture and sell our products or a competitor gaining access to the relevant technology. Termination or certain modifications of our license agreement with Princeton would have a material adverse effect on our business.
In addition, we are a party to a number of other agreements that include licenses to intellectual property, including non-exclusive licenses. We may need to enter into additional license agreements in the future. Our business could suffer, for example, if any current or future licenses terminate, if the licensors fail to abide by the terms of the license, if the licensed patents or other rights are found to be invalid or unenforceable, or if we are unable to enter into necessary licenses on acceptable terms.
As we have done previously, we may need or may choose to obtain licenses and/or acquire intellectual property rights from third parties to advance our research or begin commercialization of our current or future products, and we cannot provide any assurances that third-party patents do not exist that might be enforced against our current or future products in the absence of such a license. We may fail to obtain any of these licenses or intellectual property rights on commercially reasonable terms. Even if we are able to obtain a license, it may be non-exclusive, thereby giving our competitors access to the same technologies licensed to us. In that event, we may be required to expend significant time and resources to develop or license replacement technology. If we are unable to do so, we may be unable to develop or commercialize the affected products, which could materially harm our business and the third parties owning such intellectual property rights could seek either an injunction prohibiting our sales, or, with respect to our sales, an obligation on our part to pay royalties and/or other forms of compensation.
Licensing of intellectual property is important to our business and involves complex legal, business and scientific issues. Disputes may arise between us and our licensors regarding intellectual property subject to a license agreement, including:
|
•
|
the scope of rights granted under the license agreement and other interpretation-related issues;
|
|
•
|
whether and the extent to which our technology and processes infringe any intellectual property of the licensor that is not subject to the licensing agreement;
|
|
•
|
whether to take action to enforce any intellectual property rights against an allegedly infringing product or process of a third party;
|
|
•
|
our right to sublicense patent and other rights to third parties;
|
|
•
|
our diligence obligations with respect to the use of licensed technology in relation to our development and commercialization of our products, and what activities satisfy those diligence obligations; and
|
|
•
|
the ownership of inventions and know-how, such as intellectual property resulting from the joint creation or use of intellectual property by our licensors and us and our partners.
|
If disputes over intellectual property that we have licensed prevent or impair our ability to maintain our current licensing arrangements on acceptable terms, we may be unable to successfully develop and commercialize the affected product, or the dispute may have an adverse affect on our results of operation.
In addition to agreements pursuant to which we in-license intellectual property, we may in the future grant licenses under our intellectual property, or sell certain intellectual property. Like in-licenses, out-licenses can be complex and disputes may arise between us and our licensees, such as the types of disputes described above. Moreover, licensees may breach their obligations, or we may be exposed to liability due to our failure or alleged failure to satisfy our obligations. Any such occurrence could have an adverse affect on our business.
If we or any of our partners is sued for infringing intellectual property rights of third parties, it would be costly and time consuming, and an unfavorable outcome in that litigation could have a material adverse effect on our business.
Our success also depends on our ability to develop, manufacture, market and sell our products and perform our services without infringing the proprietary rights of third parties. Numerous U.S. and foreign-issued patents and pending patent applications owned by third parties exist in the fields in which we are developing products and services. As part of a business strategy to impede our successful commercialization and entry into new markets, competitors may allege that our products and/or services infringe their intellectual property rights.
We could incur substantial costs and divert the attention of our management and technical personnel in defending ourselves against claims of infringement made by third parties. Any adverse ruling by a court or administrative body, or perception of an adverse ruling, may have a material adverse impact on our ability to conduct our business and our finances. Moreover, third parties making claims against us may be able to obtain injunctive relief against us, which could block our ability to offer one or more products or services and could result in a substantial award of damages against us. In addition, since we sometimes indemnify customers, collaborators or licensees, we may have additional liability in connection with any infringement or alleged infringement of third-party intellectual property. Intellectual
41
property litigation can be very expensive, and we may not have the financial means to defend ourselves or our customers, collaborators and licensees.
Because patent applications can take many years to issue, there may be pending applications, some of which are unknown to us, that may result in issued patents upon which our products or proprietary technologies may infringe. Moreover, we may fail to identify issued patents of relevance or incorrectly conclude that an issued patent is invalid or not infringed by our technology or any of our products. There is a substantial amount of litigation involving patents and other intellectual property rights in our industry. If a third-party claims that we or any of our licensors, customers or collaboration partners infringe upon a third-party’s intellectual property rights, we may have to:
|
•
|
seek to obtain licenses that may not be available on commercially reasonable terms, if at all;
|
|
•
|
abandon any product alleged or held to infringe, or redesign our products or processes to avoid potential assertion of infringement;
|
|
•
|
pay substantial damages including, in exceptional cases, treble damages and attorneys’ fees, which we may have to pay if a court decides that the product or proprietary technology at issue infringes upon or violates the third-party’s rights;
|
|
•
|
pay substantial royalties or fees or grant cross-licenses to our technology; or
|
|
•
|
defend litigation or administrative proceedings that may be costly whether we win or lose, and which could result in a substantial diversion of our financial and management resources.
|
We may be involved in lawsuits to protect or enforce our patents or the patents of our licensors, which could be expensive, time-consuming and unsuccessful.
Competitors may infringe our patents or the patents we license in. In the event of infringement or unauthorized use, we may file one or more infringement lawsuits, which can be expensive and time-consuming. An adverse result in any such litigation proceedings could put one or more of our patents at risk of being invalidated, being found to be unenforceable, and/or being interpreted narrowly and could put our patent applications at risk of not issuing and/or could impact the validity or enforceability positions of our other patents or those we license. Furthermore, because of the substantial amount of discovery required in connection with intellectual property litigation, there is a risk that some of our confidential information could be compromised by disclosure during this type of litigation.
Most of our competitors are larger than we are and have substantially greater resources. They are, therefore, likely to be able to sustain the costs of complex patent litigation longer than we could. In addition, the uncertainties associated with litigation could have a material adverse effect on our ability to raise the funds necessary to continue our operations, continue our internal research programs, in-license needed technology, pursue, obtain or maintain intellectual property rights, or enter into development partnerships that would help us bring our products to market.
In addition, patent litigation can be very costly and time-consuming. An adverse outcome in such litigation or proceedings may expose us or any of our future development partners to loss of our proprietary position, expose us to significant liabilities, or require us to seek licenses that may not be available on commercially acceptable terms, if at all.
Our issued patents could be found invalid or unenforceable if challenged in court or at the Patent Office or other administrative agency, which could have a material adverse impact on our business.
If we or any of our partners were to initiate legal proceedings against a third party to enforce a patent related to one of our products or services, the defendant in such litigation could counterclaim that our patent is invalid and/or unenforceable. In patent litigation in the U.S., defendant counterclaims alleging invalidity and/or unenforceability are commonplace, as are validity challenges by the defendant against the subject patent or other patents before the USPTO. Grounds for a validity challenge could be an alleged failure to meet any of several statutory requirements, including lack of novelty, obviousness or non-enablement, failure to meet the written description requirement, indefiniteness, and/or failure to disclose the best mode or to claim patent eligible subject matter. Grounds for an unenforceability assertion could be an allegation that someone connected with prosecution of the patent intentionally withheld material information from the USPTO, or made a misleading statement, during prosecution. Additional grounds for an unenforceability assertion include an allegation of misuse or anticompetitive use of patent rights, and an allegation of incorrect inventorship with deceptive intent. Third parties may also raise similar claims before the USPTO even outside the context of litigation. The outcome is unpredictable following legal assertions of invalidity and unenforceability. With respect to the validity question, for example, we cannot be certain that no invalidating prior art existed of which we and the patent examiner were unaware during prosecution. These assertions may also be based on information known to us or the Patent Office. If a defendant or third party were to prevail on a legal assertion of invalidity and/or unenforceability, we would lose at least part, and perhaps all, of the claims of the challenged patent. Such a loss of patent protection would or could have a material adverse impact on our business.
42
We may be subject to claims that our employees, consultants or independent contractors have wrongfully used or disclosed alleged trade secrets of their other clients or former employers to us, and/or that their other clients or former employers allegedly have rights in our intellectual property, which could subject us to costly litigation.
As is common in the life sciences industry, we engage the services of consultants and independent contractors to assist us in the development of our products. Many of these consultants and independent contractors were previously employed at, or may have previously or may be currently providing consulting or other services to, universities or other technology, biotechnology or pharmaceutical companies, including our competitors or potential competitors. We may become subject to claims that our company, a consultant or an independent contractor inadvertently or otherwise used or disclosed trade secrets or other information proprietary to their former employers or their former or current clients. We may similarly be subject to claims stemming from similar actions of an employee, such as one who was previously employed by another company, including a competitor or potential competitor. We may become subject to claims that one or more current or former employees, consultants, advisors, or independent contractors of ours owns rights in our intellectual property and/or has assigned or is under an obligation to assign rights in our intellectual property to another party. This may include a competitor of ours. If a competitor has rights in our patents, the competitor or a licensee or related entity may be able to make, use, sell, import, and/or export the patented technology without liability to us under our patents or the patents we license. Litigation may be necessary to defend against these claims. Even if we are successful in defending against these claims, litigation could result in substantial costs and be a distraction to our management team. If we were not successful, we could lose valuable intellectual property rights.
We may be subject to claims challenging the inventorship or ownership of our patents and other intellectual property.
We generally enter into confidentiality and intellectual property assignment agreements with our employees, consultants, and contractors. These agreements generally provide that inventions conceived by the party in the course of rendering services to us will be our exclusive property. However, those agreements may not be honored and may not effectively assign or may be alleged to ineffectively assign intellectual property rights to us. For example, even if we have a consulting agreement in place with an academic advisor pursuant to which such academic advisor is required to assign any inventions developed in connection with providing services to us, such academic advisor may not have the right to assign such inventions to us, as it may conflict with his or her obligations to assign all such intellectual property to his or her employing institution.
In addition, we sometimes enter into agreements where we provide services to third parties, such as customers. Under such circumstances, our agreements may provide that certain intellectual property that we conceive in the course of providing those services is assigned to the customer. In those cases, we may not be able to use that particular intellectual property in, for example, our work for other customers without a license.
We may not be able to protect our intellectual property rights throughout the world, which could materially and negatively affect our business.
Filing, prosecuting, maintaining, and defending patents on current and future products in all countries throughout the world would be prohibitively expensive, and our intellectual property rights in some countries outside the U.S. can be less extensive than those in the U.S. In addition, the laws of some foreign countries do not protect intellectual property rights to the same extent as federal and state laws in the U.S. Consequently, regardless of whether we are able to prevent third parties from practicing our inventions in the U.S., we may not be able to prevent third parties from practicing our inventions in all countries outside the U.S., or from selling or importing products made using our inventions in and into the U.S. or other jurisdictions. Competitors may use our technologies in jurisdictions where we have not pursued and obtained patent protection to develop their own products, and further, may export otherwise infringing products to territories where we have patent protection, but enforcement is not as strong as it is in the U.S. These products may compete with our products and our patents or other intellectual property rights may not be effective or sufficient to prevent them from competing. Even if we pursue and obtain issued patents in particular jurisdictions, our patent claims or other intellectual property rights may not be effective or sufficient to prevent third parties from so competing. Patent protection must ultimately be sought on a country-by-country basis, which is an expensive and time-consuming process with uncertain outcomes. Accordingly, we may choose not to seek patent protection in certain countries, and we will not have the benefit of patent protection in such countries.
Many companies have encountered significant problems in protecting and defending intellectual property rights in foreign jurisdictions. The legal systems of certain countries, particularly certain developing countries, do not favor the enforcement of patents and other intellectual property protection, particularly those relating to biotechnology, which could make it difficult for us to stop the infringement of our patents or marketing of competing products in violation of our proprietary rights generally. Proceedings to enforce our patent rights in foreign jurisdictions could result in substantial costs and divert our efforts and attention from other aspects of our business, could put our patents at risk of being invalidated or interpreted narrowly and our patent applications at risk of not issuing, and could provoke third parties to assert claims against us. We may not prevail in any lawsuits that we initiate and the damages or other remedies awarded, if any, may not be commercially meaningful. Accordingly, our efforts to enforce our intellectual property rights around the world may be inadequate to obtain a significant commercial advantage from the intellectual property that we develop or license and may adversely impact our business.
43
In addition, we and our partners also face the risk that our products or components thereof are imported, reimported, or exported into markets with relatively higher prices from markets with relatively lower prices, which would result in a decrease of sales and any payments we receive from the affected market. Recent developments in U.S. patent law have made it more difficult to stop these and related practices based on theories of patent infringement.
Changes in patent laws or patent jurisprudence could diminish the value of patents in general, thereby impairing our ability to protect our products.
As is the case with other life science industry companies, our success is heavily dependent on intellectual property, particularly patents. Obtaining and enforcing patents involve both technological complexity and legal complexity. Therefore, obtaining and enforcing patents is costly, time-consuming and inherently uncertain. In addition, the America Invents Act, or the AIA, became effective on March 16, 2013.
An important change introduced by the AIA is that the U.S. transitioned to a “first-to-file” system for deciding which party should be granted a patent when two or more patent applications are filed by different parties claiming the same invention. A third party that files a patent application in the USPTO after that date but before us could therefore be awarded a patent claiming or disclosing an invention of ours even if we had made the invention before it was made by the third party. This will require us to be cognizant going forward of the time from invention to filing of a patent application, but circumstances could prevent us from promptly filing patent applications on our inventions. Additionally, there can be a trade-off between obtaining an earlier filing date, and waiting to obtain additional data and/or further refine a patent application. In some circumstances, the effects of a decision to pursue an earlier filing or a later filing will not be known until prior art or third-party activities are subsequently discovered, such as by the USPTO or by a third party seeking to challenge patent rights. These circumstances may apply, for example, to patent applications prepared and filed around the time of the implementation of the AIA, or with a priority application that preceded the implementation of the AIA.
Among some of the other changes introduced by the AIA are changes that limit where a patent holder may file a patent infringement suit and providing additional opportunities for third parties to challenge an issued patent in the USPTO. This applies to all of our owned and in-licensed U.S. patents, even those issued before March 16, 2013. Because of a lower standard for evidence in USPTO proceedings compared to the standard for evidence in U.S. federal courts necessary to invalidate a patent claim, a third party could potentially provide evidence in a USPTO proceeding sufficient for the USPTO to hold a claim invalid even though the same evidence would be insufficient to invalidate the claim if first presented in a court action. Accordingly, a third party may try to use the USPTO procedures to invalidate our patent claims that would not have been invalidated if first challenged by the third party in court. The AIA and its implementation could increase the uncertainties and costs surrounding the prosecution of our patent applications and the enforcement or defense of our issued patents. In addition, the contours of the laws under the AIA are subject to further judicial interpretation and/or legislative changes.
Additionally, the U.S. Supreme Court has ruled on several patent cases in recent years, such as
Impression Products, Inc. v. Lexmark International, Inc., Association for Molecular Pathology v. Myriad Genetics, Inc
.,
Mayo Collaborative Services v. Prometheus Laboratories, Inc.
and
Alice Corporation Pty. Ltd. v. CLS Bank International
, either narrowing the scope of patent protection available in certain circumstances or weakening the rights of patent owners in certain situations. In addition to increasing uncertainty with our ability to obtain patents in the future, this combination of events has created uncertainty as to the value of patents, once obtained, including patents in the molecular biology analysis and diagnostic space in particular. Depending on decisions by the U.S. Congress, the federal courts, and the USPTO, the laws and regulations governing patents could change in unpredictable ways that could weaken our ability to obtain new patents or to enforce our existing patents and patents that we might obtain in the future.
Obtaining and maintaining our patent protection depends on compliance with various procedural, document submission, fee payment and other requirements imposed by governmental patent agencies, and our patent protection could be reduced or eliminated for non-compliance with these requirements.
The USPTO and various foreign governmental patent agencies require compliance with a number of procedural, documentary, fee payment and other provisions during the patent process. There are situations in which noncompliance can result in abandonment or lapse of a patent or patent application, resulting in partial or complete loss of patent rights in the relevant jurisdiction. In such an event, competitors might be able to enter the market earlier than would otherwise have been the case. In some cases, our licensors may be responsible for these payments, thereby decreasing our control over compliance with these requirements.
If our trademarks and trade names are not adequately protected, then we may not be able to build name recognition in our markets of interest and our business may be adversely affected.
Our registered or unregistered trademarks or trade names may be challenged, infringed, circumvented or declared generic or determined to be infringing other marks. We may not be able to protect our rights to these trademarks and trade names, which we need to build name recognition by potential partners or customers in our markets of interest. At times, competitors may adopt trade names or trademarks similar to ours, thereby impeding our ability to build brand identity and possibly leading to market confusion. In addition,
44
there could be potential trade name or trademark infringement claims brought by owners of other registered trademarks. Over the long term, if we are unable to establish name recognition based on our trademarks and trade names, then we may not be able to compete effectively and our business may be adversely affected.
We may use third-party open source software components in future products, and failure to comply with the terms of the underlying open source software licenses could restrict our ability to sell such products.
While our current products do not contain any software tools licensed by third-party authors under “open source” licenses, we may choose to use open source software in future products. Use and distribution of open source software may entail greater risks than use of third-party commercial software, as open source licensors generally do not provide warranties or other contractual protections regarding infringement claims or the quality of the code. Some open source licenses may contain requirements that we make available source code for modifications or derivative works we create based upon the type of open source software we use. If we combine our proprietary software with open source software in a certain manner, we could, under certain open source licenses, be required to release the source code of our proprietary software to the public. This would allow our competitors to create similar products with less development effort and time, and ultimately could result in a loss of product sales.
Although we intend to monitor any use of open source software to avoid subjecting our products to conditions, we do not intend, the terms of many open source licenses have not been interpreted by U.S. courts, and there is a risk that any such licenses could be construed in a way that could impose unanticipated conditions or restrictions on our ability to commercialize our products. Moreover, we cannot assure investors that our processes for controlling our use of open source software in our products will be effective. If we are held to have breached the terms of an open source software license, we could be required to seek licenses from third parties to continue offering our products on terms that are not economically feasible, to re-engineer our products, to discontinue the sale of our products if re-engineering could not be accomplished on a timely basis, or to make generally available, in source code form, our proprietary code, any of which could adversely affect our business, operating results, and financial condition.
We use third-party software that may be difficult to replace or cause errors or failures of our products that could lead to lost customers or harm to our reputation.
We use software licensed from third parties in our products. In the future, this software may not be available to us on commercially reasonable terms, or at all. Any loss of the right to use any of this software could result in delays in the production of our products until equivalent technology is either developed by us, or, if available, is identified, obtained and integrated, which could harm our business. In addition, any errors or defects in third-party software or other third-party software failures could result in errors or defects or cause our products to fail, which could harm our business and be costly to correct. Many of these providers attempt to impose limitations on their liability for such errors, defects or failures, and, if enforceable, we may have additional liability to our customers or third-party providers that could harm our reputation and increase our operating costs.
We intend to maintain our relationships with third-party software providers and to seek software from such providers that does not contain any errors or defects. Any failure to do so could adversely impact our ability to deliver reliable products to our customers and could harm our results of operations.
Numerous factors may limit any potential competitive advantage provided by our intellectual property rights.
The degree of future protection afforded by our intellectual property rights is uncertain because intellectual property rights have limitations, and may not adequately protect our business, provide a barrier to entry against our competitors or potential competitors, or permit us to maintain our competitive advantage. Moreover, if a third party has intellectual property rights that cover or impact our use of our technology, we may not be able to fully use or extract value from our intellectual property rights. For example:
|
•
|
others may be able to develop and/or use technology that is similar to our technology or aspects of our technology but that does not cover the claims of any our patents or patents that may issue from our patent applications or those we license;
|
|
•
|
we or the licensor of our licensed-in patents might not have been the first to make the inventions disclosed and/or claimed in a pending patent application that we own or license;
|
|
•
|
we or the licensor of our licensed-in patents might not have been the first to file patent applications disclosing and/or claiming an invention;
|
|
•
|
others may independently develop similar or alternative technologies without infringing our or our licensors’ intellectual property rights;
|
|
•
|
pending patent applications that we own or license may not lead to issued patents or may not result in the claims that we want (for example, as to the scope of issued claims, if any);
|
45
|
•
|
patents, if issued, that we own or license may not provide us with any competitive advantages, or may be held invalid or unenforceable, as a result of legal challenges by our competitors or other third parties;
|
|
•
|
third parties may compete with us in jurisdictions where we do not pursue and obtain patent protection;
|
|
•
|
we may not be able to obtain and/or maintain necessary or useful licenses on reasonable terms or at all;
|
|
•
|
third parties may assert an ownership interest in our intellectual property and, if successful, such disputes may preclude us from exercising exclusive rights over that intellectual property;
|
|
•
|
we may not be able to maintain the confidentiality of our trade secrets or other proprietary information;
|
|
•
|
we may not develop or in-license additional proprietary technologies that are patentable; and
|
|
•
|
the patents or other intellectual property of others may have an adverse effect on our business.
|
Should any of these events occur, they could significantly harm our business and results of operations.
Risks Related to Ownership of our Securities
The price of our securities may be volatile, and you could lose all or part of your investment.
The trading price of our securities is likely to be highly volatile and could be subject to wide fluctuations in response to various factors, some of which are beyond our control, including limited trading volume. In addition to the factors discussed in this Part I, Item 1A Risk Factors and elsewhere in this Annual Report, these factors include:
|
•
|
our commercial progress in marketing and selling our systems, including sales and revenue trends;
|
|
•
|
changes in laws or regulations applicable our systems;
|
|
•
|
adverse developments related to our laboratory facilities;
|
|
•
|
increased competition in the diagnostics services industry;
|
|
•
|
the failure of our customers to obtain and/or maintain coverage and adequate reimbursement for their services using our systems;
|
|
•
|
adverse developments concerning our manufacturers and suppliers;
|
|
•
|
our inability to establish future collaborations;
|
|
•
|
additions or departures of key scientific or management personnel;
|
|
•
|
introduction of new testing services offered by us or our competitors;
|
|
•
|
announcements of significant acquisitions, strategic partnerships, joint ventures or capital commitments by us or our competitors;
|
|
•
|
our ability to effectively manage our growth;
|
|
•
|
the size and growth, if any, of our targeted markets;
|
|
•
|
actual or anticipated variations in quarterly operating results;
|
|
•
|
our cash position;
|
|
•
|
our failure to meet the estimates and projections of the investment community or that we may otherwise provide to the public;
|
|
•
|
publication of research reports about us or our industry or positive or negative recommendations or withdrawal of research coverage by securities analysts;
|
|
•
|
changes in the market valuations of similar companies;
|
|
•
|
overall performance of the equity markets;
|
|
•
|
issuances of debt or equity securities;
|
|
•
|
sales of our securities by us or our stockholders in the future;
|
|
•
|
trading volume of our securities;
|
|
•
|
changes in accounting practices;
|
46
|
•
|
ineffectiveness of our internal controls;
|
|
•
|
disputes or other developments relating to proprietary rights, including our ability to adequately protect our technologies;
|
|
•
|
significant lawsuits, including patent or stockholder litigation;
|
|
•
|
general political and economic conditions; and
|
|
•
|
other events or factors, many of which are beyond our control.
|
In addition, the stock market in general, and diagnostic and biotechnology companies in particular, have experienced extreme price and volume fluctuations that have often been unrelated or disproportionate to the operating performance of these companies. Broad market and industry factors may negatively affect the market price of our securities, regardless of our actual operating performance. In the past, securities class action litigation has often been instituted against companies following periods of volatility in the market price of a company’s securities. This type of litigation, if instituted, could result in substantial costs and a diversion of management’s attention and resources, which would harm our business, operating results or financial condition.
Future sales of substantial amounts of our common stock, or the possibility that such sales could occur, could adversely affect the market price of our common stock.
Future sales in the public market of shares of our common stock, including shares issued upon exercise of our outstanding stock options, or the perception by the market that these sales could occur, could lower the market price of our common stock or make it difficult for us to raise additional capital.
An active trading market for our common stock may not be sustained.
Our shares of common stock began trading on The Nasdaq Capital Market on September 21, 2018. Given the limited trading history of our common stock, there is a risk that an active trading market for our shares will not be sustained, which could put downward pressure on the market price of our common stock and thereby affect the ability of our stockholders to sell their shares.
If we are not able to comply with the applicable continued listing requirements or standards of The Nasdaq Capital Market, Nasdaq could delist our common stock.
Our ability to publicly or privately sell equity securities and the liquidity of our common stock could be adversely affected if we are delisted from The Nasdaq Capital Market or if we are unable to transfer our listing to another stock market. Our common stock is currently listed on The Nasdaq Capital Market. In order to maintain this listing, we must satisfy minimum financial and other continued listing requirements and standards, including a requirement to maintain a minimum of $2.5 million in stockholder equity.
For example, in a letter dated August 16, 2019, or the Notice, we were notified by The Nasdaq Stock Market LLC, or Nasdaq, that we failed to comply with Listing Rule 5550(b)(1) for continued listing on the Nasdaq Capital Market because our stockholder’s equity, as reported in our Quarterly Report on Form 10-Q for the period ended June 30, 2019, is below the required minimum of $2.5 million. The Notice also indicated that, as of August 13, 2019, we do not meet the alternative compliance standards relating to the market value of listed securities of $35 million or net income from continuing operations of $500,000 in the most recently completed fiscal year or in two of the last three most recently completed fiscal years, and therefore could be subject to delisting if we did not submit a plan to regain compliance within 45 calendar days of August 16, 2019.
In September 2019, we submitted a plan to Nasdaq to regain compliance. On October 16, 2019, Nasdaq granted us until February 12, 2020 to provide evidence of compliance with Listing Rule 5550(b), subject to certain requirements, including that we complete our October 2019 public offering by October 31, 2019, periodically update Nasdaq regarding any additional proceeds received from the sale of shares of our capital stock pursuant to our March 2019 common stock purchase agreement with Aspire Capital Fund, LLC, and publicly disclose evidence of our compliance with Listing Rule 5550(b).
We completed our October 2019 public offering and on January 17, 2020, Nasdaq notified us that we had regained compliance with Listing Rule 5550(b) under the alternative requirement to have a market value of listed securities of at least $35 million. Although we have regained compliance with Nasdaq, if we fail to satisfy another Nasdaq requirement for continued listing, Nasdaq staff could provide notice that our common stock may become subject to delisting. In such event, Nasdaq rules permit us to appeal the decision to reject our proposed compliance plan or any delisting determination to a Nasdaq Hearings Panel. Accordingly, there can be no guarantee that we will be able to maintain our Nasdaq listing.
If our common stock is delisted by Nasdaq, it could lead to a number of negative implications, including an adverse effect on the price of our common stock, increased volatility in our common stock, reduced liquidity in our common stock, the loss of federal preemption of state securities laws and greater difficulty in obtaining financing. In addition, delisting of our common stock could deter broker-dealers
47
from making a market in or otherwise seeking or generating interest in our common stock, could result in a loss of current or future coverage by certain sell-side analysts and might deter certain institutions and persons from investing in our securities at all. Delisting could also cause a loss of confidence of our customers, collaborators, vendors, suppliers and employees, which could harm our business and future prospects.
If our common stock is delisted by Nasdaq, our common stock may be eligible to trade on the OTC Bulletin Board, OTC-QB or another over-the-counter market. Any such alternative would likely result in it being more difficult for us to raise additional capital through the public or private sale of equity securities and for investors to dispose of or obtain accurate quotations as to the market value of, our common stock. In addition, there can be no assurance that our common stock would be eligible for trading on any such alternative exchange or markets. Moreover, if our common stock is delisted, it may come within the definition of “penny stock” under the Exchange Act, which imposes additional sales practice requirements on broker-dealers who sell securities to persons other than established customers and accredited investors. For example, we and/or broker-dealers are required to make a special suitability determination for purchases of such securities and must receive a purchaser’s written consent to the transaction prior to any purchase. Additionally, unless exempt, prior to a transaction involving a penny stock, the penny stock rules require the delivery of a disclosure schedule prescribed by the SEC relating to the penny stock market. The broker-dealer must also disclose the commissions payable to the broker-dealer, current quotations for the securities and, if the broker-dealer is the sole market-maker for the security, the fact that they are the sole market-maker and their presumed control over the market. Finally, monthly statements disclosing recent price information on the limited market in penny stocks must be sent to holders of such penny stocks. These requirements may reduce trading activity in the secondary market for our common stock and may impact the ability or willingness of broker-dealers to sell our securities which could limit the ability of stockholders to sell their securities in the public market and limit our ability to attract and retain qualified employees or raise additional capital in the future.
We have never paid dividends and we do not intend to pay dividends on our capital stock.
We have never declared or paid any cash dividend on our capital stock. We currently anticipate that we will retain future earnings for the development, operation and expansion of our business and do not anticipate declaring or paying any cash dividends for the foreseeable future. Any determination to pay dividends in the future will be at the discretion of our board of directors and will depend upon results of operations, financial condition, contractual restrictions, restrictions imposed by applicable law and other factors our board of directors deems relevant. Accordingly, realization of a gain on your investment will depend on the appreciation of the price of our securities, which may never occur. In addition, the Innovatus LSA contains a negative covenant which prohibits us from paying dividends without the prior written consent of Innovatus.
Our principal stockholders and management own a significant percentage of our stock and will be able to exert significant control over matters subject to stockholder approval.
Our executive officers, directors and 5% stockholders and their affiliates currently beneficially own a significant percentage of our outstanding voting stock. These stockholders may be able to determine all matters requiring stockholder approval. For example, these stockholders may be able to control elections of directors, amendments of our organizational documents, or approval of any merger, sale of assets or other major corporate transaction. This may prevent or discourage unsolicited acquisition proposals or offers for our securities that you may feel are in your best interest as one of our stockholders.
We are an emerging growth company, and the reduced reporting requirements applicable to emerging growth companies could make our securities less attractive to investors.
We are an emerging growth company, as defined in the Jumpstart Our Business Startups Act of 2012, or the JOBS Act. For as long as we continue to be an emerging growth company, we may take advantage of exemptions from various reporting requirements that are applicable to other public companies that are not emerging growth companies, including not being required to comply with the auditor attestation requirements of Section 404 of the Sarbanes-Oxley Act of 2002, or the Sarbanes-Oxley Act, reduced disclosure obligations regarding executive compensation in this Annual Report and our periodic reports and proxy statements and exemptions from the requirements of holding nonbinding advisory votes on executive compensation and stockholder approval of any golden parachute payments not previously approved. We can remain an emerging growth company until the earlier of (1) the last day of the fiscal year (a) ending December 31, 2023, which is the end of the fiscal year following the fifth anniversary of the closing of our initial public offering, (b) in which we have total annual gross revenue of at least $1.07 billion, or (c) in which we are deemed to be a large accelerated filer, which means the market value of our common stock that is held by non-affiliates exceeds $700 million as of the prior June 30th, and (2) the date on which we have issued more than $1.0 billion in non-convertible debt during the prior three-year period. Even after we no longer qualify as an emerging growth company, we may still qualify as a “smaller reporting company” which would allow us to take advantage of many of the same exemptions from disclosure requirements including not being required to comply with the auditor attestation requirements of Section 404 of the Sarbanes-Oxley Act and reduced disclosure obligations regarding executive compensation in our periodic reports and proxy statements. We cannot predict if investors will find our securities less attractive because we may rely on these exemptions, which could result in a less active trading market for our securities and increased volatility in the price of our securities.
48
Under the JOBS Act, emerging growth companies can also delay adopting new or revised accounting standards that have different effective dates for public and private companies until those standards apply to private companies. We have elected to use this extended transition period. As a result of this election, our timeline to comply with these standards will in many cases be delayed as compared to other public companies that are not eligible to take advantage of this election or have not made this election. Therefore, our financial statements may not be comparable to those of companies that comply with the public company effective dates for these standards.
In addition, if we cease to be an emerging growth company, we will no longer be able to use the extended transition period for complying with new or revised accounting standards. As a result, changes in rules of U.S. generally accepted accounting principles or their interpretation, the adoption of new guidance or the application of existing guidance to changes in our business could significantly affect our financial position and results of operations.
We have identified material weaknesses in our internal control over financial reporting. If our internal control over financial reporting is not effective, we may not be able to accurately report our financial results or file our periodic reports in a timely manner, which may cause adverse effects on our business and may cause investors to lose confidence in our reported financial information and may lead to a decline in our stock price.
We are subject to the reporting requirements of the Securities Exchange Act of 1934, as amended, or the Exchange Act, the Sarbanes-Oxley Act and the rules and regulations of Nasdaq. The Sarbanes-Oxley Act requires, among other things, that we maintain effective disclosure controls and procedures and internal controls over financial reporting. Internal control over financial reporting is a process designed to provide reasonable assurance regarding the reliability of financial reporting and the preparation of financial statements in accordance with accounting principles generally accepted in the U.S. Effective internal control over financial reporting is necessary for us to provide reliable financial reports in a timely manner.
In connection with the audit of our financial statements for the year ended December 31, 2019, we concluded there was a material weakness in our internal control environment over financial reporting because we did not have a sufficient number of resources to support the growth and complexity of our financial reporting requirements.
A material weakness is a deficiency, or a combination of deficiencies, in internal control over financial reporting, such that a reasonable possibility exists that a material misstatement of our annual or interim financial statements would not be prevented or detected on a timely basis. The foregoing material weakness contributed to a material weakness in our control activities based on the criteria set forth in the 2013 Framework. Specifically, the design of certain controls did not adequately provide appropriate segregation of duties and allow timely completion of financial reporting and accounting activities. The failure to maintain appropriate segregation of duties had a pervasive impact and as such, this deficiency resulted in a risk that could have impacted all financial statement account balances and disclosures. The material weaknesses did not result in any identified material misstatements to our financial statements, and there were no changes to previously released financial results.
In an attempt to remediate the material weaknesses, we have (i) engaged an external consulting firm to assist with our internal accounting functions and further enhance our internal controls, which has increased the number of personnel involved in financial reporting and (ii) are in the process of hiring a new Chief Financial Officer and other qualified individuals that will increase the number of personnel involved in financial reporting and the control environment. However, we cannot assure you that these efforts will remediate our material weakness in a timely manner, or at all.
If we are unable to remediate the material weaknesses described above, or if we or our independent registered public accounting firm are otherwise unable to conclude that our internal control over financial reporting is effective we could lose investor confidence in the accuracy and completeness of our financial reports, the market price of our securities could decline, and we could be subject to sanctions or investigations by Nasdaq, the Securities and Exchange Commission, or the SEC, or other regulatory authorities. Failure to remedy any material weakness in our internal control over financial reporting, or to implement or maintain other effective control systems required of public companies, could also restrict our future access to the capital markets.
Our disclosure controls and procedures may not prevent or detect all errors or acts of fraud.
We have designed our disclosure controls and procedures to reasonably assure that information we must disclose in reports we file or submit under the Exchange Act is accumulated and communicated to management, and recorded, processed, summarized and reported within the time periods specified in the rules and forms of the SEC. We believe that any disclosure controls and procedures or internal controls and procedures, no matter how well-conceived and operated, can provide only reasonable, not absolute, assurance that the objectives of the control system are met.
These inherent limitations include the realities that judgments in decision-making can be faulty, and that breakdowns can occur because of simple errors or mistakes. Additionally, controls can be circumvented by the individual acts of some persons, by collusion of two or more people or by an unauthorized override of the controls. Accordingly, because of the inherent limitations in our control system, misstatements due to error or fraud may occur and not be detected.
49
Based on the evaluation of our disclosure controls and procedures as of December 31, 2019, we concluded that, as of such date, our disclosure controls and procedures were not effective at a reasonable assurance level as a result of the material weakness that existed in our internal control over financial reporting, as described above. Although we are implementing certain measures to address such material weakness, as described above, we cannot assure you that these efforts will successfully remediate our material weakness in a timely manner, or at all.
We have begun to incur significant increased costs as a result of operating as a public company, and our management will be required to devote substantial time to compliance initiatives.
As a newly public company, we have begun to incur significant legal, accounting and other expenses that we did not incur as a private company. We are subject to the reporting requirements of the Securities Exchange Act of 1934, as amended, which will require, among other things, that we file with the SEC annual, quarterly and current reports with respect to our business and financial condition. In addition, the Sarbanes-Oxley Act, as well as rules subsequently adopted by the SEC and Nasdaq to implement provisions of the Sarbanes-Oxley Act, impose significant requirements on public companies, including requiring establishment and maintenance of effective disclosure and financial controls and changes in corporate governance practices. Further, in July 2010, the Dodd-Frank Wall Street Reform and Consumer Protection Act, or the Dodd-Frank Act, was enacted. There are significant corporate governance and executive-compensation-related provisions in the Dodd-Frank Act that require the SEC to adopt additional rules and regulations in these areas. Recent legislation permits emerging growth companies to implement many of these requirements over a longer period and up to five years from the pricing of our initial public offering. We intend to take advantage of this new legislation, but cannot assure you that we will not be required to implement these requirements sooner than planned and thereby incur unexpected expenses. Stockholder activism, the current political environment and the current high level of government intervention and regulatory reform may lead to substantial new regulations and disclosure obligations, which may lead to additional compliance costs and impact the manner in which we operate our business in ways we cannot currently anticipate.
We expect the rules and regulations applicable to public companies will continue to substantially increase our legal and financial compliance costs and to make some activities more time-consuming and costly. If these requirements divert the attention of our management and personnel from other business concerns, they could have a material adverse effect on our business, financial condition and results of operations. The increased costs will decrease our net income or increase our consolidated net loss, and may require us to reduce costs in other areas of our business or increase the prices of our products or services. For example, these rules and regulations to make it more difficult and more expensive for us to obtain director and officer liability insurance and we are required to incur substantial costs to maintain the same or similar coverage. We cannot predict or estimate the amount or timing of additional costs we may incur to respond to these requirements. The impact of these requirements also make it more difficult for us to attract and retain qualified persons to serve on our board of directors, our board committees or as executive officers.
A significant portion of our total outstanding shares are restricted from immediate resale but may be sold into the market in the near future. This could cause the market price of our common stock to drop significantly, even if our business is doing well.
Sales of a substantial number of shares of our common stock in the public market could occur at any time, subject to the restrictions and limitations described below. If our stockholders sell, or the market perceives that our stockholders intend to sell, substantial amounts of our common stock in the public market, the market price of our common stock could decline significantly. All of our outstanding shares of common stock are available for sale in the public market, subject only to the restrictions of Rule 144 under the Securities Act in the case of our affiliates.
In addition, as of December 31, 2019, we have filed registration statements on Form S-8 under the Securities Act registering the issuance of an aggregate of 2,694,694 shares of common stock subject to options or other equity awards issued or reserved for future issuance under our equity incentive plans. Shares registered under these registration statements on Form S-8 are available for sale in the public market subject to vesting arrangements and exercise of options, the lock-up agreements described above and the restrictions of Rule 144 in the case of our affiliates.
Additionally, as of December 31, 2019, the holders of approximately 4,048,323 shares of our common stock, including 161,987 shares issuable upon the exercise of outstanding warrants to purchase shares of our common stock, or their transferees, have rights, subject to some conditions, to require us to file one or more registration statements covering their shares or to include their shares in registration statements that we may file for ourselves or other stockholders. If we were to register the resale of these shares, they could be freely sold in the public market. If these additional shares are sold, or if it is perceived that they will be sold, in the public market, the trading price of our common stock could decline.
Anti-takeover provisions under our charter documents and Delaware law could delay or prevent a change of control which could limit the market price of our securities and may prevent or frustrate attempts by our securityholders to replace or remove our current management.
50
Our amended and restated certificate of incorporation and amended and restated bylaws, contain provisions that could delay or prevent a change of control of our company or changes in our board of directors that our stockholders might consider favorable. Some of these provisions include:
|
•
|
a board of directors divided into three classes serving staggered three-year terms, such that not all members of the board will be elected at one time;
|
|
•
|
a prohibition on stockholder action through written consent, which requires that all stockholder actions be taken at a meeting of our stockholders;
|
|
•
|
a requirement that special meetings of stockholders be called only by the chairman of the board of directors, the chief executive officer, the president or by a majority of the total number of authorized directors;
|
|
•
|
advance notice requirements for stockholder proposals and nominations for election to our board of directors;
|
|
•
|
a requirement that no member of our board of directors may be removed from office by our stockholders except for cause and, in addition to any other vote required by law, upon the approval of not less than two-thirds of all outstanding shares of our voting stock then entitled to vote in the election of directors;
|
|
•
|
a requirement of approval of not less than two-thirds of all outstanding shares of our voting stock to amend any bylaws by stockholder action or to amend specific provisions of our certificate of incorporation; and
|
|
•
|
the authority of the board of directors to issue preferred stock on terms determined by the board of directors without stockholder approval and which preferred stock may include rights superior to the rights of the holders of common stock.
|
In addition, because we are incorporated in Delaware, we are governed by the provisions of Section 203 of the Delaware General Corporate Law, which may prohibit certain business combinations with stockholders owning 15% or more of our outstanding voting stock. These anti-takeover provisions and other provisions in our amended and restated certificate of incorporation and amended and restated bylaws could make it more difficult for stockholders or potential acquirers to obtain control of our board of directors or initiate actions that are opposed by the then-current board of directors and could also delay or impede a merger, tender offer or proxy contest involving our company. These provisions could also discourage proxy contests and make it more difficult for you and other stockholders to elect directors of your choosing or cause us to take other corporate actions you desire. Any delay or prevention of a change of control transaction or changes in our board of directors could cause the market price of our securities to decline.
If securities or industry analysts do not publish research or publish inaccurate or unfavorable research about our business, the price of our securities and trading volume could decline.
The trading market for our securities will depend in part on the research and reports that securities or industry analysts publish about us or our business. As a newly public company, we have only limited research coverage on our company by equity research analysts. If securities or industry analysts elect not to initiate or continue to provide coverage of our company, the trading price for our securities would likely be negatively impacted. If one or more of the analysts who covers us downgrades our securities or publishes inaccurate or unfavorable research about our business, the price of our securities may decline. If one or more of these analysts ceases coverage of our company or fails to publish reports on us regularly, demand for our securities could decrease, which might cause the price of our securities and trading volume to decline.
Our recurring losses, negative cash flows, financial covenant breaches, and significant accumulated deficit have raised substantial doubt regarding our ability to continue as a going concern.
Since inception, we have experienced recurring operating losses and negative cash flows from operating activities, have experienced financial covenant breaches, and have significant accumulated deficit. We expect to continue to generate operating losses and consume significant cash resources for the foreseeable future. Without additional financing, these conditions raise substantial doubt about our ability to continue as a going concern, meaning that we may be unable to continue operations for the foreseeable future or realize assets and discharge liabilities in the ordinary course of operations. As a result, our financial statements include an explanatory paragraph expressing substantial doubt about our ability to continue as a going concern. If we are unable to obtain sufficient funding, our business, prospects, financial condition and results of operations will be materially and adversely affected and we may be unable to continue as a going concern. If we are unable to continue as a going concern, we may have to liquidate our assets and may receive less than the value at which those assets are carried on our consolidated financial statements, and it is likely that investors will lose all or a part of their investment. Future reports from our independent registered public accounting firm may also contain statements expressing doubt about our ability to continue as a going concern. If we seek additional financing to fund our business activities in the future and there remains doubt about our ability to continue as a going concern, investors or other financing sources may be unwilling to provide additional funding on commercially reasonable terms or at all.
51
Our amended and restated certificate of incorporation provides that the Court of Chancery of the State of Delaware and, to the extent enforceable, the U.S. federal district courts will be the exclusive forums for substantially all disputes between us and our stockholders, which could limit our stockholders’ ability to obtain a favorable judicial forum for disputes with us or our directors, officers or other employees.
Our amended and restated certificate of incorporation provides that the Court of Chancery of the State of Delaware is the sole and exclusive forum for any derivative action or proceeding brought on our behalf, any action asserting a breach of fiduciary duty, any action asserting a claim against us arising under the Delaware General Corporation Law, our amended and restated certificate of incorporation or our amended and restated bylaws, or any action asserting a claim against us that is governed by the internal affairs doctrine. Our amended and restated certificate of incorporation further provides that the U.S. federal district courts will be the exclusive forum for resolving any complaint asserting a cause of action arising under the Securities Act, subject to and contingent upon a final adjudication in the State of Delaware of the enforceability of such exclusive forum provision. These choice of forum provisions may limit a stockholder’s ability to bring a claim in a judicial forum that it finds favorable for disputes with us or our directors, officers or other employees, which may discourage such lawsuits. If a court were to find either choice of forum provision contained in our amended and restated certificate of incorporation to be inapplicable or unenforceable in an action, we may incur additional costs associated with resolving such action in other jurisdictions, which could adversely affect our results of operations and financial condition.
For example, the Court of Chancery of the State of Delaware recently determined that the exclusive forum provision of federal district courts of the United States of America for resolving any complaint asserting a cause of action arising under the Securities Act is not enforceable. However, this decision may be reviewed and ultimately overturned by the Delaware Supreme Court. If this ultimate adjudication were to occur, we would enforce the federal district court exclusive forum provision in our amended and restated certificate of incorporation.
52
Item 1B. Unresolved Staff Comments.
None.
Item 2. Properties.
We lease approximately 35,823 square feet of office, laboratory, and manufacturing space at our headquarters in San Diego, California. Of this, 16,457 square feet is sub-leased under an agreement that expires on December 31, 2020. As of January 1, 2021, our lease obligation will be 19,216 square feet, with the lease expiring December 31, 2025. We believe that we will need additional space as we grow our operations, but believe that suitable additional or substitute space will be available to accommodate future growth of our business. We believe that our existing office, laboratory and manufacturing space will be sufficient to meet our needs in the interim.
Item 3. Legal Proceedings.
We are not currently a party to any material legal proceedings and we are not aware of any pending or threatened legal proceedings against us that could reasonably be expected to have a material adverse effect on our business, financial condition or results of operations.
Item 4. Mine Safety Disclosures.
None.
53
PART II
Item 5. Market for Registrant’s Common Equity, Related Stockholder Matters and Issuer Purchases of Equity Securities.
Market Information
Our common stock began trading on The Nasdaq Capital Market on September 21, 2018 under the symbol “BNGO.” Prior to such time, there was no public market for our common stock.
Common Stock holders
As of March 6, 2020, there were approximately 90 holders of record of our common stock. Certain shares of our common stock are held in “street” name and thus the actual number of beneficial owners of such shares is not known or included in the foregoing number.
Warrant holders
As of March 6, 2020, there were no holders of record of our warrants issued in our initial public offering, which are listed on the Nasdaq Stock Market LLC under the symbol “BNGOW” (“Warrants”). The Warrants are held in “street” name and thus the actual number of beneficial owners of such Warrants is not known.
Dividend Policy
We have never declared or paid cash dividends on our capital stock. We currently intend to retain any future earnings for use in the operation of our business and do not intend to declare or pay any cash dividends in the foreseeable future. Any further determination to pay dividends on our capital stock will be at the discretion of our board of directors, subject to applicable laws, and will depend on our financial condition, results of operations, capital requirements, general business conditions and other factors that our board of directors considers relevant.
Securities Authorized for Issuance under Equity Compensation Plans
The information required by this Item regarding equity compensation plans is incorporated herein by reference to Item 12 of Part III of this Annual Report on Form 10-K.
Purchases of Equity Securities by the Issuer or Affiliated Purchasers
None.
Recent Sales of Unregistered Securities
Not applicable.
Item 6. Selected Financial Data.
As a smaller reporting company, we are not required to provide information typically disclosed under this item.
54
Item 7. Management’s Discussion and Analysis of Financial Condition and Results of Operations.
You should read the following discussion and analysis of our financial condition and results of operations together in conjunction with our financial statements and the related notes included elsewhere in this Annual Report. Some of the information contained in this discussion and analysis or set forth elsewhere in this Annual Report, including information with respect to our plans and strategy for our business and expected financial results, includes forward-looking statements that involve risks and uncertainties. You should review the risks described in Part I, Item 1A Risk Factors and elsewhere in this Annual Report.
Overview
We are a genome analysis company providing tools and services based on our Saphyr system to scientists and clinicians conducting genetic research and patient testing. We developed and market the Saphyr system, a platform for ultra-sensitive and ultra-specific structural variation detection that enables researchers and clinicians to accelerate the search for new diagnostics and therapeutic targets and to streamline the evaluation of changes in chromosomes, which is known as cytogenetics. Our commercial offering includes the Saphyr system, which is comprised of an instrument, chip consumables, reagents and a suite of data analysis tools, and genome analysis services to provide access to data generated by the Saphyr system for researchers who prefer not to adopt the Saphyr system in their labs.
Structural variation refers to large-scale structural differences in the genomic DNA of one individual compared to another. Each structural variation involves the rearrangement or repetition of as few as several hundred to as many as tens of millions of DNA base pairs. Structural variations may be inherited or arise spontaneously and many structural variations cause genetic disorders and diseases. Until our commercial launch of the Saphyr system in February 2017, and since, we believe no other products existed or exist that could more comprehensively and cost and time-efficiently detect structural variation.
Our customers include researchers and clinicians who seek to uncover and understand the biological or clinical impact of genome variation to improve the diagnosis and treatment of patients with better clinical tests and new medicines or to replace existing cytogenetic tests that are expensive, slow and labor-intense, with a modern solution designed to simplify workflow and reduce cost and that has the potential to significantly increase diagnostic yields across the industry. Our customers also include researchers in non-human segments, such as agricultural genomics, seeking to advance their understanding of how structural variation impacts industrial applications of plants and animals.
Since our inception, we have raised net proceeds of $168.3 million to fund our operations from the issuance of equity and convertible promissory notes as well as various term loans grossing $43.5 million. We have incurred losses in each year since our inception. Our net losses were
$29.8 million
and
$18.5 million
for the years ended December 31, 2019 and 2018, respectively. As of December 31, 2019, we had an accumulated deficit of
$102.6 million
.
We expect to continue to incur significant expenses and operating losses as we:
|
•
|
expand our sales and marketing efforts to further commercialize our products;
|
|
•
|
continue research and development efforts to improve our existing products;
|
|
•
|
hire additional personnel;
|
|
•
|
enter into collaboration arrangements, if any;
|
|
•
|
add operational, financial and management information systems; and
|
|
•
|
incur increased costs as a result of operating as a public company.
|
Initial Public Offering
In August 2018, we completed our initial public offering of our common stock, or the IPO, in which we sold an aggregate of
3,864,000
units (each unit consisting of one share of our common stock and one warrant to purchase one share of our common stock) at a public offering price of $6.125 per unit for net proceeds of
$19.4 million
, after deducting underwriters' discounts and commissions of
$2.2 million
and other offering expenses of
$2.1 million
.
Follow-On Offering
On October 23, 2019, we completed an underwritten public offering of 10,013,600 shares of our common stock and, to certain investors, pre-funded warrants to purchase 10,923,958 shares of our common stock, and accompanying common warrants to purchase up to an aggregate of 20,937,558 shares of our common stock. Each share of common stock and pre-funded warrant to purchase one share of common stock was sold together with a common warrant to purchase one share of common stock. The public offering price of each share of common stock and accompanying common warrant was $0.86 and $0.859, respectively. The pre-funded warrants are immediately exercisable at a price of $0.001 per share of common stock. The common warrants are immediately exercisable at a price of $0.86 per share of common stock and will expire five years from the date of issuance. The shares of common stock and pre-funded
55
warrants, and the accompanying common warrants, were issued separately and were immediately separable upon issuance. We received gross proceeds, before deducting underwriting discounts and commissions and other offering expenses, of approximately $18.0 million.
Financial Overview
Revenue
We generate product revenue from sales of our instruments and consumables. We currently sell our products for research use only applications and our customers are primarily laboratories associated with academic and governmental research institutions, as well as pharmaceutical, biotechnology and contract research companies. Consumable revenue consists of sales of complete assays which are developed internally by us, plus sales of kits which contain all the elements necessary to run tests. Other revenue consists of warranty and other service-based revenue.
The following table presents our revenue for the periods indicated:
|
Year Ended December 31,
|
|||||||
|
2019
|
2018
|
||||||
|
Product revenue
|
$
|
9,474,444
|
|
$
|
11,463,173
|
|
|
|
Service and other revenue
|
655,064
|
|
537,562
|
|
|||
|
Total
|
$
|
10,129,508
|
|
$
|
12,000,735
|
|
|
The following table reflects total revenue by geography and as a percentage of total revenue, based on the billing address of our customers. North America consists of the United States and Canada. EMEIA consists of Europe, Middle East, India and Africa. Asia Pacific includes China, Japan, South Korea, Singapore and Australia.
|
Year Ended December 31,
|
|||||||||||||
|
2019
|
2018
|
||||||||||||
|
$
|
%
|
$
|
%
|
||||||||||
|
North America
|
$
|
5,030,267
|
|
50
|
%
|
$
|
4,594,814
|
|
38
|
%
|
|||
|
EMEIA
|
3,627,602
|
|
36
|
%
|
3,954,693
|
|
33
|
%
|
|||||
|
Asia Pacific
|
1,471,639
|
|
14
|
%
|
3,451,228
|
|
29
|
%
|
|||||
|
Total
|
$
|
10,129,508
|
|
100
|
%
|
$
|
12,000,735
|
|
100
|
%
|
|||
Cost of Revenue
Cost of revenue for our instruments and consumables includes cost from the manufacturer, raw material parts costs and associated freight, shipping and handling costs, contract manufacturer costs, salaries and other personnel costs, overhead and other direct costs related to those sales recognized as product revenue in the period. Cost of other revenue consists of salaries and other personnel costs and costs related to warranties and other costs of servicing equipment at customer sites.
Research and Development Expenses
Research and development expenses consist of salaries and other personnel costs, stock-based compensation, research supplies, third-party development costs for new products, materials for prototypes, and allocated overhead costs that include facility and other overhead costs. We have made substantial investments in research and development since our inception, and plan to continue to make investments in the future. Our research and development efforts have focused primarily on the tasks required to support development and commercialization of new and existing products. We believe that our continued investment in research and development is essential to our long-term competitive position.
Selling, General and Administrative Expenses
Selling, general and administrative expenses consist primarily of salaries and other personnel costs, and stock-based compensation for our sales and marketing, finance, legal, human resources and general management, as well as professional services, such as legal and accounting services.
56
Results of Operations
Comparison of the Years Ended December 31, 2019 and 2018
The following table sets forth our results of operations for the years ended December 31, 2019 and 2018:
|
Year Ended December 31,
|
Period-to-Period Change
|
|||||||||||||
|
2019
|
2018
|
$
|
%
|
|||||||||||
|
Product revenue
|
$
|
9,474,444
|
|
$
|
11,463,173
|
|
$
|
(1,988,729
|
)
|
(17
|
)%
|
|||
|
Service and other revenue
|
655,064
|
|
537,562
|
|
117,502
|
|
22
|
%
|
||||||
|
Total revenue
|
10,129,508
|
|
12,000,735
|
|
(1,871,227
|
)
|
(16
|
)%
|
||||||
|
Cost of product revenue
|
6,495,693
|
|
8,562,042
|
|
(2,066,349
|
)
|
(24
|
)%
|
||||||
|
Cost of service and other revenue
|
272,454
|
|
149,284
|
|
123,170
|
|
83
|
%
|
||||||
|
Total cost of revenue
|
6,768,147
|
|
8,711,326
|
|
(1,943,179
|
)
|
(22
|
)%
|
||||||
|
Research and development
|
9,080,891
|
|
9,484,163
|
|
(403,272
|
)
|
(4
|
)%
|
||||||
|
Selling, general and administrative
|
20,155,376
|
|
14,220,331
|
|
5,935,045
|
|
42
|
%
|
||||||
|
Total operating expenses
|
29,236,267
|
|
23,704,494
|
|
5,531,773
|
|
23
|
%
|
||||||
|
Loss from operations
|
(25,874,906
|
)
|
(20,415,085
|
)
|
(5,459,821
|
)
|
27
|
%
|
||||||
|
Interest expense
|
(2,286,196
|
)
|
(1,381,024
|
)
|
(905,172
|
)
|
66
|
%
|
||||||
|
Change in fair value of preferred stock warrants and expirations
|
—
|
|
3,991,081
|
|
(3,991,081
|
)
|
(100
|
)%
|
||||||
|
Loss on debt extinguishment
|
(1,333,496
|
)
|
(342,164
|
)
|
(991,332
|
)
|
290
|
%
|
||||||
|
Other expense
|
(299,424
|
)
|
(333,689
|
)
|
34,265
|
|
(10
|
)%
|
||||||
|
Loss before income taxes
|
(29,794,022
|
)
|
(18,480,881
|
)
|
(11,313,141
|
)
|
61
|
%
|
||||||
|
Provision for income taxes
|
(21,048
|
)
|
(15,511
|
)
|
(5,537
|
)
|
36
|
%
|
||||||
|
Net loss
|
$
|
(29,815,070
|
)
|
$
|
(18,496,392
|
)
|
$
|
(11,318,678
|
)
|
61
|
%
|
|||
Revenue
|
Year Ended December 31,
|
Period-to-Period Change
|
|||||||||||||
|
2019
|
2018
|
$
|
%
|
|||||||||||
|
Instrument revenue
|
$
|
6,762,463
|
|
$
|
8,441,325
|
|
$
|
(1,678,862
|
)
|
(20
|
)%
|
|||
|
Consumable revenue
|
2,711,981
|
|
3,021,848
|
|
(309,867
|
)
|
(10
|
)%
|
||||||
|
Product revenue
|
9,474,444
|
|
11,463,173
|
|
(1,988,729
|
)
|
(17
|
)%
|
||||||
|
Services and other revenue
|
655,064
|
|
537,562
|
|
117,502
|
|
22
|
%
|
||||||
|
Total revenue
|
$
|
10,129,508
|
|
$
|
12,000,735
|
|
$
|
(1,871,227
|
)
|
(16
|
)%
|
|||
Revenue decreased by
$1.9 million
, or
16%
to
$10.1 million
for the year ended December 31, 2019, as compared to
$12.0 million
for the same period in 2018. The decrease is primarily driven by our instrument sales year over year where the number units sold decreased 11% and average selling price (ASP) declined by 10%.
Cost of Revenue
Cost of revenue decreased by
$1.9 million
, or
22%
, to
$6.8 million
for the year ended December 31, 2019, as compared to
$8.7 million
for the same period in 2018. The decrease is due to an 11% decline in the number of instrument units sold year over year. In addition, in connection with the market launch of the Saphyr system, including the strategic shift towards minimal selling efforts of Irys, our first generation instrument, the Company recorded a charge of
$1.3 million
included in cost of revenue to write-down these instruments to net realizable value during the year ended December 31, 2018. We expect the cost of revenue per instrument to decrease in future periods as we benefit from economies of scale and modifications to the components and assembly over time.
57
Research and Development Expenses
Research and development expenses decreased by
$0.4 million
, or
4%
, to
$9.1 million
for the year ended December 31, 2019 as compared to
$9.5 million
for the same period in 2018. The decrease was primarily due to a decrease in foundry-related expenses to design our consumable production line. This was offset by increased employee compensation costs due to headcount additions to our Assays and Regents, Genome Informatics, and Engineering teams in an effort to expand our product offerings and innovation.
Selling, General and Administrative Expenses
Selling, general and administrative expenses increased
$5.9 million
, or
42%
, to
$20.2 million
for the year ended December 31, 2019 as compared to
$14.2 million
for the same period in 2018. We incurred increased employee compensation costs due to headcount additions to our global sales and marketing teams as well as back-office support teams to assist with the growth of our world-wide product distribution. In addition, we have incurred increased professional fees to support ongoing business operations and to comply with obligations associated with being a publicly-traded company. Lastly, we have increased our marketing and promotional spending in order to help drive sales. We expect our selling, general and administrative expenses to increase in future periods as the number of sales, technical support and marketing and administrative personnel grows and we continue to broaden our customer base and grow our business.
Interest Expense
Interest expense increased by
$0.9 million
, or
66%
, to
$2.3 million
for the year ended December 31, 2019, as compared to
$1.4 million
for the same period in 2018, driven by changes in our long-term debt. During that time, the principal balance of our debt increased from $10 million under the MidCap Financial CSA to $20 million under our Loan and Security Agreement with Innovatus Life Sciences Lending Fund I, LP, as further discussed below.
Change in Fair Value of Preferred Stock Warrants
Change in fair value of preferred stock warrants and expirations decreased to zero for the year ended December 31, 2019 compared to
$4.0 million
for the same period in 2018. Prior to the IPO, we estimated fair value of the convertible preferred stock warrants at the time of issuance and subsequent remeasurement using the Black-Scholes-Merton model at each reporting date. On the date of the IPO and going forward, all outstanding warrants are accounted for as equity and are not subject to remeasurement.
Loss on Debt Extinguishment
A loss on debt extinguishment of
$1.3 million
was recognized during the year ended December 31, 2019 resulting from the decision to pay-off the Credit and Security Agreement with MidCap Financial Trust prior to its maturity date. Similarly, we recognized a loss of
$0.3 million
for the same period in 2018 when we paid-off the Western Alliance LSA.
Liquidity and Capital Resources
Since our inception, we have incurred net losses and negative cash flows from operations. We incurred net losses of
$29.8 million
, and
$18.5 million
, and used
$29.5 million
and
$19.9 million
of cash from our operating activities for the years ended December 31, 2019 and 2018, respectively. As of December 31, 2019, we had an accumulated deficit of
$102.6 million
and cash and cash equivalents of
$17.3 million
.
Sources of Liquidity
Prior to August 2018, we financed our operations principally through private placements of our convertible preferred stock, borrowings from credit facilities, and revenue from our commercial operations.
In August 2018, we completed the IPO, in which we sold
3,864,000
units (each unit consisting of one share of common stock and one warrant to purchase one share of our common stock) at a public offering price of
$6.125
per unit for net cash proceeds of
$19.4 million
after deducting underwriters' discounts and commissions of $4.3 million.
In March 2019, we entered into a common stock purchase agreement, or the Aspire Purchase Agreement, with Aspire Capital Fund, LLC, or Aspire Capital, which provides that, subject to the terms, conditions and limitations thereto, Aspire Capital is committed to purchase up to an aggregate of $10.0 million of shares of our common stock. Upon execution of the Aspire Purchase Agreement, we sold to Aspire Capital 272,479 shares of common stock at $3.67 per share for proceeds of $1.0 million and Aspire Capital committed to purchase up to $9.0 million of additional shares of our common stock at our request from time to time during the 30 month period beginning on April 23, 2019 and at prices based on the market price at the time of each sale, subject to certain conditions. In consideration for entering into the Aspire Purchase Agreement and concurrently with the execution of the Aspire Purchase Agreement, we issued to
58
Aspire Capital 69,444 shares of our common stock. In December, 2019, pursuant to the terms of the Aspire Purchase Agreement, we sold 1,067,361 shares of our common stock to Aspire Capital, resulting in $1.1 million in gross proceeds to us.
In March 2019, we entered into a common stock purchase agreement, or the Innovatus Purchase Agreement, with certain entities affiliated with Innovatus Life Sciences Lending Fund I, LP, or the Innovatus Investors, pursuant to which we agreed to issue and sell to the Innovatus Investors 406,504 shares of our common stock at $3.69 per share for proceeds of $1.5 million. Upon execution of the Innovatus Purchase Agreement, we sold all of such shares to the Innovatus Investors.
In October 2019, we completed a follow-on public offering, which resulted in gross proceeds to us, before deducting underwriting discounts and commissions and other offering expenses, of approximately $18.0 million.
Preferred stock financings
Through the date of our IPO, we raised approximately $129.3 million in net equity proceeds through sales of our preferred stock.
Loan facilities
In March 2016, we entered into a new term Loan and Security Agreement with Western Alliance Bank, or the Western Alliance LSA, for $7.0 million.
In June 2018, we entered into a new Credit and Security Agreement with MidCap Financial Trust, or the MidCap Financial CSA, which provided a five-year, $15 million term loan facility. The MidCap Financial CSA was secured by a lien covering substantially all of our assets, including intellectual property. Upon executing the agreement, we drew down a $10.0 million term loan from the credit facility. The loan proceeds were used to repay the outstanding $7.0 million balance on the Western Alliance LSA.
In March 2019, we entered into a new Loan and Security Agreement, or the Innovatus LSA, with Innovatus Life Sciences Lending Fund I, LP, or Innovatus, and certain lenders, which provides for borrowings up to $25.0 million pursuant to certain term loans and an additional $5.0 million under a revolving credit line. The Innovatus LSA is secured by a lien covering substantially all of our assets, including our intellectual property. Also in March 2019, we drew down $20.0 million in term loans from the Innovatus LSA. These loan proceeds were used to repay the outstanding balance under the MidCap Financial CSA. Beginning in May 2019, we began drawing down on the revolving credit line.
See Note 7 to our financial statements for a discussion of terms and provisions to the Western Alliance LSA, the Midcap Financial CSA, and the Innovatus LSA.
Note purchase agreement
In February 2018, we entered into a Note Purchase Agreement with various investors, or the Investors, pursuant to which we agreed to sell the Investors 8% Convertible Promissory Notes, or the Convertible Notes, in the original principal amount up to approximately $16.0 million. In the second quarter 2018, we amended the Note Purchase Agreement to, among other things, increase the principal amount available for issuance under the Note Purchase Agreement to approximately $19.4 million. In August 2018, the outstanding convertible promissory notes of $14.3 million and accrued interest was converted into 3,239,294 shares of common stock upon completion of the IPO.
Cash Flows
We derive cash flows from operations primarily from the sale of our products and services. Our cash flows from operating activities are also significantly influenced by our use of cash for operating expenses to support the growth of our business. We have historically experienced negative cash flows from operating activities as we have developed our technology, expanded our business and built our infrastructure and this may continue in the future. The following table sets forth the cash flow from operating, investing and financing activities for the periods presented:
|
Year Ended December 31,
|
|||||||
|
2019
|
2018
|
||||||
|
Net cash provided by (used in):
|
|||||||
|
Operating activities
|
$
|
(29,529,720
|
)
|
$
|
(19,943,847
|
)
|
|
|
Investing activities
|
(61,056
|
)
|
(331,716
|
)
|
|||
|
Financing activities
|
30,379,420
|
|
35,776,395
|
|
|||
Operating Activities
59
Net cash used in operating activities was
$29.5 million
during the year ended December 31, 2019 as compared to
$19.9 million
during the year ended December 31, 2018. The increase in cash used in operating activities of
$9.6 million
is attributed to increased headcount across all business segments, increased professional fees to support ongoing business operations and to comply with obligations associated with being a publicly-traded company, and increased investments in marketing and promotions. These increases are partly offset by lower facilities expense as a result of us subleasing one of our leased facilities in the fourth quarter of 2018.
Investing Activities
Historically, our primary investing activities have consisted of capital expenditures for the purchase of capital equipment to support our expanding infrastructure. We expect to continue to incur additional costs for capital expenditures related to these efforts in future periods. We did not use a significant amount of cash in investing activities during the year ended December 31, 2019 as well as for the same period in 2018.
Financing Activities
Historically, we have financed our operations principally through private placements of our convertible preferred stock and promissory notes and borrowings from credit facilities, as well as gross profits from our commercial operations. In August 2018, we completed the IPO. Net cash provided by financing activities was
$30.4 million
during the year ended December 31, 2019 as compared to
$35.8 million
during the year ended December 31, 2018, a decrease of
$5.4 million
. During the year ended December 31, 2019, we had net proceeds of $11.0 million from the Innovatus LSA and Innovatus Purchase Agreement, $2.5 million from the Aspire Purchase Agreement, and net proceeds from our follow-on public offering of $16.0 million. During the same period of 2018, we had net proceeds from the issuance of convertible notes of $14.3 million, IPO net proceeds of $19.4 million, and net debt proceeds of $2.0 million.
Capital Resources
We performed an analysis of our ability to continue as a going concern. We believe, based on our current business plan, that our existing cash and cash equivalents will be sufficient to fund our operations and obligations through the second quarter of 2020, but will not be sufficient to fund our operations and obligations throughout the remainder of the year. We plan to continue to fund our operations through cash and cash equivalents on hand, as well as through public or private equity or debt financings, strategic collaborations, licensing arrangements, asset sales, or other arrangements. There can be no assurance that additional funds will be available when needed from any source or, if available, will be available on terms that are acceptable to us. Even if we raise additional capital, we may also be required to modify, delay or abandon some of our plans which could have a material adverse effect on our business, operating results and financial condition and our ability to achieve our intended business objectives. Any of these actions could materially harm our business, results of operations and future prospects.
Off-Balance Sheet Arrangements
We did not have during the periods presented, and we do not currently have, any off-balance sheet arrangements, as defined under SEC rules, and similarly did not and do not have any holdings in variable interest entities.
Recent Accounting Pronouncements
See Note 2 to our condensed consolidated financial statements included elsewhere in this Annual Report on for information concerning recent accounting pronouncements.
60
Critical Accounting Policies and Estimates
Our management’s discussion and analysis of our financial condition and results of operations is based on our consolidated financial statements, which have been prepared in accordance with generally accepted accounting principles in the United States. The preparation of our consolidated financial statements requires us to make estimates and assumptions that affect the reported amounts of assets, liabilities and expenses and the disclosure of contingent assets and liabilities in our consolidated financial statements and accompanying notes. We evaluate these estimates and judgments on an ongoing basis. We base our estimates on historical experience and on various other factors that we believe are reasonable under the circumstances, the results of which form the basis for making judgments about the carrying value of assets and liabilities that are not readily apparent from other sources. Actual results may differ from these estimates under different assumptions or conditions.
While our significant accounting policies are more fully described in Note 2 to our consolidated financial statements appearing elsewhere in this Annual Report, we believe that the following accounting policies are the most critical for fully understanding and evaluating our financial condition and results of operations.
Revenue Recognition
We generate revenue from the sale of our products, primarily our Saphyr system and related consumables, and related services, which are primarily support, repairs and maintenance services on the instruments. Our products are sold primarily through a direct sales force, and within international markets, there is more reliance on distributors. Revenue is recorded net of sales tax. The following table provides revenue from contracts with customers by business and geographic region on a disaggregated basis:
|
Year Ended December 31,
|
|||||||||||||
|
2019
|
2018
|
||||||||||||
|
$
|
%
|
$
|
%
|
||||||||||
|
North America
|
$
|
5,030,267
|
|
50
|
%
|
$
|
4,594,814
|
|
38
|
%
|
|||
|
EMEIA
|
3,627,602
|
|
36
|
%
|
3,954,693
|
|
33
|
%
|
|||||
|
Asia Pacific
|
1,471,639
|
|
14
|
%
|
3,451,228
|
|
29
|
%
|
|||||
|
Total
|
$
|
10,129,508
|
|
100
|
%
|
$
|
12,000,735
|
|
100
|
%
|
|||
For the years ended
December 31, 2019
and
2018
, the United States represented 47% and
38%
, and China represented 5% and
17%
, respectively of total revenue.
We consider revenue to be earned when all of the following criteria are met: we have a contract with a customer that creates enforceable rights and obligations; promised products or services are identified; the transaction price, or the amount we expect to receive, including an estimate of uncertain amounts subject to a constraint to ensure revenue is not recognized in an amount that would result in a significant reversal upon resolution of the uncertainty, is determinable; and we have transferred control of the promised items to the customer. A performance obligation is a promise in a contract to transfer a distinct good or service to the customer, and is the unit of account in the contract. The transaction price for the contract is measured as the amount of consideration we expect to receive in exchange for the goods and services expected to be transferred. A contract's transaction price is allocated to each distinct performance obligation and recognized as revenue when, or as, control of the distinct good or service is transferred.
Transfer of control for our products is generally at shipment or delivery, depending on contractual terms, but occurs when title and risk of loss transfers to the customer which represents the point in time when the customer obtains the use of and substantially all of the remaining benefit of the product. As such our performance obligation related to product sales is satisfied at a point in time.
Revenue from support and maintenance contracts and extended warranties are recognized over time based on the contract term, which represents a faithful depiction of the transfer of goods and services given the stand-ready nature of the performance obligations. Service revenue related to repairs and customer sample evaluations are recognized as the services are performed based on the specific nature of the service.
We recognize a receivable when it has an unconditional right to payment, which is generally at the time of shipment of consumables and instruments, including any extended warranties, and at the time when services are rendered. Payment terms are typically 30 days for sales to customers in the United States but may be longer in international markets. We treat shipping and handling costs performed after a customer obtains control of the good as a fulfillment cost and record these costs within selling, general and administrative expenses, less any amounts reimbursed by the customer, when the corresponding revenue is recognized.
61
Some of our contracts have multiple performance obligations. For contracts with multiple performance obligations,we allocate the transaction price to each performance obligation using our best estimate of the standalone selling price of each distinct good or service in the contract. We determine our best estimate of standalone selling price using average selling prices over 3- to 12-month periods of data depending on the products or nature of the services coupled with current market considerations. If the product or service does not have a history of sales or if sales volume is not sufficient, including instruments under reagent rental agreements, we have estimated the standalone selling price to be the incremental sales price generally charged for consumables to customers under the reagent rental agreements in relation to amounts charged to other customers.
Variable Consideration
We exercise judgment in estimating variable consideration, if any, which would be recorded as a reduction to revenue. To the extent the transaction price includes variable consideration, we apply judgment in constraining the estimated variable consideration due to factors that may cause reversal of revenue recognized. We evaluate constraints based on our historical and projected experience with similar customer contracts.
Our contracts typically do not provide for product returns or refunds. In general, estimates of variable consideration and constraints are not material to our financial statements.
Remaining Performance Obligations
As of December 31, 2019, the estimated revenue expected to be recognized in the future related to performance obligations that are unsatisfied was approximately
$540,140
. These remaining performance obligations primarily relate to extended warranty and support and maintenance obligations. We expect to recognize approximately 66% of this amount as revenue in 2020, 31% in 2021 and 3% in 2022.
Contract Assets and Liabilities
We disclose accounts receivable separately in the consolidated balance sheets at their net realizable value. Contract assets primarily relate to our conditional right to consideration for work completed but not billed at the reporting date. Contract assets at the beginning and end of the period, as well as the changes in the balance, were immaterial.
Contract liabilities primarily relate to payments received from customers in advance of performance under the contract. We record a contract liability, or deferred revenue, when we have an obligation to provide service, and to a much lesser extent product, to the customer and payment is received or due in advance of performance. Deferred revenue primarily relates to support and maintenance contracts and extended warranty obligations. Contract liabilities are classified as other current liabilities and other long-term liabilities on the consolidated balance sheets. We recognized revenue of $270,171 and $74,342 during the years ended December 31, 2019 and 2018, respectively, that was included in the contract liability balance at the end of the previous year.
Distributor Transactions
In certain markets, we sell products and provide services to customers through distributors that specialize in life sciences products. In cases where the product is delivered to a distributor, revenue recognition generally occurs when title transfers to the distributor. The terms of sales transactions through distributors are generally consistent with the terms of direct sales to customers and do not contain return rights. Distributor sales transactions typically differ from direct customer sales as they do not require our services to install the instrument at the end customer or perform the services for the customer that are beyond our standard warranty in the first year following the sale. These transactions are accounted for in accordance with our revenue recognition policy described herein.
Stock-Based Compensation Expense
We recognize compensation expense for employees based on an estimated grant date fair value using the Black-Scholes option-pricing method. We have elected to account for forfeitures as they occur.
The inputs for the Black-Scholes valuation model require management’s significant assumptions. Prior to our IPO, the common share price was determined by our board based on recent prices of common shares sold in private offerings prior to the IPO. Subsequent to the IPO, the common share price was determined by using the quoted price on the grant date. The risk-free interest rates were based on the rate for U.S. Treasury securities at the date of grant with maturity dates approximately equal to the expected life at the grant date. The expected life was based on the simplified method in accordance with the SEC Staff Accounting Bulletin Nos. 107 and 110. The expected volatility was estimated based on historical volatility information of peer companies that are publicly available.
62
JOBS Act
We are an “emerging growth company,” as defined in the Jumpstart Our Business Startups Act, or JOBS Act. Under the JOBS Act, an emerging growth company can take advantage of an extended transition period for complying with new or revised accounting standards. This provision allows an emerging growth company to delay the adoption of new or revised accounting standards that have different transition dates for public and private companies until those standards would otherwise apply to private companies. We have elected to use this extended transition period. As a result of this election, our timeline to comply with these standards will in many cases be delayed as compared to other public companies that are not eligible to take advantage of this election or have not made this election. Therefore, our financial statements may not be comparable to those of companies that comply with the public company effective dates for these standards.
For so long as we are an emerging growth company we expect that:
|
•
|
we will present only two years of audited consolidated financial statements, plus unaudited consolidated condensed financial statements for any interim period, and related management’s discussion and analysis of financial condition and results of operations in our initial registration statement;
|
|
•
|
we will avail ourselves of the exemption from the requirement to obtain an attestation and report from our auditors on the assessment of our internal control over financial reporting pursuant to the Sarbanes-Oxley Act;
|
|
•
|
we will avail ourselves of the extended transition periods available to emerging growth companies under the JOBS Act for complying with new or revised accounting standards; and
|
|
•
|
we will provide less extensive disclosure about our executive compensation arrangements.
|
We will remain an emerging growth company for up to five years, although we will cease to be an “emerging growth company” upon the earliest of: (1) December 31, 2023, which is the end of the fiscal year following the fifth anniversary of the closing of our IPO, (2) the last day of the first fiscal year in which our annual revenues are $1.07 billion or more, (3) the date on which we have, during the previous rolling three-year period, issued more than $1.0 billion in non-convertible debt securities, and (4) the date on which we are deemed to be a “large accelerated filer” as defined in the Exchange Act.
Item 7A. Quantitative and Qualitative Disclosures About Market Risk.
As a smaller reporting company, we are not required to provide information typically disclosed under this item.
63
Item 8. Financial Statements and Supplementary Data.
Index to Consolidated Financial Statements
|
Pages
|
|
64
Report of Independent Registered Public Accounting Firm
To the Stockholders and Board of Directors of Bionano Genomics, Inc.
Opinion on the Financial Statements
We have audited the accompanying consolidated balance sheets of Bionano Genomics, Inc. and its subsidiaries (the “Company”), as of December 31, 2019 and 2018 and the related consolidated statements of operations, consolidated statements of stockholders’ equity, and consolidated statements of cash flows for each of the two years in the period ended December 31, 2019 and the related notes (collectively referred to as the “financial statements”). In our opinion, the financial statements present fairly, in all material respects, the financial position of the Company as of December 31, 2019 and 2018, and the results of its operations and its cash flows for each of the two years in the period ended December 31, 2019, in conformity with accounting principles generally accepted in the United States of America.
Going Concern
The accompanying financial statements have been prepared assuming that the Company will continue as a going concern. As discussed in Note 1 to the financial statements, the Company has recurring losses from operations and is not in compliance with the covenants included in its loan agreement with its lender that raise substantial doubt about its ability to continue as a going concern. Management's plans in regard to these matters are also described in Note 1. The financial statements do not include any adjustments that might result from the outcome of this uncertainty.
Basis for Opinion
These financial statements are the responsibility of the Company’s management. Our responsibility is to express an opinion on the Company’s financial statements based on our audits. We are a public accounting firm registered with the Public Company Accounting Oversight Board (United States) (PCAOB) and are required to be independent with respect to the Company in accordance with the U.S. federal securities laws and the applicable rules and regulations of the Securities and Exchange Commission and the PCAOB.
We conducted our audits in accordance with the standards of the PCAOB. Those standards require that we plan and perform the audit to obtain reasonable assurance about whether the financial statements are free of material misstatement, whether due to error or fraud. The Company is not required to have, nor were we engaged to perform, an audit of its internal control over financial reporting. As part of our audits, we are required to obtain an understanding of internal control over financial reporting but not for the purpose of expressing an opinion on the effectiveness of the Company’s internal control over financial reporting. Accordingly, we express no such opinion.
Our audits included performing procedures to assess the risks of material misstatement of the financial statements, whether due to error or fraud, and performing procedures that respond to those risks. Such procedures included examining, on a test basis, evidence regarding the amounts and disclosures in the financial statements. Our audits also included evaluating the accounting principles used and significant estimates made by management, as well as evaluating the overall presentation of the financial statements. We believe that our audits provide a reasonable basis for our opinion.
/s/ Deloitte & Touche, LLP
San Diego, California
March 10, 2020
We have served as the Company’s auditor since 2017.
65
Bionano Genomics, Inc.
Consolidated Balance Sheets
|
December 31,
|
|||||||
|
2019
|
2018
|
||||||
|
Assets
|
|||||||
|
Current assets:
|
|||||||
|
Cash and cash equivalents
|
$
|
17,311,373
|
|
$
|
16,522,729
|
|
|
|
Accounts receivable, net
|
6,333,963
|
|
4,514,333
|
|
|||
|
Inventory
|
3,443,559
|
|
1,068,557
|
|
|||
|
Prepaid expenses and other current assets
|
1,169,346
|
|
919,500
|
|
|||
|
Total current assets
|
28,258,241
|
|
23,025,119
|
|
|||
|
Property and equipment, net
|
1,949,625
|
|
1,777,302
|
|
|||
|
Total assets
|
$
|
30,207,866
|
|
$
|
24,802,421
|
|
|
|
Liabilities and stockholders’ equity
|
|||||||
|
Current liabilities:
|
|||||||
|
Accounts payable
|
$
|
2,699,153
|
|
$
|
1,351,736
|
|
|
|
Accrued expenses
|
3,225,431
|
|
2,900,129
|
|
|||
|
Contract liabilities
|
357,492
|
|
270,998
|
|
|||
|
Current portion of long-term debt
|
20,084,945
|
|
—
|
|
|||
|
Total current liabilities
|
26,367,021
|
|
4,522,863
|
|
|||
|
Long-term debt, net of current portion
|
—
|
|
9,029,374
|
|
|||
|
Long-term contract liabilities
|
182,648
|
|
304,467
|
|
|||
|
Other non-current liabilities
|
44,479
|
|
808,366
|
|
|||
|
Total liabilities
|
26,594,148
|
|
14,665,070
|
|
|||
|
Commitments and contingencies (Note 9)
|
|
|
|
|
|||
|
Stockholders’ equity:
|
|
|
|||||
|
Common stock, $0.0001 par value, 200,000,000 shares authorized at December 31, 2019 and December 31, 2018; 34,274,469 and 10,055,072 shares issued and outstanding at December 31, 2019 and December 31, 2018, respectively
|
3,427
|
|
1,004
|
|
|||
|
Preferred stock, $0.0001 par value; 10,000,000 shares authorized; no shares issued and outstanding as of December 31, 2019 and 2018
|
—
|
|
—
|
|
|||
|
Additional paid-in capital
|
106,187,789
|
|
82,898,775
|
|
|||
|
Accumulated deficit
|
(102,577,498
|
)
|
(72,762,428
|
)
|
|||
|
Total stockholders’ equity
|
3,613,718
|
|
10,137,351
|
|
|||
|
Total liabilities and stockholders’ equity
|
$
|
30,207,866
|
|
$
|
24,802,421
|
|
|
See accompanying notes to the consolidated financial statements.
66
Bionano Genomics, Inc.
Consolidated Statements of Operations
|
Year Ended
December 31, |
|||||||
|
2019
|
2018
|
||||||
|
Revenue:
|
|||||||
|
Product revenue
|
$
|
9,474,444
|
|
$
|
11,463,173
|
|
|
|
Service and other revenue
|
655,064
|
|
537,562
|
|
|||
|
Total revenue
|
10,129,508
|
|
12,000,735
|
|
|||
|
Cost of revenue:
|
|||||||
|
Cost of product revenue
|
6,495,693
|
|
8,562,042
|
|
|||
|
Cost of service and other revenue
|
272,454
|
|
149,284
|
|
|||
|
Total cost of revenue
|
6,768,147
|
|
8,711,326
|
|
|||
|
Operating expenses:
|
|||||||
|
Research and development
|
9,080,891
|
|
9,484,163
|
|
|||
|
Selling, general and administrative
|
20,155,376
|
|
14,220,331
|
|
|||
|
Total operating expenses
|
29,236,267
|
|
23,704,494
|
|
|||
|
Loss from operations
|
(25,874,906
|
)
|
(20,415,085
|
)
|
|||
|
Other income (expense)
|
|||||||
|
Interest expense
|
(2,286,196
|
)
|
(1,381,024
|
)
|
|||
|
Change in fair value of preferred stock warrants and expirations
|
—
|
|
3,991,081
|
|
|||
|
Loss on debt extinguishment
|
(1,333,496
|
)
|
(342,164
|
)
|
|||
|
Other expenses
|
(299,424
|
)
|
(333,689
|
)
|
|||
|
Total other income (expenses)
|
(3,919,116
|
)
|
1,934,204
|
|
|||
|
Loss before income taxes
|
(29,794,022
|
)
|
(18,480,881
|
)
|
|||
|
Provision for income taxes
|
(21,048
|
)
|
(15,511
|
)
|
|||
|
Net loss
|
$
|
(29,815,070
|
)
|
$
|
(18,496,392
|
)
|
|
|
Net loss per share, basic and diluted
|
$
|
(1.99
|
)
|
$
|
(2.61
|
)
|
|
|
Weighted-average common shares outstanding, basic and diluted
|
14,977,901
|
|
7,077,126
|
|
|||
See accompanying notes to the consolidated financial statements.
67
Bionano Genomics, Inc.
Consolidated Statements of Convertible Preferred Stock and Stockholders’ Equity
|
Series A
|
Series B
|
Series B-1
|
Series C
|
Series D
|
Series D-1
|
Additional
Paid-in
Capital
|
Accumulated
Deficit
|
Total
Stockholders' Equity
|
|||||||||||||||||||||||||||||||||||||||||||||||||||||
|
Convertible Preferred
Stock |
Convertible Preferred
Stock |
Convertible Preferred
Stock |
Convertible Preferred
Stock |
Convertible Preferred
Stock |
Convertible Preferred
Stock |
Common Stock
|
|||||||||||||||||||||||||||||||||||||||||||||||||||||||
|
Shares
|
Amount
|
Shares
|
Amount
|
Shares
|
Amount
|
Shares
|
Amount
|
Shares
|
Amount
|
Shares
|
Amount
|
Shares
|
Amount
|
||||||||||||||||||||||||||||||||||||||||||||||||
|
Balance at January 1, 2018
|
345,587
|
|
$
|
61,847
|
|
8,058,170
|
|
$
|
842,845
|
|
3,437,950
|
|
$
|
359,593
|
|
23,357,047
|
|
$
|
5,547,841
|
|
20,652,486
|
|
$
|
4,838,379
|
|
66,141,257
|
|
$
|
31,359,632
|
|
77,257
|
|
$
|
8
|
|
$
|
4,038,817
|
|
$
|
(54,266,036
|
)
|
$
|
(50,227,211
|
)
|
|||||||||||||||||
|
Net loss
|
—
|
|
—
|
|
—
|
|
—
|
|
—
|
|
—
|
|
—
|
|
—
|
|
—
|
|
—
|
|
—
|
|
—
|
|
—
|
|
—
|
|
—
|
|
(18,496,392
|
)
|
(18,496,392
|
)
|
|||||||||||||||||||||||||||
|
Stock-based compensation expense
|
—
|
|
—
|
|
—
|
|
—
|
|
—
|
|
—
|
|
—
|
|
—
|
|
—
|
|
—
|
|
—
|
|
—
|
|
—
|
|
—
|
|
1,193,873
|
|
—
|
|
1,193,873
|
|
|||||||||||||||||||||||||||
|
Stock option exercises
|
—
|
|
—
|
|
—
|
|
—
|
|
—
|
|
—
|
|
—
|
|
—
|
|
—
|
|
—
|
|
—
|
|
—
|
|
2,062
|
|
—
|
|
3,499
|
|
—
|
|
3,499
|
|
|||||||||||||||||||||||||||
|
IPO, net of offering costs
|
—
|
|
—
|
|
—
|
|
—
|
|
—
|
|
—
|
|
—
|
|
—
|
|
—
|
|
—
|
|
—
|
|
—
|
|
3,864,000
|
|
386
|
|
19,389,592
|
|
—
|
|
19,389,978
|
|
|||||||||||||||||||||||||||
|
Conversion of preferred stock upon IPO
|
(345,587
|
)
|
(61,847
|
)
|
(8,058,170
|
)
|
(842,845
|
)
|
(3,437,950
|
)
|
(359,593
|
)
|
(23,357,047
|
)
|
(5,547,841
|
)
|
(20,652,486
|
)
|
(4,838,379
|
)
|
(66,141,257
|
)
|
(31,359,632
|
)
|
2,850,280
|
|
285
|
|
43,009,852
|
|
—
|
|
43,010,137
|
|
|||||||||||||||||||||||||||
|
Conversion of convertible note upon IPO
|
—
|
|
—
|
|
—
|
|
—
|
|
—
|
|
—
|
|
—
|
|
—
|
|
—
|
|
—
|
|
—
|
|
—
|
|
3,239,294
|
|
323
|
|
14,898,004
|
|
—
|
|
14,898,327
|
|
|||||||||||||||||||||||||||
|
Conversion of preferred stock warrants into common stock warrants
|
—
|
|
—
|
|
—
|
|
—
|
|
—
|
|
—
|
|
—
|
|
—
|
|
—
|
|
—
|
|
—
|
|
—
|
|
—
|
|
—
|
|
84,676
|
|
—
|
|
84,676
|
|
|||||||||||||||||||||||||||
|
Issue warrants for services
|
—
|
|
—
|
|
—
|
|
—
|
|
—
|
|
—
|
|
—
|
|
—
|
|
—
|
|
—
|
|
—
|
|
—
|
|
—
|
|
—
|
|
165,000
|
|
—
|
|
165,000
|
|
|||||||||||||||||||||||||||
|
Issuance of common stock for Employee Stock Purchase Plan
|
—
|
|
—
|
|
—
|
|
—
|
|
—
|
|
—
|
|
—
|
|
—
|
|
—
|
|
—
|
|
—
|
|
—
|
|
22,179
|
|
2
|
|
115,462
|
|
—
|
|
115,464
|
|
|||||||||||||||||||||||||||
|
December 31, 2018
|
—
|
|
$
|
—
|
|
—
|
|
$
|
—
|
|
—
|
|
$
|
—
|
|
—
|
|
$
|
—
|
|
—
|
|
$
|
—
|
|
—
|
|
$
|
—
|
|
10,055,072
|
|
$
|
1,004
|
|
$
|
82,898,775
|
|
$
|
(72,762,428
|
)
|
$
|
10,137,351
|
|
|||||||||||||||||
|
Net loss
|
—
|
|
—
|
|
—
|
|
—
|
|
—
|
|
—
|
|
—
|
|
—
|
|
—
|
|
—
|
|
—
|
|
—
|
|
—
|
|
—
|
|
—
|
|
(29,815,070
|
)
|
(29,815,070
|
)
|
|||||||||||||||||||||||||||
|
Issue common stock, net of issuance costs
|
—
|
|
—
|
|
—
|
|
—
|
|
—
|
|
—
|
|
—
|
|
—
|
|
—
|
|
—
|
|
—
|
|
—
|
|
11,829,388
|
|
1,183
|
|
10,958,352
|
|
—
|
|
10,959,535
|
|
|||||||||||||||||||||||||||
|
Stock-based compensation expense
|
—
|
|
—
|
|
—
|
|
—
|
|
—
|
|
—
|
|
—
|
|
—
|
|
—
|
|
—
|
|
—
|
|
—
|
|
—
|
|
—
|
|
1,346,023
|
|
—
|
|
1,346,023
|
|
|||||||||||||||||||||||||||
|
Stock option Exercises
|
—
|
|
—
|
|
—
|
|
—
|
|
—
|
|
—
|
|
—
|
|
—
|
|
—
|
|
—
|
|
—
|
|
—
|
|
50,665
|
|
6
|
|
65,858
|
|
—
|
|
65,864
|
|
|||||||||||||||||||||||||||
|
Issue stock for covenant waiver
|
—
|
|
—
|
|
—
|
|
—
|
|
—
|
|
—
|
|
—
|
|
—
|
|
—
|
|
—
|
|
—
|
|
—
|
|
572,917
|
|
57
|
|
504,110
|
|
—
|
|
504,167
|
|
|||||||||||||||||||||||||||
|
Reduce warrant exercise price for covenant waiver
|
—
|
|
—
|
|
—
|
|
—
|
|
—
|
|
—
|
|
—
|
|
—
|
|
—
|
|
—
|
|
—
|
|
—
|
|
—
|
|
—
|
|
45,787
|
|
—
|
|
45,787
|
|
|||||||||||||||||||||||||||
|
Issuance of common stock for Employee Stock Purchase Plan
|
—
|
|
—
|
|
—
|
|
—
|
|
—
|
|
—
|
|
—
|
|
—
|
|
—
|
|
—
|
|
—
|
|
—
|
|
87,969
|
|
9
|
|
141,697
|
|
—
|
|
141,706
|
|
|||||||||||||||||||||||||||
68
|
Issue common stock for debt
|
—
|
|
—
|
|
—
|
|
—
|
|
—
|
|
—
|
|
—
|
|
—
|
|
—
|
|
—
|
|
—
|
|
—
|
|
—
|
|
—
|
|
201,789
|
|
—
|
|
201,789
|
|
|||||||||||||||||||||||||||
|
Issue warrants for debt
|
—
|
|
—
|
|
—
|
|
—
|
|
—
|
|
—
|
|
—
|
|
—
|
|
—
|
|
—
|
|
—
|
|
—
|
|
—
|
|
—
|
|
629,830
|
|
—
|
|
629,830
|
|
|||||||||||||||||||||||||||
|
Stock warrant exercises
|
—
|
|
—
|
|
—
|
|
—
|
|
—
|
|
—
|
|
—
|
|
—
|
|
—
|
|
—
|
|
—
|
|
—
|
|
11,678,458
|
|
1,168
|
|
9,395,568
|
|
—
|
|
9,396,736
|
|
|||||||||||||||||||||||||||
|
December 31, 2019
|
—
|
|
$
|
—
|
|
—
|
|
$
|
—
|
|
—
|
|
$
|
—
|
|
—
|
|
$
|
—
|
|
—
|
|
$
|
—
|
|
—
|
|
$
|
—
|
|
34,274,469
|
|
$
|
3,427
|
|
$
|
106,187,789
|
|
$
|
(102,577,498
|
)
|
$
|
3,613,718
|
|
|||||||||||||||||
See accompanying notes to the consolidated financial statements.
69
Bionano Genomics, Inc.
Consolidated Statements of Cash Flows
|
Year Ended
December 31, |
|||||||
|
2019
|
2018
|
||||||
|
Operating activities:
|
|||||||
|
Net loss
|
$
|
(29,815,070
|
)
|
$
|
(18,496,392
|
)
|
|
|
Adjustments to reconcile net loss to cash used in operating activities:
|
|||||||
|
Depreciation and amortization expense
|
1,127,850
|
|
1,320,521
|
|
|||
|
Change in fair value of preferred stock warrants and expirations
|
—
|
|
(3,991,081
|
)
|
|||
|
Non-cash interest
|
883,269
|
|
750,474
|
|
|||
|
Stock-based compensation
|
1,346,023
|
|
1,193,873
|
|
|||
|
Provision for bad debt expense
|
554,867
|
|
(262,000
|
)
|
|||
|
Inventory impairment
|
—
|
|
1,287,000
|
|
|||
|
Loss on debt extinguishment
|
1,333,496
|
|
342,164
|
|
|||
|
(Gain) loss on disposal of fixed assets
|
11,918
|
|
—
|
|
|||
|
Fair value of warrants issued for services
|
—
|
|
165,000
|
|
|||
|
Other items
|
—
|
|
115,464
|
|
|||
|
Changes in operating assets and liabilities:
|
|||||||
|
Accounts receivable
|
(2,374,497
|
)
|
(900,119
|
)
|
|||
|
Inventory
|
(3,641,017
|
)
|
(418,984
|
)
|
|||
|
Prepaid expenses and other current assets
|
(245,046
|
)
|
152,012
|
|
|||
|
Accounts payable
|
1,362,397
|
|
(954,377
|
)
|
|||
|
Accrued expenses and contract liabilities
|
(73,910
|
)
|
(247,402
|
)
|
|||
|
Net cash used in operating activities
|
(29,529,720
|
)
|
(19,943,847
|
)
|
|||
|
Investing activities:
|
|||||||
|
Purchases of property and equipment
|
(61,056
|
)
|
(331,716
|
)
|
|||
|
Net cash used in investing activities
|
(61,056
|
)
|
(331,716
|
)
|
|||
|
Financing activities:
|
|||||||
|
Proceeds from issuance of debt, net of issuance costs
|
19,134,424
|
|
23,830,489
|
|
|||
|
Proceeds from borrowing from line of credit
|
5,113,072
|
|
—
|
|
|||
|
Repayments of borrowing from line of credit
|
(3,615,117
|
)
|
—
|
|
|||
|
Repayment of long-term debt
|
(10,812,000
|
)
|
(7,447,571
|
)
|
|||
|
Proceeds from sale of common stock, net of offering costs
|
19,556,464
|
|
19,389,978
|
|
|||
|
Proceeds from sale of common stock under employee stock purchase plan
|
141,706
|
|
—
|
|
|||
|
Proceeds from warrant and option exercises
|
860,871
|
|
3,499
|
|
|||
|
Net cash provided by financing activities
|
30,379,420
|
|
35,776,395
|
|
|||
|
Net increase in cash and cash equivalents
|
788,644
|
|
15,500,832
|
|
|||
|
Cash and cash equivalents at beginning of period
|
16,522,729
|
|
1,021,897
|
|
|||
|
Cash and cash equivalents at end of period
|
$
|
17,311,373
|
|
$
|
16,522,729
|
|
|
|
Supplemental disclosure of non-cash financing and investing activity:
|
|||||||
|
Transfer of instruments and servers from inventory into property and equipment
|
$
|
1,266,015
|
|
$
|
—
|
|
|
|
Transfer of instruments and servers from property and equipment into inventory
|
$
|
—
|
|
$
|
242,831
|
|
|
|
Conversion of convertible note into common stock
|
$
|
—
|
|
$
|
14,898,327
|
|
|
|
Fair value of stock and warrants issued in conjunction with debt
|
$
|
831,619
|
|
$
|
176,813
|
|
|
|
Issue stock for covenant waiver
|
$
|
504,167
|
|
$
|
—
|
|
|
|
Reduce warrant exercise price for covenant waiver
|
$
|
45,787
|
|
$
|
—
|
|
|
|
Final payment fee due in connection with the repayment of debt classified within other long-term liabilities
|
$
|
—
|
|
$
|
400,000
|
|
|
|
Conversion of preferred stock warrants into common stock and common stock warrants
|
$
|
—
|
|
$
|
84,676
|
|
|
|
Property and equipment costs incurred but not paid included in accounts payable and accrued expenses
|
$
|
—
|
|
$
|
3,150
|
|
|
|
Supplemental disclosure of cash flow information
|
|||||||
|
Interest paid
|
$
|
1,277,184
|
|
$
|
700,353
|
|
|
See accompanying notes to the consolidated financial statements.
70
Bionano Genomics, Inc.
Notes to the Consolidated Financial Statements
1. Organization and Operations
Description of Business
Bionano Genomics, Inc. (the “Company”) was
formed in January 2003.
The Company is a life sciences instrumentation company in the genome analysis space. The Company currently develops and markets the Saphyr system, a platform for ultra-sensitive and ultra-specific structural variation detection that enables researchers and clinicians to accelerate the search for new diagnostics and therapeutic targets and to streamline the study of changes in chromosomes, which is known as cytogenetics.
Initial Public Offering
In August 2018, the Company completed its initial public offering (the “IPO”), in which it sold an aggregate of
3,864,000
units (each unit consisting of
one
share of the Company’s common stock and
one
warrant to purchase
one
share of the Company’s common stock) at a public offering price of
$6.125
per unit. The Company received cash proceeds of
$19.4 million
, net of offering costs of
$4.3 million
.
In addition, each of the following occurred in connection with the completion of the IPO:
|
•
|
The conversion of all outstanding shares of convertible preferred stock into an aggregate
2,850,280
shares of common stock.
|
|
•
|
The automatic adjustment of certain preferred stock warrants into common stock warrants; the entire
$84,676
balance of preferred stock warrant liability was reclassified as additional paid-in-capital. In addition, the Company issued warrants to the IPO underwriters to purchase up to
115,920
shares of its common stock at fair value of
$0.4 million
.
|
|
•
|
The conversion of an aggregate of
$14.9 million
of outstanding convertible promissory notes and accrued interest into an aggregate of
3,239,294
shares of common stock.
|
Reverse Stock Splits
On July 16, 2018, the Company effected a
one-for-21.4
reverse stock split of its issued and outstanding shares of common stock and a proportional adjustment to the existing conversion ratios for each series of the Company’s redeemable convertible preferred stock, and on August 15, 2018, the Company effected an additional
one-for-two
reverse stock split of its issued and outstanding shares of common stock and a proportional adjustment to the existing conversion ratios for each series of the Company’s redeemable convertible preferred stock. Accordingly, all share and per share amounts for all periods presented in the accompanying financial statements and notes thereto have been adjusted retroactively, where applicable, to reflect these reverse stock splits and adjustments of the preferred stock conversion ratios.
Going Concern
In accordance with ASU 2014-15,
Presentation of Financial Statements – Going Concern (Subtopic 205-40): Disclosure of Uncertainties About an Entity’s Ability to Continue as a Going Concern
, management is required to perform a two-step analysis over its ability to continue as a going concern. Management must first evaluate whether there are conditions and events that raise substantial doubt about the Company’s ability to continue as a going concern and to meet its obligations as they become due within one year after the date that the financial statements are issued (step 1). If management concludes that substantial doubt is raised, management is also required to consider whether its plans alleviate that doubt (step 2).
The Company has experienced recurring net losses from operations, negative cash flows from operating activities, financial covenant breaches, and significant accumulated deficit since its inception and expects to continue to incur net losses into the foreseeable future. The Company has an accumulated deficit of
$102.6 million
as of
December 31, 2019
. In 2019, the Company used
$29.5 million
cash in operations. As of
December 31, 2019
, the Company had cash and cash equivalents of
$17.3 million
. Management expects operating losses and negative cash flows to continue for at least the next year as the Company continues to incur costs related to research and commercialization efforts. Management has prepared cash flows forecasts which indicate that based on the Company’s expected operating losses and negative cash flows and current debt obligations, there is substantial doubt about the Company’s ability to continue as a going concern within twelve months after the date that the financial statements for the year ended
December 31, 2019
, are issued.
71
The Company’s ability to continue as a going concern is dependent upon its ability to raise additional funding. The Company has plans to raise additional capital through equity offerings or debt financings to fulfill its operating and capital requirements for at least 12 months and to maintain compliance with certain financial covenants in its loan agreement. The Company’s plans include continuing to fund its operating losses and capital funding needs through equity or debt financings, strategic collaborations, licensing arrangements, asset sales, or other arrangements. However, the Company may not be able to secure such financing in a timely manner or on favorable terms, if at all. Furthermore, if the Company issues equity securities to raise additional funds, its existing stockholders may experience dilution, and the new equity securities may have rights, preferences and privileges senior to those of the Company’s existing stockholders. If the Company raises additional funds through collaboration, licensing or other similar arrangements, it may be necessary to relinquish valuable rights to its products or proprietary technologies or grant licenses on terms that are not favorable to the Company. If the Company does not have or is not able to obtain sufficient funds, it may have to reduce commercialization efforts or delay its development of new products. The Company also may have to reduce marketing, customer support or other resources devoted to its products or cease operations. As a result, the aforementioned conditions, among others, raise substantial doubt about the Company’s ability to continue as a going concern within one year after the date the financial statements are issued.
The financial statements have been prepared on a going concern basis, which contemplates the realization of assets and settlement of liabilities in the normal course of business, and do not include any adjustments to reflect the outcome of this uncertainty.
On August 16, 2019, the Company received notice from the Nasdaq Stock Market LLC (“Nasdaq”) that the Company’s stockholders’ equity as reported in the Company’s Quarterly Report on Form 10-Q for the quarter ended June 30, 2019 did not satisfy the Nasdaq Capital Market continued listing requirement set forth in Nasdaq Stock Market Rule 5550(b)(1), and that, as of August 13, 2019, the Company did not meet the alternative compliance standards to maintain continued listing as set forth in Nasdaq Stock Market Rule 5550(b) (the “Listing Rule”). In September 2019, the Company submitted a plan to Nasdaq to regain compliance and on October 16, 2019, Nasdaq granted the Company until February 12, 2020 to provide evidence of compliance with the Listing Rule, subject to certain requirements. On January 17, 2020, the Company received a letter from Nasdaq confirming that the Company had regained compliance with the Listing Rule under the alternative requirement to have a market value of listed securities of at least
$35 million
.
2. Summary of Significant Accounting Policies
Use of Estimates
The preparation of financial statements in conformity with U.S. generally accepted accounting principles ("U.S. GAAP") requires management to make significant estimates and assumptions that affect the reported amounts of assets and liabilities and disclosure of contingent assets and liabilities at the date of the financial statements and the reported amounts of revenues and expenses during the reporting periods. Significant estimates and assumptions by management affect the Company’s revenue recognition for multiple performance obligation arrangements, valuations, expected future cash flows including growth rates, discount rates, terminal values and other assumptions and estimates used to evaluate the recoverability of long-lived assets, warranty reserves, certain accrued expenses, contingent liabilities, tax reserves, deferred tax rates and recoverability of the Company’s net deferred tax assets and related valuation allowances. Although the Company regularly assesses these estimates, actual results could differ materially from these estimates. Changes in estimates are recorded in the period in which they become known. The Company bases its estimates on historical experience and various other assumptions that it believes to be reasonable under the circumstances.
Basis of Presentation
The consolidated financial statements are prepared in accordance with U.S. GAAP and include the accounts of the Company’s 100%-owned subsidiary. All intercompany transactions and balances have been eliminated in consolidation.
Cash and Cash Equivalents
The Company considers all highly liquid investments with an original maturity of three months or less at the date of purchase to be cash equivalents. Cash equivalents primarily represent funds invested in readily available money market accounts. The Company has not experienced any losses in such accounts. The Company believes that it is not exposed to any significant credit risk on cash and cash equivalents.
Fair Value of Financial Instruments
The carrying amounts of all cash equivalents, accounts receivable, prepaid expenses and other current assets, accounts payable and accrued liabilities are reasonable estimates of their fair value because of the short-term nature of these items.
72
Concentrations
Credit Risks
Financial instruments, which potentially subject the Company to significant concentration of credit risk, consist primarily of cash and cash equivalents and accounts receivable. The Company maintains deposits in federally insured major financial institutions in excess of federally insured limits. The Company has not experienced any losses in such accounts and management believes that the Company is not exposed to significant credit risk due to the financial position of the depository institution in which those deposits are held.
The Company’s customers are located throughout the world. The Company generally does not require collateral from its customers, but it performs credit evaluations of their financial condition. More information on accounts receivable is contained in the paragraph titled “Accounts Receivable” below.
Sources of Materials and Products
The materials and components for the Company’s product offerings are currently obtained from single or limited sources. The Company competes with other companies for production capacity, therefore, the Company is exposed to a risk of inventory being unavailable at acceptable prices, or at all, if suppliers are unable (or decide) to provide sufficient levels of materials and components and the Company is unable to identify alternative suppliers.
Accounts Receivable
The Company extends credit to its customers in the normal course of business based upon an evaluation of each customer’s credit history, financial condition, and other factors. Estimates of allowances for doubtful accounts are determined by evaluating individual customer circumstances, historical payment patterns, length of time past due, and economic and other factors. Bad debt expense is recorded as necessary to maintain an appropriate level of allowance for doubtful accounts in selling, general and administrative expense. A portion of the receivables are with distributors who are slow payers and the Company is pursuing collection of such receivables. Based on ongoing dialog with these distributors, the Company expects these receivables to be fully collected. For the years ended December 31, 2019 the Company recorded
$554,867
as an allowance for doubtful accounts and nothing for the year ended December 31, 2018. Amounts are charged to the allowance for doubtful accounts when collection efforts have been exhausted and are deemed uncollectible.
Accounts receivable is subject to concentration risk whenever a customer has a balance that meets or exceeds 10% of the Company's total accounts receivable balance. As of December 31, 2018, Ultravision Technology Ltd., BioStar Company, and HistoGenetics, represented
13%
,
12%
, and
10%
, respectively, of the Company's total accounts receivable balance. As of December 31, 2019, Gene Company Limited represented
10%
of the Company's total accounts receivable balance.
Inventory
Inventory is stated at the lower of cost or net realizable value, on a first-in, first-out basis. Inventory includes raw materials and finished goods that may be used in the research and development process and such items are expensed as consumed or expired. Provisions for slow-moving, excess, and obsolete inventories are estimated based on product life cycles, historical experience, and usage forecasts.
The components of inventories are as follows:
|
December 31,
|
|||||||
|
2019
|
2018
|
||||||
|
Materials and supplies
|
$
|
950,846
|
|
$
|
161,468
|
|
|
|
Finished Goods
|
2,492,713
|
|
907,089
|
|
|||
|
$
|
3,443,559
|
|
$
|
1,068,557
|
|
||
In connection with the market launch of the Company’s next generation product, the Saphyr system, including the strategic shift towards minimal selling efforts of the Irys instruments, the Company recorded a charge of
$1.3 million
included in cost of revenue to write-down these instruments to net realizable value during the year ended December 31, 2018.
Property and Equipment
Property and equipment are recorded at cost and depreciated or amortized using the straight-line method over the estimated useful lives of the assets (generally
three
to
five
years, or the remaining term of the lease for leasehold improvements, whichever is shorter) and
73
generally consist of laboratory equipment, computer and office equipment, furniture and fixtures, and leasehold improvements. Repairs and maintenance costs are charged to expense as incurred.
Long-Lived Assets
The Company regularly reviews the carrying value and estimated lives of all of its long-lived assets, including property and equipment, to determine whether indicators of impairment may exist which warrant adjustments to carrying values or estimated useful lives. Should an impairment exist, the impairment loss would be measured based on the excess over the carrying amount of the asset’s fair value. During the years ended
December 31, 2019
and 2018, the Company recognized
no
impairment loss on long-lived assets. Substantially all of the Company's long-lived assets are located in the U.S.
Revenue Recognition
Revenue by Source
|
Year Ended December 31,
|
|||||||
|
2019
|
2018
|
||||||
|
Instrument revenue
|
$
|
6,762,463
|
|
$
|
8,441,325
|
|
|
|
Consumable revenue
|
2,711,981
|
|
3,021,848
|
|
|||
|
Product revenue
|
9,474,444
|
|
11,463,173
|
|
|||
|
Services and other revenue
|
655,064
|
|
537,562
|
|
|||
|
Total revenue
|
$
|
10,129,508
|
|
$
|
12,000,735
|
|
|
Revenue by Geographic Location
|
Year Ended December 31,
|
|||||||||||||
|
2019
|
2018
|
||||||||||||
|
$
|
%
|
$
|
%
|
||||||||||
|
North America
|
$
|
5,030,267
|
|
50
|
%
|
$
|
4,594,814
|
|
38
|
%
|
|||
|
EMEIA
|
3,627,602
|
|
36
|
%
|
3,954,693
|
|
33
|
%
|
|||||
|
Asia Pacific
|
1,471,639
|
|
14
|
%
|
3,451,228
|
|
29
|
%
|
|||||
|
Total
|
$
|
10,129,508
|
|
100
|
%
|
$
|
12,000,735
|
|
100
|
%
|
|||
The Company generates revenue from the sale of its products, primarily its Saphyr system and related consumables, and related services, which are primarily support, repairs and maintenance services on the instruments. The Company's products are sold primarily through a direct sales force, and within international markets, there is more reliance on distributors. Revenue is recorded net of sales tax. The table above provides revenue from contracts with customers by business and geographic region on a disaggregated basis. North America consists of the United States and Canada. EMEIA consists of Europe, the Middle East, India and Africa. Asia Pacific includes China, Japan, South Korea, Singapore and Australia. For the years ended
December 31, 2019
and
2018
, the United States represented
47%
and
38%
, and China represented
5%
and
17%
, respectively of total revenue.
The Company considers revenue to be earned when all of the following criteria are met: the Company has a contract with a customer that creates enforceable rights and obligations; promised products or services are identified; the transaction price, or the amount the Company expects to receive, including an estimate of uncertain amounts subject to a constraint to ensure revenue is not recognized in an amount that would result in a significant reversal upon resolution of the uncertainty, is determinable; and the Company has transferred control of the promised items to the customer. A performance obligation is a promise in a contract to transfer a distinct good or service to the customer, and is the unit of account in the contract. The transaction price for the contract is measured as the amount of consideration the Company expects to receive in exchange for the goods and services expected to be transferred. A contract's transaction price is allocated to each distinct performance obligation and recognized as revenue when, or as, control of the distinct good or service is transferred.
Transfer of control for the Company's products is generally at shipment or delivery, depending on contractual terms, but occurs when title and risk of loss transfers to the customer which represents the point in time when the customer obtains control of the product. As such the Company's performance obligation related to product sales is satisfied at a point in time.
74
Revenue from support and maintenance contracts and extended warranties are recognized over time based on the contract term, which represents a faithful depiction of the transfer of goods and services given the stand-ready nature of the performance obligations. Service revenue related to repairs and customer sample evaluations are recognized as the services are performed based on the specific nature of the service.
The Company recognizes a receivable when it has an unconditional right to payment, which is generally at the time of shipment of consumables and instruments, including any extended warranties, and at the time when services are rendered. Payment terms are typically 30 days for sales to customers in the United States but may be longer in international markets. The Company treats shipping and handling costs performed after a customer obtains control of the good as a fulfillment cost and records these costs within selling, general and administrative expenses, less any amounts reimbursed by the customer, when the corresponding revenue is recognized.
Some of the Company's contracts have multiple performance obligations. For contracts with multiple performance obligations, the Company allocates the transaction price to each performance obligation using its best estimate of the standalone selling price of each distinct good or service in the contract. The Company determines its best estimate of standalone selling price using average selling prices over
3- to 12-month
periods of data depending on the products or nature of the services coupled with current market considerations. If the product or service does not have a history of sales or if sales volume is not sufficient, including instruments under reagent rental agreements, the Company has estimated the standalone selling price to be the incremental sales price generally charged for consumables to customers under the reagent rental agreements in relation to amounts charged to other customers.
Variable Consideration
The Company exercises judgment in estimating variable consideration, if any, and would be recorded as a reduction to revenue. To the extent the transaction price includes variable consideration, the Company applies judgment in constraining the estimated variable consideration due to factors that may cause reversal of revenue recognized. The Company evaluates constraints based on its historical and projected experience with similar customer contracts.
The Company's contracts typically do not provide for product returns or refunds. In general, estimates of variable consideration and constraints are not material to the Company's financial statements.
Remaining Performance Obligations
As of December 31, 2019, the estimated revenue expected to be recognized in the future related to performance obligations that are unsatisfied was
$540,140
. These remaining performance obligations primarily relate to extended warranty and support and maintenance obligations. The Company expects to recognize approximately
66%
of this amount as revenue in 2020,
31%
in 2021 and
3%
in 2022. Warranty revenue is included in Service and other revenue.
Contract Assets and Liabilities
The Company discloses accounts receivable separately in the consolidated balance sheets at their net realizable value. Contract assets primarily relate to the Company's conditional right to consideration for work completed but not billed at the reporting date. Contract assets at the beginning and end of the period, as well as the changes in the balance, were immaterial.
Contract liabilities primarily relate to payments received from customers in advance of performance under the contract. The Company records a contract liability, or deferred revenue, when it has an obligation to provide service, and to a much lesser extent product, to the customer and payment is received or due in advance of performance. Deferred revenue primarily relates to support and maintenance contracts and extended warranty obligations. Contract liabilities are classified as other current liabilities and other long-term liabilities on the consolidated balance sheets. The Company recognized revenue of
$270,171
and
$211,697
during the years ended December 31, 2019 and 2018, respectively, which was included in the contract liability balance at the end of the previous year.
Distributor Transactions
In certain markets, the Company sells products and provides services to customers through distributors that specialize in life sciences products. In cases where the product is delivered to a distributor, revenue recognition generally occurs when the distributors obtains control of the product. The terms of sales transactions through distributors are generally consistent with the terms of direct sales to customers and do not contain return rights. Distributor sales transactions typically differ from direct customer sales as they do not require the Company’s services to install the instrument at the end customer or perform the services for the customer that are beyond the standard warranty in the first year following the sale. These transactions are accounted for in accordance with the Company’s revenue recognition policy described herein.
75
Cost of Revenue
Cost of revenue for products consists of the Company’s instrument cost from the manufacturer, raw material parts costs and associated freight, shipping and handling costs, contract manufacturer costs, royalties due to third parties, salaries and other personnel costs, overhead and other direct costs related to those sales recognized as product revenue in the period.
Cost of other revenue consists of salaries and other personnel costs, and facility costs associated with costs related to warranties and other costs of servicing equipment at customer sites.
Research and Development Costs
Costs incurred for research and product development, including acquired technology and costs incurred for technology in the development stage, are expensed as incurred.
Patent Costs
Costs related to filing and pursuing patent applications are recorded as selling, general and administrative expense and expensed as incurred since recoverability of such expenditures is uncertain.
Stock-based Compensation
The Company issues stock-based awards as compensation to employees and directors. Stock-based awards may include stock options, stock appreciation rights, vesting stock awards and performance share awards. These awards are accounted for as equity awards. To-date, the Company has issued stock options and recognizes stock-based compensation expense net of actual forfeitures on a straight-line basis over the underlying award’s requisite service period, which is generally the contractual term, as measured using the award’s grant date fair value.
Income Taxes
The Company accounts for income taxes under the asset and liability method, which requires the recognition of deferred tax assets and liabilities for the expected future tax consequences of events that have been included in the financial statements. Under this method, deferred tax assets and liabilities are determined on the basis of the differences between the financial statements and tax basis of assets and liabilities using enacted tax rates in effect for the year in which the differences are expected to reverse. The effect of a change in tax rates on deferred tax assets and liabilities is recognized in income in the period that includes the enactment date.
The Company recognizes deferred tax assets to the extent that the Company believes these assets are more likely than not to be realized. In making such a determination, management considers all available positive and negative evidence, including future reversals of existing taxable temporary differences, projected future taxable income, tax-planning strategies, and results of recent operations. If management determines that the Company would be able to realize its deferred tax assets in the future in excess of their recorded amount, management would make an adjustment to the deferred tax asset valuation allowance, which would reduce the provision for income taxes. Changes in the valuation allowance when they are recognized in the provision for income taxes may result in a change in the estimated annual effective tax rate.
The Company recognizes the impact of uncertain tax positions at the largest amount that is “more likely than not” to be sustained upon audit by the relevant taxing authority. An uncertain tax position will not be recognized if it does not have a greater than 50% likelihood of being sustained. The Company recognizes interest and penalties related to unrecognized tax benefits within income tax expense. Any accrued interest and penalties are included within the related tax liability.
Comprehensive Loss
Net loss and comprehensive loss were the same for all periods presented; therefore, a separate statement of comprehensive loss is not included in the financial statements.
Segment Reporting
Operating segments are identified as components of an enterprise about which separate discrete financial information is available for evaluation by the chief operating decision-maker in making decisions regarding resource allocation and assessing performance. The Company and its chief operating decision-maker, the Chief Executive Officer, views the Company’s operations and manages its business in
one
operating segment.
76
Net Loss Per Share
Basic net loss per share is calculated by dividing the net loss by the weighted-average number of common shares outstanding for the period. Diluted net loss per share is computed by dividing the net loss by the weighted average number of common shares and common share equivalents outstanding for the period. Common share equivalents are only included when their effect is dilutive. Pre-funded warrants from the Company's follow-on offering have been treated as if they were common shares outstanding on the date of issuance. The Company’s potentially dilutive securities which include convertible preferred stock and outstanding stock options under the Company’s equity incentive plans have been excluded from the computation of diluted net loss per share as they would be anti-dilutive to the net loss per share. For all periods presented, there is no difference in the number of shares used to calculate basic and diluted shares outstanding due to the Company’s net loss position.
Potentially dilutive securities not included in the calculation of diluted net loss per share because to do so would be anti-dilutive were as follows (in common stock equivalent shares):
|
Year Ended December 31,
|
|||||
|
2019
|
2018
|
||||
|
Common stock options
|
1,742,912
|
|
1,282,847
|
|
|
|
Common warrants
|
24,026,550
|
|
4,062,507
|
|
|
|
Total
|
25,769,462
|
|
5,345,354
|
|
|
Accounting Standards Updates Adopted
In May 2014, the Financial Accounting Standards Board (FASB) issued Accounting Standards Update (ASU) No. 2014-09, Revenue from Contracts with Customers (Topic 606), which supersedes the revenue recognition requirements and some cost guidance included in the Accounting Standards Codification (ASC). This ASU is based on the principle that revenue is recognized to depict the transfer of goods or services to customers at an amount that reflects the consideration to which the entity expects to be entitled in exchange for those goods or services. The ASU also requires additional disclosures about the nature, amount, timing and uncertainty of revenue and cash flows arising from customer contracts, including significant judgments and changes in judgments, and assets recognized from costs incurred to obtain or fulfill a contract. The Company adopted the standard on January 1, 2019 using the modified retrospective method. The Company did not have a cumulative effect of initially applying the new standard to all incomplete contracts as there were no changes in the timing of revenue recognition upon adoption. The Company did not elect to apply any practical expedients. In addition to being required, the adoption of this ASU is preferable as it increases comparability in accounting for economically similar transactions across companies in varying industries and provides more useful information to user of financial statements through improved disclosure requirements.
Recently Issued But Not Yet Adopted Accounting Pronouncements
On April 5, 2012, the Jump-Start Our Business Startups Act (the “JOBS Act”) was signed into law. The JOBS Act contains provisions that, among other things, reduce certain reporting requirements for an emerging growth company. As an emerging growth company, the Company may elect to adopt new or revised accounting standards when they become effective for non-public companies, which typically is later than when public companies must adopt the standards. The Company has elected to take advantage of the extended transition period afforded by the JOBS Act and, as a result, will comply with new or revised accounting standards on the relevant dates on which adoption of such standards is required for emerging growth companies, which are the dates included below.
In February 2015, the FASB issued ASU 2016-02,
Leases (Topic 842)
, which amends the FASB Accounting Standards Codification and creates Topic 842, “Leases.” The new topic supersedes Topic 840, “Leases,” and increases transparency and comparability among organizations by recognizing lease assets and lease liabilities on the balance sheet and requires disclosures of key information about leasing arrangements. The guidance is effective for reporting periods beginning after December 15, 2019, and interim periods within fiscal years beginning after December 15, 2020. ASU 2016-02 mandates a modified retrospective transition method. In July 2018, the FASB issued ASU 2018-11,
Leases (Topic 842): Targeted Improvements
which allows entities the option to adopt this standard prospectively with a cumulative-effect adjustment to opening equity and include required disclosures for prior period. The Company anticipates implementing the standard by taking advantage of the alternative transition method and will apply the transition approach as of the beginning of the period of adoption and will not be restating comparative periods. The Company is in the process of evaluating the impact of adoption of the ASU on the financial statements.
77
3. Fair Value Measurements
The accounting guidance defines fair value, establishes a consistent framework for measuring fair value and expands disclosure for each major asset and liability category measured at fair value on either a recurring or nonrecurring basis. Fair value is defined as an exit price, representing the amount that would be received to sell an asset or paid to transfer a liability in an orderly transaction between market participants. As such, fair value is a market-based measurement that should be determined based on assumptions that market participants would use in pricing an asset or liability. As a basis for considering such assumptions, the accounting guidance establishes a three-tier fair value hierarchy, which prioritizes the inputs used in measuring fair value as follows: As of December 31, 2019, cash and cash equivalents are valued using level 1.
Level 1: Unadjusted quoted prices in active markets that are accessible at the measurement date for identical, unrestricted assets or liabilities.
Level 2: Quoted prices for similar assets and liabilities in active markets, quoted prices in markets that are not active, or inputs which are observable, either directly or indirectly, for substantially the full term of the asset or liability.
Level 3: Prices or valuation techniques that require inputs that are both significant to the fair value measurement and unobservable (i.e. supported by little or no market activity).
4. Prepaid Expenses and Other Current Assets
Prepaid expenses and other current assets consist of the following:
|
December 31,
2019 |
December 31,
2018 |
||||||
|
Prepayment to supplier
|
$
|
409,851
|
|
$
|
74,685
|
|
|
|
Prepaid insurance
|
302,433
|
|
460,684
|
|
|||
|
Other current assets
|
457,062
|
|
384,131
|
|
|||
|
Total
|
$
|
1,169,346
|
|
$
|
919,500
|
|
|
5. Property and Equipment, net
Property and equipment, net consist of the following:
|
December 31,
2019 |
December 31,
2018 |
||||||
|
Computer and office equipment
|
$
|
476,402
|
|
$
|
476,402
|
|
|
|
Lab equipment
|
4,623,714
|
|
4,437,794
|
|
|||
|
Service equipment placed at customer sites
|
1,247,328
|
|
149,823
|
|
|||
|
Leasehold improvements
|
1,875,647
|
|
1,875,647
|
|
|||
|
8,223,091
|
|
6,939,666
|
|
||||
|
Less accumulated depreciation and amortization
|
(6,273,466
|
)
|
(5,162,364
|
)
|
|||
|
$
|
1,949,625
|
|
$
|
1,777,302
|
|
||
The Company recorded depreciation expense for property and equipment of
$1,127,850
and
$1,320,521
for the years ended
December 31, 2019
and
2018
, respectively, in operating expenses. The cost of product revenue includes
$41,118
for the year ended December 31, 2019 and
$0
for the year ended December 31, 2018.
78
6. Accrued Expenses
Accrued expenses consist of the following:
|
December 31,
2019 |
December 31,
2018 |
||||||
|
Compensation expenses
|
$
|
1,805,357
|
|
$
|
1,832,630
|
|
|
|
Deferred rent
|
266,282
|
|
268,319
|
|
|||
|
Goods received not invoiced
|
191,721
|
|
—
|
|
|||
|
Professional fees and royalties
|
213,514
|
|
195,854
|
|
|||
|
Employee expense reimbursements
|
187,516
|
|
133,697
|
|
|||
|
Interest
|
125,743
|
|
—
|
|
|||
|
Other
|
435,298
|
|
469,629
|
|
|||
|
Total
|
$
|
3,225,431
|
|
$
|
2,900,129
|
|
|
7. Long-Term Debt
Western Alliance LSA
In March 2016, the Company entered into a new term Loan and Security Agreement with the Western Alliance Bank (the “Western Alliance LSA”) for
$7.0 million
. The loan proceeds were used to repay the outstanding
$5.0 million
loan with Square 1 Bank, as required by the twelfth amendment to that certain Loan and Security Agreement with Square 1 Bank.
Additionally, in conjunction with the entry into Western Alliance LSA, the Company issued to Western Alliance Bank a warrant to purchase
510,417
shares of Series D convertible preferred stock at an exercise price of
$0.48
per share. The Company valued the warrant to purchase Series D convertible preferred stock using the Black-Scholes-Merton model, and the initial fair value of the warrant to purchase Series D convertible preferred stock of
$65,384
was recorded as a debt discount and was being amortized to interest expense over the term of the loan. Upon the closing of the IPO in August 2018, the warrants exercisable for shares of Series D convertible preferred stock were adjusted to warrants exercisable for
11,925
shares of common stock for
$20.56
per share. The warrants expire in March 2026.
In December 2016, the Western Alliance LSA was amended, and in conjunction with this amendment, the Company issued to Western Alliance Bank a warrant to purchase
291,667
shares of Series D-1 convertible preferred stock. The Company valued the warrant to purchase Series D-1 convertible preferred stock using the Black-Scholes-Merton model, and the initial fair value of the warrant to purchase Series D-1 convertible preferred stock of
$34,300
was recorded as a debt discount and was being amortized to interest expense over the term of the loan. Upon the closing of the IPO in August 2018, the warrants exercisable for shares of Series D-1 convertible preferred stock were adjusted to warrants exercisable for
6,814
shares of common stock for
$20.56
per share. The warrants expire in December 2026.
In February 2018, the Western Alliance LSA was amended, requiring the Company to secure
$21.0 million
in funding prior to June 30, 2018. As part of the amendment, Western Alliance Bank agreed to forbear from exercising any of its default remedies set forth in the Western Alliance LSA as a result of the Company’s previous loan default as of December 31, 2017.
In June 2018, the Western Alliance LSA was amended, replacing previously amended funding requirements and requiring the Company to secure
$5.0 million
in funding prior to August 3, 2018. Additionally, the amendment restricted the Company’s use of all cash collected from customers, received on and after amendment date, until the Company collected a total of
$2.5 million
. As part of this amendment, Western Alliance Bank waived the existing default.
In June 2018, the Company repaid the Western Alliance LSA in connection with the MidCap Financial CSA (as defined below).
In November 2018, the Company entered into an Amendment Agreement with Western Alliance Bank to amend (i) that certain Warrant to Purchase Stock, dated March 8, 2016, (ii) that certain Warrant to Purchase Stock, dated December 9, 2016 ((i) and (ii) collectively, the “Bank Warrants”) and (iii) the Western Alliance LSA. Pursuant to Section 2.6(g) of the Western Alliance LSA, the Company was obligated to pay Western Alliance Bank a success fee of
$210,000
in connection with the IPO. As part of the Amendment Agreement, this success fee was decreased from
$210,000
to
$160,000
and the exercise price of the Bank Warrants was decreased to
$6.99
per share.
MidCap Financial CSA
79
In June 2018, the Company entered into a Credit and Security Agreement with MidCap Financial Trust (the “MidCap Financial CSA”) which provided a
$15.0 million
term loan facility available in a first tranche of
$10 million
(“Tranche 1”), a second tranche of
$2.5 million
and a third tranche of
$2.5 million
. The Company borrowed
$10.0 million
from Tranche 1 immediately upon execution of the MidCap Financial CSA. Proceeds from the loan were used to repay the outstanding
$7.0 million
due to Western Alliance LSA.
In March 2019, the Company repaid the MidCap Financial CSA in connection with the Innovatus LSA (as defined below).
The MidCap Financial CSA bore interest at an annual rate of one month LIBOR plus
7.5%
, subject to a LIBOR floor of
1.5%
. The loan had a
60
-month term, with interest only for the first
18 months
and straight-line amortization of principal and interest for the remaining
42 months
. The MidCap Financial CSA was secured by substantially all of the assets of the Company and was scheduled to mature in July 2023.
The Company paid issuance fees of approximately
$0.3 million
at the inception of the loan, which was recorded as a debt discount and was recognized as additional interest expense over the term of the loan. Subject to certain limited exceptions, amounts prepaid in relation to the MidCap Financial CSA are subject to a prepayment fee determined by multiplying the amount being prepaid by
4%
in the first year of the term,
3%
in year two, and
2%
thereafter. When the Company paid-off the MidCap Financial CSA, it incurred a prepayment fee of
$0.4 million
. The prepayment fee is recognized as loss on debt extinguishment during the year ended December 31, 2019. In addition, upon repayment of the total amounts borrowed, the Company was required to pay an end of term charge equal to
4%
of the total amount borrowed. Accordingly, an end of term charge of
$0.4 million
was included in other long-term liabilities on the balance sheet as of December 31, 2018. The end of term charge was being recognized as additional interest expense over the term of the loan. The unamortized portion of the end of term charge was written-off as loss on debt extinguishment during the year ended December 31, 2019 in conjunction with the Company's repayment of the MidCap Financial CSA.
In conjunction with entering into the MidCap Financial CSA, the Company issued to MidCap a warrant to purchase
625,000
shares of Series D-1 convertible preferred stock at an exercise price of
$0.48
per share that was immediately exercisable. The Company valued the warrant to purchase Series D convertible preferred stock using the Black-Scholes-Merton model, and the initial fair value of the warrant to purchase Series D-1 convertible preferred stock of
$0.2 million
was recorded as a debt discount and was being amortized to interest expense over the term of the loan. The assumptions used in the model were: the fair value of the Series D-1 convertible preferred stock, which was determined using an OPM analysis, an expected life of
10
years, a risk-free interest rate of
2.83%
and an expected volatility of
59%
. Upon the closing of the IPO in August 2018, the warrant was adjusted from being exercisable for shares of Series D convertible preferred stock to exercisable for
14,602
shares of common stock for
$20.56
. The warrant expires on
June 29, 2028
.
In addition, MidCap invested
$1.0 million
in the convertible note offering at terms identical to other investors described in the Convertible Notes section below.
Innovatus LSA
In March 2019, the Company entered into a Loan and Security Agreement (the “Innovatus LSA”) by and among Innovatus Life Sciences Lending Fund I, LP, a Delaware limited partnership (“Innovatus”), as collateral agent and the lenders listed on Schedule 1.1 thereto, including East West Bank (the “Bank”, and together with the lenders, the “Lenders”). Under the Innovatus LSA, Innovatus agreed, among other things, to make a first term loan of
$17.5 million
to the Company (the “Term A-1 Loan”), a second term loan of
$2.5 million
to the Company (the “Term A-2 Loan”) and a third term loan of
$5.0 million
to the Company (the “Term B Loan”), each upon satisfaction of certain funding conditions. In addition, the Bank has agreed to make available to the Company a revolving line of credit in an amount not to exceed
$5.0 million
(the “Revolver”).
Under the Innovatus LSA, interest is payable, at the Company’s option (i) in cash at a rate of
10.25%
per annum or (ii) at a discounted rate of
7.25%
in cash, with
3.0%
of the
10.25%
per annum rate (the “PIK Loan”) added to the principal of the loan and subject to accruing interest through the end of the interest only payment period. Interest only payments are due on the first of each month through March 2022. Beginning in April 2022, the Company will make equal monthly payments of principal and interest over
24
months. At maturity in March 2024 (or earlier prepayment), the Company is also required to make a final payment equal to
3.75%
of the original principal amount borrowed. At inception the Company elected to pay interest in cash at a rate of
7.25%
per annum and have
3.0%
per annum of the interest added back to the outstanding principal.
The Innovatus LSA provides for prepayment fees of
3.0%
of the outstanding balance of the loan if the loan is repaid on or prior to March 14, 2020,
2.0%
of the amount prepaid if the prepayment occurs after March 14, 2020 but prior to March 14, 2021,
1.0%
of the amount prepaid after March 14, 2021 but prior to March 14, 2022 and
0%
of the amount prepaid if the prepayment occurs thereafter. In addition, upon repayment of the total amounts borrowed, the Company is required to pay an end of term charge of
$0.8 million
. This end of term charge is being recognized as additional interest expense over the term of the Innovatus LSA.
80
The Innovatus LSA is collateralized by substantially all of the Company’s assets, including the Company's intellectual property. The Innovatus LSA requires the Company to comply with various affirmative and negative covenants, including: (1) a liquidity covenant requiring the Company to maintain a minimum cash balance at all times in a collateral account; (2) a revenue covenant requiring the Company to meet certain minimum revenue targets measured at the end of each calendar quarter. The Innovatus LSA also includes standard events of default, including a provision that Innovatus could declare an event of default upon non-compliance with covenants or the occurrence of any event that it interprets as having a material adverse change in the Company's business, operations, or condition, a material impairment on the Company's ability to pay the secured obligations under the Innovatus LSA, or upon a material adverse effect on the collateral under the agreement, thereby requiring the Company to repay the loan immediately, together with a prepayment fee and other applicable fees.
Additionally, in connection with the Innovatus LSA, in March 2019, the Company entered into a Common Stock Purchase Agreement (the “Innovatus Purchase Agreement”) with certain entities affiliated with Innovatus (the “Innovatus Investors”), pursuant to which the Company agreed to issue and sell
406,504
shares of common stock at
$3.69
per share for proceeds of
$1.5 million
. Upon execution of the Innovatus Purchase Agreement, the Company sold all of such shares to the Innovatus Investors. Because the shares were issued at a discount to the fair market value of the Company’s common stock on the issuance date, the Company recorded the difference of
$0.2 million
between the issuance price and fair value which was allocated to the debt on a relative fair value basis.
In March 2019, in connection with the receipt of
$20.0 million
in funding with respect to the Term A-1 Loan and Term A-2 Loan, the Company issued to Innovatus a warrant to purchase up to
161,987
shares of common stock at an exercise price of
$4.63
per share, which has a term of
10
years. The Company applied the Black-Scholes option pricing model to estimate the fair value of the warrants, with the following assumptions: a) risk-free rate of
2.43%
; b) expected volatility of
66.93%
; c)
no
dividend would be payable; and d) expected life of
10
years. Based on this model, the aggregate relative fair value of the warrants was determined to be
$0.6 million
. Subject to the terms of the Innovatus LSA, the warrant to be issued in connection with funding of the Term B Loan will entitle the Lender to purchase up to
40,496
shares of the Company’s common stock and will have an exercise price of
$4.63
per share.
The Company paid issuance fees of approximately
$0.8 million
which was recorded as part of the debt discount. The issuance fees are amortized as additional interest expense over the life of the debt using the effective interest method. The Company recognized the fair value of the warrants and the discount of the common stock as a debt discount and along with the issuance costs will amortize these amounts using the effective interest rate method over the life of the applicable term loan. The effective interest rate as of
December 31, 2019
was
13.7%
.
In May 2019, the Company began to draw down on its
$5.0 million
revolving line of credit (the Revolver). Through December 31, 2019, the Company had borrowed
$5.1 million
and had repaid
$3.6 million
under the Revolver. The Company may repay and borrow amounts under the Revolver at any time prior to the March 1, 2024 maturity date without penalty or premium, at which time such amounts will become immediately due and payable. The Company’s obligation to repay amounts borrowed under the Revolver is subject to acceleration upon the occurrence of certain specified events, including an event of default and a permitted prepayment of the term loans borrowed under the Loan Agreement. The outstanding balance of amounts borrowed under the Revolver bear interest at a rate equal to
2.0%
above the variable rate of interest, per annum, most recently announced by the Bank as its “prime rate,” whether or not such announced rate is the lowest rate available from the Bank.
In June 2019, the Innovatus LSA was amended to among other things: (i) extend the deadline for the Company to maintain its domestic depository and operating accounts with the Bank, subject to a control agreement in favor of Innovatus, to July 31, 2019 and (ii) permit the Company to incur credit card indebtedness in an amount not to exceed
$150,000
. As of
September 30, 2019
, the Company did not achieve a certain trailing twelve month revenue covenant under the Innovatus LSA.
In October 2019, the Company obtained a waiver letter (the “Waiver Letter”) from Innovatus, with respect to certain financial covenants under the Innovatus LSA. Pursuant to the Waiver Letter, Innovatus agreed to allow the Company to cure its noncompliance with a revenue covenant as of September 30, 2019 so long as the Company (i) raised at least
$10 million
in gross proceeds from the sale of its securities in an underwritten public offering by October 31, 2019 and (ii) amended that certain Warrant to Purchase Stock, issued by the Company to Innovatus in March 2019 (the "Innovatus Warrant"), to decrease the exercise price of the Innovatus Warrant from
$4.63
per share to
$0.48
per share (the “Warrant Amendment”). Also pursuant to the Waiver Letter, as consideration for the prospective waiver of a liquidity covenant, the Company agreed to issue to Innovatus
572,917
shares of the Company's common stock. As a result of the amendment and shares issued, the Company recognized
$549,955
in incremental debt issuance cost which is being amortized to interest expense over the remaining term.
In October 2019, the Company completed (i) its follow-on public offering, which resulted in gross proceeds to the Company, before deducting underwriting discounts and commissions and other offering expenses, of approximately
$18.0 million
and (ii) the Warrant Amendment. In November 2019, the Company entered into a Common Stock Issuance Agreement (the “Innovatus Issuance Agreement”) with Innovatus, pursuant to which it issued Innovatus
572,917
shares of the Company’s common stock in accordance with the terms of
81
the Waiver. Also on November 8, 2019, the Company amended the Innovatus Registration Rights Agreement to include such shares of common stock as Registrable Securities as defined in such agreement.
As of December 31, 2019, the Company did not achieve certain financial covenants under the Innovatus LSA. Subsequent to December 31, 2019, in March 2020, the Company and Innovatus entered into an amendment to the Innovatus LSA to, among other things, waive the events of default from not achieving the specific financial covenants for the December 31, 2019 measurement date, require an immediate partial repayment of
$2,100,000
and an additional payment of
$2,900,000
on the earlier of completion of an equity raise, as defined in the amendment, or April 30, 2020. In addition, the amendment modified the liquidity covenant that requires the Company to maintain a minimum cash balance, which varies depending on borrowing capacity under the Revolver and operating cash flows but no less than
$2 million
, as well as modified the events of default. Furthermore, the amendment provides for a cure period for the minimum revenue financial covenants as long as the Company submits updated management plans and financial projections, which are subject to Innovatus approval, and completes an additional equity raise, as defined in the amendment, within
45
days of the breach. The amendment also included a reduction in the minimum revenue covenant amounts. In connection with the March 2020 amendment, the Company is obligated to pay Innovatus a waiver fee in the amount of
$200,000
and a prepayment fee of $100,000, payable in cash or Company stock at the Company's election, no later than following completion of the additional equity raise. As of December 31, 2019, the Company has classified all borrowings from Innovatus as current debt as the Company has not yet met the requirements of the cure described above.
Convertible Notes
In February 2018, the Company entered into a Note Purchase Agreement (the “Note Purchase Agreement”) with various investors, which included related parties (the “Investors”), pursuant to which the Company agreed to sell to the Investors convertible promissory notes (the “Convertible Notes”) in the original principal amount of up to
$16.0 million
. In April 2018, the Company amended the Note Purchase Agreement to, among other things, increase the principal amount available for issuance under the Note Purchase Agreement to
$18.4 million
. In June 2018, the Note Purchase Agreement was amended to increase the principal amount available for issuance from
$18.4 million
to
$19.4 million
. In August 2018, the outstanding convertible promissory notes of
$14.9 million
of principal and interest were converted into
3,239,294
shares of common stock upon completion of the IPO. As of
December 31, 2019
and 2018, there are
no
convertible notes outstanding. The Convertible Notes had a maturity date of September 30, 2018 and were convertible either into the Company’s common stock or convertible preferred stock, dependent on the conversion events.
Summary of Debt Obligations
Debt obligations consist of the following:
|
December 31,
2019 |
December 31,
2018 |
||||||
|
Innovatus LSA
|
$
|
20,473,436
|
|
$
|
—
|
|
|
|
MidCap Financial CSA
|
—
|
|
10,000,000
|
|
|||
|
Revolver
|
1,497,955
|
|
—
|
|
|||
|
Total principal
|
21,971,391
|
|
10,000,000
|
|
|||
|
Less: unamortized debt issuance costs
|
(1,886,446
|
)
|
(970,626
|
)
|
|||
|
Total carrying value of debt
|
$
|
20,084,945
|
|
$
|
9,029,374
|
|
|
Future minimum scheduled principal payments, including the impact of the March 2020 amendment discussed above, for the term loan obligation as of December 31, 2019 are as follows:
|
December 31,
2019 |
|||
|
2020
|
$
|
5,000,000
|
|
|
2021
|
—
|
|
|
|
2022
|
5,435,837
|
|
|
|
2023
|
7,926,346
|
|
|
|
2024
|
2,111,253
|
|
|
|
Total
|
$
|
20,473,436
|
|
The Company's Revolver allows the Company to borrow and repay amounts at any time prior to the maturity date in 2024.
82
8. Stockholders’ Equity
Common Stock
Sale of Common Stock
In March 2019, the Company entered into a Common Stock Purchase Agreement (the “Aspire Purchase Agreement”) with Aspire Capital Fund, LLC (“Aspire Capital”) which provides that, upon the terms and subject to the conditions and limitations therein, Aspire Capital is committed to purchase up to an aggregate of
$10.0 million
of shares of the Company’s common stock, subject to certain limitations, including that Aspire Capital is not required to purchase shares if such purchase would result in Aspire Capital (together with its affiliates) beneficially owning more than
19.99%
of the Company’s common stock outstanding.
Concurrently with entering into the Aspire Purchase Agreement, the Company also entered into a registration rights agreement with Aspire Capital, in which the Company agreed to file one or more registration statements, as permissible and necessary to register under the Securities Act of 1933, as amended, the sale of the shares of the Company’s common stock that have been and may be issued to Aspire Capital under the Aspire Purchase Agreement.
Upon execution of the Aspire Purchase Agreement, the Company sold
272,479
shares of the Company’s common stock to Aspire Capital at
$3.67
per share for net proceeds of approximately
$1.0 million
. Aspire Capital is committed to purchase up to
$9.0 million
of additional shares of common stock, subject to beneficial ownership limitations, solely at the Company’s request from time to time during a
30
month period beginning in April 2019 and at a per share purchase price equal to the lesser of:
|
•
|
the lowest sale price of the Company’s common stock on the purchase date; or
|
|
•
|
the average of the three lowest closing sale prices for the Company’s common stock during the
ten
consecutive trading days ending on the trading day immediately preceding the purchase date.
|
In consideration for entering into the Aspire Purchase Agreement and concurrently with the execution of the Aspire Purchase Agreement, the Company issued
69,444
shares of its common stock to Aspire Capital. The value of these shares was netted against the proceeds received as issuance costs.
In December 2019, pursuant to the terms of the Aspire Purchase Agreement, the Company sold
1,067,361
shares of its common stock to Aspire Capital, resulting in
$1,116,067
in gross proceeds to the Company. As of December 31, 2019, due to beneficial ownership limitations, the Company cannot sell additional shares of its common stock to Aspire Capital.
Follow-on Public Offering
In October 2019, the Company completed an underwritten public offering of
10,013,600
shares of its common stock and, to certain investors, pre-funded warrants to purchase
10,923,958
shares of its common stock, and accompanying common warrants to purchase up to an aggregate of
20,937,558
shares of its common stock. Each share of common stock and pre-funded warrant to purchase
one
share of common stock was sold together with a common warrant to purchase
one
share of common stock.
The public offering price of each share of common stock and accompanying common warrant was
$0.86
and
$0.859
for each pre-funded warrant and accompanying common warrant. The pre-funded warrants are immediately exercisable at a price of
$0.001
per share of common stock. The common warrants are immediately exercisable at a price of
$0.86
per share of common stock and will expire
five
years from the date of issuance. The shares of common stock and pre-funded warrants, and the accompanying common warrants, were issued separately and were immediately separable upon issuance. The gross proceeds to the Company, before deducting offering costs of $2.0 million, were approximately
$18.0 million
.
83
Convertible Preferred Stock
Prior to the IPO, there were
121,992,497
shares of convertible preferred stock outstanding. As a result of the IPO, each
42.8
shares of the Company's convertible preferred stock was converted into one share of common stock at a conversion price of
$1.3995
for each share of Series A, B and B-1 convertible preferred stock,
$1.4043
for each share of Series C convertible preferred stock and
$0.48
for each share of Series D and D-1 convertible preferred stock. As of December 31, 2019, there are
no
shares of the Company's convertible preferred stock outstanding.
Convertible Preferred Stock Warrants
In March 2016, in conjunction with the Western Alliance LSA, the Company issued a warrant to purchase
510,417
shares of Series D convertible preferred stock to Western Alliance Bank at an exercise price of
$0.48
per share. Additionally, in conjunction with the first amendment to the Western Alliance LSA, on December 9, 2016, the Company issued a warrant to purchase
291,667
shares of Series D-1 convertible preferred stock to Western Alliance Bank at an exercise price of
$0.48
per share. Both of these warrants expire in 2026.
In June 2018, in conjunction with the MidCap Financial CSA, the Company issued a warrant to purchase
625,000
shares of Series D-1 convertible preferred stock to MidCap Financial at an exercise price of
$0.48
per share. This warrant expires in 2028.
There were
no
warrants exercisable for the Company’s convertible preferred stock following the closing of the IPO. Of the
37.2 million
warrants previously exercisable for preferred stock,
35.7 million
warrants expired on the effective date of the IPO. The remaining
1.5 million
warrants previously exercisable for preferred stock were adjusted to become exercisable for common stock. Prior to the IPO, the Company estimated fair value of the convertible preferred stock warrants at the time of issuance and subsequent re-measurement using the Black-Scholes-Merton model at each reporting date. On the date of the IPO and going forward, all outstanding warrants are accounted for as equity and are not subject to re-measurement.
Common Stock Warrants
In November 2018, the Company issued to LifeSci Capital, LLC, a warrant to purchase
44,183
shares of its common stock, and to Russell Creative Group, a warrant to purchase
3,311
shares of its common stock (together, the “Service Provider Warrants”), each having an exercise price of
$8.25
per share of the Company's common stock and a term of
five
years. The Service Provider Warrants were issued in full satisfaction of the Company's obligations to pay to LifeSci Capital, LLC an aggregate of
$150,000
for capital advisory and investor relations services and to Russell Creative Group an aggregate of
$15,000
for branding and marketing services. The Company valued these warrants using the Black-Scholes-Merton model. The assumptions used in the model were: the fair value of the Company's common stock, an expected life of
10
years, a risk-free interest rate of
2.93%
, and an expected volatility of
62.28%
.
In November 2018, the Company entered into an amendment agreement with Western Alliance Bank in order to amend the previously issued warrants to purchase preferred stock, dated March 8, 2016 and December 9, 2016, respectively, which, in connection with the IPO, were adjusted to warrants exercisable for shares of common stock. Pursuant to the Amendment Agreement, the exercise price of the Bank Warrants was decreased from
$20.56
per share to
$6.99
per share. All other terms of the Bank Warrants remain in full force and effect.
A summary of the Company’s warrant activity for the year ended December 31, 2019 was as follows:
|
Shares of Stock under Warrants
|
Weighted-
Average
Exercise
Price
|
Weighted-
Average
Remaining
Contractual
Term
|
Aggregate
Intrinsic
Value
|
|||||||||
|
Outstanding at January 1, 2019
|
4,062,507
|
|
$
|
6.32
|
|
4.67
|
||||||
|
Granted
|
32,023,503
|
|
$
|
0.57
|
|
4.84
|
||||||
|
Exercised
|
(11,678,458
|
)
|
$
|
0.07
|
|
$
|
10,457,345
|
|
||||
|
Canceled
|
(1,502
|
)
|
$
|
59.90
|
|
|||||||
|
Outstanding at December 31, 2019
|
24,406,050
|
|
$
|
1.76
|
|
4.82
|
$
|
7,932,689
|
|
|||
During the year ended December 31, 2019, the Company recognized debt issuance costs of
$675,617
for warrants issued in 2019. During the year ended December 31, 2018, the Company recognized debt issuance costs of
$176,813
, IPO offering costs of
$361,149
and expensed
$165,000
for warrants issued in 2018.
84
Subsequent to December 31, 2019, on March 2, 2020, the Company entered into a Warrants Amendment and Agreement with certain holders of warrants that were exercisable of
3,200,000
shares of common stock. The agreement reduced the exercise price of existing warrants from
$.86
per share to
$0.75
per share, which were exercised following the amendment, in addition to issuing
3,200,000
new warrants at an exercise price per share of
$1.06
that are exercisable
six months
from the date of issuance and have a contractual term of five years, six months.
2018 Equity Incentive Plan
In August 2018, the Company’s board of directors (the “Board”) and its stockholders adopted the 2018 Equity Incentive Plan (the “2018 Plan”), as a successor to and continuation of the Company’s 2006 Equity Incentive Plan (the “2006 Plan”). Under the 2018 Plan, the Company may grant stock options, stock appreciation rights, restricted stock, restricted stock units and other awards to individuals who are then its employees, directors and consultants, including employees and consultants of its affiliates. The Company has initially reserved
1,499,454
shares of common stock for issuance under the 2018 Plan, which is the sum of (1)
1,000,000
new shares, plus (2) the number of shares that remained available for issuance under the 2006 Plan at the time the 2018 Plan became effective, and (3) any shares subject to outstanding stock options or other stock awards that were granted under the 2006 Plan that would have otherwise returned to the 2006 Plan. In addition, the number of shares of common stock reserved for issuance under the 2018 Plan will automatically increase on January 1 of each calendar year, starting on January 1, 2019 through January 1, 2028, in an amount equal to
5%
of the total number of shares of the Company’s capital stock outstanding on the last day of the calendar month before the date of each automatic increase, or a lesser number of shares determined by the Board. As of
December 31, 2019
,
196,731
shares of common stock were authorized for future grants under the 2018 Plan.
Stock Options
A summary of the Company’s stock option activity under the 2018 Plan and 2006 Plan is as follows:
|
Shares of Stock under Stock Options
|
Weighted-
Average Exercise Price |
Weighted-
Average Remaining Contractual Term |
Aggregate
Intrinsic Value |
||||||||
|
Outstanding at January 1, 2018
|
436,341
|
$
|
5.14
|
|
9.0
|
|
|
||||
|
Granted
|
886,023
|
$
|
7.69
|
|
|
|
|||||
|
Exercised
|
(2,062)
|
$
|
1.70
|
|
$
|
6,046
|
|
||||
|
Canceled
|
(37,455)
|
$
|
5.20
|
|
|
|
|||||
|
Outstanding at December 31, 2018
|
1,282,847
|
$
|
6.90
|
|
9.2
|
|
|
||||
|
Granted
|
716,960
|
$
|
3.78
|
|
|
|
|||||
|
Exercised
|
(50,665)
|
$
|
1.30
|
|
$
|
151,819
|
|
||||
|
Canceled
|
(206,230)
|
$
|
7.20
|
|
|
|
|||||
|
Outstanding at December 31, 2019
|
1,742,912
|
$
|
5.73
|
|
8.2
|
$
|
4,356
|
|
|||
|
Vested and expected to vest at December 31, 2019
|
1,709,588
|
$
|
5.81
|
|
8.2
|
$
|
4,356
|
|
|||
|
Vested and exercisable at December 31, 2019
|
817,026
|
$
|
6.33
|
|
7.4
|
$
|
—
|
|
|||
The weighted-average grant date fair value of stock option grants during the years ended
December 31, 2019
and
2018
was
$2.16
and
$6.99
, respectively. The contractual term of stock options granted to employees was
10 years
, which is also the maximum contractual term permitted for stock options (and stock appreciation rights) issued under the 2018 Plan. Stock options generally vest or become exercisable monthly over a four-year period.
Stock-Based Compensation Expense
The Company recognized stock-based compensation expense for the years ended
December 31, 2019
and
2018
was as follows:
|
Year Ended
December 31, |
|||||||
|
2019
|
2018
|
||||||
|
Research and development
|
$
|
240,692
|
|
$
|
260,840
|
|
|
|
General and administrative
|
1,105,331
|
|
933,033
|
|
|||
|
Total stock-based compensation expense
|
$
|
1,346,023
|
|
$
|
1,193,873
|
|
|
85
The weighted-average assumptions used in the Black-Scholes-Merton option pricing model to determine the fair value of the employee stock option grants were as follows:
|
Year Ended December 31,
|
|||
|
2019
|
2018
|
||
|
Risk-free interest rate
|
2.4%
|
2.9%
|
|
|
Expected volatility
|
66.7%
|
62.1%
|
|
|
Expected term (in years)
|
5.1
|
5.2
|
|
|
Expected dividend yield
|
0.0%
|
0.0%
|
|
Risk-free interest rate.
The risk-free rate assumption is based on the U.S. Treasury instruments, the terms of which were consistent with the expected term of the Company’s stock options.
Expected volatility.
Due to the Company’s limited operating history and lack of company-specific historical or implied volatility as a private company, the expected volatility assumption was determined by examining the historical volatilities of a group of industry peers whose share prices are publicly available.
Expected term.
The expected term of stock options represents the weighted-average period the stock options are expected to be outstanding. The Company does not have sufficient historical exercise data to provide a reasonable basis upon which to estimate expected term due to the limited period of time its equity shares have been publicly traded. As a result, the Company uses the simplified method for estimating the expected term as provided by the Securities and Exchange Commission. The simplified method calculates the expected term as the average of the time-to-vesting and the contractual life of the options.
Expected dividend yield.
The expected dividend assumption is based on the Company’s history and expectation of dividend payouts. The Company has not paid and does not intend to pay dividends.
Forfeitures
. The Company reduces stock-based compensation expense for actual forfeitures during the period.
As of
December 31, 2019
, the unrecognized compensation cost related to outstanding stock options was
$2,512,964
and is expected to be recognized as expense over approximately
2.2
years.
Employee Stock Purchase Plan
In August 2018, the Board and the Company’s stockholders adopted the 2018 Employee Stock Purchase Plan (the “ESPP”). A total of
175,000
shares of common stock were initially reserved for issuance under the ESPP. In addition, the number shares of common stock reserved for issuance under the ESPP will automatically increase on January 1 of each calendar year, beginning on January 1, 2019,
through January 1, 2028, by the lesser of (1)
1%
of the total number of shares of the Company’s common stock outstanding on the last day of the calendar month before the date of the automatic increase, (2)
220,000
shares, or (3) a lesser number of shares as determined by the Board.
As of
December 31, 2019
,
165,402
shares of common stock were authorized for future grants under the ESPP.
86
9. Commitments and Contingencies
Leases
The Company leases certain office and lab space in San Diego, California under a non-cancelable operating lease, which has been amended from-time-to-time to expand the space and extend the term, which is currently through December 2025. In November 2018, the Company entered into a sublease agreement (the “Sublease”) whereby a subtenant agreed to lease a portion of the office and lab space from the Company through December 2020.
Rent expense was
$171,796
and
$556,321
for the years ended
December 31, 2019
and
2018
, respectively, including the offsets for amortization of the leasehold incentive obligation of
$225,052
for each of the years ended
December 31, 2019
and
2018
and sublease rental income of
$422,116
and
$35,176
for the years ended December 31, 2019 and 2018, respectively.
The future minimum lease payments required under non-cancelable leases as of
December 31, 2019
, are summarized as follows:
|
Year Ending December 31,
|
Gross Payments
|
Scheduled Sublease Payments
|
Net Payments
|
||||||||
|
2020
|
$
|
902,412
|
|
$
|
(464,334
|
)
|
$
|
438,078
|
|
||
|
2021
|
611,061
|
|
—
|
|
611,061
|
|
|||||
|
2022
|
638,740
|
|
—
|
|
638,740
|
|
|||||
|
2023
|
666,411
|
|
—
|
|
666,411
|
|
|||||
|
2024
|
696,388
|
|
—
|
|
696,388
|
|
|||||
|
2025 and thereafter
|
728,671
|
|
—
|
|
728,671
|
|
|||||
|
Total minimum lease payments
|
$
|
4,243,683
|
|
$
|
(464,334
|
)
|
$
|
3,779,349
|
|
||
Royalty Agreements
The Company has entered into agreements to market and distribute chips and kits used in its instruments. The Company is obligated to pay royalties based on sales during each annual license period. Such royalty agreements extend through the life of underlying intellectual property which is affected by the patent filing date and jurisdiction.
Certain royalty agreements require the Company to make minimum payments regardless of the level of sales achieved. As of
December 31, 2019
, annual future minimum royalty payments total
$110,000
and are payable through November 2026.
Purchase Commitments
The Company has a contractual commitment with a supplier to purchase
$165,000
of products every
three
months for an initial term of
two
years beginning in March 2019. The contract can be terminated on
90
days written notice by either party.
Litigation
The Company is subject to potential liabilities under various claims and legal actions that are pending or may be asserted. These matters arise in the ordinary course and conduct of the business. The Company intends to continue to defend itself vigorously in such matters. The Company regularly assesses contingencies to determine the degree of probability and range of possible loss for potential accrual in the financial statements. An estimated loss contingency is accrued in the financial statements if it is probable that a liability has been incurred and the amount of the loss can be reasonably estimated. Based on the Company’s assessment, it currently does not have any amount accrued as it is not a defendant in any claims or legal actions.
87
10. Income Taxes
Significant components of the Company’s deferred tax assets at December 31, 2019 and 2018 are shown below.
|
December 31,
|
|||||||
|
2019
|
2018
|
||||||
|
Deferred tax assets:
|
|||||||
|
Net operating loss carryforwards
|
$
|
41,780,806
|
|
$
|
35,104,728
|
|
|
|
Research and development credits
|
5,007,178
|
|
4,577,582
|
|
|||
|
Other
|
1,406,893
|
|
1,725,577
|
|
|||
|
Total
|
48,194,877
|
|
41,407,887
|
|
|||
|
Less: valuation allowance
|
(48,194,877
|
)
|
(41,407,887
|
)
|
|||
|
Deferred tax assets, net of valuation allowance
|
$
|
—
|
|
$
|
—
|
|
|
The provision for domestic and foreign income taxes is as follows:
|
Years Ended December 31,
|
|||||||
|
2019
|
2018
|
||||||
|
Current:
|
|||||||
|
Foreign
|
$
|
19,492
|
|
$
|
13,955
|
|
|
|
State and local
|
1,556
|
|
1,556
|
|
|||
|
Income tax provision
|
$
|
21,048
|
|
$
|
15,511
|
|
|
The domestic and foreign components of income (loss) from continuing operations are as follows:
|
Years Ended December 31,
|
|||||||
|
2019
|
2018
|
||||||
|
Domestic
|
$
|
(29,851,428
|
)
|
$
|
(18,515,638
|
)
|
|
|
Foreign
|
57,406
|
|
34,757
|
|
|||
|
Loss before provision for income taxes
|
$
|
(29,794,022
|
)
|
$
|
(18,480,881
|
)
|
|
A reconciliation of the income tax computed at the federal statutory tax rate to the expense for income taxes are as follows:
|
December 31,
|
|||||||
|
2019
|
2018
|
||||||
|
Income taxes at statutory rate
|
$
|
(6,256,953
|
)
|
$
|
(3,880,985
|
)
|
|
|
State income taxes, net of federal benefits
|
(529,351
|
)
|
(476,179
|
)
|
|||
|
Change in valuation allowance
|
6,786,990
|
|
5,617,471
|
|
|||
|
Other permanent differences
|
449,958
|
|
95,852
|
|
|||
|
Research credits
|
(429,596
|
)
|
(502,511
|
)
|
|||
|
Change in fair value of warrants
|
—
|
|
(838,137
|
)
|
|||
|
Income tax expense
|
$
|
21,048
|
|
$
|
15,511
|
|
|
As of
December 31, 2019
, the Company has federal and state tax net operating loss carryforwards of
$176.9 million
and
$66.0 million
, respectively. The federal tax loss carryforwards include
$47.9 million
that do not expire but utilization is limited to 80% of the Company's taxable income in any given tax year based on current federal tax laws. The remaining federal tax loss carryforwards of
$129.0 million
and state tax loss carryforwards begin to expire in 2027 and 2023, respectively, unless previously utilized. As of December 31, 2019, the Company also has federal and California research credit carryforwards of
$4.9 million
and
$4.4
million, respectively. The federal research credit carryforwards begin to expire in 2027 unless previously utilized. The California research credits carry forward indefinitely.
Management assesses all available evidence to estimate if sufficient future taxable income will be generated to use the existing deferred tax assets. The Company has experienced net losses since inception, and the revenue and income potential of the Company’s business and market are unproven. Due to the Company’s continuing research and development activities, the Company expects to continue to incur net losses into the foreseeable future. As such, the Company cannot conclude that it is more likely than not that its deferred tax assets will be realized.
88
In addition, utilization of net operating losses and research and development (“R&D”) credit carryforwards may be subject to limitations due to ownership changes that have occurred or that could occur in the future in accordance with applicable provisions of the Internal Revenue Code of 1986, as amended (the “Code”), as well as similar state and foreign provisions.
In 2013, the Company completed its analysis for the period from inception through December 31, 2012, and determined the ownership changes had not resulted in any limitations on the existing net operating losses and R&D credits. However, there may have been ownership changes subsequent to December 31, 2012, that could limit the Company’s ability to utilize the net operating loss and R&D credit carryforwards. Given the Company's ongoing net operating losses, the Company does not expect to utilize any of the net operating loss and R&D credit carryforwards in the near-term but will complete an updated assessment prior to using any in the future.
A reconciliation of the beginning and ending amount of unrecognized tax benefits, excluding interest and penalties, are as follows:
|
December 31,
|
|||||||
|
2019
|
2018
|
||||||
|
Balance at beginning of the year
|
$
|
3,389,136
|
|
$
|
3,018,563
|
|
|
|
Increase related to current year positions
|
319,026
|
|
370,573
|
|
|||
|
Balance at the end of the year
|
$
|
3,708,162
|
|
$
|
3,389,136
|
|
|
Due to the valuation allowance position, none of the unrecognized tax benefits, if recognized, will impact the Company’s effective tax rate. The Company does not anticipate a significant change in the unrecognized tax benefits during the next twelve months.
The Company’s practice is to recognize interest and penalties related to income tax matters in income tax expense. The Company had no accrual of interest and penalties on the Company’s balance sheets and has not recognized interest and penalties in the statements of operations for the years ended December 31, 2019 and 2018.
The Company is subject to taxation in the United States and the United Kingdom. The Company is subject to examination by the United States and state authorities due to the carry forward of unutilized net operating losses and R&D credits.
11. Employee Benefits
The Company has a defined contribution 401(k) plan available to eligible employees. Under the terms of the plan, employees may make voluntary contributions as a percent of compensation, limited to the maximum amount allowable under federal tax regulations. The Company, at its discretion, may make certain contributions to the 401(k) plan. The Company expensed matching contributions of
$381,670
and
$272,507
for the years ended
December 31, 2019
and
2018
, respectively.
12. Quarterly Financial Data (unaudited)
The unaudited quarterly financial information should be read in conjunction with the financial statements and related notes included elsewhere in this report. The Company believes that the following unaudited information reflects all normal recurring adjustments necessary for a fair presentation of the information for the periods presented. The operating results for any quarter are not necessarily indicative of results for any future period. The following table contains selected unaudited financial data for each of the indicated periods:
|
Three months ended
|
||||||||||||||||
|
March 31,
|
June 30,
|
September 30,
|
December 31,
|
|||||||||||||
|
2019
|
||||||||||||||||
|
Revenue
|
$
|
1,852,746
|
|
$
|
2,174,635
|
|
$
|
3,312,997
|
|
$
|
2,789,130
|
|
||||
|
Cost of Revenue
|
$
|
1,147,042
|
|
$
|
1,555,246
|
|
$
|
2,375,100
|
|
$
|
1,690,759
|
|
||||
|
Operating Expenses
|
$
|
6,890,713
|
|
$
|
7,463,697
|
|
$
|
6,622,993
|
|
$
|
8,258,864
|
|
||||
|
Net Loss
|
$
|
(7,851,743
|
)
|
$
|
(7,664,566
|
)
|
$
|
(6,398,166
|
)
|
$
|
(7,900,595
|
)
|
||||
|
2018
|
||||||||||||||||
|
Revenue
|
$
|
1,768,485
|
|
$
|
3,390,009
|
|
$
|
2,828,704
|
|
$
|
4,013,537
|
|
||||
|
Cost of Revenue
|
$
|
841,449
|
|
$
|
1,813,430
|
|
$
|
3,068,332
|
|
$
|
2,988,115
|
|
||||
|
Operating Expenses
|
$
|
5,262,497
|
|
$
|
5,588,800
|
|
$
|
5,729,212
|
|
$
|
7,123,985
|
|
||||
|
Net Loss
|
$
|
(3,847,362
|
)
|
$
|
(3,311,476
|
)
|
$
|
(4,926,097
|
)
|
$
|
(6,411,457
|
)
|
||||
89
Item 9. Changes in and Disagreements With Accountants on Accounting and Financial Disclosure.
None.
Item 9A. Controls and Procedures.
Evaluation of Disclosure Controls and Procedures
Our management, with the participation of our principal executive and financial officer, evaluated the effectiveness of our disclosure controls and procedures as of December 31, 2019. The term “disclosure controls and procedures,” as defined in Rules 13a-15(e) and 15d-15(e) under the Securities Exchange Act of 1934, as amended (the “Exchange Act”), means controls and other procedures of a company that are designed to ensure that information required to be disclosed by a company in the reports that it files or submits under the Exchange Act is recorded, processed, summarized and reported, within the time periods specified in the SEC’s rules and forms. Disclosure controls and procedures include, without limitation, controls and procedures designed to ensure that information required to be disclosed by a company in the reports that it files or submits under the Exchange Act is accumulated and communicated to the company’s management, including its principal executive and principal financial officers, as appropriate to allow timely decisions regarding required disclosure. Management recognizes that any controls and procedures, no matter how well designed and operated, can provide only reasonable assurance of achieving their objectives and management necessarily applies its judgment in evaluating the cost-benefit relationship of possible controls and procedures.
Based on the evaluation of our disclosure controls and procedures as of December 31, 2019, our principal executive and financial officer concluded that, as of such date, our disclosure controls and procedures were not effective at a reasonable assurance level as a result of the material weakness that existed in our internal control over financial reporting as described below.
Management's Annual Report on Internal Control over Financial Reporting
Our management is responsible for establishing and maintaining adequate internal control over financial reporting as such term as defined in Exchange Act Rule 13a-15(f). Internal control over financial reporting is a process designed under the supervision and with the participation of our management, including our principal executive and financial officer, to provide reasonable assurance regarding the reliability of financial reporting and the preparation of financial statements for external purposes in accordance with accounting principles generally accepted in the United States of America.
Material Weaknesses in Internal Control over Financial Reporting
During the preparation of our consolidated financial statements for the year ended December 31, 2019, our management assessed the effectiveness of our internal control over financial reporting using the criteria set forth by the Committee of Sponsoring Organizations of the Treadway Commission in Internal Control-Integrated Framework (2013 Framework). Based on this assessment, our management determined that, as of December 31, 2019, there was a material weakness in our internal control environment over financial reporting because we did not have a sufficient number of resources to support the growth and complexity of our financial reporting requirements.
A material weakness is a deficiency, or a combination of deficiencies, in internal control over financial reporting, such that a reasonable possibility exists that a material misstatement of our annual or interim financial statements would not be prevented or detected on a timely basis. The foregoing material weakness contributed to a material weakness in our control activities based on the criteria set forth in the 2013 Framework. Specifically, the design of certain controls did not adequately provide appropriate segregation of duties and allow timely completion of financial reporting and accounting activities. The failure to maintain appropriate segregation of duties had a pervasive impact and as such, this deficiency resulted in a risk that could have impacted all financial statement account balances and disclosures. The material weaknesses did not result in any identified material misstatements to our financial statements, and there were no changes to previously released financial results.
Changes in Internal Control over Financial Reporting
Other than the continuation of the implementation of measures described below, there were no material changes in our internal control over financial reporting during the quarter ended December 31, 2019 that have materially affected, or are reasonably likely to materially affect, our internal control over financial reporting.
Remediation of Material Weaknesses
Management has been actively engaged in developing and implementing a remediation plan to address the material weaknesses described above. The remediation efforts that are in process or expected to be implemented include the following:
90
•
management has engaged external consultants to assist with our internal accounting functions and further enhance our internal controls which has increased the number of personnel involved in financial reporting.
•
we are in the process of hiring a new Chief Financial Officer and other qualified individuals that will increase the number of personnel involved in financial reporting and the control environment.
The additional resources and procedures described above are designed to enable us to broaden the scope and quality of our internal review of underlying information related to financial reporting and to formalize and enhance our internal control procedures. While the implementation of improved controls and procedures is ongoing, we have determined that as of March 10, 2020 the material weaknesses described above have not been fully remediated.
Attestation Report of the Registered Public Accounting Firm
This Annual Report on Form 10-K does not include an attestation report of our registered public accounting firm due to an exemption for “emerging growth companies.”
Item 9B. Other Information.
On March 6, 2020, we entered into a Second Amendment to Loan Agreement, or the Second LSA Amendment, with Innovatus to amend the Innovatus LSA. Among other things, the Second LSA Amendment amended a certain liquidity covenant, the procedure for cure with respect to our trailing 12 month revenue covenant and the projected revenues applicable to our trailing revenue covenant. The Second LSA Amendment also waived our non-compliance with respect to a trailing 12 month revenue covenant tested as of December 31, 2019. Pursuant to the Second LSA Amendment, we agreed to make a partial prepayment of principal in the amount of $2.1 million on the date of the Second LSA Amendment, which has been made, and an additional partial prepayment of principal in the amount of $2.9 million upon the earlier of April 30, 2020 or the closing of one or more equity financings during a specified period resulting in at least $15.0 million of gross proceeds to us in the aggregate. We also agreed to pay a waiver fee of $200,000 and a prepayment fee of $100,000 in connection with the aggregate prepayment of $5.0 million. The waiver fee and prepayment fee are payable in cash or shares of our common stock at our election. If we pay such fees in the form of common stock, we have agreed to register the resale of such shares on a Registration Statement on Form S-3 within 45 days following the issuance of such shares.
91
PART III
Item 10. Directors, Executive Officers and Corporate Governance.
The following table sets forth information regarding our directors and executive officers as of December 31, 2019.
|
Name
|
Age
|
Position
|
||
|
Executive Officers:
|
||||
|
R. Erik Holmlin, Ph.D.
|
52
|
President, Chief Executive Officer and Director
|
||
|
Warren Robinson
|
50
|
Chief Commercial Officer
|
||
|
Mark Oldakowski
|
46
|
Chief Operating Officer
|
||
|
Non-Employee Directors:
|
||||
|
David L. Barker, Ph.D.
(1)(2)
|
78
|
Chairman, Director
|
||
|
Albert Luderer, Ph.D.
(2)(3)
|
71
|
Director
|
||
|
Christopher Twomey
(2)
|
60
|
Director
|
||
|
Junfeng Wang
(1)(3)
|
45
|
Director
|
||
|
Kristiina Vuori, M.D., Ph.D.
(1)(3)
|
52
|
Director
|
||
|
(1)
|
Member of the compensation committee.
|
|
(2)
|
Member of the audit committee.
|
|
(3)
|
Member of the nominating and corporate governance committee.
|
Executive Officers
R. Erik Holmlin, Ph.D.
Dr. Holmlin has served as our President and Chief Executive Officer and as a member of our board of directors since January 2011. From June 2010 to February 2011, Dr. Holmlin served as president and Chief Executive Officer of GenVault Corporation, a private biosample management solutions company. Previously, Dr. Holmlin held positions as an entrepreneur in residence at Domain Associates, a dedicated life sciences venture capital firm; Chief Commercial Officer of Exiqon A/S, a publicly traded RNA research solutions company; founder and executive at GeneOhm Sciences, which was acquired by Becton Dickinson and Company; and a National Institutes of Health postdoctoral fellow at Harvard University. Until June 2016, Dr. Holmlin served as a director of Nanosphere, Inc., a publicly traded molecular diagnostic company, which was subsequently acquired by Luminex Corporation, a publicly traded biological testing company. Dr. Holmlin received his bachelor’s degree in chemistry from Occidental College, his Ph.D. in chemistry from the California Institute of Technology and MBAs from University of California, Berkeley and Columbia University. Our board of directors believes that Dr. Holmlin’s over 17 years of experience in the life sciences and healthcare industries, which includes the areas of technology development, product commercialization and venture financing, qualifies him to serve on our board of directors.
Warren Robinson.
Mr. Robinson has served as our Chief Commercial Officer since November 2017 and previously served as a Vice President with us in various sales and marketing functions from October 2015 to November 2017, including most recently as our Vice President of Global Sales and Marketing. From June 2013 to October 2015, Mr. Robinson served as Division Vice President of Aegis Chemical Solutions, LLC, a private oil production services company. Previously, Mr. Robinson held various leadership roles in sales-focused positions with Life Technologies Corporation, a publicly traded research tools development company acquired by Thermo Fisher Scientific Inc. in February 2014, and Invitrogen Corporation, a publicly traded research tools development company acquired by Life Technologies in January 2008. Mr. Robinson received his bachelor’s degree in biochemistry from The University of Lethbridge, a research university located in Canada.
Mark Oldakowski.
Mr. Oldakowski has served as our Chief Operating Officer since November 2017 and previously served as our Vice President, Product Development and Operations since October 2014. From December 2011 to August 2014, Mr. Oldakowski served as the Senior Director of Engineering and Chief Product Officer at Brooks Life Science Systems, a provider of automation and cryogenic solutions for the life science industry, and from April 2009 to October 2011 as a Director of Engineering at Affymetrix, Inc., a private life science systems company that was acquired by Thermo Fisher Scientific in March 2016. From December 2007 to April 2009, Mr. Oldakowski served as a Senior Manager and Core Team Leader of R&D for Siemens Healthcare Diagnostics, and for the prior 13 years, he developed sequencing and real-time PCR systems at Applied Biosystems, now a part of Thermo Fisher Scientific. Mr. Oldakowski received both his bachelor’s degree in electrical engineering and his master’s degree in computer and systems engineering from Rensselaer Polytechnic Institute.
Non-Employee Directors
David L. Barker, Ph.D.
Dr. Barker has served on our board of directors since May 2010, and as Chairman of our board of directors since August 2016. Dr. Barker also serves as a member of the board of directors of AmideBio, Singular Genomics Systems, Symbiotic
92
Systems, and Aspen Neuroscience. He is also a scientific advisor to MiNDERA Corp. and Luna DNA. He served as Vice President and Chief Scientific Officer at Illumina, Inc., from 2000 to 2007, and on the Illumina scientific advisory board until May 2016. He was previously on the Boards of NextBio, which was acquired by Illumina in 2013, ProteinSimple, which was acquired by Bio-Techne in 2014, Zephyrus Biosciences, Inc., acquired by Bio-Techne in 2016, IntegenX, acquired by Thermo Fisher Scientific in 2018, and Integrated Diagnostics, acquired by Biodesix in 2018. Dr. Barker served from 1998 to 2000 as Vice President and Chief Science Advisor at Amersham Biosciences, now part of General Electric. From 1988 to 1998, Dr. Barker held senior positions, including Vice President of Research and Business Development, at Molecular Dynamics, Inc., until the acquisition of Molecular Dynamics by Amersham. In his academic career, Dr. Barker conducted interdisciplinary research in neurobiology as a postdoctoral fellow at Harvard Medical School, Assistant Professor at the University of Oregon and Associate Professor at Oregon State University. Dr. Barker holds a BS with honors in Chemistry from the California Institute of Technology and a PhD in Biochemistry from Brandeis University.
Our board of directors believes Dr. Barker’s extensive experience in managing and leading early stage and established companies within the clinical diagnostic and biotechnology industries qualifies him to serve on our board of directors.
Albert Luderer, Ph.D.
Dr. Luderer has served on our board of directors since October 2011. Dr. Luderer currently serves as the Chief Executive Officer and a member of the board of directors of Indi Molecular, Inc., a synthetic antibody technology company, and as the Executive Chairman of the board of directors of Prostate Management Diagnostics Inc. Dr. Luderer has over 30 years of experience in executive leadership roles in the areas of technology development, operations and business development. Dr. Luderer received his bachelor’s degree in zoology from Drew University and his MS in immunochemistry and Ph.D. in immunogenics from Rutgers University. Our board of directors believes Dr. Luderer’s experience in the biotechnology sector, with special focuses on technology, business development and commercialization, qualifies him to serve on our board of directors.
Christopher J. Twomey
has served on our board of directors since July 2018. Since August 2013, Mr. Twomey has served as a director and Chairman of the Audit Committee of Tandem Diabetes Care, Inc., a medical device company. From March 1990 to June 2007, Mr. Twomey served in various roles, including as Senior Vice President, Finance and Chief Financial Officer, at Biosite Incorporated, a medical diagnostics company. From October 1981 to March 1990, Mr. Twomey served as an audit manager for Ernst & Young, LLP. From March 2006 to November 2018, Mr. Twomey served as a director of Senomyx, Inc., a taste technologies company that was acquired by Firmenich in November 2018. From July 2006 to March 2014, Mr. Twomey also served as a director and Chairman of the Audit Committee of Cadence Pharmaceuticals, Inc., a specialty pharmaceutical company that was acquired by Mallinckrodt plc in 2014. Mr. Twomey received his bachelors degree in Business Economics from the University of California at Santa Barbara. Mr. Twomey contributes substantial leadership skills and expertise in accounting and financial reporting that are especially valuable in his role as Chairman of our Audit Committee.
Junfeng Wang.
Mr. Wang has served on our board of directors since February 2018. Since October 2009, Mr. Wang has served as a Managing Director of Legend Capital, and held previous positions with Legend Capital as Executive Director from October 2007, Senior Vice President from October 2006 and Vice President from October 2005. Through his tenure at Legend Capital, Mr. Wang has worked in the healthcare and chemical industries, developing research and investment expertise in growth capital investment. Mr. Wang received his bachelor’s degree in polymer chemistry from Lanzhou University, a research university located in China, and his MBA from McMaster University, a research university located in Canada.
Our board of directors believes Mr. Wang’s extensive experience as a venture capital investor in the healthcare and chemical industries qualifies him to serve on our board of directors.
Kristiina Vuori, M.D., Ph.D.
has served on our board of directors since May 2019. Since January 2010, Dr. Vuori has served as President of Sanford Burnham Prebys Medical Discovery Institute, or the Institute, a non-profit research organization with major research programs in cancer, neurodegeneration, diabetes, and infectious, inflammatory, and childhood diseases. In addition, Dr. Vuori has also held the Pauline and Stanley Foster Presidential Chair at the Institute since January 2010 and served as the Institute’s interim Chief Executive Officer from January 2013 to September 2014, and from September 2017 to present. Since January 1995, Dr. Vuori has served as a Professor at the Institute’s National Cancer Institute designated Cancer Center, an interdisciplinary basic and translational research effort mobilizing over 400 scientists. In addition, from July 2014 to September 2017, Dr. Vuori served on the board of directors of WebMD, and she serves or has served in the past five years on the boards of directors of the American Association for Cancer Research, the California Institute for Regenerative Medicine, and the California Breast Cancer Research Council. Dr. Vuori earned her M.D. and Ph.D. from the University of Oulu, Finland. Our board of directors believes that Dr. Vuori’s experience in biomedical research and as an educator of research scientists, her experience managing a large non-profit research organization, and her various leadership roles qualify her to serve on our board of directors.
Family Relationships
There are no family relationships among our directors, executive officers or persons nominated to become executive officers or directors.
93
Delinquent Section 16(a) Reports
Section 16(a) of the Exchange Act requires our directors and executive officers, and persons who own more than 10% of a registered class of our equity securities, to file with the SEC initial reports of ownership and reports of changes in ownership of our common stock and other equity securities. Officers, directors and greater than 10% stockholders are required by SEC regulation to furnish us with copies of all Section 16(a) forms they file.
To our knowledge, based solely on a review of the copies of such reports furnished to us and written representations that no other reports were required, during the fiscal year ended December 31, 2019, all Section 16(a) filing requirements applicable to our officers, directors and greater than 10% beneficial owners of our capital stock were complied with.
Board Leadership Structure
Our board of directors is currently chaired by Dr. Barker, who has authority, among other things, to call and preside over board of directors meetings, to set meeting agendas and to determine materials to be distributed to the board of directors. Accordingly, the chairperson of our board of directors has substantial ability to shape the work of the board of directors. We believe that separation of the positions of chairperson and chief executive officer reinforces the independence of our board of directors in its oversight of our business and affairs. In addition, we have a separate chair for each committee of our board of directors. The chair of each committee is expected to report annually to our board of directors on the activities of their committee in fulfilling their responsibilities as detailed in their respective charters or specify any shortcomings should that be the case.
Role of the Board in Risk Oversight
The audit committee of our board of directors is primarily responsible for overseeing our risk management processes on behalf of our board of directors. Going forward, we expect that the audit committee will receive reports from management at least quarterly regarding our assessment of risks. In addition, the audit committee reports regularly to our board of directors, which also considers our risk profile. The audit committee and our board of directors focus on the most significant risks we face and our general risk management strategies. While our board of directors oversees our risk management, management is responsible for day-to-day risk management processes. Our board of directors expects management to consider risk and risk management in each business decision, to proactively develop and monitor risk management strategies and processes for day-to-day activities and to effectively implement risk management strategies adopted by the audit committee and our board of directors. We believe this division of responsibilities is the most effective approach for addressing the risks we face and that our board of directors’ leadership structure, which also emphasizes the independence of our board of directors in its oversight of its business and affairs, supports this approach.
Director Independence
Under the listing requirements and rules of Nasdaq, independent directors must comprise a majority of our board of directors as a listed company within one year of the listing date. Our board of directors has undertaken a review of the independence of each director. Based on information provided by each director concerning her or his background, employment and affiliations, our board of directors has determined that all of our directors, except Dr. Holmlin, are independent directors, as defined by Rule 5605(a)(2) of the Nasdaq Listing Rules.
Committees of Our Board of Directors
Our board of directors has established an Audit Committee, a Compensation Committee, and a Nominating and Corporate Governance Committee. The composition and responsibilities of each of the committees of our board of directors are described below. Members serve on these committees until their resignation or until otherwise determined by our board of directors. Our board of directors may establish other committees as it deems necessary or appropriate from time to time.
Audit Committee
Our audit committee consists of Mr. Twomey, Dr. Luderer and Dr. Barker, each of whom our board of directors has determined satisfies the independence requirements under the Nasdaq listing standards and Rule 10A-3(b)(1) of the Exchange Act. The chair of our audit committee is Mr. Twomey, who our board of directors has determined is an “audit committee financial expert” within the meaning of SEC regulations. Each member of our audit committee can read and understand fundamental financial statements in accordance with applicable requirements. In arriving at these determinations, the board of directors has examined each audit committee member’s scope of experience and the nature of their employment in the corporate finance sector.
The primary purpose of the audit committee is to discharge the responsibilities of our board of directors with respect to our corporate accounting and financial reporting processes, systems of internal control and financial-statement audits, and to oversee our independent registered accounting firm. Specific responsibilities of our audit committee include:
94
|
•
|
helping our board of directors oversee our corporate accounting and financial reporting processes;
|
|
•
|
managing the selection, engagement, qualifications, independence and performance of a qualified firm to serve as the independent registered public accounting firm to audit our financial statements;
|
|
•
|
discussing the scope and results of the audit with the independent registered public accounting firm, and reviewing, with management and the independent accountants, our interim and year-end operating results;
|
|
•
|
developing procedures for employees to submit concerns anonymously about questionable accounting or audit matters;
|
|
•
|
reviewing related person transactions;
|
|
•
|
obtaining and reviewing a report by the independent registered public accounting firm at least annually, that describes our internal quality control procedures, any material issues with such procedures, and any steps taken to deal with such issues when required by applicable law; and
|
|
•
|
approving, or, as permitted, pre-approving, audit and permissible non-audit services to be performed by the independent registered public accounting firm.
|
Compensation Committee
Our compensation committee consists of Dr. Barker, Mr. Wang and Dr. Vuori. The chair of our compensation committee is Dr. Barker. Our board of directors has determined that each member of the compensation committee is independent under the Nasdaq listing standards, a “non-employee director” as defined in Rule 16b-3 promulgated under the Exchange Act and an “outside director” as that term is defined in Section 162(m) of the Code.
The primary purpose of our compensation committee is to discharge the responsibilities of our board of directors in overseeing our compensation policies, plans and programs and to review and determine the compensation to be paid to our executive officers, directors and other senior management, as appropriate. Specific responsibilities of our compensation committee include:
|
•
|
reviewing and approving the compensation of our chief executive officer, other executive officers and senior management;
|
|
•
|
reviewing and recommending to our board of directors the compensation paid to our directors;
|
|
•
|
reviewing and approving the compensation arrangements with our executive officers and other senior management;
|
|
•
|
administering our equity incentive plans and other benefit programs;
|
|
•
|
reviewing, adopting, amending and terminating, incentive compensation and equity plans, severance agreements, profit sharing plans, bonus plans, change-of-control protections and any other compensatory arrangements for our executive officers and other senior management;
|
|
•
|
reviewing, evaluating and recommending to our board of directors succession plans for our executive officers; and
|
|
•
|
reviewing and establishing general policies relating to compensation and benefits of our employees, including our overall compensation philosophy.
|
Nominating and Corporate Governance Committee
Our nominating and corporate governance committee consists of Dr. Luderer, Mr. Wang and Dr. Vuori. The chair of our nominating and corporate governance committee is Dr. Luderer. Our board of directors has determined that each member of the nominating and corporate governance committee is independent under the Nasdaq listing standards, a non-employee director, and free from any relationship that would interfere with the exercise of his or her independent judgment.
Specific responsibilities of our nominating and corporate governance committee include:
|
•
|
identifying and evaluating candidates, including the nomination of incumbent directors for reelection and nominees recommended by stockholders, to serve on our board of directors;
|
|
•
|
considering and making recommendations to our board of directors regarding the composition and chairmanship of the committees of our board of directors;
|
|
•
|
instituting plans or programs for the continuing education of our board of directors and orientation of new directors;
|
|
•
|
developing and making recommendations to our board of directors regarding corporate governance guidelines and matters; and
|
95
|
•
|
overseeing periodic evaluations of the board of directors’ performance, including committees of the board of directors and management.
|
Code of Business Conduct and Ethics
We have adopted a code of business conduct and ethics that applies to all our employees, officers and directors. This includes our principal executive officer, principal financial officer and principal accounting officer or controller, or persons performing similar functions. The full text of our code of business conduct and ethics will be posted on our website at www.bionanogenomics.com. If we make any substantive amendments to the code of business conduct and ethics or grant any waiver from a provision of the code of business conduct and ethics to any executive officer or director, we will promptly disclose the nature of the amendment or waiver on our website. Information contained in, or that can be accessed through, our website is not incorporated by reference into this Annual Report, and you should not consider information on our website to be part of this Annual Report.
Item 11. Executive Compensation.
Our named executive officers for the year ended December 31, 2019, consisting of our principal executive officer, the next two most highly compensated executive officers and a former executive officer who would have been included among our highest compensated executive officers but for the fact that he was not serving as an officer as of December 31, 2019, were:
|
•
|
R. Erik Holmlin, Ph.D., our Chief Executive Officer;
|
|
•
|
Mike Ward, our former Chief Financial Officer
(1)
;
|
|
•
|
Warren Robinson, our Chief Commercial Officer; and
|
|
•
|
Mark Oldakowski, our Chief Operating Officer.
|
(1)
Mr. Ward terminated service with us effective December 6, 2019.
Summary Compensation Table
The following table presents all of the compensation awarded to or earned by or paid to our named executive officers during the fiscal year ended December 31, 2019.
|
Name and Principal Position
|
Year
|
Salary
($) |
Bonus
($) |
Option
Awards (1) ($) |
Non-Equity
Incentive Plan Compensation (2) ($) |
All Other
Compensation (3) ($) |
Total
($) |
|||||||||||||
|
R. Erik Holmlin, Ph.D.
|
2019
|
403,636
|
|
—
|
|
351,002
|
|
132,392
|
|
11,560
|
|
898,590
|
|
|||||||
|
Chief Executive Officer
|
2018
|
389,986
|
|
—
|
|
1,993,316
|
|
132,595
|
|
11,360
|
|
2,527,257
|
|
|||||||
|
Mike Ward
|
2019
|
289,874
|
|
—
|
|
145,242
|
|
—
|
|
11,560
|
|
446,676
|
|
|||||||
|
Former Chief Financial Officer
|
2018
|
289,061
|
|
—
|
|
463,014
|
|
78,241
|
|
11,360
|
|
841,676
|
|
|||||||
|
Warren Robinson
|
2019
|
305,325
|
|
—
|
|
145,242
|
|
72,667
|
|
11,560
|
|
534,794
|
|
|||||||
|
Chief Commercial Officer
|
2018
|
295,000
|
|
—
|
|
502,253
|
|
88,795
|
|
11,360
|
|
897,408
|
|
|||||||
|
Mark Oldakowski
|
2019
|
305,325
|
|
—
|
|
145,242
|
|
84,727
|
|
11,560
|
|
546,854
|
|
|||||||
|
Chief Operating Officer
|
2018
|
295,000
|
|
—
|
|
258,710
|
|
47,354
|
|
11,360
|
|
612,424
|
|
|||||||
|
(1)
|
In accordance with SEC rules, this column reflects the aggregate grant date fair value of stock options granted to our named executive officers during fiscal years ended December 31, 2018 and December 31, 2019 under our 2018 Plan, as determined in accordance with the provisions of FASB ASC Topic 718. The valuation assumptions used in calculating their fair value of the stock options are included in Note 8 to our financial statements included elsewhere in this Annual Report. These amounts do not reflect the actual economic value that may be realized by the named executive officer upon the vesting of the stock options, the exercise of the stock options, or the sale of the common stock underlying such stock options.
|
|
(2)
|
Amounts reported represent bonuses earned for 2018 and paid in 2019 and earned in 2019 and paid in 2020 at the discretion of our board of directors.
|
|
(3)
|
Amounts for 2018 reflect $11,000 for 401(k) matching contributions and $360 for life insurance premiums and amounts for 2019 reflect $11,200 for 401(k) matching contributions and $360 for life insurance premiums.
|
|
(4)
|
Mr. Ward terminated services with us effective December 6, 2019.
|
96
Annual Base Salary
The compensation of our named executive officers is generally determined and approved by our board of directors, based on the recommendation of the compensation committee of our board of directors. The 2019 base salaries that became effective as of January 1, 2019 were as follows:
|
NAME
|
2019 BASE
SALARY ($) |
||
|
R. Erik Holmlin, Ph.D.
|
403,636
|
|
|
|
Mike Ward
|
308,493
|
|
|
|
Warren Robinson
|
305,325
|
|
|
|
Mark Oldakowski
|
305,325
|
|
|
Bonus Opportunity
In addition to base salaries, our named executive officers are eligible to receive annual performance-based cash bonuses, which are designed to provide appropriate incentives to our executives to achieve defined annual performance goals and to reward our executives for individual achievement towards these goals. The annual performance-based bonus each named executive officer is eligible to receive is generally based on the extent to which we achieve the corporate goals that our compensation committee establishes each year and, for all except Dr. Holmlin, the individual’s contributions to such achievements. Dr. Holmlin’s payout is based entirely on Company performance, Mr. Robinson’s payout is based upon our achievement of certain specified revenue objectives and Mr. Ward’s and Mr. Oldakowski’s payouts are based on Company performance (50% weighting) and individual performance (50% weighting). At the end of the year, our board of directors reviews each executive’s performance and determines the actual bonus payout to be awarded to each of our named executive officers.
For 2019, the target bonus for Dr. Holmlin was 40% of base salary, for Mr. Ward was 30% of base salary, for Mr. Robinson was a range of 35%-75% of base salary and for Mr. Oldakowski was 30% of base salary. Our corporate performance objectives for 2019, as established by our compensation committee, included achievement of our 2019 operating plan, completion of market development goals, accomplishment of product development milestones, and securing additional financing. In February 2020, our board of directors approved a 82% overall achievement level of our corporate goals and awarded bonuses to our named executive officers, except for Mr. Ward, who terminated service prior to year-end, based on Company achievements and, except for Dr. Holmlin, on individual performance in 2019.
Equity-Based Incentive Awards
We believe that our ability to grant equity-based awards is a valuable and necessary compensation tool that aligns the long-term financial interests of our employees, consultants and directors with the financial interests of our stockholders. In addition, we believe that our ability to grant equity-based awards helps us to attract, retain and motivate employees, consultants and directors, and encourages them to devote their best efforts to our business and financial success. Our board of directors is responsible for approving equity grants. Vesting of equity awards is generally tied to continuous service with us and serves as an additional retention measure. Our executives generally are awarded an initial new hire grant upon commencement of employment. Additional grants may occur periodically in order to specifically incentivize executives with respect to achieving certain corporate goals or to reward executives for exceptional performance.
Prior to our August 2018 initial public offering, or the IPO, we granted all equity awards pursuant to the 2006 Plan. Following our IPO, we have granted all equity awards pursuant to the 2018 Plan. All options are granted with a per share exercise price equal to no less than the fair market value of a share of our common stock on the date of the grant of such award. Generally our stock option awards vest over a four-year period subject to the holder’s continuous service to us.
In March 2019, our board of directors granted options to purchase 145,000 shares to Dr. Holmlin, 60,000 shares to Mr. Ward, 60,000 shares to Mr. Robinson, 60,000 shares to Mr. Oldakowski. Each option has an exercise price of $4.25 per share and vests as follows: shares subject to the option vest monthly over 48 months beginning on the one-month anniversary of the vesting commencement date, such that the option shall be fully vested and exercisable on the four-year anniversary of the vesting commencement date, provided in each case that the holder is then providing services to us in accordance with the terms of the 2018 Plan. For additional information, please see below under “Outstanding Equity Awards at Fiscal Year-End.”
Agreements with Our Named Executive Officers
97
Below are descriptions of our employment agreements with our named executive officers. For a discussion of the severance pay and other benefits to be provided in connection with a termination of employment and/or a change in control under the arrangements with our named executive officers, please see “-Potential Payments upon Termination or Change in Control” below.
Dr. Holmlin
. We entered into an employment agreement with Dr. Holmlin in January 2011, as amended in March 2011 and in November 2017, which governs the current terms of his employment with us. Pursuant to the agreement, as amended, Dr. Holmlin was entitled to an initial annual base salary of $315,000 (subsequently increased to $403,636) and is eligible to receive an annual performance bonus with a target of 40% of his base salary, with a higher amount possible if goals exceeding target are achieved, as determined by our compensation committee and subject to approval by our board of directors. In addition, Dr. Holmlin was eligible to receive an option to purchase shares of the Company’s common stock representing 5.0% of the fully-diluted equity shares immediately subsequent to the closing of a Series B transaction, which were equal to 2,992 shares of our common stock and were granted in 2011. In addition, Dr. Holmlin’s agreement provided for additional options to be granted in connection with specified events in order to maintain Dr. Holmlin’s ownership percentage, pursuant to which Dr. Holmlin was granted additional options to purchase 1,115 shares in 2012 and 2,546 shares in 2015. No obligations to make additional grants to maintain Dr. Holmlin’s ownership percentage remain under his employment agreement. Dr. Holmlin’s employment is at will.
Mr. Ward.
We entered into an employment agreement with Mr. Ward in July 2016, which governed the terms of his employment with us. Pursuant to the agreement, Mr. Ward was entitled to an initial annual base salary of $278,250 (subsequently increased to $308,493) and was eligible to receive an annual performance bonus with a target amount of up to 30% of his base salary, as determined by our board of directors. Mr. Ward’s employment with us ceased on December 6, 2019.
Mr. Robinson.
We entered into an employment agreement with Mr. Robinson in November 7, 2017, which governs the current terms of his employment with us. Pursuant to the agreement, Mr. Robinson was entitled to an initial annual base salary of $275,392 (subsequently increased to $305,325) and is eligible to receive an annual performance bonus with a target amount of up to 30% of his base salary (subsequently increased to 35%), as determined by our board of directors. Mr. Robinson’s employment is at will.
Mr. Oldakowski.
We entered into an employment agreement with Mr. Oldakowski in November 7, 2017, which governs the current terms of his employment with us. Pursuant to the agreement, Mr. Oldakowski was entitled to an initial annual base salary of $276,925 (subsequently increased to $305,325) and is eligible to receive an annual performance bonus with a target amount of up to 20% of his base salary (subsequently increased to 30%), as determined by our board of directors. Mr. Oldakowski’s employment is at will.
Potential Payments upon Termination or Change in Control
Regardless of the manner in which a named executive officer’s service terminates, each named executive officer is entitled to receive amounts earned during his term of service, including unpaid salary and unused vacation. In addition, each of our named executive officers is eligible to receive certain benefits pursuant to his employment agreement with us, as described below. For the definitions of “cause,” “good reason” and “disability” referenced below, please refer to the individual employment agreements with each of our named executive officers.
Dr. Holmlin
. Upon Dr. Holmlin’s termination for any reason other than death, disability, cause or resignation without good reason, and subject to Dr. Holmlin’s execution of a release, Dr. Holmlin shall be eligible to receive (i) a lump sum amount equal to nine months of base salary, (ii) accelerated vesting of any options or restricted shares that would have vested within 18 months after the date of termination and (iii) premiums for continued health coverage for nine months following the date of termination, or until Dr. Holmlin is no longer eligible for continuation coverage, whichever is earlier. In the event of termination due to disability, and subject to Dr. Holmlin’s execution of a release, Dr. Holmlin shall be eligible to receive accelerated vesting in full for any unvested portion of the options granted pursuant to his agreement. In the event of a deemed liquidation event (as defined in Dr. Holmlin’s employment agreement), the options granted to Dr. Holmlin pursuant to his agreement shall vest in full.
Mr. Ward
. Pursuant to the terms of Mr. Ward’s employment agreement in place prior to his separation, and subject to his execution of a release, Mr. Ward was eligible to receive (i) six months of continued base salary payments at the rate in effect at the time of termination and (ii) premiums for continued health coverage for six months following the date of termination or until Mr. Ward is no longer eligible for continuation coverage or he becomes eligible for new healthcare eligibility available through new employment, whichever is earlier. Mr. Ward’s services with us ceased on December 6, 2019, and he did not receive any severance payments in connection with such separation.
Mr. Robinson
. Upon termination without cause, and subject to Mr. Robinson’s execution of a release, Mr. Robinson will be eligible to receive (i) six months of continued base salary payments at the rate in effect at the time of termination and (ii) premiums for continued health coverage for six months following the date of termination or until Mr. Robinson is no longer eligible for continuation coverage or he becomes eligible for new healthcare eligibility available through new employment, whichever is earlier.
98
Mr. Oldakowski
. Upon termination without cause, and subject to Mr. Oldakowski’s execution of a release, Mr. Oldakowski will be eligible to receive (i) six months of continued base salary payments at the rate in effect at the time of termination and (ii) premiums for continued health coverage for six months following the date of termination or until Mr. Oldakowski is no longer eligible for continuation coverage or he becomes eligible for new healthcare eligibility available through new employment, whichever is earlier.
Each of our named executive officers holds stock options under the 2006 Plan and 2018 Plan that were granted subject to the general terms of the 2006 Plan or the 2018 Plan, as applicable, and the relevant form of stock option agreement. The specific vesting terms of each named executive officer’s stock options are described below under “-Outstanding Equity Awards at Fiscal Year-End.”
Outstanding Equity Awards at Fiscal Year-End
The following table presents information regarding outstanding equity awards held by our named executive officers as of December 31, 2019.
|
Option Awards
(1)
|
||||||||||||||
|
Name
|
Grant
Date |
Number of
Securities Underlying Unexercised Options Exercisable |
Number of
Securities Underlying Unexercised Options Unexercisable |
Option
Exercise Price Per Share (2) |
Option
Expiration Date |
|||||||||
|
R. Erik Holmlin, Ph.D
(6)
|
3/1/2019
(3)
|
27,187
|
|
117,813
|
|
$
|
4.25
|
|
2/28/2029
|
|||||
|
10/1/2018
(4)
|
138,9559
|
|
117,581
|
|
$
|
7.77
|
|
9/30/2028
|
||||||
|
2/7/2017
(5)
|
96,243
|
|
57,744
|
|
$
|
1.30
|
|
2/6/2027
|
||||||
|
1/29/2015
|
7,284
|
|
—
|
|
$
|
64.22
|
|
1/28/2025
|
||||||
|
6/20/2012
|
1,115
|
|
—
|
|
$
|
68.50
|
|
6/19/2022
|
||||||
|
5/16/2011
|
2,992
|
|
—
|
|
$
|
42.82
|
|
5/15/2021
|
||||||
|
Mike Ward
(6)
|
3/1/2019
|
11,250
|
|
—
|
|
$
|
4.25
|
|
2/28/2029
|
|||||
|
10/01/2018
|
32,227
|
|
—
|
|
$
|
7.77
|
|
9/30/2028
|
||||||
|
2/7/2017
|
21,388
|
|
—
|
|
$
|
1.30
|
|
2/6/2027
|
||||||
|
1/29/2015
|
889
|
|
—
|
|
$
|
64.20
|
|
1/28/2025
|
||||||
|
4/21/2014
|
612
|
|
—
|
|
$
|
81.34
|
|
4/20/2024
|
||||||
|
Warren Robinson
|
3/1/2019
(3)
|
11,250
|
|
48,750
|
|
$
|
4.25
|
|
2/28/2029
|
|||||
|
10/1/2018
(4)
|
35,013
|
|
29,627
|
|
$
|
7.77
|
|
9/30/2028
|
||||||
|
2/7/2017
(5)
|
27,269
|
|
1,817
|
|
$
|
1.30
|
|
2/6/2027
|
||||||
|
11/9/2015
|
1,168
|
|
—
|
|
$
|
64.22
|
|
11/8/2025
|
||||||
|
Mark Oldakowski
|
3/1/2019
(3)
|
11,250
|
|
48,750
|
|
$
|
4.25
|
|
2/28/2029
|
|||||
|
10/1/2018
(4)
|
32,277
|
|
27,318
|
|
$
|
7.77
|
|
9/30/2028
|
||||||
|
2/7/2017
(5)
|
32,081
|
|
2,138
|
|
$
|
1.30
|
|
2/6/2027
|
||||||
|
1/29/2015
|
541
|
|
—
|
|
$
|
64.22
|
|
1/28/2025
|
||||||
|
1/27/2014
|
1,086
|
|
—
|
|
$
|
64.22
|
|
1/26/2024
|
||||||
|
(1)
|
Option awards were granted under the 2006 Plan and 2018 Plan.
|
|
(2)
|
All of the option awards were granted with a per share exercise price equal to the fair market value of one share of our common stock on the date of grant, as determined in good faith by our board of directors.
|
|
(3)
|
Each option award vests as follows: The shares subject to the option vest monthly over 48 months beginning on the one-month anniversary of the vesting commencement date, such that the option shall be fully vested and exercisable on the four-year anniversary of the vesting commencement date.
|
|
(4)
|
Each option award vests as follows: 25% of the shares subject to the option vest on the date of grant and the balance of the shares vest in a series of 36 successive equal monthly installments thereafter, provided in each case that the holder is then providing services to us in accordance with the terms of the 2018 Plan.
|
|
(5)
|
Each option award vests as follows: 25% of the shares subject to the option are fully vested and 6.25% of the shares subject to the option vest at the end of each three month anniversary of the vesting commencement date, subject to single trigger acceleration of vesting in connection with a change of control, provided in each case that the holder is then providing services to us in accordance with the terms of the 2006 Plan.
|
99
|
(6)
|
All outstanding options under the 2006 option plan, held by Dr. Holmlin and Mr. Ward were amended by our board of directors in August 2018 to suspend the vesting until such time as the price of our common stock is at least $12.00 per share for 90 consecutive trading days, at which point the suspension will automatically and immediately lapse and the awards will vest to the extent they otherwise would have vested pursuant to their terms and notwithstanding the suspension and will continue to vest thereafter under their original vesting schedules. In addition, the suspension will lapse as to the awards held by Dr. Holmlin or Mr. Ward upon Dr. Holmlin's or Mr. Ward`s respective death, disability or upon a change in control of the Company, as such terms are defined in the 2018 Plan.
|
Perquisites, Health, Welfare and Retirement Benefits
All of our current named executive officers are eligible to participate in our employee benefit plans, including our medical, dental, vision, life, disability and accidental death and dismemberment insurance plans, in each case on the same basis as all of our other employees. We pay the premiums for the life, disability, accidental death and dismemberment insurance for all of our employees, including our named executive officers. In addition, we provide a 401(k) plan to our employees, including our named executive officers, as discussed in the section below entitled “-401(k) Plan.” We generally do not provide perquisites or personal benefits to our named executive officers.
Nonqualified Deferred Compensation
Our named executive officers did not participate in, or earn any benefits under, a nonqualified deferred compensation plan sponsored by us during the fiscal year ended December 31, 2019. Our board of directors may elect to provide our officers and other employees with nonqualified defined contribution or other nonqualified deferred compensation benefits in the future if it determines that doing so is in our best interests
Equity Benefit Plans
The principal features of our equity plans are summarized below. These summaries are qualified in their entirety by reference to the actual text of the plans, which are filed as exhibits to the registration statement of which this Annual Report is a part and are incorporated herein by reference.
2018 Equity Incentive Plan
Our 2018 Plan became effective upon the IPO following approval by our board of directors and our stockholders. As of December 31, 2019, there were
196,731
shares remaining available for the future grant of stock awards under the 2018 Plan. As of December 31, 2019, there were outstanding stock options covering a total of
1,419,177
shares of our common stock that were granted under the 2018 Plan.
Our 2018 Plan provides for the grant of incentive stock options, or ISOs, within the meaning of Section 422 of the Code, to employees, including employees of any parent or subsidiary, and for the grant of nonstatutory stock options, or NSOs, stock appreciation rights, restricted stock awards, restricted stock unit awards, performance stock awards, performance cash awards and other forms of stock awards to employees, directors and consultants, including employees and consultants of our affiliates. Our 2018 Plan is a successor to and continuation of our 2006 Plan. Our compensation committee has the authority, concurrent with our board of directors, to administer our 2018 Plan, and may also delegate to one or more of our officers certain authority under the terms of the 2018 Plan.
Stock options under the 2018 Plan are generally granted with an exercise price equal to the fair market value of our common stock on the date of grant. Options granted under the 2018 Plan vest at the rate specified in the stock option agreement as determined by the plan administrator. Options may have a term up to a maximum of 10 years. Unless the terms of an optionee’s stock option agreement provides otherwise, if an optionee’s service relationship with us, or any of our affiliates, ceases for any reason other than disability, death or cause, the optionee may generally exercise any vested options for a period of three months following the cessation of service. If an optionee’s service relationship with us, or any of our affiliates, ceases due to disability or death, or an optionee dies within a certain period following cessation of service, the optionee or a beneficiary may generally exercise any vested options for a period of 12 months in the event of disability and 18 months in the event of death. In the event of a termination for cause, options generally terminate immediately upon the termination of the individual. In no event may an option be exercised beyond the expiration of its term.
Our 2018 Plan provides that in the event of certain specified significant corporate transactions (or a change in control, as defined below), unless otherwise provided in an award agreement or other written agreement between us and the award holder, the administrator may take one or more of the following actions with respect to such stock awards:
100
|
•
|
arrange for the assumption, continuation, or substitution of a stock award by a successor corporation;
|
|
•
|
arrange for the assignment of any reacquisition or repurchase rights held by us to a successor corporation;
|
|
•
|
accelerate the vesting, in whole or in part, of the stock award and provide for its termination if not exercised (if applicable) at or before the effective time of the transaction;
|
|
•
|
arrange for the lapse, in whole or in part, of any reacquisition or repurchase rights held by us;
|
|
•
|
cancel or arrange for the cancellation of the stock award, to the extent not vested or not exercised before the effective time of the transaction, in exchange for a cash payment, if any, as determined by the board; or
|
|
•
|
make a payment, in the form determined by our board of directors, equal to the excess, if any, of (A) the value of the property the participant would have received on exercise of the award immediately before the effective time of the transaction, over (B) any exercise price payable by the participant in connection with the exercise.
|
The plan administrator is not obligated to treat all stock awards or portions of stock awards, even those that are of the same type, in the same manner and is not obligated to treat all participants in the same manner.
Under the 2018 Plan, a corporate transaction is generally the consummation of: (1) a sale of all or substantially all of our assets, (2) the sale or disposition of more than 50% of our outstanding securities, (3) a merger or consolidation where we do not survive the transaction, or (4) a merger or consolidation where we do survive the transaction but the shares of our common stock outstanding immediately before such transaction are converted or exchanged into other property by virtue of the transaction.
In the event of a change in control, the board of directors may take any of the above-mentioned actions. Awards granted under the 2018 Plan will not receive automatic acceleration of vesting and exercisability in the event of a change in control, although this treatment may be provided for in an award agreement or other written agreement between the Company and the participant. Under the 2018 Plan, a change in control is generally (1) the acquisition by any person or company of more than 50% of the combined voting power of our then outstanding stock, (2) a merger, consolidation or similar transaction in which our stockholders immediately before the transaction do not own, directly or indirectly, more than 50% of the combined voting power of the surviving entity (or the parent of the surviving entity), (3) a sale, lease, exclusive license or other disposition of all or substantially all of our assets other than to an entity more than 50% of the combined voting power of which is owned by our stockholders, (4) a complete dissolution or liquidation of the Company, or (5) when a majority of our board of directors becomes comprised of individuals who were not serving on our board of directors on the date of the underwriting agreement related to the IPO, or the incumbent board, or whose nomination, appointment, or election was not approved by a majority of the incumbent board still in office.
Amended and Restated 2006 Equity Compensation Plan
Our board of directors adopted and our stockholders originally approved our 2006 Plan in September 2006, and it was subsequently amended and restated in September 2008 and most recently amended in March 2016. No further grants may be made under our 2006 Plan following the IPO, however outstanding awards granted under our 2006 Plan remain subject to the terms of our 2006 Plan and applicable award agreements. As of December 31, 2019, there were options to purchase
323,735
shares of common stock outstanding under the 2006 Plan.
Our 2006 Plan allowed for the grant of ISOs to employees, including employees of any subsidiary, and for the grant of NSOs, stock appreciation rights, restricted stock awards and restricted stock units and other equity awards to employees, directors and consultants, including employees and consultants of our subsidiaries. Our compensation committee has the authority, concurrent with our board of directors, to administer our 2006 Plan. Unless the terms of an optionee’s stock option agreement provides otherwise, if an optionee’s service relationship with us, or any of our affiliates, ceases for any reason other than disability, death or cause, the optionee may generally exercise any vested options for a period of three months following the cessation of service. If an optionee’s service relationship with us, or any of our affiliates, ceases due to disability or death, or an optionee dies within a certain period following cessation of service, the optionee or a beneficiary may generally exercise any vested options for a period of 12 months in the event of disability or death. In the event of a termination for cause, options generally terminate immediately upon the termination of the individual. In no event may an option be exercised beyond the expiration of its term.
Our 2006 Plan provides that in the event of a change of control, all awards granted under the 2006 Plan shall become fully vested and exercisable (as applicable), unless the board of directors determines otherwise. In the event of a change of control, the administrator may take any of the following actions with respect to any or all outstanding awards: (i) determine that all outstanding options and stock appreciation rights that are not exercised shall be assumed by, or replaced with comparable options by the surviving corporation (or a parent or subsidiary of the surviving corporation), and other outstanding grants that remain in effect after the change of control shall be converted to similar grants of the surviving corporation (or a parent or subsidiary of the surviving corporation), (ii) require that grantees surrender their outstanding options and stock appreciation rights in exchange for one or more payments, in cash or Company stock as
101
determined by the board of directors, in an amount, if any, equal to the amount by which the then fair market value of the shares of Company stock subject to the grantee’s unexercised options and stock appreciation rights exceeds the exercise price or base amount of the options and stock appreciation rights, on such terms as the board of directors determines, or (iii) after giving grantees an opportunity to exercise their outstanding options and stock appreciation rights, terminate any or all unexercised options and stock appreciation rights at such time as the board of directors deems appropriate.
Such assumption, surrender or termination shall take place as of the date of the change of control or such other date as the board of directors may specify.
Under the 2006 Plan, a change of control is generally (1) the acquisition by any person or company of more than 50% of the combined voting power of our then outstanding stock, (2) the consummation of a merger or consolidation with another corporation where our stockholders, immediately prior to the merger or consolidation, will not beneficially own, immediately after the merger or consolidation, shares entitling such stockholders to more than 50% of all votes to which all stockholders of the surviving corporation would be entitled in the election of directors, (3) the consummation of a sale or other disposition of all or substantially all of our assets, or (4) the consummation of a liquidation or dissolution.
2018 Employee Stock Purchase Plan
Additional long-term equity incentives are provided through the 2018 Employee Stock Purchase Plan, or the ESPP, which became effective in connection with the IPO. The ESPP is intended to qualify as an “employee stock purchase plan” within the meaning of Section 423 of the Code. Our compensation committee has the authority, concurrent with our board of directors, to administer the ESPP. Under the ESPP, generally all of our regular employees (including our Named Executive Officers during their employment with us) may participate and may contribute, normally through payroll deductions, up to 15% of their earnings for the purchase of our common stock
The ESPP is implemented through a series of offerings of purchase rights to eligible employees. Under the ESPP, we may specify offerings with a duration of not more than 27 months, and may specify shorter purchase periods within each offering. Each offering will have one or more purchase dates on which our common stock will be purchased for employees participating in the offering. Unless otherwise determined by our compensation committee, shares are purchased for accounts of employees participating in the ESPP at a price per share equal to the lower of (a) 85% of the fair market value of our common stock on the first date of an offering or (b) 85% of the fair market value of our common stock on the date of purchase.
401(k) Plan
We maintain a defined contribution employee retirement plan, or 401(k) plan, for our employees. Our named executive officers are eligible to participate in the 401(k) plan on the same basis as our other employees. The 401(k) plan is intended to qualify as a tax-qualified plan under Section 401(k) of the Code. The plan permits us to make discretionary contributions, including matching contributions and discretionary profit sharing contributions. The 401(k) plan currently does not offer the ability to invest in our securities.
Director Compensation
Our board of directors adopted a non-employee director compensation policy in July 2018 that became effective upon our IPO and is applicable to each member of our board of directors who is not also serving as an employee or consultant to the Company. This compensation policy provides that each such non-employee director will receive the following compensation for service on our board of directors:
|
•
|
an annual cash retainer of $30,000;
|
|
•
|
an additional annual cash retainer of $20,000 for service as chairman of the board of directors;
|
|
•
|
an additional annual cash retainer of $15,000, $10,000 and $10,000 for service as chair of the audit committee, compensation committee and the nominating and corporate governance committee, respectively;
|
|
•
|
an additional annual cash retainer of $7,500, $5,000 and $5,000 for service as a member of the audit committee, compensation committee and the nominating and corporate governance committee, respectively (not applicable to committee chairs);
|
|
•
|
an initial option grant to purchase common stock with an aggregate Black-Scholes option value of $50,000 on the date of each such non-employee director’s appointment to our board of directors; and
|
|
•
|
an annual option grant to purchase common stock with an aggregate Black-Scholes option value of $35,000 on the date of each of our annual stockholder meetings.
|
Each of the option grants described above will be granted under our 2018 Plan, the terms of which are described in more detail above under “Equity Benefit Plans.” Each such option grant will vest and become exercisable subject to the director’s continuous service to us, provided that each option will vest in full upon a change in control (as defined in the 2018 Plan). The term of each option will be
102
10 years, subject to earlier termination as provided in the 2018 Plan, provided that upon a termination of service other than for death, disability or cause, the post-termination exercise period will be 12 months from the date of termination. An eligible director may decline all or any portion of his or her compensation by giving notice to the Company prior to the date cash may be paid or equity awards are to be granted, as the case may be.
We have reimbursed and will continue to reimburse all of our non-employee directors for their reasonable out-of-pocket expenses incurred in attending board of directors and committee meetings. Dr. Holmlin, our President and Chief Executive Officer, is also a director but did not receive any additional compensation for his service as a director.
The following table sets forth in summary form information concerning the compensation that was earned by each of our non-employee directors during the year ended December 31, 2019:
|
NAME
|
FEES EARNED OR PAID IN
CASH
|
OPTION AWARDS ($)
(1)
|
TOTAL ($)
|
|||||||||
|
David L. Barker, Ph.D.
|
$
|
67,500
|
|
$
|
35,000
|
|
$
|
102,500
|
|
|||
|
Darren Cai, Ph.D.
(2)
|
$
|
22,458
|
|
$
|
35,000
|
|
$
|
57,458
|
|
|||
|
Albert Luderer, Ph.D.
|
$
|
47,500
|
|
$
|
35,000
|
|
$
|
82,500
|
|
|||
|
Christopher Twomey
|
$
|
45,000
|
|
$
|
35,000
|
|
$
|
80,000
|
|
|||
|
Junfeng Wang
|
$
|
40,000
|
|
$
|
35,000
|
|
$
|
75,000
|
|
|||
|
Kristiina Vuori, M.D., Ph.D.
(3)
|
$
|
16,978
|
|
$
|
50,000
|
|
$
|
66,978
|
|
|||
|
Quan Zhou
(4)
|
$
|
32,569
|
|
$
|
35,000
|
|
$
|
67,569
|
|
|||
|
(1)
|
The amounts reported reflect the aggregate grant date fair value of each equity award granted to our non-employee directors during the fiscal year ended December 31, 2019, as determined in accordance with the provisions of FASB ASC Topic 718. The valuation assumptions used in calculating these amounts are included in Note 8 to our financial statements included elsewhere in this Annual Report. As required by SEC rules, the amounts shown exclude the impact of estimated forfeitures related to service-based vesting conditions. These amounts do not reflect the actual economic value that will be realized by our non-employee directors upon the vesting of the stock options, the exercise of the stock options, or the sale of the common stock underlying such stock options. As of December 31, 2019, the aggregate number of shares outstanding under all options to purchase our common stock held by our non-employee directors were: Dr. Barker, 45,813; Dr. Cai, 6,572; Dr. Luderer 41,608; Mr. Twomey 32,427; Mr. Wang, 32,427; Dr. Vuori 30,274, and Mr. Zhou, 15,044.
|
|
(2)
|
Dr. Cai resigned from our board of directors in August 2019.
|
|
(3)
|
Dr. Vuori was appointed to our board of directors in May 2019.
|
|
(4)
|
Mr. Zhou resigned from our board of directors in December 2019.
|
In accordance with our compensation policy for non-employee directors, in June 2019, Dr. Vuori was granted an initial option to purchase 30,274 shares of our common stock at an exercise price per share equal to $2.78, the closing price of our common stock on the date of grant, which will vest as described above.
In addition, in accordance with our compensation policy for non-employee directors, in June 2019, each of Dr. Barker, Dr. Cai, Dr. Luderer, Mr. Twomey, Mr. Wang and Mr. Zhou were granted an option to purchase 21,911 shares of our common stock at an exercise price per share equal to $2.78, the closing price of our common stock on the date of grant, which will vest as described above.
Item 12. Security Ownership of Certain Beneficial Owners and Management and Related Stockholder Matters.
PRINCIPAL STOCKHOLDERS
The following table sets forth information regarding beneficial ownership of our capital stock as of December 31, 2019 by:
|
•
|
each person, or group of affiliated persons, known by us to beneficially own more than 5% of our common stock;
|
|
•
|
each of our directors;
|
|
•
|
each of our named executive officers; and
|
|
•
|
all of our current executive officers and directors as a group.
|
We have determined beneficial ownership in accordance with the rules of the SEC. These rules generally attribute beneficial ownership of securities to persons who possess sole or shared voting power or investment power with respect to those securities. In
103
addition, the rules include shares of common stock issuable pursuant to the exercise of stock options or warrants that are exercisable as of February 29, 2019, which is 60 days after December 31, 2019. These shares are deemed to be outstanding and beneficially owned by the person holding those options or warrants for the purpose of computing the percentage ownership of that person, but they are not treated as outstanding for the purpose of computing the percentage ownership of any other person.
The following table is based upon information supplied by officers, directors and principal stockholders and Schedules 13D and 13G, if any, filed with the SEC. Unless otherwise indicated in the footnotes to this table and subject to community property laws where applicable, we believe that each of the stockholders named in this table has sole voting and investment power with respect to the shares indicated as beneficially owned.
Unless otherwise indicated, the address for each beneficial owner listed in the table below is c/o Bionano Genomics, Inc., 9540 Towne Centre Drive, Suite 100, San Diego, California 92121.
|
Name of Beneficial Owner
|
Shares Owned Directly
|
Options Exercisable within 60 Days of 12/31/2019
|
Warrants
|
Number of
Shares Beneficially Owned (1) |
%
(2)
|
||||||||||
|
Greater than 5% Stockholders
|
|||||||||||||||
|
LC Fund VI, L.P. and Affiliates
(3)
|
2,906,915
|
|
|
|
—
|
|
2,906,915
|
|
8.5
|
%
|
|||||
|
Wealth Strategy Holding Limited
(4)
|
975,000
|
|
975,000
|
|
1,950,000
|
|
5.5
|
%
|
|||||||
|
Hudson Bay Capital Management LP
(5)
|
—
|
|
—
|
|
2,020,000
|
|
2,020,000
|
|
5.6
|
%
|
|||||
|
Entities affiliated with Innovatus Life Sciences GP, LP(6)
|
1,354,421
|
|
—
|
|
536,987
|
|
1,891,408
|
|
5.4
|
%
|
|||||
|
Directors and Named Executive Officers
|
**
|
|
**
|
|
**
|
|
**
|
|
|||||||
|
David L. Barker, Ph.D.
|
3,894
|
|
32,666
|
|
3,894
|
|
40,454
|
|
*
|
|
|||||
|
R. Erik Holmlin, Ph.D.
|
3,026
|
|
29,511
|
|
1,630
|
|
34,167
|
|
*
|
|
|||||
|
Albert Luderer, Ph.D
|
—
|
|
28,461
|
|
—
|
|
28,461
|
|
*
|
|
|||||
|
Mark Oldakowski
|
9,736
|
|
78,356
|
|
815
|
|
88,907
|
|
*
|
|
|||||
|
Warren Robinson
|
3,932
|
|
81,710
|
|
—
|
|
85,642
|
|
*
|
|
|||||
|
Christopher Twomey
|
19,500
|
|
19,280
|
|
19,500
|
|
58,280
|
|
*
|
|
|||||
|
Junfeng Wang
(3)
|
2,906,915
|
|
19,280
|
|
—
|
|
2,926,195
|
|
8.5
|
%
|
|||||
|
Mike Ward
|
—
|
|
66,416
|
|
—
|
|
66,416
|
|
*
|
|
|||||
|
Kristiina Vuori, M.D., Ph.D.
|
—
|
|
6,727
|
|
—
|
|
6,727
|
|
*
|
|
|||||
|
All directors and executive officers as a group (9 persons)
|
2,947,003
|
|
362,407
|
|
25,839
|
|
3,335,249
|
|
9.6
|
%
|
|||||
|
Shares outstanding as of 12/31/2019
|
—
|
|
—
|
|
—
|
|
34,274,469
|
|
|||||||
|
*
|
Represents beneficial ownership of less than 1%.
|
|
(1)
|
Beneficial ownership is determined in accordance with SEC rules. In computing the beneficial ownership we have included shares for which the named person has sole or shared power over voting or investment decisions. The number of shares of common stock beneficially owned includes common stock which the named person has the right to acquire, through option exercise or otherwise, within 60 days after December 31, 2019.
|
|
(2)
|
For each named person, the percentage ownership includes common stock that the person has the right to acquire within 60 days after December 31, 2019, as described in Footnote 1. However, such shares are not deemed outstanding with respect to the calculation of ownership percentage for any other person. In some cases, beneficial ownership calculations for five percent or greater stockholders are based solely on publicly-filed Schedules 13D or 13G, which five percent or greater stockholders are required to file with the SEC, and which generally set forth ownership interests as of December 31, 2019 unless otherwise provided.
|
|
(3)
|
Based solely on a Schedule 13G filed with the SEC by the reporting persons on June 7, 2019, the indicated ownership consists of (i) 426,900 shares of common stock held by LC Fund VI, L.P., (ii) 20,656 shares of common stock held by LC Parallel Fund VI, L.P., (iii) 1,325,359 shares of common stock held by LC Healthcare Fund I, L.P., and (iv) 1,134,000 shares of common stock held by Rosy Shine Limited and (v) 19,280 shares of common stock subject to options exercisable as of February 29, 2020 held by Junfeng Wang. Each of LC Fund VI, L.P., LC Parallel Fund VI, L.P., and LC Healthcare Fund I, L.P., collectively referred to as the LC Funds, are ultimately controlled and managed by Legend Capital, a limited liability Chinese company. Legend Capital is ultimately controlled by a management team consisting of three key individuals, Linan Zhu, Hao Chen, and Nengguang Wang. In addition, Junfeng Wang and Quan Zhou are Managing Directors of Legend Capital. Each of these individual managers of Legend
|
104
Capital shares voting and investment power over the shares held by the LC Funds. Rosy Shine Limited is ultimately controlled and managed by Legend Holdings, a limited liability Chinese joint stock company listed on a Stock Exchange of Hong Kong (3396). The board of directors of Legend Holdings has sole voting and investment power over the shares held by Rosy Shine Limited. None of the members of the board of directors has individual voting or investment power with respect to such shares and each disclaims beneficial ownership of such shares. The address of the principal place of business for each of the above entities except Legend Holdings is Legend Capital, 16/F, Tower B, Raycom Infotech Park, No.2 Kexueyuan South Road, Zhongguancun, Haidian District, Beijing 100190, People’s Republic of China. The Schedule 13G filed by the reporting persons provides information as of April 2, 2019 and, consequently, the beneficial ownership of the reporting persons may have changed between April 2, 2019 and December 31, 2019. The address of the principal place of business for Legend Holdings is Room 1701, 17/F, Block 1, Court No. 2, Ke Xue Yuan Nanlu, Haidian District, Beijing, People’s Republic of China.
|
(4)
|
Based solely on a Schedule 13G filed with the SEC by the reporting person on December 14, 2018, the indicated ownership consists of 975,000 shares of common stock and 975,000 shares of common stock issuable upon the exercise of warrants held by Wealth Strategy Holding Limited. According to the Schedule 13G, Mr. Kung Hung Ka may be deemed to have sole voting and dispositive power with respect to the shares held by Wealth Strategy Holding Limited. The Schedule 13G/A filed by the reporting person provides information as of August 21, 2018 and, consequently, the beneficial ownership of the reporting person may have changed between August 21, 2018 and December 31, 2019. The address for Wealth Strategy Holding Limited listed in the Schedule 13G is Level 12, International Commerce Centre, 1 Austin Road West, Kowloon, Hong Kong.
|
|
(5)
|
Based solely on a Schedule 13G filed with the SEC by the reporting person January 31, 2020, the indicated ownership consists of 2,020,000 shares of common stock issuable upon the exercise of warrants held by Hudson Bay Master Fund Ltd. According to the Schedule 13G, Hudson Bay Capital Management LP acts as investment manager to Hudson Bay Master Fund Ltd., and Mr. Sander Gerber, a United States citizen, serves as managing member of Hudson Bay Capital GP LLC, which is a general partner of Hudson Bay Capital Management LP. Hudson Bay Capital Management LP and Mr. Sander Gerber may be deemed to have shared voting and dispositive power with respect to the shares held by Hudson Bay Master Fund Ltd. The address for Hudson Bay Capital Management LP and Mr. Sander Gerber listed in the Schedule 13G is 777 Third Avenue, 30th Floor, New York, NY 10017.
|
|
(6)
|
The indicated ownership consists of (i) 839,781 shares of common stock and 332,948 shares of common stock issuable upon the exercise of warrants held by Innovatus Life Sciences Lending Fund I, LP, or Innovatus, and (ii) 514,640 shares of common stock and 204,039 shares of common stock issuable upon the exercise of warrants held by Innovatus Life Sciences Offshore Fund I-A, LP., or Innovatus Offshore. Innovatus Life Sciences GP, LP, or Innovatus GP, is the general partner of Innovatus Life Sciences Lending Fund I, LP, or Innovatus. Innovatus Capital Partners LLC, or Innovatus Manager, serves as investment manager to each of Innovatus and Innovatus Life Sciences Offshore Fund I-A, LP, or Innovatus Offshore. Innovatus Life Sciences Offshore GP, LP, or Innovatus Offshore GP, is the general partner of Innovatus Offshore. Each of Innovatus GP, Innovatus, Innovatus Manager, Innovatus Offshore GP and Innovatus Offshore are collectively referred to as the Innovatus Entities. Innovatus Flagship Parent GP, LLC, or Innovatus Holdings, is the parent company of Innovatus GP and Innovatus Offshore Parent GP, LLC, or Innovatus Offshore Holdings. David Schiff, a citizen of the United States, is the principal shareholder of each of Innovatus Holdings and Innovatus Offshore Holdings, collectively referred to as the Parent Entities, and could be deemed to exercise voting and investment power over the Parent Entities and the Innovatus Entities. The address of the principal place of business for each of the Parent Entities and David Schiff is 777 Third Avenue, 25th Floor New York, NY 10017.
|
Equity Compensation Plan Information
The following table provides information as of December 31, 2019 with respect to equity compensation plans (including individual compensation arrangements) under which the Company’s common stock is authorized for issuance.
|
Plan Category
|
Number of securities to be issued upon exercise of outstanding options, warrants, and rights
|
Weighted average exercise price of outstanding options, warrants, and rights
|
Number of securities remaining available for future issuance under equity compensation plans
|
|||||||
|
Equity compensation plans approved by stockholders
|
||||||||||
|
Amended and Restated 2006 Equity Compensation Plan
|
323,735
|
|
$
|
4.70
|
|
—
|
|
|||
|
2018 Equity Incentive Plan
|
1,419,177
|
|
$
|
5.96
|
|
196,731
|
|
|||
|
2018 Employee Stock Purchase Plan
|
165,402
|
|
||||||||
|
Equity compensation plans not approved by stockholders
|
||||||||||
|
None
|
||||||||||
|
Total
|
1,742,912
|
|
$
|
5.73
|
|
362,133
|
|
|||
105
Item 13. Certain Relationships and Related Transactions, and Director Independence.
Other than compensation arrangements for our directors and executive officers, which are described elsewhere in this Annual Report, below we describe transactions since January 1, 2017 to which we were a party or will be a party, in which:
|
•
|
the amounts involved exceeded or will exceed the lesser of (a) $120,000 or (b) 1% of our total assets at December 31, 2018 or 2019; and
|
|
•
|
any of our directors, executive officers or holders of more than 5% of our capital stock, or any member of the immediate family of, or person sharing the household with, the foregoing persons, had or will have a direct or indirect material interest.
|
Series D-1 Convertible Preferred Stock Financing
In February, March, April, May, July, August and November 2017, we issued and sold, in a series of closings, an aggregate of 36,974,586 shares of our Series D-1 convertible preferred stock at a purchase price of $0.48 per share for an aggregate gross proceeds of approximately $17.7 million. The following table summarizes the Series D-1 convertible preferred stock purchased by affiliates of our executive officers and of members of our board of directors and holders of more than 5% of our outstanding capital stock:
|
Name of Participant
|
Shares of Series D-1
Convertible Preferred Stock |
Aggregate
Purchase Price |
||||
|
Full Succeed International Limited
|
10,416,667
|
$
|
5,000,000
|
|
||
|
LC Healthcare Fund I, L.P.
|
6,472,371
|
$
|
3,106,738
|
|
||
|
Praise Alliance International Limited
|
6,250,000
|
$
|
3,000,000
|
|
||
|
Entities affiliated with Domain Partners VIII, L.P.
(1)
|
3,710,247
|
$
|
1,780,919
|
|
||
|
Han Cao, Ph.D.
|
104,167
|
$
|
50,000
|
|
||
|
(1)
|
Includes (i) $1,767,801 in cash from Domain Partners VIII, L.P., and (ii) $13,117 in cash from DP VIII Associates, L.P.
|
Convertible Promissory Note Financing
In February 2018, we issued convertible promissory notes in the aggregate principal amount of approximately $13.4 million with an interest rate of 8% per annum. In August 2018, $14.9 million of principal and interest outstanding under the convertible promissory notes converted into an aggregate of 3,239,294 shares of common stock upon completion of our IPO.
The participants in this note financing included the following members of our board of directors and holders of more than 5% of our outstanding capital stock:
|
Name of Participant
|
Total Principal
Amount |
|||
|
Entities affiliated with LC Fund VI, L.P.
(1)
|
$
|
8,460,000
|
|
|
|
Entities affiliated with Domain Partners VIII, L.P.
(2)
|
$
|
1,500,000
|
|
|
|
(1)
|
Includes (i) $3,460,000 in cash from LC Healthcare Fund I, L.P.; and (ii) $5,000,000 cash from Rosy Shine Limited.
|
|
(2)
|
Includes (i) $1,488,952 in cash from Domain Partners VIII, L.P., and (ii) $11,048 in cash from DP VIII Associates, L.P.
|
One of our current directors, Junfeng Wang, and one of our former directors, Quan Zhou, is affiliated with LC Fund VI, L.P. (and its affiliated entities that participated in the financings described above).
Investors’ Rights Agreement
In August 2016, we entered into a fifth amended and restated investors’ rights agreement, or the IRA, with certain holders of our preferred stock and common stock, including entities affiliated with LC Fund VI, L.P. and Domain Partners VIII, L.P. and including certain members of, and affiliates of, our directors and certain of our executive officers. The agreement was amended in July and August 2018. The IRA provides the holders of our preferred stock with certain registration rights, including the right to demand that we file a registration statement or request that their shares be covered by a registration statement that we are otherwise filing. After 12 months following the date of our initial public offering, the holders of 4,948,360 shares of our common stock issuable upon conversion of outstanding preferred stock will be entitled to rights with respect to the registration of their shares of common stock under the Securities Act under this agreement.
106
Indemnification Agreements
We have entered, and intend to continue to enter, into separate indemnification agreements with our directors and executive officers, in addition to the indemnification provided for in our amended and restated bylaws. These agreements, among other things, require us to indemnify our directors and executive officers for certain expenses, including attorneys’ fees, judgments, fines and settlement amounts incurred by a director or executive officer in any action or proceeding arising out of their services as one of our directors or executive officers or as a director or executive officer of any other company or enterprise to which the person provides services at our request. We believe that these bylaw provisions and indemnification agreements are necessary to attract and retain qualified persons as directors and officers.
The limitation of liability and indemnification provisions in our amended and restated certificate of incorporation and amended and restated bylaws may discourage stockholders from bringing a lawsuit against directors for breach of their fiduciary duties. They may also reduce the likelihood of derivative litigation against directors and officers, even though an action, if successful, might benefit us and our stockholders. A stockholder’s investment may decline in value to the extent we pay the costs of settlement and damage awards against directors and officers pursuant to these indemnification provisions.
Policies and Procedures for Transactions with Related Persons
In 2018
,
the Company adopted a written Related-Person Transactions Policy that sets forth the Company’s policies and procedures regarding the identification, review, consideration and approval or ratification of “related-persons transactions.” For purposes of the Company’s policy only, a “related-person transaction” is a transaction, arrangement or relationship (or any series of similar transactions, arrangements or relationships) in which the Company and any “related person” are participants involving an amount that exceeds $120,000.
Transactions involving compensation for services provided to the Company as an employee, director, consultant or similar capacity by a related person are not covered by this policy. A related person is any executive officer, director, or more than 5% stockholder of the Company, including any of their immediate family members, and any entity owned or controlled by such persons.
Under the policy, where a transaction has been identified as a related-person transaction, management must present information regarding the proposed related-person transaction to the Audit Committee (or, where Audit Committee approval would be inappropriate, to another independent body of the Board) or the Board for consideration and approval or ratification. The presentation must include a description of, among other things, all of the parties, the direct and indirect interests of the related parties, the purpose of the transaction, the material facts, the benefits of the transaction to us and whether any alternative transactions are available, an assessment of whether the terms are comparable to the terms available from unrelated third parties and management’s recommendation. To identify related-person transactions in advance, the Company relies on information supplied by its executive officers, directors and certain significant stockholders. In considering related-person transactions, the Audit Committee takes into account the relevant available facts and circumstances including, but not limited to (a) the risks, costs and benefits to the Company, (b) the impact on a director’s independence in the event the related person is a director, immediate family member of a director or an entity with which a director is affiliated, (c) the terms of the transaction, (d) the availability of other sources for comparable services or products and (e) the terms available to or from, as the case may be, unrelated third parties or to or from employees generally.
In the event a director has an interest in the proposed transaction, the director must recuse himself or herself form the deliberations and approval. The policy requires that, in determining whether to approve, ratify or reject a related-person transaction, the Audit Committee consider, in light of known circumstances, whether the transaction is in, or is not inconsistent with, the best interests of the Company and its stockholders, as the Audit Committee determines in the good faith exercise of its discretion.
Board Independence
The board has determined that, except for Mr. Holmlin, all of its members are independent directors as defined in the Nasdaq Stock Market listing standards. Mr. Holmlin is not considered independent because he is employed by us as our CEO. In addition to the board-level standards for director independence, all members of the audit committee, compensation committee and nominating and corporate governance committee are independent directors.
Item 14. Principal Accounting Fees and Services.
The following table summarizes the aggregate fees billed to the Company by its independent registered public accounting firm, Deloitte & Touche, LLP, for the fiscal years ended December 31, 2019 and 2018:
107
|
2019
|
2018
|
||||||
|
Audit fees
(1)
|
$
|
615,000
|
|
$
|
1,020,000
|
|
|
|
Audit-related fees
(2)
|
46,000
|
|
49,000
|
|
|||
|
Tax fees
(3)
|
19,700
|
|
20,000
|
|
|||
|
All other fees
(4)
|
—
|
|
2,000
|
|
|||
|
Total
|
$
|
680,700
|
|
$
|
1,091,000
|
|
|
|
(1)
|
Audit fees consist of fees billed for professional services rendered for the audit of the consolidated annual financial statements of the Company, review of the interim condensed consolidated financial statements included in quarterly reports, review of the SEC-filings associated with the Company's IPO in 2018, and services that are normally provided by Deloitte & Touche, LLP in connection with statutory and regulatory filings or engagements.
|
|
(2)
|
Audit-related fees consist of fees billed for assurance and related services that are reasonably related to the performance of the audit or review of the consolidated financial statements of the Company and are not reported under "Audit fees." For the fiscal years ended December 31, 2019 and 2018, these fees primarily related to miscellaneous professional services.
|
|
(3)
|
Tax fees consist of fees billed for professional services rendered for tax compliance, advice and planning. For the fiscal years ended December 31, 2019 and 2018, these services included assistance regarding federal and state tax compliance and consultations regarding various income tax issues.
|
|
(4)
|
All other fees for the fiscal year ended December 31, 2018 related to software subscription services.
|
In considering the nature of the services provided by Deloitte & Touche, LLP, the audit committee determined that such services were compatible with the provision of independent audit services. The audit committee discussed these services with Deloitte & Touche, LLP and Management to determine that they were permitted under the rules and regulations concerning auditor independence promulgated by the SEC to implement the Sarbanes-Oxley Act of 2002, as well as the Public Company Accounting Oversight Board. The audit committee requires that all services performed by Deloitte & Touche, LLP be pre-approved prior to the services being performed. During the fiscal years ended December 31, 2019 and 2018, all services were pre-approved in accordance with these procedures.
108
PART IV
Item 15. Exhibits, Financial Statement Schedules.
|
(a)
|
List the following documents filed as a part of the report:
|
|
(1)
|
Financial statements
|
The response to this portion of Item 15 is set forth under Item 8 above.
|
(2)
|
Financial statement schedule.
|
All schedules have been omitted because they are not required or because the required information is given in the financial statements or notes thereto set forth under Item 8 above.
|
(3)
|
Exhibits
|
A list of exhibits file with this Annual Report or incorporated herein by reference can be found in the Exhibit Index below.
Exhibit Index
|
Exhibit
Number
|
Description
|
|
|
3.1
(1)
|
||
|
3.2
(1)
|
||
|
4.1
(2)
|
||
|
4.2
(2)
|
||
|
4.3
(2)
|
||
|
4.4
(2)
|
||
|
4.5
(2)
|
||
|
4.6
(2)
|
||
|
4.7
(2)
|
||
|
4.8
(2)
|
||
|
4.9
(3)
|
||
|
4.10
(4)
|
||
|
4.11
(4)
|
||
|
4.12
(4)
|
||
|
4.13
(5)
|
||
|
4.14
(5)
|
||
|
4.15
|
Warrant Amendment Agreement, dated October 30, 2019, by and between the Company and Innovatus.
|
|
|
4.16
|
||
|
10.1
(2)
|
||
|
10.2+
(2)
|
||
|
10.3+
(2)
|
||
|
10.4+
(6)
|
||
|
10.5+
(2)
|
||
|
10.6+
(6)
|
||
|
10.7+
(2)
|
||
|
10.8+
(2)
|
||
|
10.9+
(2)
|
||
|
10.10+
(2)
|
||
109
|
Exhibit
Number
|
Description
|
|
|
10.11+
(2)
|
||
|
10.12+
(2)
|
||
|
10.13+
(2)
|
||
|
10.14+
(2)
|
||
|
10.15
(2)
|
||
|
10.16
(2)
|
||
|
10.17
(2)
|
||
|
10.18
(2)
|
||
|
10.19
(2)
|
||
|
10.20
(2)
|
||
|
10.21
(2)
|
||
|
10.22
(2)
|
||
|
10.23#
(2)
|
||
|
10.24#
(2)
|
||
|
10.25#
(2)
|
||
|
10.26#
(2)
|
||
|
10.27#
(2)
|
||
|
10.28#
(2)
|
||
|
10.29#
(2)
|
||
|
10.30#
(2)
|
||
|
10.31#
(2)
|
||
|
10.32#
(2)
|
||
|
10.33#
(2)
|
||
|
10.34#
(2)
|
||
|
10.35#
(2)
|
||
|
10.36
(2)
|
||
|
10.37
(2)
|
||
|
10.38
(2)
|
||
|
10.39#
(2)
|
||
|
10.40
(2)
|
||
|
10.41
(2)
|
||
|
10.42
(2)
|
||
|
10.43
(2)
|
||
|
10.44
(2)
|
||
110
|
Exhibit
Number
|
Description
|
|
|
10.45
(3)
|
||
|
10.46
(4)
|
||
|
10.47
(4)
|
||
|
10.48
(7)
|
||
|
10.49
|
||
|
10.50
(4)
|
||
|
22.1
(2)
|
||
|
23.1
|
||
|
24.1
|
Power of Attorney (included on signature page)
|
|
|
31.1*
|
||
|
32.1*
|
||
|
101.INS
|
XBRL Instance Document.
|
|
|
101.SCH
|
XBRL Taxonomy Extension Schema Document.
|
|
|
101.CAL
|
XBRL Taxonomy Extension Calculation Linkbase Document.
|
|
|
101.DEF
|
XBRL Taxonomy Extension Definition Linkbase Document.
|
|
|
101.LAB
|
XBRL Taxonomy Extension Label Linkbase Document.
|
|
|
101.PRE
|
XBRL Taxonomy Extension Presentation Linkbase Document.
|
|
|
(1)
|
Incorporated by reference to the Company’s Current Report on Form 8-K, filed with the SEC on August 24, 2018.
|
|
|
(2)
|
Incorporated by reference to the Company’s Registration Statement on Form S-1 (File No. 333-225970), as amended.
|
|
|
(3)
|
Incorporated by reference to the Company’s Current Report on Form 8-K, filed with the SEC on November 21, 2018.
|
|
|
(4)
|
Incorporated by reference to the Registrant’s Current Report on Form 8-K, filed with the SEC on March 14, 2019.
|
|
|
(5)
|
Incorporated by reference to the Registrant’s Registration Statement on Form S-1 (File No. 333-233828), as amended.
|
|
|
(6)
|
Incorporated by reference to the Registrant’s Registration Statement on Form S-8 (File No. 333-227073).
|
|
|
(7)
|
Incorporated by reference to the Registrant’s Quarterly Report on Form 10-Q, filed with the SEC on August 8, 2019.
|
|
|
+
|
Indicates management contract or compensatory plan.
|
|
|
#
|
Confidential treatment has been granted with respect to certain portions of this exhibit. Omitted portions have been filed separately with the SEC.
|
|
|
*
|
This certification is deemed not filed for purpose of section 18 of the Exchange Act or otherwise subject to the liability of that section, nor shall it be deemed incorporated by reference into any filing under the Securities Act or the Exchange Act.
|
|
Item 16. Form 10-K Summary
None
111
SIGNATURES
Pursuant to the requirements of Section 13 or 15(d) of the Securities Exchange Act of 1934, as amended, the Registrant has duly caused this Annual Report to be signed on its behalf by the undersigned, thereunto duly authorized
.
|
Company Name
|
||
|
Date: March 10, 2020
|
By:
|
/s/ R. Erik Holmlin, Ph.D.
|
|
R. Erik Holmlin, Ph.D.
|
||
|
President and Chief Executive Officer
|
||
POWER OF ATTORNEY
KNOW ALL PERSONS BY THESE PRESENTS, that each person whose signature appears below constitutes and appoints
R. Erik Holmlin, Ph.D
, as his or her true and lawful attorney-in-fact and agent, with full power of substitution and resubstitution, for him or her and in his or her name, place and stead, in any and all capacities, to sign this Annual Report on Form 10-K of Bionano Genomics, Inc., and any or all amendments thereto, and to file the same, with all exhibits thereto, and other documents in connection therewith, with the Securities and Exchange Commission, granting unto said attorney-in-fact and agent full power and authority to do and perform each and every act and thing requisite or necessary to be done in and about the premises hereby ratifying and confirming all that said attorney-in-fact and agent, or his or her substitute or substitutes, may lawfully do or cause to be done by virtue hereof.
Pursuant to the requirements of the Securities Exchange Act of 1934, as amended, this Annual Report has been signed below by the following persons on behalf of the Registrant in the capacities and on the dates indicated.
|
Signature
|
Title
|
Date
|
||
|
/s/ R. Erik Holmlin, Ph.D.
|
Chief Executive Officer and Director
(Principal Executive and Financial Officer) |
March 10, 2020
|
||
|
R. Erik Holmlin, Ph.D.
|
||||
|
/s/ Mark Adamchak
|
Controller
(Principal Accounting Officer) |
March 10, 2020
|
||
|
Mark Adamchak
|
||||
|
/s/ David L. Barker, Ph.D.
|
Director
|
March 10, 2020
|
||
|
David L. Barker, Ph.D.
|
||||
|
/s/ Albert A. Luderer, Ph.D.
|
Director
|
March 10, 2020
|
||
|
Albert A. Luderer, Ph.D.
|
||||
|
/s/ Junfeng Wang
|
Director
|
March 10, 2020
|
||
|
Junfeng Wang
|
||||
|
/s/ Christopher Twomey
|
Director
|
March 10, 2020
|
||
|
Christopher Twomey
|
||||
|
/s/ Kristiina Vuori, M.D., Ph.D.
|
Director
|
March 10, 2020
|
||
|
Kristiina Vuori, M.D., Ph.D.
|
||||
112
TABLE OF CONTENTS
Part IItem 1. BusinessItem 1A. Risk FactorsItem 1B. Unresolved Staff CommentsItem 2. PropertiesItem 3. Legal ProceedingsItem 4. Mine Safety DisclosuresPart IIItem 5. Market For Registrant S Common Equity, Related Stockholder Matters and Issuer Purchases Of Equity SecuritiesItem 6. Selected Financial DataItem 7. Management S Discussion and Analysis Of Financial Condition and Results Of OperationsItem 7A. Quantitative and Qualitative Disclosures About Market RiskItem 8. Financial Statements and Supplementary DataItem 9. Changes in and Disagreements with Accountants on Accounting and Financial DisclosureItem 9A. Controls and ProceduresItem 9B. Other InformationPart IIIItem 10. Directors, Executive Officers and Corporate GovernanceItem 11. Executive CompensationItem 12. Security Ownership Of Certain Beneficial Owners and Management and Related Stockholder MattersItem 13. Certain Relationships and Related Transactions, and Director IndependenceItem 14. Principal Accounting Fees and ServicesPart IVItem 15. Exhibits, Financial Statement SchedulesItem 16. Form 10-k Summary