BANK OF HAWAII CORP
10-Ks and 10-Qs
|
|
|
|
|
|
|
|
|
|
|
|
|
|
|
|
|
|
|
|
|
|
|
|
|
|
|
|
|
|
|
|
|
|
|
|
|
|
|
|
|
|
|
|
|
|
|
|
|
|
|
|
|
|
|
|
UNITED STATES
SECURITIES AND EXCHANGE COMMISSION
Washington, D.C. 20549
SECURITIES AND EXCHANGE COMMISSION
Washington, D.C. 20549
FORM 10-K
|
(Mark One)
|
|||
|
x
|
ANNUAL REPORT PURSUANT TO SECTION 13 OR 15(d) OF
THE SECURITIES EXCHANGE ACT OF 1934
|
||
|
For the fiscal year ended December 31, 2012
|
|||
|
OR
|
|||
|
o
|
TRANSITION REPORT PURSUANT TO SECTION 13 OR 15(d) OF
THE SECURITIES EXCHANGE ACT OF 1934
|
||
|
for the transition period from _________ to __________
|
|||
Commission File Number 1-6887
BANK OF HAWAII CORPORATION
(Exact name of registrant as specified in its charter)
(Exact name of registrant as specified in its charter)
|
Delaware
(State of incorporation) |
99-0148992
(I.R.S. Employer Identification No.) |
|
|
130 Merchant Street, Honolulu, Hawaii
(Address of principal executive offices) |
96813
(Zip Code) |
|
1-888-643-3888
(Registrant's telephone number, including area code)
(Registrant's telephone number, including area code)
Securities registered pursuant to Section 12(b) of the Act:
Securities registered pursuant to Section 12(g) of the Act:
None
|
Title of Each Class
|
Name of Each Exchange on Which Registered
|
|
|
Common Stock, $.01 Par Value
|
New York Stock Exchange
|
|
None
Indicate by check mark if the registrant is a well-known seasoned issuer, as defined in Rule 405 of the Securities Act.
Yes
x
No
o
Indicate by check mark if the registrant is not required to file reports pursuant to Section 13 or Section 15(d) of the Act.
Yes
o
No
x
Indicate by check mark whether the registrant (1) has filed all reports required to be filed by Section 13 or 15(d) of the Securities Exchange Act of 1934 during the preceding 12 months (or for such shorter period that the registrant was required to file such reports), and (2) has been subject to such filing requirements for the past 90 days.
Yes
x
No
o
Indicate by check mark whether the registrant has submitted electronically and posted on its corporate Web site, if any, every Interactive Data File required to be submitted and posted pursuant to Rule 405 of Regulation S-T (Section 232.405 of this chapter) during the preceding 12 months (or for such shorter period that the registrant was required to submit and post such files).
Yes
x
No
o
Indicate by check mark if disclosure of delinquent filers pursuant to Item 405 of Regulation S-K (Section 229.405 of this chapter) is not contained herein, and will not be contained, to the best of registrant's knowledge, in definitive proxy or information statements incorporated by reference in Part III of this Form 10-K or any amendment to this Form 10-K.
o
Indicate by check mark whether the registrant is a large accelerated filer, an accelerated filer, a non-accelerated filer, or a smaller reporting company. See the definitions of "large accelerated filer," "accelerated filer" and "smaller reporting company" in Rule 12b-2 of the Exchange Act.
|
Large accelerated filer
x
|
Accelerated filer
o
|
|
|
Non-accelerated filer
o
(Do not check if a smaller reporting company)
|
Smaller reporting company
o
|
|
Indicate by check mark whether the registrant is a shell company (as defined in Rule 12b-2 of the Act).
Yes
o
No
x
The aggregate market value of the registrant's outstanding voting common stock held by non-affiliates on June 30, 2012 (the last business day of the registrant's most recently completed second fiscal quarter), determined using the per share closing price on that date on the New York Stock Exchange of $45.95, was approximately $2,047,629,506. There was no non-voting common equity of the registrant outstanding on that date.
As of February 14, 2013, there were 44,868,440 shares of common stock outstanding.
DOCUMENTS INCORPORATED BY REFERENCE
Portions of the Proxy Statement relating to the 2013 Annual Meeting of Shareholders to be held on April 26, 2013, are incorporated by reference into Part III of this Report.
Bank of Hawaii Corporation
2012 Form 10-K Annual Report
Table of Contents
2012 Form 10-K Annual Report
Table of Contents
|
Item Number
|
Page
|
|||||
|
Part I
|
Item 1.
|
|||||
|
Item 1A.
|
||||||
|
Item 1B.
|
||||||
|
Item 2.
|
||||||
|
Item 3.
|
||||||
|
Item 4.
|
||||||
|
Part II
|
Item 5.
|
|||||
|
Item 6.
|
||||||
|
Item 7.
|
||||||
|
Item 7A.
|
||||||
|
Item 8.
|
||||||
|
Item 9.
|
||||||
|
Item 9A.
|
||||||
|
Item 9B.
|
||||||
|
Part III
|
Item 10.
|
|||||
|
Item 11.
|
||||||
|
Item 12.
|
||||||
|
Item 13.
|
||||||
|
Item 14.
|
||||||
|
Part IV
|
Item 15.
|
|||||
|
Signatures
|
||||||
1
General
Bank of Hawaii Corporation (the "Parent") is a Delaware corporation and a bank holding company ("BHC") headquartered in Honolulu, Hawaii.
The Parent's principal and only operating subsidiary, Bank of Hawaii (the "Bank"), was organized on December 17, 1897 and is chartered by the State of Hawaii. The Bank's deposits are insured by the Federal Deposit Insurance Corporation (the "FDIC") and the Bank is a member of the Federal Reserve System.
The Bank provides a broad range of financial services and products primarily to customers in Hawaii, Guam, and other Pacific Islands. References to "we," "our," "us," or "the Company" refer to the Parent and its subsidiaries that are consolidated for financial reporting purposes.
The Bank's subsidiaries include Bank of Hawaii Leasing, Inc., Bankoh Investment Services, Inc., and Pacific Century Life Insurance Corporation. The Bank's subsidiaries are engaged in equipment leasing, securities brokerage, investment services, and providing credit insurance.
We are organized into four business segments for management reporting purposes: Retail Banking, Commercial Banking, Investment Services, and Treasury and Other. See Management's Discussion and Analysis of Financial Condition and Results of Operations ("MD&A") and Note 13 to the Consolidated Financial Statements for more information.
Our annual report on Form 10-K, quarterly reports on Form 10-Q, current reports on Form 8-K, and all amendments to those reports can be found free of charge on our website at www.boh.com as soon as reasonably practicable after such material is electronically filed with or furnished to the U.S. Securities and Exchange Commission (the "SEC"). The SEC maintains a website, www.sec.gov, which contains reports, proxy and information statements, and other information regarding issuers that file electronically with the SEC. Our Corporate Governance Guidelines; charters of the Audit and Risk Committee, the Human Resources and Compensation Committee, and the Nominating and Corporate Governance Committee; and our Code of Business Conduct and Ethics are available on our website at www.boh.com. Printed copies of this information may be obtained, without charge, by written request to the Corporate Secretary at 130 Merchant Street, Honolulu, Hawaii, 96813.
The Parent's other subsidiary is the BOHC Investment Fund, LLC (the "Fund"). The Fund was organized in September 2007, to invest in and hold securities of Qualified High Technology Businesses, as defined in the Hawaii Revised Statutes.
Competition
The Company is subject to intense competition from traditional financial service providers including banks, savings associations, credit unions, mortgage companies, finance companies, mutual funds, brokerage firms, insurance companies, and other non-traditional providers of financial services including financial service subsidiaries of commercial and manufacturing companies. Some of our competitors are not subject to the same level of regulation and oversight that is required of banks and BHCs. As a result, some of our competitors may have lower cost structures. Also, some of our competitors, through alternative delivery channels such as the Internet, may be based outside of the markets that we serve. By emphasizing our extensive branch network, exceptional service levels, and knowledge of local trends and conditions, we believe the Company has developed an effective competitive advantage in its market.
Supervision and Regulation
Our operations are subject to extensive regulation by federal and state governmental authorities. The regulations are primarily intended to protect depositors, customers, and the integrity of the U.S. banking system and capital markets. The following information describes some of the more significant laws and regulations applicable to us. The description is qualified in its entirety by reference to the applicable laws and regulations. Proposals to change the laws and regulations governing the banking industry are frequently raised in Congress, in state legislatures, and with the various bank regulatory agencies. Changes in applicable laws or regulations, or a change in the way such laws or regulations are interpreted by regulatory agencies or courts, may have a material impact on our business, operations, and earnings.
2
On July 21, 2010, the Dodd-Frank Wall Street Reform and Consumer Protection Act of 2010 (the "Dodd-Frank Act") became effective. This law has broadly affected the financial services industry by implementing changes to the financial regulatory landscape aimed at strengthening the sound operation of the financial services industry, and will continue to significantly change the current bank regulatory structure and affect the lending, deposit, investment, trading and operating activities of financial institutions and their holding companies, including the Company and the Bank. Under the Dodd-Frank Act a broad range of new rules and regulations by various federal agencies have been implemented, and further rulemaking must be proposed and adopted which will take effect over several years. Although we have already experienced some decrease in revenue as a result of the rules implemented under the Dodd-Frank Act, it remains difficult to anticipate the overall financial impact the Dodd-Frank Act will have on the Company, our customers or the financial industry in general.
The Parent
The Parent is registered as a BHC under the Bank Holding Company Act of 1956, as amended (the "BHC Act"), and is subject to the supervision of and to examination by the Board of Governors of the Federal Reserve Bank (the "FRB"). The Parent is also registered as a financial institution holding company under the Hawaii Code of Financial Institutions (the "Code") and is subject to the registration, reporting, and examination requirements of the Code.
The BHC Act prohibits, with certain exceptions, a BHC from acquiring beneficial ownership or control of more than 5% of the voting shares of any company, including a bank, without the FRB's prior approval. The Act also prohibits a BHC from engaging in any activity other than banking, managing or controlling banks or other subsidiaries authorized under the BHC Act, or furnishing services to or performing services for its subsidiaries.
Under the BHC Act, a BHC may elect to become a financial holding company and thereby engage in a broader range of financial and other activities than are permissible for traditional BHCs. In order to qualify for the election, all of the depository institution subsidiaries of the BHC must be well-capitalized and well-managed. Additionally, all of its insured depository institution subsidiaries must have achieved a rating of "satisfactory" or better under the Community Reinvestment Act (the "CRA"). Financial holding companies are permitted to engage in activities that are "financial in nature"; activities incidental to or complementary of the financial activities of traditional BHCs, as determined by the FRB. The Parent has not elected to become a financial holding company.
Under FRB policy, a BHC is expected to serve as a source of financial and management strength to its subsidiary bank. A BHC is also expected to commit resources to support its subsidiary bank in circumstances where it might not do so absent such a policy. Under this policy, a BHC is expected to stand ready to provide adequate capital funds to its subsidiary bank during periods of financial adversity and to maintain the financial flexibility and capital-raising capacity to obtain additional resources for assisting its subsidiary bank.
Under the Riegle-Neal Interstate Banking and Branching Efficiency Act, banks and bank holding companies from any state are permitted to acquire banks located in any other state, subject to certain conditions, including certain nationwide and state-imposed deposit concentration limits. The Bank also has the ability, subject to certain restrictions, to acquire branches outside its home state by acquisition or merger. The establishment of new interstate branches is also possible in those states with laws that expressly permit de novo branching. Because the Code permits de novo branching by out-of-state banks, those banks may establish new branches in Hawaii. Interstate branches are subject to certain laws of the states in which they are located.
Bank of Hawaii
The Bank is subject to supervision and examination by the FRB of San Francisco and the State of Hawaii Department of Commerce and Consumer Affairs' ("DCCA") Division of Financial Institutions. The Bank is subject to extensive federal and state regulations that significantly affect business and activities. These regulatory bodies have broad authority to implement standards and to initiate proceedings designed to prohibit depository institutions from engaging in activities that represent unsafe or unsound banking practices or constitute violations of applicable laws, rules, regulations, administrative orders, or written agreements with regulators. The standards relate generally to operations and management, asset quality, interest rate exposure, capital, and executive compensation. These regulatory bodies are authorized to take action against institutions that fail to meet such standards, including the assessment of civil monetary penalties, the issuance of cease-and-desist orders, and other actions.
Bankoh Investment Services, Inc., the broker dealer subsidiary of the Bank, is incorporated in Hawaii and is regulated by the Financial Industry Regulatory Authority, and the DCCA's Business Registration Division. Pacific Century Life Insurance Corporation is incorporated in Arizona and is regulated by the State of Arizona Department of Insurance.
3
Capital Requirements
The federal bank regulatory agencies have issued substantially similar risk-based and leverage capital guidelines applicable to BHCs and the banks they supervise. Under the risk-based capital requirements, the Company and the Bank are each generally required to maintain a minimum ratio of total capital to risk-weighted assets of 8% to be considered "adequately capitalized." At least half of the total capital is to be composed of common equity, retained earnings, and qualifying perpetual preferred stock, less certain intangibles ("Tier 1 Capital"). The remainder may consist of certain subordinated debt, certain hybrid capital instruments and other qualifying preferred stock, and a limited amount of the allowance for loan and lease losses ("Tier 2 Capital") and, together with Tier 1 Capital, equals total capital ("Total Capital"). Risk-weighted assets are calculated by taking assets and credit equivalent amounts of off-balance-sheet items and assigning them to one of several broad risk categories. The risk categories are assigned according to the obligor, or, if relevant, to the guarantor, or to the nature of the collateral. The aggregate dollar value of the amount in each category is then multiplied by the risk weight associated with that category.
BHCs and banks are also required to maintain minimum leverage ratios established by the federal bank regulatory agencies. These requirements provide for a minimum leverage ratio of Tier 1 Capital to adjusted quarterly average assets ("Tier 1 Leverage Ratio") equal to 3% to be considered "adequately capitalized" for BHCs and banks that have the highest regulatory rating and are not experiencing significant growth or expansion. All other BHCs and banks will generally be required to maintain a Tier 1 Leverage Ratio of at least 100 to 200 basis points above the stated minimum. See Note 11 to the Consolidated Financial Statements for capital ratios for the Company and the Bank.
The risk-based capital standards identify concentrations of credit risk and the risk arising from non-traditional banking activities, as well as an institution's ability to manage these risks, as important factors to be taken into account by the agencies in assessing an institution's overall capital adequacy. The capital guidelines also provide that exposure to a decline in the economic value of an institution's capital due to changes in interest rates is a factor to be considered in evaluating a bank's capital adequacy.
Under the Federal Deposit Insurance Corporation Improvement Act of 1991 ("FDICIA"), the federal banking agencies possess broad powers to take prompt corrective action to resolve problems of insured depository institutions. FDICIA identifies five capital categories for insured depository institutions: "well capitalized," "adequately capitalized," "undercapitalized," "significantly undercapitalized," or "critically undercapitalized." Under regulations established by the federal banking agencies, a "well capitalized" institution must have a Tier 1 Capital Ratio of at least 6%, a Total Capital Ratio of at least 10%, a Tier 1 Leverage Ratio of at least 5%, and not be subject to a capital directive order. As of December 31, 2012, the Bank was classified as "well capitalized." The classification of a depository institution under FDICIA is primarily for the purpose of applying the federal banking agencies' prompt corrective action provisions, and is not intended to be, nor should it be interpreted as, a representation of the overall financial condition or the prospects of that financial institution.
In December 2010, the oversight body of the Basel Committee on Banking Supervision finalized a set of international guidelines for determining regulatory capital known as “Basel III,” which includes reforms regarding capital, leverage, and liquidity. The new capital requirements were to be phased in between January 2013 and January 2015. However, on November 9, 2012, the U.S. federal banking agencies indicated that a delay in implementation of the proposed dates was necessary, but did not provide a substitute effective date for the new rules.
In October 2012, in implementing provisions of the Dodd-Frank Act, the FRB published final rules requiring banks with total consolidated assets of more than $10.0 billion to conduct and publish annual stress tests. Compliance with these requirements has been delayed until October 2013.
See the “Regulatory Initiatives Related to Liquidity, Capital, and Stress Testing” section in MD&A for more information on Basel III and stress testing.
Dividend Restrictions
The Parent is a legal entity separate and distinct from the Bank. The Parent's principal source of funds to pay dividends on its common stock and to service its debt is dividends from the Bank. Various federal and state laws and regulations limit the amount of dividends the Bank may pay to the Parent without regulatory approval. The FRB is authorized to determine the circumstances when the payment of dividends would be an unsafe or unsound practice and to prohibit such payments. The right of the Parent, its shareholders, and creditors, to participate in any distribution of the assets or earnings of its subsidiaries is also subject to the prior claims of creditors of those subsidiaries. For information regarding the limitations on the Bank's ability to pay dividends to the Parent, see Note 11 to the Consolidated Financial Statements.
4
Transactions with Affiliates and Insiders
Under federal law, the Bank is subject to restrictions that limit the transfer of funds or other items of value to the Parent, and any other non-bank affiliates in so-called "covered transactions." In general, covered transactions include loans, leases, other extensions of credit, investments and asset purchases, as well as other transactions involving the transfer of value from the Bank to an affiliate or for the benefit of an affiliate. The Dodd-Frank Act broadened the definition of affiliate, and the definition of covered transaction to include securities borrowing/lending, repurchase/reverse repurchase agreements, and derivative transactions that the Bank may have with an affiliate. The Dodd-Frank Act also strengthened the collateral requirements and limited FRB exemptive authority.
Unless an exemption applies, covered transactions by the Bank with a single affiliate are limited to 10% of the Bank's capital and surplus, and with respect to all covered transactions with affiliates in the aggregate, they are limited to 20% of the Bank's capital and surplus.
The Federal Reserve Act also requires that certain transactions between the Bank and its affiliates be on terms substantially the same, or at least as favorable to the Bank, as those prevailing at the time for comparable transactions with or involving other non-affiliated persons. The FRB has issued Regulation W which codifies the above restrictions on transactions with affiliates.
The restrictions on loans to directors, executive officers, principal shareholders and their related interests (collectively referred to as "insiders") contained in the Federal Reserve Act and Regulation O apply to all insured institutions and their subsidiaries and holding companies. These restrictions include limits on loans to one borrower and conditions that must be met before such loans can be made. There is also an aggregate limitation on all loans to insiders and their related interests. These loans cannot exceed the institution's total unimpaired capital and surplus. The definition of "extension of credit" for transactions with executive officers, directors, and principal shareholders was also expanded under the Dodd-Frank Act to include credit exposure arising from derivative transactions, repurchase or reverse repurchase agreements, and securities lending or borrowing transactions.
FDIC Insurance
The FDIC provides insurance coverage for certain deposits through the Deposit Insurance Fund (the "DIF"), which the FDIC maintains by assessing depository institutions an insurance premium. As a result of higher levels of bank failures over the last few years and the dramatic increase in resolution costs of the FDIC, the DIF has been depleted. In addition, the amount of FDIC insurance coverage for insured deposits has been increased from $100,000 to $250,000 per depositor, per institution, and until January 1, 2013, the insurance coverage for non-interest bearing demand deposits was unlimited. These developments have caused increased stress on the DIF. In order to restore reserves and ensure that the DIF will be able to adequately cover losses from future bank failures, the FDIC approved new deposit insurance rules in November 2009. These new rules required insured depository institutions to prepay their estimated quarterly risk-based assessments for all of 2010, 2011, and 2012. As a result, on December 30, 2009, the Bank prepaid its assessment in the amount of $42.3 million related to years 2010 through 2012. As of December 31, 2012 the remaining balance of our prepaid FDIC assessment was $15.6 million.
On February 7, 2011, as required by the Dodd-Frank Act, the FDIC approved final rules on assessments which became effective on April 1, 2011. These final rules redefined the base for FDIC insurance assessments from the amount of insured deposits to an institution's "average consolidated total assets minus average tangible equity." The FDIC's final rules eliminated risk categories and debt ratings from the assessment calculation for large banks (over $10.0 billion) and combined CAMELS ratings and certain financial measures into two scorecards; one for most large banks and another for the remaining large, highly complex banks. Each scorecard assesses risk measures to produce two scores, a performance score and a loss severity score, that will be combined and converted to an initial assessment rate. However, the FDIC retains the ability to adjust the total score of large and highly complex banks based upon quantitative or qualitative measures not adequately captured in the scorecards. Our FDIC insurance assessment was
$7.9 million
in
2012
and
$9.3 million
in
2011
.
5
Other Safety and Soundness Regulations
As required by FDICIA, the federal banking agencies' prompt corrective action powers impose progressively more restrictive constraints on operations, management and capital distributions, depending on the category in which an institution is classified. These actions can include: requiring an insured depository institution to adopt a capital restoration plan guaranteed by the institution's parent company; placing limits on asset growth and restrictions on activities, including restrictions on transactions with affiliates; restricting the interest rates the institution may pay on deposits; prohibiting the payment of principal or interest on subordinated debt; prohibiting the holding company from making capital distributions without prior regulatory approval; and, ultimately, appointing a receiver for the institution.
The federal banking agencies also have adopted guidelines prescribing safety and soundness standards relating to internal controls and information systems, internal audit systems, loan documentation, credit underwriting, interest rate exposure, asset growth, and compensation and benefits. The federal regulatory agencies may take action against a financial institution that does not meet such standards.
Community Reinvestment and Consumer Protection Laws
In connection with its lending activities, the Bank is subject to a number of federal laws designed to protect borrowers and promote lending to various sectors of the economy and population. These include the Equal Credit Opportunity Act, the Truth-in-Lending Act, the Home Mortgage Disclosure Act, the Real Estate Settlement Procedures Act, and the Community Reinvestment Act (the "CRA"). In addition, federal banking regulators, pursuant to the Gramm-Leach-Bliley Act, have enacted regulations limiting the ability of banks and other financial institutions to disclose nonpublic consumer information to non-affiliated third parties. The regulations require disclosure of privacy policies and allow consumers to prevent certain personal information from being shared with non-affiliated third parties.
The CRA requires the appropriate federal banking agency, in connection with its examination of a bank, to assess the bank's record in meeting the credit needs of the communities served by the bank, including low and moderate income neighborhoods.
Under the CRA, institutions are assigned a rating of "outstanding," "satisfactory," "needs to improve," or "substantial non-compliance." The Bank received an "outstanding" rating in its most recent CRA evaluation.
The Dodd-Frank Act created the Consumer Financial Protection Bureau (the “CFPB”) as an agency to centralize responsibility for consumer financial protection, including implementing, examining and enforcing compliance with federal consumer financial laws. The CFPB has begun exercising supervisory review of banks under its jurisdiction. The CFPB is expected to focus its rulemaking in several areas, particularly in the areas of mortgage reform involving the Real Estate Settlement Procedures Act, the Truth in Lending Act, the Equal Credit Opportunity Act, and the Fair Debt Collection Practices Act; however, the content of the final rules and impact to our businesses are uncertain at this time.
Additional rulemakings to come under the Dodd-Frank Act will dictate compliance changes for financial institutions. Any such changes in regulations or regulatory policies applicable to the Bank make it difficult to predict the ultimate effect on our financial condition or results of operations.
Bank Secrecy Act / Anti-Money Laundering Laws
The Bank is subject to the Bank Secrecy Act and other anti-money laundering laws and regulations, including the USA PATRIOT Act of 2001. The USA PATRIOT Act substantially broadened the scope of U.S. anti-money laundering laws and regulations by creating new laws, regulations, and penalties, imposing significant new compliance and due diligence obligations, and expanding the extra-territorial jurisdiction of the U.S. These laws and regulations require the Bank to implement policies, procedures, and controls to detect, prevent, and report potential money laundering and terrorist financing and to verify the identity of its customers. Violations of these requirements can result in substantial civil and criminal sanctions. In addition, provisions of the USA PATRIOT Act require the federal financial institution regulatory agencies to consider the effectiveness of a financial institution's anti-money laundering activities when reviewing bank mergers and BHC acquisitions.
Employees
As of
December 31, 2012
, we had approximately 2,300 employees.
6
Executive Officers of the Registrant
Listed below are executive officers of the Parent as of
December 31, 2012
.
Peter S. Ho, 47
Chairman and Chief Executive Officer since July 2010 and President since April 2008; Vice Chairman and Chief Banking Officer from January 2006 to April 2008.
Chairman and Chief Executive Officer since July 2010 and President since April 2008; Vice Chairman and Chief Banking Officer from January 2006 to April 2008.
Kent T. Lucien, 59
Vice Chairman and Chief Financial Officer since April 2008; Trustee, C. Brewer & Co., Ltd. from April 2006 to December 2007.
Vice Chairman and Chief Financial Officer since April 2008; Trustee, C. Brewer & Co., Ltd. from April 2006 to December 2007.
Peter M. Biggs, 61
Vice Chairman since February 2011 and Chief Retail Officer since April 2012; Senior Executive Vice President, Consumer Products Division from March 2006 to February 2011.
Sharon M. Crofts, 47
Vice Chairman of Operations and Technology since October 2012; Senior Executive Vice President of Operations from May 2008 to October 2012; Executive Vice President and Chief Compliance Officer from December 2005 to May 2008.
Wayne Y. Hamano, 58
Vice Chairman since December 2008 and Chief Commercial Officer since September 2007; Senior Executive Vice President, Hawaii Commercial Banking Division from July 2006 to September 2007.
Mark A. Rossi, 63
Vice Chairman, Chief Administrative Officer, General Counsel, and Corporate Secretary since February 2007; President of Lane Powell PC from July 2004 to January 2007.
Mary E. Sellers, 56
Vice Chairman and Chief Risk Officer since July 2005.
Donna A. Tanoue, 58
Vice Chairman, Client Relations and Community Activities since February 2007; President of the Bank of Hawaii Foundation since April 2006.
Derek J. Norris, 63
Senior Executive Vice President and Controller since December 2009; Executive Vice President and Controller since December 2008; Executive Vice President and General Auditor from January 2002 to December 2008.
7
There are a number of risks and uncertainties that could negatively affect our business, financial condition or results of operations. The risks and uncertainties described below are some of the important inherent risk factors that could affect our business and operations, although they are not the only risks that may have a material adverse affect on the Company.
Changes in business and economic conditions, in particular those of Hawaii and the Pacific Islands (Guam and nearby islands), could lead to lower revenue, lower asset quality, and lower earnings.
Unlike larger national or other regional banks that are more geographically diversified, our business and earnings are closely tied to the economies of Hawaii and the Pacific Islands. These local economies rely heavily on tourism, real estate, government, and other service-based industries. Lower visitor arrivals or spending, real or threatened acts of war or terrorism, increases in energy costs, the availability of affordable air transportation, natural disasters and adverse weather, public health issues, and State of Hawaii and County budget issues impact consumer and corporate spending. As a result, such events may contribute to a significant deterioration in general economic conditions in our markets which could adversely impact us and our customers' operations.
Hawaii's economy continued to improve during 2012 due to increasing visitor arrivals and spending. However, deterioration of economic conditions or the slow pace of economic recovery could adversely affect the quality of our assets, credit losses, and the demand for our products and services, which could lead to lower revenues and lower earnings. The level of visitor arrivals and spending, housing prices, and unemployment rates are some of the metrics that we continually monitor. We also monitor the value of collateral, such as real estate, that secures the loans we have made. The borrowing power of our customers could also be negatively impacted by a decline in the value of collateral.
Changes in defense spending by the federal government as a result of congressional budget cuts could adversely impact the economy in Hawaii and the Pacific Islands.
The U.S. military has a major presence in Hawaii and the Pacific Islands. As a result, the U.S. military is an important aspect of the economies in which we operate. Proposals to cut defense and other security spending could have an adverse impact on the economies in which we operate, which could adversely affect our business, financial condition, and results of operations.
Difficult market conditions and economic trends have adversely affected our industry.
The banking industry continues to be affected by a depressed real estate market, high levels of unemployment, low demand for new lending opportunities, and low interest margins. Dramatic declines in the national housing market over the past several years, with falling home prices and increasing foreclosures and unemployment, have resulted in significant write-downs of asset values by financial institutions. Although economic conditions in Hawaii and the U.S. are showing signs of improvement, a further decline in real estate values, home sales volumes and financial stress on borrowers as a result of the uncertain economic environment could have an adverse effect on our borrowers and/or their customers, which could adversely affect our financial condition and results of operations. Continued economic conditions that negatively affect the housing market, the job market and the demand for other goods and services could cause the credit quality of the Company's loan portfolios to deteriorate, which would have a negative impact on the Company's business.
Real estate values in Hawaii were somewhat more resilient than many markets on the U.S. Mainland over recent years. Furthermore, our commercial and consumer delinquencies improved in 2012. However, there is no assurance that these trends will continue in future periods.
Risks from the debt crisis in Europe could result in a disruption of the financial markets which may have a detrimental impact on global economic conditions and affect economic conditions in Hawaii.
There remains considerable uncertainty as to future developments in the European debt crisis and the impact on financial markets. Market and economic disruptions have affected, and may continue to affect, consumer confidence levels, spending, and credit factors, such that our business and results of operations could be adversely affected.
8
Changes in interest rates could adversely impact our results of operations and capital.
Our earnings are highly dependent on the spread between the interest earned on loans, leases, and investment securities and the interest paid on deposits and borrowings. Changes in market interest rates impact the rates earned on loans, leases, and investment securities and the rates paid on deposits and borrowings. In addition, changes to market interest rates could impact the level of loans, leases, investment securities, deposits, and borrowings, and the credit profile of our current borrowers. Interest rates are affected by many factors beyond our control, and fluctuate in response to general economic conditions, currency fluctuations, and the monetary and fiscal policies of various governmental and regulatory authorities. Changes in monetary policy, including changes in interest rates, will influence the origination of loans and leases, the purchase of investments, the generation of deposits, and the rates received on loans and investment securities and paid on deposits. Any substantial prolonged change in market interest rates may negatively impact our ability to attract deposits, originate loans and leases, and achieve satisfactory interest rate spreads, any of which could adversely affect our financial condition or results of operations.
Credit losses could increase if economic conditions stagnate or deteriorate.
Although economic conditions are improving nationally and in Hawaii, increased credit losses for us could result if economic conditions stagnate or deteriorate. The risk of nonpayment on loans and leases is inherent in all lending activities. We maintain a reserve for credit losses to absorb estimated probable credit losses inherent in the loan, lease, and commitment portfolios as of the balance sheet date. Management makes various assumptions and judgments about the loan and lease portfolio in determining the level of the reserve for credit losses. Many of these assumptions are based on current economic conditions. Should economic conditions stagnate or deteriorate nationally or in Hawaii, we may experience higher credit losses in future periods.
Inability of our borrowers to make timely repayments on their loans, or decreases in real estate collateral values may result in increased delinquencies, foreclosures, and customer bankruptcies, any of which could have a material adverse effect on our financial condition or results of operations.
Legislation and regulatory initiatives affecting the financial services industry, including restrictions and requirements, could detrimentally affect the Company's business.
In light of current conditions and the market expectation of a slow economic recovery, regulators have increased their focus on the regulation of financial institutions. Laws and regulations, and in particular banking, securities and tax laws, are under intense scrutiny because of the current economic environment. The Dodd-Frank Act, enacted in July 2010, affected sweeping reforms to the financial services industry. Although some of the rules and regulations implementing the Dodd-Frank Act have already gone into effect, many provisions of the Dodd-Frank Act have yet to be implemented and will require further interpretation and rulemaking by federal regulators. We are closely monitoring all relevant sections of the Dodd-Frank Act to ensure continued compliance with laws and regulations. While the ultimate effect of the Dodd-Frank Act on us cannot currently be determined, the law and its implementing rules and regulations are likely to result in increased compliance costs and fees, along with possible restrictions on our operations, any of which may have a material adverse affect on our operating results and financial condition. The regulation of most consumer financial products and services is now centralized in the CFPB, where it has begun to exercise its broad rule-making, supervisory, and examination authority, as well as expanded data collecting and enforcement powers, over depository institutions with more than $10.0 billion in assets. However, regulation of overall safety and soundness, the CRA, federal housing and flood insurance, as they pertain to consumer financial products and services, will remain with the FRB. Much of the rules and regulations of the CFPB have not been implemented, and therefore, the scope and impact of the CFPB's actions cannot be determined at this time. This creates significant uncertainty for the Company and the financial services industry in general.
These new laws, regulations, and changes may increase our costs of regulatory compliance. They may significantly affect the markets in which we do business, the markets for and value of our investments, and our ongoing operations, costs, and profitability. The future impact of the many provisions of the Dodd-Frank Act and other legislative and regulatory initiatives on the Company's business and results of operations will depend upon regulatory interpretation and rulemaking that will be undertaken over the next several months and years. As a result, we are unable to predict the ultimate impact of the Dodd-Frank Act or of other future legislation or regulation, including the extent to which it could increase costs or limit our ability to pursue business opportunities in an efficient manner, or otherwise adversely affect our business, financial condition, and results of operations.
9
Changes in the capital, leverage, liquidity requirements and the introduction of stress testing requirements for financial institutions could materially affect future requirements of the Company.
Under Basel III, it is expected that financial institutions will be required to have more capital and a higher quality of capital. Basel III is also expected to impose a leverage ratio requirement and liquidity standards. The new minimum capital requirements were to be phased in between January 2013 and January 2015. However, on November 9, 2012, the U.S. federal banking agencies indicated that a delay in implementation of the proposed dates was necessary, but did not provide a substitute effective date for the new rules. Implementation of these new capital and liquidity requirements has created significant uncertainty with respect to the future requirements for financial institutions.
In October 2012, the FRB published final rules implementing the Dodd-Frank Act stress testing requirements for banks with total consolidated assets of more than $10.0 billion. The final stress testing rules set forth the timing and type of stress test activities as well as rules governing controls, oversight and disclosure.
Compliance with Basel III and the results of our stress testing may result in increased capital, liquidity, and disclosure requirements. See the "Regulatory Initiatives Related to Liquidity, Capital, and Stress Testing" section in MD&A for more information.
Consumer protection initiatives related to the foreclosure process could affect our remedies as a creditor.
Proposed consumer protection initiatives related to the foreclosure process, including voluntary and/or mandatory programs intended to permit or require lenders to consider loan modifications or other alternatives to foreclosure, could increase our credit losses or increase our expense in pursuing our remedies as a creditor.
For example, in May 2011, a new Hawaii foreclosure law ("Act 48") overhauled rules for nonjudicial, or out-of-court, foreclosures. Previously, nonjudicial foreclosures were how lenders handled the vast majority of foreclosures in Hawaii, as the process was quicker and less expensive than going through court. Act 48 was intended to curb potential lender abuses while providing qualified owner-occupants an option to have a dispute resolution professional assist with foreclosure mitigation in front of a lender's representative before a foreclosure sale can proceed. However, Act 48 has had the unintended effect of lenders forgoing nonjudicial foreclosures entirely and filing all foreclosures in court, creating a backlog that has slowed the judicial foreclosure process. In June 2012, Act 182 was enacted partially in an attempt to modify Act 48 to make it more acceptable for lenders to pursue nonjudicial foreclosures. The manner in which these issues are ultimately resolved could impact our foreclosure procedures, which in turn could affect our financial condition or results of operations. In addition, the joint federal-state settlement with several mortgage servicers over foreclosure practice abuses creates additional uncertainty for the Company and the mortgage servicing industry in general as it relates to the implementation of mortgage loan modifications and loss mitigation practices in the future.
Competition may adversely affect our business.
Our future depends on our ability to compete effectively. We compete for deposits, loans, leases, and other financial services with a variety of competitors, including banks, thrifts, credit unions, mortgage companies, broker dealers, and insurance companies, all of which may be based in or outside of Hawaii and the Pacific Islands. We expect competitive conditions to intensify as consolidation in the financial services industry continues. The financial services industry is also likely to become more competitive as further technological advances enable more companies, including non-depository institutions, to provide financial services. Failure to effectively compete, innovate, and to make effective use of available channels to deliver our products and services could adversely affect our financial condition or results of operations.
The Parent's liquidity is dependent on dividends from the Bank.
The Parent is a separate and distinct legal entity from the Bank. The Parent receives substantially all of its cash in the form of dividends from the Bank. These dividends are the principal source of funds to pay, for example, dividends on the Parent's common stock or to repurchase common stock under our share repurchase program. Various federal and state laws and regulations limit the amount of dividends that the Bank may pay to the Parent. If the amount of dividends paid by the Bank is further limited, the Parent's ability to meet its obligations, pay dividends to shareholders, or repurchase stock, may be further limited as well.
10
A failure in or breach of our operational systems, information systems, or infrastructure, or those of our third party vendors and other service providers, may result in financial losses, loss of customers, or damage to our reputation.
We rely heavily on communications and information systems to conduct our business. In addition, we rely on third parties to provide key components of our infrastructure, including loan, deposit and general ledger processing, internet connections, and network access. These types of information and related systems are critical to the operation of our business and essential to our ability to perform day-to-day operations, and, in some cases, are critical to the operations of certain of our customers. These third parties with which we do business or that facilitate our business activities, including exchanges, clearing firms, financial intermediaries or vendors that provide services or security solutions for our operations, could also be sources of operational and information security risk to us, including from breakdowns or failures of their own systems or capacity constraints. Although we have business continuity plans and other safeguards in place, our business operations may be adversely affected by significant and widespread disruption to our physical infrastructure or operating systems that support our business and our customers, resulting in financial losses, loss of customers, or damage to our reputation.
An interruption or breach in security of our information systems, including as a result of cyber attacks, could disrupt our business, result in the disclosure or misuse of confidential or proprietary information, damage our reputation, or result in financial losses.
Our technologies, systems, networks and software, and those of other financial institutions, have been and are likely to continue to be the target of cyber attacks, malicious code, computer viruses and denial of service attacks that could result in unauthorized access, misuse, loss or destruction of data (including confidential customer information), account takeovers, unavailability of service or other events. These types of threats may derive from human error, fraud or malice on the part of external or internal parties, or may result from accidental technological failure. Further, to access our products and services our customers may use computers and mobile devices that are beyond our security control systems. The risk of a security breach or disruption, particularly through cyber attack or cyber intrusion, including by computer hackers, has increased as the number, intensity and sophistication of attempted attacks and intrusions from around the world have increased.
Our customers and employees have been, and will continue to be, targeted by parties using fraudulent e-mails and other communications to misappropriate passwords, credit card numbers, or other personal information or to introduce viruses or other malware through "trojan horse" programs to our customers' computers. These communications may appear to be legitimate messages sent by the Bank or other businesses, but direct recipients to fake websites operated by the sender of the e-mail or request that the recipient send a password or other confidential information via e-mail or download a program. Despite our efforts to mitigate these tactics through product improvements, and customer and employee education, such attempted frauds remain a serious problem that may cause customer and/or Bank losses, damage to our brand, and an increase in our costs.
Although we make significant efforts to maintain the security and integrity of our information systems and have implemented various measures to manage the risk of a security breach or disruption, there can be no assurance that our security efforts and measures will be effective or that attempted security breaches or disruptions would not be successful or damaging. Even the most well protected information, networks, systems and facilities remain potentially vulnerable because attempted security breaches, particularly cyber attacks and intrusions, or disruptions will occur in the future, and because the techniques used in such attempts are constantly evolving and generally are not recognized until launched against a target, and in some cases are designed not to be detected and, in fact, may not be detected. Accordingly, we may be unable to anticipate these techniques or to implement adequate security barriers or other preventative measures, and thus it is virtually impossible for us to entirely mitigate this risk. A security breach or other significant disruption could: 1) Disrupt the proper functioning of our networks and systems and therefore our operations and/or those of certain of our customers; 2) Result in the unauthorized access to, and destruction, loss, theft, misappropriation or release of confidential, sensitive or otherwise valuable information of ours or our customers, including account numbers and other financial information; 3) Result in a violation of applicable privacy and other laws, subjecting the Bank to additional regulatory scrutiny and expose the Bank to civil litigation and possible financial liability; 4) Require significant management attention and resources to remedy the damages that result; or 5) Harm our reputation or cause a decrease in the number of customers that choose to do business with us. The occurrence of any such failures, disruptions or security breaches could have a negative impact on our results of operations, financial condition, and cash flows.
Negative public opinion could damage our reputation and adversely impact our earnings and liquidity.
Reputational risk, or the risk to our business, earnings, liquidity, and capital from negative public opinion could result from our actual or alleged conduct in a variety of areas, including legal and regulatory compliance, lending practices, corporate governance, litigation, ethical issues, or inadequate protection of customer information. We expend significant resources to
11
comply with regulatory requirements. Failure to comply could result in reputational harm or significant legal or remedial costs. Damage to our reputation could adversely affect our ability to retain and attract new customers, and adversely impact our earnings and liquidity.
We are subject to certain litigation, and our expenses related to this litigation may adversely affect our results.
We are, from time to time, involved in various legal proceedings arising from our normal business activities. These claims and legal actions, including supervisory actions by our regulators, could involve large monetary claims and significant defense costs. The outcome of these cases is uncertain. Substantial legal liability or significant regulatory action against us could have material financial effects or cause significant reputational harm to us, which in turn could seriously harm our business prospects. We may be exposed to substantial uninsured liabilities, which could materially affect our results of operations and financial condition. Based on information currently available, we believe that the eventual outcome of known actions against us will not be materially in excess of such amounts accrued by us. However, in the event of unexpected future developments, it is possible that the ultimate resolution of those matters may be material to our statement of income for any particular period.
Changes in income tax laws or interpretations or in accounting standards could materially affect our financial condition or results of operations.
Changes in income tax laws could be enacted, or interpretations of existing income tax laws could change, causing an adverse effect to our financial condition or results of operations. Similarly, our accounting policies and methods are fundamental to how we report our financial condition and results of operations. Some of these policies require use of estimates and assumptions that may affect the value of our assets, liabilities, and financial results. Periodically, new accounting standards are imposed or existing standards are revised, changing the methods for preparing our financial statements. These changes are not within our control and may significantly impact our financial condition and results of operations.
Our performance depends on attracting and retaining key employees and skilled personnel to operate our business effectively.
Our success is dependent on our ability to recruit qualified and skilled personnel to operate our business effectively. Competition for these qualified and skilled people is intense. There are a limited number of qualified personnel in the markets we serve, so our success depends in part on the continued services of many of our current management and other key employees. Failure to retain our key employees and maintain adequate staffing of qualified personnel could adversely impact our operations and our ability to compete.
The soundness of other financial institutions, as counterparties, may adversely impact our financial condition or results of operations.
Our ability to engage in routine funding transactions could be adversely affected by the actions and commercial soundness of other financial institutions. Financial services institutions are interrelated as a result of trading, clearing, lending, counterparty, or other relationships. As a result, defaults by, or even rumors or questions about, one or more financial services institutions or the financial services industry in general have led to market-wide liquidity problems and could lead to losses or defaults by us or by other institutions. We have exposure to many different industries and counterparties, and we routinely execute transactions with brokers and dealers, commercial banks, investment banks, mutual funds, and other institutional clients. Many of these transactions expose us to credit risk in the event of default of our counterparty or client. In addition, our credit risk may be exacerbated when the collateral held by us cannot be realized upon or is liquidated at prices not sufficient to recover the full amount of the loan or derivative exposure due us. Such losses could materially affect our financial condition or results of operations.
Changes in the capital markets could materially affect the level of assets under management and the demand for our other fee-based services.
Changes in the capital markets could affect the volume of income from and demand for our fee-based services. Our investment management revenues depend in large part on the level of assets under management. Market volatility that leads customers to liquidate investments, move investments to other institutions or asset classes, as well as lower asset values can reduce our level of assets under management and thereby decrease our investment management revenues.
12
Our mortgage banking income may experience significant volatility.
Our mortgage banking income is highly influenced by the level and direction of mortgage interest rates, real estate activity, and refinancing activity. Interest rates can affect the amount of mortgage banking activity and impact fee income and the fair value of our derivative financial instruments and mortgage servicing rights. Mortgage banking income may also be impacted by changes in our strategy to manage our residential mortgage portfolio. For example, we may occasionally change the proportion of our loan originations that are sold in the secondary market and added to our loan portfolio.
Our strong mortgage banking results for 2012 were primarily due to high levels of loan refinancing activity and loan sales, which were the result of low interest rates. We also sold loans in the secondary market at relatively higher margins in 2012 compared to prior years. Our mortgage banking results for 2012 is not necessarily indicative of results to be expected in 2013.
Our investment in the Federal Home Loan Bank of Seattle (the "FHLB") stock may be subject to impairment charges in future periods if the financial condition of the FHLB declines further.
The Bank is a member of the FHLB, and as such, is required to hold FHLB stock as a condition of membership. As of December 31, 2012, the carrying value of our FHLB stock was $60.2 million and consisted of 602,001 shares valued at a par value of $100 per share. Ownership of FHLB stock is restricted and the stock can only be redeemed or sold at par value and only to the FHLB or to another member institution. In August 2009, the FHLB received a capital classification of "undercapitalized" from its primary regulator, the Federal Housing Finance Agency (the "Finance Agency"). However, on September 7, 2012, the FHLB reported that its financial health has been steadily improving. As such, the Finance Agency upgraded the FHLB's classification to “adequately capitalized,” which allows it, conditions permitting, to repurchase a small amount of excess capital stock for the first time since December 2008. In 2007, the Company requested the redemption of 361,645 shares of FHLB common stock. In 2012, the FHLB redeemed 10,923 shares of their stock at par value of $100 per share for a total of $1.1 million. This redemption reduced our holdings in FHLB stock from $61.3 million as of December 31, 2011 to $60.2 million as of December 31, 2012.
Although the FHLB is showing signs of financial improvement, the FHLB is still dealing with generally weak demand for wholesale funding, including FHLB advances, and the possibility that further declines in the value of its private-label mortgage-backed securities could cause it to fall below its risk-based capital requirements. Such adverse occurrences could subject our FHLB stock to future impairment charges. See discussion in MD&A and Note 7 to the Consolidated Financial Statements related to the impairment analysis of our FHLB stock as of December 31, 2012.
The requirement to record certain assets and liabilities at fair value may adversely affect our financial results.
We report certain assets, including available-for-sale investment securities, at fair value. Generally, for assets that are reported at fair value we use quoted market prices or valuation models that utilize market data inputs to estimate fair value. Because we record these assets at their estimated fair value, we may incur losses even if the asset in question presents minimal credit risk. The level of interest rates can impact the estimated fair value of investment securities. Disruptions in the capital markets may require us to recognize other-than-temporary impairments in future periods with respect to investment securities in our portfolio. The amount and timing of any impairment recognized will depend on the severity and duration of the decline in fair value of our investment securities and our estimation of the anticipated recovery period.
Changes to the amount and timing of proposed common stock repurchases.
The actual amount and timing of future share repurchases, if any, will depend on market and economic conditions, applicable SEC rules, and various other factors.
13
Not Applicable.
Our principal offices are located in the Financial Plaza of the Pacific in Honolulu, Hawaii. We own and lease other branch offices and operating facilities located throughout Hawaii and the Pacific Islands. Additional information with respect to premises and equipment is presented in Notes 6 and 18 to the Consolidated Financial Statements.
Information required by this item is set forth in Note 18 to the Consolidated Financial Statements, under the discussion related to Contingencies.
Not Applicable.
14
Market Information, Shareholders, and Dividends
Information regarding the historical market prices of the Parent's common stock, book value, and dividends declared on that stock are shown below.
Market Prices, Book Values, and Common Stock Dividends Per Share
|
Market Price Range
|
Book Value
|
Dividends
Declared |
||||||||||||||||||
|
Year/Period
|
High
|
Low
|
Close
|
|||||||||||||||||
|
2012
|
$
|
49.99
|
|
$
|
41.41
|
|
$
|
44.05
|
|
$
|
22.83
|
|
$
|
1.80
|
|
|||||
|
First Quarter
|
48.75
|
|
44.08
|
|
48.35
|
|
0.45
|
|
||||||||||||
|
Second Quarter
|
49.99
|
|
44.02
|
|
45.95
|
|
0.45
|
|
||||||||||||
|
Third Quarter
|
48.92
|
|
45.29
|
|
45.62
|
|
0.45
|
|
||||||||||||
|
Fourth Quarter
|
46.38
|
|
41.41
|
|
44.05
|
|
0.45
|
|
||||||||||||
|
2011
|
$
|
49.26
|
|
$
|
34.50
|
|
$
|
44.49
|
|
$
|
21.82
|
|
$
|
1.80
|
|
|||||
|
First Quarter
|
49.23
|
|
44.32
|
|
47.82
|
|
0.45
|
|
||||||||||||
|
Second Quarter
|
49.26
|
|
44.90
|
|
46.52
|
|
0.45
|
|
||||||||||||
|
Third Quarter
|
47.10
|
|
35.30
|
|
36.40
|
|
0.45
|
|
||||||||||||
|
Fourth Quarter
|
45.13
|
|
34.50
|
|
44.49
|
|
0.45
|
|
||||||||||||
The common stock of the Parent is traded on the New York Stock Exchange (NYSE Symbol: BOH) and quoted daily in leading financial publications. As of February 14, 2013, there were 6,747 common shareholders of record.
The Parent's Board of Directors considers on a quarterly basis the feasibility of paying a cash dividend to its shareholders and the level and feasibility of repurchasing shares of the Parent's common stock. Under the Parent's general practice, dividends, if declared during the quarter, are paid prior to the end of the subsequent quarter. See "Dividend Restrictions" under "Supervision and Regulation" in Item 1 of this report and Note 11 to the Consolidated Financial Statements for more information.
Issuer Purchases of Equity Securities
|
Period
|
Total Number of
Shares Purchased 1 |
Average Price
Paid Per Share |
Total Number of
Shares Purchased as Part of Publicly Announced Plans or Programs |
Approximate Dollar Value
of Shares that May Yet Be Purchased Under the Plans or Programs 2 |
||||||||
|
October 1 - 31, 2012
|
130,000
|
$
|
44.69
|
|
130,000
|
$
|
78,647,890
|
|
||||
|
November 1 - 30, 2012
|
168,830
|
43.68
|
|
163,000
|
71,535,420
|
|
||||||
|
December 1 - 31, 2012
|
46,000
|
43.81
|
|
46,000
|
69,520,078
|
|
||||||
|
Total
|
344,830
|
$
|
44.08
|
|
339,000
|
|||||||
1
During the fourth quarter of 2012, 5,830 shares were purchased from employees in connection with stock swaps and shares purchased for a deferred
compensation plan. These shares were not purchased as part of the publicly announced program. The shares were purchased at the closing price of the Parent's
common stock on the dates of purchase.
2
The share repurchase program was first announced in July 2001. As of December 31, 2012, $69.5 million remained of the total $1.9 billion total repurchase
amount authorized by the Parent's Board of Directors under the share repurchase program. The program has no set expiration or termination date.
15
Performance Graph
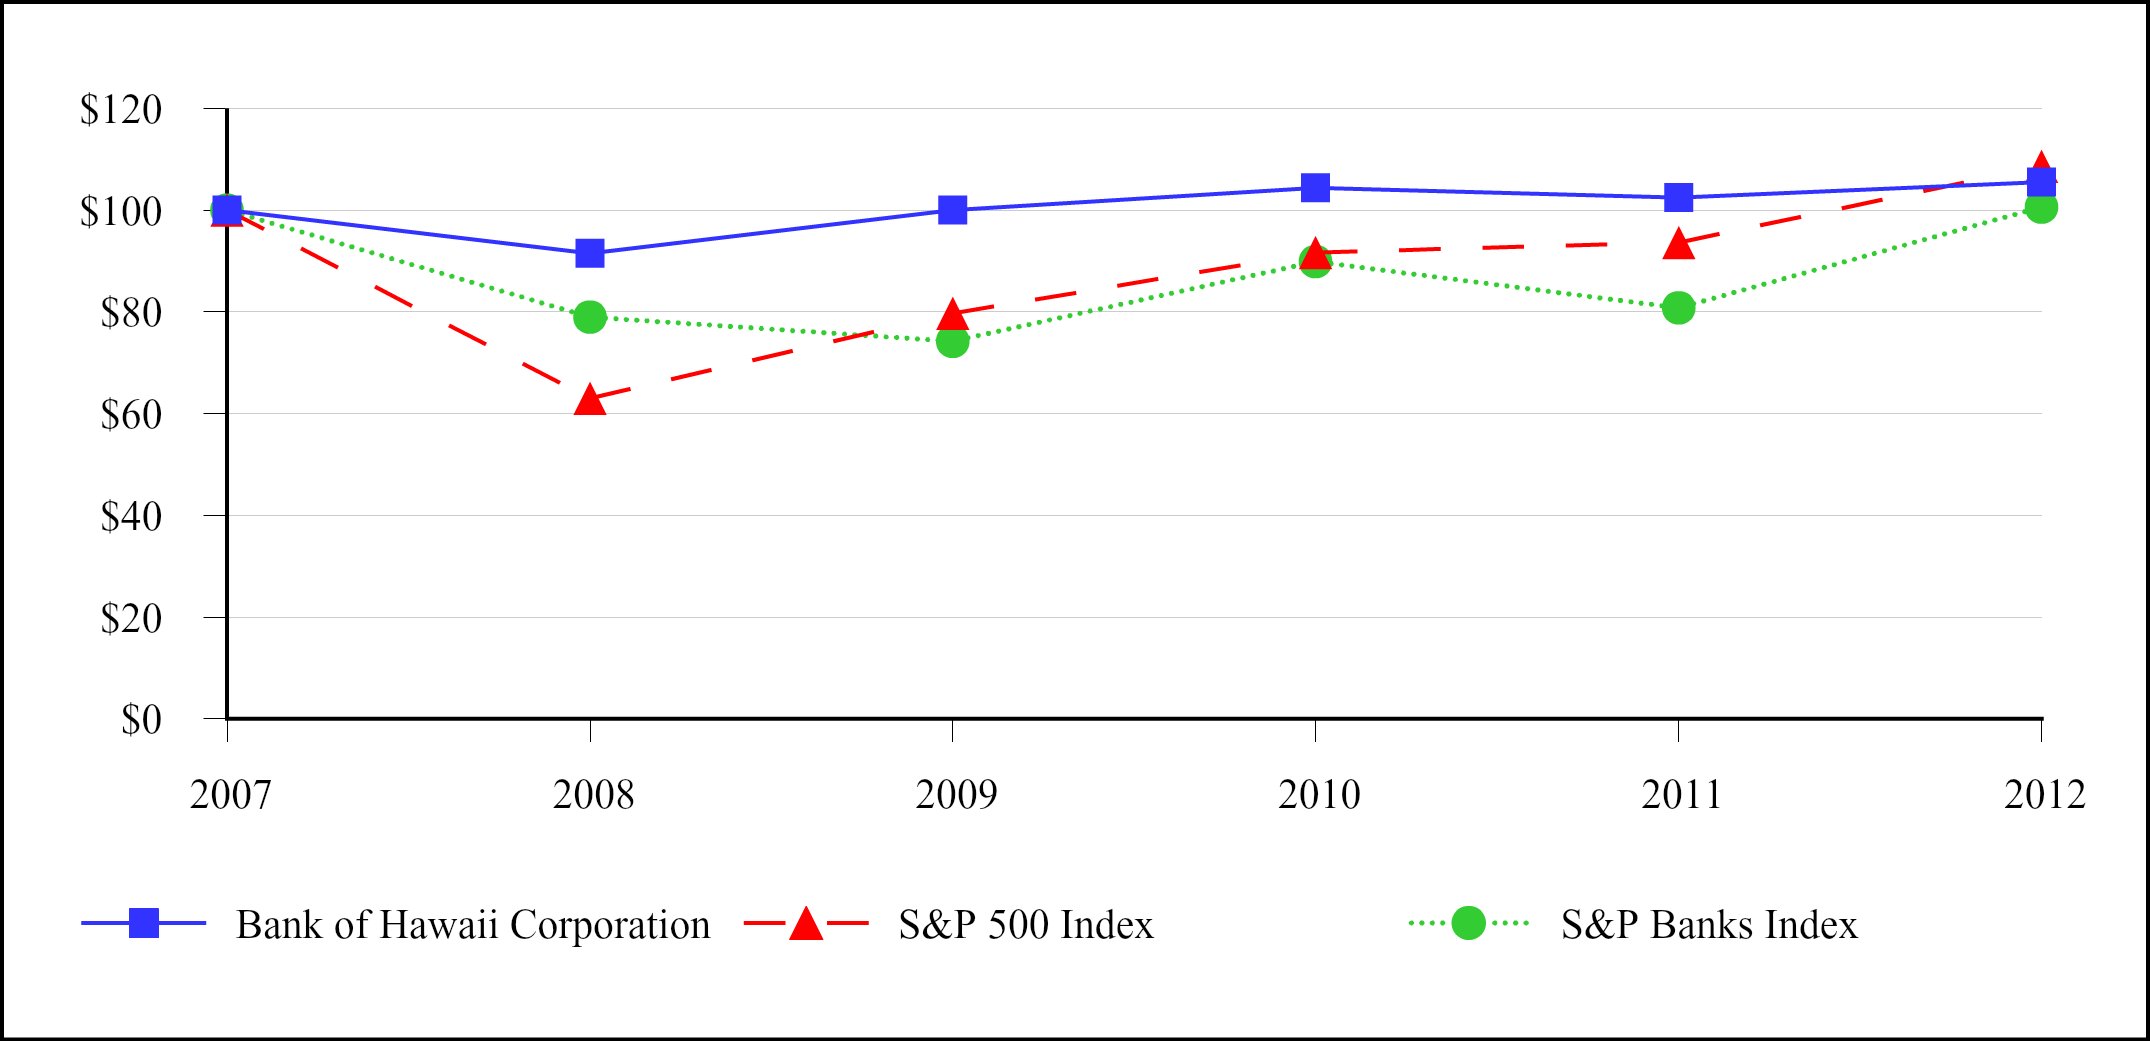
The following graph shows the cumulative total return for the Parent's common stock compared to the cumulative total returns for the Standard & Poor's ("S&P") 500 Index and the S&P Banks Index. The graph assumes that $100 was invested on December 31, 2007 in the Parent's common stock, the S&P 500 Index, and the S&P Banks Index. The cumulative total return on each investment is as of December 31 of each of the subsequent five years and assumes reinvestment of dividends.
|
2007
|
2008
|
2009
|
2010
|
2011
|
2012
|
|
|
Bank of Hawaii Corporation
|
$100
|
$92
|
$100
|
$104
|
$103
|
$106
|
|
S&P 500 Index
|
100
|
63
|
80
|
92
|
94
|
109
|
|
S&P Banks Index
|
100
|
79
|
74
|
90
|
81
|
101
|
16
Summary of Selected Consolidated Financial Data
|
(dollars in millions, except per share amounts)
|
2012
|
|
2011
|
|
2010
|
|
2009
|
|
2008
|
|
|||||||||||
|
Year Ended December 31,
|
|||||||||||||||||||||
|
Operating Results
|
|||||||||||||||||||||
|
Net Interest Income
|
$
|
377.3
|
|
$
|
390.2
|
|
$
|
406.5
|
|
$
|
412.3
|
|
$
|
418.8
|
|
||||||
|
Provision for Credit Losses
|
1.0
|
12.7
|
55.3
|
107.9
|
60.5
|
||||||||||||||||
|
Total Noninterest Income
|
200.3
|
197.7
|
255.3
|
267.8
|
258.1
|
||||||||||||||||
|
Total Noninterest Expense
|
334.3
|
348.2
|
346.2
|
350.0
|
346.8
|
||||||||||||||||
|
Net Income
|
166.1
|
160.0
|
183.9
|
144.0
|
192.2
|
||||||||||||||||
|
Basic Earnings Per Share
|
3.68
|
3.40
|
3.83
|
3.02
|
4.03
|
||||||||||||||||
|
Diluted Earnings Per Share
|
3.67
|
3.39
|
3.80
|
3.00
|
3.99
|
||||||||||||||||
|
Dividends Declared Per Share
|
1.80
|
1.80
|
1.80
|
1.80
|
1.77
|
||||||||||||||||
|
Performance Ratios
|
|||||||||||||||||||||
|
Net Income to Average Total Assets (ROA)
|
1.22
|
|
%
|
1.22
|
|
%
|
1.45
|
|
%
|
1.22
|
|
%
|
1.84
|
|
%
|
||||||
|
Net Income to Average Shareholders' Equity (ROE)
|
16.23
|
15.69
|
18.16
|
16.42
|
24.54
|
||||||||||||||||
|
Efficiency Ratio
1
|
57.88
|
59.23
|
52.32
|
51.46
|
51.23
|
||||||||||||||||
|
Net Interest Margin
2
|
2.97
|
3.13
|
3.41
|
3.72
|
4.33
|
||||||||||||||||
|
Dividend Payout Ratio
3
|
48.91
|
52.94
|
47.00
|
59.60
|
43.92
|
||||||||||||||||
|
Average Shareholders' Equity to Average Assets
|
7.52
|
7.78
|
7.98
|
7.44
|
7.50
|
||||||||||||||||
|
Average Balances
|
|||||||||||||||||||||
|
Average Loans and Leases
|
$
|
5,680.3
|
|
$
|
5,349.9
|
|
$
|
5,472.5
|
|
$
|
6,145.0
|
|
$
|
6,542.2
|
|
||||||
|
Average Assets
|
13,609.2
|
13,105.0
|
12,687.7
|
11,783.4
|
10,448.2
|
||||||||||||||||
|
Average Deposits
|
10,935.0
|
9,924.7
|
9,509.1
|
9,108.4
|
7,851.3
|
||||||||||||||||
|
Average Shareholders' Equity
|
1,023.3
|
1,020.1
|
1,012.7
|
877.2
|
783.1
|
||||||||||||||||
|
Weighted Average Shares Outstanding
|
|||||||||||||||||||||
|
Basic Weighted Average Shares
|
45,115,441
|
47,064,925
|
48,055,025
|
47,702,500
|
47,674,000
|
||||||||||||||||
|
Diluted Weighted Average Shares
|
45,249,300
|
47,224,981
|
48,355,965
|
48,009,277
|
48,200,650
|
||||||||||||||||
|
As of December 31,
|
|||||||||||||||||||||
|
|
|||||||||||||||||||||
|
Loans and Leases
|
$
|
5,854.5
|
|
$
|
5,538.3
|
|
$
|
5,335.8
|
|
$
|
5,759.8
|
|
$
|
6,530.2
|
|
||||||
|
Total Assets
|
13,728.4
|
13,846.4
|
13,126.8
|
12,414.8
|
10,763.5
|
||||||||||||||||
|
Total Deposits
|
11,529.5
|
10,592.6
|
9,889.0
|
9,409.7
|
8,292.1
|
||||||||||||||||
|
Long-Term Debt
|
128.1
|
30.7
|
32.7
|
90.3
|
203.3
|
||||||||||||||||
|
Total Shareholders' Equity
|
1,021.7
|
1,002.7
|
1011.1
|
896.0
|
790.7
|
||||||||||||||||
|
Asset Quality
|
|||||||||||||||||||||
|
Allowance for Loan and Lease Losses
|
$
|
128.9
|
|
$
|
138.6
|
|
$
|
147.4
|
|
$
|
143.7
|
|
$
|
123.5
|
|
||||||
|
Non-Performing Assets
4
|
37.1
|
40.8
|
37.8
|
48.3
|
14.9
|
||||||||||||||||
|
Financial Ratios
|
|||||||||||||||||||||
|
Allowance to Loans and Leases Outstanding
|
2.20
|
|
%
|
2.50
|
|
%
|
2.76
|
|
%
|
2.49
|
|
%
|
1.89
|
|
%
|
||||||
|
Tier 1 Capital Ratio
|
16.13
|
16.68
|
18.28
|
14.84
|
11.24
|
||||||||||||||||
|
Total Capital Ratio
|
17.39
|
17.95
|
19.55
|
16.11
|
12.49
|
||||||||||||||||
|
Tier 1 Leverage Ratio
|
6.83
|
6.73
|
7.15
|
6.76
|
7.30
|
||||||||||||||||
|
Total Shareholders' Equity to Total Assets
|
7.44
|
7.24
|
7.70
|
7.22
|
7.35
|
||||||||||||||||
|
Tangible Common Equity to Tangible Assets
5
|
7.23
|
7.03
|
7.48
|
6.98
|
7.04
|
||||||||||||||||
|
Tangible Common Equity to Risk-Weighted Assets
5
|
17.24
|
17.93
|
19.29
|
15.45
|
11.28
|
||||||||||||||||
|
Non-Financial Data
|
|||||||||||||||||||||
|
Full-Time Equivalent Employees
|
2,276
|
2,370
|
2,399
|
2,418
|
2,581
|
||||||||||||||||
|
Branches and Offices
|
76
|
81
|
82
|
83
|
85
|
||||||||||||||||
|
ATMs
|
494
|
506
|
502
|
485
|
462
|
||||||||||||||||
|
Common Shareholders of Record
|
6,775
|
6,977
|
7,128
|
7,323
|
7,523
|
||||||||||||||||
|
1
|
Efficiency ratio is defined as noninterest expense divided by total revenue (net interest income and noninterest income).
|
|
2
|
Net interest margin is defined as net interest income, on a fully taxable-equivalent basis, as a percentage of average earning assets.
|
|
3
|
Dividend payout ratio is defined as dividends declared per share divided by basic earnings per share.
|
|
4
|
Excluded from non-performing assets are contractually binding non-accrual loans held for sale of $4.2 million as of December 31, 2009.
|
|
5
|
Tangible common equity to tangible assets and tangible common equity to risk-weighted assets are Non-GAAP financial measures. See the "Use of Non-GAAP Financial Measures" section below.
|
17
Use of Non-GAAP Financial Measures
The ratios “tangible common equity to tangible assets” and “tangible common equity to risk-weighted assets” are Non-GAAP financial measures. The Company believes these measurements are useful for investors, regulators, management and others to evaluate capital adequacy relative to other financial institutions. Although these Non-GAAP financial measures are frequently used by stakeholders in the evaluation of a company, they have limitations as analytical tools, and should not be considered in isolation, or as a substitute for analyses of results as reported under GAAP. The following table provides a reconciliation of these Non-GAAP financial measures with financial measures defined by GAAP.
GAAP to Non-GAAP Reconciliation
|
December 31,
|
||||||||||||||||||||
|
(dollars in thousands)
|
2012
|
|
2011
|
|
2010
|
|
2009
|
|
2008
|
|
||||||||||
|
Total Shareholders' Equity
|
$
|
1,021,665
|
|
$
|
1,002,667
|
|
$
|
1,011,133
|
|
$
|
895,973
|
|
$
|
790,704
|
|
|||||
|
Less: Goodwill
|
31,517
|
|
31,517
|
|
31,517
|
|
31,517
|
|
34,959
|
|
||||||||||
|
Intangible Assets
|
33
|
|
83
|
|
154
|
|
233
|
|
978
|
|
||||||||||
|
Tangible Common Equity
|
$
|
990,115
|
|
$
|
971,067
|
|
$
|
979,462
|
|
$
|
864,223
|
|
$
|
754,767
|
|
|||||
|
Total Assets
|
$
|
13,728,372
|
|
$
|
13,846,391
|
|
$
|
13,126,787
|
|
$
|
12,414,827
|
|
$
|
10,763,475
|
|
|||||
|
Less: Goodwill
|
31,517
|
|
31,517
|
|
31,517
|
|
31,517
|
|
34,959
|
|
||||||||||
|
Intangible Assets
|
33
|
|
83
|
|
154
|
|
233
|
|
978
|
|
||||||||||
|
Tangible Assets
|
$
|
13,696,822
|
|
$
|
13,814,791
|
|
$
|
13,095,116
|
|
$
|
12,383,077
|
|
$
|
10,727,538
|
|
|||||
|
Risk-Weighted Assets, determined in accordance with prescribed regulatory requirements
|
$
|
5,744,722
|
|
$
|
5,414,481
|
|
$
|
5,076,909
|
|
$
|
5,594,532
|
|
$
|
6,688,530
|
|
|||||
|
Total Shareholders' Equity to Total Assets
|
7.44
|
%
|
7.24
|
%
|
7.70
|
%
|
7.22
|
%
|
7.35
|
%
|
||||||||||
|
Tangible Common Equity to
Tangible Assets (Non-GAAP) |
7.23
|
%
|
7.03
|
%
|
7.48
|
%
|
6.98
|
%
|
7.04
|
%
|
||||||||||
|
Tier 1 Capital Ratio
|
16.13
|
%
|
16.68
|
%
|
18.28
|
%
|
14.84
|
%
|
11.24
|
%
|
||||||||||
|
Tangible Common Equity to
Risk-Weighted Assets (Non-GAAP) |
17.24
|
%
|
17.93
|
%
|
19.29
|
%
|
15.45
|
%
|
11.28
|
%
|
||||||||||
18
Forward-Looking Statements
This report contains forward-looking statements concerning, among other things, the economic and business environment in our service area and elsewhere, credit quality and other financial and business matters in future periods. Our forward-looking statements are based on numerous assumptions, any of which could prove to be inaccurate and actual results may differ materially from those projected because of a variety of risks and uncertainties, including, but not limited to: 1) general economic conditions either nationally, internationally, or locally may be different than expected, and particularly, any event that negatively impacts the tourism industry in Hawaii; 2) unanticipated changes in the securities markets, public debt markets, and other capital markets in the U.S. and internationally; 3) the competitive pressure among financial services and products; 4) the impact of recent legislative and regulatory initiatives, particularly the Dodd-Frank Wall Street Reform and Consumer Protection Act (the "Dodd-Frank Act"); 5) changes in fiscal and monetary policies of the markets in which we operate; 6) the increased cost of maintaining or the Company's ability to maintain adequate liquidity and capital, based on the requirements adopted by the Basel Committee on Banking Supervision and U.S. regulators; 7) actual or alleged conduct which could harm our reputation; 8) changes in accounting standards; 9) changes in tax laws or regulations or the interpretation of such laws and regulations; 10) changes in our credit quality or risk profile that may increase or decrease the required level of our reserve for credit losses; 11) changes in market interest rates that may affect credit markets and our ability to maintain our net interest margin; 12) the impact of litigation and regulatory investigations of the Company, including costs, expenses, settlements, and judgments; 13)
any failure in or breach of our operational systems, information systems or infrastructure, or those of our third party vendors and other service providers; 14)
any interruption or breach of security of our information systems resulting in failures or disruptions in customer account management, general ledger processing, and loan or deposit systems; 15) changes to the amount and timing of proposed common stock repurchases; and 16) natural disasters, public unrest or adverse weather, public health, and other conditions impacting us and our customers' operations. A detailed discussion of these and other risks and uncertainties that could cause actual results and events to differ materially from such forward-looking statements is included under the section entitled "Risk Factors" in Part I of this report. Words such as "believes," "anticipates," "expects," "intends," "targeted," and similar expressions are intended to identify forward-looking statements but are not exclusive means of identifying such statements. We undertake no obligation to update forward-looking statements to reflect later events or circumstances.
Critical Accounting Policies
Our Consolidated Financial Statements were prepared in accordance with U.S. generally accepted accounting principles ("GAAP") and follow general practices within the industries in which we operate. The most significant accounting policies we follow are presented in Note 1 to the Consolidated Financial Statements. Application of these principles requires us to make estimates, assumptions, and judgments that affect the amounts reported in the Consolidated Financial Statements and accompanying notes. Most accounting policies are not considered by management to be critical accounting policies. Several factors are considered in determining whether or not a policy is critical in the preparation of the Consolidated Financial Statements. These factors include among other things, whether the policy requires management to make difficult, subjective, and complex judgments about matters that are inherently uncertain and because it is likely that materially different amounts would be reported under different conditions or using different assumptions. The accounting policies which we believe to be most critical in preparing our Consolidated Financial Statements are those that are related to the determination of the reserve for credit losses, fair value estimates, leased asset residual values, and income taxes.
Reserve for Credit Losses
A consequence of lending activities is that we may incur credit losses. The amount of such losses will vary depending upon the risk characteristics of the loan and lease portfolio as affected by economic conditions such as rising interest rates and the financial performance of borrowers. The reserve for credit losses consists of the allowance for loan and lease losses (the "Allowance") and a reserve for unfunded commitments (the "Unfunded Reserve"). The Allowance provides for probable and estimable losses inherent in our loan and lease portfolio. The Allowance is increased or decreased through the provisioning process. There is no exact method of predicting specific losses or amounts that ultimately may be charged-off on particular segments of the loan and lease portfolio. The Unfunded Reserve is a component of other liabilities and represents the estimate for probable credit losses inherent in unfunded commitments to extend credit. The level of the Unfunded Reserve is adjusted by recording an expense or recovery in other noninterest expense.
Management's evaluation of the adequacy of the reserve for credit losses is often the most critical of accounting estimates for a financial institution. Our determination of the amount of the reserve for credit losses is a critical accounting estimate as it requires
19
significant reliance on the accuracy of credit risk ratings on individual borrowers, the use of estimates and significant judgment as to the amount and timing of expected future cash flows on impaired loans, significant reliance on estimated loss rates on homogenous portfolios, and consideration of our quantitative and qualitative evaluation of economic factors and trends. While our methodology in establishing the reserve for credit losses attributes portions of the Allowance and Unfunded Reserve to the commercial and consumer portfolio segments, the entire Allowance and Unfunded Reserve is available to absorb credit losses inherent in the total loan and lease portfolio and total amount of unfunded credit commitments, respectively.
The reserve for credit losses related to our commercial portfolio segment is generally most sensitive to the accuracy of credit risk ratings assigned to each borrower. Commercial loan risk ratings are evaluated based on each situation by experienced senior credit officers and are subject to periodic review by an independent internal team of credit specialists. The reserve for credit losses related to our consumer portfolio segment is generally most sensitive to economic assumptions and delinquency trends. The reserve for credit losses attributable to each portfolio segment also includes an amount for inherent risks not reflected in the historical analyses. Relevant factors include, but are not limited to, concentrations of credit risk (geographic, large borrower, and industry), economic trends and conditions, changes in underwriting standards, experience and depth of lending staff, trends in delinquencies, and the level of criticized and classified loans.
See Note 4 to the Consolidated Financial Statements and the "Corporate Risk Profile – Credit Risk" section in Management's Discussion and Analysis of Financial Condition and Results of Operations ("MD&A") for more information on the Allowance and the Unfunded Reserve.
Fair Value Measurements
Fair value is the price that would be received to sell an asset or paid to transfer a liability in the principal or most advantageous market for an asset or liability in an orderly transaction between market participants at the measurement date. The degree of management judgment involved in determining the fair value of a financial instrument is dependent upon the availability of quoted market prices or observable market inputs. For financial instruments that are traded actively and have quoted market prices or observable market inputs, there is minimal subjectivity involved in measuring fair value. However, when quoted market prices or observable market inputs are not fully available, significant management judgment may be necessary to estimate fair value. In developing our fair value measurements, we maximize the use of observable inputs and minimize the use of unobservable inputs.
The fair value hierarchy defines Level 1 and 2 valuations as those that are based on quoted prices for identical instruments traded in active markets and quoted prices for similar instruments in active markets, quoted prices for identical or similar instruments in markets that are not active, and model-based valuation techniques for which all significant assumptions are observable in the market. Level 3 valuations are based on model-based techniques that use at least one significant assumption not observable in the market. These unobservable assumptions reflect estimates of assumptions that we believe market participants would use in pricing the asset or liability.
Financial assets that are recorded at fair value on a recurring basis include available-for-sale investment securities, loans held for sale, mortgage servicing rights, investments related to deferred compensation arrangements, and derivative financial instruments. As of
December 31, 2012
and
2011
,
$3.4 billion
or
25%
and
$3.5 billion
or
25%
, respectively, of our total assets consisted of financial assets recorded at fair value on a recurring basis and most of these financial assets consisted of available-for-sale investment securities measured using information from a third-party pricing service. These investments in debt securities and mortgage-backed securities were all classified in either Levels 1 or 2 of the fair value hierarchy. Financial liabilities that are recorded at fair value on a recurring basis are comprised of derivative financial instruments. As of
December 31, 2012
and
2011
,
$33.6 million
and
$36.8 million
, respectively, of our total liabilities consisted of financial liabilities recorded at fair value on a recurring basis. As of
December 31, 2012
and
2011
, Level 3 financial assets recorded at fair value on a recurring basis were
$47.1 million
and
$45.0 million
, respectively, or less than 1% of our total assets, and was comprised of mortgage servicing rights and derivative financial instruments. As of
December 31, 2012
and
2011
, Level 3 financial liabilities recorded at fair value on a recurring basis were
$32.4 million
and
$35.8 million
, respectively, or less than 1% of our total liabilities, and was comprised of derivative financial instruments.
Our third-party pricing service makes no representations or warranties that the pricing data provided to us is complete or free from errors, omissions, or defects. As a result, we have processes in place to monitor and periodically review the information provided to us by our third-party pricing service such as: 1) Our third-party pricing service provides us with documentation by asset class of inputs and methodologies used to value securities. We review this documentation to evaluate the inputs and valuation methodologies used to place securities into the appropriate level of the fair value hierarchy. This documentation is periodically updated by our third-party pricing service. Accordingly, transfers of securities within the fair value hierarchy are made if deemed necessary. 2) On a quarterly basis, management reviews the pricing information received from our third-party
20
pricing service. This review process includes a comparison to non-binding third-party broker quotes, as well as a review of market-related conditions impacting the information provided by our third-party pricing service. We also identify investment securities which may have traded in illiquid or inactive markets by identifying instances of a significant decrease in the volume or frequency of trades relative to historic levels, as well as instances of a significant widening of the bid-ask spread in the brokered markets. As of
December 31, 2012
and
2011
, management did not make adjustments to prices provided by our third-party pricing service as a result of illiquid or inactive markets. 3) On a quarterly basis, management also reviews a sample of securities priced by the Company's third-party pricing service to review significant assumptions and valuation methodologies used. Based on this review, management determines whether the current placement of the security in the fair value hierarchy is appropriate or whether transfers may be warranted. 4) On an annual basis, to the extent available, we obtain and review independent auditor's reports from our third-party pricing service related to controls placed in operation and tests of operating effectiveness. We did not note any significant control deficiencies in our review of the independent auditor's reports related to services rendered by our third-party pricing service. 5) Our third-party pricing service has also established processes for us to submit inquiries regarding quoted prices. Periodically, we will challenge the quoted prices provided by our third-party pricing service. Our third-party pricing service will review the inputs to the evaluation in light of the new market data presented by us. Our third-party pricing service may then affirm the original quoted price or may update the evaluation on a going forward basis.
Based on the composition of our investment securities portfolio, we believe that we have developed appropriate internal controls and performed appropriate due diligence procedures to prevent or detect material misstatements. See Note 19 to the Consolidated Financial Statements for more information on our fair value measurements.
Leased Asset Residual Values
Lease financing receivables include a residual value component, which represents the estimated value of leased assets upon lease expiration. Our determination of residual value is derived from a variety of sources, including equipment valuation services, appraisals, and publicly available market data on recent sales transactions on similar equipment. The length of time until lease termination, the cyclical nature of equipment values, and the limited marketplace for re-sale of certain leased assets, are important variables considered in making this determination. We update our valuation analysis on an annual basis, or more frequently as warranted by events or circumstances. When we determine that the fair value is lower than the expected residual value at lease expiration, the difference is recognized as an asset impairment in the period in which the analysis is completed.
Income Taxes
We determine our liabilities for income taxes based on current tax regulation and interpretations in tax jurisdictions where our income is subject to taxation. Currently, we file tax returns in nine federal, state and local domestic jurisdictions, and four foreign jurisdictions. In estimating income taxes payable or receivable, we assess the relative merits and risks of the appropriate tax treatment considering statutory, judicial, and regulatory guidance in the context of each tax position. Accordingly, previously estimated liabilities are regularly reevaluated and adjusted, through the provision for income taxes. Changes in the estimate of income taxes payable or receivable occur periodically due to changes in tax rates, interpretations of tax law, the status of examinations being conducted by various taxing authorities, and newly enacted statutory, judicial and regulatory guidance that impact the relative merits and risks of each tax position. These changes, when they occur, may affect the provision for income taxes as well as current and deferred income taxes, and may be significant to our statements of income and condition.
Management's determination of the realization of net deferred tax assets is based upon management's judgment of various future events and uncertainties, including the timing and amount of future income, as well as the implementation of various tax planning strategies to maximize realization of the deferred tax assets. A valuation allowance is provided when it is more likely than not that some portion of the deferred tax asset will not be realized. As of
December 31, 2012
and
2011
, we carried a valuation allowance of
$5.1 million
and
$4.4 million
, respectively, related to our deferred tax assets established in connection with our low-income housing investments.
We are also required to record a liability, referred to as an unrecognized tax benefit ("UTB"), for the entire amount of benefit taken in a prior or future income tax return when we determine that a tax position has a less than 50% likelihood of being accepted by the taxing authority. As of
December 31, 2012
and
2011
, our liabilities for UTBs were
$15.4 million
and
$13.6 million
, respectively. See Note 16 to the Consolidated Financial Statements for more information on income taxes.
21
Overview
We are a regional financial services company serving businesses, consumers, and governments in Hawaii, Guam, and other Pacific Islands. Our main operating subsidiary, the Bank, was founded in 1897 and is the largest independent financial institution in Hawaii.
Exceptional people working together are the foundation for our success and enable us to build exceptional value for our customers, communities, shareholders, and each other. Excellence, integrity, respect, innovation, commitment, and teamwork are the core values for the way we do business. In striving to achieve our governing objective, our business plan is balanced between growth and risk management, including the flexibility to adjust, given the uncertainties of a slow economic recovery. We remain cautious about the local and national economy, interest rates, loan demand, and regulatory initiatives that are expected to impact the financial services industry. We intend to continue to focus on providing customers with a competitive mix of products and services, maintaining strong credit quality, improving expense management, and efficiently managing capital.
Hawaii Economy
Hawaii's economy continued to improve during the fourth quarter of 2012 primarily due to a strong visitor industry. In 2012, a record 8.0 million total visitors arrived in Hawaii, an increase of 9.6% compared to 2011. 2012 visitor arrivals exceeded the previous record high of 7.6 million visitors in 2006. Total visitor spending for 2012 increased by 18.7% compared to 2011 due to strong spending growth by U.S. and international visitors. The statewide seasonally-adjusted unemployment rate continued to decline during the fourth quarter of 2012 to 5.2% in December 2012, compared to 7.8% nationally. In 2012, the volume of single-family home sales on Oahu was 6.5% higher compared to 2011 and the volume of condominium sales on Oahu was 8.2% higher compared to 2011. Also in 2012, the median price of single-family home sales on Oahu was 7.8% higher compared to 2011 and the median price of condominium sales on Oahu was 5.8% higher compared to 2011. As of December 31, 2012, months of inventory of single-family homes and condominiums on Oahu remained low at approximately 2.5 months and 3.0 months, respectively.
Earnings Summary
Net income for
2012
was
$166.1 million
, an increase of
$6.0 million
or
4%
compared to
2011
. Diluted earnings per share were
$3.67
in
2012
, an increase of
$0.28
or
8%
compared to
2011
. Our return on average assets was 1.22% in 2012, unchanged from 2011, and our return on average shareholders' equity was 16.23% in 2012, an increase of 54 basis points from 2011.
Our higher net income in
2012
was primarily due to the following:
|
•
|
The provision for credit losses (the "Provision") was
$1.0 million
in
2012
, a decrease of
$11.7 million
or
92%
compared to
2011
. Although loan balances have grown in
2012
, credit quality trends and the underlying risk profile of our loan and lease portfolio continued to improve, with lower levels of net charge-offs, non-performing assets, and higher risk loans and leases outstanding.
|
|
•
|
Mortgage banking income was
$35.6 million
in
2012
, an increase of
$21.0 million
compared to
2011
. This increase was primarily due to higher loan originations and sales activity in 2012, a result of low interest rates. Residential mortgage loan originations were $1.2 billion in 2012, a $256.9 million or 28% increase compared to 2011. Residential mortgage loan sales were $600.9 million in 2012, a $166.7 million or 38% increase from 2011. Also contributing to the increase in mortgage banking income was the increase in margins at which we were able to sell loans in the secondary market.
|
|
•
|
Other noninterest expense was
$69.7 million
in 2012, a decrease of
$15.7 million
or
18%
compared to
2011
. Our financial results for
2011
included a $9.0 million accrual related to the settlement of overdraft litigation recorded in the second quarter of
2011
. Also contributing to the decrease in other noninterest expense in
2012
was a $2.2 million decrease in mileage program travel expenses, a $1.5 million credit for the reduction in insurance reserves, and a $1.5 million decrease in operational losses.
|
These items were partially offset by the following:
|
•
|
Net interest income was
$377.3 million
in
2012
, a decrease of
$12.9 million
or
3%
compared to
2011
. This decrease was primarily due to lower yields on loans and investment securities. During this period of low interest rates over the past several years, we have maintained discipline in our loan underwriting and have also invested conservatively.
|
22
|
•
|
Debit card income, recorded as a component of fees, exchange, and other services charges in the consolidated statements of income, was $14.9 million in
2012
, a decrease of $10.9 million or 42% compared to
2011
. This decrease was primarily due to changes in debit card interchange rules as a result of the pricing restrictions imposed by the Durbin Amendment which was effective October 1, 2011.
|
|
•
|
We recorded a nominal amount of net investment securities losses in
2012
, while net investment securities gains were
$6.4 million
in
2011
. The amount and timing of our sale of investment securities are dependent on a number of factors, including our efforts to preserve capital levels while managing duration and extension risk.
|
|
•
|
The provision for income taxes was
$76.2 million
in
2012
, an increase of
$9.3 million
or
14%
compared to
2011
. We recorded credits to the provision for income taxes of $10.5 million in
2011
related to the reversal of liabilities for unrecognized state tax benefits, the release of general reserves due to the closing of certain IRS audit tax years, and the release of a valuation allowance related to the expected utilization of capital losses on the future sale of a low-income housing investment.
|
We maintained a strong balance sheet throughout
2012
, with adequate reserves for credit losses, and high levels of liquidity and capital. In particular:
|
•
|
The allowance for loan and lease losses (the "Allowance") was
$128.9 million
as of
December 31, 2012
, a decrease of
$9.7 million
or
7%
from
December 31, 2011
. The ratio of our Allowance to total loans and leases outstanding decreased to 2.20% as of
December 31, 2012
, compared to 2.50% as of
December 31, 2011
. The decrease in the level of the Allowance was consistent with improving credit quality metrics and an improving Hawaii economy. Absent significant deterioration in the economy and assuming continued improvement and/or stability in credit quality, we may decrease the level of the Allowance in future periods.
|
|
•
|
Total deposits were
$11.5 billion
as of
December 31, 2012
, an increase of
$936.9 million
or
9%
from
December 31, 2011
. We believe that our strong brand continues to play a key role in new account acquisitions. During 2012, we continued to grow our deposit balances while reducing associated funding costs. The growth in deposit balances was due, in part, to local government entities transferring funds from repurchase agreements to time deposits during 2012.
|
|
•
|
We continued to invest excess liquidity in high-grade investment securities. As of
December 31, 2012
, the total carrying value of our investment securities portfolio was
$7.0 billion
, a slight decrease from
$7.1 billion
as of
December 31, 2011
. In
2012
, we reduced our positions in U.S. Treasury Notes and mortgage-backed securities issued by the Government National Mortgage Association ("Ginnie Mae"). We re-invested these proceeds, in part, into state and municipal bond holdings.
|
|
•
|
Total shareholders' equity was
$1.0 billion
as of
December 31, 2012
, an increase of
$19.0 million
or
2%
from
December 31, 2011
. We continued to return capital to our shareholders in the form of share repurchases and dividends. During
2012
, we repurchased 1.7 million shares of common stock at a total cost of $79.5 million under our share repurchase program. We also paid cash dividends of
$81.6 million
during
2012
.
|
In 2013, we may see continued economic recovery and improving prospects for loan growth. However, we remain cautious about the uncertainties of government regulatory initiatives, the slow pace of economic recovery nationally, market interest rates, as well as the numerous fiscal and budgetary challenges facing our federal and local governments.
23
Average balances, related income and expenses, and resulting yields and rates are presented in Table 1. An analysis of the change in net interest income, on a taxable-equivalent basis, is presented in Table 2.
|
Average Balances and Interest Rates – Taxable-Equivalent Basis
|
Table 1
|
||||||||||||||||||||||||||||||
|
2012
|
2011
|
2010
|
|||||||||||||||||||||||||||||
|
(dollars in millions)
|
Average
Balance |
|
Income/
Expense |
|
Yield/
Rate |
Average
Balance |
|
Income/
Expense |
|
Yield/
Rate |
Average
Balance |
|
Income/
Expense |
|
Yield/
Rate |
||||||||||||||||
|
Earning Assets
|
|||||||||||||||||||||||||||||||
|
Interest-Bearing Deposits
|
$
|
3.7
|
|
$
|
—
|
|
0.26
|
%
|
$
|
4.2
|
|
$
|
—
|
|
0.19
|
%
|
$
|
4.7
|
|
$
|
—
|
|
0.59
|
%
|
|||||||
|
Funds Sold
|
263.5
|
|
0.5
|
|
0.20
|
380.2
|
|
0.8
|
|
0.22
|
390.2
|
|
1.1
|
|
0.28
|
||||||||||||||||
|
Investment Securities
|
|||||||||||||||||||||||||||||||
|
Available-for-Sale
|
3,346.3
|
|
75.0
|
|
2.24
|
4,439.8
|
|
105.4
|
|
2.37
|
5,854.1
|
|
170.1
|
|
2.91
|
||||||||||||||||
|
Held-to-Maturity
|
3,636.7
|
|
95.0
|
|
2.61
|
2,279.6
|
|
72.2
|
|
3.16
|
154.2
|
|
6.5
|
|
4.22
|
||||||||||||||||
|
Loans Held for Sale
|
14.7
|
|
0.6
|
|
4.29
|
11.0
|
|
0.5
|
|
4.54
|
10.8
|
|
0.9
|
|
8.51
|
||||||||||||||||
|
Loans and Leases
1
|
|||||||||||||||||||||||||||||||
|
Commercial and Industrial
|
800.2
|
|
31.3
|
|
3.91
|
790.6
|
|
31.8
|
|
4.02
|
764.2
|
|
33.7
|
|
4.41
|
||||||||||||||||
|
Commercial Mortgage
|
988.2
|
|
42.9
|
|
4.34
|
887.1
|
|
42.8
|
|
4.82
|
827.7
|
|
42.0
|
|
5.07
|
||||||||||||||||
|
Construction
|
101.9
|
|
5.1
|
|
5.04
|
80.1
|
|
4.0
|
|
5.06
|
95.4
|
|
4.8
|
|
5.08
|
||||||||||||||||
|
Commercial Lease Financing
|
283.3
|
|
6.8
|
|
2.39
|
322.1
|
|
8.7
|
|
2.71
|
385.1
|
|
11.3
|
|
2.92
|
||||||||||||||||
|
Residential Mortgage
|
2,349.6
|
|
111.3
|
|
4.74
|
2,126.9
|
|
111.5
|
|
5.24
|
2,105.6
|
|
118.7
|
|
5.64
|
||||||||||||||||
|
Home Equity
|
773.2
|
|
33.4
|
|
4.31
|
784.9
|
|
37.4
|
|
4.76
|
863.7
|
|
43.2
|
|
4.99
|
||||||||||||||||
|
Automobile
|
196.8
|
|
11.7
|
|
5.96
|
194.4
|
|
13.2
|
|
6.78
|
241.2
|
|
18.3
|
|
7.58
|
||||||||||||||||
|
Other
2
|
187.1
|
|
15.2
|
|
8.11
|
163.8
|
|
12.4
|
|
7.57
|
189.6
|
|
14.5
|
|
7.66
|
||||||||||||||||
|
Total Loans and Leases
|
5,680.3
|
|
257.7
|
|
4.54
|
5,349.9
|
|
261.8
|
|
4.89
|
5,472.5
|
|
286.5
|
|
5.23
|
||||||||||||||||
|
Other
|
79.9
|
|
1.1
|
|
1.41
|
79.9
|
|
1.1
|
|
1.40
|
79.8
|
|
1.1
|
|
1.39
|
||||||||||||||||
|
Total Earning Assets
3
|
13,025.1
|
|
429.9
|
|
3.30
|
12,544.6
|
|
441.8
|
|
3.52
|
11,966.3
|
|
466.2
|
|
3.90
|
||||||||||||||||
|
Cash and Noninterest-Bearing Deposits
|
137.2
|
|
135.3
|
|
229.6
|
|
|||||||||||||||||||||||||
|
Other Assets
|
446.9
|
|
425.1
|
|
491.8
|
|
|||||||||||||||||||||||||
|
Total Assets
|
$
|
13,609.2
|
|
$
|
13,105.0
|
|
$
|
12,687.7
|
|
||||||||||||||||||||||
|
Interest-Bearing Liabilities
|
|||||||||||||||||||||||||||||||
|
Interest-Bearing Deposits
|
|||||||||||||||||||||||||||||||
|
Demand
|
$
|
1,938.6
|
|
$
|
0.5
|
|
0.03
|
%
|
$
|
1,786.7
|
|
$
|
0.7
|
|
0.04
|
%
|
$
|
1,715.8
|
|
$
|
1.1
|
|
0.06
|
%
|
|||||||
|
Savings
|
4,447.8
|
|
4.5
|
|
0.10
|
4,501.0
|
|
7.3
|
|
0.16
|
4,465.0
|
|
14.7
|
|
0.33
|
||||||||||||||||
|
Time
|
1,524.6
|
|
7.4
|
|
0.48
|
1,067.8
|
|
10.3
|
|
0.96
|
1,088.7
|
|
13.4
|
|
1.23
|
||||||||||||||||
|
Total Interest-Bearing Deposits
|
7,911.0
|
|
12.4
|
|
0.16
|
7,355.5
|
|
18.3
|
|
0.25
|
7,269.5
|
|
29.2
|
|
0.40
|
||||||||||||||||
|
Short-Term Borrowings
|
15.1
|
|
—
|
|
0.14
|
18.2
|
|
—
|
|
0.11
|
23.3
|
|
—
|
|
0.13
|
||||||||||||||||
|
Securities Sold Under
Agreements to Repurchase
|
1,335.7
|
|
28.9
|
|
2.16
|
1,845.8
|
|
29.2
|
|
1.58
|
1,700.2
|
|
26.0
|
|
1.53
|
||||||||||||||||
|
Long-Term Debt
|
31.5
|
|
1.9
|
|
6.10
|
31.6
|
|
2.0
|
|
6.23
|
61.0
|
|
3.5
|
|
5.81
|
||||||||||||||||
|
Total Interest-Bearing Liabilities
|
9,293.3
|
|
43.2
|
|
0.47
|
9,251.1
|
|
49.5
|
|
0.53
|
9,054.0
|
|
58.7
|
|
0.65
|
||||||||||||||||
|
Net Interest Income
|
$
|
386.7
|
|
$
|
392.3
|
|
$
|
407.5
|
|
||||||||||||||||||||||
|
Interest Rate Spread
|
2.83
|
%
|
2.99
|
%
|
3.25
|
%
|
|||||||||||||||||||||||||
|
Net Interest Margin
|
2.97
|
%
|
3.13
|
%
|
3.41
|
%
|
|||||||||||||||||||||||||
|
Noninterest-Bearing Demand Deposits
|
3,024.0
|
|
2,569.2
|
|
2,239.6
|
|
|||||||||||||||||||||||||
|
Other Liabilities
|
268.6
|
|
264.6
|
|
381.4
|
|
|||||||||||||||||||||||||
|
Shareholders' Equity
|
1,023.3
|
|
1,020.1
|
|
1,012.7
|
|
|||||||||||||||||||||||||
|
Total Liabilities and
Shareholders' Equity
|
$
|
13,609.2
|
|
$
|
13,105.0
|
|
$
|
12,687.7
|
|
||||||||||||||||||||||
1
Non-performing loans and leases are included in the respective average loan and lease balances. Income, if any, on such loans and leases is recognized on a cash basis.
2
Comprised of other consumer revolving credit, installment, and consumer lease financing.
3
Interest income includes taxable-equivalent basis adjustments, based upon a federal statutory tax rate of 35%, of $9,473,000 for 2012, $2,080,000 for 2011, and $975,000
for 2010.
24
|
Analysis of Change in Net Interest Income – Taxable-Equivalent Basis
|
Table 2
|
|||||||||||||||||||||||
|
Year Ended December 31,
2012 Compared to 2011 |
Year Ended December 31,
2011 Compared to 2010 |
|||||||||||||||||||||||
|
(dollars in millions)
|
Volume
1
|
|
Rate
1
|
|
Total
|
|
Volume
1
|
|
Rate
1
|
|
Total
|
|
||||||||||||
|
Change in Interest Income:
|
||||||||||||||||||||||||
|
Funds Sold
|
$
|
(0.2
|
)
|
$
|
(0.1
|
)
|
$
|
(0.3
|
)
|
$
|
—
|
|
$
|
(0.3
|
)
|
$
|
(0.3
|
)
|
||||||
|
Investment Securities
|
||||||||||||||||||||||||
|
Available-for-Sale
|
(24.8
|
)
|
(5.6
|
)
|
(30.4
|
)
|
(36.5
|
)
|
(28.2
|
)
|
(64.7
|
)
|
||||||||||||
|
Held-to-Maturity
|
37.1
|
|
(14.3
|
)
|
22.8
|
|
67.7
|
|
(2.0
|
)
|
65.7
|
|
||||||||||||
|
Loans Held for Sale
|
0.1
|
|
—
|
|
0.1
|
|
—
|
|
(0.4
|
)
|
(0.4
|
)
|
||||||||||||
|
Loans and Leases
|
||||||||||||||||||||||||
|
Commercial and Industrial
|
0.4
|
|
(0.9
|
)
|
(0.5
|
)
|
1.1
|
|
(3.0
|
)
|
(1.9
|
)
|
||||||||||||
|
Commercial Mortgage
|
4.6
|
|
(4.5
|
)
|
0.1
|
|
2.9
|
|
(2.1
|
)
|
0.8
|
|
||||||||||||
|
Construction
|
1.1
|
|
0.0
|
|
1.1
|
|
(0.8
|
)
|
0.0
|
|
(0.8
|
)
|
||||||||||||
|
Commercial Lease Financing
|
(1.0
|
)
|
(0.9
|
)
|
(1.9
|
)
|
(1.8
|
)
|
(0.8
|
)
|
(2.6
|
)
|
||||||||||||
|
Residential Mortgage
|
11.1
|
|
(11.3
|
)
|
(0.2
|
)
|
1.2
|
|
(8.4
|
)
|
(7.2
|
)
|
||||||||||||
|
Home Equity
|
(0.5
|
)
|
(3.5
|
)
|
(4.0
|
)
|
(3.8
|
)
|
(2.0
|
)
|
(5.8
|
)
|
||||||||||||
|
Automobile
|
0.1
|
|
(1.6
|
)
|
(1.5
|
)
|
(3.3
|
)
|
(1.8
|
)
|
(5.1
|
)
|
||||||||||||
|
Other
2
|
1.9
|
|
0.9
|
|
2.8
|
|
(1.9
|
)
|
(0.2
|
)
|
(2.1
|
)
|
||||||||||||
|
Total Loans and Leases
|
17.7
|
|
(21.8
|
)
|
(4.1
|
)
|
(6.4
|
)
|
(18.3
|
)
|
(24.7
|
)
|
||||||||||||
|
Total Change in Interest Income
|
29.9
|
|
(41.8
|
)
|
(11.9
|
)
|
24.8
|
|
(49.2
|
)
|
(24.4
|
)
|
||||||||||||
|
Change in Interest Expense:
|
||||||||||||||||||||||||
|
Interest-Bearing Deposits
|
||||||||||||||||||||||||
|
Demand
|
0.1
|
|
(0.3
|
)
|
(0.2
|
)
|
—
|
|
(0.4
|
)
|
(0.4
|
)
|
||||||||||||
|
Savings
|
(0.1
|
)
|
(2.7
|
)
|
(2.8
|
)
|
0.1
|
|
(7.5
|
)
|
(7.4
|
)
|
||||||||||||
|
Time
|
3.4
|
|
(6.3
|
)
|
(2.9
|
)
|
(0.2
|
)
|
(2.9
|
)
|
(3.1
|
)
|
||||||||||||
|
Total Interest-Bearing Deposits
|
3.4
|
|
(9.3
|
)
|
(5.9
|
)
|
(0.1
|
)
|
(10.8
|
)
|
(10.9
|
)
|
||||||||||||
|
Securities Sold Under Agreements to Repurchase
|
(9.4
|
)
|
9.1
|
|
(0.3
|
)
|
2.3
|
|
0.9
|
|
3.2
|
|
||||||||||||
|
Long-Term Debt
|
—
|
|
(0.1
|
)
|
(0.1
|
)
|
(1.8
|
)
|
0.3
|
|
(1.5
|
)
|
||||||||||||
|
Total Change in Interest Expense
|
(6.0
|
)
|
(0.3
|
)
|
(6.3
|
)
|
0.4
|
|
(9.6
|
)
|
(9.2
|
)
|
||||||||||||
|
Change in Net Interest Income
|
$
|
35.9
|
|
$
|
(41.5
|
)
|
$
|
(5.6
|
)
|
$
|
24.4
|
|
$
|
(39.6
|
)
|
$
|
(15.2
|
)
|
||||||
1
The change in interest income and expense not solely due to changes in volume or rate has been allocated on a pro-rata basis to the volume and rate columns.
2
Comprised of other consumer revolving credit, installment, and consumer lease financing.
Net Interest Income
Net interest income is affected by the size and mix of our balance sheet components as well as the spread between interest earned on assets and interest paid on liabilities. Net interest margin is defined as net interest income, on a taxable-equivalent basis, as a percentage of average earnings assets.
Net interest income, on a taxable-equivalent basis, decreased by $5.6 million or 1% in 2012 compared to 2011. Net interest margin decreased by 16 basis points in 2012 compared to 2011. Yields on our earning assets decreased by 22 basis points in 2012 compared to 2011, reflective of investments and loans repricing at lower rates. Yields on our investment securities portfolio decreased by 21 basis points in 2012 compared to 2011, reflective of the run-off of higher yielding securities with proceeds, in part, being invested in lower yielding securities. Yields on our loans and leases declined in nearly every category in 2012 compared to 2011. Partially offsetting the lower yields on our earning assets was a decrease in deposit funding costs. Rates paid on our interest-bearing liabilities decreased by 6 basis points in 2012 compared to 2011. Rates paid on our savings deposits decreased by 6 basis points in 2012 compared to 2011 and rates paid on our time deposits decreased by 48 basis points in 2012
25
compared to 2011, partially offset by a 58 basis point increase on our rates paid on securities sold under agreements to repurchase as local government entities transferred their funds into time deposits.
Average balances of our earning assets increased by $480.5 million or 4% in 2012 compared to 2011 primarily due to an increase in our investment securities portfolio and residential mortgage loan portfolio. In 2012, we reduced our positions in U.S. Treasury Notes and mortgage-backed securities issued by Ginnie Mae and re-invested these proceeds, in part, into state and municipal bond holdings and debt securities issued by the Small Business Administration (the "SBA"). Average balances in our U.S. Treasury Notes decreased by $137.7 million and average balances in our mortgage-backed securities issued by Ginnie Mae decreased by $344.9 million in 2012 compared to 2011. Average balances of our state and municipal bond holdings increased by $511.8 million and average balances of our SBA securities increased by $253.1 million in 2012 compared to 2011. Also contributing to the increase in average balances of our earning assets was a $222.7 million increase in the average balance of our residential mortgage loan portfolio primarily due to strong refinancing activity, resulting from low interest rates, as well as our decision to add more fixed-rate conforming saleable loans to our portfolio. Average balances of our interest-bearing liabilities remained relatively unchanged at $9.3 billion in 2012. Average balances of our interest-bearing deposits increased by $555.5 million in 2012 compared to 2011 primarily due to an increase in average public time deposit balances. This was partially offset by a $510.1 million decrease in average public repurchase agreement balances due to the transfer of local government entities' funds to time deposits noted above.
Net interest income, on a taxable-equivalent basis, decreased by $15.2 million or 4% in 2011 compared to 2010. Net interest margin decreased by 28 basis points in 2011 compared to 2010. Yields on our earning assets decreased by 38 basis points in 2011 compared to 2010, reflective of higher levels of liquidity, lower average loan balances, and lower yields on loans and investment securities. Yields on our loans and leases declined in every category in 2011 compared to 2010. Yields on our investment securities portfolio decreased by 30 basis points in 2011 compared to 2010. Partially offsetting the lower yields on our earning assets was a decrease in our funding costs primarily due to lower rates paid on our interest-bearing deposits, reflective of the re-pricing of our deposits at lower interest rates. Rates paid on our savings deposits decreased by 17 basis points and rates paid on our time deposits decreased by 27 basis points in 2011 compared to 2010, partially offset by a 5 basis point increase on our rates paid on securities sold under agreements to repurchase.
Average balances of our earning assets increased by $578.3 million or 5% in 2011 compared to 2010 primarily due to an increase in our investment securities portfolio. In 2011, we changed the composition of our investment securities portfolio. We increased our holdings in U.S. Treasury Notes and securities issued by the SBA in an effort to further reduce the average duration of our portfolio. Average balances of our debt securities issued by the U.S. Treasury increased by $363.4 million and average balances of our SBA securities increased by $165.0 million in 2011 compared to 2010. Average balances of mortgaged-backed securities issued by Ginnie Mae also increased by $232.6 million in 2011 compared to 2010. Partially offsetting the increase in average balances of our earning assets was a $122.6 million decrease in average loan and lease balances resulting from continued paydowns along with subdued demand for new lending opportunities. Average balances of our interest-bearing liabilities increased by $197.0 million or 2% in 2011 compared to 2010 primarily due to growth in our interest-bearing deposits and securities sold under agreements to repurchase. Average balances of our interest-bearing demand deposits increased by $70.9 million primarily due to growth in our premier interest-bearing demand products. Average savings deposits increased by $36.0 million primarily due to an $83.7 million growth in our premier savings products and a $24.4 million growth in our personal savings product, partially offset by a $65.8 million decline in our business money market savings products. These increases were partially offset by a decline in our average time deposits as some customers moved their funds to more liquid deposits. Average balances in our securities sold under agreements to repurchase increased by $145.6 million in 2011 compared to 2010 primarily due to new placements to accommodate local government entities, partially offset by the prepayment of three repurchase agreements with private institutions in the third quarter of 2010.
Provision for Credit Losses
The Provision reflects our judgment of the expense or benefit necessary to achieve the appropriate amount of the Allowance. We maintain the Allowance at levels adequate to cover our estimate of probable credit losses as of the end of the reporting period. The Allowance is determined through detailed quarterly analyses of our loan and lease portfolio. The Allowance is based on our loss experience and changes in the economic environment, as well as an ongoing assessment of our credit quality. We recorded a Provision of
$1.0 million
in 2012,
$12.7 million
in 2011, and
$55.3 million
in 2010. The lower Provision recorded in 2012 and 2011 was reflective of continued improvements in our credit quality metrics and an improving Hawaii economy. For further discussion on the Allowance, see the "Corporate Risk Profile – Credit Risk" section in MD&A.
26
Noninterest Income
Table 3 presents the major components of noninterest income for
2012
,
2011
, and
2010
.
|
Noninterest Income
|
Table 3
|
||||||||||||||||||||||||
|
Year Ended December 31,
|
Dollar Change
|
Percent Change
|
|||||||||||||||||||||||
|
(dollars in thousands)
|
2012
|
|
2011
|
|
2010
|
|
2012
to 2011 |
|
2011
to 2010 |
|
2012
to 2011 |
|
2011
to 2010 |
|
|||||||||||
|
Trust and Asset Management
|
$
|
45,229
|
|
$
|
45,046
|
|
$
|
44,889
|
|
$
|
183
|
|
$
|
157
|
|
—
|
%
|
—
|
%
|
||||||
|
Mortgage Banking
|
35,644
|
|
14,664
|
|
18,576
|
|
20,980
|
|
(3,912
|
)
|
143
|
|
(21
|
)
|
|||||||||||
|
Service Charges on Deposit Accounts
|
37,621
|
|
38,733
|
|
53,039
|
|
(1,112
|
)
|
(14,306
|
)
|
(3
|
)
|
(27
|
)
|
|||||||||||
|
Fees, Exchange, and Other Service Charges
|
48,965
|
|
60,227
|
|
61,006
|
|
(11,262
|
)
|
(779
|
)
|
(19
|
)
|
(1
|
)
|
|||||||||||
|
Investment Securities Gains (Losses), Net
|
(77
|
)
|
6,366
|
|
42,848
|
|
(6,443
|
)
|
(36,482
|
)
|
(101
|
)
|
(85
|
)
|
|||||||||||
|
Insurance
|
9,553
|
|
10,957
|
|
9,961
|
|
(1,404
|
)
|
996
|
|
(13
|
)
|
10
|
|
|||||||||||
|
Other Income:
|
|
|
|
|
|
|
|||||||||||||||||||
|
Income from Bank-Owned Life Insurance
|
6,805
|
|
6,329
|
|
6,357
|
|
476
|
|
(28
|
)
|
8
|
|
—
|
|
|||||||||||
|
Gain on Mutual Fund Sale
|
489
|
|
1,956
|
|
2,852
|
|
(1,467
|
)
|
(896
|
)
|
(75
|
)
|
(31
|
)
|
|||||||||||
|
Gain on the Sale of Leased Assets
|
3,335
|
|
1,001
|
|
1,126
|
|
2,334
|
|
(125
|
)
|
233
|
|
(11
|
)
|
|||||||||||
|
Other
|
12,722
|
|
12,376
|
|
14,604
|
|
346
|
|
(2,228
|
)
|
3
|
|
(15
|
)
|
|||||||||||
|
Total Other Income
|
23,351
|
|
21,662
|
|
24,939
|
|
1,689
|
|
(3,277
|
)
|
8
|
|
(13
|
)
|
|||||||||||
|
Total Noninterest Income
|
$
|
200,286
|
|
$
|
197,655
|
|
$
|
255,258
|
|
$
|
2,631
|
|
$
|
(57,603
|
)
|
1
|
%
|
(23
|
)%
|
||||||
Trust and asset management income is comprised of fees earned from the management and administration of trusts and other customer assets. These fees are largely based upon the market value of the assets that we manage and the fee rate charged to customers. Total trust assets under administration were $10.1 billion, $9.3 billion, and $10.1 billion as of December 31, 2012, 2011, and 2010, respectively. Trust and asset management income remained relatively unchanged in 2012 compared to 2011. Testamentary fees increased $0.8 million and agency fees rose $0.4 million in 2012 compared to 2011. This was partially offset by a $0.9 million decrease in special service fees which were the result of two large termination fees recorded in the first quarter of 2011. Trust and asset management income remained relatively unchanged in 2011 compared to 2010 as well. Our unified managed accounts, which were introduced in the latter half of 2010, generated an additional $1.1 million of fee revenue in 2011 compared to 2010. In addition, agency fees increased by $0.9 million and irrevocable trust fees rose by $0.6 million in 2011 primarily due to higher fee rates for assets previously invested in our proprietary mutual funds, which were sold/liquidated in July 2010. These increases were largely offset by a $2.9 million decrease in mutual fund investment management fees mainly due to the sale/liquidation of our proprietary mutual funds noted above.
Mortgage banking income is highly influenced by mortgage interest rates and the housing market. Mortgage banking income increased by $21.0 million or 143% in 2012 compared to 2011. This increase was primarily due to higher loan originations, sales volume, and margins in 2012 compared to 2011. Residential mortgage loan originations were $1.2 billion in 2012, a $256.9 million or 28% increase compared to 2011. Residential mortgage loan sales were $600.9 million in 2012, a $166.7 million or 38% increase compared to 2011. As noted above, we sold mortgage loans in the secondary market at higher margins in 2012 compared to 2011. Mortgage banking income decreased by $3.9 million or 21% in 2011 compared to 2010. This decrease was primarily due to lower loan origination and sales volume in 2011 compared to 2010. Residential mortgage loan originations were $925.7 million in 2011, an $89.9 million or 9% decrease compared to 2010. Residential mortgage loan sales were $434.2 million in 2011, a $235.6 million or 35% decrease from 2010. Contributing to lower mortgage loan sales was our decision to add more fixed-rate conforming saleable loans to our portfolio in 2011.
Service charges on deposit accounts decreased by $1.1 million or 3% in 2012 compared to 2011. This decrease was primarily due to a decline in account analysis fees as a result of reduced charges applied against the customers' earnings credit rate. Service charges on deposit accounts decreased by $14.3 million or 27% in 2011 compared to 2010. This decrease was primarily due to a $12.3 million decline in overdraft fees mainly the result of several processing changes implemented in the first quarter of 2011, combined with the Federal Reserve Board's amendments to Regulation E. Beginning on July 1, 2010 for new customers and August 15, 2010 for existing customers, those amendments prohibited a financial institution from assessing a fee to complete an ATM withdrawal or one-time debit card transaction which will cause an overdraft unless the customer consents in advance ("opts-in"). In addition, account analysis fees decreased by $1.4 million in 2011 primarily due to higher investable balances resulting in larger earnings credit rates granted to our customers.
Fees, exchange, and other service charges are primarily comprised of debit card income, fees from ATMs, merchant service activity, and other loan fees and service charges. Fees, exchange, and other service charges decreased by $11.3 million or 19% in
27
2012 compared to 2011. This decrease was primarily due to a $10.9 million decline in debit card income resulting mainly from the pricing restrictions imposed by the Durbin Amendment, which was effective October 1, 2011. Fees, exchange, and other service charges decreased by $0.8 million or 1% in 2011 compared to 2010 primarily due to a $0.8 million decrease in ATM fees and a $0.5 million decrease in other loan fees. Debit card income was also adversely affected in the fourth quarter of 2011 by the pricing restrictions imposed by the Durbin Amendment noted above. These items were partially offset by a $0.7 million increase in debit card income resulting mainly from growth in debit card usage and an increase in mileage program fees.
Sales of investment securities resulted in a $0.1 million net loss in 2012, a $6.4 million net gain in 2011, and a $42.8 million net gain in 2010. The amount and timing of our sales of investment securities are dependent on a number of factors, including our efforts to preserve capital levels while managing duration and extension risk.
Insurance income decreased by $1.4 million or 13% in 2012 compared to 2011 primarily due to lower sales of our annuity products. The low interest rate environment, in particular, continues to adversely affect sales of our fixed annuity products.
Insurance income increased by $1.0 million or 10% in 2011 compared to 2010 primarily due to an increase in income from our variable annuity products.
Other noninterest income increased by $1.7 million or 8% in 2012 compared to 2011. This increase was primarily due to a lessee exercising its early buy-out option on two cargo ship leveraged leases which resulted in a pre-tax gain of $3.5 million in the first quarter of 2012. In addition, we received a $0.5 million contingent payment in the third quarter of 2012 related to the 2010 sale of our proprietary mutual funds. Also contributing to the increase was a $0.5 million increase in income from bank-owned life insurance. These items were partially offset by a $2.0 million contingent payment received in the third quarter of 2011 related to the 2010 sale of our proprietary mutual funds, combined with a $1.0 million pre-tax loss related to the sale and termination of an aircraft lease in the first quarter of 2012. Other noninterest income decreased by $3.3 million or 13% in 2011 compared to 2010. This decrease was primarily due to net gains of $2.9 million resulting from the sale of our proprietary mutual funds in the third quarter of 2010, partially offset by the aforementioned $2.0 million contingent payment received in the third quarter of 2011 related to the 2010 mutual funds sale. In addition, we recognized a $0.9 million contingent payment received in the third quarter of 2010 related to the sale of our retail insurance brokerage operation in the second quarter of 2009.
28
Noninterest Expense
Table 4 presents the major components of noninterest expense for 2012, 2011, and 2010.
|
Noninterest Expense
|
Table 4
|
||||||||||||||||||||||||
|
Year Ended December 31,
|
Dollar Change
|
Percent Change
|
|||||||||||||||||||||||
|
(dollars in thousands)
|
2012
|
|
2011
|
|
2010
|
|
2012
to 2011 |
|
2011
to 2010 |
|
2012
to 2011 |
|
2011
to 2010 |
|
|||||||||||
|
Salaries and Benefits:
|
|||||||||||||||||||||||||
|
Salaries
|
$
|
115,208
|
|
$
|
115,512
|
|
$
|
119,515
|
|
$
|
(304
|
)
|
$
|
(4,003
|
)
|
—
|
%
|
(3
|
)%
|
||||||
|
Incentive Compensation
|
16,926
|
|
16,367
|
|
15,544
|
|
559
|
|
823
|
|
3
|
|
5
|
|
|||||||||||
|
Share-Based Compensation and
Cash Grants for the Purchase of Company Stock |
6,961
|
|
5,720
|
|
6,805
|
|
1,241
|
|
(1,085
|
)
|
22
|
|
(16
|
)
|
|||||||||||
|
Commission Expense
|
6,993
|
|
6,489
|
|
6,666
|
|
504
|
|
(177
|
)
|
8
|
|
(3
|
)
|
|||||||||||
|
Retirement and Other Benefits
|
16,014
|
|
16,829
|
|
15,708
|
|
(815
|
)
|
1,121
|
|
(5
|
)
|
7
|
|
|||||||||||
|
Payroll Taxes
|
10,593
|
|
10,645
|
|
10,084
|
|
(52
|
)
|
561
|
|
—
|
|
6
|
|
|||||||||||
|
Medical, Dental, and Life Insurance
|
9,319
|
|
9,039
|
|
8,242
|
|
280
|
|
797
|
|
3
|
|
10
|
|
|||||||||||
|
Separation Expense
|
2,394
|
|
2,215
|
|
3,149
|
|
179
|
|
(934
|
)
|
8
|
|
(30
|
)
|
|||||||||||
|
Total Salaries and Benefits
|
184,408
|
|
182,816
|
|
|
185,713
|
|
1,592
|
|
(2,897
|
)
|
1
|
|
(2
|
)
|
||||||||||
|
Net Occupancy
|
42,965
|
|
43,169
|
|
40,988
|
|
(204
|
)
|
2,181
|
|
—
|
|
5
|
|
|||||||||||
|
Net Equipment
|
19,723
|
|
18,849
|
|
19,371
|
|
874
|
|
(522
|
)
|
5
|
|
(3
|
)
|
|||||||||||
|
Professional Fees
|
9,623
|
|
8,623
|
|
7,104
|
|
1,000
|
|
1,519
|
|
12
|
|
21
|
|
|||||||||||
|
FDIC Insurance
|
7,873
|
|
9,346
|
|
12,564
|
|
(1,473
|
)
|
(3,218
|
)
|
(16
|
)
|
(26
|
)
|
|||||||||||
|
Other Expense:
|
|
|
|
|
|
|
|||||||||||||||||||
|
Data Services
|
13,202
|
|
14,067
|
|
13,812
|
|
(865
|
)
|
255
|
|
(6
|
)
|
2
|
|
|||||||||||
|
Delivery and Postage Services
|
8,612
|
|
8,955
|
|
9,072
|
|
(343
|
)
|
(117
|
)
|
(4
|
)
|
(1
|
)
|
|||||||||||
|
Mileage Program Travel
|
6,741
|
|
8,910
|
|
8,055
|
|
(2,169
|
)
|
855
|
|
(24
|
)
|
11
|
|
|||||||||||
|
Merchant Transaction and Card Processing Fees
|
4,895
|
|
5,162
|
|
5,203
|
|
(267
|
)
|
(41
|
)
|
(5
|
)
|
(1
|
)
|
|||||||||||
|
Advertising
|
4,659
|
|
5,484
|
|
5,010
|
|
(825
|
)
|
474
|
|
(15
|
)
|
9
|
|
|||||||||||
|
Stationery and Supplies
|
3,972
|
|
4,275
|
|
4,587
|
|
(303
|
)
|
(312
|
)
|
(7
|
)
|
(7
|
)
|
|||||||||||
|
Donations
|
1,033
|
|
2,075
|
|
1,146
|
|
(1,042
|
)
|
929
|
|
(50
|
)
|
81
|
|
|||||||||||
|
Repurchase Agreement
Early Termination Expense |
—
|
|
—
|
|
5,189
|
|
—
|
|
(5,189
|
)
|
n.m.
|
|
n.m.
|
|
|||||||||||
|
Settlement Related to Overdraft Claims
|
—
|
|
9,000
|
|
—
|
|
(9,000
|
)
|
9,000
|
|
n.m.
|
|
n.m.
|
|
|||||||||||
|
Other
|
26,582
|
|
27,462
|
|
28,422
|
|
(880
|
)
|
(960
|
)
|
(3
|
)
|
(3
|
)
|
|||||||||||
|
Total Other Expense
|
69,696
|
|
85,390
|
|
|
80,496
|
|
|
(15,694
|
)
|
|
4,894
|
|
(18
|
)
|
6
|
|
||||||||
|
Total Noninterest Expense
|
$
|
334,288
|
|
$
|
348,193
|
|
|
$
|
346,236
|
|
|
$
|
(13,905
|
)
|
|
$
|
1,957
|
|
(4
|
)%
|
1
|
%
|
|||
n.m. - not meaningful.
Total salaries and benefits increased by $1.6 million or 1% in 2012 compared to 2011. Share-based compensation increased by $1.2 million primarily due to an increase in amortization related to performance-based restricted stock granted in the first quarter of 2012. In addition, incentive compensation and commission expense increased by $0.6 million and $0.5 million, respectively. These increases were partially offset by a $0.8 million decrease in retirement and other benefits due to lower amortization expense related to our pension plan. Total salaries and benefits decreased by $2.9 million or 2% in 2011 compared to 2010. This decrease was primarily due to a $4.0 million decrease in salaries expense. We experienced an increase in deferred salaries in 2011, which has the effect of decreasing salaries expense, resulting from our decision to add more fixed-rate conforming saleable loans to our portfolio. Lower salaries expense was also due to a decline in the number of full-time equivalent employees and one fewer paid working day. Share-based compensation and cash grants for the purchase of company stock decreased by $1.1 million primarily due to lower amortization on restricted stock awards. These decreases were partially offset by an increase in retirement benefits expense mainly due to a $1.0 million settlement gain in 2010 on the extinguishment of retiree life insurance obligations. In addition, incentive compensation was $0.8 million higher in 2011 compared to 2010. Our incentive programs are designed to reward performance and to provide market competitive total compensation. Executive incentive programs, in particular, are designed to align the long-term interests of executives and shareholders through the achievement of earnings growth and stock price appreciation.
Net occupancy decreased by $0.2 million or less than 1% in 2012 compared to 2011. This decrease was primarily due to a $0.9 million decline in depreciation expense primarily related to the closure of two branches in April 2012, partially offset by an increase in impairment charges. We recorded impairment charges of $1.1 million and $0.6 million in 2012 and 2011, respectively, related to several of the Company's branch premises. Net occupancy increased by $2.2 million or 5% in 2011 compared to 2010.
29
This increase was primarily due to a $1.4 million increase in utilities mainly the result of higher electricity rates, and a $1.0 million increase in depreciation expense due mainly to the change in estimated useful lives related to two properties.
Net equipment expense increased by $0.9 million or 5% in 2012 compared to 2011 primarily due to the purchase of technology equipment in the first quarter of 2012. Net equipment expense decreased by $0.5 million or 3% in 2011 compared to 2010 primarily due to the purchase of technology equipment in 2010.
Professional fees increased by $1.0 million or 12% in 2012 compared to 2011 primarily due to an increase in information technology and tax consulting fees. Professional fees increased by $1.5 million or 21% in 2011 compared to 2010 primarily due to a $1.0 million increase in legal fees combined with a $0.8 million increase in fees related to management of our investment platform and providing investment advisory services to our customers.
FDIC insurance expense decreased by $1.5 million or 16% in 2012 compared to 2011. This decrease was primarily due to lower rate assessments as a result of new rules finalized by the FDIC. As required by the Dodd-Frank Act, on February 7, 2011, the FDIC finalized new rules which redefined the assessment base as “average consolidated total assets minus average tangible equity.” The new rate schedule and other revisions to the assessment rules became effective April 1, 2011. On October 9, 2012, the FDIC issued a final rule that revised the definitions of subprime consumer loans and leveraged commercial loans for banks with more than $10.0 billion in assets that are subject to the large-bank pricing assessment system. The final rule is effective April 1, 2013. As of the date of this filing, management is still assessing the potential impact that the provisions of this final rule may have on the Company's FDIC assessments. FDIC insurance expense decreased by $3.2 million or 26% in 2011 compared to 2010 primarily due to the new rate schedule and other revisions to the assessment rules noted above.
Other noninterest expense decreased by $15.7 million or 18% in 2012 compared to 2011. This decrease was primarily due to $9.0 million related to the settlement of overdraft litigation recorded in the second quarter of 2011. In addition, expenses related to our debit card airline mileage program decreased by $2.2 million, insurance expense decreased by $1.6 million, and operating losses, which include losses as a result of bank error, fraud, items processing, or theft, decreased by $1.5 million in 2012 compared to 2011. Other noninterest expense increased by $4.9 million or 6% in 2011 compared to 2010. This increase was primarily due to the aforementioned $9.0 million settlement of overdraft litigation expense in the second quarter of 2011. Also contributing to the increase was a $1.3 million gain in 2010 related to the sale of foreclosed real estate, which was recorded as a component of other noninterest expense. These increases were partially offset by $5.2 million in early termination costs incurred in the third quarter of 2010 related to the prepayment of $75.0 million in securities sold under agreements to repurchase.
Income Taxes
Table 5 presents our provision for income taxes and effective tax rates for
2012
,
2011
, and
2010
:
|
Provision for Income Taxes and Effective Tax Rates
|
Table 5
|
|
|||||
|
(dollars in thousands)
|
Provision for Income Taxes
|
Effective Tax Rates
|
|
||||
|
2012
|
$
|
76,214
|
|
31.46
|
%
|
||
|
2011
|
66,937
|
|
29.49
|
%
|
|||
|
2010
|
76,273
|
|
29.31
|
%
|
|||
The provision for income taxes was
$76.2 million
in
2012
, an increase of
$9.3 million
or
14%
compared to
2011
. The higher effective tax rate in
2012
compared to
2011
was due in part to higher pretax income as well as the absence of significant discrete tax items recorded in prior years as described below.
The provision for income taxes was
$66.9 million
in
2011
, a decrease of $9.3 million or 12% compared to
2010
. The effective tax rate for
2011
remained relatively unchanged from
2010
. The effective tax rate in 2011 was favorably impacted by lower pretax income as well as several significant discrete tax items. We recorded a $3.5 million credit to the provision for income taxes related to the reversal of liabilities for unrecognized state tax benefits due to the lapse in the statute of limitations related to tax years held open by the settlement of the Lease In-Lease Out ("LILO") and Sale In-Lease Out ("SILO") transactions and the filing of Hawaii amended tax returns to report the Internal Revenue Service ("IRS") adjustments. We also recorded a $3.5 million credit to the provision for income taxes related to the release of general reserves due to the closing of the IRS audit for tax years 2007 and 2008 and as a result of settling interest due to the IRS for tax years 1998 through 2006. Also favorably impacting the effective tax rate in
2011
was a $3.5 million release of a valuation allowance for the expected utilization of capital losses on the future sale of a low-income housing investment.
30
The provision for income taxes was
$76.3 million
and the effective tax rate was
29.31%
in
2010
. The effective tax rate in
2010
was favorably impacted by a $7.7 million credit to the provision for income taxes for the release of reserves. This credit was the result of the closing of the audit by the IRS related to the tax years held open by the settlement of the LILO and SILO transactions and the filing of Hawaii amended tax returns to report the IRS adjustments. Also favorably impacting our effective tax rate in
2010
was a $2.7 million release of a valuation allowance for the expected utilization of capital losses on the future sale of a low-income housing investment. The other significant transaction that favorably impacted the effective tax rate was the sale of our equity interest in two leveraged leases, which resulted in a $4.4 million credit to the provision for income taxes in
2010
.
Analysis of Business Segments
Our business segments are Retail Banking, Commercial Banking, Investment Services, and Treasury and Other. Table 6 summarizes net income from our business segments for 2012, 2011, and 2010. Additional information about segment performance is presented in Note 13 to the Consolidated Financial Statements.
|
Business Segment Net Income
|
Table 6
|
|
|||||||||
|
Year Ended December 31,
|
|||||||||||
|
(dollars in thousands)
|
2012
|
|
2011
|
|
2010
|
|
|||||
|
Retail Banking
|
$
|
37,403
|
|
$
|
30,919
|
|
$
|
47,579
|
|
||
|
Commercial Banking
|
51,349
|
|
53,203
|
|
52,737
|
|
|||||
|
Investment Services
|
8,923
|
|
9,943
|
|
11,452
|
|
|||||
|
Total
|
97,675
|
|
94,065
|
|
111,768
|
|
|||||
|
Treasury and Other
|
68,401
|
|
65,978
|
|
72,174
|
|
|||||
|
Consolidated Total
|
$
|
166,076
|
|
$
|
160,043
|
|
$
|
183,942
|
|
||
Retail Banking
Net income increased by $6.5 million or 21% in 2012 compared to 2011 primarily due to decreases in the Provision and noninterest expense, combined with an increase in noninterest income. This was partially offset by a decrease in net interest income. The decrease in the Provision was primarily due to lower net charge-offs of loans and leases in the segment combined with improving credit trends and the underlying risk profile of the loan portfolio. The decrease in noninterest expense was primarily due to higher 2011 allocated expenses related to the overdraft litigation settlement accrued in the second quarter of 2011. The increase in noninterest income was primarily due to higher mortgage banking income, partially offset by lower debit card interchange income resulting from the pricing restrictions imposed by the Durbin Amendment, which was effective October 1, 2011. The decrease in net interest income was primarily due to lower earnings credits on the segment's deposit portfolio, partially offset by higher average deposit and loan balances.
Net income decreased by $16.7 million or 35% in 2011 compared to 2010 primarily due to a decrease in net interest income and noninterest income, combined with an increase in noninterest expense. This was partially offset by a decrease in the Provision. The decrease in net interest income was primarily due to lower earnings credits on the segment's deposit portfolio and lower average loan balances and loan margins, partially offset by higher average deposit balances. The decrease in noninterest income was primarily due to lower overdraft fees mainly resulting from several overdraft processing changes implemented in the first quarter of 2011, combined with the FRB's amendments to Regulation E. Also contributing to the decrease in noninterest income was lower mortgage banking income, ATM fees, and account analysis fees. The increase in noninterest expense was primarily due to the previously noted accrual related to the settlement of overdraft litigation recorded in the second quarter of 2011, combined with higher occupancy and debit card expense, partially offset by lower allocated FDIC insurance costs. The decrease in the Provision was primarily due to lower net charge-offs of loans and leases in the segment.
Commercial Banking
Net income decreased by $1.9 million or 3% in 2012 compared to 2011 primarily due to a decrease in net interest income. This was partially offset by decreases in the provision for income taxes and noninterest expense, and to an increase in noninterest income. The decrease in net interest income was due to lower earnings credits on the segment's deposit portfolio, partially offset by higher average deposit balances. The decrease in the provision for income taxes and the increase in noninterest income were attributed to a gain recognized upon a lessee exercising its early buy-out option on two cargo ship leveraged leases in the first quarter of 2012. The decrease in noninterest expense was primarily due to lower other operating expense, higher allocated expenses in 2011 related to the overdraft litigation settlement accrued in the second quarter of 2011, and lower allocated FDIC
31
insurance expense resulting from lower rate assessments.
Net income increased by $0.5 million or 1% in 2011 compared to 2010 primarily due to decreases in the Provision and noninterest expense. This was partially offset by lower net interest income and noninterest income. The decrease in the Provision was primarily due to reduced risk, lower net charge-offs of loans and leases, and a partial recovery on a previously charged-off leveraged lease. The decrease in noninterest expense was primarily due to lower salaries, occupancy, and allocated expenses. The decrease in net interest income was primarily due to lower earnings credits on the segment's deposit portfolio, partially offset by higher average deposit balances. The decrease in noninterest income was primarily due to lower overdraft fees, account analysis fees, and a contingent payment received in 2010 related to the sale of assets of our retail insurance brokerage operation in 2009.
Investment Services
Net income decreased by $1.0 million or 10% in 2012 compared to 2011 primarily due to decreases in net interest income and noninterest income, partially offset by a decrease in noninterest expense. The decrease in net interest income was primarily due to lower earnings credits on the segment's deposit portfolio. The decrease in noninterest income was primarily due to lower annuity and life insurance fee income from the segment's full service brokerage, coupled with a contingent payment received in the third quarter of 2011 related to the 2010 sale of our proprietary mutual funds. The decrease in noninterest expense was primarily due to lower salaries and other operating expense.
Net income decreased by $1.5 million or 13% in 2011 compared to 2010 primarily due to a decrease in net interest income and an increase in noninterest expense. The decrease in net interest income was primarily due to lower earnings credits on the segment's deposit portfolio and lower average deposit balances. The increase in noninterest expense was due to higher direct operating and allocated expenses.
Treasury and Other
Net income increased by $2.4 million or 4% in 2012 compared to 2011 primarily due to an increase in net interest income. This was partially offset by lower noninterest income. The increase in net interest income was primarily due to lower deposit funding costs partially offset by lower yields in the investment portfolio. The decrease in noninterest income was primarily due to lower net investment securities gains.
Net income decreased by $6.2 million or 9% in 2011 compared to 2010 primarily due to a decrease in noninterest income. This was partially offset by higher net interest income, and a lower Provision and noninterest expense. The decrease in noninterest income was primarily due to lower net investment securities gains. The increase in net interest income was primarily due to lower deposit funding costs. The decrease in the Provision was reflective of continued improvements in our credit quality metrics and an improving Hawaii economy. The decrease in noninterest expense was primarily due to the early termination costs related to the prepayment of $75.0 million in securities sold under agreements to repurchase in 2010 and lower separation expense in 2011.
Other organizational units (Technology, Operations, Marketing, Human Resources, Finance, Credit and Risk Management, and Corporate and Regulatory Administration) included in Treasury and Other provide a wide-range of support to the Company's other income earning segments. Expenses incurred by these support units are charged to the business segments through an internal cost allocation process.
32
Analysis of Statements of Condition
Investment Securities
Table 7 presents the contractual maturity distribution, weighted-average yield to maturity, and fair value of our investment securities.
|
Contractual Maturity Distribution, Weighted-Average Yield to Maturity, and Fair Value of Investment Securities
|
Table 7
|
|||||||||||||||||||||||||||||||||||||
|
(dollars in millions)
|
1 Year
or Less |
|
Weighted
Average Yield |
|
After 1
Year-5 Years |
|
Weighted
Average Yield |
|
After 5
Years-10 Years |
|
Weighted
Average Yield |
|
Over 10
Years |
|
Weighted
Average Yield |
|
Total
|
|
Weighted
Average Yield |
|
Fair
Value |
|
||||||||||||||||
|
As of December 31, 2012
|
||||||||||||||||||||||||||||||||||||||
|
Investment Securities Available-for-Sale
1
|
||||||||||||||||||||||||||||||||||||||
|
Debt Securities Issued by the U.S. Treasury and Government Agencies
|
$
|
401.8
|
|
0.9
|
%
|
$
|
66.7
|
|
2.3
|
%
|
$
|
67.2
|
|
2.6
|
%
|
$
|
319.4
|
|
2.3
|
%
|
$
|
855.1
|
|
1.6
|
%
|
$
|
870.0
|
|
||||||||||
|
Debt Securities Issued by States and Political Subdivisions
2
|
34.9
|
|
1.7
|
|
48.5
|
|
2.7
|
|
360.6
|
|
3.2
|
|
309.2
|
|
5.0
|
|
753.2
|
|
3.8
|
|
782.4
|
|
||||||||||||||||
|
Debt Securities Issued by Corporations
|
—
|
|
—
|
|
82.4
|
|
2.2
|
|
—
|
|
—
|
|
—
|
|
—
|
|
82.4
|
|
2.2
|
|
84.5
|
|
||||||||||||||||
|
Mortgage-Backed Securities Issued by
3
|
||||||||||||||||||||||||||||||||||||||
|
Government Agencies
|
—
|
|
—
|
|
—
|
|
—
|
|
42.0
|
|
3.5
|
|
1,523.7
|
|
2.5
|
|
1,565.7
|
|
2.5
|
|
1,593.4
|
|
||||||||||||||||
|
U.S. Government-Sponsored Enterprises
|
0.2
|
|
4.5
|
|
0.1
|
|
4.5
|
|
7.4
|
|
4.5
|
|
27.6
|
|
3.2
|
|
35.3
|
|
3.5
|
|
37.3
|
|
||||||||||||||||
|
Total Mortgage-Backed Securities
|
0.2
|
|
4.5
|
|
0.1
|
|
4.5
|
|
49.4
|
|
3.7
|
|
1,551.3
|
|
2.5
|
|
1,601.0
|
|
2.6
|
|
1,630.7
|
|
||||||||||||||||
|
Total Investment Securities
Available-for-Sale |
$
|
436.9
|
|
1.0
|
%
|
$
|
197.7
|
|
2.4
|
%
|
$
|
477.2
|
|
3.1
|
%
|
$
|
2,179.9
|
|
2.8
|
%
|
$
|
3,291.7
|
|
2.6
|
%
|
$
|
3,367.6
|
|
||||||||||
|
Investment Securities Held-to-Maturity
|
||||||||||||||||||||||||||||||||||||||
|
Debt Securities Issued by the U.S. Treasury and Government Agencies
|
$
|
50.1
|
|
1.1
|
%
|
$
|
140.1
|
|
1.8
|
%
|
$
|
—
|
|
—
|
%
|
$
|
—
|
|
—
|
%
|
$
|
190.2
|
|
1.6
|
%
|
$
|
195.4
|
|
||||||||||
|
Debt Securities Issued by Corporations
|
—
|
|
—
|
|
—
|
|
—
|
|
—
|
|
—
|
|
24
|
|
1.5
|
|
24.0
|
|
1.5
|
|
24.0
|
|
||||||||||||||||
|
Mortgage-Backed Securities Issued by
3
|
||||||||||||||||||||||||||||||||||||||
|
Government Agencies
|
—
|
|
—
|
|
—
|
|
—
|
|
30.9
|
|
3.7
|
|
3,318.5
|
|
2.9
|
|
3,349.4
|
|
2.9
|
|
3,434.7
|
|
||||||||||||||||
|
U.S. Government-Sponsored Enterprises
|
—
|
|
—
|
|
1.5
|
|
3.5
|
|
4.0
|
|
3.8
|
|
26.0
|
|
3.8
|
|
31.5
|
|
3.8
|
|
33.6
|
|
||||||||||||||||
|
Total Mortgage-Backed Securities
|
—
|
|
—
|
|
1.5
|
|
3.5
|
|
34.9
|
|
3.7
|
|
3,344.5
|
|
2.9
|
|
3,380.9
|
|
2.9
|
|
3,468.3
|
|
||||||||||||||||
|
Total Investment Securities
Held-to-Maturity |
$
|
50.1
|
|
1.1
|
%
|
$
|
141.6
|
|
1.8
|
%
|
$
|
34.9
|
|
3.7
|
%
|
$
|
3,368.5
|
|
2.9
|
%
|
$
|
3,595.1
|
|
2.9
|
%
|
$
|
3,687.7
|
|
||||||||||
|
Total Investment Securities
|
||||||||||||||||||||||||||||||||||||||
|
As of December 31, 2012
|
$
|
487.0
|
|
$
|
339.3
|
|
$
|
512.1
|
|
$
|
5,548.4
|
|
$
|
6,886.8
|
|
$
|
7,055.3
|
|
||||||||||||||||||||
|
As of December 31, 2011
|
$
|
427.3
|
|
$
|
791.5
|
|
$
|
200.8
|
|
$
|
5,625.1
|
|
$
|
7,044.7
|
|
$
|
7,206.1
|
|
||||||||||||||||||||
|
As of December 31, 2010
|
$
|
172.2
|
|
$
|
180.0
|
|
$
|
195.1
|
|
$
|
6,037.1
|
|
$
|
6,584.4
|
|
$
|
6,667.9
|
|
||||||||||||||||||||
|
1
|
Weighted-average yields on available-for-sale investment securities are based on amortized cost.
|
|
2
|
Weighted-average yields on obligations of states and political subdivisions are generally tax-exempt and are computed on a taxable-equivalent basis using a federal statutory tax rate of 35%.
|
3
Contractual maturities do not anticipate reductions for periodic paydowns.
The carrying value of our investment securities portfolio was $7.0 billion as of
December 31, 2012
, a decrease of $147.1 million or 2% compared to
December 31, 2011
.
We continually evaluate our investment securities portfolio in response to established asset/liability management objectives, changing market conditions that could affect profitability, and the level of interest rate risk to which we are exposed. These evaluations may cause us to change the level of funds we deploy into investment securities, change the composition of our investment securities portfolio, and change the proportion of investments made into the available-for-sale and held-to-maturity investment categories.
In
2012
, we reduced our positions in U.S. Treasury Notes and mortgage-backed securities issued by the Government National Mortgage Association ("Ginnie Mae"). We re-invested these proceeds, in part, into state and municipal bond holdings.
As of
December 31, 2012
, our remaining portfolio of Ginnie Mae mortgage-backed securities was primarily comprised of securities issued between 2008 and 2011. As of
December 31, 2012
, the credit ratings of these mortgage-backed securities were all AAA-rated, with a low probability of a change in ratings in the near future. As of
December 31, 2012
, our available-for-sale investment securities portfolio was comprised of securities with an average base duration of less than three years.
Gross unrealized gains in our investment securities portfolio were $172.3 million as of
December 31, 2012
and $168.0 million as of
December 31, 2011
. Gross unrealized losses on our temporarily impaired investment securities were $3.8 million as of
33
December 31, 2012
and $6.6 million as of
December 31, 2011
. As of
December 31, 2012
, the gross unrealized losses were primarily related to mortgage-backed securities issued by government agencies and were attributable primarily to changes in interest rates, relative to when the investment securities were purchased. See Note 3 to the Consolidated Financial Statements for more information.
Loans and Leases
Total loans and leases were
$5.9 billion
as of
December 31, 2012
. This represents a
$316.2 million
or
6%
increase from
December 31, 2011
with increases in nearly every lending category.
The commercial loan and lease portfolio is comprised of commercial and industrial loans, commercial mortgages, construction loans, and lease financing. Commercial and industrial loans are made primarily to corporations, middle market, and small businesses. Commercial mortgages and construction loans are offered to real estate investors, developers, and builders primarily domiciled in Hawaii. Commercial mortgages are secured by real estate. The source of repayment for investor property is cash flow from the property and for owner-occupied property is the operating cash flow from the business. Construction loans are for the purchase or construction of a property for which repayment will be generated by the property. We classify loans as construction until the completion of the construction phase. Following construction, if a loan is retained, the loan is reclassified to the commercial mortgage category. Lease financing consists of direct financing leases and leveraged leases. Although our primary market is Hawaii, the commercial portfolio contains loans to some borrowers based on the U.S. Mainland, including some Shared National Credits.
Commercial loans and leases were
$2.3 billion
as of
December 31, 2012
, an increase of
$149.9 million
or
7%
from
December 31, 2011
. Commercial and industrial loans increased by
$12.3 million
or
2%
from
December 31, 2011
. Commercial mortgage loans increased by
$159.2 million
or
17%
from
December 31, 2011
primarily due to increased demand from new and existing customers. Commercial mortgage loans originated in
2012
were to finance new business activities as well as for refinancing opportunities in the current low interest rate environment. Construction loans increased by
$15.3 million
or
16%
from
December 31, 2011
, as we experienced modest growth in this portfolio due to continued improvement in the Hawaii economy. Lease financing decreased by
$37.0 million
or
12%
from
December 31, 2011
. This decrease was primarily due to a $16.6 million decrease in balances related to a lessee's decision to exercise its early buy-out option on two cargo ship leveraged leases in
2012
. Also contributing to the decrease in lease financing balances was a $6.1 million decrease related to the sale and termination of an aircraft lease in
2012
.
The consumer loan and lease portfolio is comprised of residential mortgage loans, home equity lines and loans, personal credit lines, direct installment loans, and indirect auto loans and leases. These products are offered generally in the markets we serve. Although we offer a variety of products, our residential mortgage loan portfolio is primarily comprised of fixed rate loans concentrated in Hawaii. We also offer a variety of home equity lines and loans, secured by second mortgages on residential property of the borrower. Direct installment loans are secured or unsecured and are often used for personal expenses or for debt consolidation. Auto loans are available at fixed interest rates at terms up to 78 months. Auto leases are also available at select Hawaii new car dealerships. In 2012, we also introduced a rewards-based consumer credit card product.
Consumer loans and leases were
$3.5 billion
as of
December 31, 2012
, an increase of
$166.3 million
or
5%
from
December 31, 2011
. Residential mortgage loans increased by
$134.0 million
or
6%
from
December 31, 2011
primarily due to strong refinancing activity, the result of low interest rates, as well as our decision to add more fixed-rate conforming saleable loans to our portfolio. Home equity loans decreased by
$10.3 million
or
1%
from
December 31, 2011
primarily due to continued paydowns and reduced line utilization. Automobile loans increased by
$17.3 million
or
9%
from
December 31, 2011
primarily due to increased customer demand and changes in our underwriting practices. Other consumer loans increased by
$25.3 million
or
14%
from
December 31, 2011
primarily due to the success of our installment loan product.
See Note 4 to the Consolidated Financial Statements and the "Corporate Risk Profile – Credit Risk" section of MD&A for more information on our loan and lease portfolio.
34
Table 8 presents the geographic distribution of our loan and lease portfolio. Table 9 presents a maturity distribution for selected loan categories. This table excludes real estate loans (other than construction loans), lease financing, and consumer loans.
|
Geographic Distribution of Loan and Lease Portfolio
|
Table 8
|
||||||||||||||||||||||
|
December 31, 2012
|
|||||||||||||||||||||||
|
(dollars in thousands)
|
Hawaii
|
|
U.S.
Mainland 1 |
|
Guam
|
|
Other
Pacific Islands |
|
Foreign
2
|
|
Total
|
|
|||||||||||
|
Commercial
|
|||||||||||||||||||||||
|
Commercial and Industrial
|
$
|
726,401
|
|
$
|
29,571
|
|
$
|
70,622
|
|
$
|
2,213
|
|
$
|
705
|
|
$
|
829,512
|
|
|||||
|
Commercial Mortgage
|
988,165
|
|
33,240
|
|
76,020
|
|
—
|
|
—
|
|
1,097,425
|
|
|||||||||||
|
Construction
|
109,956
|
|
—
|
|
4,031
|
|
—
|
|
—
|
|
113,987
|
|
|||||||||||
|
Lease Financing
|
31,871
|
|
207,236
|
|
13,070
|
|
—
|
|
22,792
|
|
274,969
|
|
|||||||||||
|
Total Commercial
|
1,856,393
|
|
270,047
|
|
163,743
|
|
2,213
|
|
23,497
|
|
2,315,893
|
|
|||||||||||
|
Consumer
|
|||||||||||||||||||||||
|
Residential Mortgage
|
2,209,882
|
|
—
|
|
135,491
|
|
4,543
|
|
—
|
|
2,349,916
|
|
|||||||||||
|
Home Equity
|
740,939
|
|
7,784
|
|
19,682
|
|
1,971
|
|
—
|
|
770,376
|
|
|||||||||||
|
Automobile
|
152,031
|
|
4,068
|
|
50,716
|
|
3,017
|
|
—
|
|
209,832
|
|
|||||||||||
|
Other
3
|
148,724
|
|
—
|
|
23,867
|
|
35,904
|
|
9
|
|
208,504
|
|
|||||||||||
|
Total Consumer
|
3,251,576
|
|
11,852
|
|
229,756
|
|
45,435
|
|
9
|
|
3,538,628
|
|
|||||||||||
|
Total Loans and Leases
|
$
|
5,107,969
|
|
$
|
281,899
|
|
$
|
393,499
|
|
$
|
47,648
|
|
$
|
23,506
|
|
$
|
5,854,521
|
|
|||||
|
Percentage of Total Loans and Leases
|
87
|
%
|
5
|
%
|
7
|
%
|
1
|
%
|
—
|
%
|
100
|
%
|
|||||||||||
|
1
|
For secured loans and leases, classification as U.S. Mainland is made based on where the collateral is located. For unsecured loans and leases, classification as U.S. Mainland is made based on the location where the majority of the borrower's business operations are conducted.
|
|
2
|
Loans classified as Foreign represent those which are recorded in the Company's international business units. Lease financing classified as Foreign represent those with air transportation carriers based outside the United States.
|
|
3
|
Comprised of other revolving credit, installment, and lease financing.
|
|
Maturities for Selected Loan Categories
1
|
Table 9
|
||||||||||||||
|
December 31, 2012
|
|||||||||||||||
|
(dollars in thousands)
|
Due in
One Year or Less |
|
Due After One
to Five Years 2 |
|
Due After
Five Years 2 |
|
Total
|
|
|||||||
|
Commercial and Industrial
|
$
|
328,979
|
|
$
|
288,768
|
|
$
|
211,765
|
|
$
|
829,512
|
|
|||
|
Construction
|
40,837
|
|
65,430
|
|
7,720
|
|
113,987
|
|
|||||||
|
Total
|
$
|
369,816
|
|
$
|
354,198
|
|
$
|
219,485
|
|
$
|
943,499
|
|
|||
1
Based on contractual maturities.
2
As of December 31, 2012, loans maturing after one year consisted of $323.8 million in variable rate loans and $249.9 million in fixed rate loans.
Other Assets
Other assets were $457.0 million as of December 31, 2012, an increase of $15.2 million or 3% from December 31, 2011. The increase in other assets was primarily due to a $12.5 million increase in the balance of our low-income housing and other equity investments, a $5.3 million increase in the value of our bank-owned life insurance, and a $4.5 million increase in the fair value of our derivative financial instruments. The increase in the fair value of derivative financial instruments was primarily attributable to the fair value of our interest rate lock commitments and forward commitments, the result of a large unclosed pipeline of residential mortgage applications as of December 31, 2012. This was partially offset by a $7.1 million decrease in prepaid FDIC assessments due to amortization recorded in 2012. See Note 7 to the Consolidated Financial Statements for more information on the composition of our other assets.
As of December 31, 2012, the carrying value of our Federal Home Loan Bank of Seattle ("FHLB") stock was $60.2 million and consisted of 602,001 shares valued at a par value of $100 per share. Our investment in the FHLB is a condition of membership and, as such, is required to obtain credit and other services from the FHLB. For the past several quarters, the FHLB met all of its regulatory capital requirements, but remained classified as "undercapitalized" by its primary regulator, the Federal Housing Finance Agency ("Finance Agency"), due to several factors including the possibility that further declines in the value of its private-label mortgage-backed securities could cause it to fall below its risk-based capital requirements. However, on September 7, 2012, the FHLB reported that its financial health has been steadily improving. As such, the Finance Agency upgraded the FHLB's classification to “adequately capitalized,” which allows it, conditions permitting, to repurchase a small amount of excess capital stock for the first time since December 2008. In 2007, we requested the redemption of 361,645 shares of FHLB stock. In
35
2012, the FHLB redeemed 10,923 shares of their stock at par value of $100 per share for a total of $1.1 million. This redemption reduced our holdings in FHLB stock from $61.3 million as of December 31, 2011 to $60.2 million as of December 31, 2012. Based upon the foregoing, we have not recorded an impairment of the carrying value of our FHLB stock as of December 31, 2012.
Goodwill
Goodwill was
$31.5 million
as of
December 31, 2012
and
2011
. As of
December 31, 2012
, based on our qualitative assessment, there were no reporting units where we believed that it was more likely than not that the fair value of a reporting unit was less than its carrying amount, including goodwill. As a result, we had no reporting units where there was a reasonable possibility of failing Step 1 of the goodwill impairment test. See Note 1 to the Consolidated Financial Statements for more information on our goodwill impairment policy.
Deposits
Total deposits were
$11.5 billion
as of
December 31, 2012
, a
$936.9 million
or
9%
increase from
December 31, 2011
. We have successfully grown our deposit balances in each of the past 6 consecutive years. We believe that our strong brand plays a key role in increasing deposit balances for us, as we compete with other financial institutions for a share of the deposit market.
The increase in deposit balances in 2012 was primarily due to a $677.5 million increase in our personal and business interest and non-interest bearing demand accounts. Also contributing to the increase was a $388.4 million increase in public time deposits. This was partially offset by a $154.5 million decrease in our business money market savings accounts.
Average time deposits of $100,000 or more were $1.2 billion in
2012
and $675.1 million in
2011
. See Note 8 to the Consolidated Financial Statements for more information.
Table 10 presents the components of our savings deposits as of
December 31, 2012
and
2011
.
|
Savings Deposits
|
Table 10
|
||||||
|
(dollars in thousands)
|
2012
|
|
2011
|
|
|||
|
Money Market
|
$
|
1,605,597
|
|
$
|
1,732,999
|
|
|
|
Regular Savings
|
2,793,719
|
|
2,665,639
|
|
|||
|
Total Savings Deposits
|
$
|
4,399,316
|
|
$
|
4,398,638
|
|
|
Borrowings
Borrowings, which consists of funds purchased, were
$11.3 million
as of
December 31, 2012
, a
$0.5 million
or
5%
increase from
December 31, 2011
. We manage the level of our borrowings to ensure that we have adequate sources of liquidity. Due to high levels of deposits and our increased capital levels, our level of borrowings as a source of funds has remained low. See Note 9 to the Consolidated Financial Statements for more information.
Securities Sold Under Agreements to Repurchase
Securities sold under agreements to repurchase were
$758.9 million
as of
December 31, 2012
, a
$1.2 billion
or
61%
decrease from
December 31, 2011
. This decrease was primarily due to local government entities transferring funds from repurchase agreements to time deposits during 2012.
Average rates paid on securities sold under agreements to repurchase were 2.16% in
2012
, a 58 basis point increase from
2011
. The increase in average rates paid in 2012 was due to the balance of securities sold under agreements to repurchase being comprised of a relatively larger percentage of private institution repurchase agreements compared to local government repurchase agreements. The local government repurchase agreements were generally short-term with low interest rates. As noted above, these repurchase agreements have been decreasing, resulting in a relatively higher percentage of private institution repurchase agreements which are at higher interest rates. As of
December 31, 2012
, the weighted average interest rates for outstanding agreements with government entities and private institutions were 0.12% and 4.63%, respectively.
We have not entered into agreements in which the securities sold and the related liability was not recorded on the consolidated statements of condition. See Note 9 to the Consolidated Financial Statements for more information.
36
Long-Term Debt
Long-term debt was
$128.1 million
as of
December 31, 2012
, a
$97.4 million
increase from
December 31, 2011
. This increase was due to a $100.0 million advance we received from the FHLB in the fourth quarter of 2012. The stated interest on the advance is 0.60% with maturity in December 2015. The advance from the FHLB was primarily for asset/liability management purposes. As of
December 31, 2012
, our remaining line of credit with the FHLB of $1.0 billion.
Pension and Postretirement Plan Obligations
Retirement benefits payable were
$47.7 million
as of
December 31, 2012
, a
$0.7 million
or
2%
increase from
December 31, 2011
. Our pension and postretirement benefit obligations and net periodic benefit cost are actuarially determined based on a number of key assumptions, including the discount rate, the expected return on plan assets, and the health-care cost trend rate. The accounting for pension and postretirement benefit plans reflect the long-term nature of the obligations and the investment horizon of the plan assets. The increase in retirement benefits payable as of
December 31, 2012
was primarily due to utilizing a lower discount rate.
The discount rate is used to determine the present value of future benefit obligations and the net periodic benefit cost. The discount rate used to value the present value of future benefit obligations as of each year-end is the rate used to estimate the net periodic benefit cost for the following year. Table 11 presents a sensitivity analysis of a 25 basis point change in discount rates to the pension and postretirement benefit plan's net periodic benefit cost and benefit obligations:
|
Discount Rate Sensitivity Analysis
|
Table 11
|
|
|||||||||||||
|
Impact of
|
|||||||||||||||
|
Discount Rate
25 Basis Point Increase |
Discount Rate
25 Basis Point Decrease |
||||||||||||||
|
(dollars in thousands)
|
Base Discount Rate
|
|
Pension Benefits
|
|
Postretirement Benefits
|
|
Pension Benefits
|
|
Postretirement Benefits
|
|
|||||
|
2012 Net Periodic Benefit Cost
|
5.04
|
%
|
$
|
4
|
|
$
|
(11
|
)
|
$
|
(7
|
)
|
$
|
1
|
|
|
|
Benefit Plan Obligations as of December 31, 2012
|
4.29
|
%
|
(3,097
|
)
|
(857
|
)
|
3,243
|
|
902
|
|
|||||
|
Estimated 2013 Net Periodic Benefit Cost
|
4.29
|
%
|
14
|
|
1
|
|
(19
|
)
|
(2
|
)
|
|||||
See Note 14 to the Consolidated Financial Statements for more information on our pension and postretirement benefit plans.
Foreign Activities
Cross-border outstandings are defined as loans (including accrued interest), acceptances, interest-bearing deposits with other banks, other interest-bearing investments, and any other monetary assets which are denominated in dollars or other non-local currency. As of
December 31, 2012
,
2011
and
2010
, we did not have cross-border outstandings to any foreign country which exceeded 0.75% of our total assets.
We continue to monitor the debt crisis in Europe and the potential direct and indirect impact it may have on us. As of
December 31, 2012
, we had no direct exposure to sovereign European governments and our non-sovereign European exposures posed a low risk of loss to the Company. However, the U.S. and Hawaii economies and our customers may be adversely affected by future developments arising from the debt crisis in Europe, and, if our customers are, or the Hawaii economy is, so affected, it may have a negative effect on our business, financial condition, and results of operations.
37
Corporate Risk Profile
Managing risks is an essential part of successfully operating our business. Management believes that the most prominent risk exposures for the Company are credit risk, market risk, liquidity risk management, capital management, and operational risk.
Credit Risk
Credit risk is defined as the risk that borrowers or counterparties will be unable or unwilling to repay their obligations in accordance with the underlying contractual terms. We manage and control risk in the loan and lease portfolio by adhering to well-defined underwriting criteria and account administration standards established by management. Written credit policies document underwriting standards, approval levels, exposure limits, and other limits or standards deemed necessary and prudent. Portfolio diversification at the obligor, industry, product, and/or geographic location levels is actively managed to mitigate concentration risk. In addition, credit risk management also includes an independent credit review process that assesses compliance with commercial and consumer credit policies, risk ratings, and other critical credit information. In addition to implementing risk management practices that are based upon established and sound lending practices, we adhere to sound credit principles. We understand and evaluate our customers' borrowing needs and capacity to repay, in conjunction with their character and history.
Commercial and industrial loans are made primarily for the purpose of financing equipment acquisition, expansion, working capital, and other general business purposes. Lease financing consists of direct financing leases and leveraged leases and are used by commercial customers to finance capital purchases ranging from computer equipment to transportation equipment. The credit decisions for these transactions are based upon an assessment of the overall financial capacity of the applicant. A determination is made as to the applicant's ability to repay in accordance with the proposed terms as well as an overall assessment of the risks involved. In addition to an evaluation of the applicant's financial condition, a determination is made of the probable adequacy of the primary and secondary sources of repayment, such as additional collateral or personal guarantees, to be relied upon in the transaction. Credit agency reports of the applicant's credit history supplement the analysis of the applicant's creditworthiness.
Commercial mortgages and construction loans are offered to real estate investors, developers, builders, and owner-occupants primarily domiciled in Hawaii. These loans are secured by first mortgages on real estate at loan-to-value ("LTV") ratios deemed appropriate based on the property type, location, overall quality, and sponsorship. Generally, these LTV ratios do not exceed 75%. The commercial properties are predominantly developments such as retail centers, apartments, industrial properties and, to a lesser extent, more specialized properties such as hotels. Substantially all of our commercial mortgage loans are secured by properties located in our primary market area.
In the underwriting of our commercial mortgage loans, we obtain appraisals for the underlying properties. Decisions to lend are based on the economic fundamentals of the property and the creditworthiness of the borrower. In evaluating a proposed commercial mortgage loan, we primarily emphasize the ratio of the property's projected net cash flows to the loan's debt service requirement. The debt service coverage ratio normally is not less than 120% and it is computed after deduction for a vacancy factor and property expenses as appropriate. In addition, a personal guarantee of the loan or a portion thereof is sometimes required from the principal(s) of the borrower. We typically require title insurance insuring the priority of our lien, fire, and extended coverage casualty insurance, and flood insurance, if appropriate, in order to protect our security interest in the underlying property. In addition, business interruption insurance or other insurance may be required. Owner-occupant commercial mortgage loans are underwritten based upon the cash flow of the business provided that the real estate asset is utilized in the operation of the business. Real estate is evaluated independently as a secondary source of repayment. As noted above, LTV ratios generally do not exceed 75%.
Construction loans are underwritten against projected cash flows derived from rental income, business income from an owner-occupant, or the sale of the property to an end-user. We may mitigate the risks associated with these types of loans by requiring fixed-price construction contracts, performance and payment bonding, controlled disbursements, and pre-sale contracts or pre-lease agreements.
We offer a variety of first mortgage and junior lien loans to consumers within our markets with residential home mortgages comprising our largest loan category. These loans are secured by a primary residence and are underwritten using traditional underwriting systems to assess the credit risks and financial capacity and repayment ability of the consumer. Decisions are primarily based on LTV ratios, debt-to-income ("DTI") ratios, liquidity, and credit scores. LTV ratios generally do not exceed 80%, although higher levels are permitted with mortgage insurance. We offer variable rate mortgage loans with interest rates that are subject to change every year after the first, third, fifth, or seventh year, depending on the product and are based on the London Interbank Offered Rate ("LIBOR"). Variable rate mortgage loans are underwritten at fully-indexed interest rates. Non-traditional
38
product offerings such as interest-only facilities are underwritten using a fully amortizing payment. We do not offer payment-option facilities, sub-prime or Alt-A loans, or any product with negative amortization.
On January 10, 2013, the Consumer Financial Protection Bureau (the "CFPB") issued a final rule to ensure that prospective consumers have the ability-to-repay their residential mortgage loans prior to financial institutions extending them credit. The final rule, which will be effective January 2014, describes certain minimum requirements for financial institutions in making ability-to-repay determinations. In underwriting a residential mortgage loan, lenders will be required to consider among other factors the borrower's current or reasonably expected income or assets, current employment status, current debt obligations, DTI ratios, and the credit history of the borrower. Lenders will be presumed to have complied with the ability-to-repay rule (“safe harbor”) if they issue “Qualified Mortgages” which must meet certain criteria including the general guideline that the DTI ratio may not exceed 43%. Loans that meet these criteria will be considered "Qualified Mortgages," and as a result will generally protect lenders from fines or litigation in the event of foreclosure. The final rule, as issued by the CFPB, is not expected to have a material impact on our lending activities and on our statements of income or condition.
Home equity loans are secured primarily by second mortgages on residential property of the borrower. The underwriting terms for the home equity product generally permits borrowing availability, in the aggregate, up to 80% of the value of the collateral property at the time of origination. We offer fixed and variable rate home equity loans, with variable rate loans underwritten at fully-indexed interest rates. Our procedures for underwriting home equity loans include an assessment of an applicant's overall financial capacity and repayment ability. Decisions are primarily based on LTV ratios, DTI ratios, and credit scores. We do not offer home equity loan products with reduced documentation.
Automobile lending activities include loans and leases secured by new or used automobiles. We originate automobile loans and leases on an indirect basis through selected dealerships. Our procedures for underwriting automobile loans include an assessment of an applicant's overall financial capacity and repayment ability, credit history, and the ability to meet existing obligations and payments on the proposed loan. Although an applicant's creditworthiness is the primary consideration, the underwriting process also includes a comparison of the value of the collateral security to the proposed loan amount. We require borrowers to maintain full coverage automobile insurance on automobile loans and leases, with the Bank listed as either the loss payee or additional insured.
Our overall credit risk position reflects an improving Hawaii economy, with decreasing levels of higher risk loans and leases, criticized and classified loans and leases, and credit losses compared to 2011. The tourism industry is leading the economic recovery in Hawaii with increases in visitor arrivals and spending. The statewide seasonally-adjusted unemployment rate continued to decline during the fourth quarter of 2012 as well. The underlying risk profile of our lending portfolio continued to improve in 2012 as a result of these improvements in economic trends and credit quality trends in our portfolio.
Higher Risk Loans and Leases
Although asset quality has improved in recent years, we remain vigilant in light of the uncertainties in the U.S. economy as well as concerns related to specific segments of our lending portfolio that present a higher risk profile. As of December 31, 2012, the higher risk segments within our loan and lease portfolio continue to be concentrated in residential land loans, certain home equity loans, and air transportation leases. In addition, loans and leases based on Hawaiian islands other than Oahu (the "neighbor islands") may present a higher risk profile as the neighbor islands have continued to experience higher levels of unemployment and have shown signs of slower economic recovery when compared to Oahu.
Table 12 summarizes the amount of our loan and lease portfolio that demonstrate a higher risk profile. The Allowance associated with these higher risk loans and leases is consistent with our methodologies for each of the respective loan or lease classes. These higher risk loans and leases have been considered in our quarterly evaluation of the adequacy of the Allowance.
|
Higher Risk Loans and Leases Outstanding
|
Table 12
|
||||||
|
December 31,
|
|||||||
|
(dollars in thousands)
|
2012
|
|
2011
|
|
|||
|
Residential Land Loans
|
$
|
14,984
|
|
$
|
18,163
|
|
|
|
Home Equity Loans
|
19,914
|
|
21,413
|
|
|||
|
Air Transportation Leases
|
27,782
|
|
36,144
|
|
|||
|
Total
|
$
|
62,680
|
|
$
|
75,720
|
|
|
39
As of December 31, 2012, our higher risk loans and leases outstanding decreased by $13.0 million or 17% from December 31, 2011.
We previously reported a segment of our residential home building loans as representing a higher risk profile. However, as of December 31, 2012, this segment of our residential home building loans has significantly decreased and now represents an exposure of approximately $1.0 million due to payments and improved borrower financial performance. As such, we no longer consider this segment of our residential home building loans to be a reportable higher risk loan segment.
Residential land loans in our residential mortgage portfolio consist of consumer loans secured by unimproved lots. These loans often represent higher risk due to the volatility in the value of the underlying collateral. Our residential land loan portfolio was $15.0 million as of December 31, 2012, of which $12.9 million related to properties on the neighbor islands. The decrease in our higher risk exposure in this portfolio in 2012 was primarily due to $2.9 million in payments and $0.3 million in gross loan charge-offs. Residential land loans are collectively evaluated for impairment in connection with the evaluation of our residential mortgage portfolio. As of December 31, 2012, there were five residential land loans that were modified as troubled debt restructurings, however the specific Allowance associated with these loans was nominal as they were charged-down to fair value at the time of restructuring. As of December 31, 2012, there was one residential land loan that was 90 days past due as to principal or interest.
The higher risk segment within our Hawaii home equity lending portfolio was $19.9 million or 3% of our total home equity loans outstanding as of December 31, 2012. The higher risk segment within our Hawaii home equity portfolio includes those loans originated in 2005 or later, with current monitoring credit scores below 600, and with original LTV ratios greater than 70%. The decrease in our higher risk exposure in this portfolio segment in 2012 was primarily due to improved credit score migration from our Oahu owner occupants, which account for 67% of this higher risk segment. Higher risk loans in our Hawaii home equity portfolio are collectively evaluated for impairment in connection with the evaluation of our entire home equity portfolio. As of December 31, 2012, there was no specific Allowance associated with the remaining balance of our higher risk home equity loans. As of December 31, 2012, our higher risk home equity loans had a 90 day past due delinquency ratio of 5.2%. In 2012, $3.0 million or 45% of our gross charge-offs of home equity loans were from our higher risk segment.
We consider all of our air transportation leases to be of higher risk due to the volatile financial profile of the industry. Domestic air transportation carriers continue to demonstrate a higher risk profile due to fuel costs, pension plan obligations, consumer demand, and marginal pricing power. Carriers are migrating to newer generations of more fuel efficient fleets, which are negatively impacting older generation aircraft valuations. We believe that these risks, coupled with a slowly recovering economy, could place additional pressure on the financial health of air transportation carriers for the foreseeable future. As of December 31, 2012, included in our commercial leasing portfolio were four leveraged leases on aircraft that were originated in the 1990's and prior. Outstanding credit exposure related to our air transportation leases was $27.8 million as of December 31, 2012, a decrease of $8.4 million or 23% compared to the balance as of December 31, 2011. In 2012, we sold one aircraft and terminated the lease, and transferred one aircraft to equipment held for sale, a component of other assets, at the lease termination date. This aircraft has since been dismantled and its parts are being sold. These two transactions decreased our higher risk air transportation exposure by $8.6 million, which had a related Allowance of $3.4 million. As of December 31, 2012, the Allowance associated with the remaining balance of our air transportation leases was $12.7 million or 46% of outstanding balances, a decrease of $10.4 million from December 31, 2011. In 2012, there were no delinquencies in our air transportation leasing portfolio and no charge-offs were recorded.
40
Non-Performing Assets and Accruing Loans and Leases Past Due 90 Days or More
Table 13 presents a five-year history of non-performing assets and accruing loans and leases past due 90 days or more.
|
Non-Performing Assets and Accruing Loans and Leases Past Due 90 Days or More
|
Table 13
|
||||||||||||||||||
|
December 31,
|
|||||||||||||||||||
|
(dollars in thousands)
|
2012
|
|
2011
|
|
2010
|
|
2009
|
|
2008
|
|
|||||||||
|
Non-Performing Assets
1
|
|||||||||||||||||||
|
Non-Accrual Loans and Leases
|
|||||||||||||||||||
|
Commercial
|
|||||||||||||||||||
|
Commercial and Industrial
|
$
|
5,534
|
|
$
|
6,243
|
|
$
|
1,642
|
|
$
|
6,646
|
|
$
|
3,869
|
|
||||
|
Commercial Mortgage
|
3,030
|
|
2,140
|
|
3,503
|
|
1,167
|
|
—
|
|
|||||||||
|
Construction
|
833
|
|
2,080
|
|
288
|
|
8,154
|
|
5,001
|
|
|||||||||
|
Lease Financing
|
—
|
|
5
|
|
19
|
|
631
|
|
133
|
|
|||||||||
|
Total Commercial
|
9,397
|
|
10,468
|
|
5,452
|
|
16,598
|
|
9,003
|
|
|||||||||
|
Consumer
|
|||||||||||||||||||
|
Residential Mortgage
|
21,725
|
|
25,256
|
|
28,152
|
|
19,893
|
|
3,904
|
|
|||||||||
|
Home Equity
|
2,074
|
|
2,024
|
|
2,254
|
|
5,153
|
|
1,614
|
|
|||||||||
|
Other
2
|
—
|
|
—
|
|
—
|
|
550
|
|
—
|
|
|||||||||
|
Total Consumer
|
23,799
|
|
27,280
|
|
30,406
|
|
25,596
|
|
5,518
|
|
|||||||||
|
Total Non-Accrual Loans and Leases
|
33,196
|
|
37,748
|
|
35,858
|
|
42,194
|
|
14,521
|
|
|||||||||
|
Non-Accrual Loans Held for Sale
|
—
|
|
—
|
|
—
|
|
3,005
|
|
—
|
|
|||||||||
|
Foreclosed Real Estate
|
3,887
|
|
3,042
|
|
1,928
|
|
3,132
|
|
428
|
|
|||||||||
|
Total Non-Performing Assets
|
$
|
37,083
|
|
$
|
40,790
|
|
$
|
37,786
|
|
$
|
48,331
|
|
$
|
14,949
|
|
||||
|
Accruing Loans and Leases Past Due 90 Days or More
|
|||||||||||||||||||
|
Commercial
|
|||||||||||||||||||
|
Commercial and Industrial
|
$
|
27
|
|
$
|
1
|
|
$
|
—
|
|
$
|
623
|
|
$
|
6,785
|
|
||||
|
Lease Financing
|
—
|
|
—
|
|
—
|
|
120
|
|
268
|
|
|||||||||
|
Total Commercial
|
27
|
|
1
|
|
—
|
|
743
|
|
7,053
|
|
|||||||||
|
Consumer
|
|||||||||||||||||||
|
Residential Mortgage
|
6,908
|
|
6,422
|
|
5,399
|
|
8,979
|
|
4,192
|
|
|||||||||
|
Home Equity
|
2,701
|
|
2,194
|
|
1,067
|
|
2,210
|
|
1,077
|
|
|||||||||
|
Automobile
|
186
|
|
170
|
|
410
|
|
875
|
|
743
|
|
|||||||||
|
Other
2
|
587
|
|
435
|
|
707
|
|
886
|
|
1,134
|
|
|||||||||
|
Total Consumer
|
10,382
|
|
9,221
|
|
7,583
|
|
12,950
|
|
7,146
|
|
|||||||||
|
Total Accruing Loans and Leases
Past Due 90 Days or More
|
$
|
10,409
|
|
$
|
9,222
|
|
$
|
7,583
|
|
$
|
13,693
|
|
$
|
14,199
|
|
||||
|
Restructured Loans on Accrual Status
and Not Past Due 90 Days or More
|
$
|
31,844
|
|
$
|
33,703
|
|
$
|
23,724
|
|
$
|
7,274
|
|
$
|
—
|
|
||||
|
Total Loans and Leases
|
$
|
5,854,521
|
|
$
|
5,538,304
|
|
$
|
5,335,792
|
|
$
|
5,759,785
|
|
$
|
6,530,233
|
|
||||
|
Ratio of Non-Accrual Loans and Leases to
Total Loans and Leases
|
0.57
|
%
|
0.68
|
%
|
0.67
|
%
|
0.73
|
%
|
0.22
|
%
|
|||||||||
|
Ratio of Non-Performing Assets to Total Loans and Leases
and Foreclosed Real Estate
|
0.63
|
%
|
0.74
|
%
|
0.71
|
%
|
0.84
|
%
|
0.23
|
%
|
|||||||||
|
Ratio of Commercial Non-Performing Assets to
Total Commercial Loans and Leases
and Commercial Foreclosed Real Estate
|
0.45
|
%
|
0.56
|
%
|
0.31
|
%
|
1.04
|
%
|
0.37
|
%
|
|||||||||
|
Ratio of Consumer Non-Performing Assets to
Total Consumer Loans and Leases
and Consumer Foreclosed Real Estate
|
0.75
|
%
|
0.85
|
%
|
0.95
|
%
|
0.72
|
%
|
0.14
|
%
|
|||||||||
|
Ratio of Non-Performing Assets and Accruing
Loans and Leases Past Due 90 Days or More to
Total Loans and Leases and Foreclosed Real Estate
|
0.81
|
%
|
0.90
|
%
|
0.85
|
%
|
1.08
|
%
|
0.45
|
%
|
|||||||||
1
Excluded from non-performing assets were contractually binding non-accrual loans held for sale of $4.2 million as of December 31, 2009.
2
Comprised of other revolving credit, installment, and lease financing.
41
Table 14 presents the activity in Non-Performing Assets ("NPAs") for
2012
:
|
Non-Performing Assets
(dollars in thousands)
|
Table 14
|
|
|
|
Balance at Beginning of Year
|
$
|
40,790
|
|
|
Additions
|
19,623
|
|
|
|
Reductions
|
|||
|
Payments
|
(11,868
|
)
|
|
|
Return to Accrual Status
|
(4,431
|
)
|
|
|
Sales of Foreclosed Real Estate
|
(5,074
|
)
|
|
|
Charge-offs/Write-downs
|
(1,957
|
)
|
|
|
Total Reductions
|
(23,330
|
)
|
|
|
Balance at End of Year
|
$
|
37,083
|
|
NPAs are comprised of non-accrual loans and leases, and foreclosed real estate. Our NPAs were $37.1 million as of December 31, 2012, compared to $40.8 million as of December 31, 2011. This decrease was primarily due to a $3.5 million reduction in residential mortgage non-accrual loans. The largest component of our NPAs continues to be centered in residential mortgage loans, which generally take longer to resolve through the judicial foreclosure process. The ratio of our non-accrual loans and leases to total loans and leases was 0.57% as of December 31, 2012, an 11 basis point improvement from December 31, 2011.
Commercial and industrial non-accrual loans decreased by $0.7 million from December 31, 2011 to $5.5 million as of December 31, 2012, primarily due to payments. As of December 31, 2012, three commercial borrowers comprised over 99% of the non-accrual balance. We have evaluated these loans for impairment and have recorded partial charge-offs totaling $5.3 million on two of these loans.
Commercial mortgage non-accrual loans increased by $0.9 million from December 31, 2011 to $3.0 million as of December 31, 2012. This increase was due to the addition of three loans. As of December 31, 2012, the balance consists of six borrowers. We have evaluated these loans for impairment and have recorded a partial charge-off of $0.5 million on one of the loans.
Construction non-accrual loans decreased by $1.2 million from December 31, 2011 to $0.8 million as of December 31, 2012. This decrease was primarily due to $0.9 million in payments and $0.3 million in partial charge-offs related to one construction loan. In January 2013, this loan was sold and we fully recovered the amount partially charged-off.
Residential mortgage non-accrual loans decreased by $3.5 million from December 31, 2011 to $21.7 million as of December 31, 2012, primarily due to $8.9 million in payments, partially offset by $7.6 million in additions to non-accrual status. Residential mortgage non-accrual loans remain at elevated levels due mainly to the timeframe required to complete a judiciary foreclosure. As of December 31, 2012, our residential mortgage non-accrual loans were comprised of 59 loans with a weighted average current LTV ratio of 78%.
Foreclosed real estate represents property acquired as the result of borrower defaults on loans. Foreclosed real estate is recorded at fair value, less estimated selling costs, at the time of foreclosure. On an ongoing basis, properties are appraised as required by market indications and applicable regulations. Foreclosed real estate increased by $0.8 million from December 31, 2011 to $3.9 million as of December 31, 2012. This increase was primarily due to the foreclosure of residential properties in 2012. As of December 31, 2012, included in foreclosed real estate are one commercial property and eight residential properties, six of which are located in the State of Hawaii. Five of the residential properties were sold in 2013 resulting in a nominal gain.
Impaired loans are defined as those which we believe it is probable we will not collect all amounts due according to the contractual terms of the loan agreement, as well as those loans whose terms have been modified in a troubled debt restructuring (“TDR”). Impaired loans were $50.6 million as of December 31, 2012, compared to $47.6 million as of December 31, 2011. Impaired loans had a related Allowance of $3.7 million as of December 31, 2012 and $5.5 million as of December 31, 2011. As of December 31, 2012, we have recorded charge-offs of $12.7 million related to our impaired loans.
If interest due on the balances of all non-accrual loans as of December 31, 2012 had been accrued under the original terms, approximately $3.4 million in total interest income would have been recorded in 2012, compared to the $0.1 million recorded as interest income on those loans.
42
Loans and Leases Past Due 90 Days or More and Still Accruing Interest
Loans and leases that are 90 days or more past due, as to principal or interest, and still accruing interest are in this category because they are well secured and in the process of collection. Loans and leases past due 90 days or more and still accruing interest were $10.4 million as of December 31, 2012, an increase of $1.2 million or 13% from December 31, 2011. This increase was primarily in our residential mortgage and home equity portfolios.
Loans Modified in a Troubled Debt Restructuring
Table 15 presents information on loans whose terms have been modified in a TDR.
|
Loans Modified in a Troubled Debt Restructuring
|
Table 15
|
|
|||||
|
(dollars in thousands)
|
2012
|
|
2011
|
|
|||
|
Commercial
|
|||||||
|
Commercial and Industrial
|
$
|
4,319
|
|
$
|
5,116
|
|
|
|
Commercial Mortgage
|
1,032
|
|
1,249
|
|
|||
|
Construction
|
833
|
|
—
|
|
|||
|
Total Commercial
|
6,184
|
|
6,365
|
|
|||
|
Consumer
|
|
|
|||||
|
Residential Mortgage
|
29,036
|
|
25,726
|
|
|||
|
Home Equity
|
—
|
|
21
|
|
|||
|
Automobile
|
5,641
|
|
6,190
|
|
|||
|
Other
1
|
282
|
|
528
|
|
|||
|
Total Consumer
|
34,959
|
|
32,465
|
|
|||
|
Total
|
$
|
41,143
|
|
$
|
38,830
|
|
|
1
Comprised of other revolving credit and installment financing.
We had loans whose terms had been modified in a TDR of $41.1 million as of December 31, 2012, an increase of $2.3 million or 6% compared to the balance as of December 31, 2011. This increase was primarily due to a $3.3 million increase in modified residential mortgage loans. We continue to work with customers to modify their loans if they are experiencing financial difficulties. See Note 4 to the Consolidated Financial Statements for a description of the modification programs that we currently offer to our customers.
43
Reserve for Credit Losses
The Company's reserve for credit losses is comprised of two components, the Allowance and the reserve for unfunded commitments (the "Unfunded Reserve"). Table 16 presents the activity in the Company's reserve for credit losses for the years ended December 31:
|
Reserve for Credit Losses
|
Table 16
|
||||||||||||||||||
|
(dollars in thousands)
|
2012
|
|
2011
|
|
2010
|
|
2009
|
|
2008
|
|
|||||||||
|
Balance at Beginning of Period
|
$
|
144,025
|
|
$
|
152,777
|
|
$
|
149,077
|
|
$
|
128,667
|
|
$
|
96,167
|
|
||||
|
Loans and Leases Charged-Off
|
|||||||||||||||||||
|
Commercial
|
|||||||||||||||||||
|
Commercial and Industrial
|
(3,617
|
)
|
(8,112
|
)
|
(21,125
|
)
|
(26,641
|
)
|
(8,059
|
)
|
|||||||||
|
Commercial Mortgage
|
—
|
|
—
|
|
(2,048
|
)
|
(2,092
|
)
|
—
|
|
|||||||||
|
Construction
|
(330
|
)
|
—
|
|
(2,274
|
)
|
(10,360
|
)
|
(1,932
|
)
|
|||||||||
|
Lease Financing
|
—
|
|
—
|
|
(500
|
)
|
(14,022
|
)
|
(304
|
)
|
|||||||||
|
Consumer
|
|||||||||||||||||||
|
Residential Mortgage
|
(4,408
|
)
|
(8,174
|
)
|
(12,139
|
)
|
(7,768
|
)
|
(723
|
)
|
|||||||||
|
Home Equity
|
(6,717
|
)
|
(10,853
|
)
|
(15,052
|
)
|
(12,722
|
)
|
(2,530
|
)
|
|||||||||
|
Automobile
|
(2,082
|
)
|
(3,229
|
)
|
(6,425
|
)
|
(9,903
|
)
|
(11,236
|
)
|
|||||||||
|
Other
1
|
(7,005
|
)
|
(6,392
|
)
|
(10,315
|
)
|
(13,233
|
)
|
(10,564
|
)
|
|||||||||
|
Total Loans and Leases Charged-Off
|
(24,159
|
)
|
(36,760
|
)
|
(69,878
|
)
|
(96,741
|
)
|
(35,348
|
)
|
|||||||||
|
Recoveries on Loans and Leases Previously Charged-Off
|
|||||||||||||||||||
|
Commercial
|
|||||||||||||||||||
|
Commercial and Industrial
|
3,939
|
|
2,434
|
|
2,082
|
|
1,211
|
|
1,634
|
|
|||||||||
|
Commercial Mortgage
|
67
|
|
538
|
|
68
|
|
45
|
|
—
|
|
|||||||||
|
Construction
|
8
|
|
—
|
|
7,321
|
|
476
|
|
—
|
|
|||||||||
|
Lease Financing
|
177
|
|
3,528
|
|
158
|
|
131
|
|
10
|
|
|||||||||
|
Consumer
|
|||||||||||||||||||
|
Residential Mortgage
|
2,820
|
|
2,152
|
|
1,544
|
|
1,059
|
|
175
|
|
|||||||||
|
Home Equity
|
1,335
|
|
1,695
|
|
1,597
|
|
364
|
|
108
|
|
|||||||||
|
Automobile
|
1,931
|
|
2,479
|
|
3,128
|
|
3,153
|
|
2,817
|
|
|||||||||
|
Other
1
|
3,154
|
|
2,492
|
|
2,393
|
|
2,584
|
|
2,589
|
|
|||||||||
|
Total Recoveries on Loans and Leases
Previously Charged-Off |
13,431
|
|
15,318
|
|
18,291
|
|
9,023
|
|
7,333
|
|
|||||||||
|
Net Loans and Leases Charged-Off
|
(10,728
|
)
|
(21,442
|
)
|
(51,587
|
)
|
(87,718
|
)
|
(28,015
|
)
|
|||||||||
|
Provision for Credit Losses
|
979
|
|
12,690
|
|
55,287
|
|
107,878
|
|
60,515
|
|
|||||||||
|
Provision for Unfunded Commitments
|
—
|
|
—
|
|
—
|
|
250
|
|
—
|
|
|||||||||
|
Balance at End of Period
2
|
$
|
134,276
|
|
$
|
144,025
|
|
$
|
152,777
|
|
$
|
149,077
|
|
$
|
128,667
|
|
||||
|
Components
|
|||||||||||||||||||
|
Allowance for Loan and Lease Losses
|
$
|
128,857
|
|
$
|
138,606
|
|
$
|
147,358
|
|
$
|
143,658
|
|
$
|
123,498
|
|
||||
|
Reserve for Unfunded Commitments
|
5,419
|
|
5,419
|
|
5,419
|
|
5,419
|
|
5,169
|
|
|||||||||
|
Total Reserve for Credit Losses
|
$
|
134,276
|
|
$
|
144,025
|
|
$
|
152,777
|
|
$
|
149,077
|
|
$
|
128,667
|
|
||||
|
Average Loans and Leases Outstanding
|
$
|
5,680,279
|
|
$
|
5,349,938
|
|
$
|
5,472,534
|
|
$
|
6,144,976
|
|
$
|
6,542,178
|
|
||||
|
Ratio of Net Loans and Leases Charged-Off to
Average Loans and Leases Outstanding
|
0.19
|
%
|
0.40
|
%
|
0.94
|
%
|
1.43
|
%
|
0.43
|
%
|
|||||||||
|
Ratio of Allowance for Loan and Lease Losses to
Loans and Leases Outstanding |
2.20
|
%
|
2.50
|
%
|
2.76
|
%
|
2.49
|
%
|
1.89
|
%
|
|||||||||
|
1
|
Comprised of other revolving credit, installment, and lease financing.
|
|
2
|
Included in this analysis is activity related to the Company's reserve for unfunded commitments, which is separately recorded in other liabilities in the statements of condition.
|
44
Allowance for Loan and Lease Losses
Table 17 presents the allocation of the Allowance by loan and lease category.
|
Allocation of Allowance for Loan and Lease Losses
|
Table 17
|
||||||||||||||||||
|
(dollars in thousands)
|
2012
|
|
2011
|
|
2010
|
|
2009
|
|
2008
|
|
|||||||||
|
Commercial
|
|||||||||||||||||||
|
Commercial and Industrial
|
$
|
20,724
|
|
$
|
23,865
|
|
$
|
26,343
|
|
$
|
24,551
|
|
$
|
31,183
|
|
||||
|
Commercial Mortgage
|
33,182
|
|
25,900
|
|
26,634
|
|
25,559
|
|
14,119
|
|
|||||||||
|
Construction
|
3,592
|
|
5,326
|
|
5,691
|
|
4,499
|
|
6,227
|
|
|||||||||
|
Lease Financing
|
15,206
|
|
25,471
|
|
22,309
|
|
27,698
|
|
43,091
|
|
|||||||||
|
Total Commercial
|
72,704
|
|
80,562
|
|
80,977
|
|
82,307
|
|
94,620
|
|
|||||||||
|
Consumer
|
|||||||||||||||||||
|
Residential Mortgage
|
18,063
|
|
18,758
|
|
18,063
|
|
13,884
|
|
4,443
|
|
|||||||||
|
Home Equity
|
24,261
|
|
27,232
|
|
29,838
|
|
28,877
|
|
4,814
|
|
|||||||||
|
Automobile
|
2,370
|
|
2,646
|
|
5,579
|
|
7,349
|
|
10,992
|
|
|||||||||
|
Other
1
|
11,459
|
|
9,408
|
|
12,901
|
|
11,241
|
|
8,629
|
|
|||||||||
|
Total Consumer
|
56,153
|
|
58,044
|
|
66,381
|
|
61,351
|
|
28,878
|
|
|||||||||
|
Total Allocation of Allowance for Loan and Lease Losses
|
$
|
128,857
|
|
$
|
138,606
|
|
$
|
147,358
|
|
$
|
143,658
|
|
$
|
123,498
|
|
||||
|
2012
|
2011
|
2010
|
2009
|
2008
|
|||||||||||||||||||||||||
|
Alloc.
Allow. as % of loan or lease category |
|
Loan
category as % of total loans and leases |
|
Alloc.
Allow. as % of loan or lease category |
|
Loan
category as % of total loans and leases |
|
Alloc.
Allow. as % of loan or lease category |
|
Loan
category as % of total loans and leases |
|
Alloc.
Allow. as % of loan or lease category |
|
Loan
category as % of total loans and leases |
|
Alloc.
Allow. as % of loan or lease category |
|
Loan
category as % of total loans and leases |
|
||||||||||
|
Commercial
|
|||||||||||||||||||||||||||||
|
Commercial and Industrial
|
2.50
|
%
|
14.17
|
%
|
2.92
|
%
|
14.75
|
%
|
3.41
|
%
|
14.48
|
%
|
3.09
|
%
|
13.81
|
%
|
2.96
|
%
|
16.14
|
%
|
|||||||||
|
Commercial Mortgage
|
3.02
|
|
18.74
|
|
2.76
|
|
16.94
|
|
3.08
|
|
16.18
|
|
3.04
|
|
14.61
|
|
1.91
|
|
11.34
|
|
|||||||||
|
Construction
|
3.15
|
|
1.95
|
|
5.40
|
|
1.78
|
|
7.09
|
|
1.50
|
|
4.15
|
|
1.88
|
|
4.04
|
|
2.36
|
|
|||||||||
|
Lease Financing
|
5.53
|
|
4.70
|
|
8.17
|
|
5.63
|
|
6.66
|
|
6.28
|
|
6.71
|
|
7.17
|
|
9.20
|
|
7.17
|
|
|||||||||
|
Total Commercial
|
3.14
|
|
39.56
|
|
3.72
|
|
39.10
|
|
3.95
|
|
38.44
|
|
3.81
|
|
37.47
|
|
3.92
|
|
37.01
|
|
|||||||||
|
Consumer
|
|||||||||||||||||||||||||||||
|
Residential Mortgage
|
0.77
|
|
40.14
|
|
0.85
|
|
40.01
|
|
0.86
|
|
39.25
|
|
0.63
|
|
38.03
|
|
0.18
|
|
37.70
|
|
|||||||||
|
Home Equity
|
3.15
|
|
13.16
|
|
3.49
|
|
14.10
|
|
3.70
|
|
15.13
|
|
3.13
|
|
16.00
|
|
0.47
|
|
15.82
|
|
|||||||||
|
Automobile
|
1.13
|
|
3.58
|
|
1.37
|
|
3.48
|
|
2.67
|
|
3.92
|
|
2.59
|
|
4.93
|
|
2.97
|
|
5.66
|
|
|||||||||
|
Other
1
|
5.50
|
|
3.56
|
|
5.14
|
|
3.31
|
|
7.42
|
|
3.26
|
|
5.47
|
|
3.57
|
|
3.47
|
|
3.81
|
|
|||||||||
|
Total Consumer
|
1.59
|
|
60.44
|
|
1.72
|
|
60.90
|
|
2.02
|
|
61.56
|
|
1.70
|
|
62.53
|
|
0.70
|
|
62.99
|
|
|||||||||
|
Total
|
2.20
|
%
|
100.00
|
%
|
2.50
|
%
|
100.00
|
%
|
2.76
|
%
|
100.00
|
%
|
2.49
|
%
|
100.00
|
%
|
1.89
|
%
|
100.00
|
%
|
|||||||||
1
Comprised of other revolving credit, installment, and lease financing.
Based on our ongoing assessment of credit quality of the loan and lease portfolio and the current economic environment, our Allowance was $128.9 million as of December 31, 2012, a decrease of $9.7 million or 7% from December 31, 2011. The ratio of the Allowance to total loans and leases outstanding was 2.20%, a 30 basis point decrease from December 31, 2011. The decrease in the ratio of the Allowance to total loans and leases in 2012 was commensurate with improvements in credit quality and an improving economy in Hawaii. With continued improvement in the Hawaii economy and in our credit quality, including reductions in our higher risk loan and lease segments, we may require a lower level of the Allowance in future periods.
Net loan and lease charge-offs were $10.7 million or 0.19% of total average loans and leases in 2012, a decrease from $21.4 million or 0.40% of total average loans and leases in 2011. Net loans and leases charged-off decreased in all of our commercial and consumer lending portfolios, except the construction portfolio, during 2012. Commercial net recoveries were $0.2 million in 2012, primarily resulting from a lower level of charge-offs in our commercial and industrial portfolio. Consumer net charge-offs were $11.0 million in 2012, a decrease of $8.8 million from 2011. This decrease was primarily in our residential mortgage and home equity portfolios.
45
The components of the Allowance, including the allocation between commercial and consumer categories is based on an evaluation of individual credits, historical loan and lease loss experience, management's evaluation of the current loan portfolio, and current economic conditions.
The allocation of the Allowance to our commercial portfolio segment decreased by $7.9 million or 10% from December 31, 2011 primarily due to a reduction in our allocation to our air transportation lease exposure. Relative to our total loan and lease portfolio, our domestic air transportation leases continue to demonstrate a higher risk profile as evidenced by recent airline bankruptcies and continued high fuel prices. We have decreased the allocation of the Allowance to all classes of our commercial portfolio segment, except commercial mortgage, due to lower portfolio segment risk. The increase in the allocation to the commercial mortgage class was primarily due to portfolio growth.
The allocation of the Allowance to our consumer portfolio segment decreased by $1.9 million or 3% from December 31, 2011 primarily due to lower levels of risk across all classes in this portfolio segment. However, we increased our allocation of the Allowance to our other consumer class of loans and leases by $2.1 million or 22% from December 31, 2011 primarily due to the recent announcement of planned branch closures in American Samoa and past experience with increased delinquencies and defaults from similar closures. See Note 4 to the Consolidated Financial Statements for more information on the Allowance and credit quality indicators.
Reserve for Unfunded Commitments
The Unfunded Reserve was $5.4 million as of
December 31, 2012
, unchanged from
December 31, 2011
. The process used to determine the Unfunded Reserve is consistent with the process for determining the Allowance, as adjusted for estimated funding probabilities or loan and lease equivalency factors.
Market Risk
Market risk is the potential of loss arising from adverse changes in interest rates and prices. We are exposed to market risk as a consequence of the normal course of conducting our business activities. Our market risk management process involves measuring, monitoring, controlling, and mitigating risks that can significantly impact our statements of income and condition. In this management process, market risks are balanced with expected returns in an effort to enhance earnings performance, while limiting volatility.
Our primary market risk exposure is interest rate risk.
Interest Rate Risk
The objective of our interest rate risk management process is to maximize net interest income while operating within acceptable limits established for interest rate risk and maintaining adequate levels of funding and liquidity. The potential cash flows, sales, or replacement value of many of our assets and liabilities, especially those that earn or pay interest, are sensitive to changes in the general level of interest rates. This interest rate risk arises primarily from our normal business activities of gathering deposits and extending loans.
Many factors affect our exposure to changes in interest rates, such as general economic and financial conditions, customer preferences, historical pricing relationships, and repricing characteristics of financial instruments. Our earnings are affected not only by general economic conditions, but also by the monetary and fiscal policies of the U.S. and its agencies, particularly the FRB. The monetary policies of the FRB can influence the overall growth of loans, investment securities, and deposits and the level of interest rates earned on assets and paid for liabilities. The nature and impact of future changes in monetary policies are generally not predictable.
In managing interest rate risk, we, through the Asset/Liability Management Committee ("ALCO"), measure short and long-term sensitivities to changes in interest rates. The ALCO, which is comprised of members of executive management, utilizes several techniques to manage interest rate risk, which include:
|
•
|
adjusting the balance sheet mix or altering the interest rate characteristics of assets and liabilities;
|
|
•
|
changing product pricing strategies;
|
|
•
|
modifying characteristics of the investment securities portfolio; or
|
|
•
|
using derivative financial instruments.
|
46
The use of derivative financial instruments, as detailed in Note 17 to the Consolidated Financial Statements, has generally been limited. This is due to natural on-balance sheet hedges arising out of offsetting interest rate exposures from loans and investment securities with deposits and other interest-bearing liabilities. In particular, the investment securities portfolio is utilized to manage the interest rate exposure and sensitivity to within the guidelines and limits established by the ALCO. We utilize natural and offsetting economic hedges in an effort to reduce the need to employ off-balance sheet derivative financial instruments to hedge interest rate risk exposures. Expected movements in interest rates are also considered in managing interest rate risk. Thus, as interest rates change, we may use different techniques to manage interest rate risk.
A key element in our ongoing process to measure and monitor interest rate risk is the utilization of an asset/liability simulation model that attempts to capture the dynamic nature of the balance sheet. The model is used to estimate and measure the balance sheet sensitivity to changes in interest rates. These estimates are based on assumptions on the behavior of loan and deposit pricing, repayment rates on mortgage-based assets, and principal amortization and maturities on other financial instruments. The model's analytics include the effects of standard prepayment options on mortgages and customer withdrawal options for deposits. While such assumptions are inherently uncertain, we believe that these assumptions are reasonable.
We utilize net interest income simulations to analyze short-term income sensitivities to changes in interest rates. Table 18 presents, for the twelve months subsequent to December 31, 2012 and 2011, an estimate of the change in net interest income that would result from a gradual and immediate change in interest rates, moving in a parallel fashion over the entire yield curve, relative to the measured base case scenario. The base case scenario assumes that the balance sheet and interest rates are generally unchanged. Based on the net interest income simulation as of December 31, 2012, net interest income sensitivity to changes in interest rates as of December 31, 2012 was more sensitive to changes in interest rates compared to the sensitivity profile as of December 31, 2011. As a result of our strategy to maintain a relatively short investment portfolio duration, net interest income is expected to increase as interest rates rise. Economic conditions and government intervention continue to result in interest rates remaining relatively low.
|
Net Interest Income Sensitivity Profile
|
Table 18
|
||||||||||||
|
Impact on Future Annual Net Interest Income
|
|||||||||||||
|
(dollars in thousands)
|
December 31, 2012
|
December 31, 2011
|
|||||||||||
|
Gradual Change in Interest Rates (basis points)
|
|||||||||||||
|
+200
|
$
|
9,396
|
|
2.6
|
%
|
$
|
2,934
|
|
0.8
|
%
|
|||
|
+100
|
4,893
|
|
1.4
|
|
2,036
|
|
0.5
|
|
|||||
|
-100
|
(8,387
|
)
|
(2.4
|
)
|
(7,900
|
)
|
(2.0
|
)
|
|||||
|
Immediate Change in Interest Rates (basis points)
|
|||||||||||||
|
+200
|
$
|
26,050
|
|
7.3
|
%
|
$
|
10,086
|
|
2.6
|
%
|
|||
|
+100
|
14,449
|
|
4.1
|
|
7,226
|
|
1.9
|
|
|||||
|
-100
|
(25,931
|
)
|
(7.3
|
)
|
(25,750
|
)
|
(6.7
|
)
|
|||||
To analyze the impact of changes in interest rates in a more realistic manner, non-parallel interest rate scenarios are also simulated. These non-parallel interest rate scenarios indicate that net interest income may decrease from the base case scenario should the yield curve flatten or become inverted for a period of time. Conversely, if the yield curve should steepen, net interest income may increase.
Other Market Risks
In addition to interest rate risk, we are exposed to other forms of market risk in our normal business transactions. Foreign currency and foreign exchange contracts expose us to a small degree of foreign currency risk. These transactions are primarily executed on behalf of customers. Our trust and asset management income are at risk to fluctuations in the market values of underlying assets, particularly debt and equity securities. Also, our share-based compensation expense is dependent on the fair value of the stock options and restricted stock at the date of grant. The fair value of both stock options and restricted stock is impacted by the market price of the Parent's common stock on the date of grant and is at risk to changes in equity markets, general economic conditions, and other factors.
47
Liquidity Risk Management
The objective of our liquidity risk management process is to manage cash flow and liquidity in an effort to provide continuous access to sufficient, reasonably priced funds. Funding requirements are impacted by loan originations and refinancings, deposit growth, liability issuances and settlements, and off-balance sheet funding commitments. We consider and comply with various regulatory guidelines regarding required liquidity levels and periodically monitor our liquidity position in light of the changing economic environment and customer activity. Based on periodic liquidity assessments, we may alter our asset, liability, and off-balance sheet positions. The ALCO monitors sources and uses of funds and modifies asset and liability positions as liquidity requirements change. This process, combined with our ability to raise funds in money and capital markets and through private placements, provides flexibility in managing the exposure to liquidity risk.
In an effort to satisfy our liquidity needs, we actively manage our assets and liabilities. We have immediate liquid resources in cash and noninterest-bearing deposits and funds sold. The potential sources of short-term liquidity include interest-bearing deposits as well as the ability to sell certain assets including available-for-sale investment securities. Short-term liquidity is further enhanced by our ability to sell loans in the secondary market and to secure borrowings from the FRB and FHLB. Short-term liquidity is also generated from securities sold under agreements to repurchase, funds purchased, and short-term borrowings. Our long-term liquidity strategy is to be predominantly funded by deposits. Deposits have historically provided us with a long-term source of stable and relatively lower cost source of funding. Additional funding is available through the issuance of long-term debt.
Maturities in the loan portfolio also provide a steady flow of funds. As of
December 31, 2012
, commercial and industrial and construction loans with an aggregate balance of
$369.8 million
were due to mature in one year or less, although the Bank may renew some of these lending arrangements if the risk profile is acceptable. Funds are also provided from payments on residential mortgage and other consumer loans. Additionally, investment securities of $487.0 million were due to contractually mature in one year or less. Liquidity is further enhanced by our ability to pledge loans to access secured borrowings from the FHLB and FRB. As of December 31, 2012, we could have borrowed an additional
$1.0 billion
from the FHLB and an additional
$685.0 million
from the FRB based on the amount of collateral pledged.
We continued to maintain a strong liquidity position during
2012
. As of
December 31, 2012
, cash and cash equivalents were
$352.9 million
, available-for-sale investment securities were
$3.4 billion
, and total deposits were
$11.5 billion
. As of
December 31, 2012
, we continued to maintain our excess liquidity primarily in mortgage-backed securities issued by Ginnie Mae, state and municipal bond holdings, and in U.S. Treasury Notes. As of
December 31, 2012
, our available-for-sale investment securities portfolio was comprised of securities with an average base duration of less than three years.
Capital Management
We actively manage capital, commensurate with our risk profile, to enhance shareholder value. We also seek to maintain capital levels for the Company and the Bank at amounts in excess of the regulatory "well-capitalized" thresholds. Periodically, we may respond to market conditions by implementing changes to our overall balance sheet positioning to manage our capital position.
The Company and the Bank are each subject to regulatory capital requirements administered by the federal banking agencies. Failure to meet minimum capital requirements can cause certain mandatory and discretionary actions by regulators that, if undertaken, could have a material effect on our financial statements. Under capital adequacy guidelines and the regulatory framework for prompt corrective action, the Company and the Bank must meet specific capital guidelines that involve quantitative and qualitative measures. These measures were established by regulation to ensure capital adequacy. As of
December 31, 2012
, the Company and the Bank were "well capitalized" under this regulatory framework. The Company's regulatory capital ratios are presented in Table 19 below. There have been no conditions or events since
December 31, 2012
that management believes have changed either the Company's or the Bank's capital classifications.
As of
December 31, 2012
, shareholders' equity was
$1.0 billion
, an increase of
$19.0 million
or
2%
from
December 31, 2011
. Earnings for
2012
of
$166.1 million
, common stock issuances of
$14.5 million
, and shared-based compensation of
$7.5 million
were offset by cash dividends paid of
$81.6 million
and other comprehensive loss of
$6.1 million
. In
2012
, we also repurchased 1.7 million shares of our common stock under our share repurchase program at an average cost per share of $46.32 and a total cost of $79.5 million. From the beginning of our share repurchase program in July 2001 through
December 31, 2012
, we repurchased a total of 50.2 million shares of common stock and returned a total of $1.8 billion to our shareholders at an average cost of $36.33 per share. As of
December 31, 2012
, remaining buyback authority under our share repurchase program was $69.5 million of the total $1.9 billion repurchase amount authorized by our Board of Directors.
48
From January 1, 2013 through February 14, 2013, the Parent repurchased an additional 67,000 shares of common stock at an average cost of $47.45 per share and a total cost of $3.2 million. Remaining buyback authority was $66.3 million as of February 14, 2013. The actual amount and timing of future share repurchases, if any, will depend on market and economic conditions, regulatory rules, applicable SEC rules, and various other factors.
In January 2013, the Parent's Board of Directors declared a quarterly cash dividend of $0.45 per share on the Parent's outstanding shares. The dividend will be payable on March 14, 2013 to shareholders of record at the close of business on February 28, 2013.
We continue to evaluate the potential impact that regulatory proposals may have on our liquidity and capital management strategies, including Basel III and those required under the Dodd-Frank Act, as they continue to progress through the final rule-making process. See further discussion below on the potential impact that these regulatory proposals may have on our liquidity and capital requirements.
Table 19 presents a five-year history of activities and balances in our capital accounts, along with key capital ratios.
|
Shareholders' Equity and Regulatory Capital
|
Table 19
|
||||||||||||||||||
|
December 31,
|
|||||||||||||||||||
|
(dollars in thousands)
|
2012
|
|
2011
|
|
2010
|
|
2009
|
|
2008
|
|
|||||||||
|
Change in Shareholders' Equity
|
|||||||||||||||||||
|
Net Income
|
$
|
166,076
|
|
$
|
160,043
|
|
$
|
183,942
|
|
$
|
144,033
|
|
$
|
192,213
|
|
||||
|
Cash Dividends Paid
|
(81,645
|
)
|
(84,891
|
)
|
(86,823
|
)
|
(86,236
|
)
|
(84,855
|
)
|
|||||||||
|
Dividend Reinvestment Program
|
4,721
|
|
5,008
|
|
5,034
|
|
5,154
|
|
5,193
|
|
|||||||||
|
Common Stock Repurchased
|
(81,444
|
)
|
(111,544
|
)
|
(24,981
|
)
|
(1,337
|
)
|
(62,015
|
)
|
|||||||||
|
Other
1
|
11,290
|
|
22,918
|
|
37,988
|
|
43,655
|
|
(10,087
|
)
|
|||||||||
|
Increase (Decrease) in Shareholders' Equity
|
$
|
18,998
|
|
$
|
(8,466
|
)
|
$
|
115,160
|
|
$
|
105,269
|
|
$
|
40,449
|
|
||||
|
Regulatory Capital
|
|||||||||||||||||||
|
Shareholders' Equity
|
$
|
1,021,665
|
|
$
|
1,002,667
|
|
$
|
1,011,133
|
|
$
|
895,973
|
|
$
|
790,704
|
|
||||
|
Less: Goodwill
|
31,517
|
|
31,517
|
|
31,517
|
|
31,517
|
|
34,959
|
|
|||||||||
|
Postretirement Benefit Liability Adjustments
|
1,442
|
|
2,815
|
|
2,597
|
|
5,644
|
|
7,079
|
|
|||||||||
|
Net Unrealized Gains (Losses) on
Available-for-Sale Investment Securities
|
59,777
|
|
62,932
|
|
46,521
|
|
26,290
|
|
(4,277
|
)
|
|||||||||
|
Other
|
2,326
|
|
2,230
|
|
2,340
|
|
2,398
|
|
1,424
|
|
|||||||||
|
Tier 1 Capital
|
926,603
|
|
903,173
|
|
928,158
|
|
830,124
|
|
751,519
|
|
|||||||||
|
Allowable Reserve for Credit Losses
|
72,580
|
|
68,624
|
|
64,564
|
|
70,909
|
|
84,163
|
|
|||||||||
|
Total Regulatory Capital
|
$
|
999,183
|
|
$
|
971,797
|
|
$
|
992,722
|
|
$
|
901,033
|
|
$
|
835,682
|
|
||||
|
Risk-Weighted Assets
|
$
|
5,744,722
|
|
$
|
5,414,481
|
|
$
|
5,076,909
|
|
$
|
5,594,532
|
|
$
|
6,688,530
|
|
||||
|
Key Regulatory Capital Ratios
|
|||||||||||||||||||
|
Tier 1 Capital Ratio
|
16.13
|
%
|
16.68
|
%
|
18.28
|
%
|
14.84
|
%
|
11.24
|
%
|
|||||||||
|
Total Capital Ratio
|
17.39
|
|
17.95
|
|
19.55
|
|
16.11
|
|
12.49
|
|
|||||||||
|
Tier 1 Leverage Ratio
|
6.83
|
|
6.73
|
|
7.15
|
|
6.76
|
|
7.30
|
|
|||||||||
|
1
|
Includes unrealized gains and losses on available-for-sale investment securities, minimum pension liability adjustments, and common stock issuances under share-based compensation and related tax benefits.
|
49
Regulatory Initiatives Related to Liquidity, Capital, and Stress Testing
Basel III
On December 16, 2010, the Basel Committee on Banking Supervision (“BCBS”) released the final text of the Basel III package on capital, leverage, and liquidity reforms. Under Basel III, it is expected that financial institutions will be required to have more capital and a higher quality of capital. It does so by increasing the minimum regulatory capital ratios, narrowing the definition of capital, and requiring capital buffers. Basel III is also expected to impose a leverage ratio requirement, capital adjustments, and liquidity standards.
U.S. federal banking agencies had been considering the BCBS capital guidelines and proposals, and in June 2012, the U.S. federal banking agencies jointly issued three notices of proposed rulemaking that are essentially intended to implement the BCBS capital guidelines for U.S. banks.
The new minimum capital requirements were to be phased in between January 2013 and January 2015 as follows: (1) the minimum requirement for the Tier 1 common equity ratio was to be increased from the current 2.0% to 4.5%; (2) the minimum requirement for the Tier 1 Capital Ratio to be considered “adequately capitalized” was to be increased from the current 4.0% to 6.0%; (3) an additional 2.5% of Tier 1 common equity to total risk-weighted assets was to be required (to be phased in between January 1, 2016 and January 1, 2019); and (4) a minimum Tier 1 Leverage Ratio of 3.0% was to be required. However, on November 9, 2012, the U.S. federal banking agencies indicated that a delay in implementation of the proposed dates was necessary, but did not provide a substitute effective date for the new rules.
The new capital adjustment rules are expected to be phased in between January 2014 and January 2018. In particular, these rules would change the treatment of net unrealized gains or losses on available-for-sale investment securities in the calculation of Tier 1 Capital. Currently, net unrealized gains or losses on available-for-sale investment securities are excluded from the calculation of Tier 1 Capital, which eliminates potential capital volatility. Under the proposed rules, net unrealized gains or losses on available-for-sale investment securities would no longer be excluded from the calculation of Tier 1 Capital.
The liquidity proposals under Basel III include: (1) a liquidity coverage ratio (“LCR”) (to become effective January 1, 2015); (2) a net stable funding ratio (to become effective January 1, 2018); and (3) a set of monitoring tools to establish minimum reporting requirements of financial institutions to their regulatory supervisors.
The LCR is intended to ensure that banks have sufficient high-quality liquid assets ("HQLA") to sustain a significant liquidity stress scenario lasting 30 days. On January 6, 2013, the BCBS published changes to its release that included changes to the definition of the LCR. The revisions to the LCR incorporate amendments to the definition of HQLA and net cash outflows, which include an expansion in the range of assets eligible as HQLA, and some refinements to the assumed inflow and outflow rates to better reflect actual experience in times of stress. In addition, the BCBS agreed to a revised timetable for the phase-in of the LCR. Specifically, the LCR will be introduced as planned on January 1, 2015, but the minimum requirement will begin at 60%, rising in equal annual increments of 10 percentage points to reach 100% on January 1, 2019. This graduated approach is designed to ensure that the LCR can be introduced without disruption to the orderly strengthening of banking systems or the ongoing financing of economic activity.
The net stable funding ratio establishes a minimum acceptable amount of stable funding based on the liquidity characteristics of an institution's assets and activities over a one year time horizon. The net stable funding ratio is defined as the available amount of stable funding to the amount of required stable funding. This ratio must be greater than 100%.
Stress Testing
The Dodd-Frank Act also requires federal banking agencies to issue regulations that require banks with total consolidated assets of more than $10.0 billion to conduct and publish annual stress tests to assess the potential impact of different scenarios on the consolidated earnings and capital of a bank and certain related items over a nine-quarter forward-looking planning horizon, taking into account all relevant exposures and activities. In October 2012, the FRB published final rules implementing the stress testing requirements for banks with total consolidated assets of more than $10.0 billion, but delayed the effective date until October 2013. The final stress testing rules set forth the timing and type of stress test activities, as well as rules governing controls, oversight and disclosure.
Implementation of these new capital, liquidity, and stress testing requirements has created significant uncertainty with respect to the future requirements for financial institutions.
50
Operational Risk
Operational risk represents the risk of loss resulting from our operations, including, but not limited to, the risk of fraud by employees or persons outside the Company, errors relating to transaction processing and technology, failure to adhere to compliance requirements, and the risk of cyber security attacks. The risk of loss also includes the potential legal actions that could arise as a result of an operational deficiency or as a result of noncompliance with applicable regulatory standards, adverse business decisions or their implementation, and customer attrition due to potential negative publicity. Operational risk is inherent in all business activities, and management of this risk is important to the achievement of Company goals and objectives.
The Operating Risk Committee (the "ORC") provides oversight and assesses the most significant operational risks facing the Company. We have developed a framework that provides for a centralized operating risk management function through the ORC, supplemented by business unit responsibility for managing operational risks specific to their business units. Our internal audit department also validates the system of internal controls through ongoing risk-based audit procedures and reports on the effectiveness of internal controls to executive management and the Audit and Risk Committee of the Board of Directors.
While we believe that internal controls have been designed to minimize operational risks, there is no assurance that business disruption or operational losses will not occur. On an ongoing basis, management reassesses operational risks, implements appropriate process changes, and invests in enhancements to its systems of internal controls.
Off-Balance Sheet Arrangements and Guarantees
Off-Balance Sheet Arrangements
We hold interests in several unconsolidated variable interest entities ("VIEs"). These unconsolidated VIEs are primarily low-income housing partnerships. Variable interests are defined as contractual ownership or other interests in an entity that change with fluctuations in an entity's net asset value. The primary beneficiary consolidates the VIE. We have determined that the Company is not the primary beneficiary of these entities. As a result, we do not consolidate these VIEs. See discussion of our accounting policy related to VIEs in Note 1 to the Consolidated Financial Statements.
Guarantees
We sell residential mortgage loans in the secondary market primarily to Fannie Mae. We also pool Federal Housing Administration ("FHA") insured and U.S. Department of Veterans Affairs ("VA") guaranteed residential mortgage loans for sale to Ginnie Mae. The agreements under which we sell residential mortgage loans to Fannie Mae or Ginnie Mae and the insurance or guaranty agreements with the FHA and VA contain provisions that include various representations and warranties regarding the origination and characteristics of the residential mortgage loans. Although these loans are primarily sold on a non-recourse basis, we may be obligated to repurchase residential mortgage loans where required documents are not delivered or are defective.
We also service substantially all of the loans we sell to investors in the secondary market. Each agreement under which we act as servicer generally specifies a standard of responsibility for our actions and provides protection against expenses and liabilities incurred by us when acting in compliance with the respective servicing agreements. However, if we commit a material breach of obligations as servicer, we may be subject to various penalties which may include the repurchase of an affected loan.
See discussion of our risks related to representation and warranty provisions as well as our risks related to residential mortgage loan servicing activities in Note 18 to the Consolidated Financial Statements.
51
Credit Commitments and Contractual Obligations
Our credit commitments and contractual obligations as of
December 31, 2012
were as follows:
|
Credit Commitments and Contractual Obligations
1
|
Table 20
|
|
|||||||||||||||||
|
(dollars in thousands)
|
Less Than One Year
|
|
1-3 Years
|
|
4-5 Years
|
|
After 5 Years
|
|
Total
|
|
|||||||||
|
Credit Commitments
|
|||||||||||||||||||
|
Unfunded Commitments to Extend Credit
|
$
|
579,676
|
|
$
|
204,692
|
|
$
|
317,211
|
|
$
|
897,963
|
|
$
|
1,999,542
|
|
||||
|
Standby Letters of Credit
|
44,967
|
|
17,076
|
|
—
|
|
—
|
|
62,043
|
|
|||||||||
|
Commercial Letters of Credit
|
13,871
|
|
—
|
|
—
|
|
—
|
|
13,871
|
|
|||||||||
|
Total Credit Commitments
|
638,514
|
|
221,768
|
|
317,211
|
|
897,963
|
|
2,075,456
|
|
|||||||||
|
Contractual Obligations
|
|||||||||||||||||||
|
Deposits
|
11,194,138
|
|
194,006
|
|
124,601
|
|
16,737
|
|
11,529,482
|
|
|||||||||
|
Funds Purchased
|
11,296
|
|
—
|
|
—
|
|
—
|
|
11,296
|
|
|||||||||
|
Securities Sold Under Agreements to Repurchase
|
130,751
|
|
78,196
|
|
375,000
|
|
175,000
|
|
758,947
|
|
|||||||||
|
Long-Term Debt, including interest
|
3,890
|
|
107,750
|
|
3,857
|
|
8,730
|
|
124,227
|
|
|||||||||
|
Banker's Acceptances Outstanding
|
173
|
|
—
|
|
—
|
|
—
|
|
173
|
|
|||||||||
|
Capital Lease Obligations
|
665
|
|
1,330
|
|
1,330
|
|
5,545
|
|
8,870
|
|
|||||||||
|
Non-Cancelable Operating Leases
|
13,904
|
|
23,095
|
|
18,141
|
|
131,388
|
|
186,528
|
|
|||||||||
|
Purchase Obligations
|
20,821
|
|
13,517
|
|
2,736
|
|
—
|
|
37,074
|
|
|||||||||
|
Pension and Postretirement Benefit Contributions
2
|
1,868
|
|
3,981
|
|
4,365
|
|
11,410
|
|
21,624
|
|
|||||||||
|
Total Contractual Obligations
|
11,377,506
|
|
421,875
|
|
530,030
|
|
348,810
|
|
12,678,221
|
|
|||||||||
|
Total Credit Commitments and
Contractual Obligations
|
$
|
12,016,020
|
|
$
|
643,643
|
|
$
|
847,241
|
|
$
|
1,246,773
|
|
$
|
14,753,677
|
|
||||
|
1
|
Our liability for unrecognized tax benefits ("UTBs") as of
December 31, 2012
was
$15.4 million
. We are unable to reasonably estimate the period of cash settlement with the respective taxing authority. As a result, our liability for UTBs is not included in this disclosure.
|
|
2
|
Amounts only include obligations related to the unfunded non-qualified pension plan and postretirement benefit plan.
|
Commitments to extend credit, standby letters of credit, and commercial letters of credit do not necessarily represent future cash requirements in that these commitments often expire without being drawn upon. Our non-cancelable operating leases and capital lease obligations are primarily related to branch premises, equipment, and a portion of the Company's headquarters' building with lease terms extending through 2052. Purchase obligations arise from agreements to purchase goods or services that are enforceable and legally binding. Other contracts included in purchase obligations primarily consist of service agreements for various systems and applications supporting bank operations. Pension and postretirement benefit contributions represent the minimum expected contribution to the unfunded non-qualified pension plan and postretirement benefit plan. Actual contributions may differ from these estimates.
See discussion of credit, lease, and other contractual commitments in Note 18 to the Consolidated Financial Statements which is incorporated herein by reference.
Future Application of Accounting Pronouncements
See discussion of the expected impact of accounting pronouncements recently issued but that we have not adopted as of
December 31, 2012
in Note 1 to the Consolidated Financial Statements.
52
Selected Quarterly Consolidated Financial Data
Table 21 presents our selected quarterly financial data for
2012
and
2011
.
|
Condensed Statements of Income
|
Table 21
|
|||||||||||||||||||||||||||||||
|
Three Months Ended
|
Three Months Ended
|
|||||||||||||||||||||||||||||||
|
2012
|
2011
|
|||||||||||||||||||||||||||||||
|
(dollars in thousands, except per share amounts)
|
Dec. 31
|
|
Sept. 30
|
|
June 30
|
|
Mar. 31
|
|
Dec. 31
|
|
Sept. 30
|
|
June 30
|
|
Mar. 31
|
|
||||||||||||||||
|
Interest Income
|
$
|
100,695
|
|
$
|
104,213
|
|
$
|
106,353
|
|
$
|
109,228
|
|
$
|
107,877
|
|
$
|
109,230
|
|
$
|
110,163
|
|
$
|
112,423
|
|
||||||||
|
Interest Expense
|
10,385
|
|
10,581
|
|
10,972
|
|
11,280
|
|
11,631
|
|
12,464
|
|
12,664
|
|
12,726
|
|
||||||||||||||||
|
Net Interest Income
|
90,310
|
|
93,632
|
|
95,381
|
|
97,948
|
|
96,246
|
|
96,766
|
|
97,499
|
|
99,697
|
|
||||||||||||||||
|
Provision for Credit Losses
|
—
|
|
—
|
|
628
|
|
351
|
|
2,219
|
|
2,180
|
|
3,600
|
|
4,691
|
|
||||||||||||||||
|
Investment Securities Gains (Losses), Net
|
—
|
|
13
|
|
—
|
|
(90
|
)
|
282
|
|
—
|
|
—
|
|
6,084
|
|
||||||||||||||||
|
Noninterest Income
|
52,982
|
|
52,361
|
|
46,848
|
|
48,172
|
|
43,125
|
|
50,863
|
|
49,463
|
|
47,838
|
|
||||||||||||||||
|
Noninterest Expense
|
83,456
|
|
84,878
|
|
80,747
|
|
85,207
|
|
84,382
|
|
83,955
|
|
93,774
|
|
86,082
|
|
||||||||||||||||
|
Income Before Provision for Income Taxes
|
59,836
|
|
61,128
|
|
60,854
|
|
60,472
|
|
53,052
|
|
61,494
|
|
49,588
|
|
62,846
|
|
||||||||||||||||
|
Provision for Income Taxes
|
19,549
|
|
19,896
|
|
20,107
|
|
16,662
|
|
13,823
|
|
18,188
|
|
14,440
|
|
20,486
|
|
||||||||||||||||
|
Net Income
|
$
|
40,287
|
|
$
|
41,232
|
|
$
|
40,747
|
|
$
|
43,810
|
|
$
|
39,229
|
|
$
|
43,306
|
|
$
|
35,148
|
|
$
|
42,360
|
|
||||||||
|
Per Common Share
|
||||||||||||||||||||||||||||||||
|
Basic Earnings Per Share
|
$
|
0.90
|
|
$
|
0.92
|
|
$
|
0.90
|
|
$
|
0.96
|
|
$
|
0.85
|
|
$
|
0.93
|
|
$
|
0.74
|
|
$
|
0.89
|
|
||||||||
|
Diluted Earnings Per Share
|
$
|
0.90
|
|
$
|
0.92
|
|
$
|
0.90
|
|
$
|
0.95
|
|
$
|
0.85
|
|
$
|
0.92
|
|
$
|
0.74
|
|
$
|
0.88
|
|
||||||||
|
Dividends Declared Per Share
|
$
|
0.45
|
|
$
|
0.45
|
|
$
|
0.45
|
|
$
|
0.45
|
|
$
|
0.45
|
|
$
|
0.45
|
|
$
|
0.45
|
|
$
|
0.45
|
|
||||||||
|
Performance Ratios
|
||||||||||||||||||||||||||||||||
|
Net Income to Average Total Assets (ROA)
|
1.19
|
|
%
|
1.22
|
|
%
|
1.19
|
|
%
|
1.29
|
|
%
|
1.17
|
|
%
|
1.31
|
|
%
|
1.09
|
|
%
|
1.32
|
|
%
|
||||||||
|
Net Income to Average
Shareholders' Equity (ROE) |
15.47
|
|
16.02
|
|
16.19
|
|
17.26
|
|
15.23
|
|
16.80
|
|
13.86
|
|
16.86
|
|
||||||||||||||||
|
Efficiency Ratio
1
|
58.24
|
|
58.13
|
|
56.77
|
|
58.35
|
|
60.42
|
|
56.87
|
|
63.81
|
|
56.04
|
|
||||||||||||||||
|
Net Interest Margin
2
|
2.87
|
|
2.98
|
|
2.98
|
|
3.06
|
|
3.04
|
|
3.09
|
|
3.16
|
|
3.24
|
|
||||||||||||||||
|
1
|
The efficiency ratio is defined as noninterest expense divided by total revenue (net interest income and noninterest income).
|
|
2
|
The net interest margin is defined as net interest income, on a fully-taxable equivalent basis, as a percentage of average earning assets.
|
53
Fourth Quarter Results and Other Matters
Net Income
Net income for the fourth quarter of 2012 was $40.3 million, an increase of $1.1 million or 3% compared to the fourth quarter of 2011. Diluted earnings per share were $0.90 for the fourth quarter of 2012, an increase of $0.05 or 6% compared to the fourth quarter of 2011.
Net Interest Income
Net interest income, on a taxable-equivalent basis, for the fourth quarter of 2012 was $92.7 million, a decrease of $4.5 million or 5% compared to the fourth quarter of 2011. The net interest margin was 2.87% for the fourth quarter of 2012, a decrease of 17 basis points compared to the fourth quarter of 2011. Although we had higher average loan and lease balances in the fourth quarter of 2012 compared to the fourth quarter of 2011, loans and investment securities continued to reprice at lower yields in 2012. This was partially offset by lower rates paid on our interest-bearing deposits in the fourth quarter of 2012.
Provision for Credit Losses
We recorded no Provision in the fourth quarter of 2012, while recording net charge-offs of loans and leases of $2.1 million. In the fourth quarter of 2011, we recorded a Provision of $2.2 million while recording net charge-offs of loans and leases of $7.0 million. The lower Provision in the fourth quarter of 2012 was primarily due to improving credit trends and the underlying risk profile of our loan portfolio. As of December 31, 2012, non-performing assets and higher risk loans and leases were at lower levels as compared to December 31, 2011.
Noninterest Income
Noninterest income, excluding net gains on investment securities, was $53.0 million in the fourth quarter of 2012, an increase of $9.9 million or 23% compared to the fourth quarter of 2011. This increase was primarily due to a $7.9 million increase in mortgage banking income, reflective of higher loan origination, sales volume, and margins in the fourth quarter of 2012. Also contributing to higher mortgage banking income in the fourth quarter of 2012 was our decision to add more fixed-rate conforming saleable loans to our portfolio during the fourth quarter of 2011.
Noninterest Expense
Noninterest expense was $83.5 million in the fourth quarter of 2012, a decrease of $0.9 million or 1% compared to the fourth quarter of 2011. This decrease was primarily due to a $1.5 million credit for the reduction in insurance reserves recorded in the fourth quarter of 2012. This decrease was partially offset by a $0.5 million increase in impairment charges in the fourth quarter of 2012 compared to the fourth quarter of 2011. The impairment charges recorded in the fourth quarters of 2012 and 2011 were related to planned branch closures.
Provision for Income Taxes
The provision for income taxes was $19.5 million in the fourth quarter of 2012, an increase of $5.7 million or 41% compared to the fourth quarter of 2011. The effective tax rate for the fourth quarter of 2012 was 32.67% compared with an effective tax rate of 26.06% for the fourth quarter of 2011. The lower effective tax rate in the fourth quarter of 2011 was primarily due to the release of reserves recorded during the quarter.
Common Stock Repurchase Program
In the fourth quarter of 2012, we repurchased 339,000 shares of common stock at an average cost per share of $44.06 and a total cost of $14.9 million. See Note 11 to the Consolidated Financial Statements for more information related to our common stock repurchase program.
See the Market Risk section in Management's Discussion and Analysis of Financial Condition and Results of Operation included in Item 7 of this report.
54
Report of Independent Registered Public Accounting Firm
The Board of Directors and Shareholders
Bank of Hawaii Corporation and subsidiaries
We have audited the accompanying consolidated statements of condition of Bank of Hawaii Corporation and subsidiaries as of December 31, 2012 and 2011, and the related consolidated statements of income, comprehensive income, shareholders' equity and cash flows for each of the three years in the period ended December 31, 2012. These financial statements are the responsibility of Bank of Hawaii Corporation's management. Our responsibility is to express an opinion on these financial statements based on our audits.
We conducted our audits in accordance with the standards of the Public Company Accounting Oversight Board (United States). Those standards require that we plan and perform the audit to obtain reasonable assurance about whether the financial statements are free of material misstatement. An audit includes examining, on a test basis, evidence supporting the amounts and disclosures in the financial statements. An audit also includes assessing the accounting principles used and significant estimates made by management, as well as evaluating the overall financial statement presentation. We believe that our audits provide a reasonable basis for our opinion.
In our opinion, the financial statements referred to above present fairly, in all material respects, the consolidated financial position of Bank of Hawaii Corporation and subsidiaries as of December 31, 2012 and 2011, and the consolidated results of their operations and their cash flows for each of the three years in the period ended December 31, 2012, in conformity with U.S. generally accepted accounting principles.
We also have audited, in accordance with the standards of the Public Company Accounting Oversight Board (United States), Bank of Hawaii Corporation's internal control over financial reporting as of December 31, 2012, based on criteria established in Internal Control-Integrated Framework issued by the Committee of Sponsoring Organizations of the Treadway Commission and our report dated February 26, 2013 expressed an unqualified opinion thereon.
/s/ Ernst & Young LLP
Honolulu, Hawaii
February 26, 2013
55
Bank of Hawaii Corporation and Subsidiaries
Consolidated Statements of Income
Consolidated Statements of Income
|
Year Ended December 31,
|
|||||||||||
|
(dollars in thousands, except per share amounts)
|
2012
|
|
2011
|
|
2010
|
|
|||||
|
Interest Income
|
|||||||||||
|
Interest and Fees on Loans and Leases
|
$
|
257,896
|
|
$
|
262,239
|
|
$
|
287,381
|
|
||
|
Income on Investment Securities
|
|||||||||||
|
Available-for-Sale
|
65,972
|
|
103,363
|
|
169,151
|
|
|||||
|
Held-to-Maturity
|
94,952
|
|
72,138
|
|
6,504
|
|
|||||
|
Deposits
|
9
|
|
8
|
|
28
|
|
|||||
|
Funds Sold
|
533
|
|
828
|
|
1,076
|
|
|||||
|
Other
|
1,127
|
|
1,117
|
|
1,111
|
|
|||||
|
Total Interest Income
|
420,489
|
|
439,693
|
|
465,251
|
|
|||||
|
Interest Expense
|
|||||||||||
|
Deposits
|
12,376
|
|
18,321
|
|
29,196
|
|
|||||
|
Securities Sold Under Agreements to Repurchase
|
28,897
|
|
29,171
|
|
25,996
|
|
|||||
|
Funds Purchased
|
21
|
|
20
|
|
30
|
|
|||||
|
Long-Term Debt
|
1,924
|
|
1,973
|
|
3,549
|
|
|||||
|
Total Interest Expense
|
43,218
|
|
49,485
|
|
58,771
|
|
|||||
|
Net Interest Income
|
377,271
|
|
390,208
|
|
406,480
|
|
|||||
|
Provision for Credit Losses
|
979
|
|
12,690
|
|
55,287
|
|
|||||
|
Net Interest Income After Provision for Credit Losses
|
376,292
|
|
377,518
|
|
351,193
|
|
|||||
|
Noninterest Income
|
|||||||||||
|
Trust and Asset Management
|
45,229
|
|
45,046
|
|
44,889
|
|
|||||
|
Mortgage Banking
|
35,644
|
|
14,664
|
|
18,576
|
|
|||||
|
Service Charges on Deposit Accounts
|
37,621
|
|
38,733
|
|
53,039
|
|
|||||
|
Fees, Exchange, and Other Service Charges
|
48,965
|
|
60,227
|
|
61,006
|
|
|||||
|
Investment Securities Gains (Losses), Net
|
(77
|
)
|
6,366
|
|
42,848
|
|
|||||
|
Insurance
|
9,553
|
|
10,957
|
|
9,961
|
|
|||||
|
Other
|
23,351
|
|
21,662
|
|
24,939
|
|
|||||
|
Total Noninterest Income
|
200,286
|
|
197,655
|
|
255,258
|
|
|||||
|
Noninterest Expense
|
|||||||||||
|
Salaries and Benefits
|
184,408
|
|
182,816
|
|
185,713
|
|
|||||
|
Net Occupancy
|
42,965
|
|
43,169
|
|
40,988
|
|
|||||
|
Net Equipment
|
19,723
|
|
18,849
|
|
19,371
|
|
|||||
|
Professional Fees
|
9,623
|
|
8,623
|
|
7,104
|
|
|||||
|
FDIC Insurance
|
7,873
|
|
9,346
|
|
12,564
|
|
|||||
|
Other
|
69,696
|
|
85,390
|
|
80,496
|
|
|||||
|
Total Noninterest Expense
|
334,288
|
|
348,193
|
|
346,236
|
|
|||||
|
Income Before Provision for Income Taxes
|
242,290
|
|
226,980
|
|
260,215
|
|
|||||
|
Provision for Income Taxes
|
76,214
|
|
66,937
|
|
76,273
|
|
|||||
|
Net Income
|
$
|
166,076
|
|
$
|
160,043
|
|
$
|
183,942
|
|
||
|
Basic Earnings Per Share
|
$
|
3.68
|
|
$
|
3.40
|
|
$
|
3.83
|
|
||
|
Diluted Earnings Per Share
|
$
|
3.67
|
|
$
|
3.39
|
|
$
|
3.80
|
|
||
|
Dividends Declared Per Share
|
$
|
1.80
|
|
$
|
1.80
|
|
$
|
1.80
|
|
||
|
Basic Weighted Average Shares
|
45,115,441
|
|
47,064,925
|
|
48,055,025
|
|
|||||
|
Diluted Weighted Average Shares
|
45,249,300
|
|
47,224,981
|
|
48,355,965
|
|
|||||
The accompanying notes are an integral part of the Consolidated Financial Statements.
56
Bank of Hawaii Corporation and Subsidiaries
Consolidated Statements of Comprehensive Income
Consolidated Statements of Comprehensive Income
|
Year Ended December 31,
|
|||||||||||
|
(dollars in thousands)
|
2012
|
|
2011
|
|
2010
|
|
|||||
|
Net Income
|
$
|
166,076
|
|
$
|
160,043
|
|
$
|
183,942
|
|
||
|
Other Comprehensive Income (Loss), Net of Tax:
|
|||||||||||
|
Net Unrealized Gains (Losses) on Investment Securities
|
(3,155
|
)
|
16,411
|
|
20,231
|
|
|||||
|
Defined Benefit Plans
|
(2,900
|
)
|
(8,113
|
)
|
(191
|
)
|
|||||
|
Other Comprehensive Income (Loss)
|
(6,055
|
)
|
8,298
|
|
20,040
|
|
|||||
|
Comprehensive Income
|
$
|
160,021
|
|
$
|
168,341
|
|
$
|
203,982
|
|
||
The accompanying notes are an integral part of the Consolidated Financial Statements.
57
Bank of Hawaii Corporation and Subsidiaries
Consolidated Statements of Condition
Consolidated Statements of Condition
|
(dollars in thousands)
|
December 31,
2012 |
|
December 31,
2011 |
|
|||
|
Assets
|
|||||||
|
Interest-Bearing Deposits
|
$
|
3,393
|
|
$
|
3,036
|
|
|
|
Funds Sold
|
185,682
|
|
512,384
|
|
|||
|
Investment Securities
|
|||||||
|
Available-for-Sale
|
3,367,557
|
|
3,451,885
|
|
|||
|
Held-to-Maturity (Fair Value of $3,687,676 and $3,754,206)
|
3,595,065
|
|
3,657,796
|
|
|||
|
Loans Held for Sale
|
21,374
|
|
18,957
|
|
|||
|
Loans and Leases
|
5,854,521
|
|
5,538,304
|
|
|||
|
Allowance for Loan and Lease Losses
|
(128,857
|
)
|
(138,606
|
)
|
|||
|
Net Loans and Leases
|
5,725,664
|
|
5,399,698
|
|
|||
|
Total Earning Assets
|
12,898,735
|
|
13,043,756
|
|
|||
|
Cash and Noninterest-Bearing Deposits
|
163,786
|
|
154,489
|
|
|||
|
Premises and Equipment
|
105,005
|
|
103,550
|
|
|||
|
Customers' Acceptances
|
173
|
|
476
|
|
|||
|
Accrued Interest Receivable
|
43,077
|
|
43,510
|
|
|||
|
Foreclosed Real Estate
|
3,887
|
|
3,042
|
|
|||
|
Mortgage Servicing Rights
|
25,240
|
|
24,279
|
|
|||
|
Goodwill
|
31,517
|
|
31,517
|
|
|||
|
Other Assets
|
456,952
|
|
441,772
|
|
|||
|
Total Assets
|
$
|
13,728,372
|
|
$
|
13,846,391
|
|
|
|
Liabilities
|
|||||||
|
Deposits
|
|||||||
|
Noninterest-Bearing Demand
|
$
|
3,367,185
|
|
$
|
2,850,923
|
|
|
|
Interest-Bearing Demand
|
2,163,473
|
|
2,005,983
|
|
|||
|
Savings
|
4,399,316
|
|
4,398,638
|
|
|||
|
Time
|
1,599,508
|
|
1,337,079
|
|
|||
|
Total Deposits
|
11,529,482
|
|
10,592,623
|
|
|||
|
Funds Purchased
|
11,296
|
|
10,791
|
|
|||
|
Securities Sold Under Agreements to Repurchase
|
758,947
|
|
1,925,998
|
|
|||
|
Long-Term Debt
|
128,055
|
|
30,696
|
|
|||
|
Banker's Acceptances
|
173
|
|
476
|
|
|||
|
Retirement Benefits Payable
|
47,658
|
|
46,949
|
|
|||
|
Accrued Interest Payable
|
4,776
|
|
5,330
|
|
|||
|
Taxes Payable and Deferred Taxes
|
88,014
|
|
95,840
|
|
|||
|
Other Liabilities
|
138,306
|
|
135,021
|
|
|||
|
Total Liabilities
|
12,706,707
|
|
12,843,724
|
|
|||
|
Commitments, Contingencies, and Guarantees (Note 18)
|
|
|
|||||
|
Shareholders' Equity
|
|||||||
|
Common Stock ($.01 par value; authorized 500,000,000 shares;
issued / outstanding: December 31, 2012 - 57,319,352 / 44,754,835 and December 31, 2011 - 57,134,470 / 45,947,116) |
571
|
|
571
|
|
|||
|
Capital Surplus
|
515,619
|
|
507,558
|
|
|||
|
Accumulated Other Comprehensive Income
|
29,208
|
|
35,263
|
|
|||
|
Retained Earnings
|
1,084,477
|
|
1,003,938
|
|
|||
|
Treasury Stock, at Cost (Shares: December 31, 2012 - 12,564,517
and December 31, 2011 - 11,187,354) |
(608,210
|
)
|
(544,663
|
)
|
|||
|
Total Shareholders' Equity
|
1,021,665
|
|
1,002,667
|
|
|||
|
Total Liabilities and Shareholders' Equity
|
$
|
13,728,372
|
|
$
|
13,846,391
|
|
|
The accompanying notes are an integral part of the Consolidated Financial Statements.
58
Bank of Hawaii Corporation and Subsidiaries
Consolidated Statements of Shareholders' Equity
Consolidated Statements of Shareholders' Equity
|
(dollars in thousands)
|
Common Shares Outstanding
|
|
Common Stock
|
|
Capital Surplus
|
|
Accum. Other Compre-hensive Income
|
|
Retained Earnings
|
|
Treasury Stock
|
|
Total
|
|
||||||||||||
|
Balance as of December 31, 2009
|
48,018,943
|
|
$
|
569
|
|
$
|
494,318
|
|
$
|
6,925
|
|
$
|
843,521
|
|
$
|
(449,360
|
)
|
$
|
895,973
|
|
||||||
|
Net Income
|
—
|
|
—
|
|
—
|
|
—
|
|
183,942
|
|
—
|
|
183,942
|
|
||||||||||||
|
Other Comprehensive Income
|
—
|
|
—
|
|
—
|
|
20,040
|
|
—
|
|
—
|
|
20,040
|
|
||||||||||||
|
Share-Based Compensation
|
—
|
|
—
|
|
3,841
|
|
—
|
|
—
|
|
—
|
|
3,841
|
|
||||||||||||
|
Common Stock Issued under Purchase and Equity
|
|
|
|
|
|
|
||||||||||||||||||||
|
Compensation Plans and Related Tax Benefits
|
617,345
|
|
1
|
|
2,729
|
|
—
|
|
(8,011
|
)
|
24,422
|
|
19,141
|
|
||||||||||||
|
Common Stock Repurchased
|
(538,616
|
)
|
—
|
|
—
|
|
—
|
|
—
|
|
(24,981
|
)
|
(24,981
|
)
|
||||||||||||
|
Cash Dividends Paid ($1.80 per share)
|
—
|
|
—
|
|
—
|
|
—
|
|
(86,823
|
)
|
—
|
|
(86,823
|
)
|
||||||||||||
|
Balance as of December 31, 2010
|
48,097,672
|
|
$
|
570
|
|
$
|
500,888
|
|
$
|
26,965
|
|
$
|
932,629
|
|
$
|
(449,919
|
)
|
$
|
1,011,133
|
|
||||||
|
|
|
|
|
|
|
|||||||||||||||||||||
|
Net Income
|
—
|
|
$
|
—
|
|
$
|
—
|
|
$
|
—
|
|
$
|
160,043
|
|
$
|
—
|
|
$
|
160,043
|
|
||||||
|
Other Comprehensive Income
|
—
|
|
—
|
|
—
|
|
8,298
|
|
—
|
|
—
|
|
8,298
|
|
||||||||||||
|
Share-Based Compensation
|
—
|
|
—
|
|
6,216
|
|
—
|
|
—
|
|
—
|
|
6,216
|
|
||||||||||||
|
Common Stock Issued under Purchase and Equity
|
|
|
|
|
|
|
||||||||||||||||||||
|
Compensation Plans and Related Tax Benefits
|
389,470
|
|
1
|
|
454
|
|
—
|
|
(3,843
|
)
|
16,800
|
|
13,412
|
|
||||||||||||
|
Common Stock Repurchased
|
(2,540,026
|
)
|
—
|
|
—
|
|
—
|
|
—
|
|
(111,544
|
)
|
(111,544
|
)
|
||||||||||||
|
Cash Dividends Paid ($1.80 per share)
|
—
|
|
—
|
|
—
|
|
—
|
|
(84,891
|
)
|
—
|
|
(84,891
|
)
|
||||||||||||
|
Balance as of December 31, 2011
|
45,947,116
|
|
$
|
571
|
|
$
|
507,558
|
|
$
|
35,263
|
|
$
|
1,003,938
|
|
$
|
(544,663
|
)
|
$
|
1,002,667
|
|
||||||
|
|
|
|
|
|
|
|
||||||||||||||||||||
|
Net Income
|
—
|
|
$
|
—
|
|
$
|
—
|
|
$
|
—
|
|
$
|
166,076
|
|
$
|
—
|
|
$
|
166,076
|
|
||||||
|
Other Comprehensive Loss
|
—
|
|
—
|
|
—
|
|
(6,055
|
)
|
—
|
|
—
|
|
(6,055
|
)
|
||||||||||||
|
Share-Based Compensation
|
—
|
|
—
|
|
7,537
|
|
—
|
|
—
|
|
—
|
|
7,537
|
|
||||||||||||
|
Common Stock Issued under Purchase and Equity
|
|
|
|
|
|
|
||||||||||||||||||||
|
Compensation Plans and Related Tax Benefits
|
565,956
|
|
—
|
|
524
|
|
—
|
|
(3,892
|
)
|
17,897
|
|
14,529
|
|
||||||||||||
|
Common Stock Repurchased
|
(1,758,237
|
)
|
—
|
|
—
|
|
—
|
|
—
|
|
(81,444
|
)
|
(81,444
|
)
|
||||||||||||
|
Cash Dividends Paid ($1.80 per share)
|
—
|
|
—
|
|
—
|
|
—
|
|
(81,645
|
)
|
—
|
|
(81,645
|
)
|
||||||||||||
|
Balance as of December 31, 2012
|
44,754,835
|
|
$
|
571
|
|
$
|
515,619
|
|
$
|
29,208
|
|
$
|
1,084,477
|
|
$
|
(608,210
|
)
|
$
|
1,021,665
|
|
||||||
The accompanying notes are an integral part of the Consolidated Financial Statements.
59
Bank of Hawaii Corporation and Subsidiaries
Consolidated Statements of Cash Flows
|
Year Ended December 31,
|
||||||||||||
|
(dollars in thousands)
|
2012
|
2011
|
2010
|
|||||||||
|
Operating Activities
|
||||||||||||
|
Net Income
|
$
|
166,076
|
|
$
|
160,043
|
|
$
|
183,942
|
|
|||
|
Adjustments to Reconcile Net Income to Net Cash Provided by Operating Activities:
|
||||||||||||
|
Provision for Credit Losses
|
979
|
|
12,690
|
|
55,287
|
|
||||||
|
Depreciation and Amortization
|
13,826
|
|
14,624
|
|
13,432
|
|
||||||
|
Amortization of Deferred Loan and Lease Fees
|
(3,467
|
)
|
(2,709
|
)
|
(2,804
|
)
|
||||||
|
Amortization and Accretion of Premiums/Discounts on Investment Securities, Net
|
58,506
|
|
49,728
|
|
49,834
|
|
||||||
|
Share-Based Compensation
|
7,537
|
|
6,216
|
|
3,841
|
|
||||||
|
Benefit Plan Contributions
|
(6,166
|
)
|
(1,261
|
)
|
(3,164
|
)
|
||||||
|
Deferred Income Taxes
|
(16,784
|
)
|
198
|
|
(18,655
|
)
|
||||||
|
Net Gain on Sale of Proprietary Mutual Funds
|
—
|
|
(1,956
|
)
|
(2,852
|
)
|
||||||
|
Gains on Sale of Insurance Business
|
—
|
|
—
|
|
(904
|
)
|
||||||
|
Net Gains on Sales of Loans and Leases
|
(19,302
|
)
|
(6,792
|
)
|
(9,007
|
)
|
||||||
|
Net Losses (Gains) on Investment Securities
|
77
|
|
(6,366
|
)
|
(42,848
|
)
|
||||||
|
Proceeds from Sales of Loans Held for Sale
|
616,872
|
|
439,999
|
|
684,996
|
|
||||||
|
Originations of Loans Held for Sale
|
(603,321
|
)
|
(427,066
|
)
|
(669,423
|
)
|
||||||
|
Tax Benefits from Share-Based Compensation
|
(904
|
)
|
(884
|
)
|
(2,983
|
)
|
||||||
|
Net Change in Other Assets and Other Liabilities
|
8,559
|
|
(6,741
|
)
|
(32,486
|
)
|
||||||
|
Net Cash Provided by Operating Activities
|
222,488
|
|
229,723
|
|
206,206
|
|
||||||
|
Investing Activities
|
||||||||||||
|
Investment Securities Available-for-Sale:
|
||||||||||||
|
Proceeds from Prepayments and Maturities
|
1,016,364
|
|
1,006,397
|
|
1,681,978
|
|
||||||
|
Proceeds from Sales
|
44,844
|
|
723,556
|
|
1,289,681
|
|
||||||
|
Purchases
|
(994,840
|
)
|
(1,809,249
|
)
|
(4,145,849
|
)
|
||||||
|
Investment Securities Held-to-Maturity:
|
||||||||||||
|
Proceeds from Prepayments and Maturities
|
959,557
|
|
374,520
|
|
53,579
|
|
||||||
|
Purchases
|
(942,602
|
)
|
(760,086
|
)
|
—
|
|
||||||
|
Proceeds from Sale of Proprietary Mutual Funds
|
—
|
|
1,956
|
|
4,424
|
|
||||||
|
Proceeds from Sale of Insurance Business
|
—
|
|
—
|
|
904
|
|
||||||
|
Net Change in Loans and Leases
|
(329,436
|
)
|
(235,215
|
)
|
353,011
|
|
||||||
|
Premises and Equipment, Net
|
(15,281
|
)
|
(10,004
|
)
|
(10,626
|
)
|
||||||
|
Net Cash Used in Investing Activities
|
(261,394
|
)
|
(708,125
|
)
|
(772,898
|
)
|
||||||
|
Financing Activities
|
||||||||||||
|
Net Change in Deposits
|
936,859
|
|
703,628
|
|
479,319
|
|
||||||
|
Net Change in Short-Term Borrowings
|
(1,166,546
|
)
|
20,027
|
|
282,257
|
|
||||||
|
Proceeds from Long-Term Debt
|
100,000
|
|
—
|
|
—
|
|
||||||
|
Repayments of Long-Term Debt
|
—
|
|
—
|
|
(50,000
|
)
|
||||||
|
Tax Benefits from Share-Based Compensation
|
904
|
|
884
|
|
2,983
|
|
||||||
|
Proceeds from Issuance of Common Stock
|
13,730
|
|
12,660
|
|
16,417
|
|
||||||
|
Repurchase of Common Stock
|
(81,444
|
)
|
(111,544
|
)
|
(24,981
|
)
|
||||||
|
Cash Dividends Paid
|
(81,645
|
)
|
(84,891
|
)
|
(86,823
|
)
|
||||||
|
Net Cash Provided by (Used in) Financing Activities
|
(278,142
|
)
|
540,764
|
|
619,172
|
|
||||||
|
Net Change in Cash and Cash Equivalents
|
(317,048
|
)
|
62,362
|
|
52,480
|
|
||||||
|
Cash and Cash Equivalents at Beginning of Period
|
669,909
|
|
607,547
|
|
555,067
|
|
||||||
|
Cash and Cash Equivalents at End of Period
|
$
|
352,861
|
|
$
|
669,909
|
|
$
|
607,547
|
|
|||
|
Supplemental Information
|
||||||||||||
|
Cash Paid for Interest
|
$
|
42,487
|
|
$
|
47,735
|
|
$
|
58,732
|
|
|||
|
Cash Paid for Income Taxes
|
78,667
|
|
85,144
|
|
136,841
|
|
||||||
|
Non-Cash Investing and Financing Activities:
|
||||||||||||
|
Transfer from Investment Securities Available-For-Sale to
Investment Securities Held-To-Maturity |
—
|
|
3,167,839
|
|
—
|
|
||||||
|
Transfer from Loans to Foreclosed Real Estate
|
5,406
|
|
3,089
|
|
4,923
|
|
||||||
|
Transfers from Loans to Loans Held for Sale
|
—
|
|
8,555
|
|
8,713
|
|
||||||
The accompanying notes are an integral part of the Consolidated Financial Statements.
60
Basis of Presentation
Bank of Hawaii Corporation (the "Parent") is a bank holding company headquartered in Honolulu, Hawaii. Bank of Hawaii Corporation and its Subsidiaries (the "Company") provides a broad range of financial products and services to customers in Hawaii, Guam, and other Pacific Islands. The majority of the Company's operations consist of customary commercial and consumer banking services including, but not limited to, lending, leasing, deposit services, trust and investment activities, brokerage services, and trade financing.
The accounting and reporting principles of the Company conform to U.S. generally accepted accounting principles ("GAAP") and prevailing practices within the financial services industry. The preparation of financial statements in conformity with GAAP requires management to make estimates and assumptions that affect the reported amounts in the financial statements and accompanying notes. Actual results may differ from those estimates and such differences could be material to the financial statements.
Certain prior period information has been reclassified to conform to the current year presentation.
The following is a summary of the Company's significant accounting policies:
Consolidation
The Consolidated Financial Statements include the accounts of the Parent and its subsidiaries. The Parent's principal subsidiary is Bank of Hawaii (the "Bank"). All significant intercompany accounts and transactions have been eliminated in consolidation.
Variable Interest Entities
Variable interests are defined as contractual ownership or other interests in an entity that change with fluctuations in an entity's net asset value. The primary beneficiary consolidates the variable interest entity ("VIE"). The primary beneficiary is defined as the enterprise that has both the power to direct the activities of the VIE that most significantly impact the entity's economic performance and the obligation to absorb losses or the right to receive benefits that could be significant to the VIE.
The Company has a limited partnership interest in several low-income housing partnerships. These partnerships provide funds for the construction and operation of apartment complexes that provide affordable housing to that segment of the population with lower family income. If these developments successfully attract a specified percentage of residents falling in that lower income range, state and/or federal income tax credits are made available to the partners. The tax credits are generally recognized over
10
years. In order to continue receiving the tax credits each year over the life of the partnership, the low-income residency targets must be maintained.
These entities meet the definition of a VIE; however, the Company is not the primary beneficiary of the entities, as the general partner has both the power to direct the activities that most significantly impact the economic performance of the entities and the obligation to absorb losses or the right to receive benefits that could be significant to the entities. While the partnership agreements allow the limited partners, through a majority vote, to remove the general partner, this right is not deemed to be substantive as the general partner can only be removed for cause.
The investment in these entities is initially recorded at cost, which approximates the maximum exposure to loss as a result of the Company's involvement with these unconsolidated entities. The balance of the Company's investments in these entities was
$47.2 million
and
$34.3 million
as of
December 31, 2012
and
2011
, respectively, and is included in other assets in the consolidated statements of condition. Under the effective yield method, the Company recognizes tax credits generally over
10
years and amortizes the initial cost of the investment to provide a constant effective yield over the period that tax credits are allocated to the Company.
Unfunded commitments to fund these low-income housing partnerships were
$15.9 million
and
$9.0 million
as of
December 31, 2012
and
2011
, respectively. These unfunded commitments are unconditional and legally binding and are recorded in other liabilities in the consolidated statements of condition.
61
Investment Securities
Investment securities are accounted for according to their purpose and holding period. Trading securities are those that are bought and held principally for the purpose of selling them in the near term. The Company held no trading securities as of
December 31, 2012
and
2011
. Available-for-sale investment securities, comprised of debt and mortgage-backed securities, are those that may be sold before maturity due to changes in the Company's interest rate risk profile or funding needs, and are reported at fair value with unrealized gains and losses, net of taxes, reported as a component of other comprehensive income. Held-to-maturity investment securities, comprised of debt and mortgage-backed securities, are those that management has the positive intent and ability to hold to maturity and are reported at amortized cost.
Realized gains and losses are recorded in noninterest income and are determined on a trade date basis using the specific identification method. Interest and dividends on investment securities are recognized in interest income on an accrual basis. Premiums and discounts are amortized or accreted into interest income using the interest method over the expected lives of the individual securities.
Transfers of debt securities from the available-for-sale category to the held-to-maturity category are made at fair value at the date of transfer. The unrealized holding gain or loss at the date of transfer remains in accumulated other comprehensive income and in the carrying value of the held-to-maturity investment security. Premiums or discounts on investment securities are amortized or accreted as an adjustment of yield using the interest method over the estimated life of the security. Unrealized holding gains or losses that remain in accumulated other comprehensive income are also amortized or accreted over the estimated life of the security as an adjustment of yield, offsetting the related amortization of the premium or accretion of the discount.
Other-Than-Temporary-Impairments of Investment Securities
The Company conducts an other-than-temporary-impairment ("OTTI") analysis of investment securities on a quarterly basis or more often if a potential loss-triggering event occurs. A write-down of a debt security is recorded when fair value is below amortized cost in circumstances where: (1) the Company has the intent to sell a security; (2) it is more likely than not that the Company will be required to sell the security before recovery of its amortized cost basis; or (3) the Company does not expect to recover the entire amortized cost basis of the security. If the Company intends to sell a security or if it is more likely than not that the Company will be required to sell the security before recovery, an OTTI write-down is recognized in earnings equal to the entire difference between the security's amortized cost basis and its fair value. If the Company does not intend to sell the security or it is not more likely than not that it will be required to sell the security before recovery, the OTTI write-down is separated into an amount representing credit loss, which is recognized in earnings, and an amount related to all other factors, which is recognized in other comprehensive income. To determine the amount related to credit loss on a debt security, the Company applies a methodology similar to that used for evaluating the impairment of loans. As of
December 31, 2012
, management determined that the Company did not own any investment securities that were other-than-temporarily-impaired.
Loans Held for Sale
Residential mortgage loans originated prior to October 1, 2011, with the intent to be sold in the secondary market, were valued on an aggregate basis at the lower-of-cost-or-fair value. Residential mortgage loans originated on or after October 1, 2011, with the intent to be sold in the secondary market, are accounted for under the fair value option. Non-refundable fees and direct loan origination costs related to residential mortgage loans held for sale are recognized in noninterest income or noninterest expense as earned or incurred. Fair value is primarily determined based on quoted prices for similar loans in active markets. Gains and losses on sales of residential mortgage loans (sales proceeds minus carrying value) are recorded in the mortgage banking component of noninterest income.
Commercial loans that management has an active plan to sell are valued on an individual basis at the lower-of-cost-or fair value. Fair value is primarily determined based on quoted prices for similar loans in active markets or agreed upon sales prices. Any reduction in the loan's value, prior to being transferred to the held for sale category, is reflected as a charge-off of the recorded investment in the loan resulting in a new cost basis, with a corresponding reduction in the allowance for loan and lease losses. Further decreases in the fair value of the loan are recognized in noninterest expense.
Loans and Leases
Loans are reported at the principal amount outstanding, net of unearned income, cumulative net charge-offs, and net unamortized deferred loan fees or costs. Interest income is recognized on an accrual basis. Loan origination fees, certain direct costs, and
62
unearned discounts and premiums, if any, are deferred and are generally amortized into interest income as yield adjustments using the interest method over the contractual life of the loan. Loan commitment fees are generally recognized into noninterest income. Other credit-related fees are recognized as fee income, a component of noninterest income, when earned.
Direct financing leases are carried at the aggregate of lease payments receivable plus the estimated residual value of leased property, less unearned income. Leveraged leases, which are a form of direct financing leases, are carried net of non-recourse debt. Unearned income on direct financing and leveraged leases is amortized over the lease term by methods that approximate the interest method. Residual values on leased assets are periodically reviewed for impairment.
Portfolio segments are defined as the level at which an entity develops and documents a systematic methodology to determine its allowance for loan and lease losses (the "Allowance"). Management has determined that the Company has
two
portfolio segments of loans and leases (commercial and consumer) in determining the Allowance. Both quantitative and qualitative factors are used by management at the portfolio segment level in determining the adequacy of the Allowance for the Company. Classes of loans and leases are a disaggregation of a Company's portfolio segments. Classes are defined as a group of loans and leases which share similar initial measurement attributes, risk characteristics, and methods for monitoring and assessing credit risk. Management has determined that the Company has
eight
classes of loans and leases (commercial and industrial, commercial mortgage, construction, lease financing, residential mortgage, home equity, automobile, and other). The "other" class of loans and leases is comprised of revolving credit, installment, and lease financing arrangements.
Non-Performing Loans and Leases
Generally, all classes of commercial loans and leases are placed on non-accrual status upon becoming contractually past due
90
days as to principal or interest (unless loans and leases are adequately secured by collateral, are in the process of collection, and are reasonably expected to result in repayment), when terms are renegotiated below market levels, or where substantial doubt about full repayment of principal or interest is evident. For residential mortgage and home equity loan classes, loans are placed on non-accrual status at the earlier of the loan becoming contractually past due
120
days as to principal or interest or upon taking of a partial charge-off on the loan. For automobile and other consumer loan classes, the entire outstanding balance of the loan is charged-off when the loan becomes
120
days past due as to principal or interest.
When a loan or lease is placed on non-accrual status, the accrued and unpaid interest receivable is reversed and the loan or lease is accounted for on the cash or cost recovery method until qualifying for return to accrual status. All payments received on non-accrual loans and leases are applied against the principal balance of the loan or lease. A loan or lease may be returned to accrual status when all delinquent interest and principal become current in accordance with the terms of the loan or lease agreement and when doubt about repayment is resolved.
Generally, for all classes of loans and leases, a charge-off is recorded when it is probable that a loss has been incurred and when it is possible to determine a reasonable estimate of the loss. For all classes of commercial loans and leases, a charge-off is determined on a judgmental basis after due consideration of the debtor's prospects for repayment and the fair value of collateral. For the pooled segment of the Company's commercial and industrial loan class, which consists of small business loans, the entire outstanding balance of the loan is charged-off during the month that the loan becomes
120
days past due as to principal or interest. For residential mortgage and home equity loan classes, a partial charge-off is recorded at
120
days past due as to principal or interest for the amount that the loan balance exceeds the fair value of the collateral. In the event that loans or lines in the home equity loan class is behind another financial institution's first mortgage, the entire outstanding balance of the loan is charged-off when the loan becomes
120
days past due as to principal or interest, unless the combined loan-to-value ratio is
60%
or less. As noted above, loans in the automobile and other consumer loan classes are charged-off in its entirety upon the loan becoming
120
days past due as to principal or interest.
Impaired Loans
A loan is considered impaired when, based on current information and events, it is probable that the Company will not be able to collect all amounts due from the borrower in accordance with the contractual terms of the loan, including scheduled interest payments. Impaired loans include all classes of commercial non-accruing loans (except lease financing and small business loans), and all loans modified in a troubled debt restructuring. Impaired loans exclude lease financing and smaller balance homogeneous loans (consumer and small business non-accruing loans) that are collectively evaluated for impairment.
For all classes of commercial loans, a quarterly evaluation of individual commercial borrowers is performed to identify impaired loans. The identification of specific borrowers for review is based on a review of non-accrual loans as well as those loans
63
specifically identified by management as exhibiting above average levels of risk.
When a loan has been identified as being impaired, the amount of impairment is measured based on the present value of expected future cash flows discounted at the loan's effective interest rate, the loan's observable market price, or the estimated fair value of the collateral, less any selling costs, if the loan is collateral-dependent. If the measurement of the impaired loan is less than the recorded investment in the loan (including accrued interest, net of deferred loan fees or costs, and unamortized premiums or discounts), an impairment is recognized by establishing or adjusting an existing allocation of the Allowance, or by recording a partial charge-off of the loan to its fair value. Interest payments made on impaired loans are typically applied to principal unless collectability of the principal amount is reasonably assured, in which case interest income may be accrued or recognized on a cash basis.
Loans Modified in a Troubled Debt Restructuring
Loans are considered to have been modified in a troubled debt restructuring when, due to a borrower's financial difficulties, the Company makes certain concessions to the borrower that it would not otherwise consider. Modifications may include interest rate reductions, principal or interest forgiveness, forbearance, and other actions intended to minimize economic loss and to avoid foreclosure or repossession of collateral. Generally, a non-accrual loan that has been modified in a troubled debt restructuring remains on non-accrual status for a period of
6
months to demonstrate that the borrower is able to meet the terms of the modified loan. However, performance prior to the modification, or significant events that coincide with the modification, are included in assessing whether the borrower can meet the new terms and may result in the loan being returned to accrual status at the time of loan modification or after a shorter performance period. If the borrower's ability to meet the revised payment schedule is uncertain, the loan remains on non-accrual status.
Reserve for Credit Losses
The Company's reserve for credit losses is comprised of
two
components, the Allowance and the reserve for unfunded commitments (the "Unfunded Reserve").
Allowance for Loan and Lease Losses
The Company maintains an Allowance adequate to cover management's estimate of probable credit losses as of the balance sheet date. Changes to the absolute level of the Allowance are recognized through charges or credits to the provision for credit losses (the "Provision"). Loans and leases that are charged-off reduce the Allowance while recoveries of loans and leases previously charged-off increase the Allowance. The Allowance considers both unimpaired and impaired loans and is developed and documented at the portfolio segment level (commercial and consumer).
The level of the Allowance related to the Company's commercial portfolio segment is generally based on the credit risk ratings and historical loss experience of individual borrowers. This is supplemented as necessary by credit judgment to address observed changes in trends and conditions, and other relevant environmental and economic factors that may affect the collectability of loans and leases. Excluding those loans and leases evaluated individually for impairment, the Company's remaining commercial loans and leases are pooled and collectively evaluated for impairment based on business unit and internal risk rating segmentation.
The level of the Allowance related to the Company's consumer portfolio segment is generally based on analyses of homogeneous pools of loans and leases. Loans and leases are pooled based on similar loan and lease risk characteristics for collective evaluation of impairment. Loss estimates are calculated based on historical rolling average loss rates and average delinquency flows to loss. Consumer loans that have been individually evaluated for impairment or modified in a troubled debt restructuring are excluded from the homogeneous pools. Impairment related to such loans is generally determined based on the present value of expected future cash flows discounted at the loan's original effective interest rate.
The Allowance also includes an estimate for inherent losses not reflected in the historical analyses. Relevant factors include, but are not limited to, concentrations of credit risk (geographic, large borrower, and industry), economic trends and conditions, changes in underwriting standards, experience and depth of lending staff, trends in delinquencies, and the level of net charge-offs. In addition, the Company uses a variety of other tools to estimate probable credit losses including, but not limited to, a rolling quarterly forecast of asset quality metrics; stress testing; and performance indicators based on the Company's own experience, peers, or other industry sources.
64
Reserve for Unfunded Commitments
The Unfunded Reserve is a component of other liabilities and represents the estimate for probable credit losses inherent in unfunded commitments to extend credit. Unfunded commitments to extend credit include banker's acceptances, and standby and commercial letters of credit. The process used to determine the Unfunded Reserve is consistent with the process for determining the Allowance, as adjusted for estimated funding probabilities or loan and lease equivalency factors. The level of the Unfunded Reserve is adjusted by recording an expense or recovery in other noninterest expense.
Cash and Cash Equivalents
Cash and cash equivalents include cash and noninterest-bearing deposits, interest-bearing deposits, and funds sold. All amounts are readily convertible to cash and have maturities of less than
90
days.
Premises and Equipment
Premises and equipment, including leasehold improvements, are stated at cost, less accumulated depreciation and amortization. Capital leases are included in premises and equipment at the capitalized amount less accumulated amortization.
Premises and equipment are depreciated using the straight-line method over the estimated useful lives of the respective assets. Estimated useful lives range up to
30
years for buildings and up to
10
years for equipment. Leasehold improvements are amortized over the shorter of the estimated useful life of the asset or the lease term. Capitalized leased assets are amortized using the straight-line method over the shorter of the estimated useful life of the asset or the lease term. Repairs and maintenance are charged to expense as incurred, while improvements which extend the estimated useful life of the asset are capitalized and depreciated over the estimated remaining life of the asset.
Premises and equipment are periodically evaluated for impairment when events or changes in circumstances indicate the carrying amount may not be recoverable. Impairment exists when the expected undiscounted future cash flows of premises and equipment are less than its carrying amount. In that event, the Company records a loss for the difference between the carrying amount and the fair value of the asset based on quoted market prices, if applicable, or a discounted cash flow analysis.
Foreclosed Real Estate
Foreclosed real estate consists of properties acquired through foreclosure proceedings or acceptance of a deed-in-lieu of foreclosure. These properties are recorded at fair value less estimated costs to sell the property. If the recorded investment in the loan exceeds the property's fair value at the time of acquisition, a charge-off is recorded against the Allowance. If the fair value of the property at the time of acquisition exceeds the carrying amount of the loan, the excess is recorded either as a recovery to the Allowance if a charge-off had previously been recorded, or as a gain on initial transfer in other noninterest income. Subsequent decreases in the property's fair value and operating expenses of the property are recognized through charges to other noninterest expense. The fair value of the property acquired is based on third party appraisals, broker price opinions, recent sales activity, or a combination thereof, subject to management judgment.
Mortgage Servicing Rights
Mortgage servicing rights are recognized as assets when mortgage loans are sold and the rights to service those loans are retained. Mortgage servicing rights are initially recorded at fair value by using a discounted cash flow model to calculate the present value of estimated future net servicing income.
The Company's mortgage servicing rights accounted for under the fair value method are carried on the statements of condition at fair value with changes in fair value recorded in mortgage banking income in the period in which the change occurs. Changes in the fair value of mortgage servicing rights are primarily due to changes in valuation inputs, assumptions, and the collection and realization of expected cash flows.
The Company's mortgage servicing rights accounted for under the amortization method are initially recorded at fair value. However, these mortgage servicing rights are amortized in proportion to and over the period of estimated net servicing income. An impairment analysis is prepared on a quarterly basis by estimating the fair value of the mortgage servicing rights and comparing that value to the carrying amount. A valuation allowance is established when the carrying amount of these mortgage servicing rights exceeds fair value.
65
Written Loan Commitments
The Company includes the fair value associated with the expected net future cash flows related to the servicing of the loan in the measurement of interest rate lock commitments that are accounted for at fair value through earnings. The expected net future cash flows from servicing the loan that are to be included in measuring the fair value of the interest rate lock commitment is determined in the same manner that the fair value of a recognized servicing asset is measured. However, a separate and distinct servicing asset is not recognized for accounting purposes until the servicing rights have been contractually separated from the underlying loan by sale or securitization of the loan with servicing rights retained. See Note 17 to the Consolidated Financial Statements for more information on written loan commitments.
Goodwill
Goodwill represents the excess of the purchase price over the fair value of the net assets acquired in a business combination. Goodwill is assigned to reporting units, which are operating segments or one level below an operating segment. Goodwill is assigned to the Company's reporting units that are expected to benefit from the business combination. Goodwill is assessed annually for impairment, and more frequently if events or changes in circumstances indicate that there may be an impairment. Adverse changes in the economic environment, declining operations, unanticipated competition, loss of key personnel, or other factors could result in a decline in the implied fair value of goodwill. If the implied fair value of goodwill is less than the carrying amount, a loss would be recognized in other noninterest expense to reduce the carrying amount to the implied fair value of goodwill. A goodwill impairment analysis is comprised of two steps. Step 1, used to identify instances of potential impairment, compares the fair value of a reporting unit with its carrying amount, including goodwill. If the fair value of a reporting unit exceeds its carrying amount, including goodwill, goodwill of the reporting unit is considered not impaired. If the carrying amount of a reporting unit, including goodwill, exceeds its fair value, the second step of the goodwill impairment analysis is performed to measure the amount of impairment loss, if any. Step 2 of the goodwill impairment analysis compares the implied fair value of reporting unit goodwill with the carrying amount of that goodwill. If the carrying amount of goodwill for that reporting unit exceeds the implied fair value of that reporting unit's goodwill, an impairment loss is recognized in an amount equal to that excess. Subsequent reversals of goodwill impairment are prohibited.
GAAP also permits an entity an option to first perform a qualitative assessment to determine whether it is more likely than not that the fair value of a reporting unit is less than its carrying amount. If an entity believes, as a result of its qualitative assessment, that it is more likely than not that the fair value of a reporting unit is less than its carrying amount, the Step 1 quantitative impairment analysis described above is required. Otherwise, no further impairment testing is required. During the fourth quarter of
2012
, the Company performed its annual evaluation for goodwill impairment. This evaluation indicated no impairment of the Company's goodwill.
Non-Marketable Equity Securities
The Company is required to hold non-marketable equity securities, comprised of Federal Home Loan Bank of Seattle ("FHLB") and Federal Reserve Bank ("FRB") stock, as a condition of membership. These securities are accounted for at cost which equals par or redemption value. These securities do not have a readily determinable fair value as their ownership is restricted and there is no market for these securities. These securities can only be redeemed or sold at their par value and only to the respective issuing government supported institution or to another member institution. The Company records these non-marketable equity securities as a component of other assets which are periodically evaluated for impairment. Management considers these non-marketable equity securities to be long-term investments. Accordingly, when evaluating these securities for impairment, management considers the ultimate recoverability of the par value rather than by recognizing temporary declines in value.
Securities Sold Under Agreements to Repurchase
The Company enters into agreements under which it sells securities subject to an obligation to repurchase the same or similar securities. Under these arrangements, the Company may transfer legal control over the assets but still retain effective control through an agreement that both entitles and obligates the Company to repurchase the assets. As a result, securities sold under agreements to repurchase are accounted for as collateralized financing arrangements and not as a sale and subsequent repurchase of securities. The obligation to repurchase the securities is reflected as a liability in the Company's consolidated statements of condition, while the securities underlying the securities sold under agreements to repurchase remain in the respective asset accounts and are delivered to and held in collateral by third party trustees.
66
In April 2011, the Financial Accounting Standards Board (the “FASB”) issued Accounting Standards Update (“ASU”) No. 2011-03,
“Reconsideration of Effective Control for Repurchase Agreements.”
The provisions of ASU No. 2011-03 modify the criteria for determining when repurchase agreements would be accounted for as a secured borrowing rather than as a sale. ASU No. 2011-03 removes from the assessment of effective control the criterion requiring the transferor to have the ability to repurchase or redeem the financial assets on substantially the agreed terms, even in the event of default by the transferee. The FASB believes that contractual rights and obligations determine effective control and that there does not need to be a requirement to assess the ability to exercise those rights. ASU No. 2011-03 does not change the other existing criteria used in the assessment of effective control. The Company adopted the provisions of ASU No. 2011-03 prospectively for transactions or modifications of existing transactions that occurred on or after January 1, 2012. As the Company accounted for all of its repurchase agreements as collateralized financing arrangements prior to the adoption of ASU No. 2011-03, the adoption had no impact on the Company's Consolidated Financial Statements.
Pension and Postretirement Benefit Plans
The Company incurs certain employment-related expenses associated with its
two
pension plans and a postretirement benefit plan (the "Plans"). In order to measure the expense associated with the Plans, various assumptions are made including the discount rate, expected return on plan assets, anticipated mortality rates, and expected future healthcare costs. The assumptions are based on historical experience as well as current facts and circumstances. The Company uses a December 31 measurement date for its Plans. As of the measurement date, plan assets are determined based on fair value, generally representing observable market prices. The projected benefit obligation is primarily determined based on the present value of projected benefit distributions at an assumed discount rate.
Net periodic pension benefit costs include interest costs based on an assumed discount rate, the expected return on plan assets based on actuarially derived market-related values, and the amortization of net actuarial losses. Net periodic postretirement benefit costs include service costs, interest costs based on an assumed discount rate, and the amortization of prior service credits and net actuarial gains. Differences between expected and actual results in each year are included in the net actuarial gain or loss amount, which is recognized in other comprehensive income. The net actuarial gain or loss in excess of a
10%
corridor is amortized in net periodic benefit cost over the average remaining expected lives of the pension plan participants. The prior service credit is amortized over the average remaining service period to full eligibility for participating employees expected to receive benefits.
The Company recognizes in its statement of condition an asset for a plan's overfunded status or a liability for a plan's underfunded status. The Company also measures the Plans' assets and obligations that determine its funded status as of the end of the fiscal year and recognizes those changes in other comprehensive income, net of tax.
Income Taxes
The Parent files a consolidated federal income tax return with the Bank and its subsidiaries. Calculation of the Company's provision for income taxes requires the interpretation of income tax laws and regulations and the use of estimates and judgments in its determination. The Company is subject to examination by governmental authorities that may give rise to income tax issues due to differing interpretations. Changes to the liability for income taxes also occur due to changes in income tax rates, implementation of new business strategies, resolution of issues with taxing authorities, and newly enacted statutory, judicial, and regulatory guidance.
Deferred income taxes are provided to reflect the tax effect of temporary differences between financial statement carrying amounts and the corresponding tax basis of assets and liabilities. Deferred income taxes are calculated by applying enacted statutory tax rates and tax laws to future years in which temporary differences are expected to reverse. The impact on deferred tax assets and liabilities of a change in tax rates is recognized in income in the period that the tax rate change is enacted. A deferred tax valuation allowance is established if it is more likely than not that a deferred tax asset will not be realized.
The Company's tax sharing policy provides for the settlement of income taxes between each relevant subsidiary as if the subsidiary had filed a separate return. Payments are made to the Parent by subsidiaries with tax liabilities and subsidiaries that generate tax benefits receive payments for those benefits as used.
The Company maintains reserves for certain tax positions that arise in the normal course of business. As of
December 31, 2012
, these positions were evaluated based on an assessment of probabilities as to the likelihood of whether a liability had been incurred. Such assessments are reviewed as events occur and adjustments to the reserves are made as appropriate.
67
In evaluating a tax position for recognition, the Company judgmentally evaluates whether it is more likely than not that a tax position will be sustained upon examination, including resolution of related appeals or litigation processes, based on the technical merits of the position. If the tax position meets the more likely than not recognition threshold, the tax position is measured and recognized in the Company's Consolidated Financial Statements as the largest amount of tax benefit that, in management's judgment, is greater than
50%
likely of being realized upon ultimate settlement.
Treasury Stock
Shares of the Parent's common stock that are repurchased are recorded in treasury stock at cost. On the date of subsequent re-issuance, the treasury stock account is reduced by the cost of such stock on a first-in, first-out basis.
Earnings Per Share
Basic earnings per share is computed by dividing net income by the weighted average number of common shares outstanding for the period. Diluted earnings per share is computed by dividing net income by the weighted average number of common shares outstanding for the period, assuming conversion of all potentially dilutive common stock equivalents.
Derivative Financial Instruments
In the ordinary course of business, the Company enters into derivative financial instruments as an end-user in connection with its risk management activities and to accommodate the needs of its customers. The Company has elected not to qualify for hedge accounting methods addressed under current provisions of GAAP. Derivative financial instruments are stated at fair value on the consolidated statements of condition with changes in fair value reported in current period earnings.
Share-Based Compensation
The Company may grant share-based compensation to employees and non-employee directors in the form of restricted stock and stock options. Share-based compensation expense is measured based on the fair value of the award at the date of grant and is recognized in the statement of income on a straight-line basis over the requisite service period for service-based awards. The fair value of restricted stock is determined based on the closing price of the Parent's common stock on the date of grant. The Company recognizes compensation expense related to restricted stock on a straight-line basis over the vesting period for service-based awards, plus additional recognition of costs associated with accelerated vesting based on the projected attainment of Company performance measures. The fair value of stock options is estimated at the date of grant using a Black-Scholes option pricing model and related assumptions. The Company uses historical data to predict option exercise and employee termination behavior. Expected volatilities are based on the historical volatility of the Parent's common stock. The expected term of options granted is derived from actual historical exercise activity and represents the period of time that options granted are expected to be outstanding. The risk-free rate is derived from the U.S. Treasury yield curve in effect at the time of grant based on the expected life of the option. The dividend yield is equal to the dividend yield of the Parent's common stock at the time of grant. The amortization of share-based compensation reflects estimated forfeitures, adjusted for actual forfeiture experience. Share-based compensation is recorded in the statements of income as a component of salaries and benefits for employees and as a component of other noninterest expense for non-employee directors, with a corresponding increase to capital surplus in shareholders' equity. As share-based compensation expense is recognized, a deferred tax asset is established that represents an estimate of future income tax deductions from the release of restrictions or the exercise of stock options.
Advertising Costs
Advertising costs are expensed as incurred. Advertising costs were
$4.7 million
,
$5.5 million
, and
$5.0 million
for the years ended
December 31, 2012
,
2011
, and
2010
, respectively.
International Operations
The Bank has operations that are conducted in certain Pacific Islands that are denominated in U.S. dollars. These operations are classified as domestic.
68
Fair Value Measurements
Fair value measurements apply whenever GAAP requires or permits assets or liabilities to be measured at fair value either on a recurring or nonrecurring basis. Fair value is defined as the price that would be received to sell an asset or paid to transfer a liability in the principal or most advantageous market for an asset or liability in an orderly transaction between market participants at the measurement date. Fair value is based on the assumptions that management believes market participants would use when pricing an asset or liability. Fair value measurement and disclosure guidance established a three-level fair value hierarchy that prioritizes the use of inputs used in valuation methodologies. Management maximizes the use of observable inputs and minimizes the use of unobservable inputs when determining fair value measurements. Management reviews and updates the fair value hierarchy classifications of the Company's assets and liabilities on a quarterly basis. The three-level fair value hierarchy is as follows:
|
Level 1:
|
Inputs to the valuation methodology are quoted prices, unadjusted, for identical assets or liabilities in active markets. A quoted price in an active market provides the most reliable evidence of fair value and shall be used to measure fair value whenever available. A contractually binding sales price also provides reliable evidence of fair value.
|
|
Level 2:
|
Inputs to the valuation methodology include quoted prices for similar assets or liabilities in active markets; inputs to the valuation methodology include quoted prices for identical or similar assets or liabilities in markets that are not active; or inputs to the valuation methodology that utilize model-based techniques for which all significant assumptions are observable in the market.
|
|
Level 3:
|
Inputs to the valuation methodology are unobservable and significant to the fair value measurement; inputs to the valuation methodology that utilize model-based techniques for which significant assumptions are not observable in the market; or inputs to the valuation methodology that requires significant management judgment or estimation, some of which may be internally developed.
|
In determining fair value measurements, management assesses whether the volume and level of activity for an asset or liability have significantly decreased. In such instances, management determines whether recent quoted prices are associated with illiquid or inactive markets. If management concludes that quoted prices are associated with illiquid or inactive markets, adjustments to quoted prices may be necessary or management may conclude that a change in valuation technique or the use of multiple valuation techniques may be appropriate to estimate an asset or liability's fair value. See Note 14 and Note 19 to the Consolidated Financial Statements for the required fair value measurement disclosures.
In May 2011, the FASB issued ASU No. 2011-04,
“Amendments to Achieve Common Fair Value Measurement and Disclosure Requirements in U.S. GAAP and IFRSs.”
The provisions of ASU No. 2011-04 result in a consistent definition of fair value and common requirements for the measurement of and disclosure about fair value between U.S. GAAP and International Financial Reporting Standards (“IFRS”). The changes to U.S. GAAP as a result of ASU No. 2011-04 are as follows: (1) The concepts of highest and best use and valuation premise are only relevant when measuring the fair value of nonfinancial assets (that is, it does not apply to financial assets or any liabilities); (2) U.S. GAAP currently prohibits application of a blockage factor in valuing financial instruments with quoted prices in active markets. ASU No. 2011-04 extends that prohibition to all fair value measurements; (3) An exception is provided to the basic fair value measurement principles for an entity that holds a group of financial assets and financial liabilities with offsetting positions in market risks or counterparty credit risk that are managed on the basis of the entity's net exposure to either of those risks. This exception allows the entity, if certain criteria are met, to measure the fair value of the net asset or liability position in a manner consistent with how market participants would price the net risk position; (4) Aligns the fair value measurement of instruments classified within an entity's shareholders' equity with the guidance for liabilities; and (5) Disclosure requirements have been expanded for Level 3 fair value measurements to disclose quantitative information about unobservable inputs and assumptions used, to describe the valuation processes used by the entity, and to qualitatively describe the sensitivity of fair value measurements to changes in unobservable inputs and the interrelationships between those inputs. In addition, entities must report the level in the fair value hierarchy of items that are not measured at fair value in the statement of condition but whose fair value must be disclosed. The Company adopted the provisions of ASU No. 2011-04 effective January 1, 2012. The fair value measurement provisions of ASU No. 2011-04 had no impact on the Company's statements of income and condition. See Note 19 to the Consolidated Financial Statements for the expanded disclosures required by ASU No. 2011-04.
Comprehensive Income
In June 2011, the FASB issued ASU No. 2011-05, “
Presentation of Comprehensive Income.”
The provisions of ASU No. 2011-05 allow an entity the option to present the total of comprehensive income, the components of net income, and the components of other comprehensive income either in a single continuous statement of comprehensive income or in two separate but consecutive
69
statements. In both options, an entity is required to present each component of net income along with total net income, each component of other comprehensive income along with a total for other comprehensive income, and a total amount for comprehensive income. Under either method, entities are required to present on the face of the financial statements reclassification adjustments for items that are reclassified from other comprehensive income to net income in the statement(s) where the components of net income and the components of other comprehensive income are presented. ASU No. 2011-05 also eliminates the option to present the components of other comprehensive income as part of the statement of changes in shareholders' equity but does not change the items that must be reported in other comprehensive income or when an item of other comprehensive income must be reclassified to net income. ASU No. 2011-05 was effective for the Company's interim reporting period beginning on or after January 1, 2012, with retrospective application required. In December 2011, the FASB issued ASU No. 2011-12,
“Deferral of the Effective Date for Amendments to the Presentation of Reclassifications of Items Out of Accumulated Other Comprehensive Income in Accounting Standards Update No. 2011-05.”
The provisions of ASU No. 2011-12 defer indefinitely the requirement for entities to present reclassification adjustments out of accumulated other comprehensive income by component in both the statement in which net income is presented and the statement in which other comprehensive income is presented. ASU No. 2011-12, which shares the same effective date as ASU No. 2011-05, does not defer the requirement for entities to present components of comprehensive income in either a single continuous statement of comprehensive income or in two separate but consecutive statements. The Company adopted the provisions of ASU No. 2011-05 and ASU No. 2011-12, which resulted in a new statement of comprehensive income, for the interim period ended March 31, 2012. The adoption of ASU No. 2011-05 and ASU No. 2011-12 had no impact on the Company's statements of income, condition, shareholders' equity, and cash flows.
Future Application of Accounting Pronouncements
In December 2011, the FASB issued ASU No. 2011-11,
“Disclosures About Offsetting Assets and Liabilities.”
This project began as an attempt to converge the offsetting requirements under U.S. GAAP and IFRS. However, as the FASB and International Accounting Standards Board were not able to reach a converged solution with regards to offsetting requirements, they each developed convergent disclosure requirements to assist in reconciling differences in the offsetting requirements under U.S. GAAP and IFRS. The new disclosure requirements mandate that entities disclose both gross and net information about instruments and transactions eligible for offset in the statement of financial position as well as instruments and transactions subject to an agreement similar to a master netting arrangement. ASU No. 2011-11 also requires disclosure of collateral received and posted in connection with master netting agreements or similar arrangements. In January 2013, the FASB issued ASU No. 2013-01,
"Clarifying the Scope of Disclosures about Offsetting Assets and Liabilities."
The provisions of ASU No. 2013-01 limits the scope of the new balance sheet offsetting disclosures to the following financial instruments, to the extent they are offset in the financial statements or subject to an enforceable master netting arrangement or similar agreement, irrespective of whether they are offset in the statement of financial position: (1) derivatives; (2) repurchase agreements and reverse repurchase agreements; and (3) securities borrowing and securities lending transactions. ASU No. 2013-01, which shares the same effective date as ASU No. 2011-11, is effective for interim and annual reporting periods beginning on or after January 1, 2013. As the provisions of ASU No. 2011-11 and ASU No. 2013-01 only impact the disclosure requirements related to the offsetting of assets and liabilities, the adoption will have no impact on the Company's statements of income and condition.
In February 2013, the FASB issued ASU No. 2013-02,
"Reporting of Amounts Reclassified Out of Accumulated Other Comprehensive Income,"
to improve the transparency of reporting these reclassifications. ASU No. 2013-02 does not amend any existing requirements for reporting net income or other comprehensive income in the financial statements. ASU No. 2013-02 requires an entity to disaggregate the total change of each component of other comprehensive income (e.g., unrealized gains or losses on available-for-sale investment securities) and separately present reclassification adjustments and current period other comprehensive income. The provisions of ASU No. 2013-02 also requires that entities present either in a single note or parenthetically on the face of the financial statements, the effect of significant amounts reclassified from each component of accumulated other comprehensive income based on its source (e.g., unrealized gains or losses on available-for-sale investment securities) and the income statement line item affected by the reclassification (e.g., realized gains (losses) on sales of investment securities). If a component is not required to be reclassified to net income in its entirety (e.g., amortization of defined benefit plan items), entities would instead cross reference to the related note to the financial statements for additional information (e.g., pension footnote). ASU No. 2013-02 is effective for interim and annual reporting periods beginning after December 15, 2012. The adoption of ASU No. 2013-02 is expected to have no impact on the Company's statements of income and condition.
The FRB requires bank subsidiaries to maintain minimum average reserve balances based on the amount of deposits held. The Bank's average required reserve balances were
$93.6 million
and
$63.1 million
as of
December 31, 2012
and
2011
, respectively.
70
The amortized cost, gross unrealized gains and losses, and fair value of the Company's investment securities as of
December 31, 2012
,
2011
, and
2010
were as follows:
|
(dollars in thousands)
|
Amortized
Cost |
|
Gross
Unrealized Gains |
|
Gross
Unrealized Losses |
|
Fair
Value |
|
|||||||
|
December 31, 2012
|
|||||||||||||||
|
Available-for-Sale:
|
|||||||||||||||
|
Debt Securities Issued by the U.S. Treasury and Government Agencies
|
$
|
855,070
|
|
$
|
14,936
|
|
$
|
(17
|
)
|
$
|
869,989
|
|
|||
|
Debt Securities Issued by States and Political Subdivisions
|
753,207
|
|
30,159
|
|
(955
|
)
|
782,411
|
|
|||||||
|
Debt Securities Issued by Corporations
|
82,450
|
|
1,984
|
|
—
|
|
84,434
|
|
|||||||
|
Mortgage-Backed Securities Issued by
|
|||||||||||||||
|
Government Agencies
|
1,565,724
|
|
29,190
|
|
(1,489
|
)
|
1,593,425
|
|
|||||||
|
U.S. Government-Sponsored Enterprises
|
35,234
|
|
2,064
|
|
—
|
|
37,298
|
|
|||||||
|
Total Mortgage-Backed Securities
|
1,600,958
|
|
31,254
|
|
(1,489
|
)
|
1,630,723
|
|
|||||||
|
Total
|
$
|
3,291,685
|
|
$
|
78,333
|
|
$
|
(2,461
|
)
|
$
|
3,367,557
|
|
|||
|
Held-to-Maturity:
|
|||||||||||||||
|
Debt Securities Issued by the U.S. Treasury and Government Agencies
|
$
|
190,168
|
|
$
|
5,198
|
|
$
|
—
|
|
$
|
195,366
|
|
|||
|
Debt Securities Issued by Corporations
|
24,000
|
|
4
|
|
—
|
|
24,004
|
|
|||||||
|
Mortgage-Backed Securities Issued by
|
|||||||||||||||
|
Government Agencies
|
3,349,403
|
|
86,673
|
|
(1,366
|
)
|
3,434,710
|
|
|||||||
|
U.S. Government-Sponsored Enterprises
|
31,494
|
|
2,102
|
|
—
|
|
33,596
|
|
|||||||
|
Total Mortgage-Backed Securities
|
3,380,897
|
|
88,775
|
|
(1,366
|
)
|
3,468,306
|
|
|||||||
|
Total
|
$
|
3,595,065
|
|
$
|
93,977
|
|
$
|
(1,366
|
)
|
$
|
3,687,676
|
|
|||
|
December 31, 2011
|
|||||||||||||||
|
Available-for-Sale:
|
|||||||||||||||
|
Debt Securities Issued by the U.S. Treasury and Government Agencies
|
$
|
1,220,282
|
|
$
|
11,204
|
|
$
|
(468
|
)
|
$
|
1,231,018
|
|
|||
|
Debt Securities Issued by States and Political Subdivisions
|
391,276
|
|
15,783
|
|
—
|
|
407,059
|
|
|||||||
|
Debt Securities Issued by Corporations
|
97,917
|
|
607
|
|
(2,137
|
)
|
96,387
|
|
|||||||
|
Mortgage-Backed Securities Issued by
|
|
||||||||||||||
|
Government Agencies
|
1,618,913
|
|
38,066
|
|
(1,107
|
)
|
1,655,872
|
|
|||||||
|
U.S. Government-Sponsored Enterprises
|
58,548
|
|
3,001
|
|
—
|
|
61,549
|
|
|||||||
|
Total Mortgage-Backed Securities
|
1,677,461
|
|
41,067
|
|
(1,107
|
)
|
1,717,421
|
|
|||||||
|
Total
|
$
|
3,386,936
|
|
$
|
68,661
|
|
$
|
(3,712
|
)
|
$
|
3,451,885
|
|
|||
|
Held-to-Maturity:
|
|||||||||||||||
|
Debt Securities Issued by the U.S. Treasury and Government Agencies
|
$
|
179,474
|
|
$
|
6,704
|
|
$
|
—
|
|
$
|
186,178
|
|
|||
|
Mortgage-Backed Securities Issued by
|
|
||||||||||||||
|
Government Agencies
|
3,429,038
|
|
89,801
|
|
(2,918
|
)
|
3,515,921
|
|
|||||||
|
U.S. Government-Sponsored Enterprises
|
49,284
|
|
2,823
|
|
—
|
|
52,107
|
|
|||||||
|
Total Mortgage-Backed Securities
|
3,478,322
|
|
92,624
|
|
(2,918
|
)
|
3,568,028
|
|
|||||||
|
Total
|
$
|
3,657,796
|
|
$
|
99,328
|
|
$
|
(2,918
|
)
|
$
|
3,754,206
|
|
|||
|
December 31, 2010
|
|||||||||||||||
|
Available-for-Sale:
|
|||||||||||||||
|
Debt Securities Issued by the U.S. Treasury and Government Agencies
|
$
|
536,770
|
|
$
|
19,131
|
|
$
|
(45
|
)
|
$
|
555,856
|
|
|||
|
Debt Securities Issued by States and Political Subdivisions
|
113,715
|
|
1,477
|
|
(1,583
|
)
|
113,609
|
|
|||||||
|
Debt Securities Issued by U.S. Government-Sponsored Enterprises
|
500
|
|
5
|
|
—
|
|
505
|
|
|||||||
|
Mortgage-Backed Securities Issued by
|
|||||||||||||||
|
Government Agencies
|
5,696,907
|
|
84,008
|
|
(30,887
|
)
|
5,750,028
|
|
|||||||
|
U.S. Government-Sponsored Enterprises
|
109,259
|
|
4,617
|
|
—
|
|
113,876
|
|
|||||||
|
Total Mortgage-Backed Securities
|
5,806,166
|
|
88,625
|
|
(30,887
|
)
|
5,863,904
|
|
|||||||
|
Total
|
$
|
6,457,151
|
|
$
|
109,238
|
|
$
|
(32,515
|
)
|
$
|
6,533,874
|
|
|||
|
Held-to-Maturity:
|
|||||||||||||||
|
Mortgage-Backed Securities Issued by
|
|||||||||||||||
|
Government Agencies
|
$
|
47,368
|
|
$
|
2,959
|
|
$
|
—
|
|
$
|
50,327
|
|
|||
|
U.S. Government-Sponsored Enterprises
|
79,881
|
|
3,820
|
|
—
|
|
83,701
|
|
|||||||
|
Total
|
$
|
127,249
|
|
$
|
6,779
|
|
$
|
—
|
|
$
|
134,028
|
|
|||
71
During the year ended December 31, 2011, the Company reclassified at fair value approximately
$3.2 billion
in available-for-sale investment securities to the held-to-maturity category. The related unrealized after-tax gains of approximately
$27.9 million
remained in accumulated other comprehensive income to be amortized over the estimated remaining life of the securities as an adjustment of yield, offsetting the related amortization of the premium or accretion of the discount on the transferred securities. No gains or losses were recognized at the time of reclassification. Management considers the held-to-maturity classification of these investment securities to be appropriate as the Company has the positive intent and ability to hold these securities to maturity.
The table below presents an analysis of the contractual maturities of the Company's investment securities as of
December 31, 2012
. Mortgage-backed securities are disclosed separately in the table below as these investment securities may prepay prior to their scheduled contractual maturity dates.
|
(dollars in thousands)
|
Amortized
Cost |
|
Fair Value
|
|
|||
|
Available-for-Sale:
|
|||||||
|
Due in One Year or Less
|
$
|
436,741
|
|
$
|
438,156
|
|
|
|
Due After One Year Through Five Years
|
197,603
|
|
204,713
|
|
|||
|
Due After Five Years Through Ten Years
|
427,842
|
|
440,818
|
|
|||
|
Due After Ten Years
|
628,541
|
|
653,147
|
|
|||
|
1,690,727
|
|
1,736,834
|
|
||||
|
Mortgage-Backed Securities Issued by
|
|||||||
|
Government Agencies
|
1,565,724
|
|
1,593,425
|
|
|||
|
U.S. Government-Sponsored Enterprises
|
35,234
|
|
37,298
|
|
|||
|
Total Mortgage-Backed Securities
|
1,600,958
|
|
1,630,723
|
|
|||
|
Total
|
$
|
3,291,685
|
|
$
|
3,367,557
|
|
|
|
Held-to-Maturity:
|
|||||||
|
Due in One Year or Less
|
$
|
50,125
|
|
$
|
50,512
|
|
|
|
Due After One Year Through Five Years
|
140,043
|
|
144,854
|
|
|||
|
Due After Ten Years
|
24,000
|
|
24,004
|
|
|||
|
214,168
|
|
219,370
|
|
||||
|
Mortgage-Backed Securities Issued by
|
|||||||
|
Government Agencies
|
3,349,403
|
|
3,434,710
|
|
|||
|
U.S. Government-Sponsored Enterprises
|
31,494
|
|
33,596
|
|
|||
|
Total Mortgage-Backed Securities
|
3,380,897
|
|
3,468,306
|
|
|||
|
Total
|
$
|
3,595,065
|
|
$
|
3,687,676
|
|
|
Investment securities with carrying values of
$2.9 billion
,
$3.6 billion
, and
$3.2 billion
as of
December 31, 2012
,
2011
, and
2010
, respectively, were pledged to secure deposits of governmental entities and securities sold under agreements to repurchase. As of
December 31, 2012
,
2011
, and
2010
, the Company did not pledge any investment securities where the secured party had the right to sell or repledge the collateral.
Gross gains and losses from the sales of investment securities for the years ended
December 31, 2012
,
2011
, and
2010
were as follows:
|
(dollars in thousands)
|
2012
|
|
2011
|
|
2010
|
|
|||||
|
Gross Gains on Sales of Investment Securities
|
$
|
255
|
|
$
|
10,874
|
|
$
|
42,867
|
|
||
|
Gross Losses on Sales of Investment Securities
|
(332
|
)
|
(4,508
|
)
|
(19
|
)
|
|||||
|
Net Gains (Losses) on Sales of Investment Securities
|
$
|
(77
|
)
|
$
|
6,366
|
|
$
|
42,848
|
|
||
The Company's sales of investment securities for the year ended
December 31, 2012
were from our available-for-sale portfolio due to management's ongoing evaluation of the portfolio in response to established asset/liability management objectives.
72
The Company's investment securities in an unrealized loss position, segregated by continuous length of impairment, were as follows:
|
Less Than 12 Months
|
12 Months or Longer
|
Total
|
|||||||||||||||||||||
|
(dollars in thousands)
|
Fair Value
|
|
Gross
Unrealized Losses |
|
Fair Value
|
|
Gross
Unrealized Losses |
|
Fair Value
|
|
Gross
Unrealized Losses |
|
|||||||||||
|
December 31, 2012
|
|||||||||||||||||||||||
|
Available-for-Sale:
|
|||||||||||||||||||||||
|
Debt Securities Issued by the U.S. Treasury
and Government Agencies |
$
|
2,295
|
|
$
|
(14
|
)
|
$
|
564
|
|
$
|
(3
|
)
|
$
|
2,859
|
|
$
|
(17
|
)
|
|||||
|
Debt Securities Issued by
States and Political Subdivisions |
72,400
|
|
(955
|
)
|
—
|
|
—
|
|
72,400
|
|
(955
|
)
|
|||||||||||
|
Mortgage-Backed Securities Issued by
|
|||||||||||||||||||||||
|
Government Agencies
|
269,208
|
|
(1,254
|
)
|
22,389
|
|
(235
|
)
|
291,597
|
|
(1,489
|
)
|
|||||||||||
|
Total
|
$
|
343,903
|
|
$
|
(2,223
|
)
|
$
|
22,953
|
|
$
|
(238
|
)
|
$
|
366,856
|
|
$
|
(2,461
|
)
|
|||||
|
Held-to-Maturity:
|
|||||||||||||||||||||||
|
Mortgage-Backed Securities Issued by
|
|||||||||||||||||||||||
|
Government Agencies
|
$
|
351,762
|
|
$
|
(1,366
|
)
|
$
|
—
|
|
$
|
—
|
|
$
|
351,762
|
|
$
|
(1,366
|
)
|
|||||
|
Total
|
$
|
351,762
|
|
$
|
(1,366
|
)
|
$
|
—
|
|
$
|
—
|
|
$
|
351,762
|
|
$
|
(1,366
|
)
|
|||||
|
December 31, 2011
|
|||||||||||||||||||||||
|
Available-for-Sale:
|
|||||||||||||||||||||||
|
Debt Securities Issued by the U.S. Treasury
and Government Agencies |
$
|
127,644
|
|
$
|
(464
|
)
|
$
|
920
|
|
$
|
(4
|
)
|
$
|
128,564
|
|
$
|
(468
|
)
|
|||||
|
Debt Securities Issued by Corporations
|
38,059
|
|
(2,137
|
)
|
—
|
|
—
|
|
38,059
|
|
(2,137
|
)
|
|||||||||||
|
Mortgage-Backed Securities Issued by
|
|||||||||||||||||||||||
|
Government Agencies
|
168,714
|
|
(833
|
)
|
34,824
|
|
(274
|
)
|
203,538
|
|
(1,107
|
)
|
|||||||||||
|
Total
|
$
|
334,417
|
|
$
|
(3,434
|
)
|
$
|
35,744
|
|
$
|
(278
|
)
|
$
|
370,161
|
|
$
|
(3,712
|
)
|
|||||
|
Held-to-Maturity:
|
|||||||||||||||||||||||
|
Mortgage-Backed Securities Issued by
|
|||||||||||||||||||||||
|
Government Agencies
|
$
|
559,012
|
|
$
|
(2,918
|
)
|
$
|
—
|
|
$
|
—
|
|
$
|
559,012
|
|
$
|
(2,918
|
)
|
|||||
|
Total
|
$
|
559,012
|
|
$
|
(2,918
|
)
|
$
|
—
|
|
$
|
—
|
|
$
|
559,012
|
|
$
|
(2,918
|
)
|
|||||
The Company does not believe that the investment securities that were in an unrealized loss position as of
December 31, 2012
, which was comprised of
54
securities, represent an other-than-temporary impairment. Total gross unrealized losses were primarily attributable to changes in interest rates, relative to when the investment securities were purchased, and not due to the credit quality of the investment securities. As of
December 31, 2012
, the gross unrealized losses reported for mortgage-backed securities were related to investment securities issued by the Government National Mortgage Association. The Company does not intend to sell the investment securities that were in an unrealized loss position and it is not more likely than not that the Company will be required to sell the investment securities before recovery of their amortized cost bases, which may be at maturity.
Substantially all of the Company's interest income on investment securities for the years ended
December 31, 2012
,
2011
, and
2010
, was comprised of taxable interest income. The income tax benefit related to the Company's net realized losses on the sales of investment securities was not material for the year ended
December 31, 2012
. The income tax expense related to the Company's net realized gains on the sales of investment securities was
$2.5 million
and
$16.7 million
for the years ended
December 31, 2011
and
2010
, respectively. Net unrealized gains on the Company's available-for-sale investment securities, net of tax, were
$46.0 million
,
$39.4 million
, and
$46.5 million
as of
December 31, 2012
,
2011
, and
2010
, respectively. Net unrealized gains on the Company's held-to-maturity investment securities, net of tax, were
$13.8 million
and
$23.5 million
as of
December 31, 2012
and
2011
, respectively, and were related to the transfers of securities from the available-for-sale portfolio. These net unrealized gains, net of tax, were recorded as a component of accumulated other comprehensive income.
73
Loans and Leases
The Company's loan and lease portfolio was comprised of the following as of December 31:
|
(dollars in thousands)
|
2012
|
|
2011
|
|
2010
|
|
2009
|
|
2008
|
|
|||||||||
|
Commercial
|
|||||||||||||||||||
|
Commercial and Industrial
|
$
|
829,512
|
|
$
|
817,170
|
|
$
|
772,624
|
|
$
|
795,167
|
|
$
|
1,053,781
|
|
||||
|
Commercial Mortgage
|
1,097,425
|
|
938,250
|
|
863,385
|
|
841,431
|
|
740,779
|
|
|||||||||
|
Construction
|
113,987
|
|
98,669
|
|
80,325
|
|
108,395
|
|
153,952
|
|
|||||||||
|
Lease Financing
|
274,969
|
|
311,928
|
|
334,997
|
|
412,933
|
|
468,140
|
|
|||||||||
|
Total Commercial
|
2,315,893
|
|
2,166,017
|
|
2,051,331
|
|
2,157,926
|
|
2,416,652
|
|
|||||||||
|
Consumer
|
|||||||||||||||||||
|
Residential Mortgage
|
2,349,916
|
|
2,215,892
|
|
2,094,189
|
|
2,190,677
|
|
2,461,824
|
|
|||||||||
|
Home Equity
|
770,376
|
|
780,691
|
|
807,479
|
|
921,571
|
|
1,033,221
|
|
|||||||||
|
Automobile
|
209,832
|
|
192,506
|
|
209,008
|
|
283,937
|
|
369,789
|
|
|||||||||
|
Other
1
|
208,504
|
|
183,198
|
|
173,785
|
|
205,674
|
|
248,747
|
|
|||||||||
|
Total Consumer
|
3,538,628
|
|
3,372,287
|
|
3,284,461
|
|
3,601,859
|
|
4,113,581
|
|
|||||||||
|
Total Loans and Leases
|
$
|
5,854,521
|
|
$
|
5,538,304
|
|
$
|
5,335,792
|
|
$
|
5,759,785
|
|
$
|
6,530,233
|
|
||||
1
Comprised of other revolving credit, installment, and lease financing.
Total loans and leases were reported net of unearned income of
$71.9 million
and
$97.6 million
as of
December 31, 2012
and
2011
, respectively.
Commercial loans and residential mortgage loans of
$1.0 billion
and
$1.1 billion
were pledged to secure an undrawn FRB line of credit as of
December 31, 2012
and
2011
, respectively.
As of
December 31, 2012
and
2011
, residential mortgage loans of approximately
$1.6 billion
and
$1.3 billion
, respectively, were pledged under a blanket pledge arrangement to secure FHLB advances. See Note 10 for FHLB advances outstanding as of
December 31, 2012
. The Company had no FHLB advances outstanding as of December 31, 2011.
Net gains related to sales of residential mortgage loans, recorded as a component of mortgage banking income, were
$16.0 million
,
$5.8 million
, and
$7.9 million
for the years ended
December 31, 2012
,
2011
, and
2010
, respectively. There were no net gains or losses related to sales of commercial loans for the years ended
December 31, 2012
,
2011
, and
2010
.
Most of the Company's lending activity is with customers located in the State of Hawaii. A substantial portion of the Company's real estate loans are secured by real estate in Hawaii.
74
Allowance for Loan and Lease Losses
The following presents by portfolio segment, the activity in the Allowance for the years ended
December 31, 2012
and
2011
. The following also presents by portfolio segment, the balance in the Allowance disaggregated on the basis of the Company's impairment measurement method and the related recorded investment in loans and leases as of
December 31, 2012
and
2011
.
|
(dollars in thousands)
|
Commercial
|
|
Consumer
|
|
Total
|
|
|||||
|
For the Year Ended December 31, 2012
|
|||||||||||
|
Allowance for Loan and Lease Losses:
|
|||||||||||
|
Balance at Beginning of Period
|
$
|
80,562
|
|
$
|
58,044
|
|
$
|
138,606
|
|
||
|
Loans and Leases Charged-Off
|
(3,947
|
)
|
(20,212
|
)
|
(24,159
|
)
|
|||||
|
Recoveries on Loans and Leases Previously Charged-Off
|
4,191
|
|
9,240
|
|
13,431
|
|
|||||
|
Net Loans and Leases Charged-Off
|
244
|
|
(10,972
|
)
|
(10,728
|
)
|
|||||
|
Provision for Credit Losses
|
(8,102
|
)
|
9,081
|
|
979
|
|
|||||
|
Balance at End of Period
|
$
|
72,704
|
|
$
|
56,153
|
|
$
|
128,857
|
|
||
|
As of December 31, 2012
|
|||||||||||
|
Allowance for Loan and Lease Losses:
|
|||||||||||
|
Individually Evaluated for Impairment
|
$
|
161
|
|
$
|
3,564
|
|
$
|
3,725
|
|
||
|
Collectively Evaluated for Impairment
|
72,543
|
|
52,589
|
|
125,132
|
|
|||||
|
Total
|
$
|
72,704
|
|
$
|
56,153
|
|
$
|
128,857
|
|
||
|
Recorded Investment in Loans and Leases:
|
|||||||||||
|
Individually Evaluated for Impairment
|
$
|
13,098
|
|
$
|
37,500
|
|
$
|
50,598
|
|
||
|
Collectively Evaluated for Impairment
|
2,302,795
|
|
3,501,128
|
|
5,803,923
|
|
|||||
|
Total
|
$
|
2,315,893
|
|
$
|
3,538,628
|
|
$
|
5,854,521
|
|
||
|
For the Year Ended December 31, 2011
|
|||||||||||
|
Allowance for Loan and Lease Losses:
|
|||||||||||
|
Balance at Beginning of Period
|
$
|
80,977
|
|
$
|
66,381
|
|
$
|
147,358
|
|
||
|
Loans and Leases Charged-Off
|
(8,112
|
)
|
(28,648
|
)
|
(36,760
|
)
|
|||||
|
Recoveries on Loans and Leases Previously Charged-Off
|
6,500
|
|
8,818
|
|
15,318
|
|
|||||
|
Net Loans and Leases Charged-Off
|
(1,612
|
)
|
(19,830
|
)
|
(21,442
|
)
|
|||||
|
Provision for Credit Losses
|
1,197
|
|
11,493
|
|
12,690
|
|
|||||
|
Balance at End of Period
|
$
|
80,562
|
|
$
|
58,044
|
|
$
|
138,606
|
|
||
|
As of December 31, 2011
|
|||||||||||
|
Allowance for Loan and Lease Losses:
|
|||||||||||
|
Individually Evaluated for Impairment
|
$
|
1,195
|
|
$
|
4,256
|
|
$
|
5,451
|
|
||
|
Collectively Evaluated for Impairment
|
79,367
|
|
53,788
|
|
133,155
|
|
|||||
|
Total
|
$
|
80,562
|
|
$
|
58,044
|
|
$
|
138,606
|
|
||
|
Recorded Investment in Loans and Leases:
|
|||||||||||
|
Individually Evaluated for Impairment
|
$
|
15,135
|
|
$
|
32,465
|
|
$
|
47,600
|
|
||
|
Collectively Evaluated for Impairment
|
2,150,882
|
|
3,339,822
|
|
5,490,704
|
|
|||||
|
Total
|
$
|
2,166,017
|
|
$
|
3,372,287
|
|
$
|
5,538,304
|
|
||
75
Credit Quality Indicators
The Company uses several credit quality indicators to manage credit risk in an ongoing manner. The Company uses an internal credit risk rating system that categorizes loans and leases into pass, special mention, or classified categories. Credit risk ratings are applied individually to those classes of loans and leases that have significant or unique credit characteristics that benefit from a case-by-case evaluation. These are typically loans and leases to businesses or individuals in the classes which comprise the commercial portfolio segment. Groups of loans and leases that are underwritten and structured using standardized criteria and characteristics, such as statistical models (e.g., credit scoring or payment performance), are typically risk-rated and monitored collectively. These are typically loans and leases to individuals in the classes which comprise the consumer portfolio segment.
The following are the definitions of the Company's credit quality indicators:
|
Pass:
|
Loans and leases in all classes within the commercial and consumer portfolio segments that are not adversely rated, are contractually current as to principal and interest, and are otherwise in compliance with the contractual terms of the loan or lease agreement. Management believes that there is a low likelihood of loss related to those loans and leases that are considered pass.
|
|
Special Mention:
|
Loans and leases in the classes within the commercial portfolio segment that have potential weaknesses that deserve management's close attention. If not addressed, these potential weaknesses may result in deterioration of the repayment prospects for the loan or lease. The special mention credit quality indicator is not used for classes of loans and leases that are included in the consumer portfolio segment. Management believes that there is a moderate likelihood of some loss related to those loans and leases that are considered special mention.
|
|
Classified:
|
Loans and leases in the classes within the commercial portfolio segment that are inadequately protected by the sound worth and paying capacity of the borrower or of the collateral pledged, if any. Classified loans and leases are also those in the classes within the consumer portfolio segment that are past due
90
days or more as to principal or interest. Residential mortgage loans that are past due
90
days or more as to principal or interest may be considered pass if the Company is in the process of collection and the current loan-to-value ratio is
60%
or less. Home equity loans that are past due
90
days or more as to principal or interest may be considered pass if the Company is in the process of collection, the first mortgage is with the Company, and the current combined loan-to-value ratio is
60%
or less. Residential mortgage and home equity loans may be current as to principal and interest, but may be considered classified for a period of up to
six
months following a loan modification. Following a period of demonstrated performance in accordance with the modified contractual terms, the loan may be removed from classified status. Management believes that there is a distinct possibility that the Company will sustain some loss if the deficiencies related to classified loans and leases are not corrected in a timely manner.
|
76
The Company's credit quality indicators are periodically updated on a case-by-case basis. The following presents by class and by credit quality indicator, the recorded investment in the Company's loans and leases as of
December 31, 2012
and
2011
.
|
December 31, 2012
|
|||||||||||||||||||
|
(dollars in thousands)
|
Commercial
and Industrial |
|
Commercial
Mortgage |
|
Construction
|
|
Lease
Financing |
|
Total
Commercial |
|
|||||||||
|
Pass
|
$
|
779,654
|
|
$
|
1,018,128
|
|
$
|
96,058
|
|
$
|
247,401
|
|
$
|
2,141,241
|
|
||||
|
Special Mention
|
22,759
|
|
23,848
|
|
15,839
|
|
26,540
|
|
88,986
|
|
|||||||||
|
Classified
|
27,099
|
|
55,449
|
|
2,090
|
|
1,028
|
|
85,666
|
|
|||||||||
|
Total
|
$
|
829,512
|
|
$
|
1,097,425
|
|
$
|
113,987
|
|
$
|
274,969
|
|
$
|
2,315,893
|
|
||||
|
(dollars in thousands)
|
Residential
Mortgage |
|
Home
Equity |
|
Automobile
|
|
Other
1
|
|
Total
Consumer |
|
|||||||||
|
Pass
|
$
|
2,326,216
|
|
$
|
766,912
|
|
$
|
209,646
|
|
$
|
207,917
|
|
$
|
3,510,691
|
|
||||
|
Classified
|
23,700
|
|
3,464
|
|
186
|
|
587
|
|
27,937
|
|
|||||||||
|
Total
|
$
|
2,349,916
|
|
$
|
770,376
|
|
$
|
209,832
|
|
$
|
208,504
|
|
$
|
3,538,628
|
|
||||
|
Total Recorded Investment in Loans and Leases
|
$
|
5,854,521
|
|
||||||||||||||||
|
December 31, 2011
|
|||||||||||||||||||
|
(dollars in thousands)
|
Commercial
and Industrial |
|
Commercial
Mortgage |
|
Construction
|
|
Lease
Financing |
|
Total
Commercial |
|
|||||||||
|
Pass
|
$
|
765,339
|
|
$
|
859,891
|
|
$
|
83,722
|
|
$
|
282,081
|
|
$
|
1,991,033
|
|
||||
|
Special Mention
|
30,316
|
|
43,805
|
|
370
|
|
26,257
|
|
100,748
|
|
|||||||||
|
Classified
|
21,515
|
|
34,554
|
|
14,577
|
|
3,590
|
|
74,236
|
|
|||||||||
|
Total
|
$
|
817,170
|
|
$
|
938,250
|
|
$
|
98,669
|
|
$
|
311,928
|
|
$
|
2,166,017
|
|
||||
|
(dollars in thousands)
|
Residential
Mortgage |
|
Home
Equity |
|
Automobile
|
|
Other
1
|
|
Total
Consumer |
|
|||||||||
|
Pass
|
$
|
2,186,063
|
|
$
|
776,473
|
|
$
|
192,336
|
|
$
|
182,431
|
|
$
|
3,337,303
|
|
||||
|
Classified
|
29,829
|
|
4,218
|
|
170
|
|
767
|
|
34,984
|
|
|||||||||
|
Total
|
$
|
2,215,892
|
|
$
|
780,691
|
|
$
|
192,506
|
|
$
|
183,198
|
|
$
|
3,372,287
|
|
||||
|
Total Recorded Investment in Loans and Leases
|
$
|
5,538,304
|
|
||||||||||||||||
1
Comprised of other revolving credit, installment, and lease financing.
77
Aging Analysis
The following presents by class, an aging analysis of the Company's loan and lease portfolio as of
December 31, 2012
and
2011
.
|
(dollars in thousands)
|
30 - 59
Days Past Due |
|
60 - 89
Days Past Due |
|
Past Due
90 Days or More |
|
Non-
Accrual |
|
Total
Past Due and Non-Accrual |
|
Current
|
|
Total Loans
and Leases |
|
Non-Accrual
Loans and Leases that are Current 2 |
|
|||||||||||||||
|
As of December 31, 2012
|
|||||||||||||||||||||||||||||||
|
Commercial
|
|||||||||||||||||||||||||||||||
|
Commercial and Industrial
|
$
|
806
|
|
$
|
10,382
|
|
$
|
27
|
|
$
|
5,534
|
|
$
|
16,749
|
|
$
|
812,763
|
|
$
|
829,512
|
|
$
|
4,963
|
|
|||||||
|
Commercial Mortgage
|
188
|
|
542
|
|
—
|
|
3,030
|
|
3,760
|
|
1,093,665
|
|
1,097,425
|
|
1,810
|
|
|||||||||||||||
|
Construction
|
—
|
|
—
|
|
—
|
|
833
|
|
833
|
|
113,154
|
|
113,987
|
|
833
|
|
|||||||||||||||
|
Lease Financing
|
—
|
|
—
|
|
—
|
|
—
|
|
—
|
|
274,969
|
|
274,969
|
|
—
|
|
|||||||||||||||
|
Total Commercial
|
994
|
|
10,924
|
|
27
|
|
9,397
|
|
21,342
|
|
2,294,551
|
|
2,315,893
|
|
7,606
|
|
|||||||||||||||
|
Consumer
|
|||||||||||||||||||||||||||||||
|
Residential Mortgage
|
6,891
|
|
5,433
|
|
6,908
|
|
21,725
|
|
40,957
|
|
2,308,959
|
|
2,349,916
|
|
4,941
|
|
|||||||||||||||
|
Home Equity
|
6,768
|
|
3,267
|
|
2,701
|
|
2,074
|
|
14,810
|
|
755,566
|
|
770,376
|
|
191
|
|
|||||||||||||||
|
Automobile
|
3,758
|
|
586
|
|
186
|
|
—
|
|
4,530
|
|
205,302
|
|
209,832
|
|
—
|
|
|||||||||||||||
|
Other
1
|
2,144
|
|
1,093
|
|
587
|
|
—
|
|
3,824
|
|
204,680
|
|
208,504
|
|
—
|
|
|||||||||||||||
|
Total Consumer
|
19,561
|
|
10,379
|
|
10,382
|
|
23,799
|
|
64,121
|
|
3,474,507
|
|
3,538,628
|
|
5,132
|
|
|||||||||||||||
|
Total
|
$
|
20,555
|
|
$
|
21,303
|
|
$
|
10,409
|
|
$
|
33,196
|
|
$
|
85,463
|
|
$
|
5,769,058
|
|
$
|
5,854,521
|
|
$
|
12,738
|
|
|||||||
|
As of December 31, 2011
|
|||||||||||||||||||||||||||||||
|
Commercial
|
|||||||||||||||||||||||||||||||
|
Commercial and Industrial
|
$
|
2,959
|
|
$
|
743
|
|
$
|
1
|
|
$
|
6,243
|
|
$
|
9,946
|
|
$
|
807,224
|
|
$
|
817,170
|
|
$
|
5,661
|
|
|||||||
|
Commercial Mortgage
|
678
|
|
—
|
|
—
|
|
2,140
|
|
2,818
|
|
935,432
|
|
938,250
|
|
959
|
|
|||||||||||||||
|
Construction
|
—
|
|
—
|
|
—
|
|
2,080
|
|
2,080
|
|
96,589
|
|
98,669
|
|
—
|
|
|||||||||||||||
|
Lease Financing
|
—
|
|
—
|
|
—
|
|
5
|
|
5
|
|
311,923
|
|
311,928
|
|
5
|
|
|||||||||||||||
|
Total Commercial
|
3,637
|
|
743
|
|
1
|
|
10,468
|
|
14,849
|
|
2,151,168
|
|
2,166,017
|
|
6,625
|
|
|||||||||||||||
|
Consumer
|
|||||||||||||||||||||||||||||||
|
Residential Mortgage
|
8,878
|
|
9,258
|
|
6,422
|
|
25,256
|
|
49,814
|
|
2,166,078
|
|
2,215,892
|
|
1,856
|
|
|||||||||||||||
|
Home Equity
|
5,310
|
|
2,694
|
|
2,194
|
|
2,024
|
|
12,222
|
|
768,469
|
|
780,691
|
|
97
|
|
|||||||||||||||
|
Automobile
|
4,095
|
|
839
|
|
170
|
|
—
|
|
5,104
|
|
187,402
|
|
192,506
|
|
—
|
|
|||||||||||||||
|
Other
1
|
1,679
|
|
1,528
|
|
435
|
|
—
|
|
3,642
|
|
179,556
|
|
183,198
|
|
—
|
|
|||||||||||||||
|
Total Consumer
|
19,962
|
|
14,319
|
|
9,221
|
|
27,280
|
|
70,782
|
|
3,301,505
|
|
3,372,287
|
|
1,953
|
|
|||||||||||||||
|
Total
|
$
|
23,599
|
|
$
|
15,062
|
|
$
|
9,222
|
|
$
|
37,748
|
|
$
|
85,631
|
|
$
|
5,452,673
|
|
$
|
5,538,304
|
|
$
|
8,578
|
|
|||||||
|
1
|
Comprised of other revolving credit, installment, and lease financing.
|
|
2
|
Represents non-accrual loans that are not past due 30 days or more; however, full payment of principal and interest is still not expected.
|
78
Impaired Loans
The following presents by class, information related to impaired loans as of
December 31, 2012
and
2011
.
|
(dollars in thousands)
|
Recorded
Investment |
|
Unpaid
Principal Balance |
|
Related
Allowance for Loan Losses |
|
|||||
|
December 31, 2012
|
|||||||||||
|
Impaired Loans with No Related Allowance Recorded:
|
|||||||||||
|
Commercial
|
|||||||||||
|
Commercial and Industrial
|
$
|
7,464
|
|
$
|
12,714
|
|
$
|
—
|
|
||
|
Commercial Mortgage
|
2,971
|
|
3,471
|
|
—
|
|
|||||
|
Construction
|
833
|
|
1,163
|
|
—
|
|
|||||
|
Total Commercial
|
11,268
|
|
17,348
|
|
—
|
|
|||||
|
Total Impaired Loans with No Related Allowance Recorded
|
$
|
11,268
|
|
$
|
17,348
|
|
$
|
—
|
|
||
|
Impaired Loans with an Allowance Recorded:
|
|||||||||||
|
Commercial
|
|||||||||||
|
Commercial and Industrial
|
$
|
1,772
|
|
$
|
1,772
|
|
$
|
148
|
|
||
|
Commercial Mortgage
|
58
|
|
58
|
|
13
|
|
|||||
|
Total Commercial
|
1,830
|
|
1,830
|
|
161
|
|
|||||
|
Consumer
|
|||||||||||
|
Residential Mortgage
|
31,577
|
|
38,219
|
|
3,492
|
|
|||||
|
Automobile
|
5,641
|
|
5,641
|
|
58
|
|
|||||
|
Other
1
|
282
|
|
282
|
|
14
|
|
|||||
|
Total Consumer
|
37,500
|
|
44,142
|
|
3,564
|
|
|||||
|
Total Impaired Loans with an Allowance Recorded
|
$
|
39,330
|
|
$
|
45,972
|
|
$
|
3,725
|
|
||
|
Impaired Loans:
|
|||||||||||
|
Commercial
|
$
|
13,098
|
|
$
|
19,178
|
|
$
|
161
|
|
||
|
Consumer
|
37,500
|
|
44,142
|
|
3,564
|
|
|||||
|
Total Impaired Loans
|
$
|
50,598
|
|
$
|
63,320
|
|
$
|
3,725
|
|
||
|
December 31, 2011
|
|||||||||||
|
Impaired Loans with No Related Allowance Recorded:
|
|||||||||||
|
Commercial
|
|||||||||||
|
Commercial and Industrial
|
$
|
6,176
|
|
$
|
13,526
|
|
$
|
—
|
|
||
|
Commercial Mortgage
|
2,140
|
|
2,640
|
|
—
|
|
|||||
|
Total Commercial
|
8,316
|
|
16,166
|
|
—
|
|
|||||
|
Total Impaired Loans with No Related Allowance Recorded
|
$
|
8,316
|
|
$
|
16,166
|
|
$
|
—
|
|
||
|
Impaired Loans with an Allowance Recorded:
|
|||||||||||
|
Commercial
|
|||||||||||
|
Commercial and Industrial
|
$
|
4,447
|
|
$
|
4,447
|
|
$
|
846
|
|
||
|
Commercial Mortgage
|
2,372
|
|
2,372
|
|
349
|
|
|||||
|
Total Commercial
|
6,819
|
|
6,819
|
|
1,195
|
|
|||||
|
Consumer
|
|||||||||||
|
Residential Mortgage
|
25,726
|
|
30,606
|
|
4,138
|
|
|||||
|
Home Equity
|
21
|
|
21
|
|
1
|
|
|||||
|
Automobile
|
6,190
|
|
6,190
|
|
75
|
|
|||||
|
Other
1
|
528
|
|
528
|
|
42
|
|
|||||
|
Total Consumer
|
32,465
|
|
37,345
|
|
4,256
|
|
|||||
|
Total Impaired Loans with an Allowance Recorded
|
$
|
39,284
|
|
$
|
44,164
|
|
$
|
5,451
|
|
||
|
Impaired Loans:
|
|||||||||||
|
Commercial
|
$
|
15,135
|
|
$
|
22,985
|
|
$
|
1,195
|
|
||
|
Consumer
|
32,465
|
|
37,345
|
|
4,256
|
|
|||||
|
Total Impaired Loans
|
$
|
47,600
|
|
$
|
60,330
|
|
$
|
5,451
|
|
||
|
1
|
Comprised of other revolving credit and installment financing.
|
79
The following presents by class, information related to the average recorded investment and interest income recognized on impaired loans for the years ended
December 31, 2012
and
2011
.
|
Year Ended
December 31, 2012 |
Year Ended
December 31, 2011 |
||||||||||||||
|
(dollars in thousands)
|
Average
Recorded Investment |
|
Interest
Income Recognized |
|
Average
Recorded Investment |
|
Interest
Income Recognized |
|
|||||||
|
Impaired Loans with No Related Allowance Recorded:
|
|||||||||||||||
|
Commercial
|
|||||||||||||||
|
Commercial and Industrial
|
$
|
8,064
|
|
$
|
—
|
|
$
|
3,367
|
|
$
|
—
|
|
|||
|
Commercial Mortgage
|
2,643
|
|
—
|
|
2,845
|
|
—
|
|
|||||||
|
Construction
|
890
|
|
—
|
|
115
|
|
—
|
|
|||||||
|
Total Commercial
|
11,597
|
|
—
|
|
6,327
|
|
—
|
|
|||||||
|
Total Impaired Loans with No Related Allowance Recorded
|
$
|
11,597
|
|
$
|
—
|
|
$
|
6,327
|
|
$
|
—
|
|
|||
|
Impaired Loans with an Allowance Recorded:
|
|||||||||||||||
|
Commercial
|
|||||||||||||||
|
Commercial and Industrial
|
$
|
1,752
|
|
$
|
126
|
|
$
|
3,988
|
|
$
|
150
|
|
|||
|
Commercial Mortgage
|
128
|
|
12
|
|
755
|
|
14
|
|
|||||||
|
Construction
|
416
|
|
—
|
|
58
|
|
—
|
|
|||||||
|
Total Commercial
|
2,296
|
|
138
|
|
4,801
|
|
164
|
|
|||||||
|
Consumer
|
|||||||||||||||
|
Residential Mortgage
|
27,310
|
|
428
|
|
24,075
|
|
333
|
|
|||||||
|
Home Equity
|
4
|
|
—
|
|
21
|
|
—
|
|
|||||||
|
Automobile
|
5,811
|
|
585
|
|
5,911
|
|
597
|
|
|||||||
|
Other
1
|
380
|
|
17
|
|
516
|
|
29
|
|
|||||||
|
Total Consumer
|
33,505
|
|
1,030
|
|
30,523
|
|
959
|
|
|||||||
|
Total Impaired Loans with an Allowance Recorded
|
$
|
35,801
|
|
$
|
1,168
|
|
$
|
35,324
|
|
$
|
1,123
|
|
|||
|
Impaired Loans:
|
|||||||||||||||
|
Commercial
|
$
|
13,893
|
|
$
|
138
|
|
$
|
11,128
|
|
$
|
164
|
|
|||
|
Consumer
|
33,505
|
|
1,030
|
|
30,523
|
|
959
|
|
|||||||
|
Total Impaired Loans
|
$
|
47,398
|
|
$
|
1,168
|
|
$
|
41,651
|
|
$
|
1,123
|
|
|||
1
Comprised of other revolving credit and installment financing.
For the year ended
December 31, 2010
, the average recorded investment in impaired loans was
$33.6 million
and the interest income recognized on impaired loans was
$0.8 million
. For the years ended
December 31, 2012
,
2011
, and
2010
, the amount of interest income recognized by the Company within the period that the loans were impaired were primarily related to loans modified in a troubled debt restructuring that remained on accrual status. For the years ended
December 31, 2012
,
2011
, and
2010
, the amount of interest income recognized using a cash-basis method of accounting during the time within that period that the loans were impaired was not material.
Modifications
A modification of a loan constitutes a troubled debt restructuring ("TDR") when the Company for economic or legal reasons related to a borrower's financial difficulties grants a concession to the borrower that it would not otherwise consider. Loans modified in a TDR were
$41.1 million
and
$38.8 million
as of
December 31, 2012
and
2011
, respectively. There were no commitments to lend additional funds on loans modified in a TDR as of
December 31, 2012
.
The Company offers various types of concessions when modifying a loan or lease, however, forgiveness of principal is rarely granted. Commercial and industrial loans modified in a TDR often involve temporary interest-only payments, term extensions, and converting revolving credit lines to term loans. Additional collateral, a co-borrower, or a guarantor is often requested. Commercial mortgage and construction loans modified in a TDR often involve reducing the interest rate for the remaining term of the loan, extending the maturity date at an interest rate lower than the current market rate for new debt with similar risk, or substituting or adding a new borrower or guarantor. Construction loans modified in a TDR may also involve extending the interest-only payment period. Lease financing modifications generally involves a short-term forbearance period, usually about
three
months, after which the missed payments are added to the end of the lease term, thereby extending the maturity date.
80
Interest continues to accrue on the missed payments and as a result, the effective yield on the lease remains unchanged. As the forbearance period usually involves an insignificant payment delay, lease financing modifications typically do not meet the reporting criteria for a TDR. Prior to November 2012, residential mortgage loans modified in a TDR were primarily comprised of loans where monthly payments were lowered to accommodate the borrowers' financial needs for a period of time, normally
two years
. During that time, the borrower's entire monthly payment was applied to principal. After the lowered monthly payment period ended, the borrower reverted back to paying principal and interest per the original terms with the maturity date adjusted accordingly. Effective November 2012, the Company revised its modification program to resemble the Federal Government's Home Affordable Modification Payment (“HAMP”) Tier 2 program. Under this new modification program, the concessions will generally include a lower interest rate and the loan being fully amortized for up to
40 years
from the modification effective date. In some cases, the Company may forbear a portion of the unpaid principal balance with a balloon payment due upon maturity or pay-off of the loan. Land loans are also included in the class of residential mortgage loans. Land loans are typically structured as interest-only monthly payments with a balloon payment due at maturity. Prior to September 2012, land loans modified in a TDR typically involved extending the balloon payment by
one
to
three
years, changing the monthly payments from interest-only to principal and interest, while leaving the interest rate unchanged. In September 2012, the land loan modification program was changed to offer an extension to term-out and fully amortize the loan over a period of up to
360 months
. Home equity modifications are made infrequently and are offered to borrowers if the Company does not hold the first mortgage. Home equity modifications are uniquely designed to meet the specific needs of each borrower. Borrowers having both a first mortgage and home equity loan with the Company are offered a residential mortgage loan modification. Automobile loans modified in a TDR are primarily comprised of loans where the Company has lowered monthly payments by extending the term.
Loans modified in a TDR are typically already on non-accrual status and partial charge-offs have in some cases already been taken against the outstanding loan balance. As a result, loans modified in a TDR for the Company may have the financial effect of increasing the specific Allowance associated with the loan. An Allowance for impaired consumer and commercial loans that have been modified in a TDR is measured based on the present value of expected future cash flows discounted at the loan's effective interest rate, the loan's observable market price, or the estimated fair value of the collateral, less any selling costs, if the loan is collateral dependent. Management exercises significant judgment in developing these estimates.
The following presents by class, information related to loans modified in a TDR during the year ended
December 31, 2012
and
2011
.
|
Loans Modified as a TDR for the
Year Ended December 31, 2012 |
Loans Modified as a TDR for the
Year Ended December 31, 2011 |
||||||||||||||||||||
|
Troubled Debt Restructurings
(dollars in thousands ) |
Number of
Contracts |
|
Recorded
Investment (as of period end) 1 |
|
Increase in
Allowance (as of period end) |
|
Number of
Contracts |
|
Recorded
Investment (as of period end) 1 |
|
Increase in
Allowance (as of period end) |
|
|||||||||
|
Commercial
|
|||||||||||||||||||||
|
Commercial and Industrial
|
5
|
|
$
|
1,059
|
|
$
|
131
|
|
7
|
|
$
|
4,281
|
|
$
|
782
|
|
|||||
|
Commercial Mortgage
|
—
|
|
—
|
|
—
|
|
4
|
|
1,249
|
|
19
|
|
|||||||||
|
Construction
|
1
|
|
833
|
|
—
|
|
—
|
|
—
|
|
—
|
|
|||||||||
|
Total Commercial
|
6
|
|
1,892
|
|
131
|
|
11
|
|
5,530
|
|
801
|
|
|||||||||
|
Consumer
|
|||||||||||||||||||||
|
Residential Mortgage
|
12
|
|
8,094
|
|
831
|
|
17
|
|
7,384
|
|
964
|
|
|||||||||
|
Automobile
|
210
|
|
2,139
|
|
22
|
|
289
|
|
2,946
|
|
36
|
|
|||||||||
|
Other
2
|
—
|
|
—
|
|
—
|
|
3
|
|
313
|
|
8
|
|
|||||||||
|
Total Consumer
|
222
|
|
10,233
|
|
853
|
|
309
|
|
10,643
|
|
1,008
|
|
|||||||||
|
Total
|
228
|
|
$
|
12,125
|
|
$
|
984
|
|
320
|
|
$
|
16,173
|
|
$
|
1,809
|
|
|||||
|
1
|
The period end balances reflect all partial paydowns and charge-offs since the modification date. TDRs fully paid-off, charged-off, or foreclosed upon by period end are not included.
|
|
2
|
Comprised of other revolving credit and installment financing.
|
81
The following presents by class, loans modified in a TDR that defaulted during the year ended
December 31, 2012
and
2011
, and within twelve months of their modification date. A TDR is considered to be in default once it becomes
60
days or more past due following a modification.
|
Year Ended December 31, 2012
|
Year Ended December 31, 2011
|
||||||||||||
|
TDRs that Defaulted During the Period,
Within Twelve Months of their Modification Date (dollars in thousands) |
Number of
Contracts |
|
Recorded
Investment (as of period end) 1 |
|
Number of
Contracts |
|
Recorded
Investment (as of period end) 1 |
|
|||||
|
Commercial
|
|||||||||||||
|
Commercial Mortgage
|
—
|
|
$
|
—
|
|
2
|
|
$
|
957
|
|
|||
|
Total Commercial
|
—
|
|
—
|
|
2
|
|
957
|
|
|||||
|
Consumer
|
|||||||||||||
|
Residential Mortgage
|
3
|
|
1,153
|
|
1
|
|
293
|
|
|||||
|
Automobile
|
7
|
|
32
|
|
12
|
|
150
|
|
|||||
|
Total Consumer
|
10
|
|
1,185
|
|
13
|
|
443
|
|
|||||
|
Total
|
10
|
|
$
|
1,185
|
|
15
|
|
$
|
1,400
|
|
|||
|
1
|
The period end balances reflect all partial paydowns and charge-offs since the modification date. TDRs fully paid-off, charged-off, or foreclosed upon by period end are not included.
|
Of the three residential mortgage loans modified in a TDR that subsequently defaulted during the twelve months ended December 31, 2012, one was modified by temporarily lowering monthly payments and applying all payments during this time to principal. The other residential mortgage loan in default pertained to a land loan which was modified from an interest-only loan to an amortizing loan, while granting a brief extension on the balloon payment. The third residential mortgage loan in default was modified by granting a term extension, a rate reduction, and a principal forbearance. Automobile loans modified in a TDR that subsequently defaulted were primarily modified by lowering monthly payments by extending the term.
Loans modified in a TDR are closely monitored for delinquency as an early indicator of possible future default. If loans modified in a TDR subsequently default, the Company evaluates the loan for possible further impairment. The Allowance may be increased, adjustments may be made in the allocation of the Allowance, or partial charge-offs may be taken to further write-down the carrying value of the loan.
Related Party Loans
Certain directors and executive officers of the Company, companies in which they are principal owners, and trusts in which they are involved, have loans with the Bank. These loans were made in the ordinary course of business at normal credit terms, including interest rate and collateral requirements. As of
December 31, 2012
and
2011
, related party loan balances were
$6.7 million
and
$6.4 million
, respectively.
The Company's portfolio of residential mortgage loans serviced for third parties was
$3.1 billion
as of
December 31, 2012
and
$3.2 billion
as of
December 31, 2011
and
2010
. Generally, the Company's residential mortgage loans sold to third parties are sold on a non-recourse basis. The Company's mortgage servicing activities include collecting principal, interest, and escrow payments from borrowers; making tax and insurance payments on behalf of the borrowers; monitoring delinquencies and executing foreclosure proceedings; and accounting for and remitting principal and interest payments to investors. Servicing income, including late and ancillary fees, was
$8.2 million
,
$8.6 million
, and
$8.5 million
for the years ended
December 31, 2012
,
2011
, and
2010
, respectively. Servicing income is recorded as a component of mortgage banking income in the Company's consolidated statements of income. The Company's residential mortgage loan servicing portfolio is comprised primarily of fixed-rate loans concentrated in Hawaii.
82
For the years ended
December 31, 2012
,
2011
, and
2010
, the change in the fair value of the Company's mortgage servicing rights accounted for under the fair value measurement method was as follows:
|
(dollars in thousands)
|
2012
|
|
2011
|
|
2010
|
|
|||||
|
Balance at Beginning of Year
|
$
|
7,131
|
|
$
|
10,226
|
|
$
|
15,332
|
|
||
|
Changes in Fair Value:
|
|||||||||||
|
Due to Change in Valuation Assumptions
1
|
(863
|
)
|
(1,521
|
)
|
(2,546
|
)
|
|||||
|
Due to Payoffs
|
(1,507
|
)
|
(1,574
|
)
|
(2,560
|
)
|
|||||
|
Total Changes in Fair Value of Mortgage Servicing Rights
|
(2,370
|
)
|
(3,095
|
)
|
(5,106
|
)
|
|||||
|
Balance at End of Year
|
$
|
4,761
|
|
$
|
7,131
|
|
$
|
10,226
|
|
||
|
1
|
Principally represents changes in discount rates and loan repayment rate assumptions, mostly due to changes in interest rates.
|
For the years ended
December 31, 2012
,
2011
, and
2010
, the change in the carrying value of the Company's mortgage servicing rights accounted for under the amortization method was as follows:
|
(dollars in thousands)
|
2012
|
|
2011
|
|
2010
|
|
|||||
|
Balance at Beginning of Year
|
$
|
17,148
|
|
$
|
15,153
|
|
$
|
10,638
|
|
||
|
Servicing Rights that Resulted From Asset Transfers
|
6,016
|
|
4,139
|
|
6,086
|
|
|||||
|
Amortization
|
(2,685
|
)
|
(2,144
|
)
|
(1,571
|
)
|
|||||
|
Balance at End of Year
|
$
|
20,479
|
|
$
|
17,148
|
|
$
|
15,153
|
|
||
|
Fair Value of Mortgage Servicing Rights Accounted for
Under the Amortization Method
|
|||||||||||
|
Beginning of Year
|
$
|
17,159
|
|
$
|
20,340
|
|
$
|
14,853
|
|
||
|
End of Year
|
$
|
23,143
|
|
$
|
17,159
|
|
$
|
20,340
|
|
||
The key assumptions used in estimating the fair value of the Company's mortgage servicing rights as of
December 31, 2012
and
2011
were as follows:
|
2012
|
2011
|
|||
|
Weighted-Average Constant Prepayment Rate
1
|
12.26
|
%
|
15.56
|
%
|
|
Weighted-Average Life (in years)
|
6.24
|
5.03
|
||
|
Weighted-Average Note Rate
|
4.59
|
%
|
4.87
|
%
|
|
Weighted-Average Discount Rate
2
|
5.57
|
%
|
6.31
|
%
|
|
1
|
Represents annualized loan repayment rate assumption.
|
|
2
|
Derived from multiple interest rate scenarios that incorporate a spread to the London Interbank Offered Rate swap curve and market volatilities.
|
Residential mortgage loan repayment rates for the Company's servicing portfolio, which is concentrated in Hawaii, was slightly lower than the national average for the years ended
December 31, 2012
and
2011
.
A sensitivity analysis of the Company's fair value of mortgage servicing rights to changes in certain key assumptions as of
December 31, 2012
and
2011
is presented in the following table.
|
(dollars in thousands)
|
2012
|
|
2011
|
|
|||
|
Constant Prepayment Rate
|
|||||||
|
Decrease in fair value from 25 basis points ("bps") adverse change
|
$
|
(378
|
)
|
$
|
(295
|
)
|
|
|
Decrease in fair value from 50 bps adverse change
|
(746
|
)
|
(582
|
)
|
|||
|
Discount Rate
|
|||||||
|
Decrease in fair value from 25 bps adverse change
|
(439
|
)
|
(331
|
)
|
|||
|
Decrease in fair value from 50 bps adverse change
|
(864
|
)
|
(652
|
)
|
|||
This analysis generally cannot be extrapolated because the relationship of a change in one key assumption to the change in the fair value of the Company's mortgage servicing rights usually is not linear. Also, the effect of changing one key assumption without changing other assumptions is not realistic.
83
The components of the Company's premises and equipment as of
December 31, 2012
and
2011
were as follows:
|
(dollars in thousands)
|
Cost
|
|
Accumulated
Depreciation and Amortization |
Net Book Value
|
|||||||
|
December 31, 2012
|
|||||||||||
|
Premises
|
$
|
314,152
|
|
$
|
(224,108
|
)
|
$
|
90,044
|
|
||
|
Equipment
|
111,177
|
|
(97,109
|
)
|
14,068
|
|
|||||
|
Capital Leases
|
4,464
|
|
(3,571
|
)
|
893
|
|
|||||
|
Total
|
$
|
429,793
|
|
$
|
(324,788
|
)
|
$
|
105,005
|
|
||
|
December 31, 2011
|
|||||||||||
|
Premises
|
$
|
306,766
|
|
$
|
(218,519
|
)
|
$
|
88,247
|
|
||
|
Equipment
|
107,964
|
|
(93,732
|
)
|
14,232
|
|
|||||
|
Capital Leases
|
4,464
|
|
(3,393
|
)
|
1,071
|
|
|||||
|
Total
|
$
|
419,194
|
|
$
|
(315,644
|
)
|
$
|
103,550
|
|
||
Depreciation and amortization (including capital lease amortization) included in noninterest expense was
$13.8 million
,
$14.6 million
, and
$13.4 million
for the years ended
December 31, 2012
,
2011
, and
2010
, respectively.
For the years ended
December 31, 2012
and
2011
, the Company recorded impairment charges of
$1.1 million
and
$0.6 million
, respectively, related to several of the Company's branch premises. These impairment charges were recorded as a component of net occupancy expense in the Company's consolidated statements of income. For the year ended
December 31, 2010
, there was no impairment of the Company's premises and equipment.
The components of the Company's other assets as of
December 31, 2012
and
2011
were as follows:
|
(dollars in thousands)
|
2012
|
|
2011
|
|
|||
|
Bank-Owned Life Insurance
|
$
|
218,429
|
|
$
|
213,113
|
|
|
|
Federal Home Loan Bank and Federal Reserve Bank Stock
|
79,152
|
|
79,946
|
|
|||
|
Derivative Financial Instruments
|
42,610
|
|
38,085
|
|
|||
|
Low-Income Housing and Other Equity Investments
|
48,373
|
|
35,860
|
|
|||
|
Prepaid Expenses
|
21,820
|
|
28,979
|
|
|||
|
Accounts Receivable
|
13,854
|
|
13,607
|
|
|||
|
State Tax Deposits
|
6,069
|
|
6,069
|
|
|||
|
Other
|
26,645
|
|
26,113
|
|
|||
|
Total
|
$
|
456,952
|
|
$
|
441,772
|
|
|
The carrying value of the Company's FHLB stock was
$60.2 million
and
$61.3 million
as of
December 31, 2012
and
2011
, respectively. In September 2012, the FHLB reported that its financial condition has been steadily improving. As such, the FHLB's primary regulator, the Federal Housing Finance Agency upgraded the FHLB's classification from "undercapitalized" to “adequately capitalized,” which allows it, conditions permitting, to repurchase a small amount of excess capital stock for the first time since December 2008. As of September 30, 2012, the FHLB met all of its regulatory capital requirements, and to our knowledge, continues to meet its debt obligations, and if needed has an additional source of liquidity available to U.S. Government-Sponsored Enterprises through the U.S. Treasury. Based upon the foregoing, the Company has not recorded an impairment of the carrying value of the Company's FHLB stock as of
December 31, 2012
.
84
Time Deposits
As of
December 31, 2012
and
2011
, the Company's total time deposits were
$1.6 billion
and
$1.3 billion
, respectively. As of
December 31, 2012
, the contractual maturities of these time deposits were as follows:
|
(dollars in thousands)
|
Amount
|
|
|
|
2013
|
$
|
1,264,164
|
|
|
2014
|
111,173
|
|
|
|
2015
|
82,833
|
|
|
|
2016
|
80,053
|
|
|
|
2017
|
44,548
|
|
|
|
Thereafter
|
16,737
|
|
|
|
Total
|
$
|
1,599,508
|
|
The amount of time deposits with balances of $100,000 or more was
$1.3 billion
and
$966.8 million
as of
December 31, 2012
and
2011
, respectively. As of
December 31, 2012
, the contractual maturities of these time deposits were as follows:
|
(dollars in thousands)
|
Amount
|
|
|
|
Three Months or Less
|
$
|
915,321
|
|
|
Over Three Months through Six Months
|
107,056
|
|
|
|
Over Six Months through Twelve Months
|
66,764
|
|
|
|
Over Twelve Months
|
187,321
|
|
|
|
Total
|
$
|
1,276,462
|
|
Public Deposits
As of
December 31, 2012
and
2011
, deposits of governmental entities of
$1.4 billion
and
$978.6 million
, respectively, required collateralization by acceptable investment securities of the Company.
Details of the Company's borrowings as of and for the years ended
December 31, 2012
,
2011
, and
2010
were as follows:
|
(dollars in thousands)
|
2012
|
|
2011
|
|
2010
|
|
|||||
|
Funds Purchased
1
|
|||||||||||
|
Amounts Outstanding as of End of Year
|
$
|
11,296
|
|
$
|
10,791
|
|
$
|
9,478
|
|
||
|
Average Amount Outstanding During Year
|
14,928
|
|
11,508
|
|
16,284
|
|
|||||
|
Maximum Amount Outstanding at Any Month End
|
21,024
|
|
10,791
|
|
77,832
|
|
|||||
|
Weighted Average Interest Rate During Year
|
0.14
|
%
|
0.17
|
%
|
0.18
|
%
|
|||||
|
Weighted Average Interest Rate End of Year
|
0.14
|
%
|
0.14
|
%
|
0.22
|
%
|
|||||
|
Securities Sold Under Agreements to Repurchase
2
|
|||||||||||
|
Amounts Outstanding as of End of Year
|
$
|
158,947
|
|
$
|
1,325,998
|
|
$
|
1,301,084
|
|
||
|
Average Amount Outstanding During Year
|
735,711
|
|
1,245,763
|
|
1,052,558
|
|
|||||
|
Maximum Amount Outstanding at Any Month End
|
1,354,838
|
|
1,369,378
|
|
1,406,393
|
|
|||||
|
Weighted Average Interest Rate During Year
|
0.08
|
%
|
0.08
|
%
|
0.10
|
%
|
|||||
|
Weighted Average Interest Rate End of Year
|
0.12
|
%
|
0.07
|
%
|
0.09
|
%
|
|||||
1
Federal funds purchased generally mature on the next business day following the date of purchase.
2
Excludes long-term securities sold under agreements to repurchase with private institutions of
$600.0 million
as of
December 31, 2012
,
2011
, and
2010
.
85
As of
December 31, 2012
, the contractual maturities of the Company's total securities sold under agreements to repurchase were as follows:
|
(dollars in thousands)
|
Amount
|
|
|
|
Overnight
|
$
|
—
|
|
|
2 to 30 Days
|
71,000
|
|
|
|
31 to 90 Days
|
13,538
|
|
|
|
Over 90 Days
|
674,409
|
|
|
|
Total
|
$
|
758,947
|
|
The Company's total securities sold under agreements to repurchase were
$758.9 million
as of
December 31, 2012
, and
$1.9 billion
as of
December 31, 2011
and
2010
. As of
December 31, 2012
, total securities sold under agreements to repurchase placed with private institutions were
$600.0 million
, all of which were at fixed interest rates. As of
December 31, 2012
, the weighted average interest rate for the Company's agreements with private institutions was
4.63%
and the remaining terms of these agreements ranged from
3
to
10
years.
As of
December 31, 2012
, the weighted average maturity was
177
days for the Company's securities sold under agreements to repurchase with government entities and
4.94
years for securities sold under agreements to repurchase with private institutions, subject to the private institutions' right to terminate certain agreements at earlier specified dates which could decrease the weighted average maturity to
2.51
years.
There were
no
short-term borrowings as of
December 31, 2012
and 2011. Short-term borrowings typically consist of treasury tax and loan balances, which represent tax payments collected on behalf of the U.S. Government, callable at any time and typically bears market interest rates. However, due to the low interest rate environment, no interest has been charged on these borrowings since 2008.
The Company's long-term debt as of
December 31, 2012
and
2011
were as follows:
|
(dollars in thousands)
|
2012
|
|
2011
|
|
|||
|
Federal Home Loan Bank Advance
|
$
|
100,000
|
|
$
|
—
|
|
|
|
Non-Recourse Debt
|
19,185
|
|
21,787
|
|
|||
|
Capital Lease Obligations
|
8,870
|
|
8,909
|
|
|||
|
Total
|
$
|
128,055
|
|
$
|
30,696
|
|
|
As a member of the FHLB, the Bank may borrow funds from the FHLB in amounts up to
15%
of the Bank's total assets, provided the Bank is able to pledge an adequate amount of qualified assets to secure the borrowings. The stated interest rate on the FHLB advance is
0.60%
with maturity in December 2015. As of
December 31, 2012
, the Company had a remaining line of credit with the FHLB of
$1.0 billion
. See Note 4 for loans pledged to the FHLB as of December 31, 2012 and 2011.
As of
December 31, 2012
, the Company's non-recourse debt was bearing interest at a fixed rate of
6.3%
with maturity in June 2021.
Capital lease obligations relate to office space at the Company's headquarters. The lease began in 1993 and has a
60
year term. Lease payments were fixed at
$0.7 million
per year through December 2012 and are negotiable thereafter. Negotiations are currently ongoing regarding future lease payment amounts. Until an agreement is reached, management expects that annual lease payment amounts will remain unchanged.
As of
December 31, 2012
, the Company had an undrawn line of credit with the FRB of
$685.0 million
. See Note 4 for loans pledged to the FRB as of December 31, 2012 and 2011.
86
As of
December 31, 2012
, the annual maturities of the Company's long-term debt, exclusive of capital lease obligations, were expected to be as follows:
|
(dollars in thousands)
|
Amount
|
||
|
2013
|
$
|
3,308
|
|
|
2014
|
2,872
|
|
|
|
2015
|
103,067
|
|
|
|
2016
|
2,785
|
|
|
|
2017
|
—
|
|
|
|
Thereafter
|
7,153
|
|
|
|
Total
|
$
|
119,185
|
|
Regulatory Capital
The table below sets forth the minimum required capital amounts and ratios for well capitalized institutions and the actual capital amounts and ratios for the Company and the Bank as of
December 31, 2012
and
2011
:
|
(dollars in thousands)
|
Well Capitalized
Minimum Ratio |
|
Company
|
|
Bank
|
|
||||
|
As of December 31, 2012:
|
||||||||||
|
Shareholders' Equity
|
$
|
1,021,665
|
|
$
|
977,591
|
|
||||
|
Tier 1 Capital
|
926,603
|
|
896,658
|
|
||||||
|
Total Capital
|
999,183
|
|
969,144
|
|
||||||
|
Tier 1 Capital Ratio
|
6
|
%
|
16.13
|
%
|
15.63
|
%
|
||||
|
Total Capital Ratio
|
10
|
%
|
17.39
|
%
|
16.89
|
%
|
||||
|
Tier 1 Leverage Ratio
|
5
|
%
|
6.83
|
%
|
6.63
|
%
|
||||
|
As of December 31, 2011:
|
||||||||||
|
Shareholders' Equity
|
$
|
1,002,667
|
|
$
|
926,673
|
|
||||
|
Tier 1 Capital
|
903,173
|
|
841,308
|
|
||||||
|
Total Capital
|
971,797
|
|
909,838
|
|
||||||
|
Tier 1 Capital Ratio
|
6
|
%
|
16.68
|
%
|
15.56
|
%
|
||||
|
Total Capital Ratio
|
10
|
%
|
17.95
|
%
|
16.83
|
%
|
||||
|
Tier 1 Leverage Ratio
|
5
|
%
|
6.73
|
%
|
6.30
|
%
|
||||
The Company and the Bank are subject to various regulatory capital requirements administered by the federal banking agencies. Failure to meet minimum capital requirements can result in certain mandatory, and possibly additional discretionary, actions by regulators that, if undertaken, could have a direct material effect on the Company's financial statements. Under capital adequacy guidelines and the regulatory framework for prompt corrective action, the Company and the Bank must meet specific capital guidelines that involve quantitative measures of assets, liabilities, and certain off-balance sheet items as calculated under regulatory accounting practices. The capital amounts and classifications are also subject to qualitative judgments by regulators about the components of regulatory capital, risk weightings, and other factors.
Quantitative measures established by regulation to ensure capital adequacy require the Company and the Bank to maintain minimum amounts and ratios of Tier 1 and Total Capital. Tier 1 Capital is common shareholders' equity, reduced by certain intangible assets, postretirement benefit liability adjustments, and unrealized gains and losses on investment securities. Total Capital is Tier 1 Capital plus an allowable amount of the reserve for credit losses. Three capital ratios are used to measure capital adequacy: Tier 1 Capital divided by risk-weighted assets, as defined; Total Capital divided by risk-weighted assets; and the Tier 1 Leverage ratio, which is Tier 1 Capital divided by quarterly average total assets.
As of
December 31, 2012
, the Company and the Bank were well capitalized as defined in the regulatory framework for prompt corrective action. There were no conditions or events since
December 31, 2012
that management believes have changed the Company or the Bank's capital ratings.
87
Dividends
Dividends paid by the Parent are substantially funded from dividends received from the Bank. The Bank is subject to federal and state regulatory restrictions that limit cash dividends and loans to the Parent. These restrictions generally require advanced approval from the Bank's regulator for payment of dividends in excess of the sum of net income for the current calendar year and the retained net income of the prior
two
calendar years.
Common Stock Repurchase Program
The Parent has a common stock repurchase program in which shares repurchased are held in treasury stock for reissuance in connection with share-based compensation plans and for general corporate purposes. For the year ended
December 31, 2012
, the Parent repurchased
1.7 million
shares of common stock at an average cost per share of
$46.32
and a total cost of
$79.5 million
. From the beginning of the stock repurchase program in July 2001 through
December 31, 2012
, the Parent repurchased a total of
50.2 million
shares of common stock and returned a total of
$1.8 billion
to its shareholders at an average cost of
$36.33
per share. Remaining buyback authority under the common stock repurchase program was
$69.5 million
as of
December 31, 2012
. From January 1, 2013 through February 14, 2013, the Parent repurchased an additional
67,000
shares of common stock at an average cost of
$47.45
per share for a total of
$3.2 million
. Remaining buyback authority under the common stock repurchase program was
$66.3 million
as of February 14, 2013. The actual amount and timing of future share repurchases, if any, will depend on market conditions, applicable SEC rules and various other factors.
Accumulated Other Comprehensive Income
The components of accumulated other comprehensive income, net of tax, which is a component of shareholders' equity were as follows:
|
(dollars in thousands)
|
Net Unrealized
Gains on Investment Securities |
Defined
Benefit Plans |
Accumulated Other
Comprehensive Income |
|||||||||
|
Balance, December 31, 2009
|
$
|
26,290
|
|
$
|
(19,365
|
)
|
$
|
6,925
|
|
|||
|
Net change
|
20,231
|
|
(191
|
)
|
20,040
|
|
||||||
|
Balance, December 31, 2010
|
46,521
|
|
(19,556
|
)
|
26,965
|
|
||||||
|
Net change
|
16,411
|
|
(8,113
|
)
|
8,298
|
|
||||||
|
Balance, December 31, 2011
|
62,932
|
|
(27,669
|
)
|
35,263
|
|
||||||
|
Net change
|
(3,155
|
)
|
(2,900
|
)
|
(6,055
|
)
|
||||||
|
Balance, December 31, 2012
|
$
|
59,777
|
|
$
|
(30,569
|
)
|
$
|
29,208
|
|
|||
88
The following table presents the components of other comprehensive income (loss), net of tax:
|
(dollars in thousands)
|
Before Tax
|
|
Tax Effect
|
|
Net of Tax
|
|
|||||
|
December 31, 2012:
|
|||||||||||
|
Net Unrealized Losses on Investment Securities:
|
|||||||||||
|
Net Unrealized Gains Arising During the Period
|
$
|
10,846
|
|
$
|
4,312
|
|
$
|
6,534
|
|
||
|
Less: Reclassification Adjustment for Gains Realized in Net Income
1
|
(15,999
|
)
|
(6,310
|
)
|
(9,689
|
)
|
|||||
|
Net Unrealized Losses on Investment Securities
|
(5,153
|
)
|
(1,998
|
)
|
(3,155
|
)
|
|||||
|
Defined Benefit Plans:
|
|
|
|||||||||
|
Net Actuarial Losses Arising During the Period
|
(5,798
|
)
|
(2,295
|
)
|
(3,503
|
)
|
|||||
|
Amortization of Accumulated Benefit Plan Losses
|
1,318
|
|
520
|
|
798
|
|
|||||
|
Amortization of Prior Service Credit Included in Net Periodic Benefit Cost
|
(322
|
)
|
(127
|
)
|
(195
|
)
|
|||||
|
Defined Benefit Plans, Net
|
(4,802
|
)
|
(1,902
|
)
|
(2,900
|
)
|
|||||
|
Other Comprehensive Loss
|
$
|
(9,955
|
)
|
$
|
(3,900
|
)
|
$
|
(6,055
|
)
|
||
|
December 31, 2011:
|
|||||||||||
|
Net Unrealized Gains on Investment Securities:
|
|||||||||||
|
Net Unrealized Gains Arising During the Period
|
$
|
40,645
|
|
$
|
16,037
|
|
$
|
24,608
|
|
||
|
Less: Reclassification Adjustment for Gains Realized in Net Income
1
|
(13,525
|
)
|
(5,328
|
)
|
(8,197
|
)
|
|||||
|
Net Unrealized Gains on Investment Securities
|
27,120
|
|
10,709
|
|
16,411
|
|
|||||
|
Defined Benefit Plans:
|
|||||||||||
|
Prior Service Credit from Plan Amendment During the Period
|
917
|
|
361
|
|
556
|
|
|||||
|
Amortization of Prior Service Credit Included in Net Periodic Benefit Cost
|
(322
|
)
|
(127
|
)
|
(195
|
)
|
|||||
|
Net Prior Service Credit
|
595
|
|
234
|
|
361
|
|
|||||
|
Net Actuarial Losses Arising During the Period
|
(17,368
|
)
|
(6,841
|
)
|
(10,527
|
)
|
|||||
|
Amortization of Accumulated Benefit Plan Losses
|
3,387
|
|
1,334
|
|
2,053
|
|
|||||
|
Defined Benefit Plans, Net
|
(13,386
|
)
|
(5,273
|
)
|
(8,113
|
)
|
|||||
|
Other Comprehensive Income
|
$
|
13,734
|
|
$
|
5,436
|
|
$
|
8,298
|
|
||
|
December 31, 2010:
|
|||||||||||
|
Net Unrealized Gains on Investment Securities:
|
|||||||||||
|
Net Unrealized Gains Arising During the Period
|
$
|
78,494
|
|
$
|
33,941
|
|
$
|
44,553
|
|
||
|
Less: Reclassification Adjustment for Gains Realized in Net Income
|
(42,848
|
)
|
(18,526
|
)
|
(24,322
|
)
|
|||||
|
Net Unrealized Gains on Investment Securities
|
35,646
|
|
15,415
|
|
20,231
|
|
|||||
|
Defined Benefit Plans:
|
|||||||||||
|
Settlement Gain Related to Defined Benefit Plan
|
(951
|
)
|
(343
|
)
|
(608
|
)
|
|||||
|
Net Actuarial Losses Arising During the Period
|
(3,613
|
)
|
(5,955
|
)
|
2,342
|
|
|||||
|
Amortization of Accumulated Benefit Plan Losses
|
2,771
|
|
4,567
|
|
(1,796
|
)
|
|||||
|
Amortization of Prior Service Credit Included in Net Periodic Benefit Cost
|
(213
|
)
|
(84
|
)
|
(129
|
)
|
|||||
|
Defined Benefit Plans, Net
|
(2,006
|
)
|
(1,815
|
)
|
(191
|
)
|
|||||
|
Other Comprehensive Income
|
$
|
33,640
|
|
$
|
13,600
|
|
$
|
20,040
|
|
||
1
Includes amounts related to the sales of investment securities and amounts related to the amortization of gains from the reclassification of available-for-sale
investment securities to the held-to-maturity category made during the year ended December 31, 2011.
There were no adjustments to net income, the numerator, for purposes of computing basic earnings per share. The following is a reconciliation of the weighted average number of common shares outstanding for computing diluted earnings per share and antidilutive stock options and restricted stock outstanding for the years ended
December 31, 2012
,
2011
, and
2010
:
|
Weighted Average Shares
|
||||||||
|
2012
|
|
2011
|
|
2010
|
|
|||
|
Denominator for Basic Earnings Per Share
|
45,115,441
|
|
47,064,925
|
|
48,055,025
|
|
||
|
Dilutive Effect of Stock Options
|
102,149
|
|
140,815
|
|
279,371
|
|
||
|
Dilutive Effect of Restricted Stock
|
31,710
|
|
19,241
|
|
21,569
|
|
||
|
Denominator for Diluted Earnings Per Share
|
45,249,300
|
|
47,224,981
|
|
48,355,965
|
|
||
|
Antidilutive Stock Options and Restricted Stock Outstanding
|
522,383
|
|
554,062
|
|
224,372
|
|
||
89
The Company's business segments are defined as Retail Banking, Commercial Banking, Investment Services, and Treasury and Other. The Company's internal management accounting process measures the performance of the business segments based on the management structure of the Company. This process, which is not necessarily comparable with similar information for any other financial institution, uses various techniques to assign balance sheet and income statement amounts to the business segments, including allocations of income, expense, the provision for credit losses, and capital. This process is dynamic and requires certain allocations based on judgment and other subjective factors. Unlike financial accounting, there is no comprehensive authoritative guidance for management accounting that is equivalent to GAAP. Previously reported results have been reclassified to conform to the current organizational reporting structure.
The net interest income of the business segments reflects the results of a funds transfer pricing process that matches assets and liabilities with similar interest rate sensitivity and maturity characteristics and reflects the allocation of net interest income related to the Company's overall asset and liability management activities on a proportionate basis. The basis for the allocation of net interest income is a function of the Company's assumptions that are subject to change based on changes in current interest rates and market conditions. Funds transfer pricing also serves to transfer interest rate risk to Treasury. However, the other business segments have some latitude to retain certain interest rate exposures related to customer pricing decisions within guidelines.
The provision for credit losses reflects the actual net charge-offs of the business segments. This may be adjusted periodically for
changes in the risk profile of the business segment. The total provision for loan and lease losses is based on the methodology that we use to estimate our total Allowance. The residual provision for credit losses to arrive at the total provision for credit losses is included in Treasury and Other.
Implicit in noninterest income and expense are allocations from support units to business units. These allocations are based on actual usage where practicably calculated or by management’s estimate of such usage.
The provision for income taxes is allocated to business segments using a
37%
effective tax rate, with the exception of our Leasing
business unit which is assigned its actual effective tax rate due to the unique relationship that income taxes have with their leasing
products. The residual income tax expense or benefit to arrive at the consolidated effective tax rate is included in Treasury and Other.
Retail Banking
Retail Banking offers a broad range of financial products and services to consumers and small businesses. Loan and lease products include residential mortgage loans, home equity lines of credit, automobile loans and leases, and installment loans. Deposit products include checking, savings, and time deposit accounts. Retail Banking also offers retail insurance products. Products and services from Retail Banking are delivered to customers through
65
Hawaii branch locations,
494
ATMs throughout Hawaii and the Pacific Islands, e-Bankoh (on-line banking service), a 24-hour customer service center, and a mobile banking service.
Commercial Banking
Commercial Banking offers products including corporate banking, commercial real estate loans, commercial lease financing, auto dealer financing, and deposit products. Commercial lending and deposit products are offered to middle-market and large companies in Hawaii. Commercial real estate mortgages focus on customers that include investors, developers, and builders predominantly domiciled in Hawaii. Commercial Banking also includes international banking and operations at the Bank's
11
branches in the Pacific Islands and also provides merchant services to its small business customers.
Investment Services
Investment Services includes private banking, trust services, investment management, and institutional investment advisory services. A significant portion of this segment's income is derived from fees, which are generally based on the market values of assets under management. The private banking and personal trust group assists individuals and families in building and preserving their wealth by providing investment, credit, and trust services to high-net-worth individuals. The investment management group manages portfolios utilizing a variety of investment products. Institutional client services offer investment advice to corporations, government entities, and foundations. Investment Services also provides a full service brokerage offering equities, mutual funds, life insurance, and annuity products.
90
Treasury and Other
Treasury consists of corporate asset and liability management activities, including interest rate risk management and a foreign exchange business. This segment's assets and liabilities (and related interest income and expense) consist of interest-bearing deposits, investment securities, federal funds sold and purchased, government deposits, and short and long-term borrowings. The primary sources of noninterest income are from bank-owned life insurance, net gains from the sale of investment securities, and foreign exchange income related to customer driven currency requests from merchants and island visitors. The net residual effect of the transfer pricing of assets and liabilities is included in Treasury, along with the elimination of intercompany transactions.
Other organizational units (Technology, Operations, Marketing, Human Resources, Finance, Credit and Risk Management, and Corporate and Regulatory Administration) provide a wide-range of support to the Company's other income earning segments. Expenses incurred by these support units are charged to the business segments through an internal cost allocation process.
Selected business segment financial information as of and for the years ended
December 31, 2012
,
2011
, and
2010
were as follows:
|
(dollars in thousands)
|
Retail
Banking |
|
Commercial
Banking |
|
Investment
Services |
|
Treasury
and Other |
|
Consolidated
Total |
|
|||||||||
|
Year Ended December 31, 2012
|
|||||||||||||||||||
|
Net Interest Income
|
$
|
156,911
|
|
$
|
123,911
|
|
$
|
12,448
|
|
$
|
84,001
|
|
$
|
377,271
|
|
||||
|
Provision for Credit Losses
|
11,443
|
|
(909
|
)
|
196
|
|
(9,751
|
)
|
979
|
|
|||||||||
|
Net Interest Income After Provision for Credit Losses
|
145,468
|
|
124,820
|
|
12,252
|
|
93,752
|
|
376,292
|
|
|||||||||
|
Noninterest Income
|
93,482
|
|
37,580
|
|
57,454
|
|
11,770
|
|
200,286
|
|
|||||||||
|
Noninterest Expense
|
(179,580
|
)
|
(90,110
|
)
|
(55,543
|
)
|
(9,055
|
)
|
(334,288
|
)
|
|||||||||
|
Income Before Provision for Income Taxes
|
59,370
|
|
72,290
|
|
14,163
|
|
96,467
|
|
242,290
|
|
|||||||||
|
Provision for Income Taxes
|
(21,967
|
)
|
(20,941
|
)
|
(5,240
|
)
|
(28,066
|
)
|
(76,214
|
)
|
|||||||||
|
Net Income
|
$
|
37,403
|
|
$
|
51,349
|
|
$
|
8,923
|
|
$
|
68,401
|
|
$
|
166,076
|
|
||||
|
Total Assets as of December 31, 2012
|
$
|
3,365,123
|
|
$
|
2,497,642
|
|
$
|
190,383
|
|
$
|
7,675,224
|
|
$
|
13,728,372
|
|
||||
|
Year Ended December 31, 2011
|
|||||||||||||||||||
|
Net Interest Income
|
$
|
173,979
|
|
$
|
137,354
|
|
$
|
15,137
|
|
$
|
63,738
|
|
$
|
390,208
|
|
||||
|
Provision for Credit Losses
|
22,341
|
|
(938
|
)
|
64
|
|
(8,777
|
)
|
12,690
|
|
|||||||||
|
Net Interest Income After Provision for Credit Losses
|
151,638
|
|
138,292
|
|
15,073
|
|
72,515
|
|
377,518
|
|
|||||||||
|
Noninterest Income
|
84,008
|
|
37,132
|
|
59,891
|
|
16,624
|
|
197,655
|
|
|||||||||
|
Noninterest Expense
|
(186,567
|
)
|
(93,935
|
)
|
(59,180
|
)
|
(8,511
|
)
|
(348,193
|
)
|
|||||||||
|
Income Before Provision for Income Taxes
|
49,079
|
|
81,489
|
|
15,784
|
|
80,628
|
|
226,980
|
|
|||||||||
|
Provision for Income Taxes
|
(18,160
|
)
|
(28,286
|
)
|
(5,841
|
)
|
(14,650
|
)
|
(66,937
|
)
|
|||||||||
|
Net Income
|
$
|
30,919
|
|
$
|
53,203
|
|
$
|
9,943
|
|
$
|
65,978
|
|
$
|
160,043
|
|
||||
|
Total Assets as of December 31, 2011
|
$
|
3,147,765
|
|
$
|
2,337,214
|
|
$
|
218,088
|
|
$
|
8,143,324
|
|
$
|
13,846,391
|
|
||||
|
Year Ended December 31, 2010
|
|||||||||||||||||||
|
Net Interest Income
|
$
|
188,660
|
|
$
|
147,016
|
|
$
|
16,567
|
|
$
|
54,237
|
|
$
|
406,480
|
|
||||
|
Provision for Credit Losses
|
38,377
|
|
17,085
|
|
(129
|
)
|
(46
|
)
|
55,287
|
|
|||||||||
|
Net Interest Income After Provision for Credit Losses
|
150,283
|
|
129,931
|
|
16,696
|
|
54,283
|
|
351,193
|
|
|||||||||
|
Noninterest Income
|
100,859
|
|
41,304
|
|
59,949
|
|
53,146
|
|
255,258
|
|
|||||||||
|
Noninterest Expense
|
(175,621
|
)
|
(96,225
|
)
|
(58,467
|
)
|
(15,923
|
)
|
(346,236
|
)
|
|||||||||
|
Income Before Provision for Income Taxes
|
75,521
|
|
75,010
|
|
18,178
|
|
91,506
|
|
260,215
|
|
|||||||||
|
Provision for Income Taxes
|
(27,942
|
)
|
(22,273
|
)
|
(6,726
|
)
|
(19,332
|
)
|
(76,273
|
)
|
|||||||||
|
Net Income
|
$
|
47,579
|
|
$
|
52,737
|
|
$
|
11,452
|
|
$
|
72,174
|
|
$
|
183,942
|
|
||||
|
Total Assets as of December 31, 2010
|
$
|
3,078,747
|
|
$
|
2,244,788
|
|
$
|
196,466
|
|
$
|
7,606,786
|
|
$
|
13,126,787
|
|
||||
91
The Company has defined contribution plans, defined benefit plans, and a postretirement benefit plan.
Defined Contribution Plans
The Bank of Hawaii Retirement Savings Plan (the "Savings Plan") has
three
Company contribution components in addition to employee contributions: 1) 401(k) matching; 2) a
3%
fixed amount based on eligible compensation; and 3) a discretionary value-sharing contribution.
Under the 401(k) matching component, participating employees may contribute up to
50%
of their eligible compensation (within federal limits) to the Savings Plan. The Company makes matching contributions on behalf of participants equal to
$1.25
for each
$1.00
contributed by participants, up to
2%
of the participants' eligible compensation, and
$0.50
for every
$1.00
contributed by participants over
2%
, up to
5%
of the participants' eligible compensation. A
3%
fixed contribution and a discretionary value-sharing contribution, that is linked to the Company's financial goals, are made regardless of whether the participating employee contributes to the Savings Plan and are invested in accordance with the participant's selection of investment options available under the Savings Plan. The Company also has a non-qualified savings plan which covers certain employees with compensation exceeding Internal Revenue Service ("IRS") limits on pay amounts in the allocation of the Savings Plan's benefits. Total expense for all components of the Company's defined contribution plans was
$11.8 million
,
$11.4 million
, and
$11.7 million
for the years ended
December 31, 2012
,
2011
, and
2010
, respectively.
Defined Benefit Plans
The Company has
two
defined benefit plans (the "Pension Plans"). In 1995, the Company froze its non-contributory, qualified defined benefit retirement plan (the "Retirement Plan") and the excess retirement plan (the "Excess Plan"), which covered employees of the Company and participating subsidiaries who met certain eligibility requirements. Beginning January 1, 2001, the Pension Plans no longer provided for compensation increases in the determination of benefits. The projected benefit obligation is equal to the accumulated benefit obligation due to the frozen status of the Pension Plans.
The assets of the Retirement Plan primarily consist of equity and fixed income mutual funds.
The Excess Plan is a non-qualified excess retirement benefit plan which covers certain employees of the Company and participating subsidiaries with compensation exceeding IRS limits on pay amounts applicable to the Pension Plan's benefit formula. The Excess Plan has no plan assets. The Excess Plan's projected benefit obligation and accumulated benefit obligation were
$4.8 million
and
$4.9 million
as of
December 31, 2012
and
2011
, respectively.
Postretirement Benefit Plan
The Company's postretirement benefit plan provides retirees with medical and dental insurance coverage. For eligible participants that retired before 2008 and met certain age requirements, the Company and retiree share in the cost of providing postretirement benefits where both the employer and retirees pay a portion of the insurance premiums. Eligible participants who retired before 2008 who did not meet certain age requirements continued on the Company's benefit plans, but pay for their full insurance premiums. Participants who retire on or after January 1, 2008, who have medical or dental coverage under the Company's plans immediately before retirement and meet certain age and years of service requirements as of December 31, 2008 are also eligible to participate in the Company's benefit plans, but must pay for their full insurance premiums. Retirees age
65
and older are provided with a Medicare supplemental plan subsidy. Most employees of the Company who have met certain eligibility requirements are covered by this plan. Participants who retire on or after January 1, 2008 who meet certain age and/or years of service requirements are eligible for the Health Reimbursement Account ("HRA") program. The HRA program provides retirees with an initial credit based on years of service. Thereafter, an annual credit up to a maximum of
$1,200
is provided into the HRA. The retiree may use the HRA for medical, vision, prescription drug and dental premiums, co-payments, and medically necessary health care expenses that are not covered by any medical or dental insurance program or flexible health spending account. As of
December 31, 2012
and
2011
, the Company had no segregated assets to provide for postretirement benefits.
The Company settled the retiree life insurance portion of the postretirement benefit obligation in December 2010. The settlement reduced the net periodic benefit cost for the year ended December 31, 2010 by
$1.0 million
.
92
The following table provides a reconciliation of changes in benefit obligation and fair value of plan assets, as well as the funded status recognized in the Company's statements of condition for the Pension Plans and postretirement benefit plan for the years ended
December 31, 2012
and
2011
.
|
Pension Benefits
|
Postretirement Benefits
|
||||||||||||||
|
(dollars in thousands)
|
2012
|
|
2011
|
|
2012
|
|
2011
|
|
|||||||
|
Benefit Obligation at Beginning of Year
|
$
|
102,742
|
|
$
|
93,062
|
|
$
|
25,979
|
|
$
|
25,658
|
|
|||
|
Service Cost
|
—
|
|
|
—
|
|
585
|
|
|
514
|
|
|||||
|
Interest Cost
|
4,996
|
|
|
5,221
|
|
1,302
|
|
|
1,341
|
|
|||||
|
Actuarial Losses (Gains)
|
7,780
|
|
8,675
|
|
1,942
|
|
(762
|
)
|
|||||||
|
Employer Benefits Paid
1
|
(7,685
|
)
|
(4,216
|
)
|
(678
|
)
|
(772
|
)
|
|||||||
|
Benefit Obligation at End of Year
|
$
|
107,833
|
|
$
|
102,742
|
|
$
|
29,130
|
|
$
|
25,979
|
|
|||
|
Fair Value of Plan Assets at Beginning of Year
|
$
|
82,163
|
|
$
|
87,960
|
|
$
|
—
|
|
$
|
—
|
|
|||
|
Actual Return on Plan Assets
|
9,523
|
|
(2,086
|
)
|
—
|
|
—
|
|
|||||||
|
Employer Contributions
|
5,488
|
|
505
|
|
678
|
|
772
|
|
|||||||
|
Employer Benefits Paid
1
|
(7,685
|
)
|
(4,216
|
)
|
(678
|
)
|
(772
|
)
|
|||||||
|
Fair Value of Plan Assets at End of Year
|
$
|
89,489
|
|
$
|
82,163
|
|
$
|
—
|
|
$
|
—
|
|
|||
|
Funded Status at End of Year
2
|
$
|
(18,344
|
)
|
$
|
(20,579
|
)
|
$
|
(29,130
|
)
|
$
|
(25,979
|
)
|
|||
1
Participants' contributions relative to the postretirement benefit plan were offset against employer benefits paid in the table above. Participants' contributions for
postretirement benefits were
$1.0 million
and
$1.1 million
for the years ended
December 31, 2012
and
2011
, respectively.
2
Amounts are recognized in Retirement Benefits Payable in the statements of condition.
The following presents the amounts recognized in the Company's accumulated other comprehensive income for the Pension Plans and postretirement benefit plan as of
December 31, 2012
and
2011
.
|
Pension Benefits
|
Postretirement Benefits
|
||||||||||||||
|
(dollars in thousands)
|
2012
|
|
2011
|
|
2012
|
|
2011
|
|
|||||||
|
Amounts Recognized in Accumulated Other
Comprehensive Income, Net of Tax |
|||||||||||||||
|
Net Actuarial Gains (Losses)
|
$
|
(32,011
|
)
|
$
|
(30,484
|
)
|
$
|
245
|
|
$
|
1,422
|
|
|||
|
Net Prior Service Credit
|
—
|
|
—
|
|
1,197
|
|
1,393
|
|
|||||||
|
Total Amounts Recognized in Accumulated Other
Comprehensive Income, Net of Tax |
$
|
(32,011
|
)
|
$
|
(30,484
|
)
|
$
|
1,442
|
|
$
|
2,815
|
|
|||
Components of net periodic benefit cost for the Company's Pension Plans and the postretirement benefit plan are presented in the following table for the years ended
December 31, 2012
,
2011
, and
2010
.
|
Pension Benefits
|
Postretirement Benefits
|
||||||||||||||||||||||
|
(dollars in thousands)
|
2012
|
|
2011
|
|
2010
|
|
2012
|
|
2011
|
|
2010
|
|
|||||||||||
|
Service Cost
|
$
|
—
|
|
$
|
—
|
|
$
|
—
|
|
$
|
585
|
|
$
|
514
|
|
$
|
460
|
|
|||||
|
Interest Cost
|
4,996
|
|
5,221
|
|
5,226
|
|
1,302
|
|
1,341
|
|
1,769
|
|
|||||||||||
|
Expected Return on Plan Assets
|
(5,829
|
)
|
(6,451
|
)
|
(6,526
|
)
|
—
|
|
—
|
|
—
|
|
|||||||||||
|
Amortization of:
|
|
|
|
|
|
|
|||||||||||||||||
|
Prior Service Credit
1
|
—
|
|
—
|
|
—
|
|
(322
|
)
|
(322
|
)
|
(213
|
)
|
|||||||||||
|
Net Actuarial Losses (Gains)
1
|
1,318
|
|
3,466
|
|
2,988
|
|
—
|
|
(79
|
)
|
(217
|
)
|
|||||||||||
|
Settlement Gain
1
|
—
|
|
—
|
|
—
|
|
—
|
|
—
|
|
(951
|
)
|
|||||||||||
|
Net Periodic Benefit Cost
|
$
|
485
|
|
$
|
2,236
|
|
$
|
1,688
|
|
$
|
1,565
|
|
$
|
1,454
|
|
$
|
848
|
|
|||||
|
1
|
Represents reclassification adjustments from accumulated other comprehensive income during the period.
|
The estimated net actuarial loss related to the Company's Pension Plans that is expected to be amortized from accumulated other comprehensive income into net periodic benefit cost for the year ending
December 31, 2013
is approximately
$1.7 million
. There is no net actuarial gain related to the Company's postretirement benefit plan that is expected to be amortized from accumulated other comprehensive income into net periodic benefit cost for the year ending
December 31, 2013
. The prior service credit related to the Company's postretirement benefit plan that is expected to be amortized from accumulated other comprehensive income into net periodic benefit cost for the year ending
December 31, 2013
is approximately
$0.3 million
.
93
Assumptions used to determine the benefit obligations as of
December 31, 2012
and
2011
for the Company's Pension Plans and postretirement benefit plan were as follows:
|
Pension Benefits
|
Postretirement Benefits
|
||||||||||
|
2012
|
|
2011
|
|
2012
|
|
2011
|
|
||||
|
Weighted Average Assumptions as of December 31:
|
|||||||||||
|
Discount Rate
|
4.29
|
%
|
5.04
|
%
|
4.29
|
%
|
5.04
|
%
|
|||
|
Health Care Cost Trend Rate Assumed For Next Year
|
—
|
|
—
|
|
7.70
|
%
|
8.00
|
%
|
|||
The health care cost trend rate is assumed to decrease annually, until reaching the ultimate trend rate of
4.5%
in
2027
.
Assumptions used to determine the net periodic benefit cost for the Company's Pension Plans and postretirement benefit plan for the years ended
December 31, 2012
,
2011
, and
2010
were as follows:
|
Pension Benefits
|
Postretirement Benefits
|
||||||||||||||||
|
2012
|
|
2011
|
|
2010
|
|
2012
|
|
2011
|
|
2010
|
|
||||||
|
Weighted Average Assumptions as of December 31:
|
|||||||||||||||||
|
Discount Rate
|
5.04
|
%
|
5.75
|
%
|
6.00
|
%
|
5.04
|
%
|
5.75
|
%
|
6.00
|
%
|
|||||
|
Expected Long-Term Rate of Return on Plan Assets
|
6.50
|
%
|
8.00
|
%
|
8.00
|
%
|
—
|
|
—
|
|
—
|
|
|||||
|
Health Care Cost Trend Rate
|
—
|
|
—
|
|
—
|
|
8.00
|
%
|
8.50
|
%
|
9.00
|
%
|
|||||
A combination of factors is used by management in determining the expected long-term rate of return on plan assets. Historical return experience for major asset categories are evaluated and current market factors, such as inflation and interest rates, are considered in determining the expected long-term rate of return assumption.
A one percent change in the health care cost trend rate assumption (with all other assumptions remaining constant) would have impacted the service and interest cost components of the net periodic postretirement benefit cost and the postretirement benefit obligation as of and for the year ended
December 31, 2012
as follows:
|
(dollars in thousands)
|
One Percent
Increase |
One Percent
Decrease |
|||||||
|
Effect on the Total of Service and Interest Cost Component of
Net Periodic Postretirement Benefit Cost |
$
|
170
|
|
$
|
(173
|
)
|
|||
|
Effect on the Postretirement Benefit Obligation
|
2,362
|
|
(2,363
|
)
|
|||||
The Company expects to contribute
$0.5 million
to the Pension Plans and
$1.4 million
to the postretirement benefit plan for the year ending
December 31, 2013
.
As of
December 31, 2012
, expected benefits to be paid in each of the next five years and in the aggregate for the five years thereafter are as follows:
|
(dollars in thousands)
|
Pension Benefits
|
Postretirement Benefits
|
|||||||
|
2013
|
$
|
5,228
|
|
$
|
1,400
|
|
|||
|
2014
|
5,768
|
|
1,485
|
|
|||||
|
2015
|
6,111
|
|
1,564
|
|
|||||
|
2016
|
6,386
|
|
1,734
|
|
|||||
|
2017
|
6,658
|
|
1,773
|
|
|||||
|
Years 2018-2022
|
35,777
|
|
9,669
|
|
|||||
94
Retirement Plan Assets
The Company's overall investment strategy is to maintain the purchasing power of the current assets and all future contributions by producing positive rates of return on plan assets; achieve capital growth towards the attainment of full funding of the Retirement Plan's termination liability; maximize returns within reasonable and prudent levels of risk; and control costs of administering the plan and managing the investments. The long-term investment objective is to achieve an overall annualized total return, gross of fees, above the blended benchmark index comprised of
30%
S&P 500 Index,
15%
MSCI EAFE Index, and
55%
Barclays Capital Aggregate Bond Index.
Subject to liquidity requirements, the asset allocation targets are
45%
for equity securities,
55%
for fixed income securities with a
20%
plus or minus from the strategic targets, and
zero
to
20%
for cash. Within the equity securities portfolio, the range for domestic securities is from
50%
to
100%
and the range for international securities is from
0%
to
50%
. All assets selected for the Retirement Plan must have a readily ascertainable market value and must be readily marketable.
Due to market fluctuations or cash flows, the allocation limits for each asset class may be breached by as much as plus or minus
5%
. Such situations are acceptable on a temporary basis, but asset allocation is expected to conform to range limits within
90
days of such an occurrence.
The fair values of the Retirement Plan assets as of
December 31, 2012
and
2011
by asset category were as follows:
|
Fair Value Measurements
|
||||||||||||||||||||
|
Asset Category
(dollars in thousands) |
Quoted Prices in
Active Markets for Identical Assets (Level 1) |
Significant Other
Observable Inputs (Level 2) |
Significant Other
Unobservable Inputs (Level 3) |
Total
as of Dec. 31, 2012 |
|
Total
as of Dec. 31, 2011 |
|
|||||||||||||
|
Cash
|
$
|
2,100
|
|
$
|
—
|
|
$
|
—
|
|
$
|
2,100
|
|
$
|
1,380
|
|
|||||
|
Equity Security – Mutual Funds:
|
||||||||||||||||||||
|
Large-Cap
|
6,976
|
|
—
|
|
—
|
|
6,976
|
|
6,810
|
|
||||||||||
|
Mid-Cap
|
2,483
|
|
—
|
|
—
|
|
2,483
|
|
2,846
|
|
||||||||||
|
Small-Cap
|
2,529
|
|
—
|
|
—
|
|
2,529
|
|
2,923
|
|
||||||||||
|
Mixed-Cap
|
14,716
|
|
—
|
|
—
|
|
14,716
|
|
16,042
|
|
||||||||||
|
International
|
8,741
|
|
—
|
|
—
|
|
8,741
|
|
9,630
|
|
||||||||||
|
Emerging Market
|
4,748
|
|
—
|
|
—
|
|
4,748
|
|
5,123
|
|
||||||||||
|
Fixed Income – Mutual Funds
|
47,196
|
|
—
|
|
—
|
|
47,196
|
|
37,409
|
|
||||||||||
|
Total
|
$
|
89,489
|
|
$
|
—
|
|
$
|
—
|
|
$
|
89,489
|
|
$
|
82,163
|
|
|||||
Quoted prices for these investments were available in active markets, and therefore were classified as Level 1 measurements in the fair value hierarchy.
The Company has share-based compensation plans which allow grants of stock options, restricted stock, stock appreciation rights, and restricted stock units to its employees and non-employee directors. The Company's employee stock option plans are shareholder approved and administered by the Human Resources and Compensation Committee of the Board of Directors. Stock options provide grantees the option to purchase shares of the Parent's common stock at a specified exercise price and, generally, expire
10
years from the date of grant. Stock option grants include incentive and non-qualified stock options whose vesting may be based on a service period and/or achievement of Company performance measures. Stock option exercise prices were equal to the quoted market price of the Parent's common stock on the date of grant. Restricted stock provides grantees with rights to shares of common stock upon completion of a service period and/or achievement of Company performance measures. During the restriction period, all shares are considered outstanding and dividends are paid on the restricted stock. Generally, restricted stock vests over periods ranging from
one
to
five
years from the date of grant, although accelerated vesting was provided for in certain grants, based on the attainment of defined Company performance measures. Restricted stock is forfeited if an employee terminates prior to vesting.
As of
December 31, 2012
, total shares authorized under the plans were
4.7 million
shares, of which
2.7 million
shares were available for future grants of stock options or restricted stock.
95
The Company recognizes compensation expense, measured as the fair value of the share-based award on the date of grant, on a straight-line basis over the vesting period. Share-based compensation is recorded in the statements of income as a component of salaries and benefits for employees and as a component of other noninterest expense for non-employee directors, with a corresponding increase to capital surplus in shareholders' equity. For the years ended
December 31, 2012
,
2011
, and
2010
, compensation expense and the related income tax benefit recognized for all share-based awards were as follows:
|
(dollars in thousands)
|
2012
|
|
2011
|
|
2010
|
|
|||||
|
Compensation Expense
|
$
|
7,537
|
|
$
|
6,216
|
|
$
|
3,841
|
|
||
|
Income Tax Benefit
|
2,972
|
|
2,668
|
|
1,648
|
|
|||||
Stock Options
Stock options granted to employees during the year ended
December 31, 2012
vest in February 2013 based on service through December 31, 2012 and achieving certain 2012 Company performance measures. Stock options granted to employees during the year ended
December 31, 2011
were fully vested as of
December 31, 2011
. There were no stock options granted for the year ended
December 31, 2010
. The Company reissues treasury stock to satisfy stock option exercises. The Company used the Black-Scholes option pricing model to estimate the fair value of stock options granted. The weighted average fair value of stock option grants and the assumptions that were used in calculating such fair values were based on estimates at the date of grant as follows:
|
|
2012
|
|
2011
|
|
||
|
Weighted Average Fair Value of Stock Options
|
|
|
||||
|
Granted During the Year
|
$
|
9.81
|
|
$
|
10.47
|
|
|
Stock Options Granted During the Year
|
341,665
|
|
341,629
|
|
||
|
Assumptions:
|
|
|
||||
|
Average Risk-Free Interest Rate
|
1.13
|
%
|
0.96
|
%
|
||
|
Average Expected Volatility
|
33.14
|
%
|
39.94
|
%
|
||
|
Expected Dividend Yield
|
3.77
|
%
|
3.87
|
%
|
||
|
Expected Life
|
5.46 years
|
|
5.22 years
|
|
||
The following table presents the activity related to stock options under all plans for the year ended
December 31, 2012
.
|
Stock
Options |
|
Weighted
Average Exercise Price |
Weighted
Average Remaining Contractual Term (in years) |
Aggregate
Intrinsic Value (in thousands) |
||||||||
|
Stock Options Outstanding as of January 1, 2012
|
1,021,190
|
|
$
|
39.88
|
|
|||||||
|
Granted
|
341,665
|
|
47.72
|
|
||||||||
|
Exercised
|
(245,199
|
)
|
30.59
|
|
||||||||
|
Expired
|
(16,715
|
)
|
50.72
|
|
||||||||
|
Forfeited
|
(15,000
|
)
|
47.72
|
|
||||||||
|
Stock Options Outstanding as of December 31, 2012
|
1,085,941
|
|
44.17
|
|
6.1
|
$
|
2,385
|
|
||||
|
Stock Options Vested and Exercisable as of December 31, 2012
|
759,276
|
|
42.65
|
|
4.8
|
2,385
|
|
|||||
The following summarizes certain stock option activity of the Company for the years ended
December 31, 2012
,
2011
, and
2010
:
|
(dollars in thousands)
|
2012
|
|
2011
|
|
2010
|
|
|||||
|
Intrinsic Value of Stock Options Exercised
|
$
|
3,907
|
|
$
|
3,790
|
|
$
|
9,507
|
|
||
|
Cash Received from Stock Options Exercised
|
7,500
|
|
6,044
|
|
9,628
|
|
|||||
|
Tax Benefits Realized from Stock Options Exercised
|
904
|
|
888
|
|
2,983
|
|
|||||
|
Total Fair Value of Stock Options that Vested
|
—
|
|
3,578
|
|
—
|
|
|||||
96
Restricted Stock
As of
December 31, 2012
, unrecognized compensation cost related to unvested restricted stock was
$6.0 million
. The unrecognized compensation cost is expected to be recognized over a weighted average period of
2.0
years.
The following table presents the activity for all restricted stock awards:
|
Number of Shares
|
|
Weighted Average
Grant Date Fair Value |
Grant Date Fair Value
of Restricted Stock that Vested During the Year (in thousands) |
|||||||
|
Unvested as of December 31, 2009
|
143,965
|
|
$
|
50.84
|
|
|||||
|
Granted
|
88,404
|
|
52.50
|
|
||||||
|
Vested
|
(104,128
|
)
|
50.40
|
|
$
|
5,248
|
|
|||
|
Forfeited
|
(1,356
|
)
|
53.42
|
|
||||||
|
Unvested as of December 31, 2010
|
126,885
|
|
$
|
52.34
|
|
|||||
|
Granted
|
20,831
|
|
47.58
|
|
||||||
|
Vested
|
(65,226
|
)
|
52.28
|
|
$
|
3,410
|
|
|||
|
Forfeited
|
(1,648
|
)
|
52.69
|
|
||||||
|
Unvested as of December 31, 2011
|
80,842
|
|
$
|
51.15
|
|
|||||
|
Granted
|
187,514
|
|
47.42
|
|
||||||
|
Vested
|
(54,198
|
)
|
51.01
|
|
$
|
2,764
|
|
|||
|
Forfeited
|
(2,632
|
)
|
48.86
|
|
||||||
|
Unvested as of December 31, 2012
|
211,526
|
|
$
|
47.91
|
|
|||||
Provision for Income Taxes
The components of the Company's provision for income taxes for the years ended
December 31, 2012
,
2011
, and
2010
were as follows:
|
(dollars in thousands)
|
2012
|
|
2011
|
|
2010
|
|
|||||
|
Current:
|
|||||||||||
|
Federal
|
$
|
80,224
|
|
$
|
60,371
|
|
$
|
78,888
|
|
||
|
State
|
10,106
|
|
3,995
|
|
12,809
|
|
|||||
|
Foreign
|
2,668
|
|
2,373
|
|
3,231
|
|
|||||
|
Total Current
|
92,998
|
|
66,739
|
|
94,928
|
|
|||||
|
Deferred:
|
|||||||||||
|
Federal
|
(13,104
|
)
|
1,254
|
|
(19,102
|
)
|
|||||
|
State
|
(3,680
|
)
|
(1,056
|
)
|
447
|
|
|||||
|
Total Deferred
|
(16,784
|
)
|
198
|
|
(18,655
|
)
|
|||||
|
Provision for Income Taxes
|
$
|
76,214
|
|
$
|
66,937
|
|
$
|
76,273
|
|
||
The tax effects of fair value adjustments on available-for-sale investment securities, the amortization of gains related to held-to-maturity investment securities, the minimum pension liability adjustment, and tax benefits related to stock options are recorded directly to consolidated shareholders' equity. The net tax benefit recorded directly to consolidated shareholders' equity was
$4.7 million
for the year ended
December 31, 2012
. The net tax charge recorded directly to consolidated shareholders' equity was
$4.6 million
and
$10.8 million
for the years ended
December 31, 2011
and
2010
, respectively.
97
Deferred Tax Liabilities and Assets
As of
December 31, 2012
and
2011
, significant components of the Company's deferred tax liabilities and assets were as follows:
|
(dollars in thousands)
|
2012
|
|
2011
|
|
|||
|
Deferred Tax Liabilities:
|
|||||||
|
Accrued Pension Cost
|
$
|
(14,616
|
)
|
$
|
(14,648
|
)
|
|
|
Federal Home Loan Bank Stock
|
(9,582
|
)
|
(9,898
|
)
|
|||
|
Lease Transactions
|
(115,699
|
)
|
(125,472
|
)
|
|||
|
Net Unrealized Gains on Investments Securities Available-for-Sale
|
(38,868
|
)
|
(40,847
|
)
|
|||
|
Deferred Loan Fees
|
(4,478
|
)
|
(2,682
|
)
|
|||
|
Originated Mortgage Servicing Rights
|
(10,872
|
)
|
(6,693
|
)
|
|||
|
Other
|
(502
|
)
|
(518
|
)
|
|||
|
Gross Deferred Tax Liabilities
|
(194,617
|
)
|
(200,758
|
)
|
|||
|
Deferred Tax Assets:
|
|||||||
|
Accelerated Depreciation
|
10,097
|
|
8,772
|
|
|||
|
Allowance for Loan Losses
|
47,808
|
|
47,843
|
|
|||
|
Minimum Pension Liability
|
19,906
|
|
17,981
|
|
|||
|
Accrued Expenses
|
14,499
|
|
16,103
|
|
|||
|
Postretirement Benefit Obligations
|
12,580
|
|
12,124
|
|
|||
|
Capital Lease Expenses
|
3,146
|
|
3,087
|
|
|||
|
Restricted Stock
|
4,591
|
|
2,706
|
|
|||
|
Investment in Unincorporated Entities
|
7,304
|
|
6,546
|
|
|||
|
Deductible State and Local Taxes
|
10,284
|
|
10,225
|
|
|||
|
Other
|
6,338
|
|
5,218
|
|
|||
|
Gross Deferred Tax Assets Before Valuation Allowance
|
136,553
|
|
130,605
|
|
|||
|
Valuation Allowance
|
(5,133
|
)
|
(4,433
|
)
|
|||
|
Gross Deferred Tax Assets After Valuation Allowance
|
131,420
|
|
126,172
|
|
|||
|
Net Deferred Tax Liabilities
|
$
|
(63,197
|
)
|
$
|
(74,586
|
)
|
|
Both positive and negative evidence was considered by management in determining the need for a valuation allowance. Negative evidence included the uncertainty regarding the generation of capital gains in future years and restrictions on the ability to sell low-income housing investments during periods when carrybacks of capital losses are allowed. Positive evidence included capital gains in the current year and carryback years. After considering all available evidence, management determined that a valuation allowance to offset deferred tax assets related to low-income housing investments that can only be used to offset capital gains was appropriate. Management determined that a valuation allowance was not required for the remaining deferred tax assets because it is more likely than not these assets will be realized through future reversals of existing taxable temporary differences, future taxable income exclusive of reversing temporary differences, and taxable income in prior carryback years.
Certain events covered by Internal Revenue Code Section 593(e) will trigger a recapture of base year reserves of acquired thrift institutions. The base year reserves of acquired thrift institutions would be recaptured if an entity ceases to qualify as a bank for federal income tax purposes. The base year reserves of thrift institutions also remain subject to income tax penalty provisions that, in general, require recapture upon certain stock redemptions of, and excess distributions to, stockholders. As of
December 31, 2012
, retained earnings included approximately
$18.2 million
of base year reserves for which the deferred federal income tax liability of
$7.2 million
has not been recognized.
98
Effective Tax Rate
The following is a reconciliation of the statutory federal income tax rate to the Company's effective tax rate for the years ended
December 31, 2012
,
2011
, and
2010
:
|
2012
|
|
2011
|
|
2010
|
|
|||
|
Statutory Federal Income Tax Rate
|
35.00
|
%
|
35.00
|
%
|
35.00
|
%
|
||
|
Increase (Decrease) in Income Tax Rate Resulting From:
|
||||||||
|
State Taxes, Net of Federal Income Tax
|
1.90
|
|
0.71
|
|
4.42
|
|
||
|
Tax Reserve Adjustments
|
0.44
|
|
(2.21
|
)
|
(6.58
|
)
|
||
|
Leveraged Leases
|
(1.44
|
)
|
0.05
|
|
(1.31
|
)
|
||
|
Low-Income Housing Investments
|
0.16
|
|
(1.55
|
)
|
(1.18
|
)
|
||
|
Bank-Owned Life Insurance
|
(0.98
|
)
|
(0.97
|
)
|
(0.86
|
)
|
||
|
Tax-Exempt Income
|
(2.31
|
)
|
(0.57
|
)
|
(0.23
|
)
|
||
|
Other
|
(1.31
|
)
|
(0.97
|
)
|
0.05
|
|
||
|
Effective Tax Rate
|
31.46
|
%
|
29.49
|
%
|
29.31
|
%
|
||
Unrecognized Tax Benefits
The Company is required to record a liability, referred to as an unrecognized tax benefit ("UTB"), for the entire amount of benefit taken in a prior or future income tax return when the Company determines that a tax position has a less than
50%
likelihood of being accepted by the taxing authority. The following presents a reconciliation of the Company's liability for UTBs for the years ended
December 31, 2012
,
2011
, and
2010
:
|
(dollars in thousands)
|
2012
|
|
2011
|
|
2010
|
|
||||
|
Unrecognized Tax Benefits at Beginning of Year
|
$
|
13,633
|
|
$
|
22,980
|
|
$
|
16,400
|
|
|
|
Gross Increases, Related to Tax Positions Taken in a Prior Period
|
280
|
|
725
|
|
8,520
|
|
||||
|
Gross Increases, Related to Current Period Tax Positions
|
1,888
|
|
—
|
|
300
|
|
||||
|
Settlement with Taxing Authority
|
(40
|
)
|
(1,889
|
)
|
—
|
|
||||
|
Lapse of Statute of Limitations
|
(328
|
)
|
(8,183
|
)
|
(2,240
|
)
|
||||
|
Unrecognized Tax Benefits at End of Year
|
$
|
15,433
|
|
$
|
13,633
|
|
$
|
22,980
|
|
|
As of
December 31, 2012
and
2011
,
$14.2 million
and
$13.6 million
, respectively, in liabilities for UTBs was related to UTBs that if reversed would have an impact on the Company's effective tax rate.
Management believes that it is reasonably possible that the Company's liability for UTBs could significantly decrease as a result of the expiration of statutes of limitations and potential settlements with taxing authorities within the next 12 months. However, management is currently not able to estimate a range of possible change in the amount of the liability for UTBs recorded as of
December 31, 2012
.
The Company classifies interest and penalties, if any, related to the liability for UTBs as a component of the provision for income taxes. For the years ended
December 31, 2012
,
2011
, and
2010
, the Company recorded a net tax provision of
$0.5 million
, a net tax benefit of
$2.6 million
, and a net tax provision of
$2.2 million
, respectively, for interest and penalties. As of
December 31, 2012
and
2011
, the Company had accrued
$3.1 million
and
$2.6 million
, respectively, for the payment of possible interest and penalties.
The Company's federal income tax return for 2011 is currently under examination by the IRS. The State of Hawaii is currently in the process of examining state income tax returns filed for 2003 through 2010. The Company's State of Hawaii income tax returns for 2003 through 2011 remain subject to examination by the taxing authorities.
99
The notional amount and fair value of the Company's derivative financial instruments as of
December 31, 2012
and
2011
were as follows:
|
December 31, 2012
|
December 31, 2011
|
||||||||||||||||
|
(dollars in thousands)
|
Notional Amount
|
Fair Value
|
|
Notional Amount
|
Fair Value
|
|
|||||||||||
|
Interest Rate Lock Commitments
|
$
|
243,094
|
|
$
|
10,188
|
|
$
|
62,459
|
|
$
|
2,334
|
|
|||||
|
Forward Commitments
|
194,658
|
|
(140
|
)
|
62,819
|
|
(938
|
)
|
|||||||||
|
Interest Rate Swap Agreements
|
|||||||||||||||||
|
Receive Fixed/Pay Variable Swaps
|
236,803
|
|
32,193
|
|
259,218
|
|
35,503
|
|
|||||||||
|
Pay Fixed/Receive Variable Swaps
|
236,803
|
|
(32,441
|
)
|
259,218
|
|
(35,779
|
)
|
|||||||||
|
Foreign Exchange Contracts
|
|||||||||||||||||
|
Buy
|
22,318
|
|
(845
|
)
|
27,459
|
|
194
|
|
|||||||||
|
Sell
|
8,211
|
|
29
|
|
9,571
|
|
(61
|
)
|
|||||||||
The following table presents the Company's derivative financial instruments, their fair values, and balance sheet location as of
December 31, 2012
and
2011
:
|
December 31, 2012
|
December 31, 2011
|
|||||||||||||||
|
Derivative Financial Instruments Not Designated
as Hedging Instruments 1 (dollars in thousands) |
Asset
Derivatives |
|
Liability
Derivatives |
|
Asset
Derivatives |
|
Liability
Derivatives |
|
||||||||
|
Interest Rate Lock Commitments
|
$
|
10,188
|
|
$
|
—
|
|
$
|
2,344
|
|
$
|
10
|
|
||||
|
Forward Commitments
|
189
|
|
329
|
|
8
|
|
946
|
|
||||||||
|
Interest Rate Swap Agreements
|
32,193
|
|
32,441
|
|
35,503
|
|
35,779
|
|
||||||||
|
Foreign Exchange Contracts
|
40
|
|
856
|
|
230
|
|
97
|
|
||||||||
|
Total
|
$
|
42,610
|
|
$
|
33,626
|
|
$
|
38,085
|
|
$
|
36,832
|
|
||||
1
Asset derivatives are included in other assets and liability derivatives are included in other liabilities in the consolidated statements of condition.
The following table presents the Company's derivative financial instruments and the amount and location of the net gains or losses recognized in the statements of income for the years ended
December 31, 2012
,
2011
, and
2010
:
|
Location of Net Gains (Losses)Recognized in the
Statement of Income |
Year Ended December 31,
|
||||||||||||
|
Derivative Financial Instruments Not Designated
as Hedging Instruments (dollars in thousands) |
2012
|
|
2011
|
|
2010
|
|
|||||||
|
Interest Rate Lock Commitments
|
Mortgage Banking
|
$
|
37,490
|
|
$
|
14,091
|
|
$
|
15,007
|
|
|||
|
Forward Commitments
|
Mortgage Banking
|
(1,959
|
)
|
(4,735
|
)
|
1,227
|
|
||||||
|
Interest Rate Swap Agreements
|
Other Noninterest Income
|
33
|
|
309
|
|
282
|
|
||||||
|
Foreign Exchange Contracts
|
Other Noninterest Income
|
3,237
|
|
3,120
|
|
2,994
|
|
||||||
|
Total
|
$
|
38,801
|
|
$
|
12,785
|
|
$
|
19,510
|
|
||||
Management has received authorization from the Bank's Board of Directors to use derivative financial instruments as an end-user in connection with its risk management activities and to accommodate the needs of its customers. As with any financial instrument, derivative financial instruments have inherent risks. Market risk is defined as the risk of adverse financial impact due to fluctuations in interest rates, foreign exchange rates, and equity prices. Market risks associated with derivative financial instruments are balanced with the expected returns to enhance earnings performance and shareholder value, while limiting the volatility of each. The Company uses various processes to monitor its overall market risk exposure, including sensitivity analysis, value-at-risk calculations, and other methodologies.
Derivative financial instruments are also subject to credit and counterparty risk, which is defined as the risk of financial loss if a borrower or counterparty is either unable or unwilling to repay borrowings or settle a transaction in accordance with the underlying contractual terms. Credit and counterparty risks associated with derivative financial instruments are similar to those relating to traditional financial instruments. The Company manages derivative credit and counterparty risk by evaluating the creditworthiness of each borrower or counterparty, adhering to the same credit approval process used for commercial lending activities.
Derivative financial instruments are required to be carried at their fair value on the Company's consolidated statements of condition. As of
December 31, 2012
and
2011
, the Company did not designate any derivative financial instruments as formal
100
hedging relationships. The Bank's free-standing derivative financial instruments have been recorded at fair value on the Company's consolidated statements of condition. These financial instruments have been limited to interest rate lock commitments ("IRLCs"), forward commitments, interest rate swap agreements, and foreign exchange contracts.
The Company enters IRLCs for residential mortgage loans which commit us to lend funds to a potential borrower at a specific interest rate and within a specified period of time. IRLCs that relate to the origination of mortgage loans that will be held for sale are considered derivative instruments under applicable accounting guidance. Outstanding IRLCs expose the Company to the risk that the price of the mortgage loans underlying the commitments may decline due to increases in mortgage interest rates from inception of the rate lock to the funding of the loan. To mitigate this risk, the Company utilizes forward commitments as economic hedges against the potential decreases in the values of the loans held for sale. The IRLCs and forward commitments are free-standing derivatives which are carried at fair value with changes recorded in the mortgage banking component of noninterest income in the Company's consolidated statements of income. Changes in the fair value of IRLCs and forward commitments subsequent to inception are based on changes in the fair value of the underlying loan resulting from the fulfillment of the commitment and changes in the probability that the loan will fund within the terms of the commitment, which is affected primarily by changes in interest rates and the passage of time.
The Company enters into interest rate swap agreements to facilitate the risk management strategies of a small number of commercial banking customers. The Company mitigates this risk by entering into equal and offsetting interest rate swap agreements with highly rated third party financial institutions. The interest rate swap agreements are free-standing derivatives which are carried at fair value with changes included in other noninterest income in the Company's consolidated statements of income. The Company is party to master netting arrangements with its institutional counterparties; however, the Company does not offset assets and liabilities under these arrangements for financial statement presentation. Collateral, usually in the form of marketable securities, is posted by the counterparty with liability positions in accordance with contract thresholds. The Company had net liability positions with its financial institution counterparties totaling
$32.4 million
and
$35.8 million
as of
December 31, 2012
and
2011
, respectively. The collateral posted by the Company for these net liability positions was
$3.1 million
and
$3.6 million
as of
December 31, 2012
and
2011
, respectively.
The Company's interest rate swap agreements with institutional counterparties contain credit-risk-related contingent features tied to the Company's debt ratings or capitalization levels. Under these provisions, if the Company's debt rating falls below investment grade or if the Company's capitalization levels fall below stipulated thresholds, certain counterparties may require immediate and ongoing collateralization on interest rate swaps in net liability positions, or may require immediate settlement of the contracts. As of
December 31, 2012
, the Company's debt ratings and capital levels were in excess of these minimum requirements.
The Company utilizes foreign exchange contracts to offset risks related to transactions executed on behalf of customers. The foreign exchange contracts are free-standing derivatives which are carried at fair value with changes included in other noninterest income in the Company's consolidated statements of income.
The Company's credit commitments as of
December 31, 2012
were as follows:
|
(dollars in thousands)
|
Total
|
|
|
|
Unfunded Commitments to Extend Credit
|
$
|
1,999,542
|
|
|
Standby Letters of Credit
|
62,043
|
|
|
|
Commercial Letters of Credit
|
13,871
|
|
|
|
Total
|
$
|
2,075,456
|
|
Unfunded Commitments to Extend Credit
Commitments to extend credit are agreements to lend to a customer as long as there is no violation of the terms or conditions established in the contract. Commitments generally have fixed expiration dates or other termination clauses and may require payment of a fee. Since commitments may expire without being drawn, the total commitment amount does not necessarily represent future cash requirements.
101
Standby and Commercial Letters of Credit
Standby letters of credit are conditional commitments issued by the Company to guarantee the performance of a customer to a third party. Standby letters of credit generally become payable upon the failure of the customer to perform according to the terms of the underlying contract with the third party, while commercial letters of credit are issued specifically to facilitate commerce and typically result in the commitment being drawn on when the underlying transaction is consummated between the customer and a third party. The contractual amount of these letters of credit represents the maximum potential future payments guaranteed by the Company. The Company has recourse against the customer for any amount it is required to pay to a third party under a standby letter of credit, and holds cash and deposits as collateral on those standby letters of credit for which collateral is deemed necessary. Assets valued at
$28.2 million
secured certain specifically identified standby letters of credit as of
December 31, 2012
. As of
December 31, 2012
, the standby and commercial letters of credit had remaining terms ranging from
1
to
16
months.
Lease Commitments
A portion of the Company's headquarters' building is leased with a lease term through 2052. The Company leases certain other branch premises and equipment with lease terms extending through 2048. Most of the leases for premises provide for a base rent over a specified period with renewal options thereafter. Portions of certain properties are subleased for periods expiring in various years through 2022. Lease terms generally specify that the Company is to pay for taxes, maintenance, and other operating costs. Rental expense for all operating leases for the years ended
December 31, 2012
,
2011
, and
2010
were as follows:
|
(dollars in thousands)
|
2012
|
|
2011
|
|
2010
|
|
|||||
|
Minimum Rentals
|
$
|
20,429
|
|
$
|
20,427
|
|
$
|
20,187
|
|
||
|
Sublease Rental Income
|
(5,540
|
)
|
(5,463
|
)
|
(5,387
|
)
|
|||||
|
Total
|
$
|
14,889
|
|
$
|
14,964
|
|
$
|
14,800
|
|
||
Future minimum payments for capital leases and non-cancelable operating leases with initial or remaining terms of one year or more consisted of the following as of
December 31, 2012
:
|
(dollars in thousands)
|
Capital Leases
|
|
Operating Leases
|
|
||||
|
2013
|
$
|
665
|
|
$
|
13,904
|
|
||
|
2014
|
665
|
|
12,368
|
|
||||
|
2015
|
665
|
|
10,727
|
|
||||
|
2016
|
665
|
|
10,002
|
|
||||
|
2017
|
665
|
|
8,139
|
|
||||
|
Thereafter
|
23,259
|
|
131,388
|
|
||||
|
Total Future Minimum Lease Payments
|
26,584
|
|
$
|
186,528
|
|
|||
|
Amounts Representing Interest
|
(17,714
|
)
|
||||||
|
Present Value of Net Future Minimum Lease Payments
|
$
|
8,870
|
|
|||||
Minimum future rental income receivable under non-cancelable subleases were
$17.1 million
as of
December 31, 2012
.
102
Contingencies
The Company, along with other members of Visa are parties to Loss and Judgment Sharing Agreements (the "Agreements"), which provide that the Company along with other member banks of Visa, will share, based on its proportionate interest in Visa, in any losses from certain litigation specified in the Agreements. In March 2008, Visa funded an escrow account from its initial public offering to settle claims covered under the Agreements. In connection with the initial public offering, the Company received restricted Class B common stock in Visa. Should the escrow account established by Visa not be sufficient to cover litigation claims specified in the Agreements, Visa is entitled to fund additional amounts to the escrow account by reducing each member bank's Class B conversion ratio to unrestricted Class A shares. As of
December 31, 2012
, management believes that the Company's indemnification of Visa, related to the costs of these lawsuits, will be sufficiently funded from the escrow account or through future reductions in the conversion ratio.
In addition to the litigation noted above, the Company is subject to various other pending and threatened legal proceedings arising out of the normal course of business or operations. On at least a quarterly basis, the Company assesses its liabilities and contingencies in connection with outstanding legal proceedings utilizing the most recent information available. On a case-by-case basis, reserves are established for those legal claims for which it is probable that a loss will be incurred and the amount of such loss can be reasonably estimated. Based on information currently available, management believes that the eventual outcome of these other actions against the Company will not be materially in excess of such amounts accrued by the Company. However, in the event of unexpected future developments, it is possible that the ultimate resolution of those matters may be material to the Company's statement of income for any particular period.
Risks Related to Representation and Warranty Provisions
The Company sells residential mortgage loans in the secondary market primarily to Fannie Mae. The Company also pools Federal Housing Administration (“FHA”) insured and U.S. Department of Veterans Affairs (“VA”) guaranteed residential mortgage loans for sale to Ginnie Mae. These pools of FHA-insured and VA-guaranteed residential mortgage loans are securitized by Ginnie Mae. The agreements under which the Company sells residential mortgage loans to Fannie Mae or Ginnie Mae and the insurance or guaranty agreements with FHA and VA contain provisions that include various representations and warranties regarding the origination and characteristics of the residential mortgage loans. Although the specific representations and warranties vary among investors, insurance or guarantee agreements, they typically cover ownership of the loan, validity of the lien securing the loan, the absence of delinquent taxes or liens against the property securing the loan, compliance with loan criteria set forth in the applicable agreement, compliance with applicable federal, state, and local laws, and other matters. As of
December 31, 2012
, the unpaid principal balance of the Company's portfolio of residential mortgage loans sold was
$2.9 billion
. The agreements under which the Company sells residential mortgage loans require delivery of various documents to the investor or its document custodian. Although these loans are primarily sold on a non-recourse basis, the Company may be obligated to repurchase residential mortgage loans where required documents are not delivered or are defective. Investors may require the immediate repurchase of a mortgage loan when an early payment default underwriting review reveals significant underwriting deficiencies, even if the mortgage loan has subsequently been brought current. Upon receipt of a repurchase request, the Company works with investors or insurers to arrive at a mutually agreeable resolution. Repurchase demands are typically reviewed on an individual loan by loan basis to validate the claims made by the investor or insurer and to determine if a contractually required repurchase event has occurred. The Company manages the risk associated with potential repurchases or other forms of settlement through careful underwriting and quality assurance practices and by servicing mortgage loans to meet investor and secondary market standards. For the year ended
December 31, 2012
, the Company repurchased
seven
residential mortgage loans with an unpaid principal balance totaling
$2.2 million
as a result of the representation and warranty provisions contained in these contracts.
Four
of these loans were delinquent as to principal and interest at the time of repurchase. However, no losses were incurred related to these repurchases. As of
December 31, 2012
, there were no pending repurchase requests related to representation and warranty provisions.
Risks Relating to Residential Mortgage Loan Servicing Activities
In addition to servicing loans in the Company's portfolio, substantially all of the loans the Company sells to investors are sold with servicing rights retained. The loans that the Company services were originated either by the Company or by other mortgage loan originators. As servicer, the Company's primary duties are to: (1) collect payments due from borrowers; (2) advance certain delinquent payments of principal and interest; (3) maintain and administer any hazard, title, or primary mortgage insurance policies relating to the mortgage loans; (4) maintain any required escrow accounts for payment of taxes and insurance and administer escrow payments; and (5) foreclose on defaulted mortgage loans or, to the extent consistent with the documents governing a securitization, consider alternatives to foreclosure, such as loan modifications or short sales. Each agreement under
103
which the Company acts as servicer generally specifies a standard of responsibility for actions taken by the Company in such capacity and provides protection against expenses and liabilities incurred by the Company when acting in compliance with the respective servicing agreements. However, if the Company commits a material breach of obligations as servicer, the Company may be subject to termination if the breach is not cured within a specified period following notice. The standards governing servicing and the possible remedies for violations of such standards vary by investor. These standards and remedies are determined by servicing guides issued by the investors as well as the contract provisions established between the investors and the Company. Remedies could include repurchase of an affected loan. As of
December 31, 2012
, there were no pending repurchase requests related to loan servicing activities.
Although to date repurchase requests related to representation and warranty provisions, and servicing activities have been limited, it is possible that requests to repurchase mortgage loans may increase in frequency as investors more aggressively pursue all means of recovering losses on their purchased loans. However, as of
December 31, 2012
, management believes that this exposure is not material due to the historical level of repurchase requests and loss trends and thus have not established a liability for losses related to mortgage loan repurchases. As of
December 31, 2012
,
99%
of the Company's residential mortgage loans serviced for investors were current. The Company maintains ongoing communications with investors and continues to evaluate this exposure by monitoring the level and number of repurchase requests as well as the delinquency rates in the Company's investor portfolios.
The following is a description of the valuation methodologies and key inputs used to measure assets and liabilities recorded at fair value on a recurring basis.
Assets and Liabilities Measured at Fair Value on a Recurring Basis
Investment Securities Available-for-Sale
Fair values of investment securities available-for-sale were primarily measured using information from a third-party pricing service. This service provides pricing information by utilizing evaluated pricing models supported with market data information. Standard inputs include benchmark yields, reported trades, broker/dealer quotes, issuer spreads, two-sided markets, benchmark securities, bids, offers, and reference data from market research publications. Level 1 investment securities are comprised of debt securities issued by the U.S. Treasury as quoted prices were available, unadjusted, for identical securities in active markets. Level 2 investment securities were primarily comprised of debt securities issued by the Small Business Administration, states and municipalities, corporations, as well as mortgage-backed securities issued by government agencies. Fair values were estimated primarily by obtaining quoted prices for similar assets in active markets or through the use of pricing models. In cases where there may be limited or less transparent information provided by the Company's third-party pricing service, fair value may be estimated by the use of secondary pricing services or through the use of non-binding third-party broker quotes.
On a quarterly basis, management reviews the pricing information received from the Company's third-party pricing service. This review process includes a comparison to non-binding third-party broker quotes, as well as a review of market-related conditions impacting the information provided by the Company's third-party pricing service. Management primarily identifies investment securities which may have traded in illiquid or inactive markets by identifying instances of a significant decrease in the volume or frequency of trades, relative to historical levels, as well as instances of a significant widening of the bid-ask spread in the brokered markets. Investment securities that are deemed to have been trading in illiquid or inactive markets may require the use of significant unobservable inputs. As of
December 31, 2012
and
2011
, management did not make adjustments to prices provided by the third-party pricing service as a result of illiquid or inactive markets. On a quarterly basis, management also reviews a sample of securities priced by the Company's third-party pricing service to review significant assumptions and valuation methodologies used. Based on this review, management determines whether the current placement of the security in the fair value hierarchy is appropriate or whether transfers may be warranted. The Company's third-party pricing service has also established processes for us to submit inquiries regarding quoted prices. Periodically, we will challenge the quoted prices provided by our third-party pricing service. The Company's third-party pricing service will review the inputs to the evaluation in light of the new market data presented by us. The Company's third-party pricing service may then affirm the original quoted price or may update the evaluation on a going forward basis.
Loans Held for Sale
The fair value of the Company's residential mortgage loans held for sale was determined based on quoted prices for similar loans in active markets, and therefore, is classified as a Level 2 measurement.
104
Mortgage Servicing Rights
Mortgage servicing rights do not trade in an active market with readily observable market data. As a result, the Company estimates the fair value of mortgage servicing rights by using a discounted cash flow model to calculate the present value of estimated future net servicing income. The Company stratifies its mortgage servicing portfolio on the basis of loan type. The assumptions used in the discounted cash flow model are those that we believe market participants would use in estimating future net servicing income. Significant assumptions in the valuation of mortgage servicing rights include estimated loan repayment rates, the discount rate, servicing costs, and the timing of cash flows, among other factors. Mortgage servicing rights are classified as Level 3 measurements due to the use of significant unobservable inputs, as well as significant management judgment and estimation.
Other Assets
Other assets recorded at fair value on a recurring basis are primarily comprised of investments related to deferred compensation arrangements. Quoted prices for these investments, primarily in mutual funds, are available in active markets. Thus, the Company's investments related to deferred compensation arrangements are classified as Level 1 measurements in the fair value hierarchy.
Derivative Financial Instruments
Derivative financial instruments recorded at fair value on a recurring basis are comprised of interest rate lock commitments (“IRLCs”), forward commitments, interest rate swap agreements, and foreign exchange contracts. The fair values of IRLCs are calculated based on the value of the underlying loan, which in turn is based on quoted prices for similar loans in the secondary market. However, this value is adjusted by a factor which considers the likelihood that the loan in a lock position will ultimately close. This factor, the closing ratio, is derived from the Bank's internal data and is adjusted using significant management judgment. As such, IRLCs are classified as Level 3 measurements. Forward commitments are classified as Level 2 measurements as they are primarily based on quoted prices from the secondary market based on the settlement date of the contracts, interpolated or extrapolated, if necessary, to estimate a fair value as of the end of the reporting period. The fair values of interest rate swap agreements are calculated using a discounted cash flow approach and utilize Level 2 observable inputs such as the LIBOR swap curve, effective date, maturity date, notional amount, and stated interest rate. In addition, the Company includes in its fair value calculation a credit factor adjustment which is based primarily on management judgment. Thus, interest rate swap agreements are classified as a Level 3 measurement. The fair values of foreign exchange contracts are calculated using the Bank's multi-currency accounting system which utilizes contract specific information such as currency, maturity date, contractual amount, and strike price, along with market data information such as the spot rates of specific currency and yield curves. Foreign exchange contracts are classified as Level 2 measurements because while they are valued using the Bank's multi-currency accounting system, significant management judgment or estimation is not required.
The Company is exposed to credit risk if borrowers or counterparties fail to perform. The Company seeks to minimize credit risk through credit approvals, limits, monitoring procedures, and collateral requirements. The Company generally enters into transactions with borrowers and counterparties that carry high quality credit ratings. Credit risk associated with borrowers or counterparties as well as the Company's non-performance risk is factored into the determination of the fair value of derivative financial instruments.
105
The table below presents the balances of assets and liabilities measured at fair value on a recurring basis as of
December 31, 2012
and
2011
:
|
(dollars in thousands)
|
Quoted Prices
In Active Markets for Identical Assets or Liabilities (Level 1) |
Significant
Other Observable Inputs (Level 2) |
Significant
Unobservable Inputs (Level 3) |
Total
|
|
|||||||||||
|
December 31, 2012
|
||||||||||||||||
|
Assets:
|
||||||||||||||||
|
Investment Securities Available-for-Sale
|
||||||||||||||||
|
Debt Securities Issued by the U.S. Treasury
and Government Agencies
|
$
|
470,535
|
|
$
|
399,454
|
|
$
|
—
|
|
$
|
869,989
|
|
||||
|
Debt Securities Issued by States and Political Subdivisions
|
—
|
|
782,411
|
|
—
|
|
782,411
|
|
||||||||
|
Debt Securities Issued by Corporations
|
—
|
|
84,434
|
|
—
|
|
84,434
|
|
||||||||
|
Mortgage-Backed Securities Issued by
|
||||||||||||||||
|
Government Agencies
|
—
|
|
1,593,425
|
|
—
|
|
1,593,425
|
|
||||||||
|
U.S. Government-Sponsored Enterprises
|
—
|
|
37,298
|
|
—
|
|
37,298
|
|
||||||||
|
Total Mortgage-Backed Securities
|
—
|
|
1,630,723
|
|
—
|
|
1,630,723
|
|
||||||||
|
Total Investment Securities Available-for-Sale
|
470,535
|
|
2,897,022
|
|
—
|
|
3,367,557
|
|
||||||||
|
Loans Held for Sale
|
—
|
|
21,374
|
|
—
|
|
21,374
|
|
||||||||
|
Mortgage Servicing Rights
|
—
|
|
—
|
|
4,761
|
|
4,761
|
|
||||||||
|
Other Assets
|
12,566
|
|
—
|
|
—
|
|
12,566
|
|
||||||||
|
Derivatives
1
|
—
|
|
229
|
|
42,381
|
|
42,610
|
|
||||||||
|
Total Assets Measured at Fair Value on a
Recurring Basis as of December 31, 2012 |
$
|
483,101
|
|
$
|
2,918,625
|
|
$
|
47,142
|
|
$
|
3,448,868
|
|
||||
|
Liabilities:
|
||||||||||||||||
|
Derivatives
1
|
$
|
—
|
|
$
|
1,185
|
|
$
|
32,441
|
|
$
|
33,626
|
|
||||
|
Total Liabilities Measured at Fair Value on a
Recurring Basis as of December 31, 2012 |
$
|
—
|
|
$
|
1,185
|
|
$
|
32,441
|
|
$
|
33,626
|
|
||||
|
December 31, 2011
|
||||||||||||||||
|
Assets:
|
||||||||||||||||
|
Investment Securities Available-for-Sale
|
||||||||||||||||
|
Debt Securities Issued by the U.S. Treasury
and Government Agencies
|
$
|
822,508
|
|
$
|
408,510
|
|
$
|
—
|
|
$
|
1,231,018
|
|
||||
|
Debt Securities Issued by States and Political Subdivisions
|
—
|
|
407,059
|
|
—
|
|
407,059
|
|
||||||||
|
Debt Securities Issued by Corporations
|
—
|
|
96,387
|
|
—
|
|
96,387
|
|
||||||||
|
Mortgage-Backed Securities Issued by
|
||||||||||||||||
|
Government Agencies
|
—
|
|
1,655,872
|
|
—
|
|
1,655,872
|
|
||||||||
|
U.S. Government-Sponsored Enterprises
|
—
|
|
61,549
|
|
—
|
|
61,549
|
|
||||||||
|
Total Mortgage-Backed Securities
|
—
|
|
1,717,421
|
|
—
|
|
1,717,421
|
|
||||||||
|
Total Investment Securities Available-for-Sale
|
822,508
|
|
|
2,629,377
|
|
|
—
|
|
3,451,885
|
|
||||||
|
Loans Held for Sale
|
—
|
|
18,957
|
|
—
|
|
18,957
|
|
||||||||
|
Mortgage Servicing Rights
|
—
|
|
—
|
|
7,131
|
|
7,131
|
|
||||||||
|
Other Assets
|
11,082
|
|
—
|
|
—
|
|
11,082
|
|
||||||||
|
Derivatives
1
|
—
|
|
238
|
|
37,847
|
|
38,085
|
|
||||||||
|
Total Assets Measured at Fair Value on a
Recurring Basis as of December 31, 2011 |
$
|
833,590
|
|
$
|
2,648,572
|
|
$
|
44,978
|
|
$
|
3,527,140
|
|
||||
|
Liabilities:
|
||||||||||||||||
|
Derivatives
1
|
$
|
—
|
|
$
|
1,043
|
|
$
|
35,789
|
|
$
|
36,832
|
|
||||
|
Total Liabilities Measured at Fair Value on a
Recurring Basis as of December 31, 2011 |
$
|
—
|
|
$
|
1,043
|
|
$
|
35,789
|
|
$
|
36,832
|
|
||||
1
The fair value of each class of derivatives is shown in Note 17 to the Consolidated Financial Statements.
106
For the years ended
December 31, 2012
and
2011
, the changes in Level 3 assets and liabilities measured at fair value on a recurring basis were as follows:
|
(dollars in thousands)
|
Mortgage
Servicing Rights 1 |
Net Derivative
Assets and
Liabilities
2
|
Total
|
|
||||||||
|
Year Ended December 31, 2012
|
||||||||||||
|
Balance as of January 1, 2012
|
$
|
7,131
|
|
$
|
2,058
|
|
$
|
9,189
|
|
|||
|
Realized and Unrealized Net Gains (Losses):
|
||||||||||||
|
Included in Net Income
|
(2,370
|
)
|
37,518
|
|
35,148
|
|
||||||
|
Transfers to Loans Held for Sale
|
—
|
|
(29,636
|
)
|
(29,636
|
)
|
||||||
|
Balance as of December 31, 2012
|
$
|
4,761
|
|
$
|
9,940
|
|
$
|
14,701
|
|
|||
|
Total Unrealized Net Gains (Losses) Included in Net Income
Related to Assets Still Held as of December 31, 2012 |
$
|
(863
|
)
|
$
|
9,940
|
|
$
|
9,077
|
|
|||
|
Year Ended December 31, 2011
|
||||||||||||
|
Balance as of January 1, 2011
|
$
|
10,226
|
|
$
|
(332
|
)
|
$
|
9,894
|
|
|||
|
Realized and Unrealized Net Gains (Losses):
|
||||||||||||
|
Included in Net Income
|
(3,095
|
)
|
14,030
|
|
10,935
|
|
||||||
|
Transfers to Loans Held for Sale
|
—
|
|
(11,640
|
)
|
(11,640
|
)
|
||||||
|
Balance as of December 31, 2011
|
$
|
7,131
|
|
$
|
2,058
|
|
$
|
9,189
|
|
|||
|
Total Unrealized Net Gains (Losses) Included in Net Income
Related to Assets Still Held as of December 31, 2011 |
$
|
(1,521
|
)
|
$
|
2,058
|
|
$
|
537
|
|
|||
1
Realized and unrealized gains and losses related to mortgage servicing rights are reported as a component of mortgage banking income in the Company's consolidated statements of income.
2
Realized and unrealized gains and losses related to interest rate lock commitments are reported as a component of mortgage banking income in the Company's consolidated statements of income. Realized and unrealized gains and losses related to interest rate swap agreements are recorded as a component of other noninterest income in the Company's consolidated statements of income.
For Level 3 assets and liabilities measured at fair value on a recurring or nonrecurring basis as of
December 31, 2012
, the significant unobservable inputs used in the fair value measurements were as follows:
|
(dollars in thousands)
|
Fair Value at
December 31, 2012
|
Valuation Technique
|
Significant Unobservable Inputs
|
Significant Unobservable
Input Value
|
|
|||
|
Mortgage Servicing Rights
|
$
|
27,904
|
|
Discounted Cash Flow
|
Weighted-Average Constant Prepayment Rate
1
|
12.26
|
%
|
|
|
Weighted-Average Discount Rate
2
|
5.57
|
%
|
||||||
|
Net Derivative Assets and Liabilities:
|
||||||||
|
Interest Rate Lock Commitments
|
$
|
10,188
|
|
Pricing Model
|
Weighted-Average Closing Ratio
|
88.86
|
%
|
|
|
Interest Rate Swap Agreements
|
$
|
(248
|
)
|
Discounted Cash Flow
|
Weighted-Average Credit Factor
|
0.77
|
%
|
|
1
Represents annualized loan repayment rate assumption.
2
Derived from multiple interest rate scenarios that incorporate a spread to the London Interbank Offered Rate swap curve and market volatilities.
The significant unobservable inputs used in the fair value measurement of the Company's mortgage servicing rights are the weighted average constant prepayment rate and weighted average discount rate. Significant increases (decreases) in any of those inputs in isolation could result in a significantly lower (higher) fair value measurement. Although the constant prepayment rate and the discount rate are not directly interrelated, they will generally move in opposite directions of each other.
The Company estimates the fair value of mortgage servicing rights by using a discounted cash flow model to calculate the present value of estimated future net servicing income. The Company's Treasury Division enters observable and unobservable inputs into the model to arrive at an estimated fair value. To assess the reasonableness of the fair value measurement, the Treasury Division performs a back-test by applying the model to historical prepayment data. The fair value and constant prepayment rate are also compared to forward-looking estimates to assess reasonableness. The Treasury Division also compares the fair value of the Company's mortgage servicing rights to a value calculated by an independent third-party. Discussions are held with members from the Treasury, Mortgage Banking, and Controllers Divisions, along with the independent third-party to discuss and reconcile the fair value estimates and key assumptions used by the respective parties in arriving at those estimates. A subcommittee of the Company's Asset/Liability Management Committee is responsible for providing oversight over the valuation methodology and key assumptions.
107
The significant unobservable input used in the fair value measurement of the Company's IRLCs is the closing ratio, which represents the percentage of loans currently in a lock position which management estimates will ultimately close. Generally, the fair value of an IRLC is positive (negative) if the prevailing interest rate is lower (higher) than the IRLC rate. Therefore, an increase in the closing ratio (i.e., higher percentage of loans are estimated to close) will result in the fair value of the IRLC to increase if in a gain position, or decrease if in a loss position. The closing ratio is largely dependent on the loan processing stage that a loan is currently in and the change in prevailing interest rates from the time of the rate lock. The closing ratio is computed by our secondary marketing system using historical data and the ratio is periodically reviewed by the Company's Secondary Marketing Department of the Mortgage Banking Division for reasonableness.
The unobservable input used in the fair value measurement of the Company's interest rate swap agreements is the credit factor. This factor represents the risk that a counterparty is either unable or unwilling to settle a transaction in accordance with the underlying contractual terms. A significant increase (decrease) in the credit factor could result in a significantly lower (higher) fair value measurement. The credit factor is determined by the Treasury Division based on the risk rating assigned to each counterparty in which the Company holds a net asset position. The Company's Credit Policy Committee periodically reviews and approves the Expected Default Frequency of the Economic Capital Model for Credit Risk. The Expected Default Frequency is used as the credit factor for the interest rate swap agreements.
Assets and Liabilities Measured at Fair Value on a Nonrecurring Basis
The Company may be required periodically to measure certain assets and liabilities at fair value on a nonrecurring basis in accordance with GAAP. These adjustments to fair value usually result from the application of lower-of-cost-or-fair value accounting or impairment write-downs of individual assets. For the year ended December 31, 2012, the Company recorded a
$1.1 million
impairment charge to fully write-down the net book value of leasehold improvements and other fixed assets related to planned branch closures. For the year ended
December 31, 2011
, several of the Company's branch premises with a carrying value of
$1.0 million
were written down to their fair value of
$0.4 million
, resulting in an impairment charge of
$0.6 million
, which was included in net occupancy expense for the period. The Company primarily utilized the tax assessed value and other observable market inputs to determine fair market value of the properties, and therefore, is classified as a Level 2 measurement.
Fair Value Option
The Company elected the fair value option for all residential mortgage loans held for sale originated on or after October 1, 2011. This election allows for a more effective offset of the changes in fair values of the loans held for sale and the derivative financial instruments used to economically hedge them without having to apply complex hedge accounting provisions. As noted above, the fair value of the Company's residential mortgage loans held for sale was determined based on quoted prices for similar loans in active markets.
The following table reflects the difference between the aggregate fair value and the aggregate unpaid principal balance of the Company's residential mortgage loans held for sale as of
December 31, 2012
and
2011
.
|
(dollars in thousands)
|
Aggregate
Fair Value |
|
Aggregate
Unpaid Principal |
Aggregate Fair Value
Less Aggregate Unpaid Principal |
|||||||
|
December 31, 2012
|
|||||||||||
|
Loans Held for Sale
|
$
|
21,374
|
|
$
|
20,492
|
|
$
|
882
|
|
||
|
December 31, 2011
|
|||||||||||
|
Loans Held for Sale
|
$
|
18,957
|
|
$
|
18,088
|
|
$
|
869
|
|
||
Changes in the estimated fair value of residential mortgage loans held for sale are reported as a component of mortgage banking income in the Company's consolidated statements of income. For the years ended
December 31, 2012
and
2011
, the Company recorded a
$0.1 million
net loss and a
$0.1 million
net gain, respectively, as a result of the change in fair value of the Company's residential mortgage loans held for sale.
108
Financial Instruments Not Recorded at Fair Value on a Recurring Basis
The assumptions used below are expected to approximate those that market participants would use in valuing these financial instruments.
Investment Securities Held-to-Maturity
The fair value of the Company's investment securities held-to-maturity was primarily measured using information from a third-party pricing service. Level 1 investment securities are comprised of debt securities issued by the U.S. Treasury as quoted prices were available, unadjusted, for identical securities in active markets. If quoted prices were not available, fair values were estimated primarily by obtaining quoted prices for similar assets in active markets or through the use of pricing models. In cases where there may be limited or less transparent information provided by the Company's third-party pricing service, fair value may be estimated by the use of secondary pricing services or through the use of non-binding third-party broker quotes.
Loans
The fair value of the Company's loans was estimated by discounting the expected future cash flows using the current interest rates at which similar loans would be made to borrowers with similar credit ratings and for the same remaining maturities. Loans were first segregated by type such as commercial, real estate, and consumer, and were then further segmented into fixed and variable rate and loan quality categories. Expected future cash flows were projected based on contractual cash flows, adjusted for estimated prepayments.
Time Deposits
The fair value of the Company's time deposits was estimated using a discounted cash flow analyses. The discount rates used were based on rates currently offered for deposits with similar remaining maturities. The fair values of the Company's time deposit liabilities do not take into consideration the value of the Company's long-term relationships with depositors, which may have significant value.
Securities Sold Under Agreements to Repurchase
The fair value of the Company's securities sold under agreements to repurchase was calculated using discounted cash flow analyses, applying discount rates currently offered for new agreements with similar remaining maturities and considering the Company's non-performance risk.
Long-Term Debt
The fair value of the Company's long-term debt was calculated using a discounted cash flow approach and applying discount rates currently offered for new notes with similar remaining maturities and considering the Company's non-performance risk.
109
The following presents the carrying amount, fair value, and placement in the fair value hierarchy of the Company's financial instruments as of
December 31, 2012
and
2011
. This table excludes financial instruments for which the carrying amount approximates fair value. For short-term financial assets such as cash and cash equivalents, the carrying amount is a reasonable estimate of fair value due to the relatively short time between the origination of the instrument and its expected realization. For non-marketable equity securities such as Federal Home Loan Bank and Federal Reserve Bank stock, the carrying amount is a reasonable estimate of fair value as these securities can only be redeemed or sold at their par value and only to the respective issuing government supported institution or to another member institution. For financial liabilities such as noninterest-bearing demand, interest-bearing demand, and savings deposits, the carrying amount is a reasonable estimate of fair value due to these products having no stated maturity.
|
Fair Value Measurements
|
|||||||||||||||||||
|
(dollars in thousands)
|
Carrying Amount
|
|
Fair Value
|
|
Quoted Prices in Active Markets for
Identical Assets or
Liabilities(Level 1)
|
|
Significant
Other Observable Inputs (Level 2) |
|
Significant
Unobservable Inputs (Level 3) |
|
|||||||||
|
December 31, 2012
|
|||||||||||||||||||
|
Financial Instruments – Assets
|
|||||||||||||||||||
|
Investment Securities Held-to-Maturity
|
$
|
3,595,065
|
|
$
|
3,687,676
|
|
$
|
195,366
|
|
$
|
3,492,310
|
|
$
|
—
|
|
||||
|
Loans
1
|
5,451,935
|
|
5,846,906
|
|
—
|
|
—
|
|
5,846,906
|
|
|||||||||
|
Financial Instruments – Liabilities
|
|||||||||||||||||||
|
Time Deposits
|
1,599,508
|
|
1,609,506
|
|
—
|
|
1,609,506
|
|
—
|
|
|||||||||
|
Securities Sold Under Agreements to Repurchase
|
758,947
|
|
868,199
|
|
—
|
|
868,199
|
|
—
|
|
|||||||||
|
Long-Term Debt
2
|
119,185
|
|
121,906
|
|
—
|
|
121,906
|
|
—
|
|
|||||||||
|
December 31, 2011
|
|||||||||||||||||||
|
Financial Instruments – Assets
|
|||||||||||||||||||
|
Investment Securities Held-to-Maturity
|
$
|
3,657,796
|
|
$
|
3,754,206
|
|
$
|
186,178
|
|
$
|
3,568,028
|
|
$
|
—
|
|
||||
|
Loans
1
|
5,098,681
|
|
5,373,777
|
|
—
|
|
—
|
|
5,373,777
|
|
|||||||||
|
Financial Instruments – Liabilities
|
|||||||||||||||||||
|
Time Deposits
|
1,337,079
|
|
1,347,576
|
|
—
|
|
1,347,576
|
|
—
|
|
|||||||||
|
Securities Sold Under Agreements to Repurchase
|
1,925,998
|
|
2,031,057
|
|
—
|
|
2,031,057
|
|
—
|
|
|||||||||
|
Long-Term Debt
2
|
21,787
|
|
24,076
|
|
—
|
|
24,076
|
|
—
|
|
|||||||||
1
Comprised of loans, net of unearned income and the allowance for loan losses.
|
2
|
Excludes capital lease obligations.
|
110
Condensed financial statements of the Parent were as follows:
Condensed Statements of Comprehensive Income
|
Year Ended December 31,
|
|||||||||||
|
(dollars in thousands)
|
2012
|
|
2011
|
|
2010
|
|
|||||
|
Income
|
|||||||||||
|
Dividends and Interest from Bank of Hawaii
|
$
|
117,050
|
|
$
|
148,356
|
|
$
|
110,161
|
|
||
|
Other Income
|
570
|
|
496
|
|
903
|
|
|||||
|
Total Income
|
117,620
|
|
148,852
|
|
111,064
|
|
|||||
|
Noninterest Expense
|
|||||||||||
|
Intercompany Salaries and Services
|
858
|
|
867
|
|
1,171
|
|
|||||
|
Other Expenses
|
1,795
|
|
1,349
|
|
2,086
|
|
|||||
|
Total Noninterest Expense
|
2,653
|
|
2,216
|
|
3,257
|
|
|||||
|
Income Before Income Tax Benefit and Equity in Undistributed Income of Subsidiaries
|
114,967
|
|
146,636
|
|
107,807
|
|
|||||
|
Income Tax Benefit
|
1,848
|
|
1,855
|
|
1,817
|
|
|||||
|
Equity in Undistributed Income of Subsidiaries
|
49,261
|
|
11,552
|
|
74,318
|
|
|||||
|
Net Income
|
$
|
166,076
|
|
$
|
160,043
|
|
$
|
183,942
|
|
||
|
Comprehensive Income
|
$
|
160,021
|
|
$
|
168,341
|
|
$
|
203,982
|
|
||
Condensed Statements of Condition
|
(dollars in thousands)
|
December 31,
2012 |
December 31,
2011 |
||||||
|
Assets
|
||||||||
|
Cash with Bank of Hawaii
|
$
|
35,611
|
|
$
|
6,822
|
|
||
|
Funds Sold To Bank of Hawaii
|
—
|
|
61,250
|
|
||||
|
Goodwill
|
14,129
|
|
14,129
|
|
||||
|
Income Taxes Receivable and Deferred Tax Assets
|
1,381
|
|
1,896
|
|
||||
|
Other Assets
|
7,634
|
|
7,377
|
|
||||
|
Equity in Net Assets of Subsidiaries
|
979,002
|
|
928,032
|
|
||||
|
Total Assets
|
$
|
1,037,757
|
|
|
$
|
1,019,506
|
|
|
|
Liabilities
|
||||||||
|
Income Taxes Payable
|
$
|
6,320
|
|
$
|
6,236
|
|
||
|
Other Liabilities
|
9,772
|
|
10,603
|
|
||||
|
Total Liabilities
|
16,092
|
|
16,839
|
|
||||
|
Shareholders' Equity
|
1,021,665
|
|
1,002,667
|
|
||||
|
Total Liabilities and Shareholders' Equity
|
$
|
1,037,757
|
|
$
|
1,019,506
|
|
||
111
Condensed Statements of Cash Flows
|
Year Ended December 31,
|
|||||||||||
|
(dollars in thousands)
|
2012
|
|
2011
|
|
2010
|
|
|||||
|
Operating Activities
|
|||||||||||
|
Net Income
|
$
|
166,076
|
|
$
|
160,043
|
|
$
|
183,942
|
|
||
|
Adjustments to Reconcile Net Income to Net Cash Provided by Operating Activities:
|
|
|
|||||||||
|
Share-Based Compensation
|
576
|
|
(352
|
)
|
(2,501
|
)
|
|||||
|
Equity in Undistributed Income of Subsidiaries
|
(49,261
|
)
|
(11,552
|
)
|
(74,318
|
)
|
|||||
|
Net Change in Other Assets and Other Liabilities
|
(493
|
)
|
1,709
|
|
4,390
|
|
|||||
|
Net Cash Provided by Operating Activities
|
116,898
|
|
149,848
|
|
111,513
|
|
|||||
|
Financing Activities
|
|||||||||||
|
Tax Benefits from Share-Based Compensation
|
—
|
|
889
|
|
2,983
|
|
|||||
|
Proceeds from Issuance of Common Stock
|
13,730
|
|
12,660
|
|
16,417
|
|
|||||
|
Repurchase of Common Stock
|
(81,444
|
)
|
(111,544
|
)
|
(24,981
|
)
|
|||||
|
Cash Dividends Paid
|
(81,645
|
)
|
(84,891
|
)
|
(86,823
|
)
|
|||||
|
Net Cash Used in Financing Activities
|
(149,359
|
)
|
(182,886
|
)
|
(92,404
|
)
|
|||||
|
Net Change in Cash and Cash Equivalents
|
(32,461
|
)
|
(33,038
|
)
|
19,109
|
|
|||||
|
Cash and Cash Equivalents at Beginning of Period
|
68,072
|
|
101,110
|
|
82,001
|
|
|||||
|
Cash and Cash Equivalents at End of Period
|
$
|
35,611
|
|
$
|
68,072
|
|
$
|
101,110
|
|
||
112
None.
Disclosure Controls and Procedures
The Company's management, including the Chief Executive Officer and Chief Financial Officer, conducted an evaluation of the effectiveness of the Company's disclosure controls and procedures (as defined in Rules 13a-15(e) and 15d-15(e) under the Securities Exchange Act of 1934, as amended (the "Exchange Act")) as of
December 31, 2012
. The Company's disclosure controls and procedures are designed to ensure that information required to be disclosed by the Company in the reports that it files or submits under the Exchange Act is recorded, processed, summarized, and reported within the time periods specified in the U.S. Securities and Exchange Commission's rules and forms, and that such information is accumulated and communicated to the Company's management, including the Company's Chief Executive Officer and Chief Financial Officer, to allow timely decisions regarding required disclosure. Based on this evaluation, the Chief Executive Officer and Chief Financial Officer concluded that the Company's disclosure controls and procedures were effective as of
December 31, 2012
.
Management's Annual Report on Internal Control over Financial Reporting
Management of the Company is responsible for establishing and maintaining effective internal control over financial reporting. Internal control is designed to provide reasonable assurance to the Company's management and board of directors regarding the preparation of reliable published financial statements. Internal control over financial reporting includes self-monitoring mechanisms, and actions are taken to correct deficiencies as they are identified.
Because of inherent limitations in any system of internal control, no matter how well designed, misstatements due to error or fraud may occur and not be detected, including the possibility of the circumvention or overriding of controls. Accordingly, even effective internal control over financial reporting can provide only reasonable assurance with respect to financial statement preparation. Further, because of changes in conditions, internal control effectiveness may vary over time.
Management assessed the Company's internal control over financial reporting as of
December 31, 2012
. This assessment was based on criteria for effective internal control over financial reporting described in "Internal Control – Integrated Framework" issued by the Committee of Sponsoring Organizations of the Treadway Commission. Based on this assessment, the Chief Executive Officer and Chief Financial Officer assert that the Company maintained effective internal control over financial reporting as of
December 31, 2012
based on the specified criteria.
The effectiveness of the Company's internal control over financial reporting as of
December 31, 2012
has been audited by Ernst & Young LLP, the independent registered public accounting firm who also has audited the Company's consolidated financial statements included in this Annual Report on Form 10-K. Ernst & Young LLP's attestation report on the Company's internal control over financial reporting appears on the following page and is incorporated by reference herein.
Changes in Internal Control over Financial Reporting
There were no changes in the Company's internal control over financial reporting (as defined in Rules 13a-15(f) and 15d-15(f) under the Exchange Act) that occurred during the quarter ended
December 31, 2012
that have materially affected or are reasonably likely to materially affect the Company's internal control over financial reporting.
113
Report of Independent Registered Public Accounting Firm
On Internal Control Over Financial Reporting
The Board of Directors and Shareholders
Bank of Hawaii Corporation
We have audited Bank of Hawaii Corporation's internal control over financial reporting as of December 31, 2012, based on criteria established in Internal Control-Integrated Framework issued by the Committee of Sponsoring Organizations of the Treadway Commission (the COSO criteria). Bank of Hawaii Corporation's management is responsible for maintaining effective internal control over financial reporting, and for its assessment of the effectiveness of internal control over financial reporting included in the accompanying Management's Annual Report on Internal Control over Financial Reporting. Our responsibility is to express an opinion on the company's internal control over financial reporting based on our audit.
We conducted our audit in accordance with the standards of the Public Company Accounting Oversight Board (United States). Those standards require that we plan and perform the audit to obtain reasonable assurance about whether effective internal control over financial reporting was maintained in all material respects. Our audit included obtaining an understanding of internal control over financial reporting, assessing the risk that a material weakness exists, testing and evaluating the design and operating effectiveness of internal control based on the assessed risk, and performing such other procedures as we considered necessary in the circumstances. We believe that our audit provides a reasonable basis for our opinion.
A company's internal control over financial reporting is a process designed to provide reasonable assurance regarding the reliability of financial reporting and the preparation of financial statements for external purposes in accordance with generally accepted accounting principles. A company's internal control over financial reporting includes those policies and procedures that (1) pertain to the maintenance of records that, in reasonable detail, accurately and fairly reflect the transactions and dispositions of the assets of the company; (2) provide reasonable assurance that transactions are recorded as necessary to permit preparation of financial statements in accordance with generally accepted accounting principles, and that receipts and expenditures of the company are being made only in accordance with authorizations of management and directors of the company; and (3) provide reasonable assurance regarding prevention or timely detection of unauthorized acquisition, use, or disposition of the company's assets that could have a material effect on the financial statements.
Because of its inherent limitations, internal control over financial reporting may not prevent or detect misstatements. Also, projections of any evaluation of effectiveness to future periods are subject to the risk that controls may become inadequate because of changes in conditions, or that the degree of compliance with the policies or procedures may deteriorate.
In our opinion, Bank of Hawaii Corporation maintained, in all material respects, effective internal control over financial reporting as of December 31, 2012, based on
the COSO criteria
.
We also have audited, in accordance with the standards of the Public Company Accounting Oversight Board (United States), the consolidated statements of condition of Bank of Hawaii Corporation and subsidiaries as of December 31, 2012 and 2011 and the related consolidated statements of income, comprehensive income, shareholders' equity and cash flows for each of the three years in the period ended December 31, 2012 and our report dated February 26, 2013 expressed an unqualified opinion thereon.
/s/ Ernst & Young LLP
Honolulu, Hawaii
February 26, 2013
114
None.
Except as otherwise indicated, the following information required by the Instructions to Form 10-K is incorporated herein by reference from various sections of the Bank of Hawaii Corporation Proxy Statement for the annual meeting of shareholders to be filed with the SEC within 120 days after the end of the Company's fiscal year.
"Board of Directors"; "Section 16(a) Beneficial Ownership Reporting Compliance"; and "Audit and Risk Committee Report."
Information regarding the executive officers of the Parent is incorporated by reference from "Executive Officers of the Registrant" in Part I, Item 1 of this report.
The Parent's Board of Directors has determined that Robert Huret and Mark A. Burak, members of the Parent's Audit and Risk Committee, are audit committee financial experts within the meaning of Item 407(d)(5) of Regulation S-K. These audit committee financial experts are independent within the meaning of Section 10A(m)(3) of the Exchange Act and the rules of the New York Stock Exchange.
The Company has adopted a written code of ethics within the meaning of Item 406 of Regulation S-K that applies to the Parent's Chief Executive Officer, Chief Financial Officer, and Chief Accounting Officer. A copy of the Code of Ethics for Senior Financial Officers is available on the Company's website, www.boh.com. The Company intends to provide disclosure of any change to, or waiver from, the Company's Code of Ethics for Senior Financial Officers via its website.
"Executive Compensation - Compensation Discussion and Analysis"; "Summary Compensation Table"; "Grants of Plan-Based Awards in 2012"; "Outstanding Equity Awards at Fiscal Year-End"; Option Exercises and Stock Vested in 2012"; "Pension Benefits"; "Nonqualified Deferred Compensation"; "Change in Control, Termination, and Other Arrangements"; "Director Compensation"; "Director Compensation Table"; "Corporate Governance – Human Resources and Compensation Committee Interlocks and Insider Participation"; and "Compensation Committee Report."
"Equity Compensation Plan Information" and "Beneficial Ownership."
"Certain Relationships and Related Transactions" and "Corporate Governance – Director Independence."
"Ernst & Young LLP Fees" and "Audit and Risk Committee Pre-Approval Policies and Procedures."
115
|
(a)
|
Financial Statements and Schedules
|
The following Consolidated Financial Statements of Bank of Hawaii Corporation and Subsidiaries are included in Item 8 of this report:
Consolidated Statements of Income – Years ended
December 31, 2012
,
2011
, and
2010
Consolidated Statements of Comprehensive Income – Years ended
December 31, 2012
,
2011
, and
2010
Consolidated Statements of Condition –
December 31, 2012
and
2011
Consolidated Statements of Shareholders' Equity – Years ended
December 31, 2012
,
2011
, and
2010
Consolidated Statements of Cash Flows – Years ended
December 31, 2012
,
2011
, and
2010
Notes to Consolidated Financial Statements
All other schedules to the Consolidated Financial Statements stipulated by Article 9 of Regulation S-X and all other schedules to the financial statements of the registrant required by Article 5 of Regulation S-X are not required under the related instructions or are inapplicable and, therefore, have been omitted.
116
Exhibit Table
|
Exhibit
Number |
||
|
3.1
|
Certificate of Incorporation of Bank of Hawaii Corporation (f/k/a Pacific Century Financial Corporation and Bancorp Hawaii, Inc.), as amended (incorporated by reference from Exhibit 3.1 to Bank of Hawaii Corporation's Annual Report on Form 10-K for its fiscal year ended December 31, 2005, as filed on February 28, 2006 (the "2005 10-K")).
|
|
|
3.2
|
Certificate of Amendment of Certificate of Incorporation of Bank of Hawaii Corporation (incorporated by reference from Exhibit 3.1 to Bank of Hawaii Corporation's Current Report on Form 8-K filed on April 30, 2008 (the "April 30, 2008 8-K")).
|
|
|
3.3
|
Amended and Restated By-Laws of Bank of Hawaii Corporation (incorporated by reference from Exhibit 3.2 to the April 30, 2008 8-K).
|
|
|
4.1
|
Instruments defining the rights of holders of long-term debt of Bank of Hawaii Corporation and its consolidated subsidiaries are not filed as exhibits because the amount of debt authorized under any such instruments does not exceed 10% of the total assets of Bank of Hawaii Corporation and its consolidated subsidiaries. Bank of Hawaii Corporation agrees to furnish a copy of any such instrument to the Commission upon request.
|
|
|
10.1
|
Bank of Hawaii Corporation's Executive Incentive Plan, as amended (incorporated by reference from Exhibit 10.2 to the 2005 10-K).*
|
|
|
10.2
|
Bank of Hawaii Corporation's Executive Base Salary Deferral Plan (incorporated by reference from Exhibit 10.1 to the Bank of Hawaii Corporation's Current Report on Form 8-K filed on December 22, 2005).*
|
|
|
10.3
|
Bank of Hawaii Corporation's Directors' Deferred Compensation Plan, as amended (incorporated by reference from Exhibit 10.7 to the 2005 10-K).*
|
|
|
10.4
|
Bank of Hawaii Corporation's Director Stock Compensation Program, as amended (incorporated by reference from Exhibit 10.8 to the 2005 10-K).*
|
|
|
10.5
|
Bank of Hawaii Corporation's Amended and Restated Director Stock Compensation Plan (incorporated by reference from Appendix B to Bank of Hawaii Corporation's Definitive Proxy Statement on Schedule 14A for the 2005 Annual Meeting of Shareholders filed on March 17, 2005).*
|
|
|
10.6
|
Bank of Hawaii Corporation's Stock Option Plan of 1994, as amended (incorporated by reference from Exhibit 10.12 to the 2005 10-K).*
|
|
|
10.7
|
Bank of Hawaii Corporation's 2004 Stock and Incentive Compensation Plan (incorporated by reference from Appendix C to Bank of Hawaii Corporation's Definitive Proxy Statement on Schedule 14A for the 2004 Annual Meeting of Shareholders, as filed on March 18, 2004).*
|
|
|
10.8
|
Bank of Hawaii Corporation's 2004 Stock and Incentive Compensation Plan — Form of Stock Option Agreement (incorporated by reference from Exhibit 10.14 to the 2005 10-K).*
|
|
|
10.9
|
Bank of Hawaii Corporation's 2004 Stock and Incentive Compensation Plan — Form of Service-Based Restricted Share Agreement (incorporated by reference from Exhibit 10.15 to the 2005 10-K).*
|
|
|
10.10
|
Bank of Hawaii Corporation's 2004 Stock and Incentive Compensation Plan — Form of Performance-Based Restricted Share Agreement (incorporated by reference from Exhibit 10.16 to the 2005 10-K).*
|
|
|
10.11
|
Amendment 2007-1 to the Bank of Hawaii Corporation 2004 Stock and Incentive Compensation Plan (incorporated by reference from Exhibit 10.13 to the Bank of Hawaii Corporation's Annual Report on Form 10-K, as filed on February 25, 2008 (the "2007 10-K")).*
|
|
|
10.12
|
Amendment 2007-1 to the Bank of Hawaii Corporation Executive Incentive Plan (incorporated by reference from Exhibit 10.16 to the 2007 10-K).*
|
|
|
10.13
|
Board Resolution for Amendment to the Restricted Stock and Option Awards under the Bank of Hawaii Corporation's Amended and Restated Director Stock Compensation Plan (incorporated by reference from Exhibit 10.1 to Bank of Hawaii Corporation's Current Report on Form 8-K, as filed on July 28, 2008).*
|
|
|
10.14
|
Grant to Peter S. Ho (incorporated by reference from Exhibit 10.2 to Bank of Hawaii Corporation's Current Report on Form 8-K, as filed on December 22, 2008).*
|
|
|
10.15
|
Bank of Hawaii Corporation's Amended and Restated Change-In-Control Retention Plan, (incorporated by reference from Exhibit 10.1 to Bank of Hawaii Corporation's Current Report on Form 8-K, as filed on December 18, 2009).*
|
|
|
10.16
|
Bank of Hawaii Corporation's 2004 Stock and Incentive Compensation Plan –Restricted Stock Grant Agreement – Ho - (incorporated by reference from Exhibit 10.1 to Bank of Hawaii Corporation's Current Report on Form 8-K, as filed on April 28, 2010).*
|
|
|
10.17
|
Bank of Hawaii Corporation's 2004 Stock and Incentive Compensation Plan – Form of Restricted Stock Grant Agreement – Lucien, Rossi & Sellers (incorporated by reference from Exhibit 10.2 to Bank of Hawaii Corporation's Current Report on Form 8-K, as filed on April 28, 2010).*
|
|
117
|
10.18
|
Agreement with Kent T. Lucien (incorporated by reference from Exhibit 10.2 to Bank of Hawaii Corporation's Current Report on Form 8-K, as filed on July 6, 2010).*
|
|
|
10.19
|
Amendment 2010-1 to the Bank of Hawaii Corporation Executive Incentive Plan (incorporated by reference from Exhibit 10.1 to the Bank of Hawaii Corporation's Current Report on Form 8-K, as filed on July 26, 2010).*
|
|
|
10.20
|
Bank of Hawaii Corporation's 2004 Stock and Incentive Compensation Plan – Form of 2011 Restricted Stock Grant Agreement – Ho, Rossi & Sellers (incorporated by reference from Exhibit 10.1 to Bank of Hawaii Corporation's Current Report on Form 8-K, as filed on December 20, 2010).*
|
|
|
10.21
|
Bank of Hawaii Corporation's 2004 Stock and Incentive Compensation Plan – Form of 2011 Restricted Stock Grant Agreement – Lucien (incorporated by reference from Exhibit 10.2 to Bank of Hawaii Corporation's Current Report on Form 8-K, as filed on December 20, 2010).*
|
|
|
10.22
|
Bank of Hawaii Corporation's 2004 Stock and Incentive Compensation Plan – Share Appreciation Program (incorporated by reference from Bank of Hawaii Corporation's Current Report on Form 8-K, as filed on March 29, 2011).*
|
|
|
10.23
|
Bank of Hawaii Corporation's 2004 Stock and Incentive Compensation Plan –Share Appreciation Replacement Program (incorporated by reference from Bank of Hawaii Corporation's Current Report on Form 8-K, as filed on November 22, 2011).*
|
|
|
10.24
|
Amendment to Agreement with Kent T. Lucien (incorporated by reference from Exhibit 10.1 to Bank of Hawaii Corporation's Current Report on Form 8-K, as filed on January 23, 2012).*
|
|
|
10.25
|
Bank of Hawaii Corporation's 2004 Stock and Incentive Compensation Plan - Form of 2012 Restricted Stock Grant Agreement (incorporated by reference from Exhibit 10.2 to Bank of Hawaii Corporation's Current Report on Form 8-K, as filed on January 23, 2012).*
|
|
|
10.26
|
Bank of Hawaii Corporation's 2004 Stock and Incentive Compensation Plan - Form of 2012 Restricted Stock In Lieu Of Base Salary Grant Agreement (incorporated by reference from Exhibit 10.3 to Bank of Hawaii Corporation's Current Report on Form 8-K, as filed on January 23, 2012).*
|
|
|
10.27
|
Bank of Hawaii Corporation's 2004 Stock and Incentive Compensation Plan – Form of 2012 Nonqualified Stock Option Grant Agreement (incorporated by reference from Exhibit 10.4 to Bank of Hawaii Corporation's Current Report on Form 8-K, as filed on January 23, 2012).*
|
|
|
10.28
|
Agreement with Wayne Y. Hamano executed August 3, 2012.*
|
|
|
10.29
|
Bank of Hawaii Corporation's 2004 Stock and Incentive Compensation Plan - July 2012 Restricted Stock Grant Agreement - Hamano - executed August 3, 2012.*
|
|
|
10.30
|
Bank of Hawaii Corporation's 2004 Stock and Incentive Compensation Plan - Form of 2013 Restricted Stock Grant Agreement (incorporated by reference from Exhibit 10.1 to Bank of Hawaii Corporation's Current Report on Form 8-K, as filed on January 30, 2013).*
|
|
|
21.1
|
Subsidiaries of the Registrant.
|
|
|
23.1
|
Consent of Independent Registered Public Accounting Firm.
|
|
|
31.1
|
Certification on Chief Executive Officer Pursuant to Rule 13a-14(a) Under the Securities Exchange Act of 1934.
|
|
|
31.2
|
Certification of Chief Financial Officer Pursuant to Rule 13a-14(a) Under the Securities Exchange Act of 1934.
|
|
|
32
|
Certification of Chief Executive Officer and Chief Financial Officer Pursuant to 18 U.S.C. Section 1350, as adopted Pursuant to Section 906 of the Sarbanes-Oxley Act of 2002.
|
|
|
101
|
Interactive Data File.
|
|
___________________________________
*
Management contract or compensatory plan or arrangement.
118
Signatures
Pursuant to the requirements of Section 13 or 15(d) of the Securities Exchange Act of 1934, the registrant has duly caused this report to be signed on its behalf by the undersigned, thereunto duly authorized.
|
Date:
|
February 26, 2013
|
Bank of Hawaii Corporation
|
|
|
By: |
/s/ Peter S. Ho
|
||
|
Peter S. Ho
Chairman of the Board, Chief Executive Officer, and President |
|||
Pursuant to the requirements of the Securities Exchange Act of 1934, this report has been signed below by the following persons on behalf of the registrant and in the capacities and on the dates indicated.
Date:
February 26, 2013
|
/s/ Peter S. Ho
|
/s/ S. Haunani Apoliona
|
|
|
Peter S. Ho
Chairman of the Board, Chief Executive Officer, and President |
S. Haunani Apoliona, Director
|
|
|
/s/ Mary G. F. Bitterman
|
/s/ Mark A. Burak
|
|
|
Mary G. F. Bitterman, Director
|
Mark A. Burak, Director
|
|
|
/s/ Michael J. Chun |
/s/ Clinton R. Churchill
|
|
|
Michael J. Chun, Director
|
Clinton R. Churchill, Director
|
|
|
/s/ David A. Heenan
|
/s/ Robert Huret
|
|
|
David A. Heenan, Director
|
Robert Huret, Director
|
|
|
/s/ Kent T. Lucien
|
/s/ Martin A. Stein
|
|
|
Kent T. Lucien, Director and
Chief Financial Officer |
Martin A. Stein, Director
|
|
|
/s/ Donald M. Takaki
|
/s/ Barbara J. Tanabe
|
|
|
Donald M. Takaki, Director
|
Barbara J. Tanabe, Director
|
|
|
/s/ Robert W. Wo
|
/s/ Derek J. Norris
|
|
|
Robert W. Wo Director
|
Derek J. Norris
Principal Accounting Officer |
|
119
TABLE OF CONTENTS
Part IItem 1. BusinessItem 1A. Risk FactorsItem 1B. Unresolved Staff CommentsItem 2. PropertiesItem 3. Legal ProceedingsItem 4. Mine Safety DisclosuresPart IIItem 5. Market For Registrant's Common Equity, Related Stockholder Matters and Issuer Purchases Of Equity SecuritiesItem 6. Selected Financial DataItem 7. Management's Discussion and Analysis Of Financial Condition and Results Of OperationsItem 7A. Quantitative and Qualitative Disclosures About Market RiskItem 8. Financial Statements and Supplementary DataNote 1. Summary Of Significant Accounting PoliciesNote 2. Restrictions on Cash and Noninterest-bearing DepositsNote 3. Investment SecuritiesNote 4. Loans and Leases and The Allowance For Loan and Lease LossesNote 5. Mortgage Servicing RightsNote 6. Premises and EquipmentNote 7. Other AssetsNote 8. DepositsNote 9. BorrowingsNote 10. Long-term DebtNote 11. Shareholders' EquityNote 12. Earnings Per ShareNote 13. Business SegmentsNote 14. Employee BenefitsNote 15. Share-based CompensationNote 16. Income TaxesNote 17. Derivative Financial InstrumentsNote 18. Commitments, Contingencies, and GuaranteesNote 19. Fair Value Of Assets and LiabilitiesNote 20. Bank Of Hawaii Corporation Financial StatementsItem 9. Changes in and Disagreements with Accountants on Accounting and Financial DisclosureItem 9A. Controls and ProceduresItem 9B. Other InformationPart IIIItem 10. Directors, Executive Officers and Corporate GovernanceItem 11. Executive CompensationItem 12. Security Ownership Of Certain Beneficial Owners and Management and Related Stockholder MattersItem 13. Certain Relationships and Related Transactions, and Director IndependenceItem 14. Principal Accounting Fees and ServicesPart IVItem 15. Exhibits, Financial Statement Schedules