BOK FINANCIAL CORP ET AL
10-Ks and 10-Qs
|
|
|
|
|
|
|
|
|
|
|
|
|
|
|
|
|
|
|
|
|
|
|
|
|
|
|
|
|
|
|
|
|
|
|
|
|
|
|
|
|
|
|
|
|
|
|
|
|
|
|
|
|
|
|
|
UNITED STATES
SECURITIES AND EXCHANGE COMMISSION
Washington, D.C. 20549
FORM 10-K
(Mark One)
|
ý
|
|
ANNUAL REPORT PURSUANT TO SECTION 13 OR 15(d) OF THE SECURITIES EXCHANGE ACT OF 1934
|
For the quarterly period ended
December 31, 2016
OR
|
¨
|
|
TRANSITION REPORT PURSUANT TO SECTION 13 OR 15(d) OF THE SECURITIES EXCHANGE ACT OF 1934
|
For the transition period from _____________ to ______________
Commission File No. 0-19341
BOK FINANCIAL CORPORATION
(Exact name of registrant as specified in its charter)
|
Oklahoma
|
|
73-1373454
|
|
(State or other jurisdiction
of Incorporation or Organization)
|
|
(IRS Employer
Identification No.)
|
|
|
|
|
|
Bank of Oklahoma Tower
|
|
|
|
Boston Avenue at Second Street
|
|
|
|
Tulsa, Oklahoma
|
|
74172
|
|
(Address of Principal Executive Offices)
|
|
(Zip Code)
|
(918) 588-6000
(Registrant’s telephone number, including area code)
Securities registered pursuant to Section 12 (b) of the Act: None
Securities registered pursuant to Section 12 (g) of the Act:
Common stock, $0.00006 par value
Indicate by check mark if the registrant is a well-known seasoned issuer, as defined in Rule 405 of the Securities Act. Yes
ý
No
¨
Indicate by check mark if the registrant is not required to file reports pursuant to Section 13 or Section 15 (d) of the Act. Yes
¨
No
ý
Indicate by check mark whether the registrant (1) has filed all reports required to be filed by Section 13 or 15(d) of the Securities Exchange Act of 1934 during the preceding 12 months (or for such shorter period that the registrant was required to file such reports), and (2) has been subject to such filing requirements for the past 90 days. Yes
ý
No
¨
Indicate by check mark whether the registrant has submitted electronically and posted on its corporate Website, if any, every Interactive Data File required to be submitted and posted pursuant to Rule 405 of Regulation S-T (§232.405 of this chapter)during the preceding 12 months (or for such shorter period that the registrant was required to submit and post such files)Yes
ý
No
¨
Indicate by check mark if disclosure of delinquent filers pursuant to Item 405 of Regulation S-K is not contained herein, and will not be contained, to the best of registrant’s knowledge, in definitive proxy or information statements incorporated by reference in Part III of this Form 10-K or any amendment to this Form 10-K.
¨
Indicate by check mark whether the registrant is a large accelerated filer, an accelerated filer, a non-accelerated filer or a smaller reporting company. See definitions of “larger accelerated filer,” “accelerated filer” and “smaller reporting company” in Rule 12b-2 of the Exchange Act. (Check one):
Large accelerated filer
ý
Accelerated filer
¨
Non-accelerated filer
¨
Smaller reporting company
¨
Indicate by check mark whether the registrant is a shell company (as defined in Rule 12b-2 of the Act). Yes
¨
No
ý
The aggregate market value of the registrant's common stock ("Common Stock") held by non-affiliates is approximately $1.6 billion (based on the June 30, 2016 closing price of Common Stock of $62.70 per share). As of January 31,
2017
, there were
65,489,810
shares of Common Stock outstanding.
DOCUMENTS INCORPORATED BY REFERENCE
Part III incorporates certain information by reference from the Registrant’s Proxy Statement for the
2017
Annual Meeting of Shareholders.
BOK Financial Corporation
Form 10-K
Year Ended
December 31, 2016
Index
|
Item 1
|
||
|
Item 1A
|
||
|
Item 1B
|
||
|
Item 2
|
||
|
Item 3
|
||
|
Item 4
|
||
|
Item 5
|
||
|
Item 6
|
||
|
Item 7
|
||
|
Item 7A
|
||
|
Item 8
|
||
|
Item 9
|
||
|
Item 9A
|
||
|
Item 9B
|
||
|
Item 10
|
||
|
Item 11
|
||
|
Item 12
|
||
|
Item 13
|
||
|
Item 14
|
||
|
Item 15
|
||
|
Exhibit 21
|
Subsidiaries of the Registrant
|
|
|
Exhibit 23
|
Consent of Independent Registered Public Accounting Firm
|
|
|
Exhibit 31.1
|
Chief Executive Officer Section 302 Certification
|
|
|
Exhibit 31.2
|
Chief Financial Officer Section 302 Certification
|
|
|
Exhibit 32
|
Section 906 Certifications
|
|
General
Developments relating to individual aspects of the business of BOK Financial Corporation (“BOK Financial” or “the Company”) are described below. Additional discussion of the Company’s activities during the current year appears within Item 7 “Management’s Discussion and Analysis of Financial Condition and Results of Operations.”
Description of Business
BOK Financial is a financial holding company incorporated in the state of Oklahoma in 1990 whose activities are governed by the Bank Holding Company Act of 1956 (“BHCA”), as amended by the Financial Services Modernization Act or Gramm-Leach-Bliley Act and the Dodd-Frank Wall Street Reform and Consumer Protection Act (the "Dodd-Frank Act"). BOK Financial offers full service banking in Oklahoma, Texas, New Mexico, Northwest Arkansas, Colorado, Arizona, and Kansas/Missouri. At
December 31, 2016
, the Company reported total consolidated assets of
$33 billion
and ranked as the 55th largest bank holding company based on asset size.
BOKF, NA is a wholly owned subsidiary bank of BOK Financial. BOKF, NA operates TransFund, Cavanal Hill Investment Management, BOK Financial Asset Management, Inc. and seven banking divisions: Bank of Albuquerque, Bank of Arizona, Bank of Arkansas, Bank of Kansas City, Bank of Oklahoma, Bank of Texas and Colorado State Bank and Trust. On December 1, 2016, BOK Financial acquired Missouri Bank and Trust Company Kansas City dba Mobank as a wholly owned subsidiary bank of BOK Financial, more than doubling our market share in the Kansas City area. Mobank was merged into BOKF, NA on February 17, 2017. The Bank of Kansas City banking centers were converted to the Mobank brand. BOKF, NA and Mobank are collectively referred to as ("the subsidiary banks") in the discussion following. Other wholly owned subsidiaries of BOK Financial include BOK Financial Securities, Inc., a broker/dealer that primarily engages in retail and institutional securities sales and municipal bond underwriting and The Milestone Group, Inc., an investment adviser to high net worth clients. Other non-bank subsidiary operations do not have a significant effect on the Company’s financial statements.
Our overall strategic objective is to emphasize growth in long-term value by building on our leadership position in Oklahoma through expansion into other high-growth markets in contiguous states. We operate primarily in the metropolitan areas of Tulsa and Oklahoma City, Oklahoma; Dallas, Fort Worth and Houston, Texas; Albuquerque, New Mexico; Denver, Colorado; Phoenix, Arizona, and Kansas City, Kansas/Missouri. Our acquisition strategy targets fairly priced quality organizations with demonstrated solid growth that would supplement our principal lines of business. We provide additional growth opportunities by hiring talent to enhance competitiveness, adding locations and broadening product offerings. Our operating philosophy embraces local decision-making in each of our geographic markets while adhering to common Company standards.
Our primary focus is to provide a comprehensive range of nationally competitive financial products and services in a personalized and responsive manner. Products and services include loans and deposits, cash management services, fiduciary services, mortgage banking and brokerage and trading services to middle-market businesses, financial institutions and consumers. Commercial banking represents a significant part of our business. Our credit culture emphasizes building relationships by making high quality loans and providing a full range of financial products and services to our customers. Our energy financing expertise enables us to offer commodity derivatives for customers to use in their risk management. We also offer derivative products for customers to use in managing their interest rate and foreign exchange risk. Our diversified base of revenue sources is designed to generate returns in a range of economic situations. Historically, fees and commissions provide 43% to 49% of our total revenue. Approximately
48%
of our revenue came from fees and commissions in
2016
.
BOK Financial’s corporate headquarters is located at Bank of Oklahoma Tower, Boston Avenue at Second Street, Tulsa, Oklahoma 74172.
The Company’s Annual Reports on Form 10-K, Quarterly Reports on Form 10-Q, Current Reports on Form 8-K and amendments to those reports are available on the Company’s website at www.bokf.com as soon as reasonably practicable after the Company electronically files such material with or furnishes it to the Securities and Exchange Commission.
1
Operating Segments
BOK Financial operates three principal lines of business: Commercial Banking, Consumer Banking and Wealth Management. Commercial Banking includes lending, treasury and cash management services and customer risk management products for small businesses, middle market and larger commercial customers. Commercial Banking also includes the TransFund electronic funds network. Consumer Banking includes retail lending and deposit services, lending and deposit services to small business customers served through the retail branch network and all mortgage banking activities. Wealth Management provides fiduciary services, private bank services and investment advisory services in all markets. Wealth Management also underwrites state and municipal securities and engages in brokerage and trading activities. Discussion of these principal lines of business appears within the Lines of Business section of “Management's Discussion and Analysis of Financial Condition and Results of Operations”.
Competition
BOK Financial and its operating segments face competition from other banks, thrifts, credit unions and other non-bank financial institutions, such as investment banking firms, investment advisory firms, brokerage firms, investment companies, government agencies, mortgage brokers and insurance companies. The Company competes largely on the basis of customer services, interest rates on loans and deposits, lending limits and customer convenience. Some operating segments face competition from institutions that are not as closely regulated as banks, and therefore are not limited by the same capital requirements and other restrictions. All market share information presented below is based upon share of deposits in specified areas according to SNL DataSource as of
June 30, 2016
.
We are the largest financial institution in the state of Oklahoma with 14% of the state’s total deposits. Bank of Oklahoma has 30% and 12% of the market share in the Tulsa and Oklahoma City areas, respectively.
We compete with two banks that have operations nationwide and have greater access to funds at lower costs, higher lending limits, and greater access to technology resources. We also compete with regional and locally-owned banks in both the Tulsa and Oklahoma City areas, as well as in every other community in which we do business throughout the state.
Bank of Texas competes against numerous financial institutions, including some of the largest in the United States,
and has a market share of approximately 2% in the Dallas, Fort Worth area and less than 1% in the Houston area. Bank of Albuquerque has a 9% market share in the Albuquerque area and competes with four large national banks, some regional banks and several locally-owned smaller community banks. Colorado State Bank and Trust has a market share of approximately 2% in the Denver area.
Bank of Arkansas serves Benton and Washington counties in Arkansas with a market share of approximately 3%. Bank of Arizona operates as a community bank with locations in Phoenix, Mesa and Scottsdale with less than 1% market share. Bank of Kansas City and Mobank collectively have a 1% market share in the Kansas City, Kansas/Missouri market. The Company’s ability to expand into additional states remains subject to various federal and state laws.
Employees
As of
December 31, 2016
, BOK Financial and its subsidiaries employed
4,884
full-time equivalent employees. None of the Company’s employees are represented by collective bargaining agreements. Management considers its employee relations to be good.
Supervision and Regulation
BOK Financial and its subsidiaries are subject to extensive regulations under federal and state laws. These regulations are designed to promote safety and soundness, protect consumers and ensure the stability of the banking system as a whole. The purpose of these regulations is not necessarily to protect shareholders and creditors. As detailed below, these regulations require the Company and its subsidiaries to maintain certain capital balances and require the Company to provide financial support to its subsidiaries. These regulations may restrict the Company’s ability to diversify, to acquire other institutions and to pay dividends on its capital stock. These regulations also include requirements on certain programs and services offered to our customers, including restrictions on fees charged for certain services.
The following information summarizes certain existing laws and regulations that affect the Company’s operations. It does not summarize all provisions of these laws and regulations and does not include all laws and regulations that affect the Company presently or in the future.
2
General
As a financial holding company, BOK Financial is regulated under the BHCA and is subject to regular inspection, examination and supervision by the Board of Governors of the Federal Reserve System (the “Federal Reserve Board”). Under the BHCA, BOK Financial files quarterly reports and other information with the Federal Reserve Board.
BOKF, NA is organized as a national banking association under the National Banking Act, and is subject to regulation, supervision and examination by the Office of the Comptroller of the Currency (the “OCC”), the Federal Deposit Insurance Corporation (the “FDIC”), the Federal Reserve Board, the Consumer Financial Protection Bureau and other federal and state regulatory agencies. The OCC
has primary supervisory responsibility for national banks and must approve certain corporate or structural changes, including changes in capitalization, payment of dividends, change of place of business, and establishment of a branch or operating subsidiary. The OCC performs examinations concerning safety and soundness, the quality of management and directors, information technology and compliance with applicable regulations. The National Banking Act authorizes the OCC to examine every national bank as often as necessary.
A financial holding company, and the companies under its control, are permitted to engage in activities considered “financial in nature” as defined by the BHCA, Gramm-Leach-Bliley Act and Federal Reserve Board interpretations. Activities that are “financial in nature” include securities underwriting and dealing, insurance underwriting, merchant banking, operating a mortgage company, performing certain data processing operations, servicing loans and other extensions of credit, providing investment and financial advice, owning and operating savings and loan associations, and leasing personal property on a full pay-out, non-operating basis. A financial holding company is required to notify the Federal Reserve Board within thirty days of engaging in new activities determined to be “financial in nature.” BOK Financial is engaged in some of these activities and has notified the Federal Reserve Board.
In order for a financial holding company to commence any new activity permitted by the BHCA, each insured depository institution subsidiary of the financial holding company must be "well capitalized" and "well managed" and have received a rating of at least "satisfactory" in its most recent examination under the Community Reinvestment Act. A financial holding company and its depository institution subsidiaries are considered to be "well capitalized" if they meet the requirements discussed in the section captioned "Capital Adequacy and Prompt Corrective Action" which follows. A financial holding company and its depository institution subsidiaries are considered to be "well managed" if they receive a composite rating and management rating of at least "satisfactory" in their most recent examinations. If a financial holding company fails to meet these requirements, the Federal Reserve Board may impose limitations or conditions on the conduct of its activities and the company may not commence any new financial activities without prior approval.
The BHCA requires the Federal Reserve Board’s prior approval for the direct or indirect acquisition of more than five percent of any class of voting stock of any non-affiliated bank. Under the Federal Bank Merger Act, the prior approval of the OCC is required for a national bank to merge with another bank or purchase the assets or assume the deposits of another bank. In reviewing applications seeking approval of merger and acquisition transactions, the bank regulatory authorities consider, among other things, the competitive effect and public benefits of the transactions, the capital position of the combined organization, the applicant’s performance record under the Community Reinvestment Act and fair housing laws and the effectiveness of the subject organizations in combating money laundering activities.
A financial holding company and its subsidiaries are prohibited under the BHCA from engaging in certain tie-in arrangements in connection with the provision of any credit, property or services. Thus, a subsidiary of a financial holding company may not extend credit, lease or sell property, furnish any services or fix or vary the consideration for these activities on the condition that (1) the customer obtain or provide additional credit, property or services from or to the financial holding company or any subsidiary thereof, or (2) the customer may not obtain some other credit, property or services from a competitor, except to the extent reasonable conditions are imposed to insure the soundness of credit extended.
The subsidiary banks and other non-bank subsidiaries are also subject to other federal and state laws and regulations. For example, BOK Financial Securities, Inc. is regulated by the Securities and Exchange Commission (“SEC”), the Financial Industry Regulatory Authority (“FINRA”), the Federal Reserve Board, and state securities regulators. Such regulations generally include licensing of certain personnel, customer interactions, and trading operations.
3
Dodd-Frank Wall Street Reform and Consumer Protection Act
On July 21, 2010, the Dodd-Frank Act was signed into law, giving federal banking agencies authority to increase regulatory capital requirements, impose additional rules and regulations over consumer financial products and services and limit the amount of interchange fees that may be charged in an electronic debit transaction. In addition, the Dodd-Frank Act made permanent the $250,000 limit for federal deposit insurance. It also repealed prohibitions on payment of interest on demand deposits, which could impact how interest is paid on business transaction and other accounts. Further, the Dodd-Frank Act prohibits banking entities from engaging in proprietary trading and restricts banking entities' sponsorship of or investment in private equity funds and hedge funds. Final rules required to implement the Dodd-Frank Act have largely been issued. Many of these rules have extended phase-in periods and the full impact of this legislation on the banking industry, including the Company, has not been fully realized.
The Durbin Amendment to the Dodd-Frank Act required that interchange fees on electronic debit transactions paid by merchants must be “reasonable and proportional to the cost incurred by the issuer” and prohibited card network rules that have limited price competition among networks. Effective October 1, 2011, the Federal Reserve issued its final ruling to implement the Durbin Amendment. This ruling established a cap on interchange fees banks with more than $10 billion in total assets can charge merchants for certain debit card transactions. The Durbin Amendment also required all banks to comply with the prohibition on network exclusivity and routing requirements. Debit card issuers are required to make at least two unaffiliated networks available to merchants.
The Dodd-Frank Act established the Consumer Financial Protection Bureau ("CFPB") with powers to supervise and enforce consumer protection laws. The CFPB has broad rule-making authority for a wide range of consumer protection laws that apply to all banks and savings institutions, including the authority to prohibit "unfair, deceptive or abusive" acts and practices. Established July 21, 2011, the CFPB has examination and enforcement authority over all banks and savings institutions with more than $10 billion in assets for certain designated consumer laws and regulations. The CFPB issued mortgage servicing standards and mortgage lending rules, including “qualified mortgage” rules that are designed to protect consumers and ensure the reliability of mortgages. Mortgage lenders are required to make a reasonable and good faith determination based on verified and documented information that a consumer applying for a mortgage loan has a reasonable ability to repay the loan according to its terms. Qualified mortgages that meet this requirement and other specified criteria are given a safe harbor of compliance. Rules affecting mortgage lenders and servicers became effective on January 10, 2014.
Title VI of the Dodd-Frank Act, commonly known as the Volcker Rule, prohibits banking entities from engaging in proprietary trading as defined by the Dodd-Frank Act and restricts sponsorship of, or investment in, private equity funds and hedge funds, subject to limited exceptions and exclusions. In December 2013, Federal banking agencies approved regulations that implement the Volcker Rule. In July 2016, the Federal Reserve extended the conformance period to July 2017 for key elements of the Rule relating to certain relationships and investments in legacy funds. On December 12, 2016, the Federal Reserve issued guidance regarding how banking entities may apply for an additional extension of up to five years from July 2017 to conform investment in "illiquid fund." The Company’s private equity investment activities may be curtailed. The Company’s trading activity remains largely unaffected, as most of our trading activity is exempted or excluded from the Volcker Rule trading prohibitions.
Title VII of the Dodd-Frank Act subjects nearly all derivative transactions to the regulations of the Commodity Futures Trading Commission (“CFTC”) or SEC. This includes registration, recordkeeping, reporting, capital, margin and business conduct requirements on swap dealers and major swap participants. The CFTC and SEC both approved interim final rules on the definition "swap" and “swap dealer" which were effective October 2012. Under these rules, entities transacting in less than $8 billion in notional value of swaps over any 12 month period during the phase-in period will be exempt from the definition of "swap dealer." The phase-in period is set to expire on December 31, 2017, after which the $8 billion threshold will be reduced to $3 billion unless the CFTC takes further action affecting the threshold. The Company currently estimates that the nature and volume of swap activity will not require it to register as a swap dealer any time prior to December 2018. Although the ultimate impact of Title VII remains uncertain, we currently believe its full implementation is not likely to impose significantly higher compliance costs on the Company.
4
Capital Adequacy and Prompt Corrective Action
The Federal Reserve Board, the OCC and the FDIC have issued substantially similar risk-based and leverage capital guidelines applicable to United States banking organizations to ensure capital adequacy based upon the risk levels of assets and off-balance sheet financial instruments. In addition, these regulatory agencies may from time to time require that a banking organization maintain capital above the minimum levels, whether because of its financial condition or actual or anticipated growth. Capital adequacy guidelines and prompt corrective action regulations involve quantitative measures of assets, liabilities, and certain off-balance sheet items calculated under regulatory accounting practices. Capital amounts and classifications are also subject to qualitative judgments by regulators regarding components, risk weighting and other factors.
Federal Reserve Board risk-based guidelines define a four-tier capital framework. Common equity Tier 1 capital (CET1) includes common shareholders' equity, less goodwill, most intangible assets and other adjustments. Tier 1 capital consists of CET1 capital plus certain additional capital instruments and related surplus. Supplementary capital (Tier 2) consists of preferred stock not qualifying as Tier 1 capital, qualifying mandatory convertible debt securities, limited amounts of subordinated debt, other qualifying term debt and allowances for credit losses, subject to limitations. Assets and off-balance sheet exposures are assigned to categories of risk-weights, based primarily upon relative credit risk. Risk-based capital ratios are calculated by dividing CET1, Tier 1 and total capital by risk-weighted assets.
New capital rules were effective for banks and bank holding companies, including BOK Financial on January 1, 2015 as part of a package of regulatory reforms developed by the Basel Committee on Banking Supervision ("BCBS") to strengthen the regulation, supervision and risk management of the banking sector, commonly referred to as the Basel III framework. Components of these rules will phase in through January 1, 2019. The new capital rules established a 7% threshold for common equity Tier 1 ratio consisting of a minimum level plus a capital conservation buffer. The rules also changed both the Tier 1 risk based capital requirements and the total risk based requirements to a minimum of 6% and 8%, respectively, plus a capital conservation buffer of 2.5% totaling 8.5% and 10.5%, respectively. The Company elected to exclude unrealized gains and losses from available for sale securities from its calculation of Tier 1 capital, consistent with the treatment under previous capital rules.
As of
December 31, 2016
, BOK Financial's common equity Tier 1 ratio was
11.21%
. BOK Financial's Tier 1 and total capital ratios were
11.21%
and
12.81%
, respectively.
The leverage ratio is determined by dividing Tier 1 capital by adjusted average total assets. Banking organizations are required to maintain a ratio of at least 4%. A bank which falls below these levels, including the capital conservation buffer, would be subject to regulatory restrictions on capital distributions (including but not limited to dividends and share repurchases) and executive bonus payments. BOK Financial's leverage ratio at
December 31, 2016
was
8.72%
.
The Federal Deposit Insurance Corporation Improvement Act of 1991 (the “FDICIA”), among other things, identifies five capital categories for insured depository institutions from well capitalized to critically under-capitalized and requires the respective federal regulatory agencies to implement systems for prompt corrective action for institutions failing to meet minimum capital requirements within such categories. FDICIA imposes progressively more restrictive covenants on operations, management and capital distributions, depending upon the category in which an institution is classified. The various regulatory agencies have adopted substantially similar regulations that define the five capital categories identified by FDICIA, using the total risk-based capital, Tier 1 risk-based capital and leverage capital ratios as the relevant capital measures. Such regulations establish various degrees of corrective action to be taken when an institution is considered under-capitalized. Under these guidelines, the subsidiary banks were considered well capitalized as of
December 31, 2016
.
Liquidity Requirements
The Basel III framework also requires bank holding companies and banks to measure their liquidity against specific liquidity tests. One test, referred to as the liquidity coverage ratio, is designed to ensure that the banking entity maintains a prescribed minimum level of unencumbered high-quality liquid assets equal to expected net cash outflows as defined. The other test, referred to as the net stable funding ratio, is designed to promote greater reliance on medium and long term funding sources.
5
On September 3, 2014, U.S. federal banking agencies published the final rule covering Liquidity Risk Management Standards that would standardize minimum liquidity requirements for internationally active banking organizations as defined (generally those with total consolidated assets in excess of $250 billion) as well as modified liquidity requirements for other banking organizations with total consolidated assets in excess of $50 billion that are not internationally active. Although the final rule does not apply to banking organizations with total assets less than $50 billion, including the Company, if growth in the balance sheet of the Company were to approach the $50 billion threshold, the costs of such liquidity regulations would begin to be realized.
Stress Testing
As required by the Dodd-Frank Act, the Federal Reserve published regulations that require bank holding companies with $10 billion to $50 billion in assets to perform annual capital stress tests. The requirements for annual capital stress testing became effective for the Company in the fourth quarter of 2013. The Dodd-Frank Act Stress Test ("DFAST") is a forward-looking exercise under which the Company and its banking subsidiary estimate the impact of a hypothetical severely adverse macroeconomic scenario provided by the Federal Reserve and the Office of the Comptroller of the Currency on its financial condition and regulatory capital ratios over a nine-quarter time horizon. Under the scenario provided by the regulatory agencies for the Company's most recently completed stress test, all capital ratio measures remain above the minimum regulatory thresholds. Additional information concerning the annual stress test may be found on the Company's Investor Relations page at www.bokf.com under the "Presentations" tab. The results of future capital stress tests may place constraints on capital distributions or increases in required regulatory capital under certain circumstances.
Further discussion of regulatory capital, including regulatory capital amounts and ratios, is set forth under the heading “Liquidity and Capital” within “Management's Discussion and Analysis of Financial Condition and Results of Operations” and in Note
15
of the Company's Notes to Consolidated Financial Statements, both of which appear elsewhere herein.
Executive and Incentive Compensation
Guidelines adopted by federal banking agencies prohibit excessive compensation as an unsafe and unsound practice and describe compensation as excessive when the amounts paid are unreasonable or disproportionate to the services performed by an executive officer, employee, director or principal shareholder. The Federal Reserve Board has issued comprehensive guidance on incentive compensation intended to ensure that the incentive compensation policies do not undermine safety and soundness by encouraging excessive risk taking. This guidance covers all employees that have the ability to materially affect the risk profile of an organization, either individually or as part of a group, based on key principles that (i) incentives do not encourage risk-taking beyond the organization's ability to identify and manage risk, (ii) compensation arrangements are compatible with effective internal controls and risk management, and (iii) compensation arrangements are supported by strong corporate governance, including active and effective board oversight. Deficiencies in compensation practices may affect supervisory ratings and enforcement actions may be taken if incentive compensation arrangements pose a risk to safety and soundness.
Deposit Insurance
Substantially all of the deposits held by the subsidiary banks are insured up to applicable limits by the Deposit Insurance Fund (“DIF”) of the FDIC and are subject to deposit insurance assessments to maintain the DIF. In 2011, the FDIC released a final rule to implement provisions of the Dodd-Frank Act that affect deposit insurance assessments. Among other things, the Dodd-Frank Act raised the minimum designated reserve ratio from 1.15% to 1.35% of estimated insured deposits, removed the upper limit of the designated reserve ratio, required that the designated reserve ratio reach 1.35% by September 30, 2020, and required that the FDIC offset the effect of increasing the minimum designated reserve ratio on depository institutions with total assets of less than $10 billion. The Dodd-Frank Act provided the FDIC flexibility in implementation of the increase in the designated reserve ratio, but it will ultimately result in increased deposit insurance costs to the Company. The Dodd-Frank Act also required that the FDIC redefine the assessment base to average consolidated assets minus average tangible equity.
On June 30, 2016, the DIF rose above the 1.15%, resulting in a reduction of the initial assessment rate for all banks and implementing a 4.5% surcharge on insured depository institutions with total consolidated assets of $10 billion or more. The assessment base for the surcharge will be the regular assessment base reduced by $10 billion. If the DIF reserve ratio does not reach 1.35% by December 31, 2018, the FDIC will impose a shortfall assessment on banks with total consolidated assets of $10 billion or more in the first quarter of 2019.
6
Dividends
A key source of liquidity for BOK Financial is dividends from BOKF, NA, which is limited by various banking regulations to net profits, as defined, for the year plus retained profits for the preceding two years. Dividends are further restricted by minimum capital requirements and the Company's internal capital policy. BOKF, NA's dividend limitations are discussed under the heading “Liquidity and Capital” within “Management's Discussion and Analysis of Financial Condition and Results of Operations”.
Source of Strength Doctrine
According to Federal Reserve Board policy, a bank holding company is expected to act as a source of financial strength to each subsidiary bank and to commit resources to support each such subsidiary. This support may be required at times when a bank holding company may not be able to provide such support.
Transactions with Affiliates
The Federal Reserve Board regulates transactions between the Company and its subsidiaries. Generally, the Federal Reserve Act and Regulation W, as amended by the Dodd-Frank Act, limit the Company’s banking subsidiary and its subsidiaries, to lending and other “covered transactions” with affiliates. The aggregate amount of covered transactions a banking subsidiary or its subsidiaries may enter into with an affiliate may not exceed 10% of the capital stock and surplus of the banking subsidiary. The aggregate amount of covered transactions with all affiliates may not exceed 20% of the capital stock and surplus of the banking subsidiary.
Covered transactions with affiliates are also subject to collateral requirements and must be conducted on arm’s length terms. Covered transactions include (a) a loan or extension of credit by the banking subsidiary, including derivative contracts, (b) a purchase of securities issued to a banking subsidiary, (c) a purchase of assets by the banking subsidiary unless otherwise exempted by the Federal Reserve, (d) acceptance of securities issued by an affiliate to the banking subsidiary as collateral for a loan, and (e) the issuance of a guarantee, acceptance or letter of credit by the banking subsidiary on behalf of an affiliate.
Bank Secrecy Act and USA PATRIOT Act
The Bank Secrecy Act (“BSA”) and The USA PATRIOT Act of 2001 (“PATRIOT Act”) imposes many requirements on financial institutions in the interest of national security and law enforcement. BSA requires banks to maintain records and file suspicious activity reports that are of use to law enforcement and regulators in combating money laundering and other financial crimes. The PATRIOT Act is intended to deny terrorists and criminals the ability to access the U.S. financial services system and places significantly greater requirements on financial institutions. Financial institutions, such as the Company and its subsidiaries, must have a designated BSA Officer, internal controls, independent testing and training programs commensurate with their size and risk profile. As part of its internal control program, a financial institution is expected to have effective customer due diligence and enhanced due diligence requirements for high-risk customers, as well as processes to prohibit transactions with entities subject to Office of Foreign Asset Control sanctions. Documentation and recordkeeping requirements, as well as system requirements, aimed at identifying and reporting suspicious activity reporting, must increase with the institution's size and complexity. Failure to implement or maintain adequate programs and controls to combat terrorist financing and money laundering may have serious legal, financial, and reputational consequences.
7
Governmental Policies and Economic Factors
The operations of BOK Financial and its subsidiaries are affected by legislative changes and by the policies of various regulatory authorities and, in particular, the policies of the Federal Reserve Board. The Federal Reserve Board has statutory objectives to maximize employment and maintain price stability. Among the instruments of monetary policy used by the Federal Reserve Board to implement these objectives are: open-market operations in U.S. Government securities, changes in the discount rate and federal funds rate on bank borrowings, and changes in reserve requirements on bank deposits. The effect of future changes in such policies on the business and earnings of BOK Financial and its subsidiaries is uncertain.
In response to the significant recession in business activity which began in 2007, the Federal Reserve took aggressive actions to reduce interest rates and provide liquidity. While many of the crisis-related programs have expired or been closed, government legislation and policies continue to be accommodative, including increases in government spending, reduction of certain taxes and promotion of home affordability programs.
The Federal Reserve completed its bond purchase program designed to reduce longer–term rates in October of 2014. Although it continues to maintain an accommodative policy of reinvesting principal payments from its holdings of agency debt and agency mortgage–backed securities and rolling over maturing Treasury securities, it could either curtail reinvestment in or begin selling those securities at any time.
As a result of signs of an improving economy, the Federal Reserve increased its target rate by 25 basis points in December of 2016, the second such increase since the end of 2008. In addition, it has signaled its expectations for a gradual tightening cycle as the economy improves. The short–term effectiveness and long–term impact of these programs on the economy in general and on BOK Financial in particular are uncertain.
Foreign Operations
BOK Financial does not engage in operations in foreign countries, nor does it lend to foreign governments.
8
BOK Financial Corporation and its subsidiaries could be adversely affected by risks and uncertainties that could have a material impact on its financial condition and results of operations, as well as on its common stock and other financial instruments. Risk factors which are significant to the Company include, but are not limited to:
General and Regulatory Risk Factors
Adverse factors could impact BOK Financial's ability to implement its operating strategy.
Although BOK Financial has developed an operating strategy which it expects to result in continuing improved financial performance, BOK Financial cannot ensure that it will be successful in fulfilling this strategy or that this operating strategy will be successful. Achieving success is dependent upon a number of factors, many of which are beyond BOK Financial's direct control. Factors that may adversely affect BOK Financial's ability to implement its operating strategy include:
|
•
|
deterioration of BOK Financial's asset quality;
|
|
•
|
deterioration in general economic conditions, especially in BOK Financial's core markets;
|
|
•
|
inability to control BOK Financial's non-interest expenses;
|
|
•
|
inability to increase non-interest income;
|
|
•
|
inability to access capital;
|
|
•
|
decreases in net interest margins;
|
|
•
|
increases in competition;
|
|
•
|
adverse regulatory developments.
|
Substantial competition could adversely affect BOK Financial.
Banking is a competitive business. BOK Financial competes actively for loan, deposit and other financial services business in the southwest region of the United States. BOK Financial's competitors include a large number of small and large local and national banks, savings and loan associations, credit unions, trust companies, broker-dealers and underwriters, as well as many financial and non-financial firms that offer services similar to those of BOK Financial. Large national financial institutions have substantial capital, technology and marketing resources. Such large financial institutions may have greater access to capital at a lower cost than BOK Financial does, which may adversely affect BOK Financial's ability to compete effectively.
BOK Financial has expanded into markets outside of Oklahoma, where it competes with a large number of financial institutions that have an established customer base and greater market share than BOK Financial. BOK Financial may not be able to continue to compete successfully in these markets outside of Oklahoma. With respect to some of its services, BOK Financial competes with non-bank companies that are not subject to regulation. The absence of regulatory requirements may give non-banks a competitive advantage.
Government regulations could adversely affect BOK Financial.
BOK Financial and BOKF, NA are subject to banking laws and regulations that limit the type of acquisitions and investments that we may make. In addition, certain permitted acquisitions and investments are subject to prior review and approval by banking regulators, including the Federal Reserve, OCC and FDIC. Banking regulators have broad discretion on whether to approve proposed acquisitions and investments. In deciding whether to approve a proposed acquisition, federal banking regulators will consider, among other things, the effect of the acquisition on competition; the convenience and needs of the communities to be served, including our record of compliance under the Community Reinvestment Act; and our effectiveness in combating money laundering. They will also consider our financial condition and our future prospects, including projected capital ratios and levels; the competence, experience, and integrity of our management; and our record of compliance with laws and regulations.
The last several years have seen an increase in regulatory costs borne by the banking industry. Laws, regulations or policies currently affecting BOK Financial and its subsidiaries may change. The implementation of the Dodd-Frank Act has and will continue to affect BOK Financial’s businesses, including interchange revenue, mortgage banking, derivative and trading activities on behalf of customers, consumer products and funds management.
9
Regulatory authorities may change their interpretation of these statutes and regulations, including the OCC, our primary regulator, and the CFPB, our regulator for certain designated consumer laws and regulations. Violations of laws and regulations could limit the growth potential of BOK Financial's businesses. We have made extensive investments in human and technological resources to address enhanced regulatory expectations, including investments in the areas of risk management, compliance, and capital planning. Recent political developments, including the change in administration in the United States, have added additional uncertainty to the implementation, scope and timing of changes in the regulatory environment for the banking industry and for the broader economy.
Tax reform is a known priority of the new President along with the Ways and Means Committee, which introduced the Republican Blueprint for Tax Reform and is currently drafting proposed legislation. Both the Blueprint and the President's tax reform proposal have similar provisions. This alignment along with the Republican majority in Congress has significantly increased the likelihood of tax reform. Key proposals that may impact banks include lowering the corporate tax rate, full expensing of intangible assets, interest expense deductibility limited to interest income, and elimination of net operating loss carrybacks, most tax credits and special deductions. The impact to BOKF will depend on the final legislation, including the phase in provisions, which at this point is uncertain.
Political environment could negatively impact BOK Financial’s business.
As a result of the financial crisis and related government intervention to stabilize the banking system, there have been a series of laws and related regulations proposed or enacted in an attempt to ensure the crisis is not repeated. Many of the proposed new regulations are far-reaching. The intervention by the government also impacted populist sentiment with a negative view of financial institutions. High profile mistakes by the very largest banks in the country have continued to fuel negative sentiment towards the banking industry. This sentiment may increase litigation risk to the Company or have an adverse impact on BOK Financial’s future operations.
Credit Risk Factors
Adverse regional economic developments could negatively affect BOK Financial's business.
At
December 31, 2016
, loans to businesses and individuals with collateral primarily located in Texas represented approximately
32%
of the total loan portfolio and loans to businesses and individuals with collateral primarily located in Oklahoma represented approximately
21%
of our total loan portfolio. These geographic concentrations subject the loan portfolio to the general economic conditions within these areas. Poor economic conditions in Oklahoma, Texas or other markets in the southwest region may cause BOK Financial to incur losses associated with higher default rates and decreased collateral values in BOK Financial's loan portfolio. A regional economic downturn could also adversely affect revenue from brokerage and trading activities, mortgage loan originations and other sources of fee-based revenue.
Extended oil and gas commodity price downturns could negatively affect BOK Financial customers.
At
December 31, 2016
,
15%
of BOK Financial's total loan portfolio is comprised of loans to borrowers in the energy industry. The energy industry is historically cyclical and prolonged periods of low oil and gas commodity prices could negatively impact borrowers' ability to pay. In addition, the Company does business in several major oil and natural gas producing states including Oklahoma, Texas and Colorado. The economies of these states could be negatively impacted by prolonged periods of low oil and gas commodity prices resulting in increased credit migration to classified and nonaccruing categories, higher loan loss provisions and risk of credit losses from both energy borrowers and businesses and individuals in those regional economies.
Other adverse economic factors affecting particular industries could have a negative effect on BOK Financial customers and their ability to make payments to BOK Financial.
Certain industry-specific economic factors also affect BOK Financial. For example, BOK Financial's loan portfolio includes commercial real estate loans. A downturn in the real estate industry in general or in certain segments of the commercial real estate industry in the southwest region could also have an adverse effect on BOK Financial's operations. Regulatory changes in healthcare may negatively affect our customers, which to date primarily has been focused in senior housing. A U.S. House proposal that provides states more flexibility in using Medicare/Medicaid funds may reduce healthcare reimbursement rates.
10
Adverse global economic factors could have a negative effect on BOK Financial customers and counterparties.
Economic conditions globally, including those of the European Union and China, could impact BOK Financial’s customers and counterparties with which we do business. We have no direct exposure to European sovereign debt and our aggregate gross exposure to European financial institutions totaled $6.9 million at
December 31, 2016
. Our exposure to Chinese financial institutions is limited. In addition, we have an aggregate gross exposure to internationally active domestic financial institutions of approximately $206 million at
December 31, 2016
composed of $195 million of cash and securities positions and $11 million of gross derivative positions. The financial condition of these institutions is monitored on an on-going basis. We have not identified any significant customer exposures to European sovereign debt, European financial institutions or Chinese financial institutions.
Liquidity and Interest Rate Risk Factors
Fluctuations in interest rates could adversely affect BOK Financial's business.
BOK Financial's business is highly sensitive to:
|
•
|
the monetary policies implemented by the Federal Reserve Board, including the discount rate on bank borrowings and changes in reserve requirements, which affect BOK Financial's ability to make loans and the interest rates we may charge;
|
|
•
|
changes in prevailing interest rates, due to the dependency of the subsidiary banks on interest income;
|
|
•
|
open market operations in U.S. Government securities.
|
A significant increase in market interest rates, or the perception that an increase may occur, could adversely affect both BOK Financial's ability to originate new loans and BOK Financial's ability to grow. Conversely, a decrease in interest rates could result in acceleration in the payment of loans, including loans underlying BOK Financial's holdings of residential mortgage-backed securities and termination of BOK Financial's mortgage servicing rights. In addition, changes in market interest rates, changes in the relationships between short-term and long-term market interest rates or changes in the relationships between different interest rate indices, could affect the interest rates charged on interest-earning assets differently than the interest rates paid on interest-bearing liabilities. This difference could result in an increase in interest expense relative to interest income, which would reduce the Company’s net interest revenue. In a rising interest rate environment, the composition of the deposit portfolio could shift resulting in a mix that is more sensitive to changes in interest rates than is the current mix. An increase in market interest rates also could adversely affect the ability of BOK Financial's floating-rate borrowers to meet their higher payment obligations. If this occurred, it could cause an increase in nonperforming assets and net charge-offs, which could adversely affect BOK Financial's business.
Changes in mortgage interest rates could adversely affect mortgage banking operations as well as BOK Financial's substantial holdings of residential mortgage-backed securities and mortgage servicing rights, and brokerage and trading revenue.
Our available for sale residential mortgage-backed security portfolio represents investment interests in pools of residential mortgages, composing
$5.6 billion
or
17%
of total assets of the Company at
December 31, 2016
. The fair value of residential mortgage-backed securities is highly sensitive to changes in interest rates. BOK Financial mitigates this risk somewhat by investing principally in shorter duration mortgage products, which are less sensitive to changes in interest rates. A significant decrease in interest rates may lead mortgage holders to refinance the mortgages constituting the pool backing the securities, subjecting BOK Financial to a risk of prepayment and decreased return on investment due to subsequent reinvestment at lower interest rates. A significant decrease in interest rates may also accelerate premium amortization. Conversely, a significant increase in interest rates may cause mortgage holders to extend the term over which they repay their loans, which delays the Company’s opportunity to reinvest funds at higher rates.
Residential mortgage-backed securities are also subject to credit risk from delinquency or default of the underlying loans. BOK Financial mitigates this risk somewhat by investing in securities issued by U.S. government agencies. Principal and interest payments on the loans underlying these securities are guaranteed by these agencies.
11
BOK Financial derives a substantial amount of revenue from mortgage loan activities, including
$70 million
from the production and sale of mortgage loans,
$64 million
from the servicing of mortgage loans, $46 million from the trading of U.S. agency residential mortgage backed securities and related financial instruments and
$39 million
from sales of financial instruments to other mortgage lenders in
2016
. These activities, as well our substantial holdings of residential mortgage backed securities and mortgage servicing rights may be adversely affected by changes in government policies and programs.
In addition, as part of BOK Financial's mortgage banking business, BOK Financial has substantial holdings of mortgage servicing rights, totaling
$247 million
or
0.75%
of total assets at
December 31, 2016
. The fair value of these rights is also very sensitive to changes in interest rates. Falling interest rates tend to increase loan prepayments, which may lead to a decrease in the value of related servicing rights. BOK Financial attempts to manage this risk by maintaining an active hedging program for its mortgage servicing rights. The Company's hedging program focuses on partially hedging the risk of changes in fair value, primarily related to changes mortgage interest rates. Other factors, such as short-term interest rates, which also impact the value of mortgage servicing rights, may not be hedged. The value of mortgage servicing rights may also decrease due to rising delinquency or default of the loans serviced, which are not hedged. This risk is mitigated somewhat by adherence to underwriting standards on loans originated for sale.
Market disruptions could impact BOK Financial’s funding sources.
BOK Financial’s subsidiary bank may rely on other financial institutions and the Federal Home Loan Bank of Topeka as a significant source of funds. Our ability to fund loans, manage our interest rate risk and meet other obligations depends on funds borrowed from these sources. The inability to borrow funds at market interest rates could have a material adverse effect on our operations.
Operating Risk Factors
Dependence on technology increases cybersecurity risk.
As a financial institution, we process a significant number of customer transactions and possess a significant amount of sensitive customer information. As technology advances, the ability to initiate transactions and access data has become more widely distributed among mobile phones, personal computers, automated teller machines, remote deposit capture sites and similar access points. These technological advances increase cybersecurity risk. While the Company maintains programs intended to prevent or limit the effects of cybersecurity risk, there is no assurance that unauthorized transactions or unauthorized access to customer information will not occur. The financial, reputational and regulatory impact of unauthorized transactions or unauthorized access to customer information could be significant.
We depend on third parties for critical components of our infrastructure.
We outsource a significant portion of our information systems, communications, data management and transaction processing to third parties. These third parties are sources of risk associated with operational errors, system interruptions or breaches, unauthorized disclosure of confidential information and misuse of intellectual property. If the service providers encounter any of these issues, we could be exposed to disruption of service, reputation damages, and litigation risk that could be material to our business.
Risks Related to an Investment in Our Stock
Although publicly traded, BOK Financial's common stock has substantially less liquidity than the average trading market for a stock quoted on the NASDAQ National Market System.
A relatively small fraction of BOK Financial's outstanding common stock is actively traded. The risks of low liquidity include increased volatility of the price of BOK Financial's common stock. Low liquidity may also limit holders of BOK Financial's common stock in their ability to sell or transfer BOK Financial's shares at the price, time and quantity desired.
12
BOK Financial's principal shareholder controls a majority of BOK Financial's common stock.
Mr. George B. Kaiser owns approximately 61% of the outstanding shares of BOK Financial's common stock at
December 31, 2016
. Mr. Kaiser is able to elect all of BOK Financial's directors and effectively control the vote on all matters submitted to a vote of BOK Financial's common shareholders. Mr. Kaiser's ability to prevent an unsolicited bid for BOK Financial or any other change in control could have an adverse effect on the market price for BOK Financial's common stock. A substantial majority of BOK Financial's directors are not officers or employees of BOK Financial or any of its affiliates. However, because of Mr. Kaiser's control over the election of BOK Financial's directors, he could change the composition of BOK Financial's Board of Directors so that it would not have a majority of outside directors.
Possible future sales of shares by BOK Financial's principal shareholder could adversely affect the market price of BOK Financial's common stock.
Mr. Kaiser has the right to sell shares of BOK Financial's common stock in compliance with the federal securities laws at any time, or from time to time. The federal securities laws will be the only restrictions on Mr. Kaiser's ability to sell. Because of his current control of BOK Financial, Mr. Kaiser could sell large amounts of his shares of BOK Financial's common stock by causing BOK Financial to file a registration statement that would allow him to sell shares more easily. In addition, Mr. Kaiser could sell his shares of BOK Financial's common stock without registration under Rule 144 of the Securities Act. Although BOK Financial can make no predictions as to the effect, if any, that such sales would have on the market price of BOK Financial's common stock, sales of substantial amounts of BOK Financial's common stock, or the perception that such sales could occur, could adversely affect market prices. If Mr. Kaiser sells or transfers his shares of BOK Financial's common stock as a block, another person or entity could become BOK Financial's controlling shareholder.
Statutory restrictions on subsidiary dividends and other distributions and debts of BOK Financial's subsidiaries could limit amounts BOK Financial's subsidiaries may pay to BOK Financial.
A substantial portion of BOK Financial's cash flow typically comes from dividends paid by BOKF, NA. Statutory provisions and regulations restrict the amount of dividends BOKF, NA may pay to BOK Financial without regulatory approval. Management also developed, and the BOK Financial board of directors approved, an internal capital policy that is more restrictive than the regulatory capital standards. In the event of liquidation, creditors of the subsidiary banks and other non-bank subsidiaries of BOK Financial are entitled to receive distributions from the assets of that subsidiary before BOK Financial, as holder of an equity interest in the subsidiaries, is entitled to receive any distributions.
13
None.
BOK Financial and its subsidiaries own and lease improved real estate that is carried at $191 million, net of depreciation and amortization. The Company’s principal offices are located in leased premises in the Bank of Oklahoma Tower in Tulsa, Oklahoma. Banking offices are primarily located in Tulsa and Oklahoma City, Oklahoma; Dallas, Fort Worth and Houston, Texas; Albuquerque, New Mexico; Denver, Colorado; Phoenix, Arizona; and Kansas City, Kansas/Missouri. Primary operations facilities are located in Tulsa and Oklahoma City, Oklahoma; Dallas, Texas and Albuquerque, New Mexico. The Company’s facilities are suitable for their respective uses and present needs.
The information set forth in Notes
5
and
14
of the Company’s Notes to Consolidated Financial Statements, which appear elsewhere herein, provides further discussion related to properties.
The information set forth in Note
14
of the Company’s Notes to Consolidated Financial Statements, which appear elsewhere herein, provides discussion related to legal proceedings.
Not applicable.
14
BOK Financial’s $0.00006 par value common stock is traded on the NASDAQ Stock Market under the symbol BOKF. As of January 31, 2017, common shareholders of record numbered 755 with
65,489,810
shares outstanding.
The highest and lowest quarterly closing bid price for shares and cash dividends declared per share of BOK Financial common stock follows:
|
|
First
|
Second
|
Third
|
Fourth
|
||||||||||||
|
2016:
|
|
|
|
|
||||||||||||
|
Low
|
$
|
44.72
|
|
$
|
51.36
|
|
$
|
58.49
|
|
$
|
67.72
|
|
||||
|
High
|
58.60
|
|
64.61
|
|
69.31
|
|
84.13
|
|
||||||||
|
Cash dividends declared
|
0.43
|
|
0.43
|
|
0.43
|
|
0.44
|
|
||||||||
|
2015:
|
|
|
|
|
|
|
|
|
||||||||
|
Low
|
$
|
53.37
|
|
$
|
60.18
|
|
$
|
57.09
|
|
$
|
58.92
|
|
||||
|
High
|
61.67
|
|
70.72
|
|
70.15
|
|
72.44
|
|
||||||||
|
Cash dividends declared
|
0.42
|
|
0.42
|
|
0.42
|
|
0.43
|
|
||||||||
15
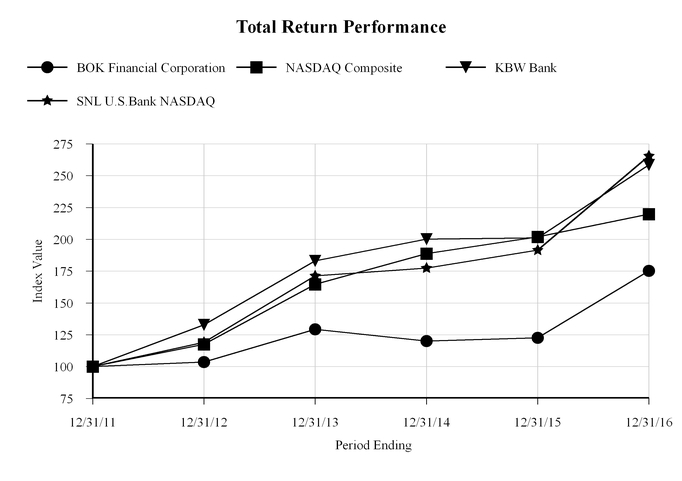
Shareholder Return Performance Graph
Set forth below is a line graph comparing the change in cumulative shareholder return of the NASDAQ Index, the NASDAQ Bank Index, the KBW 50 Bank Index and the SNL U.S. Bank NASDAQ for the period commencing
December 31, 2011
and ending
December 31, 2016
.*
|
|
Period Ending December 31,
|
|||||||||||||||||
|
Index
|
2011
|
2012
|
2013
|
2014
|
2015
|
2016
|
||||||||||||
|
BOK Financial Corporation
|
100.00
|
|
103.63
|
|
129.32
|
|
120.00
|
|
122.66
|
|
175.30
|
|
||||||
|
NASDAQ Composite
|
100.00
|
|
117.45
|
|
164.57
|
|
188.84
|
|
201.98
|
|
219.89
|
|
||||||
|
SNL U.S. Bank NASDAQ
|
100.00
|
|
119.19
|
|
171.31
|
|
177.42
|
|
191.53
|
|
265.56
|
|
||||||
|
KBW 50
|
100.00
|
|
132.91
|
|
183.08
|
|
200.24
|
|
201.22
|
|
258.59
|
|
||||||
|
*
|
Graph assumes value of an investment in the Company's Common Stock for each index was $100 on
December 31, 2011
. The KBW 50 Bank index is the Keefe, Bruyette & Woods, Inc. index, which is available only for calendar quarter end periods. Cash dividends on Common Stock are assumed to have been reinvested in BOK Financial Common Stock.
|
16
The following table provides information with respect to purchases made by or on behalf of the Company or any “affiliated purchaser” (as defined in Rule 10b-18(a)(3) under the Securities Exchange Act of 1934), of the Company’s common stock during the three months ended
December 31, 2016
.
|
Period
|
Total Number of Shares Purchased
2
|
Average Price Paid per Share
|
Total Number of Shares Purchased as Part of Publicly Announced Plans or Programs
1
|
Maximum Number of Shares that May Yet Be Purchased Under the Plans
|
|||||||||
|
October 1, 2016 to October 31, 2016
|
—
|
|
$
|
—
|
|
—
|
|
2,820,757
|
|
||||
|
November 1, 2016 to November 30, 2016
|
700,000
|
|
$
|
70.03
|
|
700,000
|
|
2,120,757
|
|
||||
|
December 1, 2016 to December 31, 2016
|
—
|
|
$
|
—
|
|
—
|
|
2,120,757
|
|
||||
|
Total
|
700,000
|
|
700,000
|
|
|||||||||
|
1
|
On October 1, 2015, the Company's board of directors authorized the Company to repurchase up to five million shares of the Company's common stock. As of
December 31, 2016
, the Company had repurchased 2,879,243 shares under this plan. Future repurchases of the Company's common stock will vary based on market conditions, regulatory limitations and other factors.
|
|
2
|
The Company may repurchase shares from employees to cover the exercise price and taxes in connection with employee shared-based compensation.
|
17
The selected financial data is set forth within Table 1 of Item 7, “Management’s Discussion and Analysis of Financial Condition and Results of Operations.”
|
Table 1 -- Consolidated Selected Financial Data
|
||||||||||||||||||||
|
(Dollars in thousands, except per share data)
|
||||||||||||||||||||
|
|
December 31,
|
|||||||||||||||||||
|
2016
|
2015
|
2014
|
2013
|
2012
|
||||||||||||||||
|
Selected Financial Data
|
|
|
|
|
|
|||||||||||||||
|
For the year:
|
|
|
|
|
|
|||||||||||||||
|
Interest revenue
|
$
|
829,117
|
|
$
|
766,828
|
|
$
|
732,239
|
|
$
|
745,371
|
|
$
|
794,871
|
|
|||||
|
Interest expense
|
81,889
|
|
63,474
|
|
67,045
|
|
70,894
|
|
87,322
|
|
||||||||||
|
Net interest revenue
|
747,228
|
|
703,354
|
|
665,194
|
|
674,477
|
|
707,549
|
|
||||||||||
|
Provision for for credit losses
|
65,000
|
|
34,000
|
|
—
|
|
(27,900
|
)
|
(22,000
|
)
|
||||||||||
|
Fees and commissions revenue
|
686,748
|
|
650,646
|
|
621,319
|
|
603,844
|
|
628,880
|
|
||||||||||
|
Net income attributable to BOK Financial Corporation shareholders
|
232,668
|
|
288,565
|
|
292,435
|
|
316,609
|
|
351,191
|
|
||||||||||
|
Period-end:
|
|
|
|
|
|
|
|
|
||||||||||||
|
Loans
|
16,989,660
|
|
15,941,154
|
|
14,208,037
|
|
12,792,264
|
|
12,311,456
|
|
||||||||||
|
Assets
|
32,772,281
|
|
31,476,128
|
|
29,089,698
|
|
27,015,432
|
|
28,148,631
|
|
||||||||||
|
Deposits
|
22,748,095
|
|
21,088,158
|
|
21,140,859
|
|
20,269,327
|
|
21,179,060
|
|
||||||||||
|
Subordinated debentures
|
144,640
|
|
226,350
|
|
347,983
|
|
347,802
|
|
347,633
|
|
||||||||||
|
Shareholders’ equity
|
3,274,854
|
|
3,230,556
|
|
3,302,179
|
|
3,020,049
|
|
2,957,860
|
|
||||||||||
|
Nonperforming assets
1
|
356,641
|
|
251,908
|
|
256,617
|
|
247,743
|
|
276,716
|
|
||||||||||
|
Profitability Statistics
|
|
|
|
|
|
|
|
|
||||||||||||
|
Earnings per share (based on average equivalent shares):
|
|
|
|
|
|
|
|
|
||||||||||||
|
Basic
|
$
|
3.53
|
|
$
|
4.22
|
|
$
|
4.23
|
|
$
|
4.61
|
|
$
|
5.15
|
|
|||||
|
Diluted
|
3.53
|
|
4.21
|
|
4.22
|
|
4.59
|
|
5.13
|
|
||||||||||
|
Percentages (based on daily averages):
|
|
|
|
|
|
|
|
|
||||||||||||
|
Return on average assets
|
0.72
|
%
|
0.94
|
%
|
1.04
|
%
|
1.16
|
%
|
1.34
|
%
|
||||||||||
|
Return on average shareholders' equity
|
7.02
|
%
|
8.65
|
%
|
9.21
|
%
|
10.64
|
%
|
12.24
|
%
|
||||||||||
|
Average total equity to average assets
|
10.38
|
%
|
11.03
|
%
|
11.47
|
%
|
11.00
|
%
|
11.05
|
%
|
||||||||||
|
Common Stock Performance
|
|
|
|
|
|
|
|
|
||||||||||||
|
Per Share:
|
|
|
|
|
|
|
|
|
||||||||||||
|
Book value per common share
|
$
|
50.12
|
|
$
|
49.03
|
|
$
|
47.78
|
|
$
|
43.88
|
|
$
|
43.29
|
|
|||||
|
Market price: December 31 close
|
83.04
|
|
59.79
|
|
60.04
|
|
66.32
|
|
54.46
|
|
||||||||||
|
Market range – High close bid price
|
84.13
|
|
72.44
|
|
70.18
|
|
69.36
|
|
59.77
|
|
||||||||||
|
Market range – Low close bid price
|
44.72
|
|
53.37
|
|
57.87
|
|
55.05
|
|
52.56
|
|
||||||||||
|
Cash dividends declared
|
1.73
|
|
1.69
|
|
1.62
|
|
1.54
|
|
2.47
|
|
4
|
|||||||||
|
Dividend payout ratio
|
48.81
|
%
|
40.03
|
%
|
38.35
|
%
|
33.43
|
%
|
48.01
|
%
|
4
|
|||||||||
18
|
Table 1 -- Consolidated Selected Financial Data
|
||||||||||||||||||||
|
(Dollars in thousands, except per share data)
|
||||||||||||||||||||
|
|
December 31,
|
|||||||||||||||||||
|
2016
|
2015
|
2014
|
2013
|
2012
|
||||||||||||||||
|
Selected Balance Sheet Statistics
|
|
|
|
|
|
|
|
|
||||||||||||
|
Period-end:
|
|
|
|
|
|
|
|
|
||||||||||||
|
Common equity Tier 1 ratio
2
|
11.21
|
%
|
12.13
|
%
|
N/A
|
|
N/A
|
|
N/A
|
|
||||||||||
|
Tier 1 capital ratio
2
|
11.21
|
%
|
12.13
|
%
|
13.33
|
%
|
13.77
|
%
|
12.78
|
%
|
||||||||||
|
Total capital ratio
2
|
12.81
|
%
|
13.30
|
%
|
14.66
|
%
|
15.56
|
%
|
15.13
|
%
|
||||||||||
|
Leverage ratio
2
|
8.72
|
%
|
9.25
|
%
|
9.96
|
%
|
10.05
|
%
|
9.01
|
%
|
||||||||||
|
Allowance for loan losses to nonaccruing loans
5
|
112.33
|
%
|
180.09
|
%
|
245.34
|
%
|
184.71
|
%
|
160.92
|
%
|
||||||||||
|
Allowance for loan losses to loans
|
1.45
|
%
|
1.41
|
%
|
1.33
|
%
|
1.45
|
%
|
1.75
|
%
|
||||||||||
|
Combined allowances for credit losses to loans
3
|
1.52
|
%
|
1.43
|
%
|
1.34
|
%
|
1.47
|
%
|
1.77
|
%
|
||||||||||
|
Miscellaneous (at December 31)
|
|
|
|
|
|
|
|
|
||||||||||||
|
Number of employees (full-time equivalent)
|
4,884
|
|
4,789
|
|
4,743
|
|
4,632
|
|
4,704
|
|
||||||||||
|
Number of TransFund locations
|
2,021
|
|
1,972
|
|
2,080
|
|
1,998
|
|
1,970
|
|
||||||||||
|
Fiduciary assets
|
$
|
41,781,564
|
|
$
|
38,333,638
|
|
$
|
35,997,877
|
|
$
|
30,137,092
|
|
$
|
25,829,038
|
|
|||||
|
Mortgage loans serviced for others
|
21,997,568
|
|
19,678,226
|
|
16,162,887
|
|
13,718,942
|
|
11,981,624
|
|
||||||||||
|
1
|
Includes nonaccruing loans, renegotiated loans and assets acquired in satisfaction of loans. Excludes loans past due 90 days or more and still accruing.
|
|
2
|
Risk-based capital ratios for 2016 and 2015 calculated under revised regulatory capital rules issued July 2013 and effective for the Company on January 1, 2015. Previous risk-based ratios presented are calculated in accordance with then current regulatory capital rules.
|
|
3
|
Includes allowance for loan losses and accrual for off-balance sheet credit risk.
|
|
4
|
Includes $1.00 per share special dividend.
|
|
5
|
Excludes residential mortgage loans guaranteed by agencies of the U.S. government.
|
Management’s Assessment of Operations and Financial Condition
Overview
The following discussion is management’s analysis to assist in the understanding and evaluation of the financial condition and results of operations of BOK Financial Corporation (“BOK Financial” or “the Company”). This discussion should be read in conjunction with the consolidated financial statements and footnotes and selected financial data presented elsewhere in this report.
The first quarter of 2016 began with a continued decline in energy prices that started in June of 2014. West Texas Intermediate crude oil fell to a low of $26 per barrel in February of 2016, rebounded and then stabilized in a range between $40 and $50 a barrel by June. In November, the Organization of Petroleum Exporting Countries ("OPEC") announced production cuts of 1.2 million barrels per day in 2017 further supporting improvement in the supply and demand imbalance. The prolonged low price environment significantly impacted oil and gas producers and service companies supporting those industries. During the year, these companies reduced capital expenditure spending, cut headcount and focused on paying down debt and strengthening their balance sheets. These actions slowed growth within our geographical footprint, but to date have not had a significant direct impact. Moving into 2017, the industry remains cautious, but is poised for continued improvement as the supply and demand imbalance tightens.
For 2016, overall U.S. economic activity continued at a moderate pace and unemployment improved. National unemployment rates declined to 4.7% in December of 2016 from 5.0% in December of 2015. The minutes of the Federal Open Market Committee ("FOMC") of the Federal Reserve for December indicated continued strengthening of labor market and a moderate rise in household spending. However, business investment has remained soft. While inflation has increased, it is still below the Federal Reserve's 2% long-run objective. The Federal Reserve policies remain accommodative in order to foster maximum employment and price stability.
Investment returns were strong for 2016. The S&P 500 index was up 12% for the year, with 5% of that gain coming after the November election. This represents the 8th year in a row of positive returns for the S&P 500 index. Small cap stock also performed very well, up over 21% for 2016.
19
Short term interest rates, the rates most influenced by the Federal Reserve, moved up slightly during the year. As expected, the FOMC voted to raise the target range for the federal funds rate by ¼ percentage point in December of 2016, bringing it from ½ to ¾ percent. With the federal funds rate increase in December of 2015, the Federal Reserve ended an extraordinary seven-year period during which the federal funds rate was held near zero to support the recovery of the economy from the worst financial crisis and recession since the Great Depression. Long-term rates saw more volatility during 2016. The 10-year U.S. Treasury note started 2016 with a yield of 2.27%, dropped to a low of 1.36% in early July and then rose to 2.45% at year-end. We expect rates to continue to increase during 2017. The yield curve is also expected to steepen, with long-term interest rates up more than short-term interest rates through the end of 2017.
The markets have reacted positively to the outcome of the presidential election on the expectation of tax reform, decreased regulation, support of the fossil fuel industry and focus on the return of capital stranded offshore. But uncertainty exists as to the ability to deliver on these promised economic reforms. Potential missteps in trade negotiations, the impact of a strong dollar and budget deficits also remain as concerns.
20
Performance Summary
Net income for the year ended
December 31, 2016
totaled
$232.7 million
or
$3.53
per diluted share compared with net income of
$288.6 million
or
$4.21
per diluted share for the year ended
December 31, 2015
.
Highlights of
2016
included:
|
•
|
Net interest revenue totaled
$747.2 million
for
2016
, up from
$703.4 million
for
2015
primarily due to growth in average loans. The benefit of an increase in short-term interest rates on the loan portfolio and interest-bearing cash and cash equivalent yields was offset by higher borrowing costs. Net interest margin was
2.66%
for
2016
compared to
2.60%
for
2015
.
|
|
•
|
Fees and commissions revenue
increase
d
$36.1 million
or
6%
over
2015
to
$686.7 million
for
2016
with growth in most revenue categories. Fiduciary and asset management revenue grew by
$9.3 million
due to decreased fee waivers and asset growth from acquisitions. Brokerage and trading revenue was up primarily due to increased customer hedging revenue. Mortgage banking revenue
increase
d
$7.9 million
primarily related to increased servicing revenue. Transaction card revenue grew
$7.1 million
over the prior year due to transaction growth.
|
|
•
|
The change in the fair value of mortgage servicing rights, net of economic hedges, decreased other operating revenue by
$28.4 million
in
2016
and by
$7.9 million
in
2015
. An unexpected 85 basis point increase in the 10-year U.S. Treasury interest rate and related interest rates due to the market's reaction to the outcome of the U.S. presidential election increased the fair value of our servicing rights
$39.8 million
. The fair value of our economic hedges decreased
$56.8 million
.
|
|
•
|
Operating expenses totaled
$1.0 billion
, an
increase
of
$121.4 million
or
14%
over the prior year, including
$9.1 million
of litigation and settlement expenses,
$7.5 million
of integration costs related to the Mobank acquisition and
$5.0 million
of severance costs related to the previously announced reduction of workforce to better align expenses with expected revenue growth. Excluding these items, personnel costs
increase
d
$31.3 million
or
6%
, primarily due to increased incentive compensation expense. Non-personnel expenses
increase
d
$68.5 million
or
18%
, primarily due to increased mortgage banking expense related to the effect of increased prepayments on our mortgage servicing rights, higher deposit insurance expense related to elevated criticized and classified asset levels and a new surcharge on banks over $10 billion in total assets and continued upgrades of our information technology infrastructure and cybersecurity.
|
|
•
|
After evaluating all credit factors, the Company determined that a
$65.0 million
provision for credit losses was necessary in
2016
, primarily due to credit migration in the energy portfolio. A
$34.0 million
provision for credit losses was necessary in
2015
. The Company had net charge-offs of
$34.8 million
or
0.21%
of average loans for
2016
compared to a net recovery of
$2.9 million
or
(0.02)%
of average loans for
2015
. Gross charge-offs increased to
$42.6 million
in
2016
from
$15.2 million
in
2015
, primarily due to energy loans.
|
|
•
|
The combined allowance for credit losses totaled
$257 million
or
1.52%
of outstanding loans at
December 31, 2016
compared to
$227 million
or
1.43%
of outstanding loans at
December 31, 2015
.
|
|
•
|
Nonperforming assets not guaranteed by U.S. government agencies totaled
$263 million
or
1.56%
of outstanding loans and repossessed assets (excluding those guaranteed by U.S. government agencies) at
December 31, 2016
and
$156 million
or
0.99%
of outstanding loans and repossessed assets (excluding those guaranteed by U.S. government agencies) at
December 31, 2015
. Excluding assets guaranteed by U.S. government agencies, nonaccruing loans
increase
d
$94 million
and repossessed assets
increase
d
$14 million
during
2016
.
|
|
•
|
Period-end outstanding loan balances were
$17.0 billion
at
December 31, 2016
, an
increase
of
$1.0 billion
over the prior year. The acquisition of Mobank added $485 million of loans, including $289 million of commercial loans and $87 million of commercial real estate balances. Commercial loan balances grew by
$138 million
or
1%
and commercial real estate loans
increase
d
$550 million
or
17%
. Residential mortgage loans
increase
d
$73 million
. Personal loans
increase
d
$287 million
.
|
|
•
|
Period-end deposits totaled
$22.7 billion
at
December 31, 2016
, up
$1.7 billion
over
December 31, 2015
. The Mobank acquisition added $624 million in deposits. Demand deposit accounts
increase
d by
$939 million
and interest-bearing transaction deposits
increase
d
$866 million
, partially offset by a
$184 million
decrease
in time deposit balances.
|
|
•
|
The Company's common equity Tier 1 capital ratio was
11.21%
at
December 31, 2016
. In addition, the Company's Tier 1 capital ratio was
11.21%
, total capital ratio was
12.81%
and leverage ratio was
8.72%
at
December 31, 2016
. At
December 31, 2015
, the Company's Tier 1 capital ratio was
12.13%
at
December 31, 2015
, the total capital ratio was
13.30%
and the leverage ratio was
9.25%
.
|
21
|
•
|
The Company repurchased
1,005,169
shares at an average price of
$66.45
per share during
2016
. The Company repurchased
3,634,578
shares at an average price of
$63.15
during
2015
.
|
|
•
|
The Company paid cash dividends of
$1.73
per common share during
2016
and
$1.69
per common share in
2015
.
|
Net income for the
fourth quarter of 2016
totaled
$50.0 million
or
$0.76
per diluted share compared to
$59.6 million
or
$0.89
per diluted share for the
fourth quarter of 2015
.
Highlights of the
fourth quarter of 2016
included:
|
•
|
Net interest revenue totaled
$194.2 million
for the
fourth quarter of 2016
,
up
$12.9 million
over the
fourth quarter of 2015
. Net interest margin was
2.69%
for the
fourth quarter of 2016
, up from
2.64%
for the
fourth quarter of 2015
. Net interest revenue increased primarily due to the growth in average loan balances and improving loan yields. Trading securities balances also increased and yields improved, partially offset by lower yields on the fair value option securities portfolio and increased funding costs.
|
|
•
|
Other operating revenue was
$143.8 million
for the
fourth quarter of 2016
, a
decrease
of
$15.2 million
compared to the
fourth quarter of 2015
. Fees and commissions revenue was up
$8.3 million
over the
fourth quarter of 2015
. The fourth quarter of 2016 included a
$17.0 million
decrease in the fair value of mortgage servicing rights, net of economic hedges and a
$5.0 million
decrease in the net fair value of trading portfolio positions related to an unexpected 85 basis point increase in the 10-year U.S. Treasury interest rate and related interest rates primarily due to the market's reaction to the outcome of the U.S. presidential election. Mortgage banking revenue increased
$5.5 million
over the
fourth quarter of 2015
. Fiduciary and asset management revenue and transaction card revenue were both up over the
fourth quarter of 2015
.
|
|
•
|
Operating expenses totaled
$265.5 million
, an
increase
of
$35.1 million
over the prior year. Excluding the impact of
$5.0 million
of severance and other expenses related to the workforce reductions and
$4.7 million
of integration costs related to the Mobank acquisition in the fourth quarter of 2016, other operating expense
increase
d
$25.4 million
over the
fourth quarter of 2015
. Personnel expense
increase
d
$3.5 million
primarily due to cash-based incentive compensation. Non-personnel expense was up
$21.9 million
primarily due to mortgage banking, deposit insurance, professional fees and services and occupancy and equipment expenses. We also made a $2.0 million cash contribution to the BOK Charitable Foundation in 2016.
|
|
•
|
No
provision for credit losses was recorded in the
fourth quarter of 2016
due to improving credit metrics, largely driven by energy price stability. A
$22.5 million
provision for credit losses was recorded in the
fourth quarter of 2015
. The Company had a net recovery of
$1.2 million
in the
fourth quarter of 2016
compared to net charge-offs of
$3.0 million
in the
fourth quarter of 2015
. Gross charge-offs were down to
$1.7 million
compared to
$4.9 million
in the prior year.
|
22
Critical Accounting Policies & Estimates
The Consolidated Financial Statements and accompanying notes are prepared in accordance with generally accepted accounting principles in the United States of America (“GAAP”). The Company's accounting policies are more fully described in Note 1 of the Consolidated Financial Statements. Management makes significant assumptions and estimates in the preparation of the Consolidated Financial Statements and accompanying notes in conformity with GAAP that may be highly subjective, complex and subject to variability. Actual results could differ significantly from these assumptions and estimates. The following discussion addresses the most critical areas where these assumptions and estimates could affect the financial condition, results of operations and cash flows of the Company. These critical accounting policies and estimates have been discussed with the appropriate committees of the Board of Directors.
Allowance for Loan Losses and Accrual for Off-Balance Sheet Credit Risk
The appropriateness of the allowance for loan losses and accrual for off-balance sheet credit risk is assessed quarterly by management based on an ongoing evaluation of the probable estimated losses inherent in the loan portfolio and probable estimated losses on unused commitments to provide financing. A consistent, well-documented methodology has been developed and is applied by an independent Credit Administration department to ensure consistency across the Company. The allowance for loan losses consists of specific allowances attributed to certain impaired loans that have not yet been charged down to amounts we expect to recover, general allowances for unimpaired loans that are based on estimated loss rates by loan class and nonspecific allowances for risks beyond factors specific to a particular portfolio segment or loan class. There have been no material changes in the approach or techniques utilized in developing the allowance for loan losses and accrual for off-balance sheet credit risk during 2016.
Loans are considered impaired when it is probable that we will not collect all amounts due according to the contractual terms of the loan agreements, including loans modified in a troubled debt restructuring. Internally risk graded loans are evaluated individually for impairment. Substantially all commercial and commercial real estate loans and certain residential mortgage and personal loans are risk graded through a quarterly evaluation of the borrower's ability to repay.
Specific allowances for impaired loans that have not yet been charged down to amounts we expect to recover are measured by an evaluation of estimated future cash flows discounted at the loan's initial effective interest rate or the fair value of collateral for certain collateral dependent loans. Collateral value of real property is generally based on third party appraisals that conform to Uniform Standards of Professional Appraisal Practice, less estimated selling costs. Appraised values are on an “as-is” basis and generally are not adjusted by the Company. Updated appraisals are obtained at least annually or more frequently if market conditions indicate collateral values may have declined. Collateral value of mineral rights is determined by our internal staff of engineers based on projected cash flows under current market conditions. The value of other collateral is generally determined by our special assets staff based on liquidation cash flows under current market conditions. Collateral values and available cash resources that support impaired loans are evaluated quarterly. Historical statistics may be used as a practical way to estimate impairment in limited situations, such as when a collateral dependent loan is identified as impaired near the end of a reporting period until an updated appraisal of collateral value is received or a full assessment of future cash flows is completed. Estimates of future cash flows and collateral values require significant judgments and may be volatile.
General allowances for unimpaired loans are based on estimated loss rates by loan class. The appropriate historical gross loss rate for each loan class is determined by the greater of the current loss rate based on the most recent twelve months or a ten-year average gross loss rate. Recoveries are not directly considered in the estimation of historical loss rates. Recoveries generally do not follow predictable patterns and are not received until well-after the charge-off date as a result of protracted legal proceedings. For risk graded loans, historical loss rates are adjusted for changes in risk rating. For each loan class, the weighted average current risk grade is compared to the weighted average long-term risk grade. This comparison determines whether the risk in each loan class is increasing or decreasing. Historical loss rates are adjusted upward or downward in proportion to changes in weighted average risk grading. General allowances for unimpaired loans also consider inherent risks identified for a given loan class. Inherent risks include consideration of the loss rates that most appropriately represent the current credit cycle and other factors attributable to a specific loan class which have not yet been represented in the historical gross loss rates or risk grading. Examples of these factors include changes in commodity prices or engineering imprecision, which may affect the value of reserves that secure our energy loan portfolio, construction risk that may affect commercial real estate loans, changes in regulations and public policy that may disproportionately impact health care loans and changes in loan product types.
Nonspecific allowances are maintained for risks beyond factors specific to a particular portfolio segment or loan class. These factors include trends in the economy in our primary lending areas, concentrations in loans with large balances and other relevant factors.
23
Fair Value Measurement
Certain assets and liabilities are recorded at fair value in the Consolidated Financial Statements. Fair value is defined by applicable accounting guidance as the price to sell an asset or transfer a liability in an orderly transaction between market participants in the principal markets for the given asset or liability at the measurement date based on market conditions at that date. An orderly transaction assumes exposure to the market for a customary period for marketing activities prior to the measurement date and not a forced liquidation or distressed sale.
A hierarchy for fair value has been established that prioritizes the inputs of valuation techniques used to measure fair value into three broad categories: unadjusted quoted prices in active markets for identical assets or liabilities (Level 1), other observable inputs that can be observed either directly or indirectly (Level 2) and unobservable inputs for assets or liabilities (Level 3). Fair value may be recorded for certain assets and liabilities every reporting period on a recurring basis or under certain circumstances on a non-recurring basis.
The following represents significant fair value measurements included in the Consolidated Financial Statements based on estimates. See Note
18
of the Consolidated Financial Statements for additional discussion of fair value measurement and disclosure included in the Consolidated Financial Statements.
Mortgage Servicing Rights
We have a significant investment in mortgage servicing rights. Our mortgage servicing rights are primarily retained from sales in the secondary market of residential mortgage loans we have originated or purchased from correspondent lenders. Occasionally, mortgage servicing rights may be purchased from other lenders. Both originated and purchased mortgage servicing rights are initially recognized at fair value. We carry all mortgage servicing rights at fair value. Changes in fair value are recognized in earnings as they occur.
There is no active market for mortgage servicing rights after origination. The fair value of mortgage servicing rights is determined by discounting the projected cash flows. Certain significant assumptions and estimates used in valuing mortgage servicing rights are based on current market sources including projected prepayment speeds, assumed servicing costs, earnings on escrow deposits, ancillary income and discount rates. Assumptions used to value our mortgage servicing rights are considered significant unobservable inputs and represent our best estimate of assumptions that market participants would use to value this asset. A separate third party model is used to estimate prepayment speeds based on interest rates, housing turnover rates, estimated loan curtailment, anticipated defaults and other relevant factors. The prepayment model is updated periodically for changes in market conditions and adjusted to better correlate with actual performance of our servicing portfolio. The discount rate is based on benchmark rates for mortgage loans plus a market spread expected by investors in servicing rights. Significant assumptions used to determine the fair value of our mortgage servicing rights are presented in Note
7
to the Consolidated Financial Statements. At least annually, we request estimates of fair value from outside sources to corroborate the results of the valuation model.
The assumptions used in this model are primarily based on mortgage interest rates. Evaluation of the effect of a change in one assumption without considering the effect of that change on other assumptions is not meaningful. Considering all related assumptions, we expect a 50 basis point increase in primary mortgage interest rates to increase the fair value of our servicing rights by $25 million. We expect a $29 million decrease in the fair value of our mortgage servicing rights from a 50 basis point decrease in primary mortgage interest rates.
Valuation of Derivative Instruments
We use interest rate derivative instruments to manage our interest rate risk. We also offer interest rate, commodity, foreign exchange and equity derivative contracts to our customers. All derivative instruments are carried on the balance sheet at fair value. Fair values for exchange-traded contracts are based on quoted prices in an active market for identical instruments. Fair values for over-the-counter interest rate contracts used to manage our interest rate risk are generated internally using third-party valuation models. Inputs used in third-party valuation models to determine fair values are considered significant other observable inputs. Fair values for interest rate, commodity, foreign exchange and equity contracts used in our customer hedging programs are based on valuations generated internally by third-party provided pricing models. These models use significant other observable market inputs to estimate fair values. Changes in assumptions used in these pricing models could significantly affect the reported fair values of derivative assets and liabilities, though the net effect of these changes should not significantly affect earnings.
24
Credit risk is considered in determining the fair value of derivative instruments. Deterioration in the credit rating of customers or dealers reduces the fair value of asset contracts. The reduction in fair value is recognized in earnings during the current period. Fair value adjustments are based on various risk factors including but not limited to counterparty credit rating or equivalent loan grading, derivative contract notional size, price volatility of the underlying commodity, duration of the derivative contracts and expected loss severity. Expected loss severity is based on historical losses for similarly risk-graded commercial loan customers. Deterioration in our credit rating below investment grade would affect the fair value of our derivative liabilities. In the event of a credit down-grade, the fair value of our derivative liabilities would decrease. The reduction in fair value would be recognized in earnings in the current period. The impact of credit valuation adjustments on the total valuation of derivative contracts was not significant.
Valuation of Securities
The fair value of our securities portfolio is generally based on a single price for each financial instrument provided to us by a third-party pricing service determined by one or more of the following:
|
•
|
Quoted prices for similar, but not identical, assets or liabilities in active markets;
|
|
•
|
Quoted prices for identical or similar assets or liabilities in inactive markets;
|
|
•
|
Inputs other than quoted prices that are observable, such as interest rate and yield curves, volatilities, prepayment speeds, loss severities, credit risks and default rates;
|
|
•
|
Other inputs derived from or corroborated by observable market inputs.
|
The underlying methods used by the third-party pricing services are considered in determining the primary inputs used to determine fair values. We evaluate the methodologies employed by the third-party pricing services by comparing the price provided by the pricing service with other sources, including brokers' quotes, sales or purchases of similar instruments and discounted cash flows to establish a basis for reliance on the pricing service values. Significant differences between the pricing service provided value and other sources are discussed with the pricing service to understand the basis for their values. Based on all observable inputs, management may adjust prices obtained from third-party pricing services to more appropriately reflect the prices that would be received to sell assets or paid to transfer liabilities in orderly transactions in the current market. No significant adjustments were made to prices provided by third-party pricing services at
December 31, 2016
or
December 31, 2015
.
Valuation of Impaired Loans and Real Estate and Other Repossessed Assets
The fair value of collateral for certain impaired loans and real estate and other repossessed assets is measured on a non-recurring basis. The fair value of real estate is generally based on unadjusted third-party appraisals derived principally from or corroborated by observable market data. Fair value measurements based on these appraisals are considered to be based on Level 2 inputs. Fair value measurements based on appraisals that are not based on observable inputs or that require significant adjustments by us or fair value measurements that are not based on third-party appraisals are considered to be based on Level 3 inputs. Significant unobservable inputs include listing prices for comparable assets, uncorroborated expert opinions or management's knowledge of the collateral or industry.
The fair value of mineral rights is generally determined by our internal staff of engineers based on projected cash flows from proven oil and gas reserves under existing economic and operating conditions. Proven oil and gas reserves are estimated quantities that geological and engineering data demonstrate, with reasonable certainty, to be recoverable in future years from known reservoirs using existing prices and costs. Projected cash flows incorporate assumptions related to a number of factors including production, sales prices, operating expenses, severance, ad valorem taxes, capital costs and appropriate discount rate. Fair values determined through this process are considered to be based on Level 3 inputs.
Income Taxes
Determination of income tax expense and related assets and liabilities is complex and requires estimates and judgments when applying tax laws, rules, regulations and interpretations. It also requires judgments as to future earnings and the timing of future events. Accrued income taxes represent an estimate of net amounts due to or from taxing jurisdictions based upon these estimates, interpretations and judgments.
25
Management evaluates the Company's current tax expense or benefit based upon estimates of taxable income, tax credits and statutory tax rates. Annually, we file tax returns with each jurisdiction where we conduct business and adjust recognized income tax expense or benefit to filed tax returns.
We recognize deferred tax assets and liabilities based upon the differences between the values of assets and liabilities as recognized in the financial statements and their related tax basis using enacted tax rates in effect for the year in which the differences are expected to be recovered or settled. A valuation allowance is provided when it is more likely than not that some portion of the entire deferred tax asset may not be realized based on taxes previously paid in net loss carry-back periods and other factors.
We also recognize the benefit of uncertain income tax positions when based upon all relevant evidence, it is more-likely-than-not that our position would prevail upon examination, including resolution of related appeals or litigation, based upon the technical merits of the position. Unrecognized tax benefits, including estimated interest and penalties, are part of our current accrued income tax liability. Estimated penalties and interest are recognized in income tax expense. Income tax expense in future periods may decrease if an uncertain tax position is favorably resolved, generally upon completion of an examination by the taxing authorities, expiration of a statute of limitations, or changes in facts and circumstances.
26
Results of Operations
Net Interest Revenue and Net Interest Margin
Net interest revenue is the interest earned on debt securities, loans and other interest-earning assets less interest paid for interest-bearing deposits and other borrowings. The net interest margin is calculated by dividing tax-equivalent net interest revenue by average interest-earning assets. Net interest spread is the difference between the average rate earned on interest-earning assets and the average rate paid on interest-bearing liabilities. Net interest margin is typically greater than net interest spread due to interest income earned on assets funded by non-interest bearing liabilities such as demand deposits and equity.
Tax-equivalent net interest revenue totaled
$764.8 million
for
2016
, up from
$715.8 million
for
2015
. Net interest margin was
2.66%
for
2016
and
2.60%
for
2015
. Tax-equivalent net interest revenue
increase
d
$49.0 million
over the prior year. Net interest revenue increased
$47.2 million
from growth in earning assets and increased
$1.8 million
due to rates. The benefit of an increase in short-term interest rates on the loan portfolio and interest-bearing cash and cash equivalent yields was offset by higher borrowing costs. Table
2
shows the effects on net interest revenue of changes in average balances and interest rates for the various types of earning assets and interest-bearing liabilities. In addition, see the Annual and Quarterly Financial Summary of consolidated daily average balances, yields and rates following the Consolidated Financial Statements.
The tax-equivalent yield on earning assets was
2.95%
for
2016
compared to
2.84%
in
2015
. Loan yields
increase
d
5
basis points compared to the prior year primarily due to growth in variable rate loans and an increase in short-term interest rates. The yield on trading securities
increase
d
94
basis points to
3.43%
due to a change in mix toward more higher-yielding U.S. agency residential mortgage-backed securities. The yield on interest-bearing cash and cash equivalents
increase
d
26
basis points to
0.53%
. The available for sale securities portfolio yield
increase
d
4
basis points to
2.03%
. The benefit from improved yields on investment securities was offset by lower yields on restricted equity securities and fair value option securities. Funding costs
increase
d
7
basis points over
2015
. The cost of interest-bearing deposits
decrease
d
1
basis point, while the cost of other borrowed funds
increase
d
25
basis points, primarily due to increases in federal funds rates by the Federal Reserve in the fourth quarters of 2016 and 2015. The cost of subordinated debentures
increase
d
98
basis points as lower variable rate debt outstanding during 2015 was replaced by higher fixed rate debt. The Company issued $150 million of 40 year, 5.375% fixed rate subordinated debt during the second quarter that replaced $227 million of floating rate subordinated debt based on three-month LIBOR plus 0.69%. The benefit to net interest margin from earning assets funded by non-interest bearing liabilities was
13
basis points for
2016
, compared to
11
basis points for
2015
.
Average earning assets for
2016
increase
d
$1.2 billion
or
4%
over
2015
. Average loans, net of allowance for loan losses,
increase
d
$1.3 billion
due primarily to growth in average commercial and commercial real estate loans. Average trading securities balances
increase
d
$168 million
primarily related to the addition of a new group trading in U.S. mortgage-backed securities during 2016. The average balance of available for sale securities, which consists largely of residential and commercial mortgage-backed securities guaranteed by U.S. government agencies,
decrease
d
$152 million
. We purchase securities to supplement earnings and to manage interest rate risk. We have reduced the size of our bond portfolio during 2014, 2015 and 2016 through normal monthly runoff to better position the balance sheet for an environment of rising longer-term rates. Our outlook for earning assets is for continued growth in loan balances, partially offset by a reduction in the securities portfolio balance. We expect mid single digit annualized loan growth for 2017. We expect stable to rising net interest margin and increasing net interest revenue.
Growth in average assets was funded by increased borrowings from the Federal Home Loan Banks and demand deposit growth, partially offset by lower interest-bearing deposits and subordinated debt balances. Total average deposits were largely unchanged compared to the prior year. Average demand deposit balances grew by
$426 million
over the prior year. This growth was offset by a
$328 million
decrease
in average time deposits and a
$175 million
decrease
in average interest-bearing transaction account balances. Average borrowed funds
increase
d
$1.6 billion
over the prior year. Borrowings from the Federal Home Loan Banks
increase
d
$1.1 billion
, partially offset by decreased funds purchased, repurchase agreements and subordinated debenture balances compared to the prior year.
27
Our overall objective is to manage the Company’s balance sheet to be relatively neutral to changes in interest rates as is further described in the Market Risk section of this report. As shown in Table
20
, approximately
81%
of our commercial and commercial real estate loan portfolios are either variable rate loans or fixed rate loans that will re-price within one year. These loans are funded primarily by deposit accounts that are either non-interest bearing, or that re-price more slowly than the loans. The result is a balance sheet that would be asset sensitive, which means that assets generally re-price more quickly than liabilities. Among the strategies that we use to manage toward a relatively rate-neutral position, we purchase fixed rate residential mortgage-backed securities issued primarily by U.S. government agencies and fund them with market rate sensitive liabilities. The liability-sensitive nature of this strategy provides an offset to the asset-sensitive characteristics of our loan portfolio. We also may use derivative instruments to manage our interest rate risk.
The effectiveness of these strategies is reflected in the overall change in net interest revenue due to changes in interest rates as shown in Table
2
and in the interest rate sensitivity projections as shown in the Market Risk section of this report.
Fourth Quarter
2016
Net Interest Revenue
Tax-equivalent net interest revenue totaled
$198.6 million
for the
fourth quarter of 2016
, an
increase
of
$14.1 million
over the
fourth quarter of 2015
. Net interest margin was
2.69%
for the
fourth quarter of 2016
compared to
2.64%
for the
fourth quarter of 2015
. Net interest revenue increased
$14.2 million
primarily due to the growth in average loan balances and increased trading securities balances.
The tax-equivalent yield on earning assets was
2.98%
for the
fourth quarter of 2016
,
up
12
basis points over the
fourth quarter of 2015
. Loan yields
increased
12
basis points to
3.67%
due primarily to growth in variable rate loans and an increase in short-term interest rates. The yield on interest-bearing cash and cash equivalents
increased
26
basis points to
0.55%
. The available for sale securities portfolio yield
decreased
4 basis points
to
2.00%
. Funding costs were
up
10 basis points
from the
fourth quarter of 2015
. The cost of interest-bearing deposits was unchanged compared to the
fourth quarter of 2015
. The cost of other borrowed funds
increased
22 basis points
, primarily due to the increase in the federal funds rate by the Federal Reserve. The cost of subordinated debt was up
438
basis points as lower variable rate debt outstanding in the fourth quarter of 2015 was replaced with higher fixed rate debt. The benefit to net interest margin from earning assets funded by non-interest bearing liabilities was
15 basis points
in the
fourth quarter of 2016
, compared to
12 basis points
in the
fourth quarter of 2015
.
Average earning assets for the
fourth quarter of 2016
increased
$1.1 billion
over the
fourth quarter of 2015
, including $244 million related to the acquisition of Mobank. Average loans, net of allowance for loan losses,
increased
$1.1 billion
due primarily to growth in commercial and commercial real estate loan balances and included $162 million related to the Mobank acquisition. Growth in the average balance of the trading securities portfolio was offset by decreased available for sale securities and fair value option securities held as an economic hedge of mortgage servicing rights.
Average deposits
increased
$998 million
over the
fourth quarter of 2015
, including $206 million related to the Mobank acquisition. Average demand deposit balances
increase
d
$812 million
and average interest-bearing transaction accounts
increase
d
$453 million
. Average time deposits
decrease
d
$306 million
. Average borrowed funds
increased
$1.0 billion
over the
fourth quarter of 2015
, primarily due to increased Federal Home Loan Bank borrowings. The average subordinated debt balance decreased
$82 million
as the size of the borrowing was reduced when it was refinanced during 2016.
2015
Net Interest Revenue
Tax-equivalent net interest revenue for
2015
was
$715.8 million
, up from
$676.1 million
for
2014
. Net interest margin was
2.60%
for
2015
compared to
2.68%
for
2014
. The
$39.7 million
increase
in net interest margin was due primarily to growth in earning assets, partially offset by a narrowing loan yields during the year. The yield on the available for sale securities portfolio increased and funding costs were lower compared to
2014
.
The tax-equivalent yield on average earning assets
decrease
d
11
basis points from
2014
. Loan yields
decrease
d
23
basis points primarily due to market pricing pressure and lower interest rates for the majority of 2015. The available for sale securities portfolio yield
increase
d
4
basis points. Yields on restricted equity securities, fair value option securities and interest-bearing cash and cash equivalents all improved over
2014
. The cost of interest-bearing liabilities
decrease
d
6
basis points. The cost of interest-bearing deposits was
down
6
basis points and the cost of other borrowed funds
increase
d
5
basis points largely due to the mix of funding sources. The cost of subordinated debentures
decrease
d
66
basis points as $122 million of fixed-rate subordinated debt matured on June 1, 2015. The cost of this subordinated debt was 5.56%. The benefit to net interest margin from earning assets funded by non-interest bearing liabilities was
11
basis points for
2015
, compared to
14
basis points for
2014
.
28
Average earning assets
increase
d
$2.4 billion
or 9% during
2015
. Average loans, net of allowance for loan losses,
increase
d
$1.6 billion
. The average balance of interest-bearing cash and cash equivalents grew by
$904 million
over
2014
as borrowings from the Federal Home Loan Bank were deposited in the Federal Reserve to earn a spread. The average balance of the available for sale securities portfolio
decrease
d
$620 million
. We reduced the size of our securities portfolio during 2014 and 2015 through normal monthly runoff to better position the balance sheet for an environment of rising longer-term rates. Growth in average assets was funded by a
$518 million
increase in average deposit balances. Average demand deposit account balances grew by
$361 million
and average interest-bearing transaction account balances were up
$182 million
, partially offset by a
$57 million
decrease
in average time deposit balances. Average borrowed funds balances
increase
d
$1.7 billion
over
2014
. Borrowings from the Federal Home Loan Banks increased $3.0 billion, partially offset by decreased funds purchased, repurchase agreements and subordinated debt balances.
Table
2
–
Volume/Rate Analysis
(In thousands)
|
Year Ended
|
Year Ended
|
|||||||||||||||||||||||
|
December 31, 2016 / 2015
|
December 31, 2015 / 2014
|
|||||||||||||||||||||||
|
|
|
Change Due To
1
|
|
Change Due To
1
|
||||||||||||||||||||
|
Change
|
Volume
|
Yield /
Rate
|
Change
|
Volume
|
Yield
/Rate
|
|||||||||||||||||||
|
Tax-equivalent interest revenue:
|
|
|
|
|
|
|
||||||||||||||||||
|
Interest-bearing cash and cash equivalents
|
$
|
5,146
|
|
$
|
(58
|
)
|
$
|
5,204
|
|
$
|
2,831
|
|
$
|
2,331
|
|
$
|
500
|
|
||||||
|
Trading securities
|
6,158
|
|
4,318
|
|
1,840
|
|
535
|
|
625
|
|
(90
|
)
|
||||||||||||
|
Investment securities:
|
||||||||||||||||||||||||
|
Taxable securities
|
(664
|
)
|
(528
|
)
|
(136
|
)
|
(251
|
)
|
172
|
|
(423
|
)
|
||||||||||||
|
Tax-exempt securities
|
1,596
|
|
(961
|
)
|
2,557
|
|
(814
|
)
|
(579
|
)
|
(235
|
)
|
||||||||||||
|
Total investment securities
|
932
|
|
(1,489
|
)
|
2,421
|
|
(1,065
|
)
|
(407
|
)
|
(658
|
)
|
||||||||||||
|
Available for sale securities:
|
||||||||||||||||||||||||
|
Taxable securities
|
690
|
|
(2,617
|
)
|
3,307
|
|
(10,341
|
)
|
(13,401
|
)
|
3,060
|
|
||||||||||||
|
Tax-exempt securities
|
12
|
|
(655
|
)
|
667
|
|
20
|
|
(417
|
)
|
437
|
|
||||||||||||
|
Total available for sale securities
|
702
|
|
(3,272
|
)
|
3,974
|
|
(10,321
|
)
|
(13,818
|
)
|
3,497
|
|
||||||||||||
|
Fair value option securities
|
(2,541
|
)
|
(1,290
|
)
|
(1,251
|
)
|
5,653
|
|
5,025
|
|
628
|
|
||||||||||||
|
Restricted equity securities
|
3,706
|
|
5,490
|
|
(1,784
|
)
|
6,492
|
|
5,659
|
|
833
|
|
||||||||||||
|
Residential mortgage loans held for sale
|
(944
|
)
|
(416
|
)
|
(528
|
)
|
3,459
|
|
4,540
|
|
(1,081
|
)
|
||||||||||||
|
Loans
|
54,274
|
|
46,549
|
|
7,725
|
|
28,510
|
|
61,236
|
|
(32,726
|
)
|
||||||||||||
|
Total tax-equivalent interest revenue
|
67,433
|
|
49,832
|
|
17,601
|
|
36,094
|
|
65,191
|
|
(29,097
|
)
|
||||||||||||
|
Interest expense:
|
||||||||||||||||||||||||
|
Transaction deposits
|
5,085
|
|
(16
|
)
|
5,101
|
|
(936
|
)
|
110
|
|
(1,046
|
)
|
||||||||||||
|
Savings deposits
|
3
|
|
39
|
|
(36
|
)
|
(18
|
)
|
45
|
|
(63
|
)
|
||||||||||||
|
Time deposits
|
(8,764
|
)
|
(4,139
|
)
|
(4,625
|
)
|
(5,559
|
)
|
(839
|
)
|
(4,720
|
)
|
||||||||||||
|
Funds purchased
|
121
|
|
13
|
|
108
|
|
(276
|
)
|
(336
|
)
|
60
|
|
||||||||||||
|
Repurchase agreements
|
(34
|
)
|
(52
|
)
|
18
|
|
(301
|
)
|
(106
|
)
|
(195
|
)
|
||||||||||||
|
Other borrowings
|
21,045
|
|
8,239
|
|
12,806
|
|
7,109
|
|
7,744
|
|
(635
|
)
|
||||||||||||
|
Subordinated debentures
|
959
|
|
(1,445
|
)
|
2,404
|
|
(3,590
|
)
|
(1,537
|
)
|
(2,053
|
)
|
||||||||||||
|
Total interest expense
|
18,415
|
|
2,639
|
|
15,776
|
|
(3,571
|
)
|
5,081
|
|
(8,652
|
)
|
||||||||||||
|
Tax-equivalent net interest revenue
|
49,018
|
|
47,193
|
|
1,825
|
|
39,665
|
|
60,110
|
|
(20,445
|
)
|
||||||||||||
|
Change in tax-equivalent adjustment
|
5,144
|
|
1,505
|
|
||||||||||||||||||||
|
Net interest revenue
|
$
|
43,874
|
|
$
|
38,160
|
|
||||||||||||||||||
1
Changes attributable to both volume and yield/rate are allocated to both volume and yield/rate on an equal basis.
29
Table
2
–
Volume/Rate Analysis
(continued)
(In thousands)
|
Three Months Ended
|
||||||||||||
|
December 31, 2016 / 2015
|
||||||||||||
|
|
|
Change Due To
1
|
||||||||||
|
Change
|
Volume
|
Yield /
Rate
|
||||||||||
|
Tax-equivalent interest revenue:
|
|
|
|
|||||||||
|
Interest-bearing cash and cash equivalents
|
$
|
1,334
|
|
$
|
28
|
|
$
|
1,306
|
|
|||
|
Trading securities
|
3,714
|
|
2,957
|
|
757
|
|
||||||
|
Investment securities:
|
||||||||||||
|
Taxable securities
|
(120
|
)
|
(110
|
)
|
(10
|
)
|
||||||
|
Tax-exempt securities
|
441
|
|
(247
|
)
|
688
|
|
||||||
|
Total investment securities
|
321
|
|
(357
|
)
|
678
|
|
||||||
|
Available for sale securities:
|
||||||||||||
|
Taxable securities
|
(1,167
|
)
|
(224
|
)
|
(943
|
)
|
||||||
|
Tax-exempt securities
|
(38
|
)
|
(211
|
)
|
173
|
|
||||||
|
Total available for sale securities
|
(1,205
|
)
|
(435
|
)
|
(770
|
)
|
||||||
|
Fair value option securities
|
(1,920
|
)
|
(848
|
)
|
(1,072
|
)
|
||||||
|
Restricted equity securities
|
649
|
|
1,054
|
|
(405
|
)
|
||||||
|
Residential mortgage loans held for sale
|
(133
|
)
|
310
|
|
(443
|
)
|
||||||
|
Loans
|
17,362
|
|
11,401
|
|
5,961
|
|
||||||
|
Total tax-equivalent interest revenue
|
20,122
|
|
14,110
|
|
6,012
|
|
||||||
|
Interest expense:
|
||||||||||||
|
Transaction deposits
|
1,814
|
|
120
|
|
1,694
|
|
||||||
|
Savings deposits
|
2
|
|
5
|
|
(3
|
)
|
||||||
|
Time deposits
|
(1,741
|
)
|
(918
|
)
|
(823
|
)
|
||||||
|
Funds purchased
|
23
|
|
(6
|
)
|
29
|
|
||||||
|
Repurchase agreements
|
(34
|
)
|
(4
|
)
|
(30
|
)
|
||||||
|
Other borrowings
|
4,595
|
|
1,397
|
|
3,198
|
|
||||||
|
Subordinated debentures
|
1,359
|
|
(682
|
)
|
2,041
|
|
||||||
|
Total interest expense
|
6,018
|
|
(88
|
)
|
6,106
|
|
||||||
|
Tax-equivalent net interest revenue
|
14,104
|
|
14,198
|
|
(94
|
)
|
||||||
|
Change in tax-equivalent adjustment
|
1,167
|
|
||||||||||
|
Net interest revenue
|
$
|
12,937
|
|
|||||||||
1
Changes attributable to both volume and yield/rate are allocated to both volume and yield/rate on an equal basis.
30
Other Operating Revenue
Other operating revenue was
$674.0 million
for
2016
,
up
$15.5 million
or
2%
over
2015
. Fees and commissions revenue grew by
$36.1 million
or
6%
over
2015
. The change in the fair value of mortgage servicing rights, net of economic hedges, decreased other operating revenue by
$28.4 million
in
2016
and
$7.9 million
in
2015
.
Table
3
–
Other Operating Revenue
(In thousands)
|
|
Year Ended December 31,
|
||||||||||||||||||
|
|
2016
|
2015
|
2014
|
2013
|
2012
|
||||||||||||||
|
Brokerage and trading revenue
|
$
|
138,377
|
|
$
|
129,556
|
|
$
|
134,437
|
|
$
|
125,478
|
|
$
|
126,930
|
|
||||
|
Transaction card revenue
|
135,758
|
|
128,621
|
|
123,689
|
|
116,823
|
|
107,985
|
|
|||||||||
|
Fiduciary and asset management revenue
|
135,477
|
|
126,153
|
|
115,652
|
|
96,082
|
|
80,053
|
|
|||||||||
|
Deposit service charges and fees
|
92,193
|
|
90,431
|
|
90,911
|
|
95,110
|
|
98,917
|
|
|||||||||
|
Mortgage banking revenue
|
133,914
|
|
126,002
|
|
109,093
|
|
121,934
|
|
169,302
|
|
|||||||||
|
Other revenue
|
51,029
|
|
49,883
|
|
47,537
|
|
48,417
|
|
45,693
|
|
|||||||||
|
Total fees and commissions revenue
|
686,748
|
|
|
650,646
|
|
621,319
|
|
603,844
|
|
628,880
|
|
||||||||
|
Other gains, net
|
4,030
|
|
5,702
|
|
2,953
|
|
4,875
|
|
2,397
|
|
|||||||||
|
Gain (loss) on derivatives, net
|
(15,685
|
)
|
430
|
|
2,776
|
|
(4,367
|
)
|
(301
|
)
|
|||||||||
|
Gain (loss) on fair value option securities, net
|
(10,555
|
)
|
(3,684
|
)
|
10,189
|
|
(15,212
|
)
|
9,230
|
|
|||||||||
|
Change in fair value of mortgage servicing rights
|
(2,193
|
)
|
(4,853
|
)
|
(16,445
|
)
|
22,720
|
|
(9,210
|
)
|
|||||||||
|
Gain on available for sale securities, net
|
11,675
|
|
12,058
|
|
1,539
|
|
10,720
|
|
33,845
|
|
|||||||||
|
Total other-than-temporary impairment
|
—
|
|
(2,443
|
)
|
(373
|
)
|
(2,574
|
)
|
(1,144
|
)
|
|||||||||
|
Portion of loss recognized in (reclassified from) other comprehensive income
|
—
|
|
624
|
|
—
|
|
266
|
|
(6,207
|
)
|
|||||||||
|
Net impairment losses recognized in earnings
|
—
|
|
(1,819
|
)
|
(373
|
)
|
(2,308
|
)
|
(7,351
|
)
|
|||||||||
|
Total other operating revenue
|
$
|
674,020
|
|
$
|
658,480
|
|
$
|
621,958
|
|
$
|
620,272
|
|
$
|
657,490
|
|
||||
Fees and commissions revenue
Diversified sources of fees and commissions revenue are a significant part of our business strategy and represented
48%
of total revenue for
2016
, excluding provision for credit losses and gains and losses on asset sales, securities and derivatives and the change in the fair value of mortgage servicing rights. We believe that a variety of fee revenue sources provide an offset to changes in interest rates, values in the equity markets, commodity prices and consumer spending, all of which can be volatile. As an example of this strength, many of the economic factors that cause net interest revenue compression such as falling interest rates may also drive growth in our mortgage banking revenue. We expect growth in other operating revenue to come through offering new products and services and by further development of our presence in other markets. However, current and future economic conditions, regulatory constraints, increased competition and saturation in our existing markets could affect the rate of future increases.
Brokerage and trading revenue, which includes revenues from trading, customer hedging, retail brokerage and investment banking,
increase
d
$8.8 million
or
7%
over the prior year.
Trading revenue includes net realized and unrealized gains primarily related to sales of U.S. government securities, residential mortgage-backed securities guaranteed by U.S. government agencies and municipal securities to institutional customers and related derivative instruments. Trading revenue totaled
$43.0 million
for
2016
, compared to
$44.7 million
for
2015
. Trading revenue was negatively impacted by an unexpected 85 basis point increase in the 10-year U.S. Treasury rate primarily due to the market's reaction to the outcome of the presidential election. This increase in interest rates decreased the fair value of our trading securities portfolio by approximately $5.0 million. Excluding this estimated impact, trading revenue was up
$3.3 million
or
7%
over the prior year.
31
The Company added a new group trading in U.S. government agency residential mortgage-backed securities and related to-be-announced derivatives in the third quarter of 2016. This new trading group added $6.6 million of net interest revenue and $2.3 million of trading revenue in the latter half of 2016, excluding the impact of the unexpected increase in long-term interest rates. This new group also increased our trading securities portfolio by $300 million and receivables for unsettled trades by $405 million at December 31, 2016.
Customer hedging revenue is based primarily on realized and unrealized changes in the fair value of derivative contracts held for customer risk management programs. As more fully discussed under Customer Derivative Programs in Note
3
of the Consolidated Financial Statements, we offer commodity, interest rate, foreign exchange and equity derivatives to our customers. Derivative contracts executed with customers are offset with contracts between selected counterparties and exchanges to minimize market risk from changes in commodity prices, interest rates or foreign exchange rates. Customer hedging revenue totaled
$47.2 million
for
2016
, an
increase
of
$6.3 million
or
15%
over
2015
. The volume of derivative contracts sold to our mortgage banking customers used to hedge their pipelines of mortgage loan originations increased as average mortgage rates trended down during 2016. Volumes of derivative contracts sold to energy customers increased as energy prices stabilized during 2016 and volumes of interest rate contracts increased in anticipation of rising interest rates.
Revenue earned from retail brokerage transactions totaled
$26.0 million
for
2016
, an
increase
of
$1.5 million
or
6%
over the the prior year. Retail brokerage revenue is primarily based on fees and commissions earned on sales of fixed income securities, annuities, mutual funds and other financial instruments to retail customers. Revenue is primarily based on the volume of customer transactions and applicable commission rate for each type of product. The increase in revenue due to transaction volume growth was partially offset by a change in product mix to products that pay a lower commission rate. In addition, volume shifted from sales of products that pay us a one-time transaction fee to accounts that pay us an on-going management fee.
Investment banking, which includes fees earned upon completion of underwriting, financial advisory services and loan syndication fees totaled
$22.2 million
for
2016
, an
increase
of
$2.7 million
or
14%
over
2015
, related to the timing and volume of completed transactions.
Transaction card revenue depends largely on the volume and amount of transactions processed, the number of TransFund automated teller machine (“ATM”) locations and the number of merchants served. Transaction card revenue totaled
$135.8 million
for
2016
, a
$7.1 million
or
6%
increase
over
2015
. Revenues from the processing of transactions on behalf of the members of our TransFund electronic funds transfer ("EFT") network totaled
$70.6 million
,
up
$5.4 million
or
8%
over
2015
, due primarily to increased transaction volumes. The number of TransFund ATM locations totaled
2,021
at
December 31, 2016
compared to
1,972
at
December 31, 2015
. Merchant services fees paid by customers for account management and electronic processing of card transactions totaled
$45.9 million
, an
increase
of
$1.5 million
or
3%
over the prior year. The increase was primarily due to higher transaction processing volume throughout our geographical footprint. Revenue from interchange fees paid by merchants for transactions processed from debit cards issued by the Company totaled
$19.3 million
, an
increase
of
$265 thousand
or
1%
over
2015
due to increased transaction volume.
Fiduciary and asset management revenue grew
$9.3 million
or
7%
over
2015
, primarily due to decreased fee waivers and growth in assets under management. We earn fees as administrator to and investment adviser for the Cavanal Hill Funds, a diversified, open-ended investment company established as a business trust under the Investment Company Act of 1940 (the "1940 Act"). BOKF, NA is custodian and BOK Financial Securities, Inc. is distributor for the Cavanal Hill Funds. Products of the Cavanal Hill Funds are offered to customers, employee benefit plans, trusts and the general public in the ordinary course of business. We have voluntarily waived administration fees on the Cavanal Hill money market funds in order to maintain positive yields on these funds in the current low short-term interest rate environment. Waived fees totaled
$6.8 million
for
2016
compared to
$12.5 million
for
2015
. The decrease in fee waivers was primarily related to increased interest rates as a result of the Federal Reserve's federal funds rate increase in the fourth quarter of 2015. The remaining increase in fiduciary and asset management revenue was largely due to growth in assets under management from the acquisition of Weaver and Tidwell Financial Advisors LTD dba Weaver Wealth Management, a registered investment advisor, in the first quarter of 2016.
The fair value of fiduciary assets administered by the Company totaled
$41.8 billion
at
December 31, 2016
and
$38.3 billion
at
December 31, 2015
. Fiduciary assets are assets for which the Company possesses investment discretion on behalf of another, or any other similar capacity.
Deposit service charges and fees
increase
d
$1.8 million
or
2%
over
2015
. Commercial account service charge revenue totaled
$44.9 million
, an
increase
of
$2.9 million
or
7%
over the prior year. Overdraft fees totaled
$40.5 million
for
2016
, a
decrease
of
$774 thousand
or
2%
compared to last year. Service charges on deposit accounts with a standard monthly fee were
$6.7 million
, a
decrease
of
$334 thousand
or
5%
compared to the prior year.
32
Mortgage banking revenue totaled
$133.9 million
for
2016
, a
$7.9 million
or
6%
increase
over
2015
.
Mortgage production revenue totaled
$69.6 million
, largely unchanged compared to the prior year. A
$512 million
or
8%
decrease
in mortgage loan production volume from the record level achieved in 2015 was largely offset by improved gain on sale margins. The decrease in mortgage loan production volume was due primarily to a strategic decision to exit the corresponding lending channel during the third quarter of 2016 based on careful consideration of continued pressure on margin due to the competitive landscape and regulatory costs.
Gain on sale margins increased 9 basis points compared to the previous year. The margin increase was primarily due to exiting the correspondent lending channel, the lowest margin of our three sales channels.
Mortgage servicing revenue was
$64.3 million
, a
$7.9 million
or
14%
increase
over the prior year. The outstanding principal balance of mortgage loans serviced for others totaled
$22.0 billion
at
December 31, 2016
, a
$2.3 billion
increase
over
December 31, 2015
.
Table
4
–
Mortgage Banking Revenue
(In thousands)
|
|
Year Ended December 31,
|
||||||||||||||||||
|
|
2016
|
2015
|
2014
|
2013
|
2012
|
||||||||||||||
|
Mortgage production revenue
|
$
|
69,628
|
|
$
|
69,587
|
|
$
|
61,061
|
|
$
|
79,545
|
|
$
|
129,117
|
|
||||
|
Mortgage loans funded for sale
|
$
|
6,117,417
|
|
$
|
6,372,956
|
|
$
|
4,484,394
|
|
$
|
4,081,390
|
|
$
|
3,708,350
|
|
||||
|
Add: Current year end outstanding commitments
|
318,359
|
|
601,147
|
|
627,505
|
|
258,873
|
|
356,634
|
|
|||||||||
|
Less: Prior year end outstanding commitments
|
601,147
|
|
627,505
|
|
258,873
|
|
356,634
|
|
189,770
|
|
|||||||||
|
Total mortgage production volume
|
5,834,629
|
|
6,346,598
|
|
4,853,026
|
|
3,983,629
|
|
3,875,214
|
|
|||||||||
|
Gain on sale margin
|
1.19
|
%
|
1.10
|
%
|
1.26
|
%
|
2.00
|
%
|
3.33
|
%
|
|||||||||
|
Primary mortgage interest rates:
|
|||||||||||||||||||
|
Average
|
3.83
|
%
|
3.89
|
%
|
4.17
|
%
|
3.99
|
%
|
3.66
|
%
|
|||||||||
|
Period end
|
4.32
|
%
|
3.96
|
%
|
3.83
|
%
|
4.48
|
%
|
3.35
|
%
|
|||||||||
|
Mortgage servicing revenue
|
$
|
64,286
|
|
$
|
56,415
|
|
$
|
48,032
|
|
$
|
42,389
|
|
$
|
40,185
|
|
||||
|
Average outstanding principal balance of mortgage loans serviced for others
|
20,837,897
|
|
17,920,557
|
|
14,940,915
|
|
12,850,283
|
|
11,641,305
|
|
|||||||||
|
Average mortgage servicing fee rates
|
0.31
|
%
|
0.31
|
%
|
0.32
|
%
|
0.33
|
%
|
0.35
|
%
|
|||||||||
Primary rates disclosed in Table
4
above represent rates generally available to borrowers on 30 year conforming mortgage loans.
Net gains on securities, derivatives and other assets
We recognized
$11.7 million
of net gains from sales of
$0.9 billion
of available for sale securities in
2016
. We recognized
$12.1 million
of net gains from sales of
$1.6 billion
of available for sale securities in
2015
. Securities were sold either because they had reached their expected maximum potential or to move into securities that are expected to perform better in the current rate environment.
As discussed in the Market Risk section of this report, the fair value of our portfolio of mortgage servicing rights ("MSRs")changes in response to changes in primary mortgage loan rates and other assumptions. We attempt to mitigate the earnings volatility caused by changes in the fair value of MSRs within Board-approved limits by designating certain financial instruments as an economic hedge. Changes in the fair value of these instruments generally are expected to partially offset changes in the fair value of the MSRs.
33
Since mid-year 2016, the economic hedge was largely positioned to offset the impact of a 50 basis point decrease in primary mortgage interest rates and related interest rates, including 10-year U.S. Treasury rates. During the fourth quarter, the 10-year U.S. Treasury interest rate increased 85 basis points primarily due to the market's reaction to the outcome of the U.S. presidential election. This unexpected increase in rates resulted in a
$39.8 million
increase in the fair value of our MSRs, offset by a
$56.8 million
loss on our economic hedges.
Table
5
–
Gain (Loss) on Mortgage Servicing Rights, Net of Economic Hedge
(In thousands)
|
|
Year Ended December 31,
|
||||||||||||||||||
|
|
2016
|
2015
|
2014
|
2013
|
2012
|
||||||||||||||
|
Gain (loss) on mortgage hedge derivative contracts, net
|
$
|
(15,696
|
)
|
$
|
634
|
|
$
|
2,776
|
|
$
|
(5,080
|
)
|
$
|
116
|
|
||||
|
Gain (loss) on fair value option securities, net
|
(10,555
|
)
|
(3,684
|
)
|
10,003
|
|
(15,436
|
)
|
7,793
|
|
|||||||||
|
Gain (loss) on economic hedge of mortgage servicing rights
|
(26,251
|
)
|
(3,050
|
)
|
12,779
|
|
(20,516
|
)
|
7,909
|
|
|||||||||
|
Gain (loss) on change in fair value of mortgage servicing rights
|
(2,193
|
)
|
(4,853
|
)
|
(16,445
|
)
|
22,720
|
|
(9,210
|
)
|
|||||||||
|
Gain (loss) on changes in fair value of mortgage servicing rights, net of economic hedges included in other operating revenue
|
(28,444
|
)
|
(7,903
|
)
|
(3,666
|
)
|
2,204
|
|
(1,301
|
)
|
|||||||||
|
Net interest revenue on fair value option securities
1
|
4,356
|
|
8,001
|
|
3,253
|
|
3,290
|
|
7,811
|
|
|||||||||
|
Total economic benefit (cost) of changes in the fair value of mortgage servicing rights, net of economic hedges
|
$
|
(24,088
|
)
|
$
|
98
|
|
$
|
(413
|
)
|
$
|
5,494
|
|
$
|
6,510
|
|
||||
|
1
|
Actual interest earned on fair value option securities less internal transfer-priced cost of funds.
|
Net gains on other assets totaled
$4.0 million
for
2016
. The Company recognized $2.0 million related to the mutual termination of a rent guarantee between the Company and the City of Tulsa for office space in a building immediately adjacent to the Company's main office rented by third party tenants. The Company also recognized a $2.1 million gain on the sale of a merchant banking investment during the year. Net gains on other assets totaled $5.7 million for
2015
. The Company recognized a $1.7 million gain on the sale of bank premises and a $2.8 million gain on underlying investments held by two consolidated private equity funds. Private equity gains are largely attributed to non-controlling interests.
Fourth Quarter
2016
Other Operating Revenue
Other operating revenue was
$143.8 million
for the
fourth quarter of 2016
, a
decrease
of
$15.2 million
compared to the
fourth quarter of 2015
. The fourth quarter of 2016 included a
$5.0 million
decrease in the net fair value of trading portfolio positions and a
$17.0 million
decrease in the fair value of mortgage servicing rights, net of economic hedges. The change in the fair value of mortgage servicing rights, net of economic hedges, increased other operating revenue
$2.6 million
for the
fourth quarter of 2015
.
Fees and commissions revenue was up
$8.3 million
over the
fourth quarter of 2015
. Excluding the estimated impact of the unexpected increase in long-term interest rates, brokerage and trading revenue
increase
d
$3.2 million
. Trading revenue totaled
$5.7 million
for the
fourth quarter of 2016
, a
$996 thousand
decrease
. Customer hedging revenue totaled
$11.1 million
, an
increase
of
$1.4 million
. Revenue earned from retail brokerage transactions was
$5.9 million
, largely unchanged compared to the
fourth quarter of 2015
. Investment banking revenue totaled
$5.8 million
, a
$2.7 million
increase
over the
fourth quarter of 2015
related to the timing and volume of completed transactions.
Transaction card revenue was
$34.5 million
for the
fourth quarter of 2016
, a
$2.2 million
or
7%
increase
over the
fourth quarter of 2015
, primarily due to a
$1.6 million
increase in revenues from the processing of transactions on behalf of members of our TransFund EFT network. Revenues from the processing of transactions on behalf of the members of our TransFund EFT network totaled
$18.1 million
and merchant services fees totaled
$11.6 million
. Interchange fees paid by merchants for transactions processed from debit cards issued by the Company totaled
$4.8 million
.
Fiduciary and asset management revenue
increase
d
$3.4 million
over the
fourth quarter of 2015
to
$34.5 million
primarily due to a decrease in waived administrative fees and growth in assets under management, including the addition of assets from the Weaver Wealth Management acquisition in the first quarter of 2016. Waived administration fees on the Cavanal Hill money market funds totaled
$1.4 million
for the
fourth quarter of 2016
, compared to
$3.5 million
for the
fourth quarter of 2015
.
34
Deposit service charges and fees were
$23.4 million
for the
fourth quarter of 2016
, up
$552 thousand
over the
fourth quarter of 2015
. Overdraft fees totaled
$10.4 million
, largely unchanged compared to the
fourth quarter of 2015
. Commercial account service charge revenue totaled
$11.2 million
, an
increase
of
$794 thousand
. Service charges on deposit accounts with a standard monthly fee were
$1.7 million
, also largely unchanged compared to the
fourth quarter of 2015
.
Mortgage banking revenue was
$28.4 million
for the
fourth quarter of 2016
, up
$5.5 million
over the
fourth quarter of 2015
. The Company's exit of the correspondent lending channel in the third quarter of 2016 improved gain on sale margins, partially offset by a decrease in mortgage loan loan production volume. Mortgage loan production volumes were
$878 million
for the
fourth quarter of 2016
compared to
$1.2 billion
in the
fourth quarter of 2015
. Mortgage loan refinances, which have higher gains on sale margins, represented
63%
of total loans funded during the
fourth quarter of 2016
, compared to
41%
in the
fourth quarter of 2015
.
2015
Other Operating Revenue
Other operating revenue totaled
$658.5 million
for
2015
,
up
$36.5 million
or
6%
over
2014
. Fees and commissions revenue
increase
d
$29.3 million
. The change in the fair value of mortgage servicing rights, net of economic hedges, decreased operating revenue in
2015
by
$7.9 million
and decreased operating revenue
$3.7 million
in
2014
. Net gains on sales of available for sale securities were
$12.1 million
for
2015
compared to
$1.5 million
for
2014
. Other-than-temporary impairment charges recognized in earnings were
$1.4 million
more than charges recognized in
2014
.
Brokerage and trading revenue for
2015
decrease
d
$4.9 million
compared to
2014
. Decreased retail brokerage fees and lower investment banking revenue were partially offset by increased trading revenue and customer hedging revenue. Transaction card revenue grew by
$4.9 million
over
2014
primarily due to growth in merchant services and TransFund EFT transaction volumes. Fiduciary and asset management fees
increase
d
$10.5 million
related to a full year of revenue from the GTRUST Financial Corporation and MBM Advisors acquisitions in 2014 which added $4.0 million of revenue. The remaining increase was primarily due to growth in the fair value of fiduciary assets. Deposit service charges and fees
decrease
d
$480 thousand
. Increased commercial account service charges were offset by lower overdraft fees and service charges on deposit accounts with a standard monthly fee. Mortgage banking revenue grew by
$16.9 million
over
2014
. A record
$6.3 billion
of mortgage loans were produced in
2015
due to the expansion of our correspondent and HomeDirect online mortgage channel and a decrease in average primary mortgage interest rates. The correspondent and HomeDirect online lending channels have lower margins than the retail lending channel.
Net gains on other assets totaled
$5.7 million
for
2015
. We recognized a $1.7 gain on the sale of bank premises and a $2.8 million gain on underlying investments held by two consolidated private equity funds. Private equity gains are largely attributed to non-controlling interests.
35
Other Operating Expense
Other operating expense for
2016
totaled
$1.0 billion
, a
$121.4 million
or
14%
increase
over the prior year. Personnel expense
increase
d
$37.8 million
or
7%
. Non-personnel expenses
increase
d
$83.6 million
or
22%
over the prior year. Other operating expense for
2016
included
$9.1 million
of litigation and settlement expenses as discussed further in Note
14
to the consolidated financial statements,
$7.5 million
of integration costs related to the Mobank acquisition and
$5.0 million
of severance costs related to the previously announced reduction of workforce to better align expenses with expected revenue growth. These items have been excluded from the discussion following.
Table
6
–
Other Operating Expense
(In thousands)
|
Year Ended December 31,
|
|||||||||||||||||||
|
|
2016
|
2015
|
2014
|
2013
|
2012
|
||||||||||||||
|
Regular compensation
|
$
|
332,740
|
|
$
|
313,403
|
|
$
|
298,420
|
|
$
|
279,493
|
|
$
|
262,736
|
|
||||
|
Incentive compensation:
|
|||||||||||||||||||
|
Cash-based compensation
|
128,077
|
|
114,305
|
|
111,748
|
|
110,871
|
|
116,718
|
|
|||||||||
|
Share-based compensation
|
10,464
|
|
12,358
|
|
10,875
|
|
8,189
|
|
9,668
|
|
|||||||||
|
Deferred compensation
|
1,687
|
|
361
|
|
(13,692
|
)
|
32,083
|
|
27,502
|
|
|||||||||
|
Total incentive compensation
|
140,228
|
|
127,024
|
|
108,931
|
|
151,143
|
|
153,888
|
|
|||||||||
|
Employee benefits
|
80,151
|
|
74,871
|
|
69,580
|
|
74,589
|
|
74,409
|
|
|||||||||
|
Total personnel expense
|
553,119
|
|
515,298
|
|
476,931
|
|
505,225
|
|
491,033
|
|
|||||||||
|
Business promotion
|
26,582
|
|
27,851
|
|
26,649
|
|
22,598
|
|
23,338
|
|
|||||||||
|
Charitable contributions to BOKF Foundation
|
2,000
|
|
796
|
|
4,267
|
|
2,062
|
|
2,062
|
|
|||||||||
|
Professional fees and services
|
56,783
|
|
40,123
|
|
44,440
|
|
32,552
|
|
34,015
|
|
|||||||||
|
Net occupancy and equipment
|
80,024
|
|
76,016
|
|
77,232
|
|
69,773
|
|
66,726
|
|
|||||||||
|
Insurance
|
32,489
|
|
20,375
|
|
18,578
|
|
16,122
|
|
15,356
|
|
|||||||||
|
Data processing & communications
|
131,841
|
|
122,383
|
|
115,225
|
|
105,967
|
|
98,904
|
|
|||||||||
|
Printing, postage and supplies
|
15,584
|
|
13,498
|
|
13,518
|
|
13,885
|
|
14,228
|
|
|||||||||
|
Net losses & operating expenses of repossessed assets
|
3,359
|
|
1,446
|
|
6,019
|
|
5,160
|
|
20,528
|
|
|||||||||
|
Amortization of intangible assets
|
6,862
|
|
4,359
|
|
3,965
|
|
3,428
|
|
2,927
|
|
|||||||||
|
Mortgage banking costs
|
61,387
|
|
38,813
|
|
31,705
|
|
31,196
|
|
44,334
|
|
|||||||||
|
Other expense
|
47,560
|
|
35,233
|
|
28,993
|
|
32,652
|
|
26,912
|
|
|||||||||
|
Total other operating expense
|
$
|
1,017,590
|
|
$
|
896,191
|
|
$
|
847,522
|
|
$
|
840,620
|
|
$
|
840,363
|
|
||||
|
Average number of employees (full-time equivalent)
|
4,872
|
|
4,797
|
|
4,679
|
|
4,683
|
|
4,614
|
|
|||||||||
Personnel expense
Regular compensation expense, which consists of salaries and wages, overtime pay and temporary personnel costs,
increase
d
$12.8 million
or
4%
over
2015
. The average number of employees grew by
2%
over the prior year. Recent additions have been in mortgage, wealth management and technology. In addition, standard annual merit increases in regular compensation were effective for the majority of our staff March 1.
Incentive compensation
increase
d
$13.2 million
or
10%
over
2015
. Cash-based incentive compensation plans are either intended to provide current rewards to employees who generate long-term business opportunities for the Company based on growth in loans, deposits, customer relationships and other measurable metrics or intended to compensate employees with commissions on completed transactions. Total cash-based incentive compensation
increase
d
$13.8 million
or
12%
over
2015
. As discussed further in Management's Discussion and Analysis – Lines of Business following, growth in incentive compensation expense was primarily related to revenue growth in the Wealth Management segment during the year.
Share-based compensation expense represents expense for equity awards based on the grant-date fair value. Share-based compensation expense for equity awards
decrease
d
$1.9 million
or
15%
over
2015
primarily due to the decrease in the vesting probability of certain performance-based share awards.
36
The Company currently offers a deferred compensation plan for certain executive and senior officers. Deferred compensation expense totaled
$1.7 million
for
2016
, a
$1.3 million
increase
over the prior year. Deferred compensation expense is largely offset by changes in the fair value of assets held in rabbi trusts for the benefit of participants included other income in the consolidated statements of earnings.
Employee benefit expense
increase
d
$5.3 million
or
7%
compared to
2015
primarily due to
increase
d employee medical costs. The Company self-insures a portion of its employee health care coverage, up to a stop-loss of $750 thousand per employee, and these costs may be volatile.
Non-personnel operating expense
Non-personnel expense
increase
d
$68.5 million
or
18%
over the prior year.
Mortgage banking expense
increase
d
$22.6 million
or
58%
. Mortgage banking expense
increase
d
$12.7 million
due to the effect of actual residential mortgage loan prepayments on the fair value of mortgage servicing rights. As mortgage interest rates fall, actual prepayments increase due to borrowers refinancing loans. As mortgage interest rates increase, actual prepayment speeds slow. Mortgage banking expenses also increased
$8.1 million
over the prior year primarily due to default servicing and loss mitigation costs related to loans serviced for others.
Insurance expense was up
$12.1 million
or
59%
, primarily due to higher deposit insurance expense related to increased criticized and classified asset levels, an input to the deposit insurance assessment, overall growth in bank assets and a new surcharge for banks with more than $10 billion in assets, that was effective in the third quarter of 2016. Criticized and classified asset levels were elevated during the year primarily due to credit migration of energy loans as a result of low energy prices.
Professional fees and services expense
increase
d
$10.9 million
or
27%
, data processing and communications expense
increase
d
$9.5 million
or
8%
and premises and equipment expense
increase
d
$4.0 million
or
5%
. These increases were primarily related to continued upgrades of our information technology infrastructure and cybersecurity.
All other non-personnel operating expenses were up $9.6 million, net.
Fourth Quarter
2016
Operating Expenses
Other operating expense for the
fourth quarter of 2016
totaled
$265.5 million
. Excluding the impact of
$5.0 million
of severance and other expenses related to the workforce reductions and
$4.7 million
of integration costs related to the Mobank acquisition in the fourth quarter of 2016, other operating expense
increase
d
$25.4 million
over the
fourth quarter of 2015
.
Excluding the impact of the workforce reduction and Mobank integration costs, personnel expense
increase
d
$3.5 million
over the
fourth quarter of 2015
. Regular compensation expense
increase
d
$1.1 million
over the
fourth quarter of 2015
. Incentive compensation
increase
d
$2.8 million
over the
fourth quarter of 2015
. Cash-based compensation was up
$4.5 million
, partially offset by a
$1.4 million
decrease
in share-based compensation expense.
Excluding the impact of Mobank integration costs, non-personnel expense was up
$21.9 million
over the
fourth quarter of 2015
. Mortgage banking costs were up
$5.9 million
primarily due to the effect of actual residential mortgage loan prepayments on the fair value of mortgage servicing rights. Insurance expense
increase
d
$3.3 million
primarily due to a new surcharge for banks over $10 billion effective in the third quarter of 2016. Professional fees and services expense increased $3.1 million and data processing and communications costs were up
$2.4 million
, primarily related to information technology infrastructure and cybersecurity project costs. Occupancy and equipment expense
increase
d
$2.1 million
primarily due to property lease termination costs and software costs. We also made a
$2.0 million
cash contribution to the BOKF Foundation during the
fourth quarter of 2016
. All other expense categories were up $3.1 on a net basis.
37
2015
Operating Expenses
Other operating expense totaled
$896.2 million
for
2015
, a
$48.7 million
or
6%
increase
over
2014
.
Personnel expense for 2014 included a
$12.6 million
net reduction in the accrual for amounts payable to certain executive officers under the 2011 True-Up Plan. Approved by shareholders on April 26, 2011, the True-Up Plan was designed to adjust annual and long-term performance-based incentive compensation for certain senior executives for 2006 through 2013. The 2011 True-Up Plan ended on December 31, 2013 and amounts accrued were paid in May 2014. Excluding the impact of the 2011 True-Up Plan adjustment, personnel expense
increase
d
$25.7 million
or
5%
. Regular compensation expense totaled
$313.4 million
,
up
$15.0 million
primarily due to the investment in higher-costing wealth management, compliance and risk management positions. Regular compensation expense for 2014 also included $800 thousand related to retail branch closure costs. Excluding the impact of the 2011 True-Up plan adjustment in 2014, incentive compensation expense
increase
d
$5.5 million
, primarily due to cash-based incentive compensation. Employee benefit expense
increase
d
$5.3 million
primarily due to employee medical costs.
Non-personnel expense for
2015
was
$10.3 million
or
3%
higher than
2014
. Mortgage banking expense
increase
d
$7.1 million
primarily due to changes in the fair value of mortgage servicing rights related to actual mortgage loan prepayments. Data processing and communications expense increased
$7.2 million
primarily related to increased transaction activity costs and completion of risk management and compliance projects. Professional fees and services expense
decrease
d
$4.3 million
after risk management and regulatory compliance costs stabilized after growing in 2014. Net losses and operating expenses of repossessed assets
decrease
d
$4.6 million
. All other non-personnel operating expenses were up $4.9 million, net.
Income Taxes
Income tax expense was
$106.4 million
or
31.4%
of net income before taxes for
2016
,
$139.4 million
or
32.3%
of net income before taxes for
2015
and
$144.2 million
or
32.8%
of net income before taxes for
2014
. Tax expense currently payable totaled
$118 million
in
2016
,
$130 million
in
2015
and
$105 million
in
2014
.
The statute of limitations expired on uncertain tax positions during
2014
,
2015
, and
2016
. Excluding the statute expiration, income tax expense would have been $108.3 million or 32.0% of net income before taxes for
2016
, $140.9 million or 32.6% of net income before taxes for
2015
and $145.8 million or 33.2% of net income before taxes for
2014
.
Net deferred tax assets totaled
$29.3 million
at
December 31, 2016
compared to a net deferred tax liability of
$1.4 million
at
December 31, 2015
. We have evaluated the recoverability of our deferred tax assets based on taxes previously paid in net loss carry-back periods and other factors and determined that no valuation allowance was required in
2016
and
2015
.
Unrecognized tax benefits totaled
$15.8 million
at
December 31, 2016
compared to
$13.2 million
at
December 31, 2015
. BOK Financial operates in numerous jurisdictions, which requires judgment regarding the allocation of income, expense, and earnings under various laws and regulations of each of these taxing jurisdictions. Each jurisdiction may audit our tax returns and may take different positions with respect to these allocations.
Income tax expense was
$22.5 million
or
31.1%
of net income before taxes for the
fourth quarter of 2016
compared to
$26.2 million
or
30.1%
of net income before taxes for the
fourth quarter of 2015
. Income tax expense as a percentage of net income before taxes was higher in the
fourth quarter of 2016
primarily due to an increase in unrecognized tax benefits related to an income allocation change between taxing jurisdictions.
38
Table
7
–
Selected Quarterly Financial Data (Unaudited)
(In thousands, except per share data)
|
2016
|
|||||||||||||||
|
|
First
|
Second
|
Third
|
Fourth
|
|||||||||||
|
Interest revenue
|
$
|
201,796
|
|
$
|
202,267
|
|
$
|
209,317
|
|
$
|
215,737
|
|
|||
|
Interest expense
|
19,224
|
|
19,655
|
|
21,471
|
|
21,539
|
|
|||||||
|
Net interest revenue
|
182,572
|
|
182,612
|
|
187,846
|
|
194,198
|
|
|||||||
|
Provision for credit losses
|
35,000
|
|
20,000
|
|
10,000
|
|
—
|
|
|||||||
|
Net interest revenue after provision for credit losses
|
147,572
|
|
162,612
|
|
177,846
|
|
194,198
|
|
|||||||
|
Fees and commissions revenue
|
163,297
|
|
180,147
|
|
181,276
|
|
162,028
|
|
|||||||
|
Gain (loss) on financial instruments and other assets, net
|
22,105
|
|
21,678
|
|
3,707
|
|
(58,025
|
)
|
|||||||
|
Change in fair value of mortgage servicing rights
|
(27,988
|
)
|
(16,283
|
)
|
2,327
|
|
39,751
|
|
|||||||
|
Other-than-temporary impairment losses
|
—
|
|
—
|
|
—
|
|
—
|
|
|||||||
|
Other operating revenue
|
157,414
|
|
185,542
|
|
187,310
|
|
143,754
|
|
|||||||
|
Personnel expense
|
133,562
|
|
139,213
|
|
139,212
|
|
141,132
|
|
|||||||
|
Other non-personnel expense
|
109,008
|
|
112,172
|
|
118,876
|
|
124,415
|
|
|||||||
|
Total other operating expense
|
242,570
|
|
251,385
|
|
258,088
|
|
265,547
|
|
|||||||
|
Net income before taxes
|
62,416
|
|
96,769
|
|
107,068
|
|
72,405
|
|
|||||||
|
Federal and state income taxes
|
21,428
|
|
30,497
|
|
31,956
|
|
22,496
|
|
|||||||
|
Net income
|
40,988
|
|
66,272
|
|
75,112
|
|
49,909
|
|
|||||||
|
Net income (loss) attributable to non-controlling interests
|
(1,576
|
)
|
471
|
|
835
|
|
(117
|
)
|
|||||||
|
Net income attributable to shareholders of BOK Financial Corp. shareholders
|
$
|
42,564
|
|
$
|
65,801
|
|
$
|
74,277
|
|
$
|
50,026
|
|
|||
|
Earnings per share:
|
|||||||||||||||
|
Basic
|
$
|
0.64
|
|
$
|
1.00
|
|
$
|
1.13
|
|
$
|
0.76
|
|
|||
|
Diluted
|
$
|
0.64
|
|
$
|
1.00
|
|
$
|
1.13
|
|
$
|
0.76
|
|
|||
|
Average shares:
|
|||||||||||||||
|
Basic
|
65,297
|
|
65,246
|
|
65,085
|
|
64,719
|
|
|||||||
|
Diluted
|
65,331
|
|
65,303
|
|
65,158
|
|
64,788
|
|
|||||||
39
Table
7
–
Selected Quarterly Financial Data (Unaudited)
(continued)
(In thousands, except per share data)
|
2015
|
|||||||||||||||
|
|
First
|
Second
|
Third
|
Fourth
|
|||||||||||
|
Interest revenue
|
$
|
184,569
|
|
$
|
191,813
|
|
$
|
193,664
|
|
$
|
196,782
|
|
|||
|
Interest expense
|
16,843
|
|
16,082
|
|
15,028
|
|
15,521
|
|
|||||||
|
Net interest revenue
|
167,726
|
|
175,731
|
|
178,636
|
|
181,261
|
|
|||||||
|
Provision for credit losses
|
—
|
|
4,000
|
|
7,500
|
|
22,500
|
|
|||||||
|
Net interest revenue after provision for credit losses
|
167,726
|
|
171,731
|
|
171,136
|
|
158,761
|
|
|||||||
|
Fees and commissions revenue
|
163,696
|
|
170,295
|
|
162,963
|
|
153,692
|
|
|||||||
|
Gain (loss) on financial instruments and other assets, net
|
8,640
|
|
(4,272
|
)
|
10,536
|
|
(398
|
)
|
|||||||
|
Change in fair value of mortgage servicing rights
|
(8,522
|
)
|
8,010
|
|
(11,757
|
)
|
7,416
|
|
|||||||
|
Other-than-temporary impairment losses
|
(92
|
)
|
—
|
|
—
|
|
(1,727
|
)
|
|||||||
|
Other operating revenue
|
163,722
|
|
174,033
|
|
161,742
|
|
158,983
|
|
|||||||
|
Personnel expense
|
126,303
|
|
130,493
|
|
127,399
|
|
131,104
|
|
|||||||
|
Other non-personnel expense
|
91,667
|
|
94,368
|
|
95,535
|
|
99,322
|
|
|||||||
|
Total other operating expense
|
217,970
|
|
224,861
|
|
222,934
|
|
230,426
|
|
|||||||
|
Net income before taxes
|
113,478
|
|
120,903
|
|
109,944
|
|
87,318
|
|
|||||||
|
Federal and state income taxes
|
38,384
|
|
40,630
|
|
34,128
|
|
26,242
|
|
|||||||
|
Net income
|
$
|
75,094
|
|
$
|
80,273
|
|
$
|
75,816
|
|
$
|
61,076
|
|
|||
|
Net income attributable to non-controlling interests
|
251
|
|
1,043
|
|
925
|
|
1,475
|
|
|||||||
|
Net income attributable to shareholders of BOK Financial Corp. shareholders
|
$
|
74,843
|
|
$
|
79,230
|
|
74,891
|
|
59,601
|
|
|||||
|
Earnings per share:
|
|||||||||||||||
|
Basic
|
$
|
1.08
|
|
$
|
1.15
|
|
$
|
1.09
|
|
$
|
0.89
|
|
|||
|
Diluted
|
$
|
1.08
|
|
$
|
1.15
|
|
$
|
1.09
|
|
$
|
0.89
|
|
|||
|
Average shares:
|
|||||||||||||||
|
Basic
|
68,255
|
|
68,096
|
|
67,668
|
|
66,378
|
|
|||||||
|
Diluted
|
68,345
|
|
68,210
|
|
67,762
|
|
66,468
|
|
|||||||
40
Lines of Business
We operate three principal lines of business: Commercial Banking, Consumer Banking and Wealth Management. Commercial Banking includes lending, treasury and cash management services and customer risk management products for small businesses, middle market and larger commercial customers. Commercial banking also includes the TransFund EFT network. Consumer Banking includes retail lending and deposit services, lending and deposit services to small businesses served through our consumer branch network and all mortgage banking activities. Wealth Management provides fiduciary services, private bank services and investment advisory services in all markets. Wealth Management also underwrites state and municipal securities and engages in brokerage and trading activities.
In addition to our lines of business, we have a Funds Management unit. The primary purpose of this unit is to manage our overall liquidity needs and interest rate risk. Each line of business borrows funds from and provides funds to the Funds Management unit as needed to support their operations. Operating results for Funds Management and other include the effect of interest rate risk positions and risk management activities, securities gains and losses including impairment charges, the provision for credit losses in excess of net loans charged off, tax planning strategies and certain executive compensation costs that are not attributed to the lines of business. The Funds Management unit also initially recognizes accruals for loss contingencies when losses become probable. Actual losses are recognized by the lines of business if the accruals are settled.
We allocate resources and evaluate the performance of our lines of business using the net direct contribution which includes the allocation of funds, actual net credit losses and capital costs. In addition, we measure the performance of our business lines after allocations of certain direct expenses and taxes based on statutory rates.
The cost of funds borrowed from the Funds Management unit by the operating lines of business is transfer priced at rates that approximate market rates for funds with similar similar interest rate and liquidity risk characteristics. Market rates are generally based on the applicable LIBOR or interest rate swap rates, adjusted for prepayment risk. This method of transfer-pricing funds that support assets of the operating lines of business tends to insulate them from interest rate risk.
The value of funds provided by the operating lines of business to the Funds Management unit is also based on rates which approximate wholesale market rates for funds with similar duration and re-pricing characteristics. Market rates are generally based on LIBOR or interest rate swap rates. The funds credit formula applied to deposit products with indeterminate maturities is established based on their re-pricing characteristics reflected in a combination of the short-term LIBOR rate and a moving average of an intermediate term swap rate, with an appropriate spread applied to both. Shorter duration products are weighted towards the short term LIBOR rate and longer duration products are weighted towards the intermediate swap rates. The expected duration ranges from 30 days for certain rate-sensitive deposits to five years.
Economic capital is assigned to the business units by a capital allocation model that reflects management’s assessment of risk. This model assigns capital based upon credit, operating, interest rate and market risk inherent in our business lines and recognizes the diversification benefits among the units. The level of assigned economic capital is a combination of the risk taken by each business line, based on its actual exposures and calibrated to its own loss history where possible. Average invested capital includes economic capital and amounts we have invested in the lines of business.
As shown in Table
8
following, net income attributable to our lines of business
decrease
d
$9.0 million
or
4%
compared to the prior year. The decrease in net income attributed to our lines of business was due primarily to increased credit losses, litigation settlements, and net changes in the fair value of mortgage servicing rights. Net interest revenue increased
$70.4 million
mostly from commercial loan growth and improving yields. Fees and commission revenue increased
$40.2 million
from growth in most every revenue category. These increases were offset by increased net loans charged-off, operating expenses and the change in the fair value of mortgage servicing rights, net of economic hedges. Net charge-offs attributed to the lines of business were
$37.1 million
in
2016
, primarily due to energy loans, compared to a net recovery of
$897 thousand
in
2015
. Operating expense
increase
d
$82.7 million
or
13%
, including a $22.2 million increase in personnel expense and a $60.4 million increase in non-personnel expense. The decrease in net income provided by Funds Management was largely due lower net interest revenue from our securities portfolio, increased operating expense and provision for credit losses in excess of net charge-offs..
The acquisition of Mobank on December 1, 2016 was not yet allocated to the operating segments at December 31, 2016. Accordingly, the operation, assets and liabilities of Mobank were included in Funds Management and Other for 2016.
41
Table
8
–
Net Income by Line of Business
(In thousands)
|
Year Ended December 31,
|
|||||||||||
|
|
2016
|
2015
|
2014
|
||||||||
|
Commercial Banking
|
$
|
210,927
|
|
$
|
199,516
|
|
$
|
169,058
|
|
||
|
Consumer Banking
|
18
|
|
23,131
|
|
26,616
|
|
|||||
|
Wealth Management
|
32,174
|
|
29,431
|
|
18,248
|
|
|||||
|
Subtotal
|
243,119
|
|
252,078
|
|
213,922
|
|
|||||
|
Funds Management and other
|
(10,451
|
)
|
36,487
|
|
78,513
|
|
|||||
|
Total
|
$
|
232,668
|
|
$
|
288,565
|
|
$
|
292,435
|
|
||
Commercial Banking
Commercial Banking contributed
$210.9 million
to consolidated net income in
2016
,
up
$11.4 million
or
5.7%
over the prior year. Net interest revenue grew by
$46.7 million
as the balance of average commercial loans increased
$1.2 billion
or
10%
. Net loans charged off were
$33.0 million
compared to a net recovery of
$6.7 million
in
2015
. Fees and commission revenue
increase
d
$16.3 million
or
9%
over the prior year primarily due to growth in all revenue sources. Other operating expense
increase
d
$13.6 million
or
7%
compared to
2015
.
Table
9
–
Commercial Banking
(Dollars in thousands)
|
Year Ended December 31,
|
|||||||||||
|
|
2016
|
2015
|
2014
|
||||||||
|
Net interest revenue from external sources
|
$
|
492,967
|
|
$
|
439,751
|
|
$
|
382,331
|
|
||
|
Net interest expense from internal sources
|
(58,781
|
)
|
(52,313
|
)
|
(40,083
|
)
|
|||||
|
Total net interest revenue
|
434,186
|
|
387,438
|
|
342,248
|
|
|||||
|
Net loans charged off (recovered)
|
32,959
|
|
(6,748
|
)
|
(7,447
|
)
|
|||||
|
Net interest revenue after net loans charged off (recovered)
|
401,227
|
|
394,186
|
|
349,695
|
|
|||||
|
Fees and commissions revenue
|
193,508
|
|
177,251
|
|
170,362
|
|
|||||
|
Other gains, net
|
2,013
|
|
478
|
|
1,028
|
|
|||||
|
Other operating revenue
|
195,521
|
|
177,729
|
|
171,390
|
|
|||||
|
Personnel expense
|
112,021
|
|
108,661
|
|
104,845
|
|
|||||
|
Non-personnel expense
|
104,430
|
|
94,143
|
|
90,861
|
|
|||||
|
Other operating expense
|
216,451
|
|
202,804
|
|
195,706
|
|
|||||
|
Net direct contribution
|
380,297
|
|
369,111
|
|
325,379
|
|
|||||
|
Gain on financial instruments, net
|
10
|
|
—
|
|
—
|
|
|||||
|
Gain (loss) on repossessed assets, net
|
669
|
|
708
|
|
(3,187
|
)
|
|||||
|
Corporate expense allocations
|
35,760
|
|
43,279
|
|
45,502
|
|
|||||
|
Income before taxes
|
345,216
|
|
326,540
|
|
276,690
|
|
|||||
|
Federal and state income taxes
|
134,289
|
|
127,024
|
|
107,632
|
|
|||||
|
Net income
|
$
|
210,927
|
|
$
|
199,516
|
|
$
|
169,058
|
|
||
|
Average assets
|
$
|
16,998,626
|
|
$
|
16,284,527
|
|
$
|
15,394,957
|
|
||
|
Average loans
|
13,600,221
|
|
12,404,064
|
|
10,712,559
|
|
|||||
|
Average deposits
|
8,430,507
|
|
8,773,512
|
|
8,886,549
|
|
|||||
|
Average invested capital
|
1,163,965
|
|
1,050,758
|
|
946,384
|
|
|||||
42
Net interest revenue
increase
d
$46.7 million
or
12%
over
2015
. Growth in net interest revenue was due to a
$1.2 billion
increase in average loan balances as discussed further in the Loans section of Management's Discussion and Analysis of Financial Condition. Commercial and commercial real estate loans are primarily attributed to the Commercial Banking segment. Yields on commercial loans also improved primarily due to rising interest rates.
Average deposits attributed to Commercial Banking were
$8.4 billion
for
2016
, a
decrease
of
$343 million
or
4%
compared to
2015
. See additional discussion concerning changes in Commercial Banking deposits in the Liquidity and Capital section of Management's Discussion and Analysis following. The net interest impact of this decrease in average deposit balances sold to the Funds Management unit were partially offset by the increase in the federal funds rate in December 2015 and 2016.
Fees and commissions revenue
increase
d
$16 million
or
9%
over
2015
. Transaction card revenue generated by the TransFund EFT network
increase
d
$6.4 million
or
6%
due to increased customer transaction volume. Brokerage and trading revenue
increase
d
$5.4 million
or
63%
. Loan syndication fees were up $2.9 million due to the timing and volume of completed deals. Customer hedging revenue increased $2.5 million primarily due to energy prices stabilizing during 2016. Commercial deposit service charges and fees
increase
d
$2.6 million
or
7%
over the prior year. Other revenue
increase
d
$2.5 million
or
10%
primarily related to merchant banking activity.
Other gains, net of
$2.0 million
for
2016
was primarily due to a gain on sale of a merchant banking investment.
Operating expense
increase
d
$13.6 million
or
7%
over
2015
. Personnel costs
increase
d
$3.4 million
or
3%
primarily due to standard annual merit increases. Non-personnel expense
increase
d
$10.3 million
or
11%
over the prior year. Intangible asset amortization was
$2.3 million
higher due to a consolidated merchant banking investment acquired in 2015. Other expense was up $6.4 million over the prior year primarily due to $3.9 million of litigation settlements and $2.7 million of post-acquisition valuation adjustments to a consolidated merchant banking investment. Corporate expense allocations
decrease
d
$7.5 million
compared to the prior year.
43
Consumer Banking
Consumer Banking services are provided through four primary distribution channels: traditional branches, the 24-hour ExpressBank call center, Internet banking and mobile banking. Consumer Banking also conducts mortgage banking activities through offices located outside of our consumer banking markets and through HomeDirect Mortgage, an online origination channel.
Net income attributed to Consumer Banking totaled
$18 thousand
for
2016
, compared to
$23.1 million
in the prior year. As previously discussed in Management's Discussion and Analysis – Other Operating Revenue, pre-tax net income attributable to the Consumer Banking segment was negatively impacted by an unexpected 85 basis point increase in the 10-year U.S. Treasury interest rate and related interest rates due to the markets reaction to the outcome of the U.S. presidential election. The change in the fair value of mortgage servicing rights, net of economic hedges, decreased pre-tax net income by
$28.4 million
in
2016
and decreased pre-tax net income
$7.9 million
in
2015
. In addition, other operating expense attributable to the Consumer Banking division included $11.1 million of litigation and settlement costs in 2016. These items have been excluded from the discussion following.
Table
10
–
Consumer Banking
(Dollars in thousands)
|
Year Ended December 31,
|
|||||||||||
|
|
2016
|
2015
|
2014
|
||||||||
|
Net interest revenue from external sources
|
$
|
85,998
|
|
$
|
84,848
|
|
$
|
81,852
|
|
||
|
Net interest revenue from internal sources
|
37,777
|
|
28,503
|
|
26,813
|
|
|||||
|
Total net interest revenue
|
123,775
|
|
113,351
|
|
108,665
|
|
|||||
|
Net loans charged off
|
4,927
|
|
6,934
|
|
5,477
|
|
|||||
|
Net interest revenue after net loans charged off
|
118,848
|
|
106,417
|
|
103,188
|
|
|||||
|
Fees and commissions revenue
|
224,980
|
|
218,859
|
|
212,387
|
|
|||||
|
Other gains (losses), net
|
(178
|
)
|
(764
|
)
|
2,270
|
|
|||||
|
Other operating revenue
|
224,802
|
|
218,095
|
|
214,657
|
|
|||||
|
Personnel expense
|
103,034
|
|
96,604
|
|
96,801
|
|
|||||
|
Other non-personnel expense
|
146,710
|
|
106,466
|
|
110,330
|
|
|||||
|
Total other operating expense
|
249,744
|
|
203,070
|
|
207,131
|
|
|||||
|
Net direct contribution
|
93,906
|
|
121,442
|
|
110,714
|
|
|||||
|
Gain (loss) on financial instruments, net
|
(26,252
|
)
|
(4,712
|
)
|
12,406
|
|
|||||
|
Change in fair value of mortgage servicing rights
|
(2,193
|
)
|
(4,853
|
)
|
(16,445
|
)
|
|||||
|
Gain on repossessed assets, net
|
979
|
|
916
|
|
1,418
|
|
|||||
|
Corporate allocations
|
66,411
|
|
74,936
|
|
64,531
|
|
|||||
|
Net income before taxes
|
29
|
|
37,857
|
|
43,562
|
|
|||||
|
Federal and state income taxes
|
11
|
|
14,726
|
|
16,946
|
|
|||||
|
Net income
|
$
|
18
|
|
$
|
23,131
|
|
$
|
26,616
|
|
||
|
Average assets
|
$
|
8,722,372
|
|
$
|
8,836,327
|
|
$
|
8,373,317
|
|
||
|
Average loans
|
1,893,375
|
|
1,900,768
|
|
1,987,668
|
|
|||||
|
Average deposits
|
6,632,687
|
|
6,668,520
|
|
6,520,835
|
|
|||||
|
Average invested capital
|
270,209
|
|
265,775
|
|
277,404
|
|
|||||
44
Net interest revenue from Consumer Banking activities grew by
$10.4 million
or
9%
over
2015
, primarily related to increased yields on deposit balances sold to the Funds Management unit. Both average deposits and average loan balances were largely unchanged compared to the prior year. Net loans charged off by the Consumer Banking unit
decrease
d
$2.0 million
compared to
2015
to
$4.9 million
or
0.32%
of average loans. Net consumer banking charge-offs include overdrawn deposit accounts and other consumer loans.
Fees and commissions revenue
increase
d
$6.1 million
or
2.8%
compared to the prior year. Mortgage banking revenue was
up
$7.9 million
or
6%
over the prior year. A decrease in mortgage loan production volumes from the record level achieved in 2015 primarily related to the exit of the correspondent lending channel, was offset by improved gain on sale margins and increased servicing revenue. Revenue from interchange fees paid by merchants for transactions processed from debit cards issued by the Company
increase
d
$580 thousand
or
3%
. Deposit service charges and fees
decrease
d
$983 thousand
or
2%
compared to the prior year primarily due to lower overdraft fees. Other revenue decreased $1.3 million compared to the prior year primarily due to changes in earnings related to low income housing tax credit investments.
Operating expense
increase
d $35.7 million or 18% over
2015
. Personnel expenses were
up
$6.4 million
or
7%
, primarily due to regular merit increases and growth in mortgage banking headcount. Non-personnel expense
increase
d $29.3 million or 28%. Mortgage banking costs were
up
$22.7 million
over the prior year. Mortgage banking expense
increase
d
$12.7 million
due to the effect of actual residential mortgage loan prepayments on the fair value of mortgage servicing rights. Default servicing and loss mitigation costs were up
$8.1 million
. Data processing and communications costs
increase
d
$2.3 million
, printing, postage and supplies expense
increase
d
$1.6 million
and occupancy and equipment expense was up
$1.2 million
.
45
Wealth Management
Wealth Management contributed
$32.2 million
to consolidated net income in
2016
, up
$2.7 million
or
9%
over the prior year. Net interest revenue
increase
d
$13.0 million
or
26%
from growth in both average loan and deposit balances and improved yields. Fees and commissions revenue grew by
$15.9 million
or
6%
over the prior year. Fiduciary revenue was up over the prior year, primarily due to decreased fee waivers and growth in assets under management from acquisitions. Growth in brokerage and trading revenue related to the addition of a new group trading in U.S. government agency residential mortgage-backed securities and related derivatives was offset by $5.0 million from the impact of the unexpected increase in long-term interest rates related to the market's reaction to the outcome of the U.S. presidential election. Other operating expense
increase
d
$22.3 million
or
10%
. Corporate expense allocations
increase
d
$2.0 million
or
5%
.
Table
11
–
Wealth Management
(Dollars in thousands)
|
Year Ended December 31,
|
|||||||||||
|
|
2016
|
2015
|
2014
|
||||||||
|
Net interest revenue from external sources
|
$
|
33,006
|
|
$
|
24,744
|
|
$
|
23,817
|
|
||
|
Net interest revenue from internal sources
|
29,043
|
|
24,043
|
|
20,959
|
|
|||||
|
Total net interest revenue
|
62,049
|
|
48,787
|
|
44,776
|
|
|||||
|
Net loans charged off (recovered)
|
(801
|
)
|
(1,083
|
)
|
213
|
|
|||||
|
Net interest revenue after net loans charged off (recovered)
|
62,850
|
|
49,870
|
|
44,563
|
|
|||||
|
Fees and commissions revenue
|
282,710
|
|
266,790
|
|
240,926
|
|
|||||
|
Other gains, net
|
512
|
|
733
|
|
1,342
|
|
|||||
|
Other operating revenue
|
283,222
|
|
267,523
|
|
242,268
|
|
|||||
|
Personnel expense
|
190,756
|
|
178,333
|
|
170,869
|
|
|||||
|
Other non-personnel expense
|
60,238
|
|
50,331
|
|
47,131
|
|
|||||
|
Other operating expense
|
250,994
|
|
228,664
|
|
218,000
|
|
|||||
|
Net direct contribution
|
95,078
|
|
88,729
|
|
68,831
|
|
|||||
|
Gain (loss) on financial instruments, net
|
(42
|
)
|
(204
|
)
|
(235
|
)
|
|||||
|
Corporate allocations
|
42,378
|
|
40,357
|
|
38,731
|
|
|||||
|
Net income before taxes
|
52,658
|
|
48,168
|
|
29,865
|
|
|||||
|
Federal and state income tax
|
20,484
|
|
18,737
|
|
11,617
|
|
|||||
|
Net income
|
$
|
32,174
|
|
$
|
29,431
|
|
$
|
18,248
|
|
||
|
Average assets
|
$
|
6,281,127
|
|
$
|
5,444,483
|
|
$
|
5,002,515
|
|
||
|
Average loans
|
1,132,966
|
|
1,068,638
|
|
985,659
|
|
|||||
|
Average deposits
|
4,867,293
|
|
4,573,710
|
|
4,391,935
|
|
|||||
|
Average invested capital
|
240,451
|
|
225,968
|
|
215,089
|
|
|||||
Our Wealth Management division serves as custodian to or manages assets of customers. Fees are earned commensurate with the level of service provided. We may have sole or joint investment discretion over the assets of the customer or may be fiduciary for the assets, but investment selection authority remains with the customer or a manager outside of the Company. The Wealth Management division also provides safekeeping services for personal and institutional customers including holding of the customer's assets, processing of income and redemptions and other customer recordkeeping and reporting services. We also provide brokerage services for customers who maintain or delegate investment authority and for which BOK Financial does not have custody of the assets.
A summary of assets under management or in custody follows in Table
12
.
46
Table
12
–
Assets Under Management or In Custody
(Dollars in thousands)
|
December 31,
|
||||||||||||
|
|
2016
|
2015
|
2014
|
|||||||||
|
Fiduciary assets in custody for which BOKF has sole or joint discretionary authority
|
$
|
14,226,844
|
|
$
|
14,012,350
|
|
$
|
14,644,494
|
|
|||
|
Fiduciary assets not in custody for which BOKF has sole or joint discretionary authority
|
3,862,939
|
|
3,384,444
|
|
3,324,667
|
|
||||||
|
Non-managed fiduciary assets in custody
|
23,691,780
|
|
20,936,844
|
|
18,028,716
|
|
||||||
|
Total fiduciary assets
|
41,781,563
|
|
38,333,638
|
|
35,997,877
|
|
||||||
|
Assets held in safekeeping
|
27,633,471
|
|
26,897,107
|
|
22,952,394
|
|
||||||
|
Brokerage accounts under BOKF administration
|
5,992,828
|
|
5,817,028
|
|
5,653,095
|
|
||||||
|
Assets under management or in custody
|
$
|
75,407,862
|
|
$
|
71,047,773
|
|
$
|
64,603,366
|
|
|||
Net interest revenue
increase
d
$13 million
or
26%
over the prior year primarily related to growth in the trading securities portfolio related to the addition of a new trading group, improved yields on deposit balances sold to the Funds Management unit and growth in average deposit balances. Average deposit balances
increase
d
$294 million
or
6%
over the prior year and average loan balances were
up
$64 million
or
6%
.
Fees and commissions revenue grew by
$15.9 million
or
6%
over the prior year. Fiduciary and asset management revenue
increase
d
$9.3 million
or
7%
primarily related to decreased fee waivers, the acquisition of Weaver Wealth Management and changes in market values. Excluding the impact of the unexpected increase in long-term interest rates, brokerage and trading revenue increased $9.0 million or 7%. The addition of this new trading group added $139 million to the average balance of the trading securities portfolio in 2016. Retail brokerage fees increased $949 thousand or 4% over the prior year.
Other operating revenue includes fees earned from state and municipal bond underwriting and financial advisory services, primarily in the Oklahoma and Texas markets. In
2016
, the Wealth Management division participated in 417 underwritings that totaled $17.8 billion. As a participant, the Wealth Management division was responsible for facilitating the sale of approximately $2.7 billion of these underwritings. The Wealth Management division also participated in 24 corporate debt underwritings during 2016 that totaled $9.5 billion. Our interest in these underwritings was $223 million. In
2015
, the Wealth Management division participated in 434 underwritings that totaled approximately $9.3 billion. Our interest in these underwritings totaled approximately $2.9 billion. The Wealth Management division also participated in 15 corporate debt underwritings during 2015 that totaled $11.8 billion. Our interest in these underwritings was $230 million.
Operating expenses
increase
d
$22 million
or
10%
over the prior year. Personnel expenses
increase
d
$12.4 million
or
7%
, primarily due to a
$10.2 million
increase
in incentive compensation expense. Regular compensation expense also
increase
d
$2.1 million
primarily due to increased headcount and annual merit increases. Non-personnel expense was up
$9.9 million
or
20%
over
2015
. Non-personnel expense included $1.6 million of litigation costs and a $1.6 million increase in legal fees for matters discussed in Note
14
to the consolidated financial statements. Other professional fees related to continued technology upgrades increased $4.0 million. Data processing and communication expense
increase
d
$1.2 million
.
47
Financial Condition
Securities
We maintain a securities portfolio to enhance profitability, manage interest rate risk, provide liquidity and comply with regulatory requirements. Securities are classified as trading, held for investment, or available for sale. See Note
2
to the consolidated financial statements for the composition of the securities portfolio as of
December 31, 2016
,
December 31, 2015
and
December 31, 2014
.
Table
13
–
Securities
(In thousands)
|
|
December 31,
|
|||||||||||||||||||||||
|
|
2016
|
2015
|
2014
|
|||||||||||||||||||||
|
|
Amortized
Cost
|
Fair
Value
|
Amortized
Cost
|
Fair
Value
|
Amortized
Cost
|
Fair
Value
|
||||||||||||||||||
|
Trading:
|
|
|
|
|
|
|
||||||||||||||||||
|
U.S. government agency debentures
|
$
|
6,238
|
|
$
|
6,234
|
|
$
|
61,366
|
|
$
|
61,295
|
|
$
|
85,154
|
|
$
|
85,092
|
|
||||||
|
U.S. government agency residential mortgage-backed securities
|
309,432
|
|
310,067
|
|
10,972
|
|
10,989
|
|
30,930
|
|
31,199
|
|
||||||||||||
|
Municipal and other tax-exempt securities
|
14,377
|
|
14,427
|
|
31,691
|
|
31,901
|
|
38,933
|
|
38,951
|
|
||||||||||||
|
Other trading securities
|
6,843
|
|
6,900
|
|
18,235
|
|
18,219
|
|
33,496
|
|
33,458
|
|
||||||||||||
|
Total trading securities
|
$
|
336,890
|
|
$
|
337,628
|
|
$
|
122,264
|
|
$
|
122,404
|
|
$
|
188,513
|
|
$
|
188,700
|
|
||||||
|
Investment:
|
|
|
|
|
|
|
||||||||||||||||||
|
Municipal and other tax-exempt securities
|
$
|
320,364
|
|
$
|
321,225
|
|
$
|
365,258
|
|
368,910
|
|
$
|
405,090
|
|
$
|
408,344
|
|
|||||||
|
U.S. government agency residential mortgage-backed securities
|
20,777
|
|
21,473
|
|
26,833
|
|
27,874
|
|
35,750
|
|
37,463
|
|
||||||||||||
|
Other debt securities
|
205,004
|
|
222,795
|
|
205,745
|
|
232,375
|
|
211,520
|
|
227,819
|
|
||||||||||||
|
Total investment securities
|
$
|
546,145
|
|
$
|
565,493
|
|
$
|
597,836
|
|
$
|
629,159
|
|
$
|
652,360
|
|
$
|
673,626
|
|
||||||
|
Available for sale:
|
|
|
|
|
|
|
||||||||||||||||||
|
U.S. Treasury securities
|
$
|
1,000
|
|
$
|
999
|
|
$
|
1,000
|
|
$
|
995
|
|
$
|
1,005
|
|
$
|
1,005
|
|
||||||
|
Municipal and other tax-exempt securities
|
41,050
|
|
40,993
|
|
56,681
|
|
56,817
|
|
63,018
|
|
63,557
|
|
||||||||||||
|
Residential mortgage-backed securities:
|
|
|
|
|
|
|
||||||||||||||||||
|
U.S. government agencies
|
5,475,351
|
|
5,460,386
|
|
5,861,096
|
|
5,898,351
|
|
6,549,304
|
|
6,646,884
|
|
||||||||||||
|
Private issue
|
101,192
|
|
115,535
|
|
128,111
|
|
139,118
|
|
154,360
|
|
165,957
|
|
||||||||||||
|
Total residential mortgage-backed securities
|
5,576,543
|
|
5,575,921
|
|
5,989,207
|
|
6,037,469
|
|
6,703,664
|
|
6,812,841
|
|
||||||||||||
|
Commercial mortgage-backed securities guaranteed by U.S. government agencies
|
3,035,750
|
|
3,017,933
|
|
2,919,044
|
|
2,905,796
|
|
2,064,091
|
|
2,048,609
|
|
||||||||||||
|
Other debt securities
|
4,400
|
|
4,152
|
|
4,400
|
|
4,151
|
|
9,438
|
|
9,212
|
|
||||||||||||
|
Perpetual preferred stock
|
15,561
|
|
18,474
|
|
17,171
|
|
19,672
|
|
22,171
|
|
24,277
|
|
||||||||||||
|
Equity securities and mutual funds
|
17,424
|
|
18,357
|
|
17,121
|
|
17,833
|
|
18,603
|
|
19,444
|
|
||||||||||||
|
Total available for sale securities
|
$
|
8,691,728
|
|
$
|
8,676,829
|
|
$
|
9,004,624
|
|
$
|
9,042,733
|
|
$
|
8,881,990
|
|
$
|
8,978,945
|
|
||||||
|
Fair value option securities:
|
|
|
|
|
|
|
||||||||||||||||||
|
U.S. government agency residential mortgage-backed securities
|
$
|
78,823
|
|
$
|
77,046
|
|
$
|
446,277
|
|
$
|
444,217
|
|
$
|
309,973
|
|
$
|
311,597
|
|
||||||
48
We enter into trading activities both as an intermediary for customers and for our own account. We take positions in securities for resale to customers, which include individuals, corporations, foundations and financial institutions. During 2016, we expanded our trading activities for two principal strategies. We increased the volume of mortgage-backed securities trading. Through this activity, we purchase pools with specific retail mortgage collateral or to-be-announced ("TBA") derivatives with stipulations. These financial instruments are customized to meet requirements of our institutional customers. We also increased the volume of transactions where we serve as market makers by providing liquidity as a buyer and seller of TBA derivative contracts. These transactions accommodate our customers' hedging requirements or meet their needs for investment products or cash. Customers for this trading activity generally include mortgage loan originators, money managers, banks, insurance companies and hedge funds. Expansion of our trading activities resulted in an increase in the reported balances of trading securities and receivables for unsettled trading positions in the Consolidated Balance Sheets. Price risk for our trading activities is incorporated into the limits described in the Market Risk section of this report.
At
December 31, 2016
, the carrying value of investment (held-to-maturity) securities was
$546 million
and the fair value was
$565 million
. Investment securities consist primarily of intermediate and long-term, fixed rate Oklahoma and Texas municipal bonds, taxable Texas school construction bonds and residential mortgage-backed securities issued by U.S. government agencies. The investment security portfolio is diversified among issuers. The largest obligation of any single issuer is $30 million. Substantially all of these bonds are general obligations of the issuers. Approximately $104 million of the Texas school construction bonds are also guaranteed by the Texas Permanent School Fund Guarantee Program supervised by the State Board of Education for the State of Texas.
Available for sale securities, which may be sold prior to maturity, are carried at fair value. Unrealized gains or losses, net of deferred taxes, are recorded as accumulated other comprehensive income in shareholders’ equity. The amortized cost of available for sale securities totaled
$8.7 billion
at
December 31, 2016
, a
decrease
of
$313 million
compared to
December 31, 2015
. Available for sale securities consist primarily of U.S. government agency residential mortgage-backed securities and U.S. government agency commercial mortgage-backed securities. Commercial mortgage-backed securities have prepayment penalties similar to commercial loans. At
December 31, 2016
, residential mortgage-backed securities represented
64%
of total available for sale securities. The decrease in amortized cost during the year was primarily due to a decrease in U.S. government agency residential mortgage-backed securities.
A primary risk of holding residential mortgage-backed securities comes from extension during periods of rising interest rates or prepayment during periods of falling interest rates. We evaluate this risk through extensive modeling of risk both before making an investment and throughout the life of the security. Our best estimate of the duration of the combined investment and available for sale securities portfolios at
December 31, 2016
is 3.1 years. Management estimates the combined portfolios' duration extends to 3.4 years assuming an immediate 200 basis point upward shock. The estimated combined portfolios' duration contracts to 2.9 years assuming a 50 basis point decline in the current low rate environment.
Residential mortgage-backed securities also have credit risk from delinquency or default of the underlying loans. We mitigate this risk by primarily investing in securities issued by U.S. government agencies. Principal and interest payments on the underlying loans are fully guaranteed. At
December 31, 2016
, approximately
$5.5 billion
of the amortized cost of the Company’s residential mortgage-backed securities were issued by U.S. government agencies. The fair value of these residential mortgage-backed securities totaled
$5.5 billion
at
December 31, 2016
.
We also hold amortized cost of
$101 million
in residential mortgage-backed securities privately issued by publicly-owned financial institutions. The amortized cost of these securities
decrease
d
$27 million
from
December 31, 2015
, due to cash payments received during the year. The fair value of our portfolio of privately issued residential mortgage-backed securities totaled
$116 million
at
December 31, 2016
.
The amortized cost of our portfolio of privately issued residential mortgage-backed securities included
$57 million
of Jumbo-A residential mortgage loans and
$44 million
of Alt-A residential mortgage loans. Jumbo-A residential mortgage loans generally meet government underwriting standards, but have loan balances that exceed agency maximums. Alt-A mortgage loans generally do not have sufficient documentation to meet government agency underwriting standards. Approximately 90% of our Alt-A mortgage-backed securities represent pools of fixed rate residential mortgage loans. None of the adjustable rate mortgages are payment option adjustable rate mortgages (“ARMs”). Approximately 30% of our Jumbo-A residential mortgage-backed securities represent pools of fixed rate residential mortgage loans and none of the adjustable rate mortgages are payment option ARMs.
49
The aggregate gross amount of unrealized losses on available for sale securities totaled
$75 million
at
December 31, 2016
, a
$33 million
increase compared to
December 31, 2015
. On a quarterly basis, we perform separate evaluations on debt and equity securities to determine if the unrealized losses are temporary as more fully described in Note
2
of the Consolidated Financial Statements.
No
other-than-temporary impairment charges were recognized in earnings in
2016
.
Certain residential mortgage-backed securities issued by U.S. government agencies and included in fair value option securities on the Consolidated Balance Sheets, have been segregated and designated as economic hedges of changes in the fair value of our mortgage servicing rights. We have elected to carry these securities at fair value with changes in fair value recognized in current period income. These securities are held with the intent that gains or losses will offset changes in the fair value of mortgage servicing rights and related derivative contracts.
We are required to hold stock as members of the Federal Reserve system and the Federal Home Loan Banks ("FHLB"). These restricted equity securities are carried at cost as these securities do not have a readily determined fair value because ownership of these shares are restricted and they lack a market. Federal Reserve Bank stock totaled
$36 million
at
December 31, 2016
,
$36 million
at
December 31, 2015
and
$35 million
at
December 31, 2014
. Holdings of FHLB stock totaled
$271 million
at
December 31, 2016
,
$237 million
at
December 31, 2015
and
$106 million
at
December 31, 2014
. We are required to hold FHLB stock in proportion to our borrowings with the FHLB.
Bank-Owned Life Insurance
We have approximately
$308 million
of bank-owned life insurance at
December 31, 2016
. This investment is expected to provide a long-term source of earnings to support existing employee benefit programs. Approximately $281 million is held in separate accounts. Our separate account holdings are invested in diversified portfolios of investment-grade fixed income securities and cash equivalents, including U.S. Treasury and Agency securities, residential mortgage-backed securities, corporate debt, asset-backed and commercial mortgage-backed securities. The portfolios are managed by unaffiliated professional managers within parameters established in the portfolio’s investment guidelines. The cash surrender value of certain life insurance policies is further supported by a stable value wrap, which protects against changes in the fair value of the investments. At
December 31, 2016
, the fair value of investments held in separate accounts was approximately $285 million. As the underlying fair value of the investments held in a separate account at
December 31, 2016
exceeded the net book value of the investments, no cash surrender value was supported by the stable value wrap. The stable value wrap is provided by a domestic financial institution. The remaining cash surrender value of $27 million primarily represents the cash surrender value of policies held in general accounts and other amounts due from various insurance companies.
50
Loans
The aggregate loan portfolio before allowance for loan losses totaled
$17.0 billion
at
December 31, 2016
, growing
$1.0 billion
or
7%
over
December 31, 2015
, including $485 million from the Mobank acquisition. Commercial loans have grown by
$138 million
or
1%
due largely to growth in services, healthcare and wholesale/retail sector loans, partially offset by a decrease in energy loan balances compared to the prior year. The Mobank acquisition added $289 million of commercial loans, primarily in the services sector. Commercial real estate loans
increase
d
$550 million
or
17%
primarily due to growth in loans secured by industrial facilities, office buildings and multifamily residential properties. The Mobank acquisition added $87 million in commercial real estate balances. Residential mortgage loans
increase
d
$73 million
and personal loans
increase
d
$287 million
.
Table
14
–
Loans
(In thousands)
|
December 31,
|
||||||||||||||||||||
|
2016
|
2015
|
2014
|
2013
|
2012
|
||||||||||||||||
|
Commercial:
|
|
|
|
|
|
|||||||||||||||
|
Services
|
$
|
3,108,990
|
|
$
|
2,784,276
|
|
$
|
2,391,530
|
|
$
|
2,282,210
|
|
$
|
2,164,186
|
|
|||||
|
Energy
|
2,497,868
|
|
3,097,328
|
|
2,860,428
|
|
2,351,760
|
|
2,460,659
|
|
||||||||||
|
Healthcare
|
2,201,916
|
|
1,883,380
|
|
1,454,969
|
|
1,274,246
|
|
1,081,406
|
|
||||||||||
|
Wholesale/retail
|
1,576,818
|
|
1,422,064
|
|
1,440,015
|
|
1,201,364
|
|
1,106,439
|
|
||||||||||
|
Manufacturing
|
514,975
|
|
556,729
|
|
532,594
|
|
391,751
|
|
348,484
|
|
||||||||||
|
Other commercial and industrial
|
490,257
|
|
508,754
|
|
416,134
|
|
441,890
|
|
480,738
|
|
||||||||||
|
Total commercial
|
10,390,824
|
|
10,252,531
|
|
9,095,670
|
|
7,943,221
|
|
7,641,912
|
|
||||||||||
|
Commercial real estate:
|
|
|
|
|
|
|
|
|
|
|
||||||||||
|
Multifamily
|
903,272
|
|
751,085
|
|
704,298
|
|
576,502
|
|
402,896
|
|
||||||||||
|
Industrial
|
871,749
|
|
563,169
|
|
428,817
|
|
243,877
|
|
245,994
|
|
||||||||||
|
Office
|
798,888
|
|
637,707
|
|
415,544
|
|
411,499
|
|
427,872
|
|
||||||||||
|
Retail
|
761,888
|
|
796,499
|
|
666,889
|
|
586,047
|
|
522,786
|
|
||||||||||
|
Residential construction and land development
|
135,533
|
|
160,426
|
|
143,591
|
|
206,258
|
|
253,093
|
|
||||||||||
|
Other commercial real estate
|
337,716
|
|
350,147
|
|
369,011
|
|
391,170
|
|
376,358
|
|
||||||||||
|
Total commercial real estate
|
3,809,046
|
|
3,259,033
|
|
2,728,150
|
|
2,415,353
|
|
2,228,999
|
|
||||||||||
|
Residential mortgage:
|
|
|
|
|
|
|
|
|
|
|
||||||||||
|
Permanent mortgage
|
1,006,820
|
|
945,336
|
|
969,951
|
|
1,062,744
|
|
1,123,965
|
|
||||||||||
|
Permanent mortgages guaranteed by U.S. government agencies
|
199,387
|
|
196,937
|
|
205,950
|
|
181,598
|
|
160,444
|
|
||||||||||
|
Home equity
|
743,625
|
|
734,620
|
|
773,611
|
|
807,684
|
|
760,631
|
|
||||||||||
|
Total residential mortgage
|
1,949,832
|
|
1,876,893
|
|
1,949,512
|
|
2,052,026
|
|
2,045,040
|
|
||||||||||
|
Personal
|
839,958
|
|
552,697
|
|
434,705
|
|
381,664
|
|
395,505
|
|
||||||||||
|
Total
|
$
|
16,989,660
|
|
$
|
15,941,154
|
|
$
|
14,208,037
|
|
$
|
12,792,264
|
|
$
|
12,311,456
|
|
|||||
51
Commercial
Commercial loans represent loans for working capital, facilities acquisition or expansion, purchases of equipment and other needs of commercial customers primarily located within our geographical footprint. Commercial loans are underwritten individually and represent on-going relationships based on a thorough knowledge of the customer, the customer’s industry and market. While commercial loans are generally secured by the customer’s assets including real property, inventory, accounts receivable, operating equipment, interests in mineral rights and other property and may also include personal guarantees of the owners and related parties, the primary source of repayment of the loans is the on-going cash flow from operations of the customer’s business. Inherent lending risks are centrally monitored on a continuous basis from underwriting throughout the life of the loan for compliance with commercial lending policies.
Service sector loans grew by
$325 million
or
12%
, healthcare sector loans
increase
d
$319 million
or
17%
and wholesale/retail sector loans
increase
d
$155 million
or
11%
over
December 31, 2015
. This growth was partially offset by a
decrease
of
$599 million
or
19%
in energy sector loan balances.
Table
15
presents our commercial loan portfolio distributed primarily by collateral location. Loans for which the collateral location is less relevant, such as unsecured loans and reserve-based energy loans, are distributed by the borrower’s primary operating location.
Table
15
–
Commercial Loans by Collateral Location
(In thousands)
|
|
Oklahoma
|
Texas
|
New
Mexico |
Arkansas
|
Colorado
|
Arizona
|
Kansas/
Missouri |
Other
|
Total
|
||||||||||||||||||||||||||
|
Services
|
$
|
741,806
|
|
$
|
893,893
|
|
$
|
207,966
|
|
$
|
12,609
|
|
$
|
322,053
|
|
$
|
206,986
|
|
$
|
337,772
|
|
$
|
385,905
|
|
$
|
3,108,990
|
|
||||||||
|
Energy
|
510,621
|
|
1,243,253
|
|
17,557
|
|
5,099
|
|
229,585
|
|
9,526
|
|
90,440
|
|
391,787
|
|
2,497,868
|
|
|||||||||||||||||
|
Healthcare
|
291,834
|
|
379,504
|
|
136,004
|
|
100,187
|
|
129,250
|
|
123,987
|
|
252,334
|
|
788,816
|
|
2,201,916
|
|
|||||||||||||||||
|
Wholesale/retail
|
382,739
|
|
554,069
|
|
49,198
|
|
71,268
|
|
66,878
|
|
70,695
|
|
99,309
|
|
282,662
|
|
1,576,818
|
|
|||||||||||||||||
|
Manufacturing
|
109,288
|
|
149,525
|
|
472
|
|
4,790
|
|
42,628
|
|
62,131
|
|
76,305
|
|
69,836
|
|
514,975
|
|
|||||||||||||||||
|
Other commercial and industrial
|
100,963
|
|
125,577
|
|
3,666
|
|
51,056
|
|
21,940
|
|
36,983
|
|
73,280
|
|
76,792
|
|
490,257
|
|
|||||||||||||||||
|
Total commercial loans
|
$
|
2,137,251
|
|
$
|
3,345,821
|
|
$
|
414,863
|
|
$
|
245,009
|
|
$
|
812,334
|
|
$
|
510,308
|
|
$
|
929,440
|
|
$
|
1,995,798
|
|
$
|
10,390,824
|
|
||||||||
The majority of our commercial portfolio is located within our geographic footprint. At
December 31, 2016
, the Other category is composed primarily of
California
totaling
$301 million
or
2.9%
of the commercial portfolio,
Louisiana
totaling
$158 million
or
1.5%
of the commercial portfolio,
Florida
totaling
$116 million
or
1.1%
of the commercial portfolio and
Tennessee
totaling
$109 million
or
1.1%
of the commercial portfolio. All other states individually represent one percent or less of the total commercial loan portfolio.
Supporting the energy industry with loans to producers and other energy-related entities has been a hallmark of the Company since its founding and represents a large portion of our commercial loan portfolio. In addition, energy production and related industries have a significant impact on the economy in our primary markets. Loans collateralized by oil and gas properties are subject to a semi-annual engineering review by our internal staff of petroleum engineers. This review is utilized as the basis for developing the expected cash flows supporting the loan amount. The projected cash flows are discounted according to risk characteristics of the underlying oil and gas properties. Loans are evaluated to demonstrate with reasonable certainty that crude oil, natural gas and natural gas liquids can be recovered from known oil and gas reservoirs under existing economic and operating conditions at current pricing levels and with existing conventional equipment and operating methods and costs. As part of our evaluation of credit quality, we analyze rigorous stress tests over a range of commodity prices and take proactive steps to mitigate risk when appropriate.
52
Outstanding energy loans totaled
$2.5 billion
or
15%
of total loans at
December 31, 2016
. Unfunded energy loan commitments
increase
d by
$320 million
during the year to
$2.7 billion
at
December 31, 2016
primarily due to energy borrowers paying down outstanding balances. Total outstanding loan balances as a percentage of total energy loan commitments decreased to
50%
at
December 31, 2016
, compared to
58%
at
December 31, 2015
. Approximately
$2.0 billion
or
80%
of energy loans were to oil and gas producers, a
$550 million
decrease
compared to
December 31, 2015
. The majority of this portfolio is first lien, senior secured, reserve-based lending, which we believe is the lowest risk form of energy lending. The Company has largely avoided higher-risk energy lending areas including second-lien financing, mezzanine debt and subordinated debt. In addition, the Company has no direct exposure to energy company equity or to borrowers with deepwater offshore exposure. Approximately
57%
of the committed production loans are secured by properties primarily producing oil and
43%
of the committed production loans are secured by properties primarily producing natural gas. Loans to borrowers in the midstream sector of the industry totaled
$264 million
or
10%
of energy loans, an
increase
of
$71 million
over the prior year. Loans to borrowers that provide services to the energy industry totaled
$185 million
or
7%
of energy loans, a
decrease
of
$94 million
during
2016
. Loans to other energy borrowers, including those engaged in wholesale or retail energy sales totaled
$60 million
or
3%
of energy loans, a
decrease
of
$26 million
compared to the prior year.
The services sector of the loan portfolio totaled
$3.1 billion
or
18%
of total loans and consists of a large number of loans to a variety of businesses, including governmental, financial and insurance, educational, religious and not-for-profit and professional/technical services. Loans to governmental entities totaled $680 million at December 31, 2016. Approximately
$1.4 billion
of the services category is made up of loans with individual balances of less than $10 million. Service sector loans are generally secured by the assets of the borrower with repayment coming from the cash flows of ongoing operations of the customer’s business.
The healthcare sector of the loan portfolio totaled
$2.2 billion
or
13%
of total loans and consists primarily of loans for the development and operation of senior housing and care facilities, including independent living, assisted living and skilled nursing. Healthcare also includes loans to hospitals and other medical service providers.
We participate in shared national credits when appropriate to obtain or maintain business relationships with local customers. Shared national credits are defined by banking regulators as credits of more than $20 million and with three or more non-affiliated banks as participants. At
December 31, 2016
, the outstanding principal balance of these loans totaled $3.7 billion. Approximately 81% of these loans are to borrowers with local market relationships. We serve as the agent lender in approximately 17% of our shared national credits, based on dollars committed. We hold shared credits to the same standard of analysis and perform the same level of review as internally originated credits. Our lending policies generally avoid loans in which we do not have the opportunity to maintain or achieve other business relationships with the customer. In addition to management’s quarterly assessment of credit risk, banking regulators annually review a sample of shared national credits for proper risk grading.
Commercial Real Estate
Commercial real estate represents loans for the construction of buildings or other improvements to real estate and property held by borrowers for investment purposes. The majority of commercial real estate loans are secured by properties within our geographic footprint, with the larger concentrations in Texas and Oklahoma,
30%
and
11%
at
December 31, 2016
. We require collateral values in excess of the loan amounts, demonstrated cash flows in excess of expected debt service requirements, equity investment in the project and a portion of the project already sold, leased or permanent financing already secured. The expected cash flows from all significant new or renewed income producing property commitments are stress tested to reflect the risks in varying interest rates, vacancy rates and rental rates. As with commercial loans, inherent lending risks are centrally monitored on a continuous basis from underwriting throughout the life of the loan for compliance with applicable lending policies.
Commercial real estate loans totaled
$3.8 billion
or
22%
of the loan portfolio at
December 31, 2016
. The outstanding balance of commercial real estate loans
increase
d
$550 million
over
2015
, primarily due to growth in loans secured by industrial facilities, office buildings and multifamily residential properties. This growth was partially offset by a decrease in loans secured by retail facilities and residential construction and land development loans. The commercial real estate loan segment is approaching our internal concentration limit. The commercial real estate loan balance as a percentage of our total loan portfolio has ranged from
18%
to 23% over the past five years. The commercial real estate segment of our loan portfolio distributed by collateral location follows in Table
16
.
53
Table
16
–
Commercial Real Estate Loans by Collateral Location
(In thousands)
|
|
Oklahoma
|
Texas
|
New
Mexico |
Arkansas
|
Colorado
|
Arizona
|
Kansas/
Missouri |
Other
|
Total
|
|||||||||||||||||||||||||||
|
Multifamily
|
95,095
|
|
320,982
|
|
11,877
|
|
25,093
|
|
67,770
|
|
71,188
|
|
120,629
|
|
190,638
|
|
903,272
|
|
||||||||||||||||||
|
Industrial
|
83,607
|
|
254,542
|
|
26,869
|
|
54
|
|
33,319
|
|
18,075
|
|
81,087
|
|
374,196
|
|
871,749
|
|
||||||||||||||||||
|
Office
|
86,388
|
|
208,124
|
|
52,654
|
|
1,833
|
|
66,043
|
|
66,397
|
|
76,508
|
|
240,941
|
|
798,888
|
|
||||||||||||||||||
|
Retail
|
79,363
|
|
298,886
|
|
108,856
|
|
6,712
|
|
20,308
|
|
32,855
|
|
20,255
|
|
194,653
|
|
761,888
|
|
||||||||||||||||||
|
Residential construction and land development
|
13,206
|
|
28,691
|
|
18,025
|
|
6,038
|
|
25,145
|
|
8,001
|
|
13,560
|
|
22,867
|
|
135,533
|
|
||||||||||||||||||
|
Other commercial real estate
|
70,841
|
|
37,652
|
|
15,069
|
|
5,440
|
|
24,755
|
|
42,167
|
|
27,499
|
|
114,293
|
|
337,716
|
|
||||||||||||||||||
|
Total commercial real estate loans
|
$
|
428,500
|
|
$
|
1,148,877
|
|
$
|
233,350
|
|
$
|
45,170
|
|
$
|
237,340
|
|
$
|
238,683
|
|
$
|
339,538
|
|
$
|
1,137,588
|
|
$
|
3,809,046
|
|
|||||||||
The Other category includes
California
with
$189 million
or
5%
of total commercial real estate loans and
Utah
with
$139 million
or
4%
, of total commercial real estate loans. All other states individually represent less than 3% of the total commercial real estate loan population.
Residential Mortgage and Personal
Residential mortgage loans provide funds for our customers to purchase or refinance their primary residence or to borrow against the equity in their home. Residential mortgage loans are secured by a first or second-mortgage on the customer’s primary residence. Personal loans consist primarily of loans to wealth management clients secured by the cash surrender value of insurance policies and marketable securities. It also includes direct loans secured by and for the purchase of automobiles, recreational and marine equipment as well as unsecured loans. Residential mortgage and personal loans are made in accordance with underwriting policies we believe to be conservative and are fully documented. Credit scoring is assessed based on significant credit characteristics including credit history, residential and employment stability.
Residential mortgage loans totaled
$1.9 billion
, a
$73 million
or
4%
increase
compared to
December 31, 2015
. In general, we sell the majority of our fixed rate loan originations that conform to U.S. government agency standards in the secondary market and retain the majority of our non-conforming and adjustable-rate mortgage loans. We have no concentration in sub-prime residential mortgage loans. Our mortgage loan portfolio does not include payment option adjustable rate mortgage loans or adjustable rate mortgage loans with initial rates that are below market. Collateral for
97%
of our residential mortgage portfolio is located within our geographic footprint.
The majority of our permanent mortgage loan portfolio is primarily composed of various non-conforming mortgage programs to support customer relationships including jumbo mortgage loans, non-builder construction loans and special loan programs for high net worth individuals or certain professionals. Jumbo loans may be fixed or variable rate and are fully amortizing. The size of jumbo loans exceed maximums set under government sponsored entity standards, but otherwise generally conform to those standards. These loans generally require a minimum FICO score of 720 and a maximum debt-to-income ratio (“DTI”) of 38%. Loan-to-value ratios (“LTV”) are tiered from 60% to 100%, depending on the market. Special mortgage programs include fixed and variable rate fully amortizing loans tailored to the needs of certain healthcare professionals. Variable rate loans are fully indexed at origination and may have fixed rates for three to ten years, then adjust annually thereafter.
At
December 31, 2016
,
$199 million
of permanent residential mortgage loans are guaranteed by U.S. government agencies. We have minimal credit exposure on loans guaranteed by the agencies. This amount includes residential mortgage loans previously sold into GNMA mortgage pools that are eligible to be repurchased. We may repurchase these loans when certain defined delinquency criteria are met. Because of this repurchase right, the Company is deemed to have regained effective control over these loans and must include them in the Consolidated Balance Sheets. Permanent residential mortgage loans guaranteed by U.S. government agencies
increase
d
$2.5 million
or
1%
over
December 31, 2015
.
54
Home equity loans totaled
$744 million
at
December 31, 2016
, a
$9.0 million
or
1%
increase
over
December 31, 2015
. Our home equity portfolio is primarily composed of first-lien, fully amortizing home equity loans. Home equity loans generally require a minimum FICO score of 700 and a maximum DTI of 50%. The maximum loan amount available for our home equity loan products is generally $400 thousand. Revolving loans have a 10 year revolving period followed by 15 year term of amortizing repayments. Interest-only home equity loans have a 5 year revolving period followed by a 15 year term of amortizing repayments and may not be extended for any additional revolving time. All other home equity loans may be extended at management's discretion for an additional 5 year revolving term subject to an update of certain credit information. A summary of our home equity loan portfolio at
December 31, 2016
by lien position and amortizing status follows in Table
17
.
Table
17
–
Home Equity Loans
(In thousands)
|
Revolving
|
Amortizing
|
Total
|
||||||||||
|
First lien
|
$
|
70,854
|
|
$
|
414,236
|
|
$
|
485,090
|
|
|||
|
Junior lien
|
123,779
|
|
134,756
|
|
258,535
|
|
||||||
|
Total home equity
|
$
|
194,633
|
|
$
|
548,992
|
|
$
|
743,625
|
|
|||
The distribution of residential mortgage and personal loans at
December 31, 2016
is presented in Table
18
. Residential mortgage loans are distributed by collateral location. Personal loans are generally distributed by borrower location.
Table
18
–
Residential Mortgage and Personal Loans by Collateral Location
(In thousands)
|
Oklahoma
|
Texas
|
New Mexico
|
Arkansas
|
Colorado
|
Arizona
|
Kansas/Missouri
|
Other
|
Total
|
||||||||||||||||||||||||||||
|
Residential mortgage:
|
|
|
|
|
|
|
|
|
||||||||||||||||||||||||||||
|
Permanent mortgage
|
$
|
187,855
|
|
$
|
407,108
|
|
$
|
38,037
|
|
$
|
14,032
|
|
$
|
159,205
|
|
$
|
91,208
|
|
$
|
77,928
|
|
$
|
31,447
|
|
$
|
1,006,820
|
|
|||||||||
|
Permanent mortgages guaranteed by U.S. government agencies
|
57,192
|
|
25,509
|
|
60,069
|
|
6,870
|
|
5,348
|
|
1,919
|
|
14,071
|
|
28,409
|
|
199,387
|
|
||||||||||||||||||
|
Home equity
|
406,393
|
|
137,288
|
|
102,821
|
|
5,599
|
|
35,324
|
|
8,688
|
|
47,147
|
|
365
|
|
743,625
|
|
||||||||||||||||||
|
Total residential mortgage
|
$
|
651,440
|
|
$
|
569,905
|
|
$
|
200,927
|
|
$
|
26,501
|
|
$
|
199,877
|
|
$
|
101,815
|
|
$
|
139,146
|
|
$
|
60,221
|
|
$
|
1,949,832
|
|
|||||||||
|
Personal
|
$
|
295,047
|
|
$
|
334,710
|
|
$
|
11,306
|
|
$
|
6,525
|
|
$
|
52,679
|
|
$
|
48,910
|
|
$
|
78,386
|
|
$
|
12,395
|
|
$
|
839,958
|
|
|||||||||
55
The Company secondarily evaluates loan portfolio performance based on the primary geographical market managing the loan. Loans attributed to a geographical market may not represent the location of the borrower or the collateral. All permanent mortgage loans serviced by our mortgage banking unit and held for investment by BOKF, NA are centrally managed by the Bank of Oklahoma.
Table
19
–
Loans Managed by Primary Geographical Market
(In thousands)
|
December 31,
|
||||||||||||||||||||
|
2016
|
2015
|
2014
|
2013
|
2012
|
||||||||||||||||
|
Bank of Oklahoma:
|
|
|
|
|
|
|||||||||||||||
|
Commercial
|
$
|
3,370,259
|
|
$
|
3,782,687
|
|
$
|
3,142,689
|
|
$
|
2,902,140
|
|
$
|
3,089,686
|
|
|||||
|
Commercial real estate
|
684,381
|
|
739,829
|
|
603,610
|
|
602,010
|
|
580,694
|
|
||||||||||
|
Residential mortgage
|
1,407,197
|
|
1,409,114
|
|
1,467,096
|
|
1,524,212
|
|
1,488,486
|
|
||||||||||
|
Personal
|
303,823
|
|
255,387
|
|
206,115
|
|
192,283
|
|
220,096
|
|
||||||||||
|
Total Bank of Oklahoma
|
5,765,660
|
|
6,187,017
|
|
5,419,510
|
|
5,220,645
|
|
5,378,962
|
|
||||||||||
|
Bank of Texas:
|
|
|
|
|
|
|
|
|
|
|
||||||||||
|
Commercial
|
4,022,455
|
|
3,908,425
|
|
3,549,128
|
|
3,052,274
|
|
2,726,925
|
|
||||||||||
|
Commercial real estate
|
1,415,011
|
|
1,204,202
|
|
1,027,817
|
|
816,574
|
|
771,796
|
|
||||||||||
|
Residential mortgage
|
233,981
|
|
219,126
|
|
235,948
|
|
260,544
|
|
275,408
|
|
||||||||||
|
Personal
|
306,748
|
|
203,496
|
|
154,363
|
|
131,297
|
|
116,252
|
|
||||||||||
|
Total Bank of Texas
|
5,978,195
|
|
5,535,249
|
|
4,967,256
|
|
4,260,689
|
|
3,890,381
|
|
||||||||||
|
Bank of Albuquerque:
|
|
|
|
|
|
|
|
|
|
|
||||||||||
|
Commercial
|
399,256
|
|
375,839
|
|
383,439
|
|
342,336
|
|
265,830
|
|
||||||||||
|
Commercial real estate
|
284,603
|
|
313,422
|
|
296,358
|
|
308,829
|
|
326,135
|
|
||||||||||
|
Residential mortgage
|
108,058
|
|
120,507
|
|
127,999
|
|
133,900
|
|
130,337
|
|
||||||||||
|
Personal
|
11,483
|
|
11,557
|
|
10,899
|
|
13,842
|
|
15,456
|
|
||||||||||
|
Total Bank of Albuquerque
|
803,400
|
|
821,325
|
|
818,695
|
|
798,907
|
|
737,758
|
|
||||||||||
|
Bank of Arkansas:
|
|
|
|
|
|
|
|
|
|
|
||||||||||
|
Commercial
|
86,577
|
|
92,359
|
|
95,510
|
|
81,556
|
|
62,049
|
|
||||||||||
|
Commercial real estate
|
73,616
|
|
69,320
|
|
88,301
|
|
78,264
|
|
90,821
|
|
||||||||||
|
Residential mortgage
|
7,015
|
|
8,169
|
|
7,261
|
|
7,922
|
|
13,046
|
|
||||||||||
|
Personal
|
6,524
|
|
819
|
|
5,169
|
|
8,023
|
|
15,421
|
|
||||||||||
|
Total Bank of Arkansas
|
173,732
|
|
170,667
|
|
196,241
|
|
175,765
|
|
181,337
|
|
||||||||||
|
Colorado State Bank & Trust:
|
|
|
|
|
|
|
|
|
|
|
||||||||||
|
Commercial
|
1,018,208
|
|
987,076
|
|
977,961
|
|
735,626
|
|
776,610
|
|
||||||||||
|
Commercial real estate
|
265,264
|
|
223,946
|
|
194,553
|
|
190,355
|
|
173,327
|
|
||||||||||
|
Residential mortgage
|
59,631
|
|
53,782
|
|
57,119
|
|
62,821
|
|
59,363
|
|
||||||||||
|
Personal
|
50,372
|
|
23,384
|
|
27,918
|
|
22,686
|
|
19,333
|
|
||||||||||
|
Total Colorado State Bank & Trust
|
1,393,475
|
|
1,288,188
|
|
1,257,551
|
|
1,011,488
|
|
1,028,633
|
|
||||||||||
|
Bank of Arizona:
|
|
|
|
|
|
|
|
|
|
|
||||||||||
|
Commercial
|
686,253
|
|
606,733
|
|
547,524
|
|
417,702
|
|
313,296
|
|
||||||||||
|
Commercial real estate
|
747,409
|
|
507,523
|
|
355,140
|
|
257,477
|
|
201,760
|
|
||||||||||
|
Residential mortgage
|
36,265
|
|
44,047
|
|
35,872
|
|
47,111
|
|
57,803
|
|
||||||||||
|
Personal
|
52,553
|
|
31,060
|
|
12,883
|
|
7,887
|
|
4,686
|
|
||||||||||
|
Total Bank of Arizona
|
1,522,480
|
|
1,189,363
|
|
951,419
|
|
730,177
|
|
577,545
|
|
||||||||||
|
Bank of Kansas City / Mobank:
|
|
|
|
|
|
|
|
|
|
|
||||||||||
|
Commercial
|
807,816
|
|
499,412
|
|
399,419
|
|
411,587
|
|
407,516
|
|
||||||||||
|
Commercial real estate
|
338,762
|
|
200,791
|
|
162,371
|
|
161,844
|
|
84,466
|
|
||||||||||
|
Residential mortgage
|
97,685
|
|
22,148
|
|
18,217
|
|
15,516
|
|
20,597
|
|
||||||||||
|
Personal
|
108,455
|
|
26,994
|
|
17,358
|
|
5,646
|
|
4,261
|
|
||||||||||
|
Total Bank of Kansas City / Mobank
|
1,352,718
|
|
749,345
|
|
597,365
|
|
594,593
|
|
516,840
|
|
||||||||||
|
Total BOK Financial loans
|
$
|
16,989,660
|
|
$
|
15,941,154
|
|
$
|
14,208,037
|
|
$
|
12,792,264
|
|
$
|
12,311,456
|
|
|||||
56
Table
20
–
Loan Maturity and Interest Rate Sensitivity
at
December 31, 2016
(In thousands)
|
|
|
Remaining Maturities of Selected Loans
|
||||||||||||||
|
|
Total
|
Within 1 Year
|
1-5 Years
|
After 5 Years
|
||||||||||||
|
Loan maturity:
|
|
|
|
|
||||||||||||
|
Commercial
|
$
|
10,390,824
|
|
$
|
783,534
|
|
$
|
5,771,115
|
|
$
|
3,836,175
|
|
||||
|
Commercial real estate
|
3,809,046
|
|
351,546
|
|
2,438,228
|
|
1,019,272
|
|
||||||||
|
Total
|
$
|
14,199,870
|
|
$
|
1,135,080
|
|
$
|
8,209,343
|
|
$
|
4,855,447
|
|
||||
|
Interest rate sensitivity for selected loans with:
|
||||||||||||||||
|
Predetermined interest rates
|
$
|
2,820,073
|
|
$
|
120,765
|
|
$
|
685,710
|
|
$
|
2,013,598
|
|
||||
|
Floating or adjustable interest rates
|
11,379,797
|
|
1,014,315
|
|
7,523,633
|
|
2,841,849
|
|
||||||||
|
Total
|
$
|
14,199,870
|
|
$
|
1,135,080
|
|
$
|
8,209,343
|
|
$
|
4,855,447
|
|
||||
Loan Commitments
We enter into certain off-balance sheet arrangements in the normal course of business. These arrangements include unfunded loan commitments which totaled
$9.4 billion
and standby letters of credit which totaled
$585 million
at
December 31, 2016
. Loan commitments may be unconditional obligations to provide financing or conditional obligations that depend on the borrower’s financial condition, collateral value or other factors. Standby letters of credit are unconditional commitments to guarantee the performance of our customer to a third party. Since some of these commitments are expected to expire before being drawn upon, the total commitment amounts do not necessarily represent future cash requirements. Approximately
$390 thousand
of the outstanding standby letters of credit were issued on behalf of customers whose loans are nonperforming at
December 31, 2016
.
Table
21
–
Off-Balance Sheet Credit Commitments
(In thousands)
|
|
December 31,
|
|||||||||||||||||
|
|
2016
|
2015
|
2014
|
2013
|
2012
|
|||||||||||||
|
Loan commitments
|
$
|
9,404,665
|
|
$
|
8,455,037
|
|
$
|
8,328,416
|
|
7,096,373
|
|
6,636,587
|
|
|||||
|
Standby letters of credit
|
585,472
|
|
507,988
|
|
447,599
|
|
444,248
|
|
466,477
|
|
||||||||
|
Mortgage loans sold with recourse
|
139,486
|
|
155,489
|
|
179,822
|
|
191,299
|
|
226,922
|
|
||||||||
We have off-balance sheet commitments related to certain residential mortgage loans originated under community development loan programs that were sold to a U.S. government agency with full recourse. These mortgage loans were underwritten to standards approved by the agencies, including full documentation and originated under programs available only for owner-occupied properties. We no longer sell residential mortgage loans with recourse other than obligations under standard representations and warranties. We are obligated to repurchase these loans for the life of these loans in the event of foreclosure for the unpaid principal and interest at the time of foreclosure. At
December 31, 2016
, the principal balance of residential mortgage loans sold subject to recourse obligations totaled
$139 million
, down from
$155 million
at
December 31, 2015
. Substantially all of these loans are to borrowers in our primary markets including
$88 million
to borrowers in Oklahoma,
$15 million
to borrowers in Arkansas and
$12 million
to borrowers in New Mexico. At
December 31, 2016
, approximately
3%
of these loans were nonperforming and
6%
were past due 30 to 89 days. A separate accrual for credit risk of
$4.0 million
is available to absorb losses on these loans.
We also have an off-balance sheet obligation to repurchase residential mortgage loans sold to government sponsored entities through our mortgage banking activities due to standard representations and warranties made under contractual agreements as described further in Note
7
to the Consolidated Financial Statements. For the period from 2010 through
2016
, approximately
21%
of repurchase requests have currently resulted in actual repurchases or indemnification by the Company. The accrual for credit losses related to potential loan repurchases under representations and warranties totaled
$2.8 million
at
December 31, 2016
.
57
Customer Derivative Programs
We offer programs that permit our customers to hedge various risks, including fluctuations in energy, cattle and other agricultural product prices, interest rates and foreign exchange rates. Each of these programs work essentially the same way. Derivative contracts are executed between the customers and the Company. Offsetting contracts are executed between the Company and selected counterparties or exchanges to minimize market risk to us from changes in commodity prices, interest rates or foreign exchange rates. The counterparty contracts are identical to the customer contracts, except for a fixed pricing spread or a fee paid to us as compensation for administrative costs, credit risk and profit.
The customer derivative programs create credit risk for potential amounts due to the Company from our customers and from the counterparties. Customer credit risk is monitored through existing credit policies and procedures. The effects of changes in commodity prices, interest rates or foreign exchange rates are evaluated across a range of possible options to determine the maximum exposure we are willing to have individually to any customer. Customers may also be required to provide cash margin or other collateral in conjunction with our credit agreements to further limit our credit risk.
Counterparty credit risk is evaluated through existing policies and procedures. This evaluation considers the total relationship between BOK Financial and each of the counterparties. Individual limits are established by management, approved by Credit Administration and reviewed by the Asset/Liability Committee. Margin collateral is required if the exposure between the Company and any counterparty exceeds established limits. Based on declines in the counterparties’ credit ratings, these limits may be reduced and additional margin collateral may be required.
A deterioration of the credit standing of one or more of the customers or counter-parties to these contracts may result in BOK Financial recognizing a loss as the fair value of the affected contracts may no longer move in tandem with the offsetting contracts. This occurs if the credit standing of the customer or counterparty deteriorated such that either the fair value of underlying collateral no longer supports the contract or the customer or counterparty’s ability to provide margin collateral was impaired. Credit losses on customer derivatives reduce brokerage and trading revenue in the Consolidated Statements of Earnings.
Derivative contracts are carried at fair value. At
December 31, 2016
, the net fair values of derivative contracts, before consideration of cash margin, reported as assets under these programs totaled
$690 million
compared to
$611 million
at
December 31, 2015
. Derivative contracts carried as assets include foreign exchange contracts with fair values of
$494 million
, to-be-announced residential mortgage-backed securities with fair values of
$120 million
, energy contracts with fair values of
$36 million
, interest rate swaps primarily sold to loan customers with fair values of
$34 million
and equity option contracts with fair values of
$4.4 million
. Before consideration of cash margin paid to counterparties, the aggregate net fair values of derivative contracts held under these programs reported as liabilities totaled
$687 million
.
At
December 31, 2016
, total derivative assets were reduced by
$11 million
of cash collateral received from counterparties and total derivative liabilities were reduced by
$48 million
of cash collateral paid to counterparties related to instruments executed with the same counterparty under a master netting agreement.
A table showing the notional and fair value of derivative assets and liabilities on both a gross and net basis is presented in Note
3
to the Consolidated Financial Statements.
The fair value of derivative contracts reported as assets under these programs, net of cash margin held by the Company, by category of debtor at
December 31, 2016
follows in Table
22
.
Table
22
–
Fair Value of Derivative Contracts
(In thousands)
|
Banks and other financial institutions
|
$
|
289,356
|
|
|
|
Customers
|
285,636
|
|
||
|
Exchanges and clearing organizations
|
104,454
|
|
||
|
Fair value of customer hedge asset derivative contracts, net
|
$
|
679,446
|
|
|
The largest exposure to a single counterparty was to a clearing organization for to-be-announced mortgage-backed securities which totaled $97 million at
December 31, 2016
.
58
Our customer derivative program also introduces liquidity and capital risk. We are required to provide cash margin to certain counterparties when the net negative fair value of the contracts exceeds established limits. Also, changes in commodity prices affect the amount of regulatory capital we are required to hold as support for the fair value of our derivative assets. These risks are modeled as part of the management of these programs. Based on current prices, a decrease in market prices equivalent to $29.52 per barrel of oil would decrease the fair value of derivative assets by $28 million. An increase in prices equivalent to $82.29 per barrel of oil would increase the fair value of derivative assets by $258 million. Liquidity requirements of this program are also affected by our credit rating. A decrease in credit rating to below investment grade would increase our obligation to post cash margin on existing contracts by approximately $15 million. The fair value of our to-be-announced residential mortgage-backed securities and interest rate swap derivative contracts is affected by changes in interest rates. Based on our assessment as of
December 31, 2016
, changes in interest rates would not materially impact regulatory capital or liquidity needed to support this portion of our customer derivative program.
Summary of Loan Loss Experience
We maintain an allowance for loan losses and an accrual for off-balance sheet credit risk. At
December 31, 2016
, the combined allowance for loan losses and accrual for off-balance sheet credit risk totaled
$257 million
or
1.52%
of outstanding loans and
117%
of nonaccruing loans, excluding loans guaranteed by U.S. Government agencies. The allowance for loan losses was
$246 million
and the accrual for off-balance sheet credit risk was
$11 million
. At
December 31, 2015
, the combined allowance for credit losses was
$227 million
or
1.43%
of outstanding loans and
181%
of nonaccruing loans, excluding loans guaranteed by U.S. Government agencies. The allowance for loan losses was
$226 million
and the accrual for off-balance sheet credit risk was
$1.7 million
.
On December 1, 2016, we acquired $492 million of loans in conjunction with the acquisition of Mobank at a fair value of $485 million. The aggregate discount of $7.1 million included $3.7 million for credit risk. None of the acquired loans were considered to be purchase credit impaired loans. No allowance has been attributed to the Mobank loans as of December 31, 2016.
The provision for credit losses is the amount necessary to maintain the allowance for loan losses and an accrual for off-balance sheet credit risk at an amount determined by management to be appropriate based on its evaluation. The provision includes the combined charge or credit to expense for both the allowance for loan losses and the accrual for off-balance sheet credit risk. All losses incurred from lending activities will ultimately be reflected in charge-offs against the allowance for loan losses following funds advanced against outstanding commitments. After evaluating all credit factors, the Company determined that a
$65.0 million
provision for credit losses was necessary due to credit migration in our energy loan portfolio at the beginning of the year due to low energy prices. Trends in credit metrics in the latter half of 2016 have continued to show improvement, largely driven by energy price stability and decreased rates of newly identified nonaccruing and potential problem loans.
Based on currently available information, our expectations for loan growth, historical credit factors by loan type and other qualitative and environmental factors, and including the results of our energy stress testing, discussed in more detail following, we estimate a loan loss provision range of $20 million to $30 million may be necessary to maintain an appropriate allowance for loan losses and accrual for off-balance sheet credit risk in 2017.
59
Table
23
–
Summary of Loan Loss Experience
(In thousands)
|
|
Year Ended December 31,
|
||||||||||||||||||||
|
2016
|
2015
|
2014
|
2013
|
2012
|
|||||||||||||||||
|
Allowance for loan losses:
|
|
|
|||||||||||||||||||
|
Beginning balance
|
$
|
225,524
|
|
$
|
189,056
|
|
$
|
185,396
|
|
$
|
215,507
|
|
$
|
253,481
|
|
||||||
|
Loans charged off:
|
|||||||||||||||||||||
|
Commercial
|
(35,828
|
)
|
(6,734
|
)
|
(3,569
|
)
|
(6,335
|
)
|
(9,341
|
)
|
|||||||||||
|
Commercial real estate
|
—
|
|
(944
|
)
|
(2,047
|
)
|
(5,845
|
)
|
(11,642
|
)
|
|||||||||||
|
Residential mortgage
|
(1,312
|
)
|
(2,205
|
)
|
(4,448
|
)
|
(5,753
|
)
|
(10,047
|
)
|
|||||||||||
|
Personal
|
(5,448
|
)
|
(5,288
|
)
|
(6,168
|
)
|
(7,349
|
)
|
(11,108
|
)
|
|||||||||||
|
Total
|
(42,588
|
)
|
(15,171
|
)
|
(16,232
|
)
|
(25,282
|
)
|
(42,138
|
)
|
|||||||||||
|
Recoveries of loans previously charged off:
|
|||||||||||||||||||||
|
Commercial
|
1,727
|
|
2,729
|
|
5,703
|
|
7,488
|
|
6,128
|
|
1
|
||||||||||
|
Commercial real estate
|
1,283
|
|
11,079
|
|
7,003
|
|
9,420
|
|
5,706
|
|
|||||||||||
|
Residential mortgage
|
1,999
|
|
1,260
|
|
2,000
|
|
1,558
|
|
1,928
|
|
|||||||||||
|
Personal
|
2,747
|
|
3,052
|
|
4,328
|
|
4,778
|
|
5,056
|
|
|||||||||||
|
Total
|
7,756
|
|
18,120
|
|
19,034
|
|
23,244
|
|
18,818
|
|
|||||||||||
|
Net loans recovered (charged off )
|
(34,832
|
)
|
2,949
|
|
2,802
|
|
(2,038
|
)
|
(23,320
|
)
|
|||||||||||
|
Provision for loan losses
|
55,467
|
|
33,519
|
|
858
|
|
(28,073
|
)
|
(14,654
|
)
|
|||||||||||
|
Ending balance
|
$
|
246,159
|
|
$
|
225,524
|
|
$
|
189,056
|
|
$
|
185,396
|
|
$
|
215,507
|
|
||||||
|
Accrual for off-balance sheet credit risk:
|
|||||||||||||||||||||
|
Beginning balance
|
$
|
1,711
|
|
$
|
1,230
|
|
$
|
2,088
|
|
$
|
1,915
|
|
$
|
9,261
|
|
||||||
|
Provision for off-balance sheet credit risk
|
9,533
|
|
481
|
|
(858
|
)
|
173
|
|
(7,346
|
)
|
|||||||||||
|
Ending balance
|
$
|
11,244
|
|
$
|
1,711
|
|
$
|
1,230
|
|
$
|
2,088
|
|
$
|
1,915
|
|
||||||
|
Total combined provision for credit losses
|
$
|
65,000
|
|
$
|
34,000
|
|
$
|
—
|
|
$
|
(27,900
|
)
|
$
|
(22,000
|
)
|
||||||
|
Allowance for loan losses to loans outstanding at period end
|
1.45
|
%
|
1.41
|
%
|
1.33
|
%
|
1.45
|
%
|
1.75
|
%
|
|||||||||||
|
Net charge-offs (recoveries) to average loans
|
0.21
|
%
|
(0.02
|
)%
|
(0.02
|
)%
|
0.02
|
%
|
0.20
|
%
|
|||||||||||
|
Total provision for credit losses to average loans
|
0.40
|
%
|
0.23
|
%
|
—
|
%
|
(0.23
|
)%
|
(0.19
|
)%
|
|||||||||||
|
Recoveries to gross charge-offs
|
18.21
|
%
|
119.44
|
%
|
117.26
|
%
|
91.94
|
%
|
44.66
|
%
|
|||||||||||
|
Allowance for loan losses as a multiple of net charge-offs
|
7.07
|
x
|
(76.47
|
)x
|
(67.47
|
)x
|
90.97
|
x
|
9.24
|
x
|
|||||||||||
|
Accrual for off-balance sheet credit risk to off-balance sheet credit commitments
|
0.11
|
%
|
0.02
|
%
|
0.01
|
%
|
0.03
|
%
|
0.03
|
%
|
|||||||||||
|
Combined allowance for credit losses to loans outstanding at period-end
|
1.52
|
%
|
1.43
|
%
|
1.34
|
%
|
1.47
|
%
|
1.77
|
%
|
|||||||||||
|
1
|
Includes $7.1 million of negative recovery related to a refund of a settlement between BOK Financial and the City of Tulsa invalidated by the Oklahoma Supreme Court. Excluding this refund, BOK Financial net charge-offs to average loans was 0.14%, recoveries to gross charge-offs were 61.51% and the allowance for loan losses as a multiple of net charge-offs was 13.29x for 2012.
|
60
Allowance for Loan Losses
The appropriateness of the allowance for loan losses is assessed by management based on an ongoing quarterly evaluation of the probable estimated losses inherent in the portfolio. The allowance consists of specific allowances attributed to certain impaired loans, general allowances based on estimated loss rates by loan class and non-specific allowances based on general economic conditions, concentration in loans with large balances and other relevant factors.
Loans are considered to be impaired when it is probable that we will not collect all amounts due according to the contractual terms of the loan agreements. This includes all nonaccruing loans, all loans modified in trouble debt restructurings and all government guaranteed loans repurchased from GNMA pools. At
December 31, 2016
, impaired loans totaled
$419 million
, including
$11 million
with specific allowances of
$843 thousand
and
$407 million
with no specific allowances because the loan balances represent the amounts we expect to recover. At
December 31, 2015
, impaired loans totaled
$322 million
, including
$44 million
of impaired loans with specific allowances of
$16 million
and
$278 million
with no specific allowances. All Mobank loans were initially recognized at fair value as of the December 1, 2016 acquisition date. Therefore, no allowance for credit losses has been provided. None of the Mobank loans are impaired at December 31, 2016.
Risk grading guidelines in the OCC Oil and Gas Lending Handbook updated at the beginning of 2016, heavily weight the borrowers' ability to repay total debt, regardless of collateral position. This change in grading methodology has increased loans especially mentioned, potential problem loans and nonaccruing loans. Because substantially all of our loans to energy producers are supported by senior lien positions that, in general, have substantially lower loss exposure, the historical relationship between loan credit risk classification and loss exposure has been more difficult to correlate. Our most recently completed energy portfolio redetermination supported that
$121 million
of impaired energy loans required no allowance for credit losses based on the adequacy of collateral. In addition, $89 million of impaired energy loans are current on all payments due.
General allowances for unimpaired loans are based on an estimated loss rate by loan class. Estimated loss rates for risk-graded loans are either increased or decreased based on changes in risk grading for each loan class. Estimated loss rates for both risk-graded and non-risk graded loans may be further adjusted for inherent risks identified for the given loan class which have not yet been captured in the loss rate.
The aggregate amount of general allowances for all unimpaired loans totaled
$217 million
at
December 31, 2016
, compared to
$179 million
at
December 31, 2015
. The general allowance for the commercial loan portfolio segment
increase
d by
$25 million
primarily related to the prolonged low energy price environment. The general allowance for the commercial real estate loan portfolio segment
increase
d
$9.4 million
over
December 31, 2015
primarily due to loan growth and the mix of commercial real estate loans in the portfolio. The general allowance for residential mortgage loans
decrease
d
$1.3 million
. The general allowance for personal loans
increase
d
$4.6 million
over the prior year.
Nonspecific allowances are maintained for risks beyond factors specific to a particular portfolio segment or loan class. These factors include trends in the economy in our primary lending areas, concentrations in loans with large balances and other relevant factors. Nonspecific allowances totaled
$28 million
at
December 31, 2016
, compared to
$30 million
at
December 31, 2015
. The nonspecific allowance includes consideration of the indirect impact of the prolonged low energy price environment on the broader economies within our geographical footprint that are highly dependent on the energy industry.
An allocation of the allowance for loan losses by loan category follows in Table
24
.
61
Table
24
–
Allowance for Loan Losses Allocation
(Dollars in thousands)
|
December 31,
|
||||||||||||||||||||||||||||||||||
|
2016
|
2015
|
2014
|
2013
|
2012
|
||||||||||||||||||||||||||||||
|
Allowance
|
% of Loans
1
|
Allowance
|
% of Loans
1
|
Allowance
|
% of Loans
1
|
Allowance
|
% of Loans
1
|
Allowance
|
% of Loans
1
|
|||||||||||||||||||||||||
|
Loan category:
|
||||||||||||||||||||||||||||||||||
|
Commercial
|
$
|
140,213
|
|
61.16
|
%
|
$
|
130,334
|
|
64.32
|
%
|
$
|
90,875
|
|
64.02
|
%
|
$
|
79,180
|
|
62.10
|
%
|
$
|
65,280
|
|
62.07
|
%
|
|||||||||
|
Commercial real estate
|
50,749
|
|
22.42
|
%
|
41,391
|
|
20.44
|
%
|
42,445
|
|
19.20
|
%
|
41,573
|
|
18.88
|
%
|
54,884
|
|
18.11
|
%
|
||||||||||||||
|
Residential mortgage
|
18,224
|
|
11.48
|
%
|
19,509
|
|
11.77
|
%
|
23,458
|
|
13.72
|
%
|
29,465
|
|
16.04
|
%
|
41,703
|
|
16.61
|
%
|
||||||||||||||
|
Personal
|
8,773
|
|
4.94
|
%
|
4,164
|
|
3.47
|
%
|
4,233
|
|
3.06
|
%
|
6,965
|
|
2.98
|
%
|
9,453
|
|
3.21
|
%
|
||||||||||||||
|
Nonspecific allowance
|
28,200
|
|
30,126
|
|
28,045
|
|
28,213
|
|
44,187
|
|
||||||||||||||||||||||||
|
Total
|
$
|
246,159
|
|
100.00
|
%
|
$
|
225,524
|
|
100.00
|
%
|
$
|
189,056
|
|
100.00
|
%
|
$
|
185,396
|
|
100.00
|
%
|
$
|
215,507
|
|
100.00
|
%
|
|||||||||
1
Represents ratio of loan category balance to total loans.
Our loan monitoring process also identified certain accruing substandard loans, based on regulatory guidelines, that possess more than the normal amount of risk due to deterioration in the financial condition of the borrower or the value of the collateral. Because the borrowers are still performing in accordance with the original terms of the loan agreements, and no loss of principal or interest is anticipated, these loans were not included in nonperforming assets. Known information does, however, cause management concern as to the borrowers’ continued ability to comply with current repayment terms. These potential problem loans totaled
$399 million
at
December 31, 2016
composed primarily of
$308 million
or
12%
of energy loans,
$38 million
or
1%
of services loans,
$16 million
or less than
1%
of healthcare loans,
$15 million
or
3%
of manufacturing loans and
$13 million
or less than
1%
of wholesale/retail sector loans. Potential problem loans totaled
$155 million
at
December 31, 2015
.
Our loan monitoring process also identified loans considered to be "other loans especially mentioned" based on regulatory guidelines. Other loans especially mentioned are in compliance with the original terms of the agreement, but may have a weakness that deserves management's close attention. Other loans especially mentioned totaled
$230 million
at
December 31, 2016
and were composed primarily of
$120 million
or
5%
of energy loans,
$44 million
or
2%
of healthcare loans,
$27 million
or
5%
of manufacturing loans,
$17 million
or
1%
of wholesale/retail sector loans and
$11 million
or less than 1% of service sector loans. Other loans especially mentioned totaled
$386 million
at
December 31, 2015
.
We updated our energy portfolio stress test at
December 31, 2016
to determine how the energy portfolio may respond in a prolonged low-price environment. Stress test assumptions included a starting price of $2.00 per million BTUs for natural gas and $37.50 per barrel of oil, gradually escalating over seven years to a maximum of $3.00 and $55, respectively. In this scenario, the energy portfolio exhibits a greater stress than the Company's fifteen year historical loss rate on energy production loans of 18 basis points. The results of the stress test are factored into our expectation that the loan loss provision could range from $20 million to $30 million for 2017, based on current observed conditions. The portion of the combined allowance for credit losses attributable to the energy portfolio totaled 3.68% of outstanding energy loans at
December 31, 2016
, compared to 2.89% of outstanding energy loans at
December 31, 2015
.
Net Loans Charged Off
Loans are charged off against the allowance for loan losses when the loan balance or a portion of the loan balance is no longer covered by the paying capacity of the borrower based on an evaluation of available cash resources and collateral value. Internally risk graded loans are evaluated quarterly and charge-offs are taken in the quarter in which the loss is identified. Non-risk graded loans are generally charged off when payments are between 60 days and 180 days past due, depending on loan class. In addition, non-risk graded loans are generally charged-down to collateral value within 60 days of being notified of a borrower's bankruptcy filing, regardless of payment status.
BOK Financial had net loans charged off of
$34.8 million
or
0.21%
of average loans for
2016
compared to a net recovery of
$2.9 million
or
(0.02)%
of average loans in
2015
.
62
Net commercial loans charged off totaled
$34.1 million
, primarily from energy loans. Energy loan charge-offs included $21.6 million from a single borrower due to steeper than expected production declines and higher lease operating expenses. Net commercial real estate loan recoveries totaled
$1.3 million
. Net recoveries of residential mortgage loans totaled
$687 thousand
for the year and net charge-offs of personal loans were
$2.7 million
.
|
Table 25 – Nonperforming Assets
(In thousands)
|
||||||||||||||||||||
|
December 31,
|
||||||||||||||||||||
|
2016
|
2015
|
2014
|
2013
|
2012
|
||||||||||||||||
|
Nonaccruing loans:
|
|
|
|
|
||||||||||||||||
|
Commercial
|
$
|
178,953
|
|
$
|
76,424
|
|
$
|
13,527
|
|
$
|
16,760
|
|
$
|
24,467
|
|
|||||
|
Commercial real estate
|
5,521
|
|
9,001
|
|
18,557
|
|
40,850
|
|
60,626
|
|
||||||||||
|
Residential mortgage
|
46,220
|
|
61,240
|
|
48,121
|
|
42,320
|
|
46,608
|
|
||||||||||
|
Personal
|
290
|
|
463
|
|
566
|
|
1,219
|
|
2,709
|
|
||||||||||
|
Total nonaccruing loans
|
230,984
|
|
147,128
|
|
80,771
|
|
101,149
|
|
134,410
|
|
||||||||||
|
Accruing renegotiated loans guaranteed by U.S. government agencies
|
81,370
|
|
74,049
|
|
73,985
|
|
54,322
|
|
38,515
|
|
||||||||||
|
Real estate and other repossessed assets:
|
||||||||||||||||||||
|
Guaranteed by U.S. government agencies
1
|
—
|
|
—
|
|
49,898
|
|
37,431
|
|
22,365
|
|
||||||||||
|
Other
|
44,287
|
|
30,731
|
|
51,963
|
|
54,841
|
|
81,426
|
|
||||||||||
|
Real estate and other repossessed assets
|
44,287
|
|
30,731
|
|
101,861
|
|
92,272
|
|
103,791
|
|
||||||||||
|
Total nonperforming assets
|
$
|
356,641
|
|
$
|
251,908
|
|
$
|
256,617
|
|
$
|
247,743
|
|
$
|
276,716
|
|
|||||
|
Total nonperforming assets excluding those guaranteed by U.S. government agencies
|
$
|
263,425
|
|
$
|
155,959
|
|
$
|
129,022
|
|
$
|
155,213
|
|
$
|
215,347
|
|
|||||
|
Nonaccruing loans by loan class:
|
|
|
|
|
||||||||||||||||
|
Commercial:
|
|
|
|
|
||||||||||||||||
|
Energy
|
$
|
132,499
|
|
$
|
61,189
|
|
$
|
1,416
|
|
$
|
1,860
|
|
$
|
2,460
|
|
|||||
|
Services
|
8,173
|
|
10,290
|
|
5,201
|
|
4,922
|
|
12,090
|
|
||||||||||
|
Healthcare
|
825
|
|
1,072
|
|
1,380
|
|
1,586
|
|
3,166
|
|
||||||||||
|
Wholesale/retail
|
11,407
|
|
2,919
|
|
4,149
|
|
6,969
|
|
3,077
|
|
||||||||||
|
Manufacturing
|
4,931
|
|
331
|
|
450
|
|
592
|
|
2,007
|
|
||||||||||
|
Other
|
21,118
|
|
623
|
|
931
|
|
831
|
|
1,667
|
|
||||||||||
|
Total commercial
|
178,953
|
|
76,424
|
|
13,527
|
|
16,760
|
|
24,467
|
|
||||||||||
|
Commercial real estate:
|
|
|
|
|
||||||||||||||||
|
Retail
|
326
|
|
1,319
|
|
3,926
|
|
4,857
|
|
8,117
|
|
||||||||||
|
Multifamily
|
38
|
|
274
|
|
—
|
|
7
|
|
2,706
|
|
||||||||||
|
Office
|
426
|
|
651
|
|
3,420
|
|
6,391
|
|
6,829
|
|
||||||||||
|
Industrial
|
76
|
|
76
|
|
—
|
|
252
|
|
3,968
|
|
||||||||||
|
Residential construction and land development
|
3,433
|
|
4,409
|
|
5,299
|
|
17,377
|
|
26,131
|
|
||||||||||
|
Other commercial real estate
|
1,222
|
|
2,272
|
|
5,912
|
|
11,966
|
|
12,875
|
|
||||||||||
|
Total commercial real estate
|
5,521
|
|
9,001
|
|
18,557
|
|
40,850
|
|
60,626
|
|
||||||||||
|
Residential mortgage:
|
|
|
|
|
||||||||||||||||
|
Permanent mortgage
|
22,855
|
|
28,984
|
|
34,845
|
|
34,279
|
|
39,863
|
|
||||||||||
|
Permanent mortgages guaranteed by U.S. government agencies
|
11,846
|
|
21,900
|
|
3,712
|
|
777
|
|
489
|
|
||||||||||
|
Home equity
|
11,519
|
|
10,356
|
|
9,564
|
|
7,264
|
|
6,256
|
|
||||||||||
|
Total residential mortgage
|
46,220
|
|
61,240
|
|
48,121
|
|
42,320
|
|
46,608
|
|
||||||||||
|
Personal
|
290
|
|
463
|
|
566
|
|
1,219
|
|
2,709
|
|
||||||||||
|
Total nonaccruing loans
|
$
|
230,984
|
|
$
|
147,128
|
|
$
|
80,771
|
|
$
|
101,149
|
|
$
|
134,410
|
|
|||||
63
|
Table 25 – Nonperforming Assets
(In thousands)
|
||||||||||||||||||||
|
December 31,
|
||||||||||||||||||||
|
2016
|
2015
|
2014
|
2013
|
2012
|
||||||||||||||||
|
Nonaccruing loans as % of outstanding loan balance for class:
|
||||||||||||||||||||
|
Nonaccruing loans by loan class:
|
||||||||||||||||||||
|
Commercial:
|
||||||||||||||||||||
|
Energy
|
5.30
|
%
|
1.98
|
%
|
0.05
|
%
|
0.08
|
%
|
0.10
|
%
|
||||||||||
|
Services
|
0.26
|
%
|
0.37
|
%
|
0.22
|
%
|
0.22
|
%
|
0.56
|
%
|
||||||||||
|
Healthcare
|
0.04
|
%
|
0.06
|
%
|
0.09
|
%
|
0.12
|
%
|
0.29
|
%
|
||||||||||
|
Wholesale/retail
|
0.72
|
%
|
0.21
|
%
|
0.29
|
%
|
0.58
|
%
|
0.28
|
%
|
||||||||||
|
Manufacturing
|
0.96
|
%
|
0.06
|
%
|
0.08
|
%
|
0.15
|
%
|
0.58
|
%
|
||||||||||
|
Other
|
4.31
|
%
|
0.12
|
%
|
0.22
|
%
|
0.19
|
%
|
0.35
|
%
|
||||||||||
|
Total commercial
|
1.72
|
%
|
0.75
|
%
|
0.15
|
%
|
0.21
|
%
|
0.32
|
%
|
||||||||||
|
Commercial real estate:
|
||||||||||||||||||||
|
Retail
|
0.04
|
%
|
0.17
|
%
|
0.59
|
%
|
0.83
|
%
|
1.55
|
%
|
||||||||||
|
Multifamily
|
—
|
%
|
0.04
|
%
|
—
|
%
|
—
|
%
|
0.67
|
%
|
||||||||||
|
Office
|
0.05
|
%
|
0.10
|
%
|
0.82
|
%
|
1.55
|
%
|
1.60
|
%
|
||||||||||
|
Industrial
|
0.01
|
%
|
0.01
|
%
|
—
|
%
|
0.10
|
%
|
1.61
|
%
|
||||||||||
|
Residential construction and land development
|
2.53
|
%
|
2.75
|
%
|
3.69
|
%
|
8.42
|
%
|
10.32
|
%
|
||||||||||
|
Other commercial real estate
|
0.36
|
%
|
0.65
|
%
|
1.60
|
%
|
3.06
|
%
|
3.42
|
%
|
||||||||||
|
Total commercial real estate
|
0.14
|
%
|
0.28
|
%
|
0.68
|
%
|
1.69
|
%
|
2.72
|
%
|
||||||||||
|
Residential mortgage:
|
||||||||||||||||||||
|
Permanent mortgage
|
2.27
|
%
|
3.07
|
%
|
3.59
|
%
|
3.23
|
%
|
3.55
|
%
|
||||||||||
|
Permanent mortgages guaranteed by U.S. government agencies
|
5.94
|
%
|
11.12
|
%
|
1.80
|
%
|
0.43
|
%
|
0.30
|
%
|
||||||||||
|
Home equity
|
1.55
|
%
|
1.41
|
%
|
1.24
|
%
|
0.90
|
%
|
0.82
|
%
|
||||||||||
|
Total residential mortgage
|
2.37
|
%
|
3.26
|
%
|
2.47
|
%
|
2.06
|
%
|
2.28
|
%
|
||||||||||
|
Personal
|
0.03
|
%
|
0.08
|
%
|
0.13
|
%
|
0.32
|
%
|
0.68
|
%
|
||||||||||
|
Total nonaccruing loans
|
1.36
|
%
|
0.92
|
%
|
0.57
|
%
|
0.79
|
%
|
1.09
|
%
|
||||||||||
|
Allowance for loan losses to nonaccruing loans
2
|
112.33
|
%
|
180.09
|
%
|
245.34
|
%
|
184.71
|
%
|
160.92
|
%
|
||||||||||
|
Accruing loans 90 days or more past due
2
|
$
|
5
|
|
$
|
1,207
|
|
$
|
125
|
|
$
|
1,415
|
|
$
|
3,925
|
|
|||||
|
Foregone interest on nonaccruing loans
3
|
15,990
|
|
7,432
|
|
8,170
|
|
5,361
|
|
8,587
|
|
||||||||||
|
1
|
Approximately $50 million was reclassified from Real estate and other repossessed assets to Receivables on the balance sheet on January 1, 2015 with the adoption of Financial Accounting Standards Board Update No. 2014-14,
Classification of Certain Government-Guaranteed Mortgage Loans Upon Foreclosure
("ASU 2014-14"). With the implementation of ASU 2014-14, upon foreclosure of loans for which the loan balance is expected to be recovered from the guarantee by a U.S. government agency, the loan balance is directly reclassified to other receivables without including such foreclosed assets in real estate and other repossessed assets.
|
|
2
|
Excludes residential mortgages guaranteed by agencies of the U.S. government.
|
|
3
|
Interest collected and recognized on nonaccruing loans was not significant in
2016
and previous years.
|
Nonperforming assets
increase
d
$105 million
during
2016
to
$357 million
or
2.09%
of outstanding loans and repossessed assets at
December 31, 2016
. Nonaccruing loans totaled
$231 million
, accruing renegotiated residential mortgage loans totaled
$81 million
and real estate and other repossessed assets totaled
$44 million
. All accruing renegotiated residential mortgage loans and
$12 million
of nonaccruing loans are guaranteed by U.S. government agencies. Excluding assets guaranteed by U.S. government agencies, nonperforming assets
increase
d
$107 million
during the year to
$263 million
or
1.56%
of outstanding non-guaranteed loans and repossessed assets. The increase was primarily due to nonaccruing energy and other commercial & industrial loans, as well as real estate and other repossessed assets from repossession of collateral of certain energy loans. The Company generally retains nonperforming assets to maximize potential recovery, which may cause future nonperforming assets to decrease more slowly.
64
Loans are generally classified as nonaccruing when it becomes probable that we will not collect the full contractual principal and interest. As more fully discussed in Note
4
to the Consolidated Financial Statements, we may modify loans in a troubled debt restructuring. Modifications may include extension of payment terms and rate concessions. We generally do not forgive principal or accrued but unpaid interest. All loans modified in troubled debt restructurings, except residential mortgage loans guaranteed by U.S. government agencies, are classified as nonaccruing. We may renew matured nonaccruing loans. All nonaccruing loans, including those renewed or modified in troubled debt restructurings, are charged off when the loan balance is no longer covered by the paying capacity of the borrower based on a quarterly evaluation of available cash resources and collateral value. All nonaccruing loans generally remain on nonaccruing status until full collection of principal and interest in accordance with the original terms, including principal previously charged off, is probable. We generally do not voluntarily modify personal loans to troubled borrowers. Personal loans modified at the direction of bankruptcy court orders are identified as troubled debt restructurings and classified as nonaccruing.
As of
December 31, 2016
, renegotiated loans consist solely of accruing residential mortgage loans guaranteed by U.S. government agencies that have been modified in troubled debt restructurings. See Note
4
to the Consolidated Financial Statements for additional discussion of troubled debt restructurings. Generally, we modify residential mortgage loans primarily by reducing interest rates and extending the number of payments in accordance with U.S. government agency guidelines. No unpaid principal or interest is forgiven. Interest continues to accrue based on the modified terms of the loan. Modified loans guaranteed by U.S. government agencies under residential mortgage loan programs may be sold once they become eligible according to U.S. government agency guidelines.
A rollforward of nonperforming assets for the year ended
December 31, 2016
follows in Table
26
.
Table
26
–
Rollforward of Nonperforming Assets
(In thousands)
|
Year Ended December 31, 2016
|
||||||||||||||||
|
|
Nonaccruing Loans
|
Renegotiated Loans
|
Real Estate and Other Repossessed Assets
|
Total Nonperforming Assets
|
||||||||||||
|
Balance, December 31, 2015
|
$
|
147,128
|
|
$
|
74,049
|
|
$
|
30,731
|
|
$
|
251,908
|
|
||||
|
Additions
|
273,969
|
|
46,593
|
|
—
|
|
320,562
|
|
||||||||
|
Net transfer to premises and equipment
|
—
|
|
—
|
|
2,109
|
|
2,109
|
|
||||||||
|
Payments
|
(97,214
|
)
|
(1,808
|
)
|
—
|
|
(99,022
|
)
|
||||||||
|
Charge-offs
|
(42,588
|
)
|
—
|
|
—
|
|
(42,588
|
)
|
||||||||
|
Net gains (losses) and write-downs
|
—
|
|
—
|
|
1,108
|
|
1,108
|
|
||||||||
|
Foreclosure of nonaccruing loans
|
(34,282
|
)
|
—
|
|
34,282
|
|
—
|
|
||||||||
|
Foreclosure of loans guaranteed by U.S. government agencies
|
(18,045
|
)
|
(9,471
|
)
|
—
|
|
(27,516
|
)
|
||||||||
|
Proceeds from sales
|
—
|
|
(26,384
|
)
|
(25,596
|
)
|
(51,980
|
)
|
||||||||
|
Acquisition of Mobank
|
—
|
|
—
|
|
1,740
|
|
1,740
|
|
||||||||
|
Net transfers to nonaccruing loans
|
2,061
|
|
(2,061
|
)
|
—
|
|
—
|
|
||||||||
|
Return to accrual status
|
(45
|
)
|
—
|
|
—
|
|
(45
|
)
|
||||||||
|
Other, net
|
—
|
|
452
|
|
(87
|
)
|
365
|
|
||||||||
|
Balance, December 31, 2016
|
$
|
230,984
|
|
$
|
81,370
|
|
$
|
44,287
|
|
|
$
|
356,641
|
|
|||
We foreclose on loans guaranteed by U.S. government agencies in accordance with agency guidelines. Generally these loans are not eligible for modification programs or have failed to comply with modified loan terms. Principal is guaranteed by agencies of the U.S. government, subject to limitations and credit risk is minimal. At foreclosure, these amounts are transferred to claims receivable accounts. These properties will be conveyed to the agencies and receivables collected once applicable criteria have been met.
Nonaccruing loans totaled
$231 million
or
1.36%
of outstanding loans at
December 31, 2016
compared to
$147 million
or
0.92%
of outstanding loans at
December 31, 2015
. Nonaccruing loans
increase
d
$84 million
from
December 31, 2015
. Newly identified nonaccruing loans totaled
$274 million
for
2016
, partially offset by
$97 million
of payments,
$43 million
of charge-offs and
$34 million
of foreclosures.
65
Commercial
Nonaccruing commercial loans totaled
$179 million
or
1.72%
of total commercial loans at
December 31, 2016
, compared to
$76 million
or
0.75%
of total commercial loans at
December 31, 2015
. Nonaccruing commercial loans
increase
d
$103 million
during
2016
. Newly identified nonaccruing commercial loans totaled
$225 million
, offset by
$61 million
in payments,
$36 million
of charge-offs and
$25 million
of repossessions.
Nonaccruing commercial loans at
December 31, 2016
were primarily composed of
$132 million
or
5.30%
of total energy loans,
$21 million
or
4.31%
of other commercial and industrial loans,
$11 million
or
0.72%
of wholesale/retail loans and
$8.2 million
or
0.26%
of total services loans.
Commercial Real Estate
Nonaccruing commercial real estate loans were
$5.5 million
or
0.14%
of outstanding commercial real estate loans at
December 31, 2016
, down from
$9.0 million
or
0.28%
of outstanding commercial real estate loans at
December 31, 2015
. The
$3.5 million
decrease
was primarily due to
$6.8 million
of cash payments received, partially offset by
$3.4 million
of newly identified commercial real estate loans during the year. There were no charge-offs or foreclosures of commercial real estate loans in 2016.
Nonaccruing commercial real estate loans were composed of
$3.4 million
or
2.53%
of total residential land development and construction loans and
$1.2 million
or
0.36%
of total other commercial real estate loans.
Residential Mortgage and Personal
Nonaccruing residential mortgage loans totaled
$46 million
or
2.37%
of outstanding residential mortgage loans at
December 31, 2016
, compared to
$61 million
or
3.26%
of outstanding residential mortgage loans at
December 31, 2015
. Newly identified nonaccruing residential mortgage loans of
$39 million
were offset by
$28 million
of cash payments,
$26 million
of foreclosures and
$1.3 million
of loans charged off during the year. Nonaccruing residential mortgage loans primarily consisted of
$23 million
or
2.27%
of non-guaranteed permanent residential mortgage loans and
$12 million
or
5.94%
of permanent residential mortgage loans guaranteed by U.S. government agencies. Nonaccruing home equity loans totaled
$12 million
or
1.55%
of total home equity loans.
Payments on accruing residential mortgage loans and personal loans may be delinquent. The composition of residential mortgage loans and personal loans past due but still accruing is included in the following Table
27
. Substantially all non-guaranteed residential loans past due 90 days or more are nonaccruing. At
December 31, 2016
, residential mortgage loans 30 to 59 days past due of
$5.6 million
were largely unchanged compared to the prior year. Residential mortgage loans 60 to 89 days past due increased $901 thousand over
December 31, 2015
. Personal loans 30 to 59 days past due decreased $76 thousand and personal loans 60 to 89 days past due increased $235 thousand compared to
December 31, 2015
.
Table
27
–
Residential Mortgage and Personal Loans Past Due
(In thousands)
|
|
December 31, 2016
|
December 31, 2015
|
||||||||||||||||||||||
|
|
90 Days or More
|
60 to 89 Days
|
30 to 59 Days
|
90 Days or More
|
60 to 89 Days
|
30 to 59 Days
|
||||||||||||||||||
|
Residential mortgage:
|
|
|
|
|
||||||||||||||||||||
|
Permanent mortgage
1
|
$
|
—
|
|
$
|
1,280
|
|
$
|
3,299
|
|
$
|
—
|
|
$
|
—
|
|
$
|
3,290
|
|
||||||
|
Home equity
|
—
|
|
337
|
|
2,276
|
|
20
|
|
716
|
|
2,379
|
|
||||||||||||
|
Total residential mortgage
|
$
|
—
|
|
$
|
1,617
|
|
$
|
5,575
|
|
$
|
20
|
|
$
|
716
|
|
$
|
5,669
|
|
||||||
|
|
|
|
|
|
|
|
|
|||||||||||||||||
|
Personal
|
$
|
5
|
|
$
|
263
|
|
$
|
589
|
|
$
|
8
|
|
$
|
28
|
|
$
|
665
|
|
||||||
|
1
|
Excludes past due residential mortgage loans guaranteed by agencies of the U.S. government.
|
66
Real Estate and Other Repossessed Assets
Real estate and other repossessed assets are assets acquired in partial or total forgiveness of loans. The assets are carried at the lower of cost as determined by fair value at date of foreclosure or current fair value, less estimated selling costs.
Real estate and other repossessed assets totaled
$44 million
at
December 31, 2016
, a
$14 million
increase
over
December 31, 2015
. The distribution of real estate and other repossessed assets distributed primarily by collateral location is included in Table
28
following.
Table
28
–
Real Estate and Other Repossessed Assets by Collateral Location
as of
December 31, 2016
(In thousands)
|
|
||||||||||||||||||||||||||||||||||||
|
|
Oklahoma
|
Texas
|
Colorado
|
Arkansas
|
New
Mexico
|
Arizona
|
Kansas/
Missouri
|
Other
|
Total
|
|||||||||||||||||||||||||||
|
Oil and gas properties
|
$
|
—
|
|
$
|
25,421
|
|
$
|
—
|
|
$
|
—
|
|
$
|
—
|
|
$
|
—
|
|
$
|
—
|
|
$
|
—
|
|
$
|
25,421
|
|
|||||||||
|
1-4 family residential properties
|
4,198
|
|
305
|
|
—
|
|
472
|
|
1,927
|
|
780
|
|
511
|
|
428
|
|
8,621
|
|
||||||||||||||||||
|
Developed commercial real estate properties
|
64
|
|
—
|
|
2,637
|
|
—
|
|
590
|
|
198
|
|
1,296
|
|
—
|
|
4,785
|
|
||||||||||||||||||
|
Undeveloped land
|
1,350
|
|
1,305
|
|
—
|
|
—
|
|
—
|
|
306
|
|
1,740
|
|
—
|
|
4,701
|
|
||||||||||||||||||
|
Residential land development properties
|
26
|
|
—
|
|
210
|
|
—
|
|
—
|
|
499
|
|
2
|
|
—
|
|
737
|
|
||||||||||||||||||
|
Vehicles
|
4
|
|
18
|
|
—
|
|
—
|
|
—
|
|
|
|
—
|
|
—
|
|
22
|
|
||||||||||||||||||
|
Total real estate and other repossessed assets
|
$
|
5,642
|
|
$
|
27,049
|
|
$
|
2,847
|
|
$
|
472
|
|
$
|
2,517
|
|
$
|
1,783
|
|
$
|
3,549
|
|
$
|
428
|
|
$
|
44,287
|
|
|||||||||
Undeveloped land is primarily zoned for commercial development. Developed commercial real estate properties are primarily completed with no additional construction necessary for sale.
67
Liquidity and Capital
Based on the average balances for
2016
, approximately
65%
of our funding was provided by deposit accounts,
21%
from borrowed funds,
1%
from long-term subordinated debt and
10%
from equity. Our funding sources, which primarily include deposits and borrowings from the Federal Home Loan Banks, provide adequate liquidity to meet our operating needs.
Subsidiary Banks
Deposits and borrowed funds are the primary sources of liquidity for the subsidiary banks. Deposit accounts represent our largest funding source. We compete for retail and commercial deposits by offering a broad range of products and services and focusing on customer convenience. Retail deposit growth is supported through personal and small business checking, online bill paying services, mobile banking services, an extensive network of branch locations and ATMs and our Express Bank call center. Commercial deposit growth is supported by offering treasury management and lockbox services. We also acquire brokered deposits when the cost of funds is advantageous to other funding sources.
Table
29
-
Average Deposits by Line of Business
(In thousands)
|
Year Ended December 31,
|
|||||||
|
|
2016
|
2015
|
|||||
|
Commercial Banking
|
$
|
8,430,507
|
|
$
|
8,773,512
|
|
|
|
Consumer Banking
|
6,632,687
|
|
6,668,520
|
|
|||
|
Wealth Management
|
4,867,293
|
|
4,573,710
|
|
|||
|
Subtotal
|
19,930,487
|
|
20,015,742
|
|
|||
|
Funds Management and other
|
962,086
|
|
917,504
|
|
|||
|
Total
|
$
|
20,892,573
|
|
$
|
20,933,246
|
|
|
Average deposits for
2016
totaled
$20.9 billion
and represented approximately
65%
of total liabilities and capital compared with
$20.9 billion
and
68%
of total liabilities and capital for
2015
. Average deposits
decrease
d
$41 million
compared to the prior year. Demand deposits grew by
$426 million
, offset by a
$175 million
decrease
in interest-bearing transaction deposit account balances and a
$328 million
decrease
in time deposits.
Average deposits attributed to Commercial Banking were
$8.4 billion
for
2016
, a
decrease
of
$343 million
or
4%
compared to
2015
. Decreased interest-bearing transaction account and time deposit balances, were partially offset by growth in demand deposit balances. Average balances attributed to our commercial & industrial loan customers
decrease
d
$277 million
or
6%
. Average balances attributed to our energy customers
decrease
d
$116 million
or
8%
. Average balances attributed to commercial real estate customers were
$53 million
or
10%
lower than in the prior year. Small business banking customer average balances
increase
d
$66 million
or
5%
and average balances attributed to our healthcare customers
increase
d
$59 million
or
9%
. Commercial customers continue to maintain large cash reserves primarily due to low yields available on other high quality investment alternatives and to minimize deposit service charges through the earnings credit. The earnings credit is a non-cash method that enables commercial customers to offset deposit service charges based on account balances. Commercial account balances may decrease as short-term interest rates rise and commercial customers redeploy cash to better yielding investment alternatives.
Average Consumer Banking deposit balances were largely unchanged compared to the prior year. Average demand deposit balances grew by
$118 million
or
8%
and average interest-bearing transaction accounts
increase
d
$52 million
or
2%
. Average savings account balances were
up
$30 million
or
8%
. Higher costing time deposit balances
decrease
d
$235 million
or
17%
. Average Wealth Management deposit balances
increase
d
$294 million
or
6%
over the prior year. Non-interest-bearing demand deposits
increase
d
$184 million
and interest-bearing transaction balances
increase
d
$171 million
, partially offset by a
$64 million
decrease
in time deposits.
The general trend of increased deposits over the past several years reflects modest growth in the overall economy and low short-term interest rates. If economic activity were to improve significantly, deposits may decline as customers deploy funds into projects. In addition, if short-term interest rates were to increase further, customers could shift deposits from non-interest bearing demand deposits into interest-bearing alternatives.
68
Table
30
- Maturity of Domestic CDs and Public
Funds in Amounts of $100,000 or More
(In thousands)
|
December 31,
|
||||||||
|
2016
|
2015
|
|||||||
|
Months to maturity:
|
||||||||
|
3 or less
|
$
|
295,755
|
|
$
|
292,292
|
|
||
|
Over 3 through 6
|
243,210
|
|
206,935
|
|
||||
|
Over 6 through 12
|
315,506
|
|
268,894
|
|
||||
|
Over 12
|
590,981
|
|
746,719
|
|
||||
|
Total
|
$
|
1,445,452
|
|
$
|
1,514,840
|
|
||
Brokered deposits included in time deposits averaged
$384 million
for
2016
compared to
$416 million
for
2015
. Brokered deposits included in time deposits totaled
$417 million
at
December 31, 2016
and
$358 million
at
December 31, 2015
.
Average interest-bearing transaction accounts for
2016
included $732 million of brokered deposits compared to $573 million for
2015
. Brokered deposits included in interest-bearing transaction accounts totaled $1.3 billion at
December 31, 2016
and $561 million at
December 31, 2015
. The increase in brokered interest-bearing transaction account balances was primarily due to use of a reciprocal program that spreads large customer deposits among participating banks in amounts that qualify FDIC insurance. In exchange, we also receive deposits from participating banks in amounts that qualify for FDIC insurance. Our increased use of this reciprocal program has enabled us to reduce the amount of deposits we are required to collateralize, thereby improving liquidity.
69
The distribution of our period end deposit account balances among principal markets follows in Table
31
.
|
Table 31 -- Period End Deposits by Principal Market Area
|
||||||||||||||||||||
|
(In thousands)
|
||||||||||||||||||||
|
December 31,
|
||||||||||||||||||||
|
2016
|
2015
|
2014
|
2013
|
2012
|
||||||||||||||||
|
Bank of Oklahoma:
|
|
|
||||||||||||||||||
|
Demand
|
$
|
3,993,170
|
|
$
|
4,133,520
|
|
$
|
3,828,819
|
|
$
|
3,432,940
|
|
$
|
4,207,263
|
|
|||||
|
Interest-bearing:
|
||||||||||||||||||||
|
Transaction
|
6,345,536
|
|
5,971,819
|
|
6,117,886
|
|
6,318,045
|
|
6,023,384
|
|
||||||||||
|
Savings
|
241,696
|
|
226,733
|
|
206,357
|
|
191,880
|
|
163,512
|
|
||||||||||
|
Time
|
1,118,355
|
|
1,202,274
|
|
1,301,194
|
|
1,214,507
|
|
1,267,854
|
|
||||||||||
|
Total interest-bearing
|
7,705,587
|
|
7,400,826
|
|
7,625,437
|
|
7,724,432
|
|
7,454,750
|
|
||||||||||
|
Total Bank of Oklahoma
|
11,698,757
|
|
11,534,346
|
|
11,454,256
|
|
11,157,372
|
|
11,662,013
|
|
||||||||||
|
Bank of Texas:
|
||||||||||||||||||||
|
Demand
|
3,137,009
|
|
2,627,764
|
|
2,639,732
|
|
2,481,603
|
|
2,606,176
|
|
||||||||||
|
Interest-bearing:
|
||||||||||||||||||||
|
Transaction
|
2,388,812
|
|
2,132,099
|
|
2,065,723
|
|
1,966,580
|
|
2,129,084
|
|
||||||||||
|
Savings
|
83,101
|
|
77,902
|
|
72,037
|
|
64,632
|
|
58,429
|
|
||||||||||
|
Time
|
535,642
|
|
549,740
|
|
547,316
|
|
638,465
|
|
762,233
|
|
||||||||||
|
Total interest-bearing
|
3,007,555
|
|
2,759,741
|
|
2,685,076
|
|
2,669,677
|
|
2,949,746
|
|
||||||||||
|
Total Bank of Texas
|
6,144,564
|
|
5,387,505
|
|
5,324,808
|
|
5,151,280
|
|
5,555,922
|
|
||||||||||
|
Bank of Albuquerque:
|
||||||||||||||||||||
|
Demand
|
627,979
|
|
487,286
|
|
487,819
|
|
502,395
|
|
427,510
|
|
||||||||||
|
Interest-bearing:
|
||||||||||||||||||||
|
Transaction
|
590,571
|
|
563,723
|
|
519,544
|
|
529,140
|
|
511,758
|
|
||||||||||
|
Savings
|
49,963
|
|
43,672
|
|
37,471
|
|
33,944
|
|
31,926
|
|
||||||||||
|
Time
|
238,408
|
|
267,821
|
|
295,798
|
|
327,281
|
|
364,928
|
|
||||||||||
|
Total interest-bearing
|
878,942
|
|
875,216
|
|
852,813
|
|
890,365
|
|
908,612
|
|
||||||||||
|
Total Bank of Albuquerque
|
1,506,921
|
|
1,362,502
|
|
1,340,632
|
|
1,392,760
|
|
1,336,122
|
|
||||||||||
|
Bank of Arkansas:
|
||||||||||||||||||||
|
Demand
|
26,389
|
|
27,252
|
|
35,996
|
|
38,566
|
|
39,897
|
|
||||||||||
|
Interest-bearing:
|
||||||||||||||||||||
|
Transaction
|
105,232
|
|
202,857
|
|
158,115
|
|
144,018
|
|
101,868
|
|
||||||||||
|
Savings
|
2,192
|
|
1,747
|
|
1,936
|
|
1,986
|
|
2,239
|
|
||||||||||
|
Time
|
16,696
|
|
24,983
|
|
28,520
|
|
32,949
|
|
42,573
|
|
||||||||||
|
Total interest-bearing
|
124,120
|
|
229,587
|
|
188,571
|
|
178,953
|
|
146,680
|
|
||||||||||
|
Total Bank of Arkansas
|
150,509
|
|
256,839
|
|
224,567
|
|
217,519
|
|
186,577
|
|
||||||||||
70
|
Table 31 -- Period End Deposits by Principal Market Area
|
||||||||||||||||||||
|
(In thousands)
|
||||||||||||||||||||
|
December 31,
|
||||||||||||||||||||
|
2016
|
2015
|
2014
|
2013
|
2012
|
||||||||||||||||
|
Colorado State Bank & Trust:
|
||||||||||||||||||||
|
Demand
|
576,000
|
|
497,318
|
|
445,755
|
|
409,942
|
|
336,252
|
|
||||||||||
|
Interest-bearing:
|
||||||||||||||||||||
|
Transaction
|
616,679
|
|
616,697
|
|
631,874
|
|
541,675
|
|
676,144
|
|
||||||||||
|
Savings
|
32,866
|
|
31,927
|
|
29,811
|
|
26,880
|
|
25,889
|
|
||||||||||
|
Time
|
242,782
|
|
296,224
|
|
353,998
|
|
407,088
|
|
472,305
|
|
||||||||||
|
Total interest-bearing
|
892,327
|
|
944,848
|
|
1,015,683
|
|
975,643
|
|
1,174,338
|
|
||||||||||
|
Total Colorado State Bank & Trust
|
1,468,327
|
|
1,442,166
|
|
1,461,438
|
|
1,385,585
|
|
1,510,590
|
|
||||||||||
|
Bank of Arizona:
|
||||||||||||||||||||
|
Demand
|
366,755
|
|
326,324
|
|
369,115
|
|
204,092
|
|
161,093
|
|
||||||||||
|
Interest-bearing:
|
||||||||||||||||||||
|
Transaction
|
305,099
|
|
358,556
|
|
347,214
|
|
364,736
|
|
360,276
|
|
||||||||||
|
Savings
|
2,973
|
|
2,893
|
|
2,545
|
|
2,432
|
|
1,978
|
|
||||||||||
|
Time
|
27,765
|
|
29,498
|
|
36,680
|
|
34,391
|
|
31,371
|
|
||||||||||
|
Total interest-bearing
|
335,837
|
|
390,947
|
|
386,439
|
|
401,559
|
|
393,625
|
|
||||||||||
|
Total Bank of Arizona
|
702,592
|
|
717,271
|
|
755,554
|
|
605,651
|
|
554,718
|
|
||||||||||
|
Bank of Kansas City / Mobank:
|
||||||||||||||||||||
|
Demand
|
508,418
|
|
197,424
|
|
259,121
|
|
246,739
|
|
260,095
|
|
||||||||||
|
Interest-bearing:
|
||||||||||||||||||||
|
Transaction
|
513,176
|
|
153,203
|
|
273,999
|
|
69,857
|
|
85,524
|
|
||||||||||
|
Savings
|
12,679
|
|
1,378
|
|
1,274
|
|
1,252
|
|
771
|
|
||||||||||
|
Time
|
42,152
|
|
35,524
|
|
45,210
|
|
41,312
|
|
26,728
|
|
||||||||||
|
Total interest-bearing
|
568,007
|
|
190,105
|
|
320,483
|
|
112,421
|
|
113,023
|
|
||||||||||
|
Total Bank of Kansas City / Mobank
|
1,076,425
|
|
387,529
|
|
579,604
|
|
359,160
|
|
373,118
|
|
||||||||||
|
Total BOK Financial deposits
|
$
|
22,748,095
|
|
$
|
21,088,158
|
|
$
|
21,140,859
|
|
$
|
20,269,327
|
|
$
|
21,179,060
|
|
|||||
See Note
9
to the Consolidated Financial Statements for a summary of other borrowings.
In addition to deposits, liquidity for the subsidiary banks is provided primarily by federal funds purchased, securities repurchase agreements and Federal Home Loan Bank borrowings. Federal funds purchased consist primarily of unsecured, overnight funds acquired from other financial institutions. Funds are primarily purchased from bankers’ banks and Federal Home Loan banks from across the country. The largest single source of wholesale federal funds purchased totaled $12 million at
December 31, 2016
. Securities repurchase agreements generally mature within 90 days and are secured by certain available for sale securities. Federal Home Loan Bank borrowings are generally short term and are secured by a blanket pledge of eligible collateral (generally unencumbered U.S. Treasury and mortgage-backed securities, 1-4 family residential mortgage loans, multifamily and other qualifying commercial real estate loans). Amounts borrowed from the Federal Home Loan Bank of Topeka averaged
$6.0 billion
during
2016
and
$4.9 billion
during
2015
.
At
December 31, 2016
, the estimated unused credit available to the subsidiary banks from collateralized sources was approximately $5.1 billion.
71
In 2007, BOKF, NA issued $250 million of subordinated debt due May 15, 2017 to fund the Worth National Bank and First United Bank acquisitions and fund continued asset growth. Interest on this debt was based on a fixed rate of 5.75% through May 14, 2012 which then converted to a floating rate of three-month LIBOR plus 0.69%. The $227 million that remained outstanding at December 31, 2015 was called during 2016.
BOKF, NA also has a liability related to the repurchase of certain delinquent residential mortgage loans previously sold in GNMA mortgage pools. Interest is payable monthly at rates contractually due to investors.
Parent Company and Other Non-Bank Subsidiaries
The primary sources of liquidity for BOK Financial are cash on hand and dividends from the subsidiary banks. Cash on hand at
December 31, 2016
totaled
$163 million
. Dividends from the subsidiary banks are limited by various banking regulations to net profits, as defined, for the year plus retained profits for the two preceding years. Dividends are further restricted by minimum capital requirements. At
December 31, 2016
, based on the most restrictive limitations as well as management’s internal capital policy, BOKF, NA could declare up to
$171 million
of dividends without regulatory approval. Dividend constraints may be alleviated through increases in retained earnings, capital issuances or changes in risk weighted assets. Future losses or increases in required regulatory capital could also affect its ability to pay dividends to the parent company.
On June 27, 2016, the parent company issued $150 million of subordinated debt that will mature on June 30, 2056. This debt bears interest at the rate of 5.375%, payable quarterly. On June 30, 2021, we will have the option to redeem the debt at the principal amount plus accrued interest, subject to regulatory approval.
Shareholders' equity at
December 31, 2016
was
$3.3 billion
, an
increase
of
$44 million
over
December 31, 2015
. Net income less cash dividends paid
increase
d equity
$119 million
during
2016
. Changes in interest rates resulted in an accumulated other comprehensive loss of
$11 million
at
December 31, 2016
, compared to an accumulated other comprehensive gain of
$22 million
at
December 31, 2015
. The Company also repurchased
$67 million
of our common stock during
2016
. We also deployed $103 million of capital to acquire all of the outstanding stock of MBT Bancshares, Inc. in an all cash deal. Capital is managed to maximize long-term value to the shareholders. Factors considered in managing capital include projections of future earnings, asset growth and acquisition strategies, and regulatory and debt covenant requirements. Capital management may include subordinated debt issuance, share repurchase and stock and cash dividends.
On October 27, 2015, the board of directors authorized the Company to purchase up to five million common shares, subject to market conditions, securities laws and other regulatory compliance limitations. As of
December 31, 2016
, a cumulative total of 2,879,243 shares have been repurchased under this authorization. The Company repurchased
1,005,169
shares during
2016
at an average price of
$66.45
per share.
BOK Financial and the subsidiary banks are subject to various capital requirements administered by federal agencies. Failure to meet minimum capital requirements can result in certain mandatory and additional discretionary actions by regulators that could have a material impact on operations. These capital requirements include quantitative measures of assets, liabilities and off-balance sheet items. The capital standards are also subject to qualitative judgments by the regulators.
Effective January 1, 2015, capital rules establish a 7% threshold for the common equity Tier 1 ratio consisting of a minimum level plus capital conservation buffer. The Company has elected to exclude unrealized gains and losses from available for sale securities from its calculation of Tier 1 capital, consistent with the treatment under previous capital rules. Components of the capital rules effective January 1, 2015 will phase in through January 1, 2019.
A summary of minimum capital requirements, including capital conservation buffer follows in Table
32
. Failure to meet these minimum capital requirements, including capital conservation buffer, could subject BOK Financial to regulatory restrictions on capital distributions (including but not limited to dividends and share repurchases) and executive bonus payments.
The capital ratios for BOK Financial on a consolidated basis are presented in Table
32
following.
72
Table
32
–
Capital Ratios
|
Minimum Capital Requirement
|
Capital Conservation Buffer
1
|
Minimum Capital Requirement Including Capital Conservation Buffer
|
||||||||||||
|
December 31,
|
||||||||||||||
|
2016
|
2015
|
|||||||||||||
|
Risk-based capital:
|
|
|
||||||||||||
|
Common equity Tier 1
|
4.50
|
%
|
2.50
|
%
|
7.00
|
%
|
11.21
|
%
|
12.13
|
%
|
||||
|
Tier 1 capital
|
6.00
|
%
|
2.50
|
%
|
8.50
|
%
|
11.21
|
%
|
12.13
|
%
|
||||
|
Total capital
|
8.00
|
%
|
2.50
|
%
|
10.50
|
%
|
12.81
|
%
|
13.30
|
%
|
||||
|
Tier 1 Leverage
|
4.00
|
%
|
N/A
|
|
4.00
|
%
|
8.72
|
%
|
9.25
|
%
|
||||
|
Average total equity to average assets
|
10.38
|
%
|
11.03
|
%
|
||||||||||
|
Tangible common equity ratio
|
8.61
|
%
|
9.02
|
%
|
||||||||||
|
1
|
Effective January 1, 2016
|
Capital resources of financial institutions are also regularly measured by the tangible common shareholders’ equity ratio. Tangible common shareholders’ equity is shareholders’ equity as defined by generally accepted accounting principles in the United States of America (“GAAP”), including unrealized gains and losses on available for sale securities, less intangible assets and equity which does not benefit common shareholders. Equity that does not benefit common shareholders includes preferred equity. This non-GAAP measure is a valuable indicator of a financial institution’s capital strength since it eliminates intangible assets from shareholders’ equity and retains the effect of unrealized losses on securities and other components of accumulated other comprehensive income in shareholders’ equity.
Table
33
following provides a reconciliation of the non-GAAP measures with financial measures defined by GAAP.
Table
33
–
Non-GAAP Measures
(Dollars in thousands)
|
December 31,
|
||||||||
|
2016
|
2015
|
|||||||
|
Tangible common equity ratio:
|
|
|
||||||
|
Total shareholders' equity
|
$
|
3,274,854
|
|
$
|
3,230,556
|
|
||
|
Less: Goodwill and intangible assets, net
|
495,830
|
|
429,370
|
|
||||
|
Tangible common equity
|
2,779,024
|
|
2,801,186
|
|
||||
|
Total assets
|
32,772,281
|
|
31,476,128
|
|
||||
|
Less: Goodwill and intangible assets, net
|
495,830
|
|
429,370
|
|
||||
|
Tangible assets
|
$
|
32,276,451
|
|
$
|
31,046,758
|
|
||
|
Tangible common equity ratio
|
8.61
|
%
|
9.02
|
%
|
||||
On October 20, 2016, BOK Financial published the results of its annual capital stress test. In accordance with the Dodd-Frank Act, the Federal Reserve must publish regulations that require bank holding companies with $10 billion to $50 billion in assets to perform annual capital stress tests. The requirements for annual capital stress tests became effective for the Company in the fourth quarter of 2013. The Dodd-Frank Act Stress Test ("DFAST") is a forward-looking exercise under which the Company and its banking subsidiary estimate the impact of a hypothetical severely adverse macroeconomic scenario provided by the Federal Reserve and Office of the Comptroller of the Currency on its financial condition and regulatory capital ratios over a nine-quarter time horizon. Under the scenario provided by the regulatory agencies, all capital ratio measures remain above minimum regulatory thresholds. Additional information concerning the annual stress test may be found on the Company's Investor Relations page at www.bokf.com under the "Presentations" tab. The results of future capital stress tests may place constraints on capital distributions or increases in required regulatory capital under certain circumstances.
73
Off-Balance Sheet Arrangements
See Note
14
to the Consolidated Financial Statements for a discussion of the Company’s significant off-balance sheet commitments.
Aggregate Contractual Obligations
BOK Financial has numerous contractual obligations in the normal course of business. These obligations include time deposits and other borrowed funds, premises used under various operating leases, commitments to extend credit to borrowers and to purchase securities, derivative contracts and contracts for services such as data processing that are integral to our operations. Table
34
following summarizes payments due on contractual obligations with initial terms in excess of one year.
Table
34
–
Contractual Obligations as of
December 31, 2016
(In thousands)
|
Less Than
1 Year
|
1 to 3
Years
|
4 to 5
Years
|
More Than
5 Years
|
Total
|
|||||||||||||||
|
Time deposits
|
$
|
624,375
|
|
$
|
417,589
|
|
$
|
216,275
|
|
$
|
407,939
|
|
$
|
1,666,178
|
|
||||
|
Other borrowings
|
724
|
|
1,924
|
|
2,168
|
|
22,857
|
|
27,673
|
|
|||||||||
|
Subordinated debentures
|
8,063
|
|
16,125
|
|
16,125
|
|
422,796
|
|
463,109
|
|
|||||||||
|
Operating lease obligations
|
22,502
|
|
39,734
|
|
29,577
|
|
56,818
|
|
148,631
|
|
|||||||||
|
Derivative contracts
|
9,864
|
|
12,939
|
|
11,165
|
|
8,721
|
|
42,689
|
|
|||||||||
|
Data processing services
|
15,687
|
|
19,733
|
|
1,320
|
|
605
|
|
37,345
|
|
|||||||||
|
Tax credit purchase commitment
|
3,700
|
|
—
|
|
—
|
|
—
|
|
3,700
|
|
|||||||||
|
Total
|
$
|
684,915
|
|
$
|
508,044
|
|
$
|
276,630
|
|
$
|
919,736
|
|
$
|
2,389,325
|
|
||||
|
Loan commitments
|
$
|
9,404,665
|
|
|
Standby letters of credit
|
585,472
|
|
|
|
Mortgage loans sold with recourse
|
139,486
|
|
|
|
Alternative investment commitments
|
78,357
|
|
|
|
Unfunded third-party private equity commitments
|
2,594
|
|
|
Payments on time deposits, other borrowed funds and subordinated debentures include interest which has been calculated from rates at
December 31, 2016
. These obligations may have variable interest rates and actual payments will differ from the amounts shown on this table.
Payments on time deposits are based on contractual maturity dates. These funds may be withdrawn prior to maturity. We may charge the customer a penalty for early withdrawal.
Operating lease commitments generally represent real property we rent for branch offices, corporate offices and operations facilities. Payments presented represent the minimum lease payments and exclude related costs such as utilities and property taxes.
Obligations under derivative contracts are used in customer hedging programs. As previously discussed, we have entered into derivative contracts which are expected to substantially offset the cash payments due on these obligations.
We also have obligations with respect to employee benefit plans. See Note
11
to the Consolidated Financial Statements for additional information about our employee benefit plans.
Data processing and communications contracts represent the minimum obligations under the contracts. Additional payments that are based on the volume of transactions processed are excluded.
Loan commitments represent legally binding obligations to provide financing to our customers. Some of these commitments are expected to expire before being drawn upon and the total commitment amounts do not necessarily represent future cash requirements. Approximately
$1.4 billion
of the loan commitments expire within one year.
74
The Company has funded
$174 million
and has commitments to fund an additional
$78 million
for various alternative investments. Alternative investments generally consist of limited partnership interests in or loans to entities that invest in low income housing or economic development projects, distressed assets, energy development, venture capital and other activities. The Company is prohibited by banking regulations from controlling or actively managing the activities of these investments. Legally binding commitments to fund alternative investments are recognized as liabilities in the consolidated financial statements.
An indirect wholly-owned subsidiary of the Company is general partner of two private equity funds and has contingent obligations to make additional investments totaling
$2.6 million
as of
December 31, 2016
. These commitments, which are included in unfunded third-party private equity commitments, generally reflect customer investment obligations. We do not recognize contingent commitments to fund investments that are primarily customer obligations as liabilities in the consolidated financial statements.
Recently Issued Accounting Standards
See Note
1
of the consolidated financial statements for disclosure of newly adopted and pending accounting standards.
Forward-Looking Statements
This report contains forward-looking statements that are based on management's beliefs, assumptions, current expectations, estimates, and projections about BOK Financial, the financial services industry and the economy in general. Words such as “anticipates,” “believes,” ”estimates,” “expects,” “forecasts,” “plans,” “projects,” “will,” “intends,” variations of such words and similar expressions are intended to identify such forward-looking statements. Management judgments relating to and discussion of the provision and allowance for loan losses and accrual for off-balance sheet credit risk, allowance for uncertain tax positions, accruals for loss contingencies and valuation of mortgage servicing rights involve judgments as to expected events and are inherently forward-looking statements. Assessments that BOK Financial's acquisitions and other growth endeavors will be profitable are necessary statements of belief as to the outcome of future events, based in part on information provided by others that BOK Financial has not independently verified. These statements are not guarantees of future performance and involve certain risks, uncertainties and assumptions that are difficult to predict with regard to timing, extent, likelihood and degree of occurrence. Therefore, actual results and outcomes may materially differ from what is expressed, implied, or forecasted in such forward-looking statements. Internal and external factors that might cause such a difference include, but are not limited to changes in commodity prices, interest rates and interest rate relationships, demand for products and services, the degree of competition by traditional and nontraditional competitors, changes in banking regulations, tax laws, prices, levies, and assessments, the impact of technological advances and trends in customer behavior as well as their ability to repay loans. BOK Financial and its affiliates undertake no obligation to update, amend, or clarify forward-looking statements, whether as a result of new information, future events or otherwise.
Legal Notice
As used in this report, the term “BOK Financial” and such terms as “the Company,” “the Corporation,” “our,” “we” and “us” may refer to one or more of the consolidated subsidiaries or all of them taken as a whole. All these terms are used for convenience only and are not intended as a precise description of any of the separate companies, each of which manages its own affairs.
75
Market Risk
Market risk is a broad term for the risk of economic loss due to adverse changes in the fair value of a financial instrument. These changes may be the result of various factors, including interest rates, foreign exchange rates, commodity prices or equity prices. Financial instruments that are subject to market risk can be classified either as held for trading or held for purposes other than trading. Market risk excludes changes in fair value due to credit of the individual issuers of financial instruments.
BOK Financial is subject to market risk primarily through the effect of changes in interest rates on both its assets held for purposes other than trading and trading assets. The effects of other changes, such as foreign exchange rates, commodity prices or equity prices do not pose significant market risk to BOK Financial. BOK Financial has no material investments in assets that are affected by changes in foreign exchange rates or equity prices. Energy and agricultural product derivative contracts, which are affected by changes in commodity prices, are matched against offsetting contracts as previously discussed.
The Asset/Liability Committee is responsible for managing market risk in accordance with policy limits established by the Board of Directors. The Committee monitors projected variation in net interest revenue, net interest income and economic value of equity due to specified changes in interest rates. These limits also set maximum levels for short-term borrowings, short-term assets, public funds and brokered deposits and establish minimum levels for unpledged assets, among other things. Further, the Board approved market risk limits for fixed income trading, mortgage pipeline and mortgage servicing assets inclusive of economic hedge benefits. Compliance is reviewed monthly. Deviations from the Board approved limits require Board escalation and approval.
The simulations used to manage market risk are based on numerous assumptions regarding the effects of changes in interest rates on the timing and extent of re-pricing characteristics, future cash flows and customer behavior. These assumptions are inherently uncertain and, as a result, models cannot precisely estimate or precisely predict the impact of higher or lower interest rates. Actual results will differ from simulated results due to timing, magnitude and frequency of interest rate changes, market conditions and management strategies, among other factors.
Interest Rate Risk – Other than Trading
As previously noted in the Net Interest Revenue section of this report, management has implemented strategies to manage the Company’s balance sheet to have relatively limited exposure to changes in interest rates over a twelve-month period. The effectiveness of these strategies in managing the overall interest rate risk is evaluated through the use of an asset/liability model. BOK Financial performs a sensitivity analysis to identify more dynamic interest rate risk exposures, including embedded option positions, on net interest revenue. A simulation model is used to estimate the effect of changes in interest rates on our performance across multiple interest rate scenarios. While the current internal policy limit for net interest revenue variation is a maximum decline of 5% due to a 200 basis point change in market interest rates over twelve months, the results of a 200 basis point decrease in interest rates in the current low-rate environment are not meaningful. We report the effect of a 50 basis point decrease in the interim.
The Company’s primary interest rate exposures include the Federal Funds rate, which affects short-term borrowings, and the prime lending rate and LIBOR, which are the basis for much of the variable rate loan pricing. Additionally, residential mortgage rates directly affect the prepayment speeds for residential mortgage-backed securities and mortgage servicing rights. Derivative financial instruments and other financial instruments used for purposes other than trading are included in this simulation. In addition, the impact on the level and composition of demand deposit accounts and other core deposit balances resulting from a significant increase in short-term market interest rates and the overall interest rate environment is likely to be material. The simulation incorporates assumptions regarding the effects of such changes based on a combination of historical analysis and expected behavior. The impact of planned growth and new business activities is factored into the simulation model.
76
Table
35
– Interest Rate Sensitivity
(Dollar in thousands)
|
|
200 bp Increase
|
50 bp Decrease
|
||||||||||||||
|
|
2016
|
2015
|
2016
|
2015
|
||||||||||||
|
Anticipated impact over the next twelve months on net interest revenue
|
$
|
(4,932
|
)
|
$
|
(7,576
|
)
|
$
|
(18,021
|
)
|
$
|
(22,501
|
)
|
||||
|
|
(0.60
|
)%
|
(0.97
|
)%
|
(2.19
|
)%
|
(2.87
|
)%
|
||||||||
BOK Financial is also subjected to market risk through changes in the fair value of mortgage servicing rights. Changes in the fair value of mortgage servicing rights are highly dependent on changes in primary mortgage rates offered to borrowers, intermediate-term interest rates that affect the value of custodial funds, and assumptions about servicing revenues, servicing costs and discount rates. As primary mortgage rates increase, prepayment speeds slow and the value of our mortgage servicing rights increases. As primary mortgage rates fall, prepayment speeds increase and the value of our mortgage servicing rights decreases.
We maintain a portfolio of financial instruments, which may include residential mortgage-backed securities issued by U.S. government agencies, U.S. Treasury securities and interest rate derivative contracts held as an economic hedge of the changes in the fair value of our mortgage servicing rights. Composition of this portfolio will change based on our assessment of market risk. Changes in the fair value of residential mortgage-backed securities are highly dependent on changes in secondary mortgage rates required by investors, and interest rate derivative contracts are highly dependent on changes in other market interest rates. While primary and secondary mortgage rates generally move in the same direction, the spread between them may widen and narrow due to market conditions and government intervention. Changes in the forward-looking spread between the primary and secondary rates can cause significant earnings volatility.
Management performs a stress test to measure market risk due to changes in interest rates inherent in its MSR portfolio and hedges. The stress test shocks applicable interest rates up and down 50 basis points and calculates an estimated change in fair value, net of economic hedging activity that may result. The Board has approved a $20 million market risk limit for mortgage servicing rights, net of economic hedges.
Table
36
-
MSR Asset and Hedge Sensitivity Analysis
(In thousands)
|
Year Ended December 31
|
||||||||||||||||
|
|
2016
|
2015
|
||||||||||||||
|
Up 50 bp
|
Down 50 bp
|
Up 50 bp
|
Down 50 bp
|
|||||||||||||
|
Average
|
$
|
(1,756
|
)
|
$
|
(11,150
|
)
|
$
|
431
|
|
$
|
(907
|
)
|
||||
|
Low
|
(14,461
|
)
|
(24,758
|
)
|
(2,700
|
)
|
(4,080
|
)
|
||||||||
|
High
|
12,963
|
|
9,267
|
|
5,775
|
|
1,327
|
|
||||||||
|
Period End
|
(1,750
|
)
|
(2,724
|
)
|
809
|
|
292
|
|
||||||||
Trading Activities
The Company bears market risk by originating residential mortgages held for sale (RMHFS). RMHFS are generally outstanding for 60 to 90 days which represents the typical period from commitment to originate a loan to sale of the closed loan to an investor. Primary mortgage interest rate changes during this period affect the value of RMHFS commitments and loans. We use forward sale contracts to mitigate market risk on all closed mortgage loans held for sale and on an estimate of mortgage loan commitments that are expected to result in closed loans.
A variety of methods are used to monitor market risk of mortgage origination activities. These methods include daily marking of all positions to market value, independent verification of inventory pricing, and revenue sensitivity limits.
Management performs a stress test to measure market risk due to changes in interest rates inherent in the mortgage production pipeline. The stress test shocks applicable interest rates up and down 50 basis points and calculates an estimated change in fair value, net of economic hedging activity that may result. The Board has approved a $7 million market risk limit for the mortgage production pipeline, net of forward sale contracts.
77
Table
37
-
Mortgage Pipeline Sensitivity Analysis
(In thousands)
|
Year Ended December 31
|
||||||||||||||||
|
|
2016
|
2015
|
||||||||||||||
|
Up 50 bp
|
Down 50 bp
|
Up 50 bp
|
Down 50 bp
|
|||||||||||||
|
Average
|
$
|
(1,840
|
)
|
$
|
(583
|
)
|
$
|
(2,967
|
)
|
$
|
(1,932
|
)
|
||||
|
Low
|
(6,858
|
)
|
(2,953
|
)
|
(6,590
|
)
|
(4,351
|
)
|
||||||||
|
High
|
2,037
|
|
1,815
|
|
(998
|
)
|
1,483
|
|
||||||||
|
Period End
|
602
|
|
(1,158
|
)
|
(2,036
|
)
|
(1,951
|
)
|
||||||||
BOK Financial enters into trading activities both as an intermediary for customers and for its own account. As an intermediary, we take positions in securities, generally residential mortgage-backed securities, government agency securities and municipal bonds. These securities are purchased for resale to customers, which include individuals, corporations, foundations and financial institutions. On a limited basis, we may also take trading positions in U.S. Treasury securities, residential mortgage-backed securities, and municipal bonds to enhance returns on its securities portfolios. Both of these activities involve interest rate, liquidity and price risk. BOK Financial has an insignificant exposure to foreign exchange risk and does not take positions in commodity derivatives.
A variety of methods are used to monitor the interest rate risk of trading activities. These methods include daily marking of all positions to market value, independent verification of inventory pricing, and position limits for each trading activity. Economic hedges in either the futures or cash markets may be used to reduce the risk associated with some trading programs.
Management performs a stress test to measure market risk from changes in interest rates on its trading portfolio. The stress test shocks applicable interest rates up and down 50 basis points and calculates an estimated change in fair value, net of economic hedging activity that may result. The Board has approved a $8 million market risk limit for the trading portfolio, net of economic hedges.
Table
38
–
BOKFS Trading Sensitivity Analysis
(In thousands)
|
Year Ended December 31
|
||||||||||||||||
|
|
2016
|
2015
|
||||||||||||||
|
Up 50 bp
|
Down 50 bp
|
Up 50 bp
|
Down 50 bp
|
|||||||||||||
|
Average
|
$
|
(3,150
|
)
|
$
|
3,196
|
|
$
|
(1,767
|
)
|
$
|
1,703
|
|
||||
|
Low
|
(6,130
|
)
|
(107
|
)
|
(4,727
|
)
|
(446
|
)
|
||||||||
|
High
|
146
|
|
7,013
|
|
437
|
|
4,728
|
|
||||||||
|
Period End
|
1,212
|
|
(734
|
)
|
865
|
|
(1,157
|
)
|
||||||||
78
Report of Management on Internal Control over Financial Reporting
Management of BOK Financial Corporation is responsible for establishing and maintaining adequate internal control over financial reporting and for assessing the effectiveness of internal control over financial reporting, as such term is defined in Exchange Act Rules 13a-15(f) and 15d-15(f), as amended. Management has assessed the effectiveness of the Company’s internal control over financial reporting based on the criteria established in “Internal Control – Integrated Framework,” issued by the Committee of Sponsoring Organizations (“COSO”) of the Treadway Commission in 2013. Based on that assessment and criteria, management has determined that the Company maintained effective internal control over financial reporting as of
December 31, 2016
.
As permitted, management excluded from its assessment the operations of Missouri Bank and Trust Company which was acquired on December 1, 2016. As described in Note 6 to the Consolidated Financial Statements, assets acquired and excluded from management's assessment of internal control over financial reporting comprised approximately 2% of consolidated assets at December 31, 2016.
Ernst & Young LLP, the independent registered public accounting firm that audited the consolidated financial statements of the Company included in this annual report has issued an audit report on the effectiveness of the Company’s internal control over financial reporting as of
December 31, 2016
. Their report, which expresses unqualified opinion on the effectiveness of the Company’s internal control over financial reporting as of
December 31, 2016
, is included in this annual report.
79
Report of Ernst & Young LLP, Independent Registered Public Accounting Firm
The Board of Directors and Shareholders of BOK Financial Corporation
We have audited BOK Financial Corporation’s ("the Company") internal control over financial reporting as of
December 31, 2016
, based on criteria established in Internal Control—Integrated Framework issued by the Committee of Sponsoring Organizations of the Treadway Commission (2013 framework) (the COSO criteria). BOK Financial Corporation’s management is responsible for maintaining effective internal control over financial reporting, and for its assessment of the effectiveness of internal control over financial reporting included in the accompanying Report of Management on Internal Control over Financial Reporting. Our responsibility is to express an opinion on the Company’s internal control over financial reporting based on our audit.
We conducted our audit in accordance with the standards of the Public Company Accounting Oversight Board (United States). Those standards require that we plan and perform the audit to obtain reasonable assurance about whether effective internal control over financial reporting was maintained in all material respects. Our audit included obtaining an understanding of internal control over financial reporting, assessing the risk that a material weakness exists, testing and evaluating the design and operating effectiveness of internal control based on the assessed risk, and performing such other procedures as we considered necessary in the circumstances. We believe that our audit provides a reasonable basis for our opinion.
A company’s internal control over financial reporting is a process designed to provide reasonable assurance regarding the reliability of financial reporting and the preparation of financial statements for external purposes in accordance with generally accepted accounting principles. A company’s internal control over financial reporting includes those policies and procedures that (1) pertain to the maintenance of records that, in reasonable detail, accurately and fairly reflect the transactions and dispositions of the assets of the company; (2) provide reasonable assurance that transactions are recorded as necessary to permit preparation of financial statements in accordance with generally accepted accounting principles, and that receipts and expenditures of the company are being made only in accordance with authorizations of management and directors of the company; and (3) provide reasonable assurance regarding prevention or timely detection of unauthorized acquisition, use, or disposition of the company’s assets that could have a material effect on the financial statements.
Because of its inherent limitations, internal control over financial reporting may not prevent or detect misstatements. Also, projections of any evaluation of effectiveness to future periods are subject to the risk that controls may become inadequate because of changes in conditions, or that the degree of compliance with the policies or procedures may deteriorate.
As indicated in the accompanying Report of Management on Internal Control over Financial Reporting, management’s assessment of and conclusion on the effectiveness of internal control over financial reporting did not include the internal controls of Missouri Bank and Trust of Kansas City (“Mobank”), which is included in the 2016 consolidated financial statements of the BOK Financial Corporation and constituted $749 million and $125 million of total and net assets, respectively, as of December 31, 2016 and $2 million and $124 thousand of revenues and net income, respectively, for the year then ended. Our audit of internal control over financial reporting of BOK Financial Corporation also did not include an evaluation of the internal control over financial reporting of Mobank.
In our opinion, BOK Financial Corporation maintained, in all material respects, effective internal control over financial reporting as of
December 31, 2016
, based on
the COSO criteria
.
We also have audited, in accordance with the standards of the Public Company Accounting Oversight Board (United States), the consolidated balance sheets of BOK Financial Corporation as of
December 31, 2016
and
2015
, and the related consolidated statements of earnings, comprehensive income, changes in equity, and cash flows for each of the three years in the period ended
December 31, 2016
and our report dated
February 28, 2017
expressed an unqualified opinion thereon.
/s/ Ernst & Young LLP
Tulsa, Oklahoma
February 28, 2017
80
Report of Ernst & Young LLP, Independent Registered Public Accounting Firm
The Board of Directors and Shareholders of BOK Financial Corporation
We have audited the accompanying consolidated balance sheets of BOK Financial Corporation ("the Company") as of
December 31, 2016
and
2015
, and the related consolidated statements of earnings, comprehensive income, changes in equity, and cash flows for each of the three years in the period ended
December 31, 2016
. These financial statements are the responsibility of the Company's management. Our responsibility is to express an opinion on these financial statements based on our audits.
We conducted our audits in accordance with the standards of the Public Company Accounting Oversight Board (United States). Those standards require that we plan and perform the audit to obtain reasonable assurance about whether the financial statements are free of material misstatement. An audit includes examining, on a test basis, evidence supporting the amounts and disclosures in the financial statements. An audit also includes assessing the accounting principles used and significant estimates made by management, as well as evaluating the overall financial statement presentation. We believe that our audits provide a reasonable basis for our opinion.
In our opinion, the financial statements referred to above present fairly, in all material respects, the consolidated financial position of BOK Financial Corporation at
December 31, 2016
and
2015
, and the consolidated results of its operations and its cash flows for each of the three years in the period ended
December 31, 2016
, in conformity with U.S. generally accepted accounting principles.
We also have audited, in accordance with the standards of the Public Company Accounting Oversight Board (United States), BOK Financial Corporation's internal control over financial reporting as of
December 31, 2016
, based on criteria established in Internal Control-Integrated Framework issued by the Committee of Sponsoring Organizations of the Treadway Commission (2013 framework) and our report dated
February 28, 2017
expressed an unqualified opinion thereon.
/s/ Ernst & Young LLP
Tulsa, Oklahoma
February 28, 2017
81
|
Consolidated Statements of Earnings
|
||||||||||||
|
(In thousands, except share and per share data)
|
||||||||||||
|
Year Ended December 31,
|
||||||||||||
|
Interest and dividend revenue
|
2016
|
2015
|
2014
|
|||||||||
|
Loans
|
$
|
581,030
|
|
$
|
529,683
|
|
$
|
502,753
|
|
|||
|
Residential mortgage loans held for sale
|
12,658
|
|
13,602
|
|
10,143
|
|
||||||
|
Trading securities
|
8,527
|
|
2,240
|
|
1,945
|
|
||||||
|
Investment securities
|
16,894
|
|
18,098
|
|
18,891
|
|
||||||
|
Available for sale securities
|
175,321
|
|
174,829
|
|
185,107
|
|
||||||
|
Fair value option securities
|
6,723
|
|
9,264
|
|
3,611
|
|
||||||
|
Restricted equity securities
|
17,238
|
|
13,532
|
|
7,040
|
|
||||||
|
Interest-bearing cash and cash equivalents
|
10,726
|
|
5,580
|
|
2,749
|
|
||||||
|
Total interest and dividend revenue
|
829,117
|
|
766,828
|
|
732,239
|
|
||||||
|
Interest expense
|
|
|
|
|
|
|
||||||
|
Deposits
|
40,494
|
|
44,170
|
|
50,683
|
|
||||||
|
Borrowed funds
|
35,336
|
|
14,204
|
|
7,672
|
|
||||||
|
Subordinated debentures
|
6,059
|
|
5,100
|
|
8,690
|
|
||||||
|
Total interest expense
|
81,889
|
|
63,474
|
|
67,045
|
|
||||||
|
Net interest and dividend revenue
|
747,228
|
|
703,354
|
|
665,194
|
|
||||||
|
Provision for credit losses
|
65,000
|
|
34,000
|
|
—
|
|
||||||
|
Net interest and dividend revenue after provision for credit losses
|
682,228
|
|
669,354
|
|
665,194
|
|
||||||
|
Other operating revenue
|
|
|
|
|
|
|
||||||
|
Brokerage and trading revenue
|
138,377
|
|
129,556
|
|
134,437
|
|
||||||
|
Transaction card revenue
|
135,758
|
|
128,621
|
|
123,689
|
|
||||||
|
Fiduciary and asset management revenue
|
135,477
|
|
126,153
|
|
115,652
|
|
||||||
|
Deposit service charges and fees
|
92,193
|
|
90,431
|
|
90,911
|
|
||||||
|
Mortgage banking revenue
|
133,914
|
|
126,002
|
|
109,093
|
|
||||||
|
Other revenue
|
51,029
|
|
49,883
|
|
47,537
|
|
||||||
|
Total fees and commissions
|
686,748
|
|
650,646
|
|
621,319
|
|
||||||
|
Other gains, net
|
4,030
|
|
5,702
|
|
2,953
|
|
||||||
|
Gain (loss) on derivatives, net
|
(15,685
|
)
|
430
|
|
2,776
|
|
||||||
|
Gain (loss) on fair value option securities, net
|
(10,555
|
)
|
(3,684
|
)
|
10,189
|
|
||||||
|
Change in fair value of mortgage servicing rights
|
(2,193
|
)
|
(4,853
|
)
|
(16,445
|
)
|
||||||
|
Gain on available for sale securities, net
|
11,675
|
|
12,058
|
|
1,539
|
|
||||||
|
Total other-than-temporary impairment losses
|
—
|
|
(2,443
|
)
|
(373
|
)
|
||||||
|
Portion of loss recognized in other comprehensive income
|
—
|
|
624
|
|
—
|
|
||||||
|
Net impairment losses recognized in earnings
|
—
|
|
(1,819
|
)
|
(373
|
)
|
||||||
|
Total other operating revenue
|
674,020
|
|
658,480
|
|
621,958
|
|
||||||
|
Other operating expense
|
|
|
|
|
|
|
||||||
|
Personnel
|
553,119
|
|
515,298
|
|
476,931
|
|
||||||
|
Business promotion
|
26,582
|
|
27,851
|
|
26,649
|
|
||||||
|
Charitable contributions to BOKF Foundation
|
2,000
|
|
796
|
|
4,267
|
|
||||||
|
Professional fees and services
|
56,783
|
|
40,123
|
|
44,440
|
|
||||||
|
Net occupancy and equipment
|
80,024
|
|
76,016
|
|
77,232
|
|
||||||
|
Insurance
|
32,489
|
|
20,375
|
|
18,578
|
|
||||||
|
Data processing and communications
|
131,841
|
|
122,383
|
|
115,225
|
|
||||||
|
Printing, postage and supplies
|
15,584
|
|
13,498
|
|
13,518
|
|
||||||
|
Net losses and operating expenses of repossessed assets
|
3,359
|
|
1,446
|
|
6,019
|
|
||||||
|
Amortization of intangible assets
|
6,862
|
|
4,359
|
|
3,965
|
|
||||||
|
Mortgage banking costs
|
61,387
|
|
38,813
|
|
31,705
|
|
||||||
|
Other expense
|
47,560
|
|
35,233
|
|
28,993
|
|
||||||
|
Total other operating expense
|
1,017,590
|
|
896,191
|
|
847,522
|
|
||||||
|
Net income before taxes
|
338,658
|
|
431,643
|
|
439,630
|
|
||||||
|
Federal and state income taxes
|
106,377
|
|
139,384
|
|
144,151
|
|
||||||
|
Net income
|
232,281
|
|
292,259
|
|
295,479
|
|
||||||
|
Net income (loss) attributable to non-controlling interests
|
(387
|
)
|
3,694
|
|
3,044
|
|
||||||
|
Net income attributable to BOK Financial Corporation shareholders
|
$
|
232,668
|
|
$
|
288,565
|
|
$
|
292,435
|
|
|||
|
Earnings per share:
|
|
|
|
|
|
|
||||||
|
Basic
|
$
|
3.53
|
|
$
|
4.22
|
|
$
|
4.23
|
|
|||
|
Diluted
|
$
|
3.53
|
|
$
|
4.21
|
|
$
|
4.22
|
|
|||
|
Average shares used in computation:
|
|
|
|
|
|
|
||||||
|
Basic
|
65,085,627
|
|
67,594,689
|
|
68,394,194
|
|
||||||
|
Diluted
|
65,143,898
|
|
67,691,658
|
|
68,544,770
|
|
||||||
|
Dividends declared per share
|
$
|
1.73
|
|
$
|
1.69
|
|
$
|
1.62
|
|
|||
See accompanying notes to consolidated financial statements.
82
|
Consolidated Statements of Comprehensive Income
|
||||||||||||
|
(In thousands)
|
|
|
||||||||||
|
Year Ended December 31,
|
||||||||||||
|
|
2016
|
2015
|
2014
|
|||||||||
|
Net income
|
$
|
232,281
|
|
$
|
292,259
|
|
$
|
295,479
|
|
|||
|
Other comprehensive income (loss) before income taxes:
|
|
|
|
|||||||||
|
Net change in unrealized gain (loss)
|
(41,521
|
)
|
(46,803
|
)
|
136,775
|
|
||||||
|
Reclassification adjustments included in earnings:
|
||||||||||||
|
Interest revenue, Investment securities, Taxable securities
|
(112
|
)
|
(503
|
)
|
(1,216
|
)
|
||||||
|
Interest expense, Subordinated debentures
|
—
|
|
121
|
|
296
|
|
||||||
|
Net impairment losses recognized in earnings
|
—
|
|
1,819
|
|
373
|
|
||||||
|
Gain on available for sale securities, net
|
(11,675
|
)
|
(12,058
|
)
|
(1,539
|
)
|
||||||
|
Other comprehensive income (loss), before income taxes
|
(53,308
|
)
|
(57,424
|
)
|
134,689
|
|
||||||
|
Federal and state income taxes
|
(20,754
|
)
|
(22,338
|
)
|
52,393
|
|
||||||
|
Other comprehensive income (loss), net of income taxes
|
(32,554
|
)
|
|
(35,086
|
)
|
|
82,296
|
|
||||
|
Comprehensive income
|
199,727
|
|
257,173
|
|
377,775
|
|
||||||
|
Comprehensive income (loss) attributable to non-controlling interests
|
(387
|
)
|
3,694
|
|
3,044
|
|
||||||
|
Comprehensive income attributable to BOK Financial Corp. shareholders
|
$
|
200,114
|
|
$
|
253,479
|
|
$
|
374,731
|
|
|||
See accompanying notes to consolidated financial statements.
83
|
|
||||||||
|
(In thousands, except share data)
|
|
|
||||||
|
December 31,
|
||||||||
|
|
2016
|
2015
|
||||||
|
|
||||||||
|
Assets
|
|
|
||||||
|
Cash and due from banks
|
$
|
620,846
|
|
$
|
573,699
|
|
||
|
Interest-bearing cash and cash equivalents
|
1,916,651
|
|
2,069,900
|
|
||||
|
Trading securities
|
337,628
|
|
122,404
|
|
||||
|
Investment securities (fair value
: 2016 – $565,493; 2015
– $629,159)
|
546,145
|
|
597,836
|
|
||||
|
Available for sale securities
|
8,676,829
|
|
9,042,733
|
|
||||
|
Fair value option securities
|
77,046
|
|
444,217
|
|
||||
|
Restricted equity securities
|
307,240
|
|
273,684
|
|
||||
|
Residential mortgage loans held for sale
|
301,897
|
|
308,439
|
|
||||
|
Loans
|
16,989,660
|
|
15,941,154
|
|
||||
|
Allowance for loan losses
|
(246,159
|
)
|
(225,524
|
)
|
||||
|
Loans, net of allowance
|
16,743,501
|
|
15,715,630
|
|
||||
|
Premises and equipment, net
|
325,849
|
|
306,490
|
|
||||
|
Receivables
|
772,952
|
|
163,480
|
|
||||
|
Goodwill
|
448,899
|
|
385,461
|
|
||||
|
Intangible assets, net
|
46,931
|
|
43,909
|
|
||||
|
Mortgage servicing rights
|
247,073
|
|
218,605
|
|
||||
|
Real estate and other repossessed assets, net of allowance (
2016 – $9,562
; 2015 – $12,622)
|
44,287
|
|
30,731
|
|
||||
|
Derivative contracts
|
689,872
|
|
586,270
|
|
||||
|
Cash surrender value of bank-owned life insurance
|
308,430
|
|
303,335
|
|
||||
|
Receivable on unsettled available for sale securities sales
|
7,188
|
|
40,193
|
|
||||
|
Other assets
|
353,017
|
|
249,112
|
|
||||
|
Total assets
|
$
|
32,772,281
|
|
$
|
31,476,128
|
|
||
|
Liabilities and Equity
|
||||||||
|
Liabilities:
|
||||||||
|
Noninterest-bearing demand deposits
|
$
|
9,235,720
|
|
$
|
8,296,888
|
|
||
|
Interest-bearing deposits:
|
|
|
|
|
||||
|
Transaction
|
10,865,105
|
|
9,998,954
|
|
||||
|
Savings
|
425,470
|
|
386,252
|
|
||||
|
Time
|
2,221,800
|
|
2,406,064
|
|
||||
|
Total deposits
|
22,748,095
|
|
21,088,158
|
|
||||
|
Funds purchased
|
57,929
|
|
491,192
|
|
||||
|
Repurchase agreements
|
668,661
|
|
722,444
|
|
||||
|
Other borrowings
|
4,846,072
|
|
4,837,879
|
|
||||
|
Subordinated debentures
|
144,640
|
|
226,350
|
|
||||
|
Accrued interest, taxes and expense
|
146,704
|
|
119,584
|
|
||||
|
Derivative contracts
|
664,531
|
|
581,701
|
|
||||
|
Due on unsettled available for sale securities purchases
|
6,508
|
|
16,897
|
|
||||
|
Other liabilities
|
182,784
|
|
124,284
|
|
||||
|
Total liabilities
|
29,465,924
|
|
28,208,489
|
|
||||
|
Shareholders' equity:
|
|
|
|
|
||||
|
Common stock ($.00006 par value; 2,500,000,000 shares authorized; shares issued and outstanding:
2016 – 74,993,407;
2015 – 74,530,364)
|
4
|
|
4
|
|
||||
|
Capital surplus
|
1,006,535
|
|
982,009
|
|
||||
|
Retained earnings
|
2,823,334
|
|
2,704,121
|
|
||||
|
Treasury stock (shares at cost:
2016 – 9,655,975
; 2015 – 8,636,332)
|
(544,052
|
)
|
(477,165
|
)
|
||||
|
Accumulated other comprehensive income (loss)
|
(10,967
|
)
|
21,587
|
|
||||
|
Total shareholders’ equity
|
3,274,854
|
|
3,230,556
|
|
||||
|
Non-controlling interests
|
31,503
|
|
37,083
|
|
||||
|
Total equity
|
3,306,357
|
|
3,267,639
|
|
||||
|
Total liabilities and equity
|
$
|
32,772,281
|
|
$
|
31,476,128
|
|
||
See accompanying notes to consolidated financial statements.
84
|
Consolidated Statements of Changes in Equity
|
|||||||||||||||||||||||||||||||||||||
|
(In thousands)
|
|
|
|
|
Accumulated Other Comprehensive Income (Loss)
|
|
|
|
|||||||||||||||||||||||||||||
|
|
Common Stock
|
Capital
Surplus
|
Retained
Earnings
|
Treasury Stock
|
Total
Shareholders’
Equity
|
Non-
Controlling
Interests
|
Total Equity
|
||||||||||||||||||||||||||||||
|
|
Shares
|
Amount
|
Shares
|
Amount
|
|||||||||||||||||||||||||||||||||
|
Balance, December 31, 2013
|
73,163
|
|
$
|
4
|
|
$
|
898,586
|
|
$
|
2,349,428
|
|
4,305
|
|
$
|
(202,346
|
)
|
$
|
(25,623
|
)
|
$
|
3,020,049
|
|
$
|
34,924
|
|
$
|
3,054,973
|
|
|||||||||
|
Net income
|
—
|
|
—
|
|
—
|
|
292,435
|
|
—
|
|
—
|
|
—
|
|
292,435
|
|
3,044
|
|
295,479
|
|
|||||||||||||||||
|
Other comprehensive income
|
—
|
|
—
|
|
—
|
|
—
|
|
—
|
|
—
|
|
82,296
|
|
82,296
|
|
—
|
|
82,296
|
|
|||||||||||||||||
|
Repurchase of common stock
|
—
|
|
—
|
|
—
|
|
—
|
|
200
|
|
(12,337
|
)
|
—
|
|
(12,337
|
)
|
—
|
|
(12,337
|
)
|
|||||||||||||||||
|
Issuance of shares for equity compensation, net
|
510
|
|
—
|
|
16,632
|
|
—
|
|
183
|
|
(12,160
|
)
|
—
|
|
4,472
|
|
—
|
|
4,472
|
|
|||||||||||||||||
|
Tax effect from equity compensation, net
|
—
|
|
—
|
|
8,258
|
|
—
|
|
—
|
|
—
|
|
—
|
|
8,258
|
|
—
|
|
8,258
|
|
|||||||||||||||||
|
Share-based compensation
|
—
|
|
—
|
|
9,680
|
|
—
|
|
—
|
|
—
|
|
—
|
|
9,680
|
|
—
|
|
9,680
|
|
|||||||||||||||||
|
Issuance of shares in settlement of deferred compensation, net
|
331
|
|
21,488
|
|
202
|
|
(13,136
|
)
|
8,352
|
|
8,352
|
|
|||||||||||||||||||||||||
|
Cash dividends on common stock
|
—
|
|
—
|
|
—
|
|
(111,026
|
)
|
—
|
|
—
|
|
—
|
|
(111,026
|
)
|
—
|
|
(111,026
|
)
|
|||||||||||||||||
|
Capital calls and distributions, net
|
—
|
|
—
|
|
—
|
|
—
|
|
—
|
|
—
|
|
—
|
|
—
|
|
(3,941
|
)
|
(3,941
|
)
|
|||||||||||||||||
|
Balance, December 31, 2014
|
74,004
|
|
4
|
|
954,644
|
|
2,530,837
|
|
4,890
|
|
(239,979
|
)
|
56,673
|
|
3,302,179
|
|
34,027
|
|
3,336,206
|
|
|||||||||||||||||
|
Net income
|
—
|
|
—
|
|
—
|
|
288,565
|
|
—
|
|
—
|
|
—
|
|
288,565
|
|
3,694
|
|
292,259
|
|
|||||||||||||||||
|
Other comprehensive loss
|
—
|
|
—
|
|
—
|
|
—
|
|
—
|
|
—
|
|
(35,086
|
)
|
(35,086
|
)
|
—
|
|
(35,086
|
)
|
|||||||||||||||||
|
Repurchase of common stock
|
—
|
|
—
|
|
—
|
|
—
|
|
3,634
|
|
(229,540
|
)
|
—
|
|
(229,540
|
)
|
—
|
|
(229,540
|
)
|
|||||||||||||||||
|
Issuance of shares for equity compensation, net
|
526
|
|
—
|
|
14,357
|
|
—
|
|
112
|
|
(7,646
|
)
|
—
|
|
6,711
|
|
—
|
|
6,711
|
|
|||||||||||||||||
|
Tax effect from equity compensation, net
|
—
|
|
—
|
|
925
|
|
—
|
|
—
|
|
—
|
|
—
|
|
925
|
|
—
|
|
925
|
|
|||||||||||||||||
|
Share-based compensation
|
—
|
|
—
|
|
12,083
|
|
—
|
|
—
|
|
—
|
|
—
|
|
12,083
|
|
—
|
|
12,083
|
|
|||||||||||||||||
|
Cash dividends on common stock
|
—
|
|
—
|
|
—
|
|
(115,281
|
)
|
—
|
|
—
|
|
—
|
|
(115,281
|
)
|
—
|
|
(115,281
|
)
|
|||||||||||||||||
|
Sale of non-controlling interest
|
—
|
|
—
|
|
—
|
|
—
|
|
—
|
|
—
|
|
—
|
|
—
|
|
5,500
|
|
5,500
|
|
|||||||||||||||||
|
Capital calls and distributions, net
|
—
|
|
—
|
|
—
|
|
—
|
|
—
|
|
—
|
|
—
|
|
—
|
|
(6,138
|
)
|
(6,138
|
)
|
|||||||||||||||||
|
Balance, December 31, 2015
|
74,530
|
|
4
|
|
982,009
|
|
2,704,121
|
|
8,636
|
|
(477,165
|
)
|
21,587
|
|
3,230,556
|
|
37,083
|
|
3,267,639
|
|
|||||||||||||||||
|
Net income (loss)
|
—
|
|
—
|
|
—
|
|
232,668
|
|
—
|
|
—
|
|
—
|
|
232,668
|
|
(387
|
)
|
232,281
|
|
|||||||||||||||||
|
Other comprehensive loss
|
—
|
|
—
|
|
—
|
|
—
|
|
—
|
|
—
|
|
(32,554
|
)
|
(32,554
|
)
|
—
|
|
(32,554
|
)
|
|||||||||||||||||
|
Repurchase of common stock
|
—
|
|
—
|
|
—
|
|
—
|
|
1,005
|
|
(66,792
|
)
|
—
|
|
(66,792
|
)
|
—
|
|
(66,792
|
)
|
|||||||||||||||||
|
Issuance of shares for equity compensation, net
|
463
|
|
—
|
|
12,465
|
|
—
|
|
15
|
|
(95
|
)
|
—
|
|
12,370
|
|
—
|
|
12,370
|
|
|||||||||||||||||
|
Tax effect from equity compensation, net
|
—
|
|
—
|
|
1,590
|
|
—
|
|
—
|
|
—
|
|
—
|
|
1,590
|
|
—
|
|
1,590
|
|
|||||||||||||||||
|
Share-based compensation
|
—
|
|
—
|
|
10,471
|
|
—
|
|
—
|
|
—
|
|
—
|
|
10,471
|
|
—
|
|
10,471
|
|
|||||||||||||||||
|
Cash dividends on common stock
|
—
|
|
(113,455
|
)
|
(113,455
|
)
|
—
|
|
(113,455
|
)
|
|||||||||||||||||||||||||||
|
Capital calls and distributions, net
|
—
|
|
—
|
|
—
|
|
—
|
|
—
|
|
—
|
|
—
|
|
—
|
|
(5,193
|
)
|
(5,193
|
)
|
|||||||||||||||||
|
Balance, December 31, 2016
|
74,993
|
|
$
|
4
|
|
$
|
1,006,535
|
|
$
|
2,823,334
|
|
9,656
|
|
$
|
(544,052
|
)
|
$
|
(10,967
|
)
|
$
|
3,274,854
|
|
$
|
31,503
|
|
$
|
3,306,357
|
|
|||||||||
See accompanying notes to consolidated financial statements.
85
|
(In thousands)
|
||||||||||||
|
|
Year Ended
|
|||||||||||
|
|
2016
|
2015
|
2014
|
|||||||||
|
Cash Flows From Operating Activities:
|
|
|
||||||||||
|
Net income
|
$
|
232,281
|
|
$
|
292,259
|
|
$
|
295,479
|
|
|||
|
Adjustments to reconcile net income to net cash provided by (used in) operating activities:
|
||||||||||||
|
Provision for credit losses
|
65,000
|
|
34,000
|
|
—
|
|
||||||
|
Change in fair value of mortgage servicing rights due to market changes
|
2,193
|
|
4,853
|
|
16,445
|
|
||||||
|
Change in fair value of mortgage servicing rights due to loan runoff
|
40,744
|
|
28,064
|
|
19,325
|
|
||||||
|
Unrealized losses (gains) from derivative contracts
|
11,234
|
|
964
|
|
(6,495
|
)
|
||||||
|
Depreciation and amortization
|
47,016
|
|
37,918
|
|
36,707
|
|
||||||
|
Tax effect from equity compensation, net
|
(1,505
|
)
|
(925
|
)
|
(8,258
|
)
|
||||||
|
Share-based compensation
|
10,471
|
|
12,083
|
|
9,680
|
|
||||||
|
Net amortization of securities discounts and premiums
|
41,643
|
|
55,145
|
|
57,202
|
|
||||||
|
Net realized gains on financial instruments and other assets
|
(13,011
|
)
|
(15,212
|
)
|
(1,362
|
)
|
||||||
|
Net gain on mortgage loans held for sale
|
(63,636
|
)
|
(75,780
|
)
|
(62,053
|
)
|
||||||
|
Mortgage loans originated for sale
|
(6,117,417
|
)
|
(6,372,956
|
)
|
(4,484,394
|
)
|
||||||
|
Proceeds from sale of mortgage loans held for sale
|
6,193,587
|
|
6,446,659
|
|
4,441,819
|
|
||||||
|
Capitalized mortgage servicing rights
|
(71,405
|
)
|
(79,546
|
)
|
(54,413
|
)
|
||||||
|
Change in trading and fair value option securities
|
149,921
|
|
(69,298
|
)
|
(243,265
|
)
|
||||||
|
Change in receivables
|
(603,861
|
)
|
(6,943
|
)
|
(7,103
|
)
|
||||||
|
Change in other assets
|
(49,565
|
)
|
(29,548
|
)
|
68,821
|
|
||||||
|
Change in accrued interest, taxes and expense
|
44,269
|
|
17,517
|
|
(115,772
|
)
|
||||||
|
Change in other liabilities
|
(11,413
|
)
|
15,756
|
|
1,007
|
|
||||||
|
Net cash provided by (used in) operating activities
|
(93,454
|
)
|
295,010
|
|
(36,630
|
)
|
||||||
|
Cash Flows From Investing Activities:
|
||||||||||||
|
Proceeds from sales of available for sale securities
|
899,381
|
|
1,600,380
|
|
2,664,740
|
|
||||||
|
Proceeds from maturities or redemptions of investment securities
|
86,847
|
|
72,664
|
|
63,258
|
|
||||||
|
Proceeds from maturities or redemptions of available for sale securities
|
1,740,226
|
|
1,542,517
|
|
1,635,533
|
|
||||||
|
Purchases of investment securities
|
(41,590
|
)
|
(25,132
|
)
|
(44,723
|
)
|
||||||
|
Purchases of available for sale securities
|
(2,333,740
|
)
|
(3,300,601
|
)
|
(3,045,077
|
)
|
||||||
|
Change in amount receivable on unsettled securities sales
|
33,005
|
|
34,066
|
|
(57,085
|
)
|
||||||
|
Loans originated, net of principal collected
|
(621,605
|
)
|
(1,681,035
|
)
|
(1,346,995
|
)
|
||||||
|
Net payments on derivative asset contracts
|
(103,668
|
)
|
(156,419
|
)
|
(247,726
|
)
|
||||||
|
Proceeds from disposition of assets
|
198,922
|
|
195,760
|
|
273,271
|
|
||||||
|
Acquisitions, net of cash acquired
|
56,017
|
|
(18,098
|
)
|
(21,898
|
)
|
||||||
|
Purchases of assets
|
(199,802
|
)
|
(265,406
|
)
|
(307,318
|
)
|
||||||
|
Net cash used in investing activities
|
(286,007
|
)
|
(2,001,304
|
)
|
(434,020
|
)
|
||||||
|
Cash Flows From Financing Activities:
|
||||||||||||
|
Net change in demand deposits, transaction deposits and savings accounts
|
1,277,285
|
|
149,951
|
|
958,809
|
|
||||||
|
Net change in time deposits
|
(216,084
|
)
|
(202,652
|
)
|
(87,277
|
)
|
||||||
|
Net change in other borrowed funds
|
(606,476
|
)
|
2,547,688
|
|
511,776
|
|
||||||
|
Repayment of subordinated debentures
|
(226,550
|
)
|
(121,810
|
)
|
—
|
|
||||||
|
Issuance of subordinated debentures, net of issuance costs
|
144,615
|
|
—
|
|
—
|
|
||||||
|
Change in amount due on unsettled security purchases
|
(10,389
|
)
|
(273,643
|
)
|
244,800
|
|
||||||
|
Issuance of common and treasury stock, net
|
12,455
|
|
6,711
|
|
4,472
|
|
||||||
|
Net change in derivative margin accounts
|
(28,806
|
)
|
(43,226
|
)
|
84,365
|
|
||||||
|
Net payments or proceeds on derivative liability contracts
|
106,051
|
|
149,428
|
|
257,439
|
|
||||||
|
Tax effect from equity compensation, net
|
1,505
|
|
925
|
|
8,258
|
|
||||||
|
Sale of non-controlling interests
|
—
|
|
5,500
|
|
—
|
|
||||||
|
Repurchase of common stock
|
(66,792
|
)
|
(229,540
|
)
|
(12,337
|
)
|
||||||
|
Dividends paid
|
(113,455
|
)
|
(115,281
|
)
|
(111,026
|
)
|
||||||
|
Net cash provided by financing activities
|
273,359
|
|
1,874,051
|
|
1,859,279
|
|
||||||
|
Net increase (decrease) in cash and cash equivalents
|
(106,102
|
)
|
167,757
|
|
1,388,629
|
|
||||||
|
Cash and cash equivalents at beginning of period
|
2,643,599
|
|
2,475,842
|
|
1,087,213
|
|
||||||
|
Cash and cash equivalents at end of period
|
$
|
2,537,497
|
|
$
|
2,643,599
|
|
$
|
2,475,842
|
|
|||
86
|
Consolidated Statements of Cash Flows
(In thousands)
|
||||||||||||
|
|
Year Ended
|
|||||||||||
|
|
2016
|
2015
|
2014
|
|||||||||
|
Supplemental Cash Flow Information:
|
||||||||||||
|
Cash paid for interest
|
$
|
82,876
|
|
$
|
66,091
|
|
$
|
65,721
|
|
|||
|
Cash paid for taxes
|
$
|
79,883
|
|
$
|
101,991
|
|
$
|
67,199
|
|
|||
|
Net loans and bank premises transferred to repossessed real estate and other assets
|
$
|
36,391
|
|
$
|
12,592
|
|
$
|
79,464
|
|
|||
|
Residential mortgage loans guaranteed by U.S. government agencies that became eligible for repurchase during the period
|
$
|
120,406
|
|
$
|
123,383
|
|
$
|
144,630
|
|
|||
|
Conveyance of other real estate owned guaranteed by U.S. government agencies
|
$
|
68,873
|
|
$
|
110,505
|
|
$
|
44,963
|
|
|||
|
Issuance of shares in settlement of accrued executive compensation
|
$
|
—
|
|
$
|
—
|
|
$
|
8,352
|
|
|||
See accompanying notes to consolidated financial statements.
87
Notes to Consolidated Financial Statements
(
1
) Significant Accounting Policies
Basis of Presentation
The Consolidated Financial Statements of BOK Financial Corporation (“BOK Financial” or “the Company”) have been prepared in conformity with accounting principles generally accepted in the United States ("U.S. GAAP"), including interpretations of U.S. GAAP issued by federal banking regulators and general practices of the banking industry. The consolidated financial statements include the accounts of BOK Financial and its subsidiaries, principally BOKF, NA, BOK Financial Securities, Inc., The Milestone Group, Inc. and Cavanal Hill Investment Management, Inc. All significant intercompany transactions are eliminated in consolidation.
The consolidated financial statements include the assets, liabilities, non-controlling interests and results of operations of variable interest entities (“VIEs”) when BOK Financial is determined to be the primary beneficiary. Variable interest entities are generally defined as entities that either do not have sufficient equity to finance their activities without support from other parties or whose equity investors lack a controlling financial interest. See additional discussion of variable interest entities at Note
14
following.
Certain prior year amounts have been reclassified to conform to the current year presentation. For 2015,
$8.4 million
of residential mortgage loan origination costs were reclassified from operating expense to mortgage banking revenue. Correction of this error did not affect net income or earnings per share.
Nature of Operations
BOK Financial, through its subsidiaries, provides a wide range of financial services to commercial and industrial customers, other financial institutions, municipalities, and consumers. These services include depository and cash management; lending and lease financing; mortgage banking; securities brokerage, trading and underwriting; and personal and corporate trust.
BOKF, NA operates as Bank of Oklahoma primarily in the Tulsa and Oklahoma City metropolitan areas of the state of Oklahoma and Bank of Texas primarily in the Dallas, Fort Worth and Houston metropolitan areas of the state of Texas. In addition, BOKF, NA does business as Bank of Albuquerque in Albuquerque, New Mexico; Colorado State Bank and Trust in Denver, Colorado; Bank of Arizona in Phoenix, Arizona; Bank of Kansas City and Mobank in Kansas City, Missouri/Kansas and Bank of Arkansas in Northwest Arkansas. BOKF, NA also operates the TransFund electronic funds network.
Use of Estimates
Preparation of BOK Financial's consolidated financial statements requires management to make estimates of future economic activities, including loan collectability, prepayments and cash flows from customer accounts. These estimates are based upon current conditions and information available to management. Actual results may differ significantly from these estimates.
Acquisitions
Assets and liabilities acquired, including identifiable intangible assets, are recorded at fair value on the acquisition date. The purchase price includes consideration paid at closing and the estimated fair value of contingent consideration that will be paid in the future, subject to achieving defined performance criteria. Premiums and discounts assigned to interest-earning assets and interest-bearing liabilities are amortized over the lives of the acquired assets and liabilities on either an individual instrument or pool basis. Provision for credit losses is recognized for changes in credit quality after the acquisition date. Goodwill is recognized as the excess of the purchase price over the net fair value of assets acquired and liabilities assumed. The Consolidated Statements of Earnings include the results of operations from the acquisition date.
Goodwill and Intangible Assets
Goodwill and intangible assets generally result from business combinations and are evaluated for each of BOK Financial's reporting units for impairment annually or more frequently if conditions indicate impairment. The evaluation of possible impairment of goodwill and intangible assets involves significant judgment based upon short-term and long-term projections of future performance.
88
Reporting units are defined by the Company as significant lines of business within each operating segment. This definition is consistent with the manner in which the chief operating decision maker assesses the performance of the Company and makes decisions concerning the allocation of resources. The Company qualitatively assesses whether it is more likely than not that the fair value of the reporting units are less than their carrying value, including goodwill. Reporting unit carrying value includes sufficient capital to exceed regulatory requirements. This assessment includes consideration of relevant events and circumstances including but not limited to macroeconomic conditions, industry and market conditions, the financial and stock performance of the Company and other relevant factors.
If the Company concludes that it is not more likely than not that the fair value of a reporting unit is less than its carrying value through the qualitative assessment, a quantitative Step 1 analysis is performed. The quantitative analysis compares the fair value of the reporting unit with its carrying value, including goodwill. The fair value of each reporting unit is estimated by the discounted future earnings method. Goodwill is considered impaired if the fair value of the reporting unit is less than the carrying value of the reporting unit, including goodwill. Impairment is measured through a detailed Step 2 assessment of the fair values for each asset and liability assigned to the reporting unit performed in a manner similar to a business combination.
Intangible assets are generally composed of customer relationships, naming rights, non-compete agreements and core deposit premiums. They are amortized using accelerated or straight-line methods, as appropriate, over the estimated benefit periods. These periods range from
3 years
to
20 years
. The net book values of identifiable intangible assets are evaluated for impairment when economic conditions indicate impairment may exist.
Cash Equivalents
Due from banks, funds sold (generally federal funds sold for
one
day), resell agreements (which generally mature within
one
to
30 days
) and investments in money market funds are considered cash equivalents.
Securities
Securities are identified as trading, investment (held to maturity) or available for sale at the time of purchase based upon the intent of management, liquidity and capital requirements, regulatory limitations and other relevant factors. Trading securities, which are acquired for profit through resale, are carried at fair value with unrealized gains and losses included in current period earnings. Investment securities are carried at amortized cost. Amortization is computed by methods that approximate level yield and is adjusted for changes in prepayment estimates. Securities identified as available for sale are carried at fair value. Unrealized gains and losses are recorded, net of deferred income taxes, as accumulated other comprehensive income in shareholders' equity. Available for sale securities are separately identified as pledged to creditors if the creditor has the right to sell or re-pledge the collateral.
The purchase or sale of securities is recognized on a trade date basis. Realized gains and losses on sales of securities are based upon specific identification of the security sold. A receivable or payable is recognized for subsequent transaction settlement. Securities meeting certain criteria may also be transferred from the available for sale classification to the investment securities portfolio at fair value on the date of transfer. The unrealized gain or loss at the date of transfer is retained in accumulated other comprehensive income and in the carrying value of the investment securities portfolio. Such amounts are amortized over the estimated remaining life of the security as an adjustment to yield, offsetting the related amortization of the premium or accretion of the discount on the transferred securities.
On a quarterly basis, the Company performs separate evaluations of impaired debt investment and available for sale securities and equity available for sale securities to determine if the decline in fair value below the amortized cost is other-than-temporary.
For debt securities, management determines whether it intends to sell or if it is more likely than not that it will be required to sell impaired securities. This determination considers current and forecasted liquidity requirements and securities portfolio management. If the Company intends to sell or it is more likely than not that it will be required to sell the impaired debt security, a charge is recognized against earnings for the entire unrealized loss. For all impaired debt securities for which there is no intent or expected requirement to sell, the evaluation considers all available evidence to assess whether it is more likely than not that all amounts due would not be collected according to the security's contractual terms. Impairment of debt securities rated investment grade by all nationally-recognized rating agencies is considered temporary unless specific contrary information is identified. Impairment of debt securities rated below investment grade by at least one of the nationally recognized rating agencies is evaluated based on projections of estimated cash flows. Any expected credit loss due to the inability to collect all amounts due according to the security's contractual terms is recognized as a charge against earnings. Any remaining unrealized loss related to other factors would be recognized in other comprehensive income, net of taxes.
89
For equity securities, management evaluates various factors including cause, severity and duration of the decline in value of the security and prospects for recovery, as well as the Company's intent and ability not to sell the security until the fair value exceeds amortized cost over periods not to exceed three years. If an unrealized loss is determined to be other-than-temporary, a charge is recognized against earnings for the difference between the security's amortized cost and fair value.
BOK Financial may elect to carry certain securities at fair value with changes in fair value recognized in current period income. These securities are held with the intent that gains or losses will offset changes in the fair value of mortgage servicing rights or certain derivative instruments.
Restricted equity securities represent equity interests the Company is required to hold in the Federal Reserve Banks and Federal Home Loan Banks. Restricted equity securities are carried at cost as these securities do not have a readily determined fair value because ownership of these shares is restricted and they lack a market.
Derivative Instruments
Derivative instruments may be used by the Company as part of its internal risk management programs or may be offered to customers. All derivative instruments are carried at fair value and changes in fair value are generally reported in income as they occur. The determination of fair value of derivative instruments considers changes in interest rates, commodity prices and foreign exchange rates. Credit risk is also considered in determining fair value. Deterioration in the credit rating of customers or other counterparties reduces the fair value of asset contracts. Deterioration of our credit rating could decrease the fair value of our derivative liabilities.
When bilateral netting agreements or similar agreements exist between the Company and its counterparties that create a single legal claim or obligation to pay or receive the net amount in settlement of the individual derivative contracts, the Company reports derivative assets and liabilities on a net by derivative contract by counterparty basis.
Derivative contracts may also require the Company to provide or receive cash margin as collateral for derivative assets and liabilities. Derivative assets and liabilities are reported net of cash margin when certain conditions are met. In addition, derivative contracts executed with customers under Customer Risk Management Programs may be secured by non-cash collateral in conjunction with a credit agreement with that customer. Access to collateral, in the event of default is reasonably assured.
Derivative instruments may be designated as cash flow hedges of variable rate assets or liabilities, or of anticipated transactions. Changes in the fair value of derivative instruments designated as cash flow hedges are recorded in accumulated other comprehensive income to the extent they are effective. The amount recorded in other comprehensive income is reclassified to earnings in the same periods as the hedged cash flows impact earnings. The ineffective portion of changes in fair value is reported in current earnings.
BOK Financial may use derivative instruments in managing its interest rate sensitivity, as part of its economic hedge of the changes in the fair value of mortgage servicing rights and as an economic hedge of trading securities. Changes in the fair value of derivative instruments used in managing interest rate sensitivity and as part of its economic hedge of changes in the fair value of mortgage servicing rights are included in Other Operating Revenue - Gain (loss) on derivatives, net in the Consolidated Statement of Earnings. Changes in the fair value of derivative instruments used as an economic hedge of trading securities are included in Operating Revenue- Brokerage and trading revenue.
BOK Financial also enters into mortgage loan commitments that are considered derivative contracts. Forward sales contracts that have not been designated as hedging instruments are used to economically hedge these mortgage loan commitments as well as mortgage loans held for sale. Mortgage loan commitments are carried at fair value based upon quoted prices. Changes in fair value of mortgage loan commitments, mortgage loans held for sale and forward sales contracts are reported in Other Operating Revenue - Mortgage Banking Revenue.
90
BOK Financial offers programs that permit its customers to manage various risks, including fluctuations in energy, cattle and other agricultural products, interest rates and foreign exchanges rates with derivative contracts. Customers may also manage interest rate risk through interest rate swaps used by the borrower to modify interest rate terms of their loans or to-be-announced securities used by our mortgage banking customers to hedge their loan production. Derivative contracts are executed between the customers and BOK Financial. Offsetting contracts are executed between BOK Financial and other selected counterparties to minimize market risk from changes in commodity prices, interest rates or foreign exchange rates. The counterparty contracts are identical to customer contracts, except for a fixed pricing spread or fee paid to BOK Financial as profit and compensation for administrative costs and credit risk which is recognized over the life of the contracts and included in other Operating Revenue - Brokerage and Trading Revenue in the Consolidated Statements of Earnings.
Loans
Loans are either secured or unsecured based on the type of loan and the financial condition of the borrower. Repayment is generally expected from cash flow or proceeds from the sale of selected assets of the borrower. BOK Financial is exposed to risk of loss on loans due to the borrower's financial difficulties, which may arise from any number of factors, including problems within the respective industry or local economic conditions. Access to collateral, in the event of borrower default, is reasonably assured through adherence to applicable lending laws and through sound lending standards and credit review procedures. Accounting policies for all loans, excluding residential loans guaranteed by U.S. government agencies, are as follows.
Interest is accrued at the applicable interest rate on the outstanding principal amount. Loans are placed on nonaccruing status when, in the opinion of management, full collection of principal or interest is uncertain. Internally risk graded loans are individually evaluated for nonaccruing status quarterly. Non-risk graded loans are generally placed on nonaccruing status when
90 days
or more past due or within
60 days
of being notified of the borrower's bankruptcy filing. Interest previously accrued but not collected is charged against interest income when the loan is placed on nonaccruing status. Payments received on nonaccruing loans are applied to principal or recognized as interest income, according to management's judgment as to the collectability of principal. Loans may be returned to accruing status when, in the opinion of management, full collection of principal and interest, including principal previously charged off, is probable based on improvements in the borrower's financial condition or a sustained period of performance.
Loans to borrowers experiencing financial difficulties may be modified in troubled debt restructurings ("TDRs"). All TDRs are classified as nonaccruing. Modifications generally consist of extension of payment terms or interest rate concessions and may result either voluntarily through negotiations with the borrower or involuntarily through court order. Generally, principal and accrued but unpaid interest is not voluntarily forgiven.
Performing loans may be renewed under the current collateral, debt service ratio and other underwriting standards. Nonaccruing loans may also be renewed and will remain classified as nonaccruing.
Occasionally, loans, other than residential mortgage loans, may be held for sale in order to manage credit concentration. These loans are carried at the lower of cost or fair value with gains or losses recognized in gain (loss) on assets.
All loans are charged-off when the loan balance or a portion of the loan balance is no longer supported by the paying capacity of the borrower or when the required cash flow is reduced in a TDR. The charge-off amount is determined through an evaluation of available cash resources and collateral value. Internally risk graded loans are evaluated quarterly and charge-offs are taken in the quarter in which the loss is identified. Non-risk graded loans that are past due between
60 days
and
180 days
, based on the loan product type, are charged off. Loans to borrowers whose personal obligation has been discharged through Chapter 7 bankruptcy proceedings are charged off within
60 days
of notice of the bankruptcy filing, regardless of payment status.
Loan origination and commitment fees and direct loan acquisition and origination costs are deferred and amortized as an adjustment to yield over the life of the loan or over the commitment period, as applicable. Amortization does not anticipate loan prepayments. Net unamortized fees are recognized in full at time of payoff.
91
Qualifying residential mortgage loans guaranteed by U.S. government agencies have been sold into GNMA pools. Under certain performance conditions specified in government programs, the Company has the right, but not the obligation to repurchase loans from GNMA pools. These loans no longer qualify for sale accounting and are recognized in the Consolidated Balance Sheet. Guaranteed loans are considered to be impaired because we do not expect to receive all principal and interest based on the loan's contractual terms. The principal balance continues to be guaranteed, however, interest accrues at a curtailed rate as specified in the programs. The carrying value of these loans is reduced based on an estimate of expected cash flows discounted at the original note rate plus a liquidity spread. Guaranteed loans may be modified in TDRs in accordance with U.S. government agency guidelines. Interest continues to accrue at the modified rate. U.S. government guaranteed loans may either be resold into GNMA pools after a performance period specified by the programs or foreclosed and conveyed to the guarantors.
Loans are disaggregated into portfolio segments and further disaggregated into classes. The portfolio segment is the level at which the Company develops and documents a systematic method for determining its Allowance for Credits Losses. Classes are based on the risk characteristics of the loans and the Company's method for monitoring and assessing credit risk.
Allowance for Loan Losses and Accrual for Off-Balance Sheet Credit Risk
The appropriateness of the allowance for loan losses and accrual for off-balance sheet credit risk (collectively "Allowance for Credit Losses") is assessed by management quarterly based on an ongoing quarterly evaluation of the probable estimated losses inherent in the portfolio, including probable losses on outstanding loans and unused commitments to provide financing.
A consistent well-documented methodology has been developed and is applied by an independent Credit Administration department to assure consistency across the Company.
The allowance for loan losses consists of specific allowances attributed to impaired loans that have not yet been charged down to amounts we expect to recover, general allowances based on estimated loss rates by loan class and nonspecific allowances based on factors that affect more than one portfolio segment. There were no changes to the methodology for estimating general allowances during
2016
or
2015
.
Loans are considered to be impaired when it becomes probable that BOK Financial will be unable to collect all amounts due according to the contractual terms of the loan agreements. Internally risk graded loans are evaluated individually for impairment. Substantially all commercial and commercial real estate loans and certain residential mortgage and personal loans are risk graded based on a quarterly evaluation of the borrowers' ability to repay. Certain commercial loans and most residential mortgage and personal loans are small balance, homogeneous pools of loans that are not risk graded. Non-risk graded loans are identified as impaired based on performance status. Generally, non-risk graded loans 90 days or more past due, modified in a troubled debt restructuring or in bankruptcy are considered to be impaired.
Specific allowances for impaired loans are measured by an evaluation of estimated future cash flows discounted at the loan's initial effective interest rate or the fair value of collateral for certain collateral dependent loans. The fair value of real property held as collateral is generally based on third party appraisals that conform to Uniform Standards of Professional Appraisal Practice, less estimated selling costs. Appraised values are on an “as-is” basis and generally are not adjusted by the Company. Updated appraisals are obtained at least annually or more frequently if market conditions indicate collateral values may have declined. Collateral value of mineral rights is generally determined by our internal staff of engineers based on projected cash flows from proven oil and gas reserves under existing economic and operating conditions. The value of other collateral is generally determined by our special assets staff based on projected liquidation cash flows under current market conditions. Collateral values and available cash resources that support impaired loans are evaluated quarterly. Historical statistics may be used as a practical way to estimate impairment in limited situations, such as when a collateral dependent loan is identified as impaired at the end of a reporting period until an appraisal of collateral value is received or a full assessment of future cash flows is completed. Estimates of future cash flows and collateral values require significant judgments and may be volatile.
92
General allowances for unimpaired loans are based on an estimated loss rate by loan class. The appropriate historical gross loss rate for each loan class is determined by the greater of the current loss rate based on the most recent twelve months or a ten-year average gross loss rate. Recoveries are not directly considered in the estimation of historical loss rates. Recoveries generally do not follow predictable patterns and are not received until well-after the charge-off date as a result of protracted legal actions. For risk graded loans, historical gross loss rates are adjusted for changes in risk grading. For each loan class, the current weighted average risk grade is compared to the long-term weighted average risk grade. This comparison determines whether credit risk in each loan class is increasing or decreasing. Historical loss rates are adjusted upward or downward in proportion to changes in average risk grading. General allowances for unimpaired loans also consider inherent risks identified for each loan class. Inherent risks consider loss rates that most appropriately represent the current credit cycle and other factors attributable to a specific loan class which have not yet been represented in the historical gross loss rates or risk grading. These factors include changes in commodity prices or engineering imprecision which may affect the value of reserves that secure our energy loan portfolio, construction risk that may affect commercial real estate loans, changes in regulations and public policy that may disproportionately impact health care loans and changes in loan products.
Nonspecific allowances are maintained for risks beyond factors specific to a particular portfolio segment or loan class. These factors include trends in the economy in our primary lending areas, concentration in large-balance loans and other relevant factors.
An accrual for off-balance sheet credit risk is included in Other liabilities. The appropriateness of the accrual is determined in the same manner as the allowance for loan losses.
A provision for credit losses is charged against or credited to earnings in amounts necessary to maintain an appropriate Allowance for Credit Losses. Recoveries of loans previously charged off are added to the allowance when received.
Transfers of Financial Assets
BOK Financial regularly transfers financial assets as part of its mortgage banking activities and periodically may transfer other financial assets. Transfers are recorded as sales when the criteria for surrender of control are met.
The Company has elected to carry certain residential mortgage loans held for sale at fair value under the fair value option. Changes in fair value are recognized in net income as they occur. These loans are reported separately in the Consolidated Balance Sheets and changes in fair value are recorded in other operating revenue - mortgage banking revenue in the Consolidated Statements of Earnings.
Fair value of conforming residential mortgage loans that will be sold to U.S. government agencies is based on sales commitments or market quotes considered Level 2 inputs. Fair value of mortgage loans that are unable to be sold to U.S. government agencies is based on Level 3 inputs using quoted prices of loans that are sold in securitization transactions with a liquidity discount applied. The fair value is corroborated with an independent third party on at least an annual basis.
BOK Financial retains a repurchase obligation under underwriting representations and warranties related to residential mortgage loans transferred and generally retains the right to service the loans. The Company may incur a recourse obligation in limited circumstances. Separate accruals are recognized in Other liabilities in the Consolidated Balance Sheets for repurchase and recourse obligations. These reserves reflect the estimated amount of probable loss the Company will incur as a result of repurchasing a loan, indemnifications, and other settlement resolutions.
Repurchases of loans with an origination defect that are also credit impaired are considered collateral dependent and are initially recognized at net realizable value (appraised value less the cost to sell). The difference between unpaid principal balance and net realizable value is not accreted. Repurchases of loans with an origination defect that are not credit impaired are carried at fair value as of the repurchase date. Interest income continues to accrue on these loans and the discount is accreted over the estimated life of the loan.
The accrual for credit losses related to recourse loans for principal and interest is performed by Credit Administration and subject to oversight by the Finance/Credit Administration Allowance Committee. All other mortgage related accruals are reviewed monthly by the Mortgage Contingency Loss Accrual Committee which is subject to oversight by Finance.
The Company may also choose to purchase GNMA loans once certain mandated delinquency criteria are met. The loans that are eligible and are chosen to be repurchased are initially recognized at fair value based on expected cash flow discounted using the average agency guaranteed debenture rates, average actual principal loss rates and liquidity premium.
93
The Company may also retain a residual interest in excess cash flows generated by the assets. All assets obtained, including cash, servicing rights and residual interests, and all liabilities incurred, including recourse obligations, are initially recognized at fair value, all assets transferred are de-recognized and any gain or loss on the sale is recognized in earnings. Subsequently, servicing rights and residual interest are carried at fair value with changes in fair value recognized in earnings as they occur.
Real Estate and Other Repossessed Assets
Real estate and other repossessed assets are acquired in partial or total forgiveness of loans. These assets are initially recognized at cost, which is determined by fair value at date of foreclosure less estimated disposal costs. They are subsequently carried at the lower of cost or current fair value less estimated disposal costs. Decreases in fair value below cost are recognized as asset-specific valuation allowances which may be reversed when supported by future increases in fair value.
Subsequent increases in fair value may be used to reduce the allowance but not below zero.
Fair values of real estate are based on “as is” appraisals which are updated at least annually or more frequently for certain asset types or assets located in certain distressed markets. Fair values based on appraisals are generally considered to be based on significant other observable inputs. The Company also considers decreases in listing price and other relevant information in quarterly evaluations and reduces the carrying value of real estate and other repossessed assets when necessary. Fair values based on list prices and other relevant information are generally considered to be based on significant unobservable inputs. Additional costs incurred to complete real estate and other repossessed assets may increase the carrying value, up to current fair value based on “as completed” appraisals. The fair value of mineral rights included in repossessed assets are generally determined by our internal staff of engineers based on projected cash flows from proven oil and gas reserves under existing economic and operating conditions. The value of other repossessed assets is generally determined by our special assets staff based on projected liquidation cash flows under current market conditions. Income generated by these assets is recognized as received. Operating expenses are recognized as incurred. Gains or losses on sales of real estate and other repossessed assets are based on the cash proceeds received less the cost basis of the asset, net of any valuation allowances.
The estimated disposal costs of real estate and other repossessed assets are evaluated by the Company on an annual basis based on actual results.
Premises and Equipment
Premises and equipment are carried at cost, including capitalized interest when appropriate, less accumulated depreciation and amortization. Depreciation and amortization are computed on a straight-line basis over the estimated useful lives of the assets or, for leasehold improvements, over the shorter of the estimated useful lives or remaining lease terms. Useful lives range from
5 years
to
40 years
for buildings and improvements,
3 years
to
10 years
for software and
3 years
to
10 years
for furniture and equipment. Construction in progress represents facilities construction and data processing systems projects underway that have not yet been placed into service. Depreciation and amortization begin once the assets are placed into service.
Repair and maintenance costs, including software maintenance and enhancement costs, are charged to expense as incurred. Software licensing costs are generally charged to expense as incurred. Software licensing costs are capitalized if the contractual right to take possession of the software exists and it is feasible to take possession without significant penalty. Capitalized costs are amortized over the shorter of the estimated useful life of the software or remaining contractual life of the license.
Premises no longer used by the Company are transferred to real estate and other repossessed assets. The transferred amount is the lower of cost less accumulated depreciation or fair value less estimated disposal costs as of the transfer date.
Rent expense for leased premises is recognized as incurred over the lease term. The effects of rent holidays, significant rent escalations and other adjustments to rent payments are recognized on a straight-line basis over the lease term.
Ongoing technology projects of significant size or length are reviewed at least annually for impairment. The construction in progress account is reviewed for projects or components of projects that do not support the value of the asset being constructed. Findings of obsolescence, duplicate effort or other conditions that do not support the recorded value are impaired, with the cost of the impaired components being charged to current-year earnings.
Mortgage Servicing Rights
Mortgage servicing rights may be purchased or may be recognized when mortgage loans are originated and sold with servicing right retained. All mortgage servicing rights are carried at fair value. Changes in the fair value are recognized in earnings as they occur.
94
There is no active market for trading in mortgage servicing rights after origination. A cash flow model is used to determine fair value. Key assumptions and estimates, including projected prepayment speeds and assumed servicing costs, earnings on escrow deposits, ancillary income and discount rates, used by this model are based on current market sources. Assumptions used to value mortgage servicing rights are considered significant unobservable inputs. A separate third party model is used to estimate prepayment speeds based on interest rates, housing turnover rates, estimated loan curtailment, anticipated defaults and other relevant factors. The prepayment model is updated daily for changes in market conditions and adjusted to better correlate with actual performance of BOK Financial's servicing portfolio. Fair value estimates from outside sources are received at least annually to corroborate the results of the valuation model.
Federal and State Income Taxes
BOK Financial and its subsidiaries file consolidated tax returns. The subsidiaries provide for income taxes on a separate return basis and remit to BOK Financial amounts determined to be currently payable. BOK Financial is agent for its subsidiaries under the Company's tax sharing agreements and has no ownership rights to any refunds received for the benefit of its subsidiaries.
Current income tax expense or benefit is based on an evaluation that considers estimated taxable income, tax credits, and statutory federal and state income tax rates. The amount of current income tax expense or benefit recognized in any period may differ from amounts reported to taxing authorities. Annually, tax returns are filed with each jurisdiction where the Company conducts business and recognized current income tax expense or benefit is adjusted to the filed tax returns.
Deferred tax assets and liabilities are based upon the differences between the values of assets and liabilities as recognized in the financial statements and their related tax basis using enacted tax rates in effect for the year in which the differences are expected to be recovered or settled. A valuation allowance is provided when it is more likely than not that some portion of the entire deferred tax asset may not be realized based on taxes previously paid in net loss carry-back periods and other factors.
BOK Financial has unrecognized tax benefits, which are included in accrued current income taxes payable, for the uncertain portion of recorded tax benefits and related interest. These uncertainties result from the application of complex tax laws, rules, regulations and interpretations, primarily in state taxing jurisdictions. Unrecognized tax benefits are assessed quarterly and may be adjusted through current income tax expense in future periods based on changing facts and circumstances, completion of examinations by taxing authorities or expiration of a statute of limitations. Estimated penalties and interest on uncertain tax positions are recognized in income tax expense.
Employee Benefit Plans
BOK Financial sponsors a defined benefit cash balance pension plan (“Pension Plan”), qualified profit sharing plan (“Thrift Plan”) and employee health care plans. Pension Plan costs, which are based upon actuarial computations of current costs, are expensed annually. Unrecognized prior service cost and net gains or losses are amortized on a straight-line basis over a period not to exceed the average remaining service periods of the participants. Employer contributions to the Pension Plan are in accordance with Federal income tax regulations. Pension Plan benefits were curtailed as of April 1, 2006. No participants may be added to the Pension Plan and no additional service benefits will be accrued.
BOK Financial recognizes the funded status of its employee benefit plans. For a pension plan, the funded status is the difference between the fair value of plan assets and the projected benefit obligation measured as of the fiscal year-end date. Adjustments required to recognize the Pension Plan's net funded status are made through accumulated other comprehensive income, net of deferred income taxes.
Employer contributions to the Thrift Plan, which matches employee contributions subject to percentage and years of service limits, are expensed when incurred. BOK Financial recognizes the expense of health care benefits on the accrual method.
95
Share-Based Compensation Plans
BOK Financial awards stock options and non-vested common shares as compensation to certain officers. Compensation cost is generally fixed based on the grant date fair value of the award. The grant date fair value of stock options is based on the Black-Scholes option pricing model. Stock options generally have graded vesting over
7 years
. Each tranche is considered a separate award for valuation and compensation cost recognition. Grant date fair value of non-vested shares is based on the then-current market value of BOK Financial common stock. Non-vested shares awarded prior to 2013 generally cliff vest in
5 years
. Non-vested shares awarded since January 1, 2013 generally cliff vest in
3 years
and are subject to a
two
year holding period after vesting. Shares awarded under the Executive Incentive Plan are subject to downward adjustment at the discretion of the Incentive Compensation Committee. Compensation cost of non-vested shares granted under the Executive Incentive Plan varies based on changes in the fair value of BOKF common shares.
Compensation cost is recognized as expense over the service period, which is generally the vesting period. Expense is reduced for estimated forfeitures over the vesting period and adjusted for actual forfeitures as they occur. Stock-based compensation awarded to certain officers has performance conditions that affect the number of awards granted. Compensation cost is adjusted based on the probable outcome of the performance conditions.
Excess tax benefits from share-based payments recognized in capital surplus are determined by the excess of tax benefits recognized over the tax effect of compensation cost recognized. Dividends on non-vested shares that are not subject to forfeiture are charged to dividends paid.
Other Operating Revenue
Fees and commission revenue is recognized at the time the related services are provided or products are sold and may be accrued when necessary. Accrued fees and commissions are reversed against revenue if amounts are subsequently deemed to be uncollectible. Revenue is recognized on a gross basis whenever we have primary responsibility and risk in providing the services or products to our customers and on a net basis whenever we act as a broker for products or services of others.
Brokerage and trading revenue includes changes in the fair value of securities and derivatives held for trading purposes and derivatives held for customer risk management programs, including credit losses, commissions earned from the retail sale of securities, mutual funds and other financial instruments, and underwriting and financial advisory fees.
Transaction card revenue includes merchant discount fees, electronic funds transfer network fees and check card fees. Merchant discount fees represent fees paid by customers for account management and electronic processing of transactions. Merchant discount fees are recognized at the time the customer's transactions are processed or other services are performed. The Company also maintains the TransFund electronic funds transfer network for the benefit of its members, which includes BOKF, NA. Electronic funds transfer fees are recognized as electronic transactions processed on behalf of its members. Check card fees represent interchange fees paid by a merchant bank for transactions processed from cards issued by the Company. Check card fees are recognized when transactions are processed. Interchange fees are generally recognized on a gross basis. Related expenses are generally recognized as Data processing and communications expense.
Fiduciary and asset management revenue includes fees from asset management, custody, recordkeeping, investment advisory and administration services. Revenue is recognized on an accrual basis at the time the services are performed and may be based on either the fair value of the account or the service provided.
Deposit service charges and fees are recognized at least quarterly in accordance with a published deposit account agreements and disclosure statements for retail accounts or contractual agreements for commercial accounts. Item charges for overdraft or non-sufficient funds items are recognized as items are presented for payment. Account balance charges and activity fees are accrued monthly and collected in arrears. Commercial account activity fees may be offset by an earnings credit based on account balances.
96
Newly Adopted and Pending Accounting Pronouncements
The following is a summary of newly adopted and pending accounting pronouncements that may have a more than insignificant effect on the Company's financial statements.
Financial Accounting Standards Board ("FASB")
FASB Accounting Standards Update No. 2014-09,
Revenue from Contracts with Customers
("ASU 2014-09")
On May 28, 2014, the FASB issued ASU 2014-09 to clarify the principles for recognizing revenue by providing a more robust framework that will give greater consistency and comparability in revenue recognition practices. In the new framework, an entity recognizes revenue in an amount that reflects the consideration to which the entity expects to be entitled in exchange for goods or services. The new model requires the identification of performance obligations included in contracts with customers, a determination of the transaction price and an allocation of the price to those performance obligations. The entity recognizes revenue when performance obligations are satisfied. ASU 2014-09 is effective for the Company for annual reporting periods beginning after December 15, 2017, including interim periods within that reporting period. Net interest revenue from financial assets and liabilities is explicitly excluded from the scope of ASU 2014-09. Management expects that most fees and commission revenue will not be affected. The Company continues to evaluate the impact of ASU 2014-09 on Fiduciary and Asset Management Revenue and Transaction Card Revenue which represent
18%
of total gross revenue and
39%
of fees and commissions revenue for 2016. Timing of revenue recognition and gross vs. net revenue presentation may be affected. Management expects to adopt the standard in the first quarter of 2018 with a cumulative effect adjustment to opening retained earnings if such adjustment is significant.
FASB Accounting Standards Update No. 2016-08,
Revenue from Contracts with Customers (Topic 606): Principal versus Agent Considerations (Reporting Revenue Gross versus Net) ("ASU 2016-08")
On March 17, 2016, the FASB Issued ASU 2016-08 to amend the principal versus agent implementation guidance in ASU 2014-09. The ASU clarifies that an entity should evaluate whether it is the principal or the agent for each specified good or service promised in a contract with a customer. ASU 2016-08 is effective for the Company for annual reporting periods beginning after December 15, 2017, including interim periods within that reporting period. The Company generally follows the guidance of ASU 2016-08 and is evaluating the impact the adoption of ASU 2016-08 may have on the Company's financial statements along with ASU 2014-09.
FASB Accounting Standards Update No. 2016-10,
Revenue from Contracts with Customers (Topic 606): Identifying Performance Obligations and Licensing ("ASU 2016-10")
On April 14, 2016, the FASB issued ASU 2016-10 which amends certain sections of ASU 2014-09 related to identifying performance obligations and licensing implementation. ASU 2016-10 is effective for the Company for annual reporting periods beginning after December 15, 2017, including interim periods within that reporting period. The Company is evaluating the impact the adoption of ASU 2016-10 may have on the Company's financial statements along with ASU 2014-09.
FASB Accounting Standards Update No. 2016-12,
Revenue from Contracts with Customers (Topic 606): Narrow-Scope Improvements and Practical Expedients ("ASU 2016-12")
On May 9, 2016, the FASB issued ASU 2016-12, which amends certain aspects of the Board's new revenue standard, ASU 2014-09. The amendments clarify information regarding collectibility, presentation of sales tax and other similar taxes collected from customers, noncash consideration, contract modifications and completed contracts at transition, and transition disclosures. ASU 2016-12 is effective for the Company for annual reporting periods beginning after December 15, 2017, including interim periods within that reporting period. The Company is evaluating the impact the adoption of ASU 2016-12 may have on the Company's financial statements along with ASU 2014-09.
97
FASB Accounting Standards Update No. 2014-16,
Derivatives and Hedging (Topic 815): Determining Whether the Host Contract in a Hybrid Financial Instrument Issued in the Form of a Share is More Akin to Debt or to Equity
("ASU 2014-16")
On November 3, 2014, the FASB issued ASU 2014-16 to eliminate the use of different methods and reduce diversity under GAAP in the accounting for hybrid financial instruments issued in the form of a share. For hybrid financial instruments issued in the form of a share, an entity should determine the nature of the host contract by considering all stated and implied substantive terms and features of the hybrid financial instrument. The entity should determine the nature of the host contract by considering the economic characteristics and risks of the entire hybrid financial instrument, including the embedded derivative feature that is being evaluated for separate accounting from the host contract. For public business entities, the ASU was effective for annual periods beginning after December 15, 2015, and interim periods within those annual periods. Adoption of ASU 2014-16 did not impact the Company's consolidated financial statements.
FASB Accounting Standards Update No. 2015-02,
Consolidation (Topic 810): Amendments to the Consolidation Analysis
("ASU 2015-02")
On February 18, 2015, the FASB issued ASU 2015-02 to address concerns that current U.S. GAAP may require a reporting entity to consolidate another legal entity where the reporting entity's contractual rights do not give it the ability to act primarily on its own behalf, the reporting entity does not hold a majority of the legal entity's voting rights, or the reporting entity is not exposed to a majority of the legal entity's economic benefits or obligations. The amendments affected limited partnerships and similar legal entities, the evaluation of fees paid to a decision maker or a service provider as a variable interest, the effect of fee arrangements and related parties on the primary beneficiary determination, and certain investment funds. The ASU was effective for periods beginning after December 15, 2015 for public companies. Adoption of ASU 2015-02 did not have a material impact on the Company's consolidated financial statements.
FASB Accounting Standards Update No. 2015-07,
Fair Value Measurements (Topic 820): Disclosures for Investments in Certain Entities That Calculate Net Asset Value per Share (or Its Equivalent) ("ASU 2015-07")
On May 1, 2015, the FASB issued ASU 2015-07 to gain consistency within the categorization of the fair value hierarchy. The update removed the requirement to categorize within the fair value hierarchy all investments for which fair value is measured using the net asset value per share practical expedient. It also removed the requirement to make certain disclosures for all investments that are eligible to be measured at fair value using the net asset value per share practical expedient. The ASU was effective for the Company for interim and annual periods beginning after December 15, 2015 and was applied retrospectively to all periods presented. Adoption of ASU 2015-07 did not have a material impact on the Company's consolidated financial statements.
FASB Accounting Standards Update No. 2016-01,
Financial Instruments - Overall (Subtopic 825-10): Recognition and Measurement of Financial Assets and Financial Liabilities ("ASU 2016-01")
On January 5, 2016, the FASB issued ASU 2016-01 which requires equity investments, in general, to be measured at fair value with changes in fair value recognized in earnings. It also eliminates the requirement to disclose the methods and significant assumptions used to estimate the fair value for financial instruments measured at amortized cost, requires entities to use the exit price notion when measuring fair value, requires an entity to present separately in other comprehensive income the portion of the total change in fair value of a liability resulting from a change in the instrument-specific credit risk when the fair value option has been elected, requires separate presentation of financial assets and liabilities by measurement category and form on the balance sheet or accompanying notes, clarifies that an entity should evaluate the need for a valuation allowance on a deferred tax asset related to available-for-sale securities in combination with the entity's other deferred tax assets, and simplifies the impairment assessment of equity investments without readily determinable fair values. The ASU is effective for the Company for interim and annual periods beginning after December 15, 2017. Upon adoption, unrealized gains and losses from equity securities will be reclassified from other comprehensive income to retained earnings. As of December 31, 2016, the Company had
$2.4 million
of net unrealized gains and losses from equity securities in other comprehensive income.
FASB Accounting Standards Update No. 2016-02,
Leases (Topic 842) ("ASU 2016-02")
On February 25, 2016, the FASB issued ASU 2016-02 to increase transparency and comparability by recognizing substantially all lease liabilities on the balance sheet and disclosing key information about leasing arrangements. Lessees will be required to recognize an obligation for future lease payments measured on a discounted basis and a related right-of-use asset. The ASU is effective for the Company for interim and annual periods beginning after December 15, 2018 and requires transition through a modified retrospective approach for leases existing at or entered into after January 1, 2017. The Company is evaluating the impact the adoption of ASU 2016-02 will have on the Company's financial statements.
98
FASB Accounting Standards Update No. 2016-05,
Derivatives and Hedging (Topic 815): Effect of Derivative Contract Novations on Existing Hedge Accounting Relationships ("ASU 2016-05")
On March 10, 2016, the FASB issued ASU 2016-05 which clarifies that "a change in the counterparty to a derivative instrument that has been designated as the hedging instrument in an existing hedging relationship would not, in and of itself, be considered a termination of the derivative instrument" or "a change in a critical term of the hedging relationship." If all other hedge accounting criteria in ASC 815 are met, a hedging relationship where the hedging derivative instrument is novated would not be discontinued or need to be re-designated. The ASU is effective for interim and annual periods beginning after December 15, 2016. An entity would apply the guidance prospectively unless modified retrospective transition is elected. Early adoption is permitted. Adoption of ASU 2016-05 did not have a material impact on the Company's financial statements.
FASB Accounting Standards Update No. 2016-07,
Investments - Equity Method and Joint Ventures ("ASU 2016-07")
On March 15, 2016, the FASB issued ASU 2016-07 to simplify the equity method of accounting by eliminating the requirement to retrospectively apply the equity method to an investment that subsequently qualifies for such accounting. The ASU also requires that unrealized holding gains or losses in accumulated other comprehensive income related to an available for sale security that becomes eligible for the equity method be recognized in earnings as of the date the investment qualifies for the equity method. The ASU was effective for all entities for fiscal years beginning after December 15, 2016, including interim periods within those fiscal years. Adoption of ASU 2016-07 did not have a material impact on the Company's financial statements.
FASB Accounting Standards Update No. 2016-09,
Compensation - Stock Compensation (Topic 718): Improvements to Employee Share-Based Payment Accounting ("ASU 2016-09")
On March 30, 2016, the FASB issued ASU 2016-09 to simplify multiple aspects of accounting for employee share-based payment transactions including accounting income taxes, forfeitures, and statutory tax withholding requirements. The ASU is effective for annual reporting periods beginning after December 15, 2016, including interim periods within those annual reporting periods. Implementation of ASU 2016-09 will add volatility to tax expense as stock prices change; however, we expect the impact on future periods to be insignificant.
FASB Accounting Standards Update No. 2016-13,
Financial Instruments - Credit Losses (Topic 326): Assets Measured at Amortized Cost ("ASU 2016-13")
On June 16, 2016, the FASB issued ASU 2016-13 to provide more timely recording of credit losses on loans and other financial instruments. The ASU requires an impairment model (known as the current expected credit loss ("CECL") model) that is based on expected credit losses rather than incurred credit losses. It requires measurement of all expected credit losses for financial assets carried at amortized cost, including loans and investment securities, based on historical experience, current conditions, and reasonable and supportable forecasts. ASU 2016-13 also changes the recognition of other-than-temporary impairment of available for sale securities to an allowance methodology from an direct write-down methodology. ASU 2016-13 will be effective for the Company for annual reporting periods beginning after December 15, 2019, including interim periods within those fiscal years. Early adoption is permitted for annual reporting periods beginning after December 15, 2018. ASU 2016-13 will be applied through a cumulative-effect adjustment to retained earnings as of the beginning of the first reporting period in which the guidance is effective. The Company is evaluating the impact the adoption of ASU 2016-13 will have on the Company's financial statements.
FASB Accounting Standards Update No. 2016-15,
Statement of Cash Flows (Topic 230): Classification of Certain Cash Receipts and Cash Payments ("ASU 2016-15")
On August 26, 2016, the FASB issued ASU 2016-15, which amends ASC 230 on the classification of certain cash receipts and payments in the statement of cash flows. The amendments address eight specific cash flow issues. ASU 2016-15 is effective for the Company for annual reporting periods beginning after December 15, 2017, including interim periods within those fiscal years. Entities generally must apply the guidance retrospectively to all periods presented. Adoption of ASU 2016-15 is not expected to have a material impact on the Company's financial statements.
99
FASB Accounting Standards Update No. 2016-17,
Consolidation (Topic 810): Interests Held through Related Parties that are under Common Control ("ASU 2016-17")
On October 26, 2016, the FASB issued ASU 2016-17, which amends consolidation guidance on related parties under common control. The ASU requires that a single decision maker consider indirect interests held by related parties under common control on a proportionate basis in a manner consistent with its evaluation of indirect interests held through other related parties. ASU 2016-17 was effective for the Company for annual reporting periods beginning after December 15, 2016, including interim and annual periods. Adoption of ASU 2016-17 did not have a material impact on the Company's financial statements.
(
2
)
Securities
Trading Securities
The fair value and net unrealized gain (loss) included in trading securities is as follows (in thousands):
|
|
December 31, 2016
|
December 31, 2015
|
||||||||||||||
|
|
Fair Value
|
Net Unrealized Gain (Loss)
|
Fair Value
|
Net Unrealized Gain (Loss)
|
||||||||||||
|
U.S. government agency debentures
|
$
|
6,234
|
|
$
|
(4
|
)
|
$
|
61,295
|
|
$
|
(71
|
)
|
||||
|
U.S. government agency residential mortgage-backed securities
|
310,067
|
|
635
|
|
10,989
|
|
17
|
|
||||||||
|
Municipal and other tax-exempt securities
|
14,427
|
|
50
|
|
31,901
|
|
210
|
|
||||||||
|
Other trading securities
|
6,900
|
|
57
|
|
18,219
|
|
(16
|
)
|
||||||||
|
Total trading securities
|
$
|
337,628
|
|
$
|
738
|
|
$
|
122,404
|
|
$
|
140
|
|
||||
Investment Securities
The amortized cost and fair values of investment securities are as follows (in thousands):
|
|
December 31, 2016
|
|||||||||||||||||||
|
|
Amortized
|
Carrying
|
Fair
|
Gross Unrealized
1
|
||||||||||||||||
|
|
Cost
|
Value
|
Value
|
Gain
|
Loss
|
|||||||||||||||
|
Municipal and other tax-exempt securities
|
$
|
320,364
|
|
$
|
320,364
|
|
$
|
321,225
|
|
$
|
2,272
|
|
$
|
(1,411
|
)
|
|||||
|
U.S. government agency residential mortgage-backed securities – Other
|
20,777
|
|
20,777
|
|
21,473
|
|
767
|
|
(71
|
)
|
||||||||||
|
Other debt securities
|
205,004
|
|
205,004
|
|
222,795
|
|
18,115
|
|
(324
|
)
|
||||||||||
|
Total investment securities
|
$
|
546,145
|
|
$
|
546,145
|
|
$
|
565,493
|
|
$
|
21,154
|
|
$
|
(1,806
|
)
|
|||||
|
1
|
Gross unrealized gains and losses are not recognized in AOCI in the Consolidated Balance Sheets.
|
|
|
December 31, 2015
|
|||||||||||||||||||
|
|
Amortized
|
Carrying
|
Fair
|
Gross Unrealized
1
|
||||||||||||||||
|
|
Cost
|
Value
|
Value
|
Gain
|
Loss
|
|||||||||||||||
|
Municipal and other tax-exempt securities
|
$
|
365,258
|
|
$
|
365,258
|
|
$
|
368,910
|
|
$
|
3,935
|
|
$
|
(283
|
)
|
|||||
|
U.S. government agency residential mortgage-backed securities – Other
|
26,721
|
|
26,833
|
|
27,874
|
|
1,063
|
|
(22
|
)
|
||||||||||
|
Other debt securities
|
205,745
|
|
205,745
|
|
232,375
|
|
26,689
|
|
(59
|
)
|
||||||||||
|
Total investment securities
|
$
|
597,724
|
|
$
|
597,836
|
|
$
|
629,159
|
|
$
|
31,687
|
|
$
|
(364
|
)
|
|||||
|
1
|
Gross unrealized gains and losses are not recognized in AOCI in the Consolidated Balance Sheets.
|
100
The amortized cost and fair values of investment securities at
December 31, 2016
, by contractual maturity, are as shown in the following table (dollars in thousands):
|
Less than
One Year
|
One to
Five Years
|
Six to
Ten Years
|
Over
Ten Years
|
Total
|
Weighted
Average
Maturity²
|
||||||||||||||||||
|
Municipal and other tax-exempt securities:
|
|
|
|
|
|
|
|||||||||||||||||
|
Carrying value
|
$
|
83,583
|
|
$
|
181,596
|
|
$
|
5,909
|
|
$
|
49,276
|
|
$
|
320,364
|
|
3.41
|
|
||||||
|
Fair value
|
83,544
|
|
180,993
|
|
5,836
|
|
50,852
|
|
321,225
|
|
|||||||||||||
|
Nominal yield¹
|
1.48
|
%
|
2.08
|
%
|
3.31
|
%
|
5.20
|
%
|
2.43
|
%
|
|||||||||||||
|
Other debt securities:
|
|
|
|
|
|
|
|
|
|
|
|||||||||||||
|
Carrying value
|
$
|
16,045
|
|
$
|
41,804
|
|
$
|
127,320
|
|
$
|
19,835
|
|
$
|
205,004
|
|
6.66
|
|
||||||
|
Fair value
|
16,107
|
|
44,372
|
|
142,010
|
|
20,306
|
|
222,795
|
|
|||||||||||||
|
Nominal yield
|
3.28
|
%
|
5.14
|
%
|
5.86
|
%
|
4.79
|
%
|
5.41
|
%
|
|||||||||||||
|
Total fixed maturity securities:
|
|
|
|
|
|
|
|
|
|
|
|||||||||||||
|
Carrying value
|
$
|
99,628
|
|
$
|
223,400
|
|
$
|
133,229
|
|
$
|
69,111
|
|
$
|
525,368
|
|
4.68
|
|
||||||
|
Fair value
|
99,651
|
|
225,365
|
|
147,846
|
|
71,158
|
|
544,020
|
|
|
|
|||||||||||
|
Nominal yield
|
1.77
|
%
|
2.65
|
%
|
5.75
|
%
|
5.08
|
%
|
3.59
|
%
|
|
|
|||||||||||
|
Residential mortgage-backed securities:
|
|
|
|
|
|
|
|
|
|
|
|
|
|||||||||||
|
Carrying value
|
|
|
|
|
|
|
|
|
$
|
20,777
|
|
³
|
|
||||||||||
|
Fair value
|
|
|
|
|
|
|
|
|
21,473
|
|
|
|
|||||||||||
|
Nominal yield
4
|
|
|
|
|
|
|
|
|
2.76
|
%
|
|
|
|||||||||||
|
Total investment securities:
|
|
|
|
|
|
|
|
|
|
|
|
|
|||||||||||
|
Carrying value
|
|
|
|
|
|
|
|
|
$
|
546,145
|
|
|
|
||||||||||
|
Fair value
|
|
|
|
|
|
|
|
|
565,493
|
|
|
|
|||||||||||
|
Nominal yield
|
|
|
|
|
|
|
|
|
3.56
|
%
|
|
|
|||||||||||
|
1
|
Calculated on a taxable equivalent basis using a
39%
effective tax rate.
|
|
2
|
Expected maturities may differ from contractual maturities because borrowers may have the right to call or prepay obligations with or without penalty.
|
|
3
|
The average expected lives of residential mortgage-backed securities were
4.7 years
based upon current prepayment assumptions.
|
|
4
|
The nominal yield on residential mortgage-backed securities is based upon prepayment assumptions at the purchase date. Actual yields earned may differ significantly based upon actual prepayments. See Quarterly Financial Summary - Unaudited for current yields on the investment securities portfolio.
|
101
Available for Sale Securities
The amortized cost and fair value of available for sale securities are as follows (in thousands):
|
|
December 31, 2016
|
|||||||||||||||||||
|
|
Amortized
|
Fair
|
Gross Unrealized
1
|
|
||||||||||||||||
|
|
Cost
|
Value
|
Gain
|
Loss
|
OTTI
²
|
|||||||||||||||
|
U.S. Treasury securities
|
$
|
1,000
|
|
$
|
999
|
|
$
|
—
|
|
$
|
(1
|
)
|
$
|
—
|
|
|||||
|
Municipal and other tax-exempt securities
|
41,050
|
|
40,993
|
|
343
|
|
(400
|
)
|
—
|
|
||||||||||
|
Residential mortgage-backed securities:
|
|
|
|
|
|
|
|
|
|
|
||||||||||
|
U.S. government agencies:
|
|
|
|
|
|
|
|
|
|
|
||||||||||
|
FNMA
|
3,062,525
|
|
3,055,676
|
|
25,066
|
|
(31,915
|
)
|
—
|
|
||||||||||
|
FHLMC
|
1,534,451
|
|
1,531,116
|
|
8,475
|
|
(11,810
|
)
|
—
|
|
||||||||||
|
GNMA
|
878,375
|
|
873,594
|
|
2,259
|
|
(7,040
|
)
|
—
|
|
||||||||||
|
Total U.S. government agencies
|
5,475,351
|
|
5,460,386
|
|
35,800
|
|
(50,765
|
)
|
—
|
|
||||||||||
|
Private issue:
|
|
|
|
|
|
|
|
|
|
|
||||||||||
|
Alt-A loans
|
44,245
|
|
51,512
|
|
7,485
|
|
—
|
|
(218
|
)
|
||||||||||
|
Jumbo-A loans
|
56,947
|
|
64,023
|
|
7,092
|
|
(16
|
)
|
—
|
|
||||||||||
|
Total private issue
|
101,192
|
|
115,535
|
|
14,577
|
|
(16
|
)
|
(218
|
)
|
||||||||||
|
Total residential mortgage-backed securities
|
5,576,543
|
|
|
5,575,921
|
|
50,377
|
|
(50,781
|
)
|
(218
|
)
|
|||||||||
|
Commercial mortgage-backed securities guaranteed by U.S. government agencies
|
3,035,750
|
|
3,017,933
|
|
5,472
|
|
(23,289
|
)
|
—
|
|
||||||||||
|
Other debt securities
|
4,400
|
|
4,152
|
|
—
|
|
(248
|
)
|
—
|
|
||||||||||
|
Perpetual preferred stock
|
15,561
|
|
18,474
|
|
2,913
|
|
—
|
|
—
|
|
||||||||||
|
Equity securities and mutual funds
|
17,424
|
|
18,357
|
|
1,060
|
|
(127
|
)
|
—
|
|
||||||||||
|
Total available for sale securities
|
$
|
8,691,728
|
|
$
|
8,676,829
|
|
$
|
60,165
|
|
$
|
(74,846
|
)
|
$
|
(218
|
)
|
|||||
|
1
|
Gross unrealized gain/loss recognized in AOCI in the consolidated balance sheet.
|
|
2
|
Amounts represent unrealized loss that remains in AOCI after an other-than-temporary credit loss has been recognized in income.
|
102
|
|
December 31, 2015
|
|||||||||||||||||||
|
|
Amortized
|
Fair
|
Gross Unrealized¹
|
|
||||||||||||||||
|
|
Cost
|
Value
|
Gain
|
Loss
|
OTTI
²
|
|||||||||||||||
|
U.S. Treasury securities
|
$
|
1,000
|
|
$
|
995
|
|
$
|
—
|
|
$
|
(5
|
)
|
$
|
—
|
|
|||||
|
Municipal and other tax-exempt securities
|
56,681
|
|
56,817
|
|
873
|
|
(737
|
)
|
—
|
|
||||||||||
|
Residential mortgage-backed securities:
|
|
|
|
|
|
|
|
|
||||||||||||
|
U.S. government agencies:
|
|
|
|
|
|
|
|
|
|
|
||||||||||
|
FNMA
|
3,156,214
|
|
3,187,215
|
|
41,502
|
|
(10,501
|
)
|
—
|
|
||||||||||
|
FHLMC
|
1,940,915
|
|
1,949,335
|
|
14,727
|
|
(6,307
|
)
|
—
|
|
||||||||||
|
GNMA
|
763,967
|
|
761,801
|
|
2,385
|
|
(4,551
|
)
|
—
|
|
||||||||||
|
Total U.S. government agencies
|
5,861,096
|
|
5,898,351
|
|
58,614
|
|
(21,359
|
)
|
—
|
|
||||||||||
|
Private issue:
|
|
|
|
|
|
|
|
|
|
|
||||||||||
|
Alt-A loans
|
56,387
|
|
62,574
|
|
6,574
|
|
—
|
|
(387
|
)
|
||||||||||
|
Jumbo-A loans
|
71,724
|
|
76,544
|
|
5,260
|
|
—
|
|
(440
|
)
|
||||||||||
|
Total private issue
|
128,111
|
|
139,118
|
|
11,834
|
|
—
|
|
(827
|
)
|
||||||||||
|
Total residential mortgage-backed securities
|
5,989,207
|
|
6,037,469
|
|
70,448
|
|
(21,359
|
)
|
(827
|
)
|
||||||||||
|
Commercial mortgage-backed securities guaranteed by U.S. government agencies
|
2,919,044
|
|
2,905,796
|
|
5,396
|
|
(18,644
|
)
|
—
|
|
||||||||||
|
Other debt securities
|
4,400
|
|
4,151
|
|
—
|
|
(249
|
)
|
—
|
|
||||||||||
|
Perpetual preferred stock
|
17,171
|
|
19,672
|
|
2,501
|
|
—
|
|
—
|
|
||||||||||
|
Equity securities and mutual funds
|
17,121
|
|
17,833
|
|
752
|
|
(40
|
)
|
—
|
|
||||||||||
|
Total available for sale securities
|
$
|
9,004,624
|
|
$
|
9,042,733
|
|
$
|
79,970
|
|
$
|
(41,034
|
)
|
$
|
(827
|
)
|
|||||
|
1
|
Gross unrealized gain/loss recognized in AOCI in the consolidated balance sheet.
|
|
2
|
Amounts represent unrealized loss that remains in AOCI after an other-than-temporary credit loss has been recognized in income.
|
103
The amortized cost and fair values of available for sale securities at
December 31, 2016
, by contractual maturity, are as shown in the following table (dollars in thousands):
|
Less than
One Year
|
One to
Five Years
|
Six to
Ten Years
|
Over
Ten Years
|
Total
|
Weighted
Average
Maturity
5
|
||||||||||||||||||
|
U.S. Treasury securities:
|
|
|
|
|
|
|
|||||||||||||||||
|
Amortized cost
|
$
|
—
|
|
$
|
1,000
|
|
$
|
—
|
|
$
|
—
|
|
$
|
1,000
|
|
1.04
|
|
||||||
|
Fair value
|
—
|
|
999
|
|
—
|
|
—
|
|
999
|
|
|||||||||||||
|
Nominal yield
|
—
|
%
|
0.87
|
%
|
—
|
%
|
—
|
%
|
0.87
|
%
|
|||||||||||||
|
Municipal and other tax-exempt securities:
|
|
|
|
|
|
|
|
|
|
|
|||||||||||||
|
Amortized cost
|
9,848
|
|
12,254
|
|
2,103
|
|
16,845
|
|
41,050
|
|
7.95
|
|
|||||||||||
|
Fair value
|
9,903
|
|
12,399
|
|
2,151
|
|
16,540
|
|
40,993
|
|
|||||||||||||
|
Nominal yield¹
|
4.81
|
%
|
4.01
|
%
|
3.47
|
%
|
2.28
|
%
|
6
|
|
3.46
|
%
|
|||||||||||
|
Commercial mortgage-backed securities:
|
|
|
|
|
|
|
|
|
|
|
|||||||||||||
|
Amortized cost
|
31,910
|
|
921,981
|
|
1,832,535
|
|
249,324
|
|
3,035,750
|
|
6.90
|
|
|||||||||||
|
Fair value
|
31,856
|
|
920,108
|
|
1,820,627
|
|
245,342
|
|
3,017,933
|
|
|||||||||||||
|
Nominal yield
|
1.00
|
%
|
1.79
|
%
|
1.85
|
%
|
1.82
|
%
|
1.81
|
%
|
|||||||||||||
|
Other debt securities:
|
|||||||||||||||||||||||
|
Amortized cost
|
—
|
|
—
|
|
—
|
|
4,400
|
|
4,400
|
|
30.66
|
|
|||||||||||
|
Fair value
|
—
|
|
—
|
|
—
|
|
4,152
|
|
4,152
|
|
|||||||||||||
|
Nominal yield
|
—
|
%
|
—
|
%
|
—
|
%
|
1.71
|
%
|
1.71
|
%
|
|||||||||||||
|
Total fixed maturity securities:
|
|
|
|
|
|
|
|
|
|
|
|||||||||||||
|
Amortized cost
|
$
|
41,758
|
|
$
|
935,235
|
|
$
|
1,834,638
|
|
$
|
270,569
|
|
$
|
3,082,200
|
|
6.95
|
|
||||||
|
Fair value
|
41,759
|
|
933,506
|
|
1,822,778
|
|
266,034
|
|
3,064,077
|
|
|||||||||||||
|
Nominal yield
|
1.89
|
%
|
1.82
|
%
|
1.85
|
%
|
1.84
|
%
|
1.83
|
%
|
|||||||||||||
|
Residential mortgage-backed securities:
|
|
|
|
|
|
|
|
|
|
|
|||||||||||||
|
Amortized cost
|
|
|
|
|
|
|
|
|
$
|
5,576,543
|
|
2
|
|
||||||||||
|
Fair value
|
|
|
|
|
|
|
|
|
5,575,921
|
|
|||||||||||||
|
Nominal yield
4
|
|
|
|
|
|
|
|
|
1.86
|
%
|
|||||||||||||
|
Perpetual preferred stock. equity securities and mutual funds:
|
|
|
|
|
|
|
|
|
|
|
|
|
|||||||||||
|
Amortized cost
|
|
|
|
|
|
|
|
|
$
|
32,985
|
|
³
|
|
||||||||||
|
Fair value
|
|
|
|
|
|
|
|
|
36,831
|
|
|
|
|||||||||||
|
Nominal yield
|
|
|
|
|
|
|
|
|
—
|
%
|
|
|
|||||||||||
|
Total available-for-sale securities:
|
|
|
|
|
|
|
|
|
|
|
|
||||||||||||
|
Amortized cost
|
|
|
|
|
|
|
|
|
$
|
8,691,728
|
|
|
|
||||||||||
|
Fair value
|
|
|
|
|
|
|
|
|
8,676,829
|
|
|
|
|||||||||||
|
Nominal yield
|
|
|
|
|
|
|
|
|
1.84
|
%
|
|
|
|||||||||||
|
1
|
Calculated on a taxable equivalent basis using a
39%
effective tax rate.
|
|
2
|
The average expected lives of mortgage-backed securities were
3.9 years
based upon current prepayment assumptions.
|
|
3
|
Primarily common stock and preferred stock of corporate issuers with no stated maturity.
|
|
4
|
The nominal yield on mortgage-backed securities is based upon prepayment assumptions at the purchase date. Actual yields earned may differ significantly based upon actual prepayments. See Quarterly Financial Summary –– Unaudited following for current yields on available for sale securities portfolio.
|
|
5
|
Expected maturities may differ from contractual maturities, because borrowers may have the right to call or prepay obligations with or without penalty.
|
|
6
|
Nominal yield on municipal and other tax-exempt securities and other debt securities with contractual maturity dates over ten years are based on variable rates which generally are reset within
35 days
.
|
104
Sales of available for sale securities resulted in gains and losses as follows (in thousands):
|
Year Ended December 31,
|
||||||||||
|
|
2016
|
2015
|
2014
|
|||||||
|
Proceeds
|
$
|
899,381
|
|
$
|
1,600,380
|
|
2,664,740
|
|
||
|
Gross realized gains
|
11,696
|
|
15,849
|
|
24,923
|
|
||||
|
Gross realized losses
|
(21
|
)
|
(3,791
|
)
|
(23,384
|
)
|
||||
|
Related federal and state income tax expense
|
4,542
|
|
4,691
|
|
599
|
|
||||
A summary of investment and available for sale securities that have been pledged as collateral for repurchase agreements, public trust funds on deposit and for other purposes, as required by law was as follows (in thousands):
|
December 31,
|
|||||||
|
2016
|
2015
|
||||||
|
Investment:
|
|||||||
|
Carrying value
|
$
|
322,208
|
|
$
|
231,033
|
|
|
|
Fair value
|
323,808
|
|
234,382
|
|
|||
|
Available for sale:
|
|||||||
|
Amortized cost
|
7,353,116
|
|
6,831,743
|
|
|||
|
Fair value
|
7,327,470
|
|
6,849,524
|
|
|||
The secured parties do not have the right to sell or re-pledge these securities.
105
Temporarily Impaired Securities as of
December 31, 2016
(In thousands)
|
|
Number of Securities
|
Less Than 12 Months
|
12 Months or Longer
|
Total
|
|||||||||||||||||||||||
|
Fair
Value
|
Unrealized
Loss
|
Fair
Value
|
Unrealized
Loss
|
Fair
Value
|
Unrealized
Loss
|
||||||||||||||||||||||
|
Investment:
|
|
|
|
|
|
|
|
||||||||||||||||||||
|
Municipal and other tax-exempt securities
|
151
|
|
$
|
219,892
|
|
$
|
1,316
|
|
$
|
4,333
|
|
$
|
95
|
|
$
|
224,225
|
|
$
|
1,411
|
|
|||||||
|
U.S. government agency residential mortgage-backed securities – Other
|
1
|
|
4,358
|
|
71
|
|
—
|
|
—
|
|
4,358
|
|
71
|
|
|||||||||||||
|
Other debt securities
|
41
|
|
11,820
|
|
322
|
|
855
|
|
2
|
|
12,675
|
|
324
|
|
|||||||||||||
|
Total investment securities
|
193
|
|
$
|
236,070
|
|
$
|
1,709
|
|
$
|
5,188
|
|
$
|
97
|
|
$
|
241,258
|
|
$
|
1,806
|
|
|||||||
|
|
Number of Securities
|
Less Than 12 Months
|
12 Months or Longer
|
Total
|
|||||||||||||||||||||||
|
Fair
Value
|
Unrealized
Loss
|
Fair
Value
|
Unrealized
Loss
|
Fair
Value
|
Unrealized
Loss
|
||||||||||||||||||||||
|
Available for sale:
|
|
|
|
|
|
|
|
|
|
|
|
|
|
|
|||||||||||||
|
U.S. Treasury securities
|
1
|
|
$
|
999
|
|
$
|
1
|
|
$
|
—
|
|
$
|
—
|
|
$
|
999
|
|
$
|
1
|
|
|||||||
|
Municipal and other tax-exempt securities
|
24
|
|
$
|
15,666
|
|
$
|
22
|
|
$
|
4,689
|
|
$
|
378
|
|
20,355
|
|
400
|
|
|||||||||
|
Residential mortgage-backed securities:
|
|
|
|
|
|
|
|
|
|
|
|
|
|||||||||||||||
|
U.S. government agencies:
|
|
|
|
|
|
|
|
|
|
|
|
|
|||||||||||||||
|
FNMA
|
91
|
|
1,787,644
|
|
30,238
|
|
72,105
|
|
1,677
|
|
1,859,749
|
|
31,915
|
|
|||||||||||||
|
FHLMC
|
58
|
|
964,017
|
|
11,210
|
|
18,307
|
|
600
|
|
982,324
|
|
11,810
|
|
|||||||||||||
|
GNMA
|
31
|
|
548,637
|
|
6,145
|
|
25,796
|
|
895
|
|
574,433
|
|
7,040
|
|
|||||||||||||
|
Total U.S. agencies
|
180
|
|
3,300,298
|
|
47,593
|
|
116,208
|
|
3,172
|
|
3,416,506
|
|
50,765
|
|
|||||||||||||
|
Private issue
1
:
|
|
|
|
|
|
|
|
|
|
|
|
|
|
|
|||||||||||||
|
Alt-A loans
|
5
|
|
7,931
|
|
174
|
|
7,410
|
|
44
|
|
15,341
|
|
218
|
|
|||||||||||||
|
Jumbo-A loans
|
1
|
|
—
|
|
—
|
|
6,098
|
|
16
|
|
6,098
|
|
16
|
|
|||||||||||||
|
Total private issue
|
6
|
|
7,931
|
|
174
|
|
13,508
|
|
60
|
|
21,439
|
|
234
|
|
|||||||||||||
|
Total residential mortgage-backed securities
|
186
|
|
3,308,229
|
|
47,767
|
|
129,716
|
|
3,232
|
|
3,437,945
|
|
50,999
|
|
|||||||||||||
|
Commercial mortgage-backed securities guaranteed by U.S. government agencies
|
171
|
|
1,904,584
|
|
22,987
|
|
38,875
|
|
302
|
|
1,943,459
|
|
23,289
|
|
|||||||||||||
|
Other debt securities
|
2
|
|
—
|
|
—
|
|
4,152
|
|
248
|
|
4,152
|
|
248
|
|
|||||||||||||
|
Perpetual preferred stock
|
—
|
|
—
|
|
—
|
|
—
|
|
—
|
|
—
|
|
—
|
|
|||||||||||||
|
Equity securities and mutual funds
|
104
|
|
2,127
|
|
41
|
|
817
|
|
86
|
|
2,944
|
|
127
|
|
|||||||||||||
|
Total available for sale securities
|
488
|
|
$
|
5,231,605
|
|
$
|
70,818
|
|
$
|
178,249
|
|
$
|
4,246
|
|
$
|
5,409,854
|
|
$
|
75,064
|
|
|||||||
|
1
|
Includes securities for which an unrealized loss remains in AOCI after an other-than-temporary credit loss has been recognized in income.
|
106
Temporarily Impaired Securities as of
December 31, 2015
(In thousands)
|
|
Number of Securities
|
Less Than 12 Months
|
12 Months or Longer
|
Total
|
|||||||||||||||||||||||
|
Fair
Value
|
Unrealized
Loss
|
Fair
Value
|
Unrealized
Loss
|
Fair
Value
|
Unrealized
Loss
|
||||||||||||||||||||||
|
Investment:
|
|
|
|
|
|
|
|
||||||||||||||||||||
|
Municipal and other tax- exempt securities
|
73
|
|
$
|
127,319
|
|
$
|
206
|
|
$
|
13,380
|
|
$
|
77
|
|
$
|
140,699
|
|
$
|
283
|
|
|||||||
|
U.S. government agency residential mortgage-backed securities – Other
|
1
|
|
5,533
|
|
22
|
|
—
|
|
—
|
|
5,533
|
|
22
|
|
|||||||||||||
|
Other debt securities
|
11
|
|
1,082
|
|
41
|
|
1,715
|
|
18
|
|
2,797
|
|
59
|
|
|||||||||||||
|
Total investment securities
|
85
|
|
$
|
133,934
|
|
$
|
269
|
|
$
|
15,095
|
|
$
|
95
|
|
$
|
149,029
|
|
$
|
364
|
|
|||||||
|
Number of Securities
|
Less Than 12 Months
|
12 Months or Longer
|
Total
|
||||||||||||||||||||||||
|
Fair
Value
|
Unrealized
Loss
|
Fair
Value
|
Unrealized
Loss
|
Fair
Value
|
Unrealized
Loss
|
||||||||||||||||||||||
|
Available for sale:
|
|
|
|
|
|
|
|
|
|
|
|
|
|
|
|||||||||||||
|
U.S. Treasury securities
|
1
|
|
$
|
995
|
|
$
|
5
|
|
$
|
—
|
|
$
|
—
|
|
$
|
995
|
|
$
|
5
|
|
|||||||
|
Municipal and other tax-exempt securities
|
20
|
|
$
|
9,909
|
|
$
|
27
|
|
$
|
11,664
|
|
$
|
710
|
|
21,573
|
|
737
|
|
|||||||||
|
Residential mortgage-backed securities:
|
|
|
|
|
|
|
|
|
|
|
|
|
|
|
|||||||||||||
|
U. S. government agencies:
|
|
|
|
|
|
|
|
|
|
|
|
|
|
|
|||||||||||||
|
FNMA
|
55
|
|
1,188,022
|
|
10,262
|
|
18,236
|
|
239
|
|
1,206,258
|
|
10,501
|
|
|||||||||||||
|
FHLMC
|
40
|
|
726,713
|
|
4,827
|
|
77,545
|
|
1,480
|
|
804,258
|
|
6,307
|
|
|||||||||||||
|
GNMA
|
15
|
|
364,919
|
|
1,951
|
|
102,109
|
|
2,600
|
|
467,028
|
|
4,551
|
|
|||||||||||||
|
Total U.S. agencies
|
110
|
|
2,279,654
|
|
17,040
|
|
197,890
|
|
4,319
|
|
2,477,544
|
|
21,359
|
|
|||||||||||||
|
Private issue
1
:
|
|
|
|
|
|
|
|
|
|
|
|
|
|
|
|||||||||||||
|
Alt-A loans
|
4
|
|
—
|
|
—
|
|
9,264
|
|
387
|
|
9,264
|
|
387
|
|
|||||||||||||
|
Jumbo-A loans
|
8
|
|
—
|
|
—
|
|
8,482
|
|
440
|
|
8,482
|
|
440
|
|
|||||||||||||
|
Total private issue
|
12
|
|
—
|
|
—
|
|
17,746
|
|
827
|
|
17,746
|
|
827
|
|
|||||||||||||
|
Total residential mortgage-backed securities
|
122
|
|
2,279,654
|
|
17,040
|
|
215,636
|
|
5,146
|
|
2,495,290
|
|
22,186
|
|
|||||||||||||
|
Commercial mortgage-backed securities guaranteed by U.S. government agencies
|
213
|
|
1,582,469
|
|
11,419
|
|
484,258
|
|
7,225
|
|
2,066,727
|
|
18,644
|
|
|||||||||||||
|
Other debt securities
|
2
|
|
—
|
|
—
|
|
4,151
|
|
249
|
|
4,151
|
|
249
|
|
|||||||||||||
|
Perpetual preferred stock
|
—
|
|
—
|
|
—
|
|
—
|
|
—
|
|
—
|
|
—
|
|
|||||||||||||
|
Equity securities and mutual funds
|
61
|
|
782
|
|
5
|
|
991
|
|
35
|
|
1,773
|
|
40
|
|
|||||||||||||
|
Total available for sale securities
|
419
|
|
|
$
|
3,873,809
|
|
|
$
|
28,496
|
|
|
$
|
716,700
|
|
|
$
|
13,365
|
|
|
$
|
4,590,509
|
|
|
$
|
41,861
|
|
|
|
1
|
Includes securities for which an unrealized loss remains in AOCI after an other-than-temporary credit loss has been recognized in income.
|
For debt securities, management determines whether it intends to sell or if it is more-likely-than-not that it will be required to sell impaired securities. Based on this evaluation as of
December 31, 2016
, we do not intend to sell any impaired available for sale securities before fair value recovers to our current amortized cost and it is more-likely-than-not that we will not be required to sell impaired securities before fair value recovers, which may be maturity.
107
At
December 31, 2016
, the composition of the Company’s investment and available for sale securities portfolios by the lowest current credit rating assigned by any of the three nationally-recognized rating agencies is as follows (in thousands):
|
|
AAA - AA
|
A - BBB
|
Below Investment Grade
|
Not Rated
|
Total
|
|||||||||||||||||||||||||||||||||||
|
Carrying
Value
|
Fair
Value
|
Carrying
Value
|
Fair
Value
|
Carrying
Value
|
Fair
Value
|
Carrying
Value
|
Fair
Value
|
Carrying
Value
|
Fair
Value
|
|||||||||||||||||||||||||||||||
|
Investment:
|
|
|
|
|
|
|
|
|
|
|
||||||||||||||||||||||||||||||
|
Municipal and other tax-exempt
|
$
|
193,931
|
|
$
|
193,834
|
|
$
|
6,028
|
|
$
|
6,037
|
|
$
|
—
|
|
$
|
—
|
|
$
|
120,405
|
|
$
|
121,354
|
|
$
|
320,364
|
|
$
|
321,225
|
|
||||||||||
|
U.S. government agency residential mortgage-backed securities
1
|
—
|
|
—
|
|
—
|
|
—
|
|
—
|
|
—
|
|
20,777
|
|
21,473
|
|
20,777
|
|
21,473
|
|
||||||||||||||||||||
|
Other debt securities
|
140,184
|
|
156,641
|
|
—
|
|
—
|
|
—
|
|
—
|
|
64,820
|
|
66,154
|
|
205,004
|
|
222,795
|
|
||||||||||||||||||||
|
Total investment securities
|
$
|
334,115
|
|
$
|
350,475
|
|
$
|
6,028
|
|
$
|
6,037
|
|
$
|
—
|
|
$
|
—
|
|
$
|
206,002
|
|
$
|
208,981
|
|
$
|
546,145
|
|
$
|
565,493
|
|
||||||||||
|
|
AAA - AA
|
A - BBB
|
Below Investment Grade
|
Not Rated
|
Total
|
|||||||||||||||||||||||||||||||||||
|
|
Amortized Cost
|
Fair Value
|
Amortized Cost
|
Fair Value
|
Amortized Cost
|
Fair Value
|
Amortized Cost
|
Fair Value
|
Amortized Cost
|
Fair
Value
|
||||||||||||||||||||||||||||||
|
Available for Sale:
|
|
|
|
|
|
|
|
|
|
|
|
|
|
|
|
|
|
|
|
|
||||||||||||||||||||
|
U.S. Treasury securities
|
$
|
—
|
|
$
|
—
|
|
$
|
—
|
|
$
|
—
|
|
$
|
—
|
|
$
|
—
|
|
$
|
1,000
|
|
$
|
999
|
|
$
|
1,000
|
|
$
|
999
|
|
||||||||||
|
Municipal and other tax-exempt
|
23,343
|
|
23,657
|
|
5,595
|
|
5,237
|
|
—
|
|
—
|
|
12,112
|
|
12,099
|
|
41,050
|
|
40,993
|
|
||||||||||||||||||||
|
U.S. government agency residential mortgage-backed securities
1
|
—
|
|
—
|
|
—
|
|
—
|
|
—
|
|
—
|
|
5,475,351
|
|
5,460,386
|
|
5,475,351
|
|
5,460,386
|
|
||||||||||||||||||||
|
Privately issued residential mortgage-backed securities
|
—
|
|
—
|
|
—
|
|
—
|
|
101,192
|
|
115,535
|
|
—
|
|
—
|
|
101,192
|
|
115,535
|
|
||||||||||||||||||||
|
Commercial mortgage-backed securities guaranteed by U.S. government agencies
|
—
|
|
—
|
|
—
|
|
—
|
|
—
|
|
—
|
|
3,035,750
|
|
3,017,933
|
|
3,035,750
|
|
3,017,933
|
|
||||||||||||||||||||
|
Other debt securities
|
4,400
|
|
4,152
|
|
—
|
|
—
|
|
—
|
|
—
|
|
—
|
|
—
|
|
4,400
|
|
4,152
|
|
||||||||||||||||||||
|
Perpetual preferred stock
|
—
|
|
—
|
|
4,796
|
|
5,177
|
|
10,765
|
|
13,297
|
|
—
|
|
—
|
|
15,561
|
|
18,474
|
|
||||||||||||||||||||
|
Equity securities and mutual funds
|
4
|
|
759
|
|
—
|
|
—
|
|
—
|
|
—
|
|
17,420
|
|
17,598
|
|
17,424
|
|
18,357
|
|
||||||||||||||||||||
|
Total available for sale securities
|
$
|
27,747
|
|
|
$
|
28,568
|
|
|
$
|
10,391
|
|
|
$
|
10,414
|
|
|
$
|
111,957
|
|
|
$
|
128,832
|
|
|
$
|
8,541,633
|
|
|
$
|
8,509,015
|
|
|
$
|
8,691,728
|
|
|
$
|
8,676,829
|
|
|
|
1
|
U.S. government and government sponsored enterprises are not rated by the nationally-recognized rating agencies as these securities are guaranteed by agencies of the U.S. government or government-sponsored enterprises.
|
At
December 31, 2016
, the entire portfolio of privately issued residential mortgage-backed securities was rated below investment grade by at least one of the nationally-recognized rating agencies. The gross unrealized loss on these securities totaled
$234 thousand
. Impairment of these securities was evaluated based on projections of estimated cash flows.
The primary assumptions used in this evaluation were:
|
December 31,
|
|||
|
2016
|
2015
|
||
|
Unemployment rate
|
Decreasing to 4.6% over the next 12 months and remain at 4.6% thereafter.
|
Decreasing to 4.8% over the next 12 months and remain at 4.8% thereafter.
|
|
|
Housing price appreciation/depreciation
|
Starting with current depreciated housing prices based on information derived from the FHFA
1
, appreciating 3.1% over the next 12 months, then flat for the following 12 months and then appreciating at 2% per year thereafter.
|
Starting with current depreciated housing prices based on information derived from the FHFA
1
, appreciating 3.5% over the next 12 months, then flat for the following 12 months and then appreciating at 2% per year thereafter.
|
|
|
Estimated liquidation costs
|
Reflect actual historical liquidations costs observed on Jumbo and Alt-A residential mortgage loans in securities owned by the Company.
|
Reflect actual historical liquidations costs observed on Jumbo and Alt-A residential mortgage loans in securities owned by the Company.
|
|
|
Discount rates
|
Estimated cash flows were discounted at rates that range from 2.00% to 6.25% based on our current expected yields.
|
Estimated cash flows were discounted at rates that range from 2.00% to 6.25% based on our current expected yields.
|
|
|
1
|
Federal Housing Finance Agency
|
108
The Company recognized
no
credit loss impairment on private-label residential mortgage-backed securities in earnings during
2016
. Credit loss impairment of
$157 thousand
was recognized in earnings on private-label residential mortgage-backed securities in
2015
and
none
was recognized in
2014
.
Impaired equity securities, including perpetual preferred stocks, are evaluated based on management's ability and intent to hold the securities until fair value recovers. Based on this evaluation,
no
other-than-temporary impairment losses were recorded in earnings on equity securities during
2016
. A
$1.7 million
other-than-temporary impairment loss related to equity securities was recorded in earnings in
2015
and
$373 thousand
in impairment losses were recognized on equity securities in
2014
.
The following is a tabular roll forward of the amount of credit-related OTTI recognized on available for sale debt securities in earnings (in thousands):
|
Year Ended December 31,
|
||||||||||||
|
|
2016
|
2015
|
2014
|
|||||||||
|
Balance of credit-related OTTI recognized on available for sale debt, beginning of period
|
$
|
54,504
|
|
$
|
54,347
|
|
$
|
67,346
|
|
|||
|
Additions for credit-related OTTI not previously recognized
|
—
|
|
—
|
|
—
|
|
||||||
|
Additions for increases in credit-related OTTI previously recognized when there is no intent to sell and no requirement to sell before recovery of amortized cost
|
—
|
|
157
|
|
—
|
|
||||||
|
Reductions for change in intent to hold before recovery
|
—
|
|
—
|
|
—
|
|
||||||
|
Sales
|
—
|
|
—
|
|
(12,999
|
)
|
||||||
|
Balance of credit-related OTTI recognized on available for sale debt securities, end of period
|
$
|
54,504
|
|
$
|
54,504
|
|
$
|
54,347
|
|
|||
Fair Value Option Securities
Fair value option securities represent securities which the Company has elected to carry at fair value and separately identified on the Consolidated Balance Sheets with changes in the fair value recognized in earnings as they occur. Certain residential mortgage-backed securities issued by U.S. government agencies and derivative contracts are held as an economic hedge of the mortgage servicing rights.
The fair value and net unrealized gain (loss) included in Fair value option securities is as follows (in thousands):
|
|
December 31, 2016
|
December 31, 2015
|
||||||||||||||
|
|
Fair Value
|
Net Unrealized Gain (Loss)
|
Fair Value
|
Net Unrealized Gain (Loss)
|
||||||||||||
|
U.S. government agency residential mortgage-backed securities
|
$
|
77,046
|
|
$
|
(1,777
|
)
|
$
|
444,217
|
|
$
|
(2,060
|
)
|
||||
Restricted Equity Securities
Restricted equity securities include stock we are required to hold as members of the Federal Reserve system and the Federal Home Loan Banks ("FHLB"). Restricted equity securities are carried at cost as these securities do not have a readily determined fair value because ownership of these shares is restricted and they lack a market. A summary of restricted equity securities follows (in thousands):
|
December 31,
|
|||||||
|
2016
|
2015
|
||||||
|
Federal Reserve Bank stock
|
$
|
36,498
|
|
$
|
36,148
|
|
|
|
Federal Home Loan Bank stock
|
270,541
|
|
237,365
|
|
|||
|
Other
|
201
|
|
171
|
|
|||
|
Total
|
$
|
307,240
|
|
$
|
273,684
|
|
|
109
(
3
)
Derivatives
The following table summarizes the fair values of derivative contracts recorded as “derivative contracts” assets and liabilities in the balance sheet at
December 31, 2016
(in thousands):
|
Assets
|
||||||||||||||||||||||||
|
|
Notional
1
|
Gross Fair Value
|
Netting Adjustments
|
Net Fair Value Before Cash Collateral
|
Cash Collateral
|
Fair Value Net of Cash Collateral
|
||||||||||||||||||
|
Customer risk management programs:
|
|
|
|
|||||||||||||||||||||
|
Interest rate contracts
|
||||||||||||||||||||||||
|
To-be-announced residential mortgage-backed securities
|
$
|
16,949,152
|
|
$
|
180,695
|
|
$
|
(60,555
|
)
|
$
|
120,140
|
|
$
|
—
|
|
$
|
120,140
|
|
||||||
|
Interest rate swaps
|
1,403,408
|
|
34,442
|
|
—
|
|
34,442
|
|
(4,567
|
)
|
29,875
|
|
||||||||||||
|
Energy contracts
|
835,566
|
|
64,140
|
|
(28,298
|
)
|
35,842
|
|
(71
|
)
|
35,771
|
|
||||||||||||
|
Agricultural contracts
|
53,209
|
|
1,382
|
|
(515
|
)
|
867
|
|
—
|
|
867
|
|
||||||||||||
|
Foreign exchange contracts
|
580,886
|
|
494,349
|
|
—
|
|
494,349
|
|
(5,183
|
)
|
489,166
|
|
||||||||||||
|
Equity option contracts
|
100,924
|
|
4,357
|
|
—
|
|
4,357
|
|
(730
|
)
|
3,627
|
|
||||||||||||
|
Total customer risk management programs
|
19,923,145
|
|
779,365
|
|
(89,368
|
)
|
689,997
|
|
(10,551
|
)
|
679,446
|
|
||||||||||||
|
Internal risk management programs
|
2,514,169
|
|
10,426
|
|
—
|
|
10,426
|
|
—
|
|
10,426
|
|
||||||||||||
|
Total derivative contracts
|
$
|
22,437,314
|
|
$
|
789,791
|
|
$
|
(89,368
|
)
|
$
|
700,423
|
|
$
|
(10,551
|
)
|
$
|
689,872
|
|
||||||
|
Liabilities
|
||||||||||||||||||||||||
|
|
Notional¹
|
Gross Fair Value
|
Netting Adjustments
|
Net Fair Value Before Cash Collateral
|
Cash Collateral
|
Fair Value Net of Cash Collateral
|
||||||||||||||||||
|
Customer risk management programs:
|
|
|
|
|||||||||||||||||||||
|
Interest rate contracts
|
||||||||||||||||||||||||
|
To-be-announced residential mortgage-backed securities
|
$
|
16,637,532
|
|
$
|
176,928
|
|
$
|
(60,555
|
)
|
$
|
116,373
|
|
$
|
—
|
|
$
|
116,373
|
|
||||||
|
Interest rate swaps
|
1,403,408
|
|
34,442
|
|
—
|
|
34,442
|
|
(11,977
|
)
|
22,465
|
|
||||||||||||
|
Energy contracts
|
820,365
|
|
64,306
|
|
(28,298
|
)
|
36,008
|
|
(31,534
|
)
|
4,474
|
|
||||||||||||
|
Agricultural contracts
|
53,216
|
|
1,365
|
|
(515
|
)
|
850
|
|
(769
|
)
|
81
|
|
||||||||||||
|
Foreign exchange contracts
|
580,712
|
|
494,695
|
|
—
|
|
494,695
|
|
(3,630
|
)
|
491,065
|
|
||||||||||||
|
Equity option contracts
|
100,924
|
|
4,357
|
|
—
|
|
4,357
|
|
—
|
|
4,357
|
|
||||||||||||
|
Total customer risk management programs
|
19,596,157
|
|
776,093
|
|
(89,368
|
)
|
686,725
|
|
(47,910
|
)
|
638,815
|
|
||||||||||||
|
Internal risk management programs
|
2,582,202
|
|
25,716
|
|
—
|
|
25,716
|
|
—
|
|
25,716
|
|
||||||||||||
|
Total derivative contracts
|
$
|
22,178,359
|
|
$
|
801,809
|
|
$
|
(89,368
|
)
|
$
|
712,441
|
|
$
|
(47,910
|
)
|
$
|
664,531
|
|
||||||
|
1
|
Notional amounts for commodity contracts are converted into dollar-equivalent amounts based on dollar prices at the inception of the contract.
|
When bilateral netting agreements exist between the Company and its counterparties that create a single legal claim or obligation to pay or receive the net amount in settlement of the individual derivative contracts, the Company reports derivative assets and liabilities on a net by counterparty basis. Contracts may also require the Company to provide or receive cash margin as collateral for derivative assets and liabilities. Derivative assets and liabilities are reported net of cash margin when certain conditions are met.
110
The following table summarizes the fair values of derivative contracts recorded as “derivative contracts” assets and liabilities in the balance sheet at
December 31, 2015
(in thousands):
|
Assets
|
||||||||||||||||||||||||
|
|
Notional
1
|
Gross Fair Value
|
Netting Adjustments
|
Net Fair Value Before Cash Collateral
|
Cash Collateral
|
Fair Value Net of Cash Collateral
|
||||||||||||||||||
|
Customer risk management programs:
|
|
|
|
|||||||||||||||||||||
|
Interest rate contracts
|
||||||||||||||||||||||||
|
To-be-announced residential mortgage-backed securities
|
$
|
14,583,052
|
|
$
|
43,270
|
|
$
|
(28,305
|
)
|
$
|
14,965
|
|
$
|
—
|
|
$
|
14,965
|
|
||||||
|
Interest rate swaps
|
1,332,044
|
|
31,744
|
|
—
|
|
31,744
|
|
(1,424
|
)
|
30,320
|
|
||||||||||||
|
Energy contracts
|
470,613
|
|
83,045
|
|
(22,970
|
)
|
60,075
|
|
(18,606
|
)
|
41,469
|
|
||||||||||||
|
Agricultural contracts
|
61,662
|
|
2,591
|
|
(1,158
|
)
|
1,433
|
|
—
|
|
1,433
|
|
||||||||||||
|
Foreign exchange contracts
|
546,572
|
|
498,830
|
|
—
|
|
498,830
|
|
(4,140
|
)
|
494,690
|
|
||||||||||||
|
Equity option contracts
|
137,278
|
|
3,780
|
|
—
|
|
3,780
|
|
(470
|
)
|
3,310
|
|
||||||||||||
|
Total customer risk management programs
|
17,131,221
|
|
663,260
|
|
(52,433
|
)
|
610,827
|
|
(24,640
|
)
|
586,187
|
|
||||||||||||
|
Internal risk management programs
|
22,000
|
|
83
|
|
—
|
|
83
|
|
—
|
|
83
|
|
||||||||||||
|
Total derivative contracts
|
$
|
17,153,221
|
|
$
|
663,343
|
|
$
|
(52,433
|
)
|
$
|
610,910
|
|
$
|
(24,640
|
)
|
$
|
586,270
|
|
||||||
|
Liabilities
|
||||||||||||||||||||||||
|
|
Notional¹
|
Gross Fair Value
|
Netting Adjustments
|
Net Fair Value Before Cash Collateral
|
Cash Collateral
|
Fair Value Net of Cash Collateral
|
||||||||||||||||||
|
Customer risk management programs:
|
|
|
|
|||||||||||||||||||||
|
Interest rate contracts
|
||||||||||||||||||||||||
|
To-be-announced residential mortgage-backed securities
|
$
|
14,168,927
|
|
$
|
40,141
|
|
$
|
(28,305
|
)
|
$
|
11,836
|
|
$
|
(1,308
|
)
|
$
|
10,528
|
|
||||||
|
Interest rate swaps
|
1,332,044
|
|
31,928
|
|
—
|
|
31,928
|
|
(20,530
|
)
|
11,398
|
|
||||||||||||
|
Energy contracts
|
463,703
|
|
81,869
|
|
(22,970
|
)
|
58,899
|
|
—
|
|
58,899
|
|
||||||||||||
|
Agricultural contracts
|
61,657
|
|
2,579
|
|
(1,158
|
)
|
1,421
|
|
(1,248
|
)
|
173
|
|
||||||||||||
|
Foreign exchange contracts
|
546,405
|
|
498,574
|
|
—
|
|
498,574
|
|
(1,951
|
)
|
496,623
|
|
||||||||||||
|
Equity option contracts
|
137,278
|
|
3,780
|
|
—
|
|
3,780
|
|
—
|
|
3,780
|
|
||||||||||||
|
Total customer risk management programs
|
16,710,014
|
|
658,871
|
|
(52,433
|
)
|
606,438
|
|
(25,037
|
)
|
581,401
|
|
||||||||||||
|
Internal risk management programs
|
75,000
|
|
300
|
|
—
|
|
300
|
|
—
|
|
300
|
|
||||||||||||
|
Total derivative contracts
|
$
|
16,785,014
|
|
$
|
659,171
|
|
$
|
(52,433
|
)
|
$
|
606,738
|
|
$
|
(25,037
|
)
|
$
|
581,701
|
|
||||||
|
1
|
Notional amounts for commodity contracts are converted into dollar-equivalent amounts based on dollar prices at the inception of the contract.
|
111
The following summarizes the pre-tax net gains (losses) on derivative instruments and where they are recorded in the Consolidated Statement of Earnings (in thousands):
|
|
Year Ended December 31,
|
|||||||||||||||||||||||
|
2016
|
2015
|
2014
|
||||||||||||||||||||||
|
|
Brokerage
and Trading Revenue
|
Gain (Loss)
on Derivatives, Net
|
Brokerage
and Trading
Revenue
|
Gain (Loss)
on Derivatives,
Net
|
Brokerage
and Trading
Revenue
|
Gain (Loss)
on Derivatives,
Net
|
||||||||||||||||||
|
Customer risk management programs:
|
|
|
|
|
||||||||||||||||||||
|
Interest rate contracts
|
||||||||||||||||||||||||
|
To-be-announced residential mortgage-backed securities
|
$
|
38,523
|
|
$
|
—
|
|
$
|
33,877
|
|
$
|
—
|
|
$
|
27,007
|
|
$
|
—
|
|
||||||
|
Interest rate swaps
|
2,589
|
|
—
|
|
2,066
|
|
—
|
|
2,494
|
|
—
|
|
||||||||||||
|
Energy contracts
|
5,027
|
|
—
|
|
4,060
|
|
—
|
|
6,572
|
|
—
|
|
||||||||||||
|
Agricultural contracts
|
111
|
|
—
|
|
123
|
|
—
|
|
146
|
|
—
|
|
||||||||||||
|
Foreign exchange contracts
|
945
|
|
—
|
|
797
|
|
—
|
|
1,581
|
|
—
|
|
||||||||||||
|
Equity option contracts
|
—
|
|
—
|
|
—
|
|
—
|
|
—
|
|
—
|
|
||||||||||||
|
Total customer risk management programs
|
47,195
|
|
—
|
|
40,923
|
|
—
|
|
37,800
|
|
—
|
|
||||||||||||
|
Internal risk management programs
|
(4,592
|
)
|
(15,685
|
)
|
(209
|
)
|
430
|
|
—
|
|
2,776
|
|
||||||||||||
|
Total derivative contracts
|
$
|
42,603
|
|
$
|
(15,685
|
)
|
$
|
40,714
|
|
$
|
430
|
|
$
|
37,800
|
|
$
|
2,776
|
|
||||||
As discussed in Note
7
, certain derivative contracts not designated as hedging instruments related to mortgage loan commitments and forward sales contracts are included in Residential mortgage loans held for sale on the Consolidated Balance Sheets. See Note
7
for additional discussion of notional, fair value and impact on earnings of these contracts. Forward sales contracts are not considered swaps under the Commodity and Futures Trading Commission final rules.
No derivative contracts have been designated as hedging instruments for financial reporting purposes.
(
4
)
Loans and Allowances for Credit Losses
The portfolio segments of the loan portfolio are as follows (in thousands):
|
|
December 31, 2016
|
December 31, 2015
|
||||||||||||||||||||||||||||||
|
Fixed
Rate
|
Variable
Rate
|
Non-accrual
|
Total
|
Fixed
Rate
|
Variable
Rate
|
Non-accrual
|
Total
|
|||||||||||||||||||||||||
|
Commercial
|
$
|
2,327,085
|
|
$
|
7,884,786
|
|
$
|
178,953
|
|
$
|
10,390,824
|
|
$
|
1,850,548
|
|
$
|
8,325,559
|
|
$
|
76,424
|
|
$
|
10,252,531
|
|
||||||||
|
Commercial real estate
|
624,187
|
|
3,179,338
|
|
5,521
|
|
3,809,046
|
|
627,678
|
|
2,622,354
|
|
9,001
|
|
3,259,033
|
|
||||||||||||||||
|
Residential mortgage
|
1,647,357
|
|
256,255
|
|
46,220
|
|
1,949,832
|
|
1,598,992
|
|
216,661
|
|
61,240
|
|
1,876,893
|
|
||||||||||||||||
|
Personal
|
154,971
|
|
684,697
|
|
290
|
|
839,958
|
|
91,816
|
|
460,418
|
|
463
|
|
552,697
|
|
||||||||||||||||
|
Total
|
$
|
4,753,600
|
|
$
|
12,005,076
|
|
$
|
230,984
|
|
$
|
16,989,660
|
|
$
|
4,169,034
|
|
$
|
11,624,992
|
|
$
|
147,128
|
|
$
|
15,941,154
|
|
||||||||
|
Accruing loans past due (90 days)
1
|
|
|
|
|
|
|
$
|
5
|
|
|
|
|
|
|
|
$
|
1,207
|
|
||||||||||||||
|
Foregone interest on nonaccrual loans
|
$
|
15,990
|
|
$
|
7,432
|
|
||||||||||||||||||||||||||
|
1
|
Excludes residential mortgage loans guaranteed by agencies of the U.S. government.
|
112
At
December 31, 2016
, loans to businesses and individuals with collateral primarily located in Texas totaled
$5.4 billion
or
32%
of the total loan portfolio. Loans to businesses and individuals with collateral primarily located in Oklahoma totaled
$3.5 billion
or
21%
of our total loan portfolio. Loans for which the collateral location is not relevant, such as unsecured loans and reserve-based energy loans, are distributed by the borrower’s primary operating location. These geographic concentrations subject the loan portfolio to the general economic conditions within these areas. At
December 31, 2015
, loans to businesses and individuals with collateral primarily located in Texas totaled
$5.3 billion
or
33%
of the loan portfolio and loans to businesses and individuals with collateral primarily located in Oklahoma totaled
$3.9 billion
or
24%
of the loan portfolio.
Commercial
Commercial loans represent loans for working capital, facilities acquisition or expansion, purchases of equipment and other needs of commercial customers primarily located within our geographical footprint. Commercial loans are underwritten individually and represent on-going relationships based on a thorough knowledge of the customer, the customer’s industry and market. While commercial loans are generally secured by the customer’s assets including real property, inventory, accounts receivable, operating equipment, interest in mineral rights and other property and may also include personal guarantees of the owners and related parties, the primary source of repayment of the loans is the on-going cash flow from operations of the customer’s business. Inherent lending risk is centrally monitored on a continuous basis from underwriting throughout the life of the loan for compliance with commercial lending policies.
At
December 31, 2016
, commercial loans with collateral primarily located in Texas totaled
$3.3 billion
or
32%
of the commercial loan portfolio segment and commercial loans with collateral primarily located in Oklahoma totaled
$2.1 billion
or
21%
of the commercial loan portfolio segment. The commercial loan portfolio segment is further divided into loan classes. The services loan class totaled
$3.1 billion
or
18%
of total loans. Approximately
$1.4 billion
of loans in the services class consisted of loans with individual balances of less than
$10 million
. Businesses included in the services class include governmental, financial & insurance, educational, religious and not-for-profit and professional/technical services. The energy loan class totaled
$2.5 billion
or
15%
of total loans, including
$2.0 billion
of outstanding loans to energy producers. Approximately
57%
of committed production loans were secured by properties primarily producing oil and
43%
are secured by properties producing natural gas. The healthcare loan class totaled
$2.2 billion
or
13%
of total loans. The healthcare loan class consists primarily of loans for the development and operation of senior housing and care facilities, including independent living, assisted living and skilled nursing. Healthcare also includes loans to hospitals and other medical service providers.
At
December 31, 2015
, commercial loans with collateral primarily located in Texas totaled
$3.5 billion
or
34%
of the commercial loan portfolio segment and commercial loans with collateral primarily located in Oklahoma totaled
$2.5 billion
or
24%
of the commercial loan portfolio segment. The energy loan class totaled
$3.1 billion
or
19%
of total loans, including
$2.5 billion
of outstanding loans to energy producers. At
December 31, 2015
, approximately
62%
of committed production loans were secured by properties primarily producing oil and
38%
were secured by properties producing natural gas. The services loan class totaled
$2.8 billion
or
17%
of total loans. Approximately
$1.2 billion
of loans in the services category consisted of loans with individual balances of less than
$10 million
. The healthcare loan class totaled
$1.9 billion
or
12%
of total loans.
Commercial Real Estate
Commercial real estate loans are for the construction of buildings or other improvements to real estate and property held by borrowers for investment purposes primarily within our geographical footprint. We require collateral values in excess of the loan amounts, demonstrated cash flows in excess of expected debt service requirements, equity investment in the project and a portion of the project already sold, leased or permanent financing already secured. The expected cash flows from all significant new or renewed income producing property commitments are stress tested to reflect the risks in varying interest rates, vacancy rates and rental rates. As with commercial loans, inherent lending risks are centrally monitored on a continuous basis from underwriting throughout the life of the loan for compliance with applicable lending policies.
At
December 31, 2016
,
30%
of commercial real estate loans are secured by properties primarily located in the Dallas and Houston areas of Texas. An additional
11%
of commercial real estate loans are secured by properties located primarily in the Tulsa and Oklahoma City metropolitan areas of Oklahoma. At
December 31, 2015
,
30%
of commercial real estate loans were secured by properties in Texas,
13%
of commercial real estate loans were secured by properties in Oklahoma.
113
Residential Mortgage and Personal
Residential mortgage loans provide funds for our customers to purchase or refinance their primary residence or to borrow against the equity in their home. Residential mortgage loans are secured by a first or second mortgage on the customer’s primary residence. Personal loans consist primarily of loans secured by the cash surrender value of insurance policies and marketable securities. It also includes direct loans secured by and for the purchase of automobiles, recreational and marine equipment as well as other unsecured loans. Residential mortgage and personal loans are made in accordance with underwriting policies. Credit scoring is assessed based on significant credit characteristics including credit history, residential and employment stability. Residential mortgage loans retained in the Company’s portfolio are primarily composed of various mortgage programs to support customer relationships including jumbo mortgage loans, non-builder construction loans and special loan programs for high net worth individuals and certain professionals. Jumbo loans may be fixed or variable rate and are fully amortizing. Jumbo loans generally conform to government sponsored entity standards, except that the loan size exceeds maximums required under these standards. These loans generally require a minimum FICO score of
720
and a maximum debt-to-income ratio (“DTI”) of
38%
. Loan-to-value (“LTV”) ratios are tiered from
60%
to
100%
, depending on the market. Special mortgage programs include fixed and variable fully amortizing loans tailored to the needs of certain healthcare professionals. Variable rate loans are fully indexed at origination and may have fixed rates for
three
to
ten
years, then adjust annually thereafter.
At
December 31, 2016
and
2015
, residential mortgage loans included
$199 million
and
$197 million
, respectively, of loans guaranteed by U.S. government agencies previously sold into GNMA mortgage pools. These loans either have been repurchased or are eligible to be repurchased by the Company when certain defined delinquency criteria are met. Although payments on these loans generally are past due more than 90 days, interest continues to accrue based on the government guarantee.
Home equity loans totaled
$744 million
at
December 31, 2016
and
$735 million
at
December 31, 2015
. At
December 31, 2016
,
65%
of the home equity loan portfolio was comprised of first lien loans and
35%
of the home equity portfolio was comprised of junior lien loans. Junior lien loans were distributed
52%
to amortizing term loans and
48%
to revolving lines of credit. At
December 31, 2015
,
68%
of the home equity portfolio was comprised of first lien loans and
32%
of the home equity loan portfolio was comprised of junior lien loans. Junior lien loans were distributed
65%
to amortizing term loans and
35%
to revolving lines of credit.
Home equity loans generally require a minimum FICO score of 700 and a maximum DTI of 40%.
The maximum loan amount available for our home equity loan products is generally
$400 thousand
. Revolving loans have a
5
year revolving period followed by
15
year term of amortizing repayments. Interest-only home equity loans may not be extended for any additional revolving time. All other home equity loans may be extended at management's discretion for an additional
5
year revolving term subject to an update of certain credit information.
At
December 31, 2016
,
33%
of residential mortgage loans are secured by properties located in Oklahoma,
29%
of residential mortgage loans are secured by properties located in Texas,
10%
of residential mortgage are secured by properties located in New Mexico and
10%
of residential mortgage are secured by properties located in Colorado. At
December 31, 2015
,
37%
of residential mortgage loans were secured by properties in Oklahoma,
29%
of residential mortgage were secured by properties in Texas,
12%
of residential mortgage loans are secured by properties in New Mexico and
9%
of residential mortgage loans are secured by properties in Colorado.
Credit Commitments
Commitments to extend credit are agreements to lend to a customer as long as there is no violation of conditions established in the contract. Commitments generally have fixed expiration dates or other termination clauses and may require payment of a fee. At
December 31, 2016
, outstanding commitments totaled
$9.4 billion
. Because some commitments are expected to expire before being drawn upon, the total commitment amounts do not necessarily represent future cash requirements. BOK Financial uses the same credit policies in making commitments as it does loans.
The amount of collateral obtained, if deemed necessary, is based upon management’s credit evaluation of the borrower.
114
Standby letters of credit are conditional commitments issued to guarantee the performance of a customer to a third party. Because the credit risk involved in issuing standby letters of credit is essentially the same as that involved in extending loan commitments, BOK Financial uses the same credit policies in evaluating the creditworthiness of the customer. Additionally, BOK Financial uses the same evaluation process in obtaining collateral on standby letters of credit as it does for loan commitments. The term of these standby letters of credit is defined in each commitment and typically corresponds with the underlying loan commitment. At
December 31, 2016
, outstanding standby letters of credit totaled
$585 million
. Commercial letters of credit are used to facilitate customer trade transactions with the drafts being drawn when the underlying transaction is consummated. At
December 31, 2016
, outstanding commercial letters of credit totaled
$4.2 million
.
Allowances for Credit Losses
BOK Financial maintains an allowance for loan losses and an accrual for off-balance sheet credit risk. The accrual for off-balance sheet credit risk is maintained at a level that is appropriate to cover estimated losses associated with credit instruments that are not currently recognized as assets such as loan commitments, standby letters of credit or guarantees. As discussed in greater detail in Note
7
, the Company also has separate accruals related to off-balance sheet credit risk related to residential mortgage loans previously sold with full or partial recourse and for residential mortgage loans sold to government sponsored agencies under standard representations and warranties.
The allowance for loan losses consists of specific allowances attributed to impaired loans that have not yet been charged down to amounts we expect to recover, general allowances for unimpaired loans based on estimated loss rates by loan class and nonspecific allowances based on general economic conditions, concentration in loans with large balances and other relevant factors.
The activity in the allowance for loan losses and the accrual for off-balance sheet credit risk related to loan commitments and standby letters of credit for the year ended
December 31, 2016
is summarized as follows (in thousands):
|
|
Commercial
|
Commercial Real Estate
|
Residential Mortgage
|
Personal
|
Nonspecific Allowance
|
Total
|
||||||||||||||||||
|
Allowance for loan losses:
|
|
|
|
|
|
|
||||||||||||||||||
|
Beginning balance
|
$
|
130,334
|
|
$
|
41,391
|
|
$
|
19,509
|
|
$
|
4,164
|
|
$
|
30,126
|
|
$
|
225,524
|
|
||||||
|
Provision for loan losses
|
43,980
|
|
8,075
|
|
(1,972
|
)
|
7,310
|
|
(1,926
|
)
|
55,467
|
|
||||||||||||
|
Loans charged off
|
(35,828
|
)
|
—
|
|
(1,312
|
)
|
(5,448
|
)
|
—
|
|
(42,588
|
)
|
||||||||||||
|
Recoveries
|
1,727
|
|
1,283
|
|
1,999
|
|
2,747
|
|
—
|
|
7,756
|
|
||||||||||||
|
Ending balance
|
$
|
140,213
|
|
$
|
50,749
|
|
$
|
18,224
|
|
$
|
8,773
|
|
$
|
28,200
|
|
$
|
246,159
|
|
||||||
|
Accrual for off-balance sheet credit risk:
|
|
|
|
|
|
|
|
|
|
|
|
|
||||||||||||
|
Beginning balance
|
$
|
1,506
|
|
$
|
153
|
|
$
|
30
|
|
$
|
22
|
|
$
|
—
|
|
$
|
1,711
|
|
||||||
|
Provision for off-balance sheet credit risk
|
9,557
|
|
(30
|
)
|
20
|
|
(14
|
)
|
—
|
|
9,533
|
|
||||||||||||
|
Ending balance
|
$
|
11,063
|
|
$
|
123
|
|
$
|
50
|
|
$
|
8
|
|
$
|
—
|
|
$
|
11,244
|
|
||||||
|
Total provision for credit losses
|
$
|
53,537
|
|
$
|
8,045
|
|
$
|
(1,952
|
)
|
$
|
7,296
|
|
$
|
(1,926
|
)
|
$
|
65,000
|
|
||||||
115
The activity in the allowance for loan losses and the accrual for off-balance sheet credit risk related to loan commitments and standby letters of credit for the year ended
December 31, 2015
is summarized as follows (in thousands):
|
|
Commercial
|
Commercial Real Estate
|
Residential Mortgage
|
Personal
|
Nonspecific Allowance
|
Total
|
||||||||||||||||||
|
Allowance for loan losses:
|
|
|
|
|
|
|
||||||||||||||||||
|
Beginning balance
|
$
|
90,875
|
|
$
|
42,445
|
|
$
|
23,458
|
|
$
|
4,233
|
|
$
|
28,045
|
|
$
|
189,056
|
|
||||||
|
Provision for loan losses
|
43,464
|
|
(11,189
|
)
|
(3,004
|
)
|
2,167
|
|
2,081
|
|
33,519
|
|
||||||||||||
|
Loans charged off
|
(6,734
|
)
|
(944
|
)
|
(2,205
|
)
|
(5,288
|
)
|
—
|
|
(15,171
|
)
|
||||||||||||
|
Recoveries
|
2,729
|
|
11,079
|
|
1,260
|
|
3,052
|
|
—
|
|
18,120
|
|
||||||||||||
|
Ending balance
|
$
|
130,334
|
|
$
|
41,391
|
|
$
|
19,509
|
|
$
|
4,164
|
|
$
|
30,126
|
|
$
|
225,524
|
|
||||||
|
Accrual for off-balance sheet credit risk:
|
|
|
|
|
|
|
|
|
|
|
|
|
||||||||||||
|
Beginning balance
|
$
|
475
|
|
$
|
707
|
|
$
|
28
|
|
$
|
20
|
|
$
|
—
|
|
$
|
1,230
|
|
||||||
|
Provision for off-balance sheet credit risk
|
1,031
|
|
(554
|
)
|
2
|
|
2
|
|
—
|
|
481
|
|
||||||||||||
|
Ending balance
|
$
|
1,506
|
|
$
|
153
|
|
$
|
30
|
|
$
|
22
|
|
$
|
—
|
|
$
|
1,711
|
|
||||||
|
Total provision for credit losses
|
$
|
44,495
|
|
$
|
(11,743
|
)
|
$
|
(3,002
|
)
|
$
|
2,169
|
|
$
|
2,081
|
|
$
|
34,000
|
|
||||||
The activity in the allowance for loan losses and the accrual for off-balance sheet credit risk related to loan commitments and standby letters of credit for the year ended
December 31, 2014
is summarized as follows (in thousands):
|
|
Commercial
|
Commercial Real Estate
|
Residential Mortgage
|
Personal
|
Nonspecific Allowance
|
Total
|
||||||||||||||||||
|
Allowance for loan losses:
|
|
|
|
|
|
|
||||||||||||||||||
|
Beginning balance
|
$
|
79,180
|
|
$
|
41,573
|
|
$
|
29,465
|
|
$
|
6,965
|
|
$
|
28,213
|
|
$
|
185,396
|
|
||||||
|
Provision for loan losses
|
9,561
|
|
(4,084
|
)
|
(3,559
|
)
|
(892
|
)
|
(168
|
)
|
858
|
|
||||||||||||
|
Loans charged off
|
(3,569
|
)
|
(2,047
|
)
|
(4,448
|
)
|
(6,168
|
)
|
—
|
|
(16,232
|
)
|
||||||||||||
|
Recoveries
|
5,703
|
|
7,003
|
|
2,000
|
|
4,328
|
|
—
|
|
19,034
|
|
||||||||||||
|
Ending balance
|
$
|
90,875
|
|
$
|
42,445
|
|
$
|
23,458
|
|
$
|
4,233
|
|
$
|
28,045
|
|
$
|
189,056
|
|
||||||
|
Accrual for off-balance sheet credit risk:
|
|
|
|
|
|
|
|
|
|
|
|
|
||||||||||||
|
Beginning balance
|
$
|
119
|
|
$
|
1,876
|
|
$
|
90
|
|
$
|
3
|
|
$
|
—
|
|
$
|
2,088
|
|
||||||
|
Provision for off-balance sheet credit risk
|
356
|
|
(1,169
|
)
|
(62
|
)
|
17
|
|
—
|
|
(858
|
)
|
||||||||||||
|
Ending balance
|
$
|
475
|
|
$
|
707
|
|
$
|
28
|
|
$
|
20
|
|
$
|
—
|
|
$
|
1,230
|
|
||||||
|
Total provision for credit losses
|
$
|
9,917
|
|
$
|
(5,253
|
)
|
$
|
(3,621
|
)
|
$
|
(875
|
)
|
$
|
(168
|
)
|
$
|
—
|
|
||||||
116
The allowance for loan losses and recorded investment of the related loans by portfolio segment for each impairment measurement method at
December 31, 2016
is as follows (in thousands):
|
|
Collectively Measured
for Impairment
|
Individually Measured
for Impairment
|
Total
|
|||||||||||||||||||||
|
|
Recorded Investment
|
Related Allowance
|
Recorded Investment
|
Related Allowance
|
Recorded Investment
|
Related
Allowance
|
||||||||||||||||||
|
Commercial
|
$
|
10,211,871
|
|
$
|
139,416
|
|
$
|
178,953
|
|
$
|
797
|
|
$
|
10,390,824
|
|
$
|
140,213
|
|
||||||
|
Commercial real estate
|
3,803,525
|
|
50,749
|
|
5,521
|
|
—
|
|
3,809,046
|
|
50,749
|
|
||||||||||||
|
Residential mortgage
|
1,903,612
|
|
18,178
|
|
46,220
|
|
46
|
|
1,949,832
|
|
18,224
|
|
||||||||||||
|
Personal
|
839,668
|
|
8,773
|
|
290
|
|
—
|
|
839,958
|
|
8,773
|
|
||||||||||||
|
Total
|
16,758,676
|
|
217,116
|
|
230,984
|
|
843
|
|
16,989,660
|
|
217,959
|
|
||||||||||||
|
Nonspecific allowance
|
—
|
|
—
|
|
—
|
|
—
|
|
—
|
|
28,200
|
|
||||||||||||
|
Total
|
$
|
16,758,676
|
|
$
|
217,116
|
|
$
|
230,984
|
|
$
|
843
|
|
$
|
16,989,660
|
|
$
|
246,159
|
|
||||||
The allowance for loan losses and recorded investment of the related loans by portfolio segment for each impairment measurement method at
December 31, 2015
is as follows (in thousands):
|
|
Collectively Measured
for Impairment
|
Individually Measured
for Impairment
|
Total
|
|||||||||||||||||||||
|
|
Recorded Investment
|
Related Allowance
|
Recorded Investment
|
Related Allowance
|
Recorded Investment
|
Related
Allowance
|
||||||||||||||||||
|
Commercial
|
$
|
10,176,107
|
|
$
|
114,027
|
|
$
|
76,424
|
|
$
|
16,307
|
|
$
|
10,252,531
|
|
$
|
130,334
|
|
||||||
|
Commercial real estate
|
3,250,032
|
|
41,373
|
|
9,001
|
|
18
|
|
3,259,033
|
|
41,391
|
|
||||||||||||
|
Residential mortgage
|
1,815,653
|
|
19,441
|
|
61,240
|
|
68
|
|
1,876,893
|
|
19,509
|
|
||||||||||||
|
Personal
|
552,234
|
|
4,164
|
|
463
|
|
—
|
|
552,697
|
|
4,164
|
|
||||||||||||
|
Total
|
15,794,026
|
|
179,005
|
|
147,128
|
|
16,393
|
|
15,941,154
|
|
195,398
|
|
||||||||||||
|
Nonspecific allowance
|
—
|
|
—
|
|
—
|
|
—
|
|
—
|
|
30,126
|
|
||||||||||||
|
Total
|
$
|
15,794,026
|
|
$
|
179,005
|
|
$
|
147,128
|
|
$
|
16,393
|
|
$
|
15,941,154
|
|
$
|
225,524
|
|
||||||
117
Credit Quality Indicators
The Company utilizes loan class and risk grading as primary credit quality indicators. Substantially all commercial and commercial real estate loans and certain residential mortgage and personal loans are risk graded based on a quarterly evaluation of the borrowers’ ability to repay the loans. Certain commercial loans and most residential mortgage and personal loans are small, homogeneous pools that are not risk graded.
The allowance for loan losses and recorded investment of the related loans by portfolio segment for risk graded and non-risk graded loans at
December 31, 2016
is as follows (in thousands):
|
|
Internally Risk Graded
|
Non-Graded
|
Total
|
|||||||||||||||||||||
|
|
Recorded Investment
|
Related Allowance
|
Recorded Investment
|
Related Allowance
|
Recorded Investment
|
Related
Allowance
|
||||||||||||||||||
|
Commercial
|
$
|
10,360,725
|
|
$
|
139,293
|
|
$
|
30,099
|
|
$
|
920
|
|
$
|
10,390,824
|
|
$
|
140,213
|
|
||||||
|
Commercial real estate
|
3,809,046
|
|
50,749
|
|
—
|
|
—
|
|
3,809,046
|
|
50,749
|
|
||||||||||||
|
Residential mortgage
|
243,703
|
|
2,893
|
|
1,706,129
|
|
15,331
|
|
1,949,832
|
|
18,224
|
|
||||||||||||
|
Personal
|
744,602
|
|
5,035
|
|
95,356
|
|
3,738
|
|
839,958
|
|
8,773
|
|
||||||||||||
|
Total
|
15,158,076
|
|
197,970
|
|
1,831,584
|
|
19,989
|
|
16,989,660
|
|
217,959
|
|
||||||||||||
|
Nonspecific allowance
|
—
|
|
—
|
|
—
|
|
—
|
|
—
|
|
28,200
|
|
||||||||||||
|
Total
|
$
|
15,158,076
|
|
$
|
197,970
|
|
$
|
1,831,584
|
|
$
|
19,989
|
|
$
|
16,989,660
|
|
$
|
246,159
|
|
||||||
The allowance for loan losses and recorded investment of the related loans by portfolio segment for risk graded and non-risk graded loans at
December 31, 2015
is as follows (in thousands):
|
|
Internally Risk Graded
|
Non-Graded
|
Total
|
|||||||||||||||||||||
|
|
Recorded Investment
|
Related Allowance
|
Recorded Investment
|
Related Allowance
|
Recorded Investment
|
Related
Allowance
|
||||||||||||||||||
|
Commercial
|
$
|
10,227,303
|
|
$
|
129,426
|
|
$
|
25,228
|
|
$
|
908
|
|
$
|
10,252,531
|
|
$
|
130,334
|
|
||||||
|
Commercial real estate
|
3,259,033
|
|
41,391
|
|
—
|
|
—
|
|
3,259,033
|
|
41,391
|
|
||||||||||||
|
Residential mortgage
|
196,701
|
|
2,883
|
|
1,680,192
|
|
16,626
|
|
1,876,893
|
|
19,509
|
|
||||||||||||
|
Personal
|
467,955
|
|
1,390
|
|
84,742
|
|
2,774
|
|
552,697
|
|
4,164
|
|
||||||||||||
|
Total
|
14,150,992
|
|
175,090
|
|
1,790,162
|
|
20,308
|
|
15,941,154
|
|
195,398
|
|
||||||||||||
|
Nonspecific allowance
|
—
|
|
—
|
|
—
|
|
—
|
|
—
|
|
30,126
|
|
||||||||||||
|
Total
|
$
|
14,150,992
|
|
$
|
175,090
|
|
$
|
1,790,162
|
|
$
|
20,308
|
|
$
|
15,941,154
|
|
$
|
225,524
|
|
||||||
Loans are considered to be performing if they are in compliance with the original terms of the agreement which is consistent with the regulatory guideline of “pass.” Performing also includes loans considered to be “other loans especially mentioned” by regulatory guidelines and all residential mortgage loans guaranteed by agencies of the U.S. government that continue to accrue interest based on criteria of the guarantor's programs. Other loans especially mentioned are currently performing in compliance with the original terms of the agreement but may have a potential weakness that deserves management's close attention, consistent with regulatory guidelines.
The risk grading process identified certain loans that have a well-defined weakness (e.g. inadequate debt service coverage or liquidity or marginal capitalization; repayment may depend on collateral or other risk mitigation) that may jeopardize liquidation of the debt and represent a greater risk due to deterioration in the financial condition of the borrower. This is consistent with the regulatory guideline for “substandard.” Because the borrowers are still performing in accordance with the original terms of the loan agreements, these loans were not placed in nonaccruing status.
118
Nonaccruing loans represent loans for which full collection of principal and interest in accordance with the original terms of the loan agreements is uncertain. This is substantially the same criteria used to determine whether a loan is impaired and includes certain loans considered “substandard” and all loans considered “doubtful” by regulatory guidelines.
The following table summarizes the Company’s loan portfolio at
December 31, 2016
by the risk grade categories (in thousands):
|
|
Internally Risk Graded
|
Non-Graded
|
|
|||||||||||||||||||||||||
|
Performing
|
||||||||||||||||||||||||||||
|
|
Pass
|
Other Loans Especially Mentioned
|
Accruing
Substandard
|
Nonaccrual
|
Performing
|
Nonaccrual
|
Total
|
|||||||||||||||||||||
|
Commercial:
|
|
|
|
|
|
|
||||||||||||||||||||||
|
Energy
|
$
|
1,937,790
|
|
$
|
119,583
|
|
$
|
307,996
|
|
$
|
132,499
|
|
—
|
|
—
|
|
$
|
2,497,868
|
|
|||||||||
|
Services
|
3,052,002
|
|
10,960
|
|
37,855
|
|
8,173
|
|
—
|
|
—
|
|
3,108,990
|
|
||||||||||||||
|
Wholesale/retail
|
1,535,463
|
|
16,886
|
|
13,062
|
|
11,407
|
|
—
|
|
—
|
|
1,576,818
|
|
||||||||||||||
|
Manufacturing
|
468,314
|
|
26,532
|
|
15,198
|
|
4,931
|
|
—
|
|
—
|
|
514,975
|
|
||||||||||||||
|
Healthcare
|
2,140,458
|
|
44,472
|
|
16,161
|
|
825
|
|
—
|
|
—
|
|
2,201,916
|
|
||||||||||||||
|
Other commercial and industrial
|
433,789
|
|
5,309
|
|
—
|
|
21,060
|
|
30,041
|
|
58
|
|
490,257
|
|
||||||||||||||
|
Total commercial
|
9,567,816
|
|
223,742
|
|
390,272
|
|
178,895
|
|
30,041
|
|
58
|
|
10,390,824
|
|
||||||||||||||
|
Commercial real estate:
|
|
|
|
|
|
|
|
|
|
|
|
|
||||||||||||||||
|
Residential construction and land development
|
131,630
|
|
—
|
|
470
|
|
3,433
|
|
—
|
|
—
|
|
135,533
|
|
||||||||||||||
|
Retail
|
756,418
|
|
4,745
|
|
399
|
|
326
|
|
—
|
|
—
|
|
761,888
|
|
||||||||||||||
|
Office
|
798,462
|
|
—
|
|
—
|
|
426
|
|
—
|
|
—
|
|
798,888
|
|
||||||||||||||
|
Multifamily
|
898,800
|
|
—
|
|
4,434
|
|
38
|
|
—
|
|
—
|
|
903,272
|
|
||||||||||||||
|
Industrial
|
871,673
|
|
—
|
|
—
|
|
76
|
|
—
|
|
—
|
|
871,749
|
|
||||||||||||||
|
Other commercial real estate
|
336,488
|
|
—
|
|
6
|
|
1,222
|
|
—
|
|
—
|
|
337,716
|
|
||||||||||||||
|
Total commercial real estate
|
3,793,471
|
|
4,745
|
|
5,309
|
|
5,521
|
|
—
|
|
—
|
|
3,809,046
|
|
||||||||||||||
|
Residential mortgage:
|
|
|
|
|
|
|
|
|
|
|
|
|
||||||||||||||||
|
Permanent mortgage
|
238,769
|
|
1,186
|
|
2,331
|
|
1,417
|
|
741,679
|
|
21,438
|
|
1,006,820
|
|
||||||||||||||
|
Permanent mortgages guaranteed by U.S. government agencies
|
—
|
|
—
|
|
—
|
|
—
|
|
187,541
|
|
11,846
|
|
199,387
|
|
||||||||||||||
|
Home equity
|
—
|
|
—
|
|
—
|
|
—
|
|
732,106
|
|
11,519
|
|
743,625
|
|
||||||||||||||
|
Total residential mortgage
|
238,769
|
|
1,186
|
|
2,331
|
|
1,417
|
|
1,661,326
|
|
44,803
|
|
1,949,832
|
|
||||||||||||||
|
Personal
|
743,451
|
|
—
|
|
1,054
|
|
97
|
|
95,163
|
|
193
|
|
839,958
|
|
||||||||||||||
|
Total
|
$
|
14,343,507
|
|
$
|
229,673
|
|
$
|
398,966
|
|
$
|
185,930
|
|
$
|
1,786,530
|
|
$
|
45,054
|
|
$
|
16,989,660
|
|
|||||||
119
The following table summarizes the Company’s loan portfolio at
December 31, 2015
by the risk grade categories (in thousands):
|
|
Internally Risk Graded
|
Non-Graded
|
|
||||||||||||||||||||||||
|
Performing
|
|||||||||||||||||||||||||||
|
|
Pass
|
Other Loans Especially Mentioned
|
Accruing Substandard
|
Nonaccrual
|
Performing
|
Nonaccrual
|
Total
|
||||||||||||||||||||
|
Commercial:
|
|
|
|
|
|
|
|||||||||||||||||||||
|
Energy
|
$
|
2,580,694
|
|
$
|
325,663
|
|
$
|
129,782
|
|
61,189
|
|
$
|
—
|
|
$
|
—
|
|
$
|
3,097,328
|
|
|||||||
|
Services
|
2,763,929
|
|
3,296
|
|
6,761
|
|
10,290
|
|
—
|
|
—
|
|
2,784,276
|
|
|||||||||||||
|
Wholesale/retail
|
1,394,596
|
|
18,184
|
|
6,365
|
|
2,919
|
|
—
|
|
—
|
|
1,422,064
|
|
|||||||||||||
|
Manufacturing
|
534,966
|
|
19,560
|
|
1,872
|
|
331
|
|
—
|
|
—
|
|
556,729
|
|
|||||||||||||
|
Healthcare
|
1,876,745
|
|
5,563
|
|
—
|
|
1,072
|
|
—
|
|
—
|
|
1,883,380
|
|
|||||||||||||
|
Other commercial and industrial
|
477,551
|
|
5,479
|
|
—
|
|
496
|
|
25,101
|
|
127
|
|
508,754
|
|
|||||||||||||
|
Total commercial
|
9,628,481
|
|
377,745
|
|
144,780
|
|
76,297
|
|
25,101
|
|
127
|
|
10,252,531
|
|
|||||||||||||
|
Commercial real estate:
|
|
|
|
|
|
|
|
|
|
|
|
|
|||||||||||||||
|
Residential construction and land development
|
154,369
|
|
1,355
|
|
293
|
|
4,409
|
|
—
|
|
—
|
|
160,426
|
|
|||||||||||||
|
Retail
|
788,708
|
|
6,046
|
|
426
|
|
1,319
|
|
—
|
|
—
|
|
796,499
|
|
|||||||||||||
|
Office
|
636,210
|
|
291
|
|
555
|
|
651
|
|
—
|
|
—
|
|
637,707
|
|
|||||||||||||
|
Multifamily
|
744,299
|
|
—
|
|
6,512
|
|
274
|
|
—
|
|
—
|
|
751,085
|
|
|||||||||||||
|
Industrial
|
563,093
|
|
—
|
|
—
|
|
76
|
|
—
|
|
—
|
|
563,169
|
|
|||||||||||||
|
Other commercial real estate
|
347,864
|
|
—
|
|
11
|
|
2,272
|
|
—
|
|
—
|
|
350,147
|
|
|||||||||||||
|
Total commercial real estate
|
3,234,543
|
|
7,692
|
|
7,797
|
|
9,001
|
|
—
|
|
—
|
|
3,259,033
|
|
|||||||||||||
|
Residential mortgage:
|
|
|
|
|
|
|
|
|
|
|
|
|
|||||||||||||||
|
Permanent mortgage
|
192,367
|
|
89
|
|
1,932
|
|
2,313
|
|
721,964
|
|
26,671
|
|
945,336
|
|
|||||||||||||
|
Permanent mortgages guaranteed by U.S. government agencies
|
—
|
|
—
|
|
—
|
|
—
|
|
175,037
|
|
21,900
|
|
196,937
|
|
|||||||||||||
|
Home equity
|
—
|
|
—
|
|
—
|
|
—
|
|
724,264
|
|
10,356
|
|
734,620
|
|
|||||||||||||
|
Total residential mortgage
|
192,367
|
|
89
|
|
1,932
|
|
2,313
|
|
1,621,265
|
|
58,927
|
|
1,876,893
|
|
|||||||||||||
|
Personal
|
467,808
|
|
3
|
|
14
|
|
130
|
|
84,409
|
|
333
|
|
552,697
|
|
|||||||||||||
|
Total
|
$
|
13,523,199
|
|
$
|
385,529
|
|
$
|
154,523
|
|
87,741
|
|
$
|
1,730,775
|
|
$
|
59,387
|
|
$
|
15,941,154
|
|
|||||||
120
Impaired Loans
Loans are considered to be impaired when it is probable that the Company will not be able to collect all amounts due according to the contractual terms of the loan agreement. This includes all nonaccruing loans, all loans modified in a troubled debt restructuring and all loans repurchased from GNMA pools.
A summary of impaired loans follows (in thousands):
|
|
As of December 31, 2016
|
Year Ended
|
|||||||||||||||||||||||||
|
|
|
Recorded Investment
|
|
December 31, 2016
|
|||||||||||||||||||||||
|
|
Unpaid
Principal
Balance
|
Total
|
With No
Allowance |
With Allowance
|
Related Allowance
|
Average Recorded
Investment |
Interest Income Recognized
|
||||||||||||||||||||
|
Commercial:
|
|
|
|
|
|
|
|
||||||||||||||||||||
|
Energy
|
$
|
146,897
|
|
$
|
132,499
|
|
$
|
121,418
|
|
$
|
11,081
|
|
$
|
762
|
|
$
|
80,100
|
|
$
|
—
|
|
||||||
|
Services
|
11,723
|
|
8,173
|
|
8,173
|
|
—
|
|
—
|
|
9,232
|
|
—
|
|
|||||||||||||
|
Wholesale/retail
|
17,669
|
|
11,407
|
|
11,407
|
|
—
|
|
—
|
|
7,163
|
|
—
|
|
|||||||||||||
|
Manufacturing
|
5,320
|
|
4,931
|
|
4,931
|
|
—
|
|
—
|
|
2,631
|
|
—
|
|
|||||||||||||
|
Healthcare
|
1,147
|
|
825
|
|
825
|
|
—
|
|
—
|
|
949
|
|
—
|
|
|||||||||||||
|
Other commercial and industrial
|
29,006
|
|
21,118
|
|
21,083
|
|
35
|
|
35
|
|
10,870
|
|
—
|
|
|||||||||||||
|
Total commercial
|
211,762
|
|
178,953
|
|
167,837
|
|
11,116
|
|
797
|
|
110,945
|
|
—
|
|
|||||||||||||
|
Commercial real estate:
|
|
|
|
|
|
|
|
|
|
|
|
|
|
|
|||||||||||||
|
Residential construction and land development
|
4,951
|
|
3,433
|
|
3,433
|
|
—
|
|
—
|
|
3,921
|
|
—
|
|
|||||||||||||
|
Retail
|
530
|
|
326
|
|
326
|
|
—
|
|
—
|
|
823
|
|
—
|
|
|||||||||||||
|
Office
|
521
|
|
426
|
|
426
|
|
—
|
|
—
|
|
539
|
|
—
|
|
|||||||||||||
|
Multifamily
|
1,000
|
|
38
|
|
38
|
|
—
|
|
—
|
|
156
|
|
—
|
|
|||||||||||||
|
Industrial
|
76
|
|
76
|
|
76
|
|
—
|
|
—
|
|
76
|
|
—
|
|
|||||||||||||
|
Other commercial real estate
|
7,349
|
|
1,222
|
|
1,222
|
|
—
|
|
—
|
|
1,747
|
|
—
|
|
|||||||||||||
|
Total commercial real estate
|
14,427
|
|
5,521
|
|
5,521
|
|
—
|
|
—
|
|
7,262
|
|
—
|
|
|||||||||||||
|
Residential mortgage:
|
|
|
|
|
|
|
|
|
|
|
|
|
|
|
|||||||||||||
|
Permanent mortgage
|
28,830
|
|
22,855
|
|
22,809
|
|
46
|
|
46
|
|
25,920
|
|
1,255
|
|
|||||||||||||
|
Permanent mortgage guaranteed by U.S. government agencies
1
|
205,564
|
|
199,387
|
|
199,387
|
|
—
|
|
—
|
|
193,889
|
|
7,759
|
|
|||||||||||||
|
Home equity
|
12,611
|
|
11,519
|
|
11,519
|
|
—
|
|
—
|
|
10,937
|
|
—
|
|
|||||||||||||
|
Total residential mortgage
|
247,005
|
|
233,761
|
|
233,715
|
|
46
|
|
46
|
|
230,746
|
|
9,014
|
|
|||||||||||||
|
Personal
|
332
|
|
290
|
|
290
|
|
—
|
|
—
|
|
377
|
|
—
|
|
|||||||||||||
|
Total
|
$
|
473,526
|
|
$
|
418,525
|
|
$
|
407,363
|
|
$
|
11,162
|
|
$
|
843
|
|
$
|
349,330
|
|
$
|
9,014
|
|
||||||
|
1
|
All permanent mortgage loans guaranteed by U.S. government agencies are considered impaired as we do not expect full collection of contractual principal and interest. At
December 31, 2016
,
$12 million
of these loans are nonaccruing and
$188 million
are accruing based on the guarantee by U.S. government agencies.
|
Generally, no interest income is recognized on impaired loans until all principal balances, including amounts charged-off, have been recovered.
121
|
|
As of December 31, 2015
|
Year Ended
|
||||||||||||||||||||||||||
|
|
|
Recorded Investment
|
|
December 31, 2015
|
||||||||||||||||||||||||
|
|
Unpaid
Principal
Balance
|
Total
|
With No
Allowance
|
With Allowance
|
Related Allowance
|
Average Recorded
Investment
|
Interest Income Recognized
|
|||||||||||||||||||||
|
Commercial:
|
|
|
|
|
|
|||||||||||||||||||||||
|
Energy
|
$
|
63,910
|
|
$
|
61,189
|
|
$
|
18,330
|
|
$
|
42,859
|
|
$
|
16,115
|
|
$
|
31,303
|
|
$
|
—
|
|
|||||||
|
Services
|
13,449
|
|
10,290
|
|
9,657
|
|
633
|
|
148
|
|
7,746
|
|
—
|
|
||||||||||||||
|
Wholesale/retail
|
8,582
|
|
2,919
|
|
2,907
|
|
12
|
|
9
|
|
3,534
|
|
—
|
|
||||||||||||||
|
Manufacturing
|
665
|
|
331
|
|
331
|
|
—
|
|
—
|
|
391
|
|
—
|
|
||||||||||||||
|
Healthcare
|
1,352
|
|
1,072
|
|
931
|
|
141
|
|
35
|
|
1,226
|
|
—
|
|
||||||||||||||
|
Other commercial and industrial
|
8,304
|
|
623
|
|
623
|
|
—
|
|
—
|
|
777
|
|
—
|
|
||||||||||||||
|
Total commercial
|
96,262
|
|
76,424
|
|
32,779
|
|
43,645
|
|
16,307
|
|
44,977
|
|
—
|
|
||||||||||||||
|
Commercial real estate:
|
|
|
|
|
|
|
|
|
|
|
||||||||||||||||||
|
Residential construction and land development
|
8,963
|
|
4,409
|
|
4,409
|
|
—
|
|
—
|
|
4,854
|
|
—
|
|
||||||||||||||
|
Retail
|
1,923
|
|
1,319
|
|
1,319
|
|
—
|
|
—
|
|
2,622
|
|
—
|
|
||||||||||||||
|
Office
|
937
|
|
651
|
|
651
|
|
—
|
|
—
|
|
2,035
|
|
—
|
|
||||||||||||||
|
Multifamily
|
1,192
|
|
274
|
|
274
|
|
—
|
|
—
|
|
137
|
|
—
|
|
||||||||||||||
|
Industrial
|
76
|
|
76
|
|
76
|
|
—
|
|
—
|
|
38
|
|
—
|
|
||||||||||||||
|
Other commercial real estate
|
8,363
|
|
2,272
|
|
2,113
|
|
159
|
|
18
|
|
4,092
|
|
—
|
|
||||||||||||||
|
Total commercial real estate
|
21,454
|
|
9,001
|
|
8,842
|
|
159
|
|
18
|
|
13,778
|
|
—
|
|
||||||||||||||
|
Residential mortgage:
|
|
|
|
|
|
|
|
|
|
|
||||||||||||||||||
|
Permanent mortgage
|
37,273
|
|
28,984
|
|
28,868
|
|
116
|
|
68
|
|
31,914
|
|
1,242
|
|
||||||||||||||
|
Permanent mortgage guaranteed by U.S. government agencies
1
|
202,984
|
|
196,937
|
|
196,937
|
|
—
|
|
—
|
|
196,827
|
|
7,814
|
|
||||||||||||||
|
Home equity
|
10,988
|
|
10,356
|
|
10,356
|
|
—
|
|
—
|
|
9,960
|
|
—
|
|
||||||||||||||
|
Total residential mortgage
|
251,245
|
|
236,277
|
|
236,161
|
|
116
|
|
68
|
|
238,701
|
|
9,056
|
|
||||||||||||||
|
Personal
|
489
|
|
463
|
|
463
|
|
—
|
|
—
|
|
515
|
|
—
|
|
||||||||||||||
|
Total
|
$
|
369,450
|
|
$
|
322,165
|
|
$
|
278,245
|
|
$
|
43,920
|
|
$
|
16,393
|
|
$
|
297,971
|
|
$
|
9,056
|
|
|||||||
|
1
|
All permanent mortgage loans guaranteed by U.S. government agencies are considered impaired as we do not expect full collection of contractual principal and interest. At
December 31, 2015
,
$22 million
of these loans are nonaccruing and
$175 million
are accruing based on the guarantee by U.S. government agencies.
|
122
Troubled Debt Restructurings
A summary of troubled debt restructurings ("TDRs") by accruing status as of
December 31, 2016
is as follows (in thousands):
|
|
As of December 31, 2016
|
|||||||||||||||||||
|
|
Recorded
Investment
|
Performing in Accordance With Modified Terms
|
Not
Performing in Accordance With Modified Terms
|
Specific
Allowance
|
Amounts Charged-Off During the Year Ended December 31, 2016
|
|||||||||||||||
|
Nonaccruing TDRs:
|
||||||||||||||||||||
|
Commercial:
|
|
|
|
|
|
|||||||||||||||
|
Energy
|
$
|
16,893
|
|
$
|
10,867
|
|
$
|
6,026
|
|
$
|
—
|
|
$
|
4,401
|
|
|||||
|
Services
|
7,527
|
|
6,830
|
|
697
|
|
—
|
|
—
|
|
||||||||||
|
Wholesale/Retail
|
11,291
|
|
11,251
|
|
40
|
|
—
|
|
—
|
|
||||||||||
|
Manufacturing
|
224
|
|
224
|
|
—
|
|
—
|
|
—
|
|
||||||||||
|
Healthcare
|
607
|
|
—
|
|
607
|
|
—
|
|
—
|
|
||||||||||
|
Other commercial and industrial
|
337
|
|
53
|
|
284
|
|
—
|
|
—
|
|
||||||||||
|
Total commercial
|
36,879
|
|
29,225
|
|
7,654
|
|
—
|
|
4,401
|
|
||||||||||
|
Commercial real estate:
|
|
|
|
|
|
|
|
|
|
|
||||||||||
|
Residential construction and land development
|
690
|
|
97
|
|
593
|
|
—
|
|
—
|
|
||||||||||
|
Retail
|
326
|
|
326
|
|
—
|
|
—
|
|
—
|
|
||||||||||
|
Office
|
143
|
|
143
|
|
—
|
|
—
|
|
—
|
|
||||||||||
|
Multifamily
|
—
|
|
—
|
|
—
|
|
—
|
|
—
|
|
||||||||||
|
Industrial
|
—
|
|
—
|
|
—
|
|
—
|
|
—
|
|
||||||||||
|
Other commercial real estate
|
548
|
|
548
|
|
—
|
|
—
|
|
—
|
|
||||||||||
|
Total commercial real estate
|
1,707
|
|
1,114
|
|
593
|
|
—
|
|
—
|
|
||||||||||
|
Residential mortgage:
|
|
|
|
|
|
|
|
|
|
|
||||||||||
|
Permanent mortgage
|
14,876
|
|
10,175
|
|
4,701
|
|
46
|
|
28
|
|
||||||||||
|
Permanent mortgage guaranteed by U.S. government agencies
|
6,702
|
|
2,241
|
|
4,461
|
|
—
|
|
—
|
|
||||||||||
|
Home equity
|
5,346
|
|
4,458
|
|
888
|
|
—
|
|
230
|
|
||||||||||
|
Total residential mortgage
|
26,924
|
|
16,874
|
|
10,050
|
|
46
|
|
258
|
|
||||||||||
|
Personal
|
237
|
|
236
|
|
1
|
|
—
|
|
73
|
|
||||||||||
|
Total nonaccruing TDRs
|
65,747
|
|
47,449
|
|
18,298
|
|
46
|
|
4,732
|
|
||||||||||
|
Accruing TDRs:
|
||||||||||||||||||||
|
Residential mortgage:
|
||||||||||||||||||||
|
Permanent mortgages guaranteed by U.S. government agencies
|
81,370
|
|
27,289
|
|
54,081
|
|
—
|
|
—
|
|
||||||||||
|
Total residential mortgage
|
81,370
|
|
27,289
|
|
54,081
|
|
—
|
|
—
|
|
||||||||||
|
Total accruing TDRs
|
81,370
|
|
27,289
|
|
54,081
|
|
—
|
|
—
|
|
||||||||||
|
Total TDRs
|
$
|
147,117
|
|
$
|
74,738
|
|
$
|
72,379
|
|
$
|
46
|
|
$
|
4,732
|
|
|||||
123
A summary of troubled debt restructurings by accruing status as of
December 31, 2015
is as follows (in thousands):
|
|
As of December 31, 2015
|
|||||||||||||||||||
|
|
Recorded
Investment
|
Performing in Accordance With Modified Terms
|
Not
Performing in Accordance With Modified Terms
|
Specific
Allowance
|
Amounts Charged-off During the Year Ended December 31, 2015
|
|||||||||||||||
|
Nonaccruing TDRs:
|
||||||||||||||||||||
|
Commercial:
|
|
|
|
|
||||||||||||||||
|
Energy
|
$
|
2,304
|
|
$
|
2,304
|
|
$
|
—
|
|
$
|
—
|
|
$
|
928
|
|
|||||
|
Services
|
9,027
|
|
8,210
|
|
817
|
|
148
|
|
—
|
|
||||||||||
|
Wholesale/retail
|
2,758
|
|
2,706
|
|
52
|
|
9
|
|
—
|
|
||||||||||
|
Manufacturing
|
282
|
|
282
|
|
—
|
|
—
|
|
—
|
|
||||||||||
|
Healthcare
|
673
|
|
673
|
|
—
|
|
—
|
|
—
|
|
||||||||||
|
Other commercial and industrial
|
621
|
|
89
|
|
532
|
|
—
|
|
—
|
|
||||||||||
|
Total commercial
|
15,665
|
|
14,264
|
|
1,401
|
|
157
|
|
928
|
|
||||||||||
|
Commercial real estate:
|
|
|
|
|
|
|
|
|
||||||||||||
|
Residential construction and land development
|
2,328
|
|
1,556
|
|
772
|
|
—
|
|
—
|
|
||||||||||
|
Retail
|
1,319
|
|
942
|
|
377
|
|
—
|
|
—
|
|
||||||||||
|
Office
|
165
|
|
165
|
|
—
|
|
—
|
|
—
|
|
||||||||||
|
Multifamily
|
—
|
|
—
|
|
—
|
|
—
|
|
—
|
|
||||||||||
|
Industrial
|
—
|
|
—
|
|
—
|
|
—
|
|
—
|
|
||||||||||
|
Other commercial real estate
|
920
|
|
478
|
|
442
|
|
—
|
|
—
|
|
||||||||||
|
Total commercial real estate
|
4,732
|
|
3,141
|
|
1,591
|
|
—
|
|
—
|
|
||||||||||
|
Residential mortgage:
|
|
|
|
|
|
|
|
|
||||||||||||
|
Permanent mortgage
|
16,618
|
|
9,043
|
|
7,575
|
|
68
|
|
192
|
|
||||||||||
|
Permanent mortgage guaranteed by U.S. government agencies
|
11,136
|
|
139
|
|
10,997
|
|
—
|
|
—
|
|
||||||||||
|
Home equity
|
5,159
|
|
4,218
|
|
941
|
|
—
|
|
80
|
|
||||||||||
|
Total residential mortgage
|
32,913
|
|
13,400
|
|
19,513
|
|
68
|
|
272
|
|
||||||||||
|
Personal
|
324
|
|
297
|
|
27
|
|
—
|
|
11
|
|
||||||||||
|
Total nonaccuring TDRs
|
53,634
|
|
31,102
|
|
22,532
|
|
225
|
|
1,211
|
|
||||||||||
|
Accruing TDRs:
|
||||||||||||||||||||
|
Residential mortgage:
|
||||||||||||||||||||
|
Permanent mortgages guaranteed by U.S. government agencies
|
74,050
|
|
23,029
|
|
51,021
|
|
—
|
|
—
|
|
||||||||||
|
Total residential mortgage
|
74,050
|
|
23,029
|
|
51,021
|
|
—
|
|
—
|
|
||||||||||
|
Total accruing TDRs
|
74,050
|
|
23,029
|
|
51,021
|
|
—
|
|
—
|
|
||||||||||
|
Total TDRs
|
$
|
127,684
|
|
$
|
54,131
|
|
$
|
73,553
|
|
$
|
225
|
|
$
|
1,211
|
|
|||||
124
Troubled debt restructurings generally consist of interest rate concessions, payment stream concessions or a combination of concessions to distressed borrowers. The following table details the recorded balance of loans at
December 31, 2016
by class that were restructured during the year ended
December 31, 2016
by primary type of concession (in thousands):
|
Year Ended December 31, 2016
|
|||||||||||||||||||||||||||||||
|
Accruing
|
Nonaccrual
|
Total
|
|||||||||||||||||||||||||||||
|
Payment Stream
|
Combination & Other
|
Total
|
Interest Rate
|
Payment Stream
|
Combination & Other
|
Total
|
|||||||||||||||||||||||||
|
Commercial:
|
|||||||||||||||||||||||||||||||
|
Energy
|
$
|
—
|
|
$
|
—
|
|
$
|
—
|
|
$
|
—
|
|
$
|
—
|
|
$
|
16,892
|
|
$
|
16,892
|
|
$
|
16,892
|
|
|||||||
|
Services
|
—
|
|
—
|
|
—
|
|
—
|
|
—
|
|
—
|
|
—
|
|
—
|
|
|||||||||||||||
|
Wholesale/retail
|
—
|
|
—
|
|
—
|
|
—
|
|
—
|
|
9,103
|
|
9,103
|
|
9,103
|
|
|||||||||||||||
|
Manufacturing
|
—
|
|
—
|
|
—
|
|
—
|
|
—
|
|
—
|
|
—
|
|
—
|
|
|||||||||||||||
|
Healthcare
|
—
|
|
—
|
|
—
|
|
—
|
|
—
|
|
—
|
|
—
|
|
—
|
|
|||||||||||||||
|
Other commercial and industrial
|
—
|
|
—
|
|
—
|
|
—
|
|
—
|
|
—
|
|
—
|
|
—
|
|
|||||||||||||||
|
Total commercial
|
—
|
|
—
|
|
—
|
|
—
|
|
—
|
|
25,995
|
|
25,995
|
|
25,995
|
|
|||||||||||||||
|
Commercial real estate:
|
|
|
|||||||||||||||||||||||||||||
|
Residential construction and land development
|
—
|
|
—
|
|
—
|
|
—
|
|
—
|
|
—
|
|
—
|
|
—
|
|
|||||||||||||||
|
Retail
|
—
|
|
—
|
|
—
|
|
—
|
|
—
|
|
—
|
|
—
|
|
—
|
|
|||||||||||||||
|
Office
|
—
|
|
—
|
|
—
|
|
—
|
|
—
|
|
—
|
|
—
|
|
—
|
|
|||||||||||||||
|
Multifamily
|
—
|
|
—
|
|
—
|
|
—
|
|
—
|
|
—
|
|
—
|
|
—
|
|
|||||||||||||||
|
Industrial
|
—
|
|
—
|
|
—
|
|
—
|
|
—
|
|
—
|
|
—
|
|
—
|
|
|||||||||||||||
|
Other commercial real estate
|
—
|
|
—
|
|
—
|
|
—
|
|
—
|
|
—
|
|
—
|
|
—
|
|
|||||||||||||||
|
Total commercial real estate
|
—
|
|
—
|
|
—
|
|
—
|
|
—
|
|
—
|
|
—
|
|
—
|
|
|||||||||||||||
|
Residential mortgage:
|
|||||||||||||||||||||||||||||||
|
Permanent mortgage
|
—
|
|
—
|
|
—
|
|
—
|
|
1,036
|
|
328
|
|
1,364
|
|
1,364
|
|
|||||||||||||||
|
Permanent mortgage guaranteed by U.S. government agencies
|
11,879
|
|
10,042
|
|
21,921
|
|
—
|
|
—
|
|
979
|
|
979
|
|
22,900
|
|
|||||||||||||||
|
Home equity
|
—
|
|
—
|
|
—
|
|
—
|
|
46
|
|
2,077
|
|
2,123
|
|
2,123
|
|
|||||||||||||||
|
Total residential mortgage
|
11,879
|
|
10,042
|
|
21,921
|
|
—
|
|
1,082
|
|
3,384
|
|
4,466
|
|
26,387
|
|
|||||||||||||||
|
Personal
|
—
|
|
—
|
|
—
|
|
—
|
|
—
|
|
77
|
|
77
|
|
77
|
|
|||||||||||||||
|
Total
|
$
|
11,879
|
|
$
|
10,042
|
|
$
|
21,921
|
|
$
|
—
|
|
$
|
1,082
|
|
$
|
29,456
|
|
$
|
30,538
|
|
$
|
52,459
|
|
|||||||
125
The following table details the recorded balance of loans by class that were restructured during the year ended
December 31, 2015
by primary type of concession (in thousands):
|
Year Ended December 31, 2015
|
|||||||||||||||||||||||||||||||
|
Accruing
|
Nonaccrual
|
Total
|
|||||||||||||||||||||||||||||
|
Payment Stream
|
Combination & Other
|
Total
|
Interest Rate
|
Payment Stream
|
Combination & Other
|
Total
|
|||||||||||||||||||||||||
|
Commercial:
|
|||||||||||||||||||||||||||||||
|
Energy
|
$
|
—
|
|
$
|
—
|
|
$
|
—
|
|
$
|
—
|
|
$
|
—
|
|
$
|
2,304
|
|
$
|
2,304
|
|
$
|
2,304
|
|
|||||||
|
Services
|
—
|
|
—
|
|
—
|
|
—
|
|
—
|
|
7,577
|
|
7,577
|
|
7,577
|
|
|||||||||||||||
|
Wholesale/retail
|
—
|
|
—
|
|
—
|
|
—
|
|
—
|
|
—
|
|
—
|
|
—
|
|
|||||||||||||||
|
Manufacturing
|
—
|
|
—
|
|
—
|
|
—
|
|
—
|
|
—
|
|
—
|
|
—
|
|
|||||||||||||||
|
Healthcare
|
—
|
|
—
|
|
—
|
|
673
|
|
—
|
|
—
|
|
673
|
|
673
|
|
|||||||||||||||
|
Other commercial and industrial
|
—
|
|
—
|
|
—
|
|
—
|
|
—
|
|
57
|
|
57
|
|
57
|
|
|||||||||||||||
|
Total commercial
|
—
|
|
—
|
|
—
|
|
673
|
|
—
|
|
9,938
|
|
10,611
|
|
10,611
|
|
|||||||||||||||
|
Commercial real estate:
|
|||||||||||||||||||||||||||||||
|
Residential construction and land development
|
—
|
|
—
|
|
—
|
|
—
|
|
329
|
|
—
|
|
329
|
|
329
|
|
|||||||||||||||
|
Retail
|
—
|
|
—
|
|
—
|
|
—
|
|
—
|
|
—
|
|
—
|
|
—
|
|
|||||||||||||||
|
Office
|
—
|
|
—
|
|
—
|
|
—
|
|
—
|
|
—
|
|
—
|
|
—
|
|
|||||||||||||||
|
Multifamily
|
—
|
|
—
|
|
—
|
|
—
|
|
—
|
|
—
|
|
—
|
|
—
|
|
|||||||||||||||
|
Industrial
|
—
|
|
—
|
|
—
|
|
—
|
|
—
|
|
—
|
|
—
|
|
—
|
|
|||||||||||||||
|
Other commercial real estate
|
—
|
|
—
|
|
—
|
|
—
|
|
—
|
|
—
|
|
—
|
|
—
|
|
|||||||||||||||
|
Total commercial real estate
|
—
|
|
—
|
|
—
|
|
—
|
|
329
|
|
—
|
|
329
|
|
329
|
|
|||||||||||||||
|
Residential mortgage:
|
|||||||||||||||||||||||||||||||
|
Permanent mortgage
|
—
|
|
—
|
|
—
|
|
—
|
|
3,004
|
|
1,051
|
|
4,055
|
|
4,055
|
|
|||||||||||||||
|
Permanent mortgage guaranteed by U.S. government agencies
|
17,717
|
|
10,384
|
|
28,101
|
|
—
|
|
1,264
|
|
1,837
|
|
3,101
|
|
31,202
|
|
|||||||||||||||
|
Home equity
|
—
|
|
—
|
|
—
|
|
57
|
|
181
|
|
1,870
|
|
2,108
|
|
2,108
|
|
|||||||||||||||
|
Total residential mortgage
|
17,717
|
|
10,384
|
|
28,101
|
|
57
|
|
4,449
|
|
4,758
|
|
9,264
|
|
37,365
|
|
|||||||||||||||
|
Personal
|
—
|
|
—
|
|
—
|
|
—
|
|
—
|
|
115
|
|
115
|
|
115
|
|
|||||||||||||||
|
Total
|
$
|
17,717
|
|
$
|
10,384
|
|
$
|
28,101
|
|
$
|
730
|
|
$
|
4,778
|
|
$
|
14,811
|
|
$
|
20,319
|
|
$
|
48,420
|
|
|||||||
126
The following table summarizes, by loan class, the recorded investment at
December 31, 2016
and
2015
, respectively of loans modified as TDRs within the previous 12 months and for which there was a payment default during the years ended
December 31, 2016
and
2015
, respectively (in thousands):
|
Year Ended
|
|||||||||||||||||||||||
|
December 31, 2016
|
December 31, 2015
|
||||||||||||||||||||||
|
Accruing
|
Nonaccrual
|
Total
|
Accruing
|
Nonaccrual
|
Total
|
||||||||||||||||||
|
Commercial:
|
|||||||||||||||||||||||
|
Energy
|
$
|
—
|
|
$
|
8,593
|
|
$
|
8,593
|
|
$
|
—
|
|
$
|
—
|
|
$
|
—
|
|
|||||
|
Services
|
—
|
|
—
|
|
—
|
|
—
|
|
—
|
|
—
|
|
|||||||||||
|
Wholesale/retail
|
—
|
|
—
|
|
—
|
|
—
|
|
—
|
|
—
|
|
|||||||||||
|
Manufacturing
|
—
|
|
—
|
|
—
|
|
—
|
|
—
|
|
—
|
|
|||||||||||
|
Healthcare
|
—
|
|
—
|
|
—
|
|
—
|
|
—
|
|
—
|
|
|||||||||||
|
Other commercial and industrial
|
—
|
|
—
|
|
—
|
|
—
|
|
38
|
|
38
|
|
|||||||||||
|
Total commercial
|
—
|
|
8,593
|
|
8,593
|
|
—
|
|
38
|
|
38
|
|
|||||||||||
|
Commercial real estate:
|
|||||||||||||||||||||||
|
Residential construction and land development
|
—
|
|
—
|
|
—
|
|
—
|
|
329
|
|
329
|
|
|||||||||||
|
Retail
|
—
|
|
—
|
|
—
|
|
—
|
|
—
|
|
—
|
|
|||||||||||
|
Office
|
—
|
|
—
|
|
—
|
|
—
|
|
—
|
|
—
|
|
|||||||||||
|
Multifamily
|
—
|
|
—
|
|
—
|
|
—
|
|
—
|
|
—
|
|
|||||||||||
|
Industrial
|
—
|
|
—
|
|
—
|
|
—
|
|
—
|
|
—
|
|
|||||||||||
|
Other commercial real estate
|
—
|
|
—
|
|
—
|
|
—
|
|
—
|
|
—
|
|
|||||||||||
|
Total commercial real estate
|
—
|
|
—
|
|
—
|
|
—
|
|
329
|
|
329
|
|
|||||||||||
|
Residential mortgage:
|
|||||||||||||||||||||||
|
Permanent mortgage
|
—
|
|
544
|
|
544
|
|
—
|
|
3,034
|
|
3,034
|
|
|||||||||||
|
Permanent mortgage guaranteed by U.S. government agencies
|
17,154
|
|
647
|
|
17,801
|
|
27,223
|
|
3,101
|
|
30,324
|
|
|||||||||||
|
Home equity
|
—
|
|
585
|
|
585
|
|
—
|
|
524
|
|
524
|
|
|||||||||||
|
Total residential mortgage
|
17,154
|
|
1,776
|
|
18,930
|
|
27,223
|
|
6,659
|
|
33,882
|
|
|||||||||||
|
Personal
|
—
|
|
5
|
|
5
|
|
—
|
|
13
|
|
13
|
|
|||||||||||
|
Total
|
$
|
17,154
|
|
$
|
10,374
|
|
$
|
27,528
|
|
$
|
27,223
|
|
$
|
7,039
|
|
$
|
34,262
|
|
|||||
A payment default is defined as being 30 days or more past due. The table above includes loans that experienced a payment default during the period, but may be performing in accordance with the modified terms as of the balance sheet date.
127
Nonaccrual & Past Due Loans
Past due status for all loan classes is based on the actual number of days since the last payment was due according to the contractual terms of the loans.
A summary of loans currently performing, loans past due and accruing and nonaccrual loans as of
December 31, 2016
is as follows (in thousands):
|
|
|
Past Due
|
|
|
|||||||||||||||||||
|
|
Current
|
30 to 59
Days
|
60 to 89
Days
|
90 Days
or More
|
Nonaccrual
|
Total
|
|||||||||||||||||
|
Commercial:
|
|
|
|
|
|
||||||||||||||||||
|
Energy
|
$
|
2,364,890
|
|
$
|
479
|
|
—
|
|
$
|
—
|
|
$
|
132,499
|
|
$
|
2,497,868
|
|
||||||
|
Services
|
3,099,605
|
|
191
|
|
1,021
|
|
—
|
|
8,173
|
|
3,108,990
|
|
|||||||||||
|
Wholesale/retail
|
1,561,650
|
|
3,761
|
|
—
|
|
—
|
|
11,407
|
|
1,576,818
|
|
|||||||||||
|
Manufacturing
|
509,662
|
|
382
|
|
—
|
|
—
|
|
4,931
|
|
514,975
|
|
|||||||||||
|
Healthcare
|
2,201,050
|
|
—
|
|
41
|
|
—
|
|
825
|
|
2,201,916
|
|
|||||||||||
|
Other commercial and industrial
|
468,981
|
|
155
|
|
3
|
|
—
|
|
21,118
|
|
490,257
|
|
|||||||||||
|
Total commercial
|
10,205,838
|
|
4,968
|
|
1,065
|
|
—
|
|
178,953
|
|
10,390,824
|
|
|||||||||||
|
Commercial real estate:
|
|
|
|
|
|
|
|
|
|
|
|||||||||||||
|
Residential construction and land development
|
132,100
|
|
—
|
|
—
|
|
—
|
|
3,433
|
|
135,533
|
|
|||||||||||
|
Retail
|
761,562
|
|
—
|
|
—
|
|
—
|
|
326
|
|
761,888
|
|
|||||||||||
|
Office
|
798,462
|
|
—
|
|
—
|
|
—
|
|
426
|
|
798,888
|
|
|||||||||||
|
Multifamily
|
903,234
|
|
—
|
|
—
|
|
—
|
|
38
|
|
903,272
|
|
|||||||||||
|
Industrial
|
871,673
|
|
—
|
|
—
|
|
—
|
|
76
|
|
871,749
|
|
|||||||||||
|
Other commercial real estate
|
336,488
|
|
6
|
|
—
|
|
—
|
|
1,222
|
|
337,716
|
|
|||||||||||
|
Total commercial real estate
|
3,803,519
|
|
6
|
|
—
|
|
—
|
|
5,521
|
|
3,809,046
|
|
|||||||||||
|
Residential mortgage:
|
|
|
|
|
|
|
|
|
|
|
|||||||||||||
|
Permanent mortgage
|
979,386
|
|
3,299
|
|
1,280
|
|
—
|
|
22,855
|
|
1,006,820
|
|
|||||||||||
|
Permanent mortgages guaranteed by U.S. government agencies
|
40,594
|
|
17,465
|
|
13,803
|
|
115,679
|
|
11,846
|
|
199,387
|
|
|||||||||||
|
Home equity
|
729,493
|
|
2,276
|
|
337
|
|
—
|
|
11,519
|
|
743,625
|
|
|||||||||||
|
Total residential mortgage
|
1,749,473
|
|
23,040
|
|
15,420
|
|
115,679
|
|
46,220
|
|
1,949,832
|
|
|||||||||||
|
Personal
|
838,811
|
|
589
|
|
263
|
|
5
|
|
290
|
|
839,958
|
|
|||||||||||
|
Total
|
$
|
16,597,641
|
|
$
|
28,603
|
|
16,748
|
|
$
|
115,684
|
|
$
|
230,984
|
|
$
|
16,989,660
|
|
||||||
128
A summary of loans currently performing, loans past due and accruing and nonaccrual loans as of
December 31, 2015
is as follows (in thousands):
|
|
|
Past Due
|
|
|
|||||||||||||||||||
|
|
Current
|
30 to 59
Days
|
60 to 89
Days
|
90 Days
or More
|
Nonaccrual
|
Total
|
|||||||||||||||||
|
Commercial:
|
|
|
|
|
|
||||||||||||||||||
|
Energy
|
$
|
3,033,504
|
|
$
|
2,635
|
|
—
|
|
$
|
—
|
|
$
|
61,189
|
|
$
|
3,097,328
|
|
||||||
|
Services
|
2,769,895
|
|
66
|
|
4,025
|
|
—
|
|
10,290
|
|
2,784,276
|
|
|||||||||||
|
Wholesale/retail
|
1,418,396
|
|
49
|
|
—
|
|
700
|
|
2,919
|
|
1,422,064
|
|
|||||||||||
|
Manufacturing
|
556,398
|
|
—
|
|
—
|
|
—
|
|
331
|
|
556,729
|
|
|||||||||||
|
Healthcare
|
1,879,873
|
|
2,435
|
|
—
|
|
—
|
|
1,072
|
|
1,883,380
|
|
|||||||||||
|
Other commercial and industrial
|
507,929
|
|
84
|
|
16
|
|
102
|
|
623
|
|
508,754
|
|
|||||||||||
|
Total commercial
|
10,165,995
|
|
5,269
|
|
4,041
|
|
802
|
|
76,424
|
|
10,252,531
|
|
|||||||||||
|
Commercial real estate:
|
|
|
|
|
|
|
|
|
|
|
|||||||||||||
|
Residential construction and land development
|
156,017
|
|
—
|
|
—
|
|
—
|
|
4,409
|
|
160,426
|
|
|||||||||||
|
Retail
|
795,180
|
|
—
|
|
—
|
|
—
|
|
1,319
|
|
796,499
|
|
|||||||||||
|
Office
|
637,056
|
|
—
|
|
—
|
|
—
|
|
651
|
|
637,707
|
|
|||||||||||
|
Multifamily
|
742,697
|
|
8,114
|
|
—
|
|
—
|
|
274
|
|
751,085
|
|
|||||||||||
|
Industrial
|
563,093
|
|
—
|
|
—
|
|
—
|
|
76
|
|
563,169
|
|
|||||||||||
|
Other commercial real estate
|
347,498
|
|
—
|
|
—
|
|
377
|
|
2,272
|
|
350,147
|
|
|||||||||||
|
Total commercial real estate
|
3,241,541
|
|
8,114
|
|
—
|
|
377
|
|
9,001
|
|
3,259,033
|
|
|||||||||||
|
Residential mortgage:
|
|
|
|
|
|
|
|
|
|
|
|||||||||||||
|
Permanent mortgage
|
913,062
|
|
3,290
|
|
—
|
|
—
|
|
28,984
|
|
945,336
|
|
|||||||||||
|
Permanent mortgages guaranteed by U.S. government agencies
|
33,653
|
|
16,986
|
|
13,397
|
|
111,001
|
|
21,900
|
|
196,937
|
|
|||||||||||
|
Home equity
|
721,149
|
|
2,379
|
|
716
|
|
20
|
|
10,356
|
|
734,620
|
|
|||||||||||
|
Total residential mortgage
|
1,667,864
|
|
22,655
|
|
14,113
|
|
111,021
|
|
61,240
|
|
1,876,893
|
|
|||||||||||
|
Personal
|
551,533
|
|
665
|
|
28
|
|
8
|
|
463
|
|
552,697
|
|
|||||||||||
|
Total
|
$
|
15,626,933
|
|
$
|
36,703
|
|
18,182
|
|
$
|
112,208
|
|
$
|
147,128
|
|
$
|
15,941,154
|
|
||||||
129
(
5
)
Premises and Equipment
Premises and equipment at December 31 are summarized as follows (in thousands):
|
|
December 31,
|
|||||||
|
|
2016
|
2015
|
||||||
|
Land
|
$
|
70,552
|
|
$
|
72,612
|
|
||
|
Buildings and improvements
|
250,311
|
|
225,181
|
|
||||
|
Software
|
158,155
|
|
142,476
|
|
||||
|
Furniture and equipment
|
217,399
|
|
194,715
|
|
||||
|
Construction in progress
|
36,743
|
|
39,886
|
|
||||
|
Premises and equipment
|
733,160
|
|
674,870
|
|
||||
|
Less accumulated depreciation
|
407,311
|
|
368,380
|
|
||||
|
Premises and equipment, net of accumulated depreciation
|
$
|
325,849
|
|
$
|
306,490
|
|
||
Depreciation expense of premises and equipment was
$40 million
,
$34 million
and
$33 million
for the years ended
December 31, 2016
,
2015
and
2014
, respectively.
(
6
)
Goodwill and Intangible Assets
On May 4, 2015, the Company acquired a majority voting interest in Heartland Food Products, LLC, a Kansas-based food product and restaurant equipment company pursuant to merchant banking regulations and restrictions. The cash purchase price for this acquisition was
$18 million
. The purchase price allocation included
$11 million
of identifiable intangible assets and
$2.7 million
of goodwill.
On January 12, 2016, the Company acquired E-Spectrum Advisors, a boutique energy investment banking firm based in Dallas that offers a broad range of oil and natural gas property sales and strategic advisory services. On February 29, 2016, the Company acquired Weaver and Tidwell Financial Advisors LTD d/b/a Weaver Wealth Management, a registered investment advisor. The acquisition included hiring Weaver Wealth Management’s team and transitioning its wealth management clients to The Milestone Group, a wholly owned subsidiary of BOK Financial. The acquisition increased BOK Financial’s assets under management and administration by approximately
$340 million
. The combined cash purchase price for these two acquisitions in 2016 totaled
$7.7 million
, including
$5.3 million
of identifiable intangible assets and
$3.3 million
of goodwill.
On
December 1, 2016
, the Company acquired MBT Bancshares, Inc. ("MBT"), parent company of Missouri Bank and Trust of Kansas City (“Mobank”). Mobank operates four banking branches in the Kansas City, Missouri area. BOK Financial paid
$102.5 million
in an all-cash deal for all outstanding shares of MBT stock. MBT was merged into BOK Financial and Mobank became a wholly owned subsidiary of BOK Financial on December 1, 2016. On February 17, 2017, Mobank was merged with the Bank of Kansas City banking division of BOKF, NA. All branches in the Kansas City market will operate under the Mobank name.
130
A summary of the preliminary purchase price allocation and resulting goodwill follows (in thousands):
|
Cash and cash equivalents
|
$
|
166,215
|
|
|
Securities
|
14,431
|
|
|
|
Loans
1
|
444,482
|
|
|
|
Premises and equipments, net
|
8,035
|
|
|
|
Intangible assets – Core deposit premium
|
6,510
|
|
|
|
Other assets
|
3,599
|
|
|
|
Total assets acquired
|
643,272
|
|
|
|
Deposits
|
598,735
|
|
|
|
Other borrowings
|
7,217
|
|
|
|
Other liabilities
|
980
|
|
|
|
Total liabilities assumed
|
606,932
|
|
|
|
Net assets acquired
|
36,340
|
|
|
|
Less: purchase price
|
102,500
|
|
|
|
Goodwill
|
$
|
66,160
|
|
1
Loans are presented net of participations sold to BOKF NA.
The pro-forma impact of all acquisition transactions for periods prior to the acquisition dates was not material to the Company's consolidated financial statements.
The following table presents the original cost and accumulated amortization of intangible assets (in thousands):
|
|
Dec. 31,
|
|||||||
|
|
2016
|
2015
|
||||||
|
Core deposit premiums
|
$
|
35,879
|
|
$
|
29,369
|
|
||
|
Less accumulated amortization
|
29,369
|
|
29,101
|
|
||||
|
Net core deposit premiums
|
6,510
|
|
268
|
|
||||
|
Other identifiable intangible assets
|
60,951
|
|
55,509
|
|
||||
|
Less accumulated amortization
|
20,530
|
|
11,868
|
|
||||
|
Net other identifiable intangible assets
|
40,421
|
|
43,641
|
|
||||
|
Total intangible assets, net
|
$
|
46,931
|
|
$
|
43,909
|
|
||
Expected amortization expense for intangible assets that will continue to be amortized (in thousands):
|
Core
Deposit
Premiums
|
Other
Identifiable
Intangible Assets
|
Total
|
||||||||||
|
2017
|
$
|
808
|
|
$
|
4,565
|
|
$
|
5,373
|
|
|||
|
2018
|
732
|
|
3,908
|
|
4,640
|
|
||||||
|
2019
|
716
|
|
3,556
|
|
4,272
|
|
||||||
|
2020
|
697
|
|
3,420
|
|
4,117
|
|
||||||
|
2021
|
675
|
|
3,063
|
|
3,738
|
|
||||||
|
Thereafter
|
2,882
|
|
21,909
|
|
24,791
|
|
||||||
|
|
$
|
6,510
|
|
$
|
40,421
|
|
$
|
46,931
|
|
|||
131
The changes in the carrying value of goodwill by operating segment are as follows (in thousands):
|
|
Commercial Banking
|
Consumer Banking
|
Wealth
Management
|
Funds Management and Other
|
Total
|
|||||||||||||||
|
Balance, December 31, 2014
|
||||||||||||||||||||
|
Goodwill
|
$
|
269,363
|
|
$
|
39,251
|
|
$
|
69,394
|
|
$
|
—
|
|
$
|
378,008
|
|
|||||
|
Accumulated impairment losses
|
—
|
|
(228
|
)
|
—
|
|
—
|
|
(228
|
)
|
||||||||||
|
269,363
|
|
39,023
|
|
69,394
|
|
—
|
|
377,780
|
|
|||||||||||
|
Goodwill acquired during 2015
|
7,681
|
|
—
|
|
—
|
|
—
|
|
7,681
|
|
||||||||||
|
Balance, December 31, 2015
|
||||||||||||||||||||
|
Goodwill
|
277,044
|
|
39,251
|
|
69,394
|
|
—
|
|
385,689
|
|
||||||||||
|
Accumulated impairment losses
|
—
|
|
(228
|
)
|
—
|
|
—
|
|
(228
|
)
|
||||||||||
|
277,044
|
|
39,023
|
|
69,394
|
|
—
|
|
385,461
|
|
|||||||||||
|
Goodwill acquired during 2016
|
1,210
|
|
—
|
|
2,126
|
|
66,160
|
|
69,496
|
|
||||||||||
|
Adjustment
1
|
(6,058
|
)
|
—
|
|
—
|
|
—
|
|
(6,058
|
)
|
||||||||||
|
Balance, December 31, 2016
|
||||||||||||||||||||
|
Goodwill
|
272,196
|
|
39,251
|
|
71,520
|
|
66,160
|
|
449,127
|
|
||||||||||
|
Accumulated impairment losses
|
—
|
|
(228
|
)
|
—
|
|
—
|
|
(228
|
)
|
||||||||||
|
$
|
272,196
|
|
$
|
39,023
|
|
$
|
71,520
|
|
$
|
66,160
|
|
$
|
448,899
|
|
||||||
|
1
|
Completion of an external audit of Heartland Food Products resulted in a reallocation of the purchase price between net assets acquired, intangible assets and goodwill during 2016.
|
Goodwill related to the Mobank acquisition was not yet allocated to the operating segments as of December 31, 2016 and accordingly is included in Funds Management and Other above. All of the goodwill related to the Mobank acquisition is tax deductible.
The annual goodwill evaluations for
2016
and
2015
did not indicate impairment for any reporting unit. Economic conditions did not indicate that impairment existed for any identifiable intangible assets and therefore no impairment evaluation was performed.
(
7
)
Mortgage Banking Activities
Residential Mortgage Loan Production
The Company originates, markets and services conventional and government-sponsored residential mortgage loans. Generally, conforming fixed rate residential mortgage loans are held for sale in the secondary market and non-conforming and adjustable-rate residential mortgage loans are held for investment. The volume of mortgage loans originated for sale and secondary market prices are the primary drivers of originating and marketing revenue.
Residential mortgage loan commitments are generally outstanding for 60 to 90 days, which represents the typical period from commitment to originate a residential mortgage loan to when the closed loan is sold to an investor. Residential mortgage loan commitments are subject to both credit and interest rate risk. Credit risk is managed through underwriting policies and procedures, including collateral requirements, which are generally accepted by the secondary loan markets. Exposure to interest rate fluctuations is partially managed through forward sales of residential mortgage-backed securities and forward sales contracts. These latter contracts set the price for loans that will be delivered in the next 60 to 90 days.
132
The unpaid principal balance of residential mortgage loans held for sale, notional amounts of derivative contracts related to residential mortgage loan commitments and forward contract sales and their related fair values included in Mortgage loans held for sale on the Consolidated Balance Sheets were (in thousands):
|
|
December 31, 2016
|
December 31, 2015
|
||||||||||||||
|
|
Unpaid Principal Balance/
Notional
|
Fair Value
|
Unpaid Principal Balance/
Notional
|
Fair Value
|
||||||||||||
|
Residential mortgage loans held for sale
|
$
|
286,414
|
|
$
|
286,971
|
|
$
|
293,637
|
|
$
|
299,505
|
|
||||
|
Residential mortgage loan commitments
|
318,359
|
|
9,733
|
|
601,147
|
|
8,134
|
|
||||||||
|
Forward sales contracts
|
569,543
|
|
5,193
|
|
884,710
|
|
800
|
|
||||||||
|
|
|
|
$
|
301,897
|
|
|
|
$
|
308,439
|
|
||||||
No residential mortgage loans held for sale were 90 days or more past due or considered impaired as of
December 31, 2016
or
December 31, 2015
. No credit losses were recognized on residential mortgage loans held for sale for the years ended
December 31, 2016
,
2015
and
2014
.
Mortgage banking revenue was as follows (in thousands):
|
|
Year Ended
|
|||||||||||
|
|
2016
|
2015
|
2014
|
|||||||||
|
Production revenue:
|
|
|
||||||||||
|
Net realized gains on sales of mortgage loans
|
$
|
68,947
|
|
$
|
67,407
|
|
$
|
56,696
|
|
|||
|
Net change in unrealized gain on mortgage loans held for sale
|
(5,311
|
)
|
(784
|
)
|
5,357
|
|
||||||
|
Net change in the fair value of mortgage loan commitments
|
1,599
|
|
(1,837
|
)
|
7,315
|
|
||||||
|
Net change in the fair value of forward sales contracts
|
4,393
|
|
4,801
|
|
(8,307
|
)
|
||||||
|
Total production revenue
|
69,628
|
|
69,587
|
|
61,061
|
|
||||||
|
Servicing revenue
|
64,286
|
|
56,415
|
|
48,032
|
|
||||||
|
Total mortgage banking revenue
|
$
|
133,914
|
|
$
|
126,002
|
|
$
|
109,093
|
|
|||
Mortgage production revenue includes gain (loss) on residential mortgage loans held for sale and changes in the fair value of derivative contracts not designated as hedging instruments related to residential mortgage loan commitments and forward sales contracts. Servicing revenue includes servicing fee income and late charges on loans serviced for others.
Residential Mortgage Servicing
The Company generally retains the right to service residential mortgage loans sold and may purchase mortgage servicing rights. The unpaid principal balance of loans serviced for others is the primary driver of servicing revenue.
The following represents a summary of mortgage servicing rights (Dollars in thousands):
|
December 31,
|
||||||||||||
|
|
2016
|
2015
|
2014
|
|||||||||
|
Number of residential mortgage loans serviced for others
|
139,340
|
|
131,859
|
|
117,483
|
|
||||||
|
Outstanding principal balance of residential mortgage loans serviced for others
|
$
|
21,997,568
|
|
$
|
19,678,226
|
|
$
|
16,162,887
|
|
|||
|
Weighted average interest rate
|
3.97
|
%
|
4.12
|
%
|
4.29
|
%
|
||||||
|
Remaining contractual term (in months)
|
301
|
|
300
|
|
296
|
|
||||||
133
Activity in capitalized mortgage servicing rights during the three years ended
December 31, 2016
is as follows (in thousands):
|
|
Purchased
|
Originated
|
Total
|
|||||||||
|
Balance, December 31, 2013
|
$
|
15,935
|
|
$
|
137,398
|
|
$
|
153,333
|
|
|||
|
Additions, net
|
—
|
|
54,413
|
|
54,413
|
|
||||||
|
Change in fair value due to loan runoff
|
(2,357
|
)
|
(16,968
|
)
|
(19,325
|
)
|
||||||
|
Change in fair value due to market changes
|
(2,464
|
)
|
(13,981
|
)
|
(16,445
|
)
|
||||||
|
Balance, December 31, 2014
|
11,114
|
|
160,862
|
|
171,976
|
|
||||||
|
Additions, net
|
—
|
|
79,546
|
|
79,546
|
|
||||||
|
Change in fair value due to loan runoff
|
(2,645
|
)
|
(25,419
|
)
|
(28,064
|
)
|
||||||
|
Change in fair value due to market changes
|
1,442
|
|
(6,295
|
)
|
(4,853
|
)
|
||||||
|
Balance, December 31, 2015
|
9,911
|
|
208,694
|
|
218,605
|
|
||||||
|
Additions, net
|
—
|
|
71,405
|
|
71,405
|
|
||||||
|
Change in fair value due to loan runoff
|
(2,844
|
)
|
(37,900
|
)
|
(40,744
|
)
|
||||||
|
Change in fair value due to market changes
|
1,842
|
|
(4,035
|
)
|
(2,193
|
)
|
||||||
|
Balance, December 31, 2016
|
$
|
8,909
|
|
$
|
238,164
|
|
$
|
247,073
|
|
|||
Changes in the fair value of mortgage servicing rights due to market changes are included in Other operating revenue in the Consolidated Statements of Earnings. Changes in fair value due to loan runoff are included in Mortgage banking costs.
There is no active market for trading in mortgage servicing rights after origination. Fair value is determined by discounting the projected net cash flows. Significant assumptions used to determine fair value considered to be significant unobservable inputs were as follows:
|
December 31,
|
||||
|
|
2016
|
2015
|
||
|
Discount rate – risk-free rate plus a market premium
|
10.08%
|
10.11%
|
||
|
Prepayment rate - based upon loan interest rate, original term and loan type
|
8.98%-16.91%
|
7.41% - 23.88%
|
||
|
Loan servicing costs – annually per loan based upon loan type:
|
||||
|
Performing loans
|
$63 - $120
|
$63 - $105
|
||
|
Delinquent loans
|
$150 - $500
|
$150 - $500
|
||
|
Loans in foreclosure
|
$650 - $4,250
|
$650 - $4,250
|
||
|
Primary/secondary mortgage rate spread
|
105 bps
|
130 bps
|
||
|
Escrow earnings rate – indexed to rates paid on deposit accounts with comparable average life
|
1.98%
|
1.73%
|
||
Changes in primary residential mortgage interest rates directly affect the prepayment speeds used in valuing our mortgage servicing rights. A separate third party model is used to estimate prepayment speeds based on interest rates, housing turnover rates, estimated loan curtailment, anticipated defaults and other relevant factors. The prepayment model is updated periodically for changes in market conditions and adjusted to better correlate with actual performance of BOK Financial’s servicing portfolio.
The interest rate sensitivity of our mortgage servicing rights is modeled over a range of +/- 50 basis points. At
December 31, 2016
, a 50 basis point increase in mortgage interest rates is expected to increase the fair value of our mortgage servicing rights by
$25 million
. A 50 basis point decrease in mortgage interest rates is expected to decrease the fair value of our mortgage servicing rights by
$29 million
. In the model, changes in the value of servicing rights due to changes in interest rates assume stable relationships between residential mortgage rates and prepayment speeds. Changes in market conditions can cause variations from these assumptions. These factors and others may cause changes in the value of our mortgage servicing rights to differ from our expectations.
134
The aging status of our mortgage loans serviced for others by investor at
December 31, 2016
follows (in thousands):
|
|
|
Past Due
|
|
|||||||||||||||||
|
|
Current
|
30 to 59
Days
|
60 to 89
Days
|
90 Days or More
|
Total
|
|||||||||||||||
|
FHLMC
|
$
|
7,950,818
|
|
$
|
52,434
|
|
$
|
9,812
|
|
$
|
25,670
|
|
$
|
8,038,734
|
|
|||||
|
FNMA
|
6,922,833
|
|
44,532
|
|
11,233
|
|
21,486
|
|
7,000,084
|
|
||||||||||
|
GNMA
|
6,304,914
|
|
181,669
|
|
56,534
|
|
22,471
|
|
6,565,588
|
|
||||||||||
|
Other
|
390,109
|
|
763
|
|
351
|
|
1,939
|
|
393,162
|
|
||||||||||
|
Total
|
$
|
21,568,674
|
|
$
|
279,398
|
|
$
|
77,930
|
|
$
|
71,566
|
|
$
|
21,997,568
|
|
|||||
The Company has off-balance sheet credit risk related to first lien, fixed-rate residential mortgage loans sold to U.S. government agencies with recourse prior to 2008 under various community development programs. The Company no longer sells residential mortgage loans with recourse other than obligations under standard representations and warranties. The recourse obligation relates to loan performance for the life of the loan. The principal balance of residential mortgage loans sold subject to recourse obligations totaled
$139 million
at
December 31, 2016
and
$155 million
at
December 31, 2015
. A separate accrual for these off-balance sheet commitments is included in Other liabilities in the Consolidated Balance Sheets. The provision for credit losses on loans sold with recourse is included in Mortgage banking costs in the Consolidated Statements of Earnings.
The activity in the accrual for losses on loans sold with recourse included in Other liabilities in the Consolidated Balance Sheets is summarized as follows (in thousands):
|
Year Ended
|
|||||||||||
|
|
2016
|
2015
|
2014
|
||||||||
|
Beginning balance
|
$
|
4,649
|
|
$
|
7,299
|
|
$
|
9,562
|
|
||
|
Provision for recourse losses
|
725
|
|
(982
|
)
|
354
|
|
|||||
|
Loans charged off, net
|
(1,358
|
)
|
(1,668
|
)
|
(2,617
|
)
|
|||||
|
Ending balance
|
$
|
4,016
|
|
$
|
4,649
|
|
$
|
7,299
|
|
||
The Company also has off-balance sheet obligations to repurchase or provide indemnification for residential mortgage loans sold to government sponsored entities due to standard representations and warranties made under contractual agreements. The Company has established an accrual for credit losses related to potential loan repurchases under representations and warranties and related servicing expenses that is included in Other liabilities in the Consolidated Balance Sheets and in Mortgage banking costs in the Consolidated Statements of Earnings. In
2016
, the Company repurchased
18
loans from the agencies for
$3.9 million
and paid indemnification for
7
loans. Losses on both repurchases and indemnifications were insignificant.
A summary of unresolved deficiency requests from the agencies follows (in thousands, except for number of unresolved deficiency requests):
|
December 31,
|
|||||||
|
2016
|
2015
|
||||||
|
Number of unresolved deficiency requests
|
233
|
|
198
|
|
|||
|
Aggregate outstanding principal balance subject to unresolved deficiency requests
|
$
|
17,382
|
|
$
|
15,624
|
|
|
|
Unpaid principal balance subject to indemnification by the Company
|
5,803
|
|
4,365
|
|
|||
The activity in the accruals for mortgage losses related to repurchases is summarized as follows (in thousands).
|
|
December 31,
|
||||||
|
|
2016
|
2015
|
|||||
|
Beginning balance
|
$
|
3,359
|
|
$
|
3,220
|
|
|
|
Provision for losses
|
27
|
|
353
|
|
|||
|
Charge-offs, net
|
(598
|
)
|
(214
|
)
|
|||
|
Ending balance
|
$
|
2,788
|
|
$
|
3,359
|
|
|
135
(
8
)
Deposits
Interest expense on deposits is summarized as follows (in thousands):
|
Year Ended December 31,
|
||||||||||||
|
|
2016
|
2015
|
2014
|
|||||||||
|
Transaction deposits
|
$
|
13,906
|
|
$
|
8,821
|
|
$
|
9,757
|
|
|||
|
Savings
|
386
|
|
383
|
|
401
|
|
||||||
|
Time:
|
||||||||||||
|
Certificates of deposits under $100,000
|
8,776
|
|
11,894
|
|
14,278
|
|
||||||
|
Certificates of deposits $100,000 and over
|
10,123
|
|
10,643
|
|
11,878
|
|
||||||
|
Other time deposits
|
7,303
|
|
12,429
|
|
14,369
|
|
||||||
|
Total time
|
26,202
|
|
34,966
|
|
40,525
|
|
||||||
|
Total
|
$
|
40,494
|
|
$
|
44,170
|
|
$
|
50,683
|
|
|||
The aggregate amounts of time deposits in denominations of $250,000 or more at
December 31, 2016
and
2015
were $
866 million
and $
905 million
, respectively.
Time deposit maturities are as follows:
2017
– $
1.3 billion
,
2018
– $
340 million
,
2019
– $
71 million
,
2020
– $
94 million
,
2021
– $
114 million
and $
342 million
thereafter.
At
December 31, 2016
and
2015
, the Company had
$417 million
and
$358 million
, respectively, in fixed rate, brokered certificates of deposits. The weighted-average interest rate paid on these certificates was
1.33%
in
2016
and
1.48%
in
2015
.
The aggregate amount of overdrawn customer transaction deposits that have been reclassified as loan balances was $
9.7 million
at
December 31, 2016
and $
5.3 million
at
December 31, 2015
.
136
(
9
)
Other Borrowings
Information relating to other borrowings is summarized as follows (dollars in thousands):
|
|
As of
|
Year Ended
|
||||||||||||||||
|
December 31, 2016
|
December 31, 2016
|
|||||||||||||||||
|
Balance
|
Rate
|
Average Balance
|
Rate
|
Maximum
Outstanding At Any Month End |
||||||||||||||
|
Parent company and other non-bank subsidiaries:
|
|
|
|
|||||||||||||||
|
Trust preferred debt
|
$
|
7,217
|
|
3.28
|
%
|
$
|
611
|
|
3.27
|
%
|
$
|
7,217
|
|
|||||
|
Other
|
1,092
|
|
8.27
|
%
|
2,073
|
|
16.11
|
%
|
3,157
|
|
||||||||
|
Total other borrowings
|
8,309
|
|
2,684
|
|
13.19
|
%
|
||||||||||||
|
Subordinated debentures
|
144,640
|
|
5.60
|
%
|
74,428
|
|
5.59
|
%
|
$
|
145,393
|
|
|||||||
|
Total parent company and other non-bank subsidiaries
|
152,949
|
|
77,112
|
|
5.86
|
%
|
||||||||||||
|
BOKF, NA:
|
||||||||||||||||||
|
Funds purchased
|
57,929
|
|
0.38
|
%
|
78,222
|
|
0.24
|
%
|
567,103
|
|
||||||||
|
Repurchase agreements
|
668,661
|
|
0.02
|
%
|
589,145
|
|
0.04
|
%
|
668,661
|
|
||||||||
|
Other borrowings:
|
||||||||||||||||||
|
Federal Home Loan Bank advances
|
4,800,000
|
|
0.72
|
%
|
5,985,656
|
|
0.55
|
%
|
6,500,000
|
|
||||||||
|
GNMA repurchase liability
|
22,471
|
|
4.26
|
%
|
15,637
|
|
4.74
|
%
|
22,471
|
|
||||||||
|
Other
|
15,292
|
|
2.66
|
%
|
15,670
|
|
2.41
|
%
|
15,797
|
|
||||||||
|
Total other borrowings
|
4,837,763
|
|
6,016,963
|
|
0.57
|
%
|
||||||||||||
|
Subordinated debentures
|
—
|
|
—
|
%
|
140,414
|
|
1.35
|
%
|
226,434
|
|
||||||||
|
Total BOKF, NA
|
5,564,353
|
|
6,824,744
|
|
0.54
|
%
|
||||||||||||
|
Total other borrowed funds
|
$
|
5,717,302
|
|
$
|
6,901,856
|
|
0.60
|
%
|
||||||||||
137
|
|
As of
|
Year Ended
|
||||||||||||||||
|
December 31, 2015
|
December 31, 2015
|
|||||||||||||||||
|
Balance
|
Rate
|
Average Balance
|
Rate
|
Maximum
Outstanding At Any Month End |
||||||||||||||
|
Parent company and other non-bank subsidiaries:
|
||||||||||||||||||
|
Trust preferred debt
|
$
|
—
|
|
—
|
%
|
$
|
—
|
|
—
|
%
|
$
|
—
|
|
|||||
|
Other
|
—
|
|
—
|
%
|
—
|
|
—
|
%
|
—
|
|
||||||||
|
Total other borrowings
|
—
|
|
—
|
|
—
|
%
|
||||||||||||
|
Subordinated debentures
|
—
|
|
—
|
%
|
—
|
|
—
|
%
|
—
|
|
||||||||
|
Total parent company and other non-bank subsidiaries
|
—
|
|
—
|
|
—
|
%
|
||||||||||||
|
BOKF, NA:
|
||||||||||||||||||
|
Funds purchased
|
491,192
|
|
0.15
|
%
|
73,219
|
|
0.09
|
%
|
491,192
|
|
||||||||
|
Repurchase agreements
|
722,444
|
|
0.02
|
%
|
623,921
|
|
0.04
|
%
|
1,008,144
|
|
||||||||
|
Other borrowings:
|
||||||||||||||||||
|
Federal Home Loan Bank advances
|
4,800,000
|
|
0.48
|
%
|
4,921,739
|
|
0.28
|
%
|
5,000,000
|
|
||||||||
|
GNMA repurchase liability
|
19,478
|
|
4.75
|
%
|
16,668
|
|
4.95
|
%
|
19,478
|
|
||||||||
|
Other
|
18,402
|
|
2.70
|
%
|
18,768
|
|
2.35
|
%
|
26,058
|
|
||||||||
|
Total other borrowings
|
4,837,880
|
|
4,957,175
|
|
0.33
|
%
|
||||||||||||
|
Subordinated debentures
|
226,350
|
|
1.05
|
%
|
226,332
|
|
1.84
|
%
|
348,076
|
|
||||||||
|
Total BOKF, NA
|
6,277,866
|
|
5,880,647
|
|
0.36
|
%
|
||||||||||||
|
Total other borrowed funds
|
$
|
6,277,866
|
|
$
|
5,880,647
|
|
0.36
|
%
|
||||||||||
|
|
As of
|
Year Ended
|
||||||||||||||||
|
December 31, 2014
|
December 31, 2014
|
|||||||||||||||||
|
Balance
|
Rate
|
Average Balance
|
Rate
|
Maximum
Outstanding At Any Month End |
||||||||||||||
|
Parent company and other non-bank subsidiaries:
|
|
|
|
|||||||||||||||
|
Trust preferred debt
|
$
|
—
|
|
—
|
%
|
$
|
—
|
|
—
|
%
|
$
|
—
|
|
|||||
|
Other
|
—
|
|
—
|
%
|
—
|
|
—
|
%
|
—
|
|
||||||||
|
Total other borrowings
|
—
|
|
—
|
|
—
|
%
|
||||||||||||
|
Subordinated debentures
|
—
|
|
—
|
%
|
—
|
|
—
|
%
|
—
|
|
||||||||
|
Total parent company and other non-bank subsidiaries
|
—
|
|
—
|
|
—
|
%
|
||||||||||||
|
BOKF, NA:
|
||||||||||||||||||
|
Funds purchased
|
57,031
|
|
0.05
|
%
|
494,220
|
|
0.07
|
%
|
1,548,676
|
|
||||||||
|
Repurchase agreements
|
1,187,489
|
|
0.04
|
%
|
928,767
|
|
0.06
|
%
|
1,187,489
|
|
||||||||
|
Other borrowings:
|
||||||||||||||||||
|
Federal Home Loan Bank advances
|
2,103,400
|
|
0.25
|
%
|
1,894,966
|
|
0.24
|
%
|
3,453,400
|
|
||||||||
|
GNMA repurchase liability
|
14,298
|
|
5.05
|
%
|
17,343
|
|
5.20
|
%
|
24,980
|
|
||||||||
|
Other
|
16,076
|
|
2.73
|
%
|
16,433
|
|
2.32
|
%
|
16,582
|
|
||||||||
|
Total other borrowings
|
2,133,774
|
|
1,928,742
|
|
0.35
|
%
|
||||||||||||
|
Subordinated debentures
|
347,983
|
|
2.35
|
%
|
347,892
|
|
2.50
|
%
|
347,983
|
|
||||||||
|
Total BOKF, NA
|
3,726,277
|
|
3,699,621
|
|
0.43
|
%
|
||||||||||||
|
Total other borrowed funds
|
$
|
3,726,277
|
|
$
|
3,699,621
|
|
0.43
|
%
|
||||||||||
138
Aggregate annual principal repayments at
December 31, 2016
are as follows (in thousands):
|
Parent
Company and Other Non-bank Subsidiaries
|
BOKF, NA
|
|||||||
|
2017
|
$
|
—
|
|
$
|
5,549,587
|
|
||
|
2018
|
—
|
|
711
|
|
||||
|
2019
|
—
|
|
956
|
|
||||
|
2020
|
—
|
|
961
|
|
||||
|
2021
|
—
|
|
965
|
|
||||
|
Thereafter
|
152,949
|
|
11,173
|
|
||||
|
Total
|
$
|
152,949
|
|
$
|
5,564,353
|
|
||
Funds purchased are unsecured and generally mature within
one
to
ninety
days from the transaction date. Securities repurchase agreements are recorded as secured borrowings that generally mature within
ninety
days and are secured by certain available for sale securities. There was
no
outstanding accrued interest payable related to repurchase agreements at
December 31, 2016
or
December 31, 2015
.
Additional information relating to securities sold under agreements to repurchase and related liabilities at
December 31, 2016
and
2015
is as follows (dollars in thousands):
|
|
December 31, 2016
|
||||||||||||||
|
|
Amortized
|
Fair
|
Repurchase
|
Average
|
|||||||||||
|
Security Sold/Maturity
|
Cost
|
Value
|
Liability
1
|
Rate
|
|||||||||||
|
U.S. government agency mortgage-backed securities:
|
|
|
|
|
|||||||||||
|
Overnight
1
|
$
|
655,529
|
|
$
|
655,851
|
|
$
|
668,661
|
|
0.02
|
%
|
||||
|
Long-term
|
—
|
|
—
|
|
—
|
|
—
|
%
|
|||||||
|
Total Agency Securities
|
$
|
655,529
|
|
$
|
655,851
|
|
$
|
668,661
|
|
0.02
|
%
|
||||
|
|
December 31, 2015
|
||||||||||||||
|
|
Amortized
|
Fair
|
Repurchase
|
Average
|
|||||||||||
|
Security Sold/Maturity
|
Cost
|
Value
|
Liability
1
|
Rate
|
|||||||||||
|
U.S. government agency mortgage-backed securities:
|
|
|
|
|
|
|
|
|
|||||||
|
Overnight
1
|
$
|
685,458
|
|
$
|
688,485
|
|
$
|
722,444
|
|
0.02
|
%
|
||||
|
Long-term
|
—
|
|
—
|
|
—
|
|
—
|
%
|
|||||||
|
Total Agency Securities
|
$
|
685,458
|
|
$
|
688,485
|
|
$
|
722,444
|
|
0.02
|
%
|
||||
|
1
|
BOK Financial maintains control over the securities underlying overnight repurchase agreements and generally transfers control over securities underlying longer-term dealer repurchase agreements to the respective counterparty.
|
Borrowings from the Federal Home Loan Banks are used for funding purposes. In accordance with policies of the Federal Home Loan Banks, BOK Financial has granted a blanket pledge of eligible assets (generally unencumbered U.S. Treasury and residential mortgage-backed securities, 1-4 family loans and multifamily loans) as collateral for these advances. The Federal Home Loan Banks have issued letters of credit totaling
$242 million
to secure BOK Financial’s obligations to depositors of public funds. The unused credit available to BOK Financial at
December 31, 2016
pursuant to the Federal Home Loan Bank’s collateral policies is
$1.3 billion
.
In 2016, BOK Financial issued
$150 million
of subordinated debt that will mature on
June 30, 2056
. Interest on this debt bears an interest rate of
5.375%
, payable quarterly. On
June 30, 2021
, BOK Financial will have the option to redeem the debt at the principal amount plus accrued interest, subject to regulatory approval.
139
In conjunction with the acquisition of MBT, BOK Financial assumed
$7.2 million
of variable rate subordinated trust preferred. This trust preferred debt is callable prior to maturity on
September 17, 2033
and
December 15, 2036
, respectively, subject to regulatory approval. Interest is payable quarterly at
three-month LIBOR plus 2.95%
on
$3.1 million
and
three-month LIBOR plus 1.82%
on
$4.1 million
.
BOK Financial Securities, Inc. may borrow funds from Pershing, LLC ("Pershing"), a clearing broker/dealer and a wholly owned subsidiary of Bank of New York Mellon, for the purposes of financing securities purchases or to facilitate funding of investment banking activities, on terms to be negotiated at the time of the borrowing. BOK Financial Securities, Inc. had
no
borrowings from Pershing outstanding at
December 31, 2016
or
December 31, 2015
.
In 2007, BOKF, NA issued
$250 million
of subordinated debt due
May 15, 2017
. Interest on this debt was based upon a
fixed rate of 5.75% through May 14, 2012 and is based on a floating rate of three-month LIBOR plus 0.69% thereafter
. The proceeds of this debt were used to fund the Worth National Bank and First United Bank acquisitions and to fund continued asset growth. The outstanding balance of this subordinated debt was
$226 million
at
December 31, 2015
. The remaining outstanding balance was called during 2016.
The Company has a liability related to the repurchase of certain delinquent residential mortgage loans previously sold into GNMA mortgage pools. Interest is payable at rates contractually due to investors.
140
(
10
)
Federal and State Income Taxes
Deferred income taxes reflect the net tax effects of temporary differences between the carrying amounts of assets and liabilities for financial reporting purposes and the amounts used for income tax purposes. Significant components of deferred tax assets and liabilities are as follows (in thousands):
|
December 31,
|
|||||||
|
2016
|
2015
|
||||||
|
Deferred tax assets:
|
|||||||
|
Available for sale securities mark to market
|
$
|
5,779
|
|
$
|
—
|
|
|
|
Share-based compensation
|
9,360
|
|
10,522
|
|
|||
|
Credit loss allowances
|
99,191
|
|
88,906
|
|
|||
|
Valuation adjustments
|
12,222
|
|
6,957
|
|
|||
|
Deferred compensation
|
30,262
|
|
25,950
|
|
|||
|
Unearned fees
|
11,877
|
|
11,124
|
|
|||
|
Other
|
42,541
|
|
34,169
|
|
|||
|
Total deferred tax assets
|
211,232
|
|
177,628
|
|
|||
|
Deferred tax liabilities:
|
|||||||
|
Available for sale securities mark to market
|
—
|
|
14,828
|
|
|||
|
Depreciation
|
25,877
|
|
22,080
|
|
|||
|
Mortgage servicing rights
|
92,748
|
|
77,900
|
|
|||
|
Lease financing
|
17,923
|
|
22,301
|
|
|||
|
Other
|
45,363
|
|
41,904
|
|
|||
|
Total deferred tax liabilities
|
181,911
|
|
179,013
|
|
|||
|
Net deferred tax assets (liabilities)
|
$
|
29,321
|
|
$
|
(1,385
|
)
|
|
The Company determined that no valuation allowance was necessary on deferred tax assets as of
December 31, 2016
and
2015
.
The significant components of the provision for income taxes attributable to continuing operations for BOK Financial are shown below (in thousands):
|
Year Ended December 31,
|
|||||||||||
|
2016
|
2015
|
2014
|
|||||||||
|
Current income tax expense:
|
|||||||||||
|
Federal
|
$
|
107,379
|
|
$
|
117,566
|
|
$
|
95,289
|
|
||
|
State
|
11,028
|
|
12,397
|
|
9,392
|
|
|||||
|
Total current income tax expense
|
118,407
|
|
129,963
|
|
104,681
|
|
|||||
|
Deferred income tax expense:
|
|||||||||||
|
Federal
|
(11,340
|
)
|
8,397
|
|
36,521
|
|
|||||
|
State
|
(690
|
)
|
1,024
|
|
2,949
|
|
|||||
|
Total deferred income tax expense
|
(12,030
|
)
|
9,421
|
|
39,470
|
|
|||||
|
Total income tax expense
|
$
|
106,377
|
|
$
|
139,384
|
|
$
|
144,151
|
|
||
141
The reconciliations of income attributable to continuing operations at the U.S. federal statutory tax rate to income tax expense are as follows (in thousands):
|
Year Ended December 31,
|
|||||||||||
|
|
2016
|
2015
|
2014
|
||||||||
|
Amount:
|
|
|
|||||||||
|
Federal statutory tax
|
$
|
118,530
|
|
$
|
151,075
|
|
$
|
153,870
|
|
||
|
Tax exempt revenue
|
(10,544
|
)
|
(9,553
|
)
|
(8,446
|
)
|
|||||
|
Effect of state income taxes, net of federal benefit
|
6,478
|
|
9,082
|
|
9,054
|
|
|||||
|
Utilization of tax credits:
|
|||||||||||
|
Low-income housing tax credits, net of amortization
|
(4,171
|
)
|
(3,874
|
)
|
(2,953
|
)
|
|||||
|
Other tax credits
|
(2,085
|
)
|
(2,085
|
)
|
(2,109
|
)
|
|||||
|
Bank-owned life insurance
|
(2,911
|
)
|
(3,264
|
)
|
(3,183
|
)
|
|||||
|
Other, net
|
1,080
|
|
(1,997
|
)
|
(2,082
|
)
|
|||||
|
Total income tax expense
|
$
|
106,377
|
|
$
|
139,384
|
|
$
|
144,151
|
|
||
|
Year Ended December 31,
|
||||||||
|
|
2016
|
2015
|
2014
|
|||||
|
Percent of pretax income:
|
|
|
||||||
|
Federal statutory tax
|
35.0
|
%
|
35.0
|
%
|
35.0
|
%
|
||
|
Tax exempt revenue
|
(3.1
|
)
|
(2.2
|
)
|
(1.9
|
)
|
||
|
Effect of state income taxes, net of federal benefit
|
1.9
|
|
2.1
|
|
2.1
|
|
||
|
Utilization of tax credits:
|
||||||||
|
Low-income housing tax credits, net of amortization
|
(1.2
|
)
|
(0.9
|
)
|
(0.7
|
)
|
||
|
Other tax credits
|
(0.6
|
)
|
(0.5
|
)
|
(0.5
|
)
|
||
|
Bank-owned life insurance
|
(0.9
|
)
|
(0.7
|
)
|
(0.7
|
)
|
||
|
Other, net
|
0.3
|
|
(0.5
|
)
|
(0.5
|
)
|
||
|
Total
|
31.4
|
%
|
32.3
|
%
|
32.8
|
%
|
||
A reconciliation of the beginning and ending amount of unrecognized tax benefits is as follows (in thousands):
|
2016
|
2015
|
2014
|
|||||||||
|
Balance as of January 1
|
$
|
13,232
|
|
$
|
13,374
|
|
$
|
12,058
|
|
||
|
Additions for tax for current year positions
|
5,640
|
|
2,226
|
|
3,813
|
|
|||||
|
Settlements during the period
|
—
|
|
—
|
|
—
|
|
|||||
|
Lapses of applicable statute of limitations
|
(3,031
|
)
|
(2,368
|
)
|
(2,497
|
)
|
|||||
|
Balance as of December 31
|
$
|
15,841
|
|
$
|
13,232
|
|
$
|
13,374
|
|
||
Of the above unrecognized tax benefits,
$10.3 million
, if recognized, would have affected the effective tax rate.
BOK Financial recognizes interest and penalties accrued related to unrecognized tax benefits in income tax expense. The Company recognized
$1.0 million
for
2016
,
$1.0 million
for
2015
and
$1.5 million
for
2014
in interest and penalties. The Company had approximately
$3.5 million
and
$3.3 million
accrued for the payment of interest and penalties at
December 31, 2016
and
2015
, respectively. Federal statutes remain open for federal tax returns filed in the previous
three
reporting periods. Various state income tax statutes remain open for the previous
three
to
six
reporting periods.
142
(
11
)
Employee Benefits
BOK Financial sponsors a defined benefit cash balance Pension Plan for all employees who satisfy certain age and service requirements. Pension Plan benefits were curtailed as of April 1, 2006. No participants may be added to the plan and no additional service benefits will be accrued. During 2016 and 2015, interest accrued on employees' account balances at a variable rate tied to the five-year trailing average of five-year U.S. Treasury securities plus
1.5%
. The rate has a floor of
3.0%
and a ceiling of
5.0%
. The 2016 quarterly variable rates remained at
3.00%
.
The following table presents information regarding this plan (in thousands):
|
|
December 31,
|
|||||||
|
|
2016
|
2015
|
||||||
|
Change in projected benefit obligation:
|
|
|
||||||
|
Projected benefit obligation at beginning of year
|
$
|
38,797
|
|
$
|
45,224
|
|
||
|
Interest cost
|
1,309
|
|
1,487
|
|
||||
|
Actuarial loss (gain)
|
(55
|
)
|
(2,702
|
)
|
||||
|
Benefits paid
|
(5,087
|
)
|
(5,212
|
)
|
||||
|
Projected benefit obligation at end of year
1,2
|
$
|
34,964
|
|
$
|
38,797
|
|
||
|
Change in plan assets:
|
|
|
||||||
|
Plan assets at fair value at beginning of year
|
$
|
44,190
|
|
$
|
49,443
|
|
||
|
Actual return on plan assets
|
2,666
|
|
(41
|
)
|
||||
|
Benefits paid
|
(5,087
|
)
|
(5,212
|
)
|
||||
|
Plan assets at fair value at end of year
|
$
|
41,769
|
|
$
|
44,190
|
|
||
|
Funded status of the plan
|
$
|
6,805
|
|
$
|
5,393
|
|
||
|
Components of net periodic benefit costs:
|
|
|
||||||
|
Interest cost
|
$
|
1,309
|
|
$
|
1,487
|
|
||
|
Expected return on plan assets
|
(2,167
|
)
|
(2,706
|
)
|
||||
|
Other
|
(741
|
)
|
1,849
|
|
||||
|
Net benefit cost
|
$
|
(1,599
|
)
|
$
|
630
|
|
||
|
1
|
Projected benefit obligation equals accumulated benefit obligation.
|
|
2
|
Projected benefit obligation is based on January 1 measurement date.
|
|
Weighted-average assumptions as of December 31:
|
2016
|
2015
|
||||
|
Discount rate
|
3.43
|
%
|
3.54
|
%
|
||
|
Expected return on plan assets
|
5.00
|
%
|
5.00
|
%
|
||
As of
December 31, 2016
, expected future benefit payments related to the Pension Plan were as follows (in thousands):
|
2017
|
$
|
2,706
|
|
|
2018
|
3,072
|
|
|
|
2019
|
3,402
|
|
|
|
2020
|
3,090
|
|
|
|
2021
|
2,934
|
|
|
|
Thereafter
|
28,044
|
|
|
|
Total estimated future benefit payments
|
$
|
43,248
|
|
143
Assets of the Pension Plan consist primarily of shares in the Cavanal Hill Active Core Fund. The stated objective of this fund is to provide an attractive total return with a well-balanced mix of equities and bonds. The typical portfolio mix is approximately
60%
equities and
40%
bonds. The net asset value of shares in the Cavanal Hill Funds is reported daily based on market quotations for the Fund’s securities. Management considers the Fund's recent and long-term performance as indicators when setting the expected return on plan assets. As of
December 31, 2016
, the expected return on plan assets for 2017 is
5.00%
. The maximum tax deductible Pension Plan contribution for
2016
was
$12 million
. No minimum contribution was required for
2016
,
2015
or
2014
.
Employee contributions to the Thrift Plan are eligible for Company matching equal to
6%
of base compensation, as defined in the plan. The Company-provided matching contribution rates range from
50%
for employees with less than
4
years of service to
200%
for employees with
15
or more years of service. Additionally, a maximum Company-provided, non-elective annual contribution of up to
$750
per participant is provided for employees whose annual base compensation is less than
$40,000
. Total non-elective contributions were
$530 thousand
for
2016
,
$605 thousand
for
2015
and
$662 thousand
for
2014
.
Participants may direct investments in their accounts to a variety of options, including a BOK Financial common stock fund and Cavanal Hill funds. Employer contributions, which are invested in accordance with the participant’s investment options, vest over
five
years. Thrift Plan expenses were
$22.4 million
for
2016
,
$20.6 million
for
2015
and
$18.6 million
for
2014
.
BOK Financial offers numerous incentive compensation plans that are aligned with the Company’s growth strategy. Compensation awarded under these plans may be based on defined formulas, other performance criteria or discretionary. Incentive compensation is designed to motivate and reinforce sales and customer service behavior in all markets. Earnings were charged
$128.1 million
in
2016
,
$114.3 million
in
2015
, and
$111.7 million
in
2014
for cash incentive compensation.
144
(
12
)
Share-Based Compensation Plans
The shareholders and Board of Directors of BOK Financial have approved various share-based compensation plans. An independent compensation committee of the Board of Directors determines the number of awards granted to the Chief Executive Officer and other senior executives. Share-based compensation is granted to other officers and employees as determined by the Chief Executive Officer.
The following table presents stock options outstanding during
2016
,
2015
and
2014
under these plans (in thousands, except for per share data):
|
Number
|
Weighted-
Average
Exercise
Price
|
Aggregate
Intrinsic
Value
|
|||||||||
|
Options outstanding at December 31, 2013
|
1,135,105
|
|
$
|
49.09
|
|
$
|
19,564
|
|
|||
|
Options awarded
|
—
|
|
—
|
|
|||||||
|
Options exercised
|
(323,004
|
)
|
49.17
|
|
|||||||
|
Options forfeited
|
(15,509
|
)
|
45.71
|
|
|||||||
|
Options expired
|
(2,701
|
)
|
47.98
|
|
|||||||
|
Options outstanding at December 31, 2014
|
793,891
|
|
49.05
|
|
8,725
|
|
|||||
|
Options awarded
|
—
|
|
—
|
|
|||||||
|
Options exercised
|
(286,678
|
)
|
47.86
|
|
|||||||
|
Options forfeited
|
(22,304
|
)
|
48.90
|
|
|||||||
|
Options expired
|
(4,874
|
)
|
51.32
|
|
|||||||
|
Options outstanding at December 31, 2015
|
480,035
|
|
49.75
|
|
4,821
|
|
|||||
|
Options awarded
|
—
|
|
—
|
|
|||||||
|
Options exercised
|
(249,404
|
)
|
47.60
|
|
|||||||
|
Options forfeited
|
(4,098
|
)
|
55.44
|
|
|||||||
|
Options expired
|
(8,009
|
)
|
53.43
|
|
|||||||
|
Options outstanding at December 31, 2016
|
218,524
|
|
$
|
51.95
|
|
$
|
6,793
|
|
|||
|
Options vested at:
|
|||||||||||
|
December 31, 2014
|
347,633
|
|
$
|
48.85
|
|
$
|
3,889
|
|
|||
|
December 31, 2015
|
243,395
|
|
48.17
|
2,829
|
|
||||||
|
December 31, 2016
|
93,117
|
|
46.22
|
3,429
|
|
||||||
The following table summarizes information concerning currently outstanding and vested stock options:
|
Options Outstanding
|
Options Vested
|
|||||||||||||
|
|
|
Weighted
|
|
|
|
Weighted
|
||||||||
|
|
|
Average
|
Weighted
|
|
Weighted
|
Average
|
||||||||
|
|
Remaining
|
Average
|
|
Average
|
Remaining
|
|||||||||
|
Exercise
|
Number
|
Contractual
|
Exercise
|
Number
|
Exercise
|
Contractual
|
||||||||
|
Prices
|
Outstanding
|
Life (years)
|
Price
|
Vested
|
Price
|
Life (years)
|
||||||||
|
$36.65
|
36,722
|
|
1.45
|
$36.65
|
36,722
|
|
$36.65
|
1.45
|
||||||
|
48.30
|
14,208
|
|
2.32
|
48.30
|
6,906
|
|
48.30
|
1.57
|
||||||
|
48.46
|
21,138
|
|
0.81
|
48.46
|
21,138
|
|
48.46
|
0.81
|
||||||
|
54.33
|
3,628
|
|
0.03
|
54.33
|
3,628
|
|
54.33
|
0.03
|
||||||
|
55.74
|
51,570
|
|
4.28
|
55.74
|
5,008
|
|
55.74
|
2.03
|
||||||
|
55.94
|
48,800
|
|
3.08
|
55.94
|
12,260
|
|
55.94
|
1.72
|
||||||
|
58.76
|
42,458
|
|
3.62
|
58.76
|
7,455
|
|
58.76
|
1.70
|
||||||
The aggregate intrinsic value of options exercised was $
6.2 million
for
2016
, $
5.1 million
for
2015
and $
5.5 million
for
2014
.
145
No options were granted in 2016, 2015 or 2014. Compensation expense recognized on stock options totaled $
254 thousand
for
2016
, $
362 thousand
for
2015
and $
826 thousand
for
2014
. Compensation cost of stock options granted that may be recognized as compensation expense in future years totaled $
229 thousand
at
December 31, 2016
.
The following represents a summary of the non-vested stock awards as of
December 31, 2016
(in thousands):
|
|
Shares
|
Weighted
Average
Grant Date
Fair Value
|
|||
|
Non-vested at January 1, 2014
|
647,989
|
|
|||
|
Granted
|
206,621
|
|
$64.96
|
||
|
Vested
|
(140,820
|
)
|
$44.56
|
||
|
Forfeited
|
(25,179
|
)
|
$56.26
|
||
|
Non-vested at December 31, 2014
|
688,611
|
|
|||
|
Granted
|
312,755
|
|
$57.66
|
||
|
Vested
|
(114,045
|
)
|
$50.15
|
||
|
Forfeited
|
(96,212
|
)
|
$58.33
|
||
|
Non-vested at December 31, 2015
|
791,109
|
|
|||
|
Granted
|
256,670
|
|
$55.35
|
||
|
Vested
|
(213,941
|
)
|
$55.87
|
||
|
Forfeited
|
(47,132
|
)
|
$57.86
|
||
|
Non-vested at December 31, 2016
|
786,706
|
|
|||
Compensation expense recognized on non-vested shares totaled
$10.2 million
for
2016
,
$12.0 million
for
2015
and
$10.0 million
for
2014
. Unrecognized compensation cost of non-vested shares totaled $
14.1 million
at
December 31, 2016
. Subject to adjustment for forfeitures and changes in the fair value of
293,110
shares awarded under the Executive Incentive Plan, we expect to recognize compensation expense of $
9.3 million
in
2017
, $
4.7 million
in
2018
, and $
89 thousand
in
2019
.
During January 2017, BOK Financial awarded
170,785
shares of non-vested stock with a fair value per award of
$83.50
. The aggregate compensation cost of these awards totaled approximately $
14.3 million
.
146
(
13
)
Related Parties
In compliance with applicable banking regulations, the Company may extend credit to certain executive officers, directors, principal shareholders and their affiliates (collectively referred to as “related parties”) in the ordinary course of business. The Company’s loans to related parties do not involve more than the normal credit risk and there are no nonaccruing or impaired related party loans outstanding at
December 31, 2016
or
2015
.
Activity in loans to related parties is summarized as follows (in thousands):
|
Year Ended December 31,
|
||||||||
|
|
2016
|
2015
|
||||||
|
Beginning balance
|
$
|
594,225
|
|
$
|
103,395
|
|
||
|
Advances
|
884,511
|
|
3,582,384
|
|
||||
|
Payments
|
(1,123,747
|
)
|
(3,104,004
|
)
|
||||
|
Adjustments
1
|
(218,044
|
)
|
12,450
|
|
||||
|
Ending balance
|
$
|
136,945
|
|
$
|
594,225
|
|
||
|
1
|
Adjustments generally consist of changes in status as a related party.
|
As defined by banking regulations, loan commitments and equity investments to a single affiliate may not exceed
10%
of unimpaired capital and surplus and loan commitments and equity investments to all affiliates may not exceed
20%
of unimpaired capital and surplus. All loans to affiliates must be fully secured by eligible collateral. At
December 31, 2016
, loan commitments and equity investments were limited to
$287 million
to a single affiliate and
$573 million
to all affiliates. The largest loan commitment and equity investment to a single affiliate was
$220 million
and the aggregate loan commitments and equity investments to all affiliates were
$337 million
. The largest outstanding amount to a single affiliate at
December 31, 2016
was
$24 million
and the total outstanding amounts to all affiliates were
$39 million
. At
December 31, 2015
, total loan commitments and equity investments to all affiliates were
$330 million
and the total outstanding amounts to all affiliates were
$244 million
.
Certain related parties are customers of the Company for services other than loans, including consumer banking, corporate banking, risk management, wealth management, brokerage and trading, or fiduciary/trust services. The Company engages in transactions with related parties in the ordinary course of business in compliance with applicable regulations.
The Company rents office space in facilities owned by affiliates of Mr. Kaiser, its Chairman and principal shareholder. Lease payments totaled
$1.1 million
for 2016,
$975 thousand
for 2015 and
$1.1 million
for 2014.
During 2016, the Company agreed to purchase approximately
$7.5 million
of Oklahoma Historic State Income Tax Credits from the George Kaiser Family Foundation, a principal shareholder of BOKF. In the fourth quarter,
$3.8 million
of these tax credits were purchased and reduced the Company's state liability for 2016. The remaining credits when purchased will be used to reduce the Company's state income tax liability in 2017.
Cavanal Hill Investment Management, Inc., a wholly-owned subsidiary of BOKF, NA, is the administrator to and investment advisor for the Cavanal Hill Funds (the "Funds"), a diversified, open-ended investment company established as a business trust under the Investment Company Act of 1940 (the "1940 Act"). BOKF, NA is custodian and BOK Financial Securities, Inc. is distributor for the Funds. The Funds’ products are offered to customers, employee benefit plans, trusts and the general public in the ordinary course of business. Approximately
94%
of the Funds’ assets of $
3.8
billion are held for the Company's clients. A Company executive officer serves on the Funds' board of trustees and officers of BOKF, NA serve as president and secretary of the Funds. A majority of the members of the Funds’ board of trustees are, however, independent of the Company and the Funds are managed by its board of trustees.
147
(
14
)
Commitments and Contingent Liabilities
Litigation Contingencies
As a member of Visa, BOK Financial is obligated for a proportionate share of certain covered litigation losses incurred by Visa under a retrospective responsibility plan. A contingent liability was recognized for the Company’s share of Visa’s covered litigation liabilities. Visa funded an escrow account to cover litigation claims, including covered litigation losses under the retrospective responsibility plan, with proceeds from its initial public offering in 2008 and from available cash.
BOK Financial currently owns
252,233
Visa Class B shares which are convertible into
415,755
shares of Visa Class A shares after the final settlement of all covered litigation. Class B shares may be diluted in the future if the escrow fund is not adequate to cover future covered litigation costs. Therefore, no value has been currently assigned to the Class B shares and no value may be assigned until the Class B shares are converted into a known number of Class A shares.
On March 3, 2015, BOKF, NA and the Company were named as defendants in a class action alleging (1) that the manner in which the Bank posted charges to its consumer deposit accounts was improper from September 1, 2011 through July 8, 2014, the period after which the Bank and BOK Financial had settled a class action respecting a similar claim, and before it made changes to its posting order and (2) that the manner in which the Bank posted charges to its small business deposit accounts was improper from July 9, 2009 through July 8, 2014. Following mediation of the case in August 2016, the Class Representatives and the Bank reached a settlement of the action for
$7.8 million
. The settlement is subject to the approval of the Court which the Parties to the Action expect. The Company has funded the settlement.
On June 24, 2015, the Bank received a complaint alleging that an employee had colluded with a bond issuer and an individual in misusing revenues pledged to municipal bonds for which the Bank served as trustee under the bond indenture. The Company conducted an investigation and concluded that employees in one of its Corporate Trust offices had, with respect to a single group of affiliated bond issuances, violated Company policies and procedures by waiving financial covenants, granting forbearances and accepting without disclosure to the bondholders, debt service payments from sources other than pledged revenues. The relationship manager was terminated. The Company reported the circumstances to, and cooperated with an investigation by, the Securities and Exchange Commission ("SEC"). On December 28, 2015, in an action brought by the SEC, the United States District Court for the District of New Jersey entered a judgment against the principals involved in the issuing the bonds, precluding the principals from denying the alleged violations of the federal securities laws and requiring the principals to pay all outstanding principal, accrued interest, and other amounts required under the bond documents (estimated to be approximately
$73 million
, less the value of the facilities securing repayment of the bonds), subject to oversight by a court appointed monitor. On September 7, 2016, the Bank agreed, and the SEC entered, a consent order finding that the Bank had violated Section 17(a) of the Securities Act of 1933 and Section 10(b) of the Securities Exchange Act and requiring the Bank to disgorge
$1,067,721
of fees and pay a civil penalty of
$600,000
. The Bank has disgorged the fees and paid the penalty. On January 7, 2016, the terminated employee filed an action against the Bank alleging the Bank defamed the employee and made a demand for indemnification respecting the SEC investigation which demand the respective boards of directors of the Company and the Bank denied. On September 26, 2016, the employee dismissed the action without prejudice. On September 9, 2016, the SEC filed a complaint against the terminated employee alleging the employee violated Section 17(a) of the Securities Act of 1933 and Section 10(b) of the Securities Exchange Act and requiring the employee to disgorge ill-gotten gains. The SEC and the terminated employee have advised the Court that a settlement has been reached subject to approval by the Commission. On August 26, 2016, the Bank was sued in the United States District Court for New Jersey by
two
bondholders in a putative class action on behalf of all holders of the bonds alleging the Bank participated in the fraudulent sale of securities by the principals. On September 14, 2016, the Bank was sued in the District Court of Tulsa County, Oklahoma by
19
bondholders alleging the Bank participated in the fraudulent sale of securities by the principals. Management has been advised by counsel that the Bank has valid defenses to the claims. The Bank expects the Court ordered payment plan will result in the payment of the bonds by the principals. Accordingly, no loss is probable at this time and no provision for loss has been made. If the payment plan does not result in payment of the bonds, a loss could become probable. A reasonable estimate cannot be made at this time though the amount could be material to the Company.
The Director of the New Mexico Securities Division of the State of New Mexico Regulation and Licensing Department ("the Director") issued a Notice of Contemplated Action in connection with the purchase of various municipal bonds by the elected County Treasurer of Bernalillo County, New Mexico, from BOK Financial Securities, Inc., the Company’s broker-dealer affiliate. The Notice was settled by a
$125,000
payment to the Division’s Educational fund, without any fine, penalty or sanction. The County of Bernalillo, New Mexico, has commenced arbitration pursuant to the Arbitration Rules of FINRA seeking recovery of
$5.6 million
arising out of the purchase. The Company has been advised that any recovery by the County is remote.
148
In the ordinary course of business, BOK Financial and its subsidiaries are subject to legal actions and complaints. Management believes, based upon the opinion of counsel, that the actions and liability or loss, if any, resulting from the final outcomes of the proceedings, will not have a material effect on the Company’s financial condition, results of operations or cash flows.
Alternative Investment Commitments
The Company sponsors
two
private equity funds and invests in several tax credit entities and other funds as permitted by banking regulations. Consolidation of these investments is based on the variable interest model determined by the nature of the entity. Variable interest entities are generally defined as entities that either do not have sufficient equity to finance their activities without support from other parties or whose equity investors lack a controlling financial interest. Variable interest entities are consolidated based on the determination that the Company is the primary beneficiary including the power to direct the activities that most significantly impact the variable interest's economic performance and the obligation to absorb losses of the variable interest or the right to receive benefits of the variable interest that could be significant to the variable interest.
BOKF Equity, LLC, an indirect wholly-owned subsidiary, is the general partner of
two
consolidated private equity funds (“the Funds”). The Funds provide alternative investment opportunities to certain customers, some of which are related parties, through unaffiliated limited partnerships. These unaffiliated limited partnerships generally invest in distressed assets, asset buy-outs or venture capital companies. As general partner, BOKF Equity, LLC has the power to direct activities that most significantly affect the Funds' performance and contingent obligations to make additional investments totaling
$2.6 million
at
December 31, 2016
. Substantially all of the obligations are offset by limited partner commitments. The Company does not accrue its contingent liability to fund investments. The Volcker Rule in Title VI of the Dodd-Frank Act will limit both the amount and structure of these type of investments.
Consolidated tax credit entities represent the Company's interest in entities earning federal new market tax credits related to qualifying loans for which the Company has the power to direct the activities that most significantly impact the variable interest's economic performance of the entity including being the primary beneficiary of or the obligation to absorb losses of the variable interest that could be significant to the variable interest. The creditors underlying the other borrowings of consolidated tax credit entities do not have recourse to the general credit of BOKF.
The Company also has interests in various unrelated alternative investments generally consisting of unconsolidated limited partnership interests in or loans to entities for which investment return is in the form of tax credits or that invest in distressed real estate loans and properties, energy development, venture capital and other activities. The Company is prohibited by banking regulations from controlling or actively managing the activities of these investments and the Company's maximum exposure to loss is restricted to its investment balance. The Company's obligation to fund alternative investments is included in Other liabilities in the Consolidated Balance Sheets.
A summary of consolidated and unconsolidated alternative investments as of
December 31, 2016
and
December 31, 2015
is as follows (in thousands):
|
December 31, 2016
|
||||||||||||||||||||
|
Loans
|
Other
Assets
|
Other
Liabilities
|
Other
Borrowings
|
Non-controlling
Interests
|
||||||||||||||||
|
Consolidated:
|
||||||||||||||||||||
|
Private equity funds
|
$
|
—
|
|
$
|
17,357
|
|
$
|
—
|
|
$
|
—
|
|
$
|
13,237
|
|
|||||
|
Tax credit entities
|
10,000
|
|
11,585
|
|
—
|
|
10,964
|
|
10,000
|
|
||||||||||
|
Other
|
—
|
|
29,783
|
|
3,189
|
|
1,092
|
|
8,266
|
|
||||||||||
|
Total consolidated
|
$
|
10,000
|
|
$
|
58,725
|
|
$
|
3,189
|
|
$
|
12,056
|
|
$
|
31,503
|
|
|||||
|
Unconsolidated:
|
||||||||||||||||||||
|
Tax credit entities
|
$
|
44,488
|
|
$
|
143,715
|
|
$
|
63,329
|
|
$
|
—
|
|
$
|
—
|
|
|||||
|
Other
|
—
|
|
31,675
|
|
15,028
|
|
—
|
|
—
|
|
||||||||||
|
Total unconsolidated
|
$
|
44,488
|
|
$
|
175,390
|
|
$
|
78,357
|
|
$
|
—
|
|
$
|
—
|
|
|||||
149
|
December 31, 2015
|
||||||||||||||||||||
|
Loans
|
Other
Assets |
Other
Liabilities |
Other
Borrowings |
Non-controlling
Interests |
||||||||||||||||
|
Consolidated:
|
||||||||||||||||||||
|
Private equity funds
|
$
|
—
|
|
$
|
22,472
|
|
$
|
—
|
|
$
|
—
|
|
$
|
17,823
|
|
|||||
|
Tax credit entities
|
10,000
|
|
12,206
|
|
—
|
|
10,964
|
|
10,000
|
|
||||||||||
|
Other
|
—
|
|
40,453
|
|
2,198
|
|
2,831
|
|
9,260
|
|
||||||||||
|
Total consolidated
|
$
|
10,000
|
|
$
|
75,131
|
|
$
|
2,198
|
|
$
|
13,795
|
|
$
|
37,083
|
|
|||||
|
Unconsolidated:
|
||||||||||||||||||||
|
Tax credit entities
|
$
|
16,916
|
|
$
|
85,274
|
|
$
|
14,572
|
|
$
|
—
|
|
$
|
—
|
|
|||||
|
Other
|
—
|
|
15,506
|
|
6,319
|
|
—
|
|
—
|
|
||||||||||
|
Total unconsolidated
|
$
|
16,916
|
|
$
|
100,780
|
|
$
|
20,891
|
|
$
|
—
|
|
$
|
—
|
|
|||||
Other Commitments and Contingencies
Cavanal Hill Funds’ assets include U.S. Treasury and government securities market funds. Assets of these funds consist of highly-rated, short-term obligations of the U.S. Treasury and Agencies. The net asset value of units in these funds was
$1.00
at
December 31, 2016
. An investment in these funds is not insured by the Federal Deposit Insurance Corporation or guaranteed by BOK Financial or any of its subsidiaries. BOK Financial may, but is not obligated to purchase assets from these funds to maintain the net asset value at
$1.00
. No assets were purchased from the funds in
2016
or
2015
.
Total rent expense for BOK Financial was $
25.8 million
in
2016
,
$25.2 million
in
2015
and
$25.0 million
in
2014
. At
December 31, 2016
, future minimum lease payments for premises under operating leases were as follows:
$22.5 million
in
2017
,
$20.1 million
in
2018
,
$19.6 million
in
2019
,
$16.2 million
in
2020
,
$13.4 million
in
2021
and
$56.8 million
thereafter. BOKF, NA is obligated under a long-term lease for its bank premises in downtown Tulsa. The lease term, which began November 1, 1976, is for fifty-seven years with an option to terminate in 2024 with a two-year prior written notice. Premises leases may include options to renew at then current market rates and may include escalation provisions based upon changes in consumer price index or similar benchmarks.
The Federal Reserve Bank requires member banks to maintain certain minimum average cash balances. Member banks may satisfy reserve balance requirements through holdings of vault cash and balances maintained directly with a Federal Reserve Bank. The combined average balance of vault cash and balances held at the Federal Reserve Bank was
$1.9 billion
for the year ended
December 31, 2016
and
$1.8 billion
for the year ended
December 31, 2015
.
150
(
15
)
Shareholders Equity
Preferred Stock
One billion
shares of preferred stock with a par value of
$0.00005
per share are authorized. The Series A Preferred Stock has no voting rights except as otherwise provided by Oklahoma corporate law and may be converted into
one share of Common Stock for each 36 shares of Series A Preferred Stock at the option of the holder
. Dividends are cumulative at an annual rate of
ten percent
of the
$0.06
per share liquidation preference value when declared and are payable in cash. Aggregate liquidation preference is
$15 million
.
No
Series A Preferred Stock was outstanding in
2016
,
2015
or
2014
.
Common Stock
Common stock consists of
2.5 billion
authorized shares with a
$0.00006
par value. Holders of common shares are entitled to
one
vote per share at the election of the Board of Directors and on any question arising at any shareholders’ meeting and to receive dividends when and as declared. Additionally, regulations restrict the ability of national
banks and bank holding companies to pay dividends.
Subsidiary Bank
The amounts of dividends that BOK Financial’s subsidiary bank can declare and the amounts of loans the subsidiary bank can extend to affiliates are limited by various federal banking regulations and state corporate law. Generally, dividends declared during a calendar year are limited to net profits, as defined, for the year plus retained profits for the preceding two years. The amounts of dividends are further restricted by minimum capital requirements.
Regulatory Capital
BOK Financial and the subsidiary banks are subject to various capital requirements administered by the federal banking agencies. Failure to meet minimum capital requirements can initiate certain mandatory and additional discretionary actions by regulators that could have a material effect on BOK Financial's operations. These capital requirements include quantitative measures of assets, liabilities and certain off-balance sheet items. The capital standards are also subject to qualitative judgments by the regulators.
New capital rules were effective for BOK Financial on January 1, 2015. Components of these rules will phase in through January 1, 2019. A bank falling below the minimum capital requirements, including the capital conservation buffer, would be subject to regulatory restrictions on capital distributions (including but not limited to dividends and share repurchases) and executive bonus payments. For a banking institution to qualify as well capitalized, Common equity Tier 1, Tier I, Total and Leverage capital ratios must be at least
6.5%
,
8%
,
10%
and
5%
, respectively. Tier I capital consists primarily of common stockholders' equity, excluding unrealized gains or losses on available for sale securities, less goodwill, core deposit premiums and certain other intangible assets. Total capital consists primarily of Tier I capital plus preferred stock, subordinated debt and allowances for credit losses, subject to certain limitations. The subsidiary banks exceeded the regulatory definition of well capitalized as of
December 31, 2016
and
December 31, 2015
.
151
A summary of regulatory capital minimum requirements and levels follows (dollars in thousands):
|
Minimum Capital Requirement
|
Capital Conservation Buffer
1
|
Minimum Capital Requirement Including Capital Conservation Buffer
|
December 31, 2016
|
December 31, 2015
|
||||||||||||||||
|
Common equity Tier 1 Capital (to Risk Weighted Assets):
|
||||||||||||||||||||
|
Consolidated
|
4.50%
|
2.50%
|
7.00%
|
2,834,532
|
|
11.21
|
%
|
$
|
2,842,193
|
|
12.13
|
%
|
||||||||
|
BOKF, NA
|
4.50%
|
N/A
|
4.50%
|
2,609,450
|
|
10.65
|
%
|
2,385,323
|
|
10.26
|
%
|
|||||||||
|
Mobank
2
|
4.50%
|
N/A
|
4.50%
|
54,616
|
|
10.03
|
%
|
N/A
|
N/A
|
|||||||||||
|
Tier I Capital (to Risk Weighted Assets):
|
||||||||||||||||||||
|
Consolidated
|
6.00%
|
2.50%
|
8.50%
|
$
|
2,834,532
|
|
11.21
|
%
|
$
|
2,842,193
|
|
12.13
|
%
|
|||||||
|
BOKF, NA
|
6.00%
|
N/A
|
6.00%
|
2,609,450
|
|
10.65
|
%
|
2,385,323
|
|
10.26
|
%
|
|||||||||
|
Mobank
2
|
6.00%
|
N/A
|
6.00%
|
54,616
|
|
10.03
|
%
|
N/A
|
N/A
|
|||||||||||
|
Total Capital (to Risk Weighted Assets):
|
|
|
|
|
||||||||||||||||
|
Consolidated
|
8.00%
|
2.50%
|
10.50%
|
$
|
3,238,323
|
|
12.81
|
%
|
$
|
3,116,144
|
|
13.30
|
%
|
|||||||
|
BOKF, NA
|
8.00%
|
N/A
|
8.00%
|
2,866,949
|
|
11.70
|
%
|
2,657,935
|
|
11.43
|
%
|
|||||||||
|
Mobank
2
|
8.00%
|
N/A
|
8.00%
|
54,617
|
|
10.03
|
%
|
N/A
|
N/A
|
|||||||||||
|
Leverage (Tier I Capital to Average Assets):
|
||||||||||||||||||||
|
Consolidated
|
4.00%
|
N/A
|
4.00%
|
$
|
2,834,532
|
|
8.72
|
%
|
$
|
2,842,193
|
|
9.25
|
%
|
|||||||
|
BOKF, NA
|
4.00%
|
N/A
|
4.00%
|
2,609,450
|
|
8.11
|
%
|
2,385,323
|
|
7.81
|
%
|
|||||||||
|
Mobank
2
|
4.00%
|
N/A
|
4.00%
|
54,616
|
|
8.37
|
%
|
N/A
|
N/A
|
|||||||||||
|
1
|
Capital conservation buffer is effective January 1, 2016 and is phased in through 2019. The phased in capital conservation buffer at December 31, 2016 is
0.625%
. The fully phased in requirement of
2.50%
is included in the table above.
|
|
2
|
Missouri Bank and Trust Company of Kansas City dba Mobank was acquired by BOK Financial effective December 1, 2016.
|
152
Accumulated Other Comprehensive Income (Loss)
AOCI includes unrealized gains and losses on available for sale ("AFS") securities and non-credit related unrealized losses on AFS securities for which an other-than-temporary impairment has been recorded in earnings. AOCI also includes unrealized gains on AFS securities that were transferred from AFS to investment securities in 2011. Such amounts were amortized over the estimated remaining life of the security as an adjustment to yield, offsetting the related amortization of premium on the transferred securities. Unrealized losses on employee benefit plans will be reclassified into income as pension plan costs are recognized over the remaining service period of plan participants. Accumulated losses on the interest rate lock hedge of the subordinated debt issuance in 2005 were reclassified into income over the ten-year life of the debt. Gains and losses in AOCI are net of deferred income taxes.
A rollforward of the components of accumulated other comprehensive income (loss) is included as follows (in thousands):
|
Unrealized Gain (Loss) on
|
||||||||||||||||||||
|
Available for Sale Securities
|
Investment Securities Transferred from AFS
|
Employee Benefit Plans
|
Loss on Effective Cash Flow Hedges
|
Total
|
||||||||||||||||
|
Balance, December 31, 2013
|
$
|
(23,175
|
)
|
$
|
1,118
|
|
$
|
(3,311
|
)
|
$
|
(255
|
)
|
$
|
(25,623
|
)
|
|||||
|
Net change in unrealized gain (loss)
|
136,050
|
|
—
|
|
725
|
|
—
|
|
136,775
|
|
||||||||||
|
Reclassification adjustments included in earnings:
|
||||||||||||||||||||
|
Interest revenue, Investment securities, Taxable securities
|
—
|
|
(1,216
|
)
|
—
|
|
—
|
|
(1,216
|
)
|
||||||||||
|
Interest expense, Subordinated debentures
|
—
|
|
—
|
|
—
|
|
296
|
|
296
|
|
||||||||||
|
Net impairment losses recognized in earnings
|
373
|
|
—
|
|
—
|
|
—
|
|
373
|
|
||||||||||
|
Gain on available for sale securities, net
|
(1,539
|
)
|
—
|
|
—
|
|
—
|
|
(1,539
|
)
|
||||||||||
|
Other comprehensive income (loss), before income taxes
|
134,884
|
|
(1,216
|
)
|
725
|
|
296
|
|
134,689
|
|
||||||||||
|
Federal and state income tax
1
|
52,470
|
|
(474
|
)
|
282
|
|
115
|
|
52,393
|
|
||||||||||
|
Other comprehensive income (loss), net of income taxes
|
82,414
|
|
|
(742
|
)
|
|
443
|
|
|
181
|
|
|
82,296
|
|
||||||
|
Balance, December 31, 2014
|
59,239
|
|
376
|
|
(2,868
|
)
|
(74
|
)
|
56,673
|
|
||||||||||
|
Net change in unrealized gain (loss)
|
(48,607
|
)
|
—
|
|
1,804
|
|
—
|
|
(46,803
|
)
|
||||||||||
|
Reclassification adjustments included in earnings:
|
||||||||||||||||||||
|
Interest revenue, Investment securities, Taxable securities
|
—
|
|
(503
|
)
|
—
|
|
—
|
|
(503
|
)
|
||||||||||
|
Interest expense, Subordinated debentures
|
—
|
|
—
|
|
—
|
|
121
|
|
121
|
|
||||||||||
|
Net impairment losses recognized in earnings
|
1,819
|
|
—
|
|
—
|
|
—
|
|
1,819
|
|
||||||||||
|
Gain on available for sale securities, net
|
(12,058
|
)
|
—
|
|
—
|
|
—
|
|
(12,058
|
)
|
||||||||||
|
Other comprehensive income (loss), before income taxes
|
(58,846
|
)
|
(503
|
)
|
1,804
|
|
121
|
|
(57,424
|
)
|
||||||||||
|
Federal and state income tax
1
|
(22,891
|
)
|
(195
|
)
|
701
|
|
47
|
|
(22,338
|
)
|
||||||||||
|
Other comprehensive income (loss), net of income taxes
|
(35,955
|
)
|
|
(308
|
)
|
|
1,103
|
|
|
74
|
|
|
(35,086
|
)
|
||||||
|
Balance, December 31, 2015
|
23,284
|
|
68
|
|
(1,765
|
)
|
—
|
|
21,587
|
|
||||||||||
|
Net change in unrealized gain (loss)
|
(41,333
|
)
|
—
|
|
(188
|
)
|
—
|
|
(41,521
|
)
|
||||||||||
|
Reclassification adjustments included in earnings:
|
||||||||||||||||||||
|
Interest revenue, Investment securities, Taxable securities
|
—
|
|
(112
|
)
|
—
|
|
—
|
|
(112
|
)
|
||||||||||
|
Interest expense, Subordinated debentures
|
—
|
|
—
|
|
—
|
|
—
|
|
—
|
|
||||||||||
|
Net impairment losses recognized in earnings
|
—
|
|
—
|
|
—
|
|
—
|
|
—
|
|
||||||||||
|
Gain on available for sale securities, net
|
(11,675
|
)
|
—
|
|
—
|
|
—
|
|
(11,675
|
)
|
||||||||||
|
Other comprehensive income (loss), before income taxes
|
(53,008
|
)
|
(112
|
)
|
(188
|
)
|
—
|
|
(53,308
|
)
|
||||||||||
|
Federal and state income tax
1
|
(20,637
|
)
|
(44
|
)
|
(73
|
)
|
—
|
|
(20,754
|
)
|
||||||||||
|
Other comprehensive income (loss), net of income taxes
|
(32,371
|
)
|
|
(68
|
)
|
|
(115
|
)
|
|
—
|
|
|
(32,554
|
)
|
||||||
|
Balance, December 31, 2016
|
$
|
(9,087
|
)
|
$
|
—
|
|
$
|
(1,880
|
)
|
$
|
—
|
|
$
|
(10,967
|
)
|
|||||
|
1
|
Calculated using 39% effective tax rate.
|
153
(
16
)
Earnings Per Share
The following table presents the computation of basic and diluted earnings per share (dollars in thousands, except per share data):
|
Year Ended
|
||||||||||||
|
2016
|
2015
|
2014
|
||||||||||
|
Numerator:
|
|
|
||||||||||
|
Net income attributable to BOK Financial Corp. shareholders
|
$
|
232,668
|
|
$
|
288,565
|
|
$
|
292,435
|
|
|||
|
Less: Earnings allocated to participating securities
|
2,883
|
|
3,383
|
|
3,239
|
|
||||||
|
Numerator for basic earnings per share – income available to common shareholders
|
229,785
|
|
285,182
|
|
289,196
|
|
||||||
|
Effect of reallocating undistributed earnings of participating securities
|
1
|
|
3
|
|
4
|
|
||||||
|
Numerator for diluted earnings per share – income available to common shareholders
|
$
|
229,786
|
|
$
|
285,185
|
|
$
|
289,200
|
|
|||
|
Denominator:
|
|
|
|
|
||||||||
|
Weighted average shares outstanding
|
65,901,110
|
|
68,397,215
|
|
69,159,902
|
|
||||||
|
Less: Participating securities included in weighted average shares outstanding
|
815,483
|
|
802,526
|
|
765,708
|
|
||||||
|
Denominator for basic earnings per common share
|
65,085,627
|
|
67,594,689
|
|
68,394,194
|
|
||||||
|
Dilutive effect of employee stock compensation plans
1
|
58,271
|
|
96,969
|
|
150,576
|
|
||||||
|
Denominator for diluted earnings per common share
|
65,143,898
|
|
67,691,658
|
|
68,544,770
|
|
||||||
|
Basic earnings per share
|
$
|
3.53
|
|
$
|
4.22
|
|
$
|
4.23
|
|
|||
|
Diluted earnings per share
|
$
|
3.53
|
|
$
|
4.21
|
|
$
|
4.22
|
|
|||
|
1
Excludes employee stock options with exercise prices greater than current market price.
|
—
|
|
—
|
|
—
|
|
||||||
(
17
)
Reportable Segments
BOK Financial operates three principal lines of business: Commercial Banking, Consumer Banking and Wealth Management. Commercial Banking includes lending, treasury and cash management services and customer risk management products to small businesses, middle market and larger commercial customers. Commercial Banking also includes the TransFund EFT network. Consumer Banking includes retail lending and deposit services, lending and deposit services to small business customers served through the consumer branch network and all mortgage banking activities. Wealth Management provides fiduciary services, private bank services and investment advisory services in all markets. Wealth Management also underwrites state and municipal securities and engages in brokerage and trading activities.
In addition to its lines of business, BOK Financial has a Funds Management unit. The primary purpose of this unit is to manage overall liquidity needs and interest rate risk. Each line of business borrows funds from and provides funds to the Funds Management unit as needed to support their operations. Operating results for Funds Management and other include the effect of interest rate risk positions and risk management activities, securities gains and losses including impairment charges, the provision for credit losses in excess of net loans charged off, tax planning strategies and certain executive compensation costs that are not attributed to the lines of business.
BOK Financial allocates resources and evaluates performance of its lines of business after allocation of funds, actual net credit losses and capital costs. In addition, we measure the performance of our business lines after allocation of certain indirect expenses and taxes on statutory rates. The allocation for the prior comparable periods have been revised on a comparable basis.
The cost of funds borrowed from the Funds Management unit by the operating lines of business is transfer priced at rates that approximate market rates for funds with similar duration. Market rates are generally based on the applicable LIBOR or interest rate swap rates, adjusted for prepayment risk. This method of transfer-pricing funds that support assets of the operating lines of business tends to insulate them from interest rate risk.
154
The value of funds provided by the operating lines of business to the Funds Management unit is based on rates which approximate the wholesale market rates for funds with similar duration and re-pricing characteristics. Market rates are generally based on LIBOR or interest rate swap rates. The funds credit formula applied to deposit products with indeterminate maturities is established based on their re-pricing characteristics reflected in a combination of the short-term LIBOR rates and a moving average of an intermediate term swap rate, with an appropriate spread applied to both. Shorter duration products are weighted towards the short-term LIBOR rate and longer duration products are weighted towards intermediate swap rates. The expected duration ranges from 30 days for certain rate-sensitive deposits to five years.
Substantially all revenue is from domestic customers. No single external customer accounts for more than 10% of total revenue.
Net loans charged off and provision for credit losses represents net loans charged off as attributed to the lines of business and the provision for credit losses in excess of net charge-offs attributed to Funds Management and Other.
The acquisition of Mobank on December 1, 2016 was not yet allocated to the operating segments at December 31, 2016. Accordingly, the operation, assets and liabilities of Mobank were included in Funds Management and Other for 2016.
Reportable segments reconciliation to the Consolidated Financial Statements for the year ended
December 31, 2016
is as follows (in thousands):
|
|
Commercial
|
Consumer
|
Wealth
Management
|
Funds Management and Other
|
BOK
Financial
Consolidated
|
|||||||||||||||
|
Net interest and dividend revenue from external sources
|
$
|
492,967
|
|
$
|
85,998
|
|
$
|
33,006
|
|
$
|
135,257
|
|
$
|
747,228
|
|
|||||
|
Net interest revenue (expense) from internal sources
|
(58,781
|
)
|
37,777
|
|
29,043
|
|
(8,039
|
)
|
—
|
|
||||||||||
|
Net interest and dividend revenue
|
434,186
|
|
123,775
|
|
62,049
|
|
127,218
|
|
747,228
|
|
||||||||||
|
Provision for credit losses
|
32,959
|
|
4,927
|
|
(801
|
)
|
27,915
|
|
65,000
|
|
||||||||||
|
Net interest and dividend revenue after provision for credit losses
|
401,227
|
|
118,848
|
|
62,850
|
|
99,303
|
|
682,228
|
|
||||||||||
|
Other operating revenue
|
195,521
|
|
224,802
|
|
283,222
|
|
(29,525
|
)
|
674,020
|
|
||||||||||
|
Other operating expense
|
216,451
|
|
249,744
|
|
250,994
|
|
300,401
|
|
1,017,590
|
|
||||||||||
|
Net direct contribution
|
380,297
|
|
93,906
|
|
95,078
|
|
(230,623
|
)
|
338,658
|
|
||||||||||
|
Gain (loss) on financial instruments, net
|
10
|
|
(26,252
|
)
|
(42
|
)
|
26,284
|
|
—
|
|
||||||||||
|
Change in fair value of mortgage servicing rights
|
—
|
|
(2,193
|
)
|
—
|
|
2,193
|
|
—
|
|
||||||||||
|
Gain (loss) on repossessed assets, net
|
669
|
|
979
|
|
—
|
|
(1,648
|
)
|
—
|
|
||||||||||
|
Corporate expense allocations
|
35,760
|
|
66,411
|
|
42,378
|
|
(144,549
|
)
|
—
|
|
||||||||||
|
Net income before taxes
|
345,216
|
|
29
|
|
52,658
|
|
(59,245
|
)
|
338,658
|
|
||||||||||
|
Federal and state income taxes
|
134,289
|
|
11
|
|
20,484
|
|
(48,407
|
)
|
106,377
|
|
||||||||||
|
Net income
|
210,927
|
|
18
|
|
32,174
|
|
(10,838
|
)
|
232,281
|
|
||||||||||
|
Net income (loss) attributable to non-controlling interests
|
—
|
|
—
|
|
—
|
|
(387
|
)
|
(387
|
)
|
||||||||||
|
Net income attributable to BOK Financial Corp. shareholders
|
$
|
210,927
|
|
$
|
18
|
|
$
|
32,174
|
|
$
|
(10,451
|
)
|
$
|
232,668
|
|
|||||
|
Average assets
|
$
|
16,998,626
|
|
$
|
8,722,372
|
|
$
|
6,281,127
|
|
$
|
276,277
|
|
$
|
32,278,402
|
|
|||||
155
Reportable segments reconciliation to the Consolidated Financial Statements for the year ended
December 31, 2015
is as follows (in thousands):
|
|
Commercial
|
Consumer
|
Wealth
Management
|
Funds Management and Other
|
BOK
Financial
Consolidated
|
|||||||||||||||
|
Net interest and dividend revenue from external sources
|
$
|
439,751
|
|
$
|
84,848
|
|
$
|
24,744
|
|
$
|
154,011
|
|
$
|
703,354
|
|
|||||
|
Net interest revenue (expense) from internal sources
|
(52,313
|
)
|
28,503
|
|
24,043
|
|
(233
|
)
|
—
|
|
||||||||||
|
Net interest and dividend revenue
|
387,438
|
|
113,351
|
|
48,787
|
|
153,778
|
|
703,354
|
|
||||||||||
|
Provision for credit losses
|
(6,748
|
)
|
6,934
|
|
(1,083
|
)
|
34,897
|
|
34,000
|
|
||||||||||
|
Net interest and dividend revenue after provision for credit losses
|
394,186
|
|
106,417
|
|
49,870
|
|
118,881
|
|
669,354
|
|
||||||||||
|
Other operating revenue
|
177,729
|
|
218,095
|
|
267,523
|
|
(4,867
|
)
|
658,480
|
|
||||||||||
|
Other operating expense
|
202,804
|
|
203,070
|
|
228,664
|
|
261,653
|
|
896,191
|
|
||||||||||
|
Net direct contribution
|
369,111
|
|
121,442
|
|
88,729
|
|
(147,639
|
)
|
431,643
|
|
||||||||||
|
Gain (loss) on financial instruments, net
|
—
|
|
(4,712
|
)
|
(204
|
)
|
4,916
|
|
—
|
|
||||||||||
|
Change in fair value of mortgage servicing rights
|
—
|
|
(4,853
|
)
|
—
|
|
4,853
|
|
—
|
|
||||||||||
|
Gain (loss) on repossessed assets, net
|
708
|
|
916
|
|
—
|
|
(1,624
|
)
|
—
|
|
||||||||||
|
Corporate expense allocations
|
43,279
|
|
74,936
|
|
40,357
|
|
(158,572
|
)
|
—
|
|
||||||||||
|
Net income before taxes
|
326,540
|
|
37,857
|
|
48,168
|
|
19,078
|
|
431,643
|
|
||||||||||
|
Federal and state income taxes
|
127,024
|
|
14,726
|
|
18,737
|
|
(21,103
|
)
|
139,384
|
|
||||||||||
|
Net income
|
199,516
|
|
23,131
|
|
29,431
|
|
40,181
|
|
292,259
|
|
||||||||||
|
Net income attributable to non-controlling interests
|
—
|
|
—
|
|
—
|
|
3,694
|
|
3,694
|
|
||||||||||
|
Net income attributable to BOK Financial Corp. shareholders
|
$
|
199,516
|
|
$
|
23,131
|
|
$
|
29,431
|
|
$
|
36,487
|
|
$
|
288,565
|
|
|||||
|
Average assets
|
$
|
16,284,527
|
|
$
|
8,836,327
|
|
$
|
5,444,483
|
|
$
|
9,418
|
|
$
|
30,574,755
|
|
|||||
156
Reportable segments reconciliation to the Consolidated Financial Statements for the year ended
December 31, 2014
is as follows (in thousands):
|
|
Commercial
|
Consumer
|
Wealth
Management
|
Funds Management and Other
|
BOK
Financial
Consolidated
|
|||||||||||||||
|
Net interest and dividend revenue from external sources
|
$
|
382,331
|
|
$
|
81,852
|
|
$
|
23,817
|
|
$
|
177,194
|
|
$
|
665,194
|
|
|||||
|
Net interest revenue (expense) from internal sources
|
(40,083
|
)
|
26,813
|
|
20,959
|
|
(7,689
|
)
|
—
|
|
||||||||||
|
Net interest and dividend revenue
|
342,248
|
|
108,665
|
|
44,776
|
|
169,505
|
|
665,194
|
|
||||||||||
|
Provision for credit losses
|
(7,447
|
)
|
5,477
|
|
213
|
|
1,757
|
|
—
|
|
||||||||||
|
Net interest and dividend revenue after provision for credit losses
|
349,695
|
|
103,188
|
|
44,563
|
|
167,748
|
|
665,194
|
|
||||||||||
|
Other operating revenue
|
171,390
|
|
214,657
|
|
242,268
|
|
(6,357
|
)
|
621,958
|
|
||||||||||
|
Other operating expense
|
195,706
|
|
207,131
|
|
218,000
|
|
226,685
|
|
847,522
|
|
||||||||||
|
Net direct contribution
|
325,379
|
|
110,714
|
|
68,831
|
|
(65,294
|
)
|
439,630
|
|
||||||||||
|
Gain (loss) on financial instruments, net
|
—
|
|
12,406
|
|
(235
|
)
|
(12,171
|
)
|
—
|
|
||||||||||
|
Change in fair value of mortgage servicing rights
|
—
|
|
(16,445
|
)
|
—
|
|
16,445
|
|
—
|
|
||||||||||
|
Gain (loss) on repossessed assets, net
|
(3,187
|
)
|
1,418
|
|
—
|
|
1,769
|
|
—
|
|
||||||||||
|
Corporate expense allocations
|
45,502
|
|
64,531
|
|
38,731
|
|
(148,764
|
)
|
—
|
|
||||||||||
|
Net income before taxes
|
276,690
|
|
43,562
|
|
29,865
|
|
89,513
|
|
439,630
|
|
||||||||||
|
Federal and state income taxes
|
107,632
|
|
16,946
|
|
11,617
|
|
7,956
|
|
144,151
|
|
||||||||||
|
Net income
|
169,058
|
|
26,616
|
|
18,248
|
|
81,557
|
|
295,479
|
|
||||||||||
|
Net income attributable to non-controlling interests
|
—
|
|
—
|
|
—
|
|
3,044
|
|
3,044
|
|
||||||||||
|
Net income attributable to BOK Financial Corp. shareholders
|
$
|
169,058
|
|
$
|
26,616
|
|
$
|
18,248
|
|
$
|
78,513
|
|
$
|
292,435
|
|
|||||
|
Average assets
|
$
|
15,394,957
|
|
$
|
8,373,317
|
|
$
|
5,002,515
|
|
$
|
(771,931
|
)
|
$
|
27,998,858
|
|
|||||
157
(
18
)
Fair Value Measurements
Fair value is defined by applicable accounting guidance as the price to sell an asset or transfer a liability in an orderly transaction between market participants in the principal market for the given asset or liability at the measurement date based on market conditions at that date. An orderly transaction assumes exposure to the market for a customary period for marketing activities prior to the measurement date and not a forced liquidation or distressed sale. Certain assets and liabilities are recorded in the Company’s financial statements at fair value. Some are recorded on a recurring basis and some on a non-recurring basis.
For some assets and liabilities, observable market transactions and market information might be available. For other assets and liabilities, observable market transactions and market information might not be available. A hierarchy for fair value has been established which categorizes into three levels the inputs to valuation techniques used to measure fair value. The three levels are as follows:
Quoted Prices in Active Markets for Identical Assets or Liabilities (Level 1) - fair value is based on unadjusted quoted prices in active markets for identical assets or liabilities.
Significant Other Observable Inputs (Level 2) - fair value is based on significant other observable inputs which are generally determined based on a single price for each financial instrument provided to us by an applicable third-party pricing service and is based on one or more of the following:
|
•
|
Quoted prices for similar, but not identical, assets or liabilities in active markets;
|
|
•
|
Quoted prices for identical or similar assets or liabilities in inactive markets;
|
|
•
|
Inputs other than quoted prices that are observable, such as interest rate and yield curves, volatilities, prepayment speeds, loss severities, credit risks and default rates;
|
|
•
|
Other inputs derived from or corroborated by observable market inputs.
|
Significant Unobservable Inputs (Level 3) - fair value is based upon model-based valuation techniques for which at least one significant assumption is not observable in the market.
Transfers between levels are recognized as of the end of the reporting period. There were no transfers in or out of quoted prices in active markets for identical instruments to significant other observable inputs or significant unobservable inputs during the year ended
December 31, 2016
and
2015
, respectively. Transfers between significant other observable inputs and significant unobservable inputs during the year ended
December 31, 2016
and
2015
are included in the summary of changes in recurring fair values measured using unobservable inputs.
The underlying methods used by the third-party pricing services are considered in determining the primary inputs used to determine fair values. Management has evaluated the methodologies employed by the third-party pricing services by comparing the price provided by the pricing service with other sources, including brokers' quotes, sales or purchases of similar instruments and discounted cash flows to establish a basis for reliance on the pricing service values. Significant differences between the pricing service provided value and other sources are discussed with the pricing service to understand the basis for their values. Based on all observable inputs, management may adjust prices obtained from third-party pricing services to more appropriately reflect the prices that would be received to sell assets or paid to transfer liabilities in orderly transactions in the current market. No significant adjustments were made to prices provided by third-party pricing services at
December 31, 2016
and
2015
.
158
Assets and Liabilities Measured at Fair Value on a Recurring Basis
The fair value of financial assets and liabilities that are measured on a recurring basis is as follows as of
December 31, 2016
(in thousands):
|
|
Total
|
Quoted Prices in Active Markets for Identical Instruments
|
Significant Other Observable Inputs
|
Significant Unobservable Inputs
|
||||||||||||
|
Assets:
|
|
|
|
|
||||||||||||
|
Trading securities:
|
||||||||||||||||
|
U.S. government agency debentures
|
$
|
6,234
|
|
$
|
—
|
|
$
|
6,234
|
|
$
|
—
|
|
||||
|
U.S. agency residential mortgage-backed securities
|
310,067
|
|
—
|
|
310,067
|
|
—
|
|
||||||||
|
Municipal and other tax-exempt securities
|
14,427
|
|
—
|
|
14,427
|
|
—
|
|
||||||||
|
Other trading securities
|
6,900
|
|
—
|
|
6,900
|
|
—
|
|
||||||||
|
Total trading securities
|
337,628
|
|
—
|
|
337,628
|
|
—
|
|
||||||||
|
Available for sale securities:
|
|
|
|
|
|
|
|
|
||||||||
|
U.S. Treasury securities
|
999
|
|
999
|
|
—
|
|
—
|
|
||||||||
|
Municipal and other tax-exempt securities
|
40,993
|
|
—
|
|
35,204
|
|
5,789
|
|
||||||||
|
U.S. government agency residential mortgage-backed securities
|
5,460,386
|
|
—
|
|
5,460,386
|
|
—
|
|
||||||||
|
Privately issued residential mortgage-backed securities
|
115,535
|
|
—
|
|
115,535
|
|
—
|
|
||||||||
|
Commercial mortgage-backed securities guaranteed by U.S. government agencies
|
3,017,933
|
|
—
|
|
3,017,933
|
|
—
|
|
||||||||
|
Other debt securities
|
4,152
|
|
—
|
|
—
|
|
4,152
|
|
||||||||
|
Perpetual preferred stock
|
18,474
|
|
—
|
|
18,474
|
|
—
|
|
||||||||
|
Equity securities and mutual funds
|
18,357
|
|
3,495
|
|
14,862
|
|
—
|
|
||||||||
|
Total available for sale securities
|
8,676,829
|
|
4,494
|
|
8,662,394
|
|
9,941
|
|
||||||||
|
Fair value option securities – U.S. government agency residential mortgage-backed securities
|
77,046
|
|
—
|
|
77,046
|
|
—
|
|
||||||||
|
Residential mortgage loans held for sale
|
301,897
|
|
—
|
|
290,280
|
|
11,617
|
|
||||||||
|
Mortgage servicing rights, net
1
|
247,073
|
|
—
|
|
—
|
|
247,073
|
|
||||||||
|
Derivative contracts, net of cash margin
2
|
689,872
|
|
7,541
|
|
682,331
|
|
—
|
|
||||||||
|
Liabilities:
|
|
|
|
|
|
|
|
|
||||||||
|
Derivative contracts, net of cash margin
2
|
664,531
|
|
6,972
|
|
657,559
|
|
—
|
|
||||||||
|
1
|
A reconciliation of the beginning and ending fair value of mortgage servicing rights and disclosures of significant assumptions used to determine fair value are presented in Note
7
, Mortgage Banking Activities.
|
|
2
|
See Note
3
for detail of fair value of derivative contracts by contract type. Derivative contracts in a net asset position that were valued based on quoted prices in active markets or identical instruments (Level 1) are exchange-traded interest rate and energy derivative contracts, net of cash margin. Derivative contracts in a net liability position that were valued using quoted prices in active markets for identical instruments (Level 1) are exchange-traded interest rate, energy and agricultural derivative contracts, net of cash margin.
|
159
The fair value of financial assets and liabilities that are measured on a recurring basis is as follows as of
December 31, 2015
(in thousands):
|
|
Total
|
Quoted Prices in Active Markets for Identical Instruments
|
Significant Other Observable Inputs
|
Significant Unobservable Inputs
|
||||||||||||
|
Assets:
|
|
|
|
|
||||||||||||
|
Trading securities:
|
||||||||||||||||
|
U.S. government agency debentures
|
$
|
61,295
|
|
$
|
—
|
|
$
|
61,295
|
|
$
|
—
|
|
||||
|
U.S. government agency residential mortgage-backed securities
|
10,989
|
|
—
|
|
10,989
|
|
—
|
|
||||||||
|
Municipal and other tax-exempt securities
|
31,901
|
|
—
|
|
31,901
|
|
—
|
|
||||||||
|
Other trading securities
|
18,219
|
|
—
|
|
18,219
|
|
—
|
|
||||||||
|
Total trading securities
|
122,404
|
|
—
|
|
122,404
|
|
—
|
|
||||||||
|
Available for sale securities:
|
|
|
|
|
|
|
|
|
||||||||
|
U.S. Treasury securities
|
995
|
|
995
|
|
—
|
|
—
|
|
||||||||
|
Municipal and other tax-exempt securities
|
56,817
|
|
—
|
|
47,207
|
|
9,610
|
|
||||||||
|
U.S. government agency residential mortgage-backed securities
|
5,898,351
|
|
—
|
|
5,898,351
|
|
—
|
|
||||||||
|
Privately issued residential mortgage-backed securities
|
139,118
|
|
—
|
|
139,118
|
|
—
|
|
||||||||
|
Commercial mortgage-backed securities guaranteed by U.S. government agencies
|
2,905,796
|
|
—
|
|
2,905,796
|
|
—
|
|
||||||||
|
Other debt securities
|
4,151
|
|
—
|
|
—
|
|
4,151
|
|
||||||||
|
Perpetual preferred stock
|
19,672
|
|
—
|
|
19,672
|
|
—
|
|
||||||||
|
Equity securities and mutual funds
|
17,833
|
|
3,265
|
|
14,568
|
|
—
|
|
||||||||
|
Total available for sale securities
|
9,042,733
|
|
4,260
|
|
9,024,712
|
|
13,761
|
|
||||||||
|
Fair value option securities – U.S. government agency residential mortgage-backed securities
|
444,217
|
|
—
|
|
444,217
|
|
—
|
|
||||||||
|
Residential mortgage loans held for sale
|
308,439
|
|
—
|
|
300,565
|
|
7,874
|
|
||||||||
|
Mortgage servicing rights, net
1
|
218,605
|
|
—
|
|
—
|
|
218,605
|
|
||||||||
|
Derivative contracts, net of cash margin
2
|
586,270
|
|
38,530
|
|
547,740
|
|
—
|
|
||||||||
|
Liabilities:
|
|
|
|
|
||||||||||||
|
Derivative contracts, net of cash margin
2
|
581,701
|
|
—
|
|
581,701
|
|
—
|
|
||||||||
|
1
|
A reconciliation of the beginning and ending fair value of mortgage servicing rights and disclosures of significant assumptions used to determine fair value are presented in Note
7
, Mortgage Banking Activities.
|
|
2
|
See Note
3
for detail of fair value of derivative contracts by contract type. Derivative contracts in a net asset position that were valued based on quoted prices in active markets for identical instruments (Level 1) are exchange-traded energy derivative contracts, net of cash margin. Derivative contracts in a net liability position that were valued using quoted prices in active markets for identical instruments based on quoted prices in active markets for identical instruments (Level 1) are exchange-traded interest rate and agricultural derivative contracts, fully offset by cash margin.
|
160
Following is a description of the Company's valuation methodologies used for assets and liabilities measured on a recurring basis:
Securities
The fair values of trading, available for sale and fair value option securities are based on quoted prices for identical instruments in active markets, when available. If quoted prices for identical instruments are not available, fair values are based on significant other observable inputs such as quoted prices of comparable instruments or interest rates and credit spreads, yield curves, volatilities, prepayment speeds and loss severities.
The fair value of certain available for sale municipal and other debt securities may be based on significant unobservable inputs. These significant unobservable inputs include limited observed trades, projected cash flows, current credit rating of the issuers and, when applicable, the insurers of the debt and observed trades of similar debt. Discount rates are primarily based on reference to interest rate spreads on comparable securities of similar duration and credit rating as determined by the nationally-recognized rating agencies adjusted for a lack of trading volume. Significant unobservable inputs are developed by investment securities professionals involved in the active trading of similar securities. A summary of significant inputs used to value these securities follows. A management committee composed of senior members from the Company's Capital Markets, Risk Management and Finance departments assess the appropriateness of these inputs quarterly.
Derivatives
All derivative instruments are carried on the balance sheet at fair value. Fair values for exchange-traded contracts are based on quoted prices. Fair values for over-the-counter interest rate, commodity and foreign exchange contracts are based on valuations provided either by third-party dealers in the contracts, quotes provided by independent pricing services, or a third-party provided pricing model that uses significant other observable market inputs.
Credit risk is considered in determining the fair value of derivative instruments. Management determines fair value adjustments based on various risk factors including but not limited to counterparty credit rating or equivalent loan grading, derivative contract notional size, price volatility of the underlying commodity, duration of the derivative contracts and expected loss severity. Expected loss severity is based on historical losses for similarly risk graded commercial loan customers. Decreases in counterparty credit rating or grading and increases in price volatility and expected loss severity all tend to increase the credit quality adjustment which reduces the fair value of asset contracts.
We also consider our own credit risk in determining the fair value of derivative contracts. Changes in our credit rating would affect the fair value of our derivative liabilities. In the event of a credit downgrade, the fair value of our derivative liabilities would increase. The change in the fair value would be recognized in earnings in the current period.
Residential Mortgage Loans Held for Sale
Residential mortgage loans held for sale are carried on the balance sheet at fair value. The fair values of conforming residential mortgage loans held for sale are based upon quoted market prices of such loans sold in securitization transactions, including related unfunded loan commitments. The fair value of mortgage loans that are unable to be sold to U.S. government agencies is determined using quoted prices of loans that are sold in securitization transactions with a liquidity discount applied.
Other Assets - Private Equity Funds
The fair value of the portfolio investments of the Company's two private equity funds are based upon net asset value reported by the underlying funds, as adjusted by the general partner when necessary, as a practical expedient to measure the fair value of the investments in the underlying funds. The Company's private equity funds provide customers alternative investment opportunities as limited partners of the funds. As fund of funds, the private equity funds invest in other limited partnerships or limited liability companies that invest substantially all of their assets in U.S. companies pursuing diversified investment strategies including early-stage venture capital, distressed securities and corporate or asset buy-outs. Private equity fund assets are long-term, illiquid investments. No secondary market exists for these assets. The private equity funds typically invest in funds that provide no redemption rights to investors. The fair value of the private equity investments may only be realized through cash distributions from the underlying funds.
See Note
14
for disclosure of the fair value of the private equity funds using the net asset value per share of the underlying investments, as a practical expedient, included in Other assets in the Consolidated Balance Sheets of the Company.
161
The following represents the changes related to assets measured at fair value on a recurring basis using significant unobservable inputs (in thousands):
|
|
Available for Sale Securities
|
Residential mortgage loans held for sale
|
||||||||||
|
|
Municipal and other tax-exempt securities
|
Other debt securities
|
||||||||||
|
Balance, December 31, 2014
|
$
|
10,093
|
|
$
|
4,150
|
|
$
|
11,856
|
|
|||
|
Transfer to Level 3 from Level 2
1
|
—
|
|
—
|
|
2,193
|
|
||||||
|
Purchases and capital calls
|
—
|
|
—
|
|
—
|
|
||||||
|
Redemptions and distributions
|
—
|
|
—
|
|
—
|
|
||||||
|
Proceeds from sales
|
—
|
|
—
|
|
(6,283
|
)
|
||||||
|
Gain (loss) recognized in earnings:
|
||||||||||||
|
Mortgage banking revenue
|
—
|
|
—
|
|
108
|
|
||||||
|
Other comprehensive income (loss):
|
||||||||||||
|
Net change in unrealized gain (loss)
|
(483
|
)
|
1
|
|
—
|
|
||||||
|
Balance, December 31, 2015
|
9,610
|
|
4,151
|
|
7,874
|
|
||||||
|
Transfer to Level 3 from Level 2
1
|
—
|
|
—
|
|
6,631
|
|
||||||
|
Purchases and capital calls
|
—
|
|
—
|
|
—
|
|
||||||
|
Redemptions and distributions
|
(3,975
|
)
|
—
|
|
—
|
|
||||||
|
Proceeds from sales
|
—
|
|
—
|
|
(2,540
|
)
|
||||||
|
Gain (loss) recognized in earnings:
|
||||||||||||
|
Mortgage banking revenue
|
—
|
|
—
|
|
(348
|
)
|
||||||
|
Other comprehensive income (loss):
|
||||||||||||
|
Net change in unrealized gain (loss)
|
154
|
|
1
|
|
—
|
|
||||||
|
Balance, December 31, 2016
|
$
|
5,789
|
|
$
|
4,152
|
|
$
|
11,617
|
|
|||
|
1
|
Recurring transfers to Level 3 from Level 2 consist of residential mortgage loans intended for sale to U.S. government agencies that fail to meet conforming standards.
|
162
A summary of quantitative information about assets measured at fair value on a recurring basis using significant unobservable inputs (Level 3) as of
December 31, 2016
follows (in thousands):
|
Quantitative Information about Level 3 Recurring Fair Value Measurements
|
|||||||||||||||||||
|
Par
Value
|
Amortized
Cost/Unpaid Principal Balance
|
Fair
Value
|
Valuation Technique(s)
|
Significant Unobservable Input
|
Range
(Weighted Average)
|
||||||||||||||
|
Available for sale securities:
|
|||||||||||||||||||
|
Municipal and other tax-exempt securities
|
$
|
6,195
|
|
$
|
6,163
|
|
$
|
5,712
|
|
Discounted cash flows
|
1
|
Interest rate spread
|
5.91%-6.21% (6.16%)
|
2
|
|||||
|
90.00%-93.40% (92.20%)
|
3
|
||||||||||||||||||
|
Other debt securities
|
4,400
|
|
4,400
|
|
4,152
|
|
Discounted cash flows
|
1
|
Interest rate spread
|
6.01% - 6.26% (6.23%)
|
4
|
||||||||
|
94.34% - 94.36% (94.36%)
|
3
|
||||||||||||||||||
|
Residential mortgage loans held for sale
|
N/A
|
12,431
|
|
11,617
|
|
Quoted prices of loans sold in securitization transactions, with a liquidity discount applied
|
Liquidity discount applied to the market value of mortgage loans qualifying for sale to U.S. government agencies
|
93.45%
|
|||||||||||
|
1
|
Discounted cash flows developed using discount rates primarily based on reference to interest rate spreads for comparable securities of similar duration and credit rating as determined by the nationally-recognized rating agencies, adjusted for lack of trading volume.
|
|
2
|
Interest rate yields used to value investment grade tax-exempt securities represent a spread of
467
to
525
basis points over average yields for comparable tax-exempt securities.
|
|
3
|
Represents fair value as a percentage of par value.
|
|
4
|
Interest rate yields used to value investment grade taxable securities based on comparable short-term taxable securities which are generally yielding approximately
1%
.
|
A summary of quantitative information about Recurring Fair Value Measurements based on Significant Unobservable Inputs (Level 3) as of
December 31, 2015
follows (in thousands):
|
Quantitative Information about Level 3 Recurring Fair Value Measurements
|
|||||||||||||||||||
|
Par
Value
|
Amortized
Cost
6
|
Fair
Value
|
Valuation Technique(s)
|
Significant Unobservable Input
|
Range
(Weighted Average)
|
||||||||||||||
|
Available for sale securities:
|
|||||||||||||||||||
|
Municipal and other tax-exempt securities
|
$
|
10,370
|
|
$
|
10,311
|
|
$
|
9,610
|
|
Discounted cash flows
|
1
|
Interest rate spread
|
5.47%-5.77% (5.73%)
|
2
|
|||||
|
92.34%-92.93% (92.67%)
|
3
|
||||||||||||||||||
|
Other debt securities
|
4,400
|
|
4,400
|
|
4,151
|
|
Discounted cash flows
|
1
|
Interest rate spread
|
5.80% - 5.92% (5.90%)
|
4
|
||||||||
|
94.33% - 94.34% (94.34%)
|
3
|
||||||||||||||||||
|
Residential mortgage loans held for sale
|
N/A
|
8,395
|
|
7,874
|
|
Quoted prices of loans sold in securitization transactions, with a liquidity discount applied
|
Liquidity discount applied to the market value of mortgage loans qualifying for sale to U.S. government agencies
|
93.79%
|
|||||||||||
|
1
|
Discounted cash flows developed using discount rates primarily based on reference to interest rate spreads for comparable securities of similar duration and credit rating as determined by the nationally-recognized rating agencies, adjusted for lack of trading volume.
|
|
2
|
Interest rate yields used to value investment grade tax-exempt securities represent a spread of
499
to
541
basis points over average yields for comparable tax-exempt securities.
|
|
3
|
Represents fair value as a percentage of par value.
|
|
4
|
Interest rate yields used to value investment grade taxable securities based on comparable short-term taxable securities which are generally yielding less than
1%
.
|
163
Fair Value of Assets and Liabilities Measured on a Non-Recurring Basis
Assets measured at fair value on a non-recurring basis include pension plan assets, which are based on quoted prices in active markets for identical instruments, collateral for certain impaired loans and real property and other assets acquired to satisfy loans, which are based primarily on comparisons to completed sales of similar assets. See Note
6
for information related to the non-recurring fair value measurement of Mobank.
The following represents the carrying value of assets measured at fair value on a non-recurring basis and related losses recorded during the year. The carrying value represents only those assets with the balance sheet date for which the fair value was adjusted during the year:
|
|
Carrying Value at December 31, 2016
|
Fair Value Adjustments for the
Year Ended December 31, 2016 Recognized In: |
|||||||||||||||||
|
|
Quoted Prices
in Active Markets for Identical Instruments
|
Significant
Other
Observable
Inputs
|
Significant
Unobservable
Inputs
|
Gross charge-offs against allowance for loan losses
|
Net losses and expenses of repossessed assets, net
|
||||||||||||||
|
Impaired loans
|
$
|
—
|
|
$
|
539
|
|
$
|
11,295
|
|
$
|
7,594
|
|
$
|
—
|
|
||||
|
Real estate and other repossessed assets
|
—
|
|
7,965
|
|
2,192
|
|
—
|
|
2,527
|
|
|||||||||
|
|
Carrying Value at December 31, 2015
|
Fair Value Adjustments for the
Year Ended December 31, 2015 Recognized In: |
|||||||||||||||||
|
|
Quoted Prices
in Active Markets for Identical Instruments
|
Significant
Other
Observable
Inputs
|
Significant
Unobservable
Inputs
|
Gross charge-offs against allowance for loan losses
|
Net losses and expenses of repossessed assets, net
|
||||||||||||||
|
Impaired loans
|
$
|
—
|
|
$
|
252
|
|
$
|
20,805
|
|
$
|
4,042
|
|
$
|
—
|
|
||||
|
Real estate and other repossessed assets
|
—
|
|
13,611
|
|
245
|
|
—
|
|
1,820
|
|
|||||||||
The fair value of collateral-dependent impaired loans and real estate and other repossessed assets and the related fair value adjustments are generally based on unadjusted third-party appraisals. Our appraisal review policies require appraised values to be supported by observed inputs derived principally from or corroborated by observable market data. Appraisals that are not based on observable inputs or that require significant adjustments or fair value measurements that are not based on third-party appraisals are considered to be based on significant unobservable inputs. Non-recurring fair value measurements of collateral-dependent impaired loans and real estate and other repossessed assets based on significant unobservable inputs are generally due to estimates of current fair values between appraisal dates. Significant unobservable inputs include listing prices for comparable assets, uncorroborated expert opinions or management's knowledge of the collateral or industry. Non-recurring fair value measurements of collateral dependent loans secured by mineral rights are generally determined by our internal staff of engineers on projected cash flows under current market conditions and are based on significant unobservable inputs. Projected cash flows are discounted according to risk characteristics of the underlying oil and gas properties. Assets are evaluated to demonstrate with reasonable certainty that crude oil, natural gas and natural gas liquids can be recovered from known oil and gas reservoirs under existing economic and operating conditions at current prices with existing conventional equipment, operating methods and costs. Significant unobservable inputs are developed by asset management and workout professionals and approved by senior Credit Administration executives.
164
A summary of quantitative information about Non-recurring Fair Value Measurements based on Significant Unobservable Inputs (Level 3) as of
December 31, 2016
follows (in thousands):
|
Quantitative Information about Level 3 Non-recurring Fair Value Measurements
|
||||||||||
|
Fair Value
|
Valuation Technique(s)
|
Significant Unobservable Input
|
Range
(Weighted Average)
|
|||||||
|
Impaired loans
|
$
|
11,295
|
|
Appraised value, as adjusted
|
Recoverable oil and gas reserves, forward-looking commodity prices and estimated operating costs
|
22% - 59% (57%)
1
|
||||
|
Real estate and other repossessed assets
|
2,192
|
|
Appraised value, as adjusted
|
Marketability adjustments off appraised value
2
|
70% - 87% (74%)
|
|||||
|
1
|
Represents fair value as a percentage of the unpaid principal balance.
|
|
2
|
Marketability adjustments include consideration of estimated costs to sell which is approximately
10%
of the fair value.
|
A summary of quantitative information about Non-recurring Fair Value Measurements based on Significant Unobservable Inputs (Level 3) as of
December 31, 2015
follows (in thousands):
|
Quantitative Information about Level 3 Non-recurring Fair Value Measurements
|
||||||||||
|
Fair Value
|
Valuation Technique(s)
|
Significant Unobservable Input
|
Range
(Weighted Average)
|
|||||||
|
Impaired loans
|
$
|
20,805
|
|
Appraised value, as adjusted
|
Broker quotes and management's knowledge of industry and collateral.
|
N/A
|
||||
|
Real estate and other repossessed assets
|
245
|
|
Appraised value, as adjusted
|
Marketability adjustments off appraised value
1
|
66%-81% (74%)
|
|||||
|
1
|
Marketability adjustments include consideration of estimated costs to sell which is approximately
10%
of the fair value.
|
The fair value of pension plan assets was approximately
$42 million
at
December 31, 2016
and
$44 million
at
December 31, 2015
, determined by significant other observable inputs. Fair value adjustments of pension plan assets along with changes in the projected benefit obligation are recognized in other comprehensive income.
165
Fair Value of Financial Instruments
The following table presents the carrying values and estimated fair values of all financial instruments, including those financial assets and liabilities that are not measured and reported at fair value on a recurring basis or non-recurring (dollars in thousands):
|
December 31, 2016
|
||||||||||||||||
|
Carrying
Value
|
Estimated Fair Value
|
Quoted Prices in Active Markets for Identical Instruments (Level 1)
|
Significant Other Observable Inputs (Level 2)
|
Significant Unobservable Inputs (Level 3)
|
||||||||||||
|
Cash and due from banks
|
$
|
620,846
|
|
620,846
|
|
620,846
|
|
—
|
|
—
|
|
|||||
|
Interest-bearing cash and cash equivalents
|
1,916,651
|
|
1,916,651
|
|
1,916,651
|
|
—
|
|
—
|
|
||||||
|
Trading securities:
|
||||||||||||||||
|
U.S. government agency debentures
|
6,234
|
|
6,234
|
|
—
|
|
6,234
|
|
—
|
|
||||||
|
U.S. government agency residential mortgage-backed securities
|
310,067
|
|
310,067
|
|
—
|
|
310,067
|
|
—
|
|
||||||
|
Municipal and other tax-exempt securities
|
14,427
|
|
14,427
|
|
—
|
|
14,427
|
|
—
|
|
||||||
|
Other trading securities
|
6,900
|
|
6,900
|
|
—
|
|
6,900
|
|
—
|
|
||||||
|
Total trading securities
|
337,628
|
|
337,628
|
|
|
—
|
|
|
337,628
|
|
|
—
|
|
|||
|
Investment securities:
|
|
|
|
|
|
|||||||||||
|
Municipal and other tax-exempt securities
|
320,364
|
|
321,225
|
|
—
|
|
321,225
|
|
—
|
|
||||||
|
U.S. government agency residential mortgage-backed securities
|
20,777
|
|
21,473
|
|
—
|
|
21,473
|
|
—
|
|
||||||
|
Other debt securities
|
205,004
|
|
222,795
|
|
—
|
|
222,795
|
|
—
|
|
||||||
|
Total investment securities
|
546,145
|
|
565,493
|
|
—
|
|
565,493
|
|
—
|
|
||||||
|
Available for sale securities:
|
|
|
|
|
|
|||||||||||
|
U.S. Treasury securities
|
999
|
|
999
|
|
999
|
|
—
|
|
—
|
|
||||||
|
Municipal and other tax-exempt securities
|
40,993
|
|
40,993
|
|
—
|
|
35,204
|
|
5,789
|
|
||||||
|
U.S. government agency residential mortgage-backed securities
|
5,460,386
|
|
5,460,386
|
|
—
|
|
5,460,386
|
|
—
|
|
||||||
|
Privately issued residential mortgage-backed securities
|
115,535
|
|
115,535
|
|
—
|
|
115,535
|
|
—
|
|
||||||
|
Commercial mortgage-backed securities guaranteed by U.S. government agencies
|
3,017,933
|
|
3,017,933
|
|
—
|
|
3,017,933
|
|
—
|
|
||||||
|
Other debt securities
|
4,152
|
|
4,152
|
|
—
|
|
—
|
|
4,152
|
|
||||||
|
Perpetual preferred stock
|
18,474
|
|
18,474
|
|
—
|
|
18,474
|
|
—
|
|
||||||
|
Equity securities and mutual funds
|
18,357
|
|
18,357
|
|
3,495
|
|
14,862
|
|
—
|
|
||||||
|
Total available for sale securities
|
8,676,829
|
|
8,676,829
|
|
4,494
|
|
8,662,394
|
|
9,941
|
|
||||||
|
Fair value option securities – U.S. government agency residential mortgage-backed securities
|
77,046
|
|
77,046
|
|
—
|
|
77,046
|
|
—
|
|
||||||
|
Residential mortgage loans held for sale
|
301,897
|
|
301,897
|
|
—
|
|
290,280
|
|
11,617
|
|
||||||
|
Loans:
|
|
|
||||||||||||||
|
Commercial
|
10,390,824
|
|
10,437,016
|
|
—
|
|
—
|
|
10,437,016
|
|
||||||
|
Commercial real estate
|
3,809,046
|
|
3,850,981
|
|
—
|
|
—
|
|
3,850,981
|
|
||||||
|
Residential mortgage
|
1,949,832
|
|
2,025,159
|
|
—
|
|
—
|
|
2,025,159
|
|
||||||
|
Personal
|
839,958
|
|
864,904
|
|
—
|
|
—
|
|
864,904
|
|
||||||
|
Total loans
|
16,989,660
|
|
17,178,060
|
|
—
|
—
|
|
17,178,060
|
|
|||||||
|
Allowance for loan losses
|
(246,159
|
)
|
—
|
|
—
|
—
|
|
—
|
|
|||||||
|
Loans, net of allowance
|
16,743,501
|
|
17,178,060
|
|
—
|
—
|
|
17,178,060
|
|
|||||||
|
Mortgage servicing rights
|
247,073
|
|
247,073
|
|
—
|
|
—
|
|
247,073
|
|
||||||
|
Derivative instruments with positive fair value, net of cash margin
|
689,872
|
|
689,872
|
|
7,541
|
|
682,331
|
|
—
|
|
||||||
|
Deposits with no stated maturity
|
20,526,295
|
|
20,526,295
|
|
—
|
|
—
|
|
20,526,295
|
|
||||||
|
Time deposits
|
2,221,800
|
|
2,218,303
|
|
—
|
|
—
|
|
2,218,303
|
|
||||||
|
Other borrowed funds
|
5,572,662
|
|
5,556,327
|
|
—
|
|
—
|
|
5,556,327
|
|
||||||
|
Subordinated debentures
|
144,640
|
|
128,903
|
|
—
|
|
128,903
|
|
—
|
|
||||||
|
Derivative instruments with negative fair value, net of cash margin
|
664,531
|
|
664,531
|
|
6,972
|
|
657,559
|
|
—
|
|
||||||
166
|
December 31, 2015
|
||||||||||||||||||
|
Carrying
Value
|
Estimated Fair Value
|
Quoted Prices in Active Markets for Identical Instruments (Level 1)
|
Significant Other Observable Inputs (Level 2)
|
Significant Unobservable Inputs (Level 3)
|
||||||||||||||
|
Cash and due from banks
|
$
|
573,699
|
|
$
|
573,699
|
|
573,699
|
|
—
|
|
$
|
—
|
|
|||||
|
Interest-bearing cash and cash equivalents
|
2,069,900
|
|
2,069,900
|
|
2,069,900
|
|
—
|
|
—
|
|
||||||||
|
Trading securities:
|
||||||||||||||||||
|
U.S. government agency debentures
|
61,295
|
|
61,295
|
|
—
|
|
61,295
|
|
—
|
|
||||||||
|
U.S. government agency residential mortgage-backed securities
|
10,989
|
|
10,989
|
|
—
|
|
10,989
|
|
—
|
|
||||||||
|
Municipal and other tax-exempt securities
|
31,901
|
|
31,901
|
|
—
|
|
31,901
|
|
—
|
|
||||||||
|
Other trading securities
|
18,219
|
|
18,219
|
|
—
|
|
18,219
|
|
—
|
|
||||||||
|
Total trading securities
|
122,404
|
|
122,404
|
|
—
|
|
122,404
|
|
—
|
|
||||||||
|
Investment securities:
|
|
|
|
|
|
|||||||||||||
|
Municipal and other tax-exempt securities
|
365,258
|
|
368,910
|
|
—
|
|
368,910
|
|
—
|
|
||||||||
|
U.S. government agency residential mortgage-backed securities
|
26,833
|
|
27,874
|
|
—
|
|
27,874
|
|
—
|
|
||||||||
|
Other debt securities
|
205,745
|
|
232,375
|
|
—
|
|
232,375
|
|
—
|
|
||||||||
|
Total investment securities
|
597,836
|
|
629,159
|
|
—
|
|
629,159
|
|
—
|
|
||||||||
|
Available for sale securities:
|
|
|
|
|
|
|||||||||||||
|
U.S. Treasury securities
|
995
|
|
995
|
|
995
|
|
—
|
|
—
|
|
||||||||
|
Municipal and other tax-exempt securities
|
56,817
|
|
56,817
|
|
—
|
|
47,207
|
|
9,610
|
|
||||||||
|
U.S. government agency residential mortgage-backed securities
|
5,898,351
|
|
5,898,351
|
|
—
|
|
5,898,351
|
|
—
|
|
||||||||
|
Privately issued residential mortgage-backed securities
|
139,118
|
|
139,118
|
|
—
|
|
139,118
|
|
—
|
|
||||||||
|
Commercial mortgage-backed securities guaranteed by U.S. government agencies
|
2,905,796
|
|
2,905,796
|
|
—
|
|
2,905,796
|
|
—
|
|
||||||||
|
Other debt securities
|
4,151
|
|
4,151
|
|
—
|
|
—
|
|
4,151
|
|
||||||||
|
Perpetual preferred stock
|
19,672
|
|
19,672
|
|
—
|
|
19,672
|
|
—
|
|
||||||||
|
Equity securities and mutual funds
|
17,833
|
|
17,833
|
|
3,265
|
|
14,568
|
|
—
|
|
||||||||
|
Total available for sale securities
|
9,042,733
|
|
9,042,733
|
|
4,260
|
|
9,024,712
|
|
13,761
|
|
||||||||
|
Fair value option securities – U.S. government agency residential mortgage-backed securities
|
444,217
|
|
444,217
|
|
—
|
|
444,217
|
|
—
|
|
||||||||
|
Residential mortgage loans held for sale
|
308,439
|
|
308,439
|
|
—
|
|
300,565
|
|
7,874
|
|
||||||||
|
Loans:
|
|
|
||||||||||||||||
|
Commercial
|
10,252,531
|
|
10,053,952
|
|
—
|
|
—
|
|
10,053,952
|
|
||||||||
|
Commercial real estate
|
3,259,033
|
|
3,233,476
|
|
—
|
|
—
|
|
3,233,476
|
|
||||||||
|
Residential mortgage
|
1,876,893
|
|
1,902,976
|
|
—
|
|
—
|
|
1,902,976
|
|
||||||||
|
Personal
|
552,697
|
|
549,068
|
|
—
|
|
—
|
|
549,068
|
|
||||||||
|
Total loans
|
15,941,154
|
|
15,739,472
|
|
—
|
|
—
|
|
15,739,472
|
|
||||||||
|
Allowance for loan losses
|
(225,524
|
)
|
—
|
|
—
|
|
—
|
|
—
|
|
||||||||
|
Loans, net of allowance
|
15,715,630
|
|
15,739,472
|
|
—
|
|
—
|
|
15,739,472
|
|
||||||||
|
Mortgage servicing rights
|
218,605
|
|
218,605
|
|
—
|
|
—
|
|
218,605
|
|
||||||||
|
Derivative instruments with positive fair value, net of cash margin
|
586,270
|
|
586,270
|
|
38,530
|
|
547,740
|
|
—
|
|
||||||||
|
Deposits with no stated maturity
|
18,682,094
|
|
18,682,094
|
|
—
|
|
—
|
|
18,682,094
|
|
||||||||
|
Time deposits
|
2,406,064
|
|
2,394,562
|
|
—
|
|
—
|
|
2,394,562
|
|
||||||||
|
Other borrowed funds
|
6,051,515
|
|
5,600,932
|
|
—
|
|
—
|
|
5,600,932
|
|
||||||||
|
Subordinated debentures
|
226,350
|
|
223,758
|
|
—
|
|
—
|
|
223,758
|
|
||||||||
|
Derivative instruments with negative fair value, net of cash margin
|
581,701
|
|
581,701
|
|
—
|
|
581,701
|
|
—
|
|
||||||||
Because no market exists for certain of these financial instruments and management does not intend to sell these financial instruments, the fair values shown in the tables above may not represent values at which the respective financial instruments could be sold individually or in the aggregate at the given reporting date.
167
The following methods and assumptions were used in estimating the fair value of these financial instruments:
Cash and Cash Equivalents
The book value reported in the consolidated balance sheet for cash and short-term instruments approximates those assets’ fair values.
Securities
The fair values of securities are generally based on Significant Other Observable Inputs such as quoted prices for comparable instruments or interest rates and credit spreads, yield curves, volatilities, prepayment speeds and loss severities.
Loans
The fair value of loans, excluding loans held for sale, are based on discounted cash flow analyses using interest rates and credit and liquidity spreads currently being offered for loans with similar remaining terms to maturity and risk, adjusted for the impact of interest rate floors and ceilings which are classified as Significant Unobservable Inputs. The fair values of loans were estimated to approximate their discounted cash flows less loan loss allowances allocated to these loans of
$218 million
at
December 31, 2016
and
$195 million
at
December 31, 2015
. A summary of assumptions used in determining the fair value of loans follows:
|
Range of
Contractual Yields |
Average
Re-pricing (in years) |
Discount
Rate |
||||
|
December 31, 2016
|
||||||
|
Commercial
|
0.38% - 30.00%
|
0.70
|
0.64% - 4.60%
|
|||
|
Commercial real estate
|
0.38% - 18.00%
|
0.71
|
0.94% - 4.27%
|
|||
|
Residential mortgage
|
1.74% - 18.00%
|
2.27
|
1.71% - 4.26%
|
|||
|
Personal
|
0.25% - 21.00%
|
0.40
|
1.03% - 4.59%
|
|||
|
December 31, 2015
|
||||||
|
Commercial
|
0.25% - 30.00%
|
0.62
|
0.52% - 4.34%
|
|||
|
Commercial real estate
|
0.38% - 18.00%
|
0.73
|
0.95% - 3.93%
|
|||
|
Residential mortgage
|
1.67% - 18.00%
|
2.42
|
0.86% - 4.25%
|
|||
|
Personal
|
0.38% - 21.00%
|
0.37
|
1.19% - 4.11%
|
|||
Deposits
The fair values of time deposits are based on discounted cash flow analyses using interest rates currently being offered on similar transactions which are considered Significant Unobservable Inputs. Estimated fair value of deposits with no stated maturity, which includes demand deposits, transaction deposits, money market deposits and savings accounts, is equal to the amount payable on demand. Although market premiums paid reflect an additional value for these low cost deposits, adjusting fair value for the expected benefit of these deposits is prohibited. Accordingly, the positive effect of such deposits is not included in the tables above.A summary of assumptions used in determining the fair value of time deposits follows:
|
Range of
Contractual Yields |
Average
Re-pricing (in years) |
Discount
Rate |
||||
|
December 31, 2016
|
0.02% - 9.65%
|
1.96
|
1.57% - 2.00%
|
|||
|
December 31, 2015
|
0.02% - 5.50%
|
1.78
|
1.11% - 1.57%
|
|||
168
Other Borrowed Funds and Subordinated Debentures
The fair values of these instruments are based upon discounted cash flow analyses using interest rates currently being offered on similar instruments which are considered Significant Unobservable Inputs. A summary of assumptions used in determining the fair value of other borrowings and subordinated debentures follows:
|
Range of
Contractual Yields |
Average
Re-pricing (in years) |
Discount
Rate |
||||
|
December 31, 2016
|
||||||
|
Other borrowed funds
|
0.25% - 3.50%
|
0.00
|
0.55% - 3.22%
|
|||
|
Subordinated debentures
|
5.38%
|
16.86
|
6.11%
|
|||
|
December 31, 2015
|
||||||
|
Other borrowed funds
|
0.25% - 3.40%
|
0.00
|
0.20% - 2.89%
|
|||
|
Subordinated debentures
|
1.05%
|
1.37
|
2.12%
|
|||
Off-Balance Sheet Instruments
The fair values of commercial loan commitments are based on fees currently charged to enter into similar agreements, taking into account the remaining terms of the agreements. The fair values of these off-balance sheet instruments were not significant at
December 31, 2016
or
December 31, 2015
.
Fair Value Election
As more fully disclosed in Note
2
and Note
7
to the Consolidated Financial Statements, the Company has elected to carry all U.S. government agency residential mortgage-backed securities held as economic hedges against changes in the fair value of mortgage servicing rights and all residential mortgage loans originated for sale at fair value. Changes in the fair value of these financial instruments are recognized in earnings.
169
(
19
)
Parent Company Only Financial Statements
Summarized financial information for BOK Financial – Parent Company Only follows:
Balance Sheets
(In thousands)
|
December 31,
|
||||||||
|
|
2016
|
2015
|
||||||
|
Assets
|
|
|
||||||
|
Cash and cash equivalents
|
$
|
163,418
|
|
$
|
282,169
|
|
||
|
Available for sale securities
|
19,234
|
|
20,150
|
|
||||
|
Investment in bank subsidiaries
|
3,067,595
|
|
2,746,810
|
|
||||
|
Investment in non-bank subsidiaries
|
177,068
|
|
186,271
|
|
||||
|
Other assets
|
4,865
|
|
1,534
|
|
||||
|
Total assets
|
$
|
3,432,180
|
|
$
|
3,236,934
|
|
||
|
Liabilities and Shareholders’ Equity
|
||||||||
|
Liabilities:
|
||||||||
|
Other liabilities
|
$
|
5,469
|
|
$
|
6,378
|
|
||
|
Other borrowings – Trust preferred debt
|
7,217
|
|
—
|
|
||||
|
Subordinated debentures
|
144,640
|
|
—
|
|
||||
|
Total liabilities
|
157,326
|
|
6,378
|
|
||||
|
Shareholders’ equity:
|
||||||||
|
Common stock
|
4
|
|
4
|
|
||||
|
Capital surplus
|
1,006,535
|
|
982,009
|
|
||||
|
Retained earnings
|
2,823,334
|
|
2,704,121
|
|
||||
|
Treasury stock
|
(544,052
|
)
|
(477,165
|
)
|
||||
|
Accumulated other comprehensive income (loss)
|
(10,967
|
)
|
21,587
|
|
||||
|
Total shareholders’ equity
|
3,274,854
|
|
3,230,556
|
|
||||
|
Total liabilities and shareholders’ equity
|
$
|
3,432,180
|
|
$
|
3,236,934
|
|
||
170
(In thousands)
|
Year Ended December 31,
|
||||||||||||
|
2016
|
2015
|
2014
|
||||||||||
|
Dividends, interest and fees received from bank subsidiaries
|
$
|
15,237
|
|
$
|
150,308
|
|
$
|
75,412
|
|
|||
|
Dividends, interest and fees received from non-bank subsidiaries
|
25,923
|
|
—
|
|
—
|
|
||||||
|
Other revenue
|
1,612
|
|
1,279
|
|
1,572
|
|
||||||
|
Total revenue
|
42,772
|
|
151,587
|
|
76,984
|
|
||||||
|
Interest expense
|
4,182
|
|
131
|
|
293
|
|
||||||
|
Charitable contributions to BOKF Foundation
|
—
|
|
—
|
|
2,420
|
|
||||||
|
Professional fees and services
|
395
|
|
378
|
|
600
|
|
||||||
|
Other operating expense
|
1,583
|
|
1,864
|
|
1,556
|
|
||||||
|
Total expense
|
6,160
|
|
2,373
|
|
4,869
|
|
||||||
|
Income before taxes and equity in undistributed income of subsidiaries
|
36,612
|
|
149,214
|
|
72,115
|
|
||||||
|
Federal and state income taxes
|
(1,920
|
)
|
(375
|
)
|
(1,702
|
)
|
||||||
|
Income before equity in undistributed income of subsidiaries
|
38,532
|
|
149,589
|
|
73,817
|
|
||||||
|
Equity in undistributed income of bank subsidiaries
|
216,120
|
|
134,045
|
|
214,435
|
|
||||||
|
Equity in undistributed income of non-bank subsidiaries
|
(21,984
|
)
|
4,931
|
|
4,183
|
|
||||||
|
Net income attributable to BOK Financial Corp. shareholders
|
$
|
232,668
|
|
$
|
288,565
|
|
$
|
292,435
|
|
|||
171
Statements of Cash Flows
(In thousands)
|
Year Ended December 31,
|
||||||||||||
|
|
2016
|
2015
|
2014
|
|||||||||
|
Cash Flows From Operating Activities:
|
|
|
|
|||||||||
|
Net income
|
$
|
232,668
|
|
$
|
288,565
|
|
$
|
292,435
|
|
|||
|
Adjustments to reconcile net income to net cash provided by operating activities:
|
||||||||||||
|
Equity in undistributed income of bank subsidiaries
|
(216,120
|
)
|
(134,045
|
)
|
(214,435
|
)
|
||||||
|
Equity in undistributed income of non-bank subsidiaries
|
21,984
|
|
(4,931
|
)
|
(4,183
|
)
|
||||||
|
Tax effect from equity compensation, net
|
(1,505
|
)
|
(925
|
)
|
(8,258
|
)
|
||||||
|
Change in other assets
|
(2,933
|
)
|
49
|
|
8,726
|
|
||||||
|
Change in other liabilities
|
(1,285
|
)
|
(2,818
|
)
|
1,055
|
|
||||||
|
Net cash provided by operating activities
|
32,809
|
|
145,895
|
|
75,340
|
|
||||||
|
Cash Flows From Investing Activities:
|
||||||||||||
|
Proceeds from sales of available for sale securities
|
1,632
|
|
4,760
|
|
—
|
|
||||||
|
Investment in subsidiaries
|
(26,000
|
)
|
(41,969
|
)
|
(15,336
|
)
|
||||||
|
Acquisitions, net of cash acquired
|
(105,520
|
)
|
—
|
|
—
|
|
||||||
|
Net cash used in investing activities
|
(129,888
|
)
|
(37,209
|
)
|
(15,336
|
)
|
||||||
|
Cash Flows From Financing Activities:
|
||||||||||||
|
Issuance of subordinated debentures, net of issuance costs
|
144,615
|
|
—
|
|
—
|
|
||||||
|
Issuance of common and treasury stock, net
|
12,455
|
|
6,711
|
|
4,472
|
|
||||||
|
Tax effect from equity compensation, net
|
1,505
|
|
925
|
|
8,258
|
|
||||||
|
Dividends paid
|
(113,455
|
)
|
(115,281
|
)
|
(111,026
|
)
|
||||||
|
Repurchase of common stock
|
(66,792
|
)
|
(229,540
|
)
|
(12,337
|
)
|
||||||
|
Net cash used in financing activities
|
(21,672
|
)
|
(337,185
|
)
|
(110,633
|
)
|
||||||
|
Net decrease in cash and cash equivalents
|
(118,751
|
)
|
(228,499
|
)
|
(50,629
|
)
|
||||||
|
Cash and cash equivalents at beginning of period
|
282,169
|
|
510,668
|
|
561,297
|
|
||||||
|
Cash and cash equivalents at end of period
|
$
|
163,418
|
|
$
|
282,169
|
|
$
|
510,668
|
|
|||
|
Cash paid for interest
|
$
|
4,127
|
|
$
|
131
|
|
$
|
293
|
|
|||
|
Issuance of shares in settlement of deferred compensation, net
|
$
|
—
|
|
$
|
—
|
|
$
|
8,352
|
|
|||
(
20
)
Subsequent Events
The Company evaluated events from the date of the consolidated financial statements on
December 31, 2016
through the issuance of those consolidated financial statements included in this Annual Report on Form 10-K. No events were identified requiring recognition in and/or disclosure in the consolidated financial statements.
172
173
|
Annual Financial Summary – Unaudited
Consolidated Daily Average Balances, Average Yields and Rates
|
|||||||||||
|
(Dollars in Thousands, Except Per Share Data)
|
Year Ended
|
||||||||||
|
|
December 31, 2016
|
||||||||||
|
Average
Balance
|
Revenue/
Expense
|
Yield/
Rate
|
|||||||||
|
Assets
|
|
|
|
||||||||
|
Interest-bearing cash and cash equivalents
|
$
|
2,038,919
|
|
$
|
10,726
|
|
0.53
|
%
|
|||
|
Trading securities
|
317,808
|
|
9,213
|
|
3.43
|
%
|
|||||
|
Investment securities
|
|||||||||||
|
Taxable
|
226,442
|
|
12,268
|
|
5.42
|
%
|
|||||
|
Tax-exempt
|
334,812
|
|
7,567
|
|
2.26
|
%
|
|||||
|
Total investment securities
|
561,254
|
|
19,835
|
|
3.54
|
%
|
|||||
|
Available for sale securities
|
|||||||||||
|
Taxable
|
8,799,716
|
|
173,272
|
|
2.01
|
%
|
|||||
|
Tax-exempt
|
67,667
|
|
3,353
|
|
5.18
|
%
|
|||||
|
Total available for sale securities
|
8,867,383
|
|
176,625
|
|
2.03
|
%
|
|||||
|
Fair value option securities
|
323,695
|
|
6,723
|
|
1.93
|
%
|
|||||
|
Restricted equity securities
|
320,975
|
|
17,238
|
|
5.37
|
%
|
|||||
|
Residential mortgage loans held for sale
|
370,600
|
|
12,658
|
|
3.45
|
%
|
|||||
|
Loans
|
16,357,867
|
|
593,700
|
|
3.63
|
%
|
|||||
|
Allowance for loan losses
|
(243,631
|
)
|
|||||||||
|
Loans, net of allowance
|
16,114,236
|
|
593,700
|
|
3.68
|
%
|
|||||
|
Total earning assets
|
28,914,870
|
|
846,718
|
|
2.95
|
%
|
|||||
|
Receivable on unsettled securities sales
|
114,773
|
|
|||||||||
|
Cash and other assets
|
3,248,759
|
|
|||||||||
|
Total assets
|
$
|
32,278,402
|
|
||||||||
|
Liabilities and equity
|
|||||||||||
|
Interest-bearing deposits:
|
|||||||||||
|
Transaction
|
$
|
9,744,998
|
|
$
|
13,906
|
|
0.14
|
%
|
|||
|
Savings
|
414,103
|
|
386
|
|
0.09
|
%
|
|||||
|
Time
|
2,259,242
|
|
26,202
|
|
1.16
|
%
|
|||||
|
Total interest-bearing deposits
|
12,418,343
|
|
40,494
|
|
0.33
|
%
|
|||||
|
Funds purchased
|
78,222
|
|
186
|
|
0.24
|
%
|
|||||
|
Repurchase agreements
|
589,145
|
|
248
|
|
0.04
|
%
|
|||||
|
Other borrowings
|
6,019,647
|
|
34,902
|
|
0.58
|
%
|
|||||
|
Subordinated debentures
|
214,842
|
|
6,059
|
|
2.82
|
%
|
|||||
|
Total interest-bearing liabilities
|
19,320,199
|
|
81,889
|
|
0.42
|
%
|
|||||
|
Non-interest bearing demand deposits
|
8,474,230
|
|
|||||||||
|
Due on unsettled securities purchases
|
132,539
|
|
|||||||||
|
Other liabilities
|
1,002,018
|
|
|||||||||
|
Total equity
|
3,349,416
|
|
|||||||||
|
Total liabilities and equity
|
$
|
32,278,402
|
|
||||||||
|
Tax-equivalent Net Interest Revenue
|
$
|
764,829
|
|
2.53
|
%
|
||||||
|
Tax-equivalent Net Interest Revenue to Earning Assets
|
2.66
|
%
|
|||||||||
|
Less tax-equivalent adjustment
|
17,601
|
|
|||||||||
|
Net Interest Revenue
|
747,228
|
|
|||||||||
|
Provision for credit losses
|
65,000
|
|
|||||||||
|
Other operating revenue
|
674,020
|
|
|||||||||
|
Other operating expense
|
1,017,590
|
|
|||||||||
|
Net income before taxes
|
338,658
|
|
|||||||||
|
Federal and state income taxes
|
106,377
|
|
|||||||||
|
Net income
|
232,281
|
|
|||||||||
|
Net income attributable to non-controlling interests
|
(387
|
)
|
|||||||||
|
Net income attributable to BOK Financial Corporation shareholders
|
$
|
232,668
|
|
||||||||
|
Earnings Per Average Common Share Equivalent:
|
|
|
|
|
|
|
|||||
|
Net income:
|
|
|
|
|
|
|
|||||
|
Basic
|
|
|
$
|
3.53
|
|
|
|
||||
|
Diluted
|
|
|
$
|
3.53
|
|
|
|
||||
Yield calculations are shown on a tax equivalent at the statutory federal and state rates for the periods presented.The yield calculations exclude security trades that have been recorded on trade date with no corresponding interest income and the unrealized gains and losses. The yield calculation also include average loan balances for which the accrual of interest has been discontinued and are net of unearned income. Yield/rate calculations are generally based on the conventions that determine how interest income and expense is accrued.
174
|
Annual Financial Summary – Unaudited (continued)
Consolidated Daily Average Balances, Average Yields and Rates
|
|||||||||||||||||||||
|
(Dollars in Thousands, Except Per Share Data)
|
Year Ended
|
||||||||||||||||||||
|
|
December 31, 2015
|
December 31, 2014
|
|||||||||||||||||||
|
Average
Balance |
Revenue/
Expense |
Yield/
Rate |
Average
Balance |
Revenue/
Expense |
Yield/
Rate |
||||||||||||||||
|
Assets
|
|
|
|
|
|
|
|||||||||||||||
|
Interest-bearing cash and cash equivalents
|
$
|
2,031,403
|
|
$
|
5,580
|
|
0.27
|
%
|
$
|
1,127,664
|
|
$
|
2,749
|
|
0.24
|
%
|
|||||
|
Trading securities
|
149,572
|
|
3,055
|
|
2.49
|
%
|
120,415
|
|
2,520
|
|
2.57
|
%
|
|||||||||
|
Investment securities
|
|||||||||||||||||||||
|
Taxable
|
236,193
|
|
12,932
|
|
5.48
|
%
|
233,105
|
|
13,183
|
|
5.66
|
%
|
|||||||||
|
Tax-exempt
|
386,122
|
|
5,971
|
|
1.55
|
%
|
422,507
|
|
6,785
|
|
1.61
|
%
|
|||||||||
|
Total investment securities
|
622,315
|
|
18,903
|
|
3.04
|
%
|
655,612
|
|
19,968
|
|
3.05
|
%
|
|||||||||
|
Available for sale securities
|
|||||||||||||||||||||
|
Taxable
|
8,937,418
|
|
172,582
|
|
1.97
|
%
|
9,546,366
|
|
182,923
|
|
1.94
|
%
|
|||||||||
|
Tax-exempt
|
81,469
|
|
3,341
|
|
4.25
|
%
|
92,438
|
|
3,321
|
|
3.73
|
%
|
|||||||||
|
Total available for sale securities
|
9,018,887
|
|
175,923
|
|
1.99
|
%
|
9,638,804
|
|
186,244
|
|
1.95
|
%
|
|||||||||
|
Fair value option securities
|
426,461
|
|
9,264
|
|
2.26
|
%
|
183,206
|
|
3,611
|
|
2.05
|
%
|
|||||||||
|
Restricted equity securities
|
230,140
|
|
13,532
|
|
5.88
|
%
|
127,161
|
|
7,040
|
|
5.54
|
%
|
|||||||||
|
Residential mortgage loans held for sale
|
380,979
|
|
13,602
|
|
3.59
|
%
|
259,809
|
|
10,143
|
|
3.93
|
%
|
|||||||||
|
Loans
|
15,063,002
|
|
539,426
|
|
3.58
|
%
|
13,406,118
|
|
510,916
|
|
3.81
|
%
|
|||||||||
|
Allowance for loan losses
|
(200,872
|
)
|
(189,574
|
)
|
|||||||||||||||||
|
Loans, net of allowance
|
14,862,130
|
|
539,426
|
|
3.63
|
%
|
13,216,544
|
|
510,916
|
|
3.87
|
%
|
|||||||||
|
Total earning assets
|
27,721,887
|
|
779,285
|
|
2.84
|
%
|
25,329,215
|
|
743,191
|
|
2.95
|
%
|
|||||||||
|
Receivable on unsettled securities sales
|
80,079
|
|
88,784
|
|
|||||||||||||||||
|
Cash and other assets
|
2,772,789
|
|
2,580,859
|
|
|||||||||||||||||
|
Total assets
|
$
|
30,574,755
|
|
$
|
27,998,858
|
|
|||||||||||||||
|
Liabilities and equity
|
|||||||||||||||||||||
|
Interest-bearing deposits:
|
|||||||||||||||||||||
|
Transaction
|
$
|
9,919,913
|
|
$
|
8,821
|
|
0.09
|
%
|
$
|
9,737,795
|
|
$
|
9,757
|
|
0.10
|
%
|
|||||
|
Savings
|
377,497
|
|
383
|
|
0.10
|
%
|
345,183
|
|
401
|
|
0.12
|
%
|
|||||||||
|
Time
|
2,587,367
|
|
34,966
|
|
1.35
|
%
|
2,644,847
|
|
40,525
|
|
1.53
|
%
|
|||||||||
|
Total interest-bearing deposits
|
12,884,777
|
|
44,170
|
|
0.34
|
%
|
12,727,825
|
|
50,683
|
|
0.40
|
%
|
|||||||||
|
Funds purchased
|
69,149
|
|
65
|
|
0.09
|
%
|
494,220
|
|
341
|
|
0.07
|
%
|
|||||||||
|
Repurchase agreements
|
766,410
|
|
282
|
|
0.04
|
%
|
928,767
|
|
583
|
|
0.06
|
%
|
|||||||||
|
Other borrowings
|
4,212,417
|
|
13,857
|
|
0.33
|
%
|
1,928,742
|
|
6,748
|
|
0.35
|
%
|
|||||||||
|
Subordinated debentures
|
276,662
|
|
5,100
|
|
1.84
|
%
|
347,892
|
|
8,690
|
|
2.50
|
%
|
|||||||||
|
Total interest-bearing liabilities
|
18,209,415
|
|
63,474
|
|
0.35
|
%
|
16,427,446
|
|
67,045
|
|
0.41
|
%
|
|||||||||
|
Non-interest bearing demand deposits
|
8,048,469
|
|
7,687,333
|
|
|||||||||||||||||
|
Due on unsettled securities purchases
|
173,743
|
|
136,360
|
|
|||||||||||||||||
|
Other liabilities
|
769,823
|
|
536,958
|
|
|||||||||||||||||
|
Total equity
|
3,373,305
|
|
3,210,761
|
|
|||||||||||||||||
|
Total liabilities and equity
|
$
|
30,574,755
|
|
$
|
27,998,858
|
|
|||||||||||||||
|
Tax-equivalent Net Interest Revenue
|
$
|
715,811
|
|
2.49
|
%
|
$
|
676,146
|
|
2.54
|
%
|
|||||||||||
|
Tax-equivalent Net Interest Revenue to Earning Assets
|
2.60
|
%
|
2.68
|
%
|
|||||||||||||||||
|
Less tax-equivalent adjustment
|
12,457
|
|
10,952
|
|
|||||||||||||||||
|
Net Interest Revenue
|
703,354
|
|
665,194
|
|
|||||||||||||||||
|
Provision for credit losses
|
34,000
|
|
—
|
|
|||||||||||||||||
|
Other operating revenue
|
658,480
|
|
621,958
|
|
|||||||||||||||||
|
Other operating expense
|
896,191
|
|
847,522
|
|
|||||||||||||||||
|
Net income before taxes
|
431,643
|
|
439,630
|
|
|||||||||||||||||
|
Federal and state income taxes
|
139,384
|
|
144,151
|
|
|||||||||||||||||
|
Net income
|
292,259
|
|
295,479
|
|
|||||||||||||||||
|
Net income attributable to non-controlling interests
|
3,694
|
|
3,044
|
|
|||||||||||||||||
|
Net income attributable to BOK Financial Corporation shareholders
|
$
|
288,565
|
|
$
|
292,435
|
|
|||||||||||||||
|
Earnings Per Average Common Share Equivalent:
|
|
|
|
|
|
|
|||||||||||||||
|
Net income:
|
|
|
|
|
|
|
|||||||||||||||
|
Basic
|
|
|
$
|
4.22
|
|
|
|
$
|
4.23
|
|
|||||||||||
|
Diluted
|
|
|
$
|
4.21
|
|
|
|
$
|
4.22
|
|
|||||||||||
175
|
Quarterly Financial Summary – Unaudited
Consolidated Daily Average Balances, Average Yields and Rates
|
||||||||||||||||||||||
|
(In Thousands, Except Per Share Data)
|
Three Months Ended
|
|||||||||||||||||||||
|
|
December 31, 2016
|
September 30, 2016
|
||||||||||||||||||||
|
Average
Balance
|
Revenue/
Expense
|
Yield/
Rate
|
Average
Balance
|
Revenue/
Expense
|
Yield/
Rate
|
|||||||||||||||||
|
Assets
|
|
|
|
|
|
|
||||||||||||||||
|
Interest-bearing cash and cash equivalents
|
$
|
2,032,785
|
|
$
|
2,800
|
|
0.55
|
%
|
$
|
2,047,991
|
|
$
|
2,651
|
|
0.51
|
%
|
||||||
|
Trading securities
|
476,498
|
|
4,554
|
|
3.91
|
%
|
366,545
|
|
3,157
|
|
2.71
|
%
|
||||||||||
|
Investment securities
|
||||||||||||||||||||||
|
Taxable
|
224,376
|
|
3,024
|
|
5.39
|
%
|
224,518
|
|
3,000
|
|
5.34
|
%
|
||||||||||
|
Tax-exempt
|
318,493
|
|
1,854
|
|
2.33
|
%
|
328,074
|
|
1,851
|
|
2.26
|
%
|
||||||||||
|
Total investment securities
|
542,869
|
|
4,878
|
|
3.60
|
%
|
552,592
|
|
4,851
|
|
3.51
|
%
|
||||||||||
|
Available for sale securities
|
|
|
|
|
|
|
||||||||||||||||
|
Taxable
|
8,706,449
|
|
42,482
|
|
1.98
|
%
|
8,795,869
|
|
42,513
|
|
1.99
|
%
|
||||||||||
|
Tax-exempt
|
60,106
|
|
748
|
|
5.27
|
%
|
66,721
|
|
867
|
|
5.47
|
%
|
||||||||||
|
Total available for sale securities
|
8,766,555
|
|
43,230
|
|
2.00
|
%
|
8,862,590
|
|
43,380
|
|
2.01
|
%
|
||||||||||
|
Fair value option securities
|
210,733
|
|
541
|
|
0.99
|
%
|
266,998
|
|
1,531
|
|
1.70
|
%
|
||||||||||
|
Restricted equity securities
|
334,114
|
|
4,554
|
|
5.45
|
%
|
335,812
|
|
4,510
|
|
5.37
|
%
|
||||||||||
|
Residential mortgage loans held for sale
|
345,066
|
|
2,835
|
|
3.31
|
%
|
445,930
|
|
3,615
|
|
3.28
|
%
|
||||||||||
|
Loans
|
16,723,588
|
|
156,734
|
|
3.67
|
%
|
16,447,750
|
|
150,077
|
|
3.63
|
%
|
||||||||||
|
Allowance for loan losses
|
(246,977
|
)
|
(247,901
|
)
|
||||||||||||||||||
|
Loans, net of allowance
|
16,476,611
|
|
156,734
|
|
3.72
|
%
|
16,199,849
|
|
150,077
|
|
3.69
|
%
|
||||||||||
|
Total earning assets
|
29,185,231
|
|
220,126
|
|
2.98
|
%
|
29,078,307
|
|
213,772
|
|
2.93
|
%
|
||||||||||
|
Receivable on unsettled securities sales
|
33,813
|
|
259,906
|
|
||||||||||||||||||
|
Cash and other assets
|
3,742,032
|
|
3,308,260
|
|
||||||||||||||||||
|
Total assets
|
$
|
32,961,076
|
|
$
|
32,646,473
|
|
||||||||||||||||
|
Liabilities and equity
|
|
|
|
|
|
|
|
|
|
|
|
|
||||||||||
|
Interest-bearing deposits:
|
|
|
|
|
|
|
|
|
|
|
|
|
||||||||||
|
Transaction
|
$
|
9,980,132
|
|
$
|
3,912
|
|
0.16
|
%
|
$
|
9,650,618
|
|
$
|
3,417
|
|
0.14
|
%
|
||||||
|
Savings
|
421,654
|
|
91
|
|
0.09
|
%
|
420,009
|
|
100
|
|
0.09
|
%
|
||||||||||
|
Time
|
2,177,035
|
|
6,140
|
|
1.12
|
%
|
2,197,350
|
|
6,295
|
|
1.14
|
%
|
||||||||||
|
Total interest-bearing deposits
|
12,578,821
|
|
10,143
|
|
0.32
|
%
|
12,267,977
|
|
9,812
|
|
0.32
|
%
|
||||||||||
|
Funds purchased
|
62,004
|
|
44
|
|
0.28
|
%
|
68,280
|
|
33
|
|
0.19
|
%
|
||||||||||
|
Repurchase agreements
|
560,891
|
|
34
|
|
0.02
|
%
|
522,822
|
|
53
|
|
0.04
|
%
|
||||||||||
|
Other borrowings
|
6,072,150
|
|
9,315
|
|
0.61
|
%
|
6,342,369
|
|
9,105
|
|
0.57
|
%
|
||||||||||
|
Subordinated debentures
|
144,635
|
|
2,003
|
|
5.51
|
%
|
255,890
|
|
2,468
|
|
3.84
|
%
|
||||||||||
|
Total interest-bearing liabilities
|
19,418,501
|
|
21,539
|
|
0.44
|
%
|
19,457,338
|
|
21,471
|
|
0.44
|
%
|
||||||||||
|
Non-interest bearing demand deposits
|
9,124,595
|
|
8,497,037
|
|
||||||||||||||||||
|
Due on unsettled securities purchases
|
77,575
|
|
200,574
|
|
||||||||||||||||||
|
Other liabilities
|
1,004,212
|
|
1,099,858
|
|
||||||||||||||||||
|
Total equity
|
3,336,193
|
|
3,391,666
|
|
||||||||||||||||||
|
Total liabilities and equity
|
$
|
32,961,076
|
|
$
|
32,646,473
|
|
||||||||||||||||
|
Tax-equivalent Net Interest Revenue
|
$
|
198,587
|
|
2.54
|
%
|
$
|
192,301
|
|
2.49
|
%
|
||||||||||||
|
Tax-equivalent Net Interest Revenue to Earning Assets
|
2.69
|
%
|
2.64
|
%
|
||||||||||||||||||
|
Less tax-equivalent adjustment
|
4,389
|
|
4,455
|
|
||||||||||||||||||
|
Net Interest Revenue
|
194,198
|
|
187,846
|
|
||||||||||||||||||
|
Provision for credit losses
|
—
|
|
10,000
|
|
||||||||||||||||||
|
Other operating revenue
|
143,754
|
|
187,310
|
|
||||||||||||||||||
|
Other operating expense
|
265,547
|
|
258,088
|
|
||||||||||||||||||
|
Net income before taxes
|
72,405
|
|
107,068
|
|
||||||||||||||||||
|
Federal and state income taxes
|
22,496
|
|
31,956
|
|
||||||||||||||||||
|
Net income
|
49,909
|
|
75,112
|
|
||||||||||||||||||
|
Net income attributable to non-controlling interests
|
(117
|
)
|
835
|
|
||||||||||||||||||
|
Net income attributable to BOK Financial Corp. shareholders
|
$
|
50,026
|
|
$
|
74,277
|
|
||||||||||||||||
|
Earnings Per Average Common Share Equivalent:
|
|
|
|
|
|
|
|
|
|
|
||||||||||||
|
Net income:
|
|
|
|
|
|
|
|
|
|
|
|
|
||||||||||
|
Basic
|
|
|
$
|
0.76
|
|
|
|
|
|
$
|
1.13
|
|
|
|
||||||||
|
Diluted
|
|
|
$
|
0.76
|
|
|
|
|
|
$
|
1.13
|
|
|
|
||||||||
176
|
Quarterly Financial Summary – Unaudited (continued)
Consolidated Daily Average Balances, Average Yields and Rates
|
|||||||||||||||||||||||||||||||
|
Three Months Ended
|
|||||||||||||||||||||||||||||||
|
June 30, 2016
|
Mar. 31, 2016
|
December 31, 2015
|
|||||||||||||||||||||||||||||
|
Average Balance
|
Revenue /Expense
|
Yield / Rate
|
Average Balance
|
Revenue / Expense
|
Yield / Rate
|
Average Balance
|
Revenue / Expense
|
Yield / Rate
|
|||||||||||||||||||||||
|
$
|
2,022,028
|
|
$
|
2,569
|
|
0.51
|
%
|
$
|
2,052,840
|
|
$
|
2,706
|
|
0.53
|
%
|
$
|
1,995,945
|
|
$
|
1,466
|
|
0.29
|
%
|
||||||||
|
237,808
|
|
775
|
|
1.89
|
%
|
188,100
|
|
727
|
|
2.47
|
%
|
150,402
|
|
840
|
|
2.86
|
%
|
||||||||||||||
|
227,103
|
|
3,069
|
|
5.41
|
%
|
229,817
|
|
3,175
|
|
5.53
|
%
|
232,566
|
|
3,144
|
|
5.41
|
%
|
||||||||||||||
|
335,288
|
|
1,878
|
|
2.25
|
%
|
357,648
|
|
1,984
|
|
2.22
|
%
|
369,803
|
|
1,413
|
|
1.53
|
%
|
||||||||||||||
|
562,391
|
|
4,947
|
|
3.52
|
%
|
587,465
|
|
5,159
|
|
3.51
|
%
|
602,369
|
|
4,557
|
|
3.03
|
%
|
||||||||||||||
|
8,819,135
|
|
43,345
|
|
2.01
|
%
|
8,878,478
|
|
44,932
|
|
2.06
|
%
|
8,894,019
|
|
43,649
|
|
2.02
|
%
|
||||||||||||||
|
70,977
|
|
862
|
|
5.06
|
%
|
72,958
|
|
876
|
|
4.95
|
%
|
77,071
|
|
786
|
|
4.22
|
%
|
||||||||||||||
|
8,890,112
|
|
44,207
|
|
2.04
|
%
|
8,951,435
|
|
45,808
|
|
2.08
|
%
|
8,971,090
|
|
44,435
|
|
2.04
|
%
|
||||||||||||||
|
368,434
|
|
2,062
|
|
2.19
|
%
|
450,478
|
|
2,589
|
|
2.38
|
%
|
435,449
|
|
2,461
|
|
2.32
|
%
|
||||||||||||||
|
319,136
|
|
3,863
|
|
4.84
|
%
|
294,529
|
|
4,311
|
|
5.85
|
%
|
262,461
|
|
3,905
|
|
5.95
|
%
|
||||||||||||||
|
401,114
|
|
3,508
|
|
3.53
|
%
|
289,743
|
|
2,700
|
|
3.75
|
%
|
310,425
|
|
2,968
|
|
3.85
|
%
|
||||||||||||||
|
16,263,132
|
|
144,708
|
|
3.58
|
%
|
15,991,993
|
|
142,181
|
|
3.57
|
%
|
15,586,998
|
|
139,372
|
|
3.55
|
%
|
||||||||||||||
|
(245,448
|
)
|
(234,116
|
)
|
(207,156
|
)
|
||||||||||||||||||||||||||
|
16,017,684
|
|
144,708
|
|
3.63
|
%
|
15,757,877
|
|
142,181
|
|
3.63
|
%
|
15,379,842
|
|
139,372
|
|
3.60
|
%
|
||||||||||||||
|
28,818,707
|
|
206,639
|
|
2.91
|
%
|
28,572,467
|
|
206,181
|
|
2.92
|
%
|
28,107,983
|
|
200,004
|
|
2.86
|
%
|
||||||||||||||
|
49,568
|
|
115,101
|
|
62,228
|
|
||||||||||||||||||||||||||
|
3,117,767
|
|
2,820,903
|
|
2,909,965
|
|
||||||||||||||||||||||||||
|
$
|
31,986,042
|
|
$
|
31,508,471
|
|
$
|
31,080,176
|
|
|||||||||||||||||||||||
|
$
|
9,590,855
|
|
$
|
3,260
|
|
0.14
|
%
|
$
|
9,756,843
|
|
$
|
3,317
|
|
0.14
|
%
|
$
|
9,527,491
|
|
$
|
2,098
|
|
0.09
|
%
|
||||||||
|
417,122
|
|
102
|
|
0.10
|
%
|
397,479
|
|
93
|
|
0.09
|
%
|
382,284
|
|
89
|
|
0.09
|
%
|
||||||||||||||
|
2,297,621
|
|
6,635
|
|
1.16
|
%
|
2,366,543
|
|
7,132
|
|
1.21
|
%
|
2,482,714
|
|
7,881
|
|
1.26
|
%
|
||||||||||||||
|
12,305,598
|
|
9,997
|
|
0.33
|
%
|
12,520,865
|
|
10,542
|
|
0.34
|
%
|
12,392,489
|
|
10,068
|
|
0.32
|
%
|
||||||||||||||
|
70,682
|
|
33
|
|
0.19
|
%
|
112,211
|
|
76
|
|
0.27
|
%
|
73,220
|
|
21
|
|
0.11
|
%
|
||||||||||||||
|
611,264
|
|
72
|
|
0.05
|
%
|
662,640
|
|
89
|
|
0.05
|
%
|
623,921
|
|
68
|
|
0.04
|
%
|
||||||||||||||
|
6,076,028
|
|
8,675
|
|
0.57
|
%
|
5,583,917
|
|
7,807
|
|
0.56
|
%
|
4,957,175
|
|
4,720
|
|
0.38
|
%
|
||||||||||||||
|
232,795
|
|
878
|
|
1.52
|
%
|
226,368
|
|
710
|
|
1.26
|
%
|
226,332
|
|
644
|
|
1.13
|
%
|
||||||||||||||
|
19,296,367
|
|
19,655
|
|
0.41
|
%
|
19,106,001
|
|
19,224
|
|
0.40
|
%
|
18,273,137
|
|
15,521
|
|
0.34
|
%
|
||||||||||||||
|
8,162,134
|
|
8,105,756
|
|
8,312,961
|
|
||||||||||||||||||||||||||
|
93,812
|
|
158,050
|
|
248,811
|
|
||||||||||||||||||||||||||
|
1,089,483
|
|
813,427
|
|
884,652
|
|
||||||||||||||||||||||||||
|
3,344,246
|
|
3,325,237
|
|
3,360,615
|
|
||||||||||||||||||||||||||
|
$
|
31,986,042
|
|
$
|
31,508,471
|
|
$
|
31,080,176
|
|
|||||||||||||||||||||||
|
$
|
186,984
|
|
2.50
|
%
|
$
|
186,957
|
|
2.52
|
%
|
$
|
184,483
|
|
2.52
|
%
|
|||||||||||||||||
|
2.63
|
%
|
2.65
|
%
|
2.64
|
%
|
||||||||||||||||||||||||||
|
4,372
|
|
4,385
|
|
3,222
|
|
||||||||||||||||||||||||||
|
182,612
|
|
182,572
|
|
181,261
|
|
||||||||||||||||||||||||||
|
20,000
|
|
35,000
|
|
22,500
|
|
||||||||||||||||||||||||||
|
185,542
|
|
157,414
|
|
158,983
|
|
||||||||||||||||||||||||||
|
251,385
|
|
242,570
|
|
230,426
|
|
||||||||||||||||||||||||||
|
96,769
|
|
62,416
|
|
87,318
|
|
||||||||||||||||||||||||||
|
30,497
|
|
21,428
|
|
26,242
|
|
||||||||||||||||||||||||||
|
66,272
|
|
40,988
|
|
61,076
|
|
||||||||||||||||||||||||||
|
471
|
|
(1,576
|
)
|
1,475
|
|
||||||||||||||||||||||||||
|
$
|
65,801
|
|
$
|
42,564
|
|
$
|
59,601
|
|
|||||||||||||||||||||||
|
|
|
$
|
1.00
|
|
|
|
|
|
$
|
0.64
|
|
|
|
|
|
$
|
0.89
|
|
|
|
|||||||||||
|
|
|
$
|
1.00
|
|
|
|
|
|
$
|
0.64
|
|
|
|
|
|
$
|
0.89
|
|
|
|
|||||||||||
177
None.
As of the end of the period covered by this report and pursuant to Rule 13a-15 of the Securities Exchange Act of 1934 (the “Exchange Act”), the Company's management, including the Chief Executive Officer and Chief Financial Officer, conducted an evaluation of the effectiveness and design of the Company's disclosure controls and procedures (as that term is defined in Rules 13a-15(e) and 15d-15(e) of the Exchange Act). Based upon that evaluation, the Company's Chief Executive Officer and Chief Financial Officer concluded, as of the end of the period covered by this report, that the Company's disclosure controls and procedures were effective in recording, processing, summarizing and reporting information required to be disclosed by the Company, within the time periods specified in the Securities and Exchange Commission's rules and forms.
In addition and as of the end of the period covered by this report, there have been no changes in internal control over financial reporting (as defined in Rule 13a-15(f) and 15d-15(f), as amended, of the Exchange Act) during the Company's fourth fiscal quarter
that have materially affected, or are reasonably likely to materially affect, the internal control over financial reporting.
Management's Report on Internal Control over Financial Reporting appears within Item 8, “Financial Statements and Supplementary Data.” The independent registered public accounting firm, Ernst & Young LLP, has audited the financial statements included in Item 8 and has issued an audit report on the Company's internal control over financial reporting, which appears therein.
None.
The information set forth under the headings “Election of Directors,” “Executive Officers, “Insider Reporting,” “Director Nominations,” and “Report of the Audit Committee” in BOK Financial's
2017
Annual Proxy Statement is incorporated herein by reference.
The Company has a Code of Ethics which is applicable to all Directors, officers and employees of the Company, including the Chief Executive Officer and the Chief Financial Officer, the principal executive officer and principal financial and accounting officer, respectively. A copy of the Code of Ethics will be provided without charge to any person who requests it by writing to the Company's headquarters at Bank of Oklahoma Tower, P.O. Box 2300, Tulsa, Oklahoma 74192 or telephoning the Chief Risk Officer at (918) 588-6000. The Company will also make available amendments to or waivers from its Code of Ethics applicable to Directors or executive officers, including the Chief Executive Officer and the Chief Financial Officer, in accordance with all applicable laws and regulations.
There are no material changes to the procedures by which security holders may recommend nominees to the Company's board of directors since the Company's
2016
Annual Proxy Statement to Shareholders.
The information set forth under the heading “Compensation Discussion and Analysis,” “Compensation Committee Interlocks and Insider Participation, “Compensation Committee Report,” “Executive Compensation Tables,” and “Director Compensation” in BOK Financial's
2017
Annual Proxy Statement is incorporated herein by reference.
178
The information set forth under the headings “Security Ownership of Certain Beneficial Owners and Management” and “Election of Directors” in BOK Financial's
2017
Annual Proxy Statement is incorporated herein by reference.
Information regarding related parties is set forth in Note
13
of the Company's Notes to Consolidated Financial Statements, which appears elsewhere herein. Additionally, the information set forth under the headings “Certain Transactions,” “Director Independence” and “Related Party Transaction Review and Approval Process” in BOK Financial's
2017
Annual Proxy Statement is incorporated herein by reference.
The information set forth under the heading “Principal Accountant Fees and Services” in BOK Financial's
2017
Annual Proxy Statement is incorporated herein by reference.
(a) (1) Financial Statements
The following financial statements of BOK Financial Corporation are filed as part of this Form 10-K in Item 8:
Consolidated Statements of Earnings for the years ended December 31,
2016
,
2015
and
2014
Consolidated Statements of Comprehensive Income for the years ended December 31,
2016
,
2015
and
2014
Consolidated Balance Sheets as of December 31,
2016
and
2015
Consolidated Statements of Cash Flows for the years ended December 31,
2016
,
2015
and
2014
Consolidated Statements of Changes in Equity for the years ended December 31,
2016
,
2015
and
2014
Notes to Consolidated Financial Statements
Annual Financial Summary - Unaudited
Quarterly Financial Summary - Unaudited
Reports of Independent Registered Public Accounting Firm
(a) (2) Financial Statement Schedules
The schedules to the consolidated financial statements required by Regulation S-X are not required under the related instructions or are inapplicable and are therefore omitted.
179
(a) (3) Exhibits
|
Exhibit Number
|
Description of Exhibit
|
|
|
|
|
3.0
|
The Articles of Incorporation of BOK Financial, incorporated by reference to (i) Amended and Restated Certificate of Incorporation of BOK Financial filed with the Oklahoma Secretary of State on May 28, 1991, filed as Exhibit 3.0 to S-1 Registration Statement No. 33-90450, and (ii) Amendment attached as Exhibit A to Information Statement and Prospectus Supplement filed November 20, 1991.
|
|
|
|
|
3.1
|
Bylaws of BOK Financial, incorporated by reference to Exhibit 3.1 of S-1 Registration Statement No. 33-90450.
|
|
|
|
|
3.1(a)
|
Bylaws of BOK Financial, as amended and restated as of October 30, 2007, incorporated by reference to Exhibit 3.1 of Form 8-K filed on November 5, 2007.
|
|
|
|
|
4.0
|
The rights of the holders of the Common Stock and Preferred Stock of BOK Financial are set forth in its Certificate of Incorporation.
|
|
4.2
|
Subordinated Notes Indenture, dated as of June 27, 2016, between the Company and U.S. Bank National Association, as trustee (incorporated by reference to Exhibit 4.1 to the Company's filing on Form 8-K filed June 27, 2016).
|
|
4.3
|
Form of 5.375% Subordinated Notes due 2056 Global Security (incorporated by reference to Exhibit 4.2 to the Company's Registration Statement on Form 8-A filed on June 24, 2016).
|
|
|
|
|
10.0
|
Purchase and Sale Agreement dated October 25, 1990, among BOK Financial, Kaiser, and the FDIC, incorporated by reference to Exhibit 2.0 of S-1 Registration Statement No. 33-90450.
|
|
|
|
|
10.1
|
Amendment to Purchase and Sale Agreement effective March 29, 1991, among BOK Financial, Kaiser, and the FDIC, incorporated by reference to Exhibit 2.2 of S-1 Registration Statement No. 33-90450.
|
|
|
|
|
10.2
|
Letter agreement dated April 12, 1991, among BOK Financial, Kaiser, and the FDIC, incorporated by reference to Exhibit 2.3 of S-1 Registration Statement No. 33-90450.
|
|
|
|
|
10.3
|
Second Amendment to Purchase and Sale Agreement effective April 15, 1991, among BOK Financial, Kaiser, and the FDIC, incorporated by reference to Exhibit 2.4 of S-1 Registration Statement No. 33-90450.
|
|
|
|
|
10.4
|
Employment and Compensation Agreements.
|
|
|
|
|
10.4.2
|
Amended and Restated Deferred Compensation Agreement (Amended as of December 1, 2003) between Steven G. Bradshaw and BOK Financial Corporation, incorporated by reference to Exhibit 10.4.2 of Form 10-K for the fiscal year ended December 31, 2003.
|
|
|
|
|
10.4.2 (a)
|
409A Deferred Compensation Agreement between Steven G. Bradshaw and BOK Financial Corporation dated December 31, 2004, incorporated by reference to Exhibit 10.4.2 (a) of Form 8-K filed on January 5, 2005.
|
|
|
|
|
10.4.2 (b)
|
Employment Agreement between BOK Financial and Steven G. Bradshaw dated September 29, 2003, incorporated by reference to Exhibit 10.4.2 (b) of Form 10-K for the fiscal year ended December 31, 2004.
|
|
|
|
|
10.4.2 (c)
|
Amended and Restated Employment Agreement (amended as of June 30, 2013) between BOK Financial and Steven G. Bradshaw, incorporated by reference to Exhibit 99.A of Form 8-K filed August 20, 2013.
|
|
10.4.7
|
409A Deferred Compensation Agreement between Steven E. Nell and BOK Financial Corporation dated December 31, 2004, incorporated by reference to Exhibit 10.4.7 of Form 8-K filed on January 5, 2005.
|
|
|
|
|
10.4.7 (a)
|
Amended and Restated Deferred Compensation Agreement (Amended as of December 1, 2003) between Steven E. Nell and BOK Financial Corporation, incorporated by reference to Exhibit 10.4.7 (a) of Form 10-K for the fiscal year ended December 31, 2004.
|
|
10.4.7 (b)
|
Amended and Restated Employment Agreement (amended June 15, 2013) between BOK Financial and Steven Nell incorporated by reference to Exhibit 99.B of Form 8-K filed September 4, 2013.
|
|
10.4.8
|
Employment Agreement dated August 1, 2005 between BOK Financial Corporation and Donald T. Parker, incorporated by reference to Exhibit 99 (a) of Form 8-K filed on February 1, 2006.
|
180
|
Exhibit Number
|
Description of Exhibit
|
|
10.4.8 (a)
|
Amended and Restated Employment Agreement Dated June 15, 2013 between BOK Financial and Donald T. Parker, incorporated by reference to Exhibit 10.4.8(a) of Form 10-K filed on February 27, 2015.
|
|
|
|
|
10.4.9
|
Employment Agreement dated April 4, 2008 between Bank of Texas, NA, and Norman P. Bagwell, incorporated by reference to Exhibit 10.4.9 of Form 10-K filed on February 27, 2013.
|
|
10.4.9 (a)
|
First Amendment of Employment Agreement dated June 30, 2011 between Bank of Texas, a division of BOKF, NA, and Norman P. Bagwell, incorporated by reference to Exhibit 10.4.9 (a) of Form 10-K filed on February 27, 2013.
|
|
10.4.9 (b)
|
Amended and Restated Employment Agreement (amended as of June 15, 2013) between BOK Financial and Norman Bagwell, incorporated by reference to Exhibit 99.A of Form 8-K filed September 4, 2013.
|
|
10.4.10
|
Amended and Restated Employment Agreement (amended as of June 15, 2013) between BOK Financial and Stacy C. Kymes, filed herewith.
|
|
10.6
|
Capitalization and Stock Purchase Agreement dated May 20, 1991, between BOK Financial and Kaiser, incorporated by reference to Exhibit 10.6 of S-1 Registration Statement No. 33-90450.
|
|
|
|
|
10.7.7
|
BOK Financial Corporation 2001 Stock Option Plan, incorporated by reference to Exhibit 4.0 of S-8 Registration Statement No. 333-62578.
|
|
|
|
|
10.7.8
|
BOK Financial Corporation Directors' Stock Compensation Plan, incorporated by reference to Exhibit 4.0 of S-8 Registration Statement No. 33-79836.
|
|
|
|
|
10.7.9
|
Bank of Oklahoma Thrift Plan (Amended and Restated Effective as of January 1, 1995), incorporated by reference to Exhibit 10.7.6 of Form 10-K for the year ended December 31, 1994.
|
|
|
|
|
10.7.10
|
Trust Agreement for the Bank of Oklahoma Thrift Plan (December 30, 1994), incorporated by reference to Exhibit 10.7.7 of Form 10-K for the year ended December 31, 1994.
|
|
|
|
|
10.7.11
|
BOK Financial Corporation 2003 Stock Option Plan, incorporated by reference to Exhibit 4.0 of S-8 Registration Statement No. 333-106531.
|
|
|
|
|
10.7.12
|
BOK Financial Corporation 2003 Executive Incentive Plan, incorporated by reference to Exhibit 4.0 of S-8 Registration Statement No. 333-106530.
|
|
|
|
|
10.7.13
|
10b5-1 Repurchase Plan between BOK Financial Corporation and BOSC, Inc. dated May 27, 2008, incorporated by reference to Exhibit 10.1 of Form 8-K filed May 27, 2008.
|
|
|
|
|
10.7.14
|
BOK Financial Corporation 2003 Executive Incentive Plan, as amended and restated, for the Chief Executive Officer and for Direct Reports to the Chief Executive Officer, incorporated by reference to the Schedule 14 A Definitive Proxy Statement filed on March 15, 2011.
|
|
10.7.16
|
BOK Financial Corporation 2009 Omnibus Incentive Plan, Amended and Restated effective April 30, 2013, incorporated by reference to the Schedule 14A Definitive Proxy Statement filed on March 20, 2013.
|
|
10.8
|
Lease Agreement between One Williams Center Co. and National Bank of Tulsa (predecessor to BOk) dated June 18, 1974, incorporated by reference to Exhibit 10.9 of S-1 Registration Statement No. 33-90450.
|
|
|
|
|
10.9
|
Lease Agreement between Security Capital Real Estate Fund and BOk dated January 1, 1988, incorporated by reference to Exhibit 10.10 of S-1 Registration Statement No. 33-90450.
|
|
21
|
Subsidiaries of BOK Financial, filed herewith.
|
|
|
|
|
23
|
Consent of independent registered public accounting firm - Ernst & Young LLP, filed herewith.
|
|
31.1
|
Certification of Chief Executive Officer Pursuant to Section 302 of the Sarbanes-Oxley Act of 2002, filed herewith.
|
|
|
|
|
31.2
|
Certification of Chief Financial Officer Pursuant to Section 302 of the Sarbanes-Oxley Act of 2002, filed herewith.
|
|
|
|
181
|
Exhibit Number
|
Description of Exhibit
|
|
32
|
Certification of Chief Executive Officer and Chief Financial Officer Pursuant to 18 U.S.C. Section 1350, as Adopted Pursuant to Section 906 of the Sarbanes-Oxley Act of 2002, filed herewith.
|
|
|
|
|
99
|
Additional Exhibits.
|
|
|
|
|
101
|
Interactive data files pursuant to Rule 405 of Regulation S-T: (i) the Consolidated Balance Sheets, (ii) the Consolidated Statements of Earnings, (iii) the Consolidated Statements of Changes in Equity, (iv) the Consolidated Statement of Cash Flows and (v) the Notes to the Consolidated Financial Statements, filed herewith.
|
(b) Exhibits
See Item 15 (a) (3) above.
(c) Financial Statement Schedules
See Item 15 (a) (2) above.
182
SIGNATURES
Pursuant to the requirements of Section 13 or 15(d) of the Securities Exchange Act of 1934, the registrant has duly caused this report to be signed on its behalf by the undersigned, thereunto duly authorized.
BOK FINANCIAL CORPORATION
DATE:
February 28, 2017
BY:
/s/ George B. Kaiser
George B. Kaiser Chairman of the Board of Directors
Pursuant to the requirements of the Securities Exchange Act of 1934, this report has been signed below on
February 28, 2017
, by the following persons on behalf of the registrant and in the capacities indicated.
OFFICERS
|
/s/ George B. Kaiser
|
|
/s/ Steven G. Bradshaw
|
|
George B. Kaiser
Chairman of the Board of Directors
|
|
Steven G. Bradshaw
Director, President and Chief Executive Officer
|
|
/s/ Steven E. Nell
|
/s/ John C. Morrow
|
|
|
Steven E. Nell
Executive Vice President and
Chief Financial Officer
|
|
John C. Morrow
Senior Vice President and
Chief Accounting Officer
|
183
DIRECTORS
|
/s/ Kimberley D. Henry
|
||
|
Alan S. Armstrong
|
|
Kimberley D. Henry
|
|
/s/ E. Carey Joullian, IV
|
||
|
C. Frederick Ball, Jr.
|
|
E. Carey Joullian, IV
|
|
/s/ Jack E. Finley
|
||
|
Jack E. Finley
|
|
Stanley A. Lybarger
|
|
/s/ Chester E. Cadieux, III
|
||
|
Chester E. Cadieux, III
|
|
Steven J. Malcolm
|
|
/s/ Joseph W. Craft, III
|
/s/ Emmet C. Richards
|
|
|
Joseph W. Craft, III
|
Emmet C. Richards
|
|
|
/s/ John W. Gibson
|
|
/s/ Robert J. LaFortune
|
|
John W. Gibson
|
|
Robert J. LaFortune
|
|
/s/ David F. Griffin
|
||
|
David F. Griffin
|
Michael C. Turpen
|
|
|
V. Burns Hargis
|
R.A. Walker
|
|
|
Douglas D. Hawthorne
|
Peter C. Boylan III
|
|
184
TABLE OF CONTENTS
Part IItem 1. BusinessItem 1A. Risk FactorsItem 1B. Unresolved Staff CommentsItem 2. PropertiesItem 3. Legal ProceedingsItem 4. Mine Safety DisclosuresPart IIItem 5. Market For Registrant S Common Equity, Related Stockholder Matters and Issuer Purchases Of Equity SecuritiesItem 6. Selected Financial DataItem 7. Management S Discussion and Analysis Of Financial Condition and Results Of OperationsItem 7A. Quantitative and Qualitative Disclosures About Market RiskItem 8. Financial Statements and Supplementary DataItem 9. Changes in and Disagreements with Accountants on Accounting and Financial DisclosureItem 9A. Controls and ProceduresItem 9B. Other InformationPart IIIItem 10. Directors, Executive Officers and Corporate GovernanceItem 11. Executive CompensationItem 12. Security Ownership Of Certain Beneficial Owners and Management and Related Stockholder MattersItem 13. Certain Relationships and Related Transactions, and Director IndependenceItem 14. Principal Accountant Fees and ServicesPart IVItem 15. Exhibits, Financial Statement Schedules