DMC GLOBAL INC.
10-Ks and 10-Qs
|
|
|
|
|
|
|
|
|
|
|
|
|
|
|
|
|
|
|
|
|
|
|
|
|
|
|
|
|
|
|
|
|
|
|
|
|
|
|
|
|
|
|
|
|
|
|
|
|
|
|
|
|
|
|
|
|
|
|
|
|
|
UNITED STATES
SECURITIES AND EXCHANGE COMMISSION
WASHINGTON, D.C. 20549
Form 10-K
(Mark One)
x
ANNUAL REPORT PURSUANT TO SECTION 13 OR 15(d) OF THE SECURITIES AND EXCHANGE ACT OF 1934
For the fiscal year ended
December 31, 2013
o
TRANSITION REPORT UNDER SECTION 13 OR 15(d) OF THE SECURITIES ACT OF 1934
FOR THE TRANSITION PERIOD FROM TO
Commission file number 001-14775
DYNAMIC MATERIALS CORPORATION
(Exact name of Registrant as Specified in its Charter)
|
Delaware
|
|
84-0608431
|
|
(State of Incorporation or Organization)
|
|
(I.R.S. Employer Identification No.)
|
5405 Spine Road, Boulder, Colorado 80301
(Address of principal executive offices, including zip code)
(303) 665-5700
(Registrant’s telephone number, including area code)
Securities registered pursuant to Section 12(b) of the Act:
|
Title of each class
|
|
Name of each exchange on which registered
|
|
Common Stock, $.05 Par Value
|
|
The Nasdaq National Market
|
Indicate by check mark if the registrant is a well-known seasoned issuer, as defined in Rule 405 of the Securities Act.
Yes
o
No
x
Indicate by check mark if the registrant is not required to file reports pursuant to Section 13 or 15(d) of the Act from their obligations under those sections. Yes
o
No
x
Indicate by check mark whether the registrant: (1) has filed all reports required to be filed by Section 13 or 15(d) of the Securities Exchange Act of 1934 during the preceding 12 months (or for such shorter period that the registrant was required to file such reports), and (2) has been subject to such filing requirements for the past 90 days. Yes
x
No
o
Indicate by check mark whether the registrant has submitted electronically and posted on its corporate Web site, if any, every Interactive Data File required to be submitted and posted pursuant to Rule 405 of Regulation S-T (§232.405 of this chapter) during the preceding 12 months (or for such shorter period that the registrant was required to submit and post such files). Yes
x
No
o
Indicate by check mark if disclosure of delinquent filers pursuant to Item 405 of Regulation S-K (§229.405 of this chapter) is not contained herein, and will not be contained, to the best of the registrant’s knowledge, in definitive proxy or information statements incorporated by reference in Part III of this Form 10-K or any amendment to this Form 10-K.
x
Indicate by check mark whether the registrant is a large accelerated filer, an accelerated filer, a non-accelerated filer, or a smaller reporting company. See the definitions of “large accelerated filer,” “accelerated filer” and “smaller reporting company” in Rule 12b-2 of the Exchange Act.
|
Large accelerated filer
o
|
|
Accelerated filer
x
|
|
|
|
|
|
Non-accelerated filer
o
(Do not check if smaller reporting company)
|
|
Smaller reporting company
o
|
Indicate by check mark whether the registrant is a shell company (as defined in Rule 12b-2 under the Act). Yes
o
No
x
The approximate aggregate market value of the voting stock held by non-affiliates of the registrant was $215,127,331 as of June 30, 2013.
The number of shares of Common Stock outstanding was
13,934,094
as of
March 7, 2014
.
Certain information required by Items 10, 11, 12, 13 and 14 of Form 10-K is incorporated by reference into Part III hereof from the registrant’s proxy statement for its 2014 Annual Meeting of Shareholders, which is expected to be filed with the Securities and Exchange Commission (“SEC”) within 120 days of the close of the registrant’s fiscal year ended December 31, 2013.
TABLE OF CONTENTS
|
|
|
Page
|
|
|
||
|
|
||
2
ITEM 1.
Business
References made in this Annual Report on Form 10-K to “we”, “our”, “us”, “DMC” and the “Company” refer to Dynamic Materials Corporation and its consolidated subsidiaries.
Overview
Dynamic Materials Corporation operates a diversified family of technical product and process businesses serving the energy, industrial and infrastructure markets. Our businesses operate globally through an international network of manufacturing, distribution and sales facilities.
Today, our business segments consist of NobelClad (56.5% of 2013 net sales), DynaEnergetics (39.9% of 2013 net sales), and AMK Technical Services (3.6% of 2013 net sales).
NobelClad is a global leader in the production of explosion-welded clad metal plates for use in the construction of corrosion resistant industrial processing equipment and specialized transition joints. DynaEnergetics manufactures and distributes products utilized by the global oil and gas industry principally for the perforation of oil and gas wells. AMK Technical Services provides advanced welding services, primarily to the oil and gas, power turbine and aircraft engine manufacturing industries.
Our Strategy
Our diversified business segments each provide a suite of unique technical products or services to niche segments of the global energy, industrial and infrastructure markets; and each of our businesses has established a strong or leading position in the markets in which they participate. With an underlying focus on free-cash flow generation, our objective is to sustain and grow the market share of our businesses through geographic expansion, and research and development of new and adjacent products that can be sold across our global network of sales and distribution facilities. We also intend to explore potential acquisitions of complementary businesses that could strengthen or add to our existing product and service portfolio, or expand our geographic footprint and market presence.
Business Segments
NobelClad
Clad metal plates are typically used in the construction of heavy, corrosion resistant pressure vessels and heat exchangers. Clad metal plates consist of a thin layer of an expensive, corrosion resistant metal, such as titanium or stainless steel, which is metallurgically combined with a less expensive structural base metal, such as steel. For heavy equipment, clad plates generally provide an economical alternative to building the equipment solely of a corrosion resistant alloy.
There are three major industrial clad plate manufacturing technologies; Explosion Welding, Hot Rollbonding and Weld Overlay. Explosion welding, the technology utilized by NobelClad, is the most versatile of the clad plate manufacturing technologies. Being a robust cold welding technology, explosion-welded clad products exhibit high bond strength combined with the unaltered corrosion resistance and mechanical properties of the pre-clad components. The explosion-welded clad process is suitable for joining virtually any combination of common engineering metals.
Explosion-welded clad metal is produced as flat plates or concentric cylinders which can be further formed and fabricated
as needed. When fabricated properly, the two metals will not come apart. The dimensional capabilities of the process are broad: cladding metal layers can range from a few thousandths of an inch to several inches and base metal thickness and lateral dimensions are primarily limited by the size capabilities of the world’s metal production mills. Explosion welding is used to clad a very broad range of metals to steel including aluminum, titanium, zirconium, nickel alloys, and stainless steels. The alternative technologies are typically limited to the latter two. In addition to being used as corrosion resistant clad plates, the explosion welded components can be used as transition joints, facilitating conventional welding of dissimilar metals. NobelClad transition joints are used in the aluminum production, shipbuilding and transportation industries.
3
Clad Metal End Use Markets
Explosion-welded clad metal is primarily used in construction of large industrial equipment involving high pressures and temperatures and/or corrosive processes. The eight broad industrial sectors discussed below comprise the bulk of demand for NobelClad’s business. The demand for clad metal is driven by the underlying demand for new equipment and facility maintenance in these primary market sectors.
Oil and Gas:
Oil and gas end use markets include both oil and gas production and petroleum refining. Oil and gas production covers a broad scope of operations related to recovering oil and/or gas for subsequent processing in refineries. Clad metal is used in separators, glycol contactors, piping, heat exchangers and other related equipment. The increase in oil and gas production from deep, hot, and more corrosive fields has significantly increased the demand for clad equipment. Many non-traditional energy production methods are potentially commercially viable for bringing natural gas to the market. Clad is commonly used in these facilities. The primary clad metals for this market are stainless steel and nickel alloys clad to steel, with some use of reactive metals.
Petroleum refining processes frequently are corrosive, are hot, and operate at high pressures. Clad metal is extensively used in a broad range of equipment including desulfurization hydrotreaters, coke drums, distillation columns, separators and heat exchangers. In the United States, refineries are running near their full capacity; and adding capacity and reducing costly down-time are a high priority. The increasing reliance upon low quality, high sulfur crude further drives additional demand for new corrosion resistant equipment. Worldwide trends in regulatory control of sulfur emissions in gas, diesel and jet fuel are also increasing the need for clad equipment. Like the upstream oil and gas sector, the clad metals are primarily stainless steel and nickel alloys.
Alternative Energy:
Alternative energy technologies frequently involve conditions that necessitate clad metals. Solar panels predominantly incorporate high purity silicon. Processes for manufacturing high purity silicon utilize a broad range of highly corrosion resistant clad alloys. Many geothermal fields are corrosive, requiring high alloy clad separators to clean the hot steam. Cellulosic ethanol technologies may require corrosion resistant metals such as titanium and zirconium.
Chemical and Petrochemical:
Many common products, ranging from plastics to drugs to electronic materials, are produced by chemical processes. Because the production of these items often involves corrosive agents and is conducted under high pressures or temperatures, corrosion resistant equipment is needed, equipment that is best and most cost effectively produced using clad construction. One of the larger applications for titanium-clad equipment is in the manufacture of Purified Terephthalic Acid (“PTA”), a precursor product for polyester, which is used in everything from carpets to plastic bottles. This market requires extensive use of stainless steel and nickel alloys, but also uses titanium and, to a lesser extent, zirconium and tantalum.
Hydrometallurgy:
The processes for production of nickel, gold, and copper involve acids, high pressures, and high temperatures; and titanium-clad plates are used extensively for construction of associated autoclaves and peripheral equipment.
Aluminum Production:
Aluminum is reduced from its oxide in large electric smelters called potlines. The electric current is carried via aluminum conductors. The electricity must be transmitted into steel components for the high temperature smelting operations. Aluminum cannot be welded to steel conventionally. Explosion-welded aluminum-steel transition joints provide an energy efficient and highly durable solution for making these connections. Modern potlines use a large number of transition joints, which are typically replaced after approximately five years in service. Although aluminum production is the major electrochemical application for NobelClad products, there are a number of other electrochemical applications including production of magnesium, chlorine and chlorate.
Shipbuilding:
The combined problems of corrosion and top-side weight drive significant demand for our aluminum-steel transition joints. Top-side weight is often a significant problem with tall ships, including cruise ships, naval vessels, ferries and yachts. Use of aluminum in the upper structure and steel in the lower structure provides stability. Bolted joints between aluminum and steel corrode quickly in seawater. Aluminum cannot be welded directly to steel using traditional welding processes. Welded joints can only be made using transition joints. NobelClad products can be found on many well-known ships, including the QE II and modern U.S. Navy aircraft carriers.
Power Generation:
Fossil fuel and nuclear power generation plants require extensive use of heat exchangers, many of which require corrosion resistant alloys to handle low quality cooling water. Our clad plates are used extensively for heat exchanger tubesheets. The largest clad tubesheets are used in the final low-pressure condensers. For most coastal and brackish water-cooled plants, titanium is the metal of choice technically, and titanium-clad tubesheets are the low-cost solution for power plant condensers.
4
Industrial Refrigeration:
Heat exchangers are a core component of refrigeration systems. When the cooling fluid is seawater, brackish, or even slightly polluted, corrosion resistant metals are necessary. Metal selection can range from stainless steel to copper alloy to titanium. Explosion-welded clad metal is often the low cost solution for making the tubesheets. Applications range from refrigeration chillers on fishing boats to massive air conditioning units for skyscrapers, airports, and deep underground mines.
Operations
The NobelClad segment seeks to build on its leadership position in its markets. During the three years ended December 31, 2011, 2012 and 2013, the NobelClad segment represented approximately 60%, 57%, and 56% of our revenue, respectively. The three manufacturing plants and their respective shooting sites in Pennsylvania, Germany and France provide the production capacity to address concurrent projects for NobelClad’s current domestic and international customer base.
The primary product of the NobelClad segment is explosion-welded clad metal plate. Clad metal plates are used in the construction of heavy, corrosion resistant pressure vessels and heat exchangers for oil and gas, alternative energy, chemical and petrochemical, hydrometallurgy, aluminum production, shipbuilding, power generation, industrial refrigeration, and similar industries. The characteristics of NobelClad’s explosive metalworking processes may enable the development of new products in a variety of industries and NobelClad continues to explore such development opportunities.
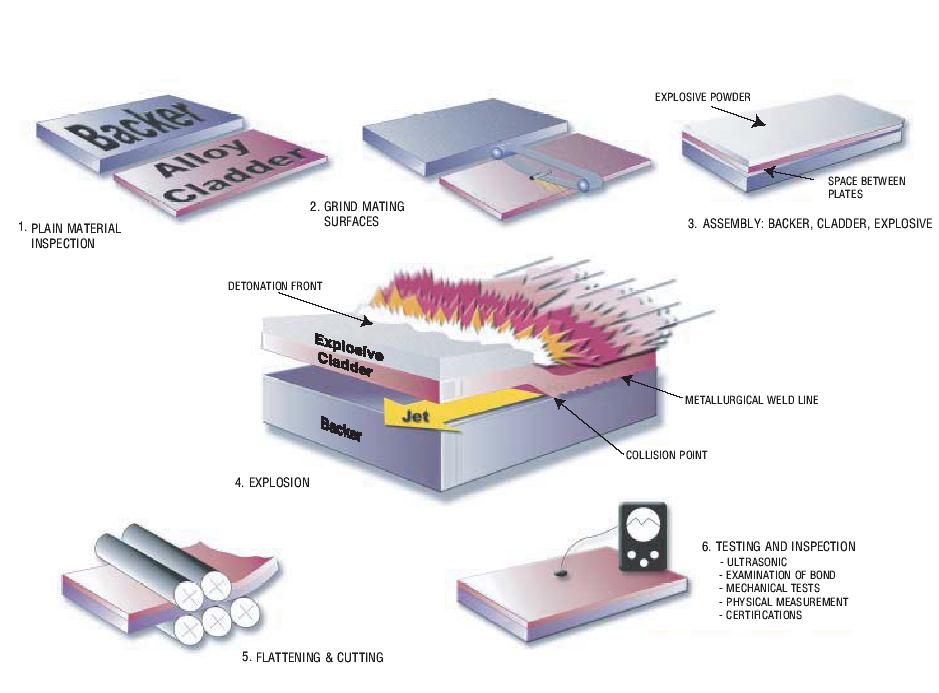
The principal product of metal cladding, regardless of the process used, is a metal plate composed of two or more dissimilar metals, usually a corrosion resistant metal and steel, bonded together. Prior to the explosion-welded clad process, the materials are inspected, the mating surfaces are ground, and the metal plates are assembled for cladding. The process involves placing a sheet of the cladder over a parallel plate of backer material and then covering the cladder material with a layer of specifically formulated explosive. A small gap or “standoff space” is maintained between the alloy cladder and the backer substrate. The explosion is then initiated on one side of the cladder and travels across the surface of the cladder forcing it down onto the backer. The explosion happens in approximately one-thousandth of a second. The collision conditions cause a thin layer of the mating surfaces to be spalled away in a jet. This action removes oxides and surface contaminants immediately ahead of the collision point. The extreme pressures force the two metal components together, creating a metallurgical bond between them. The explosion-welded clad process produces a strong, ductile, continuous metallurgical weld over the clad surface. After the explosion is completed, the resulting clad plates are flattened and cut, and then undergo testing and inspection to assure conformance with internationally accepted product specifications.
5
EXPLOSION-WELDING PROCESS
Explosion-welded cladding technology is a method to weld metals that cannot be welded by conventional processes, such as titanium-steel, aluminum-steel, and aluminum-copper. It can also be used to weld compatible metals, such as stainless steels and nickel alloys to steel. The cladding metals are typically titanium, stainless steel, aluminum, copper alloys, nickel alloys, tantalum, and zirconium. The base metals are typically carbon steel, alloy steel, stainless steel and aluminum. Although the patents for the explosion-welded cladding process have expired, NobelClad has proprietary knowledge that distinguishes it from its competitors. The entire explosion-welding process involves significant precision in all stages, and any errors can be extremely costly as they result in the discarding of the expensive raw material metals. NobelClad’s technological expertise is a significant advantage in preventing costly waste.
NobelClad’s metal products are primarily produced on a project-by-project basis conforming to requirements set forth in customers’ purchase orders. Upon receipt of an order, NobelClad obtains the component materials from a variety of sources based on quality, availability and cost and then produces the order in one of its four manufacturing plants. Final products are processed to meet contract specific requirements for product configuration and quality/inspection level.
Suppliers and Raw Materials
NobelClad uses a range of alloys, steels and other materials for its operations, such as stainless steel, copper alloys, nickel alloys, titanium, zirconium, tantalum, aluminum and other metals. NobelClad sources its raw materials from a number of different producers and suppliers. NobelClad holds a limited metal inventory and purchases its raw materials based on contract specifications. Under most contracts, any raw material price increases are passed on to NobelClad’s customers. NobelClad closely monitors the quality of its supplies and inspects the type, dimensions, markings, and certification of all incoming metals to ensure that the materials will satisfy applicable construction codes. NobelClad also manufactures a majority of its own explosives from standard raw materials, thus achieving higher quality and lower cost.
6
Competition
Metal Cladding.
NobelClad faces competition from alternative technologies such as rollbond and weld overlay. Usually the three processes do not compete directly against each other, each having its own preferential domain of application relating to metal used and thicknesses required. However, due to specific project considerations such as technical specifications, price and delivery time, explosion-welding may have the opportunity to compete successfully against these technologies. Rollbond is only produced by a few steel mills in the world. In this process, the clad metal and base metal are bonded during the hot rolling operation in which the metal slab is converted to plate. Being a high temperature process, hot rollbond is limited to joining similar metals, such as stainless steel and nickel alloys to steel. Rollbond’s niche is production of large quantities of light to medium gauge clad plates; it is frequently lower cost than explosion clad when total metal thickness is under 1 to 2 inches (dependent upon alloy and a number of other factors.) Rollbond products are generally suitable for most pressure vessel applications but have lower bond shear strength and may have inferior corrosion resistance.
The weld overlay process, which is produced among the many vessel fabricators who are often also NobelClad customers, is a slow and labor intensive process that requires a large amount of floor space for the equipment. In weld overlay cladding, the clad metal layer is deposited on the base metal using arc-welding type processes. Weld overlay is a cost-effective technology for complicated shapes, for field service jobs, and for production of heavy-wall pressure vessel reactors. During overlay welding, the cladding metal and base metal are melted together at their interface. The resulting dilution of the cladding metal chemistry may compromise corrosion performance and limit use in certain applications. Weld metal shrinkage during cooling potentially causes distortion when the base layer is thin; consequently, overlay is rarely the technically preferred solution for construction of new equipment when thicknesses are under 3 to 4 inches. As with rollbond, weld overlay is limited to metallurgically similar metals, primarily stainless steels and nickel alloys joined to steel. Weld overlay is typically performed in conventional metal fabrication shops.
Explosion-Welded Metal Cladding.
Competition in the explosion-welded clad metal business is fragmented. NobelClad holds a strong market position in the clad metal industry. NobelClad is the leading producer of explosion-welded clad products in North America, and it has a strong position in Europe against smaller competitors. NobelClad’s main competitor in Asia is a division of Asahi Kasei, which has competitive technology and a recognized local brand name. There are several explosion-welded clad producers in Korea and China, most of whom have been technically limited and have offered limited exports outside of their domestic market. A number of additional small competitors operate throughout the world. To remain competitive, NobelClad intends to continue developing and providing technologically advanced manufacturing services, maintain quality levels, offer flexible delivery schedules, deliver finished products on a reliable basis and compete favorably on the basis of price.
Customer Profile
NobelClad’s products are used in critical applications in a variety of industries, including upstream oil and gas, oil refinery, chemical and petrochemical, hydrometallurgy, aluminum production, shipbuilding, power generation, industrial refrigeration and other similar industries. NobelClad’s customers in these industries require metal products that can withstand exposure to corrosive materials, high temperatures and high pressures. NobelClad’s customers can be divided into three tiers: the product end users (e.g., operators of chemical processing plants), the engineering contractors who design and construct plants for end users, and the metal fabricators who manufacture the products or equipment that utilize NobelClad’s metal products. It is typically the fabricator that places the purchase order with NobelClad and pays the corresponding invoice. NobelClad has developed strong relationships over the years with the engineering contractors (relatively large companies) who sometimes act as prescriptor to fabricators.
Marketing, Sales, Distribution
NobelClad conducts its selling efforts by marketing its services to potential customers through senior management, direct sales personnel, program managers, and independent sales representatives. Prospective customers in specific industries are identified through networking in the industry, cooperative relationships with suppliers, public relations, customer references, inquiries from technical articles and seminars and trade shows. NobelClad’s sales office in the United States covers the Americas and East Asia. Its sales offices in Europe cover the full European continent, Africa, the Middle East, India, and Southeast Asia. During 2012 and 2013 NobelClad opened direct sales offices in South Korea and China to address these markets. These sales teams are further supported by local sales offices in the Middle East and India, with contract agents in most other developed countries, including Russia and Brazil. Contract agents typically work under multi-year agreements which are subject to sales performance as well as compliance with NobelClad quality and customer service expectations. Members of the global sales team may be called to work on projects located outside their usual territory. By maintaining relationships with its existing customers, developing new relationship with prospective customers, and educating all its customers as to the technical benefits of NobelClad’s products, NobelClad endeavors to have its products specified as early as possible in the design process.
7
NobelClad’s sales are generally shipped from its manufacturing locations in the United States, Germany and France. Generally, any shipping costs or duties for which NobelClad is responsible will be included in the price paid by the customer. Regardless of where the sale is booked (in Europe or the U.S.), NobelClad will produce it, capacity permitting, at the location closest to the delivery place. In the event that there is a short term capacity issue, NobelClad produces the order at any of its production sites, prioritizing timing. The various production sites allow NobelClad to meet customer production needs in a timely manner.
Research and Development
We prepare a formal research and development plan annually. It is implemented at our French, German, and U.S. cladding sites and is supervised by a Technical Committee that reviews progress quarterly and meets once a year to establish the plan for the following 12 months. The research and development projects concern process support, new products, and special customer-paid projects.
DynaEnergetics
DynaEnergetics manufactures, markets, and sells perforating explosives and associated hardware and seismic explosives, for the international oil and gas industry. The oil and gas industry uses perforating products to punch holes in the casing or liner of wells to connect them to the reservoir. The operator runs a casing or liner into the well and then inserts the perforating guns, which contain a series of specialized shaped charges. Once fired, the perforating guns provide access to the specified sections of the desired areas of the targeted formations. Completing wells through the use of perforation guns can provide more control over the well.
The kinds of perforating products manufactured by DynaEnergetics are essential to certain types of modern oil and gas recovery. The products are sold to large, mid-sized, and small oilfield service companies in the U.S., Europe, Canada, South America, Africa, the Middle East, and Asia, including direct sales to end users. The market for perforating products is growing. Rising worldwide demand for oil and gas increases the demand for perforating products used in exploration and recovery. Higher levels of exploration (seismic prospecting) and increased production activities in the global oil and gas industry are expected to continue. Increased exploration has led to increasingly complex completion operations, which raise the demand for high quality perforating products.
Operations
The DynaEnergetics segment seeks to build on its products, technology, and sales, supply chain and distribution network in its markets. During the three years ended December 31, 2011, 2012 and 2013, the DynaEnergetics segment represented approximately 35%, 39% and 40% of our revenue, respectively.
DynaEnergetics products are used to perform perforating services, seismic prospecting and decommissioning services. DynaEnergetics manufactures and distributes a comprehensive array of products, including shaped charges, detonators, boosters, detonating cords, perforating guns, sub-assemblies and systems. Additionally, the company designs and manufactures custom-ordered perforating products for third-party customers according to their designs and specifications.
DynaEnergetics has been producing detonating cords and
detonators and selling these and seismic explosives systems for decades. Since 1994 significant emphasis has been placed on enhancing its oilfield product offerings by improving existing products and adding new products. In recent years, various types of detonating cords and detonators have been added as well as bi-directional boosters, a wide range of shaped charges, and corresponding gun systems.
DynaEnergetics has introduced a number of new technologies designed for safe and selective perforating. Our RF-Safe Detonator Systems require a specific electronic code for firing and are immune to induced currents and voltages, static electricity and high-frequency irradiation. This significantly reduces the risk of oilfield accidents from unintentional firing. This safety feature enables concurrent perforating and fracturing processes at drilling sites with multiple well bores, improving operating efficiencies for our customers.
With selective technologies the operator can sequentially initiate multiple perforating guns in a single run, resulting in significant time and cost savings. DynaEnergetics’ Selectronic Switches provide high reliability through a microprocessor based switch design. The Selectronic switch and software operate in conjunction with our RF-Safe Detonators, Multitronic Firing Panels and a standard PC to enable up to 12 initiation devices per run. DynaEnergetics’ Mulitronic Firing Panels are installed in our customer’s service fleet vehicles to control and sequence perforating operations. The control panels and switches provide
8
uninterrupted communication with all detonators in the gun assembly and enable positive indication of gun firing along with selective control.
Our DynaSelect products combine our Selectronic Switches and RF-Safe Detonator technologies in a one piece system for improved well site efficiency, reliability, simplicity and service quality. The fully integrated design incorporates advanced software controls and reduces the size of the detonator and switch assembly. DynaSelect cuts by 40% the number of electrical connections required within each perforating gun, improving set-up times and reliability. DynaSelect is controlled by our Multronic IV Firing Panel with CCL. This system enables safe and reliable firing of up to 20 guns in a single run and incorporates a signal output function to monitor tool string movement.
Our DynaSlot system is designed for well abandonment. During abandonment the wellbore is shut in and permanently sealed, so that layers of sedimentary rock, and in particular freshwater aquifers, are pressure isolated. DynaSlot creates complete 360 degree access behind the tubing and casing, which is preferred for plug and abandonment cement squeeze operations.
DynaEnergetics Tubing Conveyed Perforating, or TCP, systems are customized for individual customer needs and well applications. TCP enables perforating of more complex highly deviated and horizontal wells. These types of wells are being increasingly drilled by the industry. TCP tools also perforate long intervals in a single trip which significantly improves rig efficiency. Our TCP tool range includes mechanical and hydraulic firing systems, gun releases, under-balancing devices and auxiliary components. Our tools are designed to withstand down hole temperatures up to 260 degrees Celsius, for safe and quick assembly at the well site, and to allow unrestricted total system length.
DynaEnergetics’s manufacturing facilities are located in Germany, Canada, the United States and Russia. During 2013 DynaEnergetics completed a new shaped charge manufacturing facility in Blum, Texas and a perforating gun manufacturing facility in Tyumen, Siberia. A new shaped charge manufacturing facility is under construction in Tyumen, Siberia and is scheduled to be become operational during the third quarter of 2014. These investments will significantly expand our global capacity for shaped charge and perforating gun production and improve our delivery and customer service capabilities for our products.
Suppliers and Raw Materials
DynaEnergetics utilizes a variety of raw materials for the production of oilfield perforating and seismic products, including high quality steel tubes, steel and copper, explosives (RDX, HMX, HNS), granulates, plastics and ancillary plastic product components. DynaEnergetics’ product line consists of complex products which require numerous high quality components. DynaEnergetics obtains its raw materials primarily from a number of different producers in Germany and other European countries, but also purchases materials from North American, Chinese, and other international suppliers.
Competition
DynaEnergetics faces competition from independent producers of perforating products who are not committed to the large service companies and each of the major oil and gas service companies who produce most of their own needs for shaped charges but buy other components and specialty products. DynaEnergetics competes for sales primarily on customer service, product quality, reliability, product performance, price and, in North America, proximity of distribution centers to oilfield drilling activity.
Customer Profile
Our DynaEnergetics products are generally purchased by oilfield service companies who use our perforating products for oil and gas recovery and our seismic products for oil and gas exploration activities. Onshore and offshore oilfield service companies use our DynaEnergetics products. Our customers desire perforating products that satisfy their specific needs and expectations and difficult geological realities, such as high pressures and temperatures in the bore hole, which exist in areas where perforating products and services are used. We believe that our customers must balance costs, productivity and risks for every job.
The customers for oilfield products can be divided into four broad categories: buying centers of large service companies, service companies worldwide, oil companies with and without their own service companies, and local resellers. DynaEnergetics’ customer base includes clients from each of these categories.
Marketing, Sales, Distribution
DynaEnergetics’ worldwide marketing and sales efforts for its oilfield and seismic products are based in Troisdorf, Germany, with regional sales headquarters in Austin, Texas for the Americas and Tyumen, Siberia for Russia and the CIS. DynaEnergetics’ sales strategy focuses on direct selling, distribution through licensed distributors and independent sales representatives, the
9
establishment of international distribution centers to better service our customers, and educating current and potential customers about its products and technologies. Currently, DynaEnergetics sells its oilfield and seismic products through wholly owned affiliates in the U.S., Canada, Colombia, Russia and Kazakhstan; and through independent sales agents in other parts of the world. DynaEnergetics has sixteen sales and distributions centers in the United States, Canada and Colombia to better serve its oilfield customers in these regions.
Research and Development
DynaEnergetics attaches great importance to its research and development capabilities and has devoted substantial resources to its R&D programs. The R&D staff works closely with sales and operations management teams to establish priorities and effectively manage individual projects. Through its ongoing involvement in oil and gas industry trade shows and conferences, DynaEnergetics has increased its profile in the oil and gas industry. An R&D Plan, which focuses on new technology, products, process support and contracted projects, is prepared and reviewed at least annually.
AMK Technical Services
Parts for power turbines, aircraft engines, and flow meters for the oil and gas industry must be machined to exacting tolerances and welded according to exacting specifications. Many of those parts have complex shapes, the welding of which requires significant expertise. AMK Technical Services is a specialized operation that welds complex, shaped parts for machining companies that, in turn, supply the manufacturers of power turbines and aircraft engines. AMK Technical Services also provides specialized, multi-axis machining for completion of certain welded components.
AMK Technical Services employs a variety of sophisticated processes and equipment to provide specialized welding and machining services principally to a power turbine manufacturer and to commercial and military aircraft engine manufacturers. AMK Technical Services is located in South Windsor, Connecticut.
Welding and machining services are provided on a project-by-project basis based on specifications set forth in customers’ purchase orders. Upon receipt of an order, AMK Technical Services performs welding and machining services using customer specific procedures.
Welding processes used by AMK Technical Services include electron beam and gas tungsten arc welding processes. AMK Technical Services also has considerable expertise in vacuum chamber welding, which is a critical capability when welding titanium, high temperature nickel alloys and other specialty alloys. These welding techniques are used for the welding of blades and vanes and other turbine parts typically located in the hot gas path of aircraft engines. In addition to its welding capabilities, AMK Technical Services also uses multi-axis machining, various heat treatment and non-destructive examination processes, such as radiographic inspection, in support of its welding operations. The company has obtained and maintains an extensive list of operational approvals for critical welding applications.
At AMK Technical Services, the materials welded are a function of the type of parts supplied by the customers and include many steel varieties, various nickel alloys and customer-created proprietary alloys typically used in the aerospace and
ground turbine industries. Other than metal wire used in the welding process, AMK Technical Service does not purchase metals, and it receives the parts to be welded from the customer.
AMK Technical Services relies on a few key customers for the majority of its business, including GE Energy, General Electric Aircraft Engines and their first tier subcontractors, such as Barnes Aerospace, and divisions of United Technology, such as Hamilton Standard, Sikorsky Aircraft and Pratt and Whitney. AMK Technical Servics generally competes against a small number of welding companies that are typically privately owned. Some machining companies also have their own welding facilities, which compete with AMK Technical Services for business. AMK Technical Services competes successfully based on a reputation for uncompromising quality and rapid responsiveness to customer needs.
In an effort to streamline our overall operational structure and further focus our business on the oil and gas industry, during the first quarter 2014 we intend to merge AMK Technical Services, which currently represents 3.6% of our net sales, into the DynaEnergetics business segment. AMK Technical Services will continue to serve its customers in the oil and gas, ground power and aerospace sectors and, in addition, it will perform specialized welding and machining services on select DynaEnergetics components.
10
Corporate History and Recent Developments
The genesis of the Company was an unincorporated business called “Explosive Fabricators,” which was formed in Colorado in 1965. The business was incorporated in Colorado in 1971 under the name “E. F. Industries, Inc.,” which was later changed to “Explosive Fabricators, Inc.” The Company became a public company in 1977. In 1994, the Company changed its name to “Dynamic Materials Corporation.” The Company reincorporated in Delaware in 1997.
In 1976, the Company became a licensee of Detaclad®, the explosion-weld clad process developed by DuPont in 1959. In 1996, the Company purchased the Detaclad® operating business from Dupont.
In 2001, the Company acquired substantially all of the stock of Nobelclad Europe SA (a French company) (“Nobelclad France”); Nobelclad France had previously acquired the stock of Nitro Metall AB (a Swedish company) (“Nitro Metall”). The stock of Nobelclad France was acquired from an affiliate of our parent company at the time, SNPE. Early in its history, Nobelclad France was a licensee of the Detaclad® technology. The acquisition of Nobelclad France expanded the Company’s explosive metalworking operations to Europe.
In 2007, the Company acquired the German company DYNAenergetics GmbH and Co. KG (“DYNAenergetics”) and certain affiliates. DYNAenergetics was comprised of two primary businesses: explosive metalworking and oilfield products. This acquisition expanded the Company’s explosive metalworking operations in Europe and added a complimentary business segment, oilfield products.
In 2009, the Company acquired all of the stock of Alberta Canada based LRI Oil Tools Inc. (“LRI”) which is now operating under the name of DYNAenergetics Canada. DYNAenergetics Canada produces and distributes perforating equipment for use by the oil and gas exploration and production industry. The business had a long-term strategic relationship with the Company’s DynaEnergetics segment, and had served for several years as its sole Canadian distributor.
In 2010, the Company purchased the outstanding minority-owned interests in its two Russian joint ventures that were previously majority-owned by the Company’s DynaEnergetics business segment. These joint ventures include DYNAenergetics RUS, which is a Russian trading company that sells the Company’s oilfield products, and Perfoline, which is a Russian manufacturer of perforating gun systems.
In 2010, the Company completed its acquisition of Texas-based Austin Explosives Company (AECO), which is now operating under the name DYNAenergetics US, Inc. This business is now part of the Company’s DynaEnergetics business segment. AECO had been a long-time distributor of DynaEnergetics shaped charges.
On January 3, 2012, the Company acquired the assets and operating business of Texas-based TRX Industries, Inc., (“TRX”), a manufacturer of perforating guns and one of DynaEnergetic’s suppliers. This business is now part of the Company’s DynaEnergetics business segment.
We recently branded our explosive metalworking operations under the single name NobelClad. Our NobelClad segment is comprised of the Company’s U.S. Clad operations as well as the explosion metalworking assets and operations purchased in the Nobelclad France and DYNAenergetics acquisitions. We recently branded our oilfield products segment as DynaEnergetics, which is comprised entirely of DYNAenergetics (other than its explosion metalworking operations), its subsidiaries and sister companies. Our third segment, formerly AMK Welding, has been branded as AMK Technical Services. Property locations for these operations are listed in detail in Item 2.
Employees
As of December 31, 2013, we employed 555 employees (255 U.S. employees and 300 foreign employees), the majority of whom are engaged in manufacturing operations, with the remainder being engaged in sales and marketing or corporate functions. The majority of our manufacturing employees are not unionized.
In addition, we also use a number of temporary workers at any given time, depending on the workload.
In the last three years, the Company has not experienced any strikes or work stoppages. We believe that employee relations are good.
11
Insurance
Our operations expose us to potential liabilities for personal injury or death as a result of the failure of a component that has been designed, manufactured, or serviced by us, or the irregularity or failure of products we have processed or distributed. We maintain liability insurance that we believe adequately protects us from future product liability claims.
Proprietary Knowledge, Permits and Patents
Protection of Proprietary Information
. We hold patents related to the business of explosive metalworking and metallic processes and also own certain registered trademarks, including Detaclad®, Detacouple®, EFTEK®, ETJ 2000® and NOBELCLAD®. Although the patents for the explosion-welded cladding process have expired, our current product application patents expire on various dates through 2020. Since individual patents relate to specific product applications and not to core technology, we do not believe that such patents are material to our business, and the expiration of any single patent is not expected to have a material adverse effect on our operations. Much of the manufacturing expertise lies in the knowledge of the factors that affect the quality of the finished clad product, including the types of metals to be explosion-welded, the setting of the explosion, the composition of the explosive, and the preparation of the plates to be bonded. We have developed this specialized knowledge over our 40 years of experience in the explosive metalworking business. We are very careful in protecting our proprietary know-how and manufacturing expertise, and we have implemented measures and procedures to ensure that the information remains confidential. We hold various patents and licenses through our DynaEnergetics perforating business, but some of the patents are not yet registered. As with the explosive metalworking business segment, since individual patents relate to specific product applications and not to core technology, we do not believe that such patents are material to our business, and the expiration of any single patent is not expected to have a material adverse effect on our current operations.
Permits
. Explosive metalworking and the production of perforation products involve the use of explosives, making safety a critical factor in our operations. In addition, explosive metalworking and the production of oilfield products are highly regulated industries for which detailed permits are required. These permits require renewal every three or four years, depending on the permit. See Item 1A — Risk Factors —
Risk Factors Related to the Dynamic Materials Corporation — We are subject to extensive government regulation and failure to comply could subject us to future liabilities and could adversely affect our ability to conduct or to expand our business
for a more detailed discussion of these permits.
Foreign and Domestic Operations and Export Sales
All of our sales are shipped from our manufacturing facilities and distribution centers located in the United States, Germany, France, Canada, Russia and Kazakhstan. During 2011, we closed our manufacturing facility in Sweden. The following chart represents our net sales based on the geographic location to where we shipped the product, regardless of the country of the actual end user. NobelClad products are usually shipped to the fabricator before being passed on to the end user.
|
(Dollars in Thousands)
|
||||||||||||
|
For the years ended December 31,
|
||||||||||||
|
|
2013
|
2012
|
2011
|
|||||||||
|
United States
|
$
|
95,214
|
|
$
|
78,676
|
|
$
|
81,410
|
|
|||
|
Canada
|
18,150
|
|
21,083
|
|
24,151
|
|
||||||
|
South Korea
|
11,642
|
|
9,469
|
|
29,951
|
|
||||||
|
Germany
|
9,208
|
|
13,992
|
|
12,960
|
|
||||||
|
India
|
8,888
|
|
3,874
|
|
6,176
|
|
||||||
|
Russia
|
5,992
|
|
6,472
|
|
8,658
|
|
||||||
|
France
|
3,957
|
|
6,838
|
|
3,828
|
|
||||||
|
Kazakhstan
|
2,513
|
|
2,359
|
|
32
|
|
||||||
|
China
|
606
|
|
7,986
|
|
1,468
|
|
||||||
|
Rest of the world
|
53,403
|
|
50,818
|
|
40,257
|
|
||||||
|
Total
|
$
|
209,573
|
|
$
|
201,567
|
|
$
|
208,891
|
|
|||
12
Company Information
We are subject to the informational requirements of the Securities Exchange Act of 1934. We therefore file periodic reports, proxy statements and other information with the Securities Exchange Commission (the “SEC”). Such reports may be obtained by visiting the Public Reference Room of the SEC at 100 F Street, N.E., Washington, D.C. 20549, or by calling the SEC at 1-800-SEC-0330. In addition, the SEC maintains an internet site at www.sec.gov that contains reports, proxy and information statements and other information regarding issuers that file electronically.
Our Internet address is www.dynamicmaterials.com. Information contained on our website does not constitute part of this Annual Report on Form 10-K. Our annual report on SEC Form 10-K, quarterly reports on Forms 10-Q, current reports on Forms 8-K, and amendments to those reports filed or furnished pursuant to Section 13(a) or 15(d) of the Exchange Act are available free of charge on our website as soon as reasonably practicable after we electronically file such material with or furnish it to the SEC. We also regularly post information about our Company on our website under the Investors tab.
ITEM 1A.
Risk Factors
Risk Factors Related to our NobelClad Segment
NobelClad operates a cyclical business and its sales are only slowly improving from the significant decline in sales experienced in 2009 and 2010.
NobelClad operates a somewhat cyclical business. Beginning in late 2008 and continuing through 2010, NobelClad's sales in some of its markets slowed down, resulting in declines of 31.2% and 26.5% in year-to-date 2009 and 2010 sales respectively. While NobelClad's sales increased in 2011, its annual sales for 2011, 2012 and 2013 were 35.3%, 40.9% and 39.4%, respectively, below the amount of its peak sales in 2008. At December 31, 2007 and 2008, order backlog was $100.0 million and $97.2 million, respectively. Year-end backlog was $49.6 million, $56.5 million, $44.6 million, $46.4 million and $39.9 million, respectively, in 2009, 2010, 2011, 2012 and 2013. The explosion-weld cladding market is dependent upon sales of products for use by customers in a limited number of heavy industries, including oil and gas, alternative energy, chemicals and petrochemicals, hydrometallurgy, aluminum production, shipbuilding, power generation, and industrial refrigeration. These industries tend to be cyclical in nature and an economic slowdown in one or all of these industries—whether due to traditional cyclicality, general economic conditions or other factors—could impact capital expenditures within that industry. If demand from such industries were to decline or to experience reduced growth rates, our sales would be expected to be affected proportionately, which may have a material adverse effect on our business, financial condition, and results of operations.
Our backlog figures may not accurately predict future sales.
We define “backlog” at any given point in time to consist of all firm, unfulfilled purchase orders and commitments at that time. Generally speaking, we expect to fill most items of backlog within the following 12 months. However, since orders may be rescheduled or canceled and a significant portion of our net sales is derived from a small number of customers, backlog is not necessarily indicative of future sales levels. Moreover, we cannot be sure of when during the future 12-month period we will be able to recognize revenue corresponding to our backlog nor can we be certain that revenues corresponding to our backlog will not fall into periods beyond the 12-month horizon. The percentage increase or decrease in NobelClad's annual sales may be substantially greater or less than the change in backlog at the previous year-end.
There is a limited availability of sites suitable for cladding operations.
Our cladding process involves the detonation of large amounts of explosives. As a result, the sites where we perform cladding must meet certain criteria, including lack of proximity to a densely populated area, the specific geological characteristics of the site, and the ability to comply with local noise and vibration abatement regulations in conducting the process. In addition, our primary U.S. shooting site is subleased under an arrangement pursuant to which we provide certain contractual services to the sub-landlord. The efforts to identify suitable sites and obtain permits for using the sites from local government agencies can be time-consuming and may not be successful. In addition, we could experience difficulty in obtaining or renewing permits because of resistance from residents in the vicinity of proposed sites. The failure to obtain required governmental approvals or permits could limit our ability to expand our cladding business in the future, and the failure to maintain such permits or satisfy other conditions to use the sites would have a material adverse effect on our business, financial condition and results of operations.
13
The use of explosives subjects us to additional regulation, and any accidents or injuries could subject us to significant liabilities.
Our operations involve the detonation of large amounts of explosives. As a result, we are required to use specific safety precautions under U.S. Occupational Safety and Health Administration guidelines and guidelines of similar entities in Germany and France. These include precautions which must be taken to protect employees from exposure to sound and ground vibration or falling debris associated with the detonation of explosives. There is a risk that an accident or death could occur in one of our facilities. Any accident could result in significant manufacturing delays, disruption of operations or claims for damages resulting from death or injuries, which could result in decreased sales and increased expenses. To date, we have not incurred any significant delays, disruptions or claims resulting from accidents at our facilities. The potential liability resulting from any accident or death, to the extent not covered by insurance, may require us to use other funds to satisfy our obligations and could cause our business to suffer. See “Our use of explosives is an inherently dangerous activity that could lead to temporary or permanent closure of our NobelClad shooting sites or DynaEnergetics manufacturing facilities” under "Risk Factors Related to Dynamic Materials Corporation" below.
Certain raw materials we use are subject to supply shortages due to general economic conditions.
Although we generally use standard metals and other materials in manufacturing our products, certain materials such as specific grades of carbon steel, titanium, zirconium and nickel can be subject to supply shortages due to general economic conditions or problems with individual suppliers. While we seek to maintain sufficient alternative supply sources for these materials, we may not always be able to obtain sufficient supplies or obtain supplies at acceptable prices without production delays, additional costs, or a loss of product quality. If we were to fail to obtain sufficient supplies on a timely basis or at acceptable prices, such loss or failure could have a material adverse effect on our business, financial condition, and results of operations.
Certain raw materials NobelClad uses are subject to price increases due to general economic conditions.
The markets for certain metals and other raw materials used by NobelClad are highly variable and are characterized by periods of increasing prices. While prices for much of the raw materials we use have recently decreased, we may again experience increasing prices. We generally do not hedge commodity prices or enter into forward supply contracts; instead we endeavor to pass along price variations to our customers. We may see a general downturn in business if the price of raw materials increases enough for our customers to delay planned projects or use alternative materials to complete their projects.
Risk Factors Related to DynaEnergetics
The manufacturing of explosives subjects DynaEnergetics to various environmental, health and safety laws.
DynaEnergetics is subject to a number of environmental, health, and safety laws and regulations, the violation of which could result in significant penalties. DynaEnergetics’ continued success depends on continued compliance with applicable laws and regulations. In addition, new environmental, health and safety laws and regulations could be passed which could create costly compliance issues. While DynaEnergetics endeavors to comply with all applicable laws and regulations, compliance with future laws and regulations may not be economically feasible or even possible.
DynaEnergetics’ continued economic success depends on remaining at the forefront of innovation in the perforating industry.
DynaEnergetics’ position in the perforation market depends in part on its ability to remain an innovative leader in the field. The ability to remain competitive depends in part on the retention of talented personnel. DynaEnergetics may be unable to remain an innovative leader in the perforation market segment or may be unable to retain top talent in the field.
Potential downturns in the oil and gas industry and related services industry could have a negative impact on DynaEnergetics’s economic success.
The oil and gas industry is unpredictable and has historically been subject to occasional downturns. Demand for DynaEnergetics’ products is linked to the financial success of the oil and gas industry as a whole, and downturns in the oil and gas industry, especially in the rate of well drilling, could negatively impact DynaEnergetics’ economic success. A variety of factors affect the demand for DynaEnergetics products, including governmental regulation of oil and gas industry and markets, international and domestic prices for oil and gas, weather conditions, the financial condition of DynaEnergetics’ clients, and consumption patterns of oil and gas.
14
Risk Factors Related to Dynamic Materials Corporation
Our use of explosives is an inherently dangerous activity that could lead to temporary or permanent closure of our NobelClad shooting sites and DynaEnergetics manufacturing facilities.
We use a large amount of explosives in connection with the creation of clad metals and manufacturing of perforating shaped charges and detonation cord. The use of explosives is an inherently dangerous activity. Explosions, even if occurring as intended, can lead to damage to the shooting site or manufacturing facility or to equipment used at the facility or injury to persons at the facility. If a person were injured or killed in connection with such explosives, or if equipment at the shooting site or manufacturing facility were damaged or destroyed, we might be required to suspend our operations for a period of time while an investigation is undertaken or repairs are made. Such a delay might impact our ability to meet the demand for our products. In addition, if the mine were seriously damaged, we might not be able to locate a suitable replacement site to continue our operations.
Weakness in the general global economy may adversely affect certain segments of our end market customers and reduce our sales and results of operations.
We supply products to customers that fabricate industrial equipment for various capital-intensive industries. Weakness in the general global economy may adversely affect our end market customers, causing them to cancel or postpone new plant or infrastructure construction, expansion, maintenance, or retrofitting projects that use our NobelClad products. Similarly, any decrease in oil and gas well drilling activities will reduce the sales of our DynaEnergetics products. Any decrease in the demand for gas turbines and airplane engines will reduce the demand for the work performed by our AMK division. The global general economic climate may lessen demand for our products and reduce our sales and results of operations.
Our operating results fluctuate from quarter to quarter.
We have experienced, and expect to continue to experience, fluctuations in annual and quarterly operating results caused by various factors, including the timing and size of significant orders by customers, customer inventory levels, shifts in product mix, acquisitions and divestitures, and general economic conditions. The upstream oil and gas, oil refinery, chemical and petrochemical, hydrometallurgy, aluminum production, shipbuilding, power generation, industrial refrigeration and other diversified industries to which we sell our products are, to varying degrees, cyclical and tend to decline in response to overall declines in industrial production. As a result, our business is also cyclical, and the demand for our products by these customers depends, in part, on overall levels of industrial production. Any future material weakness in demand in any of these industries could materially reduce our revenues and profitability. In addition, the threat of terrorism and other geopolitical uncertainty could have a negative impact on the global economy, the industries we serve and our operating results.
We typically do not obtain long-term volume purchase contracts from our customers. Quarterly sales and operating results, therefore, depend on the volume and timing of the orders in our backlog as well as bookings received during the quarter. Significant portions of our operating expenses are fixed, and planned expenditures are based primarily on sales forecasts and product development programs. If sales do not meet our expectations in any given period, the adverse impact on operating results may be magnified by our inability to adjust operating expenses sufficiently or quickly enough to compensate for such a shortfall. Results of operations in any period should not be considered indicative of the results for any future period. Fluctuations in operating results may also result in fluctuations in the price of our common stock. See “Management’s Discussion and Analysis of Financial Condition and Results of Operations.”
We are exposed to potentially volatile fluctuations of the U.S. dollar (our reporting currency) against the currencies of many of our operating subsidiaries.
Many of our operating subsidiaries conduct business in Euros or other foreign currency. Sales made in currencies other than U.S. dollars accounted for 35%, 37%, and 34% of total sales for the years ended 2013, 2012, and 2011, respectively. Any increase (decrease) in the value of the U.S. dollar against any foreign currency that is the functional currency of any of our operating subsidiaries will cause us to experience foreign currency translation losses (gains) with respect to amounts already invested in such foreign currencies. In addition, our company and our operating subsidiaries are exposed to foreign currency risk to the extent that we or they enter into transactions denominated in currencies other than our or their respective functional currencies. For example DYNAenergetics KG’s functional currency is Euros, but its sales often occur in U.S. dollars. Changes in exchange rates with respect to these items will result in unrealized (based upon period-end exchange rates) or realized foreign currency transaction gains and losses upon settlement of the transactions. In addition, we are exposed to foreign exchange rate fluctuations related to our operating subsidiaries’ assets and liabilities and to the financial results of foreign subsidiaries and affiliates when their respective financial statements are translated into U.S. dollars for inclusion in our consolidated financial statements. Cumulative translation adjustments are recorded in accumulated other comprehensive income (loss) as a separate component of equity. As a result of
15
foreign currency risk, we may experience economic loss and a negative impact on earnings and equity with respect to our holdings solely as a result of foreign currency exchange rate fluctuations. The primary exposure to foreign currency risk for us is to the Euro due to the percentage of our U.S. dollar revenue that is derived from countries where the Euro is the functional currency.
We are dependent on a relatively small number of customers for a significant portion of our net sales.
A significant portion of our net sales is derived from a relatively small number of customers; therefore, the failure to complete existing contracts on a timely basis, to receive payment for such services in a timely manner, or to enter into future contracts at projected volumes and profitability levels could adversely affect our ability to meet cash requirements exclusively through operating activities. We attempt to minimize the risk of losing customers or specific contracts by continually improving product quality, delivering product on time and competing aggressively on the basis of price. We expect to continue to depend upon our principal customers for a significant portion of our sales, although our principal customers may not continue to purchase products and services from us at current levels, if at all. The loss of one or more major customers or a change in their buying patterns could have a material adverse effect on our business, financial condition, and results of operations.
In past years, the majority of NobelClad’s revenues have been derived from customers in the oil and gas, alternative energy, chemicals and petrochemicals, hydrometallurgy, aluminum production, shipbuilding, power generation and industrial refrigeration industries and the majority of AMK Technical Services’ revenues have been derived from customers in the aircraft engine and power generation industries. Economic downturns in these industries could have a material adverse effect on our business, financial condition, and results of operations.
DynaEnergetics, which contributed approximately 39% to our 2012 sales, has customers throughout the world. Economic or political instability in certain regions of the world where DynaEnergetics conducts a significant volume of its business, such as Russia, could have a material adverse effect on DynaEnergetics’ business and operating results.
AMK Technical Services, contributed approximately 4% to our 2012 sales, continues to rely primarily on one customer for the majority of its sales. This customer and AMK Technical Services have entered into a long-term supply agreement for certain of the services provided to this customer. Any termination of or significant reduction in AMK Technical Services’ business relationship with this customer could have a material adverse effect on AMK Technical Services’ business and operating results.
Customers have the right to change orders until products are completed.
Customers have the right to change orders after they have been placed. If orders are changed, the extra expenses associated with the change will be passed on to the customer. However, because a change in an order may delay completion of the project, recognition of income for the project may also be delayed.
There is no assurance that we will continue to compete successfully against other clad, perforating, and welding companies.
Our explosion-welded clad products compete with explosion-welded clad products made by other manufacturers in the clad metal business located throughout the world and with clad products manufactured using other technologies. Our combined North American and European operations typically supply explosion-welded clad to the worldwide market. There is one other well-known explosion-welded clad supplier worldwide, a division of Asahi-Kasei Corporation of Japan. There are also a number of smaller companies worldwide with explosion-welded clad manufacturing capability, including several companies in China that appear to be growing significantly in their domestic market. There are currently no other significant North American based explosion-welded clad suppliers. We focus strongly on reliability, product quality, on-time delivery performance, and low cost manufacturing to minimize the potential of future competitive threats. However, there is no guarantee we will be able to maintain our competitive position.
Explosion-welded clad products also compete with those manufactured by rollbond and weld overlay cladding processes. In rollbond technology, the clad and base metal are bonded together during a hot rolling process in which slab is converted to plate. In weld overlay, which is typically performed by our fabricator customers, the cladding layer is deposited on the base metal through a fusion welding process. The technical and commercial niches of each cladding process are well understood within the industry and vary from one world market location to another. Our products compete with weld overlay clad products manufactured by a significant number of our fabricator customers.
DynaEnergetics competes principally with perforating companies based in North America, South America, and Russia who produce and market perforating services and products. DynaEnergetics also competes with oil and gas service companies who are able to satisfy a portion of their perforating needs through in-house production. To remain competitive, DynaEnergetics must
16
continue to provide innovative products and maintain an excellent reputation for quality, safety, and value. There can be no assurances that we will continue to compete successfully against these companies.
AMK Technical Services competes principally with other domestic companies that provide welding services to the aircraft engine and power generation industries. Some of these competitors have established positions in the market and long standing relationships with customers. To remain competitive, we must continue to develop and provide technologically advanced welding, heat-treat and inspection services, maintain quality levels, offer flexible delivery schedules, and compete favorably on the basis of price. We compete against other welding companies on the basis of quality, performance and cost. There can be no assurance that we will continue to compete successfully against these companies.
Failure to attract and retain key personnel could adversely affect our current operations.
Our continued success depends to a large extent upon the efforts and abilities of key managerial and technical employees. The loss of services of certain of these key personnel could have a material adverse effect on our business, results of operations, and financial condition. There can be no assurance that we will be able to attract and retain such individuals on acceptable terms, if at all; and the failure to do so could have a material adverse effect on our business, financial condition, and results of operations.
Liabilities under environmental and safety laws could result in restrictions or prohibitions on our facilities, substantial civil or criminal liabilities, as well as the assessment of strict liability and/or joint and several liability.
We are subject to extensive environmental and safety regulation in the countries where our manufacturing facilities are located. Any failure to comply with current and future environmental and safety regulations could subject us to significant liabilities. In particular, any failure to control the discharge of hazardous materials and wastes could subject us to significant liabilities, which could adversely affect our business, results of operations or financial condition.
We and all our activities in the United States are subject to federal, state and local environmental and safety laws and regulations, including but not limited to, noise abatement and air emissions regulations, the Comprehensive Environmental Response, Compensation and Liability Act of 1980, regulations issued and laws enforced by the labor and employment departments of the U.S. and the states in which we conduct business, by the U.S. Department of Commerce, the U.S. Environmental Protection Agency, and by state and local health and safety agencies. In Germany, we and all our activities are subject to various safety and environmental regulations of the federal state which are enforced by the local authorities, including the Federal Act on Emission Control (Bundesimmissionsschutzgesetz). The Federal Act on Emission Control permits are held by companies jointly owned by DYNAenergetics and the other companies that are located at the Würgendorf and Troisdorf manufacturing sites and are for an indefinite period of time. In France, we and all our activities are subject to state environmental and safety regulations established by various departments of the French Government, including the Ministry of Labor, the Ministry of Ecology and the Ministry of Industry, and to local environmental and safety regulations and administrative procedures established by DRIRE (Direction Régionale de l’Industrie, de la Recherche et de l’Environnement) and the Préfecture des Pyrénées Orientales. In addition, our shooting operations in Germany and France may be particularly vulnerable to noise abatement regulations because these operations are primarily conducted outdoors. The Dillenburg, Germany facility is operated based on a mountain plan (“Bergplan”), which is a specific permit granted by the local mountain authority. This permit must be renewed every three years.
Changes in or compliance with environmental and safety laws and regulations could inhibit or interrupt our operations, or require modifications to our facilities. Any actual or alleged violations of environmental and safety laws could result in restrictions or prohibitions on our facilities, substantial civil or criminal sanctions, as well as the assessment of strict liability and/or joint and several liability under applicable law. Under certain environmental laws, we could be held responsible for all of the costs relating to any contamination at our or our predecessor’s past or present facilities and at third party waste disposal sites. We could also be held liable for any and all consequences arising out of human exposure to hazardous substances or other environmental damage. Accordingly, environmental, health or safety matters may result in significant unanticipated costs or liabilities.
We are subject to extensive government regulation and failure to comply could subject us to future liabilities and could adversely affect our ability to conduct or to expand our business.
We are subject to extensive government regulation in the United States, Germany, France, Canada, Russia and Kazakhstan, including guidelines and regulations for the safe manufacture, handling, transport and storage of explosives issued by the U.S. Bureau of Alcohol, Tobacco and Firearms; the Federal Motor Carrier Safety Regulations set forth by the U.S. Department of Transportation; the Safety Library Publications of the Institute of Makers of Explosive; and similar guidelines of their European counterparts. In Germany, the transport, storage and use of explosives is governed by a permit issued under the Explosives Act (Sprengstoffgesetz). In France, the manufacture and transportation of explosives is subcontracted to a third party which is responsible for compliance with regulations established by various State and local governmental agencies concerning the handling
17
and transportation of explosives. Our French operations could be adversely affected if the third party does not comply with these regulations. We must comply with licensing and regulations for the purchase, transport, storage, manufacture, handling and use of explosives. In addition, while our shooting facilities in Würgendorf and Troisdorf, Germany and Tautavel, France are located outdoors, our shooting facilities located in Pennsylvania and in Dillenburg, Germany are located in mines, which subject us to certain regulations and oversight of governmental agencies that oversee mines.
We are also subject to extensive environmental and occupational safety regulation, as described below under “Liabilities under environmental and safety laws could result in restrictions or prohibitions on our facilities, substantial civil or criminal liabilities, as well as the assessment of strict liability and/or joint and several liability” and “The use of explosives subjects us to additional regulation, and any accidents or injuries could subject us to significant liabilities.”
The export of certain products from the United States or from foreign subsidiaries of U.S. companies is restricted by U.S. and similar foreign export regulations. These regulations generally prevent the export of products that could be used by certain end users, such as those in the nuclear or biochemical industries. In addition, the use and handling of explosives may be subject to increased regulation due to heightened concerns about security and terrorism. Such regulations could restrict our ability to access and use explosives and increase costs associated with the use of such explosives, which could have a material adverse effect on our business, financial condition, and results of operations.
Any failure to comply with current and future regulations in the countries where we operate could subject us to future liabilities. In addition, such regulations could restrict our ability to expand our facilities, construct new facilities, or compete in certain markets or could require us to incur other significant expenses in order to maintain compliance. Accordingly, our business, results of operations or financial condition could be adversely affected by our non-compliance with applicable regulations, by any significant limitations on our business as a result of our inability to comply with applicable regulations, or by any requirement that we spend substantial amounts of capital to comply with such regulations.
Work stoppages and other labor relations matters may make it substantially more difficult or expensive for us to produce our products, which could result in decreased sales or increased costs, either of which would negatively impact our financial condition and results of operations.
We are subject to the risk of work stoppages and other labor relations matters, particularly in Germany and France, where some of our employees are unionized. The employees at our U.S. and Canadian facilities, where a significant portion of our products are manufactured, are not unionized. While we believe our relations with employees are satisfactory, any prolonged work stoppage or strike at any one of our principal facilities could have a negative impact on our business, financial condition or results of operations. We have not experienced a strike or work stoppage in the last 3 years. However, if a work stoppage occurs at one or more of our facilities, it may materially impair our ability to operate our business in the future.
The terms of our indebtedness contain a number of restrictive covenants, the breach of any of which could result in acceleration of payment of our credit facilities.
We are parties to a syndicated credit agreement that, as of December 31, 2013, had an outstanding balance of approximately $29.3 million. Our credit agreement includes various covenants and restrictions, certain of which relate to the incurrence of additional indebtedness; mortgaging, pledging or disposition of major assets; and limits on capital expenditures and other investments. We are also required to maintain certain financial ratios on a quarterly basis
.
A breach of any of these covenants could result in acceleration of our obligations to repay our debt. As of December 31, 2012, we were in compliance with all financial covenants and other provisions of the credit agreement and our other loan agreements. However, our ability to comply with these covenants and ratios may be affected by events beyond our control, including prevailing economic, financial and industry conditions. Any failure to remain in compliance with any material provision or covenant of our credit agreement could result in a default which would, absent a waiver or amendment, require immediate repayment of outstanding indebtedness under our credit facilities. It may be difficult to liquidate assets sufficient to immediately repay our outstanding indebtedness under our credit facility.
The unsuccessful integration of a business we acquire could have a material adverse effect on operating results.
We continue to consider possible acquisitions as part of our growth strategy. Any potential acquisition may require additional debt or equity financing, resulting in additional leverage and dilution to existing stockholders. We may be unable to consummate any future acquisition. If any acquisition is made, we may not be able to integrate such acquisition successfully without a material adverse effect on our financial condition or results of operations.
18
ITEM 1B.
Unresolved Staff Comments
None.
ITEM 2.
Properties
Corporate Headquarters
Our corporate headquarters are located in Boulder, Colorado. The term of the lease for the office space is through November 30, 2022.
NobelClad
We own our principal domestic manufacturing site, which is located in Mount Braddock, Pennsylvania. We currently lease our primary domestic shooting site, which is located in Dunbar, Pennsylvania, and we also have license and risk allocation agreements relating to the use of a secondary shooting site that is located within a few miles of our Mount Braddock, Pennsylvania manufacturing facility. The shooting site in Dunbar and the nearby secondary shooting site support our Mount Braddock manufacturing facility. The lease for the Dunbar property will expire on December 15, 2015, but we have options to renew the lease which extend through December 15, 2029. The license and risk allocation agreements will expire on December 31, 2018, but we have options to renew these agreements through December 31, 2028. NobelClad has a manufacturing site in Würgendorf, Germany and a shooting site in Dillenburg, Germany. Portions of these sites are leased and portions are owned. The lease expiration date for our Würgendorf manufacturing site is August 31, 2016, but we have options to renew the lease through August 31, 2021 and the expiration date for our Dillenburg shooting site is August 31, 2016 and may be renewed. NobelClad owns the land and the buildings housing its operations in Rivesaltes, France, and Tautavel, France (except for a small portion in Tautavel that is leased). This lease expires on December 31, 2016, and may be extended.
DynaEnergetics
DynaEnergetics leases a manufacturing site and sales office in Troisdorf, Germany. The lease expiration date for our Troisdorf manufacturing site is February 29, 2016 and for the sales office the lease expiration date is February 29, 2016. DynaEnergetics leases office and warehouse space in various cities throughout Alberta, Canada and also leases bunkers for storage of its explosives in various locations throughout Alberta, Canada. These agreements are on a month to month basis. In the United States, DynaEnergetics leases office and warehouse space in various cities throughout Texas, as well as Lafayette, Louisiana and New Mexico. We also lease storage bunkers in various locations in Texas, Arkansas, Louisiana and New Mexico which have month to month agreements. We also lease office and warehouse space Moscow, Russia and other various cities throughout Russia and office and warehouse space in Aktobe, Kazakhstan.
AMK Technical Services
We own the land and buildings housing the operations of AMK Technical Services in South Windsor, Connecticut.
Below are charts summarizing our properties by segment, including their location, type, size, whether owned or leased and lease terms, if applicable.
Corporate Headquarters
|
Location
|
|
Facility Type
|
|
Facility Size
|
|
Owned/Leased
|
|
Expiration Date of Lease
(if applicable)
|
|
Boulder, Colorado
|
|
Corporate and Sales Office
|
|
14,630 sq. ft.
|
|
Leased
|
|
November 30, 2022
|
19
NobelClad
|
Location
|
|
Facility Type
|
|
Facility Size
|
|
Owned/Leased
|
|
Expiration Date of Lease
(if applicable)
|
|
Mt. Braddock, Pennsylvania
|
|
Clad Plate Manufacturing
|
|
48,000 sq. ft.
|
|
Owned
|
|
|
|
Dunbar, Pennsylvania
|
|
Clad Plate Shooting Site
|
|
322 acres
|
|
Leased
|
|
December 15, 2015, with renewal options through December 15, 2029
|
|
Rivesaltes, France
|
|
Clad Plate Manufacturing
|
|
6.6 acres
|
|
Owned
|
|
|
|
Rivesaltes, France
|
|
Clad Plate Manufacturing, Sales and Administration Office
|
|
49,643 sq. ft.
|
|
Owned
|
|
|
|
Rivesaltes, France
|
|
Clad Plate Manufacturing
|
|
Land around building: 61,354 sq. ft.
|
|
Leased
|
|
June 30, 2020, with renewal options
|
|
|
|
|
|
Building: 11,302 sq. ft.
|
|
Leased
|
|
|
|
Tautavel, France
|
|
Clad Shooting Site
|
|
116 acres
|
|
109 acres owned, 7 acres leased
|
|
December 31, 2016, with renewal options
|
|
Dillenburg, Germany
|
|
Clad Plate Shooting Site
|
|
11.4 acres
|
|
Owned
|
|
|
|
|
|
|
|
11,367 sq. ft.
|
|
Leased
|
|
August 31, 2016, with renewal options through August 31, 2021
|
|
Würgendorf, Germany
|
|
Manufacturing
|
|
Land: 25 acres
|
|
Owned
|
|
|
|
|
|
|
|
Shooting site: 53,282 sq. ft.
|
|
Leased
|
|
August 31, 2016, with renewal options
|
|
|
|
|
|
Building: 37,007 sq. ft.
|
|
Leased
|
|
|
|
Würgendorf, Germany
|
|
Sales and Administration Office
|
|
3,881 sq. ft.
|
|
Leased
|
|
March 31, 2016
|
20
DynaEnergetics
|
Location
|
|
Facility Type
|
|
Facility Size
|
|
Owned/Leased
|
|
Expiration Date of Lease
(if applicable)
|
|
Troisdorf, Germany
|
|
Manufacturing
|
|
263,201 sq. ft.
|
|
Leased
|
|
February 29, 2016, with renewal options through February 28, 2026
|
|
Troisdorf, Germany
|
|
Office
|
|
2,033 sq. ft.
|
|
Leased
|
|
February 29, 2016
|
|
Troisdorf, Germany
|
|
Office
|
|
6,135 sq. ft.
|
|
Leased
|
|
February 28, 2015
|
|
Calgary, Alberta
|
|
Sales office
|
|
245 sq. ft.
|
|
Leased
|
|
September 30, 2014, automatically renewed annually without written notice
|
|
Edmonton, Alberta
|
|
Sales office and warehouse
|
|
24,000 sq. ft.
|
|
Leased
|
|
January 31, 2019
|
|
Edmonton, Alberta
|
|
Storage magazines
|
|
759 sq. ft.
|
|
Leased
|
|
Month to month agreement
|
|
Grande Prairie, Alberta
|
|
Sales office and warehouse
|
|
3,000 sq. ft.
|
|
Leased
|
|
December 31, 2015, with five year renewal options
|
|
Grande Prairie, Alberta
|
Storage magazines
|
144 sq. ft.
|
Leased
|
Month to month agreement
|
||||
|
Lloydminster, Alberta
|
|
Sales office and warehouse
|
|
5,460 sq. ft.
|
|
Leased
|
|
October 31, 2014
|
|
Lloydminster, Alberta
|
Storage magazines
|
160 sq. ft.
|
Leased
|
Month to month agreement
|
||||
|
Red Deer, Alberta
|
|
Sales office and warehouse
|
|
6,583 sq. ft.
|
|
Leased
|
|
October 31, 2016
|
|
Red Deer, Alberta
|
Storage magazines
|
168 sq. ft.
|
Leased
|
Month to month agreement
|
||||
|
Andrews, Texas
|
Office and warehouse
|
4,000 sq. ft.
|
Leased
|
December 31, 2016
|
||||
|
Andrews, Texas
|
Land for magazines
|
600 sq. ft.
|
Leased
|
Month to month agreement
|
||||
|
Austin, Texas
|
|
Office
|
|
2,400 sq. ft.
|
|
Leased
|
|
April 30, 2017
|
|
Blum, Texas
|
Office, warehouse, and manufacturing
|
16,800 sq. ft.
|
Owned
|
|||||
|
Blum, Texas
|
Land for magazines
|
206.3 acres
|
Owned
|
|||||
|
Bridgeport, Texas
|
|
Office and warehouse
|
|
4,000 sq. ft.
|
|
Leased
|
|
June 30, 2014
|
|
Bridgeport, Texas
|
|
Land for magazines
|
|
100 acres
|
|
Leased
|
|
Month to month agreement
|
|
Corpus Christi, Texas
|
|
Office and warehouse
|
|
6,000 sq. ft.
|
|
Leased
|
|
August 31, 2018
|
|
Rosharon, Texas
|
|
Office and warehouse
|
|
5,000 sq. ft.
|
|
Leased
|
|
August 31, 2015
|
|
Rosharon, Texas
|
|
Land for magazines
|
|
.25 acres
|
|
Leased
|
|
August 31, 2015
|
|
Spicewood, Texas
|
|
Land for magazines
|
|
500 acres
|
|
Leased
|
|
December 31, 2015
|
21
|
Location
|
|
Facility Type
|
|
Facility Size
|
|
Owned/Leased
|
|
Expiration Date of Lease
(if applicable)
|
|
Tyler, Texas
|
|
Office and warehouse
|
|
4,000 sq. ft.
|
|
Leased
|
|
Month to month agreement
|
|
Victoria, Texas
|
|
Office and warehouse
|
|
4,000 sq. ft.
|
|
Leased
|
|
June 30, 2014
|
|
Victoria, Texas
|
|
Storage magazine
|
|
4,000 sq. ft.
|
|
Leased
|
|
Month to month agreement
|
|
Whitney, Texas
|
Office, warehouse, and manufacturing
|
36,000 sq. ft.
|
Owned
|
|||||
|
East Camden, AR
|
|
Storage magazine
|
|
6,000 sq. ft.
|
|
Leased
|
|
Month to month agreement
|
|
Lafayette, Louisiana
|
|
Office and warehouse
|
|
6,800 sq. ft.
|
|
Leased
|
|
Month to month agreement
|
|
Beaux Bridge, Louisiana
|
|
Storage magazine
|
|
600 sq. ft.
|
|
Leased
|
|
Month to month agreement
|
|
Hobbs, New Mexico
|
|
Office and warehouse
|
|
5,000 sq. ft.
|
|
Leased
|
|
Month to month agreement
|
|
Hobbs, New Mexico
|
|
Storage magazines
|
|
600 sq. ft.
|
|
Leased
|
|
Month to month agreement
|
|
Cota, Colombia
|
Office
|
245 sq. ft.
|
Leased
|
December 31, 2014
|
||||
|
Russia, Nizhnetavdinskiy District
|
|
Manufacturing
|
|
3,733 sq. ft.
|
|
Leased
|
|
February 28, 2014
|
|
Russia, Nizhnetavdinskiy District
|
Land
|
59.7 acres
|
Leased
|
October 10, 2015
|
||||
|
1.6 acres
|
Leased
|
August 8, 2016
|
||||||
|
Russia, Nizhnetavdinskiy District
|
Office
|
5,769 sq. ft.
|
Owned
|
|||||
|
Russia, Nizhnetavdinskiy District
|
Manufacturing
|
59,686 sq. ft.
|
Owned
|
|||||
|
Russia, Nizhnetavdinskiy District
|
Gatehouse
|
1,658 sq. ft.
|
Owned
|
|||||
|
Moscow, Russia
|
|
Sales office
|
|
939 sq. ft.
|
|
Leased
|
|
June 30, 2014, subject for prolongation every year
|
|
Chapaevsk, Russia
|
|
Warehouse
|
|
3,000 sq. ft.
|
|
Leased
|
|
December 31, 2014
|
|
Noyabrsk, Russia
|
|
Warehouse
|
|
3,229 sq. ft.
|
|
Leased
|
|
December 31, 2014
|
|
Nizhnevartovsk, Russia
|
|
Warehouse
|
|
7,750 sq. ft.
|
|
Leased
|
|
March 31, 2014
|
|
Sheremetyevo, Russia (Mezdunarodnoye Shosse 9)
|
|
Warehouse
|
|
Any shipped quantity of goods
|
|
Leased
|
|
Not limited
|
|
Aktobe, Kazakhstan
|
|
Sales Office
|
|
538 sq. ft.
|
|
Owned
|
|
|
|
Aktobe, Kazakhstan
|
|
Land (sales office)
|
|
0.09 acres
|
|
Owned
|
|
|
|
Aktobe, Kazakhstan
|
|
Storage
|
|
1,076 sq. ft.
|
|
Leased
|
|
Subject for prolongation every year
|
|
Aktobe, Kazakhstan
|
|
Bunker
|
|
2,389 sq. ft.
|
|
Owned
|
|
|
22
|
Location
|
|
Facility Type
|
|
Facility Size
|
|
Owned/Leased
|
|
Expiration Date of Lease
(if applicable) |
|
Aktobe, Kazakhstan
|
|
Land
|
|
20 acres
|
|
Leased
|
|
Year 2050
|
|
Aktobe, Kazakhstan
|
|
Land (power line)
|
|
0.5 acres
|
|
Leased
|
|
Year 2050
|
AMK Technical Services
|
Location
|
|
Facility Type
|
|
Facility Size
|
|
Owned/Leased
|
|
Expiration Date of Lease
(if applicable)
|
|
South Windsor, Connecticut
|
|
Manufacturing
|
|
33,850 sq. ft.
|
|
Owned
|
|
|
Although we may in the future become a party to litigation, there are no pending legal proceedings against us.
Not applicable.
23
Our common stock is publicly traded on The Nasdaq National Market (“Nasdaq”) under the symbol “BOOM.” The following table sets forth quarterly high and low sales prices for the common stock during our last two fiscal years, as reported by Nasdaq.
|
2013
|
High
|
Low
|
||||||
|
First Quarter
|
$
|
18.87
|
|
$
|
13.89
|
|
||
|
Second Quarter
|
$
|
17.40
|
|
$
|
15.19
|
|
||
|
Third Quarter
|
$
|
24.09
|
|
$
|
16.48
|
|
||
|
Fourth Quarter
|
$
|
23.63
|
|
$
|
20.91
|
|
||
|
2012
|
High
|
Low
|
||||||
|
First Quarter
|
$
|
24.53
|
|
$
|
19.37
|
|
||
|
Second Quarter
|
$
|
21.50
|
|
$
|
15.35
|
|
||
|
Third Quarter
|
$
|
18.65
|
|
$
|
14.74
|
|
||
|
Fourth Quarter
|
$
|
15.52
|
|
$
|
12.18
|
|
||
As of March 4, 2014, there were approximately 322 holders of record of our common stock.
We declared and paid quarterly dividends aggregating $0.16 per share dividend in each of 2013 and 2012. We have declared a quarterly dividend of $0.04 per share for the first quarter of 2014. We may pay quarterly dividends subject to capital availability and periodic determinations that cash dividends are in the best interests of our stockholders, but we cannot assure you that such payments will continue. Future dividends may be affected by, among other items, our views on potential future capital requirements, future business prospects, debt covenant compliance considerations, changes in income tax laws, and any other factors that our Board of Directors deems relevant. Any determination to pay cash dividends will be at the discretion of the Board of Directors.
24
FINANCIAL PERFORMANCE
The following graph compares the performance of our common stock with the Nasdaq Non-Financial Stocks Index and the Nasdaq Composite (U.S.) Index. The comparison of total return (change in year-end stock price plus reinvested dividends) for each of the years assumes that $100 was invested on December 31, 2008, in each of the Company, Nasdaq Non-Financial Stocks Index and the Nasdaq Composite (U.S.) Index with investment weighted on the basis of market capitalization. Historical results are not necessarily indicative of future performance.
As a results of a change in the total return data made available to us through the Nasdaq, our performance graphs going forward will be using a comparable index provided by the Nasdaq OMX Global Indexes. Please note, information for the CRSP Index was provided through December 31, 2013, the last day this data was available by the Nasdaq. We have included performance graphs using both indexes through December 31, 2013.

|
Total Return Analysis
|
12/31/08
|
12/31/09
|
12/31/10
|
12/30/11
|
12/31/12
|
12/31/13
|
|
Dynamic Materials Corp
|
$100
|
$103.83
|
$116.88
|
$102.43
|
$71.98
|
$112.58
|
|
Nasdaq Non-Financial Stocks
|
$100
|
$150.81
|
$178.61
|
$178.37
|
$209.07
|
$292.89
|
|
Nasdaq Composite (US)
|
$100
|
$143.74
|
$170.17
|
$171.08
|
$202.4
|
$281.91
|
25
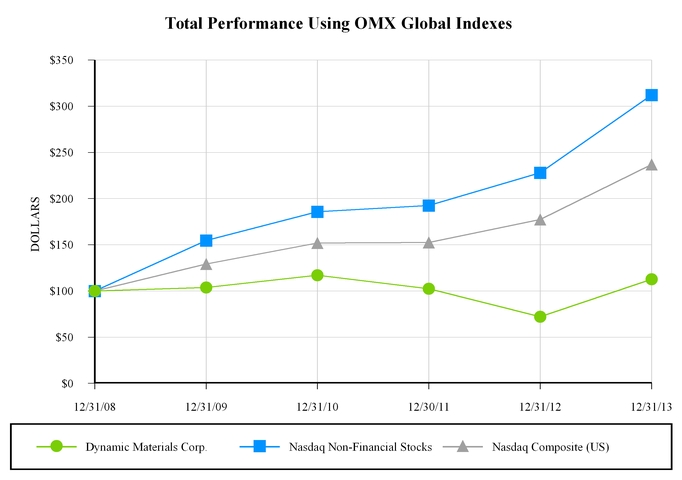
|
Total Return Analysis
|
12/31/08
|
12/31/09
|
12/31/10
|
12/30/11
|
12/31/12
|
12/31/13
|
|
Dynamic Materials Corp
|
$100
|
$103.83
|
$116.88
|
$102.43
|
$71.98
|
$112.58
|
|
Nasdaq Non-Financial Stocks
|
$100
|
$154.61
|
$185.76
|
$192.56
|
$227.89
|
$312.02
|
|
Nasdaq Composite (US)
|
$100
|
$129.26
|
$151.94
|
$152.42
|
$177.46
|
$236.88
|
26
ITEM 6.
Selected Financial Data
The following selected financial data should be read in conjunction with the Consolidated Financial Statements, including the related Notes, and “Management’s Discussion and Analysis of Financial Condition and Results of Operations.” The 2009 selected financial data includes the operating results of LRI from the October 1, 2009, acquisition date through December 31, 2009, and balance sheet information as of December 31, 2009. The 2010 selected financial data includes consolidation of the operating results of the two Russian joint ventures from the April 30, 2010, acquisition date, through December 31, 2010, and balance sheet information as of December 31, 2010. The 2010 selected financial data also includes the operating results of DYNAenergetics US from the June 4, 2010, acquisition date, through December 31, 2010, and balance sheet information as of December 31, 2010. The 2012 selected financial data includes the operating results of TRX from the January 3, 2012, acquisition date through December 31, 2012, and the balance sheet information as of December 31, 2012.
|
(Dollars in Thousands, Except Per Share Data)
|
||||||||||||||||||||
|
|
Year Ended December 31,
|
|||||||||||||||||||
|
|
2013
|
2012
|
2011
|
2010
|
2009
|
|||||||||||||||
|
Statement of Operations
|
|
|
|
|
|
|
|
|
|
|
||||||||||
|
Net sales
|
$
|
209,573
|
|
$
|
201,567
|
|
$
|
208,891
|
|
$
|
154,739
|
|
$
|
164,898
|
|
|||||
|
Cost of products sold
|
150,059
|
|
141,859
|
|
153,445
|
|
117,789
|
|
121,779
|
|
||||||||||
|
Gross profit
|
59,514
|
|
59,708
|
|
55,446
|
|
36,950
|
|
43,119
|
|
||||||||||
|
Cost and expenses
|
47,817
|
|
42,305
|
|
37,227
|
|
30,161
|
|
26,881
|
|
||||||||||
|
Income from operations
|
11,697
|
|
17,403
|
|
18,219
|
|
6,789
|
|
16,238
|
|
||||||||||
|
Other income (expense), net
|
(1,169
|
)
|
(851
|
)
|
(1,409
|
)
|
(401
|
)
|
(3,255
|
)
|
||||||||||
|
Income before income taxes
|
10,528
|
|
16,552
|
|
16,810
|
|
6,388
|
|
12,983
|
|
||||||||||
|
Income tax provision
|
2,941
|
|
4,858
|
|
4,369
|
|
1,133
|
|
4,378
|
|
||||||||||
|
Net income
|
7,587
|
|
11,694
|
|
12,441
|
|
5,255
|
|
8,605
|
|
||||||||||
|
Net income (loss) attributable to non-controlling interest
|
92
|
|
(2
|
)
|
(50
|
)
|
(10
|
)
|
56
|
|
||||||||||
|
Net income attributable to Dynamic Materials Corporation
|
$
|
7,495
|
|
$
|
11,696
|
|
$
|
12,491
|
|
$
|
5,265
|
|
$
|
8,549
|
|
|||||
|
Net income per share:
|
|
|
|
|
|
|
|
|
|
|
||||||||||
|
Basic
|
$
|
0.55
|
|
$
|
0.87
|
|
$
|
0.94
|
|
$
|
0.40
|
|
$
|
0.67
|
|
|||||
|
Diluted
|
$
|
0.54
|
|
$
|
0.87
|
|
$
|
0.93
|
|
$
|
0.40
|
|
$
|
0.66
|
|
|||||
|
Weighted average number of shares outstanding:
|
|
|
|
|
|
|
|
|
|
|
||||||||||
|
Basic
|
13,533,566
|
|
13,264,636
|
|
13,089,691
|
|
12,869,666
|
|
12,640,069
|
|
||||||||||
|
Diluted
|
13,537,525
|
|
13,268,713
|
|
13,099,121
|
|
12,881,754
|
|
12,662,440
|
|
||||||||||
|
Dividends Declared per Common Share
|
$
|
0.16
|
|
$
|
0.16
|
|
$
|
0.16
|
|
$
|
0.16
|
|
$
|
0.12
|
|
|||||
|
Financial Position
|
|
|
|
|
|
|
|
|
|
|
||||||||||
|
Current assets
|
$
|
98,764
|
|
$
|
100,666
|
|
$
|
91,189
|
|
$
|
72,735
|
|
$
|
87,974
|
|
|||||
|
Total assets
|
240,612
|
|
235,431
|
|
213,426
|
|
201,393
|
|
225,176
|
|
||||||||||
|
Current liabilities
|
31,192
|
|
24,378
|
|
29,310
|
|
38,392
|
|
42,135
|
|
||||||||||
|
Long-term debt and capital lease obligations
|
26,408
|
|
37,853
|
|
26,650
|
|
14,734
|
|
34,556
|
|
||||||||||
|
Other non-current liabilities
|
10,220
|
|
10,644
|
|
11,423
|
|
13,183
|
|
16,189
|
|
||||||||||
|
Non-controlling interest
|
—
|
|
84
|
|
83
|
|
160
|
|
185
|
|
||||||||||
|
Dynamic Materials Corporation’s stockholders’ equity
|
172,792
|
|
162,472
|
|
145,960
|
|
134,924
|
|
132,111
|
|
||||||||||
27
The following discussion should be read in conjunction with our historical consolidated financial statements and notes, as well as the selected historical consolidated financial data included elsewhere in this annual report.
Unless stated otherwise, all dollar figures in this discussion are presented in thousands (000’s).
Executive Overview
Our business is organized into three segments: NobelClad, DynaEnergetics and AMK Technical Services. In 2013, NobelClad accounted for 56% of our net sales and 76% of our income from operations before consideration of unallocated corporate expenses and stock-based compensation expense, which are not allocated to our business segments. Our DynaEnergetics and AMK Technical Services segments accounted for 40% and 4%, respectively, of our 2013 net sales, and 22% and 2%, respectively, of our income from operations before unallocated corporate expenses and stock-based compensation expense. In 2012 and 2011, NobelClad accounted for 57% and 60% of our net sales, respectively, and 69% and 66%, respectively, of income from operations before unallocated corporate expenses and stock-based compensation expense.
Our 2013 net sales increased by $8,006, or 4%, compared to 2012 net sales. The year-to-year consolidated net sales increase reflects sales increases of $3,076 (2.7%) for our NobelClad segment and $6,247 (8.1%) for our DynaEnergetics segment. These sales increases were partially offset by a sales decrease of $1,317 (14.9%) for our AMK Technical Services segment. Largely as a result of an increase of $5,512 in operating expenses, our consolidated income from operations decreased to $11,697 in 2013 from $17,403 in 2012. This $5,706 decrease in operating income reflects decreases of $349, $2,198 and $549 in the operating income reported by our NobelClad, DynaEnergetics and AMK Technical Services business segments, respectively, and a net increase of $2,610 in aggregate unallocated corporate expenses and stock-based compensation expense which includes $2,965 of non-recurring expenses associated with executive management retirements. Reported consolidated operating income for 2013 and for 2012 includes amortization expense of
$6,348
and
$6,210
, respectively, relating to purchased intangible assets associated with several acquisitions executed between November 2007 and January 2012. We reported net income of
$7,495
in 2013 compared to
$11,696
in 2012.
The explosion-welded clad plate market is dependent upon sales of products for use by customers in a number of heavy industries, including oil and gas, chemicals and petrochemicals, aluminum production, power generation, shipbuilding, industrial refrigeration, alternative energy and hydrometallurgy. These industries tend to be cyclical in nature and the uneven worldwide economic recovery has affected many of these markets. While certain sectors continue to be slow, including alternative energy, hydrometallurgy and power generation, quoting activity in other end markets remains healthy, and we continue to track an extensive list of projects. While timing of new order inflow remains difficult to predict, we believe that our NobelClad segment is well-positioned to benefit as global economic conditions improve.
As a result of acquisitions made during 2009, 2010 and 2012 and strong organic sales growth in 2010 and 2011, our DynaEnergetics segment has grown into a second core business for us, generating 40%, 39% and 35% of our consolidated net sales in 2013, 2012 and 2011, respectively, as compared to only 13% of our consolidated net sales in 2009.
Our NobelClad backlog decreased to $36,930 at December 31, 2013 from $46,398 at December 31, 2012. Based upon the negative impact this backlog decrease is expected to have on NobelClad's 2014 sales and an expected year over year sales increase for our DynaEnergetics business segment, we believe that our 2014 consolidated net sales will be flat to up 4% versus the
$209,573
in consolidated net sales that we reported in 2013.
Net sales
NobelClad's revenues are generated principally from sales of clad metal plates and sales of transition joints, which are made from clad plates, to customers that fabricate industrial equipment for various industries, including oil and gas, petrochemicals, alternative energy, hydrometallurgy, aluminum production, shipbuilding, power generation, industrial refrigeration, and similar industries. While a large portion of the demand for our clad metal products is driven by new plant construction and large plant expansion projects, maintenance and retrofit projects at existing chemical processing, petrochemical processing, oil refining, and aluminum smelting facilities also account for a significant portion of total demand.
DynaEnergetics' revenues are generated principally from sales of shaped charges, detonators and detonating cord, and bidirectional boosters and perforating guns to customers who perform the perforation of oil and gas wells and from sales of seismic products to customers involved in oil and gas exploration activities.
28
AMK Technical Services' revenues are generated from welding, heat treatment, and inspection services that are provided with respect to customer-supplied parts for customers primarily involved in the power generation industry and aircraft engine markets.
A significant portion of our revenue is derived from a relatively small number of customers; therefore, the failure to complete existing contracts on a timely basis, to receive payment for such services in a timely manner, or to enter into future contracts at projected volumes and profitability levels could adversely affect our ability to meet cash requirements exclusively through operating activities. We attempt to minimize the risk of losing customers or specific contracts by continually improving product quality, delivering product on time and competing aggressively on the basis of price.
Gross profit and cost of products sold
Cost of of products sold for NobelClad includes the cost of metals and alloys used to manufacture clad metal plates, the cost of explosives, employee compensation and benefits, freight, outside processing costs, depreciation of manufacturing facilities and equipment, manufacturing supplies and other manufacturing overhead expenses.
Cost of products sold for DynaEnergetics includes the cost of metals, explosives and other raw materials used to manufacture shaped charges, detonating products and perforating guns as well as employee compensation and benefits, depreciation of manufacturing facilities and equipment, manufacturing supplies and other manufacturing overhead expenses.
AMK Technical Services' cost of products sold consists principally of employee compensation and benefits, welding supplies (wire and gas), depreciation of manufacturing facilities and equipment, outside services and other manufacturing overhead expenses.
Backlog
We use backlog as a primary means of measuring the immediate outlook for our NobelClad business. We define “backlog” at any given point in time as consisting of all firm, unfulfilled purchase orders and commitments at that time. Generally speaking, we expect to fill most backlog orders within the following 12 months. From experience, most firm purchase orders and commitments are realized.
Forward-Looking Statements
This annual report and the documents incorporated by reference into it contain certain forward-looking statements within the safe harbor provisions of the Private Securities Litigations Reform Act of 1995. These statements include information with respect to our anticipated future financial condition and results of operations and businesses. Words such as “anticipates,” “expects,” “intends,” “plans,” “believes,” “seeks,” “estimates,” “may,” “will,” “continue,” “project,” “forecast,” and similar expressions, as well as statements in the future tense, identify forward-looking statements.
These forward-looking statements are not guarantees of our future performance and are subject to risks and uncertainties that could cause actual results to differ materially from the results contemplated by the forward-looking statements. These risks and uncertainties include:
•
The ability to obtain new contracts at attractive prices;
•
The size and timing of customer orders;
•
Fluctuations in customer demand;
•
General economic conditions, both domestically and abroad, and their effect on us and our customers;
•
Competitive factors;
•
The timely completion of contracts;
•
The timing and size of expenditures;
•
The timely receipt of government approvals and permits;
•
The adequacy of local labor supplies at our facilities;
29
|
•
|
The application of governmental regulation and oversight of our operations and products and the industries in which our customers operate;
|
•
The availability and cost of funds; and
•
Fluctuations in foreign currencies.
The effects of these factors are difficult to predict. New factors emerge from time to time and we cannot assess the potential impact of any such factor on the business or the extent to which any factor, or combination of factors, may cause results to differ materially from those contained in any forward-looking statement. Any forward-looking statement speaks only as of the date of this annual report, and we do not undertake any obligation to update any forward-looking statement to reflect events or circumstances after the date of such statement or to reflect the occurrence of unanticipated events. In addition, see “Risk Factors” for a discussion of these and other factors.
Year ended December 31, 2013 compared to Year Ended December 31, 2012
Net sales
|
|
2013
|
2012
|
Change
|
Percentage
Change
|
|||||||||||
|
Net sales
|
$
|
209,573
|
|
$
|
201,567
|
|
$
|
8,006
|
|
4.0
|
%
|
||||
Net sales for 2013 increased
4.0%
to
$209,573
from
$201,567
in 2012. This $8,006 sales increase includes a favorable foreign exchange translation adjustment of $3,070 that relates principally to the strengthening of the Euro against the U.S. dollar during 2013. Excluding the impact of this foreign exchange adjustment, the increase in our 2013 consolidated net sales was 2.5%.
NobelClad sales increased 2.7% to $118,409 in 2013 (56% of total sales) from $115,333 in 2012 (57% of total sales). The $3,076 increase in year-to-year NobelClad reflects the change in our beginning of the year backlog, which increased to $46,398 at December 31, 2012 from $44,564 at December 31, 2011, a favorable foreign exchange translation adjustment of $1,595, and the impact of timing differences with respect to when orders enter our backlog and the subsequent shipment of these orders.
DynaEnergetics contributed $83,651 to sales in 2013 (40% of total sales) compared to $77,404 in 2012 (39% of total sales), which represents a sales increase of 8.1%. Since average North American rig count in the oil and gas industry was relatively flat during 2013 and 2012, the sales increase is largely attributable to geographical expansion initiatives, favorable changes in product/customer mix and a favorable foreign exchange translation adjustment of $1,475.
AMK Technical Services contributed $7,513 to 2013 sales (4% of total sales) versus sales of $8,830 in 2012 (4% of total sales), a decrease of 14.9%. AMK continued to experience a decline in ground power sales during 2013 that is attributable to a customer's decision to discontinue new production work on a ground turbine platform that accounted for a major portion of AMK's historical ground power revenues. While we believe that AMK can replace this lost revenue stream over time by developing new business opportunities with both existing and new customers in the aircraft engine, ground turbine, and oil and gas industries, we believe that 2014 will be another transition year for AMK.
Gross profit
|
2013
|
2012
|
Change
|
Percentage
Change
|
||||||||||||
|
Gross profit
|
$
|
59,514
|
|
$
|
59,708
|
|
$
|
(194
|
)
|
(0.3
|
)%
|
||||
|
Consolidated gross profit margin rate
|
28.4
|
%
|
29.6
|
%
|
|
|
|
|
|||||||
Gross profit decreased by
0.3%
to
$59,514
in 2013 from
$59,708
in 2012. Our 2013 consolidated gross profit margin rate decreased to
28.4%
from
29.6%
in 2012.
The gross profit margin for NobelClad decreased from 27.0% in 2012 to 25.4% in 2013. The decrease relates principally to changes in 2013 product mix as compared to 2012. As has been the case historically, we expect to see continued fluctuations in NobelClad's quarterly gross margin rates in the future that result from fluctuations in quarterly sales volume and changes in product/customer mix.
30
DynaEnergetics’ gross margin decreased to 34.0% in 2013 from 34.8% in 2012. After performing a comprehensive review of DynaEnergetics inventories during 2013 to identify potentially excess, slow moving and obsolete inventory items, we determined that a change in our estimate of reserve requirements was required and recorded a year-to-year increase of $1,800 (2.2% of sales) in our provision for excess, slow-moving and obsolete inventory. Excluding the negative impact of this increased inventory provision, the DynaEnergetics' gross margin would have improved to 36.2% in 2013 from 34.8% in 2012 as result of favorable changes in product/customer mix.
The gross profit margin for AMK Technical Services decreased to 16.9% in 2013 from 22.1% in 2012, with this decrease relating principally to the $1,317 decrease in AMK's 2013 sales and the fact that the majority of AMK's manufacturing costs are fixed in nature.
Based upon the expected contribution to 2014 consolidated net sales by each of our three business segments, we expect our consolidated full year 2014 gross margin to be in a range of 29% to 31% as compared to the
28.4%
gross margin that we reported for 2013.
General and administrative expenses
|
2013
|
2012
|
Change
|
Percentage
Change
|
||||||||||||
|
General and administrative expenses
|
$
|
25,273
|
|
$
|
19,141
|
|
$
|
6,132
|
|
32.0
|
%
|
||||
|
Percentage of net sales
|
12.1
|
%
|
9.5
|
%
|
|
|
|
|
|||||||
General and administrative expenses increased by
$6,132
, or
32.0%
, to
$25,273
in 2013 from
$19,141
in 2012. Excluding the impacts of $2,965 in non-recurring expenses associated with management retirements and a $756 asset impairment charge related to an information system project in Russia, our general and administrative increased $2,411 or 12.6%. This increase includes an aggregate increase of $733 in salaries, benefits and payroll taxes, an increase of $1,215 in consulting/professional service expenses, including $439 for our re-branding project, an increase of $466 in business travel expenses, an increase of $342 in other personnel costs (principally recruiting and relocation), and a net decrease of $345 in all other expense categories. Excluding the impact of non-recurring management retirement and asset impairment expenses, general and administrative expenses, as a percentage of net sales, increased to 10.3% in 2013 from
9.5%
in 2012.
Selling and distribution expenses
|
2013
|
2012
|
Change
|
Percentage
Change
|
||||||||||||
|
Selling and distribution expenses
|
$
|
16,196
|
|
$
|
16,954
|
|
$
|
(758
|
)
|
(4.5
|
)%
|
||||
|
Percentage of net sales
|
7.7
|
%
|
8.4
|
%
|
|
|
|
|
|||||||
Selling and distribution expenses decreased by
4.5%
to
$16,196
in 2013 from
$16,954
in 2012. This decrease in our selling and distribution expenses includes decreases in stock-based compensation and commissions of $917 and $175, respectively, which were offset by increases in salaries, benefits and payroll taxes of $222 and a net increase of $112 in all other expense categories. The large decrease in 2013 stock-based compensation expense relates principally to the December 31, 2012 retirement of a senior sales executive for whom $860 of stock-based compensation expense was recognized in 2012. As a percentage of net sales, selling and distribution expenses decreased to
7.7%
in 2013 compared to
8.4%
in 2012.
Our 2013 consolidated selling and distribution expenses include $5,574 and $10,377 for our NobelClad and DynaEnergetics business segments, respectively. Our 2012 consolidated selling and distribution expenses include $6,795 and $9,058 for our NobelClad and DynaEnergetics business segments, respectively. The higher level of selling and distribution expenses for our DynaEnergetics segment relative to its contribution to our consolidated net sales reflects the need, particularly in North America, to maintain a number of strategically located distribution centers that are in close proximity to areas which contain a large concentration of oilfields and enjoy a high volume of related oil and gas drilling activities.
31
Amortization expenses
|
2013
|
2012
|
Change
|
Percentage
Change
|
||||||||||||
|
Amortization of purchased intangible assets
|
$
|
6,348
|
|
$
|
6,210
|
|
$
|
138
|
|
2.2
|
%
|
||||
|
Percentage of net sales
|
3.0
|
%
|
3.1
|
%
|
|
|
|
|
|||||||
Amortization expense relates to the amortization of values assigned to intangible assets in connection with our prior years acquisitions of DYNAenergetics, LRI, the two Russian joint ventures, Austin Explosives and our January 3, 2012 acquisition of TRX Industries, all part of our DynaEnergetics business segment. The
$138
increase in 2013 amortization expenses reflects the impact of foreign currency translation effects. Amortization expense for 2013 includes $5,021, $1,136, and $191 relating to values assigned to customer relationships, core technology, and trademarks/trade names, respectively. Amortization expense for 2012 includes $4,924, $1,101, and $185 relating to values assigned to customer relationships, core technology, and trademarks/trade names, respectively. Amortization expense (as measured in Euros) associated with the DYNAenergetics acquisition and the acquisition of the two Russian joint ventures is expected to approximate €3,333 and €225, respectively, in 2014. Our 2014 amortization expense associated with the Austin Explosives acquisition and the acquisition of TRX Industries is expected to approximate $435 and $895, respectively, and our 2014 amortization expense (as measured in Canadian dollars) associated with the LRI acquisition is expected to approximate 80 CAD.
Operating income
|
2013
|
2012
|
Change
|
Percentage
Change
|
||||||||||||
|
Operating income
|
$
|
11,697
|
|
$
|
17,403
|
|
$
|
(5,706
|
)
|
(32.8
|
)%
|
||||
Income from operations (“operating income”) decreased by
32.8%
to
$11,697
in 2013 from
$17,403
in 2012. The above consolidated operating income totals for 2013 and 2012 include $7,217 and $3,565, respectively, of unallocated corporate expenses and $3,401 and $4,443, respectively, of stock-based compensation expense. These expenses are not allocated to our business segments and thus are not included in the below 2013 and 2012 operating income totals for NobelClad, DynaEnergetics, and AMK Technical Services.
The
$5,706
decrease in our consolidated operating income for 2013 reflects a decrease of $3,096 in the aggregate operating income reported by our three business segments, an increase in unallocated corporate expenses of $3,652, and a decrease in stock-based compensation expense of $1,042. The aggregate net increase of $2,610 in unallocated corporate expenses and stock-based compensation expense includes $2,965 of non-recurring expenses associated with management retirements, the majority of which relates to the March 1, 2013 retirement of Yvon Cariou, our former President and Chief Executive Officer, who was succeeded in this position by Kevin Longe, our former Chief Operating Officer who joined the Company in July 2012.
NobelClad reported operating income of $17,090 in 2013 as compared to $17,439 in 2012. This $349 or 2.0% decrease in NobelClad's 2013 operating income reflects a small sales increase of 2.7% that was more than offset by a decline in the gross margin rate to 25.4% in 2013 from 27.0% in 2012. Operating results of NobelClad for 2013 and 2012 include $2,121 and $2,054, respectively, of amortization expense of purchased intangible assets.
DynaEnergetics reported operating income of $4,849 in 2013 compared to operating income of $7,047 in 2012. The $2,198 decrease in operating income for our DynaEnergetics segment reflects a $1,531 increase in gross profit that was more than offset by a $3,729, or 18.7%, increase in total operating expenses. While DynaEnergetics reported a 2013 sales increase of $6,247, or 8.1%, the gross profit increase was limited to $1,531 (an incremental gross margin rate of 24.5%) due principally to the $1,800 increase in the provision for excess, slow-moving and obsolete inventory that DynaEnergetics recorded in 2013 as further discussed above. Operating results of DynaEnergetics for 2013 and 2012 include $4,227 and $4,156, respectively, of amortization expense of purchased intangible assets.
AMK Technical Services reported operating income of $376 in 2013, a decrease of $549, or 59.4%, from the $925 in operating income that it reported in 2012. The decline in AMK’s operating income is largely attributable to the declines in sales and gross margin rate as discussed above.
32
Other income (expense), net
|
2013
|
2012
|
Change
|
Percentage
Change
|
||||||||||||
|
Other income (expense), net
|
$
|
(528
|
)
|
$
|
(32
|
)
|
$
|
(496
|
)
|
1,550.0
|
%
|
||||
We reported net other expense of
$528
in 2013 compared to net other expense of
$32
in 2012. Our 2013 net other income includes net realized and unrealized foreign exchange losses of $836 and net other income items aggregating $308. Our 2012 net other expense includes net realized and unrealized foreign exchange losses of $45 and net other income items aggregating $13.
Interest income (expense), net
|
2013
|
2012
|
Change
|
Percentage
Change
|
||||||||||||
|
Interest income (expense), net
|
$
|
(641
|
)
|
$
|
(819
|
)
|
$
|
178
|
|
(21.7
|
)%
|
||||
We recorded net interest expense of
$641
in 2013 compared to net interest expense of
$819
in 2012. The decreases in 2013 net interest expense reflects relatively stable interest rates, decreases in average outstanding borrowings during the year and an increase in capitalized interest on our greenfield capital investment projects in Russia and North America.
Income tax provision
|
2013
|
2012
|
Change
|
Percentage
Change
|
||||||||||||
|
Income tax provision
|
$
|
2,941
|
|
$
|
4,858
|
|
$
|
(1,917
|
)
|
(39.5
|
)%
|
||||
|
Effective tax rate
|
27.9
|
%
|
29.3
|
%
|
|
|
|
|
|||||||
We recorded an income tax provision of
$2,941
in 2013 compared to
$4,858
in 2012. Our 2013 effective tax rate decreased to
27.9%
from
29.3%
in 2012. Our consolidated income tax provision for 2013 and 2012 included $1,203 and $3,587, respectively, related to U.S. taxes, with the remainder relating to net foreign tax provisions of $1,738 in 2013 and $1,271 in 2012, respectively, associated with our foreign operations and holding companies.
Our statutory income tax rates range from 20% to 35% for our various U.S. and foreign operating entities and holding companies. In January 2013, the United States Congress authorized, and the President signed into law, changes to the U. S. income tax laws which were retroactive to January 1, 2012. However, since these changes were enacted in 2013, the financial statement benefit of such legislation could not be reflected until the first quarter of 2013. The $914 tax benefit that we recognized in 2013 had a significant favorable impact on full year effective tax rate. During 2013, we also recorded a one-time tax expense of $812 associated with a German tax audit settlement as further discussed below. This non-recurring adjustment had a significant unfavorable impact on full year effective tax rate. Excluding the effects of the $914 tax benefit and the $812 of additional German tax expense, our 2013 effective tax rate would have been 29%. Year-to-year fluctuations in our consolidated effective tax rate also reflect the different tax rates in our U.S. and foreign tax jurisdictions and the variation in contribution to consolidated pre-tax income from each jurisdiction for the respective year.
Tax returns of our German subsidiaries have been under routine examination by the German tax authorities for most of 2013. During 2013, German tax authorities proposed and we agreed to a settlement. The key provisions of the settlement resulted in a net reduction of the subsidiaries' loss carryforwards, which reduced the non-current deferred tax assets associated with these carryforwards that were recorded on our books. Thus, we recorded an additional $812 in income tax expense to reflect these reductions. The settlement also resulted in an increase in the tax basis of our amortizable, intangible assets; however, under U.S. GAAP, this increase is not reflected in the financial statements. The tax savings from the increase in these assets will be realized by the Company over the next nine years as a reduction in the taxes payable.
We expect our blended effective tax rate for the full year 2014 to range from 29% to 30% based on projected pre-tax income.
33
Adjusted EBITDA
|
2013
|
2012
|
Change
|
Percentage
Change
|
||||||||||||
|
Adjusted EBITDA
|
$
|
27,901
|
|
$
|
33,595
|
|
$
|
(5,694
|
)
|
(16.9
|
)%
|
||||
Adjusted EBITDA is a non-GAAP measure that we believe provides an important indicator of our ongoing operating performance. Our aggregate non-cash depreciation, amortization of purchased intangible assets and stock-based compensation expense for 2013 and 2012 was
$16,296
and
$16,190
, respectively. These aggregate non-cash charges represent a significant percentage of the consolidated operating income that we reported for these periods. We use non-GAAP EBITDA and Adjusted EBITDA in our operational and financial decision-making and believe that these non-GAAP measures facilitate a more meaningful and accurate comparison of the operating performance of our three business segments than do certain GAAP measures. Research analysts, investment bankers and lenders also use EBITDA and Adjusted EBITDA to assess operating performance. In addition, during 2013 and 2014, our management incentive awards will be based, in part, upon the amount of EBITDA achieved during the year. A portion of the equity incentive awards granted in 2014 to our named executive officers will be earned based on the amount of Adjusted EBITDA achieved in 2014 and 2015. The following is a reconciliation of the most directly comparable GAAP measure to Adjusted EBIDTA.
|
|
2013
|
2012
|
||||
|
Net income attributable to DMC
|
7,495
|
|
11,696
|
|
||
|
Interest expense
|
648
|
|
832
|
|
||
|
Interest income
|
(7
|
)
|
(13
|
)
|
||
|
Provision for income taxes
|
2,941
|
|
4,858
|
|
||
|
Depreciation
|
6,547
|
|
5,537
|
|
||
|
Amortization of purchased intangible assets
|
6,348
|
|
6,210
|
|
||
|
EBITDA
|
23,972
|
|
29,120
|
|
||
|
Stock-based compensation
|
3,401
|
|
4,443
|
|
||
|
Other (income) expense, net
|
528
|
|
32
|
|
||
|
Adjusted EBITDA
|
27,901
|
|
33,595
|
|
||
Adjusted EBITDA decreased
16.9%
to
$27,901
in 2013 from
$33,595
in 2012 primarily due to the decrease in operating income of $5,706 as discussed above.
Year ended December 31, 2012 compared to Year Ended December 31, 2011
Net sales
|
|
2012
|
2011
|
Change
|
Percentage
Change
|
|||||||||||
|
Net sales
|
$
|
201,567
|
|
$
|
208,891
|
|
$
|
(7,324
|
)
|
(3.5
|
)%
|
||||
Net sales for 2012 decreased 3.5% to $201,567 from $208,891 in 2011. This $7,324 sales decline includes an unfavorable foreign exchange translation adjustment of $6,464 that relates principally to the strengthening of the U.S, dollar against the Euro during 2012. Excluding the impact of this foreign exchange adjustment, the decrease in our 2012 consolidated net sales was only 0.4%.
NobelClad sales decreased 8.6% to $115,333 in 2012 (57.2% of total sales) from $126,199 in 2011 (60.4% of total sales). Our beginning of the year NobelClad backlog decreased to $44,564 at the beginning of 2012 from $56,539 at the beginning of 2011. The $10,866 decrease in year-to-year 2012 sales follows this $11,975 decrease in beginning of the year backlog. The backlog at the beginning of 2011 was favorably impacted by two large orders that we booked in December of 2010. We did not see similar large order activity near the end of either 2011 or 2012 when our year-end backlog stood at $44,564 and $46,398, respectively.
DynaEnergetics contributed $77,404 to sales in 2012 (38.4% of total sales) compared to $72,782 in 2011 (34.8% of total sales), which represents a sales increase of 6.4%. Excluding incremental sales of $5,458 from our 2012 acquisition of TRX, 2012
34
DynaEnergetics sales decreased $836, or 1.1%. This decrease is principally attributable to a decline in rig count in both the United States and Canada during last the first six months of 2012 which negatively affected our North America sales for this same period.
AMK Technical Services contributed $8,830 to 2012 sales (4.4% of total sales) versus sales of $9,910 in 2011 (4.7% of total sales), a decrease of 10.9%. This decrease reflects a $1,769, or 24.2%, decline in ground power sales that is attributable to a customer’s decision to discontinue new production work on a ground turbine platform that has accounted for a major portion of AMK’s historical ground power revenues.
Gross profit
|
2012
|
2011
|
Change
|
Percentage
Change
|
||||||||||||
|
Gross profit
|
$
|
59,708
|
|
$
|
55,446
|
|
$
|
4,262
|
|
7.7
|
%
|
||||
|
Consolidated gross profit margin rate
|
29.6
|
%
|
26.5
|
%
|
|
|
|
|
|||||||
Gross profit increased by 7.7% to $59,708 in 2012 from $55,446 in 2011, including the negative impact of $1,555 in unfavorable foreign exchange translation adjustments relating principally to the strengthening of the U.S. dollar against the Euro. Our 2012 consolidated gross profit margin rate increased to 29.6% from 26.5% in 2011. The gross profit margin for NobelClad increased from 22.4% in 2011 to 27.0% in 2012. DynaEnergetics’ gross margin increased to 34.8% in 2012 from 33.4% in 2011. The gross profit margin for AMK Technical Services decreased to 22.1% in 2012 from 31.1% in 2011.
The significant improvement in the 2012 gross profit margin rate for our NobelClad segment relates to favorable changes in product mix as compared to 2011 combined with an improved pricing environment.
The modest increase in DynaEnergetics gross margin rate in 2012 relates principally to favorable changes in product/customer mix.
The decrease in AMK Technical Services’ reported gross margin relates principally to differences in the rate at which AMK Technical Services absorbed its fixed manufacturing overhead costs based on the sales decrease discussed above.
General and administrative expenses
|
2012
|
2011
|
Change
|
Percentage
Change
|
||||||||||||
|
General and administrative expenses
|
$
|
19,141
|
|
$
|
16,711
|
|
$
|
2,430
|
|
14.5
|
%
|
||||
|
Percentage of net sales
|
9.5
|
%
|
8.0
|
%
|
|
|
|
|
|||||||
General and administrative expenses increased by $2,430, or 14.5%, to $19,141 in 2012 from $16,711 in 2011. This increase includes increases of $1,438 in salaries and accrued incentive compensation due principally to the addition of Kevin Longe, Chief Operating Officer, in July 2012 and the hiring of other administrative personnel during the year, an increase in stock-based compensation of $586 and a net increase of $406 in all other expense categories. The increase in our 2012 general and administrative expenses reflects the positive impact of $556 in favorable foreign exchange adjustments associated with the strengthening of the U.S. dollar against the Euro. As a percentage of net sales, general and administrative expenses increased to 9.5% in 2012 from 8.0% in 2011.
Selling and distribution expenses
|
2012
|
2011
|
Change
|
Percentage
Change
|
||||||||||||
|
Selling and distribution expenses
|
$
|
16,954
|
|
$
|
14,809
|
|
$
|
2,145
|
|
14.5
|
%
|
||||
|
Percentage of net sales
|
8.4
|
%
|
7.1
|
%
|
|
|
|
|
|||||||
Selling and distribution expenses, which include sales commissions of $1,592 in 2012 and $1,751 in 2011, increased by 14.5% to $16,954 in 2012 from $14,809 in 2011, with this increase reflecting the positive impact of $361 in favorable foreign exchange translation adjustments. This increase in our selling and distribution expenses includes increased selling and distribution expenses of $1,159 at our U.S. divisions and $986 at our foreign divisions. The $1,159 increase in our U.S. selling and distribution expenses reflects a decrease in commission expense of $314 that was offset by an increase in salaries and accrued incentive compensation of $151, an increase of $396 in stock-based compensation, an increase of $170 for legal expenses and a net increase
35
of $756 in all other spending categories. The $986 increase in our foreign divisions’ selling and distribution expenses reflects increases of $556 and $155 for salary expense and sales commissions, respectively, and a net increase of $275 in all other spending categories. As a percentage of net sales, selling and distribution expenses increased to 8.4% in 2012 compared to 7.1% in 2011.
Our 2012 consolidated selling and distribution expenses include $6,795 and $9,058 for our NobelClad and DynaEnergetics business segments, respectively. Our 2011 consolidated selling and distribution expenses include $6,043 and $8,061 for our NobelClad and DynaEnergetics business segments, respectively. The higher level of selling and distribution expenses for our DynaEnergetics segment relative to its contribution to our consolidated net sales reflects the need, particularly in North America, to maintain a number of strategically located distribution centers that are in close proximity to areas which contain a large concentration of oilfields and enjoy a high volume of related oil and gas drilling activities.
Amortization expenses
|
2012
|
2011
|
Change
|
Percentage
Change
|
||||||||||||
|
Amortization of purchased intangible assets
|
$
|
6,210
|
|
$
|
5,707
|
|
$
|
503
|
|
8.8
|
%
|
||||
|
Percentage of net sales
|
3.1
|
%
|
2.7
|
%
|
|
|
|
|
|||||||
Amortization expense relates to the amortization of values assigned to intangible assets in connection with our prior year acquisitions of DYNAenergetics, LRI, the two Russian joint ventures, Austin Explosives and our January 3, 2012 acquisition of TRX Industries. The $503 increase in 2012 amortization expenses reflects $894 in new amortization expense associated with the TRX acquisition that was partially offset by favorable foreign currency translation effects. Amortization expense for 2012 includes $4,924, $1,101, and $185 relating to values assigned to customer relationships, core technology, and trademarks/trade names, respectively. Amortization expense for 2011 includes $4,316, $1,191, $200 relating to values assigned to customer relationships, core technology, and trademarks/trade names, respectively.
Operating income
|
2012
|
2011
|
Change
|
Percentage
Change
|
||||||||||||
|
Operating income
|
$
|
17,403
|
|
$
|
18,219
|
|
$
|
(816
|
)
|
(4.5
|
)%
|
||||
Income from operations (“operating income”) decreased by 4.5% to $17,403 in 2012 from $18,219 in 2011. The above consolidated operating income totals for 2012 and 2011 include $3,565 and $2,686, respectively, of unallocated corporate expenses and $4,443 and $3,397, respectively, of stock-based compensation expense. These expenses are not allocated to our business segments and thus are not included in the below 2012 and 2011 operating income totals for NobelClad, DynaEnergetics, and AMK Technical Services.
The $816 decrease in our consolidated operating income reflects an increase of $1,109 in the aggregate operating income reported by our three business segments that was offset by increases in unallocated corporate expenses and stock-based compensation expense of $879 and $1,046, respectively. The increase in unallocated corporate expenses relates principally to expenses associated with the addition of Kevin Longe, our current Chief Operating Officer, who joined the company in July 2012 and will succeed Yvon Cariou as President and Chief Executive Officer on March 1, 2013 upon Mr. Cariou’s retirement. The increase in stock-based compensation includes $672 relating to the accelerated recognition of stock-based compensation expense resulting from accelerated vesting of restricted stock awards associated with Mr. Cariou’s planned retirement on March 1, 2013 and the December 31, 2012 retirement of another senior executive.
NobelClad reported operating income of $17,439 in 2012 as compared to $16,058 in 2011. This $1,381 or 8.6% increase is largely attributable to the 20.3% increase in the 2012 gross margin rate as discussed above. Operating results of NobelClad for 2012 and 2011 include $2,054 and $2,224, respectively, of amortization expense of purchased intangible assets.
DynaEnergetics reported operating income of $7,047 in 2012 as compared to operating income of $6,188 in 2011. The $859 increase in operating income for our DynaEnergetics segment is principally attributable to the sales increase of $4,622, or 6.4%, as discussed above and the corresponding $2,633 increase in gross profit. This gross profit increase was partially offset by an increase of $1,774, or 9.8%, in total operating expenses. Operating results of DynaEnergetics for 2012 and 2011 include $4,156 and $3,483, respectively, of amortization expense of purchased intangible assets.
36
AMK Technical Services reported operating income of $925 in 2012, a decrease of $1,131 or 55.0% from the $2,056 in operating income that it reported in 2011. The decline in AMK’s operating income is largely attributable to the declines in sales and gross margin rate as discussed above.
Other income (expense), net
|
2012
|
2011
|
Change
|
Percentage
Change
|
||||||||||||
|
Other income (expense), net
|
$
|
(32
|
)
|
$
|
528
|
|
$
|
(560
|
)
|
(106.1
|
)%
|
||||
We reported net other expense of $32 in 2012 compared to net other income of $528 in 2011. Our 2012 net other income includes net realized and unrealized foreign exchange losses of $45 and net other income items aggregating $13. Our 2011 net other income includes net realized and unrealized foreign exchange gains of $372, including a gain of $87 on our currency swap agreement, and net other income items aggregating $156.
Interest income (expense), net
|
2012
|
2011
|
Change
|
Percentage
Change
|
||||||||||||
|
Interest income (expense), net
|
$
|
(819
|
)
|
$
|
(1,937
|
)
|
$
|
1,118
|
|
(57.7
|
)%
|
||||
We recorded net interest expense of $819 in 2012 compared to net interest expense of $1,937 in 2011. Since our average borrowings were approximately $6,900 on average higher during 2012 than during 2011, the significant decrease in 2012 interest expense is entirely attributable to lower average interest rates on our 2012 outstanding borrowings, including a 150 basis point interest rate reduction on revolving credit borrowings under our five-year credit facility that we entered into on December 21, 2011.
Income tax provision
|
2012
|
2011
|
Change
|
Percentage
Change
|
||||||||||||
|
Income tax provision
|
$
|
4,858
|
|
$
|
4,369
|
|
$
|
489
|
|
11.2
|
%
|
||||
|
Effective tax rate
|
29.3
|
%
|
26.0
|
%
|
|
|
|
|
|||||||
We recorded an income tax provision of $4,858 in 2012 compared to $4,369 in 2011. Our 2012 effective tax rate increased to 29.3% from 26.0% in 2011. Our consolidated income tax provision for 2012 and 2011 included $3,587 and $4,078, respectively, related to U.S. taxes, with the remainder relating to net foreign tax provision of $1,271 in 2012 and a net foreign tax benefit of $291 in 2011 associated with our foreign operations and holding companies.
Our statutory income tax rates range from 19% to 35% for our various U.S. and foreign operating subsidiaries and holding companies. The increase in our 2012 consolidated effective tax rate relates principally to a change in U.S. income tax laws for 2012 related to the earnings of foreign subsidiaries. In January 2013, the United States Congress authorized, and the President signed into law, changes to the U. S. income tax laws which were retroactive to January 1, 2012; however, since these changes were enacted in 2013, the financial statement benefit of such credits cannot be reflected until the first quarter of 2013. Had these changes been enacted before the end of 2012, our 2012 effective tax rate of 29.3% would have been reduced to approximately 23.8%. Year-to-year fluctuations in our consolidated effective tax rate also reflect the different tax rates in our U.S. and foreign tax jurisdictions and the variation in contribution to consolidated pre-tax income from each jurisdiction for the respective year.
Adjusted EBITDA
|
2012
|
2011
|
Change
|
Percentage
Change
|
||||||||||||
|
Adjusted EBITDA
|
$
|
33,595
|
|
$
|
32,865
|
|
$
|
730
|
|
2.2
|
%
|
||||
Adjusted EBITDA is a non-GAAP measure that we believe provides an important indicator of our ongoing operating performance. Our aggregate non-cash depreciation, amortization of purchased intangible assets and stock-based compensation expense for 2012 and 2011 was $16,190 and $14,596, respectively. These aggregate non-cash charges represent a significant percentage of the consolidated operating income that we reported for these periods.
37
|
|
2012
|
2011
|
||||
|
Net income attributable to DMC
|
11,696
|
|
12,491
|
|
||
|
Interest expense
|
832
|
|
1,945
|
|
||
|
Interest income
|
(13
|
)
|
(8
|
)
|
||
|
Provision for income taxes
|
4,858
|
|
4,369
|
|
||
|
Depreciation
|
5,537
|
|
5,492
|
|
||
|
Amortization of purchased intangible assets
|
6,210
|
|
5,707
|
|
||
|
EBITDA
|
29,120
|
|
29,996
|
|
||
|
Stock-based compensation
|
4,443
|
|
3,397
|
|
||
|
Other (income) expense, net
|
32
|
|
(528
|
)
|
||
|
Adjusted EBITDA
|
33,595
|
|
32,865
|
|
||
Adjusted EBITDA increased 2.2% to $33,595 in 2012 from $32,865 in 2011 primarily due to a $1,594 increase in 2012 aggregate increase in non-cash depreciation, amortization of purchased intangible assets and stock-based compensation expense. This increase was partially offset by a decrease in operating income of $816.
Liquidity and Capital Resources
We have historically financed our operations from a combination of internally generated cash flow, revolving credit borrowings, various long-term debt arrangements, and the issuance of common stock. We believe that cash flow from operations and funds available under our current credit facilities and any future replacement thereof will be sufficient to fund the working capital, debt service, and capital expenditure requirements of our current business operations for the foreseeable future. Nevertheless, our ability to generate sufficient cash flows from operations will depend upon our success in executing our strategies. If we are unable to (i) realize sales from our backlog; (ii) secure new customer orders; (iii) continue selling products at attractive margins; and (iv) continue to implement cost-effective internal processes, our ability to meet cash requirements through operating activities could be impacted. Furthermore, any restriction on the availability of borrowings under our credit facilities could negatively affect our ability to meet future cash requirements.
Debt facilities
On December 21, 2011, we entered into a five-year syndicated credit agreement, which provides revolving loan availability of $36,000, 16,000 Euros and 1,500 Canadian dollars through a syndicate of four banks, and amends and restates in its entirety our prior syndicated credit agreement entered into on November 16, 2007.
As of December 31, 2013, U.S. dollar revolving loans of $26,400 were outstanding under our syndicated credit agreement, $2,856 was outstanding under our separate DYNAenergetics’ line of credit agreement, and $51 was outstanding under loan agreements with the former owners of LRI. While we had approximately $33,956 of unutilized revolving credit loan capacity as of December 31, 2013 under our various credit facilities, future borrowings are subject to compliance with financial covenants that could significantly limit availability.
There are two significant financial covenants under our syndicated credit agreement, the leverage ratio and fixed charge coverage ratio requirements. The leverage ratio is defined in the credit agreement as Consolidated Funded Indebtedness at the balance sheet date as compared to Consolidated EBITDA, which is defined as earnings before provisions for income taxes, interest expense, depreciation and amortization, extraordinary non-recurring charges, and other non-cash charges for the previous twelve months. For the years ended December 31, 2013 and 2012, Consolidated EBITDA approximated the “Adjusted EBITDA” that we reported for the respective periods. As of December 31, 2013, the maximum leverage ratio permitted by our credit facility was 2.25 to 1.0. The actual leverage ratio as of December 31, 2013 was 1.0 to 1.0. The maximum leverage ratio permitted as of March 31, June 30, September 30 and December 31, 2014 is 2.0 to 1.0.
The fixed charge ratio, as defined in the credit agreement, means, for any period, the ratio of Consolidated EBITDA to Fixed Charges. Consolidated EBITDA is defined above and Fixed Charges equals the sum of cash interest expense, cash dividends, cash income taxes and an amount equal to 75% of depreciation expense. As of December 31, 2013, the minimum fixed charge ratio permitted by our credit facility was 2.0 to 1.0. The actual fixed charge ratio as of December 31, 2013 was 3.05 to 1.0. The minimum fixed charge coverage ratio permitted for the twelve month periods ending March 31, June 30, September 30 and December 31, 2014 is 2.0 to 1.0.
38
Debt and other contractual obligations and commitments
Our existing loan agreements include various covenants and restrictions, certain of which relate to the payment of dividends or other distributions to stockholders, redemption of capital stock, incurrence of additional indebtedness, mortgaging, pledging or disposition of major assets, and maintenance of specified financial ratios. As of December 31, 2013, we were in compliance with all financial covenants and other provisions of our debt agreements.
The table below presents principal cash flows by expected maturity dates for our debt obligations and other contractual obligations and commitments as of December 31, 2013:
|
Payment Due by Period
As of December 31, 2013
|
||||||||||||||||||||
|
|
Less than
|
|
|
More than
|
|
|||||||||||||||
|
Contractual Obligations
|
1 Year
|
1-3 Years
|
3-5 Years
|
5 Years
|
Total
|
|||||||||||||||
|
Total long-term debt and interest obligations (1)
|
$
|
52
|
|
$
|
—
|
|
$
|
—
|
|
$
|
—
|
|
$
|
52
|
|
|||||
|
Capital lease obligations (2)
|
25
|
|
8
|
|
—
|
|
—
|
|
33
|
|
||||||||||
|
Operating lease obligations (3)
|
2,196
|
|
2,663
|
|
1,552
|
|
1,126
|
|
7,537
|
|
||||||||||
|
License agreements obligations (4)
|
398
|
|
796
|
|
796
|
|
—
|
|
1,990
|
|
||||||||||
|
Purchase obligations (5)
|
16,664
|
|
—
|
|
—
|
|
—
|
|
16,664
|
|
||||||||||
|
Total
|
$
|
19,335
|
|
$
|
3,467
|
|
$
|
2,348
|
|
$
|
1,126
|
|
$
|
26,276
|
|
|||||
(1) Amounts represent future cash payments on our long-term debt and interest expense obligations and are reflected in accompanying Consolidated Balance Sheets.
(2) The present value of these capital lease obligations are included in our Consolidated Balance Sheets. See
Note 8
of the Notes to Consolidated Financial Statements for additional information.
(3) The operating lease obligations presented reflect future minimum lease payments due under non-cancelable portions of our leases as of December 31, 2013. Our operating lease obligations are described in
Note 8
of the Notes to Consolidated Financial Statements.
(4) The license agreements obligations presented reflect future minimum payments due under non-cancelable portions of our agreements as of December 31, 2013. Our license agreements obligations are described in
Note 8
of the Notes to Consolidated Financial Statements.
(5) Amounts represent commitments to purchase goods or services to be utilized in the normal course of business. These amounts are not reflected in accompanying Consolidated Balance Sheets.
As of December 31, 2013, we have $26,400 of outstanding borrowings under our U.S. dollar revolving line of credit at then current interest rates of 1.42% respectively. The credit agreement has a five-year term ending December 21, 2016. For more information about our debt obligations, see
Note 4
to our consolidated financial statements elsewhere in this annual report.
Cash flows from operating activities
Net cash flows provided by operating activities increased to
$32,052
in 2013 from
$20,580
in 2012 reflecting a $4,107 decrease in net income that was offset by positive changes in net working capital of $15,189, and positive changes in non-cash adjustments aggregating $390. We experienced net positive changes in working capital of $9,028 in 2013 compared to net negative changes in working capital of $6,161 in 2012. Positive changes in our 2013 working capital included a decrease in inventories and prepaid expenses of $6,693 and $93, respectively, and increases of $2,235 and $1,754 in accounts payable and accrued expenses and other liabilities, respectively. These positive changes were partly offset by an increase of $1,382 in accounts receivable and a decrease in customer advances of $365. The large decrease in inventories reflects our focused efforts during 2013 to reduce overall inventory levels in our DynaEnergetics business, particularly within the North American distribution system. All other changes in working capital relate to typical fluctuations in our business flow and the related timing of cash payments and receipts.
39
Net cash flows provided by operating activities increased to $20,580 in 2012 from $9,726 in 2011, with the majority of this $10,854 increase resulting from changes in our working capital. While we experienced net negative changes to working capital in both 2012 and 2011, the net negative change in working capital was reduced to $6,161 in 2012 from $16,408 in 2011. Negative changes in our 2012 working capital included an increase in inventories of $2,342 and decreases in accounts payable, customer advances and accrued expenses and other liabilities of $3,618, $578 and $644, respectively. These were partly offset by decreases in accounts receivable and prepaid expenses of $560 and $461, respectively. All of foregoing changes in working capital relate to typical fluctuations in our business flow and the related timing of cash payments and receipts.
Net cash flows provided by operating activities decreased to $9,726 in 2011 from $16,693 in 2010. This $6,967 decrease reflects a $7,186 increase in net income that was more than offset by net negative changes in working capital that totaled $16,408. Negative changes in our 2011 working capital included increases in accounts receivable, inventories and prepaid expenses and a decrease in accounts payable of $9,551, $8,392, $1,346 and $1,035, respectively. These were partly offset by increases in accrued expenses and other liabilities of $3,451 and customer advances of $465. The $9,551 increase in accounts receivables follows the $9,436 increase in fourth quarter 2011 consolidated sales compared to those in the fourth quarter of 2010. The $8,392 increase in inventories relates principally to our DynaEnergetics segment, which made a deliberate effort to build up its finished goods inventories to better meet the strong increase in business activity that the segment has experienced in 2011 and the expected sales demand in 2012. The $3,342 increase in accrued expenses and other liabilities relates to both timing issues and a significant increase in accrued incentive compensation.
Cash flows from investing activities
Net cash flows used in investing activities for 2013 totaled
$18,239
and consisted almost entirely of capital expenditures. Our capital expenditures included $9,159 for our greenfield projects in Russia and North America.
Net cash flows used in investing activities for 2012 totaled $26,165 which included our $10,294 cash investment in TRX Industries and $15,647 in capital expenditures. Our capital expenditures in 2012 included $6,830 for our greenfield projects in Russia and North America and $2,300 on implementing a new ERP system for our NobelClad U.S. entity.
Net cash flows used in investing activities for 2011 totaled $7,731 which consisted almost entirely of capital expenditures.
Cash flows from financing activities
Net cash flows used in financing activities for 2013 totaled
$11,587
, which included net repayments on bank lines of credit of $9,592 and payment of quarterly dividends of $2,187.
Net cash flows provided by financing activities for 2012 totaled $8,517 and included net borrowings on bank lines of credit of $12,174. These sources of cash flow were partially offset by uses of cash for financing activities, including $1,176 in loan payments to former owners of LRI and quarterly dividend payments of $2,155.
Net cash flows used in financing activities for 2011 totaled $1,395. Significant uses of cash for financing activities included term loan payments of $22,247, including a prepayment of $13,247, under our prior syndicated credit agreement that was replaced on December 21, 2011 by a new five-year syndicated credit facility, payment of annual dividends of $2,130, $627 in final principal payments on our Nord LB term loans, $435 payment of debt issuance costs related to the new syndicated credit agreement and $295 payment on capital lease obligations. Sources of cash flow from financing activities included net borrowings on bank lines of credit of $24,191, including net borrowings of $25,402 under our new syndicated credit facility, and $177 in net proceeds from the issuance of common stock relating to the exercise of stock options.
Critical Accounting Policies and Estimates
Our historical consolidated financial statements and notes to our historical consolidated financial statements contain information that is pertinent to our management’s discussion and analysis of financial condition and results of operations. Preparation of financial statements in conformity with accounting principles generally accepted in the United States requires that our management make estimates, judgments and assumptions that affect the reported amounts of assets, liabilities, revenues and expenses, and the disclosure of contingent assets and liabilities. However, the accounting principles used by us generally do not change our reported cash flows or liquidity. Existing rules must be interpreted and judgments made on how the specifics of a given rule apply to us.
In management’s opinion, the more significant reporting areas impacted by management’s judgments and estimates are revenue recognition, asset impairments, goodwill and other intangible assets, and income taxes. Management’s judgments and
40
estimates in these areas are based on information available from both internal and external sources, and actual results could differ from the estimates, as additional information becomes known. We believe the following to be our most critical accounting policies.
Revenue recognition
Sales of clad metal products and welding services are generally based upon customer specifications set forth in customer purchase orders and require us to provide certifications relative to metals used, services performed and the results of any non-destructive testing that the customer has requested be performed. All issues of conformity of the product to specifications are resolved before the product is shipped and billed. Products related to the oilfield products segment, which include detonating cords, detonators, bi-directional boosters and shaped charges, as well as, seismic related explosives and accessories, are standard in nature. In all cases, revenue is recognized only when all four of the following criteria have been satisfied: persuasive evidence of an arrangement exists; the price is fixed or determinable; delivery has occurred; and collection is reasonably assured. For contracts that require multiple shipments, revenue is recorded only for the units included in each individual shipment. If, as a contract proceeds toward completion, projected total cost on an individual contract indicates a probable loss, we will account for such anticipated loss.
Asset impairments
We review our long-lived assets to be held and used by us for impairment whenever events or changes in circumstances indicate their carrying amount may not be recoverable. In so doing, we estimate the future net cash flows expected to result from the use of these assets and their eventual disposition. If the sum of the expected future net cash flows (undiscounted and without interest charges) is less than the carrying amount of these assets, an impairment loss is recognized to reduce the asset to its estimated fair value. Otherwise, an impairment loss is not recognized. Long-lived assets to be disposed of, if any, are reported at the lower of carrying amount or fair value less costs to sell.
Business Combinations
We account for our business acquisitions using the purchase method of accounting. We allocate the total cost of the acquisition to the underlying net assets based on their respective estimated fair values. As part of this allocation process, we identify and attribute values and estimated lives to the intangible assets acquired. These determinations involve significant estimates and assumptions regarding multiple, highly subjective variables, including those with respect to future cash flows, discount rates, asset lives, and the use of different valuation models and therefore require considerable judgment. Our estimates and assumptions are based, in part, on the availability of listed market prices or other transparent market data. These determinations affect the amount of amortization expense recognized in future periods. We base our fair value estimates on assumptions we believe to be reasonable but are inherently uncertain.
Goodwill and Other Intangible Assets
Goodwill represents the excess of the purchase price in a business combination over the fair value of the net tangible and intangible assets acquired. The carrying value of goodwill is periodically reviewed for impairment (at a minimum annually) and whenever events or changes in circumstances indicate that the carrying amount of this asset may not be recoverable. Examples of such events or changes in circumstances, many of which are subjective in nature, include significant negative industry or economic trends, significant changes in the manner of our use of the acquired assets or our strategy, a significant decrease in the market value of the asset, and a significant change in legal factors or in the business climate that could affect the value of the asset.
We test goodwill for impairment by first performing a qualitative evaluation. The qualitative evaluation is an assessment of factors, including reporting unit specific operating results as well as industry, market and general economic conditions, to determine if it is more likely than not that the fair value of a reporting unit is less than its carrying amount, including goodwill. We may elect to bypass this qualitative assessment for certain of our reporting units and perform a two-step quantitative test.
Our reporting units for goodwill impairment testing are currently the same as our operating divisions and reportable business segments: NobelClad, DynaEnergetics and AMK Technical Services. Each of these three business segments represent separately managed strategic business units and our chief operating decision maker reviews financial results and evaluates operating performance at this level.
Our annual goodwill impairment testing for 2013 was completed as of December 31, 2013 for our NobelClad and DynaEnergetics reporting units (AMK Technical Services has no recorded goodwill). For NobelClad, which has been our core business segment for more than 40 years, we performed a qualitative assessment to test this reporting unit’s goodwill for impairment. The results of this qualitative assessment indicated that the fair market value of this reporting unit substantially exceeded its
41
carrying value. For our DynaEnergetics reporting unit, which was initially established through a 2007 acquisition and has grown through subsequent acquisitions completed in 2009, 2010 and 2012, we elected to perform quantitative testing. Our quantitative testing utilized both an income approach (discounted cash flows) and a market approach consisting of a comparable public company earnings multiples methodology to estimate the fair value of this reporting unit. To determine the reasonableness of the estimated fair values, we carefully reviewed our assumptions to ensure that neither the income approach nor the market approach provided a significantly different valuation. The results of the foregoing quantitative assessment for our DynaEnergetics reporting unit indicated that its fair market value substantially exceeded its carrying value.
If the carrying value were to exceed the fair value for any reporting unit, we would then calculate and compare the estimated implied fair value of goodwill to the carrying amount of goodwill and record an impairment charge for any excess of carrying value over implied fair value. Our most recent impairment testing has resulted in a determination that the carrying value of goodwill did not exceed fair value and, consequently, that our goodwill was not impaired. A future impairment is possible and could occur if (i) operating results underperform what we have estimated or (ii) additional volatility of the capital markets or other factors should cause us to raise the discount rate percentage utilized in our discounted cash flow analysis or decrease the multiples utilized in our market-based analysis. While we believe our most recent estimates were appropriate based on our view of then current business trends, no assurance can be provided that impairment charges will not be required in the future.
Finite-lived intangible assets are tested for impairment whenever events or changes in circumstances indicate that their carrying value may not be recoverable. We compare the expected undiscounted future operating cash flows associated with these finite-lived assets to their respective carrying values to determine if they are fully recoverable. If the expected future operating cash flows of an asset are not sufficient to recover the carrying value, we estimate the fair value of the asset. Impairment is recognized when the carrying amount of the asset is not recoverable and when the carrying value exceeds fair value. The projected cash flows require several assumptions related to, among other things, relevant market factors, revenue growth, if any, and operating margins.
Income taxes
We are required to recognize deferred tax assets and deferred tax liabilities for the expected future income tax consequences of transactions that have been included in our financial statements but not our tax returns. Deferred tax assets and liabilities are determined based on income tax credits and on the temporary differences between the Consolidated Financial Statement basis and the tax basis of assets and liabilities using enacted tax rates in effect for the year in which the differences are expected to reverse. We routinely evaluate deferred tax assets to determine if they will, more likely than not, be recovered from future projected taxable income; if not, we record an appropriate valuation allowance.
Off Balance Sheet Arrangements
We have no obligations, assets or liabilities other than those appearing or disclosed in our financial statements forming part of this annual report; no trading activities involving non-exchange traded contracts accounted for at fair value; and no relationships and transactions with persons or entities that derive benefits from their non-independent relationship with us or our related parties.
Recent Accounting Pronouncements
Please refer to
Note 2
to our Consolidated Financial Statements in this annual report for a discussion of recent accounting pronouncements and their anticipated effect on our business.
Interest Rate Risk
Our interest rate risk management policies are designed to reduce the potential earnings volatility that could arise from changes in interest rates. Periodically, we use interest rate swaps to stabilize funding costs by managing the exposure created by the differing maturities and interest rate structures of our assets and liabilities. See Note 2 to the Consolidated Financial Statements for further information on interest rate risk management.
42
Foreign Currency Risk
Our consolidated financial statements are expressed in U.S. dollars, but a portion of our business is conducted in currencies other than U.S. dollars. Changes in the exchange rates for such currencies into U.S. dollars can affect our revenues, earnings, and the carrying value of our assets and liabilities in our consolidated balance sheet, either positively or negatively. Sales made in currencies other than U.S. dollars accounted for 35%, 37%, and 34% of total sales for the years ended 2013, 2012, and 2011, respectively.
43
DYNAMIC MATERIALS CORPORATION AND SUBSIDIARIES
INDEX TO CONSOLIDATED FINANCIAL STATEMENTS
As of December 31, 2013 and 2012 and for Each of the Three Years Ended
December 31, 2013, 2012 and 2011
|
|
Page
|
|
Financial Statements:
|
|
The consolidated financial statement schedules required by Regulation S-X are filed under Item 15 “Exhibits and Financial Statement Schedules”.
44
Report of Independent Registered Public Accounting Firm
The Stockholders and the
Board of Directors of Dynamic Materials Corporation
We have audited the accompanying consolidated balance sheets of Dynamic Materials Corporation and subsidiaries (the Company) as of December 31, 2013 and 2012, and the related consolidated statements of operations, comprehensive income, stockholders’ equity, and cash flows for each of the three years in the period ended December 31, 2013. Our audits also included the financial statement schedules listed in the Index at Item 15(a). These financial statements and schedules are the responsibility of the Company’s management. Our responsibility is to express an opinion on these financial statements and schedules based on our audits.
We conducted our audits in accordance with the standards of the Public Company Accounting Oversight Board (United States). Those standards require that we plan and perform the audit to obtain reasonable assurance about whether the financial statements are free of material misstatement. An audit includes examining, on a test basis, evidence supporting the amounts and disclosures in the financial statements. An audit also includes assessing the accounting principles used and significant estimates made by management, as well as evaluating the overall financial statement presentation. We believe that our audits provide a reasonable basis for our opinion.
In our opinion, the financial statements referred to above present fairly, in all material respects, the consolidated financial position of Dynamic Materials Corporation and subsidiaries at December 31, 2013 and 2012, and the consolidated results of their operations and their cash flows for each of the three years in the period ended December 31, 2013, in conformity with U.S. generally accepted accounting principles. Also, in our opinion, the related financial statement schedules, when considered in relation to the basic financial statements taken as a whole, present fairly in all material respects the information set forth therein.
We also have audited, in accordance with the standards of the Public Company Accounting Oversight Board (United States), Dynamic Materials Corporation and subsidiaries’ internal control over financial reporting as of December 31, 2013, based on criteria established in
Internal Control-Integrated Framework
issued by the Committee of Sponsoring Organizations of the Treadway Commission (1992 Framework) and our report dated March 7, 2014 expressed an unqualified opinion thereon.
|
|
/s/ Ernst & Young LLP
|
Denver, Colorado
March 7, 2014
45
DYNAMIC MATERIALS CORPORATION
CONSOLIDATED BALANCE SHEETS
DECEMBER 31, 2013 AND 2012
(Amounts in Thousands, Except Share and Per Share Data)
|
2013
|
2012
|
||||||
|
ASSETS
|
|
|
|
|
|||
|
CURRENT ASSETS:
|
|
|
|
|
|||
|
Cash and cash equivalents
|
$
|
10,617
|
|
$
|
8,200
|
|
|
|
Accounts receivable, net of allowance for doubtful accounts of $419 and $406, respectively
|
38,715
|
|
36,981
|
|
|||
|
Inventory, net
|
41,550
|
|
48,320
|
|
|||
|
Prepaid expenses and other
|
4,375
|
|
4,469
|
|
|||
|
Current deferred tax assets
|
3,507
|
|
2,074
|
|
|||
|
Total current assets
|
98,764
|
|
100,044
|
|
|||
|
PROPERTY, PLANT AND EQUIPMENT
|
107,802
|
|
90,621
|
|
|||
|
Less - accumulated depreciation
|
(42,787
|
)
|
(36,645
|
)
|
|||
|
Property, plant and equipment, net
|
65,015
|
|
53,976
|
|
|||
|
GOODWILL, net
|
37,970
|
|
37,431
|
|
|||
|
PURCHASED INTANGIBLE ASSETS, net
|
36,458
|
|
41,958
|
|
|||
|
DEFERRED TAX ASSETS
|
505
|
|
804
|
|
|||
|
OTHER ASSETS, net
|
1,900
|
|
1,218
|
|
|||
|
TOTAL ASSETS
|
$
|
240,612
|
|
$
|
235,431
|
|
|
The accompanying notes are an integral part of these Consolidated Financial Statements.
46
DYNAMIC MATERIALS CORPORATION
CONSOLIDATED BALANCE SHEETS
DECEMBER 31, 2013 AND 2012
(Amounts in Thousands, Except Share and Per Share Data)
|
2013
|
2012
|
||||||
|
LIABILITIES AND STOCKHOLDERS’ EQUITY
|
|
|
|
|
|||
|
CURRENT LIABILITIES:
|
|
|
|
|
|||
|
Accounts payable
|
$
|
14,668
|
|
$
|
11,281
|
|
|
|
Accrued expenses
|
3,966
|
|
4,564
|
|
|||
|
Dividend payable
|
550
|
|
540
|
|
|||
|
Accrued income taxes
|
2,811
|
|
406
|
|
|||
|
Accrued employee compensation and benefits
|
4,806
|
|
4,977
|
|
|||
|
Customer advances
|
1,025
|
|
1,363
|
|
|||
|
Current debt obligations
|
2,907
|
|
1,046
|
|
|||
|
Current portion of capital lease obligations
|
24
|
|
52
|
|
|||
|
Current deferred tax liabilities
|
435
|
|
149
|
|
|||
|
Total current liabilities
|
31,192
|
|
24,378
|
|
|||
|
LINES OF CREDIT
|
26,400
|
|
37,779
|
|
|||
|
LONG-TERM DEBT
|
—
|
|
55
|
|
|||
|
CAPITAL LEASE OBLIGATIONS
|
8
|
|
19
|
|
|||
|
DEFERRED TAX LIABILITIES
|
8,347
|
|
9,211
|
|
|||
|
OTHER LONG-TERM LIABILITIES
|
1,873
|
|
1,433
|
|
|||
|
Total liabilities
|
67,820
|
|
72,875
|
|
|||
|
COMMITMENTS AND CONTINGENT LIABILITIES (See Note 8)
|
|
|
|
|
|||
|
|
|
|
|
||||
|
STOCKHOLDERS’ EQUITY:
|
|||||||
|
Preferred stock, $0.05 par value; 4,000,000 shares authorized; no issued and outstanding shares
|
—
|
|
—
|
|
|||
|
Common stock, $0.05 par value; 25,000,000 shares authorized; 13,772,324 and 13,519,555 shares issued and outstanding, respectively
|
689
|
|
676
|
|
|||
|
Additional paid-in capital
|
62,934
|
|
60,158
|
|
|||
|
Retained earnings
|
113,399
|
|
108,101
|
|
|||
|
Other cumulative comprehensive loss
|
(4,230
|
)
|
(6,463
|
)
|
|||
|
Total Dynamic Materials Corporation’s stockholders’ equity
|
172,792
|
|
162,472
|
|
|||
|
Non-controlling interest
|
—
|
|
84
|
|
|||
|
Total stockholders’ equity
|
172,792
|
|
162,556
|
|
|||
|
TOTAL LIABILITIES AND STOCKHOLDERS’ EQUITY
|
$
|
240,612
|
|
$
|
235,431
|
|
|
The accompanying notes are an integral part of these Consolidated Financial Statements.
47
DYNAMIC MATERIALS CORPORATION
CONSOLIDATED STATEMENTS OF OPERATIONS
FOR THE YEARS ENDED DECEMBER 31, 2013, 2012 AND 2011
(Amounts in Thousands, Except Share and Per Share Data)
|
|
2013
|
2012
|
2011
|
||||||||
|
NET SALES
|
$
|
209,573
|
|
$
|
201,567
|
|
$
|
208,891
|
|
||
|
COST OF PRODUCTS SOLD
|
150,059
|
|
141,859
|
|
153,445
|
|
|||||
|
Gross profit
|
59,514
|
|
59,708
|
|
55,446
|
|
|||||
|
COSTS AND EXPENSES:
|
|
|
|
|
|||||||
|
General and administrative expenses
|
25,273
|
|
19,141
|
|
16,711
|
|
|||||
|
Selling and distribution expenses
|
16,196
|
|
16,954
|
|
14,809
|
|
|||||
|
Amortization of purchased intangible assets
|
6,348
|
|
6,210
|
|
5,707
|
|
|||||
|
Total costs and expenses
|
47,817
|
|
42,305
|
|
37,227
|
|
|||||
|
INCOME FROM OPERATIONS
|
11,697
|
|
17,403
|
|
18,219
|
|
|||||
|
OTHER INCOME (EXPENSE):
|
|
|
|
|
|||||||
|
Other income (expense), net
|
(528
|
)
|
(32
|
)
|
528
|
|
|||||
|
Interest expense
|
(648
|
)
|
(832
|
)
|
(1,945
|
)
|
|||||
|
Interest income
|
7
|
|
13
|
|
8
|
|
|||||
|
INCOME BEFORE INCOME TAXES AND NON-CONTROLLING INTEREST
|
10,528
|
|
16,552
|
|
16,810
|
|
|||||
|
INCOME TAX PROVISION
|
2,941
|
|
4,858
|
|
4,369
|
|
|||||
|
NET INCOME
|
7,587
|
|
11,694
|
|
12,441
|
|
|||||
|
Less: Net income (loss) attributable to non-controlling interest
|
92
|
|
(2
|
)
|
(50
|
)
|
|||||
|
NET INCOME ATTRIBUTABLE TO DYNAMIC MATERIALS CORPORATION
|
$
|
7,495
|
|
$
|
11,696
|
|
$
|
12,491
|
|
||
|
INCOME PER SHARE:
|
|
|
|
|
|||||||
|
Basic
|
$
|
0.55
|
|
$
|
0.87
|
|
$
|
0.94
|
|
||
|
Diluted
|
$
|
0.54
|
|
$
|
0.87
|
|
$
|
0.93
|
|
||
|
WEIGHTED AVERAGE NUMBER OF SHARES OUTSTANDING:
|
|
|
|
|
|||||||
|
Basic
|
13,533,566
|
|
13,264,636
|
|
13,089,691
|
|
|||||
|
Diluted
|
13,537,525
|
|
13,268,713
|
|
13,099,121
|
|
|||||
|
DIVIDENDS DECLARED PER COMMON SHARE
|
$
|
0.16
|
|
$
|
0.16
|
|
$
|
0.16
|
|
||
The accompanying notes are an integral part of these Consolidated Financial Statements.
48
DYNAMIC MATERIALS CORPORATION
CONSOLIDATED STATEMENTS OF COMPREHENSIVE INCOME
FOR THE YEARS ENDED DECEMBER 31, 2013, 2012 AND 2011
(Amounts in Thousands)
|
|
2013
|
2012
|
2011
|
||||||||
|
Net income including non-controlling interest
|
$
|
7,587
|
|
$
|
11,694
|
|
$
|
12,441
|
|
||
|
Change in cumulative foreign currency translation adjustment
|
2,237
|
|
2,796
|
|
(2,927
|
)
|
|||||
|
Total comprehensive income
|
9,824
|
|
14,490
|
|
9,514
|
|
|||||
|
Comprehensive income (loss) attributable to non-controlling interest
|
96
|
|
1
|
|
(119
|
)
|
|||||
|
Comprehensive income attributable to Dynamic Materials Corporation
|
$
|
9,728
|
|
$
|
14,489
|
|
$
|
9,633
|
|
||
The accompanying notes are an integral part of these Consolidated Financial Statements.
49
DYNAMIC MATERIALS CORPORATION
CONSOLIDATED STATEMENT OF STOCKHOLDERS’ EQUITY
FOR THE YEARS ENDED DECEMBER 31, 2013, 2012 AND 2011
(Amounts in Thousands, Except Share Data)
|
|
Dynamic Materials Corporation Stockholders
|
|
|
|||||||||||||||||||||||
|
|
|
|
|
|
Other
|
|
|
|||||||||||||||||||
|
|
|
|
Additional
|
|
Cumulative
|
Non-
|
|
|||||||||||||||||||
|
|
Common Stock
|
Paid-In
|
Retained
|
Comprehensive
|
Controlling
|
|
||||||||||||||||||||
|
|
Shares
|
Amount
|
Capital
|
Earnings
|
Loss
|
Interest
|
Total
|
|||||||||||||||||||
|
Balances, December 31, 2010
|
13,224,696
|
|
$
|
661
|
|
$
|
52,451
|
|
$
|
88,210
|
|
$
|
(6,398
|
)
|
$
|
160
|
|
$
|
135,084
|
|
||||||
|
Net income (loss)
|
—
|
|
—
|
|
—
|
|
12,491
|
|
—
|
|
(50
|
)
|
12,441
|
|
||||||||||||
|
Change in cumulative foreign currency translation adjustment
|
—
|
|
—
|
|
—
|
|
—
|
|
(2,858
|
)
|
(69
|
)
|
(2,927
|
)
|
||||||||||||
|
Shares issued in connection with stock compensation plans
|
142,473
|
|
7
|
|
170
|
|
—
|
|
—
|
|
—
|
|
177
|
|
||||||||||||
|
Tax impact of stock-based compensation
|
—
|
|
—
|
|
(35
|
)
|
—
|
|
—
|
|
—
|
|
(35
|
)
|
||||||||||||
|
Stock-based compensation
|
—
|
|
—
|
|
3,397
|
|
—
|
|
—
|
|
—
|
|
3,397
|
|
||||||||||||
|
Dividends declared
|
—
|
|
—
|
|
—
|
|
(2,136
|
)
|
—
|
|
—
|
|
(2,136
|
)
|
||||||||||||
|
Contribution from non-controlling stockholder
|
—
|
|
—
|
|
—
|
|
—
|
|
—
|
|
42
|
|
42
|
|
||||||||||||
|
Balances, December 31, 2011
|
13,367,169
|
|
$
|
668
|
|
$
|
55,983
|
|
$
|
98,565
|
|
$
|
(9,256
|
)
|
$
|
83
|
|
$
|
146,043
|
|
||||||
|
Net income (loss)
|
—
|
|
—
|
|
—
|
|
11,696
|
|
—
|
|
(2
|
)
|
11,694
|
|
||||||||||||
|
Change in cumulative foreign currency translation adjustment
|
—
|
|
—
|
|
—
|
|
—
|
|
2,793
|
|
3
|
|
2,796
|
|
||||||||||||
|
Shares issued in connection with stock compensation plans
|
152,386
|
|
8
|
|
185
|
|
—
|
|
—
|
|
—
|
|
193
|
|
||||||||||||
|
Tax impact of stock-based compensation
|
—
|
|
—
|
|
(453
|
)
|
—
|
|
—
|
|
—
|
|
(453
|
)
|
||||||||||||
|
Stock-based compensation
|
—
|
|
—
|
|
4,443
|
|
—
|
|
—
|
|
—
|
|
4,443
|
|
||||||||||||
|
Dividends declared
|
—
|
|
$
|
—
|
|
$
|
—
|
|
$
|
(2,160
|
)
|
$
|
—
|
|
$
|
—
|
|
$
|
(2,160
|
)
|
||||||
|
Balances, December 31, 2012
|
13,519,555
|
|
$
|
676
|
|
$
|
60,158
|
|
$
|
108,101
|
|
$
|
(6,463
|
)
|
$
|
84
|
|
$
|
162,556
|
|
||||||
|
Net income
|
—
|
|
—
|
|
—
|
|
7,495
|
|
—
|
|
92
|
|
7,587
|
|
||||||||||||
|
Change in cumulative foreign currency translation adjustment
|
—
|
|
—
|
|
—
|
|
—
|
|
2,233
|
|
4
|
|
2,237
|
|
||||||||||||
|
Shares issued in connection with stock compensation plans
|
252,769
|
|
13
|
|
282
|
|
—
|
|
—
|
|
—
|
|
295
|
|
||||||||||||
|
Tax impact of stock-based compensation
|
—
|
|
—
|
|
(907
|
)
|
—
|
|
—
|
|
—
|
|
(907
|
)
|
||||||||||||
|
Stock-based compensation
|
—
|
|
—
|
|
3,401
|
|
—
|
|
—
|
|
—
|
|
3,401
|
|
||||||||||||
|
Dividends declared
|
—
|
|
—
|
|
—
|
|
(2,197
|
)
|
—
|
|
—
|
|
(2,197
|
)
|
||||||||||||
|
Acquisition of minority interest
|
—
|
|
$
|
—
|
|
$
|
—
|
|
$
|
—
|
|
$
|
—
|
|
$
|
(180
|
)
|
(180
|
)
|
|||||||
|
Balances, December 31, 2013
|
13,772,324
|
|
$
|
689
|
|
$
|
62,934
|
|
$
|
113,399
|
|
$
|
(4,230
|
)
|
$
|
—
|
|
$
|
172,792
|
|
||||||
The accompanying notes are an integral part of these Consolidated Financial Statements.
50
DYNAMIC MATERIALS CORPORATION
CONSOLIDATED STATEMENTS OF CASH FLOWS
FOR THE YEARS ENDED DECEMBER 31, 2013, 2012 AND 2011
(Amounts in Thousands)
|
|
2013
|
2012
|
2011
|
||||||||
|
CASH FLOWS FROM OPERATING ACTIVITIES:
|
|
|
|
|
|||||||
|
Net income
|
$
|
7,587
|
|
$
|
11,694
|
|
$
|
12,441
|
|
||
|
Adjustments to reconcile net income to net cash provided by operating activities:
|
|
|
|
|
|
|
|||||
|
Depreciation (including capital lease amortization)
|
6,547
|
|
5,537
|
|
5,492
|
|
|||||
|
Amortization of purchased intangible assets
|
6,348
|
|
6,210
|
|
5,707
|
|
|||||
|
Amortization of deferred debt issuance costs
|
102
|
|
124
|
|
649
|
|
|||||
|
Stock-based compensation
|
3,401
|
|
4,443
|
|
3,397
|
|
|||||
|
Deferred income tax benefit
|
(1,767
|
)
|
(1,267
|
)
|
(1,587
|
)
|
|||||
|
Loss on disposal of property, plant and equipment
|
50
|
|
—
|
|
35
|
|
|||||
|
Loss on impaired assets
|
756
|
|
—
|
|
—
|
|
|||||
|
Change in:
|
|
|
|
|
|||||||
|
Accounts receivable, net
|
(1,382
|
)
|
560
|
|
(9,551
|
)
|
|||||
|
Inventory, net
|
6,693
|
|
(2,342
|
)
|
(8,392
|
)
|
|||||
|
Prepaid expenses and other
|
93
|
|
461
|
|
(1,346
|
)
|
|||||
|
Accounts payable
|
2,235
|
|
(3,618
|
)
|
(1,035
|
)
|
|||||
|
Customer advances
|
(365
|
)
|
(578
|
)
|
465
|
|
|||||
|
Accrued expenses and other liabilities
|
1,754
|
|
(644
|
)
|
3,451
|
|
|||||
|
Net cash provided by operating activities
|
32,052
|
|
20,580
|
|
9,726
|
|
|||||
|
CASH FLOWS FROM INVESTING ACTIVITIES:
|
|
|
|
|
|||||||
|
Acquisition of property, plant and equipment
|
(17,565
|
)
|
(15,647
|
)
|
(7,726
|
)
|
|||||
|
Acquisition of TRX Industries
|
—
|
|
(10,294
|
)
|
—
|
|
|||||
|
Acquisition of minority interest
|
(180
|
)
|
—
|
|
—
|
|
|||||
|
Change in other non-current assets
|
(494
|
)
|
(224
|
)
|
(5
|
)
|
|||||
|
Net cash used in investing activities
|
(18,239
|
)
|
(26,165
|
)
|
(7,731
|
)
|
|||||
|
The accompanying notes are an integral part of these Consolidated Financial Statements.
|
|||||||||||
51
DYNAMIC MATERIALS CORPORATION
CONSOLIDATED STATEMENTS OF CASH FLOWS
FOR THE YEARS ENDED DECEMBER 31, 2013, 2012 AND 2011
(Amounts in Thousands)
|
|
2013
|
2012
|
2011
|
||||||||
|
CASH FLOWS FROM FINANCING ACTIVITIES:
|
|
|
|
|
|||||||
|
Payment on syndicated term loans
|
—
|
|
—
|
|
(22,247
|
)
|
|||||
|
Borrowings (repayments) on bank lines of credit, net
|
(9,592
|
)
|
12,174
|
|
24,191
|
|
|||||
|
Payment on loans with former owners of LRI
|
(63
|
)
|
(1,176
|
)
|
(36
|
)
|
|||||
|
Payment on Nord LB term loans
|
—
|
|
—
|
|
(627
|
)
|
|||||
|
Payment on capital lease obligations
|
(40
|
)
|
(66
|
)
|
(295
|
)
|
|||||
|
Payment of dividends
|
(2,187
|
)
|
(2,155
|
)
|
(2,130
|
)
|
|||||
|
Payment of deferred debt issuance costs
|
—
|
|
—
|
|
(435
|
)
|
|||||
|
Other
|
295
|
|
(260
|
)
|
184
|
|
|||||
|
Net cash provided by (used in) financing activities
|
(11,587
|
)
|
8,517
|
|
(1,395
|
)
|
|||||
|
EFFECTS OF EXCHANGE RATES ON CASH
|
191
|
|
(8
|
)
|
104
|
|
|||||
|
NET INCREASE IN CASH AND CASH EQUIVALENTS
|
2,417
|
|
2,924
|
|
704
|
|
|||||
|
CASH AND CASH EQUIVALENTS, beginning of the period
|
8,200
|
|
5,276
|
|
4,572
|
|
|||||
|
CASH AND CASH EQUIVALENTS, end of the period
|
$
|
10,617
|
|
$
|
8,200
|
|
$
|
5,276
|
|
||
|
SUPPLEMENTAL DISCLOSURE OF CASH FLOW INFORMATION:
|
|||||||||||
|
Cash paid during the period for -
|
|||||||||||
|
Interest
|
$
|
631
|
|
$
|
746
|
|
$
|
1,280
|
|
||
|
Income taxes, net
|
$
|
1,938
|
|
$
|
7,395
|
|
$
|
5,847
|
|
||
The accompanying notes are an integral part of these Consolidated Financial Statements.
52
DYNAMIC MATERIALS CORPORATION
NOTES TO CONSOLIDATED FINANCIAL STATEMENTS
DECEMBER 31, 2013
(Amounts in Thousands, Except Share and Per Share Data)
1. ORGANIZATION AND BUSINESS
Dynamic Materials Corporation (“DMC”) was incorporated in the state of Colorado in 1971 and reincorporated in the state of Delaware during 1997. DMC is headquartered in Boulder, Colorado and has manufacturing facilities in the United States, Germany, France, Canada and Russia. Customers are located throughout the world. DMC currently operates under
three
business segments. We recently branded our Explosive Metalworking operations under the single name NobelClad. Our NobelClad segment is comprised of our U.S. Clad operations as well as the assets and operations purchased in the Nobelclad Europe S.A. (“Nobelclad France”) and Dynaplat GmbH and Co. KG (“Dynaplat”) acquisitions. The NobelClad segment metallurgically joins or alters metals by using explosives. We recently branded our Oilfield Products segment as DynaEnergetics, which is comprised entirely of DYNAenergetics GmbH and Co. KG (“DYNAenergetics”), its subsidiaries and sister companies. DynaEnergetics manufactures, markets, and sells oil field perforating equipment and explosives. Our third segment, formerly AMK Welding, was branded as AMK Technical Services and utilizes a number of welding technologies to weld components for manufacturers of jet engines, ground-based turbines and oilfield equipment.
2012 Acquisition
On January 3, 2012, we acquired the assets and operating business of Texas-based TRX Industries, Inc. (“TRX”), a manufacturer of perforating guns for our DynaEnergetics segment. TRX, which has now been integrated into DYNAenergetics US, had been a long-term supplier to DYNAenergetics US and, in recent years, accounted for a rapidly growing percentage of its perforating gun purchases. Our statements of operations include the effect of the TRX acquisition from the January 3, 2012 closing date. See Note 3 for additional disclosures regarding this acquisition.
2. SIGNIFICANT ACCOUNTING POLICIES
Principles of Consolidation
The condensed consolidated financial statements include the accounts of DMC and its controlled subsidiaries. Only subsidiaries in which controlling interests are maintained are consolidated. All significant intercompany accounts, profits, and transactions have been eliminated in consolidation.
Use of Estimates
The preparation of financial statements in conformity with accounting principles generally accepted in the United States requires management to make estimates and assumptions that affect the reported amounts of assets and liabilities and disclosure of contingent assets and liabilities at the date of the financial statements and the reported amounts of revenues and expenses during the reporting period. Actual results could differ from these estimates.
Foreign Operations and Foreign Exchange Rate Risk
The functional currency for our foreign operations is the applicable local currency for each affiliate company. Assets and liabilities of foreign subsidiaries for which the functional currency is the local currency are translated at exchange rates in effect at period-end, and the statements of operations are translated at the average exchange rates during the period. Exchange rate fluctuations on translating foreign currency financial statements into U.S. dollars that result in unrealized gains or losses are referred to as translation adjustments. Cumulative translation adjustments are recorded as a separate component of stockholders’ equity and are included in other cumulative comprehensive income (loss). Transactions denominated in currencies other than the local currency are recorded based on exchange rates at the time such transactions arise. Subsequent changes in exchange rates result in transaction gains and losses, which are reflected in income as unrealized (based on period-end translations) or realized upon settlement of the transactions. Cash flows from our operations in foreign countries are translated at actual exchange rates when known, or at the average rate for the period. As a result, amounts related to assets and liabilities reported in the consolidated statements of cash flows will not agree to changes in the corresponding balances in the consolidated balance sheets. The effects of exchange rate changes on cash balances held in foreign currencies are reported as a separate line item below cash flows from financing activities.
53
In September 2010, our German subsidiary, DYNAenergetics, entered into a currency swap agreement with its bank to economically hedge the currency risk associated with a large U.S. dollar order (
$2,700
) that was awarded to it. Under the agreement, DYNAenergetics agreed to exchange
$2,700
for Euros at an exchange rate of
1.269
U.S. dollars per Euros between January 18, 2011 and April 30, 2011. We did not designate this derivative as a cash flow hedge for accounting purposes and as such, gains and losses related to changes in its valuation were recorded in the statement of operations. During the year ended December 31, 2011 we recorded gains on this currency swap agreement of
$87
. These gains are classified as other income (expense), net in our statement of operations.
In September 2011, DYNAenergetics entered into a new currency hedge agreement with its bank to hedge its risk on a new
$2,500
order which is similar to the order described above. This hedge agreement, which was amended in December 2011, allowed DYNAenergetics to sell
$2,500
for Euros at an exchange rate of
1.425
U.S. dollars per Euros if the market rate was under
1.25
or above
1.425
at the time of settlement. If the market rate upon settlement was between
1.25
and
1.425
, the market rate would be used. The only exception to this would have been if the market exchange rate dropped below
1.25
any time prior to the settlement in which case the rate upon settlement would have been
1.425
even if the exchange rate subsequently rose back above
1.25
prior to settlement. As the market rate never went below
1.25
nor exceeded
1.425
at the time of settlement, the market rate was used at settlement. This hedge agreement expired on May 3, 2012. We did not designate this derivative as a cash flow hedge for accounting purposes and as such, gains and losses related to changes in its valuation were recorded in the statement of operations.
Cash and Cash Equivalents and Restricted Cash
For purposes of the consolidated financial statements, we consider highly liquid investments purchased with an original maturity of three months or less to be cash equivalents.
Accounts Receivable
We review our accounts receivable balance routinely to identify any specific customers with collectability issues. In circumstances where we are aware of a specific customer’s inability to meets its financial obligation to us, we record a specific allowance for doubtful accounts (with the offsetting expense charged to our statement of operations) against the amounts due reducing the net recognized receivable to the amount we estimate will be collected.
Inventories
Inventories are stated at the lower-of-cost (first-in, first-out) or market value. Cost elements included in inventory are material, labor, subcontract costs, and manufacturing overhead. As necessary, we record provisions and maintain reserves for excess, slow moving and obsolete inventory. To determine reserve amounts, we regularly review inventory quantities on hand and values, and compare them to estimates of future product demand, market conditions, production requirements and technological developments.
Comprehensive reviews of DynaEnergetics' inventories were performed throughout 2013 to identify potentially excess, slow moving and obsolete inventory items. These reviews reflected management's efforts to reduce overall inventory levels and rationalize product line offerings. Additionally, our estimate for reserving, or writing-off, inventory changed from a combination of qualitative and quantitative considerations to a more specific quantitative analysis whereby inventory items which have not had sales for a certain duration are written-off after a prescribed period.
In 2013 we changed our inventory management philosophy and intend to aggressively reduce our investment in inventory. In connection with this philosophy, we identified certain inventories that we intend to liquidate and therefore revised our assumptions for calculating estimated inventory reserves, resulting in a change in estimate. We determined that our December 31, 2013 inventory reserves for our DynaEnergetics business segment should be increased by
$1,800
to adequately provide for estimated requirements and recorded corresponding expense of
$1,800
(
$1,218
, net of tax) in cost of products sold in our 2013 consolidated statement of operations. The impact of this change in estimate reduced earnings per share by
$0.09
per share (basic and diluted) for the year ended December 31, 2013.
54
Inventories, net of reserves of
$1,729
and
$337
and most of which related to finished goods, consist of the following at
December 31, 2013
and
2012
respectively:
|
2013
|
2012
|
||||||
|
Raw materials
|
$
|
13,122
|
|
$
|
16,079
|
|
|
|
Work-in-process
|
10,188
|
|
12,133
|
|
|||
|
Finished goods
|
17,273
|
|
19,155
|
|
|||
|
Supplies
|
967
|
|
953
|
|
|||
|
|
$
|
41,550
|
|
$
|
48,320
|
|
|
Shipping and handling costs incurred by us upon shipment to customers are included in cost of products sold in the accompanying consolidated statements of operations.
Property, Plant and Equipment
Property, plant and equipment are recorded at cost, except for assets acquired in acquisitions which are recorded at fair value. Additions, improvements, and betterments are capitalized. Maintenance and repairs are charged to operations as the costs are incurred. Depreciation is computed using the straight-line method over the estimated useful life of the related asset (except leasehold improvements which are depreciated over the shorter of their estimated useful life or the lease term) as follows:
|
Buildings and improvements
|
15-30 years
|
|
Manufacturing equipment and tooling
|
3-15 years
|
|
Furniture, fixtures, and computer equipment
|
3-10 years
|
|
Other
|
3-10 years
|
Property, plant and equipment consist of the following at
December 31, 2013
and
2012
:
|
|
2013
|
2012
|
||||||
|
Land
|
$
|
2,864
|
|
$
|
2,792
|
|
||
|
Buildings and improvements
|
34,147
|
|
24,203
|
|
||||
|
Manufacturing equipment and tooling
|
44,286
|
|
39,073
|
|
||||
|
Furniture, fixtures and computer equipment
|
14,254
|
|
7,148
|
|
||||
|
Other
|
4,948
|
|
3,534
|
|
||||
|
Construction in process
|
$
|
7,303
|
|
$
|
13,871
|
|
||
|
|
$
|
107,802
|
|
$
|
90,621
|
|
||
Asset Impairments
Finite-lived assets are tested for impairment whenever events or changes in circumstances indicate that their carrying value may not be recoverable. We compare the expected undiscounted future operating cash flows associated with these finite-lived assets to their respective carrying values to determine if they are fully recoverable. If the expected future operating cash flows of an asset are not sufficient to recover the carrying value, we estimate the fair value of the asset. Impairment is recognized when the carrying amount of the asset is not recoverable and when carrying value exceeds fair value. Long-lived assets to be disposed of, if any, are reported at the lower of carrying amount or fair value less cost to sell. For the year ended
December 31, 2013
we recognized an impairment loss of approximately $
756
(recorded in G&A expenses) associated with implementation costs for a systems implementation project at our Russian and Kazakhstan locations within our DynaEnergetics segment. We have subsequently made the strategic decision to abandon this system implementation project and, therefore, the impairment loss recognized represents writing down the carrying amount of this asset to zero. There were no asset impairments for the years ending
December 31, 2012
and December 31, 2011.
55
Goodwill
Goodwill represents the excess of the purchase price in a business combination over the fair value of the net tangible and intangible assets acquired. The carrying value of goodwill is periodically reviewed for impairment (at a minimum annually) and whenever events or changes in circumstances indicate that the carrying amount of this asset may not be recoverable. Examples of such events or changes in circumstances, many of which are subjective in nature, include significant negative industry or economic trends, significant changes in the manner of our use of the acquired assets or our strategy, a significant decrease in the market value of the asset, and a significant change in legal factors or in the business climate that could affect the value of the asset.
We test goodwill for impairment by first performing a qualitative evaluation. The qualitative evaluation is an assessment of factors, including reporting unit specific operating results as well as industry, market and general economic conditions, to determine if it is more likely than not that the fair value of a reporting unit is less than its carrying amount, including goodwill. We may elect to bypass this qualitative assessment for certain of our reporting units and perform a two-step quantitative test.
Our reporting units for goodwill impairment testing are currently the same as our operating divisions and reportable business segments: NobelClad, DynaEnergetics and AMK Technical Services. Each of these three business segments represent separately managed strategic business units and our chief operating decision maker reviews financial results and evaluates operating performance at this level.
Our annual goodwill impairment testing for 2013 was completed as of December 31, 2013 for our NobelClad and DynaEnergetics reporting units (AMK Technical Services has no recorded goodwill). For NobelClad, which has been our core business segment for more than
40 years
, we performed a qualitative assessment to test this reporting unit’s goodwill for impairment. For our DynaEnergetics reporting unit, which was initially established through a 2007 acquisition and has grown through subsequent acquisitions completed in 2009, 2010 and 2012, we elected to perform quantitative testing. Our quantitative testing utilized both an income approach (discounted cash flows) and a market approach consisting of a comparable public company earnings multiples methodology to estimate the fair value of this reporting unit. To determine the reasonableness of the estimated fair values, we carefully reviewed our assumptions to ensure that neither the income approach nor the market approach provided a significantly different valuation.
If the carrying value were to exceed the fair value for any reporting unit, we would then calculate and compare the estimated implied fair value of goodwill to the carrying amount of goodwill and record an impairment charge for any excess of carrying value over implied fair value. Our most recent impairment testing has resulted in a determination that the carrying value of goodwill did not exceed fair value and, consequently, that our goodwill was not impaired. A future impairment is possible and could occur if (i) operating results underperform what we have estimated or (ii) additional volatility of the capital markets or other factors should cause us to raise the discount rate percentage utilized in our discounted cash flow analysis or decrease the multiples utilized in our market-based analysis. While we believe our most recent estimates were appropriate based on our view of then current business trends, no assurance can be provided that impairment charges will not be required in the future.
The changes to the carrying amount of goodwill during the period are summarized below:
|
NobelClad
|
DynaEnergetics
|
Total
|
|||||||||
|
Goodwill balance at December 31, 2011
|
$
|
21,637
|
|
$
|
15,870
|
|
$
|
37,507
|
|
||
|
Adjustment due to recognition of tax benefit of tax amortization of certain goodwill
|
$
|
(322
|
)
|
$
|
(485
|
)
|
$
|
(807
|
)
|
||
|
Adjustment due to exchange rate differences
|
$
|
419
|
|
$
|
312
|
|
$
|
731
|
|
||
|
Goodwill balance at December 31, 2012
|
$
|
21,734
|
|
$
|
15,697
|
|
$
|
37,431
|
|
||
|
Adjustment due to recognition of tax benefit of tax amortization of certain goodwill
|
(353
|
)
|
(598
|
)
|
(951
|
)
|
|||||
|
Adjustment due to exchange rate differences
|
857
|
|
633
|
|
1,490
|
|
|||||
|
Goodwill balance at December 31, 2013
|
$
|
22,238
|
|
$
|
15,732
|
|
$
|
37,970
|
|
||
All of the goodwill shown above, which is primarily in Germany, is amortizable goodwill for tax purposes.
56
Purchased Intangible Assets
Our purchased intangible assets include core technology, customer relationships and trademarks/trade names. Impairment, if any, is calculated based upon our evaluation whereby, estimated undiscounted future cash flows associated with these assets or operations are compared with their carrying value to determine if a write-down to fair value is required. Finite lived intangible assets are amortized over the estimated useful life of the related assets which have a weighted average amortization period of
12
years in total.
The weighted average amortization periods of the intangible assets by asset category are as follows:
|
Core technology
|
20 years
|
|
Customer relationships
|
9 years
|
|
Trademarks / Trade names
|
9 years
|
The following table presents details of our purchased intangible assets, other than goodwill, as of
December 31, 2013
:
|
Gross
|
Accumulated
Amortization
|
Net
|
|||||||||
|
Core technology
|
$
|
23,391
|
|
$
|
(7,155
|
)
|
$
|
16,236
|
|
||
|
Customer relationships
|
45,269
|
|
(25,813
|
)
|
19,456
|
|
|||||
|
Trademarks / Trade names
|
2,510
|
|
(1,744
|
)
|
766
|
|
|||||
|
Total intangible assets
|
$
|
71,170
|
|
$
|
(34,712
|
)
|
$
|
36,458
|
|
||
The following table presents details of our purchased intangible assets, other than goodwill, as of
December 31, 2012
:
|
Gross
|
Accumulated
Amortization
|
Net
|
|||||||||
|
Core technology
|
$
|
22,494
|
|
$
|
(5,749
|
)
|
$
|
16,745
|
|
||
|
Customer relationships
|
44,334
|
|
(20,046
|
)
|
24,288
|
|
|||||
|
Trademarks / Trade names
|
2,409
|
|
(1,484
|
)
|
925
|
|
|||||
|
Total intangible assets
|
$
|
69,237
|
|
$
|
(27,279
|
)
|
$
|
41,958
|
|
||
The change in the gross value of our purchased intangible assets from
December 31, 2012
to
December 31, 2013
is due solely to the impact of foreign currency translation adjustments.
Expected future amortization of intangible assets is as follows:
|
For the years ended December 31 -
|
|
|
|
|
2014
|
$
|
6,289
|
|
|
2015
|
4,776
|
|
|
|
2016
|
4,776
|
|
|
|
2017
|
4,751
|
|
|
|
2018
|
3,468
|
|
|
|
Thereafter
|
12,398
|
|
|
|
|
$
|
36,458
|
|
57
Other Assets
Included in other assets are net deferred debt issuance costs of
$305
and
$406
as of
December 31, 2013
and
2012
, respectively. On December 21, 2011, we entered into a new five-year syndicated credit agreement, which amended and restated in its entirety the prior syndicated agreement entered into on November 16, 2007. In connection with this amendment,
$284
of costs associated with the prior term loan and the banks which are no longer in the syndicate were expensed. The outstanding balance of deferred debt issuance as of December 31, 2011 included additional costs of
$435
that were incurred in connection with our amended and restated credit agreement and
$95
of deferred debt issuance costs that were carried over from the prior agreement. These deferred debt issuance are being amortized over the five-year term of the amended and restated credit agreement which expires on December 21, 2016.
Customer Advances
On occasion, we require customers to make advance payments prior to the shipment of their orders in order to help finance our inventory investment on large orders or to keep customers’ credit limits at acceptable levels. As of
December 31, 2013
and
2012
customer advances totaled
$1,025
and
$1,363
, respectively, and originated from several customers.
Revenue Recognition
Sales of clad metal products and welding services are generally based upon customer specifications set forth in customer purchase orders and require us to provide certifications relative to metals used, services performed, and the results of any non-destructive testing that the customer has requested be performed. All issues of conformity of the product to specifications are resolved before the product is shipped and billed. Products related to the DynaEnergetics segment, which include detonating cords, detonators, bi-directional boosters, and shaped charges, as well as, seismic related explosives and accessories, are standard in nature. In all cases, revenue is recognized only when all four of the following criteria have been satisfied: persuasive evidence of an arrangement exists; the price is fixed or determinable; delivery has occurred; and collection is reasonably assured. For contracts that require multiple shipments, revenue is recorded only for the units included in each individual shipment. If, as a contract proceeds toward completion, projected total cost on an individual contract indicates a probable loss, we will account for such anticipated loss. Revenue from sales of consigned inventory is recognized upon the use of the product by the consignee or according to the terms of the contract.
Earnings Per Share
Unvested awards of share-based payments with rights to receive dividends or dividend equivalents, such as our restricted stock awards (“RSAs”), are considered participating securities for purposes of calculating earnings per share (“EPS”) and require the use of the two class method for calculating EPS. Under this method, a portion of net income is allocated to these participating securities and therefore is excluded from the calculation of EPS allocated to common stock, as shown in the table below.
58
Computation and reconciliation of earnings per common share are as follows:
|
For the Year Ended
|
|||||||||||
|
December 31, 2013
|
|||||||||||
|
Income
|
Shares
|
EPS
|
|||||||||
|
Basic earnings per share:
|
|||||||||||
|
Net income attributable to DMC
|
$
|
7,495
|
|
||||||||
|
Less income allocated to RSAs
|
(119
|
)
|
|||||||||
|
Net income allocated to common stock for EPS calculation
|
$
|
7,376
|
|
13,533,566
|
|
$
|
0.55
|
|
|||
|
Adjust shares for dilutives:
|
|||||||||||
|
Stock-based compensation plans
|
3,959
|
|
|||||||||
|
Diluted earnings per share:
|
|||||||||||
|
Net income attributable to DMC
|
$
|
7,495
|
|
||||||||
|
Less income allocated to RSAs
|
(119
|
)
|
|||||||||
|
Net income allocated to common stock for EPS calculation
|
$
|
7,376
|
|
13,537,525
|
|
$
|
0.54
|
|
|||
|
For the Year Ended
|
|||||||||||
|
December 31, 2012
|
|||||||||||
|
Income
|
Shares
|
EPS
|
|||||||||
|
Basic earnings per share:
|
|||||||||||
|
Net income attributable to DMC
|
$
|
11,696
|
|
||||||||
|
Less income allocated to RSAs
|
(211
|
)
|
|||||||||
|
Net income allocated to common stock for EPS calculation
|
$
|
11,485
|
|
13,264,636
|
|
$
|
0.87
|
|
|||
|
Adjust shares for dilutives:
|
|||||||||||
|
Stock-based compensation plans
|
4,077
|
|
|||||||||
|
Diluted earnings per share:
|
|||||||||||
|
Net income attributable to DMC
|
$
|
11,696
|
|
||||||||
|
Less income allocated to RSAs
|
(211
|
)
|
|||||||||
|
Net income allocated to common stock for EPS calculation
|
$
|
11,485
|
|
13,268,713
|
|
$
|
0.87
|
|
|||
59
|
For the Year Ended
|
|||||||||||
|
December 31, 2011
|
|||||||||||
|
Income
|
Shares
|
EPS
|
|||||||||
|
Basic earnings per share:
|
|||||||||||
|
Net income attributable to DMC
|
$
|
12,491
|
|
||||||||
|
Less income allocated to RSAs
|
(246
|
)
|
|||||||||
|
Net income allocated to common stock for EPS calculation
|
$
|
12,245
|
|
13,089,691
|
|
$
|
0.94
|
|
|||
|
Adjust shares for dilutives:
|
|||||||||||
|
Stock-based compensation plans
|
9,430
|
|
|||||||||
|
Diluted earnings per share:
|
|||||||||||
|
Net income attributable to DMC
|
$
|
12,491
|
|
||||||||
|
Less income allocated to RSAs
|
(246
|
)
|
|||||||||
|
Net income allocated to common stock for EPS calculation
|
$
|
12,245
|
|
13,099,121
|
|
$
|
0.93
|
|
|||
Fair Value of Financial Instruments
The carrying values of cash and cash equivalents, trade accounts receivable and payable, accrued expenses, lines of credit and long-term debt approximate their fair value.
We had two foreign currency hedge agreements, which expired on April 30, 2011 and May 3, 2012, that were recorded at fair value. Fair value is defined as the price that would be received to sell an asset or paid to transfer a liability in an orderly transaction between market participants at the measurement date. We are required to use an established hierarchy for fair value measurements based upon the inputs to the valuation and the degree to which they are observable or not observable in the market. The three levels in the hierarchy are as follows:
·
Level 1 — Inputs to the valuation based upon quoted prices (unadjusted) for identical assets or liabilities in active markets that are accessible as of the measurement date.
·
Level 2 — Inputs to the valuation include quoted prices in either markets that are not active, or in active markets for similar assets or liabilities, inputs other than quoted prices that are observable, and inputs that are derived principally from or corroborated by observable market data.
·
Level 3 — Inputs to the valuation that are unobservable inputs for the asset or liability.
The highest priority is assigned to Level 1 inputs and the lowest priority to Level 3 inputs.
Our foreign currency hedge agreements were not exchange listed and were therefore valued with models that use Level 2 inputs.
Income Taxes
We recognize deferred tax assets and liabilities for the expected future income tax consequences of temporary differences between the financial reporting and tax bases of assets and liabilities based on enacted tax laws and for tax credits. We recognize deferred tax assets for the expected future effects of all deductible temporary differences. Deferred tax assets are then reduced, if deemed necessary, by a valuation allowance for the amount of any tax benefits which, more likely than not based on current circumstances, are not expected to be realized (see
Note 6
).
60
Concentration of Credit Risk and Off Balance Sheet Arrangements
Financial instruments, which potentially subject us to a concentration of credit risk, consist primarily of cash, cash equivalents, and accounts receivable. Generally, we do not require collateral to secure receivables. At
December 31, 2013
, we had no financial instruments with off-balance sheet risk of accounting losses other than the derivative discussed above.
Other Cumulative Comprehensive Loss
Other cumulative comprehensive loss as of
December 31, 2013
,
2012
, and
2011
consisted entirely of currency translation adjustments.
Recent Accounting Pronouncements
In February 2013, the Financial Accounting Standards Board issued an accounting standards update which requires an entity to disclose amounts reclassified out of accumulated other comprehensive income by component. In addition, an entity is required to present either on the face of the statement of operations or in the notes significant amounts reclassified out of accumulated other comprehensive income by the respective line items of net income, but only if the amount reclassified is required to be reclassified to net income in its entirety in the same reporting period. For amounts not reclassified in their entirety to net income, an entity is required to cross-reference to other disclosures that provide additional detail about those amounts. This accounting standards update is effective prospectively for fiscal years, and interim periods within those years, beginning after December 15, 2012. The adoption of this update did not have a material impact on our financial statements.
Reclassifications
Certain prior year balances in the consolidated financial statements and notes have been reclassified to conform to the
2013
presentation.
3. ACQUISITIONS
TRX Industries
On January 3, 2012, we acquired the assets and operating business of Texas-based TRX Industries, Inc. (“TRX”), a manufacturer of perforating guns, for a purchase price of
$10,294
. TRX, which has now been integrated into our subsidiary DYNAenergetics US, had been a long-term supplier to DYNAenergetics US and, in recent years, accounted for a rapidly growing percentage of its perforating gun purchases.
The acquisition of TRX was structured as an asset purchase in an all-cash transaction. The purchase price was allocated to tangible and identifiable intangible assets based on their fair values as determined by appraisals performed as of the acquisition date on property, plant and equipment and discounted cash flow analysis on the identifiable intangible assets. The allocation of the purchase price to the assets of TRX was as follows:
|
Current assets
|
$
|
2,702
|
|
|
Property, plant and equipment
|
2,227
|
|
|
|
Intangible assets
|
5,365
|
|
|
|
Deferred tax assets
|
40
|
|
|
|
Total assets acquired
|
10,334
|
|
|
|
|
|
|
|
|
Current liabilities
|
40
|
|
|
|
Total liabilities assumed
|
40
|
|
|
|
|
|
|
|
|
Net assets acquired
|
$
|
10,294
|
|
We acquired identifiable finite-lived intangible assets as a result of the acquisition of TRX. The finite-lived intangible assets acquired were classified as customer relationships, totaling
$5,365
, and are being amortized over
6
years. These amounts are included in Purchased Intangible Assets and are further discussed in Note 2.
61
Pro Forma Statements of Operations
The following table presents the pro-forma combined results of operations for the year ended
December 31, 2011
assuming (i) the acquisition of TRX had occurred on January 1; (ii) pro-forma amortization expense of the purchased intangible assets; (iii) pro-forma depreciation expense of the fair value of purchased property, plant and equipment; (iv) elimination of intercompany sales and (v) increase in interest expense for borrowing
$10,000
to fund the acquisition of TRX:
|
|
(Unaudited)
|
||
|
|
For the Year Ended
|
||
|
|
December 31, 2011
|
||
|
Net sales
|
$
|
216,014
|
|
|
Income from operations
|
$
|
20,022
|
|
|
Net income attributable to DMC
|
$
|
13,549
|
|
|
Net income per share:
|
|
|
|
|
Basic
|
$
|
1.01
|
|
|
Diluted
|
$
|
1.01
|
|
The pro-forma results above are not necessarily indicative of the operating results that would have actually occurred if the acquisition had been in effect on the dates indicated, nor are they necessarily indicative of future results of the combined companies. Since the above acquisition occurred on or before January 3, 2012, the actual results for the year ended
December 31, 2012
reflect the full year impact of this acquisition.
Lines of credit consisted of the following at
December 31, 2013
and
2012
:
|
2013
|
2012
|
||||||
|
Syndicated credit agreement:
|
|
|
|
|
|||
|
U.S. Dollar revolving loan
|
$
|
26,400
|
|
$
|
31,900
|
|
|
|
Euro revolving loan
|
—
|
|
4,625
|
|
|||
|
Canadian Dollar revolving loan
|
—
|
|
1,254
|
|
|||
|
Commerzbank line of credit
|
2,856
|
|
981
|
|
|||
|
|
29,256
|
|
38,760
|
|
|||
|
Less current portion
|
(2,856
|
)
|
(981
|
)
|
|||
|
Long-term lines of credit
|
$
|
26,400
|
|
$
|
37,779
|
|
|
Long-term debt consisted of the following at
December 31, 2013
and
2012
:
|
2013
|
2012
|
||||||
|
Loans with former owners of LRI
|
$
|
51
|
|
$
|
120
|
|
|
|
Less current maturities
|
(51
|
)
|
(65
|
)
|
|||
|
Long-term debt
|
$
|
—
|
|
$
|
55
|
|
|
62
Syndicated Credit Agreement
On December 21, 2011, we entered into a
five
-year syndicated credit agreement (“credit facility”) which amended and restated in its entirety our prior syndicated credit facility entered into on November 16, 2007. The new credit facility, which provides revolving loan availability of
$36,000
,
16,000
Euros and
1,500
Canadian dollars, is through a syndicate of four banks, with JP Morgan Chase Bank, N.A. acting as administrative agent for the U.S. and Canadian dollar loans and JP Morgan Europe Ltd. acting as administrative agent for the Euro loans. The credit facility expires on December 21, 2016. Based upon our expected 2014 operating results, planned 2014 capital expenditures and expected changes in working capital levels during 2014, we expect our average 2014 borrowings to be equal to or exceed the amount of outstanding borrowings at December 31, 2013. Thus, we have classified all borrowings outstanding as of
December 31, 2013
under our syndicated credit agreement as long-term lines of credit.
U.S. Dollar Revolving Loans: At our option, borrowings under the
$36,000
revolving loan can be in the form of Alternate Base Rate loans (“ABR” borrowings are based on the greater of adjusted Prime rates, adjusted CD rates, or adjusted Federal Funds rates) or one, two, three, or six month London Interbank Offered Rate (“LIBOR”) loans. ABR loans bear interest at the defined ABR rate plus
0.00%
(at our current leverage ratio) and LIBOR loans bear interest at the applicable LIBOR rate plus
1.25%
(at our current leverage ratio). As of
December 31, 2013
, outstanding revolving loans totaled
$26,400
and had an all-in interest rate of
1.42%
based on the LIBOR rate. Our rates are subject to change based upon changes in our current leverage ratio.
Euro Revolving Loans: At our option, borrowings under the
16,000
Euro revolving loan can be based on one, two, three, or six month Euro Interbank Offered Rate (“EURIBOR”) rates and bear interest at the applicable EURIBOR rate plus
1.25%
(at our current leverage ratio). As of
December 31, 2013
, there were
no
borrowings outstanding under our
16,000
Euro revolving loan.
Canadian Dollar Revolving Loans: At our option, borrowings under the
$1,500
Canadian dollar revolving loan can be based on one, two, three or six month Canadian Dealer Offered Rate (“CDOR”) rates and bear interest at the applicable CDOR rate plus
1.5%
(at our current leverage ratio). As of
December 31, 2013
, there were
no
borrowings outstanding under our
$1,500
Canadian dollar revolving loan.
The syndicated credit facility is secured by the assets of DMC including accounts receivable, inventory, and fixed assets, as well as guarantees and share pledges by DMC.
Line of Credit with German Bank
We maintain a line of credit with a German bank for certain DYNAenergetics operations. This line of credit provides a borrowing capacity of
4,000
Euros and is also used by DYNAenergetics to issue bank guarantees to its customers to secure advance payments made by them. As of
December 31, 2013
, we had outstanding borrowings of
2,075
Euros (
$2,856
based on the
December 31, 2013
exchange rate). As of
December 31, 2013
, we had bank guarantees secured by the line of credit of
$1,722
. The line of credit bears interest at a EURIBOR-based variable rate which at
December 31, 2013
was
3.85%
. The line of credit has open-ended terms and can be canceled by the bank at any time.
Loans with Former Owners of LRI
In connection with our October 1, 2009 acquisition of LRI, we assumed loans with the former owners of LRI totaling
$2,634
Canadian dollars. Following the acquisition, we immediately repaid
$1,302
Canadian dollars of the loans, leaving a principal balance of
$1,332
Canadian dollars, which was due in
35
equal installments beginning on December 1, 2011 with the final payment being due on October 1, 2014. Under the terms of our amended and restated credit facility, we were required to prepay the outstanding principal balance on certain of these loans in January 2012 in the amount of
$1,080
Canadian dollars. As of
December 31, 2013
, the outstanding balance on these loans was
$55
Canadian dollars (
$51
based on the
December 31, 2013
exchange rate). These loans bear interest at the prime rate plus
1.25%
(
4.25%
at December 31, 2013).
Loan Covenants and Restrictions
Our existing loan agreements include various covenants and restrictions, certain of which relate to the payment of dividends or other distributions to stockholders; redemption of capital stock; incurrence of additional indebtedness; mortgaging, pledging or disposition of major assets; and maintenance of specified financial ratios. As of
December 31, 2013
, we were in compliance with all financial covenants and other provisions of our debt agreements.
63
Scheduled Debt Maturity
Our long-term debt, other than lines of credit, all matures by December 31, 2014.
5. STOCK OWNERSHIP AND BENEFIT PLANS
On September 21, 2006, our stockholders approved, and we adopted, the 2006 Stock Incentive Plan (“2006 Plan”). On May 23, 2013, our stockholders approved an amendment to the 2006 Plan to increase the number of shares of common stock that may be issued under the 2006 Plan. The 2006 Plan provides for the grant of various types of equity-based incentives, including stock options, restricted stock, restricted stock units, stock appreciation rights, performance shares, performance units and other stock-based awards. There are a total of
1,617,500
shares available for grant under the 2006 Plan. As of
December 31, 2013
, we have granted an aggregate of
1,025,646
shares of restricted stock and restricted stock units under the 2006 Plan, leaving
591,854
shares available for future grant.
The following table sets forth the total stock-based compensation expense included in the Consolidated Statements of Operations:
|
|
2013
|
2012
|
2011
|
|||||||||
|
Cost of products sold
|
$
|
304
|
|
$
|
324
|
|
$
|
261
|
|
|||
|
General and administrative expenses
|
2,913
|
|
3,018
|
|
2,431
|
|
||||||
|
Selling and distribution expenses
|
184
|
|
1,101
|
|
705
|
|
||||||
|
Stock-based compensation expense before income taxes
|
3,401
|
|
4,443
|
|
3,397
|
|
||||||
|
Income tax benefit
|
(990
|
)
|
(864
|
)
|
(918
|
)
|
||||||
|
Stock-based compensation expense, net of income taxes
|
$
|
2,411
|
|
$
|
3,579
|
|
$
|
2,479
|
|
|||
|
Earnings per share impact:
|
|
|
|
|
|
|
||||||
|
Basic - net income
|
$
|
0.18
|
|
$
|
0.27
|
|
$
|
0.19
|
|
|||
|
Diluted - net income
|
$
|
0.18
|
|
$
|
0.27
|
|
$
|
0.19
|
|
|||
Our stock-based compensation expense results from restricted stock awards, restricted stock units and stock issued under the Employee Stock Purchase Plan. Our
2012
stock-based compensation expense includes
$672
relating to the accelerated recognition of stock-based compensation expense resulting from accelerated vesting of restricted stock awards associated with our President and Chief Executive Officer’s planned retirement on March 1, 2013 and the
December 31, 2012
retirement of another senior executive. During the first quarter of
2013
and, as a result of board actions taken in January
2013
, we recorded a one-time expense of
$2,965
associated with these management retirements. This expense included
$894
of stock-based compensation, with the remainder representing cash payments.
Restricted Stock Awards and Units: Restricted stock and restricted stock units granted to the executive officers and employees of DMC generally vest in one-third increments on the first, second, and third anniversary of the date of grant. Restricted stock granted to directors in 2012 and 2013 vest in one-third increments on the first, second, and third anniversary dates. In previous years, restricted stock granted to directors of DMC vested on the first anniversary of the date of grant. In 2008, we granted
90,000
restricted stock awards under a supplemental executive retirement plan, with
100%
of these awards vesting on the fifth anniversary of the date of grant. The fair value of restricted stock and restricted stock unit awards is based on the fair value of DMC’s stock on the date of grant and is amortized to compensation expense over the vesting period on a straight line basis.
64
A summary of the activity of our nonvested shares of restricted stock issued under the 2006 Plan for the years ended
December 31, 2013
,
2012
, and
2011
is as follows:
|
Shares
|
Weighted Average
Grant Date
Fair Value
|
||||||
|
Balance at December 31, 2010
|
237,489
|
|
$
|
32.82
|
|
||
|
Granted
|
116,500
|
|
20.90
|
|
|||
|
Vested
|
(90,660
|
)
|
24.16
|
|
|||
|
Forfeited
|
(1,500
|
)
|
18.79
|
|
|||
|
|
|
|
|
||||
|
Balance at December 31, 2011
|
261,829
|
|
$
|
30.59
|
|
||
|
Granted
|
116,900
|
|
20.74
|
|
|||
|
Vested
|
(136,344
|
)
|
27.20
|
|
|||
|
|
|
|
|
||||
|
Balance at December 31, 2012
|
242,385
|
|
$
|
27.75
|
|
||
|
Granted
|
163,579
|
|
16.37
|
|
|||
|
Vested
|
(216,851
|
)
|
27.95
|
|
|||
|
Forfeited
|
(2,000
|
)
|
22.05
|
|
|||
|
Balance at December 31, 2013
|
187,113
|
|
$
|
17.63
|
|
||
On March 1, 2013 Kevin Longe, our President and Chief Executive Officer, was granted
30,000
shares of restricted stock outside of our 2006 Plan per specific exemptions in the Nasdaq regulations. The exemption relates to equity compensation agreed upon at an arms length basis to hire a new executive or director if the terms of the grant are promptly disclosed after the award. These shares will vest in one-third increments on the first, second, and third anniversary of the date of grant.
A summary of the activity of our nonvested restricted stock units for the years ended
December 31, 2013
,
2012
, and
2011
is as follows:
|
Share
Units
|
Weighted Average
Grant Date
Fair Value
|
||||||
|
Balance at December 31, 2010
|
34,583
|
|
$
|
19.59
|
|
||
|
Granted
|
32,500
|
|
20.45
|
|
|||
|
Vested
|
(13,085
|
)
|
18.24
|
|
|||
|
|
|
|
|
||||
|
Balance at December 31, 2011
|
53,998
|
|
$
|
20.43
|
|
||
|
Granted
|
50,200
|
|
20.44
|
|
|||
|
Vested
|
(20,769
|
)
|
20.43
|
|
|||
|
Forfeited
|
(3,000
|
)
|
21.15
|
|
|||
|
|
|
|
|
||||
|
Balance at December 31, 2012
|
80,429
|
|
$
|
20.41
|
|
||
|
Granted
|
56,217
|
|
15.67
|
|
|||
|
Vested
|
(35,001
|
)
|
20.88
|
|
|||
|
Forfeited
|
(2,300
|
)
|
19.01
|
|
|||
|
Balance at December 31, 2013
|
99,345
|
|
$
|
17.59
|
|
||
As of
December 31, 2013
, there was
$2,480
and
$1,020
of total unrecognized stock-based compensation related to unvested restricted stock awards and restricted stock units, respectively. The cost is expected to be recognized over a weighted average period of
1.89 years
and
1.83 years
for the restricted stock awards and restricted stock units, respectively.
65
Stock Options: Our incentive stock options were granted at exercise prices that equaled the fair market value of the stock at the date of grant based upon the closing sales price of DMC’s common stock on that date. Incentive stock options generally vested
25%
annually and expired
ten
years from the date of grant. Non-statutory stock options were generally granted at exercise prices that equaled the fair market value of the stock at the date of grant. We have not granted options since 2006.
A summary of stock option activity for the years ended
December 31, 2013
,
2012
, and
2011
is as follows:
|
Options
|
Weighted
Average
Exercise
Price
|
Weighted
Average
Remaining
Contractual Term
|
Aggregate
Intrinsic
Value
|
||||||||||
|
Balance at December 31, 2010
|
19,700
|
|
$
|
12.74
|
|
||||||||
|
Exercised
|
(4,200
|
)
|
4.71
|
|
|||||||||
|
|
|
|
|
||||||||||
|
Balance at December 31, 2011
|
15,500
|
|
$
|
14.92
|
|
||||||||
|
Exercised
|
—
|
|
—
|
|
|||||||||
|
|
|
|
|
||||||||||
|
Balance at December 31, 2012
|
15,500
|
|
$
|
14.92
|
|
|
|
|
|||||
|
Exercised
|
(1,500
|
)
|
3.72
|
|
|
|
|
||||||
|
|
|
|
|
||||||||||
|
Balance at December 31, 2013
|
14,000
|
|
$
|
16.12
|
|
1.32
|
$
|
79
|
|
||||
|
Exercisable at December 31, 2013
|
14,000
|
|
$
|
16.12
|
|
1.32
|
$
|
79
|
|
||||
The intrinsic value of options exercised for the years ended
December 31, 2013
,
2012
, and
2011
was
$28
,
$0
and
$74
, respectively. As of
December 31, 2013
and
2012
, there was
no
unrecognized stock-based compensation cost related to unvested stock options.
The following table summarizes information about employee stock options outstanding and exercisable at
December 31, 2013
:
|
Weighted
|
|||||||||
|
Number of Options
|
Average
|
||||||||
|
Outstanding and
|
Remaining
|
Weighted
|
|||||||
|
Exercisable at
|
Contractual Life
|
Average
|
|||||||
|
Exercise Prices
|
December 31, 2013
|
in Years
|
Exercise Price
|
||||||
|
$4.87
|
4,000
|
|
1.06
|
$
|
4.87
|
|
|||
|
$20.62
|
10,000
|
|
1.42
|
$
|
20.62
|
|
|||
|
|
14,000
|
|
1.32
|
$
|
16.12
|
|
|||
Employee Stock Purchase Plan
We have an Employee Stock Purchase Plan (“ESPP”) which is authorized to issue up to
600,000
shares of which
135,366
shares remain available for future purchases. The offerings begin on the first day following each previous offering (“Offering Date”) and end six months from the offering date (“Purchase Date”). The ESPP provides that full time employees may authorize DMC to withhold up to
15%
of their earnings, subject to certain limitations, to be used to purchase common stock of DMC at the lesser of
85%
of the fair market value of DMC’s common stock on the Offering Date or the Purchase Date. In connection with the ESPP,
22,689
;
14,717
; and
8,688
shares of our stock were purchased during the years ended
December 31, 2013
,
2012
, and
2011
, respectively. Our total stock-based compensation expense for
2013
,
2012
, and
2011
includes
$76
,
$58
, and
$57
respectively, in compensation expense associated with the ESPP.
66
401(k) Plan
We offer a contributory 401(k) plan to our employees. We make matching contributions equal to
100%
of each employee’s contribution up to
3%
of qualified compensation and
50%
of the next
2%
of qualified compensation contributed by each employee. Total DMC contributions were
$485
,
$431
, and
$379
for the years ended
December 31, 2013
,
2012
and
2011
, respectively.
Defined Benefit Plans
We have defined benefit pension plans at certain foreign subsidiaries for which we have recorded an unfunded pension obligation of
$910
and
$807
as of
December 31, 2013
and
2012
, respectively, which is included in other long-term liabilities in the Consolidated Balance Sheets.
6. INCOME TAXES
The domestic and foreign components of income before tax for our operations for the years ended December 31 are summarized below:
|
|
2013
|
2012
|
2011
|
|||||||||
|
Domestic
|
$
|
7,058
|
|
$
|
7,716
|
|
$
|
12,550
|
|
|||
|
Foreign
|
3,470
|
|
8,836
|
|
4,260
|
|
||||||
|
|
$
|
10,528
|
|
$
|
16,552
|
|
$
|
16,810
|
|
|||
The components of the provision for income taxes for the years ended December 31 are as follows:
|
|
2013
|
2012
|
2011
|
|||||||||
|
Current - Federal
|
$
|
1,585
|
|
$
|
3,774
|
|
$
|
4,260
|
|
|||
|
Current - State
|
94
|
|
148
|
|
137
|
|
||||||
|
Current - Foreign
|
3,029
|
|
2,203
|
|
1,559
|
|
||||||
|
Current income tax expense
|
4,708
|
|
6,125
|
|
5,956
|
|
||||||
|
Deferred - Federal
|
(390
|
)
|
(314
|
)
|
(295
|
)
|
||||||
|
Deferred - State
|
(86
|
)
|
(21
|
)
|
(24
|
)
|
||||||
|
Deferred - Foreign
|
||||||||||||
|
Net operating losses
|
623
|
|
176
|
|
71
|
|
||||||
|
Other
|
(1,914
|
)
|
(1,108
|
)
|
(1,339
|
)
|
||||||
|
Deferred income tax benefit
|
(1,767
|
)
|
(1,267
|
)
|
(1,587
|
)
|
||||||
|
Income tax provision
|
$
|
2,941
|
|
$
|
4,858
|
|
$
|
4,369
|
|
|||
67
A reconciliation of our income tax provision computed by applying the Federal statutory income tax rate of
35%
in
December 31, 2013
,
2012
, and
2011
to income before taxes for the years ended December 31 is as follows:
|
|
2013
|
2012
|
2011
|
|||||||||
|
Federal income tax at statutory rate
|
$
|
3,652
|
|
$
|
5,793
|
|
$
|
5,900
|
|
|||
|
State and local tax items not included below, net
|
815
|
|
431
|
|
209
|
|
||||||
|
Effect of difference between U.S. Federal and foreign tax rates
|
(1,655
|
)
|
(1,459
|
)
|
(554
|
)
|
||||||
|
Permanent differences:
|
||||||||||||
|
Foreign interest expense
|
(434
|
)
|
(859
|
)
|
(784
|
)
|
||||||
|
U.S. manufacturing tax deduction
|
(224
|
)
|
(356
|
)
|
(414
|
)
|
||||||
|
German tax audit settlement
|
812
|
|
—
|
|
—
|
|
||||||
|
Deemed repatriation of foreign earnings
|
(914
|
)
|
914
|
|
—
|
|
||||||
|
Intercompany distributions
|
1,250
|
|
—
|
|
—
|
|
||||||
|
Foreign equity compensation
|
228
|
|
247
|
|
196
|
|
||||||
|
Other
|
165
|
|
79
|
|
83
|
|
||||||
|
Current year tax credits
|
(649
|
)
|
(29
|
)
|
(142
|
)
|
||||||
|
Impact of statutory tax rate change
|
(6
|
)
|
198
|
|
(31
|
)
|
||||||
|
Other
|
(99
|
)
|
(101
|
)
|
(94
|
)
|
||||||
|
Provision for income taxes
|
$
|
2,941
|
|
$
|
4,858
|
|
$
|
4,369
|
|
|||
In January 2013, the United States Congress authorized, and the President signed into law, legislation which retroactively changed federal tax laws for 2012. Since this legislation was enacted in 2013, the financial statement benefit from these changes, totaling
$914
, was reflected in the provision for income taxes in the consolidated statement of operations during the
twelve months ended December 31, 2013
. Tax returns of our German subsidiaries have been under routine examination by the German tax authorities for most of 2013. During 2013, German tax authorities proposed and we agreed to a settlement. The key provisions of the settlement resulted in a net reduction of the subsidiaries' loss carryforwards, which reduced the non-current deferred tax assets associated with these carryforwards that were recorded on our books. Thus, we recorded an additional
$812
in income tax expense to reflect these reductions.
68
Our deferred tax assets and liabilities at
December 31, 2013
and
2012
consist of the following:
|
|
2013
|
2012
|
||||||
|
Deferred tax assets:
|
|
|
|
|
||||
|
Income tax credit carryforward
|
$
|
50
|
|
$
|
584
|
|
||
|
Net foreign operating loss carryforward
|
5,396
|
|
6,019
|
|
||||
|
Inventory differences
|
2,424
|
|
1,451
|
|
||||
|
Allowance for doubtful accounts
|
105
|
|
113
|
|
||||
|
Equity compensation
|
556
|
|
1,703
|
|
||||
|
Vacation and other compensation accrual
|
374
|
|
420
|
|
||||
|
Investment in subsidiaries
|
1,154
|
|
—
|
|
||||
|
Other, net
|
175
|
|
21
|
|
||||
|
Deferred tax assets
|
10,234
|
|
10,311
|
|
||||
|
Deferred tax liabilities:
|
||||||||
|
Purchased intangible assets
|
(12,445
|
)
|
(13,257
|
)
|
||||
|
Depreciation and amortization
|
(2,315
|
)
|
(2,097
|
)
|
||||
|
Investment in partnerships
|
—
|
|
(1,129
|
)
|
||||
|
Deferred profit
|
(244
|
)
|
(236
|
)
|
||||
|
Other, net
|
—
|
|
(74
|
)
|
||||
|
Deferred tax liabilities
|
(15,004
|
)
|
(16,793
|
)
|
||||
|
Net deferred tax liabilities
|
$
|
(4,770
|
)
|
$
|
(6,482
|
)
|
||
|
Current deferred tax assets
|
$
|
3,507
|
|
$
|
2,074
|
|
||
|
Current deferred tax liabilities
|
(435
|
)
|
(149
|
)
|
||||
|
Long-term deferred tax assets
|
505
|
|
804
|
|
||||
|
Long-term deferred tax liabilities
|
(8,347
|
)
|
(9,211
|
)
|
||||
|
Net deferred tax liabilities
|
$
|
(4,770
|
)
|
$
|
(6,482
|
)
|
||
As a result of stock-based compensation in
December 31, 2013
,
2012
, and
2011
, we decreased additional paid-in-capital by
$907
,
$453
, and
$35
, respectively, for the tax impact. To the extent these adjustments reduced taxes currently payable, they are not reflected in the current income tax provision for those years.
As of
December 31, 2013
,
2012
and
2011
, income considered to be permanently reinvested in non-U.S. subsidiaries totaled approximately
$37,795
,
$42,543
and
$27,745
, respectively. Deferred income taxes have not been provided on this undistributed income, as we do not plan to initiate any action that would require the payment of U.S. income taxes on these earnings. It is not practical to estimate the amount of additional taxes that might be payable on these amounts of undistributed foreign income.
The components of the income tax credit carryforward as of
December 31, 2013
are sundry state tax credits of
$78
(which, if unused, expire between 2014 and 2022). The components of the income tax credit carryforward as of December 31, 2012, are U.S. foreign tax credits of
$551
(which, if unused, expire between 2017 and 2019) and sundry state tax credits of
$33
(which, if unused, expire beginning in 2013 and 2017).
As of
December 31, 2013
and
2012
, we had
no
state net operating loss carryforwards. The foreign loss carryforwards are primarily from jurisdictions which do not impose a time limitation on such carryforwards.
At
December 31, 2013
and
2012
, the balance of unrecognized tax benefits was
$0
. We recognize interest and penalties related to uncertain tax positions in operating expense. As of
December 31, 2013
and
2012
, our accrual for interest and penalties related to uncertain tax positions was
$0
.
69
DMC’s U.S. Federal tax returns for the tax years 2010-2013 remain open to examination while most of DMC’s state tax returns remain open to examination for the tax years 2009-2013. DMC’s foreign tax returns remain open to examination for the tax years 2008-2013.
7. BUSINESS SEGMENTS
Our business is organized in the following
three
segments: NobelClad, DynaEnergetics, and AMK Technical Services. The NobelClad segment uses explosives to perform metal cladding and shock synthesis of industrial diamonds. The most significant product of this group is clad metal which is used in the fabrication of pressure vessels, heat exchangers, and transition joints for various industries, including upstream oil and gas, oil refinery, petrochemicals, hydrometallurgy, aluminum production, shipbuilding, power generation, industrial refrigeration, and similar industries. The DynaEnergetics segment manufactures, markets and sells oilfield perforating equipment and explosives, including detonating cords, detonators, bi-directional boosters and shaped charges, and seismic related explosives and accessories. AMK Technical Services utilizes a number of welding technologies to weld components for manufacturers of jet engine and ground-based turbines.
The accounting policies of all the segments are the same as those described in the summary of significant accounting policies. Our reportable segments are separately managed strategic business units that offer different products and services. Each segment’s products are marketed to different customer types and require different manufacturing processes and technologies.
Beginning in 2011, we changed our methodology of allocating corporate overhead to our business segments. In connection with this change, we no longer allocate certain corporate expenses that do not directly benefit our business segments. DMC corporate and our U.S. NobelClad business fall under the same legal entity and historically their general ledgers have been combined. Beginning January 1, 2013, and in connection with implementing a new ERP system, we have separated DMC corporate and NobelClad U.S. into two general ledgers. Therefore we now have specifically identified corporate property, plant and equipment that are not allocated to our business segments. These assets consist of computer hardware, computer software, leasehold improvements and furniture related to our corporate offices.
Segment information is presented for the years ended
December 31, 2013
,
2012
, and
2011
as follows:
|
|
Year Ended December 31,
|
||||||||||
|
|
2013
|
|
2012
|
|
2011
|
||||||
|
Net sales:
|
|
|
|
|
|
||||||
|
NobelClad
|
$
|
118,409
|
|
|
$
|
115,333
|
|
|
$
|
126,199
|
|
|
DynaEnergetics
|
83,651
|
|
|
77,404
|
|
|
72,782
|
|
|||
|
AMK Technical Services
|
7,513
|
|
|
8,830
|
|
|
9,910
|
|
|||
|
|
|
|
|
|
|
||||||
|
Consolidated net sales
|
$
|
209,573
|
|
|
$
|
201,567
|
|
|
$
|
208,891
|
|
70
|
|
Year Ended December 31,
|
||||||||||
|
|
2013
|
|
2012
|
|
2011
|
||||||
|
Income before income taxes:
|
|
|
|
|
|
||||||
|
NobelClad
|
$
|
17,090
|
|
|
$
|
17,439
|
|
|
$
|
16,058
|
|
|
DynaEnergetics
|
4,849
|
|
7,047
|
|
6,188
|
|
|||||
|
AMK Technical Services
|
376
|
|
925
|
|
2,056
|
|
|||||
|
Segment operating income
|
22,315
|
|
25,411
|
|
24,302
|
|
|||||
|
Unallocated corporate expenses
|
(7,217
|
)
|
(3,565
|
)
|
(2,686
|
)
|
|||||
|
Stock-based compensation
|
(3,401
|
)
|
(4,443
|
)
|
(3,397
|
)
|
|||||
|
Other income (expense)
|
(528
|
)
|
(32
|
)
|
528
|
|
|||||
|
Interest expense
|
(648
|
)
|
|
(832
|
)
|
|
(1,945
|
)
|
|||
|
Interest income
|
7
|
|
|
13
|
|
|
8
|
|
|||
|
|
|||||||||||
|
Consolidated income before income taxes
|
$
|
10,528
|
|
|
$
|
16,552
|
|
|
$
|
16,810
|
|
|
|
Year Ended December 31,
|
||||||||||
|
|
2013
|
|
2012
|
|
2011
|
||||||
|
Depreciation and Amortization:
|
|
|
|
|
|
||||||
|
NobelClad
|
$
|
6,118
|
|
|
$
|
5,580
|
|
|
$
|
5,833
|
|
|
DynaEnergetics
|
6,125
|
|
|
5,631
|
|
|
4,877
|
|
|||
|
AMK Technical Services
|
652
|
|
|
536
|
|
|
489
|
|
|||
|
|
|||||||||||
|
Segment depreciation and amortization
|
$
|
12,895
|
|
|
$
|
11,747
|
|
|
$
|
11,199
|
|
|
|
Year Ended December 31,
|
||||||||||
|
|
2013
|
|
2012
|
|
2011
|
||||||
|
Capital Expenditures:
|
|
|
|
|
|
||||||
|
NobelClad
|
$
|
2,425
|
|
$
|
4,747
|
|
$
|
4,338
|
|
||
|
DynaEnergetics
|
13,022
|
|
10,386
|
|
2,904
|
|
|||||
|
AMK Technical Services
|
1,342
|
|
514
|
|
484
|
|
|||||
|
|
|
|
|
|
|
||||||
|
Segment capital expenditures
|
16,789
|
|
|
15,647
|
|
|
7,726
|
|
|||
|
Corporate and other
|
776
|
|
|
—
|
|
|
—
|
|
|||
|
|
|||||||||||
|
Consolidated capital expenditures
|
$
|
17,565
|
|
|
$
|
15,647
|
|
|
$
|
7,726
|
|
71
|
Year Ended December 31,
|
|||||||||||
|
2013
|
2012
|
2011
|
|||||||||
|
Assets:
|
|||||||||||
|
NobelClad
|
$
|
99,115
|
|
$
|
100,227
|
|
$
|
102,473
|
|
||
|
DynaEnergetics
|
112,919
|
|
112,319
|
|
92,070
|
|
|||||
|
AMK Technical Services
|
6,090
|
|
6,120
|
|
6,006
|
|
|||||
|
|
|
|
|||||||||
|
Segment assets
|
218,124
|
|
218,666
|
|
200,549
|
|
|||||
|
Cash and cash equivalents
|
10,617
|
|
8,200
|
|
5,276
|
|
|||||
|
Prepaid expenses and other assets
|
6,275
|
|
5,687
|
|
5,647
|
|
|||||
|
Deferred tax assets
|
4,012
|
|
2,878
|
|
1,954
|
|
|||||
|
Corporate property, plant and equipment
|
1,584
|
|
—
|
|
—
|
|
|||||
|
Consolidated assets
|
$
|
240,612
|
|
$
|
235,431
|
|
$
|
213,426
|
|
||
The geographic location of our property, plant and equipment, net of accumulated depreciation, is as follows:
|
|
As of December 31,
|
|||||||||||
|
|
2013
|
2012
|
2011
|
|||||||||
|
United States
|
$
|
33,301
|
|
$
|
28,248
|
|
$
|
21,810
|
|
|||
|
Germany
|
12,703
|
|
11,319
|
|
9,924
|
|
||||||
|
Russia
|
10,152
|
|
5,351
|
|
387
|
|
||||||
|
France
|
5,801
|
|
5,912
|
|
5,767
|
|
||||||
|
Canada
|
2,230
|
|
2,136
|
|
2,339
|
|
||||||
|
Kazakhstan
|
438
|
|
525
|
|
550
|
|
||||||
|
Rest of the world
|
390
|
|
485
|
|
625
|
|
||||||
|
Total
|
$
|
65,015
|
|
$
|
53,976
|
|
$
|
41,402
|
|
|||
All of our sales are from products shipped from our manufacturing facilities and distribution centers located in the United States, Germany, France, Canada, Russia, Kazakhstan and Sweden (closed during 2011). The following represents our net sales based on the geographic location of the customer:
|
|
For the Years Ended December 31,
|
|||||||||||
|
|
2013
|
2012
|
2011
|
|||||||||
|
United States
|
$
|
95,214
|
|
$
|
78,676
|
|
$
|
81,410
|
|
|||
|
Canada
|
18,150
|
|
21,083
|
|
24,151
|
|
||||||
|
South Korea
|
11,642
|
|
9,469
|
|
29,951
|
|
||||||
|
Germany
|
9,208
|
|
13,992
|
|
12,960
|
|
||||||
|
India
|
8,888
|
|
3,874
|
|
6,176
|
|
||||||
|
Russia
|
5,992
|
|
6,472
|
|
8,658
|
|
||||||
|
France
|
3,957
|
|
6,838
|
|
3,828
|
|
||||||
|
Kazakhstan
|
2,513
|
|
2,359
|
|
32
|
|
||||||
|
China
|
606
|
|
7,986
|
|
1,468
|
|
||||||
|
Rest of the world
|
53,403
|
|
50,818
|
|
40,257
|
|
||||||
|
Total
|
$
|
209,573
|
|
$
|
201,567
|
|
$
|
208,891
|
|
|||
72
During the years ended
December 31, 2013
,
2012
and
2011
,
no
one customer accounted for more than
10%
of total net sales.
8. COMMITMENTS AND CONTINGENCIES
We lease certain office space, equipment, storage space, vehicles and other equipment under various non-cancelable lease agreements. Certain of these leases (primarily equipment related) are recorded as capital leases. Amortization expense associated with the capital leases is combined with depreciation expense of fixed assets. Details of capitalized leased assets as of
December 31, 2013
and
2012
are as follows:
|
|
2013
|
2012
|
||||||
|
Manufacturing equipment and tooling
|
$
|
304
|
|
$
|
292
|
|
||
|
Furniture, fixtures and computer equipment
|
14
|
|
—
|
|
||||
|
Total
|
318
|
|
292
|
|
||||
|
Less: Accumulated amortization
|
(290
|
)
|
(231
|
)
|
||||
|
Net capitalized leased assets
|
$
|
28
|
|
$
|
61
|
|
||
Future minimum rental commitments under non-cancelable leases are as follows:
|
|
Capital Leases
|
Operating Leases
|
||||||
|
Year ended December 31 -
|
|
|
|
|
||||
|
2014
|
$
|
25
|
|
$
|
1,961
|
|
||
|
2015
|
5
|
|
1,579
|
|
||||
|
2016
|
3
|
|
1,084
|
|
||||
|
2017
|
—
|
|
788
|
|
||||
|
2018
|
—
|
|
764
|
|
||||
|
Thereafter
|
—
|
|
1,126
|
|
||||
|
Total minimum payments
|
33
|
|
$
|
7,302
|
|
|||
|
Amounts representing interest
|
(1
|
)
|
|
|
||||
|
Present value of net minimum lease payments
|
32
|
|
|
|
||||
|
Current portion of capital lease obligations
|
(24
|
)
|
|
|
||||
|
Capital lease obligations
|
$
|
8
|
|
|
|
|||
Total rental expense included in operations was
$3,884
,
$3,182
, and
$2,973
for the years ended
December 31, 2013
,
2012
, and
2011
, respectively.
73
During 2008, we entered into a license agreement and a risk allocation agreement related to our U.S. NobelClad business. These agreements, which were amended in 2012, provide us with the ability to perform our explosive shooting process at a second shooting site in Pennsylvania. Future minimum payments required to be made by us under these agreements are as follows:
|
Year ended December 31 -
|
|
|
|
|
2014
|
$
|
398
|
|
|
2015
|
398
|
|
|
|
2016
|
398
|
|
|
|
2017
|
398
|
|
|
|
2018
|
398
|
|
|
|
Thereafter
|
—
|
|
|
|
|
|
|
|
|
Total minimum payments
|
$
|
1,990
|
|
In the normal course of business, we are party to various contractual disputes and claims. After considering our evaluations by legal counsel regarding pending actions, we are of the opinion that the outcome of such actions will not have a material adverse effect on the financial position or results of operations.
9. RETIREMENT EXPENSES
During the first quarter of
2013
and, as a result of board actions taken in January
2013
, we recorded a one-time expense of
$2,965
associated with management retirements, the majority of which relates to the March 1,
2013
retirement of Yvon Cariou, our former President and Chief Executive Officer. This expense includes
$894
of stock-based compensation, with the remainder representing cash payments.
10. SUBSEQUENT EVENT
In an effort to streamline our overall operational structure and further focus our business on the oil and gas industry, during the first quarter 2014 we intend to merge AMK Technical Services, which currently represents
3.6%
of our net sales, into the DynaEnergetics business segment. AMK Technical Services will continue to serve its customers in the oil and gas, ground power and aerospace sectors and, in addition, it will perform specialized welding and machining services on select DynaEnergetics components. With AMK Technical Services’ increased focus on the oil and gas sector and our intention for it to be measured, monitored and managed in combination with our DynaEnergetics business segment , we believe it will be more appropriately included in our DynaEnergetics business segment, rather than as a separate segment. In our future filings, we will restate prior periods in our business segment disclosures to reflect this intended change.
74
11. QUARTERLY FINANCIAL DATA (UNAUDITED)
Selected unaudited quarterly financial data for the years ended
December 31, 2013
and
2012
are presented below:
|
|
|
Year Ended December 31, 2013
|
||||||||||||||
|
|
|
Quarter ended
|
|
Quarter ended
|
|
Quarter ended
|
|
Quarter ended
|
||||||||
|
|
|
March 31,
|
|
June 30,
|
|
September 30,
|
|
December 31,
|
||||||||
|
Net sales
|
|
$
|
46,270
|
|
|
$
|
57,859
|
|
|
$
|
54,268
|
|
|
$
|
51,176
|
|
|
|
|
|||||||||||||||
|
Gross profit
|
|
$
|
12,719
|
|
|
$
|
17,063
|
|
|
$
|
16,573
|
|
|
$
|
13,159
|
|
|
|
|
|||||||||||||||
|
Net income
|
|
$
|
215
|
|
|
$
|
3,440
|
|
|
$
|
3,562
|
|
|
$
|
278
|
|
|
|
|
|||||||||||||||
|
Net income per share - basic
|
|
$
|
0.02
|
|
|
$
|
0.25
|
|
|
$
|
0.26
|
|
|
$
|
0.02
|
|
|
|
|
|||||||||||||||
|
Net income per share - diluted
|
|
$
|
0.02
|
|
|
$
|
0.25
|
|
|
$
|
0.26
|
|
|
$
|
0.02
|
|
|
|
Year Ended December 31, 2012
|
|||||||||||||||
|
|
Quarter ended
|
Quarter ended
|
Quarter ended
|
Quarter ended
|
||||||||||||
|
|
March 31,
|
June 30,
|
September 30,
|
December 31,
|
||||||||||||
|
Net sales
|
$
|
50,212
|
|
$
|
48,687
|
|
$
|
50,149
|
|
$
|
52,519
|
|
||||
|
Gross profit
|
$
|
14,377
|
|
$
|
13,939
|
|
$
|
15,349
|
|
$
|
16,043
|
|
||||
|
Net income
|
$
|
2,428
|
|
$
|
2,653
|
|
$
|
3,754
|
|
$
|
2,861
|
|
||||
|
Net income per share - basic
|
$
|
0.18
|
|
$
|
0.20
|
|
$
|
0.28
|
|
$
|
0.21
|
|
||||
|
Net income per share - diluted
|
$
|
0.18
|
|
$
|
0.20
|
|
$
|
0.28
|
|
$
|
0.21
|
|
||||
The net income per share for the 2013 and 2012 quarters, when totaled, does not equal net income per share for the respective years as the per share amounts for each quarter and for each year are computed based on their respective discrete periods.
75
There are no changes in or disagreements with accountants on accounting and financial disclosure for the fiscal year ended December 31, 2013.
Evaluation of Disclosure Controls and Procedures
Our Chief Executive Officer and Chief Financial Officer have evaluated the effectiveness of our disclosure controls and procedures (as defined in Rules 13a-15(e) and 15d-15(e) under the Securities Exchange Act of 1934). Based on such evaluation, such officers have concluded that our disclosure controls and procedures are effective at the reasonable assurance level as of the end of the period covered by this Annual Report. There have been no changes in internal control over financial reporting during the fourth quarter of 2013.
76
Management’s Report on Internal Control over Financial Reporting
The management of Dynamic Materials Corporation and subsidiaries (“DMC”) is responsible for establishing and maintaining adequate internal control over financial reporting, as such term is defined in Exchange Act Rules 13a-15(f) and 15d-15(f). Under the supervision and with the participation of DMC’s management, including its Chief Executive Officer and Chief Financial Officer, management conducted an evaluation of the effectiveness of DMC’s internal control over financial reporting as of December 31, 2013 based on the framework in Internal Control — Integrated Framework issued by the Committee of Sponsoring Organizations of the Treadway Commission (1992 Framework) (COSO). In designing and evaluating the internal control over financial reporting, management recognizes that any controls and procedures, no matter how well designed and operated, can provide only reasonable assurance of achieving the desired control objectives. Also, projections of any evaluation of effectiveness to future periods are subject to the risk that controls may become inadequate because of changes in conditions, or that the degree of compliance with the policies or procedures may deteriorate.
Based on that evaluation, management concluded that DMC’s internal control over financial reporting was effective as of December 31, 2013 based on the criteria established in Internal Control - Integrated Framework (1992).
DMC’s internal control over financial reporting as of December 31, 2013, has also been audited by Ernst & Young LLP, an independent registered public accounting firm, as stated in their attestation report which is included elsewhere herein.
|
|
/s/ Kevin Longe
|
|
|
Kevin Longe
|
|
|
President and Chief Executive Officer
|
|
|
March 7, 2014
|
|
|
|
|
|
/s/ Richard A. Santa
|
|
|
Richard A. Santa
|
|
|
Senior Vice President and Chief Financial Officer
|
|
|
March 7, 2014
|
77
Report of Independent Registered Public Accounting Firm
The Stockholders and the
Board of Directors of Dynamic Materials Corporation
We have audited Dynamic Materials Corporation and subsidiaries’ (the Company) internal control over financial reporting as of December 31, 2013, based on criteria established in
Internal Control-Integrated Framework
issued by the Committee of Sponsoring Organizations of the Treadway Commission (1992 Framework) (the COSO criteria). The Company’s management is responsible for maintaining effective internal control over financial reporting, and for its assessment of the effectiveness of internal control over financial reporting included in the accompanying
Management’s Report on Internal Control Over Financial Reporting
. Our responsibility is to express an opinion on the Company’s internal control over financial reporting based on our audit.
We conducted our audit in accordance with the standards of the Public Company Accounting Oversight Board (United States). Those standards require that we plan and perform the audit to obtain reasonable assurance about whether effective internal control over financial reporting was maintained in all material respects. Our audit included obtaining an understanding of internal control over financial reporting, assessing the risk that a material weakness exists, testing and evaluating the design and operating effectiveness of internal control based on the assessed risk, and performing such other procedures as we considered necessary in the circumstances. We believe that our audit provides a reasonable basis for our opinion.
A company’s internal control over financial reporting is a process designed to provide reasonable assurance regarding the reliability of financial reporting and the preparation of financial statements for external purposes in accordance with generally accepted accounting principles. A company’s internal control over financial reporting includes those policies and procedures that (1) pertain to the maintenance of records that, in reasonable detail, accurately and fairly reflect the transactions and dispositions of the assets of the company; (2) provide reasonable assurance that transactions are recorded as necessary to permit preparation of financial statements in accordance with generally accepted accounting principles, and that receipts and expenditures of the company are being made only in accordance with authorizations of management and directors of the company; and (3) provide reasonable assurance regarding prevention or timely detection of unauthorized acquisition, use, or disposition of the company’s assets that could have a material effect on the financial statements.
Because of its inherent limitations, internal control over financial reporting may not prevent or detect misstatements. Also, projections of any evaluation of effectiveness to future periods are subject to the risk that controls may become inadequate because of changes in conditions, or that the degree of compliance with the policies or procedures may deteriorate.
In our opinion, Dynamic Materials Corporation and subsidiaries maintained, in all material respects, effective internal control over financial reporting as of December 31, 2013, based on the COSO criteria.
We also have audited, in accordance with the standards of the Public Company Accounting Oversight Board (United States), the consolidated balance sheets of Dynamic Materials Corporation and subsidiaries as of December 31, 2013 and 2012, and the related consolidated statements of operations, comprehensive income, stockholders’ equity, and cash flows for each of the three years in the period ended December 31, 2013 of Dynamic Materials Corporation and subsidiaries and our report dated
March 7, 2014
expressed an unqualified opinion thereon.
|
|
/s/ Ernst & Young LLP
|
|
Denver, Colorado
|
|
|
March 7, 2014
|
|
78
Not applicable.
79
ITEM 10.
Directors, Executive Officers and Corporate Governance
Item 10 incorporates information by reference to our Proxy Statement for the 2014 Annual Meeting of Shareholders, which is expected to be filed with the Securities and Exchange Commission within 120 days of the close of fiscal year 2013.
ITEM 11.
Executive Compensation
Item 11 incorporates information by reference to our Proxy Statement for the 2014 Annual Meeting of Shareholders, which is expected to be filed with the Securities and Exchange Commission within 120 days of the close of fiscal year 2013.
ITEM 12.
Security Ownership of Certain Beneficial Owners and Management and Related Stockholder Matters
Item 12 incorporates information by reference to our Proxy Statement for the 2014 Annual Meeting of Shareholders, which is expected to be filed with the Securities and Exchange Commission within 120 days of the close of fiscal year 2013.
For information regarding securities authorized for issuance under our equity compensation plans see the Proxy Statement for our 2013 Annual Meeting of Shareholders, which information is incorporated herein by reference.
TEM 13.
Certain Relationships and Related Transactions, and Director Independence
Item 13 incorporates information by reference to our Proxy Statement for the 2014 Annual Meeting of Shareholders, which is expected to be filed with the Securities and Exchange Commission within 120 days of the close of fiscal year 2013.
ITEM
14.
Principal Accounting Fees and Services
Item 14 incorporates information by reference to our Proxy Statement for the 2014 Annual Meeting of Shareholders, which is expected to be filed with the Securities and Exchange Commission within 120 days of the close of fiscal year 2013.
ITEM 15.
Exhibits and Financial Statement Schedules
(a)(1)
Financial Statements
See Index to Financial Statements in Item 8 of this Annual Report on Form 10-K, which is incorporated herein by reference.
(a)(2)
Financial Statement Schedules
See Schedule II beginning on page
84
of this Annual Report on Form 10-K.
(a)(3)
Exhibits
80
|
Exhibit
Number
|
|
Description
|
|
3.1
|
|
Certificate of Incorporation of the Company (incorporated by reference to the Company’s Quarterly report on Form 10-Q/A for the quarter ended March 31, 2004).
|
|
3.2
|
|
Bylaws of the Company (incorporated by reference to the Company’s Quarterly report on Form 10-Q/A for the quarter ended March 31, 2004).
|
|
10.1
|
|
Amended and Restated Credit Agreement dated as of December 21, 2011, by and among the Company, the US borrowers party thereto, the Euro borrowers party thereto, the Canadian borrowers party thereto, the guarantors party thereto, the lenders party thereto, JPMorgan Chase Bank, N.A., as US administrative agent, J.P. Morgan Europe Limited, as Euro administrative agent, JPMorgan Chase Bank, N.A., Toronto Branch, as Canadian administrative agent, KeyBank National Association, as syndication agent, Wells Fargo Bank, National Association, as documentation agent, and JPMorgan Chase Bank, N.A., as sole bookrunner and lead arranger (incorporated by reference to the Company’s Annual report on Form 10-K for the year ended December 31, 2011).
|
|
10.2
|
|
Employment Agreement, dated as of March 1, 2013, by and between the Company and Kevin Longe (incorporated by reference to the Comapny's Form 10-K filed with the Commission on March 14,2013). *
|
|
10.3
|
|
Agreement, dated as of January 18, 2013, by and between the Company and Richard A. Santa (incorporated by reference to the Company's Form 10-K filed with the Commission on March 14, 2013). *
|
|
10.4
|
|
Consulting Agreement, dated September 11, 2012, among DYNAenergetics Holding GmbH, the Company and RoRo Consult GmbH, (incorporated by reference to the Company’s Form 8-K filed with the Commission on September 13, 2012). *
|
|
10.5
|
|
Dynamic Materials Corporation 2006 Stock Incentive Plan, as amended by Amendment No. 1 to Dynamic Materials Corporation 2006 Stock Inventive Plan dated March 11, 2013. *
|
|
10.6
|
|
Dynamic Materials Corporation Performance-Based Plan (incorporated by reference to the Company's Form 8-K filed with the Commission on May 24, 2013). *
|
|
10.7
|
Dynamic Materials Corporation 2012 Nonqualified Deferred Compensation Plan (incorporated by reference to the Company's Form 8-K filed with the Commission on May 24, 2013). *
|
|
|
10.8
|
|
Form of Executive Officer Restricted Stock Award Agreement (incorporated by reference to the Company’s Form 8-K filed with the Commission on June 12, 2007). *
|
|
10.9
|
|
Form of Non-Executive Director Restricted Stock Award Agreement (incorporated by reference to the Company’s Form 8-K filed with the Commission on June 12, 2007). *
|
|
10.10
|
|
Form of Indemnification Agreement (incorporated by reference to the Company’s Form 8-K filed with the Commission on January 24, 2011). *
|
|
21.1
|
|
Subsidiaries of the Company.
|
|
23.1
|
|
Consent of Ernst & Young LLP, Independent Registered Public Accounting Firm.
|
|
31.1
|
|
Certification of the President and Chief Executive Officer pursuant to 17 CFR 240.13a-14(a) or 17 CFR 240.15d-14(a), as adopted pursuant to Section 302 of the Sarbanes-Oxley Act of 2002.
|
|
31.2
|
|
Certification of the Vice President and Chief Financial Officer pursuant to 17 CFR 240.13a-14(a) or 17 CFR 240.15d-14(a), as adopted pursuant to Section 302 of the Sarbanes-Oxley Act of 2002.
|
|
32.1
|
|
Certification of the President and Chief Executive Officer pursuant to 18 U.S.C. Section 1350, as adopted pursuant to Section 906 of the Sarbanes-Oxley Act of 2002.
|
|
32.2
|
|
Certification of the Vice President and Chief Financial Officer pursuant to 18 U.S.C. Section 1350, as adopted pursuant to Section 906 of the Sarbanes-Oxley Act of 2002.
|
|
101
|
|
The following materials from the Annual Report on Form 10-K of Dynamic Materials Corporation. For the year ended December 31, 2013, formatted in XBRL (eXtensible Business Reporting Language): (i) the Consolidated Balance Sheets, (ii) the Consolidated Statements of Operations, (iii) the Consolidated Statements of Comprehensive Income, (iv) the Consolidated Statement of Stockholders’ Equity, (v) the Consolidated Statements of Cash Flows, and (vi) the Notes to Consolidated Financial Statements.**
|
* Management contract or compensatory plan or arrangement.
** Pursuant to Rule 406T of Regulation S-T, the Interactive Data Files on Exhibit 101 hereto are deemed not filed or part of a registration statement or prospectus for purposes of Sections 11 or 12 of the Securities Act of 1933, as amended, are deemed not filed for purposes of Section 18 of the Securities and Exchange Act of 1934, as amended, and otherwise are not subject to liability under those sections.
81
SIGNATURES
Pursuant to the requirements of Section 13 or 15(d) of the Securities Exchange Act of 1934, the Company has duly caused this report to be signed on its behalf by the undersigned, thereunto duly authorized.
|
|
DYNAMIC MATERIALS CORPORATION
|
|
|
|
|
|
|
|
|
|
|
March 7, 2014
|
By:
|
/s/ Richard A. Santa
|
|
|
|
Richard A. Santa
|
|
|
|
Senior Vice President and Chief Financial Officer
|
Pursuant to the requirements of the Securities Exchange Act of 1934, this report has been signed below by the following persons on behalf of the Company and in the capacities and on the dates indicated.
|
SIGNATURE
|
|
TITLE
|
|
DATE
|
|
|
|
|
|
|
|
/s/ Kevin Longe
|
|
President and Chief Executive Officer
|
|
March 7, 2014
|
|
Kevin Longe
|
|
(Principal Executive Officer)
|
|
|
|
|
|
|
|
|
|
/s/ Richard A. Santa
|
|
Senior Vice President and Chief Financial Officer
|
|
March 7, 2014
|
|
Richard A. Santa
|
|
(Principal Financial and Accounting Officer)
|
|
|
|
|
|
|
|
|
|
/s/ Gerard Munera
|
|
Chairman and Director
|
|
March 7, 2014
|
|
Gerard Munera
|
|
|
|
|
|
|
|
|
|
|
|
/s/ David Aldous
|
|
Director
|
|
March 7, 2014
|
|
David Aldous
|
|
|
|
|
|
|
|
|
|
|
|
/s/ Yvon Pierre Cariou
|
|
Director
|
|
March 7, 2014
|
|
Yvon Pierre Cariou
|
|
|
|
|
|
|
|
|
|
|
|
/s/ Robert A. Cohen
|
|
Director
|
|
March 7, 2014
|
|
Robert A. Cohen
|
|
|
|
|
|
|
|
|
|
|
|
/s/ James J. Ferris
|
|
Director
|
|
March 7, 2014
|
|
James J. Ferris
|
|
|
|
|
|
|
|
|
|
|
|
/s/ Richard P. Graff
|
|
Director
|
|
March 7, 2014
|
|
Richard P. Graff
|
|
|
|
|
|
|
|
|
|
|
|
/s/ Bernard Hueber
|
|
Director
|
|
March 7, 2014
|
|
Bernard Hueber
|
|
|
|
|
|
|
|
|
|
|
|
/s/ Rolf Rospek
|
|
Director
|
|
March 7, 2014
|
|
Rolf Rospek
|
|
|
|
|
82
DYNAMIC MATERIALS CORPORATION AND SUBSIDIARIES
INDEX TO SCHEDULE II
AS OF DECEMBER 31, 2013
83
DYNAMIC MATERIALS CORPORATION AND SUBSIDIARIES
SCHEDULE II(a) - VALUATION AND QUALIFYING ACCOUNTS AND RESERVES
ALLOWANCE FOR DOUBTFUL ACCOUNTS
|
Balance at
beginning
of period
|
Additions
charged to
income
|
Accounts
receivable
written off
|
Other
Adjustments
|
Balance at
end of
period
|
||||||||||||||||
|
Year ended -
|
|
|
|
|
|
|
|
|
|
|
||||||||||
|
December 31, 2011
|
$
|
378
|
|
$
|
267
|
|
$
|
(149
|
)
|
$
|
(72
|
)
|
$
|
424
|
|
|||||
|
December 31, 2012
|
$
|
424
|
|
$
|
63
|
|
$
|
(10
|
)
|
$
|
(71
|
)
|
$
|
406
|
|
|||||
|
December 31, 2013
|
$
|
406
|
|
$
|
221
|
|
$
|
(13
|
)
|
$
|
(195
|
)
|
$
|
419
|
|
|||||
DYNAMIC MATERIALS CORPORATION AND SUBSIDIARIES
SCHEDULE II(b) - VALUATION AND QUALIFYING ACCOUNTS AND RESERVES
WARRANTY RESERVE
|
Balance at
beginning
of period
|
Additions
charged to
income
|
Repairs
allowed
|
Other
Adjustments
|
Balance at
end of
period
|
||||||||||||||||
|
Year ended -
|
|
|
|
|
|
|
|
|
|
|
||||||||||
|
December 31, 2011
|
$
|
597
|
|
$
|
756
|
|
$
|
(761
|
)
|
$
|
—
|
|
$
|
592
|
|
|||||
|
December 31, 2012
|
$
|
592
|
|
$
|
175
|
|
$
|
(134
|
)
|
$
|
(190
|
)
|
$
|
443
|
|
|||||
|
December 31, 2013
|
$
|
443
|
|
$
|
43
|
|
$
|
(156
|
)
|
$
|
(116
|
)
|
$
|
214
|
|
|||||
DYNAMIC MATERIALS CORPORATION AND SUBSIDIARIES
SCHEDULE II(c) - VALUATION AND QUALIFYING ACCOUNTS AND RESERVES
INVENTORY RESERVE
|
Balance at
beginning
of period
|
Additions
charged to
income
|
Inventory
write-offs
|
Balance at
end of
period
|
|||||||||||||
|
Year ended -
|
|
|
|
|
|
|
|
|
||||||||
|
December 31, 2011
|
$
|
225
|
|
$
|
77
|
|
$
|
(145
|
)
|
$
|
157
|
|
||||
|
December 31, 2012
|
$
|
157
|
|
$
|
856
|
|
$
|
(676
|
)
|
$
|
337
|
|
||||
|
December 31, 2013
|
$
|
337
|
|
$
|
2,714
|
|
$
|
(1,322
|
)
|
$
|
1,729
|
|
||||
84
TABLE OF CONTENTS
Part IItem 1. BusinessItem 1A. Risk FactorsItem 1B. Unresolved Staff CommentsItem 2. PropertiesItem 3. Legal ProceedingsItem 4. Mine Safety DisclosuresPart IIItem 5. Market For Registrant's Common Equity, Related Stockholder Matters and Issuer Purchases Of Equity SecuritiesItem 6. Selected Financial DataItem 7. Management S Discussion and Analysis Of Financial Condition and Results Of OperationsItem 7A. Quantitative and Qualitative Disclosures About Market RiskItem 8. Financial Statements and Supplementary DataItem 9. Changes in and Disagreements with Accountants on Accounting and Financial DisclosureItem 9A. Controls and ProceduresItem 9B. Other InformationPart IIIItem 10. Directors, Executive Officers and Corporate GovernanceItem 11. Executive CompensationItem 12. Security Ownership Of Certain Beneficial Owners and Management and Related Stockholder MattersItem 14. Principal Accounting Fees and ServicesPart IVItem 15. Exhibits and Financial Statement Schedules