As filed with the Securities and Exchange Commission on April 30, 2012
UNITED STATES
SECURITIES AND EXCHANGE COMMISSION
WASHINGTON, D.C. 20549
FORM 20-F
|
o
|
REGISTRATION STATEMENT PURSUANT TO SECTION 12(b) OR (g) OF THE SECURITIES EXCHANGE ACT OF 1934
|
or
|
x
|
ANNUAL REPORT PURSUANT TO SECTION 13 OR 15(d) OF THE SECURITIES EXCHANGE ACT OF 1934
|
For the fiscal year ended December 31, 2011
or
|
o
|
TRANSITION REPORT PURSUANT TO SECTION 13 OR 15(d) OF THE SECURITIES EXCHANGE ACT OF 1934
|
For the transition period from __________ to __________
or
|
o
|
SHELL COMPANY REPORT PURSUANT TO SECTION 13 OR 15(d) OF THE SECURITIES EXCHANGE ACT OF 1934
|
Date of event requiring this shell company report .................
Commission file number:
001-14184

B.O.S. BETTER ONLINE SOLUTIONS LTD.
(Exact name of Registrant as specified in its charter)
ISRAEL
(Jurisdiction of incorporation or organization)
20 Freiman Street, Rishon LeZion, 75100, Israel
(Address of principal executive offices)
Eyal Cohen, 972-3-9542070,
eyalc@boscom.com
, 20 Freiman Street, Rishon LeZion, 75100, Israel
(Name, Telephone, E-mail and/or Facsimile number and Address of Company Contact Person)
Securities registered or to be registered pursuant to Section 12(b) of the Act:
|
Title of each class
Ordinary shares, nominal value NIS 20.00 per share
|
Name of each exchange on which registered
NASDAQ Capital Market
|
Securities registered or to be registered pursuant of Section 12(g) of the Act:
None
Securities for which there is a reporting obligation pursuant to Section 15(d) of the Act:
None
Indicate the number of outstanding shares of each of the issuer’s classes of capital or common stock at the close of the period covered by the annual report:
|
|
4,467,924 ordinary shares, nominal value NIS 20.00 per share, as of December 31, 2011 and 4,471,637 ordinary shares, nominal value NIS 20.00 per share, as of March 31, 2012.
|
Indicate by check mark if the registrant is a well-known seasoned issuer, as defined in Rule 405 of the Securities Act.
Yes
o
No
x
If this report is an annual or transition report, indicate by check mark if the registrant is not required to file reports pursuant to Section 13 or 15(d) of the Securities Exchange Act of 1934.
Yes
o
No
x
|
|
Indicate by check mark whether the registrant (1) has filed all reports required to be filed by Section 13 or 15(d) of the Securities Exchange Act of 1934 during the preceding 12 months (or for such shorter period that the registrant was required to file such reports), and (2) has been subject to such filing requirements for the past 90 days.
|
Yes
x
No
o
Indicate by check mark whether the registrant has submitted electronically and posted on its corporate Web site, if any, every Interactive Data File required to be submitted and posted pursuant to Rule 405 of Regulation S-T (232.405 of this chapter) during the preceding 12 months (or for such shorter period that the registrant was required to submit and post such files).
Yes
x
No
o
Indicate by check mark whether the registrant is a large accelerated filer, an accelerated filer, or a non-accelerated filer. See definition of “accelerated filer and large accelerated filer” in Rule 12b-2 of the Exchange Act. (Check one):
|
Large accelerated filer
o
|
Accelerated filer
o
|
Non-accelerated filer
x
|
|
|
Indicate by check mark which basis of accounting the registrant has used to prepare the financial statements included in this filing:
|
|
x
U.S. GAAP
|
o
International Financial Reporting Standards as issued
by the International Accounting Standards Board
|
o
Other
|
2
If “Other” has been checked in response to the previous question, indicate by check mark which financial statement item the registrant has elected to follow.
Item 17
o
Item 18
o
If this is an annual report, indicate by check mark whether the registrant is a shell company (as defined in Rule 12b-2 of the Exchange Act).
Yes
o
No
x
This report on Form 20-F is being incorporated by reference into all effective Registration Statements filed by us under the Securities Act of 1933, to the extent not superseded by documents or reports subsequently filed or furnished.
Forward Looking Statements
This Annual Report on Form 20-F contains forward-looking statements that are intended to be, and are hereby identified as, forward looking statements for the purposes of the safe harbor provisions of the Private Securities Reform Act of 1995. These statements address, among other things: our strategy; the anticipated development of our products; the results of completed acquisitions and our ability to make future acquisitions; our projected capital expenditures and liquidity; our development of additional revenue sources; our development and expansion of relationships; the market acceptance of our products; and our technological advancement. Actual results could differ materially from those anticipated in these forward-looking statements as a result of various factors, including all the risks discussed below and elsewhere in this report.
We urge you to consider that statements that use the terms “believe”, “do not believe”, “expect”, “plan”, “intend”, “estimate”, “anticipate”, “projections”, “forecast” and similar expressions are intended to identify forward-looking statements. These statements reflect our current views with respect to future events. These statements are based on assumptions and are subject to risks and uncertainties. These risk factors and uncertainties include, amongst others, the dependency of sales being generated from one or few major customers, the uncertainty of BOS being able to maintain current gross profit margins, inability to keep up or ahead of technology and to succeed in a highly competitive industry, inability to maintain marketing and distribution arrangements and to expand our overseas markets, uncertainty with respect to the prospects of legal claims against BOS, the effect of exchange rate fluctuations, general worldwide economic conditions and continued availability of financing for working capital purposes and to refinance outstanding indebtedness; and additional risks and uncertainties set forth in this Annual Report, including under the heading “Risk Factors.” Except as required by applicable law, including the federal securities laws of the United States, we do not intend to update or revise any forward-looking statements, whether as a result of new information, future events or otherwise.
Market data and forecasts used in this report have been obtained from independent industry sources. We have not independently verified the data obtained from these sources and we cannot assure you of the accuracy or completeness of the data. Forecasts and other forward-looking information obtained from these sources are subject to the same qualifications and additional uncertainties accompanying any estimates of future market size.
3
Table of Contents
|
1
|
||
|
1
|
||
|
1
|
||
|
1
|
||
|
16
|
||
|
27
|
||
|
27
|
||
|
47
|
||
|
59
|
||
|
64
|
||
|
65
|
||
|
67
|
||
|
79
|
||
|
81
|
||
|
81
|
||
|
81
|
||
|
81
|
||
|
81
|
||
|
82
|
||
|
82
|
||
|
83
|
4
|
83
|
||
|
83
|
||
|
84
|
||
| 84 | ||
| 84 | ||
| 84 | ||
|
84
|
||
|
84
|
||
|
84
|
||
|
84
|
||
|
87
|
5
Not applicable.
Not applicable. .
Unless the context in which such terms are used would require a different meaning, all references to “BOS”, “we”, “our” or the “Company” refer to B.O.S. Better Online Solutions Ltd. and its subsidiaries.
3A. Selected Consolidated Financial Data
The selected consolidated statement of operations data for B.O.S. Better Online Solutions Ltd. set forth below with respect to the years ended December 31, 2011, 2010 and 2009, and the selected consolidated balance sheet data as of December 31, 2011 and 2010, have been derived from our audited Consolidated Financial Statements listed in Item 18, which have been prepared in accordance with generally accepted accounting principles in the United States (“U.S. GAAP”). The selected consolidated statement of operations data set forth below with respect to the years ended December 31, 2008 and 2007, and the consolidated balance sheet data as of December 31, 2009, 2008 and 2007, are derived from other consolidated financial statements not included herein and have been prepared in accordance with U.S. GAAP. The financial statements for the years ended December 31, 2011, 2010, 2009, 2008 and 2007 were audited by Kost Forer Gabbay & Kasierer, an independent registered public accounting firm and a member of Ernst & Young Global. The financial statements of BOS - Supply Chain Solutions (Lynk) Inc. (("Lynk", formerly, Lynk, USA Inc.) and its subsidiaries for the years ended December 31, 2009, 2008 and 2007 were audited by Arik Eshel, CPA & Assoc., PC an independent registered public accounting firm. The selected consolidated financial data presented below should be read in conjunction with and is qualified entirely by reference to Item 5: “Operating and Financial Review and Prospects” and the Notes to the Financial Statements included in this Annual Report on Form 20-F.
The Company has accounted for discontinued operations, in accordance with ASC 205-20,
Discontinued operations
of the Financial Accounting Standards Board. As such, the results of discontinued operations, including revenues, cost of revenues, operating expenses, and other income and expenses, related to the prior periods of the discontinued operation have been reclassified in the accompanying statements of operations (see Note 1e to the Consolidated Financial Statements for the year ended December 31, 2011).
On January 12, 2010, the Company effected a reverse share split which was approved in a general shareholders’ meeting on December 23, 2009. Pursuant to the reverse split, each 5 ordinary shares, NIS 4.00 nominal value per share, were converted into one ordinary share, NIS 20.00 nominal value per share. No fractional shares were issued as a result of the reverse split. Instead, all fractional shares were rounded up to the nearest whole number of shares. As of January 11, 2010, there were 13,090,346 ordinary shares outstanding and after the reverse split, there were 2,622,533 ordinary shares outstanding. Unless explicitly stated otherwise, all share prices and amounts are adjusted to account for the reverse share split.
- 1 -
Statement of Operations Data: (In U.S. thousands of dollars with the exception of per share data)
|
Year Ended December 31,
|
||||||||||||||||||||
|
2007
|
2008
|
2009
|
2010
|
2011
|
||||||||||||||||
|
Revenues
|
22,090 | 34,066 | 25,467 | 30,187 | 33,434 | |||||||||||||||
|
Cost of revenues
|
17,450 | 26,893 | 19,741 | 22,668 | 26,481 | |||||||||||||||
|
Inventory write off
s
|
258 | 339 | 2,235 | 36 | 443 | |||||||||||||||
|
Gross profit
|
4,382 | 6,834 | 3,491 | 7,483 | 6,510 | |||||||||||||||
|
Operating expenses
:
|
||||||||||||||||||||
|
Research and development, net
|
636 | 844 | 360 | 372 | 403 | |||||||||||||||
|
In process Research and development
|
170 | - | - | - | - | |||||||||||||||
|
Sales and marketing
|
3,448 | 6,408 | 5,426 | 4,068 | 4,273 | |||||||||||||||
|
General and administrative
|
1,980 | 2,029 | 2,004 | 1,786 | 2,252 | |||||||||||||||
|
Impairment of goodwill and other intangible assets
|
- | 568 | 383 | - | 555 | |||||||||||||||
|
Total operating expenses
|
6,234 | 9,849 | 8,173 | 6,226 | 7,483 | |||||||||||||||
|
Operating income (loss):
|
(1,852 | ) | (3,015 | ) | (4,682 | ) | 1,257 | (973 | ) | |||||||||||
|
Financial expense, net
|
(463 | ) | (431 | ) | (606 | ) | (961 | ) | (2,241 | ) | ||||||||||
|
Other expenses, net
|
(6,233 | ) | (1,448 | ) | (409 | ) | (120 | ) | (172 | ) | ||||||||||
|
Income (loss) before tax on income
|
(8,548 | ) | (4,894 | ) | (5,697 | ) | 176 | (3,386 | ) | |||||||||||
|
Tax benefit (taxes on income)
|
(38 | ) | 241 | (329 | ) | (5 | ) | 172 | ||||||||||||
|
Income (loss) from continuing operations
|
(8,586 | ) | (4,653 | ) | (6,026 | ) | 171 | (3,214 | ) | |||||||||||
|
Net income (loss) from discontinued operations
|
190 | (1,747 | ) | (3,075 | ) | (806 | ) | - | ||||||||||||
|
Net loss
|
(8,396 | ) | (6,400 | ) | (9,101 | ) | (635 | ) | (3,214 | ) | ||||||||||
|
Basic and diluted net income (loss) per share from continuing operations
|
$ | (4.96 | ) | $ | (1.94 | ) | $ | (2.32 | ) | $ | 0.07 | $ | (1.14 | ) | ||||||
|
Basic and diluted net income (loss) per share from discontinued operations
|
$ | 0.11 | $ | (0.73 | ) | $ | (1.18 | ) | $ | (0.31 | ) | $ | - | |||||||
|
Basic and diluted net loss per share
|
$ | (4.85 | ) | $ | (2.67 | ) | $ | (3.50 | ) | $ | (0.24 | ) | $ | (1.14 | ) | |||||
|
Weighted average number of shares used in computing basic net earning (loss) per share
|
1,731 | 2,396 | 2,606 | 2,622 | 2,818 | |||||||||||||||
|
Weighted average number of shares used in computing diluted net earning (loss) per share
|
2,357 | 2,396 | 2,606 | 2,757 | 2,818 | |||||||||||||||
- 2 -
|
As of December 31,
|
||||||||||||||||||||
|
Consolidated Balance Sheet Data:
|
2007
|
2008
|
2009
|
2010
|
2011
|
|||||||||||||||
|
Cash and Cash Equivalents
|
3,627 | 1,247 | 564 | 703 | 411 | |||||||||||||||
|
Working Capital (*)
|
6,157 | 3,491 | 237 | 386 | (76 | ) | ||||||||||||||
|
Total Assets
|
31,132 | 37,345 | 27,362 | 22,130 | 20,069 | |||||||||||||||
|
Short-term banks loan and current maturities of long-term bank loans
|
5,028 | 6,879 | 7,983 | 7,778 | 7,496 | |||||||||||||||
|
Long-term liabilities
|
4,450 | 4,564 | 4,274 | 4,073 | 2,713 | |||||||||||||||
|
Share Capital
|
10,628 | 13,159 | 13,225 | 13,959 | 23,065 | |||||||||||||||
|
Additional paid in Capital
|
54,758 | 55,830 | 57,042 | 56,805 | 51,093 | |||||||||||||||
|
Shareholders’ equity
|
14,438 | 11,244 | 3,643 | 3,713 | 3,598 | |||||||||||||||
|
(*)Working capital comprises of:
|
||||||||||||||||||||
|
Current assets
|
16,409 | 19,644 | 19,682 | 14,730 | 13,682 | |||||||||||||||
|
Less: current liabilities
|
10,252 | 16,153 | 19,445 | 14,344 | 13,758 | |||||||||||||||
| 6,157 | 3,491 | 237 | 386 | (76 | ) | |||||||||||||||
- 3 -
Not applicable.
3C. Reasons for the Offer and Use of proceeds
Not applicable.
3D. Risk Factors
The following factors, in addition to other information contained or incorporated by reference in this Form 20-F, should be considered carefully. Our business, financial condition or results of operations could be materially adversely affected by any of these risks. The risks described below are not the only risks facing our Company. Additional risks and uncertainties that we are not aware of or that we currently believe are immaterial may also adversely affect our business, financial condition, results of operation and liquidity. The trading price of our ordinary shares could decline due to any of these risks, and you may lose all or part of your investment.
Risks relating to our financial results and capital structure
:
We require a significant amount of cash to satisfy our debt obligations. If we fail to generate sufficient cash flow from operations, we may need to renegotiate or refinance our debt, obtain additional financing, postpone capital expenditures or sell assets.
As of December 31, 2011 we had $1,046,000 in long-term debt to Dimex Systems Ltd. (includes current maturities of $299,000) and $2,190,000 in long-term bank loans (includes current maturities of $660,000). In addition, at December 31, 2011, we had $6.8 million of short term bank loans drawn under a revolving credit facility. We depend mainly on cash generated by continuing operating activities to make payments on our debt. We cannot assure that we will generate sufficient cash flow from operations to make the scheduled payments on our debt. Our ability to meet our debt obligations will depend on whether we can successfully implement our business strategy, as well as on economic, financial, competitive and technical factors (See “Item 5B. Liquidity and Capital Resources”).
Some of the factors are beyond our control, such as economic conditions in the markets where we operate or intend to operate, changes in our customers’ demand for our products, and pressure from existing and new competitors. Also, because part of our loans bear interest at floating rates, we are susceptible to an increase in interest rates (See “Item 11. Quantitative and Qualitative Disclosures about Market Risk”).
If we cannot generate sufficient cash flow from operations to make scheduled payments on our debt obligations, we may need to renegotiate the terms of our debt, refinance our debt, obtain additional financing, delay planned capital expenditures or sell assets.
If our lenders decline to renegotiate the terms of our debt in these circumstances, the lenders could declare all amounts borrowed and all amounts due to them under the agreements due and payable.
- 4 -
We have had a history of losses and our future levels of sales and ability to achieve profitability are unpredictable.
As of December 31, 2011, we had an accumulated deficit of $70 million. In 2011, we had a net loss of $3.21 million. Our ability to maintain and improve future levels of sales and achieve profitability depends on many factors, which include:
|
|
·
|
developing and selling new Radio Frequency Identification ("RFID") and Mobile Solutions products to meet market needs;
|
|
|
·
|
delivering our products in a timely manner;
|
|
|
·
|
successfully implementing our business strategy;
|
|
|
·
|
increased demand for our existing products;
|
|
·
|
controlling costs; and
|
|
·
|
having access to sufficient working capital financing to support our operations.
|
There can be no assurance that we will be able to meet our challenges and experience any growth in sales or achieve profitability in the future, that the level of historic sales will continue in the future or that our net losses will not increase in the future.
We may be unable to maintain our gross profit margins.
Our sales and profitability may vary in any given year, and from quarter to quarter. In order to increase sales or to enter into new markets with new products we may find it necessary to decrease prices in order to be competitive. Additionally, our gross profit margin tends to fluctuate mainly due to variety and mix of products. We may not be able to maintain current gross profit margins in the future, which would have a material adverse effect on our business.
We depend on two banks which provide our short and long term loans.
We rely on Bank Leumi le-Israel
Ltd. (“Bank Leumi”) and on Bank Hapoalim, to provide credit facilities to our subsidiaries. As of December 31, 2011 we had $6.8 million drawn under a Bank Leumi short term revolving credit facility and $367,000 current maturities of long term loans extended by Bank Leumi. In addition, as of December 31, 2011 we had $278,000 current maturities of long term loans and $1.44 million of long terms bank loans with Bank HaPoalim. The Bank HaPoalim loans contain several covenants that require the Company's Israeli subsidiaries to maintain certain financial ratios and levels of profitability. As of December 31, 2011 the Company failed to meet Bank HaPoalim’s covenants. Nonetheless, Bank HaPoalim, agreed under certain conditions, including compliance by the Company with its covenants for the year 2012, to waive this failure of the Company to meet its financial covenants in 2011. Failure to meet our bank covenants may lead to a default under the loan agreements.
Our assets are subject to security interests in favor of our bank lenders. Our failure to repay the bank loans, if required, could result in legal action against us, which could require the sale of all of our assets.
The repayment of our debt to Bank Leumi is secured by a first priority floating charge on all of our Company’s assets, present and future as they may be changing from time to time, and by a first priority fixed charge on all of the Company’s issued and unpaid-for share capital, its goodwill and its shares of our Israeli subsidiaries, BOS - Dimex Ltd. (“Dimex”) and BOS - Odem Ltd. (“Odem”). In addition, the Company and its Israeli subsidiaries entered into a series of inter company guarantees in favor of Bank Leumi.
- 5 -
The repayment of the Company's debt to Bank HaPoalim is secured by long term bank deposits in the amount of $427,000.
If we are unable to repay the bank loans when due, our bank lender could foreclose on our assets in order to recover the amounts due. Any such action would require us to curtail or cease operations (See “Item 5B. Liquidity and Capital Resources”).
Our debt obligations may hinder our growth and put us at a competitive disadvantage.
Our debt obligations require us to use a substantial portion of our operating cash flow to repay the principal and interest on our loans. This reduces funds available to grow and expand our business, limits our ability to pursue business opportunities and makes us more vulnerable to economic and industry downturns. The existence of debt obligations and covenants also limits our ability to obtain additional financing on favorable terms.
Due to restrictions in our loan agreements, we may not be able to operate our business as we desire.
Our loan agreements contain a number of conditions and limitations on the way in which we can operate our business, including limitations on our ability to raise debt, sell or acquire assets and pay dividends. Our loan agreements also contain various covenants, which require that we maintain certain financial ratios related to shareholder's equity , operating results and certain levels of profitability. These limitations and covenants may force us to pursue less than optimal business strategies or forgo business arrangements which could have been financially advantageous to our shareholders and us. Our failure to comply with the covenants and restrictions contained in our loan agreements could lead to a default under the terms of these agreements (See “Item 5B. Liquidity and Capital Resources”).
Risks related to our business:
We depend on key personnel for the success of our business.
Our success depends, to a significant extent, on the continued active participation of our executive officers and other key personnel. In addition, there is significant competition for employees with technical expertise in our industry. In order to succeed we would need to be able to:
|
|
·
|
retain the executive officers and key technical personnel who have been involved in the development of our two divisions;
|
|
|
·
|
attract and retain additional qualified personnel to provide technological depth and support to enhance existing products and develop new products; and
|
|
|
·
|
attract and retain highly skilled computer operating, marketing and financial personnel.
|
We cannot make assurances that we will be successful in attracting, integrating, motivating and retaining key personnel. If we are unable to retain our key personnel and attract additional qualified personnel as and when needed, our business may be adversely affected.
- 6 -
We may be unable to effectively manage our growth and expansion, and as a result, our business results may be adversely affected.
Our goal is to grow over the next few years. The management of our growth, if any, will require the continued expansion of our operational and financial control systems, as well as a significant increase in our financial resources and in our delivery and service capabilities. These factors could place a significant strain on our resources.
Our growth increases the complexity of our operations, places significant demands on our management and our operational, financial and marketing resources and involves a number of challenges, including:
|
|
·
|
managing geographically dispersed operations;
|
|
|
·
|
retaining and motivating key personnel of the acquired businesses;
|
|
|
·
|
assimilating different corporate cultures;
|
|
|
·
|
preserving the business relationships with existing key customers and suppliers;
|
|
|
·
|
maintaining uniform standards, controls, procedures and policies; and
|
|
|
·
|
introducing joint products and service offerings.
|
In recent years, the Company has made several acquisitions, such as the acquisition of Dimex Systems’ business in March 2008, and the acquisition of BOS Supply Chain Solutions (Summit) Inc. ("Summit"),
a New Jersey based company, in October 2007
(Summit filed for Chapter 7 bankruptcy relief on November 23, 2010). There can be no assurance that we will be able to successfully integrate and manage future acquisitions, if they further occur, in order to maintain and grow the combined business and maximize the potential synergies.
Further, once integrated, acquisitions may not achieve comparable levels of revenues, profitability or productivity as were prior to the acquisitions or otherwise perform as expected. The occurrence of any of these events could harm our business, financial condition or results of operations.
Our inability to meet our delivery commitments in a timely manner (as a result of unexpected increases in orders, for example) could result in losses of sales, exposure to contractual penalties, costs or expenses, as well as damage to our reputation in the marketplace.
Our inability to manage growth effectively could have a material adverse effect on our business, financial condition and results of operations.
The continued growth of our RFID and Mobile Solutions segment depends on our ability to expand sales abroad.
In 2011, our RFID and Mobile Solutions revenues that were generated from sales outside of Israel amounted to $175,000 or 1.0% of the entire RFID and Mobile Solutions revenues, which represented a decrease of approximately $100,000 from fiscal 2010. Due to limitations in the size of the Israeli RFID and Mobile solutions markets, continued growth of this segment depends on our ability to increase our sales abroad. There can be no assurance that we will be able to maintain and increase our revenues from these markets.
- 7 -
We do not have collateral or credit insurance for all of our customers’ debt, and our allowance for bad debts may increase.
Our customers’ debt is derived from sales to customers located primarily in Israel and in the Far East. We do not have any collateral and we have limited credit insurance in respect of our customers' debt. The balance of allowance for bad debt as of December 31, 2011 amounted to $115,000, which was determined by the management to be sufficient. In face of a global economic slowdown or if a local or global recession reoccurs, we may be required to record additional and significant allowances for bad debts.
Certain customers of our Supply Chain Division may cancel purchase orders they placed before the delivery.
Supply chain programs for the sale of electronic components , including the programs offered by our Supply Chain Division, are designed to accommodate the preference of customers to work with a limited number of suppliers that are able to provide a wide range of electronic components under one order. In the event we are not able to provide all of the components required by a customer, they, could elect to terminate the entire order before its delivery. In addition, certain of our individual product orders provide a right of termination prior to delivery.
In the event substantial orders are so cancelled, there is no assurance that we will be able to sell the pre-purchased inventory at a profit, or at all. This could result in excess and obsolete inventory and could have a material adverse effect on our results of operations.
The electronic components provided by our Supply Chain Division need to meet certain industry standards and for some customers we need to be the manufacturers’ authorized distributors.
The main business of our Supply chain division is the provision of electronic components to the aerospace and defense industry. These components need to be in compliance with Aviation Standard number 9120, which was adopted by the International Aerospace Quality Group. Non compliance with these standards could limit our sales.
In addition, in face of an increased number of refurbished or non-original components offered in the marketplace, certain customers have begun to insist on purchasing components only directly from authorized distributors of the manufacturers. This could impair our ability to sell components of manufacturers for which we do not serve as authorized dealers and have a substantial adverse effect on our business.
The Supply Chain division engages in a number of business activities governed by U.S. Government Laws and Regulations, which if violated, could subject the Company to civil or criminal fines and penalties.
The Supply Chain division engages in a number of business activities governed by U.S. Government procurement laws and regulations which change frequently, including regulations relating to import-export control and technology transfer restrictions. If we or our sales representatives fail to comply with these laws and regulations, we could be subject to administrative, civil, or criminal liabilities that could have a material adverse effect on our business and results of operations.
- 8 -
We rely on certain key suppliers
.
Most of our sales rely on products of certain key suppliers, which we represent. 26% of our first quarter of 2012 Supply Chain Division segment purchases were sourced from five key suppliers and 52% of our first quarter of 2012 RFID and Mobile Solutions segment purchases were sourced from five key suppliers. In the year 2011, 24% of our Supply Chain Division segment purchases were sourced from five key suppliers and 56% of our RFID and Mobile Solutions segment purchases were sourced from five key suppliers.
In the event that any of our key suppliers becomes unable to fulfill our requirements in a timely manner or if we cease our business relationship with these suppliers, we may experience an interruption in delivery and a decrease in our business until an alternative source of supply can be obtained.
Future changes in industry standards may have an adverse effect on our business.
New industry standards in the aviation and defense industry could cause a portion of our Supply Chain Division segment’s inventory to become obsolete and unmarketable which would adversely affect our results of operations.
If revenue levels for any quarter fall below our expectations, our results of operations will be adversely affected.
Our revenues in any quarter are substantially dependent on orders received and delivered in that quarter. We base our decisions regarding our operating expenses on anticipated revenue trends, and our expenses levels are relatively fixed, or require some time for adjustment. As a result, revenue levels below our expectations will adversely affect our results of operations.
The rate of inflation in Israel may negatively impact our costs if it exceeds the rate of devaluation of the NIS against the U.S. dollar. Similarly, the U.S. dollar cost of our operations in Israel will increase to the extent increases in the rate of inflation in Israel are not offset by a devaluation of the NIS in relation to the U.S. dollar.
A substantial amount of our revenues is denominated in U.S. dollars (“U.S. dollars” or “dollars") or is U.S. dollar-linked, but we incur a significant portion of our expenses, principally salaries and related personnel expenses in Israel and rent for our facilities in Israel, in NIS. As a result, we are exposed to the risk that the rate of inflation in Israel will exceed the rate of devaluation of the NIS in relation to the U.S. dollar or that the timing of this devaluation lags behind inflation in Israel. In that event, the U.S. dollar cost of our operations in Israel will increase and our U.S. dollar-measured results of operations will be adversely affected.
Similarly, we are exposed to the risk that the NIS, after adjustment for inflation in Israel, will appreciate in relation to the U.S. dollar. In that event, the dollar-measured cost of our operations in Israel will increase and our dollar-measured results of operations will be adversely affected. In 2009 and 2010, the NIS appreciated by approximately 0.7% and 6.0%, respectively, against the U.S. dollar and in 2011 the NIS devaluated by approximately 7.7% against the U.S. dollar. In 2009, 2010 and 2011, the annual inflation rate in Israel was approximately 3.9%, 2.7% and 2.17%, respectively, and therefore the U.S. dollar cost of our Israeli operations in 2009 and 2010 has increased and in 2011 have decreased. We cannot predict whether in the future the NIS will appreciate against the U.S. dollar or vice versa. Any increase in the rate of inflation in Israel, unless the increase is offset on a timely basis by a devaluation of the NIS in relation to the U.S. dollar, will increase our labor and other costs, which will increase the U.S. dollar cost of our operations in Israel and harm our results of operations (see “Item 5A. Results of Operation - Impact of Inflation and Currency Fluctuations.”)
- 9 -
If we are unsuccessful in developing and introducing new products, we may be unable to expand our business.
The market for some of our products is characterized by rapidly changing technology and evolving industry standards. The introduction of products embodying new technology and the emergence of new industry standards can render existing products obsolete and unmarketable and can exert price pressures on existing products.
Our ability to anticipate changes in technology and industry standards and successfully develop and introduce new and enhanced products as well as additional applications for existing products, in each case on a timely basis, will be critical in our ability to grow and remain competitive. Although these products are related to, and even incorporate our existing products, there can be no assurance that we will be able to successfully develop and market any such new products. If we are unable, for technological or other reasons, to develop products that are competitive in technology and price and responsive to customer needs, our business will be materially adversely affected.
We have significant sales worldwide and could encounter problems if conditions change in the places where we market our products.
We have sold and intend to continue to sell our products in North and South America, Europe, China and Asia Pacific.
A number of risks are inherent in engaging in international transactions, including:
|
|
·
|
possible problems in collecting receivables;
|
|
|
·
|
imposition of governmental controls, or export license requirements;
|
|
|
·
|
political and economic instability in foreign companies;
|
|
|
·
|
trade restrictions or changes in tariffs being imposed; and
|
|
|
·
|
laws and legal issues concerning foreign countries.
|
If we should encounter such difficulties in conducting our international operations, it may adversely affect our business condition and results of operations.
We may be obligated to indemnify our directors and officers
.
The Company has agreements with its directors and senior officers which provide, subject to Israeli law, indemnification by the Company of directors and senior officers for: (a) monetary liability imposed upon them in favor of a third party by a judgment, including a settlement or an arbitral award confirmed by the court, as a result of an act or omission of such person in its capacity as a director or officer of the Company, (b) reasonable litigation expenses, including attorney’s fees, incurred by them pursuant to an investigation or a proceeding commenced against them by a competent authority if it was terminated without an indictment and without having a monetary charge imposed on them in exchange for a criminal procedure (as such terms are defined in the Israeli Companies Law 1999 – 5759 (the “Israeli Companies Law”)), or that was terminated without an indictment but with a monetary charge imposed on them in exchange for a criminal procedure in a crime that does not require proof of criminal intent, or in connection with a financial sanction, as a result of an act or omission of such person in its capacity as a director or officer of the Company, (c) reasonable litigation expenses, including attorney’s fees, incurred by such a director or officer or imposed on him by a court, in a proceeding brought against him by or on behalf of the Company or by a third party, or in a criminal action in which he was acquitted, or in a criminal action which does not require criminal intent in which he was convicted, in each case relating to acts or omissions of such person in its capacity as a director or officer of the Company, (d) expenses, including reasonable litigation expenses and legal fees, incurred by such a director or officer as a result of a proceeding instituted against him in relation to (A) infringements that may result in imposition of financial sanction pursuant to the provisions of Chapter H'3 under the Israeli Securities Law or (B) administrative infringements pursuant to the provisions of Chapter H'4 under the Israeli Securities Law or (C) infringements pursuant to the provisions of Chapter I'1 under the Israeli Securities Law; and (e) payments to an injured party of infringement under Section 52ND(a)(1)(a) of the Israeli Securities Law. Payment pursuant to such indemnification may materially adversely affect our financial condition.
- 10 -
The measures we take in order to protect our intellectual property may not be effective or sufficient.
Our success is dependent upon our proprietary rights and technology. We currently rely on a combination of trade secrets, copyright and trademark law, together with non-disclosure and invention assignment agreements, to establish and protect the proprietary rights and technology used in our products. We generally enter into confidentiality agreements with our employees, consultants, customers and potential customers and limit the access to and the distribution of our proprietary information. Despite these precautions, it may be possible for a third party to copy or otherwise obtain and use our technology without authorization, or to develop similar technology independently. We do not believe that our products and proprietary rights infringe upon the proprietary rights of others. However, there can be no assurance that any other party will not argue otherwise. The cost of responding and adequately protecting ourselves against any such assertion may be material, whether or not the assertion is valid. Further, the laws of certain countries in which we sell our products do not protect our intellectual property rights to the same extent as do the laws of the United States. Substantial unauthorized use of our products could have a material adverse effect on our business. We cannot make assurances that our means of protecting our proprietary rights will be adequate or that our competitors will not independently develop similar technology. Additionally, there are risks that arise from the use of intranet networks and the Internet. Although we utilize firewalls and protection software, we cannot be sure that our proprietary information is secured against penetration. Such penetration, if occurs, could have an adverse effect on our business.
There can be no assurance that we will not be classified as a passive foreign investment company (a “PFIC”).
Based upon our current and projected income, assets and activities, we do not believe that at this time BOS is a passive foreign investment company for U.S. federal income tax purposes, but there can be no assurance that we will not be classified as such in the future. Such classification may have grave tax consequences for U.S. shareholders. One method of avoiding such tax consequences is by making a “qualified electing fund” election for the first taxable year in which the Company is a PFIC. However, such an election is conditioned upon our furnishing U.S. shareholders annually with certain tax information. We do not presently prepare or provide such information, and such information may not be available to U.S. shareholders if we are subsequently determined to be a PFIC. You are advised to consult with your own tax advisor regarding the particular tax consequences related to the ownership and disposition of our ordinary shares under your own particular factual circumstances.
- 11 -
Risks related to our ordinary shares:
Our share price has been and may continue to be volatile, which could result in substantial losses for individual shareholders.
The market price of our ordinary shares has been and may continue to be highly volatile and subject to wide fluctuations. From January 2011 through March 2012, the daily closing price of our ordinary shares in NASDAQ has ranged from $0.68 to $3.52 per share. We believe that these fluctuations have been in response to a number of factors including the following, some of which are beyond our control:
|
|
·
|
variations between actual results and projections;
|
|
|
·
|
the liquidation of Summit and Lynk;
|
|
|
·
|
the limited trading volume in our stock;
|
|
|
·
|
increase in our bank debts;
|
|
|
·
|
sales of securities in private placements.
|
In addition, the stock market in general, and stocks of technology companies in particular, have from time to time experienced extreme price and volume fluctuations. This volatility is often unrelated or disproportionate to the operating performance of these companies. These broad market fluctuations may adversely affect the market price of our ordinary shares, regardless of our actual operating performance.
The Company’s shares may be delisted from the NASDAQ Capital Market if it does not meet NASDAQ’s continued listing requirements.
Over the years, the Company has received several notices from the NASDAQ Stock Market advising it of non-compliance of its shares for continued listing on this market.
Most recently, on January 17, 2012, the Company received a notice from the Listing Qualifications Department of Nasdaq advising us that the Company has failed to comply with Nasdaq’s requirement that listed securities maintain a minimum bid price of $1.00 per share as set forth in Nasdaq Listing Rules.
The Company has until July 16, 2012, to regain compliance with the $1.00 minimum bid price requirement. If at any time during this 180 days' period, the closing bid price of the Company’s security is at least $1 for a minimum of ten consecutive business days, the Company will regain compliance.
In the event that we do not regain compliance, the Company may be eligible for additional 180 calendar days. To qualify, the Company will be required to meet the continued listing requirement for market value of publicly held shares and all other initial listing standards for The Nasdaq Capital Market, with the exception of the bid price requirement, and will need to provide written notice of its intention to cure the deficiency during the second compliance period.
- 12 -
There can be no assurance that the Company will continue to qualify for listing on the Nasdaq Capital Market. If the Company’s ordinary shares are delisted from the Nasdaq Capital Market, trading in its ordinary shares could be conducted on an electronic bulletin board such as the OTC Bulletin Board. In addition, if the Company’s ordinary shares were delisted from the Nasdaq Capital Market, it would be subject to the so-called penny stock rules that impose restrictive sales practice requirements on broker-dealers who sell those securities. Consequently, de-listing, if it occurred, could affect the ability of the shareholders to sell their ordinary shares in the secondary market. The restrictions applicable to shares that are de-listed, as well as the lack of liquidity for shares that are traded on an electronic bulletin board, may adversely affect the market price of such shares.
Risks related to our location in Israel
:
Political, economic, and security conditions in Israel affect our operations and may limit our ability to produce and sell our products or provide our services.
We are incorporated under the laws of the State of Israel, where we also maintain our headquarters and our principal research and development and sales and marketing facilities. Since the establishment of the State of Israel in 1948, a number of armed conflicts have occurred between Israel and its Arab neighbors. During the winter of 2008, Israel was engaged in an armed conflict with Hamas, a militia group and political party operating in the Gaza Strip, and during the summer of 2006, Israel was engaged in an armed conflict with Hezbollah, a Lebanese Islamist Shiite militia group and political party. Since February 2011, Egypt has experienced political turbulence, following the resignation of Hosni Mubarak as president, including protests throughout Egypt, and the appointment of a military regime in his stead followed by the election to the Egyptian parliament of certain political parties which advocate breaking ties with Israel. This development may damage the current peaceful and diplomatic relations between Israel and Egypt.
Similar civil unrest and political turbulence has occurred in other countries in the region and is affecting the political stability of those countries. Syria, which borders Israel, has experienced months of violence and some have expressed concern that the unrest could spill into Israel or lead to incidents on what has been a relatively quiet border in recent years. This instability may lead to deterioration of the political and economic relationships that exist between the State of Israel and some of these countries.
In addition, Iran has threatened to attack Israel and is widely believed to be developing nuclear weapons. Iran is also believed to have a strong influence among extremist groups in the region, such as Hamas in Gaza and Hezbollah in Lebanon. The environment may potentially escalate in the future to more violent events which may affect Israel and the Company. These types of situations, including conflicts which involved missile strikes against civilian targets in various parts of Israel, had in the past negatively affected business conditions in Israel. Any hostilities involving Israel or the interruption or curtailment of trade between Israel and its present trading partners could have a material adverse effect on our business, operating results and financial condition, and could make it more difficult for us to raise capital.
- 13 -
Ongoing and revived hostilities and the attempts to resolve the conflict between Israel and its Arab neighbors often results in political instability that affects the Israeli capital markets and can cause volatility in interest rates, exchange rates and stock market quotes. The political and security situation in Israel may result in parties with whom we have contracts claiming that they are not obligated to perform their commitments under those agreements pursuant to force majeure provisions. These or other Israeli political or economic factors could harm our operations and product development and cause our sales to decrease.
Furthermore, several countries, principally those in the Middle East, still restrict business with Israel and Israeli companies.
A number of our key personnel in Israel have standing obligations to perform periodic reserve duty in the Israel Defense Forces and are subject to be called for active military duty at any time. If our key personnel are absent from our business for a significant period of time, we may experience disruptions in our business that could affect the development, sales or technical support of our products. As a result, we might not be able to compete in the market and our results of operations could be harmed.
The anti-takeover effects of Israeli laws may delay or deter a change of control of the Company.
Provisions of Israeli law may delay, prevent or make undesirable a merger or an acquisition of all or a significant portion of our shares or assets. Israeli corporate law regulates acquisitions of shares through tender offers and mergers, requires special approvals for transactions involving significant shareholders and regulates other matters that may be relevant to these types of transactions. These provisions of Israeli law could have the effect of delaying or preventing a change in control and may make it more difficult for a third party to acquire us, even if doing so would be beneficial to our shareholders. These provisions may limit the price that investors may be willing to pay in the future for our ordinary shares. Furthermore, Israeli tax considerations may make potential transactions undesirable to us or to some of our shareholders.
These laws may have the effect of delaying or deterring a change in control of the Company, thereby limiting the opportunity for shareholders to receive a premium for their shares and possibly affecting the price that some investors are willing to pay for the Company’s securities.
All of our directors and officers are non-U.S. residents and enforceability of civil liabilities against them is uncertain.
All of our directors and officers reside outside of the United States. Service of process upon them may be difficult to effect within the United States. Furthermore, because the majority of our assets are located in Israel, any judgment obtained in the United States against us or any of our directors and non-U.S. officers may not be collectible within the United States.
- 14 -
Your rights and responsibilities as our shareholder will be governed by Israeli law, which differ in some respects from the rights and responsibilities of shareholders of United States corporations.
Since we are incorporated under Israeli law, the rights and responsibilities of our shareholders are governed by our articles of association and Israeli law. These rights and responsibilities differ in some respects from the rights and responsibilities of shareholders in United States-based corporations. In particular, a shareholder of an Israeli company has a duty to act in good faith towards the company and other shareholders and to refrain from abusing its power in the company, including, among other things, in voting at the general meeting of shareholders on certain matters, such as an amendment to the company’s articles of association, an increase of the company’s authorized share capital, a merger and approval of related party transactions that require shareholder approval. In addition, a shareholder who knows that it possesses the power to determine the outcome of a shareholders’ vote or to appoint or prevent the appointment of a director or executive officer in the company has a duty of fairness towards the company. These provisions may be interpreted to impose additional obligations and liabilities on our shareholders that are not typically imposed on shareholders of U.S. corporations.
As a foreign private issuer whose shares are listed on The Nasdaq Capital Market, we may in the future elect to follow certain home country corporate governance practices instead of certain Nasdaq requirements.
We are a foreign private issuer as such term is defined under U.S. federal securities laws. As a foreign private issuer, we may elect to follow certain home country corporate governance practices instead of certain requirements of the Marketplace Rules of The Nasdaq Capital Market, or the Nasdaq Marketplace Rules. We may in the future elect to follow Israeli corporate governance practices with regard to, among other things, the composition of our board of directors, compensation of officers, director nomination procedures and quorum requirements at shareholders’ meetings. In addition, we may elect to follow Israeli corporate governance practices instead of the Nasdaq requirements to obtain shareholder approval for certain dilutive events (such as for the establishment or amendment of certain equity-based compensation plans, issuances that will result in a change of control of the company, certain transactions other than a public offering involving issuances of a 20% or more interest in the company and certain acquisitions of the stock or assets of another company). Accordingly, our shareholders may not be afforded the same protection as provided under Nasdaq’s corporate governance rules. Following our home country governance practices as opposed to the requirements that would otherwise apply to a U.S. company listed on The Nasdaq Capital Market may provide less protection than is accorded to investors of domestic issuers.
In addition, as a foreign private issuer, we are exempt from the rules and regulations under the United States Securities Exchange Act of 1934, as amended, or the Exchange Act, related to the furnishing and content of proxy statements, and our officers, directors, and principal shareholders are exempt from the reporting and short-swing profit recovery provisions contained in Section 16 of the Exchange Act. In addition, we are not required under the Exchange Act to file annual, quarterly and current reports and financial statements with the Securities and Exchange Commission as frequently or as promptly as domestic companies whose securities are registered under the Exchange Act.
- 15 -
If we were to lose our foreign private issuer status under U.S. federal securities laws, we would incur additional expenses associated with compliance with the U.S. securities laws applicable to U.S. domestic issuers.
As a foreign private issuer, we are not required to comply with all of the periodic disclosure and current reporting requirements applicable to U.S. domestic issuers, as explained above. The regulatory and compliance costs to us under U.S. securities laws, if we are required to comply with the reporting requirements applicable to a U.S. domestic issuer, may be significantly higher than the cost we currently incur as a foreign private issuer.
4A. History and Development of the Company
We were incorporated in Israel in 1990 and are subject to the Israeli Companies Law. Our executive offices and engineering, development, testing, shipping and service operations are located in Israel. Our address in Israel is 20 Freiman Street, Rishon LeZion, 75100, Israel.
Our address in the United States is B.O.S Better Online Solutions Ltd. c/o Ruby-tech, Inc. 147-20 184th St., Jamaica NY 11413, USA.
Our telephone number is 972-3-954-2000 and our website address is
www.boscom.com
. Our subsidiaries’ websites are: Odem -
www.odem.co.il
; and Dimex –
www.dimex.co.il
.
The information contained on, or linked from, our websites is not a part of this report.
We operate our business through two segments:
|
|
·
|
Supply Chain Solutions – conducted through our wholly owned subsidiary, Odem. Our Supply Chain Solutions business offers a wide range of electronic components to customers in the aviation, aerospace and high technology industry that prefer to consolidate their component acquisitions through a supplier that is able to provide a comprehensive solution to their components-supply needs.
|
|
|
·
|
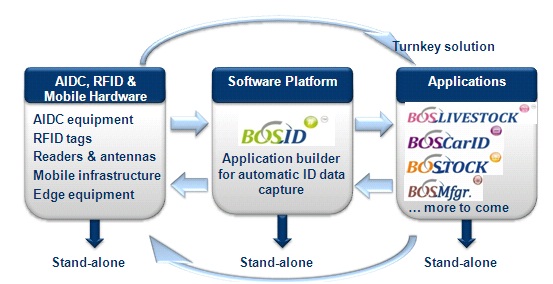
RFID and Mobile Solutions – conducted through our wholly owned subsidiary, Dimex. Our RFID and Mobile Solutions offerings form a comprehensive turn-key solution for Automatic Identification and Data Collection, combining mobile infrastructure of manufacturers that we represent, middleware software and a software application.
|
In March 2008, Dimex and its subsidiary Dimex Hagalil Projects (2008) Ltd. (“Dimex Hagalil 2008”), purchased the assets and activities of Dimex Systems, which was an integrator of AIDC (Automatic Identification and Data Collection) solutions based on RFID and barcode technology. The consideration was NIS 44.6 million (approximately $12.4 million). The consideration was comprised of cash, payable over a 24-month period and of 100,045 BOS shares (equal to approximately 4.4% of the then outstanding shares of BOS).
- 16 -
In March 2009, the Company entered into an amendment to the 2008 Dimex Systems Asset Purchase Agreement that revised the payment schedule of the approximately NIS 10 million payable in three semi-annual installments through June 2010. The amendment provided for a NIS 3.5 million payment in March 2009, NIS 4 million to be paid in 6 equal monthly installments each, starting on January 15, 2010, and the remaining approximately NIS 2.5 million was converted into the same type of convertible debentures subsequently issued by the Company in July 2009.
In August 2009, the Company closed a $2.4 million Convertible Loan Financing with several lenders including Catalyst Private Equity Partners (Israel) II L.P., Telegraph Hill Capital Fund I, LLC, certain existing shareholders and members of its management (the "Lenders"). The financing consisted of loans with a term of three years that bear interest at a rate equal to 8% per annum, compounded annually. The Company was to repay the loan principal amount and the accrued interest in one payment at the end of the term, unless converted earlier into ordinary shares at the discretion of the lender. The loan conversion rate is $3.25 per ordinary share. The Company granted the lenders warrants to purchase 100% of the number of ordinary shares into which the loan is convertible. The warrants are exercisable, in whole or in part, from 18 months to 36 months from grant, at an exercise price per ordinary share of $2.75. In addition, the lenders received certain registration rights. A total of $675,000 of the loan was extended to the Company by conversion into the debt financing of a payment otherwise due to Dimex Systems by April 2010, pursuant to the Asset Purchase Agreement the Company had entered into with Dimex Systems.
On February 4, 2010, the Company entered into an additional amendment to the Dimex Systems Asset Purchase Agreement, further revising the schedule of remaining payments in the amount of NIS 4 million, to Dimex Systems. The amendment provided for payment of:
(a) NIS 300,000 in February 2010 and NIS 3.1 million plus 8% interest per annum, to be paid in monthly installments commencing July 2010 through December 2013; and
(b)NIS 600,000 were converted into the same long-term convertible debentures, into which NIS 2.5 million were previously converted.
In addition, the Company issued to Dimex Systems a warrant to purchase 69,096 ordinary shares at an exercise price of $3.25 per ordinary shares during the first 18 months commencing August 3, 2011 and $4.00 per ordinary share thereafter.
In December 2011, the Company’s shareholders approved and the Company effected amendments to the terms of the Convertible Loan Financing agreements (the "Conversion Amendments”). The Conversion Amendments provided that approximately $2.5 million of the outstanding convertible debt (consisting of $2,093,000 principal and $430,000 accrued interest) was converted into 1,681,965 ordinary shares (at a reduced conversion price of $1.5 per ordinary share, instead of the original $3.25 price). In addition, the warrants to purchase 643,984 shares that had been issued to the Lenders were extended by two years until July 2014 and February 2015, with no change to the exercise price of $2.75 per ordinary share.
The balance of the convertible loan of $501,000 that was extended by Dimex Systems remained outstanding, and will bear a reduced interest rate of 4%, instead of the original rate of 8%, and will no longer be convertible. This amount will be repaid to Dimex Sytstems in 24 equal monthly installments commencing January 10, 2014.
- 17 -
For further details on the aforementioned loan financing. See “Item 5B. Liquidity and Capital Resources” and Note 13 to our Consolidated Financial Statements s attached to this annual report.
In addition, we have an interest in two companies:
(a) Surf Communication Solutions Ltd. (“Surf”), in which, as of December 31, 2011, we held 6.2% of the issued and outstanding share capital. Established in 1996, Surf is an Israeli privately held company. Surf develops a suite of hardware and software products that drives a wide variety of applications whose common goal is high-capacity distribution of voice and video. As of December 31, 2011, the Company's investment in Surf (a cost method investee) was measured at a fair value of $68,000
(b)
New World Brands Inc. (PINK:NWBD) (“New World” or “NWB”), a U.S. public corporation.
On February 26, 2010, the Company sold all of its holdings in NWB to P&S Spirit LLC. and recorded a capital loss of $7,000. The Company sold 61,441,827 shares of common stock of NWB and 1,430,178 warrants to purchase common stock of NWB at an exercise price of $ 0.2098 per share expiring on December 31, 2010. The consideration for the NWB shares and warrants was $ 300,000 of which $ 150,000 was paid in March 2010 and the remaining $ 150,000 plus annual interest of 4% were to be paid in twelve monthly installments commencing March 2011. The shares and warrants were delivered to an escrow agent to be released to the buyer upon full payment of the remaining debt. In May 2011, the buyer notified the Company that it will not pay the remaining debt, and the shares and warrants were released back to the Company. As of December 31, 2011, the Company's investment in NWB was fully impaired. As a result, the Company recognized a capital loss of $156,000.
Following the Company's request, on May 12, 2009 the Company's ordinary shares were delisted from trading on the Tel Aviv Stock Exchange (the “TASE”). The delisting of the ordinary shares from the TASE did not affect the continued listing of the ordinary shares on the NASDAQ Capital Market under the symbol BOSC. As a result of the delisting of the Company’s ordinary shares from the TASE, the Company is no longer subject to reporting requirements in Israel, under the Israeli Securities Law.
In December 2009, Dimex and its former U.S. distributor, 10ZIG Technologies Inc., a Nevada corporation, (formerly known as BOSaNOVA Inc.) (“10ZIG”) entered into a distribution agreement for a period of ten years ending in December 2019. Under the agreement, 10ZIG shall become an exclusive distributor of the Company’s BOSaNOVA product, on a world wide basis. 10ZIG agreed to pay to the Company a total amount of $310,000 in installments through the end of 2011 in consideration for the BOSaNOVA product licensing. Concurrently with the distribution agreement, the parties executed a Settlement & Release Agreement, pursuant to which the claims brought by Dimex, Summit and 10ZIG in the U.S. District Court of Arizona were withdrawn.
- 18 -
On November 23, 2010 the Company's two U.S. subsidiaries that are part of its Supply Chain division, Lynk and its subsidiary Summit, have filed with the US Bankruptcy Court a Chapter 7 petition. In March 2011, the Lynk case was closed. The proceedings in respect of Summit are continuing but they have no impact on the financial statements of the Company. The results of operations, including revenues, cost of revenues, operating expenses, and other income and expenses related to the prior periods of the discontinued operations, have been reclassified in the accompanying statements of operations as discontinued operations.
4B. Business Overview
BOS’s vision is to be a worldwide provider of turnkey AIDC (Automatic ID Data Capture) mobility solutions, focusing on RFID technologies, and a leading distributor of electronic components for the civil aircraft industry and for the defense industry.
The Company’s products and services assist customers worldwide in improving the efficiency of their enterprise logistics, enhancing and automating their data collection processes, improving asset tracking, and managing real-time business data.
BOS manages its business in two reportable divisions: RFID and Mobile Solutions (through its subsidiary Dimex), and Supply Chain Solutions (through its subsidiary Odem).
The Company’s customers represent a cross-section of multinational industry leaders, from the avionics, defense, retail, government, utilities, and livestock markets around the world. Our Supply Chain division customers include, among others, Bombardier, Elbit system, Refael and Israeli Aircraft Industry. Our RFID and Mobile division customers include, among others, IKEA, Blue Square, Shufersal and Teva,.
In its Supply Chain division, the Company has expanded its penetration to global, top-tier aircraft manufacturers (such as Bombardier and Indra) and has begun expansion to international markets (e.g., India, and China).
In its RFID and Mobile division, the Company continues to invest in research and development in order to further enhance its software platform, BOS ID and is working to establish sales channels for BOS ID through partnerships with systems integrators in Europe.
In February 2012, the Company successfully completed a traceability project in Spain at Barcelonesa de Metales, S.A. (BAMESA) corporation. BAMESA is a steel service center organization for automotive, home appliances and metal engineering industries, among others. The project included tagging, tracking and managing inventory for metal pallets, inside and outside of the warehouse. The project was executed in cooperation with the Supply Chain Excellence Centre of Everis, a multi-national Spanish consulting company.
In 2011, the Company was recognized with the Entrepreneurial Company of the Year Award in the field of Automatic Identification Data Capture (AIDC) for the Europe, Middle East and Africa region, by Frost & Sullivan, a leading global research organization.
- 19 -
BOS continues to execute a growth strategy in order to strengthen its product offerings and distribution channels worldwide.
BOS Product Offerings
RFID and Mobile Solutions
RFID (Radio Frequency Identification) refers to the use of an automatic identification method to remotely retrieve data using devices called RFID tags. An RFID tag is an object such as a pendant, bead, nail, label, micro wire or fiber, which can be applied to or incorporated into a product, animal, or person for the purpose of identification using radio waves.
BOS' RFID and Mobile Solutions division offers turnkey solutions as well as stand-alone products, including best-of-breed RFID and Automatic Identification Data Capture (AIDC) hardware and communications equipment, software platform, and industry-specific software applications. Customers can opt for a full solution comprised of hardware, middleware and software, or for any item as a stand-alone product or service.
Our RFID and mobile division represents leading global manufacturers of AIDC equipment based on RFID and barcode technology. Among the manufacturers we represent are Motorola Inc., Intermec Technologies and Corporation, Zebra Technologies Corp., Texas Instruments, Alien Technology, Cisco Systems Inc., M3, DLog GmbH, Microscan Systems Inc., Seagull Scientific Inc., Feig and HID Global.
- 20 -
Specifically, our RFID and Mobile Solutions division offers the following products and services:
|
|
·
|
Hardware
, including:
|
|
|
o
|
Thermal and barcode printers
|
|
|
o
|
RFID and barcode scanners and readers
|
|
|
o
|
Wireless, mobile and forklift terminals
|
|
|
o
|
Wireless infrastructure
|
|
|
o
|
Active and passive RFID tags (HF & UHF)
|
|
|
o
|
Consumables (ribbons, labels, tags)
|
|
|
·
|
BOS ID Software Platform
:
|
|
|
o
|
BOS ID
is a software platform for systems integrators to assemble applications, without programming, for transfer to any AIDC client such as a handheld rugged terminal, barcode reader or mobile PC.
|
|
|
·
|
Applications
:
|
Using its proprietary BOS ID, BOS has developed the following set of vertical applications:
|
|
o
|
BOS LIVESTOCK
is a software application that enables livestock operations to manage, track, support and plan all day-to- day tasks.
|
|
|
o
|
BOS CarID
is a turnkey solution to identify and track vehicles for a variety of transportation-related settings, such as auto vehicle testing centers, public and company parking lots, industrial factories, and automobile dealers, importers, or distributors. By using RFID tags on the vehicles, BOS CarID enables companies, government transportation agencies, and law enforcement officials in the transportation field to effectively manage, track, support and plan all day-to- day vehicle-related activities.
|
|
|
o
|
BOS STOCK
is an optimized data collection solution for logistics management in stores and warehouses. The solution may be based on RFID tags or bar codes, and is intended to provide customers with greater visibility into a retailer’s stock management and warehouse/logistics operations. BOS Stock enables storeroom managers to receive advanced delivery notifications and system alerts for delivery discrepancies, and gives them the ability to locate inventory in the stockroom. BOS Stock provides inventory managers with a direct communication link to the sales floor, and assists in minimizing inventory loss or theft. BOS Stock also enables sales floor representatives to instantly check on the availability of a product, offer alternatives if the product is out of stock, and provide the customer with up-to-date product information.
|
|
|
o
|
BOS Mfgr
. is a production line tracking solution whereby manufacturing companies can track the progress and status of items on a production line. The solution may be based on RFID tags or bar codes, and is intended to provide greater visibility into a customer’s manufacturing process, as well as traceability for critical parts. With BOS Mfgr., items entering the manufacturing plant are labeled with RFID tags or bar codes, and fixed readers that are located along the production line, record the product’s progress through the production line stations. Mobile readers may also be used to collect data from the parts labeled with RFID tags or bar codes.
|
- 21 -
BOS' RFID and Mobile Solutions division provides also complementary services such as:
|
|
·
|
Integration Services
, that include site surveys, business requirements analyses, system design and configuration, and implementation, testing and deployment.
|
|
|
·
|
Service lab,
that
lab offers maintenance and repair services to data collection equipment, as well as warehouse and on-site service plans.
|
In 2011, 39% of our revenues were attributed to sales generated from our RFID and Mobile Solutions division.
Supply Chain Solutions
Our Supply Chain Solutions division provides electronic components, networking and telecommunications equipment, and components consolidation services to the aerospace, defense, medical and telecommunications industries and enterprise customers worldwide.
These services include:
|
|
o
|
Representation of global manufacturers and distribution of their electronics components, communications and networking products (see below);
|
|
|
o
|
Kitting (electronics components consolidation) services for aerospace, defense, medical, and telecommunications industries and enterprise customers;
|
|
|
o
|
Inventory and quality control management of components entering production lines; and
|
|
|
o
|
Warehouse management for ongoing projects, including all warehouse functions such as storage, operations and inventory management.
|
Our Supply Chain division represents on a non-exclusive basis, among others, Honeywell International Inc., Holtek Semiconductor Inc., Sensata Technologies Inc., Inova, IPD, Adam Technologies Inc., Wintek Corporation, Positronic Industries, Tyco Electronics, , Bluegiga Technologies, Switchcraft Inc., Silicon Sensor, API Group Inc., Winchester, Wintek, Fema, SGC, Stroco and Jamicon Corporation USA. The electronic components from these suppliers fall into four main categories:
1) Active Components - semiconductors, transistors, detectors, diodes, integrated circuits, hybrid modems, cellular components, communication ICs, memories, displays and LEDS;
2) Passive Components - capacitors, thermistors, varistors, oscillators, crystals, resistors, C-DC converters, and power supplies;
3) Electro-Mechanical Components - relays, connectors, circuit breakers, filters, transformers, plugs, thermostats and switches; and
4) Microwave components such as repeaters and filters.
- 22 -
In 2011, 61% of our revenues were attributed to sales of the Supply Chain Solutions segment.
Marketing, Distribution and Sales
We market our RFID and Mobile Solutions primarily to medium and large sized corporations through a combination of direct sales, sales agents and integrators.
RFID and Mobile Solutions
We market our solutions directly to customers or through distributors and system integrators. We intend to increase our international sales force with new distributors, system integrators, sales representatives and direct salespersons who specialize in the RFID and Mobile Solutions sector.
In Europe, we are targeting system’s integrators as the main channel through which to sell our software products. As a secondary effort, we will focus on hardware vendors that may be seeking to enhance their product offerings by adding complementary products such as BOS ID.
Supply Chain Solutions
We market our Supply Chain Solutions directly to customers or through distributors. Our sales force is comprised of direct sales teams.
Seasonality
Our sales fluctuate seasonally, with the third quarter sales typically reduced by summer vacations in Europe and new years’ holidays in Israel, and the December and January sales typically reduced by the Christmas season.
The following tables set forth our revenues (in thousands of $), by major geographic areas and by divisions, for the periods indicated below:
Sales by major geographic areas:
|
2011
|
%
|
2010
|
%
|
2009
|
%
|
|||||||||||||||||||
|
America
|
1,514 | 5 | 2,596 | 9 | 1,548 | 6 | ||||||||||||||||||
|
Far East
|
3,943 | 12 | 2,228 | 7 | 998 | 4 | ||||||||||||||||||
|
Europe
|
976 | 3 | 811 | 3 | 566 | 2 | ||||||||||||||||||
|
Israel and others
|
27,001 | 80 | 24,552 | 81 | 22,355 | 88 | ||||||||||||||||||
|
Total Revenues
|
33,434 | 100 | 30,187 | 100 | 25,467 | 100 | ||||||||||||||||||
- 23 -
Sales by divisions:
|
2011
|
%
|
2010
|
%
|
2009
|
%
|
|||||||||||||||||||
|
RFID and Mobile Solutions
|
13,128 | 39 | 12,463 | 41 | 10,729 | 42 | ||||||||||||||||||
|
Supply Chain Solutions
|
21,332 | 64 | 17,724 | 59 | 14,738 | 58 | ||||||||||||||||||
|
Intercompany
|
(1,026 | ) | (3 | ) | - | - | - | - | ||||||||||||||||
|
Total Revenues
|
33,434 | 100 | 30,187 | 100 | 25,467 | 100 | ||||||||||||||||||
Intellectual Property
We currently rely on a combination of trade secrets, copyright and trademark law, together with non-disclosure agreements and technical measures, to establish and protect proprietary rights in our products.
We believe that the improvement of existing products and solutions, reliance upon trade secrets and proprietary know-how and the development of new products are generally as important as patent protection in establishing and maintaining a competitive advantage. We believe that the value of our products is dependent upon our proprietary software and hardware remaining “trade secrets” or subject to copyright protection.
Generally, we enter into non-disclosure and invention assignment agreements with our employees, partners and subcontractors. However, there can be no assurance that our proprietary technology will remain a trade secret, or that others will not develop similar technology or use such technology in products competitive with those offered by us.
While our competitive position may be affected by our inability to protect our proprietary information, we believe that because of the rapid pace of technological change in the industry, factors such as the technical expertise and the knowledge and innovative skill of our management and technical personnel, name recognition, the timeliness and quality of our support services and our ability to rapidly develop, produce, enhance and market software products may be more significant in maintaining our competitive position.
As the number of software products in the industry increases and the functionality of these products further overlaps, we believe that software programs will increasingly become subject to infringement claims. The cost of responding to any such assertion may be material, whether or not the assertion is valid.
- 24 -
Competition
RFID and Mobile Solutions
The RFID and Mobile Solutions market is subject to rapidly changing technology and evolving standards incorporated into mobile equipment, Enterprise Resource Planning systems, computer networks and host computers. As the market grows, so does the number of competitors. Some of the competitors have substantially greater financial, marketing and technological resources as well as stronger name recognition than BOS.
In Israel, our main competitors in the RFID and Mobile Solutions market are Soft Solutions Ltd., eWave Ltd., Dangot Computers Ltd., Dannet Advanced Technologies Ltd., Micronet Ltd., LogiTag Systems Ltd. and Galbital RFID Solutions Ltd. In the global market, competition to our platform products such as BOS ID primarily stems from existing modules in ERP systems, and system integrators that provide turnkey solutions that include both hardware and software such as
GlobeRanger Corp., Mobile Frame LLC, Decision Point systems Inc. OATSystems, a division of Checkpoint Systems, Inc., RF-iT Solutions GmbH and InSync Software, Inc.
The RFID market is highly fragmented and no one player has taken a significant share of the software platform market. We believe that we will be able to attract systems integrators, RFID hardware vendors and thus end-customers to our core offering BOS ID, due to the following factors:
|
|
•
|
BOS ID enables code-free creation and implementation of data collection applications and processes;
|
|
|
•
|
Our software can be used in a wide range of vertical markets;
|
|
|
•
|
BOS’ software products enable rapid implementation and centralized deployment for every RFID and AIDC project; and
|
|
|
•
|
Our software is flexible, hardware-independent and can function with any communication and networking protocol.
|
Supply Chain Solutions
We hold several representation agreements with major suppliers and manufacturers, such as Honeywell International Inc., Holtek Semiconductor Inc., Sensata Technologies, Inc., Inova, IPD, Adam Technologies, Inc., Wintek Corporation, Positronic Industries, Tyco Electronics, ,Bluegiga Technologies, Switchcraft Inc., Silicon Sensor, API Group, Inc., Jamicon Corporation USA. Most of our representation agreements are not on an exclusive basis.
Our Israeli competitors in distribution to the electronic industry include the publicly traded Telsys Ltd., Nisco Projects Ltd. and STG International Electronics (1981) Ltd., as well as Eastronics Ltd., Chayon Group Ltd. and C.M.S. Compucenter Ltd.
In the international market, our competitors are mainly Arrow Electronics International Inc., Avnet Electronics Marketing, TTI Inc., PEI-Genesis Inc., Marine Air Supply Co. Inc., Airtechnics Inc., Flame Enterprise Inc., Norstan Electronics Inc., Peerless Electronics Inc., Hansair Logistic Inc., Aviall, API Delevan, Cooper and Avio Innovative Propulsion.
- 25 -
Strategy
The Company's vision is to become
a
worldwide provider in the field of RFID and Mobile Solutions and Supply Chain Solutions for enterprise logistics and organizational processes.
The key elements of our strategy are as follows:
|
|
·
|
Continue to develop our range of RFID and Mobile Solutions to include platform software products, as well as a suite of business line applications, based on the BOS ID platform;
|
|
|
·
|
Increase our international sales force by new partnerships with distributors, system integrators, and hardware vendors specialized in RFID and Mobile Solutions in the United States and select European countries;
|
|
|
·
|
Secure several reference-able customers in Europe, potentially leveraging our position as a trusted supplier in the aerospace Supply Chain Solutions market;
|
|
|
·
|
Increase partnerships with manufacturers for our Supply Chain Solutions division.
|
Exchange Controls
See “Item 10D. Exchange Controls”.
For other government regulations affecting the Company’s business, see “Item 5A. Results of Operations - Grants and Participation”.
4C. Organizational Structure
The Company’s wholly owned subsidiaries include:
In Israel:
|
|
(1)
|
BOS-Dimex representing the RFID and Mobile Solutions division;
|
|
|
(2)
|
BOS-Odem, representing the Supply Chain Solutions division;
|
|
|
(3)
|
Dimex Hagalil Projects (2008), a wholly owned subsidiary of BOS-Dimex which has been inactive since 2009 and is in the process of liquidation; and
|
|
|
(4)
|
Quasar Telecom (2004) Ltd., which is liquidated as of February 29, 2012.
|
In the United States:
|
|
(1)
|
Ruby-Tech, a New York corporation, is a wholly owned subsidiary of Odem and a part of the Supply Chain Solutions division.
|
|
|
(2)
|
BOS Delaware Inc., a Delaware corporation, is a wholly owned subsidiary of Dimex, which ceased operation in 2002.
|
|
|
(3)
|
On November 23, 2010 the Company's two U.S. subsidiaries that are part of its Supply Chain division, Lynk and its subsidiary Summit, have filed with the US Bankruptcy Court a Chapter 7 petition. In March 2011, the Lynk case was closed.
|
- 26 -
In Europe:
Better On-Line Solutions Ltd., a U.K. subsidiary of Dimex, and its subsidiary, Better On-Line Solutions S.A.S incorporated in France. Since 2002, these subsidiaries are no longer active.
4D. Property, Plants and Equipment
Our executive offices and engineering, development, testing, shipping and service operations are located in the following facilities in Israel:
|
Location
|
Size (square meters)
|
End of lease period
|
Extension Option
|
|
Rishon Lezion*
|
2,170
|
May 31, 2012 through –
January 31, 2016
|
May 31, 2012 - July 7, 2016
|
|
Kibutz Dafna
|
578
|
On a
month-to-month
basis
|
*Includes 302 square meters in the same building rented by Odem.
Our average monthly rental fee in 2012 (up until February 29, 2012), for the year 2011 and for the year 2010 amounted to $9,000, $13,000 and $14,000, respectively.
Not Applicable.
The following management’s discussion and analysis of financial condition and results of operations should be read in conjunction with our financial statements and notes thereto. Certain matters discussed below and throughout this Annual Report are forward-looking statements that are based on our beliefs and assumptions as well as information currently available to us. Such forward-looking statements may be identified by the use of the words “anticipate”, “believe”, “estimate”, “expect”, “plan” and similar expressions. Such statements reflect our current views with respect to future events and are subject to certain risks and uncertainties. While we believe such forward-looking statements are based on reasonable assumptions, should one or more of the underlying assumptions prove incorrect, or these risks or uncertainties materialize, our actual results may differ materially from those described herein.
- 27 -
Critical accounting policies
Our discussion and analysis of our financial condition and results of operations is based on our consolidated financial statements which have been prepared in accordance with accounting principles generally accepted in the United States. The preparation of our financial statements in conformity with generally accepted accounting principles in the United States requires our management to make estimates and assumptions that affect the reported amounts of assets and liabilities and disclosure of contingent assets and liabilities at the date of the financial statements and the reported amounts of revenues and expenses during the reporting period. These amounts and disclosures could potentially be materially different under other assumptions and conditions. These are our management’s best estimates based on experience and historical data, however, actual results could differ materially from these estimates. Our significant accounting principles are presented within Note 2 to our Consolidated Financial Statements attached to this annual report. While all the accounting policies impact the financial statements, certain policies may be viewed to be critical. Management believes that the following policies are those that are most important to the portrayal of our financial condition and results of operations and for fully understanding and evaluating our reported results:
|
|
·
|
financial statements in U.S. dollars
|
|
|
·
|
inventories
|
|
|
·
|
investment in other companies
|
|
|
·
|
impairment of long-lived assets and goodwill
|
|
|
·
|
revenue recognition
|
|
|
·
|
income taxes
|
|
|
·
|
accounting for share-based compensation
|
|
a.
|
Financial statements in U.S. dollars:
|
A substantial portion of the Company's revenues is generated in U.S. dollars. In addition, most of the Company's costs are incurred in dollars. The Company's management believes that the dollar is the primary currency of the economic environment in which the Company operates. Thus, the functional and reporting currency of the Company is the dollar. Accordingly, monetary accounts maintained in currencies other than the dollar are remeasured into U.S. dollars in accordance with ASC 830,
Foreign Currency Matters
. All transactions gains and losses from the remeasurement of monetary balance sheet items are reflected in the statement of operations as financial income or expenses, as appropriate.
The financial statements of our subsidiary Dimex, whose functional currency is other than the dollar, have been translated into U.S. dollars. All balance sheet accounts have been translated using the exchange rates in effect at the balance sheet date. Statement of operations amounts have been translated using the average exchange rate for the period. The resulting translation adjustments are reported as a component of shareholders' equity in accumulated other comprehensive loss.
|
b.
|
Inventories:
|
Inventories are valued at the lower of cost or market value. Cost is determined using the moving average cost method.
Inventory write-offs and write-downs are provided to cover risks arising from slow-moving items or technological obsolescence. During 2011, 2010 and 2009, inventory write-offs of $ 443,000, $ 36,000 and $ 2.23 million respectively, have been recorded and presented in the consolidated statements of operations.
- 28 -
|
c.
|
Investment in other companies:
|
|
1.
|
Investment in NWB and QMX:
|
The Company accounts for its holdings in NWB shares as available for sale in accordance with ASC 320,
Investments - Debt And Equity Securities
("ASC 320"). Unrealized gains and losses, net of the related tax effect are included in other comprehensive loss. In January 2009, Qualmax was merged with and into NWB, and holdings in Qualmax were converted into shares of NWB.
Prior to this merger, the investment in Qualmax, which was traded on the Pink Sheets, was presented at cost according to ASC 325-20,
Cost Method Investments
("ASC 325-20") due to no trading volume in the Qualmax shares.
Management evaluates investments in other companies for evidence of other-than- temporary declines in value. The Company recognizes an impairment charge when a decline in the fair value of its marketable securities below the cost basis is presumed to be other-than-temporary. The Company considers various factors in determining whether to recognize an impairment charge, including the Company's intent and ability to hold the marketable securities for a period of time sufficient to allow for any anticipated recovery in market value, the length of time and extent to which the fair value has been less than the cost basis and the financial condition and near-term prospects of the issuers. If, after consideration of all available evidence to evaluate the realizable value of its marketable securities, impairment is determined to be other than- temporary, then an impairment loss equal to the difference between the marketable securities' carrying amount and its fair value is recognized. Accordingly, during 2011, 2010 and 2009, an impairment loss, due to other-than-temporary decline in fair value, of $ 156,000 $0 and $ 304,000 respectively, has been recorded and presented in other expenses, net in the consolidated statements of operations.
On February 26, 2010, the Company sold all of its holdings in NWB to P&S Spirit LLC and recorded a capital loss of $7. The Company sold 61,441,827 shares of common stock of NWB and 1,430,178 warrants to purchase common stock of NWB at an exercise price of $ 0.2098 per share expiring on December 31, 2010. The consideration for the shares and warrants was $ 300,000 of which $ 150,000 was paid in March 2010 and the remaining $ 150,000 plus annual interest of 4% were to be paid in twelve monthly installments commencing March 2011. The shares and warrants were delivered to an escrow agent, to be released to P&S Spirit LLC upon full payment of the remaining debt. In May 2011, the buyer notified the Company that it will not pay the remaining debt, and the shares and warrants were released back to the Company. As of December 31, 2011, the Company recognized other-than-temporary loss of $156,000 reflecting that the investment in NWB was fully impaired.
- 29 -
|
|
2.
|
Investment in Surf:
|
The Company's holding in Surf as of December 31, 2011 is 6.2% of Surf's issued and outstanding shares. The Company's investment in Surf is accounted for based on the cost accounting method. During 2011, 2010 and 2009, an impairment loss, due to other-than- temporary decline in fair value, of $ 39,000 $ 111,000 and $ 53,000 respectively, has been recorded and presented in other expenses, net in the consolidated statements of operations.
The Company's investment in Surf is reviewed for impairment whenever events or changes in circumstances indicate that the carrying amount of the investment may not be recoverable, in accordance with ASC 325-20.
|
d.
|
Impairment of Long-Lived Assets and Goodwill
|
Impairment of long-lived assets:
The Company's long-lived assets are reviewed for impairment in accordance with ASC 360-10, Accounting for the Impairment or Disposal of Long-Lived Asset, whenever events or changes in circumstances indicate that the carrying amount of an asset (or asset group) may not be recoverable. Recoverability of assets to be held and used is measured by a comparison of the carrying amount of an asset (or asset group) to the future undiscounted cash flows expected to be generated by the assets (or asset group). If such assets are considered to be impaired, the impairment to be recognized is measured by the amount by which the carrying amount of the assets exceeds their fair value of the assets. During 2011, the Company recognized an impairment loss of $555,000 related to a brand name and customer list, of which $470,000 was attributed to the Supply Chain segment and $85,000 was attributed to the RFID and Mobile solutions segment. The fair value of the brand name and customer list related intangibles was determined by the income approach method. Assumptions in the fair value assessment included: the impact of changes in economic conditions, revenue and cash flow forecasts for the remaining lives of the intangibles and the Company's weighted average cost of capital ("WACC").
During 2010 and 2009, no impairment losses were recorded.
Goodwill:
Goodwill represents excess of the costs over the net assets of businesses acquired. Under ASC 350,
Intangibles - Goodwill and Other
("ASC 350"), goodwill is not amortized but instead is tested for impairment at least annually or between annual tests in certain circumstances, and written-down when impaired.
- 30 -
Testing Methodology:
The Company performs its annual impairment analysis of goodwill as of December 31
st
of each year, or more often if there are indicators of impairment present. The provisions of ASC 350 require that a two-step impairment test be performed on goodwill at the level of the reporting units. In the first step, or Step 1, the Company compares the fair value of each reporting unit to its carrying value. If the fair value exceeds the carrying value of the net assets, goodwill is considered not impaired, and the Company is not required to perform further testing. If the carrying value of the net assets exceeds the fair value, then the Company must perform the second step, or Step 2, of the impairment test in order to determine the implied fair value of goodwill. To determine the fair value used in Step 1, the Company uses discounted cash flows. If and when the Company is required to perform a Step 2 analysis, determining the fair value of its net assets and its off-balance sheet intangibles would require it to make judgments that involve the use of significant estimates and assumptions.
The reporting units of the Company for purposes of the impairment test are: the Company's RFID and Mobile operating segments, and the Supply Chain segment, as these are the components of the business for which discrete financial information is available and the segment management regularly reviews the operating results of those components.
In order to determine the fair value used in Step 1, the Company uses discounted cash flows. If and when the Company is required to perform a Step 2 analysis, determining the fair value of its net assets and its off-balance sheet intangibles would require it to make judgments that involve the use of significant estimates and assumptions. The Company determined the fair value of each reporting unit using the Income Approach, which utilizes a discounted cash flow model, as it believes that this approach best approximates the reporting unit’s fair value at this time. Judgments and assumptions related to revenue, operating income, future short-term and long-term growth rates, weighted average cost of capital, interest, capital expenditures, cash flows, and market conditions are inherent in developing the discounted cash flow model. The material assumptions used for the Income Approach for 2011 were five years of projected net cash flows, WACC of 15% and a long-term growth rate of 3%. The Company considered historical rates and current market conditions when determining the discount and growth rates to use in its analyses. If these estimates or their related assumptions change in the future, the Company may be required to record impairment charges for its goodwill.
The Company corroborates the fair values using the Market Approach. The Company evaluates the reasonableness of the estimated fair value of its reporting units by reconciling to its market capitalization. This reconciliation allows the Company to consider market expectations in corroborating the reasonableness of the fair value of its reporting units. In addition, the Company compares its market capitalization, including an estimated control premium that an investor would need to pay for a controlling interest in the Company, to the fair value of the Company based on a third-party valuation study. The determination of a control premium requires the use of judgment and is based primarily on comparable industry and deal-size transactions, related synergies and other benefits. The Company’s reconciliation of the gap between its market capitalization and the aggregate fair value of the Company depends on various factors, some of which are qualitative and involve management judgment, including stable relatively high backlog coverage and experience in meeting operating cash flow targets.
Testing Results:
During 2011 and 2010, no impairment losses were recorded.
During 2009, impairment losses in the amount of $ 383,000 were recorded and attributed to the Supply Chain solutions reporting unit.
- 31 -
|
e.
|
Revenue recognition:
|
The Company derives its revenues from the sale of products, license fees for its products, commissions, support and services.
Revenues from product sales, related to both the Supply Chain and RFID and Mobile segments, are recognized in accordance with SAB 104, Revenue Recognition ("ASC 605") when delivery has occurred, persuasive evidence of an arrangement exists, the vendor's fee is fixed or determinable, no further obligation exists, and collectability is reasonably assured.
Most of the Company's revenues are generated from sales of its products directly to end-users. Other than pricing terms which may differ due to the volume of purchases between end-users, there are no material differences in the terms and arrangements among end-users.
Revenue from license fees, related to the RFID and Mobile solutions segment, is recognized in accordance with ASC No. 985-605, Software Revenue Recognition, when persuasive evidence of an agreement exists, delivery has occurred, no significant obligations with regard to implementation remain, the fee is fixed or determinable, and collectability is probable. The Company generally does not grant a right of return to its customers. When a right of return exists, the Company defers revenue until the right of return expires, at which time revenue is recognized provided that all other revenue recognition criteria have been met.
Revenues from maintenance and support services related to the license are recognized ratably over the period of the support contract.
Starting January 1, 2011. the Company adopted the guidance of ASU 2009-13, Multiple-Deliverable Revenue Arrangements, (amendments to FASB ASC Topic 605, Revenue Recognition) ("ASU 2009-13"). ASU 2009-13 requires entities to allocate revenue in an arrangement using estimated selling prices of the delivered goods and services based on a selling price hierarchy. The amendment eliminates the residual method of revenue allocation and requires revenue to be allocated using the relative selling price method. As such, the Company prospectively applied these provisions to all revenue arrangements entered into or materially modified after January 1, 2011. This guidance does not generally change the units of accounting for the Company’s revenue transactions. Most products and services qualify as separate units of accounting and the revenue is recognized when the applicable revenue recognition criteria are met.
The Company's revenue recognition policies provide that, when a sales arrangement contains multiple elements, the Company allocates revenue to each element based on a selling price hierarchy. The selling price for a deliverable is based on its vendor specific objective evidence ("VSOE"), if available, third party evidence ("TPE") if VSOE is not available, or estimated selling price ("ESP") if neither VSOE nor TPE is available.
Because the Company has neither VSOE nor TPE for its deliverables, the allocation of revenue has been based on the Company’s BESP. Amounts allocated to the deliverables are recognized at the time of sale provided the other conditions for revenue recognition have been met.
The Company’s process for determining its BESP considers multiple factors that may vary depending upon the unique facts and circumstances related to each deliverable. A key factor considered by the Company in developing the BESP for its products is the gross margins acceptable in the industry in which the Company operates. The Company may also consider additional factors as appropriate.
- 32 -
The adoption of the amendment to ASC 605-25 did not have a material effect on the Company's consolidated financial position or results of operations.
In addition, in cases that product arrangement is bundled with a separately priced extended warranty that fall under the scope of ASC 605- 20-25-1 through 25-6, revenues from the extended warranty are deferred and recognized ratably over the extended warranty period.
In the case of arrangements which require significant customization of the Company's RFID software to customer-specific specifications, the Company follows the guidance in ASC 605-35, ("ASC 605-35"), whereby the Company applies the completed contract method, since the Company is unable to obtain reasonable dependable estimates of the total effort required for completion. Under the completed contract method, all revenue and related costs of revenue are deferred and recognized upon completion. Provisions for estimated losses on contracts in process are recognized in the period such losses are determined.
|
f.
|
Income taxes:
|
The Company and its subsidiaries account for income taxes in accordance with ASC 740,
Income Taxes
("ASC 740"). ASC 740 prescribes the use of the liability method whereby deferred tax assets and liability account balances are determined based on the differences between financial reporting and tax bases of assets and liabilities and are measured using the enacted tax rates and laws that will be in effect when the differences are expected to reverse. The Company and its subsidiaries provide a valuation allowance, if necessary, to reduce deferred tax assets to the amounts that are more likely-than-not to be realized.
The Company implements a two-step approach to recognizing and measuring uncertain tax positions accounted for in accordance with ASC 740. The first step is to evaluate the tax position for recognition by determining if the weight of available evidence indicates it is more -likely-than-not that the position will be sustained on audit, including resolution of related appeals or litigation processes, if any. The second step is to measure the tax benefit as the largest amount which is more than 50% likely of being realized upon ultimate settlement. During the year ended December 31, 2011, the Company recorded a tax benefit of $ 261,000 relating to a decrease in uncertain tax position. During the years ended December 31, 2010, and 2009 the Company recorded $ 67,000 and $ 421,000, respectively in regard to uncertain tax position.
|
g.
|
Accounting for share-based compensation:
|
The Company accounts for equity-based compensation in accordance with ASC 718,
Stock
Compensation ("ASC 718") which requires the recognition of compensation expenses based on estimated fair values for all equity-based awards made to employees and nonemployees and directors.
ASC 718 requires companies to estimate the fair value of equity-based payment awards on the date of grant using an option pricing model. The value of the portion of the award that is ultimately expected to vest is recognized as an expense over the requisite service periods in the Company's consolidated statements of operations.
- 33 -
The Company recognizes compensation expenses for the value of its awards granted based on the straight line method over the requisite service period of each of the awards, net of estimated forfeitures. ASC 718 requires forfeitures to be estimated at the time of grant and revised, if necessary, in subsequent periods if actual forfeitures differ from those estimates. Estimated forfeitures are based on actual historical pre-vesting forfeitures. The Company considers many factors when estimating forfeitures, including employee class and historical experience.
The Company estimates the fair value of stock options granted using the Black-Scholes options pricing model. The option-pricing model requires a number of assumptions, of which the most significant are expected stock price volatility and the expected option term. Expected volatility was calculated based upon actual historical stock price movements over the most recent periods ending on the date of grant, equal to the expected option term. The expected option term represents the period that the Company's stock options are expected to be outstanding and was determined based on the simplified method permitted by SAB 107 and extended by SAB 110, as the average of the vesting period and the contractual term. The Company currently uses the simplified method as adequate historical experience is not available to provide a reasonable estimate. The Company adopted SAB 110 effective January 1, 2008 and will continue to apply the simplified method until enough historical experience is available to provide a reasonable estimate of the expected term for stock option grants. The risk-free interest rate is based on the yield from U.S. Treasury zero-coupon bonds with an equivalent term. The Company has historically not paid dividends and has no foreseeable plans to pay dividends.
The fair value for options granted in 2011 and 2009 was estimated on the date of grant using the Black-Scholes option pricing model with the following weighted average assumptions:
|
Year ended December 31,
|
||||||||
|
2011
|
2009
|
|||||||
|
Risk-free interest
|
1.17 | % | 1.45 | % | ||||
|
Dividend yields
|
0 | % | 0 | % | ||||
|
Volatility
|
96 | % | 77 | % | ||||
|
Expected option term
|
3.83 years
|
3.46 years
|
||||||
|
Forfeiture rate
|
24 | % | 15 | % | ||||
No options were granted during 2010.
During 2011, 2010 and 2009, the Company recognized stock-based compensation expense related to employee and director stock options as follows (in $ thousands):
|
Year ended December 31,
|
||||||||||||
|
2011
|
2010
|
2009
|
||||||||||
|
Selling and marketing
|
$ | 8 | $ | 39 | $ | 377 | ||||||
|
General and administrative
|
161 | 178 | 252 | |||||||||
|
Total stock-based compensation expense
|
$ | 169 | $ | 217 | $ | 629 | ||||||
The Company applies ASC 718 and ASC 505-50 for equity instruments that are issued to other than employees for acquiring, or in conjunction with selling, goods or services.
- 34 -
Recently Issued Accounting Pronouncements
See Note 2t to the Consolidated Financial Statements for the year ended December 31, 2011.
Legal Contingencies
The Company has been a party to various legal proceedings in the normal course of its business. The results of legal proceedings are difficult to predict and an unfavorable resolution of a lawsuit or proceeding may occur. Management believes that the prospects of these proceedings to prevail and recover a significant amount, seem remote, and a corresponding provision was recorded in this respect. For additional information, see “Item 8A. Consolidated Statements and Other Financial Information - Legal Proceedings”. As additional information becomes available, management will reassess the potential liability related to these legal proceedings and may revise its estimate of the probable cost of these proceedings. Such revisions in the estimates of the probable cost could have a material adverse effect on the Company’s future results of operations and financial position.
5A. Operating Results
On January 12, 2010, we effected a 5:1 reverse share split. All share and per share data for periods prior to that date have been retroactively adjusted to reflect this reverse share split.
Comparison of 2011 and 2010
Revenues for 2011 were $33.4 million, compared to $30.2 million in 2010. The growth in revenues was in both our Mobile and RFID and Supply Chain divisions. See note 18a to the Consolidated Financial Statements for the year ended December 31.
Gross profit for 2011 was $6.5 million (gross margin of 19.5%), compared to $7.5 million (gross margin of 24.8%) for 2010. The decrease in the gross profit in 2011 was due mainly to: (a) an inventory write-off in 2011 in the amount of $443,000, compared to a $36,000 inventory write-off in 2010 (inventory write-offs are executed in view of slow-moving items or as a result of technological obsolescence); (b) a gross loss in the software product line (related to the RFID division) in the amount of $37,000 in 2011, compared to a gross profit of $470,000 in 2010; and (c) a decrease in gross margins due to increased competition.
- 35 -
During the fourth quarter of 2011, we have successfully completed a restructuring of our software activity which yielded a positive gross profit in the fourth quarter of 2011.
Research and development expenses for 2011 increased to $403,000, compared to $372,000 in 2010. The increase reflects our continuing efforts to enhance our products offering. See “Item 5B. Liquidity and Capital Resources”.
Selling and marketing expenses for 2011 increased to $4.3 million from $4.1 million in 2010, mainly due to: (a) a 10.7% growth in 2011 revenues as compared to 2010 revenues , and (b) marketing expenses related to the acquisition of new international customers in both divisions.
General and administrative expenses for 2011 increased to $2.3 million, compared to $1.8 million in 2010. The increase was mainly due to: (a) expenses related to allowance for doubtful accounts which amounted to $82,000 in 2011, compared to income of $89,000 in 2010 resulting from a reverse of allowance for doubtful accounts and (b) an increase of approximately $185,000 in management salary and directors fees. See Note 19 to the Consolidated Financial Statements for the year ended December 31, 2011.
During 2011, the Company recognized an impairment loss of $555,000 related to customer list and a brand name, of which $470,000 related to the Supply Chain segment and $85,000 related to the RFID and Mobile solutions segment. The fair value of the brand name and customer list related intangibles was determined by the income approach method. Assumptions in the fair value assessment included: the impact of changes in revenues from major customers, economic conditions, revenue and cash flow forecasts for the remaining lives of the intangibles and the Company's weighted average cost of capital. During 2010, no impairment losses were identified.
As a result of the above, operating loss in 2011 amounted to $973,000, compared to an operating profit of $1.26 million in 2010.
Financial expenses for 2011 were $ 2.24 million, compared to $961,000 in 2010. The increase in the financial expenses in 2011 was due mainly to: (a) expenses of $860,000 related to the conversion of convertible loans pursuant to amended agreements (see Note 13 to the Consolidated Financial Statements for the year ended December 31, 2011); and (b) expenses related to changes in fair value of forward contracts in the amount of $44,000 in 2011, compared to income of $141,000 in 2010 (See Notes 2o and 17 to the Consolidated Financial Statements for the year ended December 31, 2011).
Other expenses in 2011 and 2010, which amounted to $172,000 and $120,000, respectively, were mainly due to the decrease in the value of the Company investments in NWB and Surf.
Tax benefit in 2011 amounted to $172,000, compared to a tax on income of $5,000 in 2010. Tax benefit in 2011 is mainly related to uncertain tax positions accounted for in accordance with ASC 740 (see Notes 2m and 16i to the Consolidated Financial Statements for the year ended December 31, 2011).
Loss from continuing operations in 2011 amounted to $3.2 million compared to income of $171,000 million in 2010. On a per share basis, the basic and diluted net loss per share from continuing operations in 2011 was $1.14, compared to net earnings per share of $0.07 in 2010.
- 36 -
Loss from discontinuing operations in 2010 of $806,000 was due to the closing of the operation of Lynk and its subsidiary Summit in November, 2010. Both companies belong to the Supply Chain division. There was no similar loss in 2011.On a per share basis, the basic and diluted net loss per share from discontinuing operations in 2010 was $0.31.
Comparison of 2010 and 2009
Revenues for 2010 were $30.2 million, compared to $25.5 million in 2009. The growth in revenues was in both our Mobile and RFID and Supply Chain divisions.
Gross profit for 2010 was $7.5 million (gross margin of 24.8%), compared to $3.5 million (gross margin of 13.7%) for 2009. The improvement in the gross profit in 2010 is attributed mainly to a minor inventory write-off in the amount of $36,000 compared to a $2.2 million inventory write-off in 2009, which was attributed to the global economic slowdown in 2009.
Research and development expenses for 2010 were $372,000, compared to $360,000 in 2009.
Selling and marketing expenses for 2010 decreased to $4.1 million from $5.4 million in 2009. The decrease is attributed to cost reduction, mainly in workforce, during 2010.
General and administrative expenses for 2010 decreased to $1.8 million, compared to $2.0 million in the 2009. The decrease is attributed to cost reduction that was implemented in 2010.
Impairment of goodwill in 2009 amounted to $383,000. There was no impairment of goodwill in 2010. The goodwill impairment of the Supply Chain Solutions segment was due to the global economic slowdown, which affected the future revenues and cash flows of this segment.
As a result of the above, operating profit in 2010 amounted to $1.26 million, compared to an operating loss of $4.7 million in 2009.
Financial expenses for 2010 were $961,000, compared to $606,000 in 2009. The increase is related to the convertible notes in the aggregate amount of $2.4 million, which were issued in August 2009 (see “Item 5B. Liquidity and Capital Resources”).
Other expenses in 2010 and 2009, which amounted to $120,000 and $409,000, respectively, are mainly attributed to the decrease in the value of the Company investments in NWB and Surf.
Tax on income in 2010 amounted to $5,000, compared to a tax on income of $329,000 in 2009. Tax expenses in 2009 related to uncertain tax positions accounted for in accordance with ASC 740, see Notes 2m and 16i to the Consolidated Financial Statements for the year ended December 31, 2011.
- 37 -
Income from continuing operations in 2010 amounted to $171,000 compared to a loss of $6 million in 2009. On a per share basis, the basic and diluted net earning per share from continuing operations in 2010 was $0.07, compared to net loss per share of $2.32 in 2009.
Loss from discontinuing operations is attributed to the closing of the operation of Lynk and its subsidiary Summit in November, 2010. Both companies belong to the Supply chain division. Loss from discontinued operation amounted to $806,000 in 2010 compared to a loss of $3.1 million in 2009. On a per share basis, the basic and diluted net loss per share from discontinuing operations in 2010 was $0.31, compared to net loss per share of $1.18 in 2009.
The U.S. dollar cost of our NIS expenses increased in year 2010 as compared to year 2009 because of the differential between the rate of inflation in Israel and change in the value of the NIS relative to the U.S. dollar. In year 2010, the inflation rate in Israel, as adjusted for the appreciation of the NIS against the U.S. dollar, was 8.6 % compared to 4.6% in year 2009.
Variability of Quarterly Operating Results
Our revenues and profitability may vary in any given year, and from quarter to quarter, depending on the mix of products sold. In addition, due to potential competition, uncertain market acceptance and other factors, we may be required to reduce prices for our products in the future.
Our future results will be affected by a number of factors including our ability to:
·
establish effective distribution channels and manage them;
·
develop, introduce and deliver new products on a timely basis;
·
anticipate accurately customer demand patterns; and
·
manage future inventory levels in line with anticipated demand.
These results may also be affected by currency exchange rate fluctuations and interest rate and economic conditions in the geographical areas in which we operate. There can be no assurance that our historical trends will continue, or that revenues, gross profit and net income in any particular quarter will not be lower than those of the preceding quarters, including comparable quarters.
Impact of Inflation and Currency Fluctuations
The U.S. dollar cost of our operations in Israel is influenced by the differential between the rate of inflation in Israel and any change in the value of the NIS relative to the U.S. dollar.
A devaluation of the NIS in relation to the U.S. dollar will have the effect of decreasing the U.S. dollar costs in any of our NIS expenses and a converse effect in case of devaluation of the U.S. dollar in relation to the NIS.
- 38 -
A devaluation of the NIS in relation to the U.S. dollar will also have the effect of decreasing the U.S. dollar value of any of our NIS assets (unless such asset is linked to the U.S. dollar). Such a devaluation would further have the effect of reducing the U.S. dollar amount of any of our liabilities and expenses which are payable in NIS (unless such payables are linked to the U.S. dollar). Conversely, any increase in the value of the NIS in relation to the U.S. dollar will have the effect of increasing the U.S. dollar value of our NIS assets (unless such asset is linked to the U.S. dollar). Such an increase would also have the effect of increasing the U.S. dollar amount of any of our liabilities and expenses which are payable in NIS (unless such payables are linked to the U.S. dollar).
In the years ended December 31, 2011, 2010, 2009, 2008, 2007 the inflation rate in Israel, as adjusted for the depreciation or appreciation of the NIS against the U.S. dollar, was (5.49) , 8.6 %, 4.6%,
4.9% and 12.4%, respectively. The closing representative exchange rate of the U.S. dollar at the end of each such period, as reported by the Bank of Israel, was NIS 3.821, 3.549, NIS 3.775
,
NIS 3.802 and NIS 3.846, respectively.
Effective Corporate Tax Rate
The Israeli corporate tax rate was 26% in 2009, 25% in 2010 and 24% in 2011.
A company is taxable on its real (non-inflationary) capital gains at the corporate tax rate in the year of sale. A temporary provision for 2006-2009 stipulated that the sale of an asset other than a quoted security (excluding goodwill that was not acquired) that had been purchased prior to January 1, 2003, and sold by December 31, 2009, is subject to corporate tax as follows: the part of the real capital gain
that is linearly attributed to the period prior to December 31, 2002 is subject to the corporate tax rate in the year of sale as set forth in the Israeli Income Tax Ordinance ; and the part of the real capital gain that is linearly
attributed to
the period from January 1, 2003, through December 31, 2009, is subject to tax at a rate of 25%.
On December 5, 2011, the Israeli Parliament (the Knesset) enacted the Law for Tax Burden Reform (Legislative Amendments), 2011 which, among other things, cancels, effective from 2012, the scheduled progressive reduction in the corporate tax rate. The law also increases the corporate tax rate to 25% in 2012. In parallel with this increase in the corporate tax rate, a corresponding increase was applied to the real capital gains tax rate and the real betterment tax rate as well. The law did not have a material effect on the Company's consolidated financial position or results of operations.
The Company and its Israeli subsidiaries have accumulated losses for Israeli income tax purposes as of December 31, 2011, in the amount of approximately $ 31.1 million. These losses may be carried forward and be offset against taxable income in the future for an indefinite period. In addition, the Company and its Israeli subsidiaries have accumulated capital losses, which may be carried forward under certain limitations.
Grants and Participation
Under the Law for the Encouragement of Industrial Research and Development, 1984 (the “Research Law”), research and development programs approved by a research committee of the Office of the Chief Scientist of Israel’s Ministry of Industry, Trade and Labor, are eligible for grants in exchange for payment to the Government of royalties from the sale of products developed in accordance with the program. In order to be eligible, the applicant must be an Israeli company that proposes to invest in the development of industrial know-how, the development of new products, the development of new processing or manufacturing procedures or the development of significant improvements to an existing process or product. A committee of the OCS reviews the applications, evaluates the feasibility of the proposal, determines whether or not to approve a grant, and also determines the extent of Chief Scientist funding (within a range specified by the law) for approved projects. Depending on the nature of the project, the OCS grants generally amount to up to 50% of the approved research expenses.
- 39 -
Under the Company's research and development agreements with the OCS and pursuant to applicable laws, the Company is required to pay royalties at the rate of 3.5% of sales of products developed with funds provided by the OCS, up to an amount equal to 100% of the research and development grants (U.S. dollar-linked) received from the OCS. The obligation to pay these royalties is contingent upon actual sales of the products. Royalties payable with respect to grants received under programs approved by the OCS after January 1, 1999, are subject to interest on the U.S. dollar-linked value of the total grants received at the annual rate of LIBOR applicable to U.S. dollar deposits at the time the grants were received.
The Research Law requires that the manufacture of any product developed as a result of research and development funded by the Israeli Government take place in Israel. If any of the manufacturing is performed outside of Israel, the Company would ordinarily be required to pay royalties at an increased rate and to increase the aggregate repayment amount to between 120% and 300% of the grant amount, depending on the manufacturing volume that is performed outside Israel, except in special cases that receive the prior approval of the research committee, and subject to certain payments to be made to the Israeli Government (generally an amount no less that the aggregate grants plus interest less royalties paid).
The Research Law also provides that know-how from the research may not be transferred to third parties in Israel without prior approval of the research committee. This approval, however, is not required for the sale or export of any products resulting from such research and development. Approval of such transfer of know-how may be granted in specific circumstances, only if the recipient abides by the provisions of the Research Law and related regulations, including the restrictions on the transfer of know-how and the obligation to pay royalties in an amount that may be increased. The Research Law further provides that the know-how developed under an approved research and development program may not be transferred to any third parties outside Israel, except with the approval of the OCS and subject to particular payments.
The Research Law imposes reporting requirements with respect to certain changes in the ownership of a grant recipient. The law requires the grant recipient and its controlling shareholders and interested parties to notify the Office of the Chief Scientist of any change in control of the recipient or a change in the holdings of the significant shareholders of the recipient that results in a non-Israeli becoming an interested party directly in the recipient, and requires the new interested party to undertake to the Office of the Chief Scientist to comply with the Research Law. In addition, the rules of the Office of the Chief Scientist may require prior approval of the Office of the Chief Scientist or additional information or representations in respect of certain of such events.
The funds available for Office of the Chief Scientist grants out of the annual budget of the State of Israel have been reduced, and the Israeli authorities have indicated that the government may further reduce or abolish Office of the Chief Scientist grants in the future.
- 40 -
Since 2006, we have not participated in research and development programs supported by the OCS.
As of December 31, 2011, the Company has an outstanding contingent obligation to pay royalties to the OCS, including interest, in the amount of approximately $ 3.3 million, in respect of previous grants. Commencing in year 2012, there are no sales of products that were developed using funds provided by the OCS.
We are also committed to paying royalties to the Fund for the Encouragement of Exports for its participation, by way of grants, in our marketing expenses outside of Israel. Royalties payable are 3% of the growth in exports, from the year we received the grant, up to 100% of the U.S. dollar-linked amount of the grant received at the date the grants received.
Since 1996, we have not participated in Fund for the Encouragement of Exports programs. As of December 31, 2011, the Company has an outstanding contingent obligation to pay royalties including interest of $ 101,000 with respect to export grants. No expenses were incurred on account of such royalties during 2011, 2010 and 2009.
Conditions in Israel
We are incorporated under the laws of the State of Israel, where we also maintain our headquarters and our research and development and manufacturing facilities. See Item 3D. “Risk Factors – Risks Relating to Our Location in Israel” for a description of governmental, economic, fiscal, monetary or political polices or factors that have materially affected or could materially affect our operations.
5B. Liquidity and Capital Resources
As of December 31, 2011, we had $1.0 million in long-term debt to Dimex Systems Ltd. (including current maturities of $299,000) and $2.2 million in long-term bank loans (including current maturities of $660,000). In addition, at December 31, 2011, we had $6.8 million of short term bank loans drawn under a revolving credit facility.
In August 2009, the Company closed a $2.4 million Convertible Loan Financing with several lenders including Catalyst Private Equity Partners (Israel) II L.P., Telegraph Hill Capital Fund I, LLC, certain existing shareholders and members of its management (the "Lenders"). The financing consisted of loans with a term of three years that bear interest at a rate equal to 8% per annum, compounded annually. The Company was to repay the loan principal amount and the accrued interest in one payment at the end of the term, unless converted earlier into ordinary shares at the discretion of the lender. The loan conversion rate is $3.25 per ordinary share. The Company granted the lenders warrants to purchase 100% of the number of ordinary shares into which the loan is convertible. The warrants are exercisable, in whole or in part, from 18 months to 36 months from grant, at an exercise price per ordinary share of $2.75. In addition, the lenders received certain registration rights. A total of $675,000 of the loan was extended to the Company by conversion into the debt financing of a payment otherwise due to Dimex Systems by April 2010, pursuant to the Asset Purchase Agreement the Company had entered into with Dimex Systems.
- 41 -
In November 2009, as part of a separation agreement between the Company and its former CEO, Shalom Daskal, the Company repaid to Mr. Daskal $50,000 of convertible loan he had previously extended to it as part of the August 2009 Convertible Loan Financing.
In March 2009, the Company entered into an amendment to the 2008 Dimex Systems Asset Purchase Agreement that revised the payment schedule of the approximately NIS 10 million payable in three semi-annual installments through June 2010. The amendment provided for a NIS 3.5 million payment in March 2009, NIS 4 million to be paid in 6 equal monthly installments each, starting on January 15, 2010, and the remaining approximately NIS 2.5 million was converted into the same type of convertible debentures subsequently issued by the Company in July 2009.
On February 4, 2010, the Company entered into an additional amendment to the Dimex Systems Asset Purchase Agreement, further revising the schedule of remaining payments in the amount of NIS 4 million, to Dimex Systems. The amendment provided for payment of:
(a) NIS 300,000 in February 2010 and NIS 3.1 million plus 8% interest per annum, to be paid in monthly installments commencing July 2010 through December 2013; and
(b) NIS 600,000 were converted into the same long-term convertible debentures, into which NIS 2.5 million were previously converted.
In addition, the Company issued to Dimex Systems a warrant to purchase 69,096 ordinary shares at an exercise price of $3.25 per ordinary shares during the first 18 months commencing August 3, 2011 and $4.00 per ordinary share thereafter.
In December 2011, Company’s shareholders approved and the Company effected amendments to the terms of the Convertible Loan Financing agreements (the "Conversion Amendments”). The Conversion Amendments provided that approximately $2.5 million of the outstanding convertible debt (consisting of $2,093,000 principal and $430,000 accrued interest) shall be converted into 1,681,965 ordinary shares (at a reduced conversion price of $1.5 per ordinary share, instead of the original $3.25 price). In addition, the warrants to purchase 643,984 shares that had been issued to the Lenders were extended by two years until July 2014 and February 2015, with no change to the exercise price of $2.75 per ordinary share.
The balance of the convertible loan of $501,000 that was extended by Dimex Systems remained outstanding, and will bear a reduced interest rate of 4%, instead of the original rate of 8%, and will no longer be convertible. This amount will be repaid to Dimex Sytstems in 24 equal monthly installments commencing January 10, 2014.
- 42 -
The Company’s loans from Bank Leumi are secured by:
|
|
·
|
first ranking fixed charges on the goodwill of the Company and its Israeli subsidiaries, on our shareholdings in the Israeli subsidiaries and on certain Bank Leumi accounts of Odem; and
|
|
|
·
|
floating charges on all of the assets of the Company and its Israeli subsidiaries, owned now or in the future; and
|
The Company also guarantees the liabilities of its Israeli subsidiaries to Bank Leumi and each of its Israeli subsidiaries guarantee the Company’s liabilities to Bank Leumi.
The Bank Leumi loan agreements signed by the Company and its Israeli subsidiaries contain various financial covenants, which require that the Company and the Israeli subsidiaries maintain certain financial ratios related to shareholders' equity, EBITDA and operating results. On February 8, 2010, the Company and its Israeli subsidiaries executed revised loan documents governing their credit line from Bank Leumi, in which they undertook revised covenants for year 2010. There were no Bank Leumi covenants applicable for the fiscal year 2011.
The Company’s loan from Bank HaPoalim is secured by long term bank deposits in the amount of $427,000. Bank HaPoalim’s loan agreements contain various financial covenants which require that the Company's Israeli subsidiaries maintain certain financial ratios and levels of profitability.
As of December 31, 2011, the Company failed to meet Bank HaPoalim’s covenants. Nonetheless, Bank HaPoalim agreed, under certain conditions, including compliance by the Company with its warrants for the year 2012, to waive this failure of the Company to meet its financial covenants in 2011.
We finance our activities by different means, including equity financings, short and long-term loans, and income from operating activities.
Working capital requirements will vary from time-to-time and will depend on numerous factors, including but not limited to, the operating results, scope of sales, supplier and customer credit terms, the level of resources devoted to research and development, new product introductions, and marketing and acquisition activities.
We have in-balance sheet financial instruments and off-balance sheet contingent commitments. Our in-balance sheet financial instruments consist of our assets and liabilities. Our cash is invested in short-term (less than 3 months) U.S. dollars and NIS interest bearing deposits with banks. As of December 31, 2011, our trade receivables’ and trade payables’ aging days were 93 and 57 days, respectively. The fair value of our financial instruments is similar to their book value. Our off-balance sheet contingent commitments consist of: (a) royalty commitments that are directly related to our future revenues, (b) lease commitments of our premises and vehicles, (c) directors and officers’ indemnities, in excess of the proceeds received from liability insurance which we obtain, and (d) legal proceedings.
- 43 -
In the year ended December 31, 2011, the Company incurred a loss of $3.2 million and generated negative cash flow from current operations amounting to $365,000. Due to the above, the Company's cash and cash equivalent decreased from $703,000 as of December 31, 2010 to $411,000 as of December 31, 2011. In addition, long-term bank loans increased by $1.1 million during fiscal year 2011.In view of the above, the Company has implemented an overall efficiency plan, including: a conversion of the convertible note (see Note 13 to the Consolidated Financial Statements for the year ended December 31, 2011) and a reduction in workforce. The Company expects to meet its bank covenants through December 31, 2012 and believes that its cash resources are sufficient to meet its operating needs for at least the next 12 months.
The Company expects to meet its bank covenants through December 31, 2012 and believes that its cash resources are sufficient to meet its operating needs for at least the next 12 months.
Cash Flows
Net cash used in
operating activities from continuing operations in 2011 was $365,000, compared to net cash provided by
operating activities of $1.46 million in 2010. The difference in cash flows was due to the increase of net loss from continued operations from $171,000 net profit in year 2010 to $3.2 million net loss in year 2011.
Net cash used in investing activities from continuing operations in 2011 increased to $1.04 million, compared to $105,000 in 2010. The increase was due to: (a) Increase in investment in fixed assets from $108,000 in 2010 to $357,000 in 2011 reflecting a purchase of cars instead of the lease of cars, and leasehold improvements as a result of facilities consolidation, (b) a long term deposit of $427,000 which is a security for the long term loan from Bank Hapoalim, and (c) proceeds from the sale of investment in other company amounting to $150,000 in 2010 compared to no proceeds received in 2011.
Net cash provided by financing activities from continuing operations
in 2011 amounted to $1.1 million, compared to net cash used by financing activities of $604,000 in 2010.
2009 Private Placements
In August 2009, the Company closed a $2.4 million Convertible Loan Financing with several lenders including Catalyst Private Equity Partners (Israel) II L.P., Telegraph Hill Capital Fund I, LLC, certain existing shareholders and members of its management.
2010 Private Placements
On February 4, 2010, the Company entered into an additional amendment to the Dimex Systems Asset Purchase Agreement, whereby among others, NIS 600,000 was converted into long-term convertible debentures on terms similar to those of the debentures the Company issued in August 2009. In addition, the Company issued to Dimex Systems a warrant to purchase 69,096 ordinary shares at an exercise price of $3.25 per ordinary shares during the first 18 months commencing August 3, 2011 and $4.00 per ordinary share thereafter.
- 44 -
On October 5, 2010 the Company entered into a Share Purchase Agreement with Telegraph Hill Capital Fund I, LLC for the issuance of an aggregate of 96,362 Ordinary Shares at a price per share of $3.11, or approximately $300,000 in total.
2011 Amendments to Convertible Loan Agreements
In December 2011, the Company consummated amendments to its agreements with its convertible debt lenders, including Dimex Systems, for the conversion of most of the convertible debt into the Company’s ordinary shares. See discussion above for further details.
5C. Research and Development
We believe that our future growth will depend upon our ability to enhance our existing products and introduce new products on a timely basis. Our current research and development efforts focus on our RFID and Mobile solutions for enterprise logistics and organizational processes and on our software products offering (see “Item 4B. Business Overview” for the detailed list of our software products).
We intend to finance our research and development activities with our own resources and by raising equity and debt financings.
5D. Trend Information
BOS’ vision is to become a worldwide provider in the field of RFID and Mobile solutions for enterprise logistics and organizational processes. Committed to this vision, we plan to expand our suite of solutions and anticipate that the portion of the RFID and Mobile Solutions segment revenues will increase gradually going forward.
Growth of the RFID and Mobile division depend on sales of BOS ID software product outside of Israel. We anticipate that the revenues of BOS ID will increase gradually going forward.
In addition, we are working towards an increase of our Supply Chain Solution to the international markets.
Interest rate on our short term loan that quoted in NIS was 7.25% on December 31, 2011, compared to 5.95% on December 31, 2010. Interest NIS rate on our U.S. short term loan that quoted in US$ was 5.49% on December 31, 2011, compared to 3.37% on December 31, 2010. The increase in interest rate resulted in a corresponding increase in the U.S. dollar cost of our financial expenses. Further significant increase in interest rate could have an adverse effect on our results of operation and financial condition. We cannot predict any future trends in the rate of interest.
5E. Off-Balance Sheet Arrangements
Not applicable.
- 45 -
5F. Tabular Disclosure of Contractual Obligations
The following table of our material contractual obligations as of December 31, 2011, summarizes the aggregate effect that these obligations are expected to have on our cash flow in the periods indicated:
|
Total
|
Less than 1 year
|
1-3 years
|
3-5 years
|
More than 5 years
|
||||||||||||||||
|
Long-term loans
(1)
|
$ | 2,189,964 | $ | 660,324 | $ | 1,219,605 | $ | 310,035 | - | |||||||||||
|
Accrued severance pay
(2)
|
162,663 | - | 162,663 | |||||||||||||||||
|
Liability to Dimex system
|
1,068,625 | 299,517 | 769,108 | - | ||||||||||||||||
|
Uncertain tax position
|
273,406 | - | - | - | 273,406 | |||||||||||||||
|
Operating lease - cars
|
508,718 | 290,395 | 218,323 | - | ||||||||||||||||
|
Purchase obligation for service and inventory
|
1,752,520 | 1,752,520 | - | - | ||||||||||||||||
|
Facilities lease
|
372,211 | 105,027 | 216,400 | 50,784 | - | |||||||||||||||
|
Total
|
$ | 6,305,535 | $ | 3,107,783 | $ | 2,400,864 | $ | 360,819 | $ | 436,069 | ||||||||||
|
(1)
|
Does not include interest. For information on interest rate on long terms loans. See Note 12 to the Consolidated Financial Statements for the year ended December 31, 2011.
|
|
(2)
|
The time for payment of the severance cannot be predicted.
|
The above table does not include: (i) contingent obligations to pay royalties to the Office of the Chief Scientist and to the Fund for the Encouragement of Export, since the total amount to be paid under the terms of those agreements is a function of future sales, and (ii) contingent legal claims (see “Item 8A. Consolidated Statements and Other Financial Information - Legal Proceedings”).
- 46 -
6A. Directors and Senior Management
Set forth below is information regarding our directors and senior management.
|
Name
|
Age
|
Position
|
|
Mr. Edouard Cukierman
1
|
47
|
Chairman of the Board of Directors
|
|
Mr. Yuval Viner
|
49
|
Chief Executive Officer
|
|
Mr. Avidan Zelicovsky
1
|
42
|
President
|
|
Mr. Eyal Cohen
|
43
|
Chief Financial Officer
|
|
Mr. Guillaume Binder
|
57
|
Director
|
|
Mr. Joel Adler
|
58
|
Director
|
|
Mr. Ronen Zavlik (*)
|
51
|
Director
|
|
Mr. Luis Gutierrez Roy
|
41
|
Director
|
|
Ms. Orit Nir Schwartz (*)
|
40
|
External Director
|
|
Mr. David Golan (*)
|
71
|
External Director
|
(*) Member of our Audit Committee.
Mr. Edouard Cukierman
has been a director of the Company since May 2003 and Chairman of the Company since June 2003. He is the founder of Cukierman & Co. Investment House Ltd. (CIH) and Catalyst Fund. Since its establishment in 1993, CIH realized more than € 3.5 billion of corporate finance transactions. Prior to managing Catalyst in 2000, he was the President and CEO of the Astra Technological Investments, a Venture Capital Fund established in 1993, which was the first Israeli company to go public in Continental Europe. He is the Founder of the Go4Europe yearly conference. He is a board member of Lamina Technologies in Switzerland, Dorimedia and Harmon.ie in Israel. Edouard Cukierman is the Chairman of the European Committee of the High Tech Industry Association (HTIA) since May 2011. He is as well the President of the Israeli desk of the Foundation France Israel. Mr. Cukierman is a board member of “Alliance Israelite Universelle en Israel” and a board member of Sar-El Association. In the past, Mr. Cukierman was the President of the Supervisory Board of Citec Environment SA and Services in Paris. He was a Board member of Orex, MTI Wireless and other portfolio companies of Catalyst and served as a Board member of Otto Capital, a Singapore based VC fund. Mr. Cukierman serves as reserve officer in the Crisis & Hostage Negotiation Team and he is an officer (reserve) of the Spokesman Unit. Mr. He holds an MBA from INSEAD, Fontainebleau, France and a B.Sc. from the Technion - Israel Institute of Technology.
Mr. Yuval Viner
was appointed as the Company acting CEO on October 20, 2009 and as CEO on March 17, 2010. From March 2008, following the acquisition of Dimex System’s assets, he served as the Head of RFID and Mobile Solutions Division. Mr. Viner joined Dimex Systems (1988) Ltd. in 1993 and was appointed as Dimex System’s CEO in 2000. Mr. Viner joined the Company as part of the acquisition of Dimex Systems assets. Mr. Viner is a graduate of the Practical Engineering Academy of Tel Aviv.
Mr. Avidan Zelicovsky
was appointed as the Company acting president in October 20, 2009 and as president on March 17, 2010. From November 2004, following the acquisition of Odem by BOS, Mr. Zelicovsky served as the Head of Supply Chain Solutions Division. Mr. Zelicovsky first joined the Company’s subsidiary Odem in 1996. Mr. Zelicovsky holds a B.A. in Business Administration from the Tel Aviv College of Management and an LL.M. from the Bar-Ilan University.
1
Mr. Cukierman and Mr. Zelicovsky are first cousins. There are no other family relationships among the officers and directors.
- 47 -
Mr. Eyal Cohen
was appointed as the Company’s Chief Financial Officer in January 2007. From 2004 through 2006, Mr. Cohen served as the Company’s controller, and prior to that held the position of Chief Financial Officer at Cellact Ltd. From 1998 to 2001, Mr. Cohen was the controller of e-SIM Ltd. (NASDAQ:ESIMF) and in the years 1995-1997 held an audit manager position in PricewaterhouseCoopers. Mr. Cohen holds a B.A. in Accounting and Business Administration from the College of Management in Tel-Aviv and is a certified public accountant in Israel and in the United States, in the state of Maine.
Mr. Joel Adler
has been a director of the Company since June 2005. Mr. Adler is a partner in Mishcon de Reya a leading law firm in London. He specializes in mergers & acquisitions and corporate finance work, in particular international corporate transactions. Mr. Adler advises a number of major Israel based companies on their business activities in the UK and Europe and on IPO of foreign companies on the London Stock Exchange (AIM). Mr. Adler joined Mishcon de Reya as a partner in 2006, from the London law firm of Speechly Bircham, where he was a partner from 1999. Previously, Mr. Adler was head of the corporate department of Rakisons (now part of U.S. law firm Steptoe & Johnson). He gained his experience with other leading law firms in London Herbert Oppenheimer Nathan & Vandyck (now Denton Wilde Sapte) and DJ Freeman. He is a member of the Israeli Bar and worked for the well-known Israeli law firm Caspi & Co. for two years. Mr. Adler holds a Law degree from Bar Ilan University in Israel, and an LLM from London University. He was born and educated in Vienna.
Mr. Ronen Zavlik
has been a director of the Company since May 2003. He is a partner in the CPA firm of Grinberg-Zavlik, which he founded in 1987. His firm provides a wide range of audit, tax consultancy and CFO services to a wide variety of companies. Mr. Zavlik provides internal auditing services to a number of large companies whose shares are traded on the Tel-Aviv Stock Exchange, Mr.
Zavlik holds a B.A. in Accountancy and Business Management from the College of Management in Tel-Aviv. Mr. Zavlik holds an accounting license in Israel, is a certified internal auditor in the United States and a member of the Institute of Certified Public Accountants in Israel.
Mr. Guillaume Binder
has been a director of the Company since July 2008. Mr. Binder is a licensed lawyer in France and holds a Masters in Law from Paris University, a certificate of specalization in Corporate and Tax Law and a degree of superior accounting study (DECS). Mr. Binder serves as a director in several seed and startup companies, including First Care products and Neuronix.
Mr. Luis Gutierrez Roy
has been a director of the Company since October 2010. Mr. Gutierrez Roy has been a managing partner at Telegraph Hill Capital Fund I, LLC since 2008. He was a managing director of Corporate Finance and co-head of the Technology, Media and Telecom Group at Ernst & Young (E&Y) in Spain from 2001 to 2008. Prior to E&Y, he led the Corporate Value Consulting practice at PricewaterhouseCoopers (PwC) in its Barcelona office from 1999 to 2001. Prior to joining PwC Spain, he worked for PwC and Houlihan Valuation Advisors in San Francisco from 1996 to 1999, and the Barcelona Stock Exchange, where he started his professional career in 1993. Mr. Gutierrez Roy has advised companies in cross-border transactions in Europe, the United States, Asia and Latin America. Mr. Gutierrez Roy holds a B.Sc. in Business Administration from the University of Barcelona, and an MBA from the University of San Francisco.
- 48 -
Mr. David Golan
has been an external director of the Company since February 2009. Mr. Golan provides private investment banking, managerial and consulting services. He currently serves as a director in several companies, both public and private. Previously, until 2002, he served as an Executive Director of a group of companies in the Rad-Bynet group. In the years 1998-2000 he served as President of the Zeevi Investments group. Between 1997-1998, Mr. Golan served as President of Clal Trading Ltd. and between 1992-1997 he served as Vice President in Clal Trading Ltd. Between the years 1988-1992 Mr. Golan served as managing director of Gal Industries Ltd. Mr. Golan holds a bachelor's degree in Economics and Statistics from the Hebrew University, an MBA from New York University and took part in a senior management course in IMD Lausaunne.
Ms. Orit Nir Schwartz
has been an external director of the Company since December 2011. Ms. Schwartz is the current Marketing Manager of the Imaging and Printing Group of Hewlett-Packard (HP) in Israel. Between 2004 and 2011, Ms. Schwartz worked as the Marketing Manager of Miller Jewellers, and previously, as Managing Manager of Siemens Mobile Phones from 2002 to 2003, and as Product Marketing Manager in the Marketing Division of Cellcom from 2000 to 2002. Ms. Schwartz holds a bachelor's degree in Economics and Management from the Technion - Israel Institute of Technology and an MBA from Tel Aviv University with concentrations in Marketing, Technology & Operational Systems Management.
6B. Compensation
In accordance with the approval of our shareholders, directors who are not employees (excluding the Company’s current Chairman of the Board and excluding external directors) are entitled to receive annual compensation of NIS 26,240, and an additional NIS 1,358 for each board meeting attended. The above amounts are subject to adjustment for changes in the Israeli consumer price index after March 2012.
The Company’s Chairman of the Board, Mr. Edouard Cukierman receives compensation pursuant to an Active Chairman Agreement. See Item 7B: Related Party Transactions, for further details.
The compensation of the Company's external directors is regulated by the Israeli Companies Regulations (Rules Regarding Compensation and Expenses to External Directors) - 2000, as amended, or the Regulations, and the Companies Regulations (Alleviation for Public Companies whose Shares are Traded on a Stock Exchange Outside of Israel) - 2000, as amended.
The compensation for our external directors, as approved by our shareholders, consists of an annual fee and a per meeting attendance fee equal to the “fixed” statutory amount applicable to companies of the Company’s size, as set forth from time to time, in the applicable Regulations, subject to increase in accordance with the Israeli consumer price index.
- 49 -
The current compensation rates for our external directors are an annual fee of approximately NIS 28,395 and a participation fee in meetings of approximately NIS 1,806. These amounts are subject to adjustment for changes in the Israeli consumer price index and to changes in the amounts payable pursuant to Israeli law from time to time.
Board members are compensated for telephone participation in board and committee meetings in an amount of 60% of what would be received for physical attendance and 50% of such fee for a meeting held without convening.
Each of our current directors (including the external directors but excluding the current Chairman of the Board) was also granted options to purchase 1,500 ordinary shares upon commencement of his or her term as director and at an exercise price equal to the average closing prices of the shares on the Nasdaq Capital Market on the 20 trading days preceding the appointment of the director. The Options will vest and become exercisable annually over a period of three years, in three equal parts. The maximum option term is five years from grant.
If applicable, a director shall receive an additional amount of 1,500 options to purchase the Company’s Ordinary Shares on the third anniversary of his or her service as a director of the Company.
The Company does not have any contracts with any of its non-employee/consultant directors that would provide for benefits upon termination of service.
The following table presents the total compensation paid to or accrued on behalf of all of our directors and officers as a group for the year ended December 31, 2011:
|
Salaries, Directors' fees, Service fees, Commissions and Bonus
1
|
Pension, Retirement and Similar benefits
|
|||||||
|
All directors and officers as a group (then 12 persons)
|
$ | 987,000 | $ | 109,777 | ||||
1
Includes consulting and other fees paid to Cukierman & Co., of which Mr. Edouard Cukierman, the Company’s Chairman, is (indirectly) a controlling shareholder, and stock based compensation in the amount of $223,000. Such remuneration does not include amounts expended by the Company for expenses, including business association dues and expenses reimbursed to said officers, and other fringe benefits commonly reimbursed or paid by companies in the location in which the particular executive officer of the Company is located, as the case may be.
- 50 -
6C. Board Practices
Directors:
Our Board of Directors is currently comprised of seven directors, including two external directors. The directors (except for the external directors) are elected by simple majority at the annual shareholders’ meeting, to serve until the next annual meeting of our shareholders and until their respective successors are elected and qualified. External directors, by rule of the Israeli Companies Law, are elected for a three-year term. Our Articles of Association provide that the number of directors in the Company (including external directors) shall be determined from time to time by the annual general meeting of shareholders, provided that it shall not be less than four nor more than eleven. Our Articles of Association provide that the directors may appoint additional directors (whether to fill a vacancy or to expand the Board) so long as the number of directors so appointed does not exceed the number of directors authorized by shareholders at the annual general meeting, and such appointees shall serve until the next annual general meeting.
NASDAQ Marketplace Rules require that the board of directors of a NASDAQ-listed company have a majority of independent directors, within the meaning of NASDAQ rules. Our board of directors has determined that Messrs. Adler, Binder, Gutierrez Roy, Golan, Zavlik and Ms. Nir Schwartz, who constitute a majority of the Board of Directors, are independent directors under the applicable Nasdaq Stock Market requirements.
Our Articles of Association provide that a director may appoint, by written notice to us, any individual to serve as an alternate director, up to a maximum period of one month, if the alternate is not then a member of the Board. Any alternate director shall have all of the rights and obligations of the director appointing him or her and shall be subject to all of the provisions of the Articles of Association and the Israeli Companies Law. Unless the time period or scope of any such appointment is limited by the appointing director, such appointment is effective for all purposes for a period of one month, but in any event will expire upon the expiration of the appointing director's term, removal of the alternate at an annual general meeting, the bankruptcy of the alternate, the conviction of the alternate for an offense in accordance with the Israeli Companies Law, the legal incapacitation of the alternate, the removal of the alternate by court order or the resignation of the alternate. Currently, no alternate directors have been appointed. A director may appoint an alternate to serve in his place as a member of a committee of the Board of Directors, even if the alternate currently serves as a director, as long as he does not already serve as a member of that committee.
Officers serve at the discretion of the Board or until their successors are appointed.
According to the provisions of our Articles of Association and the Israeli Companies Law, the Board of Directors convenes in accordance with the Company’s requirements, and at least once every three months. In practice, our Board of Directors convenes more often. Furthermore, our Articles of Association provide that the Board of Directors may also pass resolutions without actually convening, provided that all the directors entitled to participate in the discussion and vote on a matter that is brought for resolution agree not to convene for discussion of the matter. Resolutions passed without convening, shall be passed by an ordinary majority (just as in the case of convened meetings) and shall have the same effect as resolutions passed at a duly convened meeting.
In accordance with the requirements of the Nasdaq Stock Market, nominees for directors are recommended for selection by a majority of the independent directors.
- 51 -
External Directors:
Under the Israeli Companies Law, public companies are required to elect two external directors who must meet specified standards of independence. External directors may not have during the two years preceding their appointment, directly or indirectly through a relative, partner, employer or controlled entity, any affiliation with (i) the public company, (ii) those of its shareholders who are controlling shareholders at the time of appointment, or (iii) any entity controlled by the company or by its controlling shareholders.
The term “affiliation” includes an employment relationship, a business or professional relationship maintained on a regular basis, control and services as an office holder. The term “controlling shareholder” is defined as a shareholder who has the ability to direct the activities of a company, other than if this power derives solely from the shareholder’s position on the board of directors or any other position with the company. The definition also includes shareholders that hold 25% or more of the voting rights if no other shareholder owns more than 50% of the voting rights in the company.
In addition, an individual may not be appointed as an External Director in a company that does not have a controlling shareholder, in the event that he has affiliation, at the time of his appointment, to the chairman, chief executive officer, a 5% shareholder or the chief financial officer. An individual may not be appointed as an External Director if his relative, partner, employer, supervisor, or an entity he controls, has other than negligible business or professional relations with any of the persons with which the External Director himself may not be affiliated.
No person can serve as an external director if the person’s other positions or business creates or may create conflicts of interest with the person’s responsibilities as an external director. Until the lapse of two years from termination of office, a company may not engage an external director as an employee or otherwise. If, at the time an external director is to be appointed, all current members of the board of directors are of the same gender, then at least one external director must be of the other gender.
A person is qualified to serve as an external director only if he or she has “accounting and financial expertise” or “professional qualifications,” as such terms are defined under regulations promulgated under the Israeli Companies Law. At least one external director must have “accounting and financial expertise.” David Golan, a member of our Audit Committee, is an external director who has accounting and financial expertise.
External directors serve for an initial three-year term, The initial three-year term of service can be extended, at the election of a company subject to certain conditions, by two additional three-year terms. External Directors will be elected by a majority vote at a shareholders’ meeting, provided that either the majority of shares voted at the meeting, including at least one-half of the shares held by non-controlling shareholders voted at the meeting, vote in favor; or the total number of shares held by non-controlling shareholders voted against does not exceed two percent of the aggregate voting rights in the company.
External Directors may be re-elected for additional terms by means of one of the following mechanisms: (i) the board of directors proposed the nominee and his appointment was approved by the shareholders in the manner required to appoint external directors for their initial term, or (ii) a shareholder holding 1% or more of the voting rights proposed the nominee, and the nominee is approved by a majority of the votes cast by the shareholders of the company, excluding the votes of controlling shareholders and those who have a personal interest in the matter as a result of their relations with the controlling shareholders, provided that, the aggregate votes cast by shareholders who are not controlling shareholders and do not have a personal interest in the matter as a result of their relations with the controlling shareholders in favor of the nominee constitute more than 2% of the voting rights in the company.
- 52 -
External directors can be removed from office only by the court or by the same special percentage of shareholders that can elect them, and then only if the external directors cease to meet the statutory qualifications with respect to their appointment or if they violate their fiduciary duty to the company. The court may additionally remove external directors from office if they were convicted of certain offenses by a non-Israeli court or are permanently unable to fulfill their position.
If delegated any authority of the board of directors, any committee of the board of directors must include at least one external director. An external director is entitled to compensation as provided in regulations adopted under the Companies Law and is otherwise prohibited from receiving any other compensation, directly or indirectly, in connection with such service.
The Companies Law requires external directors to submit to the company, prior to the date of the notice of the general meeting convened to elect the external directors, a declaration stating their compliance with the requirements imposed by Companies Law for the office of external director.
Our board of directors currently has two external directors under Israeli law: (i) Mr. David Golan, who has serviced as an external director in the Company since February 2009, and was reelected for an additional three-year period at our annual general meeting of shareholders held on December 20, 2011; and (ii) Ms. Orit Nir Schwartz who was elected to serve as an external director at our annual general meeting of shareholders held on December 20, 2011
Fiduciary Duties of Office Holders
:
The Israeli Companies Law codifies the fiduciary duties that “office holders,” including directors and executive officers, owe to a company. An “office holder” is defined in the Israeli Companies Law as a director, general manager, chief business manager, deputy general manager, vice general manager, other manager directly subordinate to the general manager or any other person assuming the responsibilities of any of the foregoing positions without regard to such person’s title. An office holder’s fiduciary duties consist of a duty of care and a duty of loyalty. The duty of care requires an office holder to act at a level of care that a reasonable office holder in the same position would employ under the same circumstances. This includes the duty to utilize reasonable means to obtain (i) information regarding the business feasibility of a given action brought for his approval or performed by him by virtue of his position and (ii) all other information of importance pertaining to the foregoing actions. The duty of loyalty requires that an office holder act in good faith and for the benefit of the company, including (i) avoiding any conflict of interest between the office holder’s position in the company and any other position he holds or his personal affairs, (ii) avoiding any competition with the company’s business, (iii) avoiding exploiting any business opportunity of the company in order to receive personal gain for the office holder or others, and (iv) disclosing to the company any information or documents relating to the company’s affairs that the office holder has received by virtue of his position as an office holder.
- 53 -
Disclosure of Personal Interests of an Office Holder; Approval of Transactions with Office Holders:
The Israeli Companies Law requires that an office holder promptly, and no later than the first board meeting at which such transaction is considered, disclose any personal interest that he or she may have and all related material information known to him or her and any documents in their possession, in connection with any existing or proposed transaction relating to our company. In addition, if the transaction is an extraordinary transaction, that is, a transaction other than in the ordinary course of business, other than on market terms, or likely to have a material impact on the company’s profitability, assets or liabilities, the office holder must also disclose any personal interest held by the office holder’s spouse, siblings, parents, grandparents, descendants, spouse’s descendants and the spouses of any of the foregoing (“relatives”), or by any corporation in which the office holder or a relative is a 5% or greater shareholder, director or general manager or in which he or she has the right to appoint at least one director or the general manager.
Under the Israeli Companies Law, all arrangements as to compensation of office holders who are not directors require approval by the board of directors, and exculpation, insurance and indemnification of, or an undertaking to, indemnify an office holder who is not a director requires both board of directors and audit committee approval. The compensation of office holders who are directors must be approved by our Audit Committee, Board of Directors and shareholders, in that order.
Some other transactions, actions and arrangements involving an office holder (or a third party in which an office holder has an interest) must be approved by the board of directors or as otherwise provided for in a company’s articles of association, however, a transaction that is adverse to the company’s interest may not be approved. In some cases, such a transaction must be approved by the audit committee and by the board of directors itself, and under certain circumstances shareholder approval may be required. Generally, in all matters in which a director has a personal interest he or she shall not be permitted to vote on the matter or be present in the meeting in which the matter is considered, except in case of a transaction that is not extraordinary or the purpose of presenting the proposed transaction, if the chairman of the audit committee or board of directors (as applicable) determines it necessary. Should a majority of the audit committee or of the board of directors have a personal interest in the matter, then: (a) all of the directors are permitted to vote on the matter and attend the meeting at which the matter is considered; and (b) the matter requires approval of the shareholders at a general meeting.
Committees
Each committee of a company’s Board of Directors that has the authority to exercise powers of the Board of Directors is required to include at least one external director and its audit committee must include all external directors.
- 54 -
Audit Committee:
Our Audit Committee currently consists of David Golan, Ronen Zavlik and Orit Nir Schwartz. Under the Israeli Companies Law, public companies must establish an audit committee. The audit committee must consist of at least three members, and must include all of the company's external directors. A majority of an audit committee must be comprised of “independent directors” (as such term is defined in the Companies Law). The chairman of the board of directors, any director employed by the company or providing services to the company on a regular basis, any controlling shareholder and any relative of a controlling shareholder may not be a member of the audit committee. An audit committee may not approve an action or a transaction with an officer or director, a transaction in which an officer or director has a personal interest, a transaction with a controlling shareholder and certain other transactions specified in the Companies Law, unless at the time of approval two external directors are serving as members of the audit committee and at least one of the external directors was present at the meeting in which an approval was granted.
Our Audit Committee assists our Board of Directors in overseeing the accounting and financial reporting processes of our company and audits of our financial statements, including the integrity of our financial statements, compliance with legal and regulatory requirements, compensation of our executive officers, our independent registered public accountants’ qualifications, independence and compensation (including for non-audit services), the performance of our internal audit function, finding defects in the business management of our company and proposing to our Board of Directors ways to correct such defects, determine whether certain related party actions and transactions are "material" or "extraordinary" in connection with their approval procedures, approve related-party transactions as required by Israeli law, establish whistle blower procedures (including in respect of the protections afforded to whistle blowers) and such other duties as may be directed by our Board of Directors. The Audit Committee may consult from time to time with our independent auditors and internal auditor with respect to matters involving financial reporting and internal accounting controls.
The Company has adopted an Audit Committee Charter which sets forth the responsibilities of the committee. A copy of this charter is available upon written request to the Company at its address in Israel.
Under the Sarbanes-Oxley Act of 2002, the Audit Committee is responsible for the appointment, compensation, retention and oversight of the work of the Company’s external auditors. However, under Israeli law, the appointment of external auditors requires the approval of the shareholders of the Company. Accordingly, the appointment of the external auditors is approved and recommended to the shareholders by the Audit Committee and ratified by the shareholders. Furthermore, pursuant to the Company’s Articles of Association, the Board of Directors is the organ that has the authority to determine the compensation of the external auditors; however, the Board of Directors delegated its authority to the audit committee, so that a second discussion by the Board of Directors shall not be necessary.
The Company has determined that all the members of its Audit Committee meet the applicable Nasdaq Stock Market and SEC independence standards.
Compensation Committee
:
The role of the Compensation Committee is to provide assistance and make recommendations to the Board of Directors regarding matters related to the compensation of employees of the Company. The Compensation Committee of the Company is formed and meets on an ad hoc basis. Under the Israeli Companies Law, in respect of the grant of options, the Compensation Committee may only make recommendations to the Board of Directors (and in some cases, such grants may need approval of the audit committee, the Board of Directors and the shareholders as well).
- 55 -
In accordance with Nasdaq rules, the compensation of the Company’s Chief Executive Officer and other executive officers is recommended to the Board of Directors by a majority of the Company’s independent directors.
Israeli Securities Authority Administrative Enforcement:
Under the Israeli Securities Law- 1968, the Israeli Securities Authority, or ISA, may take certain administrative enforcement actions against a company or a person, including a director, officer or shareholder of a company, if performing certain transgressions designated in the Securities Law.
The ISA is also authorized to impose fines on any person or company breaching certain provisions designated under the Companies Law.
6D. Employees
As of December 31, 2011, we employed 85 employees. As of March 31, 2012, we employed 77 employees, all of them in Israel. Of these 77 employees: 13 employees are in general and administrative positions, 22 employees are in marketing and sales, 3 employees are in research and development, 3 employees are in project implementation, 13 employees are employed as technicians and 23 employees are in operating activities. We believe that our relations with our employees are satisfactory. We have not experienced a collective labor dispute or a strike.
Israeli labor laws are applicable to all of our employees in Israel. The laws principally concern the length of the work day, minimum daily wages for professional workers, contributions to a pension fund, insurance for work-related accidents, allotment of vacation and sickness days, procedures for dismissing employees, determination of severance pay and other conditions of employment.
All Israeli employers are required to provide a certain escalation of wages in relation to the increase in the Israeli Consumer Price Index. The specific formula of such escalation varies according to agreements reached between the Government of Israel, the Manufacturers' Association and the Histadrut, the general labor union in Israel. All of our Israeli employees are covered by pension insurance policies. Israeli employees and employers are required to pay predetermined sums to the Israel National Insurance Institute which amounts also include, since January 1, 1995, payments for national health insurance.
In December 2008 and in May 2009, we effected a progressive reduction in the salaries of the employees of the Company and its subsidiaries of up to 15%, depending on the level of salary. In connection with such reduction, in May 2009, the Company granted its employees a total of 107,751 options to purchase ordinary shares of the Company with exercise price of $0.00 per ordinary share. The options vested on a quarterly basis starting from January 2009 over a period of four quarters, in four equal parts and are now fully vested. The exercise period of the options is 5 years from January 1, 2009.
- 56 -
In addition, in May 2009, the Company’s employees were granted a total of 109,034 options to purchase the Company’s ordinary shares, as a prospective incentive. The exercise price of these options is $5.00 per ordinary share. These options vest on a yearly basis starting from January 2009 over a period of four years, in four equal parts. The exercise period of the options is 5 years from January 1, 2009.
6E.
Share Ownership
As of March 31, 2012, shares and options held by our officers and directors, then consisting of 10 persons, are as follows:
|
Name
|
Position
|
Shares
|
Options
|
Warrants
|
||||||||||
|
Mr. Edouard Cukierman
1
|
Chairman of the Board of Directors
|
8,139 | 185,032 | - | ||||||||||
|
Mr. Joel Adler
2
|
Director
|
28,185 | 4,300 | - | ||||||||||
|
Mr. Avidan Zelicovsky
|
President
|
17,355 | 70,874 | 1,077 | ||||||||||
|
Mr. Yuval Viner
|
Chief Executive Officer
|
11,352 | 43,442 | 1,077 | ||||||||||
|
Mr. Eyal Cohen
|
Chief Financial Officer
|
743 | 29,846 | 308 | ||||||||||
|
Mr. Luis Gutierrez Roy
3
|
Director
|
257,362 | 14,400 | 61,539 | ||||||||||
|
Other directors and officers
|
- | 11,600 | - | |||||||||||
Share Option Plans
The purpose of the Share Option Plans is to enable us to attract and retain qualified persons as employees, officers, directors, consultants and advisors and to motivate such persons by providing them with an equity participation in the Company. The Share Option Plans will expire 10 years after their adoption, unless terminated earlier by the Board of Directors.
The Share Option Plans are administered by the Board of Directors, which has broad discretion, subject to certain limitations, to determine the persons entitled to receive options.
1
Mr. Edouard Cukierman held 4,334 ordinary shares directly, 1,285 ordinary shares through a wholly owned company, E.D.I European Development and Investments Ltd. and an additional 2,520 ordinary shares through Cukierman & Co. Investment House that is indirectly controlled by Mr. Cukierman. Does not include shares as to which Mr. Cukierman may be deemed to share beneficial ownership. See “Item 7A: Major Shareholders”.
2
Brada Investments Limited is a discretionary trust of which Mr. Joel Adler, a director of the Company, is one of the beneficiaries. Brada Investments Limited holds 28,185 ordinary shares. Mr. Joel Adler holds 4,300 options, which he received as a director.
3
Securities are held by Telegraph Hill Capital Fund I, LLC. Mr. Gutierrez Roy may be deemed to have shared voting and dispositive power with respect to the holdings by Telegraph Hill Capital Fund I, LLC.
- 57 -
Under the Share Option Plans, the terms and conditions under which options are granted and the number of shares subject thereto shall be determined by the Board of Directors. The Board of Directors also has discretion to determine the nature of the consideration to be paid upon the exercise of an option under the Share Option Plans. Such consideration generally may consist of cash, or, at the discretion of the Board of Directors, cash and a recourse promissory note.
The ordinary shares acquired upon exercise of an option are subject to certain restrictions on transfer, sale or hypothecation. Options are exercisable and restrictions on disposition of shares lapse pursuant to the terms of the individual agreements under which such options were granted or shares issued.
The Section 102 Share Options Plans are designed to afford qualified optionees certain tax benefits under the Israel Income Tax Ordinance.
2003 Plan
In May 2003 the Company’s shareholders approved the adoption of the 2003 Israeli Stock Option Plan, pursuant to which 125,000 ordinary shares were reserved for purchase by the employees, directors, consultants and service providers of the Company and its subsidiaries. Subsequently, the shareholders approved increases of the shares reserved for issuance under the 2003 Plan, initially to 200,000, and thereafter to 300,000, to 520,000, to 830,000 and in December 21, 2011 to 1,100,000. The Board of Directors has resolved that no further grants shall be made under previous plans. The Company has elected to designate the 2003 Plan as providing benefits available under the “capital gains” alternative. Pursuant to the election made by the Company, capital gains derived by optionees arising from the sale of shares derived from the exercise of options granted to them under Section 102, will be subject to a flat capital gains tax rate of 25% (instead of the gains being taxed as salary income at the employee’s marginal tax rate). However, as a result of this election, the Company is not allowed to claim as an expense for tax purposes the amounts credited to such employees as a benefit when the related capital gains tax is payable by them. The Company may change its election from time to time, as permitted by the Tax Ordinance. There are various conditions that must be met in order to qualify for these benefits, including registration of the options in the name of a trustee (the “Trustee”) for each of the employees who is granted options. Each option, and any ordinary shares acquired upon the exercise of the option, must be held by the Trustee for a period commencing on the date of grant and ending no earlier than 24 months from the date of grant.
- 58 -
As of March 31, 2012 we had 464,261 options outstanding under this plan (of which 393,036 are exercisable) with the exercise prices as set forth below:
|
Exercise Price Per Share $
|
Outstanding
|
|||||
|
Less than $0.9
|
51,751 | |||||
| $ | 0.95 | 89,440 | ||||
| $ | 2.00 | 36,794 | ||||
| $ | 2.10 | 1,500 | ||||
| $ | 2.478 | 1,500 | ||||
| $ | 2.50 | 20,000 | ||||
| $ | 2.75 | 14,400 | ||||
| $ | 3.05 | 6,000 | ||||
| $ | 5.0 | 54,930 | ||||
| $ | 7.33 | 1,500 | ||||
| $ | 7.495 | 1,500 | ||||
| $ | 8.40 | 15,000 | ||||
| $ | 11.925 | 80,000 | ||||
| $ | 12.60 | 60,280 | ||||
| $ | 13.40 | 28,066 | ||||
| $ | 15.00 | 1,600 | ||||
|
Total
|
464,261 | |||||
7A. Major Shareholders
We are not directly or indirectly owned or controlled by another corporation or by any foreign government.
The following table sets forth, as of March 31, 2012, to the best of the Company’s knowledge, information as to each person known to the Company to be the beneficial owner of more than five percent (5%) of the Company’s outstanding ordinary shares. Except where indicated, to the best of the Company’s knowledge based on information provided by the owners, the beneficial owners of the ordinary shares listed below have sole investment and voting power with respect to those shares. Applicable percentage ownership in the following table is based on 4,471,636 shares outstanding as of March 31, 2012.
The shareholders’ holdings reflect their voting rights. The Company’s major shareholders do not have different voting rights than other shareholders, with respect to their shares.
- 59 -
|
Shares Beneficially Owned
|
||||||||||||||||
|
Name and Address
|
Outstanding Shares
|
Warrant Shares (2)
|
Total Shares
|
Percent
|
||||||||||||
|
Catalyst Funds (1)
3 Daniel Frisch Street,
|
850,103 | 163,077 | 1,013,180 | 21.86 | % | |||||||||||
|
SITA S.A. (3)
27, RTE DE GY 1252 Meinier, Geneva, Switzerland
|
627,984 | 172,862 | 800,846 | 17. 24 | % | |||||||||||
|
Bellite Pty Limited (4)
7 Beresford Road, Rose Bay 2029, NSW, Australia
|
465,142 | 115,385 | 580,527 | 12.66 | % | |||||||||||
|
Dimex Systems (1988) Ltd. (5)
3 Tvuot Ha’aretz Street, Tel Aviv 69546, Israel
|
425,385 | 326,414 | 751,799 | 15.67 | % | |||||||||||
|
Telegraph Hill Capital Fund I, LLC (6)
|
257,362 | 75,939 | 333,301 | 7.33 | % | |||||||||||
|
|
(1)
|
Represents shares held by Catalyst Investments L.P. and by Catalyst Private Equity Partners (Israel) II L.P. Catalyst Investments L.P. is the general partner of Catalyst Fund L.P., Catalyst Fund II L.P. and Catalyst Fund III, L.P., all of which are limited partnerships organized and existing under the laws of the State of Israel. Recently, the partnerships listed above were dissolved and the Company’s shares are held by Catalyst Investments on behalf of the limited partners of the funds. Catalyst Investments is in the process of distributing these shares to its limited partners. Catalyst Private Equity Partners (Israel) II L.P. is continuing its operations and the number includes 426,651 shares held by it.
|
Mr. Edouard Cukierman may be deemed to have sole voting and dispositive power with respect to shares held by Catalyst Investments. Mr. Cukierman disclaims beneficial ownership in such shares, except to the extent of his proportionate interest in them as an indirect shareholder in Catalyst Investments.
|
|
Mr. Edouard Cukierman may be deemed to have sole voting and dispositive power with respect to shares held by Catalyst Private Equity Partners (Israel) II L.P. Mr. Cukierman disclaims beneficial ownership in such shares except to the extent of his proportionate interest in them as an indirect shareholder in the general partner of Catalyst Private Equity Partners (Israel) II L.P.
|
|
|
(2)
|
Represents shares issuable upon exercise of warrants that may be exercised within 60 days following the date of this report.
|
|
|
(3)
|
Mr. Gérard Limat may be deemed to have sole voting and dispositive power with respect to the shares held by SITA SA.
|
|
|
(4)
|
Mr. Les Szekely may be deemed to have sole voting and dispositive power with respect to the shares held by Bellite Pty Limited.
|
|
|
(5)
|
Ms. Gabriela Jacobs may be deemed to have sole voting and dispositive power with respect to the shares held by Dimex Systems.
|
|
|
(6)
|
Messrs. Luis Gutierrez Roy and Clarence Wesley may be deemed to have shared voting and dispositive power with respect to the shares held by Telegraph Hill Capital Fund I, LLC.
|
- 60 -
The changes in holdings (excluding warrants) of the major shareholders over the last three years are detailed, to the best of our knowledge, in the table below:
|
Holdings as of:
|
December 31, 2009
|
December 31, 2010
|
December 31, 2011
|
March 31, 2012
|
||||||||||||
|
Catalyst Funds (1)
|
423,451 | 423,451 | 850,103 | 850,103 | ||||||||||||
|
D.S. Apex Holdings Ltd.
|
270,994 | - | - | - | ||||||||||||
|
SITA
|
175,734 | 175,734 | 627,984 | 627,984 | ||||||||||||
|
Bellite Pty Limited
|
163,266 | 163,266 | 465,142 | 465,142 | ||||||||||||
|
Telegraph Hill Capital Fund I, LLC
|
- | 96,362 | 257,362 | 257,362 | ||||||||||||
|
(1)
|
Represents shares held by Catalyst Investments L.P. and by Catalyst Private Equity Partners (Israel) II L.P.
|
As of March 31, 2012, there were 48 record holders of ordinary shares, of which 9 were registered with addresses in the United States, representing approximately 32% of the outstanding ordinary shares. However, the number of record holders in the United States is not representative of the number of beneficial holders nor is it representative of where such beneficial holders are resident since many of the ordinary shares are held of record by brokers and other nominees.
7B. Related Party Transactions
Grant of Shares and Options to Mr. Cukierman
On November 7, 2007 the Company’s shareholders approved an Active Chairman Agreement with Mr. Edouard Cukierman. Pursuant to this Agreement, in consideration for Mr. Cukierman’s services as the Company’s Active Chairman in the years 2007-2010, he was granted 80,000 options in four equal annual tranches (pro-rated for any part of the Calendar year). The options were in lieu of any compensation, fees or options otherwise payable by the Company to Mr. Cukierman as a director.
The options vested on a quarterly basis. The exercise price of the options was $11.925, which was equal to the weighted average of the closing prices of the Company’s ordinary shares on the Nasdaq Global Market during the thirty-day period preceding the shareholders approval. Unexercised options expire after five years from their respective grant date.
- 61 -
In December 2011, the Company’s shareholders approved a new Active Chairman Agreement with Mr. Cukierman. Pursuant to this agreement, in consideration for Mr. Cukierman’s services as the Company’s Active Chairman in the years 2011-2014, he shall be granted options to purchase 89,440 ordinary shares, and be paid a monthly cash payment of $5,000, plus VAT at the prevailing rate. Payment of the cash fee shall be made each month in respect of the previous month of service. Following approval by the shareholders in December, 2011, the cash fees for 2011 were paid retroactively for the entire year. The exercise price of the options is $0.95 and they vest and become exercisable in 16 equal quarterly installments of 5,590 options each. The first three installments vested immediately following the shareholders' approval, and the fourth installment vested on December 31, 2011. Additional installments vest at the end of each subsequent calendar quarter, provided that Mr. Cukierman shall hold his position as Chairman of the Board at the applicable vesting date. Pursuant to the agreement, if Mr. Cukierman’s service to the Company is terminated by the Company for no cause then: (a) any unvested options shall be accelerated, so that they become immediately vested in full as of the date of the termination and (b) the accelerated options and any previously vested options shall be exercisable for twenty four (24) months following the termination. Except for in the events of acceleration or termination for cause, the options are exercisable for five years from the grant date.
The options and the cash fee are in lieu of any compensation, fees or options otherwise payable by the Company to Mr. Cukierman as a director.
In 2003, the Company's audit committee and Board approved the engagement of Cukierman & Co., to provide non-exclusive investment-banking services and business development services to the Company, effective April 15, 2003 (the “Services Agreement”). Cukierman & Co. is a company indirectly controlled by Mr. Edouard Cukierman. Since June 26, 2003, he serves as Chairman of the Company's Board, and he may also be deemed to have sole voting and dispositive power with respect to shares held by Catalyst Investments and by Catalyst Private Equity Partners (Israel) II L.P. For its services, Cukierman & Co. is paid a monthly sum of $10,000 plus VAT (from February 9, 2009 until December 31, 2010, Cukierman & Co. agreed to temporarily reduce such fee to $8,500), in addition to a success fee of 4%-6% for a consummated private placements. The Services Agreement, as supplemented, provides for success fees in connection with securing M&A transactions of 3.5% of the proceeds exchanged in such a transaction and also for a success fee of 6% of the revenues actually received by the Company in respect of a sale of the Company's products to a new customer which was introduced by Cukierman & Co. According to its terms, the Company may terminate the Service Agreement at any time, by giving a one-month prior written notice.
For payments the Company paid and accrued pursuant to the Services Agreement in year 2011 see Note 19 to the Consolidated Financial Statements for the year ended December 31, 2011.
- 62 -
Agreements with Telegraph Hill Capital I, LLC (“Telegraph Hill Capital”)
Mr. Luis Gutierrez Roy, a director of the Company since October 2010, is the managing partner of Telegraph Hill Capital and may be deemed to have shared voting and dispositive power with respect to company shares held by Telegraph Hill Capital.
In September 2009, the Company entered into a service agreement with Telegraph Hill Capital, pursuant to which Telegraph Hill Capital was to provide the Company with non-exclusive private financing and business consulting services. In consideration, the Company issued to Telegraph Hill Capital warrants to purchase 14,400 ordinary shares at an exercise price of $2.75 per share. The warrants were exercisable as of February 28, 2011, and can be exercised until August 31, 2012.
In November 2009, the Company entered into an amendment to the service agreement with Telegraph Hill Capital, pursuant to which Telegraph Hill Capital shall be paid a success fee of 5% of the revenues generated to the Company from the sale of the Company products to business partners introduced by Telegraph Hill Capital. For payments the Company paid and accrued pursuant to the Services Agreement in year 2011 see Note 19c to the Consolidated Financial Statements for the year ended December 31, 2011.
On October 5, 2010, the Company entered into a share purchase agreement with Telegraph Hill Capital for the issuance of an aggregate of 96,362 Ordinary Shares at a price per share of $3.11, or approximately $300,000 in total. Pursuant to this agreement, Mr. Luis Gutierrez Roy was appointed to the Board of Directors.
In March 2012, the Company’s Audit Committee and Board of Directors approved an additional grant of warrants to Telegraph Hill Capital to purchase 14,400 ordinary shares. The grant is subject to the Company's shareholder approval. The warrants' exercise price, if approved, will be equal to the weighted average of the closing prices of the Company’s ordinary shares on the Nasdaq Capital Market, during the twenty-day period preceding the date of the shareholders' approval. The warrants will be exercisable for 3 years from their date.
Management Agreement with Shalom Daskal and N-D-P Consulting Ltd.
Starting from November 2008 until October 2009, Mr. Shalom Daskal provided the Company with CEO services through a management agreement by and among the Company, Shalom Daskal and N-D-P Consulting Ltd. In addition, Mr. Daskal received 80,000 options to purchase the Company’s ordinary shares, in connection with his service as a director in the Company’s subsidiaries. The terms of the options are as follows: (1) options to purchase 30,000 ordinary shares, which have an exercise price of NIS 0.05 per ordinary Share and vest and become exercisable in 3 equal semi-annual installments of 10,000 options each, with the first installment vesting upon the lapse of 6 months from November 19, 2008. (2) Options to purchase up to 50,000 ordinary shares, which have an exercise price equal to NIS 20.00. These options vest and become exercisable in 10 equal quarterly installments of 5,000 options each, with the first installment vesting in March 30, 2009 and thereafter upon the lapse of every 4 months.
In May 2009, Mr. Daskal was granted an additional 38,967 options to purchase the Company's ordinary shares. The terms of the options are as follows: (a) 12,567 options to purchase ordinary shares, with an exercise price of $0.00 per ordinary share. The options vest on a quarterly basis starting from January 2009 over a period of four quarters, in four equal parts. The exercise period of these options is 5 years from the commencement of vesting; (b) 26,400 options to purchase ordinary shares, with an exercise price of $5.00 per ordinary share. These options vest on a yearly basis starting from January 2009 over a period of four years, in four equal parts. The exercise period of these options is 5 years from the commencement of the vesting.
- 63 -
On October 20, 2009, Shalom Daskal has ceased to serve as the Chief Executive Officer of the Company. In November 2009, as part of a separation agreement between the Company and Shalom Daskal, the Company repaid to Mr. Daskal $50,000 of convertible loan he had previously extended to it. As of April 30, 2011, Mr. Daskal holds 50,000 options to purchase the Company’s ordinary shares.
August 2009 Private Placement
In August 2009, the Company closed a $2.4 million Convertible Loan Financing with several lenders including Catalyst Private Equity Partners (Israel) II L.P (For more details on the aforementioned loan financing see “Item 5B. Liquidity and Capital Resources”). In connection with certain lenders participating in this transaction, BOS paid $40,000 to Cukierman & Co., equaling 6% of the investment amount, as placement fees. Placement fees in respect of Catalyst and SITA, in amount of $61,800 were credited to the accounts of these lenders.
Indemnity Undertakings by the Company to its Directors and Officers
On February 18, 2003, the Company’s shareholders approved indemnity undertakings to its directors and officers (including future directors and officers as may be appointed from time to time), in excess of any insurance proceeds, not to exceed, in the aggregate over the years, a total amount of $2,500,000. On May 18, 2006, at the recommendation of the Audit Committee and the Board of Directors, the shareholders approved amendments to the indemnity undertakings, in light of changes to the Israeli Companies Law. On December 20, 2011, following a recent amendment to the Israeli Securities Law and a corresponding amendment to the Companies Law, which had authorized the Israeli Securities Authority to impose administrative sanctions against companies and their office holders for certain violations of the Israeli Securities Law or the Companies Law, the Company’s shareholders approved a modified form of such indemnification agreement to ensure that the Company’s directors were afforded protection to the fullest extent permitted by law.
In addition, under the new indemnification agreements, the Company exempts and releases each director from any and all liability to the Company related to any breach by each director of his duty of care to the Company, to the maximum extent permitted by law.
7C. Interests of Experts and Counsel
Not applicable.
8A. Consolidated Statements and Other Financial Information
Consolidated Financial Statements
See “Item 18. Financial Statements”.
- 64 -
Sales Outside of Israel
The total amount of revenues of the Company and its subsidiaries continued operations from sales out of Israel has been as follows:
|
Year
|
Export revenues
|
% of all revenues
|
||
|
2011
|
$6,433,000
|
19%
|
||
|
2010
|
$5,635,000
|
19%
|
||
|
2009
|
$3,112,000
|
12%
|
Legal Proceedings
On November 2008, Blockshtil Ltd. filed a claim in the Petach-Tikva Magistrate Court alleging breach of contract by the Company and seeking damages in the amount of NIS 149,000 (approximately $42,000). The Company has filed its statement of defense, and the final hearing in this case is expected to take place on September 12, 2012.
The Company's financial statements include a provision in this respect.
Dividend Policy
The Company does not currently have a dividend policy. The declaration and payment of any cash dividends in the future will be determined by the Board of Directors in light of the conditions existing at that time. This will include our earnings and financial condition. We may only pay cash dividends in any fiscal year, out of “profits”, as defined under Israeli law. Any cash dividend in the future out of an approved enterprise will be subject to an additional tax. Currently we have no profits from an approved enterprise; hence no provision has been made for tax on future dividends.
8B. Significant Changes
Not applicable.
9A. Offer and Listing Details
Commencing April 1996, our ordinary shares were traded, and our warrants, until they expired on April 2, 2000, were traded in the over-the-counter market in the United States, and quoted on what is now called the NASDAQ Capital Market under the symbol “BOSC” and “BOSCW,” respectively. In September 2000, our shares started to be traded on what is now called the NASDAQ Global Market. In January 2002, our shares began trading also on the TASE, under the symbol “BOSC”, pursuant to the dual-listing regulations of the Israeli Securities Authority. On May 12, 2009, we delisted our ordinary shares from trade on the TASE. The delisting of the ordinary shares from the TASE did not affect the continued listing of the ordinary shares on the NASDAQ Global Market under the symbol BOSC. After the delisting of the Company’s ordinary shares from the TASE, we are no longer subject to reporting requirements in Israel. On October 16, 2009, the Company’s ordinary shares were transferred to the NASDAQ Capital Market and are traded on such market under the symbol “BOSC”.
- 65 -
Prices set forth below are high and low reported closing prices for our ordinary shares as reported by NASDAQ for the periods indicated. All share prices have been retroactively adjusted to reflect the 1:5 reverse share split effected on January 12, 2010.
|
Period
|
High ($)
|
Low ($)
|
|||||||
|
Annual Information
|
|||||||||
|
2007
|
Annual
|
14.50 | 9.50 | ||||||
|
2008
|
Annual
|
10.25 | 1.15 | ||||||
|
2009
|
Annual
|
3.30 | 1.10 | ||||||
|
2010
|
Annual
|
3.30 | 0.77 | ||||||
|
2011
|
Annual
|
3.52 | 0.68 | ||||||
|
Quarterly Information (2010)
|
|||||||||
|
First Quarter
|
1.45 | 1.12 | |||||||
|
Second Quarter
|
1.43 | 0.93 | |||||||
|
Third Quarter
|
3.30 | 0.77 | |||||||
|
Fourth Quarter
|
3.10 | 1.35 | |||||||
|
December
|
1.77 | 1.35 | |||||||
|
Quarterly Information (2011)
|
|||||||||
|
First Quarter
|
2.68 | 1.36 | |||||||
|
Second Quarter
|
3.52 | 1.9 | |||||||
|
Third Quarter
|
2.73 | 1.1 | |||||||
|
Fourth Quarter
|
1.27 | 0.68 | |||||||
|
December
|
1.00 | 0.68 | |||||||
|
Monthly Information (2012)
|
|||||||||
|
January
|
0.94 | 0.72 | |||||||
|
February
|
0.90 | 0.71 | |||||||
|
March
|
1.19 | 0.85 | |||||||
|
April (until April 29)
|
1.05
|
0.80
|
|||||||
9B. Plan of Distribution
Not applicable.
9C. Markets
Our securities are traded on the NASDAQ Capital Market under the symbol “BOSC”.
- 66 -
9D. Selling Shareholders
Not applicable.
9E. Dilution
Not applicable.
9F. Expenses of Issue
Not applicable.
10A. Share Capital
Not applicable.
10B. Memorandum and Articles of Association
The Company’s registration number at the Israeli Registrar of Companies is 52-0042565.
In March 2002 the Company adopted new Articles of Association, in view of the Israeli Companies Law. Since then, certain articles of the Article of Association have been amended.
Set forth below is a summary of certain provisions of our Memorandum and Articles of Association. This summary is not complete and should be read together with our Memorandum and Articles of Association, filed as exhibits hereto.
1. Objects of the Company:
The Company’s Memorandum of Association (Article 2(p)) and Articles of Association (Article 2) provide that the Company may engage in any legal business.
2. Provisions related to the directors of the Company:
The Board of Directors may issue shares and other securities, which are convertible or exercisable into shares, up to the limit of the Company’s authorized share capital.
(a) Approval of Certain Transactions under the Israeli Companies Law:
We are subject to the provisions of the Israeli Companies Law, which became effective on February 1, 2000, as amended. See Item 6C: Board Practices above.
(b) Borrowing powers exercisable by the Directors are not specifically outlined in the Company’s Articles of Association, however, according to Article 15: “Any power of the Company which has not been vested in another organ pursuant to the Israeli Companies Law or the articles may be exercised by the Board of Directors”.
- 67 -
(c) The Company’s Articles of Association do not contain provisions regarding the retirement of directors under an age limit requirement, nor do they contain a provision requiring a Director to hold any Company shares in order to qualify as a Director.
3. With regard to the rights, preferences and restrictions attaching to the shares, the Company’s Articles of Association provide the following:
(a) Dividends, Rights to Share in the Company’s Profits and Rights to Share in any Surplus upon Liquidation
All holders of paid-up ordinary shares of the Company have an equal right to participate in the distribution of (i) dividends, whether by cash or by bonus shares; (ii) Company assets; and (iii) the Company’s surplus assets upon winding up, all pro rata to the nominal value of the shares held by them (Articles 4.2.2, 4.2.3 and 7.3).
The Board of Directors is the organ authorized to decide upon the distribution of dividends and bonus shares (Article 26). The shareholders who are entitled to a dividend are the shareholders on the date of the resolution for the dividend or on a later date if another date is specified in the resolution on the dividend’s distribution. If the Board of Directors does not otherwise determine, any dividend may be paid by way of a cheque or payment order that shall be sent by mail in accordance with the registered address of the shareholder or person entitled thereto, or in the case of registered joint shareholders to the shareholder whose name appears first in the shareholders’ register in relation to the joint shareholding. Every such cheque shall be drawn up to the order of the person to whom it is being sent. The receipt of a person who on the date of the dividend’s declaration is listed in the shareholders’ register as the holder of any share or, in the case of joint shareholders, of one of the joint shareholders shall serve as confirmation of all the payments made in connection with such share. For the purpose of implementing any resolution pursuant to the provisions of this paragraph, the Board of Directors may settle, as it deems fit, any difficulty arising in relation to the distribution of the dividend and/or bonus shares, including determine the value for the purpose of the said distribution of certain assets and resolve that payments in cash shall be made to members in reliance upon the value thus determined, determine regulations in relation to fractions of shares or in relation to non-payment of amounts less than NIS 200.
(b) Voting Rights
All holders of paid-up ordinary shares of the Company have an equal right to participate in and vote at the Company’s general meetings, whether ordinary or special, and each of the shares in the Company shall entitle its holder, present at the meeting and participating in the vote, himself, by proxy or through a voting instrument, to one vote (Article 4.2.1). Such voting rights may be affected in the future by the grant of any special voting rights to the holders of a class of shares with preferential rights. Shareholders may vote either in person or through a proxy or voting instrument, unless the Board of Directors prohibited voting through a voting instrument on a certain matter and stated so in the notice of the meeting (Articles 14.1 and 14.6). A resolution at the general meeting shall be passed by an ordinary majority unless another majority is specified in the Israeli Companies Law or the Company’s Articles of Association (Article 14.3). For applicable provisions of the Israel Companies Law, see Item 6C: Board Practices.
- 68 -
(c) Election of Directors.
The Company’s directors are elected by the shareholders at a shareholders’ meeting. The ordinary shares do not have cumulative voting rights in the election of directors. The holders of ordinary shares conferring more than 50% of the voting power present by person or by proxy at the shareholders’ meeting, have the power to elect the directors. The directors elected shall hold office until the next annual meeting, or sooner if they cease to hold office pursuant to the provisions of the Company’s Articles. In addition, the Board of Directors may appoint a director (to fill a vacancy or otherwise) between shareholder meetings, and such appointment shall be valid until the next annual meeting or until such appointee ceases to hold office pursuant to the provisions of the Company’s Articles. In compliance with the Israeli Companies Law, the Company has two external directors. The external directors are also appointed by the shareholders, subject to special majority requirements. Directors of the Company stand for reelection at every annual meeting (Article 16.2) and not at staggered intervals, with the exception of the External directors who are appointed for a term of 3 years under the Israeli Companies Law.
(d) Redemption
The Company may, subject to any applicable law, issue redeemable securities on such terms as determined by the Board of Directors, provided that the general meeting of shareholders approves the Board of Director’s recommendation and the terms determined (Article 27).
(e) Capital Calls by the Company
The Board of Directors may only make calls for payment upon shareholders in respect of monies not yet paid for shares held by them (Article 7.2).
(f) Discrimination
No provision in the Company’s Articles of Association discriminates against an existing or prospective holder of securities, as a result of such shareholder owning a substantial amount of shares.
4. Modification of Rights of Holders of Stock:
The general meeting of shareholders may resolve to create new shares of an existing class or of a new class with special rights and/or restrictions (Article 9.1).
So long as not otherwise provided in the shares’ issue terms and subject to the provisions of any law, the rights attached to a particular class of shares may be altered, after a resolution is passed by the Company and with the approval of a resolution passed at a general meeting of the holders of the shares of such class or the written agreement of all the class holders. The provisions of the Company’s Articles of Association regarding general meetings shall apply, mutatis mutandis, to a general meeting of the holders of a particular class of shares (Article 10.1). The rights vested in the holders of shares of a particular class that were issued with special rights shall not be deemed to have been altered by the creation or issue of further shares ranking equally with them, unless otherwise provided in such shares’ issue terms (Article 10.2).
- 69 -
The above mentioned conditions are not more onerous than is required by law.
5. Annual General Meetings and Extraordinary General Meetings:
General meetings shall be convened at least once a year at such place and time as determined by the Board of Directors but no later than 15 months from the last general meeting. Such general meetings shall be called “annual meetings”. The Company’s other meetings shall be called “special meetings” (Article 12.1). The annual meeting’s agenda shall include a discussion of the Board of Directors’ reports and the financial statements as required at law. The annual meeting shall appoint an auditor, appoint the directors and discuss all the other matters which must be discussed at the Company’s annual general meeting, pursuant to Company’s Articles or the Companies Law, as well as any other matter determined by the Board of Directors (Article 12.2).
The Board of Directors may convene a special meeting pursuant to its resolution and it must convene a general meeting if it receives a written requisition from any one of the following (hereinafter referred to as “requisition”) (i) two directors or one quarter of the directors holding office; and/or (ii) one or more shareholders holding at least 5% of the issued capital and at least 1% of the voting rights in the Company; and/or (iii) one or more shareholders holding at least 5% of the voting rights in the Company (Article 12.3). A requisition must detail the objects for which the meeting must be convened and shall be signed by the persons requisitioning it and sent to the Company’s registered office. The requisition may be made up of a number of documents in an identical form of wording, each of which shall be signed by one or more of the persons requisitioning the meeting (Article 12.4). Where the Board of Directors is required to convene a special meeting, it shall do so within 21 days of the requisition being submitted to it, for a date that shall be specified in the invitation and subject to the law (Article 12.5).
Notice to the Company’s members regarding the convening of a general meeting shall be sent to all the shareholders listed in the Company’s shareholders’ register at least 21 days prior to the meeting and shall be published in other ways insofar as required by the law. The notice shall include the agenda, proposed resolutions and arrangements with regard to a written vote. The accidental omission to give notice of a meeting to any member, or the non-receipt of notice sent to such member, shall not invalidate the proceedings at such meeting (Article 12.6).
The shareholders entitled to participate in and vote at the general meeting are the shareholders on the date specified by the Board of Directors in the resolution to convene the meeting, and subject to the law (Article 14.1).
No discussions may be commenced at the general meeting unless a quorum is present at the time of the discussion’s commencement. A quorum is the presence of at least two shareholders holding at least 33⅓% of the voting rights (including presence through a proxy or a voting instrument), within half an hour of the time fixed for the meeting’s commencement (Article 13.1). If no quorum is present at a general meeting within half an hour of the time fixed for the commencement thereof, the meeting shall be adjourned for one week, to the same day, time and place, or to a later time if stated in the invitation to the meeting or in the notice of the meeting (hereinafter referred to as the “adjourned meeting”) (Article 13.2). The quorum for the commencement of the adjourned meeting shall be any number of participants.
- 70 -
The Articles of Association provide that all shareholder resolutions shall be passed by an ordinary (simple) majority of the votes cast, unless another majority is specified in the Israeli Companies Law or in the Articles (Article 14.3).
|
6.
|
Limitations on the rights to own securities:
|
There are no limitations on the rights to own the Company’s securities, including the rights of non-residents or foreign shareholders to do so.
|
7.
|
Change of Control:
|
Under the Israeli Companies Law, a merger is generally required to be approved by the shareholders and Board of Directors of each of the merging companies. Shareholder approval isn’t required if the company that will not survive is controlled by the surviving company. Additionally, the law provides some exceptions to the shareholder approval requirement in the surviving company. If the share capital of the company that will not be the surviving company is divided into different classes of shares, the approval of each class is also required, unless determined otherwise by the court. A majority of votes approving the merger shall suffice, unless the company (like ours) was incorporated in Israel prior to the Israeli Companies Law, in which case a majority of 75% of the voting power is needed in order to approve the merger. Additionally, unless the court determines differently, a merger will not be approved if it is objected to by a majority of the shareholders present at the meeting, after excluding the shares held by the other party to the merger, by any person who holds 25% or more of the other party to the merger and by the relatives of and corporations controlled by these persons. Upon the request of a creditor of either party to the proposed merger, the court may delay or prevent the merger if it concludes that there exists a reasonable concern that, as a result of the merger, the surviving company will be unable to satisfy the obligations of any of the parties of the merger. Also, a merger can be completed only after all approvals have been submitted to the Israeli Registrar of Companies and provided that 30 days have elapsed since shareholder approval was received and 50 days have elapsed from the time that a proposal for approval of the merger was filed with the Registrar by each merging company.
The Israeli Companies Law also provides that an acquisition of shares in a public company must be made by means of a tender offer if, as a result of the acquisition, the purchaser would become a holder of 25% or more of the voting power at general meetings. This rule does not apply if there is already another holder of 25% or more of the voting power at general meetings. Similarly, the Israeli Companies Law provides that an acquisition of shares in a public company must be made by means of a tender offer if, as a result of the acquisition, the purchaser would become a holder of more than 45% of the voting power of the company. This rule does not apply if someone else already holds 45% of the voting power of the company. An acquisition from a 25% or 45% holder, which turns the purchaser into a 25% or 45% holder respectively, does not require a tender offer. An exception to the tender offer requirement may also apply when the additional voting power is obtained by means of a private placement approved by the general meeting of shareholders.
- 71 -
Under the Israeli Companies Law, a person may not acquire shares in a public company if, after the acquisition, he will hold more than 90% of the shares or more than 90% of any class of shares of that company, unless a tender offer is made to purchase all of the shares or all of the shares of the particular class. The Israeli Companies Law also provides that as long as a shareholder in a public company holds more than 90% of the company’s shares or of a class of shares, that shareholder shall be precluded from purchasing any additional shares. If a tender offer is accepted and less than 5% of the shares of the company are not tendered, and a majority of the offeree shareholders not having a personal interest accepted the offer, all of the shares will transfer to the ownership of the purchaser. The Companies Law provides for appraisal rights if any shareholder files a request in court within six months following the consummation of a full tender offer. However, the acquirer may stipulate in the tender offer that any shareholder tendering his shares will not be entitled to appraisal rights. If more than 5% of the outstanding shares are not tendered in the tender offer, then the acquirer may not acquire shares in the tender offer that will cause his shareholding to exceed 90% of the outstanding shares.
|
8.
|
Disclosing Share Ownership:
|
The Company has no bylaw provisions governing the ownership threshold, above which shareholder ownership must be disclosed.
10C. Material Contracts
All material contracts have been described in detail throughout this form, wherever applicable.
10D. Exchange Controls
There are currently no Israeli currency control restrictions on payments of dividends or other distributions with respect to our ordinary shares or the proceeds from the sale of the shares, except for the obligation of Israeli residents to file reports with the Bank of Israel regarding certain transactions. However, legislation remains in effect pursuant to which currency controls can be imposed by administrative action at any time.
10E. Taxation
The following is a summary of the material Israeli tax consequences, Israeli foreign exchange regulations and certain Israeli government programs affecting the Company.
To the extent that the discussion is based on new tax or other legislation that has not been subject to judicial or administrative interpretation, there can be no assurance that the views expressed in the discussion will be accepted by the tax or other authorities in question. The discussion is not intended, and should not be construed, as legal or professional tax advice and is not exhaustive of all possible tax considerations.
ISRAELI TAX CONSIDERATIONS
The following is a description of material tax consequences regarding the ownership and disposition of our ordinary shares under Israeli tax laws to which our shareholders may be subject. The information below does not apply to specific persons or cover specific situations. Therefore, you are advised to consult your own tax advisor as to particular tax consequences unique to you related to an investment in our ordinary shares including the effects of applicable Israeli or foreign or other tax laws and possible changes in the tax laws.
- 72 -
To the extent that the discussion is based on legislation yet to be judicially or administratively interpreted, we cannot assure you that the views we express herein will accord with any such interpretation in the future.
Tax Consequences Regarding Disposition of Our Ordinary Shares
Israeli law generally imposes a capital gains tax on the sale of publicly traded securities. Pursuant to changes made to the Israeli Income Tax Ordinance in January 2006, capital gains on the sale of our ordinary shares will be subject to Israeli capital gains tax, generally at a rate of 20% unless the holder holds 10% or more of our voting power during the 12 months preceding the sale, in which case it will be subject to a 25% capital gains tax. However, as of January 1, 2003, nonresidents of Israel are exempt from capital gains tax in relation to the sale of our shares for so long as (i ) the capital gains are not accrued or derived by the nonresident shareholder’s permanent enterprise in Israel,(ii) the shares were not acquired from the seller's relative and the provisions of Part Five "B" (Restructuring and Merger ) or the provisions of section 70 of the Real Estate Taxation Law did not apply on the shares, (iii) the shares are not tradable in the Israeli stock exchange on the day of the sale.
Taxes Applicable to Dividends distributed
Non-residents of Israel are generally subject to Israeli income tax on the receipt of dividends paid on our ordinary shares at the rate of 20%, which tax will be withheld at source, unless a different rate is provided in a treaty between Israel and the shareholder’s country of residence. However, if the individual shareholder is a “Controlling Shareholder” such dividend will be taxed at the rate of 25%.
Under the U.S.-Israel Tax Treaty, the maximum rate of tax withheld in Israel on dividends paid to a holder of our ordinary shares who is a U.S. resident (within the meaning of the U.S.-Israel Tax Treaty) is 25%. Furthermore, the maximum rate of withholding tax on dividends, that are paid to a U.S. corporation holding 10% or more of our outstanding voting capital during the part of the tax year that precedes the date of the payment of the dividend and during the whole of its prior tax year, is 12.5%. This reduced rate will not apply if more than 25% of our gross income consists of interest or dividends, other than dividends or interest received from a subsidiary corporation 50% or more of the outstanding shares of the voting shares of which are owned by the company. In order to obtain such a reduced tax rate, it is necessary to submit an application to the tax assessing officer.
Israeli resident individuals are generally subject to Israeli income tax on the receipt of dividends paid on our ordinary shares, other than bonus shares (share dividends) or stock dividends, at the rate of 20%. However, if the individual shareholder is a “Controlling Shareholder” such dividend will be taxed at the rate of 25%. Dividends paid on our ordinary shares to Israeli companies are exempt from such tax, except for dividends distributed from income derived outside of Israel, which are subject to the 25% tax rate.
An Israeli resident company whose shares are listed in a stock exchange is obligated to withhold tax, upon the distribution of a dividend. The following withholding tax rates will apply: (i) Israeli resident corporation – 0%, (ii) Israeli resident individual – 20% (iii) non-Israeli resident – 20%, subject to a reduced tax rate under an applicable double tax treaty.
- 73 -
General Corporate Tax Structure in Israel
Taxable income of Israeli companies is subject to tax at the rate of 26% in 2009, 25% in 2010 and 24% in 2011, and was scheduled to gradually decline to 18% by 2016. However, this scheduled decline in corporate tax rates was repealed with the enactment of the Law for Tax Burden Reform (Legislative Amendments), 2011 in Israel in late 2011 and instead the corporate tax rate will revert to 25% in 2012 and thereafter.
Our effective corporate tax rate may substantially exceed the Israeli tax rate. Our US subsidiary will generally be subject to applicable federal, state and local taxation. Because of the complexity of these local tax provisions, it is not possible to anticipate the actual combined effective corporate tax rate that will apply to us.
Tax Benefits and Grants for Research and Development
Israeli tax law allows, under certain conditions, a tax deduction in the year incurred for expenditures (including capital expenditures) in scientific research and development projects, if the expenditures are approved by the relevant Israeli government ministry, determined by the field of research, the research and development is for the promotion of the enterprise and is carried out by or on behalf of the company seeking such deduction.
In case the tax deduction, in the year research and development expenditures are incurred, is not approved by the relevant Israeli government ministry, the Company will be entitled for the tax deduction over a period of three years.
Special Provisions Relating to Taxation under Inflationary Conditions
The Income Tax Law (Inflationary Adjustments), 1985, generally referred to as the Inflationary Adjustments Law, represents an attempt to overcome the problems presented to a traditional tax system by an economy undergoing rapid inflation.
According to the Inflationary Adjustments Law, until 2007, the results for tax purposes were adjusted for the changes in the Israeli CPI. In February 2008, the “Knesset,” the Israeli parliament, passed an amendment to the Inflationary Adjustments Law, which limits the scope of the law. Starting 2008, the results for tax purposes are measured in nominal values, excluding certain adjustments for changes in the Israeli CPI carried out in the period up to December 31, 2007. The amendment to the Inflationary Adjustments Law includes, inter alia, the elimination of the inflationary additions and deductions and the additional deduction for depreciation starting 2008.
- 74 -
UNITED STATES FEDERAL INCOME TAX CONSIDERATIONS
Subject to the limitations described herein, the following is a discussion of the material U.S. federal income tax consequences of the purchase, ownership and disposition of our ordinary shares to a U.S. holder. A U.S. holder is a beneficial owner of our ordinary shares who is:
|
·
|
an individual who is a citizen or resident of the United States for U.S. federal income tax purposes;
|
|
·
|
a corporation (or other entity taxable as a corporation for U.S. federal income tax purposes) created or organized under the laws of the United States or any political subdivision thereof or the District of Columbia;
|
|
·
|
an estate, the income of which is includible in gross income for U.S. federal income tax purposes regardless of its source; or
|
|
·
|
a trust: (i) if a U.S. court is able to exercise primary supervision over its administration and one or more U.S. persons have the authority to control all of its substantial decisions; or (ii) that has in effect a valid election under applicable U.S. Treasury Regulations to be treated as a U.S. person.
|
A non-U.S. holder is a beneficial owner of our ordinary shares that is not a U.S. holder. Unless otherwise specifically indicated, this discussion does not consider the U.S. federal income tax consequences to a person that is a non-U.S. holder of our ordinary shares and considers only U.S. holders that will own the ordinary shares as capital assets (generally for investment).
If a partnership (or any other entity treated as a partnership for U.S. federal income tax purposes) holds our ordinary shares, the tax treatment of the partnership and a partner in such partnership will generally depend on the status of the partner and the activities of the partnership. Such a partner or partnership should consult its tax advisor as to its tax consequences.
This discussion is based on current provisions of the Internal Revenue Code of 1986, as amended (the “Code”), current and proposed Treasury Regulations promulgated under the Code and administrative and judicial interpretations of the Code, all as currently in effect and all of which are subject to change, possibly with retroactive effect. This discussion does not address all aspects of U.S. federal income taxation that may be relevant to any particular U.S. holder based on the U.S. holder’s particular circumstances. In particular, this discussion does not address the U.S. federal income tax consequences to U.S. holders who are broker-dealers or who own, directly, indirectly or constructively, 10% or more (by voting power) of our company, real estate investment trusts, regulated investment companies, grantor trusts, U.S. holders holding the ordinary shares as part of a hedging, straddle or conversion transaction, U.S. holders whose functional currency is not the U.S. dollar, insurance companies, tax-exempt organizations, financial institutions, persons that receive ordinary shares as compensation for the performance of services, certain former citizens or long-term residents of the United States and persons subject to the alternative minimum tax, who may be subject to special rules not discussed below. Additionally, this discussion does not address the possible application of U.S. federal estate or gift taxes or any aspect of state, local or non-U.S. tax laws.
- 75 -
Each holder of our ordinary shares is advised to consult his or her tax advisor with respect to the specific U.S. federal, state, local and foreign income tax consequences to him or her of purchasing, holding or disposing of our ordinary shares.
U.S. Holders of Ordinary Shares
Taxation of distributions on ordinary shares
Subject to the discussion below under “Tax consequences if we are a passive foreign investment company,” a distribution paid by us with respect to our ordinary shares, including the amount of any non- U.S. taxes withheld, to a U.S. holder will be treated as dividend income to the extent that the distribution does not exceed our current and accumulated earnings and profits, as determined for U.S. federal income tax purposes. Dividends that are received with respect to ordinary shares by U.S. holders that are individuals, estates or trusts generally will be taxed at the rate applicable to long-term capital gains (currently a maximum rate of 15% for the taxable years beginning on or before December 31, 2012), provided that such dividends meet the requirements of “qualified dividend income.” Dividends that fail to meet such requirements, and dividends received by corporate U.S. holders, are taxed at ordinary income rates. No dividend received by a U.S. holder will be a qualified dividend (1) if the U.S. holder held the ordinary share with respect to which the dividend was paid for less than 61 days during the 121-day period beginning on the date that is 60 days before the ex-dividend date with respect to such dividend, excluding for this purpose, under the rules of Code section 246(c), any period during which the U.S. holder has an option to sell, is under a contractual obligation to sell, has made and not closed a short sale of, is the grantor of a deep-in-the-money or otherwise nonqualified option to buy, or has otherwise diminished its risk of loss by holding other positions with respect to, such ordinary share (or substantially identical securities); or (2) to the extent that the U.S. holder is under an obligation (pursuant to a short sale or otherwise) to make related payments with respect to positions in property substantially similar or related to the ordinary share with respect to which the dividend is paid. If we were to be a “passive foreign investment company” (as such term is defined in the Code) for any taxable year, dividends paid on our ordinary shares in such year or in the following taxable year would not be qualified dividends. In addition, a non-corporate U.S. holder will be able to take a qualified dividend into account in determining its deductible investment interest (which is generally limited to its net investment income) only if it elects to do so; in such case the dividend will be taxed at ordinary income rates.
The amount of any distribution which exceeds the amount treated as a dividend will be treated first as a non-taxable return of capital, reducing the U.S. holder’s tax basis in its ordinary shares to the extent thereof, and then as capital gain from the deemed disposition of the ordinary shares. Corporate holders will not be allowed a deduction for dividends received in respect of the ordinary shares.
Dividends paid by us in NIS will be included in the gross income of U.S. holders at the U.S. dollar amount of the dividend (including any non-U.S. taxes withheld therefrom), based upon the spot rate of exchange in effect on the date the distribution is included in income. U.S. holders will have a tax basis in the NIS for U.S. federal income tax purposes equal to that dollar value. Any subsequent gain or loss in respect of the NIS arising from exchange rate fluctuations will generally be taxable as U.S. source ordinary income or loss.
- 76 -
Subject to the limitations set forth in the Code and the Treasury Regulations thereunder, U.S. holders may elect to claim as a foreign tax credit against their U.S. federal income tax liability the non-U.S. income tax withheld from dividends received in respect of the ordinary shares. The limitations on claiming a foreign tax credit include, among others, computation rules under which foreign tax credits allowable with respect to specific classes of income cannot exceed the U.S. federal income taxes otherwise payable with respect to each such class of income. In this regard, dividends paid by us generally will be foreign source “passive income” for U.S. foreign tax credit purposes. U.S. holders that do not elect to claim a foreign tax credit may instead claim a deduction for the non-U.S. income tax withheld if they itemize deductions. The rules relating to foreign tax credits are complex, and you should consult your tax advisor to determine whether and to what extent you would be entitled to this credit. A U.S. holder will be denied a foreign tax credit for non-U.S. income taxes withheld from a dividend received on the ordinary shares (i) if the U.S. holder has not held the ordinary shares for at least 16 days of the 31-day period beginning on the date which is 15 days before the ex-dividend date with respect to such dividend or (ii) to the extent the U.S. holder is under an obligation to make related payments with respect to positions in substantially similar or related property. Any days during which a U.S. holder has substantially diminished its risk of loss on the ordinary shares are not counted toward meeting the required 16-day holding period. Distributions of current or accumulated earnings and profits generally will be foreign source passive income for U.S. foreign tax credit purposes.
Taxation of the disposition of ordinary shares
Subject to the discussion below under “Tax consequences if we are a passive foreign investment company” upon the sale, exchange or other disposition of our ordinary shares, a U.S. holder will recognize capital gain or loss in an amount equal to the difference between the amount realized on the disposition and the U.S. holder’s tax basis in the ordinary shares. The gain or loss recognized on the disposition of the ordinary shares will be long-term capital gain or loss if the U.S. holder held the ordinary shares for more than one year at the time of the disposition (long-term capital gains are currently taxable at a maximum rate of 15% for taxable years beginning on or before December 31, 2012). Capital gain from the sale, exchange or other disposition of ordinary shares held for one year or less is short-term capital gain. Gain or loss recognized by a U.S. holder on a sale, exchange or other disposition of ordinary shares generally will be treated as U.S. source income or loss for U.S. foreign tax credit purposes.
A U.S. holder that uses the cash method of accounting calculates the U.S. dollar value of the proceeds received on the sale as of the date that the sale settles. However, a U.S. holder that uses the accrual method of accounting is required to calculate the value of the proceeds of the sale as of the trade date and may therefore realize foreign currency gain or loss. A U.S. holder may avoid realizing foreign currency gain or loss by electing to use the settlement date to determine the proceeds of sale for purposes of calculating the foreign currency gain or loss. In addition, a U.S. holder that receives foreign currency upon disposition of ordinary shares and converts the foreign currency into U.S. dollars after the settlement date or trade date (whichever date the U.S. holder is required to use to calculate the value of the proceeds of sale) will have foreign exchange gain or loss based on any appreciation or depreciation in the value of the foreign currency against the U.S. dollar, which will generally be U.S. source ordinary income of loss.
- 77 -
Tax consequences if we are a passive foreign investment company
We will be a passive foreign investment company, or PFIC, for a taxable year if either (1) 75% or more of our gross income in a taxable year is passive income or (2) 50% or more of the value, determined on the basis of a quarterly average, of our assets in the taxable year produce, or are held for the production of, passive income. If we own (directly or indirectly) at least 25% by value of the stock of another corporation, we will be treated for purposes of the foregoing tests as owning our proportionate share of the other corporation’s assets and as directly earning our proportionate share of the other corporation’s income. Passive income for this purpose generally includes dividends, interest, royalties, rents and gains from commodities and securities transactions.
We believe that we were not a PFIC for our 2011 taxable year. Our status in the current and future taxable years will depend on our assets and income in those years. We have no reason to believe that our assets or income will change in a manner that would cause us to be classified as a PFIC. However, since the determination of whether we are a PFIC is based upon such factual matters as the valuation of our assets (which may depend upon our market capitalization, which is subject to fluctuation) and, in certain cases, the assets of companies held by us, there can be no assurance that we will not become a PFIC. If we were a PFIC, and you are a U.S. holder, you generally would be subject to imputed interest charges and other disadvantageous tax treatment with respect to any gain from the sale or exchange of, and certain distributions with respect to, your ordinary shares (including the denial of the taxation of such distributions and gains at the lower rates applicable to long-term capital gains as discussed above under “Taxation of distributions on ordinary shares” and “Taxation of the disposition of ordinary shares”).
If we were a PFIC, you could make certain elections that may alleviate certain tax consequences referred to above, and one of these elections may be made retroactively if certain conditions are satisfied. It is expected that the conditions necessary for making certain of such elections will apply in the case of our ordinary shares. Neither the Company nor its advisors have the duty to or will undertake to inform U.S. Shareholders of changes in circumstances that would cause the Company to become a PFIC. The Company does not currently intend to take the action necessary for a U.S. Shareholder to make a “qualified electing fund” election in the event the Company is determined to be a PFIC.
U.S. holders are urged to consult their tax advisors regarding the application of the PFIC rules, including eligibility for and the manner and advisability of making certain elections with respect to our PFIC status.
Information reporting and backup withholding
A U.S. holder generally is subject to information reporting and may be subject to backup withholding at a rate of 28% with respect to dividend payments made with respect to, and proceeds from the disposition of, the ordinary shares. Backup withholding will not apply with respect to payments made to exempt recipients, including corporations, or if a U.S. holder provides a correct taxpayer identification number, certifies that such holder is not subject to backup withholding or otherwise establishes an exemption. Backup withholding is not an additional tax. It may be claimed as a credit against the U.S. federal income tax liability of a U.S. holder or the U.S. holder may be eligible for a refund of any excess amounts withheld under the backup withholding rules provided, in either case, that the required information is furnished to the Internal Revenue Service.
- 78 -
Non-U.S. Holders of Ordinary Shares
Except as provided below, a non-U.S. holder of ordinary shares will not be subject to U.S. federal income or withholding tax on the receipt of dividends on, and the proceeds from the disposition of, an ordinary share, unless that item is effectively connected with the conduct by the non-U.S. holder of a trade or business in the United States and, in the case of a resident of a country which has an income tax treaty with the United States, that item is attributable to a permanent establishment in the United States or, in the case of an individual, a fixed place of business in the United States. In addition, gain recognized by an individual non-U.S. holder on the disposition of the ordinary shares will be subject to tax in the United States if such non-U.S. holder is present in the United States for 183 days or more in the taxable year of the sale and other conditions are met.
Non-U.S. holders are generally not subject to information reporting or backup withholding with respect to the payment of dividends on, or proceeds from the disposition of, ordinary shares, provided that the non-U.S. holder provides its taxpayer identification number, certifies to its foreign status or otherwise establishes an exemption.
10F. Dividends and Paying Agents
Not applicable.
10G. Statement by Experts
Not applicable.
10H. Documents on Display
The documents concerning the Company that are referred to in the form may be inspected at the Company’s office in Israel.
10I. Subsidiary Information
For information relating to the Company’s subsidiaries, see “Item 4C. Organizational Structure” as well as the Company’s Consolidated Financial Statements (Items 8 and 18 of this form).
Market risk represents the risk of changes in the value of our financial instruments caused by fluctuations in interest rates, foreign exchange rates and equity prices. We do not engage in trading market-risk instruments or purchase hedging or “other than trading” instruments that are likely to expose us to market risk, whether interest rate, commodity price or equity price risk. We have purchased forward contracts but do not use derivative financial instruments for speculative trading purposes.
Foreign currency exchange rate risk:
The results of operation and financial position of Dimex, whose functional currency is NIS, have been translated into U.S. dollars at the applicable exchange rate for inclusion in our consolidated financial statements, exposing us to currency translation risk.
In addition, we are exposed to currency transaction risk because some of our expenses are incurred in a different currency from the currency in which our revenues are received. Our most significant currency exposures are to the NIS. In periods when the U.S. dollar devaluate against this currency, our reported results of operations may adversely affected. The Company enters into foreign currency contracts, with financial institutions to reduce the risk of exchange rate fluctuations. Such contracts are not designated as hedging instruments. From time to time, the Company recognizes derivative instruments as either assets or liabilities on the balance sheet at fair value. As of December 31, 2011, the notional principal of foreign exchange contracts to purchase U.S. dollars with foreign currencies and to sell Euros for foreign currencies was $1.6 million, and €280,000. Although from time to time we enter into foreign currency contracts to reduce currency transaction risk, these transactions will not eliminate translation risk or all currency risk.
- 79 -
Credit Risk Management
The Company sells its products and purchases products from vendors on credit terms.
The trade receivables of the Company are derived from sales to customers located primarily in Israel and in the Far East. The Company generally does not require collateral, however most of the Company's customers outside of Israel are insured against customer nonpayment, through the Israeli Credit Insurance Company Ltd., and in certain circumstances, the Company may require letters of credit, guarantees, advanced payments, or other collateral.
Provisions are made for doubtful debts on a specific basis and, in management’s opinion, appropriately reflect the loss inherent in collection of the debts. Management bases this provision on its assessment of the risk of the debt.
The table below presents the account receivables balance by geographical market as of December 31, 2011 and December 31, 2010:
|
December 31
|
||||||||
|
2011
|
2010
|
|||||||
|
Americas
|
$ | 136,000 | $ | 490,000 | ||||
|
Europe
|
152,000 | 56,000 | ||||||
|
Far East
|
724,000 | 166,000 | ||||||
|
Israel and others
|
7,495,000 | 7,007,000 | ||||||
| $ | 8,507,000 | $ | 7,719,000 | |||||
- 80 -
Interest Rate Risk
The Company's exposure to market risk for changes in interest rates, is due to loans that carry variable interest.
A material change in interest pay on our loans may have an effect on the Company’s financial results and cash flow.
Bank Risk
The Company manages its loans mainly in Bank Leumi and Bank Hapoalim, which provides credit to the Company and its Israeli subsidiaries. In case of the termination or expiration of our credit lines, a deterioration in our relations with our bank or adverse changes in the financial position of the bank, our liquidity could be materially adversely affected.
Not applicable.
Not applicable.
Not applicable.
(a) Disclosure controls and procedures.
The Company’s principal executive officer and its principal financial officer evaluated the effectiveness of the Company’s disclosure controls and procedures (as defined in Rule 13a-15(e) and 15d-15(e) of the Securities Exchange Act of 1934, as amended) as of the end of the period covered by this report at the reasonable level of assurance (see paragraph (d) below). Based on that evaluation, such principal executive officer and principal financial officer concluded that the Company’s disclosure controls and procedures were effective as of the end of the period covered by this report. This Annual Report does not include an attestation report of our registered public accounting firm regarding the effectiveness of the Company
'
s internal control over financial reporting. Management's report was not subject to attestation by our registered public accounting firm pursuant to rules of the Securities and Exchange Commission that permit us to provide only management's report in this Annual Repor
t.
(b) Management's Annual Report on Internal Control Over Financial Reporting.
Our management, under the supervision of our Chief Executive Officer and Chief Financial Officer, is responsible for establishing and maintaining adequate internal control over financial reporting as defined in Rule 13a-15(e) and Rule 15d-15(e) of the Exchange Act. Our internal control system was designed to provide reasonable assurance regarding the reliability of financial reporting and the preparation and fair presentation of our consolidated financial statements for external purposes in accordance with generally accepted accounting principles. Our Chief Executive Officer and Chief Financial Officer assessed the effectiveness of our internal control over financial reporting as of December 31, 2011. In making this assessment, they used the criteria established in Internal Control–Integrated Framework issued by the Committee of Sponsoring Organizations of the Treadway Commission (COSO). Based on this assessment, our Chief Executive Officer and Chief Financial Officer have concluded that, as of December 31, 2011, our internal control over financial reporting is effective based on those criteria. Notwithstanding the foregoing, all internal control systems, no matter how well designed, have inherent limitations. Therefore, even those systems determined to be effective may not prevent or detect misstatements and can provide only reasonable assurance with respect to financial statement preparation and presentation. Also, projections of any evaluation of effectiveness to future periods are subject to the risk that controls may become inadequate because of changes in conditions, or that the degree of compliance with the policies or procedures may deteriorate.
- 81 -
This Annual Report does not include an attestation report of the Company’s registered public accounting firm regarding internal control over financial reporting. Management’s report was not subject to attestation by the Company’s registered public accounting firm pursuant to rules of the SEC that permit the Company to provide only management’s report in this Annual Report.
(c) Change in Internal Control over Financial Reporting.
There were no changes in the Company’s internal controls over financial reporting that occurred during the fiscal year ended December 31, 2011, that have materially affected or are reasonably likely to materially affect these controls.
(d) Other.
The Company believes that a control system, no matter how well designed and operated, can not provide absolute assurance that the objectives of the control system are met, and no evaluation of controls can provide absolute assurance that all control issues and instances of fraud, if any, with the Company have been determined. Therefore, a control system, no matter how well conceived and operated, can provide only reasonable, not absolute, assurance that the objectives of the control system are met. Our disclosure controls and procedures are designed to provide such reasonable assurances of achieving our desired control objectives, and our Chief Executive Officer and Chief Financial Officer have concluded, as of December 31, 2011, that our disclosure controls and procedures were effective in achieving that level of reasonable assurance.
The Company’s Board of Directors has determined that Mr. David Golan and Mr. Ronen Zavlik, members of the audit committee, are “audit committee financial experts”, as defined by the applicable SEC regulations.
- 82 -
All the members of the Audit Committee are “independent” under the applicable SEC and Nasdaq regulations. The experience of each member is listed under Item 6A.
The Company has adopted a Code of Ethics applicable to its executive officers, directors and all other employees. A copy of the code is posted on our website and may also be obtained, without charge, upon a written request addressed to the Company’s investor relations department.
The Company’s principal accountants for the years 2010 and 2011 were Kost Forer Gabbay & Kasierer, a member of Ernst & Young Global.
The table below summarizes the audit and other fees paid and accrued by the Company and its consolidated subsidiaries to Kost Forer Gabbay & Kasierer during each of 2010 and 2011:
|
Year Ended December 31, 2011
|
Year Ended December 31, 2010
|
|||||||||||||||
|
Amount
|
Percentage
|
Amount
|
Percentage
|
|||||||||||||
|
Audit Fees
|
$ | 73,000 | 88 | % | $ | 91,000 | 90 | % | ||||||||
|
Tax Fees (1)
|
$ | 10,000 | 12 | % | $ | 10,000 | 10 | % | ||||||||
|
Total
|
$ | 83,000 | 100 | % | $ | 101,000 | 100 | % | ||||||||
|
(1)
|
“Tax Fees” are fees for professional services rendered by the Company’s auditors with respect to annual tax reports.
|
Audit Committee’s pre-approval policies and procedures:
The Audit Committee is responsible for the oversight of the independent auditors’ work, including the approval of services provided by the independent auditors. These services may include audit, audit-related, tax or other services, as described above. On an annual basis the audit committee pre-approves audit and non-audit services to be provided to the Company by its auditors, listing the particular services or categories of services, and sets forth a specific budget for such services. Additional services not covered by the annual pre-approval may be approved by the Audit Committee on a case-by-case basis as the need for such services arises. Furthermore, the Audit Committee has authorized the Committee Chairman to pre-approve engagements of the Company’s auditors so long as the fee for each such engagement does not exceed $5,000 and so long as the engagement is notified to the Committee at its next subsequent meeting. Any services pre-approved by the Audit Committee (or by the Chairman) must be permitted by applicable law. Once services have been pre-approved, the audit committee receives a report on a periodic basis regarding the extent of the services actually provided and the fees paid.
Not applicable.
- 83 -
The Company (or anyone acting on its behalf) did not purchase any of the Company’s securities in 2011.
Not applicable.
Not applicable.
Not applicable.
Not applicable.
The following financial statements are filed as part of this Annual Report:
| Page | |
|
Reports of Independent Registered Public Accounting Firms
|
F-2 – F-3
|
|
Consolidated Balance Sheets
|
F-4 – F-5
|
|
Consolidated Statements of Operations
|
F-6
|
|
Statement of Changes in Shareholders' Equity
|
F-7
|
|
Consolidated Statements of Cash Flows
|
F-8 – F-9
|
|
Notes to Consolidated Financial Statements
|
F-10 – F-47
|
The audited financial statements filed as part of this Form 20-F are identical to the audited financial statements that were furnished under Form 6-K on March 31, 2012.
The following exhibits are filed as part of this Annual Report:
|
1.1
|
Memorandum of Association, as amended (incorporated by reference to the Company’s Annual Report on Form 20-F filed on June 30, 2010).
|
|
1.2
|
Articles of Association, as amended (incorporated by reference to Exhibit 4.1 to the Company’s Form S-8 filed on January 31, 2011).
|
|
4.1
|
Form of Indemnification Agreement between the Company and its officers and directors, as amended (incorporated by reference to Annex A of the Company’s Proxy Statement on Form 6- K, filed on November 9, 2011).
|
- 84 -
|
4.2
|
Services Agreement, dated as of April 15, 2003, between Cukierman & Co. Investment House Ltd., Dimex Solutions Ltd. and the Company (incorporated by reference to the Company’s Annual Report on Form 20-F filed on June 17, 2004).
|
|
4.3
|
M&A Addendum to the Services Agreement, as of August 22, 2004, by and among Cukierman & Co. Investment House Ltd., Dimex Solutions Ltd. and the Company (incorporated by reference to the Company’s Annual Report on Form 20-F filed on June 27, 2005).
|
|
4.4
|
Business Development Addendum to the Services Agreement, as of May 24, 2010, by and among Cukierman & Co. Investment House Ltd., BOS-Dimex Ltd., BOS-Odem Ltd. and the Company. (incorporated by reference to the Company’s Annual Report on Form 20-F filed on June 30, 2010).
|
|
4.5
|
The Company’s Israeli 2003 Share Option Plan (incorporated by reference to the Company’s Registration Statement on Form S-8 No. 333-11650).
|
|
4.6
|
Asset Purchase Agreement dated as of the January 29, 2008 by and between Dimex Systems (1988) Ltd., Dimex Hagalil Ltd., and the Company (incorporated by reference to the Company’s Annual Report on Form 20-F filed on June 30, 2008).
|
|
4.7
|
Amendment No. 1 to Asset Purchase Agreement by and among the Company, Dimex Systems (1988) Ltd. and Dimex Hagalil Ltd., dated Mar 23, 2009 (incorporated by reference to the Company’s Amendment No. 2 to Registration Statement on Form F-3 No. 333-152020).
|
|
4.8
|
Amendment No. 2 to Asset Purchase Agreement by and among the Company, Dimex Systems (1988) Ltd. and Dimex Hagalil Ltd., dated February 3, 2010 and Warrant dated as of February 3, 2010 issued by the Company to Dimex Systems (1988) Ltd. (incorporated by reference to the Company’s Annual Report on Form 20-F filed on June 30, 2010).
|
|
4.9
|
Loan Agreement by and between the Company and Dimex Systems (1988) Ltd., dated February 3, 2010; Registration Rights Agreement dated as of the February 3, 2010 by and between the Company and Dimex Systems (1988) Ltd.; Warrant dated as of February 3, 2010 issued by the Company to Dimex Systems (1988) Ltd. (incorporated by reference to the Company’s Annual Report on Form 20-F filed on June 30, 2010).
|
|
4.10*
|
Agreement by and between the Company and Dimex Systems dated November 9, 2011; Amendments to Warrants issued by the Company to Dimex Systems.
|
|
4.11
|
Form of 2009 Loan Agreement and Registration Rights Agreement by and among certain lenders and the Company. Form of Warrant issued by the Company to certain lenders. (incorporated by reference to the Company’s Annual Report on Form 20-F filed on June 30, 2010).
|
|
4.12*
|
Form of Agreement by and among certain lenders and the Company (Conversion Amendments); Form of Amendment to Warrant issued by the Company to certain lenders.
|
- 85 -
|
4.13*
|
Bank Leumi Le-Israel Ltd. Agreements: Summary of Economic Terms; Form of Request to Allocate a Credit in Israeli Currency (unlinked); Form of Request to Allocate a Credit Framework in Debitory Account (unlinked); Form of Subordination Letters of BOS-Dimex Ltd. and of BOS-Odem Ltd.; and B.O.S Better Online Solutions Ltd. Subordination Letter.
|
|
4.14*
|
Bank Hapoalim Ltd. Agreements: Summary of Economic Terms; Irrevocable Undertakings by BOS-Dimex Ltd., BOS-Odem Ltd. and the Company.
|
|
4.15
|
Share Purchase Agreement dated as of October 4, 2010 between the Company and Telegraph Hill Capital Fund I, LLC (incorporated by reference to the Company’s Annual Report on Form 20-F filed on June 30, 2011).
|
|
8.1
|
List of subsidiaries (incorporated by reference to Item 4C of this Annual Report on Form 20-F).
|
|
11*
|
Statement of Computation of Earnings Per Share.
|
|
12.1
*
|
Certification by Chief Executive Officer pursuant to Rule 13a-14(a) or Rule 15d-14(a) of the Securities Exchange Act of 1934.
|
|
12.2
*
|
Certification by Chief Financial Officer pursuant to Rule 13a-14(a) or Rule 15d-14(a) of the Securities Exchange Act of 1934.
|
|
13.1
*
|
Certification by Chief Executive Officer and Chief Financial Officer pursuant to Rule 13a-14(b) or Rule 15d-14(b) of the Securities Exchange Act of 1934.
|
|
23.1
*
|
Consent of Kost Forer Gabbay & Kasierer, a member of Ernst &Young Global.
|
|
23.2
*
|
Consent of Arik Eshel, CPA & Assoc., PC
|
|
101*
|
The following financial information from the Company’s Annual Report on Form 20-F for the year ended December 31, 2011, formatted in XBRL (eXtensible Business Reporting Language): (i) Consolidated Statements of Operations for the years ended December 31, 2011, 2010 and 2009; (ii) Consolidated Balance Sheets at December 31, 2011 and 2010; (iii) Consolidated Statements of Changes in Shareholders’ Equity for the years ended December 31, 2011, 2010 and 2009; (iv) Consolidated Statements of Cash Flows for the years ended December 31, 2011, 2010 and 2009; and (v) Notes to Consolidated Financial Statements, tagged as blocks of text. Users of this data are advised, in accordance with Rule 406T of Regulation S-T promulgated by the SEC, that this Interactive Data File is deemed not filed or part of a registration statement or prospectus for purposes of Sections 11 or 12 of the Securities Act of 1933, is deemed not filed for purposes of Section 18 of the Exchange Act, and otherwise is not subject to liability under these sections.
|
|
*
|
Filed herewith.
|
- 86 -
The Registrant hereby certifies that it meets all of the requirements for filing on Form 20-F and that it has duly caused and authorized the undersigned to sign this annual report on its behalf.
|
B.O.S. Better Online Solutions Ltd.
|
||
| /s/ Yuval Viner | /s/ Eyal Cohen | |
|
Yuval Viner
Chief Executive Officer
|
Eyal Cohen
Chief Financial Officer
|
|
Date: April 30, 2012
- 87 -
B.O.S. BETTER ONLINE SOLUTIONS LTD.
AND SUBSIDIARIES
CONSOLIDATED FINANCIAL STATEMENTS
AS OF DECEMBER 31, 2011
IN U.S. DOLLARS
INDEX
|
Page
|
|
|
F-2 - F3
|
|
|
F-4 - F-5
|
|
|
F-6
|
|
|
F-7
|
|
|
F-8 - F-9
|
|
|
F-10 - F-47
|

|
Kost Forer Gabbay & Kasierer
3 Aminadav St.
Tel-Aviv 67067, Israel
Tel:
972 (3)6232525
Fax: 972 (3)5622555
www.ey.com
|
To the
Board of Directors and
Shareholders of
B.O.S. BETTER ONLINE SOLUTIONS LTD.
We have audited the accompanying consolidated balance sheets of B.O.S Better Online Solutions Ltd. ("the Company") and subsidiaries as of December 31, 2011 and 2010, and the related consolidated statements of operations, changes in shareholders' equity and cash flows for each of the three years in the period ended December 31, 2011. These financial statements are the responsibility of the Company's management. Our responsibility is to express an opinion on these financial statements based on our audits. We did not audit the 2009 financial statements of BOS - Supply Chain Solutions (Lynk) Inc., a wholly-owned U.S. subsidiary, which statements reflected total assets constituting 19% of the consolidated totals as of December 31, 2009 and total revenues constituting 0% of the related consolidated totals for 2009. These statements were audited by other auditors whose report has been furnished to us, and our opinion, insofar as it relates to the amounts included for BOS - Supply Chain Solutions (Lynk) Inc., is based solely on the report of the other auditors.
We conducted our audits in accordance with the standards of the Public Company Accounting Oversight Board (United States). Those standards require that we plan and perform the audit to obtain reasonable assurance about whether the financial statements are free of material misstatement. We were not engaged to perform an audit of the Company's internal control over financial reporting. Our audit included consideration of internal control over financial reporting as a basis for designing audit procedures that are appropriate in the circumstances, but not for the purpose of expressing an opinion on the effectiveness of the Company's internal control over financial reporting. Accordingly we express no such opinion. An audit also includes examining, on a test basis, evidence supporting the amounts and disclosures in the financial statements, assessing the accounting principles used and significant estimates made by management and evaluating the overall financial statement presentation. We believe that our audit and the report of the other auditors (for the year ended December 31, 2009), provide a reasonable basis for our opinion.
In our opinion, based on our audits and the report of other auditors (for the year ended December 31, 2009),, the financial statements referred to above present fairly, in all material respects, the consolidated financial position of the Company and subsidiaries at December 31, 2011 and 2010, and the consolidated results of their operations and their cash flows for each of the three years in the period ended December 31, 2011, in conformity with U.S. generally accepted accounting principles.
|
Tel-Aviv, Israel
|
KOST FORER GABBAY & KASIERER
|
|
March 29 , 2012
|
A Member of Ernst & Young Global
|
F-2
ARIK ESHEL, CPA & ASSOC., PC
Certified Public Accountants and Consultants
Report of Independent Registered Public Accounting Firm
To the Board of Directors and
Stockholders of BOS - Supply Chain Solutions (Lynk) Inc.
We have audited the consolidated statements of income, stockholders' equity (deficit), and cash flows of BOS - Supply Chain Solutions (Lynk) Inc. ("the Company") and subsidiaries for the year ended December 31, 2009. The Company's management is responsible for these financial statements. Our responsibility is to express an opinion on these financial statements based on our audits.
We conducted our audits in accordance with the standards of the Public Company Accounting Oversight Board (United States). Those standards require that we plan and perform the audit to obtain reasonable assurance about whether the financial statements are free of material misstatement. An audit also includes examining, on a test basis, evidence supporting the amounts and disclosures in the financial statements, assessing the accounting principles used and significant estimates made by management, as well as evaluating the overall financial statement presentation. We believe that our audits provide a reasonable basis for our opinion.
In our opinion, the consolidated financial statements referred to above present fairly, in all material respects, the results of operations of BOS- Supply Chain Solutions (Lynk) Inc. and subsidiaries for the year in the period ended December 31, 2009 in conformity with accounting principles generally accepted in the United States of America.
|
ARIK ESHEL, CPA & ASSOC., PC
|
|
|
New York, NY
|
|
|
March 29, 2012
|
|
F-3
B.O.S. BETTER ONLINE SOLUTIONS LTD.
AND ITS SUBSIDIARIES
|
December 31,
|
||||||||
|
2011
|
2010
|
|||||||
|
ASSETS
|
||||||||
|
CURRENT ASSETS:
|
||||||||
|
Cash and cash equivalents
|
$ | 411 | $ | 703 | ||||
|
Trade receivables (net of allowance for doubtful accounts of $ 115 and $ 44 at December 31, 2011 and 2010, respectively)
|
8,507 | 7,884 | ||||||
|
Other accounts receivable and prepaid expenses (Note 3)
|
744 | 1,183 | ||||||
|
Inventories (Note 5)
|
4,020 | 5,125 | ||||||
|
Total
current assets
|
13,682 | 14,895 | ||||||
|
LONG-TERM ASSETS:
|
||||||||
|
Severance pay fund
|
41 | 47 | ||||||
|
Bank deposits
|
427 | - | ||||||
|
Investment in other company (Note 6)
|
68 | 107 | ||||||
|
Other assets
|
23 | 161 | ||||||
|
Total
long-term assets
|
559 | 315 | ||||||
|
PROPERTY, PLANT AND EQUIPMENT, NET (Note 7)
|
1,166 | 1,135 | ||||||
|
OTHER INTANGIBLE ASSETS, NET (Note 8)
|
540 | 1,512 | ||||||
|
GOODWILL (Note 9)
|
4,122 | 4,438 | ||||||
| $ | 20,069 | $ | 22,295 | |||||
The accompanying notes are an integral part of the consolidated financial statements.
F-4
B.O.S. BETTER ONLINE SOLUTIONS LTD.
AND ITS SUBSIDIARIES
CONSOLIDATED BALANCE SHEETS
|
December 31,
|
||||||||
|
2011
|
2010
|
|||||||
|
LIABILITIES AND SHAREHOLDERS' EQUITY
|
||||||||
|
CURRENT LIABILITIES:
|
||||||||
|
Short-term bank loans and current maturities (Note 10)
|
$ | 7,496 | $ | 7,778 | ||||
|
Trade payables
|
4,165 | 4,317 | ||||||
|
Employees and payroll accruals
|
553 | 735 | ||||||
|
Deferred revenues
|
550 | 639 | ||||||
|
Accrued expenses and other liabilities (Note 11)
|
994 | 1,040 | ||||||
|
Total
current liabilities
|
13,758 | 14,509 | ||||||
|
LONG-TERM LIABILITIES:
|
||||||||
|
Long-term bank loans, net of current maturities (Note 12)
|
1,530 | 394 | ||||||
|
Income tax accruals (Note 16)
|
273 | 488 | ||||||
|
Accrued severance pay
|
163 | 167 | ||||||
|
Convertible note (Note 13)
|
- | 2,460 | ||||||
|
Liability to Dimex Systems (Note 13)
|
747 | 564 | ||||||
|
Total
long-term liabilities
|
2,713 | 4,073 | ||||||
|
COMMITMENTS AND CONTINGENT LIABILITIES (Note 14)
|
||||||||
|
SHAREHOLDERS' EQUITY (Note 15) (*):
|
||||||||
|
Share capital:
|
||||||||
|
Ordinary shares of NIS 20.00 nominal value: Authorized; 10,000,000 and 7,000,000 shares at December 31, 2011 and 2010; Issued and outstanding: 4,467,924 and 2,752,517 shares at December 31, 2011 and 2010, respectively
|
23,065 | 13,959 | ||||||
|
Additional paid-in capital
|
51,093 | 56,805 | ||||||
|
Accumulated other comprehensive profit (loss)
|
(243 | ) | 52 | |||||
|
Accumulated deficit
|
(70,317 | ) | (67,103 | ) | ||||
|
Total
shareholders' equity
|
3,598 | 3,713 | ||||||
|
Total
liabilities and shareholders' equity
|
$ | 20,069 | $ | 22,295 | ||||
|
/s/ Yuval Viner
|
/s/ Eyal Cohen
|
|
Yuval Viner
Chief Executive Officer
|
Eyal Cohen
Chief Financial Officer
|
|
(*)
|
All share data are reported after the effect of the 1 for 5 reverse split that occurred on January 12, 2010.
|
The accompanying notes are an integral part of the consolidated financial statements.
|
Year ended December 31,
|
||||||||||||
|
2011
|
2010
|
2009
|
||||||||||
|
Revenues
|
$ | 33,434 | $ | 30,187 | $ | 25,467 | ||||||
|
Cost of revenues
|
26,481 | 22,668 | 19,741 | |||||||||
|
Inventory write offs
|
443 | 36 | 2,235 | |||||||||
|
Gross profit
|
6,510 | 7,483 | 3,491 | |||||||||
|
Operating costs and expenses:
|
||||||||||||
|
Research and development, net
|
403 | 372 | 360 | |||||||||
|
Sales and marketing
|
4,273 | 4,068 | 5,426 | |||||||||
|
General and administrative
|
2,252 | 1,786 | 2,004 | |||||||||
|
Impairment of goodwill and other intangible assets (Notes 8, 9)
|
555 | - | 383 | |||||||||
|
Total
operating costs and expenses
|
7,483 | 6,226 | 8,173 | |||||||||
|
Operating Profit (loss)
|
(973 | ) | 1,257 | (4,682 | ) | |||||||
|
Financial expenses, net (Note 17a)
|
(2,241 | ) | (961 | ) | (606 | ) | ||||||
|
Other expenses, net (Note 2g)
|
(172 | ) | (120 | ) | (409 | ) | ||||||
|
Income (loss) before taxes on income
|
(3,386 | ) | 176 | (5,697 | ) | |||||||
|
Tax benefit (taxes on income) (Note 16)
|
172 | (5 | ) | (329 | ) | |||||||
|
Income (loss) from continuing operations
|
(3,214 | ) | 171 | (6,026 | ) | |||||||
|
Loss from discontinued operations (Note 1e)
|
- | (806 | ) | (3,075 | ) | |||||||
|
Net loss
|
$ | (3,214 | ) | $ | (635 | ) | $ | (9,101 | ) | |||
|
Basic and diluted net earnings (loss) per share from continuing operations (Note 17b) (*)
|
$ | (1.14 | ) | $ | 0.07 | $ | (2.32 | ) | ||||
|
Basic and diluted net loss per share from discontinued operations (Note 17b) (*)
|
$ | - | $ | (0.31 | ) | $ | (1.18 | ) | ||||
|
Basic and diluted net loss per share (Note 17b) (*)
|
$ | (1.14 | ) | $ | (0.24 | ) | $ | (3.50 | ) | |||
|
(*)
|
All earnings (loss) per share data are reported after the effect of the 1 for 5 reverse split that occurred on January 12, 2010.
|
The accompanying notes are an integral part of the consolidated financial statements.
F-6
B.O.S. BETTER ONLINE SOLUTIONS LTD.
AND ITS SUBSIDIARIES
|
Ordinary
shares (*)
|
Share capital
|
Additional paid-in capital
|
Accumulated other comprehensive income (loss) (**)
|
Accumulated deficit
|
Total comprehensive loss
|
Total shareholders' equity
|
||||||||||||||||||||||
|
Balance at January 1, 2009
|
2,605,592 | $ | 13,159 | $ | 55,830 | $ | (378 | ) | $ | (57,367 | ) | $ | 11,244 | |||||||||||||||
|
Issuance of Ordinary shares for options exercised
|
12,567 | 66 | (66 | ) | - | - | - | |||||||||||||||||||||
|
Issuance expenses
|
- | - | (17 | ) | - | - | (17 | ) | ||||||||||||||||||||
|
Issuance of warrants related to convertible note
|
- | - | 646 | - | - | 646 | ||||||||||||||||||||||
|
Share-based compensation expense
|
- | - | 649 | - | - | 649 | ||||||||||||||||||||||
|
Other comprehensive loss:
|
||||||||||||||||||||||||||||
|
Foreign currency translation adjustments
|
- | - | - | 168 | - | $ | 168 | 168 | ||||||||||||||||||||
|
Unrealized gain related to available for sale securities
|
54 | - | 54 | 54 | ||||||||||||||||||||||||
|
Net loss
|
- | - | - | - | (9,101 | ) | (9,101 | ) | (9,101 | ) | ||||||||||||||||||
|
Total comprehensive loss
|
$ | (8,879 | ) | |||||||||||||||||||||||||
|
Balance at December 31, 2009
|
2,618,159 | 13,225 | 57,042 | (156 | ) | (66,468 | ) | 3,643 | ||||||||||||||||||||
|
Issuance of Ordinary shares for options exercised
|
37,996 | 201 | (201 | ) | - | - | - | |||||||||||||||||||||
|
Issuance of shares related to the private placement (net of $35 issuance expenses)
|
96,362 | 533 | (268 | ) | - | - | 265 | |||||||||||||||||||||
|
Issuance of warrants related to convertible note
|
- | - | 15 | - | - | 15 | ||||||||||||||||||||||
|
Share-based compensation expense
|
- | - | 217 | - | - | 217 | ||||||||||||||||||||||
|
Other comprehensive loss:
|
||||||||||||||||||||||||||||
|
Foreign currency translation adjustments
|
- | - | - | 262 | - | $ | 262 | 262 | ||||||||||||||||||||
|
Realized gain related to available for sale securities
|
(54 | ) | - | (54 | ) | (54 | ) | |||||||||||||||||||||
|
Net loss
|
- | - | - | - | (635 | ) | (635 | ) | (635 | ) | ||||||||||||||||||
|
Total comprehensive loss
|
$ | (427 | ) | |||||||||||||||||||||||||
|
Balance at December 31, 2010
|
2,752,517 | 13,959 | 56,805 | 52 | (67,103 | ) | - | 3,713 | ||||||||||||||||||||
|
Issuance of Ordinary shares for options exercised
|
33,442 | 195 | (195 | ) | - | - | - | - | ||||||||||||||||||||
|
Issuance of Ordinary shares related to an inducement of a convertible note
|
1,681,965 | 8,911 | (5,772 | ) | - | - | - | 3,139 | ||||||||||||||||||||
|
Extension of warrants related to convertible note
|
- | - | 86 | - | - | - | 86 | |||||||||||||||||||||
|
Share-based compensation expense
|
- | - | 169 | - | - | - | 169 | |||||||||||||||||||||
|
Other comprehensive loss:
|
||||||||||||||||||||||||||||
|
Foreign currency translation adjustments
|
- | - | - | (295 | ) | - | $ | (295 | ) | (295 | ) | |||||||||||||||||
|
Net loss
|
- | - | - | - | (3,214 | ) | (3,214 | ) | (3,214 | ) | ||||||||||||||||||
|
Total comprehensive loss
|
- | - | - | - | $ | (3,509 | ) | |||||||||||||||||||||
|
Balance at December 31, 2011
|
4,467,924 | $ | 23,065 | $ | 51,093 | $ | (243 | ) | $ | (70,317 | ) | $ | 3,598 | |||||||||||||||
|
(*)
|
All share data are reported after the effect of the 1 for 5 reverse split that occurred on January 12, 2010.
|
|
(**)
|
December 31, 2009 balance includes both foreign currency translation adjustments and unrealized gains related to available for sale securities. December 31, 2010 and December 31, 2011 balance includes only foreign currency translation adjustments.
|
The accompanying notes are an integral part of the consolidated financial statements.
F-7
|
Year ended December 31,
|
||||||||||||
|
2011
|
2010
|
2009
|
||||||||||
|
Cash flows from operating activities:
|
||||||||||||
|
Net loss
|
$ | (3,214 | ) | $ | (635 | ) | $ | (9,101 | ) | |||
|
Loss from discontinued operations
|
- | 806 | 3,075 | |||||||||
|
Net profit (loss) from continuing operations
|
(3,214 | ) | 171 | (6,026 | ) | |||||||
|
Adjustments to reconcile net loss to net cash provided by (used in) operating activities:
|
||||||||||||
|
Depreciation and amortization
|
656 | 611 | 596 | |||||||||
|
Inventory write off
|
443 | 36 | 2,235 | |||||||||
|
Impairment of goodwill and intangible assets
|
555 | - | 383 | |||||||||
|
Capital loss from sale of investment in other company
|
- | 7 | - | |||||||||
|
Impairment of available for sale securities
|
156 | - | 304 | |||||||||
|
Impairment of investment in other company
|
39 | 111 | 53 | |||||||||
|
Severance pay, net
|
5 | - | (160 | ) | ||||||||
|
Share-based compensation expenses related to employees, directors and service providers
|
169 | 217 | 649 | |||||||||
|
Amortization of discount on convertible note
|
202 | 225 | 108 | |||||||||
|
Accrued interest on long-term convertible notes
|
230 | 196 | 104 | |||||||||
|
Inducement expenses of convertible note
|
760 | - | - | |||||||||
|
Revaluation of fair value related to extension of warrants as part of an Inducement of a convertible note
|
86 | |||||||||||
|
Decrease (increase) in trade receivables, net
|
(1,045 | ) | (417 | ) | 2,897 | |||||||
|
Change in income tax accruals
|
(199 | ) | 52 | 343 | ||||||||
|
Decrease (increase) in other accounts receivable and other assets
|
363 | (114 | ) | (155 | ) | |||||||
|
Decrease (increase) in inventories
|
506 | 138 | (66 | ) | ||||||||
|
Increase (decrease) in trade payables
|
(46 | ) | 332 | (818 | ) | |||||||
|
Decrease in employees and payroll accruals, deferred revenues, accrued expenses and other liabilities
|
(31 | ) | (105 | ) | (426 | ) | ||||||
|
Net cash provided by (used in) operating activities from continuing operations
|
(365 | ) | 1,460 | 21 | ||||||||
|
Net cash used in operating activities from discontinued operations
|
- | (176 | ) | (1,291 | ) | |||||||
|
Net cash provided by (used in) operating activities
|
(365 | ) | 1,284 | (1,270 | ) | |||||||
|
Cash flows from investing activities:
|
||||||||||||
|
Purchase of property, plant and equipment
|
(357 | ) | (108 | ) | (320 | ) | ||||||
|
Change in long term bank deposits
|
(427 | ) | - | - | ||||||||
|
Proceeds from sale of investment in other company
|
- | 150 | - | |||||||||
|
Repayment of deferred consideration for the acquisition of Dimex Systems Ltd activity
|
(256 | ) | (147 | ) | (967 | ) | ||||||
|
Net cash used in investing activities from continuing operations
|
(1,040 | ) | (105 | ) | (1,287 | ) | ||||||
|
Net cash used in investing activities from discontinued operations
|
- | - | (74 | ) | ||||||||
|
Net cash used in investing activities
|
(1,040 | ) | (105 | ) | (1,361 | ) | ||||||
|
Cash flows from financing activities
:
|
||||||||||||
|
Proceeds from issuance of shares, net
|
- | 265 | (17 | ) | ||||||||
|
Proceeds from (repayment of) short and long-term bank loans
|
1,113 | (841 | ) | (363 | ) | |||||||
|
Proceeds from (repayment of) long-term convertible note and warrants, net of issuance expenses
|
- | (28 | ) | 1,584 | ||||||||
|
Net cash provided by (used in) financing activities from continuing operations
|
1,113 | (604 | ) | 1,204 | ||||||||
|
Net cash provided by (used in) financing activities from discontinued operations
|
- | (308 | ) | 385 | ||||||||
|
Net cash provided by (used in) financing activities
|
1,113 | (912 | ) | 1,589 | ||||||||
|
Increase (decrease) in cash and cash equivalents
|
(292 | ) | 267 | (1,042 | ) | |||||||
|
Increase (decrease) in cash and cash equivalents from discontinued operations
|
- | (128 | ) | 359 | ||||||||
|
Cash and cash equivalents at the beginning of the year
|
703 | 564 | 1,247 | |||||||||
|
Cash and cash equivalents at the end of the year
|
$ | 411 | $ | 703 | $ | 564 | ||||||
The accompanying notes are an integral part of the consolidated financial statements.
F-8
B.O.S. BETTER ONLINE SOLUTIONS LTD.
AND ITS SUBSIDIARIES
CONSOLIDATED STATEMENTS OF CASH FLOWS
|
Year ended December 31,
|
|||||||||||||
|
2011
|
2010
|
2009
|
|||||||||||
|
Supplemental disclosure of cash flow activities
:
|
|||||||||||||
|
(i)
|
Net cash paid during the year for:
|
||||||||||||
|
Interest
|
$ | 572 | $ | 463 | $ | 538 | |||||||
|
Income tax
|
$ | 2 | $ | 2 | $ | 1 | |||||||
|
(ii)
|
Non-cash activities:
|
||||||||||||
|
Conversion of payable into long-term convertible debentures
|
$ | - | $ | 161 | $ | 675 | |||||||
|
Deferred charges related to convertible note
|
$ | - | $ | - | $ | 62 | |||||||
|
Sale of investment in other company
|
$ | - | $ | 150 | $ | - | |||||||
|
Purchase of property and equipment
|
$ | - | $ | - | $ | 47 | |||||||
|
Inducement of a convertible note into share capital
|
$ | 2,523 | $ | - | $ | - | |||||||
The accompanying notes are an integral part of the consolidated financial statements.
F-9
B.O.S. BETTER ONLINE SOLUTIONS LTD.
AND ITS SUBSIDIARIES
|
NOTE 1:-
|
GENERAL
|
|
|
a.
|
B.O.S. Better Online Solutions Ltd. ("BOS" or "the Company") is an Israeli corporation.
|
The Company's shares are listed on NASDAQ under the ticker BOSC. Effective as of May 12, 2009, the Company's ordinary shares were delisted from trade on the Tel-Aviv Stock Exchange ("TASE"). Following the delisting of the Company's shares from the TASE, the Company is not subject to reporting requirements in Israel, under the Israeli Securities Law.
On January 17, 2012, the Company received a notice from the Listing Qualifications Department of The Nasdaq Stock Market (“Nasdaq”) advising the Company that it has failed to comply with Nasdaq’s requirement that listed securities maintain a minimum bid price of $1.00 per share as set forth in Nasdaq Listing Rules (see Note 20a)
|
|
b.
|
In the year ended December 31, 2011, the Company incurred a loss of $3,214 and generated negative cash flow from current operations amounting to $365. Due to the above, the Company's cash and cash equivalent decreased from $703 as of December 31, 2010 to $411 as of December 31, 2011. In addition, long-term bank loans increased by $1,136 during fiscal year 2011.In view of the above, the Company has implemented an overall efficiency plan, including: a conversion of the convertible note as described in note 13 and a reduction in workforce. The Company expects to meet its bank covenants through December 31, 2012 and believes that its cash resources are sufficient to meet its operating needs for at least the next 12 months.
|
|
|
c.
|
All share and per share data in this report is reported after giving effect to the 1 for 5 reverse split that occurred on January 12, 2010 (see Note 15).
|
|
|
d.
|
The Company has two operating segments: the RFID and Mobile Solutions segment and the Supply Chain Solutions segment (see Note 18).
|
The Company's wholly-owned subsidiaries include:
In Israel:
|
|
(1)
|
BOS-Dimex Ltd. (previously "Dimex Solutions Ltd"), an Israeli company that provides comprehensive turn-key solutions for Automatic Identification and Data Collection.
|
|
|
BOS-Dimex Ltd. purchased in March 2008 all of the assets and activities of Dimex Systems Ltd.; and its wholly-owned subsidiary, Dimex Hagalil Projects (2008) Ltd., which was incorporated in January 2008
,
purchased all of the assets and activities of Dimex Hagalil Ltd. ; and
|
|
|
(2)
|
BOS-Odem Ltd. ("BOS-Odem"), an Israeli company, is a distributor of electronics components and advance technologies worldwide. BOS-Odem is a part of the Supply Chain Solutions segments; and
|
|
|
(3)
|
Quasar Telecom (2004) Ltd. ("Quasar Telecom"), which is inactive.
|
F-10
B.O.S. BETTER ONLINE SOLUTIONS LTD.
AND ITS SUBSIDIARIES
NOTES TO CONSOLIDATED FINANCIAL STATEMENTS
|
NOTE 1:-
|
GENERAL
|
In the United States:
|
|
(1)
|
Ruby-Tech Inc., a New York corporation, a wholly-owned subsidiary of BOS-Odem and a part of the Supply Chain Solutions segments;
|
|
|
(2)
|
BOS - Supply Chain Solutions (Lynk) Inc., a Delaware Corporation ("Lynk"), and its subsidiaries BOS-Supply Chain Solutions Inc. (Summit) Ltd. ("Summit"), Pacific Information Systems, Inc. ("PacInfo"), a Delaware corporation and PacInfo's subsidiary Dean Tech Technologies Associates, LLC., a Texan corporation ("Dean Tech"). Both of Pacinfo and Dean Tech are no longer active. On November 23, 2010 the Company announced that its two U.S. subsidiaries that are part of its Supply Chain division, Lynk and its subsidiary Summit, have filed with the US Bankruptcy Court a Chapter 7 petition. Lynk's case was closed on March 4, 2011.
|
|
|
|
|
(3)
|
BOS Delaware Inc., a Delaware corporation, which ceased operations in 2002.
|
In Europe:
BOS-Dimex has a UK subsidiary, Better On-Line Solutions Ltd. Since 2002, this company and its subsidiary, Better On-Line Solutions S.A.S that is incorporated in France, are not active.
In addition, the Company holds shares in two other companies:
|
|
(1)
|
Surf Communication Systems Ltd. ("Surf") that is a developer and global supplier of universal access and network convergence software solutions to the wire line and wireless telecommunications and data communications industries. As of December 31, 2011, the Company holds 6.2% of the outstanding shares of Surf (see Note 2f).
|
|
|
(2)
|
New World Brands Inc. (OTCQB: NWBD) ("NWB"), a U.S. public corporation. The Company's holdings in NWB were received as the consideration for the sale of the Company's communication segment. As of September 30, 2010 (the last time NWB filled a financial report), the Company holds 12.8% of the outstanding shares of NWB (see Note 2f).
|
|
|
e.
|
Discontinued operations:
|
The results of operations, including revenues, cost of revenues, operating expenses, and other income and expenses related to the prior periods of the discontinued operations, have been reclassified in the accompanying statements of operations as discontinued operations.
|
|
1.
|
In February 2009, the Company sold its OptimizeIT product and related Intellectual Property (following the Company's decision in December 2008 to cease
the operation of this product line) in consideration for $ 70 plus contingent royalties amounting to 7.5% of future revenues until the earlier of: (i) payment of $ 1,500 or (ii) the lapse of forty-two months from February 2009. As of December 31, 2011, no income from royalties was recorded.
|
F-11
B.O.S. BETTER ONLINE SOLUTIONS LTD.
AND ITS SUBSIDIARIES
NOTES TO CONSOLIDATED FINANCIAL STATEMENTS
|
NOTE 1:-
|
GENERAL (Cont.)
|
|
|
2.
|
On November 23, 2010 the Company announced that its two U.S. subsidiaries that are part of its Supply Chain division, Lynk and its subsidiary Summit, have filed with the US Bankruptcy Court a Chapter 7 petition.
|
Summarized selected financial information of the discontinued operations are as follows:
|
Year ended
December 31,
|
||||||||||||
|
2011
|
2010
|
2009
|
||||||||||
|
Revenues
|
$ | - | $ | 8,338 | $ | 8,615 | ||||||
|
Cost of revenues
|
- | 6,990 | 7,704 | |||||||||
|
Gross profit
|
- | 1,348 | 911 | |||||||||
|
Impairment of goodwill
|
- | 835 | ||||||||||
|
Total
operating costs and expenses
|
- | 1,487 | 2,705 | |||||||||
|
Operating loss
|
- | (139 | ) | (2,629 | ) | |||||||
|
Financial expenses, net
|
- | (213 | ) | (232 | ) | |||||||
|
Other expenses, net (*)
|
- | (496 | ) | - | ||||||||
|
Loss before taxes on income
|
- | (848 | ) | (2,861 | ) | |||||||
|
Tax benefit (taxes on income)
|
- | 42 | (214 | ) | ||||||||
|
Net loss
|
$ | - | $ | (806 | ) | $ | (3,075 | ) | ||||
|
(*)
|
Other expenses include $ 554 related to the write off of net assets and liabilities related to discontinued operations.
|
F-12
B.O.S. BETTER ONLINE SOLUTIONS LTD.
AND ITS SUBSIDIARIES
NOTES TO CONSOLIDATED FINANCIAL STATEMENTS
The consolidated financial statements are prepared according to United States generally accepted accounting principles ("U.S. GAAP").
|
|
a.
|
Use of estimates:
|
The preparation of financial statements in conformity with U.S. generally accepted accounting principles requires management to make estimates and assumptions that affect the amounts reported in the financial statements and accompanying notes. The most significant assumptions are employed in estimates used in determining values of goodwill and identifiable intangible assets, provision for inventory, revenue recognition, tax assets and tax positions, legal contingencies, stock-based compensation costs, and assumptions utilized in troubled debt restructuring. Actual results could differ from those estimates.
|
|
b.
|
Financial statements in U.S. dollars:
|
A substantial portion of the Company's revenues is generated in U.S. dollar ("dollars"). In addition, most of the Company's costs are incurred in dollars. Company's management believes that the dollar is the primary currency of the economic environment in which the Company operates. Thus, the functional and reporting currency of the Company is the dollar. Accordingly, monetary accounts maintained in currencies other than the dollar are remeasured into U.S. dollars in accordance with ASC 830,
Foreign Currency Matters
. All transactions gains and losses from the remeasurement of monetary balance sheet items are reflected in the statement of operations as financial income or expenses as appropriate.
The financial statements of a certain subsidiary, whose functional currency is other than the dollar, have been translated into U.S. dollars. All balance sheet accounts have been translated using the exchange rates in effect at the balance sheet date. Statement of operations amounts have been translated using the average exchange rate for the period. The resulting translation adjustments are reported as a component of shareholders' equity in accumulated other comprehensive loss.
|
|
c.
|
Principles of consolidation:
|
The consolidated financial statements include the accounts of the Company and its subsidiaries. Intercompany transactions and balances including profits from intercompany sales not yet realized outside the Company have been eliminated upon consolidation.
|
|
d.
|
Cash equivalents:
|
Cash equivalents are short-term highly liquid investments that are readily convertible to cash purchased with original maturities of less than three months.
F-13
B.O.S. BETTER ONLINE SOLUTIONS LTD.
AND ITS SUBSIDIARIES
NOTES TO CONSOLIDATED FINANCIAL STATEMENTS
NOTE 2:- SIGNIFICANT ACCOUNTING POLICIES (Cont.)
|
|
e.
|
Inventories:
|
Inventories are valued at the lower of cost or market value. Cost is determined using the moving average cost method.
Inventory write-offs and write-downs are provided to cover risks arising from slow-moving items or technological obsolescence. During 2011, 2010 and 2009, inventory write-offs of $ 443, $ 36 and $ 2,235, respectively, have been recorded and presented in the consolidated statements of operations.
|
|
f.
|
Investment in other companies:
|
|
|
1.
|
Investment in NWB and QMX:
|
The Company accounts for its holdings in NWB shares as available for sale in accordance with ASC 320,
Investments - Debt And Equity Securities
("ASC 320"). Unrealized gains and losses, net of the related tax effect are included in other comprehensive loss. In January 2009, Qualmax was merger with and into NWB , and holdings in Qualmax were converted into shares of NWB.
Prior to this merger, the investment in Qualmax, which was traded on the Pink Sheets, was presented at cost according to ASC 325-20,
Cost Method Investments
("ASC 325-20") due to no trading volume in the Qualmax shares.
Management evaluates investments in other companies for evidence of other-than- temporary declines in value. The Company recognizes an impairment charge when a decline in the fair value of its marketable securities below the cost basis is presumed to be other-than-temporary. The Company considers various factors in determining whether to recognize an impairment charge, including the Company's intent and ability to hold the marketable securities for a period of time sufficient to allow for any anticipated recovery in market value, the length of time and extent to which the fair value has been less than the cost basis and the financial condition and near-term prospects of the issuers. If, after consideration of all available evidence to evaluate the realizable value of its marketable securities, impairment is determined to be other than- temporary, then an impairment loss equal to the difference between the marketable securities' carrying amount and its fair value is recognized. Accordingly, during 2011, 2010 and 2009, an impairment loss, due to other-than-temporary decline in fair value, of $ 156, $ 0 and $ 304, respectively, has been recorded and presented in other expenses, net in the consolidated statements of operations.
F-14
B.O.S. BETTER ONLINE SOLUTIONS LTD.
AND ITS SUBSIDIARIES
NOTES TO CONSOLIDATED FINANCIAL STATEMENTS
NOTE 2:- SIGNIFICANT ACCOUNTING POLICIES (Cont.)
On February 26, 2010, the Company sold all of its holdings in NWB to P&S Spirit LLC. and recorded a capital loss of $7. The Company sold 61,441,827 shares of common stock of NWB (the "Shares") and 1,430,178 warrants to purchase common stock of NWB at an exercise price of $ 0.2098 per share expiring on December 31, 2010 (the "Warrants"). The consideration for the Shares and Warrants was $ 300 of which $ 150 was paid in March 2010 and the remaining $ 150 plus annual interest of 4% were to be paid in twelve monthly installments commencing March 2011. The Shares and Warrants were delivered to an escrow agent, to be released to the Buyer upon full payment of the Remaining Debt. In May 2011, the buyer notified the Company that it will not pay the remaining debt, and the shares and warrants were released back to the Company. As of December 31, 2011 the Company recognized other-than-temporary loss of $156, reflecting that the investment in NWB was fully impaired.
|
|
2.
|
Investment in Surf:
|
The Company's holding in Surf (a private company) as of December 31, 2011 is 6.2% of Surf's issued and outstanding shares. The Company's investment in Surf is accounted for based on the cost accounting method. During 2011, 2010 and 2009, an impairment loss, due to other-than- temporary decline in fair value, of $ 39, $ 111 and $ 53, respectively, has been recorded and presented in other expenses, net in the consolidated statements of operations.
The Company's investment in Surf is reviewed for impairment whenever events or changes in circumstances indicate that the carrying amount of the investment may not be recoverable, in accordance with ASC 325-20.
|
|
g.
|
Property, plant and equipment:
|
Property, plant and equipment are stated at cost, net of accumulated depreciation. Depreciation is calculated by using the straight line method over the estimated useful lives of the assets, at the following annual rates:
|
%
|
|||||
|
Computers and software
|
20 - 33 |
(mainly 33%)
|
|||
|
Office furniture and equipment
|
6 - 15 |
(mainly 10%)
|
|||
|
Leasehold improvements
|
10 |
(over the shorter of the period
of the lease or the life of the assets)
|
|||
|
Motor vehicles
|
15 | ||||
|
Real estate
|
4 | ||||
F-15
B.O.S. BETTER ONLINE SOLUTIONS LTD.
AND ITS SUBSIDIARIES
NOTES TO CONSOLIDATED FINANCIAL STATEMENTS
NOTE 2:- SIGNIFICANT ACCOUNTING POLICIES (Cont.)
|
|
h.
|
Impairment of long-lived assets:
|
The Company's long-lived assets are reviewed for impairment in accordance with ASC 360-10,
Accounting for the Impairment or Disposal of Long-Lived Asset
, whenever events or changes in circumstances indicate that the carrying amount of an asset (or asset group) may not be recoverable. Recoverability of assets to be held and used is measured by a comparison of the carrying amount of an asset (or asset group) to the future undiscounted cash flows expected to be generated by the assets (or asset group). If such assets are considered to be impaired, the impairment to be recognized is measured by the amount by which the carrying amount of the assets exceeds their fair value of the assets. During 2011 the Company recognized an impairment loss of $555 related to a brand name and customer list. of which $470 were attributed to the Supply Chain segment and $85 were attributed to the RFID and Mobile solutions segment. The fair value of the brand name and customer list related intangibles was determined by the income approach method. Assumptions in the fair value assessment included: the impact of changes in economic conditions, revenue and cash flow forecasts for the remaining lives of the intangibles and the Company's weighted average cost of capital ("WACC").
During 2010 and 2009, no impairment losses have been identified.
|
|
i.
|
Goodwill:
|
Goodwill represents excess of the costs over the net assets of businesses acquired. Under ASC 350,
Intangibles - Goodwill and Other
("ASC 350"), goodwill is not amortized but instead is tested for impairment at least annually or between annual tests in certain circumstances, and written-down when impaired.
Testing Methodology:
The Company performs its annual impairment analysis of goodwill as of December 31 of each year, or more often if there are indicators of impairment present. The provisions of ASC 350 require that a two-step impairment test be performed on goodwill at the level of the reporting units. In the first step, or Step 1, the Company compares the fair value of each reporting unit to its carrying value. If the fair value exceeds the carrying value of the net assets, goodwill is considered not impaired, and the Company is not required to perform further testing. If the carrying value of the net assets exceeds the fair value, then the Company must perform the second step, or Step 2, of the impairment test in order to determine the implied fair value of goodwill. To determine the fair value used in Step 1, the Company uses discounted cash flows. If and when the Company is required to perform a Step 2 analysis, determining the fair value of its net assets and its off-balance sheet intangibles would require it to make judgments that involve the use of significant estimates and assumptions.
The reporting units of the Company for purposes of the impairment test are: the Company's RFID and Mobile solutions segment, and the Supply Chain segment, as these are the components of the business for which discrete financial information is available and the segment management regularly reviews the operating results of those components.
F-16
B.O.S. BETTER ONLINE SOLUTIONS LTD.
AND ITS SUBSIDIARIES
NOTES TO CONSOLIDATED FINANCIAL STATEMENTS
NOTE 2:- SIGNIFICANT ACCOUNTING POLICIES (Cont.)
In order to determine the fair value used in Step 1, the Company uses discounted cash flows. If and when the Company is required to perform a Step 2 analysis, determining the fair value of its net assets and its off-balance sheet intangibles would require it to make judgments that involve the use of significant estimates and assumptions. The Company determined the fair value of each reporting unit using the Income Approach, which utilizes a discounted cash flow model, as it believes that this approach best approximates the reporting unit’s fair value at this time. Judgments and assumptions related to revenue, operating income, future short-term and long-term growth rates, weighted average cost of capital, interest, capital expenditures, cash flows, and market conditions are inherent in developing the discounted cash flow model. The material assumptions used for the Income Approach for 2011 were five years of projected net cash flows, WACC of 15% and a long-term growth rate of 3%. The Company considered historical rates and current market conditions when determining the discount and growth rates to use in its analyses. If these estimates or their related assumptions change in the future, the Company may be required to record impairment charges for its goodwill.
The Company corroborates the fair values using the Market Approach. The Company evaluates the reasonableness of the estimated fair value of its reporting units by reconciling to its market capitalization. This reconciliation allows the Company to consider market expectations in corroborating the reasonableness of the fair value of its reporting units. In addition, the Company compares its market capitalization, including an estimated control premium that an investor would need to pay for a controlling interest in the Company, to the fair value of the Company based on a third-party valuation study. The determination of a control premium requires the use of judgment and is based primarily on comparable industry and deal-size transactions, related synergies and other benefits. The Company's reconciliation of the gap between its market capitalization and the aggregate fair value of the Company depends on various factors, some of which are qualitative and involve management judgment, including stable relatively high backlog coverage and experience in meeting operating cash flow targets.
Testing Results:
During 2011 and 2010, no impairment losses have been identified.
During 2009 impairment losses in the amount of $ 383 were recorded and attributed to the Supply Chain solutions reporting unit.
|
|
j.
|
Research and development costs:
|
ASC 985,
Software
, requires capitalization of certain software development costs subsequent to the establishment of technological feasibility. Based on the Company's product development process, technological feasibility is established upon completion of a working model. Research and development costs incurred in the process of developing product improvements or new products, are generally charged to expenses as incurred. Costs incurred by the Company between completion of the working model and the point at which the product is ready for general releases are insignificant.
F-17
B.O.S. BETTER ONLINE SOLUTIONS LTD.
AND ITS SUBSIDIARIES
NOTES TO CONSOLIDATED FINANCIAL STATEMENTS
NOTE 2:- SIGNIFICANT ACCOUNTING POLICIES (Cont.)
|
|
k.
|
Severance pay:
|
The Company's liability for severance pay for some of the Israeli employees is calculated pursuant to the Israeli Severance Pay Law based on the most recent salary of the employees multiplied by the number of years of employment as of the balance sheet date. Employees are entitled to one month's salary for each year of employment or a portion thereof. The Company's liability for its Israeli employees is covered by insurance policies designed solely for distributing severance pay. The value of these policies is not under the Company's control, thus neither an asset nor a liability were recorded regarding these policies.
The Company has one general deposit fund. The value of the deposited funds includes profits, and is recorded as an asset in the Company's balance sheet.
The Company's payroll includes employees regarding whom its liability for severance pay is calculated pursuant to article 14 of Israel's Severance Pay Law. The Company currently deposits the corresponding amounts required in accordance with article 14 to the relevant pension funds. These amounts will be released to the applicable employees upon termination of employment and this substitutes the obligation described above, to pay severance based on the most recent salary of the employee multiplied by the number of years of employment. The aforementioned deposited amounts are not reflected on the financial statements due to the fact that they are not under the Company's control.
Severance expenses for 2011, 2010 and 2009 amounted to $ 242, $ 137 and $ 263, respectively.
|
|
l.
|
Revenue recognition:
|
The Company derives its revenues from the sale of products, license fees for its products, commissions, support and services.
Revenues from product sales, related to both the Supply Chain and RFID and Mobile segments, are recognized in accordance with SAB 104,
Revenue Recognition
("ASC 605") when delivery has occurred, persuasive evidence of an arrangement exists, the vendor's fee is fixed or determinable, no further obligation exists, and collectability is reasonably assured.
Most of the Company's revenues are generated from sales of its products directly to end-users. Other than pricing terms which may differ due to the volume of purchases between end-users, there are no material differences in the terms and arrangements among end-users.
F-18
B.O.S. BETTER ONLINE SOLUTIONS LTD.
AND ITS SUBSIDIARIES
NOTES TO CONSOLIDATED FINANCIAL STATEMENTS
NOTE 2:- SIGNIFICANT ACCOUNTING POLICIES (Cont.)
Revenue from license fees, related to the RFID and Mobile solutions segment, is recognized in accordance with
ASC No. 985-605,
Software Revenue Recognition
, when persuasive evidence of an agreement exists, delivery has occurred, no significant obligations with regard to implementation remain, the fee is fixed or determinable, and collectability is probable. The Company generally does not grant a right of return to its customers. When a right of return exists, the Company defers revenue until the right of return expires, at which time revenue is recognized provided that all other revenue recognition criteria have been met.
Revenues from maintenance and support services related to the license are recognized ratably over the period of the support contract.
Starting January 1, 2011 the Company adopted the guidance of ASU 2009-13,
Multiple-Deliverable Revenue Arrangements
, (amendments to FASB ASC Topic 605,
Revenue Recognition
) ("ASU 2009-13"). ASU 2009-13 requires entities to allocate revenue in an arrangement using estimated selling prices of the delivered goods and services based on a selling price hierarchy. The amendment eliminates the residual method of revenue allocation and requires revenue to be allocated using the relative selling price method. As such, the Company prospectively applied these provisions to all revenue arrangements entered into or materially modified after January 1, 2011. This guidance does not generally change the units of accounting for the Company’s revenue transactions. Most products and services qualify as separate units of accounting and the revenue is recognized when the applicable revenue recognition criteria are met.
The Company's revenue recognition policies provide that, when a sales arrangement contains multiple elements, the Company allocates revenue to each element based on a selling price hierarchy. The selling price for a deliverable is based on its vendor specific objective evidence ("VSOE"), if available, third party evidence ("TPE") if VSOE is not available, or estimated selling price ("ESP") if neither VSOE nor TPE is available.
Because the Company has neither VSOE nor TPE for its deliverables, the allocation of revenue has been based on the Company’s BESP. Amounts allocated to the deliverables are recognized at the time of sale provided the other conditions for revenue recognition have been met.
The Company’s process for determining its BESP considers multiple factors that may vary depending upon the unique facts and circumstances related to each deliverable. A key factor considered by the Company in developing the BESP for its products is the gross margins acceptable in the industry in which the Company operates. The Company may also consider additional factors as appropriate.
The adoption of the amendment to ASC 605-25 did not have a material effect on the Company's consolidated financial position or results of operations.
In addition, in cases that product arrangement is bundled with a separately priced extended warranty that fall under the scope of ASC 605- 20-25-1 through 25-6, revenues from the extended warranty are deferred and recognized ratably over the extended warranty period.
F-19
B.O.S. BETTER ONLINE SOLUTIONS LTD.
AND ITS SUBSIDIARIES
NOTES TO CONSOLIDATED FINANCIAL STATEMENTS
NOTE 2:- SIGNIFICANT ACCOUNTING POLICIES (Cont.)
In the case of arrangements which require significant customization of the Company's RFID software to customer-specific specifications, the Company follows the guidance in ASC 605-35, ("ASC 605-35"), whereby the Company applies the completed contract method, since the Company is unable to obtain reasonable dependable estimates of the total effort required for completion. Under the completed contract method, all revenue and related costs of revenue are deferred and recognized upon completion. Provisions for estimated losses on contracts in process are recognized in the period such losses are determined.
|
|
m.
|
Income taxes:
|
The Company and its subsidiaries account for income taxes in accordance with ASC 740,
Income Taxes
("ASC 740"). ASC 740 prescribes the use of the liability method whereby deferred tax assets and liability account balances are determined based on the differences between the financial reporting and the tax bases of assets and liabilities and are measured using the enacted tax rates and laws that will be in effect when the differences are expected to reverse. The Company and its subsidiaries provide a valuation allowance, if necessary, to reduce deferred tax assets to the amounts that are more likely-than-not to be realized.
The Company implements a two-step approach to recognizing and measuring uncertain tax positions accounted for in accordance with ASC 740. The first step is to evaluate the tax position for recognition by determining if the weight of available evidence indicates it is- more- likely- than- not that the position will be sustained on audit, including resolution of related appeals or litigation processes, if any. The second step is to measure the tax benefit as the largest amount which is more than 50% likely of being realized upon ultimate settlement.. During the year ended December 31, 2011, the Company recorded tax income of $261 in regard to a decrease of uncertain tax position. During the years ended December 31, 2010 and 2009 the Company recorded tax expenses of $ 67 and $421, respectively in regard to uncertain tax positions.
|
|
n.
|
Concentrations of credit risk:
|
Financial instruments that potentially subject the Company to concentrations of credit risk consist principally of cash and cash equivalents, trade receivables and other accounts receivable.
The trade receivables of the Company are derived from sales to customers located primarily in Israel, America, the Far East and Europe. The Company generally does not require collateral; however most of the Company's customer outside of Israel are insured against customer nonpayment, through the Israeli Credit Insurance Company Ltd. In certain circumstances, the Company may require letters of credit, other collateral, additional guarantees or advanced payments. An allowance for doubtful accounts is determined with respect to specific debts that are doubtful of collection.
F-20
B.O.S. BETTER ONLINE SOLUTIONS LTD.
AND ITS SUBSIDIARIES
NOTES TO CONSOLIDATED FINANCIAL STATEMENTS
NOTE 2:- SIGNIFICANT ACCOUNTING POLICIES (Cont.)
|
|
o.
|
Derivative financial instruments:
|
The Company's Derivatives are not designated as hedging accounting instruments under ASC 815, Derivatives and Hedging (originally issued as SFAS 133 and SFAS161).
Those derivatives consist primarily of forward contracts the Company uses to hedge the Company's exposure to currencies other than the U.S. dollar. The Company recognized derivative instruments as either assets or liabilities and measures those instruments at fair value. The derivative instruments that the Company holds do not meet the definition of hedging instruments under ASC 815, Derivatives and Hedging (originally issued as SFAS 133 and SFAS161). Therefore, the Company recognizes changes in the fair values of the derivatives in its statement of income in financial income, net, at the same period as the remeasurement of gain and loss of the related foreign currency denominated assets and liabilities.
As of December 31, 2011, the notional principal of foreign exchange contracts to purchase U.S. dollars with foreign currencies and to sell Euros for foreign currencies was $ 1,600 and €280. The Company recorded the fair value of derivative liability in the amount of $ 67 in accrued expenses and other liabilities.
|
|
p.
|
Basic and diluted net earnings (loss) per share:
|
Basic net earnings (loss) per share are calculated based on the weighted average number of ordinary shares outstanding during each year. Diluted net earnings (loss) per share are calculated based on the weighted average number of ordinary shares outstanding during each year, plus the potential dilution to ordinary shares considered outstanding during the year, in accordance with ASC 260,
Earning per Share
.
The total number of ordinary shares related to outstanding options and warrants that was excluded from the calculations of diluted net earnings (loss) per share, since they would have an anti-dilutive effect, was 1,524,610 , 1,442,339 and 1,333,370 for the years ended December 31, 2011 , 2010 and 2009, respectively.
|
|
q.
|
Accounting for share-based compensation:
|
The Company accounts for equity-based compensation in accordance with ASC 718,
Stock
Compensation ("ASC 718") which requires the recognition of compensation expenses based on estimated fair values for all equity-based awards made to employees and nonemployees and directors.
ASC 718 requires companies to estimate the fair value of equity-based payment awards on the date of grant using an option pricing model. The value of the portion of the award that is ultimately expected to vest is recognized as an expense over the requisite service periods in the Company's consolidated statements of operations.
F-21
B.O.S. BETTER ONLINE SOLUTIONS LTD.
AND ITS SUBSIDIARIES
NOTES TO CONSOLIDATED FINANCIAL STATEMENTS
NOTE 2:- SIGNIFICANT ACCOUNTING POLICIES (Cont.)
The Company recognizes compensation expenses for the value of its awards granted based on the straight line method over the requisite service period of each of the awards, net of estimated forfeitures. ASC 718 requires forfeitures to be estimated at the time of grant and revised, if necessary, in subsequent periods if actual forfeitures differ from those estimates. Estimated forfeitures are based on actual historical pre-vesting forfeitures. The Company considers many factors when estimating forfeitures, including employee class and historical experience.
The Company estimates the fair value of stock options granted using the Black-Scholes options pricing model. The option-pricing model requires a number of assumptions, of which the most significant are expected stock price volatility and the expected option term. Expected volatility was calculated based upon actual historical stock price movements over the most recent periods ending on the date of grant, equal to the expected option terms. The expected option term represents the period that the Company's stock options are expected to be outstanding and was determined based on the simplified method permitted by SAB 107 and extended by SAB 110 as the average of the vesting period and the contractual term. The Company currently uses the simplified method as adequate historical experience is not available to provide a reasonable estimate. The Company adopted SAB 110 effective January 1, 2008 and will continue to apply the simplified method until enough historical experience is available to provide a reasonable estimate of the expected term for stock option grants. The risk-free interest rate is based on the yield from U.S. Treasury zero-coupon bonds with an equivalent term. The Company has historically not paid dividends and has no foreseeable plans to pay dividends.
The fair value for options granted in 2011 and 2009 was estimated on the date of grant using the Black-Scholes option pricing model with the following weighted average assumptions:
|
Year ended
December 31,
|
||||||||
|
2011
|
2009
|
|||||||
|
Risk-free interest
|
1.17% | 1.45% | ||||||
|
Dividend yields
|
0% | 0% | ||||||
|
Volatility
|
96% | 77% | ||||||
|
Expected option term
|
3.83 years
|
3.46 years
|
||||||
|
Forfeiture rate
|
24% | 15% | ||||||
No options were granted during 2010.
F-22
B.O.S. BETTER ONLINE SOLUTIONS LTD.
AND ITS SUBSIDIARIES
NOTES TO CONSOLIDATED FINANCIAL STATEMENTS
NOTE 2:- SIGNIFICANT ACCOUNTING POLICIES (Cont.)
During 2011, 2010 and 2009, the Company recognized stock-based compensation expense related to employee and director stock options as follows:
|
Year ended December 31,
|
||||||||||||
|
2011
|
2010
|
2009
|
||||||||||
|
Selling and marketing
|
$ | 8 | $ | 39 | $ | 377 | ||||||
|
General and administrative
|
161 | 178 | 252 | |||||||||
|
Total stock-based compensation expense
|
$ | 169 | $ | 217 | $ | 629 | ||||||
The Company applies ASC 718 and ASC 505-50 for equity instruments that are issued to other than employees for acquiring, or in conjunction with, selling, goods or services.
|
|
r.
|
Fair value of financial instruments:
|
The following methods and assumptions were used by the Company in estimating fair value disclosures for financial instruments:
The carrying amounts of cash and cash equivalents, trade receivables, other accounts receivable, short term loans and trade payables approximate their fair value due to the short-term maturities of such instruments. The carrying amounts of long-term loans approximate their fair value.
Assets and liabilities measured at fair value on a recurring basis as of December 31, 2011 are comprised of foreign currency forward contracts (See Note 4).
Assets measured at fair value on a non-recurring basis as of December 31, 2011 are Investment in shares of a cost method investee and intangible assets that were written down to their fair value as a result of an impairment loss.
ASC 820 establishes a three-tier value hierarchy, which prioritizes the inputs used in the valuation methodologies in measuring fair value:
|
Level 1 -
|
Observable inputs that reflect quoted prices (unadjusted) for identical assets or liabilities in active markets.
|
|
Level 2 -
|
Include other inputs that are directly or indirectly observable in the marketplace.
|
|
Level 3 -
|
Unobservable inputs which are supported by little or no market activity.
|
F-23
B.O.S. BETTER ONLINE SOLUTIONS LTD.
AND ITS SUBSIDIARIES
NOTES TO CONSOLIDATED FINANCIAL STATEMENTS
NOTE 2:- SIGNIFICANT ACCOUNTING POLICIES (Cont.)
The fair value hierarchy also requires an entity to maximize the use of observable inputs and minimize the use of unobservable inputs when measuring fair value.
|
|
s.
|
Reclassification:
|
Certain 2010 figures have been reclassified to conform to the 2011 presentation. The reclassification had no effect on previously reported net income or shareholders' equity.
|
|
t.
|
Impact of recently issued accounting pronouncements :
|
In May 2011, the FASB issued ASU 2011-04 to amend ASC 820, “Fair Value Measurement.” The amendment requires companies to disclose the valuation techniques and inputs used to develop the measurements for assets and liabilities that are measured at fair value on a recurring or nonrecurring basis in the statement of financial position after initial recognition. For recurring fair value measurements using significant unobservable inputs (Level 3), companies are required to disclose the effect of the measurements on earnings (or changes in net assets) or other comprehensive income for the period. This guidance is effective for interim and annual periods beginning after December 15, 2011. The Company does not believe that the adoption of this guidance will have a material impact on its consolidated financial statements.
In June 2011, the FASB issued ASU 2011-05 (an amendment to ASC 220—"Presentation of Comprehensive Income"), which requires an entity to present total comprehensive income, the components of net income, and the components of other comprehensive income either in a single continuous statement of comprehensive income or in two separate but consecutive statements and eliminates the option to present the components of other comprehensive income as part of the statement of changes in stockholders’ equity. This guidance is effective for fiscal years and interim periods, beginning after December 15, 2011. The Company’s adoption of ASU 2011-05 will not have an impact on its financial statements.
In September 2011, the FASB issued ASU 2011-08, (an amendment to ASC 350, "Intangibles—Goodwill and Other"), which amends Topic 350 to allow an entity to first assess qualitative factors to determine whether it is necessary to perform the two-step quantitative goodwill impairment test. An entity would not be required to calculate the fair value of a reporting unit unless the entity determines, based the qualitative assessment, that it is more likely than not that its fair value is less than its carrying amount. This guidance is effective for annual and interim goodwill tests performed for years beginning after December 15, 2011. Early adoption is permitted. The Company’s adoption of ASU 2011-08 is not expected to have an impact on its financial statements.
In December 2011, the FASB issued ASU. 2011-12 (another amendment to ASC 220), which indefinitely deferred certain provisions of ASU 2011-05, including the requirement to present reclassification adjustments out of accumulated other comprehensive income
F-24
B.O.S. BETTER ONLINE SOLUTIONS LTD.
AND ITS SUBSIDIARIES
NOTES TO CONSOLIDATED FINANCIAL STATEMENTS
By component in both the statement in which net income is presented and the statement in which other comprehensive income is presented. This amendment is effective for both annual and interim financial statements beginning after December 15, 2011. The Company’s adoption of ASU 2011-12 will not have an impact on its financial statements.
|
NOTE 3:-
|
OTHER ACCOUNTS RECEIVABLE AND PREPAID EXPENSES
|
|
December 31,
|
||||||||
|
2011
|
2010
|
|||||||
|
Government authorities
|
$ | 92 | $ | 213 | ||||
|
Advances to suppliers
|
411 | 536 | ||||||
|
Prepaid expenses
|
172 | 57 | ||||||
|
Deferred expenses attributed to software projects
|
52 | 146 | ||||||
|
Receivable in respect of investment sale
|
- | 127 | ||||||
|
Derivative asset
|
- | 63 | ||||||
|
Other
|
17 | 41 | ||||||
| $ | 744 | $ | 1,183 | |||||
|
NOTE 4:-
|
FAIR VALUE MEASUREMENTS
|
In accordance with ASC 820, derivative contracts are classified within Level 2 as the valuation inputs are based on quoted prices and market observable data of similar instruments.
The Company's financial liabilities and assets measured at fair value on a recurring basis, consisted of derivatives which were classified within Level 2 and amounted to a ($ 67) liability and a $ 63 asset as of December 31, 2011 and 2010, respectively.
As of December 31, 2011, the Company's investment in Surf (a cost method investee) was measured at fair value of $ 68, on a nonrecurring basis, due to other–than-temporary impairment of $ 39. The fair value was determined based on the price set at a new equity financing round raised by the investee in 2010 and was classified as Level 2 in the ASC 820 hierarchy (i.e., quoted price of identical asset in a non-active market).
|
NOTE 5:-
|
INVENTORIES
|
|
December 31,
|
||||||||
|
2011
|
2010
|
|||||||
|
Raw materials
|
$ | 189 | $ | 135 | ||||
|
Finished goods
|
3,831 | 4,990 | ||||||
| $ | 4,020 | $ | 5,125 | |||||
F-25
B.O.S. BETTER ONLINE SOLUTIONS LTD.
AND ITS SUBSIDIARIES
NOTES TO CONSOLIDATED FINANCIAL STATEMENTS
|
NOTE 6:-
|
INVESTMENT IN OTHER COMPANIES
|
The Company's investments in companies comprise of an investment in Surf Communication Systems Ltd.:
|
December 31,
|
||||||||
|
2011
|
2010
|
|||||||
|
Cost net of cumulative impairment losses
|
$ | 68 | $ | 107 | ||||
|
NOTE 7:-
|
PROPERTY, PLANT AND EQUIPMENT
|
|
December 31,
|
||||||||
|
2011
|
2010
|
|||||||
|
Cost:
|
||||||||
|
Computers and software
|
$ | 2,107 | $ | 2,197 | ||||
|
Office furniture and equipment
|
1,037 | 1,027 | ||||||
|
Leasehold improvements and real estate
|
1,408 | 1,417 | ||||||
|
Motor Vehicles
|
365 | 205 | ||||||
| 4,917 | 4,846 | |||||||
|
Accumulated depreciation:
|
||||||||
|
Computers and software
|
2,002 | 2,024 | ||||||
|
Office furniture and equipment
|
615 | 594 | ||||||
|
Leasehold improvements and real estate
|
942 | 930 | ||||||
|
Motor vehicles
|
192 | 163 | ||||||
| 3,751 | 3,711 | |||||||
|
Depreciated cost
|
$ | 1,166 | $ | 1,135 | ||||
Depreciation expenses amounted to $ 280, $ 241 and $ 199 for the years ended December 31, 2011, 2010 and 2009, respectively.
F-26
B.O.S. BETTER ONLINE SOLUTIONS LTD.
AND ITS SUBSIDIARIES
NOTES TO CONSOLIDATED FINANCIAL STATEMENTS
|
NOTE 8:-
|
OTHER INTANGIBLE ASSETS, NET
|
|
December 31, 2011
|
Weighted average amortization period
|
December 31, 2010
|
Weighted average amortization period
|
|||||||||||||
|
Cost:
|
||||||||||||||||
|
Backlog
|
$ | 27 | - | $ | 29 | - | ||||||||||
|
Technology
|
226 | - | 226 | - | ||||||||||||
|
Brand name
|
670 | 4.1 | 722 | 5.1 | ||||||||||||
|
Customer list
|
2,450 | 2.5 | 2,483 | 3.5 | ||||||||||||
| 3,373 | 3,460 | |||||||||||||||
|
Accumulated amortization and depreciation:
|
||||||||||||||||
|
Backlog
|
27 | 29 | ||||||||||||||
|
Technology
|
226 | 226 | ||||||||||||||
|
Brand name
|
411 | 259 | ||||||||||||||
|
Customer list
|
2,169 | 1,434 | ||||||||||||||
| 2,833 | 1,948 | |||||||||||||||
|
Amortized cost
|
$ | 540 | $ | 1,512 | ||||||||||||
Intangible assets are amortized based on the straight line method for their remaining useful life.
Amortization expenses amounted to $ 931 (including impairment of $ 555 regarding the customer list and brand name), $ 369 and $ 397 for the years ended December 31, 2011, 2010 and 2009, respectively.
Estimated amortization expenses for the years ended:
|
December 31,
|
||||
|
2012
|
$ | 180 | ||
|
2013
|
180 | |||
|
2014
|
110 | |||
|
2015
|
63 | |||
|
2016
|
47 | |||
| $ | 540 | |||
F-27
B.O.S. BETTER ONLINE SOLUTIONS LTD.
AND ITS SUBSIDIARIES
NOTES TO CONSOLIDATED FINANCIAL STATEMENTS
|
NOTE 9:-
|
GOODWILL
|
Goodwill attributed to operating reporting units for the years ended December 31, 2011 and 2010 is as follows:
|
RFID and Mobile Solutions
|
Supply
Chain Solutions
|
Total
|
||||||||||
|
Balance as of January 1, 2010
|
$ | 4,172 | $ | - | $ | 4,172 | ||||||
|
Foreign currency translation adjustments
|
266 | - | 266 | |||||||||
|
Balance as of December 31, 2010
|
4,438 | - | 4,438 | |||||||||
|
Foreign currency translation adjustments
|
(316 | ) | - | (316 | ) | |||||||
|
Balance as of December 31, 2011
|
$ | 4,122 | $ | - | $ | 4,122 | ||||||
In accordance with ASC 320,
Goodwill
and Other Intangible Assets
, goodwill is not amortized, but instead is reviewed and tested for impairment at least annually and whenever events or circumstances occur which indicate that goodwill might be impaired (see Note 2i). Impairment of goodwill is tested at the Company's reporting unit level by comparing the carrying amount, including goodwill, to the fair value. In performing the analysis, the Company uses the best information available, including reasonable and supportable assumptions and projections and expert opinion. If the carrying amount of the Company exceeds its implied fair value, goodwill is considered impaired and a second step is performed to measure the amount of impairment loss, if any.
The Company performed an annual impairment test on December 31, 2011 and no impairment loses were recorded.
During the second quarter of 2009, the Company performed an impairment test as a result of the overall global economic conditions and determined that goodwill related to the Supply Chain Solutions reporting unit, in the amount of $383, was fully impaired.
The annual goodwill impairment tests for the RFID and Mobile solutions segment performed on December 31, 2009 and December 31, 2010 did not result in any impairment charges.
F-28
B.O.S. BETTER ONLINE SOLUTIONS LTD.
AND ITS SUBSIDIARIES
NOTES TO CONSOLIDATED FINANCIAL STATEMENTS
|
NOTE 10:-
|
SHORT-TERM BANK LOANS AND CURRENT MATURITIES
|
|
Weighted interest
rate as of December 31, 2011
|
December 31,
|
|||||||||||
|
Loan currency
|
%
|
2011
|
2010
|
|||||||||
|
NIS
|
7.25 | $ | 3,904 | $ | 5,473 | |||||||
| $ | 5.49 | 2,932 | 1,804 | |||||||||
| 6,836 | 7,277 | |||||||||||
|
Current maturities
|
5.8 | 660 | 501 | |||||||||
| $ | 7,496 | $ | 7,778 | |||||||||
The repayment of the Company's bank debt (to Bank Leumi) is secured by a first priority floating charge on all of the Company's assets, and by a first priority fixed charge on all of the Company's issued and unpaid share capital, its goodwill and its shares of its Israeli subsidiaries. The loan terms restrict substantial asset sales, cash dividends, and certain inter-company and shareholders payments. In addition, the Company and its Israeli subsidiaries entered into a series of inter-company guarantees in favor of the bank.
The Bank Leumi loan agreements contained various financial covenants which required that the Company maintain certain financial ratios related to shareholders' equity, EBITDA and operating results. On February 8, 2010, the Company and its Israeli subsidiaries executed revised loan documents governing their credit line from Bank Leumi, in which they undertook revised covenants for year 2010. There were no Bank Leumi covenants related to short term loans applicable for the fiscal year 2011.
|
NOTE 11:-
|
ACCRUED EXPENSES AND OTHER LIABILITIES
|
|
December 31,
|
||||||||
|
2011
|
2010
|
|||||||
|
Government authorities
|
$ | 275 | $ | 514 | ||||
|
Professional services
|
196 | 145 | ||||||
|
Derivative liability
|
67 | - | ||||||
|
Liability to Dimex Systems (see Note 13)
|
301 | 301 | ||||||
|
Other
|
155 | 80 | ||||||
| $ | 994 | $ | 1,040 | |||||
F-29
B.O.S. BETTER ONLINE SOLUTIONS LTD.
AND ITS SUBSIDIARIES
NOTES TO CONSOLIDATED FINANCIAL STATEMENTS
|
NOTE 12:-
|
LONG-TERM BANK LOANS, NET OF CURRENT MATURITIES
|
|
a.
|
Classified by linkage terms and interest rates, the total amount of the loans is as follows:
|
|
Weighted interest
rate as of December 31, 2011
|
December 31,
|
|||||||||||
|
Loan currency
|
%
|
2011
|
2010
|
|||||||||
|
NIS
|
5.8 (Prime plus 0 - 2.2)
|
$ | 2,190 | $ | 895 | |||||||
| 2,190 | 895 | |||||||||||
|
Less - current maturities
|
5.8 | 660 | 501 | |||||||||
| $ | 1,530 | $ | 394 | |||||||||
Bank Leumi debt amounted to $367 and $870 in December 31, 2011 and December 31, 2010, respectively.The repayment of the Company's bank debt to Bank Leumi is secured by a first priority floating charge on all of the Company's assets, and by a first priority fixed charge on all of the Company's issued and unpaid share capital, its goodwill and its shares of its Israeli subsidiaries. The loan terms restrict substantial asset sales, cash dividends, and certain inter-company and shareholders payments. In addition, the Company and its Israeli subsidiaries entered into a series of inter-company guarantees in favor of the bank.
The Bank Leumi loan agreements contained various financial covenants which require that the Company maintain certain financial ratios related to shareholders' equity, EBITDA and operating results. On February 8, 2010, the Company and its Israeli subsidiaries executed revised loan documents governing their credit line from Bank Leumi, in which they undertook revised covenants for year 2010. There were no Bank Leumi covenants applicable for the fiscal year 2011.
Bank HaPoalim debt amounted to $1,714 and $25 in December 31, 2011 and December 31, 2010, respectively.
The repayment of the Company's bank debt to Bank HaPoalim is not secured, except by long term bank deposits in the amount of $427. The Bank HaPoalim loan agreements contain various financial covenants which require that the Company's Israeli subsidiaries maintain certain financial ratios and level of profitability. As of December 31, 2011 the Company did not meet the bank HaPoalim covenants of financial ratios and profitability. However, the Company received a written waiver from Bank HaPoalim, under which, the Bank agreed, under certain conditions, to waive the failure of the Company to meet these financial covenants in 2011.
|
|
b.
|
The Company loans (from both Bank Leumi and Bank HaPoalim) mature in the following years subsequent to the balance sheet dates:
|
|
2012 (Current maturities)
|
$ | 660 | ||
|
2013
|
397 | |||
|
2014
|
437 | |||
|
2015
|
385 | |||
|
2016
|
311 | |||
| $ | 2,190 |
F-30
B.O.S. BETTER ONLINE SOLUTIONS LTD.
AND ITS SUBSIDIARIES
NOTES TO CONSOLIDATED FINANCIAL STATEMENTS
|
NOTE 13:-
|
LONG-TERM CONVERTIBLE NOTE
|
On August 20, 2009, the Company entered into a $ 2,400 convertible loan financing ("Convertible Loan Financing") with several lenders including Catalyst Private Equity Partners (Israel) II L.P., Telegraph Hill Capital Fund I, LLC, certain existing shareholders and members of its management. The financing proceeds were to be used mainly for working capital. The financing consisted of loans with a term of three years that bear interest at a rate equal to 8% per annum, compounded annually. The Company was to repay the loan principal amount and the accrued interest in one payment at the end of the term, unless converted earlier into ordinary shares at the discretion of the lender. Each lender was entitled to demand the immediate repayment in cash of its respective portion of the convertible loan amount, upon the occurrence of Events of Default, as stipulated in the Convertible Loans Agreement. In case of a Default, the Company undertook to pay the lenders the entire convertible loans amount due to them and any accrued interest. The loan conversion rate was $ 3.25 per ordinary share. The Company granted the lenders warrants to purchase 100% of the number of ordinary shares into which the loan was convertible. The warrants were exercisable, in whole or in part, from 18 months to 36 months from grant, at an exercise price per ordinary share of $ 2.75. The fair values of the warrants were calculated based on the Black-Scholes option pricing model, amounted to approximately $ 646 and are recorded as a component of shareholders' equity (as the warrants were exercisable into a fixed number of shares at a fixed exercise price and the Company has a sufficient amount of authorized shares as required by ASC 815-40). In addition, the lenders received certain registration rights (on the Company's best effort). In November 2009, as part of a separation agreement between the Company and Shalom Daskal, the Company repaid to Mr. Daskal $50 of convertible loan he had previously extended to it.
In connection with the Convertible Loan Financing, the Company accumulated in 2009 and 2010 deferred costs in the amount of $150 and $ 172, respectively, which were recorded in long-term assets and which will be amortized over the period of the convertible note.
In March 2009, the Company entered into an amendment to the Dimex Systems Asset Purchase Agreement ("the 2009 restructuring"), whereby it has revised the schedule of remaining payments of NIS 10 then still owed by the Company to Dimex Systems. The amendment to the agreement provided for a NIS 3.5 million payment in March 2009, NIS 4 million to be paid in 6 equal monthly installments each, starting on January 15, 2010, and the remaining approximately NIS 2.5 million (equivalent to $675) was converted into a convertible note as part of the aforementioned ConvertibleLoan Financing.
On February 4, 2010, the Company entered into an additional amendment to the Dimex Systems Asset Purchase Agreement of January 2008 ("the 2010 restructuring"), whereby it has revised the schedule of remaining payments of NIS 4 million then still owed by the Company to Dimex Systems. The amendment to the agreement provided for: (1) payment of NIS 300 in February 2010 (2) NIS 3.1 million to be paid in equal monthly installments commencing July 2010 through December 2013 (including a five months grace period) which bears 8% interest per annum (3) Warrants to purchase 69,096 of the Company's ordinary shares which are exercisable, in whole or in
part, through December 2013 at an exercise price per ordinary share of $ 3.25 on or before August 3, 2011 and thereafter at an increased exercise price of $ 4.00 per ordinary share, and (4) NIS 600 (equivalent to $ 161) were converted into a long-term convertible note with identical terms to the aforementioned convertible note issued in August 2009.
F-31
B.O.S. BETTER ONLINE SOLUTIONS LTD.
AND ITS SUBSIDIARIES
NOTES TO CONSOLIDATED FINANCIAL STATEMENTS
|
NOTE 13:-
|
LONG-TERM CONVERTIBLE NOTE (Cont.)
|
The Company has accounted for the restructured debts to Dimex Systems under the criteria of ASC 470-60, "Troubled Debt Restructurings by Debtors".
The new effective borrowing rate of the 2010 restructured debt was lower than the effective borrowing rate of the old debt immediately prior to the 2010 restructuring and immediately prior to the 2009 restructuring.
Therefore, the Company concluded that the creditor has granted a concession and the restructuring of the debt is within the scope of ASC 470-60. As of the dates of the 2009 and 2010 restructuring, the Company calculated the effective borrowing rate on the debt (the new effective borrowing rate is the discounted rate that equates the present value of the future cash payments specified by the new terms of the restructured debt, with the carrying amount of the payable and includes the fair value of the warrants granted in conjunction with the aforementioned restructurings). The new effective interest rate as of the 2010 restructuring date and as of December 31, 2010 was an annual rate of 11%.
On December 21, 2011, the Company amended the terms of the convertible loan conversion agreements (the "Conversion Agreements”) with its convertible debt lenders (the "Lenders"). According to the amended Conversion Agreements, $2,523 of the former Convertible Loan Financing ($2,093 principal and $430 accrued interest) was converted into 1,681,965 ordinary shares (reflecting a reduced conversion price of $1.5 per ordinary share, instead of the $3.25 conversion price under the original agreement). In addition, warrants to purchase 643,984 shares that had been issued to the Lenders were extended by two years until July 2014 and February 2015, with no change to the exercise prices.
The remaining convertible loan of $501 (the "Deferred Loan" or the "2011 restructuring") shall remain outstanding, and will bear reduced interest rate of 4% (instead of 8% according to the original agreement with Dimex Systems). The Deferred Loan will no longer be convertible. The Deferred Loan will be repaid in 24 equal monthly installments commencing January 10, 2014 (instead of in two payments – in July 2012 and February 2013, according to the original agreement with Dimex Systems).
The Company accounted for the outstanding amount of $2,523 that was converted by the holders in accordance with ASC 470-20 "Debt with Conversion and Other Options". In accordance with ASC 470- 20, an expense is recognized if and to the extent that “additional consideration is paid to debt holders for the purpose of inducing prompt conversion of the debt to equity securities (sometimes referred to as a convertible debt ‘sweetener’).”
F-32
B.O.S. BETTER ONLINE SOLUTIONS LTD.
AND ITS SUBSIDIARIES
NOTES TO CONSOLIDATED FINANCIAL STATEMENTS
|
NOTE 13:-
|
LONG-TERM CONVERTIBLE NOTE (Cont.)
|
As a result, the application of ASC 470-20 to the exchange of existing convertible debt for common stock resulted in the recording of a non-cash “inducement” accounting charge of $616, which was a calculation of the difference between the 776,378 ordinary shares that would have been issuable to the applicable note holder under the original conversion rights that existed in the convertible notes and the 1,681,965 ordinary shares underlying the amended note, multiplied by $0.68 which was the fair market value of the Company's share as of the date of the Conversion Agreement. This non-cash charge is deemed a financing expense to extinguish the notes and it is included in the Consolidated Statements of Operations with a corresponding increase in Additional paid-in capital. The Company also recorded an additional expense of $144 related to the unamortized remaining discount and deferred charges on the convertible note.
Following the extension of the warrants as mentioned above, the Company recorded $86 financial expenses in its statement of operations, reflecting the incremental compensation caused directly from the extension.
With respect to the remaining loan amount of $501 that was not converted, the Company has accounted for the 2011 restructuring under the criteria of ASC 470-60.
The new effective borrowing rate of the 2011 restructured debt was lower than the effective borrowing rate of the old debt immediately prior to the 2011 restructuring.
Therefore, the Company concluded that the creditor has granted a concession and the restructuring of the debt is within the scope of ASC 470-60. As of the date of the 2011 restructuring, the Company calculated the effective borrowing rate on the debt (the new effective borrowing rate is the discounted rate that equates the present value of the future cash payments specified by the new terms of the restructured debt, with the carrying amount of the payable and includes the fair value of the warrants granted in conjunction with the aforementioned restructurings). The new effective interest rate as of the 2011 restructurings date and as of December 31, 2011 was an annual rate of 5.9%.
|
NOTE 14:-
|
COMMITMENTS AND CONTINGENT LIABILITIES
|
|
|
a.
|
Commitments:
|
|
|
1.
|
Royalty commitments:
|
|
|
a)
|
Under the Company's research and development agreements with the Office of the Chief Scientist ("OCS") and pursuant to applicable laws, the Company is required to pay royalties at the rate of 3.5% of sales of products developed with funds provided by the OCS, up to an amount equal to 100% of the research and development grants (dollar-linked) received from the OCS. The obligation to pay these royalties is contingent upon actual sales of the products. Royalties payable with respect to grants received under programs approved by the OCS after January 1, 1999, are subject to interest on the U.S. dollar-linked value of the total grants received at the annual rate of
LIBOR applicable to U.S. dollar deposits at the time the grants are received. No grants were received during the years 2009 through 2011.
|
F-33
B.O.S. BETTER ONLINE SOLUTIONS LTD.
AND ITS SUBSIDIARIES
NOTES TO CONSOLIDATED FINANCIAL STATEMENTS
|
NOTE 14:-
|
COMMITMENTS AND CONTINGENT LIABILITIES (Cont.)
|
As of December 31, 2011, the Company has an outstanding contingent obligation to pay royalties to the OCS, including interest, in the amount of approximately $ 3,304, in respect of these grants. Royalty expenses in the amount of $ 3 were recorded on such royalties during 2011 and 2010, respectively. No royalty expenses were recorded on such royalties during
2009. Commencing year 2012, there are no sales of products that were developed using funds provided by the OCS.
|
|
b)
|
The Israeli Government, through the Overseas Marketing Fund, awarded the Company grants for participation in expenses for overseas marketing. The Company is committed to pay royalties to the Fund for Encouragement of Marketing Activities (the "Marketing Fund") at the rate of 3% of the increase in export sales, up to the amount of the grants received by the Company linked to the dollar and bearing interest. No grants were received during the years 2009 through 2011.
|
|
|
As of December 31, 2011, the Company has an outstanding contingent obligation to pay royalties to the Marketing Fund including interest, in the amount of $ 101. No Marketing Fund royalty expenses were recorded during 2011, 2010 and 2009.
|
|
|
2.
|
The facilities of the Company are rented under operating lease agreements that expire on various dates ending in 2016. Minimum future rental payments for 2012, 2013 and 2014 are $ 105, $ 93 and $ 72, respectively.
|
The Company's motor vehicles are rented under various cancelable operating lease agreements. The lease agreements for the motor vehicles expire on various dates ending in 2014. The maximum breach of contract fees may amount to $ 76.
Lease expenses for the facilities occupied by the Company and the Company's motor vehicles in 2011, 2010 and 2009 amounted to $ 551, $ 563 and $ 566, respectively.
|
|
3.
|
Litigation
|
On November 2008, Blockshtil Ltd. filed a claim in the Petach-Tikva Magistrate Court alleging breach of contract by the Company and seeking damages in the amount of NIS 149 thousand (approximately $ 42). The Company has served a statement of defense and the last hearing in this case is expected to take place on September 12, 2012.
The Company's financial statements include a provision in this respect.
F-34
B.O.S. BETTER ONLINE SOLUTIONS LTD.
AND ITS SUBSIDIARIES
NOTES TO CONSOLIDATED FINANCIAL STATEMENTS
|
NOTE 15:-
|
SHAREHOLDERS' EQUITY
|
On January 12, 2010, the Company announced that the reverse share split which was approved in the general shareholders' meeting on December 23, 2009, has become effective prior to the opening of the market on January 12, 2010. Pursuant to the reverse split, each 5 ordinary shares, NIS 4.00 nominal value per share, was converted into one ordinary share, NIS 20.00 nominal value per share. No fractional shares were issued as a result of the reverse split. Instead, all fractional shares were rounded up to the next higher whole number of shares. All share and per share data in these financial statements and related notes are reported after the effect of the 1 for 5 reverse split.
On December 23, 2009, the Company's authorized share capital increased from NIS 140,000,000, divided into 7,000,000 ordinary shares of NIS 20.00 nominal value each to NIS 200,000,000 divided into 10,000,000 ordinary shares of NIS 20.00 nominal value each.
|
|
a.
|
Private placements:
|
On October 5, 2010 the Company entered into a definitive private placement agreement with Telegraph Hill Capital Fund I, LLC ("THCAP") for the issuance of an aggregate of 96,362 Ordinary Shares at a price per share of $ 3.11, or approximately $ 300 in total. In addition, the Company announced that Mr. Luis Gutierrez Roy, managing partner in THCAP was appointed to its Board of Directors.
On December 21, 2011 the company announced that it has entered into agreements with its convertible debt lenders, for the amendment of their loan agreements and the subsequent conversion of their debt into the Company’s ordinary shares.
The amendments to the loan agreements provide that the amount of $2,460 of these loans was converted into the company's ordinary shares at a reduced conversion price of $1.50 per share, instead of the conversion rate of $3.25 per share set in the original loan agreements. As a result of the conversion, the company issued 1,681,965 ordinary shares.
In connection with the conversion, the term of warrants to purchase 643,982 shares that had been issued to the lenders, was extended by 2 years, until July 2014 and February 2015 (see Note 13).
The Company's outstanding warrants to shareholders as of December 31, 2011 are as follows
|
Outstanding and exercisable warrants
|
Weighted average exercise
|
Weighted
average
|
||||||||
|
as of
|
price of
|
remaining
|
||||||||
|
December 31,
|
outstanding
|
contractual
|
||||||||
|
2011
|
warrants
|
life (years)
|
||||||||
| 619,122 | $ | 2.75 | 2.6 | |||||||
| 24,861 | $ | 2.75 | 3.1 | |||||||
| 108,363 | $ | 13.80 | - | |||||||
F-35
B.O.S. BETTER ONLINE SOLUTIONS LTD.
AND ITS SUBSIDIARIES
NOTES TO CONSOLIDATED FINANCIAL STATEMENTS
|
NOTE 15:-
|
SHAREHOLDERS' EQUITY (Cont.)
|
|
|
b.
|
Stock option plans:
|
In May 2003, the Company's shareholders approved the adoption of the 2003 Israeli Stock Option Plan ("the Plan"), pursuant to which 125,000 ordinary shares were reserved for purchase by the employees, directors, consultants and service providers of the Company and its subsidiaries. Subsequently, the shareholders approved increases of the shares reserved for issuance under the Plan, initially to 200,000, and thereafter to 300,000, to 520,000, to 830,000 and in December 21, 2011 to 1,100,000. Any option which is canceled or forfeited before expiration will become available for future grants.
As of December 31, 2011 an aggregate of 446,701 of these options are still available for future grants. Each option granted under the Plan expires between 3-10 years from the date of the grant. The options vest gradually over a period of up to four years.
A summary of the Company's employee and director stock option activity and related information for the year ended December 31, 2011, is as follows:
|
Number of options
|
Weighted-average exercise price
|
Weighted- average remaining contractual term (in years)
|
Aggregate intrinsic value
|
|||||||||||||
|
Outstanding at January 1, 2011
|
474,591 | $ | 7.69 | 3.26 | $ | 140 | ||||||||||
|
Changes during the year:
|
||||||||||||||||
|
Granted
|
339,273 | $ | 1.72 | |||||||||||||
|
Exercised
|
(33,442 | ) | $ | - | ||||||||||||
|
Forfeited or cancelled
|
(281,596 | ) | $ | 3.94 | ||||||||||||
|
Outstanding at December 31, 2011
|
498,826 | $ | 6.25 | $ | 2.91 | $ | 60 | |||||||||
|
Vested and expected to vest
|
479,571 | $ | 6.25 | 2.88 | $ | 60 | ||||||||||
|
Exercisable at December 31,2011
|
401,716 | $ | 7.16 | $ | 2.71 | $ | 56 | |||||||||
All options exercised in 2011 were granted in 2009 and included $0 exercise price.
The weighted-average grant-date fair value of options granted during the years ended December 31 2011 and 2009 was $ 1.69 and $ 1.70, respectively,(no options were granted in 2010). The aggregate intrinsic value in the table above represents the total intrinsic value (the difference between the fair market value of the Company's ordinary shares on December 31, 2011 and the exercise price, multiplied by the number of in-the-money options) that would have been received by the option holders had all option holders exercised their options on December 31, 2011.
F-36
B.O.S. BETTER ONLINE SOLUTIONS LTD.
AND ITS SUBSIDIARIES
NOTES TO CONSOLIDATED FINANCIAL STATEMENTS
U.S. dollars in thousands, except share and per share data
|
NOTE 15:-
|
SHAREHOLDERS' EQUITY (Cont.)
|
Total intrinsic value of options exercised for the years ended December 31, 2011, 2010 and 2009 was $ 33, $ 62 and $ 25, respectively. As of December 31, 2011, there was $ 38 of total unrecognized compensation cost related to non-vested share-based compensation arrangements granted under the Company's stock option plans. That cost is expected to be recognized over a weighted-average period of 14 months.
No cash was received from exercise of options in the years ended December 31, 2011, 2010 and 2009.
The options granted to employees and director outstanding as of December 31, 2011 separated into ranges of exercise prices, are as follows:
|
Weighted average
|
||||||||||||||||||
|
Options
|
Weighted
|
Options
|
remaining
|
|||||||||||||||
|
outstanding
|
average
|
exercisable
|
contractual
|
|||||||||||||||
|
as of
|
remaining
|
as of
|
life
of options
|
|||||||||||||||
|
exercise
|
December 31,
|
contractual
|
December 31,
|
exercisable
|
||||||||||||||
|
price
|
2011
|
life (years)
|
2011
|
(years)
|
||||||||||||||
| $ | 0 | 55,144 | 2.00 | 53,644 | 1.91 | |||||||||||||
| $ | 0.95 | 89,440 | 4.98 | 22,360 | 4.98 | |||||||||||||
| $ | 2.00 | 36,794 | 4.25 | 36,794 | 4.25 | |||||||||||||
| $ | 2.10 | 1,500 | 4.51 | - | - | |||||||||||||
| $ | 2.48 | 1,500 | 2.14 | 1,000 | 2.14 | |||||||||||||
| $ | 2.75 | 2,462 | 2.56 | 2,462 | 2.56 | |||||||||||||
| $ | 3.05 | 6,000 | 1.88 | 4,500 | 1.88 | |||||||||||||
| $ | 3.49 | 1,500 | 0.12 | 1,500 | 0.12 | |||||||||||||
| $ | 5.00 | 58,640 | 1.11 | 37,610 | 1.52 | |||||||||||||
| $ | 7.33 | 1,500 | 1.34 | 1,500 | 1.34 | |||||||||||||
| $ | 7.50 | 1,500 | 1.50 | 1,500 | 1.50 | |||||||||||||
| $ | 8.40 | 15,000 | 6.24 | 15,000 | 6.24 | |||||||||||||
| $ | 8.57 | 1,500 | 0.22 | 1,500 | 0.22 | |||||||||||||
| $ | 11.93 | 80,000 | 2.75 | 80,000 | 2.75 | |||||||||||||
| $ | 12.60 | 62,680 | 4.94 | 62,680 | 4.94 | |||||||||||||
| $ | 13.40 | 28,066 | 0.38 | 28,066 | 0.38 | |||||||||||||
| $ | 15.00 | 5,600 | 0.81 | 1,600 | 2.64 | |||||||||||||
| $ | 20.00 | 50,000 | 0.05 | 50,000 | 0.05 | |||||||||||||
| 498,826 | 2.91 | 401,716 | 2.71 | |||||||||||||||
F-37
B.O.S. BETTER ONLINE SOLUTIONS LTD.
AND ITS SUBSIDIARIES
NOTES TO CONSOLIDATED FINANCIAL STATEMENTS
|
NOTE 15:-
|
SHAREHOLDERS' EQUITY (Cont.)
|
|
|
c.
|
Warrants issued to service providers and debt providers:
|
The Company accounts for warrants issued to service providers and debt providers in accordance with the provisions of ASC 505-50,
"Equity-Based Payments to Non-Employees"
. The fair value for these warrants was estimated at the date of grant using the
Black-Scholes option pricing model
. During the years 2009 and 2010 the Company granted warrants to several service and debt providers (see Note 13). No warrants were granted in 2011 to service and debt providers.
The Company's outstanding warrants to service and debt holders as of December 31, 2011 are as follows:
|
Weighted average
|
||||||||||||||||||
|
Warrants
|
Weighted
|
Warrants
|
remaining
|
|||||||||||||||
|
outstanding
|
average
|
exercisable
|
contractual
|
|||||||||||||||
|
as of
|
remaining
|
as of
|
life
of warrants
|
|||||||||||||||
|
exercise
|
December 31,
|
contractual
|
December 31,
|
exercisable
|
||||||||||||||
|
price
|
2011
|
life (years)
|
2011
|
(years)
|
||||||||||||||
| $ | 0.00 | 1,320 | 2.00 | 1,320 | 2.00 | |||||||||||||
| $ | 2.50 | 20,000 | 4.59 | 20,000 | 4.59 | |||||||||||||
| $ | 2.75 | 140,599 | 1.01 | 140,599 | 1.01 | |||||||||||||
| $ | 3.72 | 69,096 | 2.10 | 69,096 | 2.10 | |||||||||||||
| $ | 5.00 | 13,200 | 2.00 | 13,200 | 2.00 | |||||||||||||
| $ | 20.20 | 19,482 | 0.97 | 19,482 | 0.97 | |||||||||||||
| $ | 26.50 | 9,741 | 1.63 | 9,741 | 1.63 | |||||||||||||
| 273,438 | 1.61 | 273,438 | 1.61 | |||||||||||||||
|
NOTE 16:-
|
TAXES ON INCOME
|
|
|
a.
|
Change in corporate tax rate:
|
The Israeli corporate tax rate was 26% in 2009, 25% in 2010 and 24% in 2011.
A company is taxable on its real (non-inflationary) capital gains at the corporate tax rate in the year of sale. A temporary provision for 2006-2009 stipulated that the sale of an asset other than a quoted security (excluding goodwill that was not acquired) that had been purchased prior to January 1, 2003, and sold by December 31, 2009, is subject to corporate tax as follows: the part of the real capital gain that is linearly attributed to the period prior to December 31, 2002 is subject to the corporate tax rate in the year of sale as set forth in the Israeli Income Tax Ordinance, and the part of the real capital gain that is linearly attributed to the period from January 1, 2003, through December 31, 2009, is subject to tax at a rate of 25%.
F-38
B.O.S. BETTER ONLINE SOLUTIONS LTD.
AND ITS SUBSIDIARIES
NOTES TO CONSOLIDATED FINANCIAL STATEMENTS
|
NOTE 16:-
|
TAXES ON INCOME (Cont.)
|
On December 5, 2011, the Israeli Parliament (the Knesset) passed the Law for Tax Burden Reform (Legislative Amendments), 2011 ("the Law") which, among other things, cancels, effective from 2012, the scheduled progressive reduction in the corporate tax rate. The Law also increases the corporate tax rate to 25% in 2012. In parallel with this increase in
the corporate tax rate, the real capital gains tax rate and the real betterment tax rate were increasedas well.
The Law did not have a material effect on the Company's consolidated financial position or results of operations.
|
|
b.
|
Loss carry forward:
|
The Company and its Israeli subsidiaries have accumulated losses for Israeli income tax purposes as of December 31, 2011, in the amount of approximately $ 31,111. These losses may be carried forward and offset against taxable income in the future for an indefinite period. In addition, the Company and its Israeli subsidiaries have accumulated capital loses which may be carried forward under certain limitations.
|
|
c.
|
Deferred income taxes:
|
Deferred income taxes reflect the net tax effect of temporary differences between the carrying amounts of assets and liabilities for financial reporting purposes and the amounts used for income tax purposes. Significant components of the Company's deferred tax liabilities and assets are as follows:
|
December 31,
|
||||||||
|
2011
|
2010
|
|||||||
|
Assets in respect of:
|
||||||||
|
Allowances and provisions
|
$ | 195 | $ | 188 | ||||
|
Net operating loss carry forward (1)
|
7,778 | 6,625 | ||||||
| 7,973 | 6,813 | |||||||
|
Valuation allowance (2)
|
(7,838 | ) | (6,461 | ) | ||||
| 135 | 352 | |||||||
|
Liabilities in respect of intangible assets
|
(135 | ) | (352 | ) | ||||
|
Net deferred tax assets (liability)
|
$ | - | $ | - | ||||
|
|
(1)
|
See Note 16b.
|
|
|
(2)
|
The Company has provided valuation allowances in 2011 on deferred tax assets resulting from tax loss carry forward and other reserves and allowances due to their history of operating losses and current uncertainty concerning the ability to realize these deferred tax assets in the future.
|
F-39
B.O.S. BETTER ONLINE SOLUTIONS LTD.
AND ITS SUBSIDIARIES
NOTES TO CONSOLIDATED FINANCIAL STATEMENTS
U.S. dollars in thousands, except share and per share data
|
NOTE 16:-
|
TAXES ON INCOME (Cont.)
|
|
|
d.
|
Tax benefit (taxes on income) is comprised as follows:
|
|
Year ended December 31,
|
||||||||||||
|
2011
|
2010
|
2009
|
||||||||||
|
Current
|
$ | 172 | $ | (2 | ) | $ | (6 | ) | ||||
|
Prior years
|
- | (3 | ) | - | ||||||||
|
Deferred
|
- | - | (323 | ) | ||||||||
| $ | 172 | $ | (5 | ) | $ | (329 | ) | |||||
|
Domestic
|
172 | $ | (73 | ) | $ | (323 | ) | |||||
|
Foreign
|
- | 68 | (6 | ) | ||||||||
| $ | 172 | $ | (5 | ) | $ | (329 | ) | |||||
|
|
e.
|
Profit (Loss) before taxes is comprised as follows:
|
|
Year ended December 31,
|
||||||||||||
|
2011
|
2010
|
2009
|
||||||||||
|
Domestic
|
$ | (3,429 | ) | $ | 228 | $ | (5,697 | ) | ||||
|
Foreign
|
43 | (52 | ) | - | ||||||||
| $ | (3,386 | ) | $ | 176 | $ | (5,697 | ) | |||||
|
|
f.
|
Reconciliation of the theoretical tax expense to the actual tax expense:
|
The main reconciling items between the statutory tax rate of the Company and the effective tax rate are the non-recognition of tax benefits from accumulated net operating losses carry forward among the Company and various subsidiaries due to uncertainty of the realization of such tax benefits.
|
|
g.
|
Tax assessments:
|
BOS, BOS Odem, BOS Dimex and Quasar have final assessments through 2006. Dimex Hagalil was incorporated in 2008, and therefore, does not have any final assessments.
Ruby-Tech Inc., a U.S. subsidiary, has final assessments through 2007.
|
|
h.
|
In accordance with the Company's accounting policy, interest expense and potential penalties related to income taxes are included in the tax expense line of the Company's consolidated statements of operations.
|
F-40
B.O.S. BETTER ONLINE SOLUTIONS LTD.
AND ITS SUBSIDIARIES
NOTES TO CONSOLIDATED FINANCIAL STATEMENTS
|
NOTE 16:-
|
TAXES ON INCOME (Cont.)
|
The Company and its subsidiaries file income tax returns in Israel and in the United States. BOS, BOS Dimex, BOS Odem and Quasar may be subject to auditing by the Israel tax authorities for fiscal years 2007 and after. Dimex Hagalil may be subject to auditing by the Israel tax authorities for fiscal years 2008 and thereafter. Ruby-Tech Inc., a U.S. subsidiary, may be subject to auditing by the U.S. Internal Revenue Service for fiscal years 2007 and thereafter.
The Company believes that it has adequately provided for any reasonably foreseeable outcome related to tax audits and settlement. The final tax outcome of the Company's tax audits could be different from that which is reflected in the Company's income tax provisions and accruals. Such differences could have a material effect on the Company's income tax provision and net loss in the period in which such determination is made.
|
|
i.
|
Uncertain tax positions
|
|
December 31,
|
||||||||
|
2011
|
2010
|
|||||||
|
Uncertain tax positions, beginning of year
|
$ | 379 | $ | 333 | ||||
|
Decreases in tax positions for prior years
|
(207 | ) | (12 | ) | ||||
|
Increases in tax positions for current year
|
- | 58 | ||||||
|
Uncertain tax positions, end of year
|
$ | 172 | $ | 379 | ||||
The Company recognizes interest accrued that is related to unrecognized tax benefits and penalties in taxes on income. During the years ended December 31, 2011 and 2010, the Company recognized approximately ($ 54) and $ 22, respectively, in interest and penalties. The Company had approximately $ 54 and $ 109 accruals for the payment of interest and penalties at December 31, 2011 and 2010, respectively.
F-41
B.O.S. BETTER ONLINE SOLUTIONS LTD.
AND ITS SUBSIDIARIES
NOTES TO CONSOLIDATED FINANCIAL STATEMENTS
U.S. dollars in thousands, except share and per share data
|
NOTE 17:-
|
SUPPLEMENTARY INFORMATION TO STATEMENTS OF OPERATIONS
|
| Financial expenses, net: | ||||||||||||||||
|
Year ended December 31,
|
||||||||||||||||
|
2011
|
2010
|
2009
|
||||||||||||||
| a. | Financial income: | |||||||||||||||
|
Interest on bank deposits
|
$ | 3 | $ | 32 | $ | 9 | ||||||||||
|
Change in fair value of forward contracts
|
- | 141 | 82 | |||||||||||||
| 3 | 173 | 91 | ||||||||||||||
|
Financial expenses:
|
||||||||||||||||
|
In respect of bank loans and convertible note
|
(1,251 | ) | ( 1 ,039 | ) | ( 671 | ) | ||||||||||
|
Inducement and related cost (Note 13)
|
(760 | ) | - | - | ||||||||||||
|
Revaluation of fair value related to extension of warrants as part of an Inducement of a convertible note
|
(86 | ) | - | - | ||||||||||||
|
Change in fair value of forward contracts
|
(44 | ) | ||||||||||||||
|
Other (mainly foreign currency transaction losses)
|
(103 | ) | (95 | ) | (26 | ) | ||||||||||
| (2,244 | ) | (1,134 | ) | (697 | ) | |||||||||||
| $ | (2,241 | ) | $ | ( 961 | ) | $ | ( 606 | ) | ||||||||
| b. |
Net earnings (loss) per share:
|
|||||||||||||||
| 1. |
Numerator:
|
|||||||||||||||
|
Numerator for basic and diluted net Earnings (loss) per share:
|
||||||||||||||||
|
Income (loss) from continuing operations
|
$ | (3,214 | ) | $ | 171 | $ | (6,026 | ) | ||||||||
|
Loss from discontinued operations
|
- | (806 | ) | (3,075 | ) | |||||||||||
|
Net loss available to ordinary shareholders
|
$ | (3,214 | ) | $ | (635 | ) | $ | ( 9,101 | ) | |||||||
| 2. |
Denominator (in thousands):
|
|||||||||||||||
|
Basic weighted average ordinary shares outstanding (in thousands)
|
2,818 | 2,622 | 2,606 | |||||||||||||
|
Diluted weighted average ordinary shares outstanding (in thousands)
|
2,818 | 2,757 | 2,606 | |||||||||||||
|
Basic and diluted net earnings (loss) per share from continuing operations
|
$ | (1.14 | ) | $ | 0.07 | $ | (2.32 | ) | ||||||||
|
Basic and diluted net earnings (loss) per share from discontinued operations
|
$ | - | $ | (0.31 | ) | $ | (1.18 | ) | ||||||||
|
Basic and diluted net loss per share
|
$ | (1.14 | ) | $ | (0.24 | ) | $ | (3.50 | ) | |||||||
F-42
B.O.S. BETTER ONLINE SOLUTIONS LTD.
AND ITS SUBSIDIARIES
NOTES TO CONSOLIDATED FINANCIAL STATEMENTS
|
NOTE 18:-
|
SEGMENTS AND GEOGRAPHICAL INFORMATION
|
The Company manages its business in two reportable segments, consisting of the RFID and Mobile Solutions segment and the Supply Chain Solutions segment.
The Company's management makes financial decisions and allocates resources, based on the information it receives from its internal management system. The Company allocates resources and assesses performance for each operating segment using information about revenues and gross profit. The Company applies ASC 280,
Segment Reporting
.
|
|
a.
|
Revenues, gross profit and assets for the operating segments for the years 2011, 2010 and 2009 were as follows:
|
|
RFID and Mobile Solutions
|
Supply
Chain Solutions
|
Not
Allocated/ Intercompany
|
Consolidated
|
|||||||||||||
|
2011
|
||||||||||||||||
|
Revenues
|
$ | 13,128 | $ | 21,332 | $ | (1,026 | ) | $ | 33,434 | |||||||
|
Gross profit
|
$ | 3,105 | $ | 3,405 | $ | - | $ | 6,510 | ||||||||
|
Assets related to segment
|
$ | 10,132 | $ | 9,869 | $ | 68 | $ | 20,069 | ||||||||
|
2010
|
||||||||||||||||
|
Revenues
|
$ | 12,463 | $ | 17,724 | $ | - | $ | 30,187 | ||||||||
|
Gross profit
|
$ | 3,632 | $ | 3,851 | $ | - | $ | 7,483 | ||||||||
|
Assets related to segment
|
$ | 12,418 | $ | 9,605 | $ | 107 | $ | 22,130 | ||||||||
|
2009
|
||||||||||||||||
|
Revenues
|
$ | 10,729 | $ | 14,738 | $ | - | $ | 25,467 | ||||||||
|
Gross profit
|
$ | 3,375 | $ | 116 | $ | - | $ | 3,491 | ||||||||
|
Assets related to segment
|
$ | 17,201 | $ | 4,159 | $ | 579 | $ | 21,939 |
F-43
B.O.S. BETTER ONLINE SOLUTIONS LTD.
AND ITS SUBSIDIARIES
NOTES TO CONSOLIDATED FINANCIAL STATEMENTS
|
NOTE 18:-
|
SEGMENTS AND GEOGRAPHICAL INFORMATION (Cont.)
|
|
|
b.
|
The following presents total revenues and long-lived assets for the years 2011, 2010 and 2009 based on the location of customers:
|
|
Year ended December 31,
|
||||||||||||||||||||||||
|
2011
|
2010
|
2009
|
||||||||||||||||||||||
|
Total
|
Long-lived
|
Total
|
Long-lived
|
Total
|
Long-lived
|
|||||||||||||||||||
|
revenues
|
assets *)
|
revenues
|
assets *)
|
revenues
|
assets *)
|
|||||||||||||||||||
|
America
|
$ | 1,514 | $ | - | $ | 2,596 | $ | - | $ | 1,548 | $ | - | ||||||||||||
|
Far East
|
3,943 | - | 2,228 | - | 998 | - | ||||||||||||||||||
|
Europe
|
976 | - | 811 | - | 566 | - | ||||||||||||||||||
|
Israel and others
|
27,001 | 1,166 | 24,552 | 1,135 | 22,355 | 1,221 | ||||||||||||||||||
| $ | 33,434 | $ | 1,166 | $ | 30,187 | $ | 1,135 | $ | 25,467 | $ | 1,221 | |||||||||||||
|
|
*)
|
Long-lived assets are comprised of property, plant and equipment (intangible assets and goodwill are not included).
|
|
|
c.
|
Major customer data as a percentage of total revenues:
|
|
Year ended December 31,
|
||||||||||||
|
2011
|
2010
|
2009
|
||||||||||
|
Customer A (Supply Chain Segment)
|
10 | % | 7 | % | 14 | % | ||||||
|
NOTE 19:-
|
RELATED PARTIES
|
|
|
a.
|
Service Agreement of Cukierman & Co.:
|
The Company's Audit Committee and Board of Directors approved an engagement with Cukierman & Co. Investment House Ltd. ("Cukierman & Co"), to provide non-exclusive investment-banking services and business development services to the Company ("the Service Agreement"), effective April 15, 2003. Cukierman & Co. is a company indirectly controlled by Mr. Edouard Cukierman. Since June 26, 2003, Mr. Cukierman serves as Chairman of the Company's Board, and he is also a co-manager of the Catalyst Fund, the Company's largest shareholder. For its services, Cukierman & Co. is paid a monthly sum of $ 10 plus VAT, in addition to a success fee of 4%-6% for a consummated private placement. The Service Agreement provides for success fees in connection with securing M&A transactions of 3.5% of the proceeds exchanged in such a transaction and also for a success fee of 6% of the revenues actually received by the Company in respect of a sale of the Company's products to a new customer which was introduced by Cukierman & Co. According to its terms, the Company may terminate the Service Agreement at any time, by giving a one-month prior written notice.
F-44
B.O.S. BETTER ONLINE SOLUTIONS LTD.
AND ITS SUBSIDIARIES
NOTES TO CONSOLIDATED FINANCIAL STATEMENTS
|
NOTE 19:-
|
RELATED PARTIES (Cont.)
|
Expenses the Company paid or accrued according to the Service Agreement with Cukierman & Co. are:
|
Year ended December 31,
|
||||||||||||
|
2011
|
2010
|
2009
|
||||||||||
|
Business development
|
$ | 120 | $ | 95 | $ | 147 | ||||||
|
Success fee in respect of issuance of convertible loan
|
- | - | 40 | |||||||||
|
Success fee in respect of issuance of private placements
|
- | 18 | - | |||||||||
|
Total
|
$ | 120 | $ | 113 | $ | 187 | ||||||
|
|
b.
|
Active Chairman Agreement with Edouard Cukierman:
|
On November 7, 2007, the shareholders approved an Active Chairman Agreement with Mr. Edouard Cukierman, the Chairman of the Board, pursuant to which, Mr. Edouard Cukierman was granted options ("the Options") to purchase up to 20,000 ordinary shares of the Company per each calendar year of service as the Company's Chairman of the Board of Directors ("the Service") in the years 2007-2010. The Options were in lieu of any compensation, fees or options otherwise payable by the Company to Mr. Cukierman as a director.
The exercise price of the Options was $ 11.925, which was equal to the weighted average of the closing prices of the Company's ordinary shares on the Nasdaq Global Market during the thirty-day period preceding the shareholders approval. Unexercised Options expire after five years from their grant date.
In March 2011, the Company’s Audit Committee and Board of Directors approved a new Active Chairman Agreement with Mr. Cukierman for services in the years 2011-2014. The agreement was approved by the company's shareholder on December 20, 2011. Pursuant to this agreement in consideration for Mr. Cukierman’s services as the Company’s Active Chairman in the years 2011-2014, he shall be granted options to purchase 89,440 ordinary shares, and be paid a monthly cash payment of $5, plus VAT at the prevailing rate. Payment of the cash fee shall be made each month in respect of the previous month of service. Following approval by the shareholders, the cash fees for 2011 were paid retroactively for the entire year.
The exercise price of the options is $0.95 and they vest and become exercisable in 16 equal quarterly installments of 5,590 options each. The first three installments vested immediately following the shareholders approval, and the fourth installment vested on December 31, 2011. Additional installments vest at the end of each subsequent calendarquarter, provided that Mr. Cukierman shall hold his position as Chairman of the Board at the applicable vesting date.
Pursuant to the agreement, if Mr. Cukierman’s service to the Company is terminated by the Company for no cause then: (a) any unvested options shall be accelerated, so that they become immediately vested in full as of the date of the termination and (b) the accelerated options and
any previously vested options shall be exercisable for twenty four (24) months following the termination.
F-45
B.O.S. BETTER ONLINE SOLUTIONS LTD.
AND ITS SUBSIDIARIES
NOTES TO CONSOLIDATED FINANCIAL STATEMENTS
|
NOTE 19:-
|
RELATED PARTIES (Cont.)
|
The options and the cash fee are in lieu of any compensation, fees or options otherwise payable by the Company to Mr. Cukierman as a director.
Expenses the Company paid or accrued according to the Active Chairman Agreement with Edouard Cukierman are as follows:
|
Year ended December 31,
|
||||||||||||
|
2011
|
2010
|
2009
|
||||||||||
|
Chairman fees
|
$ | 60 | $ | - | $ | - | ||||||
|
Share based compensation expenses
|
43 | 75 | 147 | |||||||||
|
Total
|
$ | 103 | $ | 75 | $ | 147 | ||||||
|
|
c.
|
Agreements with THCAP:
|
In September 2009, the Company entered into a service agreement with THCAP, pursuant to which THCAP shall provide the Company with non-exclusive private financing and business consulting services. In consideration, the Company issued to THCAP warrants to purchase 14,400 ordinary shares at an exercise price of $2.75 per share. The warrants were exercisable as of February 28, 2011 and can be exercised until August 31, 2012. In March 2012,
The Company’s Audit Committee and Board of Directors approved an additional grant to THCAP of warrants to purchase 14,400 ordinary shares. The grant is subject to the Company's shareholder approval. The warrants' exercise price will be equal to the weighted average of the closing prices of the Company’s ordinary shares on the Nasdaq Capital Market, during the twenty-day period preceding the date of the shareholders' approval. The warrants will be exercisable for 3 years from the grant date.
In November 2009, the Company entered into an amendment to the service agreement with THCAP, pursuant to which THCAP shall be paid a success fee of 5% of the revenues generated to the Company from the sale of the Company products to business partners introduced by THCAP.
Expenses the Company paid or accrued according to the agreements with THCAP are as follows:
|
Year ended December 31,
|
||||||||||||
|
2011
|
2010
|
2009
|
||||||||||
|
Share based compensation expenses
|
$ | 1 | $ | 10 | $ | 1 | ||||||
On October 5, 2010 the Company entered into a definitive private placement agreement with THCAP pursuant to which the Company issued to THCAP ordinary shares (see Note 15a), and
Mr. Luis Gutierrez Roy, the managing partner in THCAP was appointed to its Board of Directors.
F-46
B.O.S. BETTER ONLINE SOLUTIONS LTD.
AND ITS SUBSIDIARIES
NOTES TO CONSOLIDATED FINANCIAL STATEMENTS
|
NOTE 20:-
|
Subsequent events
|
|
|
a.
|
On January 17, 2012, the Company received a notice from the Listing Qualifications Department of The Nasdaq Stock Market (“Nasdaq”) advising the Company that it has failed to comply with Nasdaq’s requirement that listed securities maintain a minimum bid price of $1.00 per share as set forth in Nasdaq Listing Rules. The Company has a 180 days' period, until July 16, 2012
,
to regain compliance with the $1.00 minimum bid price requirement. If at any time during this 180 days' period, the closing bid price of the Company’s security is at least $1 for a minimum of ten consecutive business days, the Company will regain compliance. In the event the Company does not regain compliance, the Company may be eligible for additional 180 calendar days. To qualify, the Company will be required to meet the continued listing requirement for market value of publicly held shares and all other initial listing standards for The Nasdaq Capital Market, with the exception of the bid price requirement, and will need to provide written notice of its intention to cure the deficiency during the second compliance period.
|
F-47
TABLE OF CONTENTS
Part IItem 1: Identity Of Directors, Senior Management and AdvisorsItem 2: Offer Statistics and Expected TimetableItem 3: Key Information Regarding BosItem 4: Information on The CompanyItem 4A: Unresolved Staff CommentsItem 5: Operating and Financial Review and ProspectsItem 6: Directors, Senior Management and EmployeesItem 7: Major Shareholders and Related Party TransactionsItem 8: Financial InformationItem 9: The Offer and ListingItem 10: Additional InformationItem 11: Quantitative and Qualitative Disclosure About Market RiskItem 12: Description Of Securities Other Than Equity SecuritiesPart IIItem 13: Defaults, Dividend Arrearages and DelinquenciesItem 14: Material Modifications To The Rights Of Security Holders and Use Of ProceedsItem 15: Controls and ProceduresItem 16: [reserved]Item 16A: Audit Committee Financial ExpertItem 16B: Code Of EthicsItem 16C: Principal Accountant Fees and ServicesItem 16D: Exemptions From The Listing Standards For Audit CommitteesItem 16E: Purchases Of Equity Securities By The Issuer and Affiliated PurchasersItem 16F: Change in Registrant S Certifying AccountantItem 16G: Corporate GovernanceItem 16H: Mine Safety DisclosuresPart IIIItem 17: Financial StatementsItem 18: Financial StatementsItem 19: ExhibitsNote 1:- GeneralNote 1:- General (cont.)Note 2:- Significant Accounting PoliciesNote 2:- Significant Accounting Policies (cont.)Note 3:- Other Accounts Receivable and Prepaid ExpensesNote 4:- Fair Value MeasurementsNote 5:- InventoriesNote 6:- Investment in Other CompaniesNote 7:- Property, Plant and EquipmentNote 8:- Other Intangible Assets, NetNote 9:- GoodwillNote 10:- Short-term Bank Loans and Current MaturitiesNote 11:- Accrued Expenses and Other LiabilitiesNote 12:- Long-term Bank Loans, Net Of Current MaturitiesNote 13:- Long-term Convertible NoteNote 13:- Long-term Convertible Note (cont.)Note 14:- Commitments and Contingent LiabilitiesNote 14:- Commitments and Contingent Liabilities (cont.)Note 15:- Shareholders' EquityNote 15:- Shareholders' Equity (cont.)Note 16:- Taxes on IncomeNote 16:- Taxes on Income (cont.)Note 17:- Supplementary Information To Statements Of OperationsNote 18:- Segments and Geographical InformationNote 18:- Segments and Geographical Information (cont.)Note 19:- Related PartiesNote 19:- Related Parties (cont.)Note 20:- Subsequent Events