UNITED STATES
SECURITIES AND EXCHANGE COMMISSION
WASHINGTON, D.C. 20549
FORM 20-F
|
o
|
REGISTRATION STATEMENT PURSUANT TO SECTION 12(b) OR 12(g) OF THE SECURITIES EXCHANGE ACT OF 1934
|
|
|
|
|
OR
|
|
|
|
|
|
x
|
ANNUAL REPORT PURSUANT TO SECTION 13 OR 15(d) OF THE SECURITIES EXCHANGE ACT OF 1934
For the fiscal year ended December 31, 2018
|
|
|
|
|
OR
|
|
|
|
|
|
o
|
TRANSITION REPORT PURSUANT TO SECTION 13 OR 15(d) OF THE SECURITIES EXCHANGE ACT OF 1934
|
|
|
|
|
OR
|
|
|
|
|
|
o
|
SHELL COMPANY REPORT PURSUANT TO SECTION 13 OR 15(d) OF THE SECURITIES EXCHANGE ACT OF 1934
|
Commission file number 001-36906
|
INTERNATIONAL GAME TECHNOLOGY PLC
|
|
(Exact name of Registrant as specified in its charter)
|
|
|
|
England and Wales
|
|
(Jurisdiction of incorporation or organization)
|
|
|
|
66 Seymour Street, 2nd Floor
London W1H 5BT
United Kingdom
|
|
(Address of principal executive offices)
|
|
|
|
Christopher Spears
Senior Vice President and General Counsel
IGT Center
10 Memorial Boulevard
Providence, RI 02903
Telephone: (401) 392-1000
Fax: (401) 392-4812
E-mail: Christopher.Spears@IGT.com
|
|
(Name, Telephone, E-mail and/or Facsimile number and Address of Company Contact Person)
|
Securities registered pursuant to Section 12(b) of the Act:
|
Title of each class
|
|
Name of each exchange on which registered
|
||
|
|
|
|
||
|
Ordinary Shares, nominal value $0.10
|
|
New York Stock Exchange
|
||
Securities registered pursuant to Section 12(g) of the Act: None
Securities for which there is a reporting obligation pursuant to Section 15(d) of the Act: None
Indicate the number of outstanding shares of each of the issuer’s classes of capital or common stock as of the close of the period covered by the annual report:
|
|
204,210,731 ordinary shares, nominal value $0.10 per share.
|
Indicate by check mark if the registrant is a well-known seasoned issuer, as defined in Rule 405 of the Securities Act.
x
Yes
o
No
If this report is an annual or transition report, indicate by check mark if the registrant is not required to file reports pursuant to Section 13 or 15(d) of the Securities Act of 1934.
o
Yes
x
No
Indicate by check mark whether the registrant: (1) has filed all reports required to be filed by Section 13 or 15(d) of the Securities Exchange Act of 1934 during the preceding 12 months (or for such shorter period that the registrant was required to file such reports), and (2) has been subject to such filing requirements for the past 90 days.
x
Yes
o
No
Indicate by check mark whether the registrant has submitted electronically every Interactive Data File required to be submitted pursuant to Rule 405 of Regulation S-T (§ 232.405 of this chapter) during the preceding 12 months (or for such shorter period that the registrant was required to submit such files).
x
Yes
o
No
Indicate by check mark whether the registrant is a large accelerated filer, an accelerated filer, a non-accelerated filer or an emerging growth company. See the definitions of “large accelerated filer,” “accelerated filer,” and “emerging growth company” in Rule 12b-2 of the Exchange Act.
|
Large accelerated filer
x
|
Accelerated filer
o
|
|
Non-accelerated filer
o
|
Emerging growth company
o
|
If an emerging growth company that prepares its financial statements in accordance with U.S. GAAP, indicate by check mark if the registrant has elected not to use the extended transition period for complying with any new or revised financial accounting standards provided pursuant to Section 13(a) of the Exchange Act.
o
Indicate by check mark which basis of accounting the registrant has used to prepare the financial statements included in this filing:
|
U.S. GAAP
x
|
|
International Financial Reporting Standards as issued
by the International Accounting Standards Board
o
|
|
Other
o
|
If “Other” has been checked in response to the previous question indicate by check mark which financial statement item the registrant has elected to follow.
o
Item 17 or
o
Item 18
If this is an annual report, indicate by check mark whether the registrant is a shell company (as defined in Rule 12b-2 of the Exchange Act).
o
Yes
x
No
(APPLICABLE ONLY TO ISSUERS INVOLVED IN BANKRUPTCY PROCEEDINGS DURING THE PAST FIVE YEARS)
Indicate by check mark whether the registrant has filed all documents and reports required to be filed by Section 12, 13 or 15(d) of the Securities Exchange Act of 1934 subsequent to the distribution of securities under a plan confirmed by a court.
o
Yes
o
No
TABLE OF CONTENTS
|
|
|
Page
|
|
|
|
|
||
|
|
|
||
|
|
|
||
|
|
|||
|
|
|
||
|
|
|||
|
|
|
||
|
|
|
||
|
|
|||
|
|
|||
2
PRESENTATION OF FINANCIAL AND CERTAIN OTHER INFORMATION
International Game Technology PLC, a public limited company organized under the laws of England and Wales (the “Parent”), has its corporate headquarters at 66 Seymour Street, 2nd floor, London, W1H 5BT, United Kingdom. The Parent is the successor to GTECH S.p.A., a
società per azioni
incorporated under the laws of Italy, and the sole stockholder of International Game Technology, a Nevada corporation. The Parent, together with its consolidated subsidiaries, has principal operating facilities in Providence, Rhode Island; Las Vegas, Nevada; and Rome, Italy.
In this annual report on Form 20-F, unless otherwise specified or the context otherwise indicates, all references to “IGT PLC” and the “Company” refer to the business and operations of the Parent and its consolidated subsidiaries.
This annual report on Form 20-F includes the consolidated financial statements of the Company for the years ended
December 31, 2018
,
2017
and
2016
(the “Consolidated Financial Statements”) prepared in accordance with United States Generally Accepted Accounting Principles as issued by the Financial Accounting Standards Board.
The financial information is presented in U.S. dollars. All references to “U.S. dollars,” “U.S. dollar,” “U.S. $” and “$” refer to the currency of the United States of America. All references to “euro” and “€” refer to the currency introduced at the start of the third stage of the European Economic and Monetary Union pursuant to the Treaty on the Functioning of the European Union, as amended.
The language of this annual report on Form 20-F is English. Certain legislative references and technical terms have been cited in their original language so that the correct technical meaning may be ascribed to them under applicable law.
3
Glossary of Certain Terms and Abbreviations (as used in this annual report on Form 20-F)
|
Abbreviation/Term
|
|
Definition
|
|
2019 Opinion
|
the opinion published on January 14, 2019 by the DOJ regarding enforcement of the Wire Act
|
|
|
ADM
|
|
Agenzia delle Dogane e Dei Monopoli
|
|
AGM
|
the annual general meeting of the Parent's shareholders
|
|
|
ASC
|
Accounting Standards Codification
|
|
|
AWPs
|
|
amusement with prize machines
|
|
Articles
|
the Articles of Association of the Parent adopted on May 17, 2018
|
|
|
B2B
|
|
business-to-business
|
|
B2C
|
|
business-to-consumer
|
|
B&D Holding
|
B&D Holding di Marco Drago e C. S.a.p.a.
|
|
|
Board
|
the board of directors of the Parent
|
|
|
Brexit
|
the vote by the U.K. to leave the E.U. and the terms of such departure
|
|
|
CA 2006
|
|
Companies Act 2006, as amended
|
|
CEO
|
|
Chief Executive Officer
|
|
CFO
|
|
Chief Financial Officer
|
|
Code
|
|
Internal Revenue Code of 1986, as amended
|
|
Company
|
the Parent together with its consolidated subsidiaries
|
|
|
COSO
|
|
Committee of Sponsoring Organizations of the Treadway Commission
|
|
Credit Suisse
|
Credit Suisse International
|
|
|
CTA
|
|
Italian Consolidated Tax Act
|
|
De Agostini
|
De Agostini S.p.A.
|
|
|
DOJ
|
U.S. Department of Justice
|
|
|
DoubleDown
|
|
Double Down Interactive LLC
|
|
DTC
|
|
The Depository Trust Company
|
|
DTR
|
|
Disclosure and Transparency Rules
|
|
EBITDA
|
|
earnings before interest, taxes, depreciation and amortization
|
|
E.U.
|
European Union
|
|
|
Election Form
|
a form submitted by a holder of Ordinary Shares who wishes to exercise the votes of the related Special Voting Shares pursuant to the terms of the Loyalty Plan
|
|
|
Eligible Person
|
a person who has maintained ownership of Ordinary Shares in accordance with Articles and the Loyalty Plan for a continuous period of three years or more
|
|
|
Exchange Act
|
|
Securities Exchange Act of 1934, as amended
|
|
FASB
|
|
Financial Accounting Standards Board
|
|
FMCs
|
|
facilities management contracts
|
|
GAAP
|
|
United States Generally Accepted Accounting Principles
|
|
GDPR
|
E.U. General Data Protection Regulation
|
|
|
GTECH
|
GTECH S.p.A.
|
|
|
Gratta e Vinci
|
the Italian instant ticket lottery game
|
|
|
HMRC
|
|
Her Majesty’s Revenue & Customs of the United Kingdom
|
|
IAS
|
|
international accounting standards
|
|
IFRS
|
|
International Financial Reporting Standards
|
|
iGaming
|
|
digital (interactive) gaming
|
|
IGT
|
|
International Game Technology, a Nevada corporation, prior to April 7, 2015
|
|
IGT PLC
|
|
the Parent together with its consolidated subsidiaries
|
|
IP
|
intellectual property
|
|
|
late number
|
one of the 90 numbers of the Lotto game in Italy that has not been drawn for 100 drawings
|
|
|
LMAs
|
|
Lottery Management Agreements
|
4
|
Abbreviation/Term
|
|
Definition
|
|
LN
|
|
Lotterie Nazionali S.r.l.
|
|
Lotto License
|
the Company's license for the operation of the Italian Gioco del Lotto game
|
|
|
Lottoitalia
|
Lottoitalia s.r.l., a joint venture company among Lottomatica, Italian Gaming Holding a.s., Arianna 2001 and Novomatic Italia
|
|
|
Lottomatica
|
Lottomatica Holding S.r.l.
|
|
|
Loyalty Plan
|
the terms and conditions related to the Special Voting Shares
|
|
|
Loyalty Register
|
the register of ordinary shares for which holders thereof have validly elected to exercise the related Special Voting Shares
|
|
|
LTI
|
|
long-term incentive compensation
|
|
LTIP
|
long-term incentive compensation plan
|
|
|
Moody’s
|
|
Moody’s Investor Service
|
|
MBOs
|
management by objectives
|
|
|
NAGI
|
|
North America Gaming and Interactive
|
|
NALO
|
North America Lottery
|
|
|
NYSE
|
|
New York Stock Exchange
|
|
OI
|
corporate operating income
|
|
|
Parent
|
International Game Technology PLC
|
|
|
PFICs
|
|
Passive Foreign Investment Companies
|
|
PwC US
|
|
PricewaterhouseCoopers LLP
|
|
R&D
|
|
research and development
|
|
RSUs
|
restricted share units
|
|
|
S&P
|
|
Standard & Poor’s Ratings Services
|
|
SAB
|
SEC Staff Accounting Bulletin
|
|
|
SAB 118
|
SAB No. 118,
Income Tax Accounting Implications of the Tax Cuts and Jobs Act
|
|
|
same store revenue
|
revenue from existing customers as opposed to new customers
|
|
|
SEC
|
|
United States Securities and Exchange Commission
|
|
SOG
|
|
stock ownership guidelines
|
|
Special Voting Shares
|
the special voting shares in the Parent, worth U.S.$000001 each and carrying 0.9995 votes
|
|
|
STI
|
|
short-term incentive compensation
|
|
10eLotto
|
|
a game of chance in Italy
|
|
Tax Act
|
|
the Tax Cuts and Jobs Act of 2017
|
|
TPE
|
third-party evidence
|
|
|
TSR
|
total shareholder return
|
|
|
U.K.
|
|
United Kingdom
|
|
U.S.
|
|
United States of America
|
|
UIGEA
|
U.S.Unlawful Internet Gambling Enforcement Act of 2006
|
|
|
Variable Forward Transaction
|
the variable forward transaction entered into between De Agostini and Credit Suisse on May 22, 2018
|
|
|
VLTs
|
|
video lottery terminals
|
|
VSOE
|
|
vendor specific objective evidence
|
|
WAP
|
|
wide area progressive
|
|
Wire Act
|
U.S. Interstate Wire Act of 1961
|
|
|
WLA
|
|
World Lottery Association
|
5
FORWARD-LOOKING STATEMENTS
This annual report on Form 20-F includes forward-looking statements (including within the meaning of the Private Securities Litigation Reform Act of 1995) concerning the Company and other matters. These statements may discuss goals, intentions, and expectations as to future plans, trends, events, dividends, results of operations, or financial condition, or otherwise, based on current beliefs of the management of the Company as well as assumptions made by, and information currently available to, such management. Forward-looking statements may be accompanied by words such as “aim,” “anticipate,” “believe,” “plan,” “could,” “would,” “should,” “shall,” “continue,” “estimate,” “expect,” “forecast,” “future,” “guidance,” “intend,” “may,” “will,” “possible,” “potential,” “predict,” “project” or the negative or other variations of them. These forward-looking statements speak only as of the date on which such statements are made and are subject to various risks and uncertainties, many of which are outside the Company’s control. Should one or more of these risks or uncertainties materialize, or should any of the underlying assumptions prove incorrect, actual results may differ materially from those predicted in the forward-looking statements and from past results, performance, or achievements. Therefore, you should not place undue reliance on such statements. Factors that could cause actual results to differ materially from those in the forward-looking statements include (but are not limited to):
|
•
|
the possibility that the Parent will be unable to pay future dividends to shareholders or that the amount of such dividends may be less than anticipated;
|
|
•
|
the possibility that the Company may not achieve its anticipated financial results in one or more future periods;
|
|
•
|
reductions in customer spending;
|
|
•
|
a slowdown in customer payments and changes in customer demand for products and services as a result of changing
|
economic conditions or otherwise;
|
•
|
unanticipated changes relating to competitive factors in the industries in which the Company operates;
|
|
•
|
the Company’s ability to hire and retain key personnel;
|
|
•
|
the Company’s ability to attract new customers and retain existing customers in the manner anticipated;
|
|
•
|
reliance on and integration of information technology systems;
|
|
•
|
changes in legislation, governmental regulations, or the enforcement thereof that could affect the Company;
|
|
•
|
enforcement of an interpretation of the U.S. Interstate Wire Act of 1961 in such a manner as to prohibit or limit activities in which the Company and its customers are engaged;
|
|
•
|
international, national, or local economic, social, or political conditions that could adversely affect the Company or its
|
customers;
|
•
|
conditions in the credit markets; risks associated with assumptions the Company makes in connection with its critical
|
accounting estimates;
|
•
|
the resolution of pending and potential future legal, regulatory, or tax proceedings and investigations; and
|
|
•
|
the Company’s international operations, which are subject to the risks of currency fluctuations and foreign
|
exchange controls.
The foregoing list of factors is not exhaustive. You should carefully consider the foregoing factors and the other risks and uncertainties that affect the Company’s business, including those described in “Item 3. Key Information—D. Risk Factors” and other documents filed by the Parent from time to time with the SEC. Except as required under applicable law, the Company does not assume any obligation to update these forward-looking statements. Nothing in this annual report is intended, or is to be construed, as a profit forecast or to be interpreted to mean that earnings per share of the Parent for the current or any future financial years will necessarily match or exceed the historical published earnings per share of the Parent, as applicable. All forward-looking statements contained in this annual report on Form 20-F are qualified in their entirety by this cautionary statement.
6
|
Item 1.
|
Identity of Directors, Senior Management and Advisers
|
Not applicable.
|
Item 2.
|
Offer Statistics and Expected Timetable
|
Not applicable.
|
Item 3.
|
Key Information
|
|
A.
|
Selected Financial Data
|
The following tables set forth the Company's summary historical consolidated financial and other information for the periods indicated, which have been derived from the consolidated financial statements of the Company for the years ended
December 31, 2018
,
2017
,
2016
,
2015
and
2014
.
The following information should be read in conjunction with:
|
•
|
“Presentation of Financial and Certain Other Information;”
|
|
•
|
“Item 3.D. Risk Factors;”
|
|
•
|
“Item 5. Operating and Financial Review and Prospects;” and
|
|
•
|
The Consolidated Financial Statements included in “Item 18. Financial Statements.”
|
Consolidated Income Statement Data
|
|
For the years ended December 31,
|
||||||||||||||
|
($ thousands, except per share and dividend amounts)
|
2018
|
2017
|
2016
|
2015
(2)
|
2014
(2)
|
||||||||||
|
Total revenue
(1)
|
4,831,256
|
|
4,938,959
|
|
5,153,896
|
|
4,689,056
|
|
3,812,311
|
|
|||||
|
Operating income (loss)
|
646,991
|
|
(51,092
|
)
|
660,436
|
|
539,956
|
|
715,051
|
|
|||||
|
Income (loss) before provision for income taxes
|
304,048
|
|
(976,925
|
)
|
323,413
|
|
(17,031
|
)
|
340,217
|
|
|||||
|
Net income (loss)
|
114,647
|
|
(947,511
|
)
|
264,207
|
|
(55,927
|
)
|
99,804
|
|
|||||
|
Attributable to:
|
|
|
|
|
|
|
|||||||||
|
IGT PLC
|
(21,350
|
)
|
(1,068,576
|
)
|
211,337
|
|
(75,574
|
)
|
86,162
|
|
|||||
|
Non-controlling interests
|
115,671
|
|
55,400
|
|
45,413
|
|
19,647
|
|
13,642
|
|
|||||
|
Redeemable non-controlling interests
|
20,326
|
|
65,665
|
|
7,457
|
|
—
|
|
—
|
|
|||||
|
Net (loss) income attributable to IGT PLC per common share - basic
|
(0.10
|
)
|
(5.26
|
)
|
1.05
|
|
(0.39
|
)
|
0.50
|
|
|||||
|
Net (loss) income attributable to IGT PLC per common share - diluted
|
(0.10
|
)
|
(5.26
|
)
|
1.05
|
|
(0.39
|
)
|
0.49
|
|
|||||
|
Dividends declared per common share ($)
(3)
|
0.80
|
|
0.80
|
|
0.80
|
|
0.40
|
|
1.97
|
|
|||||
(1) The Company adopted Accounting Standards Update ("ASU") 2014-09,
Revenue from Contracts with Customers (Topic 606)
and all subsequent amendments (collectively "ASC 606") in the first quarter of 2018 using a modified retrospective application approach. Results for reporting periods on or after January 1, 2018 are presented under ASC 606. Prior period amounts were not adjusted and, as such, are not comparable.
(2) On April 7, 2015, GTECH S.p.A. acquired IGT. Prior to April 7, 2015, the historical information presented reflects the results of GTECH S.p.A. only.
(3) Dividends declared in euro in 2014 were translated into U.S. dollars at the exchange rates in effect on the date the dividends were declared.
7
|
|
December 31,
|
||||||||||||||
|
($ thousands, except share amounts)
|
2018
|
2017
|
2016
|
2015
|
2014
(1)
|
||||||||||
|
Cash and cash equivalents
|
250,669
|
|
1,057,418
|
|
294,094
|
|
627,484
|
|
307,422
|
|
|||||
|
Total assets
(2)
|
13,648,502
|
|
15,159,208
|
|
15,060,162
|
|
15,163,295
|
|
8,458,297
|
|
|||||
|
Debt
(3)
|
8,012,089
|
|
8,376,559
|
|
7,863,162
|
|
8,334,173
|
|
2,959,471
|
|
|||||
|
Redeemable non-controlling interests
|
—
|
|
356,917
|
|
223,141
|
|
—
|
|
—
|
|
|||||
|
Total equity
|
2,751,929
|
|
2,354,931
|
|
3,425,665
|
|
3,366,142
|
|
2,947,720
|
|
|||||
|
Attributable to IGT PLC
|
1,807,899
|
|
2,004,995
|
|
3,068,699
|
|
3,017,648
|
|
2,569,837
|
|
|||||
|
Attributable to non-controlling interests
|
944,030
|
|
349,936
|
|
356,966
|
|
348,494
|
|
377,883
|
|
|||||
|
Common stock
|
20,421
|
|
20,344
|
|
20,228
|
|
20,024
|
|
217,171
|
|
|||||
|
Common shares issued
|
204,210,731
|
|
203,446,572
|
|
202,285,166
|
|
200,244,239
|
|
174,976,029
|
|
|||||
(1) On April 7, 2015, GTECH S.p.A. acquired IGT. Prior to April 7, 2015, the historical information presented reflects the results of GTECH S.p.A. only.
(2) The Company adopted ASU No. 2016-18,
Statement of Cash Flows (Topic 230): Restricted Cash
("ASU 2016-18"), in the first quarter of 2018. In connection with the adoption of ASU 2016-18, the Company corrected its consolidated balance sheet at December 31, 2015 and 2014 to include additional amounts of restricted cash and cash equivalents of $48.6 million and $23.0 million, respectively, which had previously been offset against current liabilities of the same amounts.
(3) Debt is composed of long-term debt, including current portion and short-term borrowings.
B.
Capitalization and Indebtedness
Not applicable.
|
C.
|
Reasons for the Offer and Use of Proceeds
|
Not applicable.
|
D.
|
Risk Factors
|
The following risks should be considered in conjunction with “Item 5. Operating and Financial Review and Prospects” and the other risks described in the Safe Harbor Statement set forth in Item 5.G. These risks may affect the Company's operating results and, individually or in the aggregate, could cause its actual results to differ materially from past and anticipated future results. The following discussion of risks may contain forward-looking statements which are intended to be covered by the Safe Harbor Statement. Except as may be required by law, the Company undertakes no obligation to publicly update forward-looking statements, whether as a result of new information, future events, or otherwise. The Company invites you to consult any further related disclosures made by the Parent from time to time in materials filed with or furnished to the SEC.
Risks related to the Company's Business and Industry
The global political and economic climate may impact the Company and its results of operations, business, financial conditions, and prospects
The Company is a global business and it is exposed to risks associated with the performance of the global economy. The volatility of the financial markets shows that there can be no assurance that there will not be a recurrence of global financial and economic crises or similar adverse market conditions.
Additionally, poor economic, political, and health conditions, riots, and unemployment may affect the Company's workforce and supply chain, as well as the general business environment, in specific markets in which the Company operates, including tribal jurisdictions. The Company's business is particularly sensitive to reductions in discretionary consumer spending in the markets in which it operates, which may be affected by general economic or political conditions in these markets.
8
Economic risks of doing business globally include:
|
•
|
Inflation and currency exchange risk;
|
|
•
|
High interest rates, debt default, or unstable capital markets;
|
|
•
|
Additional costs of compliance with the laws of international jurisdictions;
|
|
•
|
Illiquid or restricted foreign exchange markets;
|
|
•
|
Restrictions on foreign direct investment; and
|
|
•
|
Exposure to severe weather, wildfires, and other natural events that could disrupt operations.
|
Political risks include:
|
•
|
Political instability or change of leadership in government;
|
|
•
|
Change of governmental laws, regulations, and policies and the enforcement thereof;
|
|
•
|
New foreign exchange controls regulating the flow of money into or out of a country;
|
|
•
|
Failure of a government to honor existing contracts;
|
|
•
|
Governmental corruption; and
|
|
•
|
Political unrest, war, and acts of terrorism.
|
If new tariffs are imposed by the U.S., China, or other countries that the Company is unable to mitigate, the Company may incur increased costs that it is unable to pass on to customers. Additional tariffs could increase the costs of the Company's products in certain markets, which may reduce customer demand.
Economic contraction, economic uncertainty, and the perception of weak or weakening economic conditions globally or in specific markets in which the Company operates may cause a decline in demand for the products and services that the Company offers. In addition, a decline in the relative health of the lottery or gaming industries and any difficulty or inability of customers to obtain adequate levels of capital to finance their ongoing operations may reduce their resources available to purchase the Company's products and services or make timely payments to the Company, which may adversely affect the Company's revenues or result in the Company incurring additional provisions for bad debts related to credit concerns on certain receivables, including in connection with customer financing provided by the Company. If the Company experiences a significant unexpected decrease in demand for its products or services, the Company could also be required to increase its inventory obsolescence reserves.
The vote by the U.K. to leave the E.U. ("Brexit") has created uncertainty that could impact the Company's operations, business, financial condition, or prospects
The current deadline for the U.K. to formally exit the E.U. is March 29, 2019. If the U.K.'s membership in the E.U. terminates without a formal withdrawal agreement, there could be further political and economic uncertainty in the U.K. and the E.U. that may impact the Company's global operations. Because the Company maintains significant operations in the E.U., Brexit could also impact intercompany transactions and increase certain tax liabilities. The Company’s ability to operate in Italy may be negatively impacted if Brexit does not maintain parity rights for U.K. and E.U. companies and the current Italian regulatory framework is modified as a result of Brexit. The Company continues to monitor Brexit and its potential impacts on the Company’s results of operations, business, financial condition, or prospects.
The Company has a concentrated customer base in certain business segments, and the loss of any of its larger customers (or lower sales from any of these customers) could lead to significantly lower revenue
A substantial portion of the Company’s revenues (equal to approximately
34.9%
of its total consolidated revenues for the year ended
December 31, 2018
) is derived from exclusive and non-exclusive licenses awarded to the Company by
Agenzia delle Dogane e Dei Monopoli
(“ADM”), the governmental authority responsible for regulating and supervising gaming in Italy. In particular, a substantial portion of the Company’s revenues is derived from two exclusive licenses, one for the operation of the Italian Gioco del Lotto game (the “Lotto License”) and one for instant tickets (equal to approximately
9.8%
and
6.6%
, respectively, of its total consolidated revenues for the year ended
December 31, 2018
).
The Company expects that a significant portion of its revenues and profits will continue to depend upon the licenses awarded to the Company by ADM. Licenses may be terminated prior to their expiration dates upon the occurrence of certain events of default affecting the Company, or if such licenses are deemed to be against the public interest, or terminated or annulled if successfully challenged by competitors. In addition, the conditions for any new license will be established by law and included in the rules of the new license. Any material reduction in the Company’s revenues from these licenses, including as a result of an annulment, early termination, or non-renewal of these licenses following their expiration, could have a material adverse effect on the Company’s results of operations, business, financial condition, or prospects.
9
In addition, revenues from the Company’s top 10 customers internationally (outside of Italy) accounted for approximately
17.5%
of its total consolidated revenues for the year ended
December 31, 2018
. If the Company were to lose any of these larger customers, or if these larger customers experience slower lottery ticket sales and consequently reduced lottery revenue, there could be a material adverse effect on the Company’s results of operations, business, financial condition, or prospects.
The Company’s operations are dependent upon its continued ability to retain and extend its existing contracts and win new contracts
The Company derives a substantial portion of its revenues from its portfolio of long-term contracts in the North America Lottery and International segments (equal to approximately
33.3%
of its total consolidated revenues for the year ended
December 31, 2018
), awarded through competitive procurement processes. In addition, the Company’s U.S. lottery contracts typically permit a lottery authority to terminate the contract at any time for material, uncured breaches and for other specified reasons out of the Company's control, such as the failure by a state legislature to approve the required budget appropriations, and many of these contracts in the U.S. permit the lottery authority to terminate the contract at will with limited notice and do not specify the compensation to which the Company would be entitled were such termination to occur.
In the event that the Company is unable or unwilling to perform certain lottery contracts, such contracts permit the lottery authority a right to use the Company's system-related equipment and software necessary for the performance of the contract until the expiration or earlier termination of the contract.
The termination of or failure to renew or extend one or more of the Company’s lottery contracts, or the renewal or extension of one or more of the Company’s lottery contracts on materially altered terms, could have a material adverse effect on the Company’s results of operations, business, financial condition, or prospects.
The Company is subject to substantial penalties for failure to perform
The Company’s Italian licenses, lottery contracts in the U.S. and in other jurisdictions, and other service contracts often require performance bonds or letters of credit to secure its performance under such contracts and require the Company to pay substantial monetary liquidated damages in the event of non-performance by the Company.
At
December 31, 2018
, the Company had outstanding performance bonds and letters of credit in an aggregate amount of approximately
$1.217 billion
. These instruments present a potential for expense for the Company and divert financial resources from other uses. Claims on performance bonds, drawings on letters of credit, and payment of liquidated damages could individually or in the aggregate have a material adverse effect on the Company's results of operations, business, financial condition, or prospects.
The Company’s inability to successfully complete and integrate future acquisitions could limit its future growth or otherwise be disruptive to its ongoing business
From time to time, the Company expects it will pursue acquisitions in support of its strategic goals. There can be no assurance that acquisition opportunities will be available on acceptable terms or at all or that the Company will be able to obtain necessary financing or regulatory approvals to complete potential acquisitions. The Company’s ability to succeed in implementing its strategy will depend to some degree upon the ability of its management to identify, complete and successfully integrate commercially viable acquisitions. Acquisition transactions may disrupt the Company’s ongoing business and distract management from other responsibilities. In connection with any such acquisitions, the Company could face significant challenges in managing and integrating its expanded or combined operations, including acquired assets, operations, and personnel.
Slow growth or declines in the lottery and gaming markets could lead to lower revenues for the Company
The Company’s dependence on large jackpot games and, specifically, the decline in aggregate sales at similar jackpot levels (“jackpot fatigue”) can have a negative impact on revenue from this game category. These developments may in part reflect increased competition for consumers’ discretionary spending, including from a proliferation of destination gaming venues and an increased availability of internet gaming opportunities. The Company’s future success will depend, in part, on the success of the lottery industry and the gaming industry in attracting and retaining new players in the face of such increased competition in the entertainment and gaming markets, as well as the Company's own success in developing innovative services, products and distribution methods/systems to achieve this goal. In addition, there is a risk that new products and services may replace existing products and services. The replacement of old products and services with new products and services may offset the overall growth of sales of the Company. A failure by the Company to achieve these goals could have a material adverse effect on the Company’s results of operations, business, financial condition, or prospects.
The construction of new casinos or expansion of existing casinos fluctuates with demand, general economic conditions and the availability of financing. Slow growth in the establishment of new gaming jurisdictions, delays in the opening of new or expanded
10
casinos and declines in, or low levels of demand for, machine replacements could reduce the demand for the Company’s products. Because a substantial portion of the Company’s sales come from existing customers, its business could be affected if one or more of its customers consolidates with another entity that uses more of the products and services of the Company’s competitors, reduces spending on the Company's products, or causes downward pricing pressures. Such consolidation could lead to order cancellations, a slowing in the rate of gaming machine replacements, or require the Company’s current customers to switch to its competitors’ products, any of which could negatively impact the Company’s results of operations, business, financial condition, or prospects.
Demand for and the level of play of the Company’s products could be adversely affected by changes in social mores
The popularity and acceptance of gaming is influenced by the prevailing social mores, and changes in social mores could result in reduced acceptance of gaming as a leisure activity. The Company’s future financial success will depend on the appeal of its products to its customers and players and the general acceptance of gaming. If the Company is not able to anticipate and react to changes in consumer preferences and social mores, its results of operations, business, financial condition, or prospects may be adversely affected.
If the Company is unable to protect its intellectual property or prevent its unauthorized use by third parties, its ability to compete in the market may be harmed
The Company protects its intellectual property to ensure that its competitors do not use such intellectual property. However, intellectual property laws in the U.S., Italy, and in other jurisdictions may afford differing and limited protection, may not permit the Company to gain or maintain a competitive advantage, and may not prevent its competitors from duplicating its products, designing around its patented products, or gaining access to its proprietary information and technology.
The Company may not be able to prevent the unauthorized disclosure or use of its technical knowledge or trade secrets. For example, there can be no assurance that consultants, vendors, partners, former employees, or current employees will not breach their obligations regarding non-disclosure and restrictions on use. In addition, anyone could seek to challenge, invalidate, circumvent, or render unenforceable any of the Company's patents. The Company cannot provide assurance that any pending or future patent applications it holds will result in an issued patent, or that, if patents are issued, they would necessarily provide meaningful protection against competitors and competitive technologies or adequately protect the Company’s then-current technologies. The Company may not be able to detect the unauthorized use of its intellectual property, prevent breaches of its cybersecurity efforts, or take appropriate steps to enforce its intellectual property rights effectively. In addition, certain contractual provisions, including restrictions on use, copying, transfer, and disclosure of software, may be unenforceable under the laws of certain jurisdictions.
The Company’s success may depend in part on its ability to obtain trademark protection for the names or symbols under which it markets its products and to obtain copyright protection and patent protection of its technologies and game innovations. The Company may not be able to build and maintain goodwill in its trademarks or obtain trademark or patent protection, and there can be no assurance that any trademark, copyright, or issued patent will provide competitive advantages for the Company or that the Company’s intellectual property will not be successfully challenged or circumvented by competitors.
The Company intends to enforce its intellectual property rights, and from time to time may initiate claims against third parties that it believes are infringing its intellectual property rights. Litigation brought to protect and enforce the Company’s intellectual property rights could be costly, time-consuming, and distracting to management, could fail to obtain the results sought, and could have a material adverse effect on the Company’s results of operations, business, financial condition, or prospects.
If the Company is unable to license intellectual property from third parties, its ability to compete in the market may be harmed
The Company licenses intellectual property rights from third parties. If such third parties do not properly maintain or enforce the intellectual property rights underlying such licenses, or if such licenses are terminated or expire without being renewed, the Company could lose the right to use the licensed intellectual property, which could adversely affect its competitive position or its ability to commercialize certain of its technologies, products, or services.
In addition, some of the Company’s most popular games and features are based on trademarks, patents and other intellectual property licensed from third parties. The Company’s future success may depend upon its ability to obtain, retain and/or expand licenses for popular intellectual property rights with reasonable terms in a competitive market. If the Company cannot renew and/or expand existing licenses, it may be required to discontinue or limit its use of the games or gaming machines that use the licensed technology or bear the licensed marks, which could have a material adverse effect on the Company’s results of operations, business, financial condition, or prospects.
11
Third party intellectual property infringement claims against the Company could limit its ability to compete effectively
The Company cannot provide assurance that its products do not infringe the intellectual property rights of third parties. Infringement and other intellectual property claims and proceedings brought against the Company, whether successful or not, are costly, time-consuming and distracting to management, and could harm the Company's reputation. In addition, intellectual property claims and proceedings could require the Company to do one or more of the following: (1) cease selling or using any of its products that allegedly incorporate the infringed intellectual property, (2) pay substantial damages, (3) obtain a license from the third-party owner, which license may not be available on reasonable terms, if at all, (4) rebrand or rename its products, and (5) redesign its products to avoid infringing the intellectual property rights of third parties, which may not be possible and, if possible, could be costly, time-consuming, or result in a less effective product. A successful claim against the Company could have a material adverse effect on its results of operations, business, financial condition, or prospects.
The Company’s business may be adversely affected by competition
The lottery and gaming businesses exist in a highly competitive environment. The Company faces significant competition in the U.S., Italy, and worldwide in a number of ways, including:
|
•
|
A proliferation of destination gaming venues, and an increased availability of gaming opportunities including gaming opportunities on the internet;
|
|
•
|
Aggressive price competition from other lottery and gaming enterprises to gain market share;
|
|
•
|
Legal challenges by the Company's competitors to the awards of contracts to the Company, including challenges to the award of significant contracts;
|
|
•
|
Consolidation among gaming equipment and technology companies which are better able to compete by combining to increase their scale and operating efficiencies;
|
|
•
|
Entry of new competitors into the internet gaming market due to lower costs of entry;
|
|
•
|
Consolidation among casino operators and cutbacks in capital spending by casino operators; and
|
|
•
|
Less overall leisure time and discretionary spending by players increases competition from other forms of entertainment.
|
If any of these risks are realized, the Company’s competitive position and therefore its results of operations, business, financial condition, or prospects may be materially adversely affected.
The Company’s success depends in large part on its ability to develop and manage frequent introductions of innovative products and the ability to respond to technological changes
The gaming industry is characterized by dynamic customer demand and technological advances, both for land-based and digital gaming products. As a result, the Company must continually introduce and successfully market new games and technologies to remain competitive and effectively stimulate customer demand. The process of developing new products is inherently complex and uncertain. It requires accurate anticipation of changing customer needs and end-user preferences as well as emerging technological trends. If the Company's competitors develop new game content and technologically innovative products and the Company fails to keep pace, its business could be adversely affected. To remain competitive, the Company invests resources toward its research and development efforts to introduce new and innovative games and technology with dynamic features to attract new customers and retain existing customers. If the Company fails to accurately anticipate customer needs and end-user preferences through the development of new products and technologies, the Company could lose business to its competitors, which would adversely affect its results of operations, business, financial condition, or prospects.
The Company intends to continue investing resources in research and development. There is no assurance that its investments in research and development will guarantee successful products. The Company invests heavily in product development in various disciplines: platform hardware, platform software, digital services, content (game) design and casino software systems. Because the Company’s newer products are generally more technologically sophisticated than those it has produced in the past, the Company must continually refine its design, development, and delivery capabilities across all channels to ensure product innovation. If the Company cannot efficiently adapt its processes and infrastructure to meet the needs of its product innovations, its results of operations, business, financial condition, or prospects could be negatively impacted.
The Company’s customers will purchase new products only if such products are likely to increase profits more than the Company's competitors’ products. The amount of profits primarily depends on consumer play levels, which are influenced by player demand for the Company’s products. There is no certainty that the Company’s new products will attain this market acceptance or that the Company’s competitors will not anticipate or respond to changing customer preferences more effectively than the Company. In addition, any delays by the Company in introducing new products could negatively impact its operating results by providing an opportunity for its competitors to introduce new products and gain market share.
12
The illegal gaming market could negatively affect the Company’s business
A significant threat to the gaming industry arises from illegal activities. Such illegal activities may drain significant betting volumes away from the regulated industry. In particular, illegal gaming could take away a portion of the present players that are the focus of the Company’s business. The loss of such players could have a material adverse effect on the Company's results of operations, business, financial condition, or prospects.
The Company faces risks related to the use of social media
From time to time, the Company uses social media platforms as marketing tools. These platforms allow individuals access to a broad audience of consumers and other interested persons. Negative commentary regarding the Company or the products it sells may be posted on social media platforms and similar devices at any time and may be adverse to the Company’s reputation or business. As laws and regulations rapidly evolve to govern the use of these platforms and mobile devices, the failure by the Company, its employees or third parties acting at the Company's direction to abide by applicable laws and regulations in the use of these platforms and devices could adversely impact the Company’s business, financial condition, and results of operations or subject it to fines or other penalties.
Legal and Compliance Risks
Changing enforcement of the U.S. Interstate Wire Act of 1961 (the "Wire Act") may negatively impact the Company's operations, business, financial condition, or prospects
On January 14, 2019, the U.S. Department of Justice, (the “DOJ”) published an opinion reversing its previously-issued opinion that the Wire Act was applicable only to sports betting (the “2019 Opinion”). The 2019 Opinion interprets the Wire Act as applying to other forms of gambling that cross state lines, though the precise scope of the 2019 Opinion is unclear, and the DOJ has not yet addressed how it plans to enforce the Wire Act in light of the 2019 Opinion. The DOJ has issued a memorandum stating that it will not enforce the 2019 Opinion prior to June 14, 2019. Further, the New Hampshire Lottery Commission and certain private parties have commenced litigation in federal district court in New Hampshire challenging the 2019 Opinion, and it is unclear how the court will rule. The Company’s management is evaluating the Opinion and its implications to the Company, its customers, and the industries in which the Company operates. The Company's management is also reviewing the pending litigation and considering all of its options for addressing the impacts, if any, of the 2019 Opinion. If the Wire Act is broadly interpreted to prohibit activities in which the Company and its customers are engaged, the Company could be subject to investigations, criminal and civil penalties, sanctions and/or other remedial measures and/or the Company may be required to substantially change the way it conducts its business, any of which could have a material adverse effect on the Company’s results of operations, business, financial condition, or prospects.
The Company faces risks related to the extensive and complex governmental regulation applicable to its operations
The Company’s activities are subject to extensive and complex governmental regulation, including restrictions on advertising, increases in or differing interpretations by authorities on taxation, limitations on the use of cash, and anti-money laundering compliance procedures. In particular, the Italian government has recently banned gaming advertising and significantly raised gaming taxes. Any changes in the legal or regulatory framework or other changes, such as increases in the taxation of sports betting or gaming, changes in the compensation paid to licensees, or increases in the number of licenses, authorizations, or licenses awarded to the Company's competitors, could materially affect its profitability.
In addition, in the U.S. and in many international jurisdictions where the Company currently operates or seeks to do business, lotteries, sports betting, and gaming are not permitted unless expressly authorized by law. The successful implementation of the Company’s growth strategy and its business could be materially adversely affected if jurisdictions that do not currently authorize lotteries, sports betting, or gaming do not approve such activities or if those jurisdictions that currently authorize lotteries, sports betting, or gaming do not continue to permit such activities.
Investigations by governmental and licensing entities can result in adverse findings or negative publicity
From time to time, the Company is subject to extensive background investigations, and other investigations of various types are conducted by governmental and licensing authorities with respect to applicable regulations. These regulations and investigations vary from time to time and from jurisdiction to jurisdiction where the Company operates. Because the Company’s reputation for integrity is an important factor in its business dealings with lottery and other governmental agencies, a governmental allegation or a finding of improper conduct by or attributable to the Company in any manner, the prolonged investigation of these matters by governmental or regulatory authorities, and/or the adverse publicity resulting therefrom could have a material adverse effect
13
on the Company’s results of operations, business, financial condition, or prospects, including its ability to retain existing contracts or to obtain new or renewed contracts, both in the subject jurisdiction and elsewhere.
Failure to comply with the E.U. General Data Protection Regulation (the "GDPR") could result in significant penalties
The GDPR came into effect on May 25, 2018, expanding the rules on using personal data and increasing the risks of processing personal data compared to prior legislation and introducing new obligations on data controllers and rights for data subjects, including, among others:
|
•
|
accountability and transparency requirements, which will require data controllers to demonstrate and record compliance with the GDPR and to provide more detailed information to data subjects regarding processing;
|
|
•
|
enhanced data consent requirements, which includes "explicit" consent in relation to the processing of sensitive data;
|
|
•
|
obligations to consider data privacy as any new products or services are developed and limit the amount of information collected, processed, and stored as well as its accessibility;
|
|
•
|
constraints on using data to profile data subjects;
|
|
•
|
providing data subjects with personal data in a usable format on request and erasing personal data in certain circumstances; and
|
|
•
|
reporting of breaches without undue delay (72 hours where feasible).
|
Several of the Parent’s subsidiaries, particularly those within the Italy business segment, deal with a significant amount of employee and customer personal data. There is a risk that the Company's policies and procedures for compliance with the GDPR will not be implemented correctly or that individuals within the Company will not be fully compliant with the new procedures. Failure to comply with the GDPR may have serious financial consequences to the Company, including fines for data breaches of up to the maximum of either €20 million or 4% of worldwide annual revenue, and the Company could face significant administrative sanctions and reputational damage that could have a material adverse effect on the Company’s results of operations, business, financial condition, or prospects.
Negative perceptions and publicity surrounding the gaming industry could lead to increased gaming regulation
From time to time, the gaming industry is exposed to negative publicity related to gaming behavior, gaming by minors, the presence of gaming machines in too many locations, risks related to digital gaming and alleged association with money laundering. Publicity regarding problem gaming and other concerns with the gaming industry, even if not directly connected to the Company, could adversely impact its business, results of operations, and financial condition. For example, if the perception develops that the gaming industry is failing to address such concerns adequately, the resulting political pressure may result in the industry becoming subject to increased regulation and restrictions on operations. Such an increase in regulation could adversely impact the Company's results of operations, business, financial condition, or prospects.
The Company is exposed to significant risks in relation to compliance with anti-corruption laws and regulations and economic sanction programs
Doing business on a worldwide basis requires the Company to comply with the laws and regulations of various jurisdictions. In particular, the Company's operations are subject to anti-corruption laws and regulations, such as the U.S. Foreign Corrupt Practices Act of 1977, the U.K. Bribery Act of 2010 and other anti-corruption laws that apply in countries where the Company operates. Other laws and regulations applicable to the Company control trade by imposing economic sanctions on countries and persons and creating customs requirements and currency exchange regulations. The Company's continued global expansion, including in countries which lack a developed legal system or have high levels of corruption, increases the risk of actual or alleged violations of such laws.
The Company cannot predict the nature, scope or effect of future regulatory requirements to which its operations might be subject or the manner in which such laws might be administered or interpreted.
There can be no assurance that the policies and procedures the Company has implemented have been or will be followed at all times or will effectively detect and prevent violations of these laws by one or more of the Company's directors, officers, employees, consultants, agents, joint-venture partners or other third-party partners. As a result, the Company could be subject to investigations, criminal and civil penalties, sanctions and/or other remedial measures that in turn could have a material adverse effect on its business, results of operations and financial condition.
14
Recent and future changes to U.S. and foreign tax laws could adversely affect the Company
The Company is subject to tax laws in the U.S. and several foreign tax jurisdictions and significant judgment is required in determining the Company’s global provision for income taxes. While the Company believes its tax positions are consistent with the tax laws in the jurisdictions in which it conducts business, it is possible that these positions may be overturned by tax authorities, which may have a significant impact on the Company’s global provision for income taxes.
Changes in tax laws or regulations may be proposed or enacted that could significantly affect the Company’s overall tax expense. For example, on December 22, 2017, the U.S. government enacted comprehensive tax legislation through the Tax Act, which significantly changed the U.S. corporate income tax system and has a meaningful impact on the Company’s provision for income taxes. The Tax Act made broad changes to the U.S. federal income tax code, including reducing the federal corporate income tax rate from 35% to 21% imposing limitations on the Company’s ability to deduct interest expense for tax purposes, creating a new minimum tax on global intangible low-taxed income, and creating a base erosion and anti-abuse tax, among many other complex provisions.
The Tax Act requires complex calculations to be performed that were not previously required, significant judgments, estimates and calculations to be made in interpreting its provisions, and the preparation and analysis of information not previously relevant or regularly produced. In addition, the U.S. Department of Treasury has issued and will continue to issue regulations and interpretive guidance that may significantly impact how the Company will apply the tax law and impact the Company’s results of operations. As additional regulatory and interpretive guidance is issued, the Company may refine its analysis and make adjustments that differ from amounts initially recorded, which could materially affect its tax obligations and effective tax rate. Various uncertainties also exist in terms of how U.S. states and any foreign countries within which the Company operates will react to U.S. federal income tax reform.
In addition, tax authorities are increasingly scrutinizing the tax positions of companies. Many countries in the E.U., as well as a number of other countries and organizations such as the Organization for Economic Cooperation and Development, are actively considering changes to existing tax laws that, if enacted, could increase the Company’s tax obligations in countries where it does business. If U.S. or other foreign tax authorities change applicable tax laws, the Company’s overall taxes could increase, and its results of operations, business, financial condition, or prospects may be adversely affected.
The ongoing effects of the Tax Act and the refinement of provisional estimates could make the Company's results difficult to predict
The Company's effective tax rate may fluctuate in the future as a result of the Tax Act. The Tax Act introduces significant changes to U.S. income tax law that will have a meaningful impact on the Company's provision for income taxes. Accounting for the income tax effects of the Tax Act requires significant judgments and estimates in the interpretation and calculations of the provisions of the Tax Act. Due to the timing of the enactment and the complexity involved in applying the provisions of the Tax Act, the Company made reasonable estimates of the effects and recorded provisional amounts in its financial statements for the year ended December 31, 2017. The Company has completed its accounting for the Tax Act as described in Staff Accounting Bulletin ("SAB") No. 118,
Income Tax Accounting Implications of the Tax Cuts and Jobs Act
("SAB 118"). In 2019, the Company will continue to review and incorporate, as necessary, updates related to forthcoming U.S. Treasury Regulations, other interpretive guidance, and the finalization of the deemed inclusions to be reported on the Company's 2018 U.S. federal income tax return.
The Company may be subject to an unfavorable outcome with respect to pending regulatory, tax, or other legal proceedings, which could result in substantial monetary damages or other harm to the Company
The Company is involved in a number of legal, regulatory, tax, and arbitration proceedings including claims by and against it as well as injunctions by third parties arising out of the ordinary course of its business and is subject to investigations and compliance inquiries related to its ongoing operations. At
December 31, 2018
, the Company's total provision for litigation risks was
$12.0 million
. However, it is difficult to estimate accurately the outcome of any proceeding. As such, the amounts of the Company’s provision for litigation risks could vary significantly from the amounts the Company may be asked to pay or ultimately pay in any such proceeding. In addition, unfavorable resolution of or significant delay in adjudicating such proceedings could require the Company to pay substantial monetary damages or penalties and/or incur costs that may exceed any provision for litigation risks or, under certain circumstances, cause the termination or revocation of the relevant license or authorization and thereby have a material adverse effect on the Company’s results of operations, business, financial condition, or prospects.
In 2012, the Parent's predecessor entity, GTECH S.p.A. ("GTECH"), was audited by the Rome Public Prosecutors’ Office tax agency regarding the structuring of the acquisition of GTECH Holdings Corporation in 2006 and subsequent acquisition debt refinancing to determine whether GTECH’s income was under-reported in Italy for any tax year from 2006 to 2013. GTECH
15
settled the matter in December 2013. Under Italian law, GTECH's legal representative and signatories of the relevant corporate tax returns are subject to investigation. The relevant tax returns were signed by the Company's CEO and Board member, Marco Sala; senior executive, Renato Ascoli; and Chairperson of the Board, Lorenzo Pellicioli. While all the tax assessments and penalty and interest claims emanating from the tax audit have been resolved, under Italian law, the related criminal investigations of Marco Sala, Renato Ascoli, and Lorenzo Pellicioli can only be dismissed by a judge upon a formal petition to the Court. The Request for Dismissal was submitted by the Public Prosecutor to the Criminal Court of Rome in March 2017; the Court’s Order of Dismissal granting such request is still pending.
Operational Risks
Failure to attract, retain and motivate personnel may adversely affect the Company's ability to compete
The Company's ability to attract and retain key management, product development, finance, marketing, and research and development personnel is directly linked to the Company's continued success. Particularly in the lottery and gaming industries, the market for qualified executives and highly-skilled technical workers is intensely competitive, and the loss of key employees or an inability to hire a sufficient number of technical staff could limit the Company's ability to develop successful products and could cause delays in getting new products to market.
The Company’s business prospects and future success rely heavily upon the integrity of its employees, directors and agents and the security of its systems
The real and perceived integrity and security of the Company's products are critical to its ability to attract customers and players. The Company strives to set exacting standards of personal integrity for its employees and directors, as well as system security for the systems that it provides to its customers, and its reputation in this regard is an important factor in its business dealings with lottery, gaming, and other governmental agencies. For this reason, an allegation or a finding of improper conduct on the Company’s part, or on the part of one or more of its current or former employees, directors or agents that is attributable to the Company, or an actual or alleged system security defect or failure attributable to the Company, could have a material adverse effect upon the Company’s results of operations, business, financial condition, or prospects, including its ability to retain or renew existing contracts or obtain new contracts.
The Company faces supply chain risks that, if not properly managed, could adversely affect its financial results
The Company purchases most of the parts, components, and subassemblies necessary for its lottery terminals and electronic gaming machines from outside sources. The Company outsources all the manufacturing and assembly of certain lottery terminals to a single vendor and portions of other products to multiple vendors. The Company’s operating results could be adversely affected if one or more of its manufacturing outsourcing vendors fails to meet production schedules. The Company’s management believes that if a supply contract with one of these vendors were to be terminated or breached, it may take time to replace such vendor under some circumstances and any replacement parts, components, or subassemblies may be more expensive, which could reduce the Company’s margins. Depending on a number of factors, including the Company’s available inventory of replacement parts, components or subassemblies, the time it takes to replace a vendor may result in a delay for a customer. Generally, if the Company fails to meet its delivery schedules under its contracts, it may be subject to substantial penalties or liquidated damages, or contract termination, which in turn could adversely affect the Company's results of operations, business, financial condition, or prospects.
The Company and its operations are subject to cyber-attacks and cyber-security risks which may have an adverse effect on its business and results of operations and result in increasing costs to minimize these risks
The Company's business involves the storage and transmission of confidential business and personal information, and theft and security breaches may expose the Company to a risk of loss of, or improper use and disclosure of, such information, which may result in significant litigation expenses and liability exposure. The Company has experienced and continues to experience cyber-attacks of varying degrees and phishing attacks on a regular basis. To date, the Company has not suffered any material losses as a result of such attacks. The Company's internal policies and procedures may not be able to prevent or detect every cyber-attack or reduce all negative effects they may cause. In addition, the Company's insurance policies may not be sufficient to mitigate all potential negative effects of a cyber-attack.
Any systems failure or compromise of the Company's security that results in the release of confidential business or personal information could seriously harm the Company's reputation and have a material adverse effect on the Company’s results of operations, business, financial condition, or prospects.
The Company's security measures may also be breached due to employee error, malfeasance, system errors or vulnerabilities, including vulnerabilities of the Company's subcontractors, vendors, suppliers, or otherwise. Such breach could result in significant reputational, legal, and financial liability, and may potentially have a material adverse effect upon the Company’s business, results
16
of operations and financial condition. Because the techniques used to obtain unauthorized access, disable or degrade service, or sabotage systems change frequently, become more sophisticated, and often are not recognized until launched against a target, the Company may be unable to anticipate these techniques or to implement adequate preventative measures. Additionally, cyber-attacks could also compromise trade secrets and other sensitive information and result in such information being disclosed to others and becoming less valuable, which could have a material adverse effect upon the Company’s results of operations, business, financial condition, or prospects.
Failures in technology may disrupt the Company’s business and have an adverse effect on its results of operations
The Company’s success depends on its ability to avoid, detect, replicate, and correct software and hardware defects and fraudulent manipulation of its products. The Company incorporates security features into the design of its products which are designed to prevent its customers and players from being defrauded. The Company also monitors its software and hardware to avoid, detect and correct any technical errors. However, there can be no guarantee that the Company’s security features or technical efforts will continue to be effective in the future.
In addition, any disruption in the Company’s network or telecommunications services, or those of third parties that the Company uses in its operations, could affect the Company’s ability to operate its systems, which could result in reduced revenues and customer downtime. The Company’s network and databases of business and customer information, including intellectual property and other proprietary business information and those of third parties the Company uses, are susceptible to outages due to fire, floods, power loss, break-ins, cyber-attacks, network penetration, data privacy or security breaches, denial of service attacks, and similar events, including inadvertent dissemination of information due to increased use of social media. Disruptions with such systems could result in a wide range of negative outcomes, including devaluation of the Company’s intellectual property, increased expenditures on data security, and costly litigation and potential payment of liquidated damages, each of which could have a material adverse effect on the Company’s results of operations, business, financial condition, or prospects.
Financial Risks
Covenants in the Company’s debt agreements may limit its ability to operate its business, and the Company’s breach of such covenants could materially and adversely affect its results of operations, business, financial condition, or prospects
Certain of the Company’s debt agreements require it to comply with covenants that may limit the Company’s ability to:
|
•
|
pay dividends and repurchase shares;
|
|
•
|
acquire assets of other companies or acquire, merge or consolidate with other companies;
|
|
•
|
dispose of assets;
|
|
•
|
incur indebtedness; and
|
|
•
|
grant security interests in its assets.
|
The Company’s ability to comply with these covenants may be affected by events beyond its control, such as prevailing economic, financial, regulatory and industry conditions. These covenants may limit its ability to react to market conditions or take advantage of potential business opportunities. Further, a breach of such covenants could, if not cured or waived, result in acceleration of its indebtedness, result in the enforcement of security interests or force the Company into bankruptcy or liquidation. Such a breach or any failure to otherwise timely repay outstanding indebtedness could have a material adverse effect on the Company’s results of operations, business, financial condition, or prospects.
The Company may have to recognize impairment charges regarding the amount of goodwill and other intangible assets recognized on its consolidated balance sheets
From time to time, the Company purchases all or a part of the equity interests in or assets of other companies. The Company accounts for certain of those and similar purchases and acquisitions as a business combination by allocating the acquisition costs to the assets acquired and liabilities assumed and recognizing the remaining amount as goodwill. The Company may have to recognize impairment charges, as well as other losses associated with subsequent transactions, regarding the amount of goodwill and other intangible assets and, if recognized, such charges may negatively affect the Company’s business, financial condition, and results of operations. In the fourth quarter of 2018, the Company performed its annual goodwill impairment test that resulted in a $118.0 million non-cash goodwill impairment loss that had no impact on the Company's cash flows, ability to service debt, compliance with financial covenants, or underlying liquidity. See “Item 5.A Operating Results—Critical Accounting Estimates—Goodwill, Intangible Assets and Long-lived Assets” for additional information.
17
Risks related to the Loyalty Voting Structure
The Parent's controlling shareholder and loyalty voting structure may limit other shareholders' ability to influence corporate decisions
At February 28, 2019, De Agostini S.p.A. (“De Agostini”) had an economic interest of approximately 50.64% and, due to its election to exercise the special voting shares associated with its ordinary shares pursuant to the loyalty plan, a voting interest in the Parent of approximately 67.23% of the total voting rights. See “Item 7. Major Shareholders and Related Party Transactions” for additional information. This shareholder may make decisions with which other shareholders may disagree, including, among other things, delaying, discouraging, or preventing a change of control of the Company or a potential merger, consolidation, tender offer, takeover, or other business combination and may also prevent or discourage shareholders’ initiatives aimed at changes in the Parent’s management.
The tax consequences of the loyalty voting structure are uncertain
No statutory, judicial, or administrative authority has provided public guidance in respect of the special voting shares of the Parent and as a result, the tax consequences of owning such shares are uncertain. The fair market value of the Parent's special voting shares, which may be relevant to the tax consequences of owning, acquiring, or disposing of such shares, is a factual determination and is not governed by any guidance that directly addresses such a situation. Because, among other things, (i) the special voting shares are not transferable (other than in very limited circumstances as provided for in the loyalty voting structure), (ii) on a winding up or otherwise, the holders of the special voting shares will only be entitled to receive out of the Parent's assets available for distribution to its shareholders, in aggregate, $1, and (iii) loss of the entitlement to instruct the nominee on how to vote in respect of special voting shares will occur without consideration, the Parent believes and intends to take the position that the value of each special voting share is minimal. However, the relevant tax authorities could assert that the value of the special voting shares as determined by the Parent is incorrect. Shareholders are urged to consult their own tax advisors with respect to treatment of special voting shares. See “Item 10.E Taxation” for additional information.
The loyalty voting structure may affect the liquidity of the Parent's ordinary shares and reduce their ordinary share price
The loyalty voting structure may limit the liquidity and adversely affect the trading prices of the Parent's ordinary shares. The loyalty voting structure is intended to reward shareholders for maintaining long-term share ownership by granting persons holding ordinary shares continuously for at least three years the option to elect to receive special voting shares. The special voting shares cannot be traded and, immediately prior to the deregistration of ordinary shares from the register of loyalty shares, any corresponding special voting shares shall cease to confer any voting rights in connection with such special voting shares. This loyalty voting structure is designed to encourage a stable shareholder base, but it may deter trading by those shareholders who are interested in gaining or retaining the special voting shares. Therefore, the loyalty voting structure may reduce liquidity in the Parent's ordinary shares and adversely affect their trading price.
18
|
Item 4.
|
Information on the Company
|
|
A.
|
History and Development of the Company
|
The Parent is organized as a public limited company under the laws of England and Wales. The Parent’s principal office is located at 66 Seymour Street, 2nd Floor, London W1H 5BT, United Kingdom, telephone number +44 (0) 207 535 3200. The Parent’s agent for service in the United States is The Corporation Trust Company of Nevada, 701 S. Carson Street - Suite 200, Carson City, Nevada 89701 (telephone number: +1 518 433 4740). The Company operates under the Companies Act 2006, as amended ("CA 2006").
The Parent was formed as a business combination shell company on July 11, 2014 under the name “Georgia Worldwide Limited.” On September 16, 2014, it changed its name to “Georgia Worldwide PLC,” and on February 26, 2015, it changed its name to “International Game Technology PLC.”
The Company is a product of the acquisition of International Game Technology by GTECH S.p.A., which was completed on April 7, 2015, through mergers of the prior businesses into the Parent and a subsidiary of the Parent. Prior to the mergers, the Parent did not conduct any material activities other than those incident to its formation, the making of certain required securities law filings, and the preparation of the proxy statement/prospectus filed in connection with the acquisition and mergers. For more information on the mergers, please see Item 4.A of the Parent's annual report on Form 20-F for 2015, filed with the SEC on April 29, 2016.
Dividend Payments
The Parent paid cash dividends on its ordinary shares during 2018 as follows:
|
Declaration Date
|
Payment Date
|
Per Share Amount ($)
|
Aggregate
Payment
|
|||||
|
October 31, 2018
|
November 28, 2018
|
0.20
|
|
$40,842,146.20
|
||||
|
July 31, 2018
|
August 28, 2018
|
0.20
|
|
$40,840,804.00
|
||||
|
May 21, 2018
|
June 19, 2018
|
0.20
|
|
$40,840,202.00
|
||||
|
March 8, 2018
|
April 5, 2018
|
0.20
|
|
$40,713,190.60
|
||||
|
|
|
|
|
$163,236,342.80
|
||||
There have not been any public takeover offers by third parties in respect of the Parent’s shares or by the Parent in respect of other companies’ shares which have occurred during the last three financial years.
Capital Expenditures and Divestitures
For a description, including the amount invested, of the Company’s principal capital expenditures (including interests in other companies) for the years ended December 31, 2018, 2017, and 2016, see “Item 5.B Liquidity and Capital Resources—Capital Expenditures.”
For a description of the Company’s principal divestitures for the years ended December 31, 2018, 2017, and 2016, see “Item 5.A Operating Results.”
To date, the Company has not made any capital expenditures or divestitures in calendar year 2019 that were not in the ordinary course of business.
More Information
The SEC maintains an internet site that contains reports, proxy, and information statements, and other information regarding issuers that file electronically with the SEC at http://www.sec.gov. The Company's SEC filings can be found there and on the Company's website: www.igt.com.
19
B. Business Overview
The Company operates and provides an integrated portfolio of innovative gaming technology products and services, including: lottery management services, online and instant lottery systems, instant ticket printing, electronic gaming machines, sports betting, digital gaming, and commercial services. The Company is headquartered in London, with principal operating facilities located in Providence, Rhode Island; Las Vegas, Nevada; and Rome, Italy. The Company is organized into four business segments, which are supported by corporate shared services: North America Gaming and Interactive ("NAGI"), North America Lottery ("NALO"), International, and Italy. Research and development and manufacturing are mostly centralized in North America. The Company had over 12,000 employees at December 31, 2018.
The Company is committed to responsible gaming, giving back to its communities, and doing its part to protect the environment, and is recognized in the following ways:
|
•
|
the Company’s lottery operations have been certified for compliance with the WLA Associate Member CSR Standards and Certification Framework;
|
|
•
|
the Company has received responsible gaming accreditation for its land-based casino and lottery segments from the Global Gambling Guidance Group;
|
|
•
|
the Company’s B2C website interactive.IGTGames.com
is certified through the Internet Compliance Assessment Program (iCAP), developed by the National Council on Problem Gambling; and
|
|
•
|
the Company has received an "A" environmental, social and governance ("ESG") rating from MSCI, Inc. and a "prime" designation in corporate responsibility from ISS-oekom.
|
Products and Services
The Company has five broad categories of products and services: (1) Lottery, (2) Machine Gaming, (3) Sports Betting, (4) Digital, and (5) Commercial Services.
1. Lottery
The Company supplies a unique set of lottery solutions to more than 100 customers
worldwide, including to 37 of the 45 U.S. lotteries through its NALO segment. Lottery customers frequently designate their revenues for particular purposes, such as education, economic development, conservation, transportation, programs for senior citizens and veterans, health care, sports facilities, capital construction projects, cultural activities, tax relief, and others. Many governments have become increasingly dependent on their lotteries as revenues from lottery ticket sales are often a significant source of funding for these programs. Lottery products and services are provided through the NALO, International, and Italy business segments.
Lottery services are provided through licenses, facilities management contracts, lottery management agreements, and product sales contracts. In the majority of jurisdictions, lottery authorities award contracts through a competitive bidding process. Typical service contracts are five to 10 years in duration, often with multi-year extension options. After the expiration of the initial or extended contract term, a lottery authority generally may either seek to negotiate further extensions or commence a new competitive bidding process. Lottery authorites often require providers to pay an upfront fee for the right to manage their lotteries.
The Company designs, sells, and operates a complete suite of point-of-sale machines that are electronically linked with a centralized transaction processing system that reconciles lottery funds between the retailer and the lottery authority. The Company provides and operates highly secure, online lottery transaction processing systems that are capable of processing over 500,000 transactions per minute. The Company provides more than 450,000 point-of-sale devices to lottery customers and lotteries that it supports worldwide. The Company also produces high-quality instant ticket games and provides printing services such as instant ticket marketing plans and graphic design, programming, packaging, shipping, and delivery services.
The Company has developed and continues to develop new lottery games, licenses new game brands from third parties, and installs a range of new lottery distribution devices, all of which are designed to drive responsible same-store sales growth for its customers. In connection with its delivery of lottery services, the Company actively advises its customers on growth strategies. Depending on the type of contract and the jurisdiction, the Company also provides marketing services, including retail optimization and lottery brand awareness campaigns. The Company works closely with its lottery customers and retailers to help retailers sell lottery games more effectively. These programs include product merchandising and display recommendations, a selection of appropriate lottery product mix for each location, and account reviews to plan lottery sales growth strategies. The Company leverages years of experience accumulated from being the exclusive licensee for the Italian Lotto, one of the world’s largest lotteries. This B2C expertise in Italy, which includes management of all the activities along the lottery value chain, allows the Company to better serve B2B customers in its NALO and International segments. The Company's primary competitors in the Lottery business include Camelot, Intralot,
20
Pollard, SAZKA, Sisal, Scientific Games, and Tattersalls.
The primary types of lottery agreements are outlined below:
Licenses and Facilities Management Contracts (
“
FMCs
”
)
The majority of the Company's revenue in the Lottery business comes from licenses, a form of operating contracts, and FMCs. Since 1998, the Company has been the exclusive licensee for the Italian Lotto game (management of operations commenced in 1994). Beginning in November of 2016, the Company's exclusive license for the Italian Lotto includes partners as part of a joint venture. Lottoitalia s.r.l., ("Lottoitalia") the exclusive manager of the Italian Lotto game, is 61.5% owned by the Parent's subsidiary Lottomatica and the remainder is owned by Italian Gaming Holding a.s. (a subsidiary of Czech lottery operator SAZKA), Arianna 2001, and Novomatic Italia. The Company, through Lottoitalia, manages the activities along the lottery value chain, such as creating games, determining payouts, collecting wagers through its network, paying out prizes, managing all accounting and other back-office functions, running advertising and promotions, operating data transmission networks and processing centers, training staff, providing retailers with assistance, and supplying materials including play slips, tickets and receipts, and marketing and point-of-sale materials for the game. Since 2004, and renewed through 2028, the Company also has been the exclusive licensee for the instant ticket lottery (“Gratta e Vinci”) through Lotterie Nazionali S.r.l., a joint venture 64.0% owned by the Parent's subsidiary Lottomatica Holding, with the remainder directly and indirectly owned by Scientific Games Corporation and Arianna 2001.
The Company’s FMCs typically require the Company to design, install, and operate the lottery system and retail terminal network for an initial term, which is typically five to 10 years. The Company’s FMCs usually contain extension options under the same or similar terms and conditions, generally ranging from one to five years. Under a typical FMC, the Company maintains ownership of the technology and facilities, and is responsible for capital investments throughout the duration of the contract, although the investments are generally concentrated during the early years. Under a number of the Company’s FMCs, the Company additionally provides a wide range of support services and equipment for the lottery’s instant ticket games, such as marketing, distribution and automation of validation, inventory and accounting systems. In return, the Company receives either fixed fees or fees based upon a percentage of the sales of the instant ticket games. In limited instances, the Company provides instant tickets and online lottery systems and services under the same facilities management contract. Also, the Company offers lottery vending machines that sell instant tickets as well as draw-based games. As of February 28, 2019, the Company had FMCs with 23 U.S. states. As of December 31, 2018, the Company's largest FMCs in the U.S., by annual revenue, were California, Michigan, New York, and Texas, and the revenue weighted average remaining term of the Company's existing U.S. FMCs was 7.1 years (8.2 years including available extensions). Also as at December 31, 2018, the Company operated under licenses or FMCs in 17 international jurisdictions, excluding Italy.
Licenses and FMCs often require the Company to pay substantial monetary liquidated damages in the event of non-performance by the Company. The Company's revenues from licenses and FMCs are generally service fees paid to the Company directly from the lottery authority based on a percentage of such lottery’s wagers or ticket sales. The Company categorizes revenue from licenses and FMCs as service revenue from "Operating and Facilities Management Contracts" as described in "Notes to the Consolidated Financial Statements—
3
. Revenue Recognition" included in "Item 18. Financial Statements".
Lottery Management Agreements (
“
LMAs
”
)
A portion of the Company’s revenues are derived from LMAs. Under an LMA, the Company manages, within parameters determined by the lottery authority customer, the core lottery functions, including the lottery systems and the majority of the day-to-day activities along the lottery value chain. This includes collecting wagers, managing accounting and other back-office functions, running advertising and promotions, operating data transmission networks and processing centers, training staff, providing retailers with assistance, and supplying materials for the games. Most LMAs also include a separate supply agreement, pursuant to which the Company provides certain hardware, equipment, software, and support services. The Company provides lottery management services in New Jersey as part of a joint venture and in Indiana indirectly through a wholly-owned subsidiary of the Parent. The Company's revenues from LMAs are based on achievement of contractual metrics and for the supply contract are generally on a percentage of wagers. The Company categorizes revenue from LMAs as service revenue from "Lottery Management Agreements" as described in "Notes to the Consolidated Financial Statements—
3
. Revenue Recognition" included in "Item 18. Financial Statements".
Instant Ticket Printing Contracts
As an end-to-end provider of instant tickets and related services, the Company produces high-quality instant ticket games and provides ancillary printing services such as instant ticket marketing plans and graphic design, programming, packaging, shipping, and delivery services. Instant tickets are sold at numerous types of retail outlets but most successfully in grocery and convenience stores.
21
Instant ticket contracts are priced based on a percentage of ticket sales revenues or on a price per unit basis and generally range from two to five years with extension opportunities. Government-sponsored lotteries grant printing contracts on both an exclusive and non-exclusive basis where there is typically one primary vendor and one or more secondary vendors. A primary contract permits the vendor to supply the majority of the lottery’s ticket printing needs and includes the complete production process from concept development through production and shipment. It also typically includes marketing and research support. A primary printing contract can include any or all of the following services: warehousing, distribution, telemarketing, and sales/field support. A secondary printing contract includes providing backup printing services and alternate product sources. It may or may not include a guarantee of a minimum or maximum number of games. The Company invested in a new state-of-the-art printing press, which began production in February 2018. As of February 28, 2019, the Company had instant ticket printing contracts with 27 U.S. states and provided instant ticket products and services to 25 customers in international jurisdictions. This data excludes Italy, New Jersey, and Indiana for whom the Company provides instant tickets as part of a license or LMA. The Company categorizes revenue from instant ticket printing contracts as product revenue from "Systems and other Product sales" as described in "Notes to the Consolidated Financial Statements—
3
. Revenue Recognition" included in "Item 18. Financial Statements". The instant ticket production business is also highly competitive and subject to strong, price-based competition.
Product Sales and Services Contracts
Under product sales and services contracts, the Company constructs, sells, delivers, and installs turnkey lottery systems or lottery equipment, provides related services, and licenses related software. The lottery authority maintains, in most instances, responsibility for lottery operations. The Company sells additional machines and central computers to expand existing systems and/or replace existing equipment and provides ancillary maintenance and support services related to the systems, equipment sold, and software licensed. The Company categorizes revenue from product sales and services contracts on a case-by-case basis as either service or product revenue from "Other Services" or "Systems and other Product Sales", respectively," as described in "Notes to the Consolidated Financial Statements—
3
. Revenue Recognition" included in "Item 18. Financial Statements".
2. Machine Gaming
The Company designs, develops, manufactures and provides cabinets, games, systems and software for customers in regulated gaming markets throughout the world under fixed fee, participation and product sales contracts. The Company holds more than 450 global gaming licenses and does business with commercial casino operators, tribal casino operators, and governmental organizations (primarily consisting of Lottery operators). Machine gaming products and services are provided through the NAGI, NALO, International, and Italy business segments.
The Company’s primary global competitors in Machine Gaming are Aristocrat, Konami, Novomatic, and Scientific Games.
Gaming Machines and Game Content
The Company offers a diverse range of gaming machine cabinets from which land-based casino customers can choose to maximize functionality, flexibility, and player comfort. In addition to cabinets, the Company develops a wide range of casino games taking into account local jurisdictional requirements, market dynamics, and player preferences. The Company combines elements of math, play mechanics, sound, art, and technological advancements with a library of entertainment licenses and a proprietary intellectual property portfolio to provide gaming products designed to provide a high degree of player appeal and entertainment. The Company offers a wide array of casino-style games in a variety of multi-line, multi-coin and multi-currency configurations.
The Company's casino games typically fall into two categories: premium games and core games.
Premium games include:
|
•
|
Wide Area Progressives - games that are linked across several casinos and/or jurisdictions and share a large common jackpot, including The Wheel of Fortune
®
franchise.
|
|
•
|
Multi-Level Progressives - games that are linked to a number of other games within the casino itself and offer players the opportunity to win different levels of jackpots, such as Fort Knox
®
Video Slots.
|
Core games, which include core video reel, core mechanical reel, and core video poker, are typically sold and in some situations leased to customers.
22
The Company produces other types of games including:
|
•
|
"Centrally Determined" games which are games connected to a central server that determines the game outcome;
|
|
•
|
Class II games which are electronic video bingo machines that can be typically found in North American tribal casinos and certain other jurisdictions like South Africa; and
|
|
•
|
Random-number-generated and live dealer electronic table games, including baccarat and roulette.
|
Gaming service revenue is primarily generated through providing premium game content and cabinets to customers. These pricing arrangements are largely variable where the casino customer pays service fees to the Company based on a percentage of amounts wagered (also known as coin-in), net win, or a daily fixed fee.
Machine gaming product sales revenues are generated from the sales of land-based gaming machines (equipment and game content), systems, component parts (including game conversion sales), other equipment and services. The Company categorizes revenue from gaming machines as product revenue from "Gaming Machines" and revenue from game content as product revenue from "Systems and other Product Sales" as described in "Notes to the Consolidated Financial Statements—
3
. Revenue Recognition" included in "Item 18. Financial Statements".
Video Lottery Terminals ("VLTs") and Amusement with Prize Machines ("AWPs")
The Company provides VLTs, VLT central systems and VLT games worldwide. VLTs are usually connected to a central system. In addition, the Company provides AWPs and games to licensed operators in Italy and the rest of Europe. AWPs are typically low-denomination gaming machines installed in retail outlets.
With respect to the Company's machine gaming licenses in Italy, the Company directly manages stand-alone AWPs, as well as VLTs that are installed in various retail outlets and linked to a central system. The Company also provides systems and machines to other machine gaming licensees, either as a product sale or with long-term, fee-based contracts where the service revenue earned is generally based on a percentage of wagers, net of applicable gaming taxes. Due to the nature of the transactions, NALO and International generally categorize revenue from VLTs as product revenue from "Lottery machines" or as service revenue from "Other services" and Italy categorizes revenue from VLTs as service revenue from "Machine gaming" as described in "Notes to the Consolidated Financial Statements—
3
. Revenue Recognition" included in "Item 18. Financial Statements".
Gaming Management Systems
The Company offers a comprehensive range of system modules and applications for all areas of casino management. Gaming systems products include infrastructure and applications for casino management, customer relationship management, patron management, and server-based gaming. The Company's main casino management system offering is the Advantage
®
System, which offers solutions and modules for a wide-range of activities from accounting and payment processing to patron management and regulatory compliance.
The Company's systems feature customized player messaging, tournament management, and integrated marketing and business intelligence modules that provide analytical, predictive, and management tools for maximizing casino operational effectiveness. The server-based solutions enable electronic game delivery and configuration for slot machines, as well as providing casino operators with opportunities to increase profits by enhancing the players’ experience, connecting with players interactively, and creating operational efficiencies. Service Window enables operators to market to customers more effectively by leveraging an additional piece of hardware onto existing machines for delivering in-screen messaging. The Company's systems portfolio also extends to encompass mobile solutions such as the Cardless Connect™ app, which offers a cardless, cashless loyalty solution for casino players. Mobile solutions that drive efficiencies and enable floor monitoring for operators while decreasing response time to player needs include Mobile Host, Mobile Responder, and Mobile Notifier. The Company categorizes revenue from gaming management systems as product revenue from "Systems and other Product sales" as described in "Notes to the Consolidated Financial Statements—
3
. Revenue Recognition" included in "Item 18. Financial Statements".
3. Sports Betting
In Italy, the Company is a licensee for the operation of retail and internet-based sports betting. Specifically, the Company:
|
•
|
operates an expansive land-based B2C sports betting network through its “Better” brand on a fixed odds, pari-mutuel, or virtual betting basis;
|
|
•
|
establishes odds and assumes the risks related to fixed-odds sports contracts;
|
|
•
|
collects the wagers; and
|
|
•
|
makes the payouts.
|
23
The Company offers directly to customers betting on sports events (including basketball, horse racing, soccer, cycling, downhill skiing, cross country skiing, tennis, sailing, and volleyball), motor sports (car and motorcycle racing), and non-sports events connected with the world of entertainment, music, culture, and current affairs of primary national and international interest.
The Company also provides sports betting technology and management services in Italy, the U.S. (through both the NAGI and NALO business segments) and internationally, which include:
|
•
|
localized sports betting platforms certified for each market composed of either:
|
|
(i)
|
core engine and associated support modules, as well as trading and risk management tools, provided to customers as a fully managed service, or
|
|
(ii)
|
“software only” technical solutions to create a complete one-stop solution or to integrate new functionality to existing operations;
|
|
•
|
secure retail betting solutions;
|
|
•
|
point-of-sale display systems;
|
|
•
|
call center facilities;
|
|
•
|
internet and mobile betting technology; and
|
|
•
|
fixed odds or pool betting options.
|
Sports betting customers of the Company include: FanDuel, Horse Races S.A. (a subsidiary of OPAP), Lottery National Belgium (LNB), Pronósticos para la Asistencia Pública (a lottery in Mexico), and the Rhode Island Lottery. Commercial gaming customers include BetFred, DraftKings, and MGM Resorts International. The Company’s primary competitors in Sports Betting are Bet365, Betfair/PaddyPower, Eurobet, Sisal, SNAITECH, and William Hill. The Company categorizes revenue from sports betting as service revenue from "Other services" as described in "Notes to the Consolidated Financial Statements—
3
. Revenue Recognition" included in "Item 18. Financial Statements".
4. Digital
Digital gaming (or iGaming) enables game play via the internet for real money or for fun (social). The Company designs, manufactures, and distributes a full suite of configurable products, systems, and services and holds more than 20 digital gaming licenses worldwide. In Italy, the Company acts as both a complete internet gaming operator and mobile casino operator. The Company's digital products include poker, bingo, and online casino table and slot games with features such as single and multiplayer options with branded titles and select third-party content. The Company provides social casino content as part of a multi-year strategic partnership with DoubleU Games. The Company’s complete suite of PlayLottery solutions, services, and professional expertise allows lotteries to fully engage their players on any digital channel in regulated markets. Existing lottery game portfolios are extended to the digital channel to provide a spectrum of engaging content such as eInstant tickets.
The Company’s iGaming systems and digital platforms offer customers an integrated system that provides player account management, advanced marketing and analytical capabilities, and a highly reliable and secure payment system. IGT Connect™ integrates third-party player account management systems, third-party game engines, and regulatory systems. The Company also offers a remote game server, which is a fast gateway to extensive casino and eInstant content, virtual reality games, and digital and social gaming services that enhance player experiences and create marketing opportunities around either the Company's games or third-party games.
The IGT PlaySpot™ mobile solution, an app-based product for casinos and lotteries enabling mobile games, services, and payments in specific retail environments that are defined by regulator-grade geo-location technologies, is offered by the Company in both lottery and casino environments. Wagering for money can be offered in the IGT PlaySpot™ Lottery mobile solution locations and options include eInstants, draw game ticket purchases, and keno. IGT PlaySpot™ Casino mobile solution offers real money wagering on activities including sports wagering and betting on live roulette and baccarat tables on premise. IGT PlaySpot™ Casino mobile solution ties into existing casino loyalty and back-office systems to fully integrate into customers' marketing and operations programs.
The Company's diverse digital B2B customer base includes Caesar's Entertainment, the Georgia Lottery, and William Hill, among others. Digital and social gaming products and services are provided through the NAGI, NALO, International, and Italy business segments. The Company faces competition from operators, such as 888 Holdings and bwin.party, and broad-based traditional B2B providers, such as Playtech plc and Microgaming. The Company also faces competition in the digital space from other machine gaming suppliers, such as Scientific Games. The Company categorizes revenue from digital products as product revenue from "Systems and other Product sales" and categorizes revenue from digital services as service revenue from "Other services" as described in "Notes to the Consolidated Financial Statements—
3
. Revenue Recognition" included in "Item 18. Financial Statements".
24
5. Commercial Services
The Company develops innovative technology to enable lotteries to offer commercial services over their existing lottery infrastructure or over standalone networks separate from the lottery. Leveraging its distribution network and secure transaction processing experience, the Company offers high-volume processing of commercial transactions including: prepaid cellular telephone recharges, bill payments, e-vouchers and retail-based programs, electronic tax payments, stamp duty services, prepaid card recharges, and money transfers. These services are primarily offered outside of North America. In Italy, the Company's commercial payment and eMoney services network comprises points-of-sale divided among the primary retailers of lottery products: tobacconists, bars, petrol stations, newspaper stands, and motorway restaurants. The Company categorizes revenue from commercial services as service revenue from "Other services" as described in "Notes to the Consolidated Financial Statements—
3
. Revenue Recognition" included in "Item 18. Financial Statements".
Business Segment Revenue
Revenues for the Company by business segment are as follows:
|
|
Year Ended December 31,
|
||||||||
|
($ thousands)
|
2018
|
2017
|
2016
|
||||||
|
Service revenue
|
624,476
|
|
780,633
|
|
975,206
|
|
|||
|
Product sales
|
378,693
|
|
377,065
|
|
398,248
|
|
|||
|
NAGI
|
1,003,169
|
|
1,157,698
|
|
1,373,454
|
|
|||
|
Service revenue
|
1,111,069
|
|
1,093,048
|
|
1,128,306
|
|
|||
|
Product sales
|
80,833
|
|
92,174
|
|
65,269
|
|
|||
|
NALO
|
1,191,902
|
|
1,185,222
|
|
1,193,575
|
|
|||
|
Service revenue
|
495,497
|
|
557,049
|
|
512,668
|
|
|||
|
Product sales
|
324,486
|
|
332,015
|
|
314,637
|
|
|||
|
International
|
819,983
|
|
889,064
|
|
827,305
|
|
|||
|
Service revenue
|
1,814,549
|
|
1,703,901
|
|
1,759,843
|
|
|||
|
Product sales
|
930
|
|
1,149
|
|
1,295
|
|
|||
|
Italy
|
1,815,479
|
|
1,705,050
|
|
1,761,138
|
|
|||
|
Other
|
723
|
|
1,925
|
|
(1,576
|
)
|
|||
|
Total revenue
|
4,831,256
|
|
4,938,959
|
|
5,153,896
|
|
|||
For a further description of the principal services and products the Company provides by business segment, including a breakdown of the Company's revenues by geographic market, see “Item 5.A Operating and Financial Review and Prospects—Operating Results” and “Notes to the Consolidated Financial Statements—
21
. Segment Information.”
Seasonality
In general, the Company’s business is not materially affected by seasonal variation. However, in the sports betting business, the volume of bets that are collected over the year can be affected by the schedules of sporting events and the particular season of such sports. The volume of bets collected may also be affected by schedules of significant sporting events that occur at regular, but infrequent, intervals, such as the FIFA Football World Cup. In the lottery business, lottery consumption and gaming may decrease over the summer months due to the tendency of consumers to be on vacation during that time. Seasonal gaming trends generally show higher play levels in the spring and summer months and lower levels in the fall and winter months. Gaming product sales may be uneven throughout the year, and can be affected by factors including the timing of large transactions and new casino openings.
Source of Materials
The Company uses a variety of raw materials to assemble gaming devices (e.g., metals, wood, plastics, glass, electronic components, and LCD screens). Moreover, there is significant paper, toner, and ink consumption in the Company's offices and at our two ticket printing facilities. A large portion of the materials used involve packaging, most of which is cardboard and paper.
25
Management believes that adequate supplies and alternate sources of the Company’s principal raw materials are available, and does not believe that the prices of these raw materials are especially volatile. The Company generally has global material suppliers and uses multi-sourcing practices to promote component availability. The Company does outsource all of the manufacturing and assembly of certain lottery terminals to a single vendor; however, management believes the Company is likely to be able to realign its manufacturing facilities to manufacture such lottery terminals itself if such vendor fails to meet production schedules.
Product Development
The Company devotes substantial resources to research and development and incurred
$263.3 million
,
$313.1 million
, and
$343.5 million
in
2018
,
2017
, and
2016
, respectively. The Company's research and development efforts cover multiple creative and engineering disciplines for its lottery and gaming businesses, including creative game content, hardware, and software; and land-based, online social, and online real-money applications. These products are created primarily by employee designers, engineers, and artists, as well as third-party content creators. Third-party technologies are used to improve the yield from development investment and concentrate increased resources on product differentiation engineering.
Manufacturing operations primarily involve the configuration and assembly of electronic components, cables, harnesses, video monitors, and prefabricated parts purchased from outside sources.
Intellectual Property
The Company’s intellectual property (“IP”) portfolio of patents, trademarks, copyrights, and other licensed rights is significant. At December 31, 2018, the Company held 4,980 patents and 7,473 trademarks filed and registered worldwide. The Company's IP portfolio is widely diversified with patents related to a variety of products, including game designs, bonus and secondary embedded game features, device components, systems features, and web-based or mobile functionality. The Company also relies on trade secret protection, believing that its technical “know-how” and the creative skills of its personnel are of substantial importance to its success.
Most of the Company’s products are marketed under trademarks and copyrights that provide product recognition and promote widespread acceptance. The Company seeks protection for its copyrights and trademarks in the U.S. and various foreign countries, where applicable, and uses IP assets offensively and defensively to protect its innovation. The Company also has a program where it licenses its patents to others under terms designed to promote standardization in the gaming industry.
In addition, some of the Company’s most popular games and features, including Wheel of Fortune®, are based on trademarks, patents and/or other intellectual property licensed from third parties. The Company routinely obtains, retains, and expands licenses for popular intellectual property.
Software Development
The Company has developed software for use in the management of a range of lottery, gaming, and betting functions and products, including leveraging integration with third-party software components. Software developed by the Company is used in a variety of applications including (i) in centralized systems for the management of lotteries, machine gaming and betting, and other commercial services; (ii) to enhance functions connected to services provided through websites and mobile applications including lotteries, sports betting, instant win, and casino style games; and (iii) in a variety of back-office functions. Software developed by the Company is also used in machines for: management of lotteries, machine gaming, betting and online payments; provision of gaming and non-gaming content; and integration with other devices such as mobile phones and tablets.
Regulatory Framework
The gaming and lottery industries are subject to extensive and evolving governmental regulation in the U.S. and other jurisdictions. Gaming laws are based upon declarations of public policy designed to ensure that gaming is conducted honestly, competitively and free of criminal and corruptive elements. While the regulatory requirements vary from jurisdiction to jurisdiction, the majority typically require some form of licensing or regulatory suitability of operators, suppliers, manufacturers and distributors as well as their major shareholders, officers, directors and key employees. Regulators review many aspects of an applicant including financial stability, integrity and business experience. Additionally, the Company’s gaming products and technologies require certification or approval in most jurisdictions where the Company conducts business.
A comprehensive network of internal and external resources and controls is required to achieve compliance with the broad governmental oversight of the Company’s business. The Company has a robust internal compliance program to ensure compliance with applicable requirements imposed in connection with its gaming and lottery activities, as well as legal requirements generally
26
applicable to all publicly traded companies. The Company employs over 120 people to support global compliance which is directed on a day-to-day basis by the Company’s Senior Vice President, Chief Compliance and Risk Management Officer. Legal advice is provided by attorneys from the Company’s legal department as well as outside experts. The compliance program, accountable to the Parent’s board of directors, is overseen by the Global Compliance Governance Committee, which comprises employee and nonemployee directors and a non-employee gaming law expert. Through these efforts, the Company seeks to assure both regulators and investors that all its operations maintain the highest levels of integrity.
Gaming
The manufacture, sale and distribution of gaming devices, equipment, and related technology and services are subject to federal, state, tribal, and local regulations in the U.S. and foreign jurisdictions. The initial regulatory requirement in most jurisdictions is to obtain the privileged licenses that allow the Company to participate in gaming activities. The Company’s operating entities and key personnel have obtained or applied for all known government licenses, permits, registrations, findings of suitability, and approvals necessary to manufacture, distribute and/or operate gaming products in all jurisdictions where it does business. Although many gaming regulations across jurisdictions are similar or overlapping, the Company must satisfy all conditions individually for each jurisdiction. Obtaining the required licenses at a corporate and individual level is a thorough process, in which the authorities review detailed information about the companies and individuals applying for suitability. Once the license has been granted, regulatory oversight ensures that the licensee continue to operate with honesty and integrity.
Frequently, gaming regulators not only govern the activities within their jurisdiction or origin, but also monitor activities in other jurisdictions to ensure that the Company complies with local standards on a worldwide basis. A violation in one jurisdiction could result in disciplinary action in another.
The Company holds over 450 gaming licenses across approximately 340 jurisdictions. Key regulatory authorities that have licensed the Company include, among others, the United Kingdom Gambling Commission, the Nevada State Gaming Control Board and the New Jersey Division of Gaming Enforcement. The Company has never been denied a gaming related license, nor had any of its licenses suspended or revoked.
Lottery
Lotteries in the U.S. are regulated by state or other applicable law. There are currently 45 U.S. jurisdictions (including the District of Columbia) that authorize the operation of lotteries. The ongoing operations of lotteries and lottery operators are typically subject to extensive and broad regulation, which vary state-by-state. Lottery regulatory authorities generally exercise significant discretion, including with respect to the determination of the types of games played, the price of each wager, the manner in which the lottery is marketed and the selection of suppliers of equipment, technology, and services, as well as the retailers of lottery products. To ensure the integrity of contract awards and lottery operations, most jurisdictions require detailed background disclosure on a continuous basis from vendors and their officers, directors, subsidiaries, affiliates, and principal stockholders. Background investigations of the vendors’ employees who will be directly responsible for the operation of lottery systems are also generally conducted. Certain jurisdictions also require extensive personal and financial disclosure and background checks from persons and entities beneficially owning a specified percentage of a vendor’s securities. The awarding of lottery contracts and ongoing operations of lotteries in international jurisdictions are also extensively regulated, although international regulations typically vary from those prevailing in the U.S.
Digital and Sports Betting
In 2018, the U.S. Supreme Court overturned the Professional and Amateur Sports Protection Act of 1992 (“PASPA”), allowing states other than Nevada, Oregon, Delaware, and Montana (where sports betting was already authorized) to legalize sports wagering. A handful of states acted quickly to take advantage of the repeal: New Jersey, Mississippi, Rhode Island, West Virginia, Pennsylvania, and some individual Tribal jurisdictions. Many states are expected to address the legalization of sports wagering in upcoming legislative sessions. The channels for offering sports wagering differ from state to state, with most states seeking to offer sports wagering both in person and through some electronic means, such as via a mobile phone app.
In the U.S., the Unlawful Internet Gambling Enforcement Act of 2006 (“UIGEA”) prohibits among other things, the acceptance by a business of a wager by means of the internet where such wager is prohibited by any applicable law where initiated, received or otherwise made. Under UIGEA, severe criminal and civil sanctions may be imposed on the owners and operators of such systems and on financial institutions that process wagering transactions. The law contains a safe harbor for wagers placed within a single state (disregarding intermediate routing of the transmission) where the method of placing the bet and receiving the bet is authorized by that state’s law, provided the underlying regulations establish appropriate age and location verification.
27
Also in the U.S., the Wire Act prohibits several types of wager-related communications over a “wire communications facility.” In 2011, the DOJ issued an opinion interpreting the Wire Act as applicable only to sports wagering. In January 2019, the DOJ published the 2019 Opinion, concluding that the Wire Act was applicable to other forms of gambling that cross state lines, though the precise scope of the 2019 Opinion is unclear, and the DOJ has not yet addressed how it plans to enforce the Wire Act. The DOJ has issued a memorandum stating that it will not enforce the 2019 Opinion prior to June 14, 2019. Further, the New Hampshire Lottery Commission and certain private parties have commenced litigation in federal district court in New Hampshire challenging the Opinion, and it is unclear how the court will rule. The 2019 Opinion also states DOJ’s view that UIGEA does not supersede or otherwise limit the scope of the Wire Act.
Delaware, New Jersey, and Pennsylvania have authorized internet casino gaming and Nevada has authorized online poker. Additionally, a few state lotteries offer internet instant game sales to in-state lottery customers and several states allow subscription sales of draw games over the internet.
The Company participates in digital gaming and sports wagering in the U.S. as a content and technology provider within fully regulated gaming and lottery frameworks.
Digital gaming in the E.U. is characterized by diverse regulatory frameworks with some E.U. countries having monopolistic regimes run by a sole operator and others having established licensing systems for more than one operator. The Company carefully evaluates each E.U. jurisdiction to ensure adherence to applicable laws and regulations. As local regulations and related guidance from authorities change, the Company re-evaluates its position in any given country. In 2018, the E.U. Court of Justice announced that it was dropping all enforcement proceedings related to gambling which allows the individual E.U. country rulings to stand, regardless of whether or not they violate E.U. laws. It is possible that this decision by the European Court of Justice, and any subsequent changes in laws of individual E.U. jurisdictions, could impact some of the previous legal analysis conducted by the Company and its decisions to enter certain European markets.
Italian Gaming and Betting Regulations
The Company operates in Italy in the lottery, gaming, and betting sectors and is subject to regulatory oversight by the ADM. At December 31, 2018, the Company held licenses for (1) the activation and operation of the network for Italy's Lotto game, (2) the operation of instant and traditional lotteries, (3) the activation and operation of the network for the telematic operation of legalized AWPs and VLTs, (4) the land based collection of pari-mutuel and fixed odds betting through physical points of sale and digital channels and (5) the digital gaming collection operated through digital channels, including digital sports betting, skill games, casino games, and digital Bingo.
Gaming in Italy is an activity reserved to the State. Any game that is carried out without proper authorization is illegal and subject to criminal penalties. Italian law grants the Ministry of Economy and Finance, through ADM, the power to introduce games and to manage gaming and betting activities directly or by granting licenses to qualified operators selected by means of public tenders as further explained below. The process of creating and granting gaming and betting licenses in Italy is heavily regulated.
Gaming and betting licenses are granted pursuant to a public tender procurement process. The license provides for all of the licensee’s requirements, in accordance with the provisions of Italian law and regulation, activities and duties, including collection of the game’s revenues, the payment of winnings, the payment of the point of sale, payment of gaming taxes and all the other amounts due to the State, the drawings and the management of all of the technological assets to operate gaming, requirements of the technological infrastructure and the relevant service levels. Licenses are for a determined time period and are not renewable unless indicated in the licensing agreement; in such event, the renewal is not guaranteed to be on the same terms. In certain cases, the license may be extended at the option of the ADM on the same terms. Under other circumstances, which are typically defined in the licensing agreement, the license may be revoked or terminated. Most cases of early termination are related to the breach of the terms of the licensing agreement or the non-fulfillment of conditions of that agreement as well as the loss of the requirements prescribed by Italian law and regulation for the assignment and the maintenance of gaming licenses. In some cases, the early termination of the license allows the State to draw upon the entire amount of the performance bond presented by the licensee. Upon governmental request, the licensee has an obligation to transfer, free of charge, the assets subject of the license to the State at the end of the term of the license or in the event of its revocation or early termination. Each single license contains specific provisions enacting such general obligation.
28
|
C.
|
Organizational Structure
|
A listing of the Parent’s directly and indirectly owned subsidiaries at February 28, 2019 is set forth in Exhibit 8.1 to this annual report on Form 20-F. At February 28, 2019, De Agostini had an economic interest of approximately 50.64% and, due to its election to exercise the special voting shares associated with its ordinary shares pursuant to the loyalty plan, a voting interest in the Parent of approximately 67.23% of the total voting rights. See “Item 7. Major Shareholders and Related Party Transactions” for additional information.
The following is a diagram of the Parent and certain of its subsidiaries and associated companies at February 28, 2019:
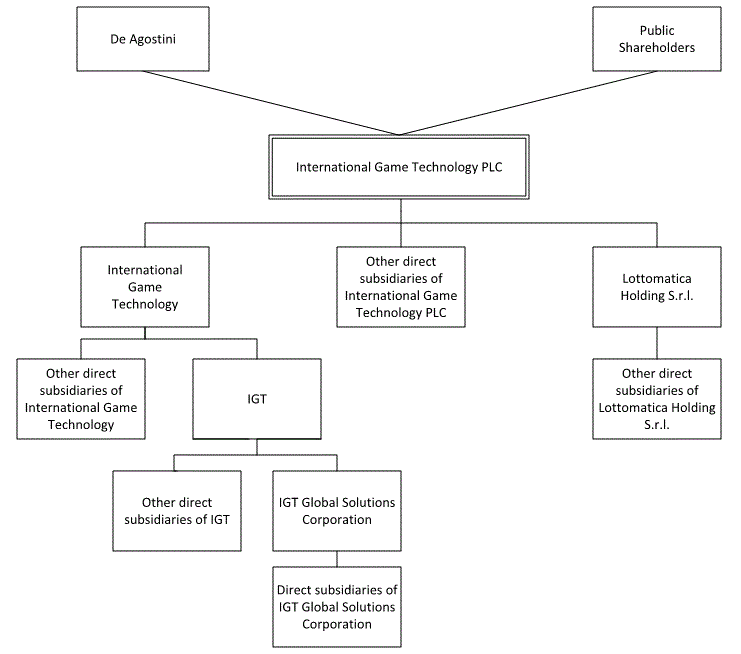
29
|
D.
|
Property, Plant and Equipment
|
The Parent's principal office is located at Marble Arch House, 66 Seymour Street, 2
nd
Floor, London W1H 5BT, U.K., telephone number +44 (0) 207 535 3200. At February 28, 2019, the Company leased approximately 126 properties in the U.S. and 291 properties outside of the U.S., and owned a number of facilities and properties, including:
|
•
|
an approximately 113,000 square foot manufacturing, research and development and office building in Moncton, New Brunswick, Canada;
|
|
•
|
an approximately 52,500 square foot research and development lab and engineering office in Reno, Nevada;
|
|
•
|
an approximately 51,000 square foot manufacturing and office facility in Gross St. Florian, Austria; and
|
|
•
|
an approximately 13,000 square foot enterprise data center in West Greenwich, Rhode Island.
|
The following table shows the Company's material properties at February 28, 2019:
U.S. Properties
|
Location
|
Square
Feet
|
Use and Productive Capacity
|
Extent of
Utilization
|
Holding
Status
|
|
|
9295 Prototype Drive,
Reno, NV
|
1,180,418
|
Office; Warehouse, Game Studios; Hardware/Software Engineering; Global Manufacturing Center; Electronic Gaming Machine and Instant Ticket Vending Machine Production
|
100
|
%
|
Leased
|
|
6355 S. Buffalo Drive,
Las Vegas, NV
|
222,268
|
U.S. Principal Operating Facility, Game Studio, Systems Software, Showroom
|
100
|
%
|
Leased
|
|
55 Technology Way,
West Greenwich, RI
|
170,000
|
WG Technology Center: Office; Research and Testing; Storage and Distribution
|
100
|
%
|
Leased
|
|
4000 South Frontage Road, Suite 101
Lakeland, FL
|
141,960
|
Printing Plant: Printing facility; Storage and Distribution; Office
|
100
|
%
|
Leased
|
|
10 Memorial Boulevard,
Providence, RI
|
124,769
|
U.S. Principal Operating Facility
|
100
|
%
|
Leased
|
|
300 California Street, Floor 8,
San Francisco, CA |
115,457
|
Office; PlayDigital HQ
|
100
|
%
|
Leased
|
|
8520 Tuscany Way, Bldg. 6, Suite 100,
Austin, TX |
81,933
|
Texas Warehouse and National Response Center: Contact Center; Storage and Distribution; Office
|
95
|
%
|
Leased
|
|
5300 Riata Park Court, Bldg. E, Suite 100,
Austin, TX |
42,537
|
Austin Tech Campus: Research and Test; Office
|
90
|
%
|
Leased
|
|
8200 Cameron Road, Suite E120,
Austin, TX |
41,705
|
Data Center of the Americas: Data Center; Network Operations; Office
|
80
|
%
|
Leased
|
|
47 Technology Way,
West Greenwich, RI |
13,050
|
Enterprise Data Center: Data Center; Network Operations
|
75
|
%
|
Owned
|
|
75 Baker Street,
Providence, RI |
10,640
|
RI National Response Center: Office; Contact Center
|
100
|
%
|
Leased
|
30
Non-U.S. Properties
|
Location
|
Square
Feet
|
Use and Productive Capacity
|
Extent of
Utilization
|
Holding
Status
|
|
|
Via delle Monachelle S.N.C.
Pomezia, Rome, Italy
|
129,120
|
Instant Ticket Warehouse; Instant Ticket Production
|
100
|
%
|
Leased
|
|
Galwin 2
1046 AW Amsterdam, Netherlands
|
125,128
|
Electronic Gaming Machine Production; Gaming Distribution/Repair; Research and Test; Office
|
90
|
%
|
Leased
|
|
Viale del Campo Boario 56/D 00154
Roma, Italy
|
123,740
|
Principal Operating Facility in Italy: Office Italy Data Center: Data Center; Network Operations
|
100
|
%
|
Leased
|
|
328 Urquhart Ave,
Moncton, New Brunswick, Canada
|
113,000
|
Canada HQ; Office; Research and Testing; VLT Production
|
100
|
%
|
Owned
|
|
Viale del Campo Boario 19 00154
Roma, Italy
|
96,840
|
Office; Software Development
|
95
|
%
|
Leased
|
|
Seering 13-14,
Unterpremstatten, Austria |
73,776
|
Austria Gaming HQ; Office; Research and Test
|
90
|
%
|
Leased
|
|
29 Suzhoujie Street, Viva Plaza, Haidian District, Room No. 1-20, 11th and 18th Floors, Beijing 100080, China
|
56,898
|
Game Studio; Systems Software; Office
|
85
|
%
|
Leased
|
|
Al. Jerozolimskie, 92
Brama Building, Warsaw, Poland |
51,072
|
International Tech Hub; Office; Research and Test
|
95
|
%
|
Leased
|
|
USCE Tower
Bulevar Mihajla, Pupina No. 6 Belgrade, Serbia |
28,471
|
Software Development Office, Lottery and Gaming Products
|
95
|
%
|
Leased
|
|
11 Talavera Rd.
Building B, Sydney, Australia |
27,432
|
Office; Sales & Marketing; Financial Support
|
100
|
%
|
Leased
|
|
10 Finsbury Square, 3rd Floor
London EC2A 1AD, United Kingdom
|
17,340
|
International Management HQ, Play Digital
|
100
|
%
|
Leased
|
|
Marble Arch House,
66 Seymour Street, 2nd Floor, London W1H 5BT, United Kingdom |
11,495
|
Registered Global Headquarters of the Parent
|
75
|
%
|
Leased
|
The Company's facilities are in good condition and are adequate for its present needs and there are no known environmental issues that may affect the Company's utilization of its real property assets.
The Company does not have any plans to construct, expand or improve its facilities in any material manner other than general maintenance of facilities. As such, no increase in productive capacity is anticipated.
None of the Company's properties are subject to mortgages or other security interests.
31
|
Item 4A.
|
Unresolved Staff Comments
|
None.
|
Item 5.
|
Operating and Financial Review and Prospects
|
The following discussion and analysis of the Company's financial condition and results of operations should be read in conjunction with the Consolidated Financial Statements, including the notes thereto, included in this annual report, as well as “Presentation of Financial and Certain Other Information,” “Item 3.A. Selected Financial Data,” “Item 3.D. Risk Factors” and “Item 4.B. Business Overview.”
The following discussion includes certain forward-looking statements. Actual results may differ materially from those discussed in such forward-looking statements. Factors that could cause or contribute to such differences include, but are not limited to, those discussed below and elsewhere in this annual report, including in “Item 5.G. Safe Harbor Statement under the Private Securities Litigation Reform Act of 1995” and “Item 3.D. Risk Factors.”
A.
Operating Results
Overview
The Company is a leading commercial operator and provider of technology in the regulated worldwide gaming markets that operates and provides a full range of services and leading-edge technology products across all gaming markets, including lotteries, machine gaming, sports betting, interactive gaming and commercial services. The Company's state-of-the-art information technology platforms and software enable distribution of its products and services through land-based systems, the internet and mobile devices.
The structure of its internal organization is customer-facing aligned around
four
segments operating in
three
regions as follows:
|
•
|
North America Gaming and Interactive
|
|
•
|
North America Lottery
|
|
•
|
International
|
|
•
|
Italy
|
Key Factors Affecting Operations and Financial Condition
The following are a description of the principal factors which have affected the Company's results of operations and financial condition and/or which may affect results of operations and financial condition for future periods.
Sale of Double Down Interactive LLC:
On June 1, 2017, the Company sold Double Down Interactive LLC ("DoubleDown") to DoubleU Games Co., Ltd. ("DoubleU"). The
$27.2 million
gain on sale, net of selling costs, is classified within transaction expense (income), net on the consolidated statement of operations. As a result of the sale, the North America Gaming and Interactive segment experienced significantly lower service revenue and operating income from social gaming in the second half of 2017 and for the year ended December 31, 2018. For the years ended December 31, 2018 and 2017, Social gaming service revenue includes only social gaming revenue earned from DoubleDown. The North America Gaming and Interactive segment continues to earn revenue from social gaming which is included in Other services within service revenue and Systems and other within product revenue.
Effects of Foreign Exchange Rates:
The Company is affected by fluctuations in foreign exchange rates (i) through translation of foreign currency financial statements into U.S. dollars for consolidation, which is referred to as the translation impact, and to a lesser extent (ii) through transactions by subsidiaries in currencies other than their own functional currencies, which is referred to as the transaction impact. Translation impacts arise in the preparation of the consolidated financial statements; in particular, the consolidated financial statements are prepared in U.S. dollars while the financial statements of each of the Company's subsidiaries are generally prepared in the functional currency of that subsidiary. In preparing consolidated financial statements, assets and liabilities measured in the functional currency of the subsidiaries are translated into U.S. dollars using the exchange rate prevailing at the balance sheet date, while income and expenses are translated using the average exchange rates for the period covered. Accordingly, fluctuations in the exchange rate of the functional currencies of the Company's subsidiaries against the U.S. dollar impacts the Company's results of operations. The Company is particularly exposed to movements in the euro/U.S. dollar exchange rate. Although the fluctuations in foreign exchange rates has had a significant impact on the Company's revenues, the impact on operating income and cash flows is less significant in that revenues are mostly matched by costs denominated in the same currency.
32
Jackpots and Late Numbers:
The Company believes that the performance of lottery products is influenced by the size of available jackpots in jurisdictions that offer such jackpots. In general, when jackpots increase, sales of lottery tickets also increase, further increasing the jackpot. The Company also believes that consumers in Italy monitor “late numbers” (numbers that have not been drawn for more than 100 draws) and when there is a good pipeline of late numbers, wagers in Italy increase. Under both circumstances, the Company's service revenues are positively impacted.
Product Sales:
The Company's product sales fluctuate from year to year due to the mix, volume and timing of the product sales transactions. In general, product sales are dependent on the timing of replacement lottery and gaming machines. Product sales amounted to
$784.9 million
,
$802.4 million
and
$778.3 million
, or approximately
16.2%
,
16.2%
and
15.1%
of total revenues, for the years ended
December 31, 2018
,
2017
and
2016
, respectively.
Restructuring Costs:
The Company has undertaken various restructuring plans, principally related to the April 2015 acquisition of IGT to eliminate redundant costs and achieve synergies across the business. The Company recorded restructuring costs associated with these plans of
$14.8 million
,
$39.9 million
and
$27.9 million
, for the years ended
December 31, 2018
,
2017
and
2016
, respectively.
Research and Development Activities:
The Company devotes substantial resources on research and development and incurred
$263.3 million
,
$313.1 million
and
$343.5 million
of related expenses for the years ended
December 31, 2018
,
2017
and
2016
, respectively. As anticipated, investments in research and development increased following the April 2015 acquisition of IGT and decreased in
2017
and
2018
as a result of integration and optimization efforts.
The Wire Act:
On January 14, 2019, the U.S. Department of Justice, (the “DOJ”) published an opinion reversing its previously-issued opinion that the Wire Act was applicable only to sports betting (the “2019 Opinion”). The 2019 Opinion interprets the Wire Act as applying to other forms of gambling that cross state lines, though the precise scope of the 2019 Opinion is unclear, and the DOJ has not yet addressed how it plans to enforce the Wire Act in light of the 2019 Opinion. Further, the New Hampshire Lottery Commission and certain private parties have commenced litigation in federal district court in New Hampshire challenging the 2019 Opinion, and it is unclear how the court will rule. The Company’s management is currently evaluating the 2019 Opinion and the related pending litigation and their implications to the Company, its customers, and the industries in which the Company operates.
Critical Accounting Estimates
The Company's consolidated financial statements are prepared in conformity with GAAP which require the use of estimates, judgments and assumptions that affect the carrying amount of assets and liabilities and the amounts of income and expenses recognized. The estimates and underlying assumptions are based on information available at the date that the financial statements are prepared, on historical experience, judgments and assumptions considered to be reasonable and realistic.
The Company periodically and continuously reviews the estimates and assumptions. Actual results for those areas requiring management judgment or estimates may differ from those recorded in the consolidated financial statements due to the occurrence of events and the uncertainties which characterize the assumptions and conditions on which the estimates are based.
The areas that require greater subjectivity of management in making estimates and judgments and where a change in such underlying assumptions could have a significant impact on the Company's consolidated financial statements are fully described in "Notes to the Consolidated Financial Statements—
2
. Summary of Significant Accounting Policies" included in "Item 18. Financial Statements". Certain critical accounting estimates are discussed below.
Revenue Recognition
As described in "Notes to the Consolidated Financial Statements—
2
. Summary of Significant Accounting Policies" included in "Item 18. Financial Statements", the Company adopted Accounting Standards Update ("ASU") 2014-09,
Revenue from Contracts with Customers
(Topic 606)
("ASC 606") in the first quarter of 2018 using a modified retrospective application approach which was applied to customer contracts, in their modified state, that were not completed as of January 1, 2018. Under ASC 606, more judgment and estimates are required within the revenue recognition process than required under prior GAAP, including identifying performance obligations in the contract, estimating the amount of variable consideration to include in the transaction price, and allocating the transaction price to each separate performance obligation. The Company's revenue recognition policy, which requires significant judgments and estimates, is fully described in "Notes to the Consolidated Financial Statements—
2
. Summary of Significant Accounting Policies" included in "Item 18. Financial Statements", except for practical expedients and exemptions used which are discussed below.
33
Practical Expedients and Exemptions
The Company reports revenue net of any revenue-based taxes assessed by governmental authorities that are imposed on and concurrent with specific revenue-producing transactions.
The Company generally expenses sales commissions when incurred because the amortization period would have been one year or less. These costs are recorded within selling, general and administrative expenses in its consolidated statements of operations. For certain of the Company's long-term contracts, it capitalizes and amortizes incremental costs of obtaining a contract (e.g., sales commissions) on a straight-line basis over the expected customer relationship period if it expects to recover those costs.
The Company does not account for significant financing components if the period between when it transfers the promised service or product to the customer and when the customer pays for that service or product will be one year or less.
The Company does not disclose the value of unsatisfied performance obligations for (i) contracts with an original expected length of one year or less and (ii) contracts for which it recognizes revenue at the amount that it has the right to invoice for services performed.
Goodwill, Intangible Assets and Long-Lived Assets
The process of evaluating potential impairments related to goodwill, intangible assets other than goodwill and long-lived assets requires the application of significant judgment. If an event occurs that would cause revisions to the estimates and assumptions used in analyzing the fair value of goodwill, intangible assets other than goodwill and long-lived assets, the revision could result in a non-cash impairment loss that could have a material impact on financial results.
Historically, goodwill and indefinite lived assets have been tested for impairment annually on November 1, or on an interim basis if facts or circumstances indicate that they may be impaired. In 2018, the Company changed its impairment valuation testing date from November 1 to December 31. The Company changed the valuation date to better align with the timing and completion of the Company’s forecasting process. The change did not delay, accelerate, or avoid an impairment charge. The change has been applied prospectively which resulted in the Company performing two impairment tests during the fourth quarter of 2018 (November 1 and December 31).
Goodwill
Goodwill is reviewed for impairment using either a qualitative assessment or a quantitative one-step process (following the Company's adoption of ASU 2017-04,
Intangibles-Goodwill and Other (Topic 350): Simplifying the Test for Goodwill Impairment
on January 1, 2017).
Goodwill is tested for impairment at the reporting unit level, which is one level below or the same level as an operating segment. The Company has four reporting units (which are equivalent to its segments) at
December 31, 2018
as follows:
|
•
|
North America Gaming and Interactive
|
|
•
|
North America Lottery
|
|
•
|
International
|
|
•
|
Italy
|
The Company's goodwill impairment test compares the fair value of a reporting unit with its carrying amount and an impairment loss is recognized for the amount by which the carrying amount exceeds the reporting unit's fair value, not to exceed the total amount of goodwill allocated to that reporting unit.
In performing the goodwill impairment test, the Company estimates the fair value of the reporting units using an income approach that analyzes projected discounted cash flows. The procedures the Company follows include, but are not limited to, the following:
|
•
|
Analysis of the conditions in, and the economic outlook for, the reporting units;
|
|
•
|
Analysis of general market data, including economic, governmental, and environmental factors;
|
|
•
|
Review of the history, current state, and future operations of the reporting units;
|
|
•
|
Analysis of financial and operating projections based on historical operating results, industry results and expectations;
|
|
•
|
Analysis of financial, transactional and trading data for companies engaged in similar lines of business to develop appropriate valuation multiples and operating comparisons; and
|
34
|
•
|
Calculation of the Company's market capitalization, total invested capital, the implied market participant acquisition premium, and supporting qualitative and quantitative analysis.
|
Under the income approach, fair value of the reporting units is determined based on the present value of each unit's estimated future cash flows, discounted at an appropriate risk-adjusted rate. The Company uses internal forecasts to estimate future cash flows and estimates long-term future growth rates based on internal projections of the long-term outlook for each reporting unit. Actual results may differ from those assumed in forecasts. The discount rates are based on a weighted average cost of capital analysis computed by calculating the after-tax cost of debt and the cost of equity and then weighted based on the concluded capital structure of the respective reporting unit. The Company uses discount rates that are commensurate with the risks and uncertainty inherent in each reporting unit and in internally developed forecasts. Discount rates used in the reporting unit valuations ranged from 7.40% to 10.15%.
Estimating the fair value of reporting units requires the Company's management to use its judgment in making estimates and making forecasts that are based on a number of factors including future cash flows, growth rates, market comparables, perpetual growth rates, weighted average cost of capital, and actual operating results. As with all forecasts, it is possible that the judgments and estimates described above may change in future periods.
Annual Tests
The Company performed quantitative assessments on all four reporting units.
The quantitative assessments for the North America Lottery and Italy reporting units did not result in an impairment. The carrying amount for the North America Lottery and Italy reporting units substantially exceeded their carrying amounts, which the Company believes to be 20% or more.
The Company determined that there was an impairment in the International reporting unit’s goodwill due to the results of 2018 being lower than forecasted along with a higher weighted average cost of capital. A
$118.0 million
non-cash goodwill impairment loss with no income tax benefit was recorded to reduce the carrying amount of the International reporting unit to fair value. The goodwill remaining in the International reporting unit after the impairment was
$1.423 billion
for the year ended
December 31, 2018
. The impairment loss had no impact on the Company’s cash flows, ability to service debt, compliance with financial covenants, or underlying liquidity. The Company's fundamental outlook for the International reporting unit has not changed, and expectations for growth remain similar to the prior year with the International reporting unit growing from a lower base.
In calculating the fair value of the International reporting unit using the income approach, the following estimates and assumptions were also used in the discounted cash flow analysis:
|
•
|
A normalized growth rate of 3.00% based on the estimated sustainable long-term growth rate for the reporting unit;
|
|
•
|
A normalized operating EBITDA margin percentage was estimated based on a review of average margins within the projection period;
|
|
•
|
Normalized capital expenditure requirements were estimated based on a review of historical and projected capital expenditures and typical replacement cycles; and
|
|
•
|
A discount rate of 10.15% based on the weighted average cost of capital.
|
As a result of the impairment tests performed in the fourth quarter of 2018, the North America Gaming and Interactive reporting unit had fair value exceeding carrying value of $127.0 million or 4.4%. The key assumptions used in the determination of the North America Gaming and Interactive reporting unit’s fair value are as follows:
|
•
|
A normalized growth rate of 2.50% based on the estimated sustainable long-term growth rate for the reporting unit;
|
|
•
|
A normalized operating EBITDA margin percentage was estimated based on a review of average margins within the projection period;
|
|
•
|
Normalized capital expenditure requirements were estimated based on a review of historical and projected capital expenditures and typical replacement cycles; and
|
|
•
|
A discount rate of 8.50% based on the weighted average cost of capital.
|
Goodwill for the North America Gaming and Interactive reporting unit was
$1.440 billion
for the year ended
December 31, 2018
.
A
$714.0 million
goodwill impairment loss was recorded in
2017
in the North America Gaming and Interactive reporting unit as the long-term strategy of improving content and game performance to stabilize and then grow market share was taking longer than expected. The Company expects improved results for the North America Gaming and Interactive reporting unit as the Company
35
brings new games and hardware to the market and the Company's expectation for long-term growth remains similar, but the North American Gaming and Interactive reporting unit will be growing from a lower base. There were no goodwill impairment losses recorded in
2016
.
Indefinite-Lived Intangible Assets
The Company first performs a qualitative assessment to determine whether it is more likely than not that the fair value of indefinite-lived intangible assets are less than their carrying amount and whether the quantitative analysis is necessary. The quantitative analysis compares the fair value of indefinite-lived intangible assets to their carrying amount and an impairment loss is recognized when the carrying amount exceeds the fair value. The annual tests performed in
2018
and
2017
did not result in impairment losses. The annual test performed for
2016
resulted in an impairment loss of
$30.0 million
in the North America Gaming and Interactive segment for certain indefinite-lived trademarks relating to the forecasted slowing of growth in the social gaming market.
Long-Lived Assets
Long-lived assets, including definite-lived intangible assets and other assets, are evaluated for impairment whenever events or changes in circumstances indicate that the carrying amount of the assets or asset groups may not be recoverable. Events or changes in circumstances that could result in an impairment review include, but are not limited to, significant underperformance relative to historical or projected future operating results, significant changes in the manner of use of the acquired assets or the overall business strategy and significant negative industry or economic trends. An impairment is recognized when the asset is not recoverable and the carrying amount of the asset exceeds its fair value as calculated on an undiscounted cash flow basis. The Company recorded impairment losses related to long-lived assets of
$2.4 million
,
$1.2 million
and
$7.7 million
for the years ended
December 31, 2018
,
2017
and
2016
, respectively.
Legal and Other Contingencies
From time to time, the Company is party to legal, regulatory or administrative proceedings regarding, among other matters, claims by and against the Company, injunctions by third parties arising out of the ordinary course of business and investigations and compliance inquiries related to ongoing operations. The outcome of these proceedings and similar future proceedings cannot be predicted with certainty. It is difficult to accurately estimate the outcome of any proceeding. As such, the amounts of the provision for litigation risk, which has been accrued on the basis of assessments made by external counsel, could vary significantly from the amounts which the Company would ultimately be obligated to pay or agree to pay to settle any such proceeding. In addition, unfavorable resolution of or significant delay in adjudicating such proceedings could require the Company to pay substantial monetary damages or penalties and/or incur costs which may exceed any provision for litigation risks or, under certain circumstances, cause the termination or revocation of the relevant license or authorization, and thereby have a material adverse effect on the consolidated results of operations, business, financial condition or prospects.
Income Taxes
The Company records a tax provision for the anticipated tax consequences of its reported operating results. The provision for income taxes is computed using the asset and liability method, under which deferred tax assets and liabilities are recognized for the expected future tax consequences of temporary differences between the financial reporting and tax bases of assets and liabilities, and for operating losses and tax credit carryforwards. Deferred tax assets and liabilities are measured using the currently enacted tax rates that apply to the taxable income in effect for the years in which those assets and liabilities are expected to be realized and settled. The Company records a valuation allowance to reduce deferred tax assets to the amount that is believed more likely than not to be realized.
The Company recognizes tax benefits from uncertain tax positions only if it is more likely than not that the tax position will be sustained on examination by the taxing authorities, based on the technical merits of the position. The tax benefits recognized in the financial statements from such positions are then measured based upon the largest benefit that has a greater than 50% likelihood of being realized upon ultimate settlement.
Management believes it is more likely than not that forecasted income, including income that may be generated as a result of certain tax planning strategies, together with future reversals of existing taxable temporary differences, will be sufficient to fully recover the deferred tax assets not otherwise subject to a valuation allowance. In the event that the Company determines all or part of the deferred tax assets are not realizable in the future, the Company will record an adjustment to the valuation allowance that would be charged to earnings in the period such determination is made. In addition, the calculation of tax liabilities involves significant judgment in estimating the impact of uncertainties in the application of GAAP and complex tax laws.
36
On December 22, 2017, the Tax Cuts and Jobs Act (the "Tax Act") was enacted. The Tax Act included significant and comprehensive changes to existing tax laws, including a permanent reduction in the federal corporate income tax rate. The SEC issued guidance under SAB 118 that allowed companies to record provisional amounts for the impacts of U.S. tax reform for up to one year from the date of enactment for provisions of the Tax Act where companies did not have the necessary information available, prepared or analyzed (including computations) in reasonable detail to complete the accounting for certain income tax effects of the Tax Act. In the fourth quarter of 2018, the Company completed its analysis to determine the effect of the Tax Act and recorded immaterial adjustments as of December 31, 2018. While SAB 118 no longer applies, the legislation is unclear in many respects and will require clarification and interpretation by the U.S. Treasury Department and the IRS in the form of amendments, technical corrections, regulations, or other forms of guidance, any of which could either lessen or increase the effect of the legislation on the Company or its shareholders. The outcome of this legislation on state and local tax authorities, and the response by such authorities, is also unclear. The Company continues to monitor changes made to the federal tax law and its potential effect on the Company.
Allowance for Credit Losses
The Company maintains an allowance for credit losses for the estimated probable losses on uncollectible trade and customer financing receivables. The allowance is estimated based upon the credit-worthiness of its customers, historical experience and aging analysis, as well as current market and economic conditions. Receivables are written off against these allowances in the period they are determined to be uncollectible.
The Company determines its allowances for credit losses on customer financing receivables based on
two
classes: contracts and notes. Contracts include extended payment terms granted to qualifying customers for periods from
one
to
six
years and are typically secured by the related products sold. Notes consist of development financing loans granted to select customers to assist in the funding of new or expanding gaming facilities, generally under terms of
one
to
seven
years, and are secured by the developed property and/or other customer assets. Customer financing interest income is recognized based on market rates prevailing at issuance.
Consolidated Results
The discussion below includes information calculated at constant currency. The Company calculates constant currency by applying the prior-year exchange rates to current financial data expressed in local currency in order to eliminate the impact of foreign exchange rate fluctuations originating from translating the income statement of the Company's foreign entities into U.S. dollars. These constant currency measures are non-GAAP measures. Although the Company does not believe that these measures are a substitute for GAAP measures, it does believe that such results excluding the impact of currency fluctuations period-on-period provide additional useful information to investors regarding operating performance on a local currency basis.
37
Comparison of the years ended
December 31, 2018
,
2017
and
2016
|
|
For the year ended
|
|||||||||||||||||
|
|
December 31, 2018
|
December 31, 2017
|
December 31, 2016
|
|||||||||||||||
|
($ thousands)
|
$
|
% of
Revenue
|
$
|
% of
Revenue
|
$
|
% of
Revenue |
||||||||||||
|
Service revenue
|
4,046,314
|
|
83.8
|
|
4,136,556
|
|
83.8
|
|
4,375,586
|
|
84.9
|
|
||||||
|
Product sales
|
784,942
|
|
16.2
|
|
802,403
|
|
16.2
|
|
778,310
|
|
15.1
|
|
||||||
|
Total revenue
|
4,831,256
|
|
100.0
|
|
4,938,959
|
|
100.0
|
|
5,153,896
|
|
100.0
|
|
||||||
|
Cost of services
|
2,450,658
|
|
50.7
|
|
2,553,083
|
|
51.7
|
|
2,553,479
|
|
49.5
|
|
||||||
|
Cost of product sales
|
491,030
|
|
10.2
|
|
579,431
|
|
11.7
|
|
582,358
|
|
11.3
|
|
||||||
|
Selling, general and administrative
|
844,059
|
|
17.5
|
|
816,093
|
|
16.5
|
|
945,824
|
|
18.4
|
|
||||||
|
Research and development
|
263,279
|
|
5.4
|
|
313,088
|
|
6.3
|
|
343,531
|
|
6.7
|
|
||||||
|
Restructuring expense
|
14,781
|
|
0.3
|
|
39,876
|
|
0.8
|
|
27,934
|
|
0.5
|
|
||||||
|
Impairment loss
|
120,407
|
|
2.5
|
|
715,220
|
|
14.5
|
|
37,744
|
|
0.7
|
|
||||||
|
Transaction expense (income), net
|
51
|
|
—
|
|
(26,740
|
)
|
(0.5
|
)
|
2,590
|
|
0.1
|
|
||||||
|
Total operating expenses
|
4,184,265
|
|
86.6
|
|
4,990,051
|
|
101.0
|
|
4,493,460
|
|
87.2
|
|
||||||
|
Operating income (loss)
|
646,991
|
|
13.4
|
|
(51,092
|
)
|
(1.0
|
)
|
660,436
|
|
12.8
|
|
||||||
|
Interest income
|
14,231
|
|
0.3
|
|
10,436
|
|
0.2
|
|
12,840
|
|
0.2
|
|
||||||
|
Interest expense
|
(431,618
|
)
|
(8.9
|
)
|
(458,899
|
)
|
(9.3
|
)
|
(469,268
|
)
|
(9.1
|
)
|
||||||
|
Foreign exchange gain (loss), net
|
129,051
|
|
2.7
|
|
(443,977
|
)
|
(9.0
|
)
|
101,040
|
|
2.0
|
|
||||||
|
Other (expense) income, net
|
(54,607
|
)
|
(1.1
|
)
|
(33,393
|
)
|
(0.7
|
)
|
18,365
|
|
0.4
|
|
||||||
|
Total non-operating expenses
|
(342,943
|
)
|
(7.1
|
)
|
(925,833
|
)
|
(18.7
|
)
|
(337,023
|
)
|
(6.5
|
)
|
||||||
|
Income (loss) before provision for (benefit from) income taxes
|
304,048
|
|
6.3
|
|
(976,925
|
)
|
(19.8
|
)
|
323,413
|
|
6.3
|
|
||||||
|
Provision for (benefit from) income taxes
|
189,401
|
|
3.9
|
|
(29,414
|
)
|
(0.6
|
)
|
59,206
|
|
1.1
|
|
||||||
|
Net income (loss)
|
114,647
|
|
2.4
|
|
(947,511
|
)
|
(19.2
|
)
|
264,207
|
|
5.1
|
|
||||||
|
Less: Net income attributable to non-controlling interests
|
115,671
|
|
2.4
|
|
55,400
|
|
1.1
|
|
45,413
|
|
0.9
|
|
||||||
|
Less: Net income attributable to redeemable non-controlling interests
|
20,326
|
|
0.4
|
|
65,665
|
|
1.3
|
|
7,457
|
|
0.1
|
|
||||||
|
Net (loss) income attributable to IGT PLC
|
(21,350
|
)
|
(0.4
|
)
|
(1,068,576
|
)
|
(21.6
|
)
|
211,337
|
|
4.1
|
|
||||||
38
Service revenue
|
|
For the year ended December 31,
|
$ Change
|
|||||||||||||||||||
|
($ thousands)
|
2018
|
2017
|
2016
|
2018 vs. 2017
|
2017 vs. 2016
|
||||||||||||||||
|
$
|
%
|
$
|
%
|
||||||||||||||||||
|
North America Gaming and Interactive
|
624,476
|
|
780,633
|
|
975,206
|
|
(156,157
|
)
|
(20.0
|
)
|
(194,573
|
)
|
(20.0
|
)
|
|||||||
|
North America Lottery
|
1,111,069
|
|
1,093,048
|
|
1,128,306
|
|
18,021
|
|
1.6
|
|
(35,258
|
)
|
(3.1
|
)
|
|||||||
|
International
|
495,497
|
|
557,049
|
|
512,668
|
|
(61,552
|
)
|
(11.0
|
)
|
44,381
|
|
8.7
|
|
|||||||
|
Italy
|
1,814,549
|
|
1,703,901
|
|
1,759,843
|
|
110,648
|
|
6.5
|
|
(55,942
|
)
|
(3.2
|
)
|
|||||||
|
Operating Segments
|
4,045,591
|
|
4,134,631
|
|
4,376,023
|
|
(89,040
|
)
|
(2.2
|
)
|
(241,392
|
)
|
(5.5
|
)
|
|||||||
|
Corporate support
|
—
|
|
1,203
|
|
—
|
|
(1,203
|
)
|
(100.0
|
)
|
1,203
|
|
-
|
|
|||||||
|
Purchase accounting
|
723
|
|
722
|
|
(437
|
)
|
1
|
|
0.1
|
|
1,159
|
|
> 200.0
|
|
|||||||
|
|
4,046,314
|
|
4,136,556
|
|
4,375,586
|
|
(90,242
|
)
|
(2.2
|
)
|
(239,030
|
)
|
(5.5
|
)
|
|||||||
The following table sets forth constant currency changes in service revenue:
|
|
Constant Currency Change
|
|||||||||||
|
2018 vs. 2017
|
2017 vs. 2016
|
|||||||||||
|
($ thousands)
|
$
|
%
|
$
|
%
|
||||||||
|
North America Gaming and Interactive
|
(155,998
|
)
|
(20.0
|
)
|
(194,458
|
)
|
(19.9
|
)
|
||||
|
North America Lottery
|
18,314
|
|
1.7
|
|
(35,865
|
)
|
(3.2
|
)
|
||||
|
International
|
(60,249
|
)
|
(10.8
|
)
|
47,386
|
|
9.2
|
|
||||
|
Italy
|
46,111
|
|
2.7
|
|
(108,838
|
)
|
(6.2
|
)
|
||||
|
Operating Segments
|
(151,822
|
)
|
(3.7
|
)
|
(291,775
|
)
|
(6.7
|
)
|
||||
|
Corporate support
|
—
|
|
—
|
|
1,203
|
|
—
|
|
||||
|
Purchase accounting
|
—
|
|
—
|
|
1,159
|
|
>200.0
|
|
||||
|
|
(151,822
|
)
|
(3.7
|
)
|
(289,413
|
)
|
(6.6
|
)
|
||||
North America Gaming and Interactive
The following table sets forth changes in service revenue in the North America Gaming and Interactive segment:
|
|
Service Revenue Change
|
|||||||||||
|
2018 vs. 2017
|
2017 vs. 2016
|
|||||||||||
|
($ thousands)
|
Constant
Currency |
$ Change
|
Constant
Currency |
$ Change
|
||||||||
|
Social gaming
|
(111,267
|
)
|
(111,267
|
)
|
(167,016
|
)
|
(167,581
|
)
|
||||
|
Machine gaming
|
(67,577
|
)
|
(67,742
|
)
|
(37,321
|
)
|
(36,897
|
)
|
||||
|
Other services
|
22,846
|
|
22,852
|
|
9,879
|
|
9,905
|
|
||||
|
|
(155,998
|
)
|
(156,157
|
)
|
(194,458
|
)
|
(194,573
|
)
|
||||
The principal drivers of the
$156.0 million
constant currency
decrease
in service revenue
for the year ended December 31, 2018
compared
to the year ended December 31, 2017
were as follows:
|
•
|
A
decrease
of
$111.3 million
in
Social gaming
, principally associated with the June 2017 sale of DoubleDown;
|
|
•
|
A
decrease
of
$67.6 million
in
Machine gaming
, primarily driven by a $58.4 million reclassification of jackpot expense from cost of services upon adoption of ASC 606 and a decrease in the average yield from overall machine mix, partially offset by a 1.3% increase in the casino installed base (23,108 machines installed at
December 31, 2018
compared to 22,807 machines installed at
December 31, 2017
); and
|
|
•
|
An
increase
of
$22.8 million
in
Other services
, principally due to:
|
|
◦
|
An increase of $11.7 million in poker revenue, primarily due to a large, multi-year poker contract; and
|
|
◦
|
An increase of $10.1 million in interactive, principally due to a content licensing and support agreement entered into in June 2017.
|
39
The principal drivers of the
$194.5 million
constant currency
decrease
in service revenue
for the year ended December 31, 2017
compared
to the year ended December 31, 2016
were as follows:
|
•
|
A
decrease
of
$167.0 million
in
Social gaming
associated with a decrease in service revenue of
$149.2 million
related to the June 2017 sale of DoubleDown, along with a decrease in service revenue from a lower volume of chips wagered; and
|
|
•
|
A
decrease
of
$37.3 million
in
Machine gaming
, principally associated with a
6.8%
decrease in the casino installed base (
24,472
machines installed at December 31, 2016 compared to
22,807
machines installed at December 31, 2017) and a decrease in the average yield.
|
North America Lottery
The following table sets forth changes in service revenue in the North America Lottery segment:
|
|
Service Revenue Change
|
|||||||||||
|
2018 vs. 2017
|
2017 vs. 2016
|
|||||||||||
|
($ thousands)
|
Constant
Currency |
$ Change
|
Constant
Currency |
$ Change
|
||||||||
|
Operating and Facilities Management Contracts
|
42,654
|
|
42,657
|
|
(22,116
|
)
|
(22,103
|
)
|
||||
|
Lottery Management Agreements
|
(27,988
|
)
|
(27,988
|
)
|
(16,958
|
)
|
(16,958
|
)
|
||||
|
Machine gaming
|
182
|
|
182
|
|
(374
|
)
|
(375
|
)
|
||||
|
Other services
|
3,466
|
|
3,170
|
|
3,583
|
|
4,178
|
|
||||
|
|
18,314
|
|
18,021
|
|
(35,865
|
)
|
(35,258
|
)
|
||||
The principal drivers of the
$18.3 million
constant currency
increase
in service revenue
for the year ended December 31, 2018
compared
to the year ended December 31, 2017
were as follows:
|
•
|
An
increase
of
$42.7 million
in
Operating and Facilities Management Contracts
, primarily related to strong same store revenue (revenue from existing customers as opposed to new customers) growth of 8.9%, primarily due to an increase of 34.0% in multi-state jackpot activity and an increase of 5.0% in instant tickets and draw-based games, partially offset by a lower effective rate due to certain recent contract extensions; and
|
|
•
|
A
decrease
of
$28.0 million
in
Lottery Management Agreements
("LMA"), principally due to a $39.1 million decrease in pass-through service revenue related to reimbursable expenses due to the end of the Illinois LMA contract; partially offset by an $11.1 million increase in the level of LMA incentives achieved in the year ended December 31, 2018 compared
to the year ended December 31, 2017
.
|
The principal drivers of the
$35.9 million
constant currency
decrease
in service revenue
for the year ended December 31, 2017
compared
to the year ended December 31, 2016
were as follows:
|
•
|
A
decrease
in
Operating and Facilities Management Contracts
of
$22.1 million
, principally driven by lower service revenue related to the record multi-state jackpot activity in 2016, partially offset by an increase in same store revenue of
5.1%
from an increase in instant tickets and other draw-based games; and
|
|
•
|
A
decrease
in
Lottery Management Agreements
of
$17.0 million
in 2017, primarily related to a decrease in pass-through service revenue related to reimbursable expenses, and a
$1.7 million
decrease in incentives from the New Jersey LMA contract.
|
International
The following table sets forth changes in service revenue in the International segment:
|
|
Service Revenue Change
|
|||||||||||
|
2018 vs. 2017
|
2017 vs. 2016
|
|||||||||||
|
($ thousands)
|
Constant
Currency |
$ Change
|
Constant
Currency |
$ Change
|
||||||||
|
Operating and Facilities Management Contracts
|
(6,952
|
)
|
(4,732
|
)
|
23,615
|
|
18,535
|
|
||||
|
Machine gaming
|
5,898
|
|
2,177
|
|
830
|
|
670
|
|
||||
|
Other services
|
(59,195
|
)
|
(58,997
|
)
|
22,941
|
|
25,176
|
|
||||
|
|
(60,249
|
)
|
(61,552
|
)
|
47,386
|
|
44,381
|
|
||||
40
The principal drivers of the
$60.2 million
constant currency
decrease
in service revenue
for the year ended December 31, 2018
compared
to the year ended December 31, 2017
were as follows:
|
•
|
A
decrease
of
$59.2 million
in
Other services
, principally due to:
|
|
◦
|
A decrease of $19.1 million in software revenue, primarily related to Europe, partially due to a $9.7 million decrease as a result of licenses being identified as distinct performance obligations and recognized in product sales in the current year in connection with ASC 606;
|
|
◦
|
A decrease of $14.8 million in Interactive Business-to-Business and Business-to-Consumer activities, primarily due to the release of a prior year jackpot liability and the exit from certain low-margin contracts:
|
|
◦
|
A decrease of $12.9 million in megajackpot revenue, primarily related to the $8.4 million reclassification of jackpot expense from cost of services upon adoption of ASC 606; and
|
|
◦
|
A decrease of $10.7 million from a customer in Europe, principally related to the achievement of certain contractual milestones that did not recur in the current year.
|
The principal drivers of the
$47.4 million
constant currency
increase
in service revenue
for the year ended December 31, 2017
compared
to the year ended December 31, 2016
were as follows:
|
•
|
An
increase
of
$23.6 million
in
Operating and Facilities Management Contracts
driven by a
$23.0 million
increase in service revenue from a customer in Europe principally related to the achievement of certain contractual milestones; and
|
|
•
|
An
increase
of
$22.9 million
in
Other services
, principally associated with:
|
|
◦
|
An increase of $13.0 million from VLT software service revenue from a customer in Europe, principally related to the achievement of certain contractual milestones;
|
|
◦
|
An increase of $6.3 million in Interactive Business-to-Business and Business-to-Consumer activities, primarily related to the release of a jackpot liability during the year ended December 31, 2017, partially offset by the exit from certain low margin contracts; and
|
|
◦
|
An increase of $4.3 million from the launch of the Greece VLT program.
|
Italy
The following table sets forth constant currency changes in service revenue in the Italy segment:
|
|
Service Revenue Change
|
|||||||||||
|
2018 vs. 2017
|
2017 vs. 2016
|
|||||||||||
|
($ thousands)
|
Constant
Currency |
$ Change
|
Constant
Currency |
$ Change
|
||||||||
|
Operating and Facilities Management Contracts
|
43,059
|
|
71,667
|
|
(140,831
|
)
|
(118,793
|
)
|
||||
|
Machine gaming
|
(3,372
|
)
|
19,652
|
|
6,878
|
|
26,177
|
|
||||
|
Other services
|
6,424
|
|
19,329
|
|
25,115
|
|
36,674
|
|
||||
|
|
46,111
|
|
110,648
|
|
(108,838
|
)
|
(55,942
|
)
|
||||
The constant currency movements in service revenue for each of the core activities within the Italy segment are discussed below.
41
Operating and Facilities Management Contracts
The following table sets forth constant currency changes in Operating and Facilities Management Contracts:
|
|
Constant Currency Change
|
||||||||||
|
2018 vs. 2017
|
2017 vs. 2016
|
||||||||||
|
($ thousands)
|
$
|
%
|
$
|
%
|
|||||||
|
Lotto
|
37,868
|
|
9.1
|
(145,334
|
)
|
(26.4
|
)
|
||||
|
Instant tickets
|
5,191
|
|
1.7
|
4,503
|
|
1.6
|
|
||||
|
43,059
|
|
6.0
|
(140,831
|
)
|
(16.8
|
)
|
|||||
Lotto
At constant currency, Lotto revenue
for the year ended December 31, 2018
increase
d by
$37.9 million
compared
to the year ended December 31, 2017
, principally due to an increase of
11.0%
in 10eLotto wagers as a result of an additional game option, Doppio Numero Oro, which launched in October 2017.
At constant currency, Lotto revenue
for the year ended December 31, 2017
decrease
d by
$145.3 million
compared
to the year ended December 31, 2016
, principally due to
€85.6 million
($94.4 million) of service revenue amortization associated with the €770.0 million upfront payment related to the new lotto license in 2016, a reduction in the fee earned (which is a fixed percentage of wagers under the new concession) and a decrease in wagers for late numbers (one of the 90 numbers of the Lotto game in Italy that has not been drawn for 100 drawings), partially offset by a
9.4%
increase
in 10eLotto wagers.
Wagers for the years ended December 31, 2018, 2017 and 2016 are as follows:
|
|
For the year ended December 31,
|
€ Change
|
|||||||||||||||||||
|
(€ millions)
|
2018
|
2017
|
2016
|
2018 vs. 2017
|
2017 vs. 2016
|
||||||||||||||||
|
€
|
%
|
€
|
%
|
||||||||||||||||||
|
10eLotto wagers
|
5,728
|
|
5,160
|
|
4,716
|
|
568
|
|
11.0
|
|
444
|
|
9.4
|
|
|||||||
|
Core wagers
|
1,877
|
|
2,011
|
|
2,227
|
|
(134
|
)
|
(6.7
|
)
|
(216
|
)
|
(9.7
|
)
|
|||||||
|
Wagers for late numbers
|
227
|
|
310
|
|
1,150
|
|
(83
|
)
|
(26.8
|
)
|
(840
|
)
|
(73.0
|
)
|
|||||||
|
Million day
|
185
|
|
—
|
|
—
|
|
185
|
|
—
|
|
—
|
|
—
|
|
|||||||
|
|
8,017
|
|
7,481
|
|
8,093
|
|
536
|
|
7.2
|
|
(612
|
)
|
(7.6
|
)
|
|||||||
Instant tickets
At constant currency, Instant tickets revenue
for the year ended December 31, 2018
increase
d by
$5.2 million
compared
to the year ended December 31, 2017
, principally driven by a
1.6%
increase
in instant ticket wagers assisted by a
1.8%
increase
in the average price point (the average value of the ticket sold), as a result of the July 2017 relaunch of Miliardario.
At constant currency, Instant tickets revenue
for the year ended December 31, 2017
increase
d by
$4.5 million
compared
to the year ended December 31, 2016
, principally due to a
3.1%
increase
in the number of tickets sold, which was partially offset by a
1.6%
decrease
in the average price point (the average value of the ticket sold).
Total wagers for the years ended December 31, 2018, 2017 and 2016 are as follows:
|
|
For the year ended December 31,
|
€ Change
|
|||||||||||||||||
|
(€ millions)
|
2018
|
2017
|
2016
|
2018 vs. 2017
|
2017 vs. 2016
|
||||||||||||||
|
€
|
%
|
€
|
%
|
||||||||||||||||
|
Total wagers
|
9,207
|
|
9,065
|
|
8,935
|
|
142
|
|
1.6
|
130
|
|
1.5
|
|||||||
42
Machine gaming
At constant currency, Machine gaming
for the year ended December 31, 2018
decrease
d by
$3.4 million
compared
to the year ended December 31, 2017
, primarily driven by a decrease in total machines installed due to a regulator-mandated reduction in AWP machines and an increase in gaming machine
taxes related to the Prelievo Unico Erariale ("PREU") increase in April 2017 and September 2018 (PREU AWP increased on annual basis from 18.52% to 19.09% and PREU VLT increased on annual basis from 5.84% to 6.09%), partially offset by an increase of
0.7%
on wagers driven by VLT.
At constant currency, Machine gaming
for the year ended December 31, 2017
increase
d by
$6.9 million
compared
to the year ended December 31, 2016
. Increased vertical integration in 2017 drove increased service revenues, which were partially offset by the
1.6%
decrease
in total machine gaming wagers and an increase in gaming machine taxes that went into effect at the end of April 2017.
Total wagers for the years ended December 31, 2018, 2017 and 2016 are as follows:
|
|
For the year ended December 31,
|
€ Change
|
|||||||||||||||||||
|
2018
|
2017
|
2016
|
2018 vs. 2017
|
2017 vs. 2016
|
|||||||||||||||||
|
(€ millions)
|
€
|
%
|
€
|
%
|
|||||||||||||||||
|
VLT wagers
|
5,838
|
|
5,543
|
|
5,460
|
|
295
|
|
5.3
|
|
83
|
|
1.5
|
|
|||||||
|
AWP wagers
|
3,717
|
|
3,949
|
|
4,188
|
|
(232
|
)
|
(5.9
|
)
|
(239
|
)
|
(5.7
|
)
|
|||||||
|
Total wagers
|
9,555
|
|
9,492
|
|
9,648
|
|
63
|
|
0.7
|
|
(156
|
)
|
(1.6
|
)
|
|||||||
Total wagers and machines installed correspond to the management of VLTs and AWPs under the Company's licenses.
Other services
At constant currency, Other services
for the year ended December 31, 2018
increased by
$6.4 million
compared
to the year ended December 31, 2017
, primarily driven by an
8.3%
increase in interactive game wagers (
€1,890.0 million
for the year ended December 31, 2018
compared to
€1,745 million
for the year ended December 31, 2017
), a
3.0%
increase in sports betting wagers (
€988.0 million
for the year ended December 31, 2018
compared to
€959.0 million
for the year ended December 31, 2017
) and a slightly lower combined payout in sports betting (
82.4%
for the year ended December 31, 2018
compared to
82.7%
for the year ended December 31, 2017
).
At constant currency, Other services
for the year ended December 31, 2017
increased by
$25.1 million
compared
to the year ended December 31, 2016
, driven primarily by a
5.2%
increase in interactive game wagers (
€1,745.0 million
for the year ended December 31, 2017
compared to
€1,659.0 million
for the year ended December 31, 2016
), a
12.2%
increase in sports betting wagers (
€959.0 million
for the year ended December 31, 2017
compared to
€855.0 million
for the year ended December 31, 2016
) and a lower combined payout in sports betting (
82.7%
for the year ended December 31, 2017
compared to
84.0%
to the year ended December 31, 2016
).
Product sales
|
|
For the year ended December 31,
|
$ Change
|
|||||||||||||||||||
|
($ thousands)
|
2018
|
2017
|
2016
|
2018 vs. 2017
|
2017 vs. 2016
|
||||||||||||||||
|
$
|
%
|
$
|
%
|
||||||||||||||||||
|
North America Gaming and Interactive
|
378,693
|
|
377,065
|
|
398,248
|
|
1,628
|
|
0.4
|
|
(21,183
|
)
|
(5.3
|
)
|
|||||||
|
North America Lottery
|
80,833
|
|
92,174
|
|
65,269
|
|
(11,341
|
)
|
(12.3
|
)
|
26,905
|
|
41.2
|
|
|||||||
|
International
|
324,486
|
|
332,015
|
|
314,637
|
|
(7,529
|
)
|
(2.3
|
)
|
17,378
|
|
5.5
|
|
|||||||
|
Italy
|
930
|
|
1,149
|
|
1,295
|
|
(219
|
)
|
(19.1
|
)
|
(146
|
)
|
(11.3
|
)
|
|||||||
|
Operating Segments
|
784,942
|
|
802,403
|
|
779,449
|
|
(17,461
|
)
|
(2.2
|
)
|
22,954
|
|
2.9
|
|
|||||||
|
Purchase accounting
|
—
|
|
—
|
|
(1,139
|
)
|
—
|
|
-
|
|
1,139
|
|
100.0
|
|
|||||||
|
|
784,942
|
|
802,403
|
|
778,310
|
|
(17,461
|
)
|
(2.2
|
)
|
24,093
|
|
3.1
|
|
|||||||
43
The following table sets forth constant currency changes in product sales:
|
|
Constant Currency Change
|
|||||||||||
|
2018 vs. 2017
|
2017 vs. 2016
|
|||||||||||
|
($ thousands)
|
$
|
%
|
$
|
%
|
||||||||
|
North America Gaming and Interactive
|
3,830
|
|
1.0
|
|
(21,958
|
)
|
(5.5
|
)
|
||||
|
North America Lottery
|
(11,417
|
)
|
(12.4
|
)
|
26,075
|
|
40.0
|
|
||||
|
International
|
(4,467
|
)
|
(1.3
|
)
|
11,198
|
|
3.6
|
|
||||
|
Italy
|
(239
|
)
|
(20.8
|
)
|
(154
|
)
|
(11.9
|
)
|
||||
|
Operating Segments
|
(12,293
|
)
|
(1.5
|
)
|
15,161
|
|
1.9
|
|
||||
|
Purchase accounting
|
—
|
|
—
|
|
1,139
|
|
(100.0
|
)
|
||||
|
|
(12,293
|
)
|
(1.5
|
)
|
16,300
|
|
2.1
|
|
||||
North America Gaming and Interactive
The following table sets forth changes in product sales in the North America Gaming and Interactive segment:
|
|
Product Sales Change
|
|||||||||||
|
2018 vs. 2017
|
2017 vs. 2016
|
|||||||||||
|
($ thousands)
|
Constant
Currency |
$ Change
|
Constant
Currency |
$ Change
|
||||||||
|
Gaming machines
|
19,823
|
|
17,864
|
|
(5,879
|
)
|
(5,596
|
)
|
||||
|
Systems and other
|
(15,993
|
)
|
(16,236
|
)
|
(16,079
|
)
|
(15,587
|
)
|
||||
|
|
3,830
|
|
1,628
|
|
(21,958
|
)
|
(21,183
|
)
|
||||
The principal drivers of the
$3.8 million
constant currency
increase
in product sales
for the year ended December 31, 2018
compared
to the year ended December 31, 2017
were as follows:
|
•
|
An
increase
of
$19.8 million
in
Gaming machines
, primarily related to 715 more machines sold during the year ended December 31, 2018 compared
to the year ended December 31, 2017
, driven primarily by replacement sales, along with an increase in the average selling price
for the year ended December 31, 2018
compared
to the year ended December 31, 2017
; and
|
|
•
|
A
decrease
of
$16.0 million
in
Systems and other
, principally associated with:
|
|
◦
|
A decrease of $16.3 million in software sales, primarily related to sales in Oregon that did not recur in the current year;
|
|
◦
|
A decrease of $13.2 million in intellectual property revenue due to the timing of recognition of multi-year licenses upon adoption of ASC 606. Under ASC 606, the Company now recognizes revenue upon transfer of the multi-year license to the customer rather than as payments become due throughout the contract period; and
|
|
◦
|
An increase of $15.3 million in casino systems.
|
The principal drivers of the
$22.0 million
constant currency
decrease
in product sales
for the year ended December 31, 2017
compared
to the year ended December 31, 2016
were as follows:
|
•
|
A
decrease
of
$5.9 million
in Gaming machines, principally associated with
1,665
fewer machines sold during the year ended December 31, 2017 compared
to the year ended December 31, 2016
; and
|
|
•
|
A
decrease
of
$16.1 million
in Systems and other driven by significant system related and intellectual property sales that did not recur in 2017.
|
44
North America Lottery
The following sets forth changes in product sales in the North America Lottery segment:
|
|
Product Sales Change
|
|||||||||||
|
2018 vs. 2017
|
2017 vs. 2016
|
|||||||||||
|
($ thousands)
|
Constant
Currency |
$ Change
|
Constant
Currency |
$ Change
|
||||||||
|
Lottery machines
|
663
|
|
739
|
|
13,955
|
|
14,553
|
|
||||
|
Systems and other
|
(12,080
|
)
|
(12,080
|
)
|
12,120
|
|
12,352
|
|
||||
|
|
(11,417
|
)
|
(11,341
|
)
|
26,075
|
|
26,905
|
|
||||
The principal drivers of the
$11.4 million
constant currency
decrease
in product sales
for the year ended December 31, 2018
compared
to the year ended December 31, 2017
were as follows:
|
•
|
An
increase
of
$0.7 million
in
Lottery machines
, principally due to lottery point-of-sale machines and hardware sales in Massachusetts, offset primarily by lottery machine sales in Canada that did not recur in the current year and a decrease of $14.5 million upon adoption of ASC 606 related to lottery machine sales in California. Under ASC 606, it was determined that control of the lottery machines sold to California had transferred to the customer prior to the adoption of ASC 606 resulting in an adjustment to retained earnings; and
|
|
•
|
A
decrease
of
$12.1 million
in
Systems and other
driven by gaming system and related hardware sales in Canada and Oregon in 2017 that did not recur in the current year.
|
The principal drivers of the
$26.1 million
constant currency
increase
in product sales
for the year ended December 31, 2017
compared
to the year ended December 31, 2016
were as follows:
|
•
|
An
increase
in
Lottery machines
of
$14.0 million
, driven primarily by machine sales in Canada and instant ticket printing sales; and
|
|
•
|
An
increase
in
Systems and other
of
$12.1 million
driven by gaming system and related hardware sales in Canada and Oregon.
|
International
The following sets forth changes in product sales in the International segment:
|
|
Product Sales Change
|
|||||||||||
|
2018 vs. 2017
|
2017 vs. 2016
|
|||||||||||
|
($ thousands)
|
Constant
Currency |
$ Change
|
Constant
Currency |
$ Change
|
||||||||
|
Lottery machines
|
(14,941
|
)
|
(14,846
|
)
|
14,703
|
|
15,686
|
|
||||
|
Gaming machines
|
(4,641
|
)
|
(6,420
|
)
|
(3,211
|
)
|
553
|
|
||||
|
Systems and other
|
15,115
|
|
13,737
|
|
(294
|
)
|
1,139
|
|
||||
|
|
(4,467
|
)
|
(7,529
|
)
|
11,198
|
|
17,378
|
|
||||
The principal drivers of the
$4.5 million
constant currency
decrease
in product sales
for the year ended December 31, 2018
compared
to the year ended December 31, 2017
were as follows:
|
•
|
A
decrease
of
$14.9 million
in
Lottery machines
, primarily related to a $6.7 million sale in Europe and a $4.9 million sale in Latin America that did not recur in the current year;
|
|
•
|
A
decrease
of
$4.6 million
in
Gaming machines
, principally due to decreased machine sales in Europe of $25.5 million and Latin America of $8.1 million, partially offset by increased machines sales in Africa of $15.7 million and the Asia Pacific region of $13.3 million; and
|
|
•
|
An
increase
of
$15.1 million
in
Systems and other
, primarily due to:
|
45
|
◦
|
A decrease of $8.7 million in gaming system sales, primarily driven by a decrease of $17.3 million related to a VLT system sale in Europe in 2017 and reduced gaming system sales in Latin America, partially offset by increased gaming system sales of $8.5 million in the Asia Pacific region;
|
|
◦
|
An increase of $6.2 million in software sales, principally driven by increased sales of $10.0 million in Africa, partially offset by lower sales of $3.0 million in the Asia Pacific region;
|
|
◦
|
An increase of $38.4 million in other product sales, principally driven by a significant product sale within Europe and a $10.0 million increase due to, in connection with ASC 606, licenses being identified as distinct performance obligations and recognized in product sales in the current year; and
|
|
◦
|
A decrease of $20.8 million in sports betting, primarily driven by sales in Europe that did not recur in the current year.
|
The principal driver of the
$11.2 million
constant currency
increase
in product sales
for the year ended December 31, 2017
compared
to the year ended December 31, 2016
was an increase of
$14.7 million
in
Lottery machines
, principally associated with an $8.2 million increase in Europe and a $5.8 million increase in Latin America.
Operating expenses
|
|
Constant Currency Change
|
$ Change
|
||||||||||||||||||||||
|
($ thousands)
|
2018 vs. 2017
|
2017 vs. 2016
|
2018 vs. 2017
|
2017 vs. 2016
|
||||||||||||||||||||
|
$
|
%
|
$
|
%
|
$
|
%
|
$
|
%
|
|||||||||||||||||
|
Cost of services
|
(139,036
|
)
|
(5.4
|
)
|
(37,368
|
)
|
(1.5
|
)
|
(102,425
|
)
|
(4.0
|
)
|
(396
|
)
|
—
|
|
||||||||
|
Cost of product sales
|
(85,138
|
)
|
(14.7
|
)
|
(5,652
|
)
|
(1.0
|
)
|
(88,401
|
)
|
(15.3
|
)
|
(2,927
|
)
|
(0.5
|
)
|
||||||||
|
Selling, general and administrative
|
26,024
|
|
3.2
|
|
(135,273
|
)
|
(14.3
|
)
|
27,966
|
|
3.4
|
|
(129,731
|
)
|
(13.7
|
)
|
||||||||
|
Research and development
|
(51,264
|
)
|
(16.4
|
)
|
(32,758
|
)
|
(9.5
|
)
|
(49,809
|
)
|
(15.9
|
)
|
(30,443
|
)
|
(8.9
|
)
|
||||||||
|
Restructuring expense
|
(25,145
|
)
|
(63.1
|
)
|
11,743
|
|
42.0
|
|
(25,095
|
)
|
(62.9
|
)
|
11,942
|
|
42.8
|
|
||||||||
|
Impairment loss
|
(594,756
|
)
|
(83.2
|
)
|
677,415
|
|
>200.0
|
|
(594,813
|
)
|
(83.2
|
)
|
677,476
|
|
> 200.0
|
|
||||||||
|
Transaction expense (income), net
|
26,791
|
|
(100.2
|
)
|
(29,315
|
)
|
>200.0
|
|
26,791
|
|
100.2
|
|
(29,330
|
)
|
> 200.0
|
|
||||||||
|
Total operating expenses
|
(842,524
|
)
|
(16.9
|
)
|
448,792
|
|
10.0
|
|
(805,786
|
)
|
(16.1
|
)
|
496,591
|
|
11.1
|
|
||||||||
Information on the material changes in operating expenses are as follows:
Cost of services
Cost of services decreased
$139.0 million
on a constant currency basis
for the year ended December 31, 2018
compared
to the year ended December 31, 2017
, principally due to:
|
•
|
A decrease of
$67.0 million
in the North America Gaming and Interactive segment, principally due to:
|
|
◦
|
A decrease of $40.1 million from the June 2017 sale of DoubleDown;
|
|
◦
|
A decrease of $63.8 million related to the reclassification of jackpot expense to service revenue upon adoption of ASC 606; and
|
|
◦
|
An increase of $32.0 million in depreciation and amortization;
|
|
•
|
A decrease of
$21.5 million
in the International segment, primarily related to the
$60.2 million
decrease
in service revenue and the reclassification of $12.1 million in jackpot expense to service revenue upon adoption of ASC 606; and
|
|
•
|
A decrease of
$61.3 million
in Purchase Accounting, principally associated with a $61.3 million decrease in depreciation and amortization, primarily related to the Company's game library (acquired in the 2015 acquisition of IGT) being fully depreciated at year ended
December 31, 2017
. On April 7, 2015, the Company acquired IGT, a global leader in casino and social gaming entertainment, headquartered in Las Vegas, Nevada.
|
Cost of services decreased
$37.4 million
on a constant currency basis
for the year ended December 31, 2017
compared
to the year ended December 31, 2016
, principally due to:
|
•
|
A
$33.1 million
decrease in the North America Gaming and Interactive segment, due to a decrease of
$59.7 million
from the June 2017 sale of DoubleDown, partially offset by an increase of
$26.6 million
, principally related to:
|
46
|
◦
|
Costs of $10.3 million associated a content licensing and support agreement entered into with DoubleU to enable DoubleU to offer the Company's extensive casino game library on DoubleU’s combined social casino platforms, in exchange for a fixed amount and usage-based royalties to the Company; and
|
|
◦
|
Costs of $12.3 million to grow and sustain the premium installed base, including higher than average jackpot expense;
|
|
•
|
A
$21.1 million
decrease in the North America Lottery segment, principally due to the decrease in service revenue of
$35.9 million
;
|
|
•
|
A
$32.9 million
increase in the International segment, principally due to the
$47.4 million
increase in service revenue and a
$15.9 million
increase in depreciation and amortization expense, partially offset by a decrease in costs related to the exit of certain interactive contracts;
|
|
•
|
A
$26.6 million
increase in the Italy segment
, principally due to:
|
|
◦
|
An increase of
$18.2 million
related to instant tickets principally associated with a VAT reduction on instant tickets in 2016 that did not recur;
|
|
◦
|
An increase of
$10.3 million
in costs related to Machine gaming, principally associated with the constant currency increase in AWP machine gaming service revenue; and
|
|
◦
|
A decrease of
$8.1 million
related to sports betting principally associated with a decrease of
$11.9 million
in depreciation and amortization related to fully depreciated assets; and
|
|
•
|
A
$36.4 million
decrease in Purchase Accounting, principally due to a $36.4 million decrease in depreciation and amortization, primarily related to:
|
|
◦
|
An $18.4 million decrease related to the June 2017 sale of DoubleDown; and
|
|
◦
|
A $14.2 million decrease in developed technology, principally related to fully depreciated assets that were acquired in the 2015 acquisition of IGT.
|
Cost of product sales
Cost of product sales decreased
$85.1 million
on a constant currency basis
for the year ended December 31, 2018
compared
to the year ended December 31, 2017
, principally due to:
|
•
|
A
$16.4 million
increase in the North America Gaming and Interactive segment, primarily related to a $20.0 million increase in machine sales costs driven by a higher volume in sales, partially offset by a $4.0 million decrease in software costs associated with software sales in Oregon that did not recur in the current year;
|
|
•
|
A
$10.0 million
decrease in the North America Lottery segment, primarily driven by gaming system and related hardware sales in 2017 that did not recur in the current year;
|
|
•
|
An
$18.4 million
decrease in the International segment, principally due to a change in product mix; and
|
|
•
|
A
$72.0 million
decrease in Purchase Accounting, principally associated with a $72.0 million decrease in depreciation and amortization, primarily related to the Company's game library (acquired in the 2015 acquisition of IGT) being fully depreciated at year ended
December 31, 2017
.
|
Cost of product sales decreased
$5.7 million
on a constant currency basis
for the year ended December 31, 2017
compared
to the year ended December 31, 2016
, principally due to:
|
•
|
A
$26.1 million
decrease in the North America Gaming and Interactive segment, principally due to the decrease in product sales of
$22.0 million
and change in product mix;
|
|
•
|
A
$22.5 million
increase in the North America Lottery segment, principally due to the
$26.1 million
increase in product sales;
|
|
•
|
A
$29.0 million
increase in the International segment, principally due to an increase in delivery costs primarily related to product sales to customers in Europe and Latin America; and
|
|
•
|
A
$31.2 million
decrease in Purchase Accounting, principally due to a $31.2 million decrease in depreciation and amortization due to fully depreciated assets.
|
Selling, general and administrative
Selling, general and administrative expense increased
$26.0 million
on a constant currency basis
for the year ended December 31, 2018
compared
to the year ended December 31, 2017
, principally due to:
47
|
•
|
A
$13.5 million
decrease in the North America Gaming and Interactive segment, principally due to a $26.7 million decrease from the June 2017 sale of DoubleDown, partially offset by an increase of $8.7 million in performance based compensation;
|
|
•
|
A
$12.5 million
increase related to the Italy segment, primarily related to:
|
|
◦
|
An increase of $12.6 million in employee related costs;
|
|
◦
|
An increase of $5.8 million in depreciation and amortization; and
|
|
◦
|
A decrease of $4.3 million in maintenance expense primarily related to software maintenance; and
|
|
•
|
A
$24.6 million
increase in Corporate Support, primarily due to:
|
|
◦
|
An increase of $17.9 million related to the January 2017 sale of a pre-merger IGT receivable that was substantially fully reserved at the date of acquisition in April 2015;
|
|
◦
|
A decrease of $19.3 million in employee related costs;
|
|
◦
|
An increase of $14.5 million in performance based compensation; and
|
|
◦
|
An increase of $3.1 million in licensing and royalties, primarily related to software licenses.
|
Selling, general and administrative expense decreased
$135.3 million
on a constant currency basis
for the year ended December 31, 2017
compared
to the year ended December 31, 2016
, principally due to:
|
•
|
A
$67.3 million
decrease related to the North America Gaming and Interactive segment, principally due to:
|
|
◦
|
A decrease of
$43.5 million
from the June 2017 sale of DoubleDown;
|
|
◦
|
A decrease of
$23.8 million
driven by:
|
|
▪
|
A decrease of
$11.3 million
in performance based compensation; and
|
|
▪
|
A decrease of
$8.7 million
related to a decrease in payroll related costs;
|
|
•
|
A
$21.5 million
decrease related to the International segment, principally due to cost savings initiatives and a decrease in incentive based compensation of
$8.2 million
; and
|
|
•
|
A
$23.3 million
decrease related to Corporate support, principally due to the January 2017 sale of a pre-merger IGT receivable for
$17.9 million
that was substantially fully reserved at the date of acquisition in April 2015.
|
Research and development
Research and development expense decreased
$51.3 million
on a constant currency basis
for the year ended December 31, 2018
compared
to the year ended December 31, 2017
, principally due to:
|
•
|
A
$31.1 million
decrease in the North America Gaming and Interactive segment, primarily related to a $13.6 million decrease from the June 2017 sale of DoubleDown and a $25.9 million decrease in employee related costs associated with optimization efforts; and
|
|
•
|
A
$10.0 million
decrease in the International segment and a
$9.1 million
decrease in the Italy segment, principally related to cost saving initiatives.
|
Research and development expense decreased
$32.8 million
on a constant currency basis
for the year ended December 31, 2017
compared
to the year ended December 31, 2016
, principally due to:
|
•
|
A
$21.1 million
decrease in the North America Gaming and Interactive segment, principally due to a decrease of
$16.5 million
from the June 2017 sale of DoubleDown along with a decrease of
$7.3 million
in performance based compensation.
|
Restructuring expense
The Company has undertaken various restructuring plans, principally related to the April 2015 acquisition of IGT to eliminate redundant costs and achieve synergies across the business. The Company recorded restructuring costs associated with these plans of
$14.8 million
,
$39.9 million
and
$27.9 million
in
2018
,
2017
and
2016
, respectively.
48
Impairment loss
In
2018
, the Company incurred a
$118.0 million
impairment loss in the International segment as discussed in the Critical Accounting Estimates section. In
2017
, the Company incurred a
$714.0 million
impairment loss in the North America Gaming and Interactive segment. In
2016
, the Company recorded an impairment loss of
$30.0 million
for certain indefinite-lived trademarks in the North America Gaming and Interactive segment. Impairments for the years ended December 31, 2018, 2017 and 2016 are recorded within Purchase Accounting.
Transaction expense (income), net
|
|
For the year ended December 31,
|
$ Change
|
|||||||||||||||||||
|
($ thousands)
|
2018
|
2017
|
2016
|
2018 vs. 2017
|
2017 vs. 2016
|
||||||||||||||||
|
$
|
%
|
$
|
%
|
||||||||||||||||||
|
Gain on sale of DoubleDown, net of selling costs
|
—
|
|
(27,232
|
)
|
—
|
|
27,232
|
|
(100.0
|
)
|
(27,232
|
)
|
—
|
|
|||||||
|
Other transaction costs
|
51
|
|
492
|
|
2,590
|
|
(441
|
)
|
(89.6
|
)
|
(2,098
|
)
|
(81.0
|
)
|
|||||||
|
51
|
|
(26,740
|
)
|
2,590
|
|
26,791
|
|
(100.2
|
)
|
(29,330
|
)
|
>200.0
|
|
||||||||
The Company received cash consideration of
$825.8 million
(
$823.8 million
net of cash divested) and recognized a gain of
$27.2 million
in connection with the June 2017 sale of DoubleDown during the year ended December 31, 2017.
Operating income
(loss)
|
|
For the year ended December 31,
|
$ Change
|
|||||||||||||||||||
|
($ thousands)
|
2018
|
2017
|
2016
|
2018 vs. 2017
|
2017 vs. 2016
|
||||||||||||||||
|
$
|
%
|
$
|
%
|
||||||||||||||||||
|
North America Gaming and Interactive
|
218,860
|
|
278,963
|
|
349,275
|
|
(60,103
|
)
|
(21.5
|
)
|
(70,312
|
)
|
(20.1
|
)
|
|||||||
|
North America Lottery
|
296,527
|
|
289,025
|
|
299,182
|
|
7,502
|
|
2.6
|
|
(10,157
|
)
|
(3.4
|
)
|
|||||||
|
International
|
142,077
|
|
163,799
|
|
142,200
|
|
(21,722
|
)
|
(13.3
|
)
|
21,599
|
|
15.2
|
|
|||||||
|
Italy
|
541,254
|
|
478,540
|
|
583,504
|
|
62,714
|
|
13.1
|
|
(104,964
|
)
|
(18.0
|
)
|
|||||||
|
Operating Segments
|
1,198,718
|
|
1,210,327
|
|
1,374,161
|
|
(11,609
|
)
|
(1.0
|
)
|
(163,834
|
)
|
(11.9
|
)
|
|||||||
|
Corporate support
|
(226,231
|
)
|
(197,089
|
)
|
(245,600
|
)
|
(29,142
|
)
|
(14.8
|
)
|
48,511
|
|
19.8
|
|
|||||||
|
Purchase accounting
|
(325,496
|
)
|
(1,064,330
|
)
|
(468,125
|
)
|
738,834
|
|
69.4
|
|
(596,205
|
)
|
(127.4
|
)
|
|||||||
|
|
646,991
|
|
(51,092
|
)
|
660,436
|
|
698,083
|
|
> 200.0
|
|
(711,528
|
)
|
(107.7
|
)
|
|||||||
The following table sets forth constant currency changes in operating income (loss):
|
|
Constant Currency Change
|
|||||||||||
|
2018 vs. 2017
|
2017 vs. 2016
|
|||||||||||
|
($ thousands)
|
$
|
%
|
$
|
%
|
||||||||
|
North America Gaming and Interactive
|
(58,661
|
)
|
(21.0
|
)
|
(68,993
|
)
|
(19.8
|
)
|
||||
|
North America Lottery
|
7,695
|
|
2.7
|
|
(11,026
|
)
|
(3.7
|
)
|
||||
|
International
|
(22,022
|
)
|
(13.4
|
)
|
24,544
|
|
17.3
|
|
||||
|
Italy
|
39,223
|
|
8.2
|
|
(119,620
|
)
|
(20.5
|
)
|
||||
|
Operating Segments
|
(33,765
|
)
|
(2.8
|
)
|
(175,095
|
)
|
(12.7
|
)
|
||||
|
Corporate support
|
(27,993
|
)
|
(14.2
|
)
|
49,351
|
|
(20.1
|
)
|
||||
|
Purchase accounting
|
738,966
|
|
69.4
|
|
(596,164
|
)
|
127.4
|
|
||||
|
|
677,208
|
|
>200.0
|
|
(721,908
|
)
|
(109.3
|
)
|
||||
49
Operating margin for each of the Company's operating segments is as follows:
|
Operating Margin
|
|||||||||
|
|
For the year ended December 31,
|
||||||||
|
2018
|
2017
|
2016
|
|||||||
|
North America Gaming and Interactive
|
21.8
|
%
|
24.1
|
%
|
25.4
|
%
|
|||
|
North America Lottery
|
24.9
|
%
|
24.4
|
%
|
25.1
|
%
|
|||
|
International
|
17.3
|
%
|
18.4
|
%
|
17.2
|
%
|
|||
|
Italy
|
29.8
|
%
|
28.1
|
%
|
33.1
|
%
|
|||
North America Gaming and Interactive
Segment operating margin decreased from
24.1%
at year ended
December 31, 2017
to
21.8%
at year ended
December 31, 2018
, principally due to service revenue versus product sales margin mix and an increase in depreciation and amortization.
Segment operating margin decreased from
25.4%
at year ended
December 31, 2016
to
24.1%
at year ended
December 31, 2017
, principally due to the product sales versus service revenue margin mix.
North America Lottery
Segment operating margin increased slightly from
24.4%
at year ended
December 31, 2017
to
24.9%
at year ended
December 31, 2018
, principally due to strong same store revenue due to multi-state jackpot activity and increased instant tickets sales, partially offset by an increase in depreciation and amortization.
Segment operating margin decreased slightly from
25.1%
at year ended
December 31, 2016
to
24.4%
at year ended
December 31, 2017
, principally due to lower multi-state jackpot activity, partially offset by a decrease in depreciation and amortization driven by contract extensions with several customers in the United States.
International
Segment operating margin decreased from
18.4%
at year ended
December 31, 2017
to
17.3%
at year ended
December 31, 2018
and increased from
17.2%
at year ended
December 31, 2016
to
18.4%
at year ended
December 31, 2017
, principally due the achievement of certain high-margin contractual milestones in 2017.
Italy
Segment operating margin increased from
28.1%
at year ended
December 31, 2017
to
29.8%
at year ended
December 31, 2018
, principally due to overall business performance and capital expenditure optimization, partially offset by one time effects of certain reimbursements that did not recur in the current year.
Segment operating margin decreased from
33.1%
at year ended
December 31, 2016
to
28.1%
at year ended
December 31, 2017
, principally due to the
decrease
in Lotto revenue, partially offset by an increase in sports betting and decrease in depreciation and amortization.
50
Non-operating expenses
Interest expense
|
|
For the year ended December 31,
|
$ Change
|
|||||||||||||||||||
|
($ thousands)
|
2018
|
2017
|
2016
|
2018 vs. 2017
|
2017 vs. 2016
|
||||||||||||||||
|
$
|
%
|
$
|
%
|
||||||||||||||||||
|
Senior Secured Notes
|
(352,293
|
)
|
(389,879
|
)
|
(391,790
|
)
|
(37,586
|
)
|
(9.6
|
)
|
(1,911
|
)
|
(0.5
|
)
|
|||||||
|
Term Loan Facilities
|
(39,462
|
)
|
(23,567
|
)
|
(19,100
|
)
|
15,895
|
|
67.4
|
|
4,467
|
|
23.4
|
|
|||||||
|
Revolving Credit Facilities
|
(27,805
|
)
|
(34,984
|
)
|
(42,179
|
)
|
(7,179
|
)
|
(20.5
|
)
|
(7,195
|
)
|
(17.1
|
)
|
|||||||
|
Other
|
(12,058
|
)
|
(10,469
|
)
|
(16,199
|
)
|
1,589
|
|
15.2
|
|
(5,730
|
)
|
(35.4
|
)
|
|||||||
|
|
(431,618
|
)
|
(458,899
|
)
|
(469,268
|
)
|
(27,281
|
)
|
(5.9
|
)
|
(10,369
|
)
|
(2.2
|
)
|
|||||||
Interest expense
for the year ended December 31, 2018
decreased
by
$27.3 million
compared
to the year ended December 31, 2017
, primarily related to:
|
•
|
A
$37.6 million
decrease in the senior secured notes, principally due to:
|
|
◦
|
A decrease of $38.8 million due to the redemption of the €500 million 6.625% Senior Secured Notes due February 2018 when they matured on February 2, 2018;
|
|
◦
|
A decrease of $11.8 million due to the repurchase of $355.7 million of the $500.0 million 7.500% Senior Secured Notes due July 2019 in June 2017;
|
|
◦
|
A decrease of $9.1 million due to the September 2018 redemption of the $600 million 5.625% Senior Secured Notes due February 2020 (the "5.625% Notes");
|
|
◦
|
An increase of $12.5 million due to the September 2018 issuance of the $750.0 million 6.250% Senior Secured Notes due January 2027; and
|
|
◦
|
An increase of $10.9 million due to the June 2018 issuance of the €500 million 3.500% Senior Secured Notes due July 2024; and
|
|
•
|
A
$15.9 million
increase in term loan facilities, primarily related to:
|
|
◦
|
A $26.9 million increase due to the July 2017 execution of the €1.5 billion term loan facility due January 2023; and
|
|
◦
|
An $11.0 million decrease due to the July 2017 prepayment of the €800 million term loan facility due January 2019.
|
Interest expense
for the year ended December 31, 2017
decreased
by
$10.4 million
, or
2.2
% compared
to the year ended December 31, 2016
, principally driven by the decrease in the Revolving Credit Facilities outstanding following the June 2017 sale of DoubleDown.
Foreign exchange gain (loss), net
The Company recorded foreign exchange gains (losses), net of
$129.1 million
,
$(444.0) million
and
$101.0 million
in
2018
,
2017
and
2016
, respectively, which are principally non-cash and relate to fluctuations in the euro to U.S. dollar exchange rate on euro denominated debt.
51
Other (expense) income, net
The components of other (expense) income, net are as follows:
|
|
For the year ended December 31,
|
$ Change
|
|||||||||||||||||||
|
($ thousands)
|
2018
|
2017
|
2016
|
2018 vs. 2017
|
2017 vs. 2016
|
||||||||||||||||
|
$
|
%
|
$
|
%
|
||||||||||||||||||
|
Debt related transactions
|
(54,907
|
)
|
(31,593
|
)
|
(5,220
|
)
|
(23,314
|
)
|
(73.8
|
)
|
(26,373
|
)
|
> 200.0
|
|
|||||||
|
Gain on sale of available-for-sale investment
|
—
|
|
—
|
|
20,365
|
|
—
|
|
-
|
|
(20,365
|
)
|
(100.0
|
)
|
|||||||
|
Other
|
300
|
|
(1,800
|
)
|
3,220
|
|
2,100
|
|
116.7
|
|
(5,020
|
)
|
(155.9
|
)
|
|||||||
|
|
(54,607
|
)
|
(33,393
|
)
|
18,365
|
|
(21,214
|
)
|
(63.5
|
)
|
(51,758
|
)
|
> 200.0
|
|
|||||||
In October 2018, the Company redeemed in full its subsidiary's $144.3 million 7.500% Senior Secured Notes due July 2019 (the "7.500% Notes") and $96.8 million of its subsidiary's $124.1 million 5.500% Senior Secured Notes due June 2020 (the "5.500% Notes") for total consideration, excluding interest, of $248.7 million and recorded a $4.8 million loss on extinguishment of debt in connection with the redemption.
In September 2018, the Company redeemed in full the 5.625% Notes for total consideration, excluding interest, of $617.1 million and recorded a $20.0 million loss on extinguishment of debt in connection with the redemption.
In June 2018, the Company offered to purchase up to €500 million of the €700 million 4.125% Senior Secured Notes due February 2020 (the "4.125% Notes") and the €500 million 4.750% Senior Secured Notes due March 2020 (the "4.750% Notes"). The Company purchased €262.4 million ($303.6 million) of the 4.125% Notes and €112.1 million ($129.7 million) of the 4.750% Notes for total consideration, excluding interest, of €395.5 million ($457.5 million) and recorded a $29.6 million loss on extinguishment of debt in connection with the purchase.
In June 2017, the Company offered to purchase any and all of the $500.0 million 7.500% Notes and the Company purchased
$355.7 million
of these notes for total consideration, excluding interest, of
$393.5 million
. The Company recorded a
$25.7 million
loss on early extinguishment of debt in connection with the purchase.
Provision for (benefit from) income taxes
|
|
For the year ended December 31,
|
||||||||
|
($ thousands, except percentages)
|
2018
|
2017
|
2016
|
||||||
|
Provision for (benefit from) income taxes
|
189,401
|
|
(29,414
|
)
|
59,206
|
|
|||
|
Income (loss) before provision for income taxes
|
304,048
|
|
(976,925
|
)
|
323,413
|
|
|||
|
Effective income tax rate
|
62.3
|
%
|
3.0
|
%
|
18.3
|
%
|
|||
In 2018, the Company's effective tax rate was higher than the U.K. statutory rate of
19.00%
primarily due to the impact of the international provisions of the Tax Act (the base-erosion and anti-abuse tax or "BEAT" and global intangible low-taxed income or "GILTI"), a goodwill impairment with no associated tax benefit, increases in uncertain tax positions and the settlement of an Italian tax audit.
In 2017, the Company's effective tax rate was higher than the U.K. statutory rate of
19.25%
primarily due to a goodwill impairment with no associated tax benefit, capital gain taxes incurred on the sale of DoubleDown, a net increase in valuation allowances in the U.K. and other foreign jurisdictions offset by a favorable net tax benefit recorded related to the impact of the Tax Act.
In 2016, the Company's effective tax rate was lower than the U.K. statutory rate of
20.00%
primarily due to a reduction in operating losses without tax benefits in certain foreign jurisdictions, decrease in uncertain tax positions as a result of a favorable settlement with the Internal Revenue Service, tax benefits associated with tax law and tax rate changes during the year, offset by an Italian audit settlement.
52
|
B.
|
Liquidity and Capital Resources
|
Overview
The Company's business is capital intensive and requires liquidity to meet its obligations and fund growth. Historically, the Company's primary sources of liquidity have been cash flows from operations and, to a lesser extent, cash proceeds from financing activities, including amounts available under the Revolving Credit Facilities due July 2021. In addition to general working capital and operational needs, the Company's liquidity requirements arise primarily from its need to meet debt service requirements and to fund capital expenditures and the upfront Italian license fee payments. The Company also requires liquidity to fund any acquisitions and associated costs. The Company's cash flows generated from operating activities together with cash flows generated from financing activities have historically been sufficient to meet the Company's liquidity requirements.
The Company believes its ability to generate cash from operations to reinvest in its business, primarily due to the long-term nature of its contracts, is one of its fundamental financial strengths. Combined with funds currently available and committed borrowing capacity, the Company expects to have sufficient liquidity to meet its financial obligations and working capital requirements in the ordinary course of business for at least the next 12 months.
The cash management, funding of operations and investment of excess liquidity are centrally coordinated by a dedicated treasury team with the objective of ensuring effective and efficient management of funds.
The Company's total available liquidity was as follows:
|
|
December 31,
|
|||||
|
($ thousands)
|
2018
|
2017
|
||||
|
Revolving Credit Facilities due July 2021
|
1,601,968
|
|
1,974,493
|
|
||
|
Cash and cash equivalents
|
250,669
|
|
1,057,418
|
|
||
|
Total Liquidity
|
1,852,637
|
|
3,031,911
|
|
||
The Revolving Credit Facilities due July 2021 are subject to customary covenants (including maintaining a minimum ratio of EBITDA to net interest costs and a maximum ratio of total net debt to EBITDA) and events of default, none of which are expected to impact the Company's liquidity or capital resources. At
December 31, 2018
, the Company was in compliance with all covenants.
The Company completed several debt transactions in 2018. Refer to the "Notes to the Consolidated Financial Statements—
14
. Debt" included in "Item 18. Financial Statements" for further discussion of these transactions as well as information regarding the Company's other debt obligations.
The following table summarizes the Company's cash balances by currency:
|
|
December 31, 2018
|
December 31, 2017
|
||||||||
|
($ thousands)
|
$
|
%
|
$
|
%
|
||||||
|
Euros
|
140,282
|
|
56.0
|
625,143
|
|
59.1
|
||||
|
U.S. dollars
|
41,395
|
|
16.5
|
362,760
|
|
34.3
|
||||
|
Other currencies
|
68,992
|
|
27.5
|
69,515
|
|
6.6
|
||||
|
Total Cash
|
250,669
|
|
100.0
|
1,057,418
|
|
100.0
|
||||
The Company holds insignificant amounts of cash in countries where there may be restrictions on transfer due to regulatory or governmental bodies. Based on the Company's review of such transfer restrictions and the cash balances held in such countries, it does not believe such transfer restrictions have an adverse impact on its ability to meet liquidity requirements at years ended
December 31, 2018
and
2017
.
53
The Company has two agreements with major European financial institutions to sell certain trade receivables related to the Italy segment on a non-recourse basis. These receivables have been derecognized from the Company's consolidated balance sheet. The agreements have a three- and five-year duration, respectively, and are subject to early termination by either party. The aggregate amount of outstanding receivables is limited to a maximum amount of €300 million and €150 million for Scratch & Win and Commercial Services, respectively. At
December 31, 2018
and
2017
, the following receivables had been sold:
|
|
December 31, 2018
|
December 31, 2017
|
||||||||||
|
(in thousands)
|
euro
|
$
|
euro
|
$
|
||||||||
|
Scratch & Win
|
128,515
|
|
147,150
|
|
175,848
|
|
210,894
|
|
||||
|
Commercial services
|
74,609
|
|
85,427
|
|
45,417
|
|
54,469
|
|
||||
|
|
203,124
|
|
232,577
|
|
221,265
|
|
265,363
|
|
||||
In addition, the Company sold trade receivables on a non-recourse basis and derecognized
$21.4 million
and
$18.6 million
at
December 31, 2018
and
2017
, respectively, primarily in the North America Gaming and Interactive segment.
The Company also sold
$6.9 million
and
$34.2 million
of certain outstanding customer financing receivables on a non-recourse basis at
December 31, 2018
and
2017
, respectively.
On March 29, 2017, the Company sold its Reno, Nevada facility for gross proceeds of $156.0 million and entered into an operating lease agreement with the buyer for a term of 15.5 years with
four
5
-year additional renewal periods exercisable at the Company's option.
Cash Flow Summary
The following table summarizes the statements of cash flows. A complete statement of cash flows is provided in the Consolidated Financial Statements included herein.
|
|
For the year ended December 31,
|
||||||||
|
($ thousands)
|
2018
|
2017
(1)
|
2016
(1)
|
||||||
|
Net cash provided by operating activities
|
29,626
|
|
663,388
|
|
338,054
|
|
|||
|
Net cash (used in) provided by investing activities
|
(511,537
|
)
|
295,566
|
|
(339,441
|
)
|
|||
|
Net cash used in financing activities
|
(311,545
|
)
|
(246,972
|
)
|
(312,139
|
)
|
|||
|
Net cash flows
|
(793,456
|
)
|
711,982
|
|
(313,526
|
)
|
|||
(1) In the first quarter of 2018, the Company adopted ASU No. 2016-18,
Statement of Cash Flows (Topic 230): Restricted Cash
("ASU 2016-18") on a retrospective basis which requires that a statement of cash flows explain the change during the period in the total of cash, cash equivalents, and restricted cash or restricted cash equivalents. As a result of the adoption of ASU 2016-18, net cash provided by operating activities and net cash (used in) provided by investing activities have been updated to remove the effects of restricted cash and cash equivalents for the years ended December 31, 2017 and 2016. Refer to "Notes to the Consolidated Financial Statements—
2
. Summary of Significant Accounting Policies" included in "Item 18. Financial Statements" for the impact of adoption on the Company's consolidated statements of cash flows.
54
Analysis of Cash Flows
Net Cash Provided by Operating Activities
Comparison of the years ended
December 31, 2018
and
2017
During the year ended
December 31, 2018
, the Company generated
$29.6 million
of net cash from operating activities, a
decrease
of
$633.8 million
compared to the year ended
December 31, 2017
. The
decrease
was principally attributed to:
|
•
|
A decrease of
$633.4 million
related to the increase in upfront Italian license fee payments
for the year ended December 31, 2018
compared
to the year ended December 31, 2017
;
|
|
•
|
A decrease of
$99.8 million
in trade and other receivables, principally due to the timing of cash collections in the Italy segment;
|
|
•
|
A decrease of
$49.0 million
in accounts payable, primarily due to the timing of payments;
|
|
•
|
An increase of $72.6 million in cash operating income in the Italy segment;
|
|
•
|
An increase of $56.6 million in income taxes paid, principally associated with the timing of payments; and
|
|
•
|
An increase of $33.3 million in cash operating income in the North America Lottery segment.
|
Comparison of the years ended
December 31, 2017
and
2016
During the year ended
December 31, 2017
, the Company generated
$663.4 million
of net cash from operating activities, an
increase
of
$325.3 million
compared to the year ended
December 31, 2016
. The
increase
was principally due to:
|
•
|
An increase of
$420.6 million
related to the decrease in upfront Italian license fee payments
for the year ended December 31, 2017
compared
to the year ended December 31, 2016
;
|
|
•
|
An increase of
$127.7 million
related to changes in inventories;
|
|
•
|
An increase of
$33.5 million
related to a decrease in interest paid;
|
|
•
|
An increase of
$30.8 million
in cash operating income in the International segment;
|
|
•
|
An increase of
$17.9 million
associated with the January 2017 sale of a pre-merger IGT receivable that was substantially fully reserved at the date of acquisition;
|
|
•
|
A decrease of
$82.6 million
in cash operating income in the North America Gaming and Interactive segment, principally related to the June 2017 sale of DoubleDown; and
|
|
•
|
A decrease of
$113.1 million
related to the increase in income taxes paid, principally associated with the June 2017 sale of DoubleDown.
|
Net Cash (Used in) Provided by Investing Activities
During the years ended December 31,
2018
,
2017
, and
2016
, net cash (used in) provided by investing activities were
$(511.5) million
,
$295.6 million
, and
$(339.4) million
, respectively.
Investing activities for
2018
|
•
|
Capital expenditures of
$533.1 million
. Refer to "Capital Expenditures" included within this section.
|
Investing activities for
2017
|
•
|
Proceeds from the June 2017 sale of DoubleDown, net of cash divested of
$823.8 million
;
|
|
•
|
Proceeds from the sale of assets of
$167.5 million
, principally related to the sale of the Company's Reno, Nevada facility; and
|
|
•
|
Capital expenditures of
$698.0 million
. Refer to "Capital Expenditures" included within this section.
|
Investing activities for
2016
|
•
|
Capital expenditures of
$541.9 million
. Refer to "Capital Expenditures" included within this section; and
|
|
•
|
Proceeds of $185.8 million, net from the sale of various assets including certain jackpot annuities and other assets.
|
55
Net Cash Used in Financing Activities
During the years ended December 31,
2018
,
2017
, and
2016
, net cash used in financing activities were
$311.5 million
,
$247.0 million
, and
$312.1 million
, respectively.
Financing activities for
2018
|
•
|
The Company made principal payments on long-term debt of
$1.900 billion
, principally composed of:
|
|
◦
|
Principal payments of $625.5 million on the 6.625% Senior Secured Notes due February 2018 upon maturity;
|
|
◦
|
Principal payments of $600.0 million on the 5.625% Notes in connection with the redemption in September 2018;
|
|
◦
|
Principal payments of $433.3 million the 4.125% Notes and the 4.750% Notes in connection with the repurchases in June 2018; and
|
|
◦
|
Principal payments of $144.3 million on the 7.500% Notes in connection with the redemption in October 2018;
|
|
•
|
The Company paid dividends of
$163.2 million
to shareholders;
|
|
•
|
The Company paid
$126.9 million
of dividends and returned
$85.1 million
of capital to non-controlling shareholders;
|
|
•
|
The Company received capital increases of
$321.6 million
from non-controlling interests primarily related to the Scratch & Win license in Italy; and
|
|
•
|
The Company received proceeds of
$1.688 billion
from long term debt, primarily related to:
|
|
◦
|
Proceeds of $577.7 million from the issuance of the
€500 million
3.500%
Senior Secured Notes due July 2024 in June 2018;
|
|
◦
|
Proceeds of $750.0 million from the issuance of the $750 million 6.250% Senior Secured Notes due January 2027 in September 2018; and
|
|
◦
|
Net proceeds of $360.1 million from the Revolving Credit Facilities due July 2021.
|
Financing activities for
2017
|
•
|
The Company made principal payments on long-term debt of
$1.754 billion
composed of:
|
|
◦
|
Principal payments of $938.2 million on the Term Loan Facilities due January 2019;
|
|
◦
|
Principal payments of
$355.7 million
on the 7.500% Notes in connection with the repurchases in June 2017; and
|
|
◦
|
Principal payments of $461.8 million principally related to the Revolving Credit Facilities due July 2021;
|
|
•
|
The Company paid dividends of
$162.5 million
to shareholders;
|
|
•
|
The Company paid
$50.6 million
of dividends and returned
$52.4 million
of capital to non-controlling shareholders;
|
|
•
|
The Company received capital increases of
$107.5 million
from redeemable non-controlling interests related to the new Lotto license in Italy; and
|
|
•
|
The Company received proceeds of
$1.762 billion
from the Term Loan Facility due January 2023.
|
Financing activities for
2016
|
•
|
The Company made principal payments on long-term debt of $357.5 million;
|
|
•
|
The Company paid dividends of $161.2 million to shareholders;
|
|
•
|
The Company paid $32.7 million of dividends and returned $35.4 million of capital to non-controlling shareholders; and
|
|
•
|
The Company received $40.8 million and $215.7 million in capital contributions from non-controlling interests and redeemable non-controlling interests, respectively, principally related to the new Lotto license in Italy.
|
56
Capital Expenditures
Capital expenditures are principally composed of:
|
•
|
Systems, equipment and other assets related to contracts;
|
|
•
|
Property, plant and equipment;
|
|
•
|
Intangible assets; and
|
|
•
|
Investments in associates.
|
The table below details total capital expenditures by operating segment:
|
|
For the year ended December 31,
|
||||||||
|
($ thousands)
|
2018
|
2017
|
2016
|
||||||
|
North America Gaming and Interactive
|
(150,985
|
)
|
(147,804
|
)
|
(154,627
|
)
|
|||
|
North America Lottery
|
(163,912
|
)
|
(196,930
|
)
|
(153,606
|
)
|
|||
|
International
|
(61,218
|
)
|
(89,700
|
)
|
(82,662
|
)
|
|||
|
Italy
|
(145,692
|
)
|
(257,586
|
)
|
(145,854
|
)
|
|||
|
Operating Segments
|
(521,807
|
)
|
(692,020
|
)
|
(536,749
|
)
|
|||
|
Corporate Support
|
(11,245
|
)
|
(5,990
|
)
|
(5,194
|
)
|
|||
|
|
(533,052
|
)
|
(698,010
|
)
|
(541,943
|
)
|
|||
North America Gaming and Interactive
Capital expenditures for
2018
of
$151.0 million
principally consist of:
|
•
|
Investments in systems, equipment and other assets related to contracts with customers in North America of $139.7 million; and
|
|
•
|
Investments in property, plant and equipment of $10.8 million.
|
Capital expenditures for
2017
of
$147.8 million
principally consist of:
|
•
|
Investments in systems, equipment and other assets related to contracts with customers in North America of $125.1 million; and
|
|
•
|
Investments in property, plant and equipment of $22.0 million.
|
Capital expenditures for
2016
of
$154.6 million
principally consist of:
|
•
|
Investments in systems, equipment and other assets related to contracts with customers in North America of $106.8 million;
|
|
•
|
Investments in property, plant and equipment of $25.5 million; and
|
|
•
|
Investments in intangible assets of $22.3 million related to interactive offerings.
|
North America Lottery
Capital expenditures for
2018
of
$163.9 million
principally consist of:
|
•
|
Investments in systems, equipment and other assets related to contracts of $158.7 million, including systems and equipment deployed in California, New York, Rhode Island, South Carolina, West Virginia and Florida.
|
Capital expenditures for
2017
of
$196.9 million
principally consist of:
|
•
|
Investments in systems, equipment and other assets related to contracts of $194.8 million, including systems and equipment deployed in Florida, Virginia, Georgia and North Carolina.
|
Capital expenditures for
2016
of
$153.6 million
principally consist of:
|
•
|
Investments in systems, equipment and other assets related to contracts of $140.3 million, including systems and equipment deployed in North Carolina, Washington, Wisconsin and Indiana; and
|
57
|
•
|
The July 2016 acquisition of Hudson Alley Software, Inc., a provider of lottery sales force automation and lottery retailer engagement applications, of $4.9 million.
|
International
Capital expenditures for
2018
of
$61.2 million
principally consist of:
|
•
|
Investment in systems, equipment and other assets related to contracts of $59.0 million including systems and equipment deployed in Greece, Africa, Mexico, Poland and the United Kingdom.
|
Capital expenditures for
2017
of
$89.7 million
principally consist of:
|
•
|
Investment in systems, equipment and other assets related to contracts of $73.2 million including systems and equipment deployed in Greece, Sweden, Colombia and Poland; and
|
|
•
|
Acquisitions of $11.6 million.
|
Capital expenditures for
2016
of
$82.7 million
principally consist of:
|
•
|
Investment in systems, equipment and other assets related to contracts of $75.2 million including systems and equipment deployed in Argentina, Colombia, Africa and Mexico.
|
Italy
Capital expenditures for
2018
of
$145.7 million
principally consist of:
|
•
|
Investments in systems, equipment and other assets related to contracts of $89.0 million principally for Lotto and Machine Gaming; and
|
|
•
|
Investments in intangible assets of $52.2 million principally related to software, sports and horse racing betting rights and licenses.
|
Capital expenditures for
2017
of
$257.6 million
principally consist of:
|
•
|
Investments in systems, equipment and other assets related to contracts of $188.3 million principally for Lotto and Machine Gaming; and
|
|
•
|
Investments in intangible assets of $58.0 million principally related to software and licenses.
|
Capital expenditures for
2016
of
$145.9 million
principally consist of:
|
•
|
Investments in systems, equipment and other assets related to contracts of $91.8 million principally for Machine Gaming and Lotto;
|
|
•
|
Investments in intangible assets of $46.1 million principally related to software, customer contracts and licenses; and
|
|
•
|
Acquisitions of $7.9 million.
|
58
|
C.
|
Research and Development, Patents and Licenses, etc.
|
To remain competitive, the Company invests resources toward its R&D efforts to introduce new and innovative games with dynamic features to attract new customers and retain existing customers. The Company's R&D efforts cover multiple creative and engineering disciplines, including creative game content, hardware, electrical, systems and software for lottery, land-based, online social, and online real-money applications.
R&D costs include salaries and benefits, stock-based compensation, consultants' fees, facilities-related costs, material costs, depreciation, and travel and are expensed as incurred.
The Company devotes substantial resources on R&D and incurred
$263.3 million
,
$313.1 million
and
$343.5 million
of related expenses in
2018
,
2017
and
2016
, respectively.
|
D.
|
Trend Information
|
See “Item 5. Operating and Financial Review and Prospects — A. Operating Results” and “Item 5. Operating and Financial Review and Prospects — B. Liquidity and Capital Resources.”
|
E.
|
Off-Balance Sheet Arrangements
|
The Company has the following off-balance sheet arrangements:
Performance and other bonds
In connection with certain contracts and procurements, the Company delivered performance bonds for the benefit of customers and bid and litigation bonds for the benefit of potential customers. These bonds give the beneficiary the right to obtain payment and/or performance from the issuer of the bond if certain specified events occur. In the case of performance bonds, which generally have a term of one year, such events include the Company's failure to perform its obligations under the applicable contract. The following table provides information related to potential commitments for bonds outstanding at
December 31, 2018
:
|
($ thousands)
|
Total bonds
|
||
|
Performance bonds
|
480,744
|
|
|
|
Wide Area Progressive bonds
|
240,560
|
|
|
|
Bid and litigation bonds
|
38,411
|
|
|
|
All other bonds
|
3,154
|
|
|
|
|
762,869
|
|
|
Letters of Credit
The Parent and certain of its subsidiaries may obtain letters of credit under the Revolving Credit Facilities due July 2021 and under senior unsecured uncommitted demand credit facilities. The letters of credit secure various obligations, including obligations arising under customer contracts and real estate leases. The following table summarizes the letters of credit outstanding at
December 31, 2018
and
2017
and the weighted average annual cost of such letters of credit:
|
Letters of Credit Outstanding
|
|
|||||||||||
|
($ thousands)
|
Not under the
Revolving Credit
Facilities
|
Under the
Revolving Credit
Facilities
|
Total
|
Weighted
Average
Annual Cost
|
||||||||
|
December 31, 2018
|
453,719
|
|
—
|
|
453,719
|
|
0.98
|
%
|
||||
|
December 31, 2017
|
510,962
|
|
—
|
|
510,962
|
|
1.02
|
%
|
||||
Loxley GTECH Technology Co., LTD Guarantee
The Company has a 49% interest in Loxley GTECH Technology Co., LTD (“LGT”). LGT is a joint venture that was formed to provide an online lottery system in Thailand.
59
The Company has guaranteed, along with the 51% shareholder in LGT, performance bonds provided on behalf of LGT by an unrelated commercial lender. The performance bonds relate to LGT’s performance under the July 2005 contract between the Government Lottery Office of Thailand and LGT should such contract become operational. The Company is jointly and severally liable with the other shareholder in LGT for this guarantee. There is no scheduled termination date for the guarantee obligation. At
December 31, 2018
, the maximum liability under the guarantee was
Baht 375 million
(
$11.6 million
). The Company does not have any obligation related to this guarantee because the July 2005 contract to provide the online lottery system is not in operation due to continuing political instability in Thailand.
F.
Tabular Disclosure of Contractual Obligations
The following table summarizes payments due under the Company's significant contractual commitments at
December 31, 2018
:
|
|
Payments by calendar year
|
||||||||||||||||||||
|
Description
|
2019
|
2020
|
2021
|
2022
|
2023
|
2024 and
thereafter |
Total
|
||||||||||||||
|
4.125% Senior Secured Notes due February 2020
|
—
|
|
501,058
|
|
—
|
|
—
|
|
—
|
|
—
|
|
501,058
|
|
|||||||
|
4.750% Senior Secured Notes due March 2020
|
—
|
|
444,146
|
|
—
|
|
—
|
|
—
|
|
—
|
|
444,146
|
|
|||||||
|
5.500% Senior Secured Notes due June 2020
|
—
|
|
27,311
|
|
—
|
|
—
|
|
—
|
|
—
|
|
27,311
|
|
|||||||
|
6.250% Senior Secured Notes due February 2022
|
—
|
|
—
|
|
—
|
|
1,500,000
|
|
—
|
|
—
|
|
1,500,000
|
|
|||||||
|
4.750% Senior Secured Notes due February 2023
|
—
|
|
—
|
|
—
|
|
—
|
|
973,250
|
|
—
|
|
973,250
|
|
|||||||
|
5.350% Senior Secured Notes due October 2023
|
—
|
|
—
|
|
—
|
|
—
|
|
60,567
|
|
—
|
|
60,567
|
|
|||||||
|
3.500% Senior Secured Notes due July 2024
|
—
|
|
—
|
|
—
|
|
—
|
|
—
|
|
572,500
|
|
572,500
|
|
|||||||
|
6.500% Senior Secured Notes due February 2025
|
—
|
|
—
|
|
—
|
|
—
|
|
—
|
|
1,100,000
|
|
1,100,000
|
|
|||||||
|
6.250% Senior Secured Notes due January 2027
|
—
|
|
—
|
|
—
|
|
—
|
|
—
|
|
750,000
|
|
750,000
|
|
|||||||
|
Senior Secured Notes, long-term
|
—
|
|
972,515
|
|
—
|
|
1,500,000
|
|
1,033,817
|
|
2,422,500
|
|
5,928,832
|
|
|||||||
|
Revolving Credit Facilities due July 2021
|
—
|
|
—
|
|
428,158
|
|
—
|
|
—
|
|
—
|
|
428,158
|
|
|||||||
|
Term Loan Facility due January 2023
|
—
|
|
366,400
|
|
366,400
|
|
366,400
|
|
618,300
|
|
—
|
|
1,717,500
|
|
|||||||
|
Total Debt
(1)
|
—
|
|
1,338,915
|
|
794,558
|
|
1,866,400
|
|
1,652,117
|
|
2,422,500
|
|
8,074,490
|
|
|||||||
|
Capital Leases
(2)
|
8,946
|
|
8,304
|
|
7,499
|
|
5,809
|
|
6,097
|
|
2,978
|
|
39,633
|
|
|||||||
|
Operating Leases
(3)
|
69,690
|
|
56,204
|
|
46,092
|
|
41,324
|
|
38,155
|
|
204,216
|
|
455,681
|
|
|||||||
|
Total
|
78,636
|
|
1,403,423
|
|
848,149
|
|
1,913,533
|
|
1,696,369
|
|
2,629,694
|
|
8,569,804
|
|
|||||||
(1) Amounts presented relate to the principal amount of long-term debt and exclude the related interest expense that will be paid when due, fair value adjustments, discounts, premiums and debt issuance costs.
(2) Capital leases consist principally of the Company's facility in Providence, Rhode Island and communications equipment used in its business. The amounts presented include the interest component of the payments to the counterparties.
(3) Operating lease obligations principally relate to leases for facilities and equipment used in the Company's business. The amounts reported above include the minimum rental and payment commitments due under such leases.
60
|
G.
|
Safe Harbor Statement under the Private Securities Litigation Reform Act of 1995
|
This annual report on Form 20-F includes forward-looking statements (including within the meaning of the Private Securities Litigation Reform Act of 1995) concerning the Company and other matters. These statements may discuss goals, intentions, and expectations as to future plans, trends, events, dividends, results of operations, or financial condition, or otherwise, based on current beliefs of the management of the Company as well as assumptions made by, and information currently available to, such management. Forward-looking statements may be accompanied by words such as “aim,” “anticipate,” “believe,” “plan,” “could,” “would,” “should,” “shall,” “continue,” “estimate,” “expect,” “forecast,” “future,” “guidance,” “intend,” “may,” “will,” “possible,” “potential,” “predict,” “project” or the negative or other variations of them. These forward-looking statements speak only as of the date on which such statements are made and are subject to various risks and uncertainties, many of which are outside the Company’s control. Should one or more of these risks or uncertainties materialize, or should any of the underlying assumptions prove incorrect, actual results may differ materially from those predicted in the forward-looking statements and from past results, performance, or achievements. Therefore, you should not place undue reliance on such statements. Factors that could cause actual results to differ materially from those in the forward-looking statements include (but are not limited to):
|
•
|
the possibility that the Parent will be unable to pay future dividends to shareholders or that the amount of such dividends may be less than anticipated;
|
|
•
|
the possibility that the Company may not achieve its anticipated financial results in one or more future periods;
|
|
•
|
reductions in customer spending;
|
|
•
|
a slowdown in customer payments and changes in customer demand for products and services as a result of changing
|
economic conditions or otherwise;
|
•
|
unanticipated changes relating to competitive factors in the industries in which the Company operates;
|
|
•
|
the Company’s ability to hire and retain key personnel;
|
|
•
|
the Company’s ability to attract new customers and retain existing customers in the manner anticipated;
|
|
•
|
reliance on and integration of information technology systems;
|
|
•
|
changes in legislation, governmental regulations, or the enforcement thereof that could affect the Company;
|
|
•
|
enforcement of an interpretation of the Wire Act in such a manner as to prohibit or limit activities in which the Company and its customers are engaged;
|
|
•
|
international, national, or local economic, social, or political conditions that could adversely affect the Company or its customers;
|
|
•
|
conditions in the credit markets; risks associated with assumptions the Company makes in connection with its critical
|
accounting estimates;
|
•
|
the resolution of pending and potential future legal, regulatory, or tax proceedings and investigations; and
|
|
•
|
the Company’s international operations, which are subject to the risks of currency fluctuations and foreign
|
exchange controls.
The foregoing list of factors is not exhaustive. You should carefully consider the foregoing factors and the other risks and uncertainties that affect the Company’s business, including those described in “Item 3. Key Information—D. Risk Factors” and other documents filed by the Parent from time to time with the SEC. Except as required under applicable law, the Company does not assume any obligation to update these forward-looking statements. Nothing in this annual report is intended, or is to be construed, as a profit forecast or to be interpreted to mean that earnings per share of the Parent for the current or any future financial years will necessarily match or exceed the historical published earnings per share of the Parent, as applicable. All forward-looking statements contained in this annual report on Form 20-F are qualified in their entirety by this cautionary statement.
61
|
Item 6.
|
Directors, Senior Management and Employees
|
|
A.
|
Directors and Senior Management
|
The Board currently consists of 10 directors. Seven of the current directors were determined by the Board to be independent under the listing standards and rules of the NYSE, as required by the Articles. For a director to be independent under the listing standards of the NYSE, the Board must affirmatively determine that the director has no material relationship with the Company (either directly or as a partner, stockholder or officer of an organization that has a relationship with the Company). The Board has made an affirmative determination that the members of the Board so designated in the table below meet the standards for “independence” set forth in the Parent's Corporate Governance Guidelines and applicable NYSE rules. The Articles require that for as long as the Parent’s ordinary shares are listed on the NYSE, the Parent will comply with all NYSE corporate governance standards set forth in Section 3 of the NYSE Listed Company Manual applicable to non-controlled domestic U.S. issuers, regardless of whether the Parent is a foreign private issuer.
At February 28, 2019, the Parent's directors and certain senior managers are as set forth below:
|
Name
|
|
Position
|
|
Lorenzo Pellicioli
(1)
|
|
Chairperson of the Board; Non-executive Director
|
|
James F. McCann
|
|
Vice-Chairperson of the Board; Lead Independent Director; Non-executive Director
|
|
Paget L. Alves
|
|
Independent Non-executive Director
|
|
Alberto Dessy
|
|
Independent Non-executive Director
|
|
Marco Drago
(1)
|
|
Non-executive Director
|
|
Patti S. Hart
|
|
Independent Non-executive Director
|
|
Heather J. McGregor
|
Independent Non-executive Director
|
|
|
Vincent L. Sadusky
|
|
Independent Non-executive Director
|
|
Marco Sala
|
|
Director and Chief Executive Officer
|
|
Gianmario Tondato da Ruos
|
|
Independent Non-executive Director
|
|
Renato Ascoli
|
|
Chief Executive Officer, North America
(2)
|
|
Walter Bugno
|
|
Chief Executive Officer, International
|
|
Fabio Cairoli
|
|
Chief Executive Officer, Italy
|
|
Fabio Celadon
|
Senior Vice President, Gaming Portfolio
|
|
|
Mario Di Loreto
|
Executive Vice President, People & Transformation
|
|
|
Alberto Fornaro
|
|
Executive Vice President and Chief Financial Officer
|
|
Scott Gunn
|
Senior Vice President of Corporate Public Affairs
|
|
|
Wendy Montgomery
|
Senior Vice President of Global Brand, Marketing and Communications
|
|
|
Robert Vincent
|
|
Executive Vice President for Administrative Services and External Relations
(3)
|
(1) Messrs. Pellicioli and Drago are the chief executive officer and chairperson of the board, respectively, of De Agostini.
(2) The Chief Executive Officer, North America, is the Chief Executive Officer of NAGI and NALO.
(3) Effective April 8, 2019, Mr. Vincent will be leaving his role as Executive Vice President for Administrative Services and External Relations to become the chairperson of IGT Global Solutions Corporation, the primary operating subsidiary for the U.S. lottery business. In that capacity, Mr. Vincent will serve as a senior consultant to Mr. Sala and the rest of the Company's senior leadership team.
On May 16, 2018 the Parent's directors approved an observer agreement (the “Observer Agreement”) between De Agostini and the Company permitting De Agostini to appoint an observer to attend meetings of the Parent's directors. On May 17, 2018, Paolo Ceretti, a former director of the Parent, acknowledged and agreed to his appointment by De Agostini as an observer pursuant to the terms of the Observer Agreement. The Observer Agreement expires following the meeting of the Parent's directors at which the financial results for the third quarter of 2019 are reviewed.
62
Directors
|
Lorenzo Pellicioli
, 67, has served as Chairperson of the Board since November 2018, before which he served as Vice-Chairperson of the Board since the formation of the Company in April 2015. From August 2006 to the formation of the Company, Mr. Pellicioli served on the GTECH S.p.A. (formerly Lottomatica Group) board of directors as Chairman from August 2006 to April 2015. Mr. Pellicioli has served as Chief Executive Officer of De Agostini S.p.A. since November 2005.
Mr. Pellicioli started his career as a journalist for the newspaper Giornale Di Bergamo and afterwards he became Bergamo TV Programmes Vice President. From 1978 to 1984, he held different posts in the sector of the Italian private television for Manzoni Pubblicità, Publikompass up to his nomination as Rete4 General Manager. In 1984, he joined the Gruppo Mondadori Espresso, the first Italian publishing group. He was initially appointed General Manager for Advertising Sales and Mondadori Periodici (magazines) Vice General Manager and afterwards President and CEO of Manzoni & C. S.p.A, advertising rep of the Group. From 1990 to 1997, he was appointed first President and CEO of Costa Cruise Lines in Miami, being part of Costa Crociere Group operating in the North American market (USA, Canada and Mexico) and then became Worldwide General Manager of Costa Crociere S.p.A., based in Genoa. From 1995 to 1997 he was also appointed President and CEO of the Compagnie Francaise de Croisières (Costa-Paquet), the Paris-based subsidiary of Costa Crociere. In 1997, he took part to the privatization of SEAT Pagine Gialle purchased by a group of financial investors. After the acquisition he was appointed CEO of SEAT. In February 2000, he also managed the “Internet Business Unit” of the Telecom Italia Group following the sale of SEAT. In September 2001, following the acquisition of Telecom Italia by the Pirelli Group, he resigned. Since November 2005 he has been CEO of the De Agostini Group, an Italian financial group with ownership in the publishing sector (De Agostini Editore), games and lotteries (IGT), media and communications (Atresmedia - Spanish television leader, Banijay Group - a leading company in the production and distribution of television and media content) and financial investments (DeA Capital). He is also Chairman of the Board of Directors of DeA Capital, a member of the Board of Directors of Assicurazioni Generali S.p.A., and a member of the Advisory Board of Palamon Capital Partners. He was formerly also a member of the Boards of Directors of Enel, INA-Assitalia, and Toro Assicurazioni and of the Advisory Board of Lehman Brothers Merchant Banking. On April 3, 2017 he was honored with the title of Chevalier dans l’ordre de la Légion d’Honneur. |
|
James F. McCann
, 67, has served on the Board since the formation of the Company and is currently the Vice Chairperson, Lead Independent Director and is Chair of the Nominating and Corporate Governance Committee. He is the Chairman of 1-800-Flowers.com, Inc., and previously served as Chief Executive Officer, a position he held since 1976. Mr. McCann serves as director and Chair of the Nominating and Governance Committee of Willis Towers Watson. He previously served as the Chairman of the Board of Directors of Willis Towers Watson since January 4, 2016. Previously he served as Director (2004-2015) and non-executive Chairman (2013-2015) of Willis Group Holdings PLC (“Willis Group”). Prior to serving as the non-executive Chairman of the board of Willis Group, he served as the company’s presiding independent director. Mr. McCann also serves as a director for Scott’s Miracle-Gro.
He previously served as a director and compensation committee member of Lottomatica S.p.A. (from August 2006 to April 2011), and as a director of Gateway, Inc. and The Boyds Collection, Ltd.
|
|
Paget L. Alves
, 64, has served on the Board since the formation of the Company and is a member of the Audit Committee and the Compensation Committee. Prior to the formation of the Company, Mr. Alves served on the International Game Technology board of directors since January 2010. He served as Chief Sales Officer of Sprint Corporation, a wireless and wireline communications services provider (“Sprint”), from January 2012 to September 2013 after serving as President of the Business Markets Group since 2009. From 2003 to 2009, Mr. Alves held various positions at Sprint, including President, Sales and Distribution from 2008 to 2009; President, South Region, from 2006 to 2008; Senior Vice President, Enterprise Markets, from 2005 to 2006; and President, Strategic Markets from 2003 to 2005. Between 2000 and 2003, Mr. Alves served as President and Chief Executive Officer of PointOne Telecommunications Inc., and President and Chief Operating Officer of Centennial Communications. He currently serves on the board of directors of YUM! Brands and Synchrony Financial.
Mr. Alves previously served on the board of directors of GTECH Holdings Corporation (2005-2006), and Herman Miller, Inc. (2008-2010). Mr. Alves earned a Bachelor of Science degree in Industrial and Labor Relations and a Juris Doctor degree from Cornell University.
|
63
|
Alberto Dessy
, 66, has served on the Board since the formation of the Company in April 2015 and is a member of the Compensation Committee. From 2011 to the formation of the Company, Mr. Dessy served on the board of directors of GTECH S.p.A. (formerly Lottomatica Group). He is currently a Professor at Bocconi University. Mr. Dessy is a Chartered Accountant who specializes in corporate finance, particularly the evaluation of companies, trademarks, equity and investments, financial structure, channels and loan instruments, funding for development and in acquisitions and disposals of companies. He has been an expert witness for parties to lawsuits and as an independent expert appointed by the court in various legal disputes.
He has previously served on the boards of many companies, both listed and unlisted, including Chiorino S.p.A., Redaelli Tecna S.p.A., Laika Caravans S.p.A., Premuda S.p.A., I.M.A., Milano Centro S.p.A., and DeA Capital S.p.A. Mr. Dessy graduated from Bocconi University and a member of the distinguished faculty in corporate finance at the SDA Bocconi School of Management.
|
|
Marco Drago
, 73, has served on the Board since the formation of the Company in April 2015. From 2002 to the formation of the Company, Mr. Drago served on the board of directors of GTECH S.p.A. (formerly Lottomatica Group). Since 1997, Mr. Drago has been the Chairman of De Agostini, one of Italy’s largest family-run groups. From July 2018 he is the President of The Board of Directors of B&D Holding S.p.A. (formerly B&D Holding di Marco Drago e C.S.a.p.A., of which he was President of the Board of Partners since 2006). He is also Vice President of Planeta De Agostini Group, Director of Atresmedia, IGT PLC, DeA Capital S.p.A., De Agostini Editore S.p.A., S. Faustin (Techint Group) and member of the Assonime’s board of governors.
Mr. Drago graduated in Economics and Business at Università Bocconi in Milan in 1969. He started his career that same year in the family company joining Istituto Geografico De Agostini. In 1997 he replaced Achille Boroli as Chairman of De Agostini Holding SpA, having previously served as Executive Officer and Managing Director. He has received important awards such as
“Bocconiano dell’anno”
in 2001, and was made
“Cavaliere del Lavoro”
in 2003.
|
|
Patti S. Hart
, 62, has served on the Board since the formation of the Company and is a member of the Nominating and Corporate Governance Committee. From June 2006 to the formation of the Company, Ms. Hart served on the board of directors of International Game Technology, where she also served as CEO from April 2009 to April 2015 and President from April 2009 until July 2011. Prior to joining International Game Technology, Ms. Hart served as the Chairman and Chief Executive Officer of each of Pinnacle Systems Inc. from 2004 to 2005, Excite@Home Inc. from 2001 to 2002, and Telocity Inc. from 1999 to 2001. Ms. Hart also held various positions at Sprint Corporation, including President and Chief Operating Officer, Long Distance Division. Ms. Hart has served on numerous public company boards, including Yahoo! Inc. (2010-2012), LIN TV Corp. (2006-2009), Spansion Inc. (2005-2008), and Korn/Ferry International Inc. (2000-2009). She served on the board of the American Gaming Association from 2009 to 2016.
Ms. Hart earned a Bachelor of Science degree in Business Administration with an emphasis in Marketing and Economics from Illinois State University.
|
|
Heather J. McGregor
, 56, was appointed to the Board in March of 2017 and is a member of the Audit Committee. She is the Executive Dean of the Edinburgh Business School, the graduate school of business of Heriot Watt University in the U.K. Professor McGregor is also the principal shareholder and non-executive chairman of the executive search firm Taylor Bennett. In addition, Professor McGregor is a director of Non-Standard Finance PLC, a company specializing in offering consumer loans in the U.K. Professor McGregor has a Ph.D. from the University of Hong Kong in Structured Finance and is an experienced writer and broadcaster, including writing for the Financial Times for 17 years. Professor McGregor is also the founder of the Taylor Bennett Foundation, which works to promote diversity in the communications industry, and a founding member of the steering committee of the 30% Club, which is working to raise the representation of women at senior levels within the U.K.’s publicly listed companies.
In June 2015, Professor McGregor was made a Commander of the British Empire for her services to diversity and employment. In February 2017, she was appointed by the U.K. Government to be a member of the Honours Committee for the Economy.
|
|
Vincent L. Sadusky
, 53, has served on the Board since the formation of the Company and is Chair of the Audit Committee. Prior to the formation of the Company, Mr. Sadusky served on the International Game Technology board of directors from July 2010 to April 2015. He is Chief Executive Officer and a member of the board of directors of Univision Communications Inc. He served as President and Chief Executive Officer of Media General, Inc., one of the nation’s largest multimedia companies, from December 2014 until January 2017, following the company’s merger with LIN Media LLC. Mr. Sadusky served as President and Chief Executive Officer of LIN Media LLC from 2006 to 2014 and was Chief Financial Officer from 2004 to 2006. Prior to joining LIN Media LLC, he held several management positions, including Chief Financial Officer and Treasurer, at Telemundo Communications, Inc. from 1994 to 2004, and from 1987 to 1994, he performed attestation and consulting services with Ernst & Young, LLP. Mr. Sadusky formerly served on the board of directors of Hemisphere Media Group, Inc. Previously, he served on the Open Mobile Video Coalition, to which he served as President from 2011 until its integration into the National Association of Broadcasters in January 2013. He formerly served on the boards of directors of JVB Financial Group, LLC, Maximum Service Television, Inc., Media General, Inc. and NBC Affiliates.
Mr. Sadusky earned a Bachelor of Science degree in Accounting from Pennsylvania State University where he was a University Scholar. He earned a Master of Business Administration degree from the New York Institute of Technology.
|
64
|
Marco Sala
, 59, has served on the Board and as Chief Executive Officer of the Parent since the formation of the Company. From 2009 to the formation of the Company, Mr. Sala served as Chief Executive Officer of GTECH S.p.A. (formerly Lottomatica Group), where he served as a member of the board of directors from 2003 to the formation of the Company. Mr. Sala joined GTECH S.p.A. as Co-General Manager in 2003, and in August 2006, he was appointed Managing Director with responsibility for the Company’s Italian Operations and other European activities. He was named Chief Executive Officer of GTECH S.p.A. in April 2009 with responsibility for overseeing all of the Company’s segments, including the Americas, International, Italy, and Products and Services. Mr. Sala is also a member of the board of directors of OPAP S.A., a Greek gaming and sports betting operator.
Before joining the Company, he served as Chief Executive Officer of Buffetti, Italy’s leading office equipment and supply retail chain. Prior to Buffetti, Mr. Sala served as Head of the Italian Business Directories Division for SEAT Pagine Gialle. He was later promoted to Head of Business Directories with responsibility for a number of international companies, such as Thomson (Great Britain), Euredit (France), and Kompass (Italy). Earlier in his career, he worked as Head of the Spare Parts Divisions at Magneti Marelli (a Fiat Group company) and soon after he became Head of the Lubricants Divisions. Additionally, he held various marketing positions at Kraft Foods. Mr. Sala graduated from Bocconi University in Milan, majoring in Business and Economics.
|
|
Gianmario Tondato da Ruos
, 59, has served on the Board since the formation of the Company and is Chair of the Compensation Committee. From 2006 to the formation of the Company, Mr. Tondato da Ruos served as a Lead Independent Director of GTECH S.p.A. (formerly Lottomatica Group). Mr. Tondato da Ruos has served as the Chief Executive Officer of Autogrill S.p.A. since April 2003. He joined Autogrill Group in 2000, and moved to the United States to manage the integration of the North American subsidiary HMSHost and successfully implemented a strategic refocusing on concessions and diversification into new business sectors, distribution channels and geographies.
Mr. Tondato da Ruos is Chairman of HMSHost Corporation. He has been a director of Autogrill since March 2003, and sits on the advisory board of Rabobank (Hollande). He was formerly Chairman of World Duty Free S.p.A. and a director of World Duty Free Group S.A.U. Mr. Tondato da Ruos graduated with a degree in economics from Ca’Foscari University of Venice.
|
65
Senior Management
|
Renato Ascoli
, 57, is Chief Executive Officer, North America, and is responsible for product development, manufacturing, marketing, and delivery of all of the Company’s gaming and lottery offerings for the NAGI and NALO business units. This includes interactive and sports betting. Mr. Ascoli also currently serves on the board of directors of the American Gaming Association.
Prior to the formation of the Company, Mr. Ascoli served as General Manager of GTECH S.p.A. (formerly known as Lottomatica Group) and President of GTECH Products and Services, where he was responsible for overseeing the design, development, and delivery of state-of-the-art platforms, products, and services. He supported all stages of the sales process, and provided marketing and technology leadership to optimize investment decisions. Prior to this role, Mr. Ascoli served as Head of Italian Operations. In this position, he was responsible for the strategic direction and operations of the Company’s Italian businesses. He joined GTECH S.p.A. in 2006 as Director of the Gaming division.
From 1992 to 2005, Mr. Ascoli worked for the national railway system Ferrovie dello Stato/Trenitalia, where he held roles of increasing responsibility including head of Administration, Budget, and Control of the Local Transport Division; head of Strategies, Planning, and Control of the Transport Area; and head of the Passengers Commercial Unit. In 2000, he was appointed Marketing Director of the Passengers Division, and later served as Director of Operations and Passengers Division. He also was head of International Development for Trenitalia. Earlier in his career, he led international marketing efforts for Fincentro Group - Armando Curcio Editore, where he was responsible for commercial development of the publishing assets of Fincentro Group. He was also responsible for defining the strategic and management assets of the many companies comprising Fincentro Group. Mr. Ascoli also served as a consultant to Ambrosetti Group, supporting the internationalization process (Spain, England, and U.S.A.). He graduated from Bocconi University in Milan, majoring in Economics and Social Studies.
|
|
Walter Bugno
, 59, is Chief Executive Officer, International, and is responsible for the management and strategic development of the International region. He works directly with the Parent’s management teams to implement the Company’s vision through the ongoing delivery of value to customers, shareholders, and employees. Mr. Bugno leads the Company’s lottery, gaming, and interactive businesses throughout Europe (except Italy), as well as in the Middle East, Latin America and the Caribbean, Africa, and the Asia-Pacific region. He also oversees private manager agreement opportunities across these regions.
He joined GTECH S.p.A. (formerly known as Lottomatica Group) in July 2010 as President and CEO of SPIELO International. He led the business by capitalizing on the many growth opportunities in the gaming industry, and overseeing the Company’s long-term strategic direction. In 2012, Mr. Bugno’s portfolio expanded to include the Company’s interactive business. Under his leadership, SPIELO experienced substantial growth and became a major contributor to the Company’s total earnings. From 2006 to 2009, Mr. Bugno was the CEO of Casinos for Tabcorp Holdings Limited, Australia’s premier gambling and entertainment group. During his tenure with Tabcorp, Mr. Bugno transformed the business from being product-driven to customer-driven by revitalizing the customer casino experience with new loyalty programs, products, and customer service. Some of his successes included a new 12-year exclusive casino license with the New South Wales government, expansion of gaming products, and increases in market share.
Prior to Tabcorp, Mr. Bugno was President of Campbell Soup Company in Asia Pacific from 2002 to 2006. He was responsible for Campbell’s food products, manufacturing, and distribution. He was previously Managing Director of Lion Nathan Australia, a division of Lion, one of Australasia’s leading beverage and food companies. Mr. Bugno grew up in Australia and Italy, and has Bachelor of Commerce and Master of Commerce degrees from the University of New South Wales, Australia.
|
|
Fabio Cairoli
, 53, is Chief Executive Officer, Italy, and is responsible for managing all business lines, marketing services, and sales for the Company’s Italian operations. Through his leadership of the largest lottery operator in the world, Mr. Cairoli shares insights and best practices with other organizations in the Company. Mr. Cairoli joined the Company in 2012 as Senior Vice President of Business. He has more than 20 years of experience in consumer goods for multinational organizations, with both local and international expertise. He served as Group General Manager and Board Member of Bialetti Industrie, a world-renowned Italian manufacturer and retailer of stovetop coffee (espresso) makers and small household electrical appliances. During his tenure at Bialetti, he was responsible for turning around the business by refocusing strategy, streamlining costs, and optimizing the product portfolio and retail presence.
Prior to Bialetti, Mr. Cairoli served as General Manager of Star Alimentare, a major Italian food company, and successfully relaunched an historical brand. Additionally, he spent part of his career with Julius Meinl Italia and with Motorola Mobile Devices Italy. He also spent 10 years with Kraft Foods in Italy and the U.K. in various capacities. Mr. Cairoli holds a Bachelor’s degree in Economics from the Catholic University in Milan.
|
66
|
Fabio Celadon
, 47, is Senior Vice President, Gaming Portfolio, and is responsible for the management of the Company’s Gaming Portfolio organization. Under his direction, the organization ensures the monitoring of relevant technological advancements and market and competitive trends; the consolidation of the Company’s global research and development plan and related allocation of budgets and resources; the evolution of the Company’s content portfolio; the consolidation of hardware and content roadmaps; and, the monitoring of hardware and content roadmaps execution as well as product performance and results. Mr. Celadon most recently served as Managing Director, IGT Greater China and Senior Vice President, IGT International. In this role, he was responsible for managing IGT’s business and operations across lotteries, video lotteries, sports betting and interactive, and mobile gaming in Greater China. He was also responsible for the strategic development of IGT’s business in Greater China, India, and Japan.
Prior to April 2015, Mr. Celadon served as Senior Vice President of Group Strategy and Corporate Development for GTECH S.p.A., where he was responsible for developing GTECH’s overall corporate strategy, identifying and evaluating key strategic growth initiatives, and executing the corporate development strategy through mergers, acquisitions, joint ventures, and divestitures. Mr. Celadon has also held several strategy, corporate development, and finance positions since he joined Lottomatica Group, GTECH’s predecessor-company, in 2002. Mr. Celadon served as CFO of Lottomatica from 2002 to 2004. Following the acquisition of GTECH by Lottomatica, he relocated to the U.S. where he held the position of GTECH Vice President of New Market Development before being promoted to Senior Vice President of Strategic Planning in 2008.
Prior to joining Lottomatica, he was a partner with Atlantis Capital Partners, a private equity firm, and prior to that, he worked for Morgan Stanley in London in the mergers and acquisitions department. Mr. Celadon holds a Law Degree from LUISS Guido Carli University in Rome and an MBA from Columbia Business School in New York.
|
|
Mario Di Loreto
, 55, is Executive Vice President, People & Transformation, and is responsible for providing the overall HR leadership and strategy to further organizational development and ensure that the Company attracts, develops, and retains a talented, diverse, and engaged workforce. Prior to joining the Company, Mr. Di Loreto was Executive Vice President for Human Resources and Organization at Telecom Italia Group and its 50,000 employees, where he led a complete re-engineering of the HR management core processes across the global organization as part of a three-year People Strategy Program.
Prior to joining Telecom Italia, he spent four years as the Human Resources Group Director for Barilla, where he was responsible for 15,000 employees in 17 countries. In this role, Mr. Di Loreto participated in the re-organization of the international subsidiary companies to achieve cultural and business integration and alignment. In addition, Mr. Di Loreto has held HR positions with increasing levels of responsibility and authority with Starwood Hotels, where he was part of a global innovation team that worked under Starwood’s CEO at its U.S. headquarters to help define the evolution of the company’s organizational and business models. He has also held senior HR positions with Air One and subsequently Alitalia, where he participated in the creation and development of two low-cost carriers, Alitalia Team and Alitalia Express.
Mr. Di Loreto graduated with a Ph.D. in the Philosophy of Science from the University of Rome, and for a time, pursued an academic career before beginning his career in business.
|
|
Alberto Fornaro
, 54, is Executive Vice President and Chief Financial Officer, and is responsible for managing and developing the financial strategy for the Company globally. He oversees the Finance, Accounting Control, Legal, Investor Relations, Compliance, Strategy and Mergers & Acquisitions, and Enterprise Resource Planning (ERP) Organization, which includes making strategic and tactical decisions and improving financial strategies to maximize shareholder value and cash flow; providing high-quality financial and management reporting; and ensuring compliance of all fiscal and statutory reporting, and legal matters.
He brings more than 25 years of strong financial expertise to the Company and has an extensive record of significant international exposure.
Mr. Fornaro is an officer and/or director of the following Company subsidiaries: International Game Technology, IGT Global Solutions Corporation, IGT Foreign Holdings Corporation, IGT Canada Solutions ULC, and I.G.T. (Australia) Pty Limited.
Prior to the formation of the Company, Mr. Fornaro served as Executive Vice President and Chief Financial Officer for GTECH S.p.A. He was previously (2008-2011) Group CFO and President of the EMEA (Europe, Middle East, and Africa) division at Doosan Infracore Construction Equipment (DICE), a world leader in the construction equipment industry formed by Bobcat and Doosan Infracore. During his tenure at DICE, he led numerous integration programs and several cost-saving initiatives, helping DICE to weather the recent economic downturn and emerge as an even stronger player in a highly competitive industry.
Mr. Fornaro also served as General Manager and CFO of Technogym, the second-largest worldwide manufacturer of fitness equipment. Additionally, he spent 12 years in finance at Case New Holland (CNH) Global/Fiat Group in Italy and the U.S. At CNH, he served in many different financial capacities at the vice president level.
He holds a bachelor’s degree in Economics and Banking Sciences from the University of Siena, Italy; a master’s degree in Banking Disciplines from the University of Siena’s Post Graduate School, Italy; and was a Visiting Scholar at the Ph.D. Program in Economics at Columbia University, New York. Mr. Fornaro is licensed as a Certified Public Accountant in Illinois. Mr. Fornaro holds dual citizenship in the U.S. and Italy.
|
67
|
Scott Gunn
, 52, is Senior Vice President of Corporate Public Affairs, and is responsible for the Company’s public affairs related to government relations strategy, and is instrumental in directing and facilitating government relationships and public engagement to advance global business interests for the NAGI, NALO, and International business units. Mr. Gunn has been with the Company for more than 24 years, and has held positions in operations, sales, business development, and public affairs. Prior to his current role, he was Senior Vice President of Global Government Relations and NALO Business Development, overseeing worldwide government relations strategy and managing the Company’s global network of government relations resources, as well as pursuing public sector market opportunities for the Company’s various lines of business in North America.
Mr. Gunn began his career at a public affairs firm in Washington, D.C. He was also an Associate at National Media Inc., where he worked on media strategy for state and federal political campaigns. He has held various positions within national and state political party organizations, and has been involved with several U.S. presidential campaigns. Mr. Gunn serves on the Board of Advisors to Reviver Auto, is chairperson of the Company’s Political Action Committee, and is a member of the Company’s Executive Diversity and Inclusion Council. He has a bachelor’s degree in Political Economics from Tulane University.
|
|
Wendy Montgomery
, 56, is Senior Vice President of Global Brand, Marketing, and Communications, and oversees the strategy for the Company’s global brand, trade shows, and external communications, including community relations, responsible gaming, and corporate social responsibility. Prior to joining the Company in 2018 as Senior Vice President of Global Lottery Marketing, Ms. Montgomery spent 13 years at the Ontario Lottery and Gaming Corporation where she led marketing, sales, operations, policy and planning, and the iGaming business. Her previous experience spans multiple industries, including in the entertainment business in her role as Vice President and General Manager, W Network, under Corus Entertainment, Inc., and before that, in the telecommunications field as Vice President of Marketing with Star Choice Communications, Inc. She has also held leadership roles in apparel, consumer products, and food categories, and has previously lived and worked in South Africa, Israel, Eastern Europe, Canada, and the United States.
Ms. Montgomery is a graduate of the Executive Leadership Program at Queen’s University in Kingston, Canada. She holds a diploma in Marketing Management from the Institute of Marketing Management in Johannesburg, South Africa, as well as a Higher National Diploma in Business Studies from Greenwich University in London, U.K.
|
|
Robert Vincent
, 65, is Executive Vice President for Administrative Services and External Relations, and is responsible for overseeing global external and internal corporate communications, media relations, branding, and social responsibility programs. Additionally, he leads a centralized Administrative Services organization that includes information security, global procurement, real estate/facilities, food services, environmental health and safety, and facility security and monitoring. He is also involved in selected business development projects, as well as support activities in compliance, investor relations, marketing communications, and government relations. Previously, he served as Senior Vice President of Human Resources and Public Affairs for the Parent.
Prior to the formation of the Company, Mr. Vincent had been affiliated with GTECH S.p.A. for more than 20 years, having served as an external consultant; as Vice President of Business Development for Dreamport, GTECH’s former gaming and entertainment subsidiary; and as Senior Vice President of Human Resources and Public Affairs for GTECH S.p.A.
Before joining the Company, he was a senior partner at RDW Group, a regional advertising and public relations company in Rhode Island. He also held senior policy and administrative positions with Rhode Island-based governments, including the Governor’s Office, Secretary of State’s Office, and the Providence Mayor’s Office. In addition, he has staffed community and government affairs efforts at Brown University in Providence.
Active in the community, Mr. Vincent serves on the Family Service of Rhode Island Board of Directors, Hasbro Children’s Hospital Advisory Board, the URI Foundation Executive Committee, and the URI Harrington School of Advisory Board. He is an Emeritus Trustee of Trinity Repertory Company.
Mr. Vincent received his bachelor’s degree in Political Science from the University of Rhode Island.
|
There are no familial relationships among any of the Parent's directors or senior managers set forth above.
68
|
B.
|
Compensation
|
Non-Executive Director Compensation
The Parent’s compensation policy for non-executive directors is to provide an annual cash retainer payable in quarterly tranches as well as a stock award vesting on an annual basis. Additional cash retainers are provided for the non-executive directors serving as Chairpersons of the Board and/or members of the Audit Committee, Compensation Committee, and Nominating and Corporate Governance Committee. Awards to non-executive directors under the Long-Term Incentive ("LTI") Compensation Plan (“LTIP”) vest over the service period of the award.
LTIP - Annual Equity Awards for Continuing Non-Executive Directors
On the date of each annual meeting of the Parent’s shareholders each non-executive director continuing to serve after that date will automatically be granted an award of restricted share units (“RSUs”). The number of RSUs covered by each such award will be determined by dividing (1) the Annual Equity Award grant value by (2) the closing price of an ordinary share as of the date of grant (rounded down to the nearest whole unit). Annual equity awards granted to non-executive directors will vest on the date of the annual meeting of the Parent’s shareholders ("AGM") that occurs in the Company’s financial year after the financial year in which the date of grant occurs.
LTIP- Initial Equity Awards for New Non-Executive Directors
Each new Non-Executive Director will be granted an award of RSUs determined by dividing (1) a pro-rata portion of the Annual Equity Award value by (2) the closing share price as of that date (rounded down to the nearest whole unit). The pro-rata portion of the Annual Equity Award value will equal the Annual Equity Award value multiplied by the fraction which results from the following formula:
X - Y
X
where:
|
•
|
X is the number of days in the period beginning with (and including) the date of the AGM immediately preceding the appointment date (the Previous AGM) and ending on (and including) the date of the AGM immediately after the appointment date (the Next AGM); and
|
|
•
|
Y is the number of days in the period beginning with (and including) the date of the Previous AGM and ending on (and including) the appointment date.
|
Initial equity awards granted to non-executive directors will vest on the date of the AGM that first occurs after the grant date.
Annual Compensation
(1) All fees are established in USD but paid in GBP.
|
Position
|
Fees ($)
(1)
|
RSUs ($)
(2)
|
||||
|
Non-executive Director
|
100,000
|
|
200,000
|
|
||
|
Chairperson additional compensation
|
50,000
|
|
50,000
|
|
||
|
Vice Chairperson additional compensation
|
—
|
|
—
|
|
||
|
Lead Independent Director additional compensation
|
20,000
|
|
20,000
|
|
||
|
Committee Chairpersons additional compensation:
|
||||||
|
Audit Committee
|
40,000
|
|
—
|
|
||
|
Compensation Committee
|
30,000
|
|
—
|
|
||
|
Nominating & Corporate Governance Committee
|
20,000
|
|
—
|
|
||
(2) RSUs are calculated using the grant date fair value.
69
2018 Plan Year Actual Compensation
The following table sets forth the approximate compensation received or earned during 2018 to the Company's non-executive directors during December 31, 2018.
|
Name & Position(s)
|
Fees ($)
|
RSUs ($)
(1)
|
|||
|
Lorenzo Pellicioli
Non-executive Director
Chairperson of the Board
(2)
|
100,000
|
286,848
|
|||
|
James F. McCann
Non-executive Director
Lead Independent Director
(3)
Chairperson of the Nominating & Corporate Governance Committee
|
122,651
|
286,848
|
|||
|
Paget L. Alves
Non-executive Director
|
107,500
|
(4)
|
286,848
|
||
|
Paolo Ceretti
(5)
Former Non-executive Director
|
50,000
|
286,848
|
|||
|
Alberto Dessy
Non-executive Director
|
110,730
|
(7)
|
286,848
|
||
|
Marco Drago
Non-executive Director
|
100,000
|
286,848
|
|||
|
Patti S. Hart
Non-executive Director
|
100,000
|
286,848
|
|||
|
Heather J. McGregor
Non-executive Director
|
107,500
|
(4)
|
286,848
|
||
|
Philip G. Satre
(8)
Former Non-executive Director
Former Chairperson of the Board
|
61,331
|
512,128
|
|||
|
Vincent L. Sadusky
Non-executive Director
Chairperson of the Audit Committee
|
154,000
|
(9)
|
286,848
|
||
|
Gianmario Tondato da Ruos
Non-executive Director
Chairperson of the Compensation Committee
|
130,000
|
286,848
|
|||
(1) Represents the settlement date fair value of RSUs vested during 2018.
(2) Mr. Pellicioli was appointed Chairperson effective November 19, 2018.
(3) Mr. McCann was appointed Lead Independent Director effective November 19, 2018 and received a prorated amount of additional compensation.
(4) Includes a payment of $7,500 for participating in business activities over and above existing contractual obligations.
(5) Mr. Ceretti retired from the Board of Directors effective May 16, 2018.
(7) Includes 4% stipend related to Italian regulatory requirements.
(8) Mr. Satre retired from the Board of Directors effective August 6, 2018.
(9) Includes a payment of $14,000 for participating in business activities over and above existing contractual obligations.
Executive Officer Compensation
Total Executive Officer Compensation
The following table sets forth the approximate compensation paid or accrued during 2018 to the Company's executive officers as of December 31, 2018, including Marco Sala, Chief Executive Officer ("CEO"); Renato Ascoli, CEO of North America; Fabio Cairoli, CEO Italy; Fabio Celadon, SVP, Gaming Portfolio; Walter Bugno, CEO International; Alberto Fornaro, EVP and CFO; Robert Vincent, EVP of External Relations & Administrative Services; and Mario Di Loreto, EVP of People and Transformation. Current executive officers Scott Gunn, SVP of Corporate Public Affairs and Wendy Montgomery, SVP, Global Brand, Marketing and Communications, were appointed effective February 13, 2019, and are therefore not included in the information presented below.
70
|
Name
|
Salary
($)
(1)
|
2018 Bonus
($)
(2)
|
Equity
Awards
($)
(3)
|
FX Adjustments
(4)
|
Other
($)
(5)
|
Total
($)
(5)
|
||||||
|
Marco Sala,
Chief Executive Officer
|
922,590
|
2,325,000
|
5,578,773
|
1,150,939
|
3,039,974
|
13,017,276
|
||||||
|
Other Executive Officers
|
3,876,197
|
4,510,719
|
4,537,703
|
—
|
3,690,827
|
16,615,446
|
||||||
(1) Mr. Sala’s salary is $1,000,000. Mr. Sala is paid 70% in the U.K. in pounds sterling (converted at an exchange rate 1.33) and 30% in Italy in euros (converted at an exchange rate of 1.18). Mr. Sala's payment arrangement requires periodic true-ups related to FX fluctuations.
(2) Represents the bonus earned for the 2018 fiscal year, expected to be paid in March 2019.
(3) Represents the grant date fair value of equity compensation vested during fiscal year 2018. Mr. Sala's equity awards includes the grant date fair value of $1,640,000 and $577,500 in performance based RSUs and options, respectively, vested in 2018 subject to his 2015 CEO Co-Investment award.
(4) Represents the adjustments related to foreign currency fluctuations on prior periods' salary and bonus payments, per Mr. Sala's employment contract, which were paid in 2018.
(5) Represents the value of health and welfare benefits received by the executive officers during 2018 (including medical, dental, disability, life insurance, relocation, tax preparation, and retirement benefits). Also includes car allowances, housing allowances, and perquisites. Mr. Sala's other compensation also includes tax payments, net of $1,849,439.
Equity Compensation
Grants of Stock Options
The table below sets forth the stock options granted to the Company's executive officers during 2018 pursuant to its LTIP:
|
Name
|
No. of
Options
(1)
|
Exercise Price ($)
|
Exercise Period
|
Grant
Date
|
Expiration Date
|
||||||||
|
Marco Sala, Chief Executive Officer
|
172,500
|
|
$
|
30.12
|
|
2021-2024
|
May 15, 2018
|
May 15, 2024
|
|||||
(1) Represents options granted subject to the CEO Co-Investment award, which cliff-vests 100% in 2021 subject to meeting certain performance conditions discussed in
CEO Co-Investment Award
, and have a three-year post-vest exercise period.
Grants of Shares
The table below sets forth the shares granted pursuant to the Company's compensation plans, other than stock options, to its executive officers during 2018.
|
Name
|
No. of
Shares
|
Fair Value at
Date of
Grant
|
Vesting
Period
|
Grant
Date
|
Share’s
Market Price
upon
Grant
|
||||||||||
|
Marco Sala, Chief Executive Officer
(1)
|
172,500
|
|
$
|
16.50
|
|
2018-2021
|
May 15, 2018
|
$
|
30.12
|
|
|||||
|
Marco Sala, Chief Executive Officer
(2)
|
157,084
|
|
$
|
30.47
|
|
2018-2022
|
May 15, 2018
|
$
|
30.12
|
|
|||||
|
Other Executive Officers
(2)
|
262,319
|
|
$
|
30.47
|
|
2018-2022
|
May 15, 2018
|
$
|
30.12
|
|
|||||
(1) Represents the shares granted subject to the CEO Co-Investment Award which cliff-vests 100% in 2021 subject to meeting certain performance conditions discussed in
CEO Co-Investment Award
.
(2) Annual awards granted in 2018 will vest 50% in 2021 and 2022, respectively, based on 2018, 2019 and 2020 performance.
Short-Term Incentive Compensation Plans
The Company's short-term incentive compensation (“STI”) plans during 2018 were performance-based and designed to encourage employees to achieve both short-term financial results and longer-term strategic objectives. The Company's executive officers participated in the same STI plans as other employees during 2018. The primary focus of the STI plans was to motivate and reward executive officers and employees for the achievement of annual objectives. The STI plans were designed to recognize growth achievement with an opportunity to earn a bonus on the upside, as well as to limit the downside potential. Payments under the STI plans were based on the Company's financial performance and individual Management by Objectives (“MBOs”).
71
Executive Officers STI
|
Level
|
Financial Performance
|
Individual MBO
|
Financial Metric Mix
|
|||
|
Corporate
|
80%
|
|
20%
|
|
25% EBITDA
25% Operating Income
30% Net Debt
|
|
|
Business Unit
|
80%
|
|
20%
|
|
25% EBITDA
35% Business Unit Operating Income
20% Net Debt
|
|
For purposes of the STI plans, financial performance was measured based on Consolidated Corporate EBITDA (“EBITDA”), Corporate Operating Income ("OI") as Consolidated OI excluding Purchase Price Accounting at the Company level and Net Debt at the Company level. Executive Officers focused on a specific Business Unit also have a Business Unit metric where appropriate. The table below sets forth the minimum, target, and maximum performance thresholds for EBITDA, OI and Net Debt under the STI plans.
OI and Performance
|
Percent of OI Achieved
|
IGT OI
($ millions)
|
Payout Curve (%)
|
|||
|
90%
|
848
|
|
—
|
||
|
100%
|
942
|
|
100
|
||
|
110%
|
1,036
|
|
200
|
||
EBITDA and Performance
|
Percent of EBITDA Achieved
|
|
IGT EBITDA
($ millions)
|
|
Payout Curve (%)
|
|
|
90%
|
|
1,523
|
|
|
—
|
|
100%
|
|
1,692
|
|
|
100
|
|
110%
|
|
1,862
|
|
|
200
|
Net Debt ($ in millions)
|
Measure
|
Threshold
|
Target
|
Maximum
|
|||||||||
|
Net Debt
|
$
|
8,109
|
|
$
|
7,911
|
|
$
|
7,713
|
|
|||
|
Payout Curve
|
—
|
%
|
100
|
%
|
200
|
%
|
||||||
All financial objectives were established by the Compensation Committee of the Board of Directors for the CEO and by the Board of Directors for the other executive officers, in each case upon recommendation of the Compensation Committee.
All STI objectives had an appropriate mix of financial and individual metrics. STI payouts could be adjusted to account for unusually negative or positive financial results due to events outside of the control of the executive officers.
STI Targets as a percentage of base salary is 150% for the CEO and 87.5% to 100% for executive officers.
Long-Term Incentive Compensation Plans
The Company’s LTIP plan provides for several different types of stock awards including stock options, restricted stock and restricted stock units (RSUs), both time and performance-based. In 2018, annual awards to executive officers under the Company's LTIP were 100% performance-based RSUs, with the exception of the CEO Co-Investment Award granted to Mr. Sala.
The principal purpose of granting LTI awards is to assist the Company in attracting and retaining executive officers, to provide a market-competitive total compensation package and to motivate recipients to increase shareholder value by enabling them to participate in the value that was created, thus aligning their interests with those of its shareholders.
72
The LTI plan for 2018 is performance-based with vesting of each award tied to three performance metrics: Three-Year Cumulative Consolidated Adjusted EBITDA (profitability measure), Adjusted Net Debt (use of cash), and relative Total Shareholder Return (TSR) (performance against peers). Adjusted EBITDA and TSR were selected as performance measures because they provide strong focus on profit and alignment to shareholder returns, respectively. The Adjusted Net Debt Scoring Factor is designed to ensure focus on de-leveraging and reducing net debt. Financial objectives were established by the Compensation Committee and reviewed by the Board, consistent with the authorization provided by the Company’s shareholders. The 2018 Company-related LTI targets are based on the following economic, consolidated performance:
|
•
|
A Three-Year Cumulative Consolidated Adjusted EBITDA of at least 92.5% of the targeted total consolidated EBITDA of $5.262 billion;
|
|
•
|
An Adjusted Net Debt Scoring Factor measured on an Adjusted EBITDA/Adjusted Net Debt Scoring Matrix that positively or negatively adjusts the EBITDA payout based on net debt results versus the plan target of $7.381 billion; and
|
|
•
|
Relative Total Shareholder Return (“TSR”) against the Russell Mid Cap Market Index.
|
Awards granted in 2018 will vest 50% in 2021 and 50% in 2022 based on performance over the measurement period of 2018, 2019 and 2020.
Vesting in 2021 and 2022 Based on 2018 - 2020 Performance
Step 1: Adjusted EBITDA
|
Adjusted EBITDA Target $5.262 billion
|
<92.5%
|
|
92.5%
|
|
100%
|
|
105%
|
|
|
% Vesting
|
-
|
|
33.5%
|
|
100%
|
|
110%
|
|
Linear interpolation will be used between the applicable Adjusted EBITDA targets set forth above. In no event will the Adjusted EBITDA Payment Factor exceed 110%. Target Adjusted EBITDA for the measurement period is $5.262 billion with adjustments for the following: foreign currency exchange differences (EUR only); US GAAP accounting changes; acquisitions, divestures and asset sales; restructuring cost in excess of the Company’s strategic plan, from time to time, to be applied as negative adjustment to EBITDA.
Step 2: Adjusted Net Debt Scoring Factor
The Adjusted Net Debt Scoring Factor is a secondary scoring criteria that positively or negatively adjusts the Adjusted EBITDA payout based upon Adjusted Net Debt results versus the plan. Adjusted Net Debt refers to net debt as reported by the Company for the relevant period and Target Net Debt for the measurement period is $7.381 billion with adjustments for the following: foreign currency exchange differences (EUR only); US GAAP accounting changes; acquisitions, divestitures, asset sales, refinancing, minority capital and transaction costs; stock transactions (i.e., net settlement, buy back); timing of significant upfront contract payments; and dividends and factoring/securitization. In no event will the Adjusted Net Debt Scoring Factor exceed 106%.
Step 3: Adjusted EBITDA/Adjusted Net Debt Payment Matrix
Adjusted EBITDA and Adjusted Net Debt performance are combined in a grid of outcomes: the Adjusted EBITDA and Adjusted Net Debt Payment Matrix. The Adjusted EBITDA and Adjusted Net Debt Payment Matrix is the net vesting percentage, prior to TSR adjustment, resulting from the combined Adjusted EBITDA and Adjusted Net Debt Performance, which is determined at the end of the performance period as follows:
|
•
|
Actual Adjusted EBITDA is divided by Target Adjusted EBITDA to determine the percent attainment versus Target;
|
|
•
|
Actual Adjusted Net Debt is compared to the Target Net Debt; and
|
|
•
|
These two metrics are combined in the Adjusted EBITDA and Adjusted Net Debt Payment Matrix to result in a single financial score that is used to determine the vesting percentage prior to the TSR adjustment. In no event will the Adjusted EBITDA and Adjusted Net Debt Payment factor exceed 1.16%.
|
73
Step 4: Relative TSR Payment Factor
|
Relative TSR Payment Factor
|
<25
th
Percentile
|
|
60
th
Percentile
|
|
>75
th
Percentile
|
|
|
% Vesting
|
75%
|
|
100%
|
|
125%
|
|
The Relative TSR Payment Factor is based on relative TSR for the companies included in the Russell MidCap Index for the measurement period. After Adjusted EBITDA and Adjusted Net Debt are calculated, the TSR modifier is applied to the calculated vesting.
Step 5: Performance Factor
The Performance Factor is the product of the Adjusted EBITDA and Adjusted Net Debt Payment Matrix, multiplied by the Relative TSR Payment Factor. Actual vesting under the plan can range from 0% to 145% if all maximum targets are met.
2016 and 2017 Long-Term Incentive Awards
In 2018, the Committee adjusted the metrics used for the 2016 and 2017 long-term incentive awards to enable the Company to achieve a more balanced scoring result in its outstanding performance-based RSUs. For these awards, the Committee eliminated the Net Debt / EBITDA leverage ratio and replaced it with a three-year Adjusted EBITDA and Adjusted Net Debt measured on the same matrix utilized for the 2018 awards, as discussed above. These changes were made because the prior plan put too much weight on EBITDA, which was essentially double counted through both the Adjusted EBITDA metric and net debt to EBITDA leverage ratio. This reduced the focus on net debt, which is an important measure of de-leveraging. In addition, the number of units earned in the 2016 plan will be multiplied by 75%, effectively reducing the award by 25%.
Executive Stock Ownership Requirements
On July 28, 2015, the Board approved share ownership guidelines for Senior Vice Presidents and above. Below is a summary of the guidelines.
|
Policy Effective Date:
|
|
July 28, 2015
|
|
Stock Ownership Guidelines apply to:
|
|
Share plans starting in 2015
Any award vesting after the Policy Effective Date
Unvested Options as of the Policy Effective Date
|
|
Covered Executives:
|
|
CEO
Business Unit CEOs and Executive Vice Presidents
Senior Vice Presidents
|
|
Ownership Requirement Multiple of Base Salary:
|
|
CEO - 5X
Business Unit CEOs and Executive Vice Presidents - 3X
Senior Vice Presidents - 1X
|
|
Shares Included in Ownership:
|
|
All shares beneficially owned regardless of whether they are from a plan of the Parent or purchased on the market
Vested shares held in a trust to benefit the executive or family members
Shares under the legacy GTECH plans where vesting has been determined (earned) but shares have not been released
Note that Unearned Performance Shares do not count towards the Stock Ownership Guidelines until earned. (i.e., Performance Factor has not been determined/applied)
|
|
Legacy GTECH Holding Requirements:
|
|
Holding requirements stated in legacy GTECH Plans are still in effect, in addition to the new Stock Ownership Guidelines
|
|
Additional Holding Requirement - Not in Compliance with Stock Ownership Requirements:
|
|
50% of after tax options or shares that vest or are exercised after the effective date of the Stock Ownership Guidelines
|
|
Additional Holding Requirement - In Compliance with Stock Ownership Requirements:
|
|
20% of after tax options or shares that are exercised or vest for a period of 3 years following the exercise or vest date
|
74
Director Stock Ownership Requirements
Beginning November 10, 2020 (or five years after joining the Board if such date is subsequent to November 10, 2020), each non-executive director is expected to hold, for as long as they remain on the Board, ordinary shares of the Parent that have a fair market value equal to at least three times the base annual retainer amount then in effect for non-executive directors. The current base annual retainer amount is $100,000.
Amounts accrued for pensions and similar benefits
At
December 31, 2018
, the total amount accrued by the Company to provide pension, retirement, or similar benefits was
$15.5 million
.
Severance Arrangements
Certain executive officers of the Company are entitled to severance payments and benefits if such executive officer’s employment is terminated other than for cause under either individual employment agreements or provisions of national collective agreements for executives of the industry.
The employment agreements with United States-based executive officers (i.e., Mssrs. Fornaro, Vincent and Celadon) generally provide for the following benefits upon a termination other than for “cause.”
|
•
|
18 months of base salary, bonus (based upon a three-year average), and perquisites;
|
|
•
|
18 months tax preparation;
|
|
•
|
any accrued but unpaid bonus earned for the prior fiscal year;
|
|
•
|
a prorated bonus for the current fiscal year;
|
|
•
|
18 months of health and welfare benefit continuation; and
|
|
•
|
18 months following termination of employment to exercise vested stock options.
|
In addition, upon the United States executive officer’s death or disability, the executive officer will be entitled to the following benefits under the employment agreements:
|
•
|
18 months of base salary;
|
|
•
|
18 months of bonus (based upon a three-year average) and perquisites;
|
|
•
|
18 months of tax preparation;
|
|
•
|
any accrued but unpaid bonus earned for the prior fiscal year;
|
|
•
|
a prorated bonus for the current fiscal year;
|
|
•
|
24 months of health and welfare benefit continuation; and
|
|
•
|
18 months following termination of employment to exercise vested stock options.
|
Upon an executive officer’s retirement from the Company, these employment agreements also provide for accelerated vesting of a portion of an executive officer’s outstanding performance share awards and an ability to exercise vested options until the expiration date.
Pursuant to the terms of the Italian national collective agreement for executives of the industry (Contratto Collettivo Nazionale di Lavoro per i Dirigenti di Aziende produttrici di beni e servizi), Messrs. Sala (30% of employment), Ascoli, Cairoli, and Di Loreto are generally entitled, unless ad hoc agreements provide differently, to the following severance payments and benefits upon a termination of employment by Lottomatica Holding S.r.l. ("Lottomatica") other than for “cause,” a resignation for “good reason,” or due to the executive officer’s death or disability:
|
•
|
severance pay determined under the collective agreement;
|
|
•
|
any accrued but unpaid bonus earned for the prior fiscal year; and
|
|
•
|
a notice indemnity equal to a minimum of six and a maximum of 12 months of total base salary and STI compensation.
|
Under the Lottomatica service agreement, Mr. Sala’s base salary is €272,003 ($311,591 at of December 31, 2018) split in 13 equal gross installments, plus additional benefits, including a company car. Mr. Sala also receives an integrative pension fund in accordance with Italian law.
Mr. Sala also has a service agreement with the Parent (70% of employment) for which Mr. Sala's employment can be terminated by either party on the giving of three months’ notice, if not immediately for cause. If terminated other than for cause, Mr. Sala is
75
entitled to a severance payment worth three years of base salary and short-term incentive assumed at top level as of the termination date. Mr. Sala cannot resign without prior approval from the Board. Under this agreement, Mr. Sala shall be paid a salary of £450,520 ($574,837 at of December 31, 2018) per annum and this salary shall be reviewed by the Board annually, but the Parent is under no obligation to award an increase in salary. The Parent will also fully reimburse Mr. Sala for any expenses incurred as a result of his appointment.
CEO Co-Investment Award
To further align Mr. Sala’s interests with those of shareholders, in 2018, the Company matched Mr. Sala’s commitment to hold his shares of Company stock 1:1 (up to 345,000 shares). The current CEO Co-Investment Award was granted in 2018. The matching grant was awarded half in shares and half in stock options, and will vest only if the following conditions are met:
|
•
|
Absolute TSR is equal to or greater than 20% over the three-year performance period (the initial price of $28.32 is equal to the 20-trading-days average stock price ending on the date of grant, and the final price is equal to the 60-trading-days-average stock price ending on the approval of the Company's 2020 financial statements at the AGM in 2021);
|
|
•
|
Mr. Sala’s continued ownership of 345,000 ordinary shares during the three-year performance period;
|
|
•
|
Mr. Sala remains an executive director of the Company until the shareholders approve the Company's 2020 financial statements at the AGM in 2021; and
|
|
•
|
Mr. Sala’s agreement to re-invest 50% of the total committed and awarded shares (considering also cash proceeds for exercised stock options) (after tax) in the next three-year co-investment plan if in 2021 he is confirmed as an executive director of the Company for another three-year mandate.
|
According to the terms of Mr. Sala's Co-Investment Award, if all of the conditions listed above are met, all shares and all options will fully vest on the date the shareholders approve the Company's 2020 financial statements at the AGM in 2021. Options will have an additional three year exercise period, with the option exercise price on the date of grant of $30.12.
The CEO does not receive any other benefits under his employment contract with the Parent.
|
C.
|
Board Practices
|
The Board currently consists of 10 members. The current directors were elected by shareholder vote on May 17, 2018. See “Item 6.A. Directors, Senior Management and Employees” above. The term of office of the current Board will expire at the conclusion of the next annual general meeting of the Company. Each director may be re-elected at any subsequent general meeting of shareholders. None of the Parent's directors have service contracts with the Parent (or any subsidiary) providing for benefits upon termination of employment as a director.
The directors are responsible for the management of the Company’s business, for which purpose they may exercise all of the powers of the Parent whether relating to the management of the business or not. As described above in section “Item 6.A. Directors, Senior Management and Employees,” the Board currently comprises (i) seven independent directors including James F. McCann, the Lead Independent Director, and (ii) three non-independent directors including the Parent’s CEO, Marco Sala, the Board's Chairperson, Lorenzo Pellicioli, and Marco Drago. Messrs. Pellicioli and Drago are the chief executive officer and chairperson of the board, respectively, of De Agostini, the Parent's controlling shareholder.
The Board has the following committees: (1) an Audit Committee, (2) a Nominating and Corporate Governance Committee, and (3) a Compensation Committee. The membership of each committee meets the independence and eligibility requirements of the NYSE and applicable law. The members of each committee are appointed by and serve at the discretion of the Board until such member’s successor is duly elected and qualified or until such member’s earlier resignation or removal. The chairperson of each committee is appointed by the Board.
The Audit Committee
The Parent’s Audit Committee is responsible for, among other things, assisting the Board's oversight of:
|
•
|
the integrity of the Parent’s financial statements;
|
|
•
|
the Parent’s compliance with legal and regulatory requirements;
|
|
•
|
the independent registered public accounting firm’s qualifications and independence; and
|
|
•
|
the performance of the Parent’s internal audit function and independent registered public accounting firm.
|
76
The Audit Committee currently consists of Vincent L. Sadusky (chairperson), Paget L. Alves, and Heather J. McGregor. Each member of the Audit Committee must meet the financial literacy requirement, as such qualification is interpreted by the Board in its business judgment, or must become financially literate within a reasonable period of time after his or her appointment to the Audit Committee. In addition, at least one member of the Audit Committee must have accounting or related financial management expertise, as the Board interprets such qualification in its business judgment. See “Item 16.A. Audit Committee Financial Expert” of this annual report on Form 20-F for additional information regarding Audit Committee financial experts.
The Compensation Committee
The purpose of the Compensation Committee is to discharge the responsibilities of the Board relating to compensation of the Parent’s executives and directors. The Compensation Committee is responsible for, among other things:
|
•
|
ensuring that provisions regarding disclosure of information, including pensions, as set out in the Large and Medium-
|
sized Companies and Groups (Accounts and Reports) Regulations 2008 (U.K.), are fulfilled;
|
•
|
producing a report of the Parent’s remuneration policy and practices to be included in the Parent’s U.K. annual report and ensure that it is approved by the Board and put to shareholders for approval at the annual general meeting in accordance with the Companies Act 2006;
|
|
•
|
reviewing management recommendations and advising management on broad compensation policies such as salary
|
ranges, deferred compensation, incentive programs, pension and executive stock plans;
|
•
|
reviewing and approving goals and objectives relevant to the CEO’s compensation, evaluating the CEO’s performance
|
in light of those goals and objectives, and setting the CEO’s compensation level;
|
•
|
monitoring issues associated with CEO succession (in non-emergencies) and management development
|
|
•
|
making recommendations to the Board with respect to the Parent’s non-CEO executive officer compensation;
|
|
•
|
reviewing and recommending director compensation; and
|
|
•
|
creating, modifying, amending, terminating and monitoring compliance with stock ownership guidelines for executives and directors.
|
The Compensation Committee currently consists of Gianmario Tondato da Ruos (chairperson), Alberto Dessy, and Mr. Alves.
The Nominating and Corporate Governance Committee
The Nominating and Corporate Governance Committee is responsible for, among other things:
|
•
|
recommending to the Board, consistent with criteria approved by the Board, the names of qualified persons to be
|
nominated for election or re-election as directors and the membership and chairperson of each Board committee;
|
•
|
reviewing directorships in other public companies held by or offered to directors and senior officers of the Parent;
|
|
•
|
making recommendations to the Board for any changes, amendments and modifications to the Parent's code of conduct and promptly disclosing any waivers for directors or executive officers, as required by applicable law;
|
|
•
|
monitoring and reassessing from time to time the Parent's Corporate Governance Guidelines and recommending any
|
changes to the Board;
|
•
|
determining, at least annually, the independence of each director under the independence requirements of the NYSE
|
and any other regulatory requirements and report such findings to the Board;
|
•
|
overseeing, at least annually, the evaluation of the performance of the Board and each Board committee, as well as individual directors where appropriate;
|
|
•
|
assisting the Parent in making the periodic disclosures related to the Nominating and Corporate Governance
|
Committee and required by rules issued or enforced by the SEC;
|
•
|
making recommendations to the Board concerning CEO emergency succession plans; and
|
|
•
|
considering Parent’s legal obligations in the context of nominations and corporate governance, including any changes in applicable law and to recommendations and associated guidance from advisors, professional bodies and proxy advisory firms.
|
The Nominating and Corporate Governance Committee currently consists of Mr. McCann (chairperson) and Patti S. Hart.
The charters for each of the Audit Committee, the Compensation Committee and the Nominating and Corporate Governance Committee are available at www.igt.com; information contained thereon, including each committee charter, is not included in, or incorporated by reference into, this annual report on Form 20-F.
77
Indemnification of Members of the Board
The Parent has committed, to the fullest extent permitted under applicable law, to indemnify and hold harmless (and advance any expenses incurred, provided that the person receiving such advancement undertakes to repay such advances if it is ultimately determined such person was not entitled to indemnification), each of the Parent’s and IGT’s and their subsidiaries’ present and former directors, officers, and employees against all costs and expenses (including attorneys’ fees), judgments, fines, losses, claims, damages, liabilities, and settlement amounts paid in connection with any claim, action, suit, proceeding, or investigation arising out of or related to such person’s service as a director, officer, or employee of the Parent or IGT's or any of their subsidiaries at or prior to the formation of the Company.
The Articles and IGT’s certificate of incorporation and bylaws provide, and will continue to provide for six years following the formation of the Company, for the exculpation and indemnification of, and advancement of expenses to, the Parent's and IGT's directors, officers, and employees.
|
D.
|
Employees
|
At December 31, 2018, the Company conducted business in approximately 100 countries on six continents and had 12,100 employees. The Company believes that its relationship with its employees is generally satisfactory. Most of the Company’s employees are not represented by any labor union. However, labor agreements are common in some countries around the world and the Company recognizes such arrangements and works closely with the applicable work councils. Relations with the Company’s mid-level employees and production workers in Italy are subject to Italy’s national collective bargaining agreement for the metalworks industry. Relations with the Company’s executives in Italy are subject to the national collective bargaining agreement for executives in the industry companies producing services (CCNL Dirigenti Industria). During the last four years, the Company has not experienced any strike that significantly influenced its business activities. In the United States, three organizational units, totaling less than 100 employees, have elected representation by third-party union organizations. Collective bargaining agreements are in place with two of the organizational units and the Company is currently negotiating in good faith a collective bargaining agreement with the third organizational unit.
The Company is operated under four business segments supported by central corporate support functions.
Employees by Segment
|
|
At December 31,
|
||||||||
|
2018
|
2017
|
2016
|
|||||||
|
North America Gaming and Interactive
(1) (2) (3)
|
5,438
|
|
4,777
|
|
6,999
|
|
|||
|
North America Lottery
(2)
|
1,635
|
|
2,608
|
|
2,482
|
|
|||
|
International
(3)
|
1,505
|
|
1,542
|
|
813
|
|
|||
|
Italy
(3)
|
2,034
|
|
1,950
|
|
1,057
|
|
|||
|
Corporate Support
(1)
|
1,488
|
|
1,401
|
|
1,262
|
|
|||
|
|
12,100
|
|
12,278
|
|
12,613
|
|
|||
(1) In 2018, there was a re-organization that moved Internal IT Services headcount from North America Gaming and Interactive to the Corporate Support organization as part of the new CIO group.
(2) In 2018, there was a re-organization that combined functions from North America Gaming and Interactive and North America Lottery which increased headcount in North America Gaming and Interactive and decreased headcount in North America Lottery.
(3) In 2017, there was a re-organization that moved headcount from North America Gaming and Interactive to the International and Italy organizations.
The chart above includes 147, 172, and 151 interns and temporary employees at December 31, 2018, 2017, and 2016, respectively.
At December 31, 2018, the proportion of women among permanent employees was 31% and 20% of employees with the title of vice president or higher were female.
In 2018, 945 employees left the Company voluntarily. The staff voluntary attrition rate was 7.88%, compared to 6.74% in 2017 and 7.47% in 2016. Additionally, 426 employees had their employment involuntarily terminated, 238 of which were workforce reductions.
78
|
E.
|
Share Ownership
|
The following table sets forth information, as of February 28, 2019, regarding the beneficial ownership of the Parent's ordinary shares, including:
|
•
|
each member of the Board;
|
|
•
|
each executive officer of the Parent; and
|
|
•
|
all members of the Board and executive officers, taken together.
|
Beneficial ownership is determined under the rules of the SEC and generally includes voting or investment power over securities. Except in cases where community property laws apply or as indicated in the footnotes to this table, the Parent believes that each shareholder identified in the table possesses sole voting and investment power over all ordinary shares of the Parent shown as beneficially owned by that shareholder. Percentage of beneficial ownership is based on approximately 204.2 million ordinary shares of the Parent outstanding as of February 28, 2019.
|
Name of Beneficial Owner
|
Number of
Ordinary
Shares
(1)
|
Number of Ordinary Shares issuable upon vest within 60 days
(2)
|
Percentage
(3)
|
||||||
|
Directors:
|
|
|
|
|
|||||
|
Lorenzo Pellicioli
|
89,564
|
|
—
|
|
0.04
|
|
|||
|
James F. McCann
|
71,332
|
|
—
|
|
0.03
|
|
|||
|
Paget L. Alves
|
27,983
|
|
—
|
|
0.01
|
|
|||
|
Alberto Dessy
|
24,405
|
|
—
|
|
0.01
|
|
|||
|
Marco Drago
|
20,986
|
|
—
|
|
0.01
|
|
|||
|
Patti S. Hart
|
58,325
|
|
—
|
|
0.03
|
|
|||
|
Heather J. McGregor
|
6,106
|
|
—
|
|
less than 0.005
|
|
|||
|
Vincent L. Sadusky
|
35,123
|
|
—
|
|
0.02
|
|
|||
|
Marco Sala
|
1,515,119
|
|
45,050
|
|
0.76
|
|
|||
|
Gianmario Tondato da Ruos
|
21,993
|
|
—
|
|
0.01
|
|
|||
|
Non-Director Executive Officers:
|
|
|
|
|
|
|
|||
|
Renato Ascoli
|
324,198
|
|
19,711
|
|
0.17
|
|
|||
|
Walter Bugno
|
368,799
|
|
14,344
|
|
0.19
|
|
|||
|
Fabio Cairoli
|
49,540
|
|
11,688
|
|
0.03
|
|
|||
|
Fabio Celadon
|
38,134
|
|
2,148
|
|
0.02
|
|
|||
|
Mario Di Loreto
|
—
|
|
5,312
|
|
less than 0.005
|
|
|||
|
Alberto Fornaro
|
309,358
|
|
15,938
|
|
0.16
|
|
|||
|
Scott Gunn
|
53,976
|
|
3,094
|
|
0.03
|
|
|||
|
Wendy Montgomery
|
—
|
|
748
|
|
less than 0.005
|
|
|||
|
Robert Vincent
|
71,938
|
|
4,250
|
|
0.04
|
|
|||
|
All Board members and executive officers as a group
|
3,086,879
|
|
122,283
|
|
1.57
|
|
|||
(1) Includes shares issuable upon the exercise of options which are exercisable as of March 8, 2019, the details of which are included in the "Amount Exercisable (Vested)" in the table below.
(2) Represents performance share units expected in the next 60 days, fractional amounts have been rounded to the nearest whole number. Excludes shares issuable upon the exercise of options.
(3) Any securities not outstanding that are subject to options or conversion privileges exercisable within 60 days of March 8, 2019 are deemed outstanding for the purpose of computing the percentage of outstanding securities of the class owned by any person holding such securities and by all Board members and executive officers as a group, but are not deemed outstanding for the purpose of computing the percentage of the class owned by any other individual person. Except where noted, percentages have been rounded to the nearest hundredth.
79
The table below sets forth the options on the Parent’s ordinary shares granted to each executive officer that were outstanding as of March 1, 2019. As of such date, neither Mssrs Cairoli and Di Loreto nor Ms. Montgomery held outstanding options. Further, none of the directors held outstanding options other than Marco Sala. For each of the option grants listed below, the options are exercisable for ordinary shares of the Parent, and there is no purchase price applicable to the options other than the exercise price indicated below.
|
Name
|
Grant Date
|
Amount of
Shares
Underlying
Grant
|
Amount
Exercisable (Vested)
|
Amount
Unexercisable (Unvested)
|
Exercise
Price
|
Expiration Date
|
|||||||||||
|
Marco Sala
|
July 30, 2013
|
349,069
|
|
251,329
|
|
—
|
|
$
|
21.74
|
|
May 27, 2019
|
||||||
|
|
July 31, 2014
|
420,673
|
|
328,124
|
|
—
|
|
$
|
20.29
|
|
May 26, 2020
|
||||||
|
November 30, 2015
|
250,000
|
|
250,000
|
|
—
|
|
$
|
15.53
|
|
December 31, 2022
|
|||||||
|
May 15, 2018
|
172,500
|
|
—
|
172,500
|
|
$
|
30.12
|
|
May 15, 2024
|
||||||||
|
Renato Ascoli
|
July 30, 2013
|
125,665
|
|
90,478
|
|
—
|
|
$
|
21.74
|
|
May 27, 2019
|
||||||
|
Walter Bugno
|
July 30, 2013
|
93,085
|
|
67,021
|
|
—
|
|
$
|
21.74
|
|
May 27, 2019
|
||||||
|
|
July 31, 2014
|
117,521
|
|
91,666
|
|
—
|
|
$
|
20.29
|
|
May 26, 2020
|
||||||
|
Fabio Celadon
|
July 30, 2013
|
10,704
|
|
7,706
|
|
—
|
|
$
|
21.74
|
|
May 27, 2019
|
||||||
|
July 31, 2014
|
17,094
|
|
13,333
|
|
—
|
|
$
|
20.29
|
|
May 26, 2020
|
|||||||
|
Alberto Fornaro
|
July 30, 2013
|
84,707
|
|
60,989
|
|
—
|
|
$
|
21.74
|
|
May 27, 2019
|
||||||
|
|
July 31, 2014
|
106,944
|
|
83,416
|
|
—
|
|
$
|
20.29
|
|
May 26, 2020
|
||||||
|
Robert Vincent
|
July 30, 2013
|
12,101
|
|
8,712
|
|
—
|
|
$
|
21.74
|
|
May 27, 2019
|
||||||
|
|
July 31, 2014
|
32,051
|
|
24,999
|
|
—
|
|
$
|
20.29
|
|
May 26, 2020
|
||||||
|
Scott Gunn
|
July 30, 2013
|
21,409
|
|
15,414
|
|
—
|
|
$
|
21.74
|
|
May 27, 2019
|
||||||
|
July 31, 2014
|
27,029
|
|
21,082
|
|
—
|
|
$
|
20.29
|
|
May 26, 2020
|
|||||||
For a further discussion of stock-based employee compensation, please see “Notes to the Consolidated Financial Statements—
22
. Stock-Based Compensation.”
80
|
Item 7.
|
Major Shareholders and Related Party Transactions
|
|
A.
|
Major Shareholders
|
At February 28, 2019, the Parent's outstanding capital stock consisted of 204,210,731 ordinary shares having a nominal value of $0.10 per share, 204,210,731 special voting shares of $0.000001 each, and 50,000 sterling non-voting shares of £1 each, held by Elian Corporate Services (U.K.) Limited. Each ordinary share carries one vote and each special voting share carries 0.9995 votes.
The following table sets forth information with respect to beneficial ownership of the Parent's ordinary shares by persons known by the Parent to beneficially own 5% or more of voting rights as a result of their ownership of ordinary shares and election to exercise the votes of special voting shares by placing the associated ordinary shares on the Loyalty Register as of February 28, 2019.
|
Name of Beneficial Owner
|
Number of
Ordinary
Shares Owned
|
Percent of
Ordinary
Shares Owned
|
Number of Ordinary Shares on the Loyalty Register
|
Percent of Total
Voting Power
|
||||
|
De Agostini S.p.A.
|
103,422,324
|
|
50.64
|
%
|
103,422,324
|
|
67.23
|
%
|
At February 28, 2019, B&D Holding di Marco Drago e C. S.a.p.a. ("B&D Holding") owned 72.68% of De Agostini. Marco Drago is the chairperson and a director of B&D Holding, and Lorenzo Pellicioli is a director of B&D Holding. B&D Holding is in turn owned by members of the Boroli and Drago families.
Significant Changes in Ownership
Prior to January 1, 2018, De Agostini's wholly-owned subsidiary, DeA Partecipazioni S.p.A., held 10,073,006 ordinary shares. Effective January 1, 2018, DeA Partecipazioni S.p.A. merged into De Agostini, resulting in the transfer of ownership of 10,073,006 ordinary shares from DeA Partecipazioni S.p.A. to De Agostini.
On May 22, 2018, De Agostini entered into a variable forward transaction (the "Variable Forward Transaction") with Credit Suisse International ("Credit Suisse") relating to
18.0 million
of the Company's ordinary shares owned by De Agostini (the "Variable Forward Transaction Shares"). As part of the Variable Forward Transaction, to hedge its exposure Credit Suisse or its affiliates borrowed approximately
13.2 million
of the Company's ordinary shares from third-party stock lenders and subsequently sold such ordinary shares in an underwritten public offering through Credit Suisse Securities (USA) LLC, acting as the underwriter, pursuant to an automatically effective registration statement on Form F-3 (including a base prospectus) filed by the Company with the SEC on May 21, 2018.
The Variable Forward Transaction does not currently impact De Agostini's ownership and voting rights with respect to the Variable Forward Transaction Shares, though if De Agostini pledges any of the Variable Forward Transaction Shares to Credit Suisse as part of the Variable Forward Transaction at a future date, the Variable Forward Transaction Shares will be removed from the Loyalty Register. Credit Suisse will also have, in the event of a De Agostini default or similar enforcement event pursuant to the Variable Forward Transaction, the right to vote or direct the vote and dispose of or direct the disposition of the Variable Forward Transaction Shares pledged by De Agostini, but not to direct the votes of the related Special Voting Shares unless they subsequently elect to place such shares on the Loyalty Register in accordance with the terms of the Loyalty Plan.
De Agostini elected, effective as of May 25, 2018, to place all its owned ordinary shares, including the Variable Forward Transaction Shares, on the Loyalty Register, thereby gaining the power to exercise the votes of the related Special Voting Shares. As of February 28, 2019, no other shareholder has elected to place any ordinary shares on the Loyalty Register. For more information regarding the Special Voting Shares and the Loyalty Register, please see “Item 10.B Memorandum and Articles of Association—Loyalty Plan.”
Voting Rights
De Agostini controls the Parent but does not have different voting rights from the Parent's other shareholders, aside from the election to exercise the votes of the special voting shares related to the shares owned by De Agostini. However, through its voting rights, De Agostini has the ability to control the Company and significantly influence the decisions submitted to a vote of the Parent's shareholders, including approval of annual dividends, the election and removal of directors, mergers or other business combinations, the acquisition or disposition of assets and issuances of equity, and the incurrence of indebtedness.
81
Additional Share Information
The Parent's ordinary shares are listed and can be traded on the NYSE in U.S. dollars. The Parent's ordinary shares may be held in the following two ways:
|
•
|
beneficial interests in the Parent's ordinary shares that are traded on the NYSE are held through the book-entry system provided by The Depository Trust Company (“DTC”) and are registered in the register of shareholders in the name of Cede & Co., as DTC’s nominee; and
|
|
•
|
in certificated form
|
All of the Parent's ordinary shares are held on the U.S. registry. As at February 28, 2019, there were 110 record holders in the U.S. holding approximately 49.35% of the Parent's outstanding ordinary shares, including ordinary shares held by Cede & Co., the nominee for DTC. Ordinary shares held through DTC may be beneficially owned by holders within or outside of the U.S. The shares held by De Agostini are beneficially owned by an entity organized under the laws of Italy. At February 28, 2019, there were 204,210,731 special voting shares of the Parent outstanding, which are all held by Computershare Company Nominees Limited in its capacity as the nominee appointed by the Parent to hold the special voting shares under the terms of the Parent’s Loyalty Plan.
The Parent's special voting shares are not listed on the NYSE and will be transferable only in very limited circumstances. For more information regarding the Special Voting Shares, please see “Item 10.B Memorandum and Articles of Association—Loyalty Plan.”
|
B.
|
Related Party Transactions
|
The Company engages in business transactions with certain related parties, which include (i) entities and individuals capable of exercising control, joint control, or significant influence over the Company, (ii) De Agostini or entities directly or indirectly controlled by De Agostini and (iii) unconsolidated subsidiaries or joint ventures of the Company. Members of the Company’s Board of Directors, executives with authority for planning, directing and controlling the activities of the Company and such Directors' and executives' close family members are also considered related parties.
The Company generally carries out transactions with related parties on commercial terms that are normal in their respective markets, considering the characteristics of the goods or services involved. For a further discussion of transactions with related parties, please see “Notes to the Consolidated Financial Statements -
26
.
Related Party Transactions.”
|
C.
|
Interests of Experts and Counsel
|
Not applicable.
Item 8.
Financial Information
|
A.
|
Consolidated Statements and Other Financial Information
|
See “Item 18. Financial Statements” for the Company's Consolidated Financial Statements including the Notes thereto and reports of its independent registered accounting firm. The Company has not yet implemented a formal policy on dividend distributions.
|
B.
|
Significant Changes
|
Not applicable.
Item 9.
The Offer and Listing
|
A.
|
Offer and Listing Details
|
The Parent's ordinary shares are listed on the NYSE under the symbol “IGT.”
|
B.
|
Plan of Distribution
|
Not applicable.
82
|
C.
|
Markets
|
The Parent's outstanding ordinary shares are listed on the NYSE under the symbol “IGT.”
|
D.
|
Selling Shareholders
|
Not applicable.
|
E.
|
Dilution
|
Not applicable.
|
F.
|
Expenses of the Issue
|
Not applicable.
|
Item
10.
|
Additional Information
|
|
A.
|
Share Capital
|
Not applicable.
|
B.
|
Memorandum and Articles of Association
|
The Parent is a public limited company registered in England and Wales under company number 09127533. Its objects are unrestricted, in line with the default position under the CA 2006. The following is a summary of certain provisions of the Articles and of the applicable laws of England. The following is a summary and, therefore, does not contain full details of the Articles, which are attached as Exhibit 1.1 to this annual report on Form 20-F.
Board of directors (the “Board”)
Directors’ interests
Except as otherwise provided in the Articles, a director may not vote on or be counted in the quorum in relation to a resolution of the directors or committee of the directors concerning a matter in which he has a direct or indirect interest which is, to his knowledge, a material interest (otherwise than by virtue of his interest in shares or debentures or other securities of or otherwise in or through the Parent), including with respect to compensation, but this prohibition does not apply to any interest arising only because a resolution concerns any of the following matters:
|
•
|
the giving of a guarantee, security, or indemnity in respect of money lent or obligations incurred by him or any other person at the request of or for the benefit of the Parent or any of its subsidiary undertakings;
|
|
•
|
the giving of a guarantee, security, or indemnity in respect of a debt or obligation of the Parent or any of its subsidiary undertakings for which the director has assumed responsibility in whole or in part, either alone or jointly with others, under a guarantee or indemnity or by the giving of security;
|
|
•
|
a transaction or arrangement concerning an offer of shares, debentures, or other securities of the Parent or any of its subsidiary undertakings for subscription or purchase, in which offer he is or may be entitled to participate as a holder of securities or in the underwriting or sub-underwriting of which he is to participate;
|
|
•
|
a transaction or arrangement to which the Parent is or is to be a party concerning another company (including a subsidiary undertaking of the Parent) in which he or any person connected with him is interested (directly or indirectly) whether as an officer, shareholder, creditor, or otherwise (a “relevant company”), if he and any persons connected with him do not to his knowledge hold an interest in shares (as that term is used in sections 820 to 825 of the CA 2006) representing 1% or more of either any class of the equity share capital (excluding any share of that class held as treasury shares) in the relevant company or of the voting rights available to members of the relevant company;
|
|
•
|
a transaction or arrangement for the benefit of the employees of the Parent or any of its subsidiary undertakings (including any pension fund or retirement, death or disability scheme) which does not award him a privilege or benefit not generally awarded to the employees to whom it relates; or
|
83
|
•
|
a transaction or arrangement concerning the purchase or maintenance of any insurance policy for the benefit of directors or for the benefit of persons including directors.
|
Directors’ borrowing powers
The directors may exercise all the powers of the Parent to borrow money and to mortgage or charge all or part of the undertaking, property, and assets (present or future) and uncalled capital of the Parent and, subject to the CA 2006, to issue debentures and other securities, whether outright or as collateral security for a debt, liability, or obligation of the Parent or of a third party.
Directors’ shareholding requirements
A director need not hold shares in the Parent to qualify to serve as a director.
Age limit
There is no age limit applicable to directors in the Articles.
Compliance with NYSE Rules
For as long as the Parent’s ordinary shares are listed on the NYSE, the Parent will comply with all NYSE corporate governance standards set forth in Section 303A of the NYSE Listed Company Manual applicable to non-controlled domestic U.S. issuers, regardless of whether the Parent is a foreign private issuer.
Classes of shares
The Parent has three classes of shares in issue. This includes ordinary shares of U.S. $0.10 each; special voting shares of U.S. $0.000001 each (the “Special Voting Shares”); and sterling non-voting shares of £1.00 each (the “Sterling Non-Voting Shares”).
Dividends and distributions
Subject to the CA 2006, the Parent's shareholders may declare a dividend on the Parent's ordinary shares by ordinary resolution, and the Board may decide to pay an interim dividend to holders of the Parent's ordinary shares in accordance with their respective rights and interests in the Parent, and may fix the time for payment of such dividend. Under English law, dividends may only be paid out of distributable reserves, defined as accumulated realized profits not previously utilized by distribution or capitalization less accumulated realized losses to the extent not previously written off in a reduction or reorganization of capital duly made, and not out of share capital, which includes the share premium account.
The Special Voting Shares and Sterling Non-Voting Shares do not entitle their holders to dividends.
If 12 years have passed from the date on which a dividend or other sum from the Parent became due for payment and the distribution recipient has not claimed it, the distribution recipient is no longer entitled to that dividend or other sum and it ceases to remain owing by the Parent.
The Articles also permit a scrip dividend scheme under which the directors may, with the prior authority of an ordinary resolution of the Parent, allot to those holders of a particular class of shares who have elected to receive them further shares of that class or ordinary shares in either case credited as fully paid instead of cash in respect of all or part of a dividend or dividends specified by the resolution.
84
Voting rights
Subject to any rights or restrictions as to voting attached to any class of shares and subject to disenfranchisement in the event of non-payment of any call or other sum due and payable in respect of any shares not fully paid, the voting rights of shareholders of the Parent in a general meeting are as follows:
1.
On a show of hands,
a.
the shareholder of the Parent who (being an individual) is present in person or (being a corporation) is present by a duly authorized corporate representative at a general meeting of the Parent will have one vote; and
b.
every person present who has been appointed by a shareholder as a proxy will have one vote, except where:
i.
that proxy has been appointed by more than one shareholder entitled to vote on the resolution; and
ii.
the proxy has been instructed:
A.
by one or more of those shareholders to vote for the resolution and by one or more of those shareholders to vote against the resolution; or
B. by one or more of those shareholders to vote in the same way on the resolution (whether for or against) and one or more of those shareholders has permitted the proxy discretion as to how to vote, in which case, the proxy has one vote for and one vote against the resolution.
2.
On a poll taken at a meeting, every qualifying shareholder present and entitled to vote on the resolution has one vote for every ordinary share of the Parent of which he, she, or it is the holder, and 0.9995 votes for every Special Voting Share for which he, she, or it is entitled under the terms of the Parent’s loyalty voting structure to direct the exercise of the vote.
Under the Articles, a poll on a resolution may be demanded by the chairperson, the directors, five or more people having the right to vote on the resolution, or a shareholder or shareholders (or their duly appointed proxies) having not less than 10% of either the total voting rights or the total paid up share capital. Once a resolution is declared, such persons may demand the poll both in advance of, and during, a general meeting, either before or immediately after a show of hands on such resolution.
In the case of joint holders, only the vote of the senior holder who votes (or any proxy duly appointed by him) may be counted by the Parent.
The necessary quorum for a general shareholder meeting is the shareholders who together represent at least a majority of the voting rights of all the shareholders entitled to vote at the meeting, present in person or by proxy, save that if the Parent only has one shareholder entitled to attend and vote at the general meeting, one shareholder present in person or by proxy at the meeting and entitled to vote is a quorum. In case of a meeting requisitioned by the shareholders, where the quorum is not met the meeting is dissolved. In case of other meetings, where the quorum is not met, the meeting is adjourned. If a meeting is adjourned for lack of quorum, the quorum of the adjourned meeting will be one shareholder present in person or by proxy.
The Sterling Non-Voting Shares carry no voting rights (save where required by law).
Winding up
On a return of capital of the Parent on a winding up or otherwise, the holders of the Parent's ordinary shares (and any other shares outstanding at the relevant time which rank equally with such shares) will share equally, on a share for share basis, in the Parent’s assets available for distribution, save that:
|
•
|
the holders of the Special Voting Shares will be entitled to receive out of the assets of the Parent available for distribution to its shareholders the sum of, in aggregate, U.S. $1.00 but shall not be entitled to any further participation in the assets of the Parent; and
|
85
|
•
|
the holders of the Sterling Non-Voting Shares will be entitled to receive out of the assets of the Parent available for distribution to its shareholders the sum of, in aggregate, £1.00 but shall not be entitled to any further participation in the assets of the Parent,
|
but in no case will any of such holders be entitled to any further participation in the assets of the Parent.
Redemption provisions
The Parent's ordinary shares are not redeemable.
The Special Voting Shares may be redeemed by the Parent for nil consideration in certain circumstances (as set out in the Articles).
The Sterling Non-Voting Shares may be redeemed by the Parent for nil consideration at any time.
Sinking fund provisions
None of the Parent's shares are subject to any sinking fund provision under the Articles or as a matter of English law.
Liability to further calls
No holder of any share in the Parent is liable to make additional contributions of capital in respect of its shares.
Discriminating provisions
There are no provisions discriminating against a shareholder because of his or her ownership of a particular number of shares.
Variation of class rights
Any special rights attached to any shares in the Parent's capital may (unless otherwise provided by the terms of issue of the shares of that class) be varied or abrogated, either while the Parent is a going concern or during or in contemplation of a winding up, with the consent in writing of those entitled to attend and vote at general meetings of the Parent representing 75.0% of the voting rights attaching to the Parent's ordinary shares and the Special Voting Shares, in aggregate, which may be exercised at such meetings, or with the sanction of 75% of those votes attaching to the Parent's ordinary shares and the Special Voting Shares, in aggregate, cast on a special resolution proposed at a separate general meeting of all those entitled to attend and vote at the Parent's general meetings, but not otherwise. The CA 2006 allows an English company to vary class rights of shares by a resolution of 75.0% of the shareholders of the class in question. The Articles treat the Parent's ordinary shares and the Special Voting Shares as a single class for the purposes of voting.
A resolution to vary any class rights relating to the giving, variation, revocation or renewal of any authority of the directors to allot shares or relating to a reduction of the Parent’s capital may only be varied or abrogated in accordance with the CA 2006 but not otherwise.
The rights attached to a class of shares are not, unless otherwise expressly provided for in the rights attaching to those shares, deemed to be varied by the creation, allotment, or issue of further shares ranking
pari passu
with or subsequent to them or by the purchase or redemption by the Parent of its own shares in accordance with the CA 2006.
General meetings and notices
The Board has the power to call a general meeting of shareholders at any time. The Board shall determine whether a general meeting (including an annual general meeting) is to be held as a physical general meeting or an electronic general meeting (or a combination thereof). In addition, the Board must convene such a meeting if it has received requests to do so from shareholders representing at least 5% of the paid up share capital of the Parent as carries voting rights at general meetings in accordance with section 303 of the CA 2006.
An annual general meeting must be called by not less than 21 clear days’ notice (i.e., excluding the date of receipt or deemed receipt of the notice and the date of the meeting itself). All other general meetings will be called by not less than 14 clear days’ notice. A general meeting may be called by shorter notice if it is agreed to by a majority in number of the shareholders having the
86
right to attend and vote at the meeting, being a majority who together hold not less than 95% in nominal value of the shares giving that right. At least seven clear days’ notice is required for any meeting adjourned for 28 days or more or for an indefinite period.
The notice of a general meeting will be given to the shareholders (other than any who, under the provisions of the Articles or the terms of allotment or issue of shares, are not entitled to receive notice), to the Board, to the beneficial owners nominated to enjoy information rights under the CA 2006, and to the auditors. The shareholders entitled to receive notice of and attend a general meeting are those on the share register at the close of business on a day determined by the directors. Under English law, the Parent is required to hold an annual general meeting within six months from the day following the end of its fiscal year and, subject to the foregoing, the meeting may be held at a time and place (whether physical or electronic or a combination thereof) determined by the Board whether within or outside of the U.K.
The notice of general meeting must specify a time (which must not be more than 48 hours, excluding any part of a day that is not a working day, before the time fixed for the meeting) by which a person must be entered on the share register in order to have the right to attend or vote at the meeting. Only such persons or their duly appointed proxies have the right to attend and vote at the meeting of shareholders.
Limitations on rights to own shares
There are no limitations imposed by the Articles or the applicable laws of England on the rights to own shares, including the right of non-residents or foreign persons to hold or vote the Parent's shares, other than limitations that would generally apply to all shareholders.
Change of control
There is no specific provision in the Articles that directly would have an effect of delaying, deferring, or preventing a change in control of the Parent and that would operate only with respect to a merger, acquisition, or corporate restructuring involving the Parent or any of its subsidiaries. However, the loyalty voting structure may make it more difficult for a third party to acquire, or attempt to acquire, control of the Parent. As a result of the loyalty voting structure, it is possible that a relatively large portion of the voting rights of the Parent could be concentrated in a relatively small number of holders who would have significant influence over the Parent. Such shareholders participating in the loyalty voting structure could reduce the likelihood of change of control transactions that may otherwise benefit holders of the Parent's ordinary shares. For a discussion of this risk, see “Item 3 Key Information - D. Risk Factors."
Disclosure of ownership interests in shares
Under article 59 of the Articles, shareholders must comply with the notification obligations to the Parent contained in Chapter 5 (
Vote Holder and Issuer Notification Rules
) of the Disclosure and Transparency Rules (“DTR”) (including, without limitation, the provisions of DTR 5.1.2) as if the Parent were an issuer whose home member state is in the United Kingdom, save that the obligation arises if the percentage of voting rights reaches, exceeds, or falls below 1% and each one percent threshold thereafter (up or down) up to 100%. In effect, this means that a shareholder must notify the Parent if the percentage of voting rights in the Parent it holds reaches 1% and crosses any one percent threshold thereafter (up or down).
Section 793 of the CA 2006 gives the Parent the power to require persons whom it knows have, or whom it has reasonable cause to believe have, or within the previous three years have had, any ownership interest in any shares of the Parent to disclose specified information regarding those shares. Failure to provide the information requested within the prescribed period (or knowingly or recklessly providing false information) after the date the notice is sent can result in criminal or civil sanctions being imposed against the person in default.
Under article 60 of the Articles, if any shareholder, or any other person appearing to be interested in the Parent's shares held by such shareholder, fails to give the Parent the information required by a section 793 notice, then the Board may withdraw voting and certain other rights, place restrictions on the rights to receive dividends, and transfer such shares (including any shares allotted or issued after the date of the Section 793 notice in respect of those shares).
Changes in share capital
The Articles authorize the directors, for a period of up to five years from the date of the shareholder resolution granting them authority (which resolution was passed on March 13, 2015), to purchase its own shares of any class, on the terms of any buyback contract approved by the shareholders (or otherwise as may be permitted by the CA 2006), provided that:
87
1.
the maximum aggregate number of the Parent's ordinary shares authorized to be purchased equals 20% of the total issued ordinary shares of the relevant class on April 7, 2015 (subject to adjustments for consolidation or division);
2.
the maximum price that may be paid to purchase an ordinary share of the Parent is 105% of the average market value of an ordinary share for the five business days prior to the day the purchase is made (subject to any further price restrictions contained in any buyback contract);
3.
the maximum aggregate number of Special Voting Shares authorized to be purchased will equal 20% of the total issued Special Voting Shares of the relevant class on April 7, 2015 (subject to adjustments for consolidation or division); and
4.
the maximum price that may be paid to purchase a Special Voting Share is its nominal value.
These provisions are more restrictive than required under English law; an English company is not required to set limits in its articles on the maximum aggregate number or price paid for the repurchase of its shares.
The Articles authorize the directors, for a period of up to five years from the date of the shareholder resolution granting them authority (which resolution was passed on March 13, 2015), to allot shares in the Parent, or to grant rights to subscribe for or to convert or exchange any security into shares in the Parent, up to an aggregate nominal amount (i.e., par value) of U.S. $185,000,000.
The Articles authorize the directors, for a period of up to five years from the date of the shareholder resolution granting them authority (which resolution was passed on March 13, 2015), to exclude pre-emption rights in respect of such issuances up to an aggregate nominal amount (i.e., par value) of U.S. $185,000,000.
These provisions are more restrictive than required under English law; an English company is not required to set limits in its articles on the maximum amounts for allotment of shares or exclusion of pre-emption rights.
Loyalty Plan
Scope
The Parent has implemented a loyalty plan (the “Loyalty Plan”), the purpose of which is to reward long-term ownership of the Parent's ordinary shares and promote stability of the Parent's shareholder base by granting long-term shareholders, subject to certain terms and conditions, with the equivalent of 1.9995 votes for each ordinary share that they hold. The Loyalty Plan is governed by the provisions of the Articles and the Loyalty Plan Terms and Conditions from time to time adopted by the Board, a copy of which is available on the Company's website, together with some Frequently Asked Questions.
Characteristics of Special Voting Shares
Each Special Voting Share carries 0.9995 votes. The Special Voting Shares and ordinary shares will be treated as if they are a single class of shares and not divided into separate classes for voting purposes (save upon a resolution in respect of any proposed termination of the Loyalty Plan).
The Special Voting Shares have only minimal economic entitlements. Such economic entitlements are designed to comply with English law but are immaterial for investors.
Issue
The number of Special Voting Shares on issue equals the number of ordinary shares on issue. A nominee appointed by the Parent (the “Nominee”), which is currently Computershare Company Nominees Limited, holds the Special Voting Shares on behalf of the shareholders of the Parent as a whole, and will exercise the voting rights attached to those shares in accordance with the Articles.
Participation in the Loyalty Plan
In order to become entitled to elect to participate in the Loyalty Plan, a person must maintain ownership in accordance with the Loyalty Plan for a continuous period of three years or more (an “Eligible Person”).
An Eligible Person within the Loyalty Plan Terms and Conditions may elect to participate in the Loyalty Plan by submitting a validly completed and signed election form (the “Election Form”) and, if applicable, the requisite custodial documentation, to the Parent’s designated agent (the “Agent”). The Election Form is available on the Company's website. Upon receipt of a valid Election
88
Form and, if applicable, custodial documentation, the Agent will register the relevant ordinary shares on a separate register (the “Loyalty Register”). In order for an Eligible Person’s ordinary shares to remain on the Loyalty Register, they may not be sold, disposed of, transferred, pledged or subjected to any lien, fixed or floating charge or other encumbrance, except in very limited circumstances.
Voting arrangements
The Nominee will exercise the votes attaching to the Special Voting Shares held by it from time to time at a general meeting or a class meeting: (a) in respect of any Special Voting Shares associated with ordinary shares held by an Eligible Person, in the same manner as the Eligible Person exercises the votes attaching to those IGT PLC ordinary shares; and (b) in respect of all other Special Voting Shares, in the same percentage as the outcome of the vote of any general meeting (taking into account any votes exercised pursuant to (a) above).
The proxy or voting instruction form in respect of an Eligible Person’s ordinary shares will contain an instruction and authorization in favor of the Nominee to exercise the votes attaching to the Special Voting Shares associated with those ordinary shares in the same manner as that Eligible Person exercises the votes attaching to those ordinary shares.
Transfer or withdrawal
If, at any time and for any reason, one or more ordinary shares are de-registered from the Loyalty Register, or any ordinary shares held by an Eligible Person on the Loyalty Register are sold, disposed of, transferred (other than with the benefit of a waiver in respect of certain permitted transfers), pledged or subjected to any lien, fixed or floating charge or other encumbrance, the Special Voting Shares associated with those ordinary shares will cease to confer on the Eligible Person any voting rights (or any other rights) in connection with those Special Voting Shares and such person will cease to be an Eligible Person in respect of those Special Voting Shares.
A shareholder may request the de-registration of their ordinary shares from the Loyalty Register at any time by submitting a validly completed Withdrawal Form to the Agent. The Agent will release the ordinary shares from the Loyalty Register within three business days thereafter. Upon de-registration from the Loyalty Register, such ordinary shares will be freely transferable. From the date on which the Withdrawal Form is processed by the Agent, the relevant shareholder will be considered to have waived their rights in respect of the relevant Special Voting Shares.
Termination of the Plan
The Loyalty Plan may be terminated at any time with immediate effect by a resolution passed on a poll taken at a general meeting with the approval of members representing 75% or more of the total voting rights attaching to the ordinary shares of members who, being entitled to vote on that resolution, do so in person or by proxy. For the avoidance of doubt, the votes attaching to the Special Voting Shares will not be exercisable upon such resolution.
Upon termination of the Loyalty Plan, the directors may elect to redeem or repurchase the Special Voting Shares, or to reclassify the Special Voting Share into deferred shares carrying no voting rights and no economic rights (or any other rights), save that on a return of capital or a winding up, the holder of the deferred shares shall be entitled to $1.00.
Transfer
The Special Voting Shares may not be transferred, except in exceptional circumstances, e.g., for transfers between Loyalty Plan nominees.
Repurchase or redemption
Special Voting Shares may only be purchased or redeemed by the Parent in limited circumstances, including to reduce the number of Special Voting Shares held by the Nominee in order to align the aggregate number of ordinary shares and Special Voting Shares in issue from time to time, upon termination of the Loyalty Plan or pursuant to an off-market purchase arrangement. Special Voting Shares may be redeemed for nil consideration and repurchased for (depending on the circumstances) nil consideration or their nominal value.
89
C.
Material Contracts
Observer Agreement with De Agostini
On May 16, 2018 the Parent's directors approved an observer agreement (the “Observer Agreement”) between De Agostini and the Company permitting De Agostini to appoint an observer to attend meetings of the Parent's directors. On May 17, 2018, Paolo Ceretti, a former director of the Parent, acknowledged and agreed to his appointment by De Agostini as an observer pursuant to the terms of the Observer Agreement. The Observer Agreement expires following the meeting of the Parent's directors at which the financial results for the third quarter of 2019 are reviewed.
Agreements Related to the Italian Lotto License
In March 2016, the Parent, through its subsidiary Lottomatica, Italian Gaming Holding a.s. ("IGH"), Arianna 2001, and Novomatic Italia (the "Consortium") entered into a consortium agreement (the "Consortium Agreement") to bid on the Italian Gioco del Lotto license (the “Lotto License”). On May 16, 2016, the Consortium was awarded management of the Lotto License for a nine-year term. Under the terms of the Consortium Agreement, Lottomatica is the principal operating partner to fulfill the requirements of the Lotto License. According to the bid procedure and Consortium Agreement, a joint venture company called Lottoitalia s.r.l ("Lottoitalia") has been established with Lottomatica having 61.5% equity ownership interest, and the remainder of the equity ownership shared among the other three Consortium members. For a further discussion of the Consortium Agreement's terms, please see "Notes to Consolidated Financial Statements—
19
. Non-Controlling Interests."
Illinois Contract Letter Agreement
Commencing in July 2011, the Company provided lottery management services in Illinois through Northstar Lottery Group, LLC (“Northstar”), a consortium in which a subsidiary of the Parent, IGT Global Solutions Corporation ("IGT Global") holds an 80% controlling interest. IGT Global provided certain hardware, equipment, software, and support services to Northstar under a supply agreement (the "IGT Supply Agreement"). On December 9, 2014, the Illinois Department of Lottery and Northstar entered into an agreement (the “Termination Agreement”) to terminate their relationship under the private management agreement (the “PMA”) between them.
In 2015, the Illinois Attorney General questioned the validity of the Termination Agreement which resulted in Northstar, IGT Global, and Scientific Games International, Inc. entering into a Letter Agreement (the “Letter Agreement”) with the State of Illinois and the Illinois Department of Lottery, effective September 18, 2015, that superseded the Termination Agreement. The Letter Agreement sets forth the terms governing the termination of the PMA, the transition services to be provided by Northstar, and the amendment and expiration terms of the IGT Supply Agreement. Under the terms of the Letter Agreement and extensions thereof, the PMA terminated effective as of January 1, 2018, the IGT Supply Agreement was assigned by Northstar to the new private manager of the Illinois Lottery, and the term of the IGT Supply Agreement was extended through April 1, 2019. The new private manager terminated the IGT Supply Agreement effective February 18, 2019. Pursuant to the terms of the Letter Agreement, IGT Global will be paid a fee in 2019 as consideration for the early termination of the IGT Supply Agreement.
Related Party Agreements
For a discussion of the Company's related party transactions, including additional transactions with De Agostini, please see “Notes to the Consolidated Financial Statements—
26
. Related Party Transactions.”
Compensation Arrangements
For a description of compensation arrangements with the Parent's directors and executive officers, please see “Item 6. Directors, Senior Managements and Employees — B. Compensation.”
Financing
For a description of the Company's outstanding financing agreements, please see section “Item 3. Key Information—B. Liquidity and Capital Resources—Credit Facilities and Indebtedness.”
|
D.
|
Exchange Controls
|
Other than applicable taxation, anti-money laundering, and counter-terrorist financing law and regulations and certain economic sanctions which may be in force from time to time, there are currently no English laws or regulations, or any provision of the
90
Articles, which would prevent the transfer of capital or remittance of dividends, interest, and other payments to holders of the Parent’s securities who are not residents of the U.K. on a general basis.
|
E.
|
Taxation
|
Material United States Federal Income Tax Considerations
This section summarizes certain material U.S. federal income tax considerations regarding the ownership and disposition of the Parent's ordinary shares by a U.S. holder (as defined below). This summary is based on U.S. federal income tax law, including the Internal Revenue Code of 1986, as amended (the “Code”), the Treasury regulations promulgated thereunder, administrative guidance and court decisions in effect on the date hereof, all of which are subject to change, possibly with retroactive effect, and to differing interpretations. No ruling from the Internal Revenue Service (the "IRS") has been sought with respect to any U.S. federal income tax considerations described below, and there can be no assurance that the IRS or a court will not take a contrary position. The discussion assumes that the Parent's shareholders hold their ordinary shares, as “capital assets” within the meaning of Section 1221 of the Code (generally, property held for investment). This discussion further assumes that all items or transactions identified as debt will be respected as such for U.S. federal income tax purposes.
This summary does not constitute tax advice and does not address all aspects of U.S. federal income taxation that may be relevant to the Parent's shareholders in light of their personal circumstances, including any tax consequences arising under the tax on certain investment income pursuant to the Health Care and Education Reconciliation Act of 2010 or arising under the U.S. Foreign Account Tax Compliance Act, (or any Treasury regulations or administrative guidance promulgated thereunder, any intergovernmental agreement entered into in connection therewith or any non-U.S. laws, rules or directives implementing or relating to any of the foregoing), or to shareholders subject to special treatment under the Code, including (but not limited to):
|
•
|
banks, thrifts, mutual funds, and other financial institutions;
|
|
•
|
regulated investment companies;
|
|
•
|
real estate investment trusts;
|
|
•
|
traders in securities that elect to apply a mark-to-market method of accounting;
|
|
•
|
broker-dealers;
|
|
•
|
tax-exempt organizations and pension funds;
|
|
•
|
U.S. holders that own (directly, indirectly, or constructively) 10% or more of the Company's stock (by vote or value);
|
|
•
|
insurance companies;
|
|
•
|
dealers or brokers in securities or foreign currency;
|
|
•
|
individual retirement and other deferred accounts;
|
|
•
|
U.S. holders whose functional currency is not the U.S. dollar;
|
|
•
|
U.S. expatriates;
|
|
•
|
“passive foreign investment companies” or “controlled foreign corporations”;
|
|
•
|
persons subject to the alternative minimum tax;
|
|
•
|
U.S. holders that hold their shares as part of a straddle, hedging, conversion constructive sale or other risk reduction transaction;
|
|
•
|
partnerships or other entities or other arrangements treated as partnerships for U.S. federal income tax purposes and their partners and investors; and
|
|
•
|
U.S. holders that received their shares through the exercise of employee stock options or otherwise as compensation or through a tax-qualified retirement plan.
|
This discussion does not address any non-income tax considerations or any state, local or non-U.S tax consequences. For purposes of this discussion, a "U.S. holder" means a beneficial owner of the Parent's ordinary shares that is, for U.S. federal income tax purposes:
|
•
|
an individual who is a citizen or resident of the United States;
|
|
•
|
a corporation (or other entity treated as a corporation for U.S. federal income tax purposes) created or organized in the United States or under the laws of the United States, any state thereof or the District of Columbia;
|
|
•
|
an estate, the income of which is includible in gross income for U.S. federal income tax purposes regardless of its source; or
|
|
•
|
a trust if (1) a court within the United States is able to exercise primary supervision over the administration of the trust and one or more U.S. persons have the authority to control all substantial decisions of the trust, or (2) the trust has a valid election in effect to be treated as a U.S. person for U.S. federal income tax purposes.
|
91
This discussion does not purport to be a comprehensive analysis or description of all potential U.S. federal income tax considerations. Each of the Parent's shareholders is urged to consult with such shareholder’s tax advisor with respect to the particular tax consequences of the ownership and disposition of the Parent's ordinary shares to such shareholder.
If a partnership, including for this purpose any entity or arrangement that is treated as a partnership for U.S. federal income tax purposes, holds the Parent's ordinary shares, the tax treatment of a partner therein will generally depend upon the status of such partner, the activities of the partnership and certain determinations made at the partner level. Any such holder that is a partnership and the partners in such partnership should consult their tax advisors about the U.S. federal income tax consequences of the ownership and disposition of their ordinary shares.
Ownership and Disposition of the Parent's Ordinary Shares
The following discusses certain material U.S. federal income tax consequences of the ownership and disposition of the Parent's ordinary shares by U.S. holders and assumes that the Parent will be a resident exclusively of the U.K. for all tax purposes.
Taxation of Distributions
Subject to the discussion below under "Passive Foreign Investment Company Considerations", the gross amount of distributions with respect to the Parent's ordinary shares (including the amount of any non-U.S. withholding taxes) will be taxable as dividends, to the extent that they are paid out of the Parent's current or accumulated earnings and profits, as determined under U.S. federal income tax principles. Such dividends will be includable in a U.S. holder’s gross income as ordinary dividend income on the day actually or constructively received by the U.S. holder. Such dividends will not be eligible for the dividends-received deduction allowed to corporations under the Code.
The gross amount of the dividends paid by the Parent to non-corporate U.S. holders may be eligible to be taxed at reduced rates of U.S. federal income tax applicable to “qualified dividend income.” Recipients of dividends from non-U.S. corporations will be taxed at this rate, provided that certain holding period requirements are satisfied and certain other requirements are met, if the dividends are received from “qualified foreign corporations,” which generally include corporations eligible for the benefits of an income tax treaty with the United States that the U.S. Secretary of the Treasury determines is satisfactory and includes an information exchange program. The U.S. Department of the Treasury and the IRS have determined that the U.K.- U.S. Income Tax Treaty is satisfactory for this purposes and the Parent believes that it is eligible for benefits under such treaty. Dividends paid with respect to stock of a foreign corporation which stock is readily tradable on an established securities market in the United States will also be treated as having been received from a “qualified foreign corporation.” The U.S. Department of the Treasury and the IRS have determined that common stock is considered readily tradable on an established securities market if it is listed on an established securities market in the United States, such as the NYSE.
Non-corporate U.S. holders that do not meet a minimum holding period requirement during which they are not protected from the risk of loss, or that elect to treat the dividend income as "investment income" pursuant to Section 163(d)(4) of the Code, will not be eligible for the reduced rates of taxation regardless of the Parent's status as a qualified foreign corporation. In addition, even if the minimum holding period requirement has been met, the rate reduction will not apply to dividends if the recipient of a dividend is obligated to make related payments with respect to positions in substantially similar or related property. Each U.S. holder should consult its own tax advisors regarding the application of these rules given its particular circumstances.
To the extent that the amount of any distribution exceeds the Parent’s current and accumulated earnings and profits for a taxable year, as determined under U.S. federal income tax principles, the excess will first be treated as a tax-free return of capital to the extent of each U.S. holder’s adjusted tax basis in the Parent's ordinary shares and will reduce such U.S. holder's basis accordingly. The balance of the excess, if any, will be taxed as capital gain, which would be long-term capital gain if the holder has held the Parent's ordinary shares for more than one year at the time the distribution is received. Long-term capital gain of certain non-corporate U.S. holders, including individuals, is generally taxed at reduced rates. The deduction of capital losses is subject to limitations.
The amount of any distribution paid in foreign currency will be the U.S. dollar value of the foreign currency distributed by the Parent, calculated by reference to the exchange rate in effect on the date the distribution is includible in the U.S. holder’s income, regardless of whether the payment is in fact converted into U.S. dollars on the date of receipt. Generally, a U.S. holder would not recognize any foreign currency gain or loss if the foreign currency is converted into U.S. dollars on the date the payment is received. However, any gain or loss resulting from currency exchange fluctuations during the period from the date the U.S. holder includes the distribution payment in income to the date such U.S. holder actually converts the payment into U.S. dollars will generally be treated as ordinary income or loss.
92
Sale, Exchange, or Other Taxable Disposition
Subject to the discussion below under "Passive Foreign Investment Company Considerations", a U.S. holder will generally recognize taxable gain or loss on the sale, exchange or other taxable disposition of the Parent's ordinary shares in an amount equal to the difference, if any, between the amount realized on the sale, exchange, or other taxable disposition and the U.S. holder’s tax basis in such Parent's ordinary shares. Such gain or loss generally will be capital gain or loss and will be long-term capital gain or loss if the ordinary shares have been held for more than one year. Long-term capital gain of certain non-corporate U.S. holders, including individuals, is generally taxed at reduced rates. The deduction of capital losses is subject to limitations.
Passive Foreign Investment Company Considerations
A Passive Foreign Investment Company ("PFIC") is any foreign corporation if, after the application of certain “look-through” rules, (a) at least 75% of its gross income is “passive income” as that term is defined in the relevant provisions of the Code, or (b) at least 50% of the average value of its assets produces “passive income” or is held for the production of “passive income.” The determination as to PFIC status is a fact-intensive determination that includes ascertaining the fair market value (or, in certain circumstances, tax basis) of all the Parent's assets on a quarterly basis and the character of each item of income, and cannot be completed until the close of a taxable year. If a U.S. holder is treated as owning PFIC stock, such U.S. holder will be subject to special rules generally intended to reduce or eliminate the benefit of the deferral of U.S. federal income tax that results from investing in a foreign corporation that does not distribute all of its earnings on a current basis. These rules may adversely affect the tax treatment to a U.S. holder of distributions paid by the Parent and of sales, exchanges, and other dispositions of the Parent's ordinary shares, and may result in other adverse U.S. federal income tax consequences.
The Parent believes that the ordinary shares should not be treated as shares of a PFIC in the current taxable year, and the Parent does not expect that it will become a PFIC in the future. However, there can be no assurance that the IRS will not successfully challenge this position or that the Parent will not become a PFIC at some future time as a result of changes in the Parent's assets, income, or business operations.
Each U.S. holder is urged to consult its tax advisor concerning the U.S. federal income tax consequences of acquiring, owning or disposing of the Parent's ordinary shares if the Parent is or becomes classified as a PFIC, including the possibility of making a mark-to-market election. The remainder of the discussion below assumes that the Parent is not a PFIC, has not been a PFIC and will not become a PFIC in the future.
Information Reporting
U.S. individuals and certain entities with interests in “specified foreign financial assets” (including, among other assets, the Parent's ordinary shares, unless such shares were held on such U.S. holder’s behalf through certain financial institutions) with values in excess of certain thresholds are required to file an information report with the IRS. Taxpayers that fail to file the information report when required are subject to penalties. U.S. holders should consult their own tax advisors as to the possible obligation to file such information reports in light of their particular circumstances.
Special Voting Shares
NO STATUTORY, JUDICIAL OR ADMINISTRATIVE AUTHORITY DIRECTLY DISCUSSES HOW THE RECEIPT, OWNERSHIP, OR LOSS OF ENTITLEMENT TO INSTRUCT THE NOMINEE ON HOW TO VOTE IN RESPECT OF SPECIAL VOTING SHARES SHOULD BE TREATED FOR U.S. FEDERAL INCOME TAX PURPOSES AND AS A RESULT, THE U.S. FEDERAL INCOME TAX CONSEQUENCES THEREOF ARE UNCERTAIN. ACCORDINGLY, U.S. HOLDERS SHOULD CONSULT THEIR TAX ADVISORS AS TO THE TAX CONSEQUENCES OF THE RECEIPT, OWNERSHIP, AND LOSS OF ENTITLEMENT TO INSTRUCT THE NOMINEE ON HOW TO VOTE IN RESPECT OF SPECIAL VOTING SHARES.
While the tax consequences of the receipt of special voting shares upon request from the Nominee are unclear, such receipt is not expected to constitute a separate transaction for U.S. federal income tax purposes. As such, the receipt of the special voting shares is not expected to give rise to a taxable event for U.S. federal income tax purposes.
Material U.K. Tax Considerations
The following summary is intended to apply only as a general guide to certain United Kingdom (“U.K.”) tax considerations, and is based on current U.K. tax law and current published practice of HM Revenue and Customs (“HMRC”), both of which are subject to change at any time, possibly with retrospective effect. They relate only to certain limited aspects of the U.K. taxation treatment of investors who are resident and, in the case of individuals, domiciled in (and only in) the U.K. for U.K. tax purposes (except to
93
the extent that the position of non-U.K. resident shareholders is expressly referred to), who will hold the Parent's ordinary shares as investments (other than under an individual savings account or a self-invested personal pension) and who are the beneficial owners of the Parent's ordinary shares. The statements may not apply to certain classes of investors such as (but not limited to) persons acquiring their ordinary shares in connection with an office or employment, dealers in securities, insurance companies, and collective investment schemes.
Any shareholder or potential investor should obtain advice from his or her own investment or taxation advisor.
Dividends
The Parent will not be required to withhold U.K. tax at the source from dividend payments it makes.
U.K. resident individual shareholders
Individual shareholders are no longer entitled to credit in respect of any dividend received from the Parent. Instead, and to the extent that the dividends they receive (whether from the Parent or other companies) exceed the tax free dividend allowance (£5,000 for the current tax year and £2,000 for the tax year beginning on April 6, 2018), they are taxed on such dividends at either 7.5% (for shareholders who are liable to tax only at the basic rate), 32.5% (for shareholders who are liable to pay tax at the higher rate) or 38.1% (for shareholders who are liable to pay tax at the additional rate).
U.K. resident corporate shareholders
A corporate shareholder resident in the U.K. for tax purposes which is a “small company” for the purposes of Chapter 2 of Part 9A of the Corporation Tax Act 2009 will not be subject to U.K. corporation tax on any dividend received from the Parent provided that certain conditions are met (including an anti-avoidance condition).
Other corporate shareholders resident in the U.K. for tax purposes will not be subject to U.K. corporation tax on any dividend received from the Parent so long as the dividends fall within an exempt class and certain conditions are met. For example, (1) dividends paid on shares that are not redeemable and do not carry any present or future preferential rights to dividends or to a company’s assets on its winding up, and (2) dividends paid to a person holding less than a 10% interest in the Parent should generally fall within an exempt class. However, the exemptions mentioned above are not comprehensive and are subject to anti-avoidance rules.
If the conditions for exemption are not met or cease to be satisfied, or such a corporate shareholder elects an otherwise exempt dividend to be taxable, the shareholder will be subject to U.K. corporation tax on dividends received from the Parent, at the rate of corporation tax applicable to that corporate shareholder (currently 19%).
Non-U.K. resident shareholders
A shareholder resident outside the U.K. for tax purposes and who holds the Parent's ordinary shares as investments will not generally be liable to tax in the U.K. on any dividend received from the Parent.
A non-U.K. resident shareholder may also be subject to taxation on dividend income under local law. A shareholder who is not solely resident in the U.K. for tax purposes should consult his or her own tax advisers concerning his or her tax liabilities (in the U.K. and any other country) on dividends received from the Parent, whether he or she is entitled to claim any part of the tax credit and, if so, the procedure for doing so, and whether any double taxation relief is due in any country in which he or she is subject to tax.
Taxation of Capital Gains
Disposal of the Parent's Ordinary Shares
A disposal or deemed disposal of the Parent's ordinary shares by a shareholder who is resident in the U.K. for tax purposes may, depending upon the shareholder’s circumstances and subject to any available exemptions and reliefs (such as the annual exempt amount for individuals and indexation allowance for corporate shareholders), give rise to a chargeable gain or an allowable loss for the purposes of U.K. taxation of capital gains.
94
If an individual shareholder who is subject to income tax at either the higher or the additional rate becomes liable to U.K. capital gains tax on the disposal of the Parent's ordinary shares, the applicable rate will be either 10% or 20% (save in some limited circumstances).
A shareholder who is not resident in the U.K. for tax purposes should not normally be liable to U.K. taxation on chargeable gains on a disposal of the Parent's ordinary shares. However, an individual shareholder who has ceased to be resident in the U.K. for tax purposes for a period of less than five years and who disposes of the Parent's ordinary shares during that period may be liable on his return to the U.K. to U.K. taxation on any capital gain realized (subject to any available exemption or relief).
Inheritance Tax
The Parent's ordinary shares will be assets situated in the U.K. for the purposes of U.K. inheritance tax. A gift or settlement of such assets by, or on the death of, an individual holder of such assets may (subject to certain exemptions and reliefs and depending upon the shareholder’s circumstances) give rise to a liability to U.K. inheritance tax even if the holder is not a resident of or domiciled in the U.K. for tax purposes. For inheritance tax purposes, a transfer of assets at less than market value may be treated as a gift and particular rules apply to gifts where the donor reserves or retains some benefit.
A charge to inheritance tax may arise in certain circumstances where the Parent's ordinary shares are held by close companies and by trustees of settlements. Shareholders should consult an appropriate tax adviser as to any inheritance tax implications if they intend to make a gift or transfer at less than market value or intend to hold the Parent's ordinary shares through a close company or trust arrangement.
Shareholders and/or potential investors who are in any doubt as to their tax position, or who are subject to tax in any jurisdiction other than the U.K., should consult a suitable professional advisor.
Material Italian Tax Considerations
This section describes the material Italian tax consequences of the ownership and transfer of the Parent's ordinary shares. The following description does not purport to be a comprehensive description of all the tax considerations that may be relevant to a decision to own or dispose of the shares (such as Italian inheritance and gift tax considerations, and transfer tax considerations, value-added and registration tax considerations) and, in particular does not discuss the treatment of shares that are held in connection with a permanent establishment or a fixed base through which a non-Italian resident shareholder carries on business or performs personal services in Italy.
For the purposes of this discussion, an “Italian Shareholder” is a beneficial owner of the Parent's ordinary shares that is:
|
•
|
an Italian resident individual; or
|
|
•
|
an Italian resident corporation.
|
This section does not apply to shareholders subject to special rules, including:
|
•
|
non-profit organizations, foundations and associations that are not subject to tax;
|
|
•
|
Italian commercial partnerships and assimilated entities (
società in nome collettivo, in accomandita semplice
);
|
|
•
|
Italian noncommercial partnerships (
società semplice
);
|
|
•
|
individuals holding the shares in connection with the exercise of a business activity; and
|
|
•
|
Italian real estate investment funds (
fondi comuni di investimento immobiliare
) and Italian real estate SICAF (
società di investimento a capitale fisso
).
|
In addition, where specified, this section also applies to Italian pension funds, Italian investment funds (
fondi comuni di investimento mobiliare
),
Società di Investimento Collettivo A Capitale Variabile
(“SICAVs”) and
Societa di Investimento Collettivo A Capitale Fisso
(“SICAFs”) other than real estate investment funds and SICAFs.
For the purposes of this discussion, a Non-Italian Shareholder means a beneficial owner of the Parent's ordinary shares that is neither an Italian Shareholder nor a permanent establishment or a fixed base through which a non-Italian resident shareholder carries on business or performs personal services in Italy nor a partnership.
This discussion is limited to Italian Shareholders and Non-Italian Shareholders that hold their shares directly and whose shares represent, and have represented in any 12-month period preceding each disposal: (i) a percentage of voting rights in the ordinary
95
shareholders’ meeting not greater than 2% for listed shares, or (ii) a participation in the share capital not greater than 5% for listed shares.
This section is based upon tax laws and applicable tax treaties and what is understood to be the current practice in Italy in effect on the date of the filing of this Form 20-F which may be subject to changes in the future, even on a retroactive basis. Italian Shareholders and Non-Italian Shareholders should consult their own advisors as to the Italian tax consequences of the ownership and disposal of the Parent's ordinary shares in their particular circumstances.
Ownership of the Parent's Ordinary Shares
Italian Shareholders
Taxation of Dividends
The tax treatment applicable to dividend distributions depends upon the nature of the dividend recipient, as summarized below.
Italian resident individual shareholders
Dividends paid by a non-Italian resident company, such as the Parent, to Italian resident individual shareholders are subject to a 26% tax. Such tax (i) may be applied by the taxpayer in its tax return or (ii) if an Italian withholding agent intervenes in the collection of the dividends, may be withheld by such withholding agent.
In the event that a taxpayer elects to be taxed under the
“Regime del Risparmio Gestito”
(discussed below in the paragraph entitled “—Taxation of Capital Gains—Italian resident individual shareholders”), dividends are not subject to the 26% tax, but are subject to taxation under such
“Regime del Risparmio Gestito.”
Subject to certain conditions and limitations, Italian resident individuals may be exempt from the 26% tax on dividends paid in relation to the Parent's ordinary shares if such shares are included in a long-term savings account (
piano di risparmio a lungo termine
) meeting the requirements set forth in Article 1(100-114) of Law No. 232 of 11 December 2016 (the “Budget Act 2017”).
Pursuant to Law Decree No. 167, dated June 28, 1990, as amended, Italian resident individual shareholders who hold (or are beneficial owners of) foreign financial activities not being deposited or otherwise held or traded through Italian resident financial intermediaries must, in certain circumstances, disclose the aforesaid to the Italian tax authorities in their income tax return.
Italian resident corporations
Subject to the paragraph below, Italian Shareholders subject to Italian corporate income tax (“IRES”) should benefit from a 95% exemption on dividends if certain conditions are met. The remaining 5% of dividends are treated as part of the taxable business income of such Italian resident corporations, subject to tax in Italy under the IRES.
Dividends, however, are fully subject to tax in the following circumstances: (i) dividends paid to taxpayers using IAS/IFRS in relation to shares deemed to be “held for trading” pursuant to art. 2 of the Ministerial Decree 10 January 2018; or (ii) dividends paid in relation to shares acquired through repurchase transactions, stock lending and similar transactions, unless the beneficial owner of such dividends would have benefited from the 95% exemption described in the above paragraph.
For certain companies operating in the financial field and subject to certain conditions, dividends are also included in the tax base for the regional tax on productive activities (
Imposta regionale sulle attività produttive
—“IRAP”).
Italian pension funds
Dividends paid to Italian pension funds (subject to the regime provided for by Article 17 of Italian Legislative Decree No. 252 dated December 5, 2005) are not subject to any withholding tax, but must be included in the result of the relevant portfolio accrued at the end of the tax period, which is subject to substitute tax at the rate of 20%.
Italian investment funds (fondi comuni di investimento mobiliare), SICAVs and SICAFs.
Dividends paid to Italian investment funds, SICAVs and SICAFs are neither subject to any withholding tax nor to any taxation at the level of the fund, SICAV or SICAF. A withholding tax may apply in certain circumstances at the rate of up to 26% on distributions made by the investment funds, SICAVs or SICAFs.
96
Taxation of Capital Gains
Italian resident individual shareholders
Capital gains realized upon disposal of shares or rights by an Italian resident individual shareholder are subject to Italian final substitute tax (
imposta sostitutiva
) at a 26% rate.
Capital gains and capital losses realized in the relevant tax year have to be declared in the annual income tax return (
Regime di Tassazione in Sede di Dichiarazione dei Redditi
). Losses in excess of gains may be carried forward against capital gains realized in the four subsequent tax years. While losses generated as of July 1, 2014 can be carried forward for their entire amount, losses realized until December 31, 2011 can be carried forward for 48.08% of their amount only, and losses realized between January 1, 2012 and June 30, 2014 for 76.92% of their amount.
As an alternative to the
Regime di Tassazione in Sede di Dichiarazione dei Redditi
described in the above paragraph, Italian resident individual shareholders may elect to be taxed under one of the two following regimes:
(i)
Regime del Risparmio Amministrato:
Under this regime, separate taxation of capital gains is allowed subject to (i) the shares and rights in respect of the shares being deposited with Italian banks,
società di intermediazione mobiliare
or certain authorized financial intermediaries resident in Italy for tax purposes and (ii) an express election for the
Regime del Risparmio Amministrato
being timely made in writing by the relevant shareholder. Under the
Regime del Risparmio Amministrato,
the financial intermediary is responsible for accounting for the substitute tax in respect of capital gains realized on each sale of the shares or rights on the shares, and is required to pay the relevant amount to the Italian tax authorities on behalf of the taxpayer, deducting a corresponding amount from the proceeds to be credited to the shareholder. Under the
Regime del Risparmio Amministrato,
where a sale of the shares or rights on the shares results in a capital loss, such loss may be deducted (up to 48.08% for capital losses realized until December 31, 2011 and up to 76.92% for capital losses realized between January 1, 2012 and June 30, 2014) from capital gains of the same kind subsequently realized under the same relationship of deposit in the same tax year or in the four subsequent tax years. Under the
Regime del Risparmio Amministrato,
the shareholder is not required to declare the capital gains in its annual tax return.
(ii)
Regime del Risparmio Gestito:
Under this regime, any capital gains accrued to Italian resident individual shareholders that have entrusted the management of their financial assets, including the shares and rights in respect of the shares, to an authorized Italian-based intermediary, and have elected for the
Regime del Risparmio Gestito,
are included in the computation of the annual increase in value of the managed assets accrued, even if not realized, at year-end, subject to the 26% substitute tax to be applied on behalf of the taxpayer by the managing authorized Italian-based intermediary. Under the
Regime del Risparmio Gestito
, any decline in value of the managed assets accrued at year-end may be carried forward (up to 48.08% if accrued until December 31, 2011 and up to 76.92% if accrued between January 1, 2012 and June 30, 2014) and set against increases in value of the managed assets which accrue in any of the four subsequent tax years. Under the
Regime del Risparmio Gestito,
the shareholder is not required to report capital gains realized in its annual tax declaration.
Subject to certain conditions and limitations, Italian resident individuals may be exempt from the 26% tax on capital gains related to the Parent's ordinary shares if such shares are included in a long-term savings account (
piano di risparmio a lungo termine
) meeting the requirements set forth in Article 1(100-114) of Budget Act 2017.
Italian resident corporations
Capital gains realized through the disposal of the Parent's ordinary shares by Italian Shareholders which are companies subject to IRES benefit from a 95% exemption (referred to as the “Participation Exemption Regime”), if the following conditions are met:
i.
the shares have been held continuously from the first day of the 12th month preceding the disposal; and
ii.
the shares were accounted for as a long-term investment in the first balance sheet closed after the acquisition of the shares (for companies adopting IAS/IFRS, shares are considered to be a long-term investment if they are different from those deemed to be “held for trading” pursuant to art. 2 of the Ministerial Decree 10 January 2018).
Based on the assumption that the Parent is a resident of the U.K. for tax purposes, that its ordinary shares are listed on a regulated market, that its value will be predominantly composed of shareholdings in companies carrying on a business activity and not resident in a State with a preferential tax system, the two additional conditions set forth by Article 87 of the CTA in order to enjoy
97
the Participation Exemption Regime (i.e., the company is not resident in a State with a preferential tax system and carries on a business activity) are both met.
The remaining 5% of the amount of such capital gain is included in the aggregate taxable income of the Italian resident corporate shareholders and subject to taxation according to ordinary IRES rules and rates.
If the conditions for the Participation Exemption Regime are met, capital losses from the disposal of shareholdings realized by Italian resident corporate shareholders are not deductible from the taxable income of the Company.
Capital gains and capital losses realized through the disposal of shareholdings which do not meet at least one of the aforementioned conditions for the Participation Exemption Regime are, respectively, fully included in the aggregate taxable income and fully deductible from the same aggregate taxable income, subject to taxation according to ordinary rules and rates. However, if such capital gains are realized upon disposal of shares which have been accounted for as a long-term investment on the last three balance sheets, then if the taxpayer so chooses the gains can be taxed in equal parts in the year of realization and the four following tax years.
The ability to use capital losses to offset income is subject to significant limitations, including provisions against “dividend washing.” In addition, Italian resident corporations that recognize capital losses exceeding €50,000 are subject to tax reporting requirements in their annual income tax return (also in case such capital losses are realized as a consequence of a number of transactions). Furthermore, for capital losses of more than €5,000,000, deriving from transactions on shares booked as fixed financial assets, the taxpayer must report the relevant information in its annual income tax return (also in case such capital losses are realized as a consequence of a number of transactions). Such an obligation does not apply to parties who prepare their financial statements in accordance with IAS/IFRS international accounting standards. Italian resident corporations that recognize capital losses should consult their tax advisors as to the tax consequences of such losses.
For certain types of companies operating in the financial field and subject to certain conditions, the capital gains are also included in the IRAP taxable base.
Italian pension funds
Capital gains realized by Italian pension funds are not subject to any withholding or substitute tax. Capital gains and capital losses must be included in the result of the relevant portfolio accrued at the end of the tax period, which is subject to a 20% substitute tax.
Italian investment funds (fondi comuni di investimento mobiliare), SICAVs and SICAFs.
Capital gains realized by Italian investment funds, SICAVs and SICAFs are not subject to any withholding or substitute tax. Capital gains and capital losses must be included in the investment funds, SICAV’s and SICAF’s annual results, which are not subject to tax. A withholding tax may apply in certain circumstances at the rate of up to 26% on distributions made by the funds, SICAVs and SICAFs.
Non-Italian Shareholders
Taxation of Dividends
According to Italian tax laws, the distribution of dividends by the Parent will not trigger any taxable event for Italian income tax purposes for Non-Italian Shareholders.
Taxation of Capital Gains
According to Italian tax laws, capital gains on the Parent's ordinary shares will not trigger any taxable event for Italian income tax purposes for Non-Italian Shareholders provided that the shares are not held in Italy.
Loyalty Voting Structure
NO STATUTORY, JUDICIAL, OR ADMINISTRATIVE AUTHORITY HAS PROVIDED PUBLISHED GUIDANCE ON THE ITALIAN TAX CONSEQUENCES OF THE RECEIPT, OWNERSHIP OR LOSS OF THE ENTITLEMENT TO INSTRUCT THE NOMINEE ON HOW TO VOTE IN RESPECT OF SPECIAL VOTING SHARES AND AS A RESULT, SUCH TAX CONSEQUENCES ARE UNCERTAIN. ACCORDINGLY, WE URGE ITALIAN SHAREHOLDERS TO CONSULT THEIR
98
TAX ADVISORS AS TO THE TAX CONSEQUENCES OF THE RECEIPT, OWNERSHIP, AND LOSS OF THE ENTITLEMENT TO INSTRUCT THE NOMINEE ON HOW TO VOTE IN RESPECT OF SPECIAL VOTING SHARES.
Receipt of the entitlement to instruct the Nominee on how to vote in respect of special voting shares
An Italian Shareholder that receives the entitlement to instruct the Nominee on how to vote in respect of special voting shares issued by the Parent should in principle not recognize any taxable income upon the receipt of such entitlement. Under a possible interpretation, the issue of special voting shares can be treated as the issue of bonus shares free of charge to the shareholders out of existing available reserves of the Parent. Such issue should not have any material effect on the allocation of the tax basis of an Italian Shareholder between its Parent's ordinary shares and the corresponding Parent's special voting shares. Because the special voting shares are not transferable and their very limited economic rights (equal to a fraction of the aggregate sum of $1) can be enjoyed only at the time of a return of capital of the Company, of a winding up or otherwise, the Parent believes and intends to take the position that the tax basis and the fair market value of the special voting shares is minimal. However, because the determination of the tax basis and fair market value of the special voting shares is not governed by any guidance that directly addresses such a situation and is unclear, the Italian tax authorities could assert that the tax basis and fair market value of the special voting shares as determined by the Parent are incorrect.
Loss of the entitlement to instruct the Nominee on how to vote in respect of special voting shares
The tax treatment of an Italian Shareholder that loses its entitlement to instruct the Nominee on how to vote in respect of special voting shares for no consideration is uncertain. It is possible that an Italian Shareholder should recognize a loss to the extent of the Italian Shareholder’s tax basis (if any). The deductibility of such loss depends on individual circumstances and conditions required by Italian law. It is also possible that an Italian Shareholder would not be allowed to recognize a loss upon losing its entitlement to instruct the Nominee on how to vote in respect of special voting shares and instead should increase its basis in its Parent's ordinary shares by an amount equal to the tax basis (if any) in such Parent's special voting shares.
IVAFE (Imposta sul Valore delle Attività Finanziarie detenute all’Estero)
According to Article 19 of the Law Decree of December 6, 2011, No. 201 (“Decree No. 201/2011”), implemented by the Law dated December 22, 2011, No. 214, Italian resident individuals holding financial assets-including shares-outside the Italian territory are required to pay a special tax (“IVAFE”) at the rate of 0.20%. The tax applies on the market value (or, in the lack thereof, on the nominal value or the redemption value) at the end of the relevant year of such financial assets held outside the Italian territory.
Taxpayers may deduct from the tax due a tax credit equal to any wealth taxes paid in the State where the financial assets are held (up to the amount of the Italian tax due).
Stamp Duty (Imposta di bollo)
According to Article 19 of Decree No. 201/2011, a proportional stamp duty applies on a yearly basis on the market value (or, in the lack thereof, on the nominal value or the redemption value) of any financial product or financial instrument. The stamp duty applies at the rate of 0.20% and, in respect of Italian Shareholders or Non-Italian Shareholders other than individuals, it cannot exceed €14,000. The stamp duty applies with respect to any Italian Shareholders or Non-Italian Shareholders (other than banks, insurance companies, investments and pension funds and certain other financial intermediaries) to the extent that the shares are held through an Italian-based banking or financial intermediary or insurance company.
|
F.
|
Dividends and Paying Agents
|
Not applicable.
|
G.
|
Statement of Experts
|
Not applicable.
99
|
H.
|
Documents on Display
|
The Parent files reports, including annual reports on Form 20-F, furnishes current reports on Form 6-K and discloses other information with the SEC pursuant to the rules and regulations of the SEC that apply to foreign private issuers. These may be read without charge and copied, upon payment of prescribed rates, at the public reference facility maintained by the SEC at 100 F Street, N.E., Washington, D.C. 20549. To obtain information on the operation of the public reference facility, the telephone number is 1-800-SEC-0330. Any SEC filings may also be accessed by visiting the SEC’s website at www.sec.gov.
|
I.
|
Subsidiary Information
|
Not applicable.
|
Item 11.
|
Quantitative and Qualitative Disclosures About Market Risk
|
The Company's activities expose it to a variety of risks including interest rate risk, foreign currency exchange rate risk, liquidity risk and credit risk. The Company's overall risk management strategy focuses on the unpredictability of financial markets and seeks to minimize potential adverse effects on its performance through ongoing operational and finance activities. The Company monitors and manages its exposure to such risks both centrally and at the local level, as appropriate, as part of its overall risk management program with the objective of seeking to reduce the potential adverse effects of such risks on its results of operations and financial position.
Depending upon the risk assessment, the Company uses selected derivative hedging instruments, including principally interest rate swaps and foreign currency forward contracts, for the purposes of managing interest rate risk and currency risks arising from its operations and sources of financing. The Company's policy is not to enter into such contracts for speculative purposes. The Company's accounting policies and disclosures regarding its derivatives are set out in Note
9
,
Derivatives,
to the Consolidated Financial Statements.
The following section provides qualitative and quantitative disclosures on the effects that these risks may have. The quantitative data reported below does not have any predictive value and does not reflect the complexity of the markets or reactions which may result from any changes that are assumed to have taken place.
Interest Rate Risk
Indebtedness
The Company's exposure to changes in market interest rates relates primarily to its cash and financial liabilities which bear floating interest rates. The Company's policy is to manage interest cost using a mix of fixed and variable rate debt. The Company has historically used various techniques to mitigate the risks associated with future changes in interest rates, including entering into interest rate swap and treasury rate lock agreements.
In
2018
and
2017
, the Company's exposure to floating rates of interest related primarily to the Revolving Credit Facilities and Term Loan Facilities.
At
December 31, 2018
and
2017
, the Company held $625.0 million (notional amount) in interest rate swaps that effectively convert $625.0 million of the 6.250% Senior Secured Notes due June 2022 from fixed interest rate debt to variable rate debt. At
December 31, 2018
and
2017
, approximately
35%
and
30%
of the Company's net debt portfolio was exposed to interest rate fluctuations, respectively.
A hypothetical 10 basis points increase in interest rates for
2018
,
2017
and
2016
, with all other variables held constant, would have resulted in incremental pre-tax losses of approximately
$2.8 million
,
$2.5 million
and
$2.0 million
, respectively.
Costs to Fund Jackpot Liabilities
Fluctuations in prime, treasury and agency rates due to changes in market and other economic conditions directly impact the Company's cost to fund jackpots and corresponding gaming operating income. If interest rates decline, jackpot cost increases and operating income decreases. The Company estimates a hypothetical decline of one percentage point in applicable interest rates would have reduced operating income by approximately
$7.1 million
and
$9.0 million
in
2018
and
2017
, respectively. The Company does not manage this exposure with derivative financial instruments.
100
Foreign Currency Exchange Rate Risk
The Company operates on an international basis across a number of geographical locations. The Company is exposed to (i) transactional foreign exchange risk when an entity enters into transactions in a currency other than its functional currency, and (ii) translation foreign exchange risk which arises when the Company translates the financial statements of its foreign entities into U.S. dollars for the preparation of the consolidated financial statements.
Transactional Risk
The Company's subsidiaries generally execute their operating activities in their respective functional currencies. In circumstances where the Company enters into transactions in a currency other than the functional currency of the relevant entity, the Company seeks to minimize its exposure by (i) sharing risk with its customers (for example, in limited circumstances, but whenever possible, the Company negotiates clauses into its contracts that allows for price adjustments should a material change in foreign exchange rates occur), (ii) creating a natural hedge by netting receipts and payments, (iii) utilizing foreign currency borrowings, and (iv) where applicable, by entering into foreign currency forward and option contracts.
The principal foreign currency to which the Company is exposed is the euro. A hypothetical 10% decrease in the U.S. dollar to euro exchange rate, with all other variables held constant, would have resulted in incremental pre-tax losses of approximately
$337.8 million
,
$362.2 million
and
$337.0 million
for
2018
,
2017
and
2016
, respectively.
From time to time, the Company enters into foreign currency forward and option contracts to reduce the exposure associated with certain firm commitments, variable service revenues, and certain assets and liabilities denominated in foreign currencies. These contracts generally have average maturities of 12 months or less, and are regularly renewed to provide continuing coverage throughout the year. It is the Company's policy to negotiate the terms of the hedge derivatives to match the terms of the hedged item to maximize hedge effectiveness.
At
December 31, 2018
, the Company had forward contracts for the sale of approximately
$283.2 million
of foreign currency (primarily euro and British pounds) and the purchase of approximately
$309.5 million
of foreign currency (primarily U.S. dollars, Canadian dollars and Swedish krona).
At
December 31, 2017
, the Company had forward contracts for the sale of approximately
$333.9 million
of foreign currency (primarily euro and British pounds) and the purchase of approximately
$227.5 million
of foreign currency (primarily U.S. dollars, Canadian dollars and Swedish krona).
Translation Risk
Certain of the Company's subsidiaries are located in countries that are outside of the United States, in particular the Eurozone. As the Company's reporting currency is the U.S. dollar, the income statements of those entities are converted into U.S. dollars using the average exchange rate for the period, and while revenues and costs are unchanged in local currency, changes in exchange rates may lead to effects on the converted balances of revenues, costs and the result in U.S. dollars. The monetary assets and liabilities of consolidated entities that have a reporting currency other than the U.S. dollar are translated into U.S. dollars at the period-end foreign exchange rate. The effects of these changes in foreign exchange rates are recognized directly in the consolidated statements of changes in equity within accumulated other comprehensive income.
The Company's foreign currency exposure primarily arises from changes between the U.S. dollar and the euro and the U.S. dollar and Swedish krona. A hypothetical 10% decrease in the U.S. dollar to euro exchange rate, with all other variables held constant, would have
reduced
equity by
$143.7 million
,
$94.2 million
and
$77.1 million
for
2018
,
2017
and
2016
, respectively. A hypothetical 10% decrease in the U.S. dollar to Swedish krona exchange rate, with all other variables held constant, would have
reduced
equity by
$15.8 million
,
$21.9 million
and
$18.2 million
for
2018
,
2017
and
2016
, respectively.
Liquidity Risk
Liquidity risk is the risk of not being able to fulfill present or future obligations if the Company does not have sufficient funds available to meet such obligations. Liquidity risk arises mostly in relation to cash flows generated and used in working capital and from financing activities, particularly by servicing the Company's debt, in terms of both interest and principal, and its payment obligations relating to its ordinary business activities. The Company believes that the cash which it generates from its operating activities, together with its committed borrowing capacity, will be sufficient to meet its financial obligations and operating requirements in the foreseeable future. Therefore, the Company does not believe that it is exposed to a significant concentration of liquidity risk.
101
Credit Risk
The Company's credit risk primarily arises from cash, trade receivables and customer financing receivables. The Company has established risk management policies, where it holds cash deposits with major, financially sound counterparties with high credit ratings, and that limit exposure to any one credit party.
The Company enters into commercial transactions only with recognized, creditworthy third parties. A significant portion of trade receivables are from government lottery entities which the Company considers to pose insignificant credit risk. Additionally, the Company does not have significant credit risk to any one customer. Geographically, credit risk is concentrated as follows:
|
December 31,
|
||||||||||
|
|
2018
|
2017
|
||||||||
|
(in thousands)
|
$
|
%
|
$
|
%
|
||||||
|
Italy
|
427,148
|
|
35.4
|
432,533
|
|
37.2
|
||||
|
United States
|
303,616
|
|
25.1
|
291,729
|
|
25.1
|
||||
|
Latin America
|
218,577
|
|
18.1
|
189,730
|
|
16.3
|
||||
|
Europe and Africa
|
159,311
|
|
13.2
|
210,516
|
|
18.1
|
||||
|
Other
|
99,060
|
|
8.2
|
39,604
|
|
3.4
|
||||
|
|
1,207,712
|
|
100.0
|
1,164,112
|
|
100.0
|
||||
|
Reconciliation to Balance Sheet:
|
|
|
|
|
|
|
||||
|
Trade and other receivables, net (Note 5)
|
949,085
|
|
|
937,854
|
|
|
||||
|
Customer financing receivables, net - current (Note 7)
|
170,273
|
|
|
151,360
|
|
|
||||
|
Customer financing receivables, net - non-current (Note 7)
|
88,354
|
|
|
74,898
|
|
|
||||
|
|
1,207,712
|
|
|
1,164,112
|
|
|
||||
Commodity Price Risk
The Company's exposure to commodity price changes is not considered material and is managed through its procurement and sales practices.
|
Item 12.
|
Description of Securities Other than Equity Securities
|
Not applicable.
102
|
Item 13.
|
Defaults, Dividends Arrearages and Delinquencies
|
None.
|
Item 14.
|
Material Modifications to the Rights of Security Holders and Use of Proceeds
|
See the description of the loyalty plan in “Item 10. Additional Information—B. Memorandum and Articles of Association—Loyalty Plan.”
|
Item 15.
|
Controls and Procedures
|
Disclosure Controls and Procedures
The Company's management maintains disclosure controls and procedures that are designed to provide reasonable assurance that information required to be disclosed in the Company’s reports that it files or submits under the Securities Exchange Act of 1934, as amended (the “Exchange Act”), is recorded, processed, summarized and reported within time periods specified in the Commission's rules and forms, and that such information is accumulated and communicated to management, including the Chief Executive Officer and Chief Financial Officer, as appropriate, to allow timely decisions regarding required disclosures. In designing and evaluating its disclosure controls and procedures, the Company recognizes that any controls and procedures, no matter how well designed and operated, can provide only reasonable assurance of achieving the desired control objectives, as the Company's are designed to do.
As required by Rule 13a-15(b) under the Exchange Act, an evaluation of the effectiveness of the Company's disclosure controls and procedures (as defined in Rule 13a-15(e) under the Exchange Act) as of December 31, 2018 was conducted under the supervision and with the participation of its management including its Chief Executive Officer and Chief Financial Officer. Based on this evaluation, its Chief Executive Officer and Chief Financial Officer concluded that its disclosure controls and procedures were effective as of December 31, 2018 at a reasonable assurance level.
Management’s Report on Internal Control over Financial Reporting
The Company's management is responsible for establishing and maintaining adequate internal control over financial reporting (as defined by Rules 13a-15(f) and 15d-15(f) under the Exchange Act).
The Company's internal control over financial reporting is a process designed to provide reasonable assurance regarding the reliability of financial reporting and the preparation of financial statements for external purposes in accordance with generally accepted accounting principles.
The Company’s internal control over financial reporting includes those policies and procedures that:
|
•
|
pertain to the maintenance of records that, in reasonable detail, accurately and fairly reflect the transactions and dispositions of the assets of the Company;
|
|
•
|
provide reasonable assurance that transactions are recorded, as necessary, to permit preparation of financial statements in accordance with generally accepted accounting principles; and that receipts and expenditures of the Company are made only in accordance with authorizations of the Company's management and directors; and
|
|
•
|
provide reasonable assurance that unauthorized acquisition, use or disposition of the Company's assets, that could have a material effect on the financial statements, would be prevented or detected on a timely basis.
|
Because of its inherent limitations, internal control over financial reporting may not prevent or detect misstatements. Also, projections of any evaluation of effectiveness to future periods are subject to the risk that controls may become inadequate because of changes in conditions, or that the degree of compliance with the policies or procedures may deteriorate.
The Company's management assessed the effectiveness of internal control over financial reporting as of December 31, 2018 based upon the framework presented in
Internal Control-Integrated Framework
(2013) issued by the Committee of Sponsoring Organizations of the Treadway Commission (“COSO”). Based on this assessment, management concluded that the Company's internal control over financial reporting was effective as of December 31, 2018.
103
The Company's independent registered public accounting firm, PricewaterhouseCoopers LLP, has audited the effectiveness of the Company's internal control over financial reporting as of December 31, 2018 as stated in their report appearing in "Report of Independent Registered Public Accounting Firm" included in "Item 18. Financial Statements".
Changes in Internal Control over Financial Reporting
There have been no changes in internal control over financial reporting during the year ended December 31, 2018 that have materially affected, or are reasonably likely to materially affect, the Company’s internal control over financial reporting.
Item 16A
.
Audit Committee Financial Expert
The Company's Board of Directors has determined that Vincent L. Sadusky, chairperson of the Audit Committee, is an audit committee financial expert. He is an independent director under the NYSE standards.
Item 16B
.
Code of Ethics
The Company has adopted a Code of Ethics for Principal Executive Officer and Senior Financial Officers which is applicable to its principal executive officer, principal financial officer, the principal accounting officer and controller, and any persons performing similar functions. This code of ethics is posted on its website, www.igt.com, and may be found as follows: from the main page, first click on “Explore IGT” and then on "Investor Relations" and then on “Management and Governance” and then on “Documents.” The information contained on the Company's website is not included in, or incorporated by reference into, this annual report on Form 20-F.
Item 16C
.
Principal Accountant Fees and Services
PricewaterhouseCoopers LLP (“PwC US”) has been serving as the Company’s independent auditor since 2015.
Aggregate fees for professional services and other services rendered by PwC US and its foreign entities belonging to the PwC network in
2018
and
2017
were as follows:
|
|
For the year ended December 31,
|
|||||
|
($ thousands)
|
2018
|
2017
|
||||
|
Audit services
|
13,254
|
|
14,582
|
|
||
|
Tax services
|
1,242
|
|
552
|
|
||
|
Audit-related services
|
1,028
|
|
204
|
|
||
|
All other services
|
189
|
|
134
|
|
||
|
|
15,713
|
|
15,472
|
|
||
|
•
|
Audit services consist of professional services performed in connection with the annual financial statements.
|
|
•
|
Tax services consist of professional services for tax planning and compliance.
|
|
•
|
Audit-related services consist of assurance and related services that are reasonably related to the performance of the audit or review of the financial statements and agreed upon procedures for certain financial statement areas.
|
|
•
|
All other services, other than those reported above, mainly consist of services in relation to intellectual property royalty audits.
|
Audit Committee’s Pre-Approval Policies and Procedures
The Audit Committee pre-approves engagements of the Company's independent registered public accounting firm to audit the Company's consolidated financial statements. The Audit Committee has a policy requiring management to obtain the Audit Committee’s approval before engaging the Company's independent registered public accounting firm to provide any other audit or permitted non-audit services to the Company or its subsidiaries. Pursuant to this policy, which is designed to ensure that such engagements do not impair the independence of the Company's independent registered public accounting firm, the Audit Committee reviews and pre-approves, if appropriate, specific audit and non-audit services in the categories audit services, tax services, audit-related services, and any other services that may be performed by the Company's independent registered public accounting firm.
Item 16D
.
Exemptions from the Listing Standards for Audit Committees
None.
104
Item 16E
.
Purchases of Equity Securities by the Issuer and Affiliated Purchasers
The Company currently has neither purchased any common shares of the Company nor announced any share buyback plans. The Company has the authority to repurchase, subject to a maximum repurchase price, a maximum of 20% of the aggregate issued share capital of ordinary shares as of April 7, 2015. This authority will expire on July 28, 2020.
Item 16F.
Change in Registrant’s Certifying Accountant
None.
Item 16G.
Corporate Governance
The Parent is a public limited company incorporated under the laws of England and Wales and qualifies as a foreign private issuer under the rules and regulations of the SEC and the listing standards of the NYSE. In accordance with the NYSE listing rules related to corporate governance, listed companies that are foreign private issuers are permitted to follow home-country practice in some circumstances in lieu of the provisions of the corporate governance rules contained in Section 303A of the NYSE Listed Company Manual that are otherwise applicable to listed companies. However, for as long as the Parent’s ordinary shares are listed on the NYSE, the Company will comply with all NYSE corporate governance standards set forth in Section 3 of the NYSE Listed Company Manual applicable to non-controlled domestic U.S. issuers, regardless of whether the Company is a foreign private issuer.
Not applicable.
|
Item 17.
|
Financial Statements
|
The Company has responded to Item 18 in lieu of responding to this item.
|
Item 18.
|
Financial Statements
|
The audited Consolidated Financial Statements as required under Item 18 are attached hereto starting on page F-1 of this annual report on Form 20-F.
|
Item 19.
|
Exhibits
|
A list of exhibits included as part of this annual report on Form 20-F is set forth in the Index to Exhibits immediately following this Item 19.
105
INDEX TO EXHIBITS
|
Exhibit
|
|
Description
|
|
|
|
|
|
1.1
|
|
|
|
|
|
|
|
|
|
There have not been filed as exhibits to this Form 20-F certain long-term debt instruments, none of which relates to indebtedness that exceeds 10% of the consolidated assets of International Game Technology PLC. International Game Technology PLC agrees to furnish the Securities and Exchange Commission, upon its request, a copy of any instrument defining the rights of holders of long-term debt of International Game Technology PLC and its consolidated subsidiaries.
|
|
|
|
|
|
2.1
|
||
|
2.2
|
|
|
|
|
|
|
|
2.3
|
|
|
|
|
|
|
|
2.4
|
||
|
2.5
|
|
|
106
|
Exhibit
|
|
Description
|
|
2.6
|
|
|
|
2.7
|
|
|
|
2.8
|
|
|
|
|
|
|
|
2.9
|
|
|
|
|
|
|
|
2.10
|
|
|
|
|
|
|
|
2.11
|
|
|
|
|
|
|
|
2.12
|
|
|
|
|
|
|
|
2.13
|
|
|
|
|
|
|
|
2.14
|
|
|
|
2.15
|
|
|
|
|
|
|
107
|
Exhibit
|
|
Description
|
|
2.16
|
||
|
2.17
|
||
|
2.18
|
||
|
2.19
|
||
|
4.1
|
|
|
|
|
|
|
|
4.2
|
|
|
|
|
|
|
|
4.3
|
|
|
|
|
|
|
|
4.4
|
|
|
|
|
|
|
|
4.5
|
|
|
|
|
|
|
|
4.6
|
|
|
|
|
|
|
|
4.7
|
||
|
4.8
|
||
|
8.1
|
|
|
108
|
Exhibit
|
|
Description
|
|
|
|
|
|
12.1
|
|
|
|
|
|
|
|
12.2
|
|
|
|
|
|
|
|
13.1
|
|
|
|
|
|
|
|
13.2
|
|
|
|
|
|
|
|
15.1
|
|
|
|
|
|
|
|
101.INS
|
|
XBRL Instance Document
|
|
|
|
|
|
101.SCH
|
|
XBRL Taxonomy Extension Schema Document
|
|
|
|
|
|
101.CAL
|
|
XBRL Taxonomy Extension Calculation Linkbase Document
|
|
|
|
|
|
101.DEF
|
|
XBRL Taxonomy Extension Definition Linkbase Document
|
|
|
|
|
|
101.LAB
|
|
XBRL Taxonomy Extension Labels Linkbase Document
|
|
|
|
|
|
101.PRE
|
|
XBRL Taxonomy Extension Presentation Linkbase Document
|
109
SIGNATURE
The registrant hereby certifies that it meets all of the requirements for filing on Form 20-F and has duly caused and authorized the undersigned to sign this annual report on its behalf.
|
|
INTERNATIONAL GAME TECHNOLOGY PLC
|
|
|
|
|
|
|
|
|
/s/ Alberto Fornaro
|
|
|
Name: Alberto Fornaro
|
|
|
Title: Chief Financial Officer
|
Dated:
March 8, 2019
110
INTERNATIONAL GAME TECHNOLOGY PLC
INDEX TO CONSOLIDATED FINANCIAL STATEMENTS
|
|
|
|
|
|
|
|
|
|
|
|
|
|
|
|
|
|
|
|
|
F-1
Report of Independent Registered Public Accounting Firm
To the
Board of Directors and Shareholders of International Game Technology PLC
Opinions on the Financial Statements and Internal Control over Financial Reporting
We have audited the accompanying consolidated balance sheets of International Game Technology PLC and its subsidiaries (the “Company”) as of December 31, 2018 and 2017, and the related consolidated statements of operations, comprehensive income, shareholders’ equity and cash flows for each of the three years in the period ended December 31, 2018, including the related notes (collectively referred to as the “consolidated financial statements”). We also have audited the Company's internal control over financial reporting as of December 31, 2018, based on criteria established in
Internal Control - Integrated Framework
(2013) issued by the Committee of Sponsoring Organizations of the Treadway Commission (COSO).
In our opinion, the consolidated financial statements referred to above present fairly, in all material respects, the financial position of the Company as of December 31, 2018 and 2017, and the results of its operations and its cash flows for each of the three years in the period ended December 31, 2018 in conformity with accounting principles generally accepted in the United States of America. Also in our opinion, the Company maintained, in all material respects, effective internal control over financial reporting as of December 31, 2018, based on criteria established in
Internal Control - Integrated Framework
(2013)
issued by the COSO.
Changes in Accounting Principles
As discussed in Note 2 to the consolidated financial statements, the Company changed the manner in which it accounts for revenues from contracts with customers and the manner in which it presents restricted cash and restricted cash equivalents in the statement of cash flows in 2018.
Basis for Opinions
The Company's management is responsible for these consolidated financial statements, for maintaining effective internal control over financial reporting, and for its assessment of the effectiveness of internal control over financial reporting, included in Management's Report on Internal Control over Financial Reporting appearing under Item 15. Our responsibility is to express opinions on the Company’s consolidated financial statements and on the Company's internal control over financial reporting based on our audits. We are a public accounting firm registered with the Public Company Accounting Oversight Board (United States) (PCAOB) and are required to be independent with respect to the Company in accordance with the U.S. federal securities laws and the applicable rules and regulations of the Securities and Exchange Commission and the PCAOB.
We conducted our audits in accordance with the standards of the PCAOB. Those standards require that we plan and perform the audits to obtain reasonable assurance about whether the consolidated financial statements are free of material misstatement, whether due to error or fraud, and whether effective internal control over financial reporting was maintained in all material respects.
Our audits of the consolidated financial statements included performing procedures to assess the risks of material misstatement of the consolidated financial statements, whether due to error or fraud, and performing procedures that respond to those risks. Such procedures included examining, on a test basis, evidence regarding the amounts and disclosures in the consolidated financial statements. Our audits also included evaluating the accounting principles used and significant estimates made by management, as well as evaluating the overall presentation of the consolidated financial statements. Our audit of internal control over financial reporting included obtaining an understanding of internal control over financial reporting, assessing the risk that a material weakness exists, and testing and evaluating the design and operating effectiveness of internal control based on the assessed risk. Our audits also included performing such other procedures as we considered necessary in the circumstances. We believe that our audits provide a reasonable basis for our opinions.
Definition and Limitations of Internal Control over Financial Reporting
A company’s internal control over financial reporting is a process designed to provide reasonable assurance regarding the reliability of financial reporting and the preparation of financial statements for external purposes in accordance with generally accepted accounting principles. A company’s internal control over financial reporting includes those policies and procedures that (i) pertain to the maintenance of records that, in reasonable detail, accurately and fairly reflect the transactions and dispositions of the assets of the company; (ii) provide reasonable assurance that transactions are recorded as necessary to permit preparation of financial statements in accordance with generally accepted accounting principles, and that receipts and
F-2
expenditures of the company are being made only in accordance with authorizations of management and directors of the company; and (iii) provide reasonable assurance regarding prevention or timely detection of unauthorized acquisition, use, or disposition of the company’s assets that could have a material effect on the financial statements.
Because of its inherent limitations, internal control over financial reporting may not prevent or detect misstatements. Also, projections of any evaluation of effectiveness to future periods are subject to the risk that controls may become inadequate because of changes in conditions, or that the degree of compliance with the policies or procedures may deteriorate.
/s/ PricewaterhouseCoopers LLP
Boston, Massachusetts
March 8, 2019
We have served as the Company’s auditor since 2015.
F-3
International Game Technology PLC
Consolidated Balance Sheets
($ thousands, except par value and number of shares)
|
|
December 31,
|
|||||||
|
|
Notes
|
2018
|
2017
|
|||||
|
Assets
|
|
|
|
|
||||
|
Current assets:
|
|
|
|
|
||||
|
Cash and cash equivalents
|
250,669
|
|
1,057,418
|
|
||||
|
Restricted cash and cash equivalents
|
261,108
|
|
248,012
|
|
||||
|
Trade and other receivables, net
|
5
|
949,085
|
|
937,854
|
|
|||
|
Inventories
|
6
|
282,698
|
|
319,545
|
|
|||
|
Other current assets
|
7
|
504,061
|
|
407,520
|
|
|||
|
Income taxes receivable
|
39,075
|
|
94,168
|
|
||||
|
Total current assets
|
2,286,696
|
|
3,064,517
|
|
||||
|
Systems, equipment and other assets related to contracts, net
|
10
|
1,404,426
|
|
1,434,194
|
|
|||
|
Property, plant and equipment, net
|
10
|
185,349
|
|
193,723
|
|
|||
|
Goodwill
|
11
|
5,580,227
|
|
5,723,815
|
|
|||
|
Intangible assets, net
|
12
|
2,044,723
|
|
2,273,460
|
|
|||
|
Other non-current assets
|
7
|
2,108,964
|
|
2,427,953
|
|
|||
|
Deferred income taxes
|
15
|
38,117
|
|
41,546
|
|
|||
|
Total non-current assets
|
11,361,806
|
|
12,094,691
|
|
||||
|
Total assets
|
21
|
13,648,502
|
|
15,159,208
|
|
|||
|
Liabilities, redeemable non-controlling interests, and shareholders' equity
|
|
|
|
|
||||
|
Current liabilities:
|
|
|
|
|
||||
|
Accounts payable
|
1,142,371
|
|
1,240,753
|
|
||||
|
Other current liabilities
|
13
|
816,722
|
|
1,780,875
|
|
|||
|
Current portion of long-term debt
|
14
|
—
|
|
599,114
|
|
|||
|
Short-term borrowings
|
14
|
34,822
|
|
—
|
|
|||
|
Income taxes payable
|
8,209
|
|
55,935
|
|
||||
|
Total current liabilities
|
2,002,124
|
|
3,676,677
|
|
||||
|
Long-term debt, less current portion
|
14
|
7,977,267
|
|
7,777,445
|
|
|||
|
Deferred income taxes
|
15
|
446,083
|
|
491,460
|
|
|||
|
Income taxes payable
|
25,654
|
|
55,665
|
|
||||
|
Other non-current liabilities
|
13
|
445,445
|
|
446,113
|
|
|||
|
Total non-current liabilities
|
8,894,449
|
|
8,770,683
|
|
||||
|
Total liabilities
|
10,896,573
|
|
12,447,360
|
|
||||
|
Commitments and contingencies
|
17
|
|
|
|
|
|||
|
Redeemable non-controlling interests
|
19
|
—
|
|
356,917
|
|
|||
|
Shareholders’ equity
|
|
|
|
|
||||
|
Common stock, par value $0.10 per share; 204,210,731 and 203,446,572 shares issued and outstanding at December 31, 2018 and 2017, respectively
|
20,421
|
|
20,344
|
|
||||
|
Additional paid-in capital
|
2,534,134
|
|
2,676,854
|
|
||||
|
Retained deficit
|
(1,008,193
|
)
|
(1,032,372
|
)
|
||||
|
Accumulated other comprehensive income
|
18
|
261,537
|
|
340,169
|
|
|||
|
Total IGT PLC’s shareholders’ equity
|
1,807,899
|
|
2,004,995
|
|
||||
|
Non-controlling interests
|
19
|
944,030
|
|
349,936
|
|
|||
|
Total shareholders’ equity
|
2,751,929
|
|
2,354,931
|
|
||||
|
Total liabilities, redeemable non-controlling interests, and shareholders’ equity
|
13,648,502
|
|
15,159,208
|
|
||||
The accompanying notes are an integral part of these consolidated financial statements.
F-4
International Game Technology PLC
($ and shares in thousands, except per share amounts)
|
|
For the year ended December 31,
|
||||||||||
|
|
Notes
|
2018
|
2017
|
2016
|
|||||||
|
Service revenue
|
3, 21
|
4,046,314
|
|
4,136,556
|
|
4,375,586
|
|
||||
|
Product sales
|
3, 21
|
784,942
|
|
802,403
|
|
778,310
|
|
||||
|
Total revenue
|
3, 21
|
4,831,256
|
|
4,938,959
|
|
5,153,896
|
|
||||
|
Cost of services
|
2,450,658
|
|
2,553,083
|
|
2,553,479
|
|
|||||
|
Cost of product sales
|
491,030
|
|
579,431
|
|
582,358
|
|
|||||
|
Selling, general and administrative
|
844,059
|
|
816,093
|
|
945,824
|
|
|||||
|
Research and development
|
263,279
|
|
313,088
|
|
343,531
|
|
|||||
|
Restructuring expense
|
14,781
|
|
39,876
|
|
27,934
|
|
|||||
|
Impairment loss
|
23
|
120,407
|
|
715,220
|
|
37,744
|
|
||||
|
Transaction expense (income), net
|
51
|
|
(26,740
|
)
|
2,590
|
|
|||||
|
Total operating expenses
|
4,184,265
|
|
4,990,051
|
|
4,493,460
|
|
|||||
|
Operating income (loss)
|
21
|
646,991
|
|
(51,092
|
)
|
660,436
|
|
||||
|
Interest income
|
14,231
|
|
10,436
|
|
12,840
|
|
|||||
|
Interest expense
|
14
|
(431,618
|
)
|
(458,899
|
)
|
(469,268
|
)
|
||||
|
Foreign exchange gain (loss), net
|
129,051
|
|
(443,977
|
)
|
101,040
|
|
|||||
|
Other (expense) income, net
|
24
|
(54,607
|
)
|
(33,393
|
)
|
18,365
|
|
||||
|
Total non-operating expenses
|
(342,943
|
)
|
(925,833
|
)
|
(337,023
|
)
|
|||||
|
Income (loss) before provision for (benefit from) income taxes
|
15
|
304,048
|
|
(976,925
|
)
|
323,413
|
|
||||
|
Provision for (benefit from) income taxes
|
15
|
189,401
|
|
(29,414
|
)
|
59,206
|
|
||||
|
Net income (loss)
|
114,647
|
|
(947,511
|
)
|
264,207
|
|
|||||
|
Less: Net income attributable to non-controlling interests
|
115,671
|
|
55,400
|
|
45,413
|
|
|||||
|
Less: Net income attributable to redeemable non-controlling interests
|
20,326
|
|
65,665
|
|
7,457
|
|
|||||
|
Net (loss) income attributable to IGT PLC
|
(21,350
|
)
|
(1,068,576
|
)
|
211,337
|
|
|||||
|
Net (loss) income attributable to IGT PLC per common share - basic
|
25
|
(0.10
|
)
|
(5.26
|
)
|
1.05
|
|
||||
|
Net (loss) income attributable to IGT PLC per common share - diluted
|
25
|
(0.10
|
)
|
(5.26
|
)
|
1.05
|
|
||||
|
Weighted-average shares - basic
|
25
|
204,083
|
|
203,130
|
|
201,511
|
|
||||
|
Weighted-average shares - diluted
|
25
|
204,083
|
|
203,130
|
|
202,214
|
|
||||
The accompanying notes are an integral part of these consolidated financial statements.
F-5
International Game Technology PLC
Consolidated Statements of Comprehensive Income
($ thousands)
|
|
For the year ended December 31,
|
||||||||||
|
|
Notes
|
2018
|
2017
|
2016
|
|||||||
|
Net income (loss)
|
114,647
|
|
(947,511
|
)
|
264,207
|
|
|||||
|
Other comprehensive (loss) income, before tax:
|
|
|
|
|
|
|
|||||
|
Change in foreign currency translation:
|
|||||||||||
|
Foreign currency translation adjustments
|
18
|
(90,309
|
)
|
182,791
|
|
(49,881
|
)
|
||||
|
Reclassification of (income) loss to net income
|
18
|
(4,254
|
)
|
—
|
|
118
|
|
||||
|
Total foreign currency translation adjustments
|
(94,563
|
)
|
182,791
|
|
(49,763
|
)
|
|||||
|
Change in unrealized gain (loss) on cash flow hedges:
|
|
|
|
|
|
|
|||||
|
Unrealized (loss) gain on cash flow hedges
|
18
|
(163
|
)
|
(6,610
|
)
|
8,351
|
|
||||
|
Reclassification of loss (gain) to net income
|
18
|
536
|
|
1,744
|
|
(5,218
|
)
|
||||
|
Total change in unrealized gain (loss) on cash flow hedges
|
373
|
|
(4,866
|
)
|
3,133
|
|
|||||
|
Unrealized (loss) gain on available-for-sale securities
|
18
|
(5,408
|
)
|
(678
|
)
|
8,772
|
|
||||
|
Unrealized gain (loss) on defined benefit plans
|
18
|
429
|
|
(120
|
)
|
(682
|
)
|
||||
|
Other comprehensive (loss) income, before tax
|
(99,169
|
)
|
177,127
|
|
(38,540
|
)
|
|||||
|
Income tax benefit related to items of other comprehensive income
|
18
|
1,846
|
|
1,936
|
|
4,548
|
|
||||
|
Other comprehensive (loss) income
|
(97,323
|
)
|
179,063
|
|
(33,992
|
)
|
|||||
|
Total comprehensive income (loss)
|
17,324
|
|
(768,448
|
)
|
230,215
|
|
|||||
|
Less: Total comprehensive income attributable to non-controlling interests
|
96,980
|
|
54,937
|
|
45,616
|
|
|||||
|
Less: Total comprehensive income attributable to redeemable non-controlling interests
|
20,326
|
|
65,665
|
|
7,457
|
|
|||||
|
Total comprehensive (loss) income attributable to IGT PLC
|
(99,982
|
)
|
(889,050
|
)
|
177,142
|
|
|||||
The accompanying notes are an integral part of these consolidated financial statements.
F-6
International Game Technology PLC
($ thousands)
|
|
For the year ended December 31,
|
||||||||||
|
|
Notes
|
2018
|
2017
|
2016
|
|||||||
|
Cash flows from operating activities
|
|
|
|
|
|
|
|||||
|
Net income (loss)
|
114,647
|
|
(947,511
|
)
|
264,207
|
|
|||||
|
Adjustments to reconcile net income (loss) to net cash provided by operating activities:
|
|
|
|
|
|
|
|||||
|
Depreciation
|
432,899
|
|
401,085
|
|
390,448
|
|
|||||
|
Amortization
|
272,561
|
|
401,355
|
|
492,021
|
|
|||||
|
Service revenue amortization
|
217,341
|
|
209,774
|
|
116,980
|
|
|||||
|
Impairment loss
|
23
|
120,407
|
|
715,220
|
|
37,744
|
|
||||
|
Loss on extinguishment of debt
|
24
|
54,423
|
|
25,733
|
|
—
|
|
||||
|
Stock-based compensation expense
|
22
|
33,086
|
|
4,704
|
|
26,346
|
|
||||
|
Debt issuance cost amortization
|
22,042
|
|
23,217
|
|
18,347
|
|
|||||
|
Deferred income tax provision
|
15
|
(34,494
|
)
|
(296,265
|
)
|
(153,649
|
)
|
||||
|
Foreign exchange (gain) loss, net
|
(129,051
|
)
|
443,977
|
|
(101,040
|
)
|
|||||
|
Gain on sale of Double Down Interactive LLC
|
4
|
—
|
|
(51,348
|
)
|
—
|
|
||||
|
Other non-cash costs, net
|
29,550
|
|
25,768
|
|
(142
|
)
|
|||||
|
Changes in operating assets and liabilities, excluding the effects of disposition and acquisitions:
|
|
|
|
|
|
|
|||||
|
Trade and other receivables
|
(54,356
|
)
|
45,465
|
|
(23,758
|
)
|
|||||
|
Inventories
|
12,556
|
|
51,406
|
|
(76,321
|
)
|
|||||
|
Upfront Italian license fees
|
13, 19
|
(878,055
|
)
|
(244,698
|
)
|
(665,260
|
)
|
||||
|
Accounts payable
|
(51,990
|
)
|
(3,031
|
)
|
37,062
|
|
|||||
|
Other assets and liabilities
|
(131,940
|
)
|
(141,463
|
)
|
(24,931
|
)
|
|||||
|
Net cash provided by operating activities
|
29,626
|
|
663,388
|
|
338,054
|
|
|||||
|
Cash flows from investing activities
|
|
|
|
|
|
|
|||||
|
Capital expenditures
|
(533,052
|
)
|
(698,010
|
)
|
(541,943
|
)
|
|||||
|
Proceeds from sale of assets
|
19,243
|
|
167,452
|
|
185,798
|
|
|||||
|
Proceeds from sale of Double Down Interactive LLC, net of cash divested
|
4
|
—
|
|
823,788
|
|
—
|
|
||||
|
Other
|
2,272
|
|
2,336
|
|
16,704
|
|
|||||
|
Net cash (used in) provided by investing activities
|
(511,537
|
)
|
295,566
|
|
(339,441
|
)
|
|||||
|
Cash flows from financing activities
|
|
|
|
|
|
|
|||||
|
Principal payments on long-term debt
|
(1,899,888
|
)
|
(1,754,259
|
)
|
(357,513
|
)
|
|||||
|
Dividends paid
|
(163,236
|
)
|
(162,528
|
)
|
(161,179
|
)
|
|||||
|
Dividends paid - non-controlling interests
|
(126,926
|
)
|
(50,601
|
)
|
(32,717
|
)
|
|||||
|
Return of capital - non-controlling interests
|
(85,121
|
)
|
(52,352
|
)
|
(35,407
|
)
|
|||||
|
Payments in connection with the extinguishment of debt
|
(49,976
|
)
|
(38,832
|
)
|
—
|
|
|||||
|
Debt issuance costs paid
|
(17,033
|
)
|
(16,378
|
)
|
(10,825
|
)
|
|||||
|
Net receipts from (payments of) financial liabilities
|
7,123
|
|
(150
|
)
|
30,595
|
|
|||||
|
Net proceeds from short-term borrowings
|
14
|
34,822
|
|
—
|
|
—
|
|
||||
|
Capital increase - non-controlling interests
|
321,584
|
|
41,011
|
|
40,771
|
|
|||||
|
Proceeds from long-term debt
|
1,687,761
|
|
1,762,270
|
|
—
|
|
|||||
|
Return of capital - redeemable non-controlling interests
|
19
|
—
|
|
(32,039
|
)
|
||||||
|
Dividends paid - redeemable non-controlling interests
|
19
|
—
|
|
(7,307
|
)
|
||||||
|
Capital increase - redeemable non-controlling interests
|
19
|
—
|
|
107,457
|
|
215,684
|
|
||||
|
Other
|
(20,655
|
)
|
(43,264
|
)
|
(1,548
|
)
|
|||||
|
Net cash used in financing activities
|
(311,545
|
)
|
(246,972
|
)
|
(312,139
|
)
|
|||||
|
Net (decrease) increase in cash and cash equivalents, and restricted cash and cash equivalents
|
(793,456
|
)
|
711,982
|
|
(313,526
|
)
|
|||||
|
Effect of exchange rate changes on cash and cash equivalents, and restricted cash and cash equivalents
|
(197
|
)
|
52,132
|
|
9,654
|
|
|||||
|
Cash and cash equivalents, and restricted cash and cash equivalents at the beginning of the period
|
1,305,430
|
|
541,316
|
|
845,188
|
|
|||||
|
Cash and cash equivalents, and restricted cash and cash equivalents at the end of the period
|
511,777
|
|
1,305,430
|
|
541,316
|
|
|||||
F-7
International Game Technology PLC
Consolidated Statements of Cash Flows
($ thousands)
|
|
For the year ended December 31,
|
||||||||
|
|
2018
|
2017
|
2016
|
||||||
|
Supplemental Cash Flow Information
|
|
|
|
|
|
|
|||
|
Interest paid
|
(445,698
|
)
|
(417,110
|
)
|
(450,655
|
)
|
|||
|
Income taxes paid
|
(239,831
|
)
|
(296,386
|
)
|
(183,278
|
)
|
|||
|
Capital expenditures
|
(51,805
|
)
|
(62,858
|
)
|
(76,174
|
)
|
|||
|
Non-cash investing activities, net
|
(51,805
|
)
|
(62,858
|
)
|
(76,174
|
)
|
|||
|
Dividends declared - non-controlling interests
|
—
|
|
(12,588
|
)
|
(12,696
|
)
|
|||
|
Non-cash financing activities, net
|
—
|
|
(12,588
|
)
|
(12,696
|
)
|
|||
The accompanying notes are an integral part of these consolidated financial statements.
F-8
International Game Technology PLC
Consolidated Statement of Shareholders’ Equity
($ thousands)
|
Common
Stock
|
Additional
Paid-In
Capital
|
Retained
(Deficit) Earnings
|
Accumulated
Other
Comprehensive
Income
|
Total
IGT PLC
Equity
|
Non-
Controlling
Interests
|
Total
Equity
|
||||||||||||||
|
Balance at December 31, 2015
|
20,024
|
|
2,816,057
|
|
(13,271
|
)
|
194,838
|
|
3,017,648
|
|
348,494
|
|
3,366,142
|
|
||||||
|
Net income
|
—
|
|
—
|
|
211,337
|
|
—
|
|
211,337
|
|
45,413
|
|
256,750
|
|
||||||
|
Other comprehensive (loss) income, net of tax
|
—
|
|
—
|
|
—
|
|
(34,195
|
)
|
(34,195
|
)
|
203
|
|
(33,992
|
)
|
||||||
|
Total comprehensive income (loss)
|
—
|
|
—
|
|
211,337
|
|
(34,195
|
)
|
177,142
|
|
45,616
|
|
222,758
|
|
||||||
|
Capital increase
|
—
|
|
—
|
|
—
|
|
—
|
|
—
|
|
40,771
|
|
40,771
|
|
||||||
|
Stock-based compensation expense
|
—
|
|
26,346
|
|
—
|
|
—
|
|
26,346
|
|
—
|
|
26,346
|
|
||||||
|
Shares issued upon exercise of stock options
|
96
|
|
11,687
|
|
—
|
|
—
|
|
11,783
|
|
—
|
|
11,783
|
|
||||||
|
Shares issued under stock award plans
|
108
|
|
(1,448
|
)
|
—
|
|
—
|
|
(1,340
|
)
|
—
|
|
(1,340
|
)
|
||||||
|
Payment for accelerated stock awards
|
—
|
|
(3,489
|
)
|
—
|
|
—
|
|
(3,489
|
)
|
—
|
|
(3,489
|
)
|
||||||
|
Return of capital
|
—
|
|
—
|
|
—
|
|
—
|
|
—
|
|
(36,197
|
)
|
(36,197
|
)
|
||||||
|
Dividends paid
|
—
|
|
—
|
|
(161,179
|
)
|
—
|
|
(161,179
|
)
|
(46,016
|
)
|
(207,195
|
)
|
||||||
|
Other
|
—
|
|
608
|
|
1,180
|
|
—
|
|
1,788
|
|
4,298
|
|
6,086
|
|
||||||
|
Balance at December 31, 2016
|
20,228
|
|
2,849,761
|
|
38,067
|
|
160,643
|
|
3,068,699
|
|
356,966
|
|
3,425,665
|
|
||||||
|
Net (loss) income
|
—
|
|
—
|
|
(1,068,576
|
)
|
—
|
|
(1,068,576
|
)
|
55,400
|
|
(1,013,176
|
)
|
||||||
|
Other comprehensive income (loss), net of tax
|
—
|
|
—
|
|
—
|
|
179,526
|
|
179,526
|
|
(463
|
)
|
179,063
|
|
||||||
|
Total comprehensive (loss) income
|
—
|
|
—
|
|
(1,068,576
|
)
|
179,526
|
|
(889,050
|
)
|
54,937
|
|
(834,113
|
)
|
||||||
|
Capital increase
|
—
|
|
—
|
|
—
|
|
—
|
|
—
|
|
41,799
|
|
41,799
|
|
||||||
|
Stock-based compensation expense
|
—
|
|
4,704
|
|
—
|
|
—
|
|
4,704
|
|
—
|
|
4,704
|
|
||||||
|
Shares issued upon exercise of stock options
|
21
|
|
(3,566
|
)
|
—
|
|
—
|
|
(3,545
|
)
|
—
|
|
(3,545
|
)
|
||||||
|
Shares issued under stock award plans
|
95
|
|
(11,514
|
)
|
—
|
|
—
|
|
(11,419
|
)
|
—
|
|
(11,419
|
)
|
||||||
|
Return of capital
|
—
|
|
—
|
|
—
|
|
—
|
|
—
|
|
(51,211
|
)
|
(51,211
|
)
|
||||||
|
Dividends paid
|
—
|
|
(162,528
|
)
|
—
|
|
—
|
|
(162,528
|
)
|
(49,777
|
)
|
(212,305
|
)
|
||||||
|
Other
|
—
|
|
(3
|
)
|
(1,863
|
)
|
—
|
|
(1,866
|
)
|
(2,778
|
)
|
(4,644
|
)
|
||||||
|
Balance at December 31, 2017
|
20,344
|
|
2,676,854
|
|
(1,032,372
|
)
|
340,169
|
|
2,004,995
|
|
349,936
|
|
2,354,931
|
|
||||||
|
Net (loss) income
|
—
|
|
—
|
|
(21,350
|
)
|
—
|
|
(21,350
|
)
|
115,671
|
|
94,321
|
|
||||||
|
Other comprehensive loss, net of tax
|
—
|
|
—
|
|
—
|
|
(78,632
|
)
|
(78,632
|
)
|
(18,691
|
)
|
(97,323
|
)
|
||||||
|
Total comprehensive (loss) income
|
—
|
|
—
|
|
(21,350
|
)
|
(78,632
|
)
|
(99,982
|
)
|
96,980
|
|
(3,002
|
)
|
||||||
|
Reclassification of redeemable non-controlling interests
|
—
|
|
—
|
|
—
|
|
—
|
|
—
|
|
377,243
|
|
377,243
|
|
||||||
|
Capital increase
|
—
|
|
—
|
|
—
|
|
—
|
|
—
|
|
319,254
|
|
319,254
|
|
||||||
|
Adoption of new accounting standards
|
—
|
|
—
|
|
45,527
|
|
—
|
|
45,527
|
|
—
|
|
45,527
|
|
||||||
|
Stock-based compensation expense
|
—
|
|
33,086
|
|
—
|
|
—
|
|
33,086
|
|
—
|
|
33,086
|
|
||||||
|
Shares issued upon exercise of stock options
|
15
|
|
(1,566
|
)
|
—
|
|
—
|
|
(1,551
|
)
|
—
|
|
(1,551
|
)
|
||||||
|
Shares issued under stock award plans
|
62
|
|
(11,153
|
)
|
—
|
|
—
|
|
(11,091
|
)
|
—
|
|
(11,091
|
)
|
||||||
|
Return of capital
|
—
|
|
—
|
|
—
|
|
—
|
|
—
|
|
(85,046
|
)
|
(85,046
|
)
|
||||||
|
Dividends paid
|
—
|
|
(163,236
|
)
|
—
|
|
—
|
|
(163,236
|
)
|
(114,337
|
)
|
(277,573
|
)
|
||||||
|
Other
|
—
|
|
149
|
|
2
|
|
—
|
|
151
|
|
—
|
|
151
|
|
||||||
|
Balance at December 31, 2018
|
20,421
|
|
2,534,134
|
|
(1,008,193
|
)
|
261,537
|
|
1,807,899
|
|
944,030
|
|
2,751,929
|
|
||||||
The accompanying notes are an integral part of these consolidated financial statements.
F-9
International Game Technology PLC
Notes to the Consolidated Financial Statements
|
1
.
|
Description of Business
|
International Game Technology PLC, a public limited company organized under the laws of England and Wales (the "Parent"), has its corporate headquarters at 66 Seymour Street, 2nd floor, London, W1H 5BT, United Kingdom. The Parent is the successor to GTECH S.p.A., a
società per azioni
incorporated under the laws of Italy ("GTECH"), and the sole stockholder of International Game Technology, a Nevada corporation ("IGT"). The Parent, together with its consolidated subsidiaries, has principal operating facilities in Providence, Rhode Island; Las Vegas, Nevada; and Rome, Italy.
When used in these notes, unless otherwise specified or the context otherwise indicates, all references to "IGT PLC," the "Company," "we," "our," or "us" refer to the business and operations of the Parent and its consolidated subsidiaries.
We are a leading commercial operator and provider of technology in the regulated worldwide gaming markets that operates and provides a full range of services and leading-edge technology products across all gaming markets, including lotteries, machine gaming, sports betting, interactive gaming and commercial services. Our state-of-the-art information technology platforms and software enable distribution of our products and services through land-based systems, internet and mobile devices.
|
2
.
|
Summary of Significant Accounting Policies
|
Basis of Preparation
The accompanying consolidated financial statements and notes of the Company have been prepared in accordance with accounting principles generally accepted in the United States of America ("GAAP"). The consolidated financial statements are stated in thousands of U.S. dollars (except share and per share data) unless otherwise indicated. We have reclassified certain prior period amounts to align with the current period presentation. All references to “U.S. dollars,” “U.S. dollar” and “$” refer to the currency of the United States of America. All references to "euro" and "€" refer to the currency introduced at the start of the third stage of the European Economic and Monetary Union pursuant to the Treaty on the Functioning of the European Union, as amended.
Use of Estimates
The preparation of financial statements in conformity with GAAP requires management to make estimates and assumptions that affect the reported amounts of assets and liabilities and disclosures of contingencies on the balance sheet dates and the reported amounts of revenue and expense during the reporting periods.
We evaluate our estimates continuously and base them on historical experience and on various other assumptions that we believe to be reasonable under the circumstances. Actual results may differ from these estimates if the assumptions prove incorrect. To the extent there are material differences between actual results and these estimates, our future results could be materially and adversely affected. We believe the accounting policies described below require us to make significant judgments and estimates in the preparation of our consolidated financial statements.
Our most critical accounting estimates include revenue recognition, allowance for doubtful accounts and credit losses, income taxes, legal and other contingencies and evaluation of long-lived assets for impairment.
Principles of Consolidation
The consolidated financial statements include the accounts of the Parent and its controlled subsidiaries, which are primarily majority owned. Investments in other entities that we have the ability to control, through a majority voting interest or otherwise, or with respect to which we are the primary beneficiary, are consolidated. Intercompany accounts and transactions have been eliminated in the consolidation. Earnings or losses attributable to any non-controlling interests or redeemable non-controlling interests in a subsidiary are included in net income (loss) in the consolidated statements of operations.
Investments in affiliates, through which we have the ability to exercise significant influence, but do not control and with respect to which we are not the primary beneficiary, are accounted for using the equity method of accounting. Investments in affiliates through which we have no ability to exercise significant influence are accounted for using the cost method of accounting.
F-10
Foreign Currency Translation
Assets and liabilities of subsidiaries located outside of the United States that have a local functional currency are translated to U.S. dollars at exchange rates in effect at the balance sheet date. Income and expense accounts for these subsidiaries are translated at the average exchange rates for the periods. Resulting translation adjustments are recorded as a component of accumulated other comprehensive income ("AOCI") within shareholders’ equity. We record gains and losses from currency transactions denominated in currencies other than the functional currency in the consolidated statement of operations.
Revenue Recognition
We account for a contract with a customer when:
|
i.
|
we have written approval;
|
|
ii.
|
the contract is committed;
|
|
iii.
|
the rights of the parties, including payment terms, are identified;
|
|
iv.
|
the contract has commercial substance; and
|
|
v.
|
collectability of consideration is probable.
|
A performance obligation is a promise in a contract with a customer to transfer products or services that are distinct. If we enter into two or more contracts at or near the same time, the contracts may be combined and accounted for as one contract, in which case we determine whether the services or products in the combined contract are distinct. A service or product that is promised to a customer is distinct if both of the following criteria are met:
|
•
|
The customer can benefit from the service or product either on its own or together with other resources that are readily available to the customer; and
|
|
•
|
Our promise to transfer the service or product to the customer is separately identifiable from other promises in the contract.
|
Revenue is recognized when (or as) control of a promised service or product transfers to a customer, in an amount that reflects the consideration (which represents the transaction price) to which we expect to be entitled in exchange for transferring that service or product. If the consideration promised in a contract includes a variable amount, we estimate the amount to which we expect to be entitled using either the expected value or most likely amount method. Our contracts may include terms that could cause variability in the consideration, including, for example, rebates, volume discounts, service-level penalties, and performance bonuses or other forms of contingent revenue.
Our standard payment terms dictate that payment is due upon receipt of invoice, payable within 30 days. Invoices are generally issued as control transfers and/or as services are rendered. Additionally, in determining the transaction price, we adjust the promised amount of consideration for the effects of the time value of money if the payment terms are not standard and the timing of payments agreed to by the parties to the contract provide the customer or the Company with a significant benefit of financing, in which case the contract contains a significant financing component. Most arrangements that contain a significant financing component include explicit financing terms.
We may include subcontractor services or third-party vendor services or products in certain arrangements. In these arrangements, revenue from sales of third-party vendor services or products are recorded net of costs when we are acting as an agent between the customer and the vendor, and gross when we are the principal for the transaction. To determine whether we are an agent or principal, we consider whether we obtain control of the services or products before they are transferred to the customer. In making this evaluation, several factors are considered, most notably whether we have primary responsibility for fulfillment to the customer, as well as inventory risk and pricing discretion.
Service Revenue
Service revenue is derived from the following sources:
|
•
|
Operating and Facilities Management Contracts;
|
|
•
|
Lottery Management Agreements ("LMA");
|
|
•
|
Machine Gaming; and
|
|
•
|
Other Services.
|
F-11
Operating and Facilities Management Contracts
Our revenue from operating contracts, primarily from the Italy segment, is derived from long-term exclusive operating licenses. Under operating contracts, we manage all the activities along the lottery value chain including collecting wagers, paying out prizes, managing all accounting and other back-office functions, running advertising and promotions, operating data transmission networks and processing centers, training staff, providing retailers with assistance, and supplying materials for the game. In most cases, the arrangement is a single performance obligation composed of a series of distinct services that are substantially the same and have the same pattern of transfer (e.g., distinct days of service).
Under operating contracts, we typically satisfy the performance obligation and recognize revenue over time because the customer simultaneously receives and consumes the benefits provided as we perform the services. The amount of consideration to which we are typically entitled is variable based on a percentage of sales. Revenue is typically recognized in the amount that we have the right to invoice the customer as this corresponds directly with the value to the customer of our completed performance. In arrangements where we are performing services on behalf of the government and the government is considered our customer, revenue is recognized net of prize payments, taxes, retailer commissions, and remittances to state authorities.
Under operating contracts, we are generally required to pay an upfront license fee. When such upfront license payments are made to our customers, the payment is recorded as a non-current asset and amortized ratably as a reduction of service revenue over the period of usage of the license.
Our revenue from facilities management contracts ("FMC") is generated by constructing, installing, and operating the online lottery system and related point-of-sale equipment. Under a typical FMC, we maintain ownership of the technology and are responsible for capital investments throughout the duration of the contract. FMCs typically include a wide range of support services that are provided throughout the contract and are part of the integrated solution that the customer has contracted to obtain. In most cases, the arrangement is a single performance obligation composed of a series of distinct services that are substantially the same and that have the same pattern of transfer. Under FMCs, we typically satisfy the performance obligation and recognize revenue over time because the customer simultaneously receives and consumes the benefits provided as we perform the services. The amount of transaction price to which we are entitled is typically variable based on a percentage of sales. Revenue is typically recognized in the amount that we have the right to invoice the customer, as this corresponds directly with the value to the customer of our completed performance.
Lottery Management Agreements
Our revenue from LMAs is primarily derived from two exclusive contracts within the North America Lottery segment. Similar to operating contracts, under LMAs we manage all the activities along the lottery value chain including collecting wagers, paying out prizes, managing all accounting and other back-office functions, running advertising and promotions, operating data transmission networks and processing centers, training staff, providing retailers with assistance and supplying materials for the game. The arrangement is a single performance obligation composed of a series of distinct services that are substantially the same and that have the same pattern of transfer (i.e., distinct days of service). In LMAs, we satisfy the performance obligation and recognize revenue over time because the customer simultaneously receives and consumes the benefits provided as we perform the services. These contracts are annual cost reimbursable contracts with incentives based on the achievement of contractual metrics. Annually, we estimate the amount of incentive to which we expect to be entitled and recognize the incentive and gross revenues on costs incurred as we perform the service. Changes in the annual estimated incentive are made cumulatively each reporting period.
Under LMAs, we can be required to pay an upfront license fee. When such upfront license payments are made to our customers, the payment is recorded as a non-current asset and amortized ratably as a reduction of service revenue over the period of usage of the license.
Machine Gaming
Our revenue from machine gaming services is generated by providing customers with proprietary land-based gaming systems and equipment under a variety of recurring revenue arrangements, including a percentage of coin-in (amounts wagered), a percentage of net win, or a fixed daily/monthly fee.
Included in machine gaming services are Wide Area Progressive ("WAP") systems. WAP systems consist of linked slot machines located in multiple casino properties, connected to a central computer system. WAP systems include a Company-sponsored progressive jackpot that increases with every wager until a player wins the top award combination. Casinos with WAP machines pay a percentage of the coin-in for services related to the design, assembly, installation, operation, maintenance, and marketing
F-12
of the WAP systems, as well as funding and administration of Company-sponsored progressive jackpots. A portion of the total fee collected is allocated to the WAP jackpot. Since the jackpot is a payment to the customer, the portion allocated to the jackpot is classified as a reduction of revenue.
In some arrangements, there is a single performance obligation composed of a series of distinct services that are substantially the same and that have the same pattern of transfer (i.e., distinct days of service). The amount of transaction price to which we are entitled typically is variable based on a percentage of wagers. This results in revenue recognition that corresponds with the value to the customer for the services transferred in the amount that we have the right to invoice. In other arrangements where the end customer is the player, we record revenue net of prize payouts once the wagering outcome has been determined.
Other Services
We also generate revenue from other services, including sports betting and commercial services.
We provide sports betting technology to lotteries and commercial operators in regulated markets, primarily in Italy and other countries in Europe as well as in the U.S. We currently offer two types of sports betting services: fixed odds contracts and sports pools arrangements.
In fixed odds contracts, we establish and assume the risks related to the odds. The potential payout is fixed at the time bets are placed and we bear the risk of odds setting. We are responsible for collecting the wagers, paying prizes, and paying fees to retailers. We retain the remaining amounts as profits. Under these contracts, we record revenue net of prize payouts, once the wagering outcome has been determined.
Our revenue from sports pools arrangements is derived from the management of sports pools where the prizes are divided among those players who select the correct outcome. There are no odds involved in sports pools and each winner’s payoff depends on the number of players and the size of the pool. Under sports pools arrangements, we collect the wagers, pay prizes, pay a percentage fee to retailers, withhold our fee, and remit the balance to the respective regulatory agency. We assume no risk associated with sports pool wagering. We record revenue net of prize payouts, retailer commissions, and remittances to state authorities once the event occurs.
We also develop technology to enable lotteries to offer commercial services over their existing lottery infrastructure or over standalone networks separate from the lottery. Leveraging our distribution network and secure transaction processing, we offer high-volume processing of commercial transactions including: prepaid cellular telephone recharges, bill payments, e-vouchers and retail-based programs, electronic tax payments, stamp duty services, prepaid card recharges, and money transfers. These services are primarily offered outside of North America. In most cases, these arrangements are considered to be short in duration. The amount of transaction price that we are typically entitled to is variable based on the number of transactions processed. Revenue is typically recognized in the amount that we have the right to invoice the customer as this corresponds directly with the value to the customer of our completed performance.
Our contracts generally include other services, including telephone support, software maintenance, content licensing, hardware maintenance, and the right to receive unspecified upgrades or enhancements on a when-and-if-available basis, and other professional services. Fees earned for other professional services are generally recognized as service revenue in the period the service is performed (i.e., over the support period).
Product Sales
Product sales are derived from the following sources:
|
•
|
Lottery and gaming machines, including game content; and
|
|
•
|
Lottery and gaming systems and other.
|
Lottery and Gaming Machines, including Game Content
Our revenue from the sale of lottery and gaming machines includes game content, non-machine gaming services related equipment, licensing and royalty fees, and component parts (including game themes and electronics conversion kits). Our credit terms are predominantly short-term in nature. We also grant extended payment terms under contracts where the sale is typically secured by the related equipment sold. Revenue from the sale of lottery and gaming machines is recognized based upon the contractual terms of each arrangement, but predominantly upon transfer of physical possession of the goods or the lapse of customer acceptance provisions. If the sale of lottery and gaming machines include multiple performance obligations, these arrangements are accounted
F-13
for under arrangements with multiple performance obligations, discussed below.
Lottery and Gaming Systems and Other
Our revenue from the sale of lottery systems and gaming systems typically includes multiple performance obligations, where we construct, sell, deliver and install a turnkey system (inclusive of point-of-sale terminals, if applicable) or deliver equipment and license the computer software for a fixed price, and the customer subsequently operates the system. These arrangements generally include customer acceptance provisions and general rights to terminate the contract if we are in breach of the contract or at the convenience of the customer. Such arrangements include hardware, software, and professional services. In these arrangements, the performance obligation is satisfied over time if the customer controls the asset as it is created (i.e., when the asset is built at the customer site) or if our performance does not create an asset with an alternative use and we have an enforceable right to payment plus a reasonable profit for performance completed to date. If revenue is not recognized over time, it is recognized based upon the contractual terms of each arrangement, but predominantly upon transfer of physical possession of the goods or the satisfaction of customer acceptance provisions. Our other product sales are primarily derived from the production and sales of instant ticket games under multi-year contracts. In these arrangements, the performance obligation is generally satisfied at a point in time (i.e., upon transfer of control of the game tickets to the customer) based on the contractual terms of each arrangement.
Arrangements with Multiple Performance Obligations
We often enter into contracts that consist of any combination of services and products based on the needs of our customers, which may include post-contract support for the software and a contract for post-warranty maintenance service for the hardware. These contracts consist of multiple services and products, whereby the hardware and software may be delivered in one period and the software support and hardware maintenance services are delivered over time.
To the extent that a service or product in an arrangement with multiple performance obligations is subject to other specific accounting guidance, that service or product is accounted for in accordance with such specific guidance.
For all other distinct services and products in these arrangements, the arrangement transaction price is allocated to each performance obligation on a relative standalone selling price basis or another method that depicts the amount of consideration to which we expect to be entitled in exchange for transferring the promised services or products. If the services and products are not distinct, we determine an appropriate measure of progress based on the nature of our overall promise for the single performance obligation.
To the extent we grant the customer the option to acquire additional services or products in one of these arrangements, we account for the option as a distinct performance obligation in the contract only if the option provides a material right to the customer that it would not receive without entering into the contract (i.e., a discount incremental to the range of discounts typically given for the service or product), in which case the customer in effect pays in advance for the option to purchase future services or products. We recognize revenue when those future services or products are transferred or when the option expires.
Standalone Selling Price
We allocate the transaction price to each performance obligation on a relative standalone selling price ("SSP") basis. The SSP is the price at which we would sell a promised service or product separately to a customer. In some instances, we are able to establish SSP based on the observable prices of services or products sold separately in comparable circumstances to a similar customer. We typically establish an SSP range for our services and products that are reassessed on a periodic basis or when facts and circumstances change.
In other instances, we may not be able to establish an SSP range based on observable prices and we estimate the SSP by considering multiple factors including, but not limited to, overall market conditions, including geographic or regional specific factors, competitive positioning, competitor actions, internal costs, profit objectives and pricing practices. Estimating SSP is a formal process that includes review and approval by management.
Contract Costs
Certain eligible, non-recurring costs incurred in the initial phases of service contracts are deferred and amortized ratably over the expected period of benefit, which includes anticipated contract renewals or extensions. Recurring operating costs in these contracts are recognized as incurred.
F-14
Practical Expedients and Exemptions
We report revenue net of any revenue-based taxes assessed by governmental authorities that are imposed on and concurrent with specific revenue-producing transactions.
We generally expense sales commissions when incurred because the amortization period would have been one year or less. These costs are recorded within selling, general and administrative expenses in our consolidated statements of operations. For certain of our long-term contracts, we capitalize and amortize incremental costs of obtaining a contract (e.g., sales commissions) on a straight-line basis over the expected customer relationship period if we expect to recover those costs.
We do not account for significant financing components if the period between when we transfer the promised service or product to the customer and when the customer pays for that service or product will be one year or less.
We do not disclose the value of unsatisfied performance obligations for (i) contracts with an original expected length of one year or less and (ii) contracts for which we recognize revenue at the amount that we have the right to invoice for services performed.
Contract Assets and Liabilities
Contract assets arise from contracts when revenue is recognized over time and the amount of revenue recognized exceeds the amount billed to the customer. These amounts are included in contract assets until the right to payment is no longer conditional on events other than the passage of time. Contract liabilities include deferred revenue, advance payments and billings in excess of revenue recognized.
Prior Accounting Standards
Prior to January 1, 2018, the Company recognized revenue under Accounting Standards Codification ("ASC") 605,
Revenue Recognition
("ASC 605") and ASC 985,
Software
("ASC 985"). Our accounting policies under Accounting Standards Update ("ASU") 2014-09,
Revenue from Contracts with Customers (Topic 606)
("ASC 606"), are materially similar to our prior accounting policies with the following differences:
|
•
|
The Company recognized revenue when persuasive evidence of an arrangement existed, delivery had occurred, the sales price was fixed and determinable and collectability was reasonably assured (or probable under ASC 985, Software);
|
|
•
|
The Company allocated the transaction price based on the relative selling price for each element determined using vendor-specific objective evidence (“VSOE”), if available, third-party evidence (“TPE”) or best estimate of selling price (“BESP”) if neither VSOE nor TPE were available. The Company’s process for determining relative selling price was materially the same as its current allocation of the transaction price to each performance obligation; and
|
|
•
|
Jackpot expense for our WAP services were recognized as a cost of service, whereas similar payments under ASC 606 are recognized as a reduction of revenue.
|
Upfront License Fees
We periodically make long-term investments in contracts with customers and obtain licenses to supply products and services to the customers. As consideration, we pay license fees, which are classified as other non-current assets in the consolidated balance sheets. We recognize the amortization of the license fees as a reduction of service revenue over the estimated economic life of the license term. This method reflects the pattern in which economic benefits are expected to be realized. The recoverability of each payment is subject to significant estimates about future revenues related to the contracts' future cash flows. We evaluate these assets for impairment and update amortization rates on an agreement by agreement basis. The assets are reviewed for impairment whenever events or changes in circumstances indicate their carrying amount may not be recoverable. In periods in which payments are made to the customer, we classify the payment as a cash outflow from operating activities in the consolidated statements of cash flows.
F-15
Jackpot Accounting
We incur costs to fund jackpots and accrue jackpot liabilities with every wager on devices connected to a WAP system. Jackpot liabilities are estimated based on the size of the jackpot, the number of WAP units in service, variations and volume of play, and interest rate movements. Jackpots are generally payable to winners immediately, in the case of instant wins, or in equal annual installments over
20
to
26 years
. Winners may elect to receive a lump sum payment for the present value of the jackpot discounted at applicable interest rates in lieu of periodic annual installments.
Jackpot liabilities are composed of payments due to previous winners, and amounts due to future winners of jackpots not yet won. Liabilities due to previous winners for periodic payments are carried at the accreted cost of a qualifying U.S. government or agency annuity investment that may be purchased at the time of the jackpot win. If the periodic liability is not initially funded with an annuity investment, it is discounted and accreted using the risk-free rate at the time of the jackpot win.
Liabilities due to future winners are recorded at the present value of the estimated amount of jackpots not yet won. We estimate the present value of these liabilities using current market rates, weighted with historical lump sum payout election ratios. Based on the most recent historical patterns, approximately
85%
of winners will elect the lump sum payment option. The current portion of these liabilities are estimated based on historical experience with winner payment elections, in conjunction with the theoretical projected number of jackpots.
Cash and Cash Equivalents
Cash and cash equivalents consist primarily of highly liquid investments purchased with an original maturity of three months or less at the date of acquisition, such as bank deposits, money market funds and interest bearing bank accounts with insignificant interest rate risk.
Restricted Cash and Cash Equivalents
We are required by gaming regulation to maintain sufficient reserves in restricted cash accounts to be used for the purpose of funding payments to WAP jackpot winners. These restricted cash balances are based primarily on the jackpot meters displayed to slot players or for previously won jackpots and vary by jurisdiction. Under our Italian Lotto contract, we deposit wagers, net of prizes paid and retailer commissions retained by the retailer at point of sale, into bank accounts, the use of which is restricted based on the contract with our customer. Restricted cash is also maintained for interactive online player deposits, collections on factored and serviced receivables not yet paid through to the third-party owner, and for customer funds received in relation to the provision of our commercial services. These amounts are restricted based on the contracts with our customers or local regulations.
Restricted cash equivalents are primarily composed of publicly-traded foreign government and corporate bonds and mutual funds, and are valued using quoted market prices.
Allowance for Credit Losses
We maintain an allowance for credit losses for the estimated probable losses on uncollectible trade and customer financing receivables. The allowance is estimated based upon the credit-worthiness of our customers, historical experience and aging analysis, as well as current market and economic conditions. Receivables are written off against these allowances in the period they are determined to be uncollectible.
We determine our allowances for credit losses on customer financing receivables based on
two
classes: contracts and notes. Contracts include extended payment terms granted to qualifying customers for periods from
one
to
six
years and are typically secured by the related products sold. Notes consist of development financing loans granted to select customers to assist in the funding of new or expanding gaming facilities, generally under terms of
one
to
seven
years, and are secured by the developed property and/or other customer assets. Customer financing interest income is recognized based on market rates prevailing at issuance.
F-16
Fair Value of Financial Instruments
Financial Accounting Standards Board ("FASB") ASC 820,
Fair Value Measurement
, defines fair value as the price that would be received to sell an asset or paid to transfer a liability in an orderly transaction between market participants at the measurement date. The fair value measurement hierarchy prioritizes the inputs to valuation techniques used to measure fair value as follows:
|
•
|
Level 1: Valuations based on inputs such as unadjusted quoted prices for identical assets or liabilities in active markets that the entity has the ability to access.
|
|
•
|
Level 2: Valuations based on inputs other than Level 1 inputs such as quoted prices for similar assets or liabilities, quoted prices in markets that are not active, or other inputs that are observable or can be corroborated by observable data for substantially the full term of the assets or liabilities.
|
|
•
|
Level 3: Valuation based on inputs that are supported by little or no market activity and that are significant to the fair value of the assets or liabilities.
|
The fair value hierarchy gives the highest priority to Level 1 inputs and the lowest priority to Level 3 inputs. A financial instrument’s fair value classification is based on the lowest level of any input that is significant in the fair value measurement hierarchy. Valuation methods and assumptions used to estimate fair value, when Level 1 inputs are not available, are subject to judgments and changes in these factors can materially affect fair value estimates.
For financial assets and financial liabilities that are recognized at fair value on a recurring basis, we determine whether transfers have occurred between levels in the hierarchy by re-assessing categorization (based on the lowest level input that is significant to the fair value measurement as a whole) at the end of each reporting period.
The carrying amounts reported in the consolidated balance sheets for cash and cash equivalents, restricted cash, trade and other receivables, other current assets, accounts payable, and other current liabilities approximate fair value due to relatively short periods to maturity.
Derivative Financial Instruments
We use derivative financial instruments for the management of foreign currency risks and interest rate risks. We do not enter into derivatives for speculative purposes. Derivatives are recognized as either assets or liabilities in the consolidated balance sheet at fair value. All derivatives are recorded gross, except netting of foreign exchange contracts and counterparty netting of interest receivable and payable related to interest rate swaps, as applicable. The accounting for changes in the fair value of a derivative depends on the nature of the hedge and the hedge effectiveness. Derivative gains and losses are reported in the consolidated statements of cash flows consistent with the classification of the cash flows from the underlying hedged items.
For derivative instruments designated as cash flow hedges, gains and losses are recorded in other comprehensive income and are subsequently reclassified when the hedged item affects earnings. At that time, the amount is reclassified from other comprehensive income to the same income statement line as the earnings effect of the hedged item.
For derivative instruments designated as fair value hedges, changes in fair value are recorded in interest income (expense) and are offset by changes in the fair value of the underlying debt instrument due to changes in the benchmark interest rate.
For derivative instruments designated as net investment hedges, the spot portion of the derivative gain or loss is reported in foreign currency translation within other comprehensive income to offset any gains or losses on translation of the net investment in the subsidiary. All other components of the derivative fair value will be reported in income, as either interest income or interest expense, on an amortized basis.
Derivative instruments not designated as hedges are recognized in the consolidated balance sheet at fair value with the changes in fair value recorded in foreign exchange gain (loss), net, in the consolidated statements of operations.
F-17
Concentrations of Risks
Financial instruments that potentially subject us to concentration of credit risk consist principally of bank deposits, short and long-term investments, trade receivable, customer financing receivables and foreign currency exchange contracts. Deposits held with banks in the United States may exceed the amount of Federal Deposit Insurance Corporation ("FDIC") insurance provided on such deposits. Deposits held with banks outside the United States generally do not benefit from FDIC insurance. The majority of our day-to-day banking operations globally are maintained with major, financially sound counterparties with high-grade credit ratings, and we limit our exposure to any one counterparty.
We provide credit to customers in the normal course of business. Credit is extended to new customers based on checks of credit references, credit scores and industry reputation. Credit is extended to existing customers based on prior payment history and demonstrated financial stability. The credit risk associated with trade and customer financing receivables is generally limited due to the large number of customers and their geographic dispersion. We establish an allowance for the estimated uncollectible portion of trade and customer financing receivables. Product sales are generally dispersed among a large number of customers, minimizing the reliance on any particular customer or group of customers.
The counterparties to our foreign currency exchange contracts consist of a number of major financial institutions. In addition to limiting the amount of contracts we enter into with any one party, we monitor the credit quality of the counterparties on an ongoing basis.
We purchase or license many sophisticated components and products from one or a limited number of qualified suppliers. If any of our suppliers were to cancel or materially change contracts or commitments with the Company or fail to meet the quality or delivery requirements needed to satisfy customer orders for our products, we could lose customer orders. We attempt to minimize this risk by finding alternative suppliers or maintaining adequate inventory levels.
Inventories
Inventories are stated at the lower of cost (applying the first in, first out method) and net realizable value. Allowances are made for defective, obsolete or excess inventory.
Legal and Other Contingencies
Loss contingency provisions arising from a legal proceeding or claim are recorded for probable and estimable losses at the best estimate of a loss, or when a best estimate cannot be made, at the minimum estimated loss, the determination of which requires significant judgment. If it is reasonably possible but not probable that a liability has been incurred, or if the amount of a probable loss cannot be reasonably estimated, the amount or range of estimated loss is disclosed, if material. We evaluate our provisions for legal contingencies at least quarterly and, as appropriate, establish new provisions or adjust existing provisions to reflect the facts and circumstances known to us at the time, including information regarding negotiations, settlements, rulings and other relevant events and developments; the advice of counsel; and the assumptions and judgment of management. Legal costs are expensed as incurred.
Income Taxes
Deferred tax assets and liabilities are recognized for the expected future tax consequences of events that have been included in the financial statements or tax returns. Deferred tax assets and liabilities are determined based on the difference between the tax basis of assets and liabilities and their reported amounts using the enacted tax rates in effect for the year in which the differences are expected to reverse. Tax credits are generally recognized as reductions of income tax provisions in the year in which the credits arise. The measurement of deferred tax assets is reduced by a valuation allowance if, based upon available evidence, it is more likely than not that some or all of the deferred tax assets will not be realized. The effect of a change in income tax rates is recognized as income or expense in the period that includes the enacted or substantively enacted date.
Accounting for uncertainty in income taxes recognized in the consolidated financial statements is in accordance with accounting authoritative guidance, which prescribes a two-step process to determine the amount of tax benefit to be recognized. First, the tax position must be evaluated to determine the likelihood that it will be sustained upon external examination. If the tax position is deemed "more likely than not" to be sustained, the tax position is then assessed to determine the amount of the benefit to recognize in the consolidated financial statements. The amount of the benefit that may be recognized is the largest amount that has a greater than 50 percent likelihood of being realized upon ultimate settlement.
F-18
We recognize interest and penalties related to unrecognized tax benefits on the provision for taxes line of the consolidated statement of operations. Accrued interest and penalties are included on the related tax liability line in the consolidated balance sheets.
At December 31, 2018, we finalized our policy and have elected to use the period cost method for global intangible low-taxed income ("GILTI") provisions and therefore have not recorded deferred taxes for basis differences expected to reverse in future periods.
Business Combinations
We account for acquired subsidiaries using the acquisition method and accordingly, the identifiable assets acquired, the liabilities assumed, and any non-controlling interest in the acquiree are recorded at their acquisition date fair values. The excess of the costs of an acquired subsidiary over the net of the amounts assigned to identifiable assets acquired and liabilities incurred or assumed, is capitalized as goodwill. Acquisition and disposition related costs are included in transaction (income) expense, net in the consolidated statements of operations. Transaction (income) expense, net is composed of transaction costs on significant business combinations and gains and losses incurred on disposals of group entities or businesses. The results of operations of acquired subsidiaries are included in the consolidated financial statements from the date control is obtained.
Goodwill
Goodwill represents the excess of the costs of an acquisition, including the fair value of any contingent consideration, over the fair value of the amounts assigned to assets acquired and liabilities incurred or assumed of the acquired subsidiary at the date of acquisition. The primary drivers that generate goodwill are the value of synergies between the acquired subsidiary and the Company and the acquired assembled workforce, neither of which qualifies as a separately identifiable intangible asset. Goodwill is stated at cost less accumulated impairment losses.
Other Intangible Assets
Other intangible assets are stated at cost, less accumulated amortization and accumulated impairment losses, and include indefinite-lived and definite-lived intangible assets.
Indefinite-lived intangible assets are composed of trademarks for which there is no foreseeable limit of the period over which they are expected to generate net cash inflows. Definite-lived intangible assets, which are primarily composed of customer relationships, computer software and game library, licenses, and developed technologies, are capitalized and amortized on a straight-line basis over their estimated economic lives. Amortization of software-related intangibles is included in cost of services and cost of product sales and amortization of other intangible assets is included in selling, general and administrative expenses in the consolidated statement of operations.
The estimated economic lives of our definite-lived intangible assets are as follows:
|
Category
|
|
Estimated economic life
|
|
Networks
|
|
7 years
|
|
Sports and horse racing betting rights
|
|
7 years
|
|
Computer software and game library
|
|
3 - 14 years
|
|
Licenses
|
|
3 - 15 years
|
|
Trademarks
|
|
3 - 20 years
|
|
Developed technologies
|
|
5 - 14 years
|
|
Customer relationships
|
|
7 - 20 years
|
|
Other
|
|
3 - 17 years
|
F-19
Systems, Equipment and Other Assets Related to Contracts, Net and Property, Plant and Equipment, Net
We have
two
categories of fixed assets: systems, equipment and other assets related to contracts ("Systems & Equipment"); and property, plant and equipment ("PPE").
Systems & Equipment are assets that primarily support our operating contracts and facilities management contracts (collectively, the "Contracts") and are principally composed of lottery and gaming assets. PPE are assets we use internally, primarily in manufacturing, selling, general and administration, research and development ("R&D"), and commercial service applications not associated with Contracts.
Systems & Equipment and PPE are stated at cost, net of accumulated depreciation and accumulated impairment loss, if any. Depreciation commences when the asset is placed in service and is recognized on a straight-line basis over the estimated useful lives of the assets. Repair and maintenance costs, including planned maintenance, are expensed as incurred.
The estimated useful lives for Systems & Equipment depends on the type of cost as follows:
|
•
|
Lottery costs (such as terminals, mainframe computers, communications equipment, and software development costs); and
|
|
•
|
Commercial gaming machines.
|
Lottery costs are typically depreciated over their estimated useful lives, generally not to exceed
10 years
, and commercial gaming machines over
three
to
five years
.
The estimated useful lives for PPE is
40 years
for buildings and
five
to
10 years
for furniture and equipment. Leasehold improvements are amortized over the shorter of the lease term or estimated useful life.
Evaluation of Long-Lived Assets for Impairment
Goodwill is tested for impairment annually, in the fourth quarter, or whenever events or changes in circumstances indicate the carrying amount may not be recoverable. In 2018, we changed our goodwill impairment testing date from November 1 to December 31 to better align with the timing and completion of our forecasting process. Goodwill is tested at the reporting unit level, which is one level below or the same level as an operating segment.
Goodwill is reviewed for impairment using either a qualitative assessment or a quantitative one-step process. The goodwill impairment test compares the fair value of a reporting unit with its carrying amount and an impairment loss is recognized for the amount by which the carrying amount exceeds the reporting unit's fair value, not to exceed the total amount of goodwill allocated to that reporting unit. In performing the goodwill impairment test, we estimate the fair value of the reporting units using an income approach that analyzes projected discounted cash flows.
Other indefinite-lived intangible assets other than goodwill are tested for impairment annually, in the fourth quarter, or whenever events or changes in circumstances indicate the carrying amount may not be recoverable. We first perform a qualitative assessment to determine whether it is more likely than not that the fair value of indefinite-lived intangible assets are less than their carrying amount and whether the quantitative analysis is necessary. The quantitative analysis compares the fair value of indefinite-lived intangible assets to their carrying amount and an impairment loss is recognized when the carrying amount exceeds the fair value.
Long-lived assets, other than goodwill and other indefinite-lived intangible assets, are tested for impairment whenever events or changes in circumstances indicate the carrying amount of those assets or asset groups may not be recoverable. An impairment loss is recognized only if the carrying amount is not recoverable and exceeds its fair value. The carrying amount is not recoverable if it exceeds the sum of the undiscounted forecasted cash flows resulting from the use and eventual disposition of such asset. An impairment loss is measured as the amount by which the carrying amount exceeds its fair value.
Research and Development Costs
R&D costs, which include salaries and benefits, stock-based compensation, consultants' fees, facilities-related costs, material costs, depreciation and travel, are expensed as incurred.
F-20
Capitalized Software Development Costs
Costs incurred in the development of our externally-sold software products are expensed as incurred, except certain software development costs eligible for capitalization. Material software development costs incurred subsequent to establishing technological feasibility and through the general release of the software products are capitalized. Technological feasibility is demonstrated by the completion of a detailed program design or working model, if no program design is completed. Capitalized costs are amortized over the products’ estimated economic life to cost of product sales in the consolidated statement of operations.
Costs incurred in the development of software to be used only for services provided to customers are capitalized as internal-use software and amortized over the useful life to cost of services. Costs incurred in the development of software to be used only for internal use are capitalized as internal-use software and amortized over the useful life to selling, general and administrative expenses in the consolidated statement of operations.
Stock-Based Compensation
Stock-based compensation represents the cost related to stock-based awards granted to directors and employees. Stock-based compensation cost is measured at the grant date, based on the estimated fair value of the award and recognized as expense, net of estimated forfeitures, over the vesting period. For awards that contain only a service vesting feature, compensation cost is recognized on a straight-line basis over the awards’ vesting period. For awards with a performance condition, when achievement of the performance condition is deemed probable, compensation cost is recognized on a graded-vesting basis over the awards’ expected vesting period.
Advertising
Advertising costs are expensed as incurred. Advertising expense was
$61.5 million
,
$111.9 million
and
$151.6 million
for the years ended
December 31, 2018
,
2017
and
2016
, respectively.
New Accounting Standards - Recently Adopted
In October 2018, the FASB issued ASU No. 2018-16,
Derivatives and Hedging (Topic 815): Inclusion of the Secured Overnight Financing Rate (SOFR) Overnight Index Swap (OIS) Rate as a Benchmark Interest Rate for Hedge Accounting Purposes
. This guidance is effective upon adoption of ASU No. 2017-12 which we early adopted in the fourth quarter of 2018 and is applied on a prospective basis for qualifying new or redesignated hedging relationships entered into on or after the adoption date. The adoption did not impact our hedging relationships and did not have a material impact on our consolidated financial statements.
In August 2018, the FASB issued ASU No. 2018-15,
Intangibles - Goodwill and other - Internal-use software (Subtopic 350-40): Customer’s Accounting for Implementation Costs Incurred in a Cloud Computing Arrangement That is a Service Contract
("ASU 2018-15"), which allows for capitalization of implementation costs incurred in a hosting arrangement that is a service contract. The capitalized costs are then expensed over the term of the hosting arrangement. We adopted ASU 2018-15 in the third quarter of 2018 and applied it prospectively. The adoption did not have a material impact on our consolidated financial statements.
In February 2018, the FASB issued ASU No. 2018-03,
Technical Corrections and Improvements to Financial Instruments-Overall (Subtopic 825-10): Recognition and Measurement of Financial Assets and Financial Liabilities
("ASU 2018-03"), which provides clarity regarding measurement, presentation, and disclosure of equity securities, options, and forward contracts. We adopted ASU 2018-03 in the third quarter of 2018 and applied it prospectively. The adoption did not have a material impact on our consolidated financial statements.
In February 2018, the FASB issued ASU No. 2018-02,
Income Statement - Reporting Comprehensive Income (Topic 220): Reclassification of Certain Tax Effects from Accumulated Other Comprehensive Income
("ASU 2018-02"), which permits entities to reclassify tax effects stranded in AOCI as a result of tax reform to retained earnings. Companies that elect to reclassify these amounts must reclassify stranded tax effects for all items accounted for in AOCI. We adopted ASU 2018-02 in the first quarter of 2018 and applied it prospectively. The adoption did not have a material impact on our consolidated financial statements.
In August 2017, the FASB issued ASU No. 2017-12,
Derivatives and Hedging (Topic 815): Targeted Improvements to Accounting for Hedging Activities
("ASU 2017-12"), which expands and refines hedge accounting for both financial and non-financial risk components and aligns the recognition and presentation of the effects of the hedging instrument and the hedged item in the financial statements. ASU 2017-12 was adopted in the fourth quarter of 2018. The adoption did not have a material impact on our consolidated financial statements. The amended presentation and disclosure guidance was applied prospectively as required, therefore, no changes were made to our prior year consolidated financial statements.
F-21
In January 2017, the FASB issued ASU No. 2017-01,
Business Combinations (Topic 805): Clarifying the Definition of a Business
("ASU 2017-01"), which clarifies the definition of a business in order to allow for the evaluation of whether transactions should be accounted for as acquisitions or disposals of assets or businesses. ASU 2017-01 was adopted in the first quarter of 2018 and did not have an impact on our consolidated financial statements.
In November 2016, the FASB issued ASU No. 2016-18,
Statement of Cash Flows (Topic 230): Restricted Cash
("ASU 2016-18"), which requires that a statement of cash flows explain the change during the period in the total of cash, cash equivalents, and amounts generally described as restricted cash or restricted cash equivalents. As a result, amounts generally described as restricted cash and restricted cash equivalents should be included with cash and cash equivalents when reconciling the beginning-of-period and end-of-period total amounts shown on the statement of cash flows.
We adopted ASU 2016-18 in the first quarter of 2018 on a retrospective basis with the following impacts to our consolidated statements of cash flows ($ thousands):
|
For the year ended
December 31, 2017 |
Under Prior
Accounting |
Restricted Cash Adjustment
|
As Adjusted
|
||||||
|
Other assets and liabilities
|
(118,923
|
)
|
(22,540
|
)
|
(141,463
|
)
|
|||
|
Net cash provided by operating activities
|
685,928
|
|
(22,540
|
)
|
663,388
|
|
|||
|
Other
|
5,435
|
|
(3,099
|
)
|
2,336
|
|
|||
|
Net cash provided by investing activities
|
298,665
|
|
(3,099
|
)
|
295,566
|
|
|||
|
Net increase in cash and cash equivalents, and restricted cash and cash equivalents
|
737,621
|
|
(25,639
|
)
|
711,982
|
|
|||
|
Effect of exchange rate changes on cash and cash equivalents, and restricted cash and cash equivalents
|
25,703
|
|
26,429
|
|
52,132
|
|
|||
|
Cash and cash equivalents, and restricted cash and cash equivalents at the beginning of the period
|
294,094
|
|
247,222
|
|
541,316
|
|
|||
|
Cash and cash equivalents, and restricted cash and cash equivalents at the end of the period
|
1,057,418
|
|
248,012
|
|
1,305,430
|
|
|||
|
For the year ended
December 31, 2016 |
Under Prior
Accounting |
Restricted Cash Adjustment
|
As Adjusted
|
||||||
|
Accounts payable
|
(22,855
|
)
|
59,917
|
|
37,062
|
|
|||
|
Other assets and liabilities
|
(21,736
|
)
|
(3,195
|
)
|
(24,931
|
)
|
|||
|
Net cash provided by operating activities
|
281,332
|
|
56,722
|
|
338,054
|
|
|||
|
Other
|
40,160
|
|
(23,456
|
)
|
16,704
|
|
|||
|
Net cash used in investing activities
|
(315,985
|
)
|
(23,456
|
)
|
(339,441
|
)
|
|||
|
Net decrease in cash and cash equivalents, and restricted cash and cash equivalents
|
(346,792
|
)
|
33,266
|
|
(313,526
|
)
|
|||
|
Effect of exchange rate changes on cash and cash equivalents, and restricted cash and cash equivalents
|
13,402
|
|
(3,748
|
)
|
9,654
|
|
|||
|
Cash and cash equivalents, and restricted cash and cash equivalents at the beginning of the period
(1)
|
627,484
|
|
217,704
|
|
845,188
|
|
|||
|
Cash and cash equivalents, and restricted cash and cash equivalents at the end of the period
|
294,094
|
|
247,222
|
|
541,316
|
|
|||
(1) In connection with the adoption of ASU 2016-18, the Company corrected its balance sheet as of January 1, 2016 to include an additional
$48.6 million
in restricted cash and cash equivalents which had previously been offset against current liabilities of the same amounts. Accordingly, the revised restricted cash and cash equivalents balance as of January 1, 2016 is
$217.7 million
which is included in the cash and cash equivalents, and restricted cash and cash equivalents at the beginning of the period in the schedule above as well as in the consolidated statements of cash flows.
In October 2016, the FASB issued ASU No. 2016-16,
Income Taxes (Topic 740): Intra-Entity Transfer of Assets Other Than Inventory
("ASU 2016-16"), which eliminates the deferral of the tax effects of intra-entity asset transfers other than inventory. As a result, the income tax consequences from the intra-entity asset transfers other than inventory and associated changes to deferred
F-22
taxes will be recognized when the transfer occurs. We adopted ASU 2016-16 in the first quarter of 2018 using the modified retrospective method. The adoption did not have a material impact on our consolidated financial statements.
In August 2016, the FASB issued ASU No. 2016-15,
Statement of Cash Flows (Topic 230): Classification of Certain Cash Receipts and Cash Payments
("ASU 2016-15"), which reduces diversity in practice in financial reporting by clarifying certain existing principles in the statements of cash flows. ASU 2016-15 was adopted in the first quarter of 2018 and did not have a material impact on our consolidated financial statements.
In January 2016, the FASB issued ASU No. 2016-01,
Financial Instruments - Overall (Subtopic 825-10): Recognition and Measurement of Financial Assets and Financial Liabilities
("ASU 2016-01"), which makes improvements specifically around recognition and measurement of financial assets and liabilities. ASU 2016-01 was adopted in the first quarter of 2018 and did not have a material impact on our consolidated financial statements.
In May 2014, the FASB issued ASC 606. The amended guidance, combined with all subsequent amendments, outlines a single comprehensive revenue model in accounting for revenue from contracts with customers. ASC 606 supersedes existing revenue recognition guidance under GAAP, including industry-specific guidance, and replaces it with a five-step revenue model with a core principle to recognize revenue when promised goods or services are transferred to customers in an amount that reflects the consideration that is expected to be received for those goods or services. Under ASC 606, more judgment and estimates are required within the revenue recognition process than required under prior GAAP, including identifying performance obligations in the contract, estimating the amount of variable consideration to include in the transaction price, and allocating the transaction price to each separate performance obligation.
We adopted ASC 606 in the first quarter of 2018 using a modified retrospective application approach which was applied to customer contracts, in their modified state, that were not completed as of January 1, 2018. We recognized the cumulative effect of initially applying the new revenue recognition standard as an adjustment to beginning retained deficit.
On January 1, 2018, we recorded a pre-tax transition adjustment within retained deficit of
$61.2 million
(
$50.9 million
after tax) in our consolidated financial statements, primarily due to multi-year licenses, LMA incentives, and lottery machines wherein control transferred in advance of delivery. ASC 606 resulted in the reclassification of our jackpot expense from cost of services to a reduction of service revenue in our consolidated statements of operations. We did not experience significant changes to our business practices and systems to support the adoption of ASC 606. See Note
3
,
Revenue Recognition
, for additional information on the adoption of ASC 606.
New Accounting Standards - Not Yet Adopted
In August 2018, the FASB issued ASU No. 2018-13,
Fair Value Measurement (Topic 820): Changes to the Disclosure Requirements for Fair Value Measurement
("ASU 2018-13"), which provides guidance around disclosure requirements for fair value measurement of investments. ASU 2018-13 is effective for fiscal years beginning after December 15, 2019, and interim periods within those fiscal years, with early adoption permitted. We will adopt ASU 2018-13 upon the effective date and are currently evaluating the impact of adoption.
In June 2016, the FASB issued ASU No. 2016-13,
Financial Instruments - Credit Losses (Topic 326): Measurement of Credit Losses on Financial Instruments
("ASU 2016-13"), which replaces the incurred loss impairment methodology in current GAAP with a methodology that reflects expected credit losses and requires consideration of a broader range of reasonable and supportable information to inform credit loss estimates. For trade and other receivables, loans and other financial instruments, we will be required to use a forward-looking expected loss model rather than the incurred loss model for recognizing credit losses which reflects losses that are probable. ASU 2016-13 will be effective beginning January 1, 2020, with early adoption permitted beginning January 1, 2018. Application of ASU 2016-13 is through a cumulative-effect adjustment to retained earnings as of the effective date. We are currently evaluating the impact and timing of adopting this guidance.
In February 2016, the FASB issued ASU No. 2016-02,
Leases (Topic 842)
("ASU 2016-02") to increase transparency and comparability among organizations by recognizing lease assets and liabilities on the balance sheet and disclosing key information about leasing arrangements. In 2017 and 2018, the FASB amended ASU 2016-02. ASU 2016-02 and related amendments (collectively "ASC 842") are effective for the Company as of January 1, 2019. The Company will adopt ASC 842 using the optional transition method which will result in a cumulative effect adjustment to retained earnings on January 1, 2019. Additionally, we have elected to apply the package of practical expedients and to use hindsight in determining the lease term and assessing impairment.
F-23
As a lessee of real estate globally, we expect the adoption of ASC 842 to have a significant impact on the consolidated balance sheet due to the recognition of right of use ("ROU") assets and lease liabilities for existing operating leases. As a lessee, we will record a ROU asset and lease liability on the balance sheet for substantially all leases with initial lease terms longer than 12 months. There will not be a significant change to our consolidated statements of operations, comprehensive income, cash flows, or liquidity.
While lessor accounting is largely unchanged under ASC 842, certain of our lottery and gaming arrangements may include leases for implicitly or explicitly identified equipment installed at customer locations as part of our long-term technology service contracts. In these arrangements, we are typically compensated based on a percentage of sales or other forms of variable payment. While most of these leases will be classified as operating leases, certain of these are leases that could be classified as sales-type financing leases either at inception or upon modification of existing contracts in future periods. After electing the practical expedient to combine lease and non-lease components as the lessor for an operating lease, most contracts will fall under the guidance of ASC 606 because the predominant component of a technology service contract is for non-lease components.
We will continue to assess the anticipated impact of adopting this guidance on ongoing business policies and processes.
We do not currently expect that any other recently issued accounting guidance will have a significant effect on the consolidated financial statements.
F-24
|
3
.
|
Revenue Recognition
|
Disaggregation of Revenue
The following table summarizes customer contract revenue disaggregated by reportable segment and the source of the revenue for the year ended
December 31, 2018
:
|
For the year ended December 31, 2018
|
||||||||||||||||||
|
($ thousands)
|
|
North America Gaming and Interactive
|
North America Lottery
|
International
|
Italy
|
Other
|
Total
|
|||||||||||
|
Operating and Facilities Management Contracts
|
—
|
|
828,641
|
|
282,864
|
|
793,315
|
|
—
|
|
1,904,820
|
|
||||||
|
Lottery Management Agreements
|
—
|
|
129,104
|
|
—
|
|
—
|
|
—
|
|
129,104
|
|
||||||
|
Machine gaming
|
420,447
|
|
99,679
|
|
53,586
|
|
672,200
|
|
—
|
|
1,245,912
|
|
||||||
|
Other services
|
|
204,029
|
|
53,645
|
|
159,047
|
|
349,034
|
|
723
|
|
766,478
|
|
|||||
|
Service revenue
|
624,476
|
|
1,111,069
|
|
495,497
|
|
1,814,549
|
|
723
|
|
4,046,314
|
|
||||||
|
Lottery machines
|
—
|
|
80,405
|
|
20,246
|
|
—
|
|
—
|
|
100,651
|
|
||||||
|
Gaming machines
|
|
261,696
|
|
—
|
|
193,092
|
|
—
|
|
—
|
|
454,788
|
|
|||||
|
Systems and other
|
|
116,997
|
|
428
|
|
111,148
|
|
930
|
|
—
|
|
229,503
|
|
|||||
|
Product sales
|
|
378,693
|
|
80,833
|
|
324,486
|
|
930
|
|
—
|
|
784,942
|
|
|||||
|
Total revenue
|
1,003,169
|
|
1,191,902
|
|
819,983
|
|
1,815,479
|
|
723
|
|
4,831,256
|
|
||||||
Contract Balances
Information about receivables, contract assets and contract liabilities subject to ASC 606 is as follows:
|
($ thousands)
|
|
December 31, 2018
|
|
January 1, 2018
(As Adjusted)
|
Balance Sheet Classification
|
|||
|
Receivables, net
|
|
949,085
|
|
938,958
|
|
Trade and other receivables, net
|
||
|
Contract assets:
|
|
|||||||
|
Current
|
58,739
|
|
27,903
|
|
Other current assets
|
|||
|
Non-current
|
69,691
|
|
43,511
|
|
Other non-current assets
|
|||
|
128,430
|
|
71,414
|
|
|||||
|
|
||||||||
|
Contract liabilities:
|
|
|||||||
|
Current
|
(72,005
|
)
|
(62,847
|
)
|
Other current liabilities
|
|||
|
Non-current
|
(67,022
|
)
|
(51,848
|
)
|
Other non-current liabilities
|
|||
|
(139,027
|
)
|
(114,695
|
)
|
|||||
The amount of revenue recognized during the year ended
December 31, 2018
that was included in the contract liabilities balance at January 1, 2018 was
$44.5 million
.
Transaction Price Allocated to Remaining Performance Obligations
Estimated revenue expected to be recognized in the future related to remaining performance obligations includes estimates of variable consideration, except when the variable consideration is a sales-based or usage-based royalty promised in exchange for a license of intellectual property, the original duration of the contract is one year or less, or we apply the right to invoice practical expedient. Remaining performance obligation estimates are subject to change and are affected by several factors, including terminations, changes in the scope of contracts, periodic revalidations, adjustment for revenue that has not materialized and adjustments for currency.
At
December 31, 2018
, unsatisfied performance obligations for contracts expected to be greater than one year or contracts for which we do not have a right to consideration from the customer in the amount that corresponds to the value to the customer for
F-25
our performance completed to date were approximately
3%
of our annual revenue for 2018, of which approximately
25%
is expected to be satisfied within
one
year and the remainder is expected to be satisfied over the subsequent
seven
years.
Reconciliation of ASC 606 to Prior Accounting Standards
The following table summarizes the impacts of adopting ASC 606 to our consolidated statement of operations for the year ended
December 31, 2018
:
|
For the year ended December 31, 2018
|
|||||||||
|
($ thousands, except per share amounts)
|
|
Under Prior
Accounting |
|
Revenue Recognition
Adjustment |
|
As Adjusted
|
|||
|
Revenue
|
|
4,896,300
|
|
(65,044
|
)
|
|
4,831,256
|
|
|
|
Operating expenses
|
(4,264,321
|
)
|
80,056
|
|
(4,184,265
|
)
|
|||
|
Provision for income taxes
|
|
(187,897
|
)
|
(1,504
|
)
|
|
(189,401
|
)
|
|
|
Net income attributable to IGT PLC
|
|
(34,858
|
)
|
13,508
|
|
|
(21,350
|
)
|
|
|
Net income attributable to IGT PLC per common share - basic
|
|
(0.17
|
)
|
0.07
|
|
|
(0.10
|
)
|
|
|
Net income attributable to IGT PLC per common share - diluted
|
|
(0.17
|
)
|
0.07
|
|
|
(0.10
|
)
|
|
The following table summarizes the impacts of adopting ASC 606 to our consolidated balance sheet at
December 31, 2018
:
|
December 31, 2018
|
|||||||||
|
($ thousands)
|
|
Under Prior
Accounting |
|
Revenue Recognition
Adjustment |
|
As Adjusted
|
|||
|
Trade and other receivables, net
|
943,935
|
|
5,150
|
|
949,085
|
|
|||
|
Inventories, net
|
298,234
|
|
(15,536
|
)
|
282,698
|
|
|||
|
Other current assets
|
|
446,285
|
|
57,776
|
|
504,061
|
|
||
|
Other non-current assets
|
|
2,081,115
|
|
27,849
|
|
2,108,964
|
|
||
|
Other current liabilities
|
802,589
|
|
14,133
|
|
816,722
|
|
|||
|
Other non-current liabilities
|
448,757
|
|
(3,312
|
)
|
445,445
|
|
|||
|
Retained deficit
|
|
(1,072,611
|
)
|
64,418
|
|
(1,008,193
|
)
|
||
The following table summarizes the impacts of adopting ASC 606 to our consolidated statement of cash flows for the year ended
December 31, 2018
:
|
For the year ended December 31, 2018
|
|||||||||
|
($ thousands)
|
|
Under Prior
Accounting |
|
Revenue Recognition
Adjustment |
|
As Adjusted
|
|||
|
Net income (loss)
|
101,102
|
|
13,545
|
|
114,647
|
|
|||
|
Trade and other receivables
|
(50,310
|
)
|
(4,046
|
)
|
(54,356
|
)
|
|||
|
Inventories
|
|
18,429
|
|
(5,873
|
)
|
12,556
|
|
||
|
Other assets and liabilities
|
|
(128,314
|
)
|
(3,626
|
)
|
(131,940
|
)
|
||
|
Net cash provided by operating activities
|
29,626
|
|
—
|
|
29,626
|
|
|||
F-26
|
4
.
|
Dispositions
|
Sale of Double Down Interactive LLC
On June 1, 2017, we sold Double Down Interactive LLC ("DoubleDown") to DoubleU Games Co., Ltd. Details of the transaction are summarized in the table below.
|
($ thousands)
|
For the year ended
December 31, 2017 |
||
|
Cash proceeds
|
825,751
|
|
|
|
Less: Cash divested
|
(1,963
|
)
|
|
|
Net cash proceeds
|
823,788
|
|
|
|
Net book value
|
(772,440
|
)
|
|
|
Gain on sale
|
51,348
|
|
|
|
Selling costs
|
(24,116
|
)
|
|
|
Gain on sale, net of selling costs
|
27,232
|
|
|
The
$27.2 million
gain on sale of DoubleDown, net of selling costs, is classified within transaction expense (income), net on the consolidated statement of operations for the year ended December 31, 2017.
|
5
.
|
Trade and Other Receivables, net
|
Trade and other receivables, net are recorded at cost.
|
|
December 31,
|
|||||
|
($ thousands)
|
2018
|
2017
|
||||
|
Gross
|
1,008,509
|
|
991,177
|
|
||
|
Allowance for credit losses
|
(59,424
|
)
|
(53,323
|
)
|
||
|
Net
|
949,085
|
|
937,854
|
|
||
The following table presents the activity in the allowance for credit losses:
|
|
December 31,
|
||||||||
|
($ thousands)
|
2018
|
2017
|
2016
|
||||||
|
Balance at beginning of year
|
(53,323
|
)
|
(58,884
|
)
|
(76,137
|
)
|
|||
|
Provisions, net
|
(10,800
|
)
|
(12,255
|
)
|
(13,594
|
)
|
|||
|
Amounts written off as uncollectible
|
2,222
|
|
17,826
|
|
29,289
|
|
|||
|
Foreign currency translation
|
2,869
|
|
(5,885
|
)
|
1,558
|
|
|||
|
Other
|
(392
|
)
|
5,875
|
|
—
|
|
|||
|
Balance at end of year
|
(59,424
|
)
|
(53,323
|
)
|
(58,884
|
)
|
|||
We have
two
agreements with major European financial institutions to sell certain trade receivables related to the Italy segment on a non-recourse basis. At
December 31, 2018
and
2017
, there were
€203.1 million
(
$232.6 million
at the
December 31, 2018
exchange rate) and
€221.3 million
(
$265.4 million
at the
December 31, 2017
exchange rate) of trade receivables outstanding that had been sold and derecognized from the consolidated balance sheet, respectively.
We also sell certain other trade receivables on a non-recourse basis which have been derecognized from the consolidated balance sheet. At
December 31, 2018
and
2017
, there were
$21.4 million
and
$18.6 million
of these receivables outstanding that had been sold, respectively, primarily in the North America Gaming and Interactive segment.
F-27
|
6
.
|
Inventories
|
|
December 31,
|
||||||
|
($ thousands)
|
2018
|
2017
|
||||
|
Raw materials
|
140,143
|
|
156,336
|
|
||
|
Work in progress
|
32,835
|
|
33,588
|
|
||
|
Finished goods
|
109,720
|
|
129,621
|
|
||
|
282,698
|
|
319,545
|
|
|||
|
7
.
|
Other Assets
|
Other Current Assets
|
|
December 31,
|
|||||
|
($ thousands)
|
2018
|
2017
|
||||
|
Customer financing receivables, net
|
170,273
|
|
151,360
|
|
||
|
Other receivables
|
61,055
|
|
65,891
|
|
||
|
Value-added tax receivable
|
60,232
|
|
49,962
|
|
||
|
Contract assets
|
58,739
|
|
—
|
|
||
|
Prepaid royalties
|
52,712
|
|
59,596
|
|
||
|
Prepaid expenses
|
47,781
|
|
30,977
|
|
||
|
Other
|
53,269
|
|
49,734
|
|
||
|
|
504,061
|
|
407,520
|
|
||
Other Non-Current Assets
|
|
December 31,
|
|||||
|
($ thousands)
|
2018
|
2017
|
||||
|
Upfront license fees, net:
|
||||||
|
Italian Scratch & Win
|
992,333
|
|
1,145,998
|
|
||
|
Italian Lotto
|
677,564
|
|
812,304
|
|
||
|
New Jersey
|
91,970
|
|
100,730
|
|
||
|
Indiana
|
13,247
|
|
14,642
|
|
||
|
1,775,114
|
|
2,073,674
|
|
|||
|
Customer financing receivables, net
|
88,354
|
|
74,898
|
|
||
|
Contract assets
|
69,691
|
|
—
|
|
||
|
Prepaid royalties
|
64,598
|
|
103,322
|
|
||
|
Prepaid income taxes
|
25,942
|
|
72,176
|
|
||
|
Other
|
85,265
|
|
103,883
|
|
||
|
|
2,108,964
|
|
2,427,953
|
|
||
Upfront License Fees
Italian Scratch & Win
In December 2017, Lotterie Nazionali S.r.l., our majority-owned subsidiary, was awarded a
nine
-year contract extension for the Italian Scratch & Win license (the "Italian Scratch & Win extension") that required an upfront license fee of
€800.0 million
(
$937.4 million
).
F-28
The upfront license fees are being amortized as follows:
|
Upfront License Fee
|
License Term
|
Amortization Start Date
|
||
|
Italian Scratch & Win
|
9 years
|
October 2010
|
||
|
Italian Scratch & Win extension
|
9 years
|
October 2019
|
||
|
Italian Lotto
|
9 years
|
December 2016
|
||
|
New Jersey
|
15 years, 9 months
|
October 2013
|
||
|
Indiana
|
15 years
|
July 2013
|
||
Contract Assets
Contract assets were recorded as a result of our adoption of ASC 606 in the first quarter of 2018. Refer to the revenue recognition policy in Note
2
,
Summary of Significant Accounting Policies
, for more information.
Customer Financing Receivables
Customer financing receivables, net are recorded at cost.
|
|
December 31, 2018
|
||||||||
|
|
|
Allowance for
|
|
||||||
|
($ thousands)
|
Gross
|
credit losses
|
Net
|
||||||
|
Current
|
196,831
|
|
(26,558
|
)
|
170,273
|
|
|||
|
Non-current
|
91,005
|
|
(2,651
|
)
|
88,354
|
|
|||
|
|
287,836
|
|
(29,209
|
)
|
258,627
|
|
|||
|
|
December 31, 2017
|
||||||||
|
|
|
Allowance for
|
|
||||||
|
($ thousands)
|
Gross
|
credit losses
|
Net
|
||||||
|
Current
|
167,985
|
|
(16,625
|
)
|
151,360
|
|
|||
|
Non-current
|
77,847
|
|
(2,949
|
)
|
74,898
|
|
|||
|
|
245,832
|
|
(19,574
|
)
|
226,258
|
|
|||
The following table presents the activity in the allowance for credit losses:
|
December 31,
|
|||||||||
|
($ thousands)
|
2018
|
2017
|
2016
|
||||||
|
Balance at beginning of year
|
(19,574
|
)
|
(7,856
|
)
|
(3,888
|
)
|
|||
|
Provisions, net
|
(10,131
|
)
|
(5,236
|
)
|
(4,481
|
)
|
|||
|
Amounts written off as uncollectible
|
317
|
|
—
|
|
—
|
|
|||
|
Foreign currency translation
|
179
|
|
(159
|
)
|
513
|
|
|||
|
Other
|
—
|
|
(6,323
|
)
|
—
|
|
|||
|
Balance at end of year
|
(29,209
|
)
|
(19,574
|
)
|
(7,856
|
)
|
|||
At
December 31, 2018
and
2017
,
$6.9 million
and
$34.2 million
, respectively, of certain outstanding customer financing receivables were sold on a non-recourse basis.
Customer financing receivables, net are recorded and valued based on expected payments and market interest rates relative to the credit risk of each customer region. At
December 31, 2018
and
2017
, the carrying value of customer financing receivables approximated its fair value and were classified within Level 3 of the fair value hierarchy.
F-29
|
8.
|
Fair Value of Financial Assets and Liabilities
|
Financial Assets and Liabilities Carried at Fair Value
The following tables represent the fair value hierarchy for financial assets and liabilities measured at fair value at
December 31, 2018
and
2017
:
|
December 31, 2018
|
||||||||||||
|
($ thousands)
|
Level 1
|
Level 2
|
Level 3
|
Total Fair Value
|
||||||||
|
Restricted cash equivalents
|
56,550
|
|
—
|
|
—
|
|
56,550
|
|
||||
|
Derivative assets
|
—
|
|
7,317
|
|
2,519
|
|
9,836
|
|
||||
|
Available-for-sale investments
|
6,585
|
|
—
|
|
—
|
|
6,585
|
|
||||
|
Derivative liabilities
|
—
|
|
25,473
|
|
—
|
|
25,473
|
|
||||
|
December 31, 2017
|
||||||||||||
|
($ thousands)
|
Level 1
|
Level 2
|
Level 3
|
Total
|
||||||||
|
Restricted cash equivalents
|
57,465
|
|
—
|
|
—
|
|
57,465
|
|
||||
|
Derivative assets
|
—
|
|
501
|
|
2,638
|
|
3,139
|
|
||||
|
Available-for-sale investments
|
11,991
|
|
—
|
|
—
|
|
11,991
|
|
||||
|
Contingent consideration liabilities
|
—
|
|
—
|
|
7,755
|
|
7,755
|
|
||||
|
Derivative liabilities
|
—
|
|
19,352
|
|
—
|
|
19,352
|
|
||||
Valuation Techniques and Balance Sheet Presentation
Restricted cash equivalents are primarily composed of publicly-traded foreign government and corporate bonds and mutual funds, and were valued using quoted market prices. Restricted cash equivalents are presented in restricted cash and cash equivalents in the consolidated balance sheets.
Derivative assets and liabilities classified as Level 2 in the table above were derived from quoted market prices for similar instruments or by discounting the future cash flows with adjustments for credit risk as appropriate. All significant inputs were derived from or corroborated by observable market data including current forward exchange rates, LIBOR rates, among others. The Level 3 derivative asset in the table above was valued based on a free cash flow forecast. Refer to Note
9
,
Derivative Financial Instruments,
for additional information.
Certain of our available-for-sale investments are carried at fair value and were valued using quoted market prices. Available-for-sale investments are presented as other non-current assets in the consolidated balance sheets.
Contingent consideration was valued using a multiple of earnings before interest, taxes, depreciation and amortization ("EBITDA") and is presented as other current liabilities in the consolidated balance sheets.
F-30
Assets and Liabilities Not Carried at Fair Value
The following tables represent the fair value hierarchy for assets and liabilities not measured at fair value at
December 31, 2018
and
2017
:
|
December 31, 2018
|
|||||||||||||||
|
($ thousands)
|
Carrying
Value |
Level 1
|
Level 2
|
Level 3
|
Total Fair Value
|
||||||||||
|
Available-for-sale investments
|
13,509
|
|
—
|
|
—
|
|
13,509
|
|
13,509
|
|
|||||
|
Jackpot liabilities
|
254,567
|
|
—
|
|
—
|
|
229,089
|
|
229,089
|
|
|||||
|
Debt
|
7,996,073
|
|
—
|
|
8,089,154
|
|
—
|
|
8,089,154
|
|
|||||
|
December 31, 2017
|
|||||||||||||||
|
($ thousands)
|
Carrying
Value |
Level 1
|
Level 2
|
Level 3
|
Total Fair Value
|
||||||||||
|
Available-for-sale investments
|
12,409
|
|
—
|
|
—
|
|
12,409
|
|
12,409
|
|
|||||
|
Jackpot liabilities
|
275,626
|
|
—
|
|
—
|
|
268,581
|
|
268,581
|
|
|||||
|
Debt
|
8,391,647
|
|
—
|
|
8,974,126
|
|
—
|
|
8,974,126
|
|
|||||
Valuation Techniques and Balance Sheet Presentation
Certain of our available-for-sale investments are carried at cost (which approximates fair value) and are presented as other non-current assets in the consolidated balance sheets.
Jackpot liabilities were primarily valued using discounted cash flows, incorporating expected future payment timing, estimated funding rates based on the treasury yield curve, and nonperformance credit risk. Expected annuity payments over
one
to
25 years
(average
10 years
) were discounted using the
10
-year treasury yield curve rate (
2.69%
) for the estimated funding rate and the
10
-year credit default swap rate (
3.60%
) for nonperformance risk. The present value (carrying value) of the expected lump sum payments were discounted using the
1
-year treasury yield curve rate (
2.63%
) with the
1
-year credit default swap rate (
0.22%
) for the current amounts, and the
2
-year treasury yield curve rate (
2.48%
) with the
2
-year credit default swap rate (
0.60%
) for non-current amounts. Significant increases (decreases) in any inputs in isolation would result in a lower (higher) fair value measurement. Generally, changes in the estimated funding rates do not correlate with changes in non-performance credit risk. Jackpot liabilities are presented as other current and other non-current liabilities in the consolidated balance sheets.
Debt is categorized within Level 2 of the fair value hierarchy and valued using quoted market prices, dealer quotes, or current interest rates. Carrying values in the table exclude swap adjustments.
|
9
.
|
Derivative Financial Instruments
|
We use selected derivative hedging instruments, principally foreign currency forward contracts and interest rate swaps, for the purpose of managing currency risks and interest rate risk arising from our operations and sources of financing.
Cash Flow Hedges
The notional amount of foreign currency forward contracts, designated as cash flow hedges, outstanding at
December 31, 2018
and
2017
were
$74.0 million
and
$100.8 million
, respectively. The amount recorded within other comprehensive income at
December 31, 2018
is expected to impact the consolidated statement of operations in
2019
.
In March 2018, prior to the issuance of the
€500 million
of
3.500%
Senior Secured Notes due July 2024 (the "3.500% Notes"), we executed
€200.0 million
notional amount of forward starting interest rate swaps to hedge against an increase in the interest rate benchmark applicable to the future expected issuance of euro denominated debt securities. We settled these swaps in June 2018 at a loss of
€3.8 million
(
$4.4 million
).
In March 2018, prior to the issuance of the
$750 million
of
6.250%
Senior Secured Notes due January 2027 (the "6.250% Notes"), we executed
$200.0 million
notional amount of treasury rate lock contracts to hedge against an increase in the interest rate
F-31
benchmark applicable to the future expected issuance of U.S. dollar denominated debt securities. We settled these treasury rate lock contracts in June and September 2018 at a loss of
$1.1 million
and a gain
$1.4 million
, respectively.
There were
no
forward starting interest rate swaps or treasury locks outstanding at
December 31, 2018
or
2017
.
Fair Value Hedges
In September 2015, we executed
$625.0 million
notional amount of interest rate swaps that effectively convert
$625.0 million
of the
6.250%
Senior Secured Notes due February 2022 from fixed interest rate debt to variable rate debt. Under the terms of these swaps, we are required to make variable rate interest payments based on six-month LIBOR plus a fixed spread, ranging between
6.95%
and
7.07%
at December 31, 2018, and will receive fixed rate interest payments from our counterparties based on a fixed rate of
6.25%
. The LIBOR rate resets semiannually on February 15 and August 15. Settlement of the net amount of interest receivable or payable under the swaps occurs semiannually on February 15 and August 15. The swaps expire in February 2022.
Net Investment Hedges
In October 2018, we executed
$200.0 million
notional amount of cross-currency swaps that effectively converted fixed rate U.S. dollar denominated debt to euros. These cross-currency swaps are being used to hedge a net investment. Under the terms of these swaps, we are required to make semi-annual fixed rate interest payments in U.S. dollars based on a fixed rate of
6.25%
and will receive fixed rate interest payments from our counterparties in euros based on a fixed rate of
2.86%
on each February 15 and August 15. A final notional exchange will occur on settlement where we pay
$200.0 million
and receive
€174.2 million
. These cross-currency swaps expire in August 2021. There were no cross-currency swap contracts outstanding as of December 31, 2017.
Derivatives Not Designated as Hedging Instruments
The notional amount of foreign currency forward contracts, not designated as hedging instruments, outstanding at
December 31, 2018
and
2017
was
$518.7 million
and
$460.6 million
, respectively.
Balance Sheet Location and Fair Value
|
|
December 31,
|
|||||||
|
($ thousands)
|
Balance Sheet Location
|
2018
|
2017
|
|||||
|
Derivatives designated as hedging instruments
|
||||||||
|
Foreign currency forward contracts
|
Current assets
|
1,634
|
|
—
|
|
|||
|
Current liabilities
|
—
|
|
(2,362
|
)
|
||||
|
Interest rate swaps
|
Current liabilities
|
(2,118
|
)
|
—
|
|
|||
|
Non-current liabilities
|
(17,839
|
)
|
(14,953
|
)
|
||||
|
Cross-currency swaps
|
Current assets
|
4,100
|
|
—
|
|
|||
|
Non-current liabilities
|
(1,850
|
)
|
—
|
|
||||
|
Derivatives not designated as hedging instruments
|
||||||||
|
Foreign currency forward contracts
|
Current assets
|
1,583
|
|
501
|
|
|||
|
Current liabilities
|
(3,666
|
)
|
(2,037
|
)
|
||||
|
Option contract
|
Non-current assets
|
2,519
|
|
2,638
|
|
|||
F-32
Income Statement Location and Effect
|
Gain (Loss) Recognized in Income
|
|||||||||||
|
|
for the year ended December 31,
|
||||||||||
|
($ thousands)
|
Income Statement Location
|
2018
|
2017
|
2016
|
|||||||
|
Derivatives designated as hedging instruments
|
|||||||||||
|
Foreign currency forward contracts
|
Service revenue
|
(536
|
)
|
(1,744
|
)
|
5,218
|
|
||||
|
Interest rate swaps
|
Other income (expense), net
|
(443
|
)
|
427
|
|
(1,820
|
)
|
||||
|
Interest income and Interest expense
|
941
|
|
—
|
|
—
|
|
|||||
|
Cross-currency swaps
|
Interest income and Interest expense
|
1,340
|
|
—
|
|
—
|
|
||||
|
Derivatives not designated as hedging instruments
|
|||||||||||
|
Foreign currency forward contracts
|
Foreign exchange gain (loss), net
|
(17,944
|
)
|
(21,870
|
)
|
16,873
|
|
||||
Refer to Note
18
,
Shareholders’ Equity
- Accumulated Other Comprehensive Income
for further information.
|
10
.
|
Systems, Equipment and Other Assets Related to Contracts, net and Property, Plant and Equipment, net
|
Systems & Equipment and PPE, net consist of the following:
|
Systems & Equipment, net
|
PPE, net
|
|||||||||||
|
|
December 31,
|
December 31,
|
||||||||||
|
($ thousands)
|
2018
|
2017
|
2018
|
2017
|
||||||||
|
Land
|
303
|
|
547
|
|
2,462
|
|
2,542
|
|
||||
|
Buildings
|
157,611
|
|
151,962
|
|
69,799
|
|
70,389
|
|
||||
|
Terminals and systems
|
3,014,733
|
|
2,969,848
|
|
—
|
|
—
|
|
||||
|
Furniture and equipment
|
205,305
|
|
197,610
|
|
257,444
|
|
241,632
|
|
||||
|
Contracts in progress
|
74,382
|
|
149,245
|
|
—
|
|
—
|
|
||||
|
Construction in progress
|
—
|
|
—
|
|
12,777
|
|
20,603
|
|
||||
|
|
3,452,334
|
|
3,469,212
|
|
342,482
|
|
335,166
|
|
||||
|
Accumulated depreciation
|
(2,047,908
|
)
|
(2,035,018
|
)
|
(157,133
|
)
|
(141,443
|
)
|
||||
|
|
1,404,426
|
|
1,434,194
|
|
185,349
|
|
193,723
|
|
||||
Borrowing costs of
$1.1 million
and
$4.2 million
were capitalized to Systems & Equipment in
2018
and
2017
, respectively. The rate used to determine the amount of borrowing costs eligible for capitalization was approximately
5.3%
and
5.8%
for
2018
and
2017
, respectively, which was the effective interest rate of all borrowings.
F-33
|
11
.
|
Goodwill
|
Changes in the carrying amount of goodwill consist of the following:
|
($ thousands)
|
North America
Gaming and
Interactive
|
North America
Lottery
|
International
|
Italy
|
Total
|
||||||||||
|
Balance at December 31, 2016
|
2,625,880
|
|
1,221,529
|
|
1,527,549
|
|
1,435,054
|
|
6,810,012
|
|
|||||
|
Impairment loss
|
(714,000
|
)
|
—
|
|
—
|
|
—
|
|
(714,000
|
)
|
|||||
|
Disposal of DoubleDown
|
(473,000
|
)
|
—
|
|
—
|
|
—
|
|
(473,000
|
)
|
|||||
|
Acquisitions
|
—
|
|
—
|
|
14,890
|
|
7,303
|
|
22,193
|
|
|||||
|
Foreign currency translation
|
—
|
|
—
|
|
6,786
|
|
70,949
|
|
77,735
|
|
|||||
|
Other
|
987
|
|
60
|
|
156
|
|
(328
|
)
|
875
|
|
|||||
|
Balance at December 31, 2017
|
1,439,867
|
|
1,221,589
|
|
1,549,381
|
|
1,512,978
|
|
5,723,815
|
|
|||||
|
Impairment loss
|
—
|
|
—
|
|
(118,000
|
)
|
—
|
|
(118,000
|
)
|
|||||
|
Foreign currency translation
|
—
|
|
—
|
|
(8,534
|
)
|
(17,319
|
)
|
(25,853
|
)
|
|||||
|
Other
|
—
|
|
—
|
|
—
|
|
265
|
|
265
|
|
|||||
|
Balance at December 31, 2018
|
1,439,867
|
|
1,221,589
|
|
1,422,847
|
|
1,495,924
|
|
5,580,227
|
|
|||||
|
Balance at December 31, 2017
|
|
|
|
|
|
|
|
|
|
|
|||||
|
Cost
|
2,153,867
|
|
1,225,682
|
|
1,674,381
|
|
1,514,777
|
|
6,568,707
|
|
|||||
|
Accumulated impairment loss
|
(714,000
|
)
|
(4,093
|
)
|
(125,000
|
)
|
(1,799
|
)
|
(844,892
|
)
|
|||||
|
|
1,439,867
|
|
1,221,589
|
|
1,549,381
|
|
1,512,978
|
|
5,723,815
|
|
|||||
|
Balance at December 31, 2018
|
|
|
|
|
|
|
|
|
|
|
|||||
|
Cost
|
2,153,867
|
|
1,225,682
|
|
1,658,698
|
|
1,497,641
|
|
6,535,888
|
|
|||||
|
Accumulated impairment loss
|
(714,000
|
)
|
(4,093
|
)
|
(235,851
|
)
|
(1,717
|
)
|
(955,661
|
)
|
|||||
|
|
1,439,867
|
|
1,221,589
|
|
1,422,847
|
|
1,495,924
|
|
5,580,227
|
|
|||||
We assess our reporting units annually and have
four
reporting units (which are equivalent to our segments) at
December 31, 2018
as follows:
|
•
|
North America Gaming and Interactive;
|
|
•
|
North America Lottery;
|
|
•
|
International; and
|
|
•
|
Italy.
|
For a discussion of the goodwill impairment losses in 2018 and 2017, refer to Note
23
,
Impairment Loss
.
F-34
|
12
.
|
Intangible Assets, net
|
Intangible assets at
December 31, 2018
and
2017
consist of:
|
|
December 31, 2018
|
||||||||||
|
($ thousands)
|
Gross Carrying
Amount |
Accumulated
Amortization |
Net Book
Value |
Weighted Average
Life (years) |
|||||||
|
Subject to amortization
|
|
|
|
|
|
|
|
||||
|
Customer relationships
|
2,428,946
|
|
1,093,753
|
|
1,335,193
|
|
15.2
|
||||
|
Computer software and game library
|
967,828
|
|
753,160
|
|
214,668
|
|
5.5
|
||||
|
Trademarks
|
185,590
|
|
61,806
|
|
123,784
|
|
14.1
|
||||
|
Licenses
|
294,104
|
|
221,934
|
|
72,170
|
|
10.0
|
||||
|
Developed technologies
|
220,097
|
|
179,192
|
|
40,905
|
|
5.4
|
||||
|
Networks
|
18,808
|
|
13,978
|
|
4,830
|
|
7.0
|
||||
|
Sports and horse racing betting rights
|
134,197
|
|
131,933
|
|
2,264
|
|
6.5
|
||||
|
Other
|
8,652
|
|
4,656
|
|
3,996
|
|
16.1
|
||||
|
|
4,258,222
|
|
2,460,412
|
|
1,797,810
|
|
|
||||
|
Not subject to amortization
|
|
|
|
|
|
|
|
||||
|
Trademarks
|
246,913
|
|
—
|
|
246,913
|
|
|
||||
|
Total intangible assets, excluding goodwill
|
4,505,135
|
|
2,460,412
|
|
2,044,723
|
|
|
||||
|
|
December 31, 2017
|
||||||||||
|
($ thousands)
|
Gross Carrying
Amount |
Accumulated
Amortization |
Net Book
Value |
Weighted Average
Life (years) |
|||||||
|
Subject to amortization
|
|
|
|
|
|
|
|
||||
|
Customer relationships
|
2,434,051
|
|
956,586
|
|
1,477,465
|
|
15.2
|
||||
|
Computer software and game library
|
947,207
|
|
710,725
|
|
236,482
|
|
5.6
|
||||
|
Trademarks
|
186,218
|
|
47,053
|
|
139,165
|
|
14.1
|
||||
|
Licenses
|
300,207
|
|
204,533
|
|
95,674
|
|
10.1
|
||||
|
Developed technologies
|
220,213
|
|
155,870
|
|
64,343
|
|
5.4
|
||||
|
Networks
|
18,806
|
|
13,571
|
|
5,235
|
|
7.0
|
||||
|
Sports and horse racing betting rights
|
132,521
|
|
128,888
|
|
3,633
|
|
6.5
|
||||
|
Other
|
8,660
|
|
4,110
|
|
4,550
|
|
16.1
|
||||
|
|
4,247,883
|
|
2,221,336
|
|
2,026,547
|
|
|
||||
|
Not subject to amortization
|
|
|
|
|
|
|
|
||||
|
Trademarks
|
246,913
|
|
—
|
|
246,913
|
|
|
||||
|
Total intangible assets, excluding goodwill
|
4,494,796
|
|
2,221,336
|
|
2,273,460
|
|
|
||||
In connection with the June 2017 sale of DoubleDown, we recorded a
$277.3 million
reduction in net book value of intangible assets (principally customer relationships and trademarks) related to the sale.
F-35
Intangible asset amortization expense of
$272.7 million
,
$401.5 million
and
$492.1 million
(which includes computer software amortization expense of
$29.6 million
,
$31.4 million
and
$38.4 million
) was recorded in
2018
,
2017
and
2016
, respectively.
Amortization expense on intangible assets for the next five years is expected to be as follows ($ thousands):
|
Year
|
Amount
|
||
|
2019
|
255,892
|
|
|
|
2020
|
226,128
|
|
|
|
2021
|
196,190
|
|
|
|
2022
|
174,281
|
|
|
|
2023
|
147,970
|
|
|
|
Total
|
1,000,461
|
|
|
|
13
.
|
Other Liabilities
|
Other Current Liabilities
|
|
December 31,
|
|||||
|
($ thousands)
|
2018
|
2017
|
||||
|
Taxes other than income taxes
|
149,203
|
|
128,703
|
|
||
|
Employee compensation
|
145,616
|
|
146,891
|
|
||
|
Accrued interest payable
|
139,276
|
|
179,230
|
|
||
|
Accrued expenses
|
115,165
|
|
121,181
|
|
||
|
Current financial liabilities
|
107,316
|
|
113,217
|
|
||
|
Jackpot liabilities
|
76,191
|
|
84,250
|
|
||
|
Contract liabilities
|
72,005
|
|
81,111
|
|
||
|
Payable to Italian regulator
|
—
|
|
899,475
|
|
||
|
Other
|
11,950
|
|
26,817
|
|
||
|
|
816,722
|
|
1,780,875
|
|
||
Payable to Italian Regulator
The Italian Scratch & Win extension required an upfront license fee to Agenzia delle Dogane e Dei Monopoli, the governmental authority responsible for regulating and supervising gaming in Italy ("ADM" or the "Italian regulator") of
€800.0 million
, of which
€50.0 million
(
$59.3 million
) was paid in 2017 and the remaining
€750.0 million
(
$878.1 million
) was paid in 2018.
Other Non-Current Liabilities
|
|
December 31,
|
|||||
|
($ thousands)
|
2018
|
2017
|
||||
|
Jackpot liabilities
|
178,376
|
|
191,376
|
|
||
|
Contract liabilities
|
67,022
|
|
54,895
|
|
||
|
Capital leases
|
57,756
|
|
57,183
|
|
||
|
Reserve for uncertain tax positions
|
40,803
|
|
34,447
|
|
||
|
Royalties payable
|
26,686
|
|
32,997
|
|
||
|
Other
|
74,802
|
|
75,215
|
|
||
|
|
445,445
|
|
446,113
|
|
||
F-36
|
14
.
|
Debt
|
|
|
December 31,
|
|||||
|
($ thousands)
|
2018
|
2017
|
||||
|
7.500% Senior Secured Notes due July 2019
|
—
|
|
148,231
|
|
||
|
4.125% Senior Secured Notes due February 2020
|
499,167
|
|
833,655
|
|
||
|
5.625% Senior Secured Notes due February 2020
|
—
|
|
595,767
|
|
||
|
4.750% Senior Secured Notes due March 2020
|
438,252
|
|
585,171
|
|
||
|
5.500% Senior Secured Notes due June 2020
|
27,519
|
|
125,709
|
|
||
|
6.250% Senior Secured Notes due February 2022
|
1,469,609
|
|
1,470,075
|
|
||
|
4.750% Senior Secured Notes due February 2023
|
964,730
|
|
1,008,601
|
|
||
|
5.350% Senior Secured Notes due October 2023
|
60,983
|
|
61,082
|
|
||
|
3.500% Senior Secured Notes due July 2024
|
567,179
|
|
—
|
|
||
|
6.500% Senior Secured Notes due February 2025
|
1,088,385
|
|
1,086,913
|
|
||
|
6.250% Senior Secured Notes due January 2027
|
742,667
|
|
—
|
|
||
|
Senior Secured Notes, long-term
|
5,858,491
|
|
5,915,204
|
|
||
|
Revolving Credit Facilities due July 2021
|
413,381
|
|
76,880
|
|
||
|
Term Loan Facility due January 2023
|
1,705,395
|
|
1,785,361
|
|
||
|
Long-term debt, less current portion
|
7,977,267
|
|
7,777,445
|
|
||
|
6.625% Senior Secured Notes due February 2018
|
—
|
|
599,114
|
|
||
|
Current portion of long-term debt
|
—
|
|
599,114
|
|
||
|
Short-term borrowings
|
34,822
|
|
—
|
|
||
|
Total Debt
|
8,012,089
|
|
8,376,559
|
|
||
The principal balance of each debt obligation, excluding short-term borrowings, reconciles to the consolidated balance sheet as follows:
|
December 31, 2018
|
|||||||||||||||
|
($ thousands)
|
Principal
|
Debt issuance
cost, net
|
Premium
|
Swap
|
Total
|
||||||||||
|
4.125% Senior Secured Notes due February 2020
|
501,058
|
|
(1,891
|
)
|
—
|
|
—
|
|
499,167
|
|
|||||
|
4.750% Senior Secured Notes due March 2020
|
444,146
|
|
(5,894
|
)
|
—
|
|
—
|
|
438,252
|
|
|||||
|
5.500% Senior Secured Notes due June 2020
|
27,311
|
|
—
|
|
234
|
|
(26
|
)
|
27,519
|
|
|||||
|
6.250% Senior Secured Notes due February 2022
|
1,500,000
|
|
(11,611
|
)
|
—
|
|
(18,780
|
)
|
1,469,609
|
|
|||||
|
4.750% Senior Secured Notes due February 2023
|
973,250
|
|
(8,520
|
)
|
—
|
|
—
|
|
964,730
|
|
|||||
|
5.350% Senior Secured Notes due October 2023
|
60,567
|
|
—
|
|
416
|
|
—
|
|
60,983
|
|
|||||
|
3.500% Senior Secured Notes due July 2024
|
572,500
|
|
(5,321
|
)
|
—
|
|
—
|
|
567,179
|
|
|||||
|
6.500% Senior Secured Notes due February 2025
|
1,100,000
|
|
(11,615
|
)
|
—
|
|
—
|
|
1,088,385
|
|
|||||
|
6.250% Senior Secured Notes due January 2027
|
750,000
|
|
(7,333
|
)
|
—
|
|
—
|
|
742,667
|
|
|||||
|
Senior Secured Notes, long-term
|
5,928,832
|
|
(52,185
|
)
|
650
|
|
(18,806
|
)
|
5,858,491
|
|
|||||
|
Revolving Credit Facilities due July 2021
|
428,158
|
|
(14,777
|
)
|
—
|
|
—
|
|
413,381
|
|
|||||
|
Term Loan Facility due January 2023
|
1,717,500
|
|
(12,105
|
)
|
—
|
|
—
|
|
1,705,395
|
|
|||||
|
Total Debt, excluding short-term borrowings
|
8,074,490
|
|
(79,067
|
)
|
650
|
|
(18,806
|
)
|
7,977,267
|
|
|||||
F-37
|
|
December 31, 2017
|
||||||||||||||
|
($ thousands)
|
Principal
|
Debt issuance
cost, net |
Premium
|
Swap
|
Total
|
||||||||||
|
7.500% Senior Secured Notes due July 2019
|
144,303
|
|
—
|
|
3,708
|
|
220
|
|
148,231
|
|
|||||
|
4.125% Senior Secured Notes due February 2020
|
839,510
|
|
(5,855
|
)
|
—
|
|
—
|
|
833,655
|
|
|||||
|
5.625% Senior Secured Notes due February 2020
|
600,000
|
|
(4,233
|
)
|
—
|
|
—
|
|
595,767
|
|
|||||
|
4.750% Senior Secured Notes due March 2020
|
599,650
|
|
(14,479
|
)
|
—
|
|
—
|
|
585,171
|
|
|||||
|
5.500% Senior Secured Notes due June 2020
|
124,143
|
|
—
|
|
1,757
|
|
(191
|
)
|
125,709
|
|
|||||
|
6.250% Senior Secured Notes due February 2022
|
1,500,000
|
|
(14,808
|
)
|
—
|
|
(15,117
|
)
|
1,470,075
|
|
|||||
|
4.750% Senior Secured Notes due February 2023
|
1,019,405
|
|
(10,804
|
)
|
—
|
|
—
|
|
1,008,601
|
|
|||||
|
5.350% Senior Secured Notes due October 2023
|
60,567
|
|
—
|
|
515
|
|
—
|
|
61,082
|
|
|||||
|
6.500% Senior Secured Notes due February 2025
|
1,100,000
|
|
(13,087
|
)
|
—
|
|
—
|
|
1,086,913
|
|
|||||
|
Senior Secured Notes, long-term
|
5,987,578
|
|
(63,266
|
)
|
5,980
|
|
(15,088
|
)
|
5,915,204
|
|
|||||
|
6.625% Senior Secured Notes due February 2018
|
599,650
|
|
(536
|
)
|
—
|
|
—
|
|
599,114
|
|
|||||
|
Revolving Credit Facilities due July 2021
|
95,000
|
|
(18,120
|
)
|
—
|
|
—
|
|
76,880
|
|
|||||
|
Term Loan Facility due January 2023
|
1,798,950
|
|
(13,589
|
)
|
—
|
|
—
|
|
1,785,361
|
|
|||||
|
Total Debt, excluding short-term borrowings
|
8,481,178
|
|
(95,511
|
)
|
5,980
|
|
(15,088
|
)
|
8,376,559
|
|
|||||
Principal payments for each debt obligation, excluding short-term borrowings, for the next five years and thereafter are as follows:
|
Calendar year
|
|||||||||||||||||||||
|
($ thousands)
|
2019
|
2020
|
2021
|
2022
|
2023
|
2024 and
thereafter |
Total
|
||||||||||||||
|
4.125% Senior Secured Notes due February 2020
|
—
|
|
501,058
|
|
—
|
|
—
|
|
—
|
|
—
|
|
501,058
|
|
|||||||
|
4.750% Senior Secured Notes due March 2020
|
—
|
|
444,146
|
|
—
|
|
—
|
|
—
|
|
—
|
|
444,146
|
|
|||||||
|
5.500% Senior Secured Notes due June 2020
|
—
|
|
27,311
|
|
—
|
|
—
|
|
—
|
|
—
|
|
27,311
|
|
|||||||
|
6.250% Senior Secured Notes due February 2022
|
—
|
|
—
|
|
—
|
|
1,500,000
|
|
—
|
|
—
|
|
1,500,000
|
|
|||||||
|
4.750% Senior Secured Notes due February 2023
|
—
|
|
—
|
|
—
|
|
—
|
|
973,250
|
|
—
|
|
973,250
|
|
|||||||
|
5.350% Senior Secured Notes due October 2023
|
—
|
|
—
|
|
—
|
|
—
|
|
60,567
|
|
—
|
|
60,567
|
|
|||||||
|
3.500% Senior Secured Notes due July 2024
|
—
|
|
—
|
|
—
|
|
—
|
|
—
|
|
572,500
|
|
572,500
|
|
|||||||
|
6.500% Senior Secured Notes due February 2025
|
—
|
|
—
|
|
—
|
|
—
|
|
—
|
|
1,100,000
|
|
1,100,000
|
|
|||||||
|
6.250% Senior Secured Notes due January 2027
|
—
|
|
—
|
|
—
|
|
—
|
|
—
|
|
750,000
|
|
750,000
|
|
|||||||
|
Senior Secured Notes, long-term
|
—
|
|
972,515
|
|
—
|
|
1,500,000
|
|
1,033,817
|
|
2,422,500
|
|
5,928,832
|
|
|||||||
|
Revolving Credit Facilities due July 2021
|
—
|
|
—
|
|
428,158
|
|
—
|
|
—
|
|
—
|
|
428,158
|
|
|||||||
|
Term Loan Facility due January 2023
|
—
|
|
366,400
|
|
366,400
|
|
366,400
|
|
618,300
|
|
—
|
|
1,717,500
|
|
|||||||
|
Total Principal Payments
|
—
|
|
1,338,915
|
|
794,558
|
|
1,866,400
|
|
1,652,117
|
|
2,422,500
|
|
8,074,490
|
|
|||||||
F-38
Senior Secured Notes
The key terms of our senior secured notes (the "Notes"), which are rated Ba2 and BB+ by Moody’s Investor Service ("Moody’s") and Standard & Poor’s Ratings Services ("S&P"), respectively, are as follows:
|
Description
|
Principal (thousands)
|
Effective
Interest Rate |
Issuer
|
Guarantors
|
Collateral
|
Redemption
|
Interest payments
|
|||||||
|
4.125% Senior Secured Notes due February 2020
|
€437,605
|
4.47%
|
Parent
|
*
|
†
|
+
|
Semi-annually in arrears
|
|||||||
|
4.750% Senior Secured Notes due March 2020
(1)
|
€387,900
|
6.00%
|
Parent
|
*
|
†
|
++
|
Annually in arrears
|
|||||||
|
5.500% Senior Secured Notes due June 2020
|
$27,311
|
4.88%
|
IGT
|
**
|
††
|
+++
|
Semi-annually in arrears
|
|||||||
|
6.250% Senior Secured Notes due February 2022
|
$1,500,000
|
6.52%
|
Parent
|
*
|
†
|
++++
|
Semi-annually in arrears
|
|||||||
|
4.750% Senior Secured Notes due February 2023
|
€850,000
|
4.98%
|
Parent
|
*
|
†
|
++++
|
Semi-annually in arrears
|
|||||||
|
5.350% Senior Secured Notes due October 2023
|
$60,567
|
5.47%
|
IGT
|
**
|
††
|
+++
|
Semi-annually in arrears
|
|||||||
|
3.500% Senior Secured Notes due July 2024
|
€500,000
|
3.68%
|
Parent
|
*
|
†
|
++++
|
Semi-annually in arrears
|
|||||||
|
6.500% Senior Secured Notes due February 2025
|
$1,100,000
|
6.71%
|
Parent
|
*
|
†
|
++++
|
Semi-annually in arrears
|
|||||||
|
6.250% Senior Secured Notes due January 2027
|
$750,000
|
6.41%
|
Parent
|
*
|
†
|
++++
|
Semi-annually in arrears
|
|||||||
(1)
Subject to a
1.25%
per annum decrease in the event of an upgrade in ratings by Moody’s and S&P.
* Certain subsidiaries of the Parent.
** The Parent and certain subsidiaries of the Parent.
|
†
|
Ownership interests of the Parent in certain of its direct subsidiaries and certain intercompany loans with principal balances in excess of
$10 million
.
|
|
††
|
Certain intercompany loans with principal balances in excess of
$10 million
.
|
|
+
|
The Parent may redeem in whole or in part at any time prior to the date which is three months prior to maturity at
100%
of their principal amount together with accrued and unpaid interest and a make-whole premium. After such date, the Parent may redeem in whole or in part at
100%
of their principal amount together with accrued and unpaid interest. The Parent may also redeem in whole but not in part at
100%
of their principal amount together with accrued and unpaid interest in connection with certain tax events. Upon the occurrence of certain events, the Parent will be required to offer to repurchase all of the notes at a price equal to
101%
of their principal amount together with accrued and unpaid interest.
|
|
++
|
The Parent may redeem in whole but not in part at any time prior to maturity at
100%
of their principal amount together with accrued and unpaid interest and a make-whole premium. The Parent may also redeem in whole but not in part at
100%
of their principal amount together with accrued and unpaid interest in connection with certain tax events. Upon the occurrence of certain events, the Parent will be required to redeem in whole or in part at
100%
of their principal amount together with accrued and unpaid interest.
|
|
+++
|
IGT may redeem in whole or in part at any time prior maturity at
100%
of their principal amount together with accrued and unpaid interest and a make-whole premium. IGT may also redeem in whole or in part at
100%
of their principal amount together with accrued and unpaid interest in connection with certain gaming regulatory events. Upon the occurrence of certain events, IGT will be required to offer to repurchase all of the notes at a price equal to
101%
of their principal amount together with accrued and unpaid interest.
|
F-39
|
++++
|
The Parent may redeem in whole or in part at any time prior to the date which is six months prior to maturity at 100% of their principal amount together with accrued and unpaid interest and a make-whole premium. After such date, the Parent may redeem in whole or in part at
100%
of their principal amount together with accrued and unpaid interest. The Parent may also redeem in whole but not in part at
100%
of their principal amount together with accrued and unpaid interest in connection with certain tax events. Upon the occurrence of certain events, the Parent will be required to offer to repurchase all of the notes at a price equal to
101%
of their principal amount together with accrued and unpaid interest.
|
The Notes contain customary covenants and events of default. At
December 31, 2018
, the issuers were in compliance with all covenants.
6.250% Senior Secured Notes due January 2027
On September 26, 2018, the Parent issued
$750 million
of
6.250%
Senior Secured Notes due January 2027 (the "6.250% Notes") at par.
The Parent used the net proceeds from the 6.250% Notes and borrowings under the Revolving Credit Facilities due July 2021 to redeem
$600.0 million
of the 5.625% Senior Secured Notes due February 2020 (the "5.625% Notes"),
$144.3 million
of the 7.500% Senior Secured Notes due July 2019 (the "7.500% Notes") and
$96.8 million
of the 5.500% Senior Secured Notes due June 2020 (the "5.500% Notes"), for total consideration, excluding interest, of
$865.8 million
. The Company recorded a
$24.8 million
loss on extinguishment of debt in connection with the redemptions, which is classified in other expense, net on the consolidated statement of operations for the year ended
December 31, 2018
.
Interest on the 6.250% Notes is payable semi-annually in arrears.
The 6.250% Notes are guaranteed by certain subsidiaries of the Parent and are secured by ownership interests of the Parent in certain of its direct subsidiaries and certain intercompany loans with principal balances in excess of
$10 million
.
Prior to July 15, 2026, the Parent may redeem the 6.250% Notes in whole or in part at
100%
of their principal amount together with accrued and unpaid interest and a make-whole premium. On or after July 15, 2026, the Parent may redeem the 6.250% Notes in whole or in part at
100%
of their principal amount together with accrued and unpaid interest. The Parent may also redeem the 6.250% Notes in whole but not in part at
100%
of their principal amount together with accrued and unpaid interest in connection with certain tax events. Upon the occurrence of certain events, the Parent will be required to offer to repurchase all of the 6.250% Notes at a price equal to
101%
of their principal amount together with accrued and unpaid interest. In certain events of default, the 6.250% Notes outstanding may become due and payable immediately.
3.500% Senior Secured Notes due July 2024
On June 27, 2018, the Parent issued
€500 million
of
3.500%
Senior Secured Notes due July 2024 (the "3.500% Notes") at par.
The Parent used the net proceeds from the 3.500% Notes to repurchase
€262.4 million
(
$303.6 million
) of the 4.125% Senior Secured Notes due February 2020 (the "4.125% Notes") and
€112.1 million
(
$129.7 million
) of the 4.750% Senior Secured Notes due March 2020 (the "4.750% Notes"), for total consideration, excluding interest, of
€395.5 million
(
$457.5 million
). The Company recorded a
$29.6 million
loss on extinguishment of debt in connection with the repurchases, which is classified in other expense, net on the consolidated statement of operations for the year ended
December 31, 2018
.
Interest on the 3.500% Notes is payable semi-annually in arrears.
The 3.500% Notes are guaranteed by certain subsidiaries of the Parent and are secured by ownership interests of the Parent in certain of its direct subsidiaries and certain intercompany loans with principal balances in excess of
$10 million
.
Prior to January 15, 2024, the Parent may redeem the 3.500% Notes in whole or in part at
100%
of their principal amount together with accrued and unpaid interest and a make-whole premium. On or after January 15, 2024, the Parent may redeem the 3.500% Notes in whole or in part at
100%
of their principal amount together with accrued and unpaid interest. The Parent may also redeem the 3.500% Notes in whole but not in part at
100%
of their principal amount together with accrued and unpaid interest in connection with certain tax events. Upon the occurrence of certain events, the Parent will be required to offer to repurchase all of the 3.500% Notes at a price equal to
101%
of their principal amount together with accrued and unpaid interest. In certain events of default, the 3.500% Notes outstanding may become due and payable immediately.
F-40
6.625% Senior Secured Notes due February 2018
The Parent redeemed the
€500 million
(
$625.5 million
)
6.625%
Senior Secured Notes due February 2018 when they matured on February 2, 2018, using proceeds from the Term Loan Facility due January 2023.
7.500% Senior Secured Notes due July 2019
On June 12, 2017, the Parent offered to purchase any and all of the
$500.0 million
7.500%
Notes and on June 21, 2017 the Parent purchased
$355.7 million
of these notes for total consideration, excluding interest, of
$393.5 million
. The Company recorded a
$25.7 million
loss on extinguishment of debt in connection with the purchase, which is classified in other expense, net, on the consolidated statement of operations for the year ended
December 31, 2017
.
Term Loan Facility
On July 25, 2017, the Parent entered into a senior facility agreement (the "Term Loan Facility Agreement") for a
€1.5 billion
term loan facility maturing in January 2023 (the "Term Loan Facility").
The Parent must repay the Term Loan Facility in four installments, as detailed below:
|
Due Date
|
Amount (€ thousands)
|
||
|
January 25, 2020
|
320,000
|
|
|
|
January 25, 2021
|
320,000
|
|
|
|
January 25, 2022
|
320,000
|
|
|
|
January 25, 2023
|
540,000
|
|
|
Interest on the Term Loan Facility is payable between one and six months in arrears at rates equal to the applicable LIBOR or EURIBOR plus a margin based on our long-term ratings by Moody’s and S&P. At
December 31, 2018
and
2017
, the effective interest rate on the Term Loan Facility was
2.05%
.
The Term Loan Facility is guaranteed by certain subsidiaries of the Parent and is secured by ownership interests of the Parent in certain of its direct subsidiaries and certain intercompany loans with principal balances in excess of
$10 million
.
Upon the occurrence of certain events, the Parent may be required to prepay the Term Loan Facility in full.
The Term Loan Facility Agreement contains customary covenants (including maintaining a minimum ratio of EBITDA to net interest costs and maximum ratio of total net debt to EBITDA) and events of default. At
December 31, 2018
, the Parent was in compliance with all covenants.
Revolving Credit Facilities
The Parent and certain of its subsidiaries are party to a senior facilities agreement (the "RCF Agreement") which provides for the following multi-currency revolving credit facilities (the "Revolving Credit Facilities"):
|
Maximum Amount
Available (thousands)
|
Facility
|
Borrowers
|
||
|
$1,200,000
|
Revolving Credit Facility A
|
Parent, IGT and IGT Global Solutions Corporation
|
||
|
€725,000
|
Revolving Credit Facility B
|
Parent and Lottomatica Holding S.r.l.
|
||
Interest on the Revolving Credit Facilities is payable between one and six months in arrears at rates equal to the applicable LIBOR or EURIBOR plus a margin based on the Parent’s long-term ratings by Moody’s and S&P. At
December 31, 2018
and
2017
, the effective interest rate on the Revolving Credit Facilities was
2.66%
and
3.48%
, respectively.
The RCF Agreement provides that the following fees, which are recorded in interest expense in the consolidated statements of operations, are payable quarterly in arrears:
|
•
|
Commitment fees - payable on the aggregate undrawn and un-cancelled amount of the Revolving Credit Facilities depending on the Parent’s long-term ratings by Moody’s and S&P. The applicable rate was
0.725%
at
December 31, 2018
.
|
F-41
|
•
|
Utilization fees - payable on the aggregate drawn amount of the Revolving Credit Facilities at a rate depending on the percentage of the Revolving Credit Facilities utilized. The applicable rate was
0.15%
at
December 31, 2018
.
|
The Revolving Credit Facilities are guaranteed by the Parent and certain of its subsidiaries and are secured by ownership interests of the Parent in certain of its direct subsidiaries and certain intercompany loans with principal balances in excess of
$10 million
.
Upon the occurrence of certain events, the borrowers may be required to repay the Revolving Credit Facilities and the lenders may have the right to cancel their commitments.
At
December 31, 2018
and
2017
, the available liquidity under the Revolving Credit Facilities was
$1.602 billion
and
$1.974 billion
, respectively.
The RCF Agreement contains customary covenants (including maintaining a minimum ratio of EBITDA to net interest costs and a maximum ratio of total net debt to EBITDA) and events of default. At
December 31, 2018
, the borrowers were in compliance with all covenants.
Other Credit Facilities
The Parent and certain of its subsidiaries may borrow under senior unsecured uncommitted demand credit facilities made available by several financial institutions. At
December 31, 2018
, there was
$34.8 million
in borrowings under these facilities with an effective interest rate of
3.64%
. At
December 31, 2017
, there were
no
borrowings under these facilities.
Letters of Credit
The Parent and certain of its subsidiaries may obtain letters of credit under the Revolving Credit Facilities and under senior unsecured uncommitted demand credit facilities. The letters of credit secure various obligations, including obligations arising under customer contracts and real estate leases. The following table summarizes the letters of credit outstanding at
December 31, 2018
and
2017
and the weighted average annual cost of such letters of credit:
|
Letters of Credit Outstanding
|
|
|||||||||||
|
($ thousands)
|
Not under the
Revolving Credit
Facilities
|
Under the
Revolving Credit
Facilities
|
Total
|
Weighted
Average
Annual Cost
|
||||||||
|
December 31, 2018
|
453,719
|
|
—
|
|
453,719
|
|
0.98
|
%
|
||||
|
December 31, 2017
|
510,962
|
|
—
|
|
510,962
|
|
1.02
|
%
|
||||
Interest Expense
Interest expense is composed of the following:
|
|
For the year ended
|
||||||||
|
|
December 31,
|
||||||||
|
($ thousands)
|
2018
|
2017
|
2016
|
||||||
|
Senior Secured Notes
|
(352,293
|
)
|
(389,879
|
)
|
(391,790
|
)
|
|||
|
Term Loan Facilities
|
(39,462
|
)
|
(23,567
|
)
|
(19,100
|
)
|
|||
|
Revolving Credit Facilities
|
(27,805
|
)
|
(34,984
|
)
|
(42,179
|
)
|
|||
|
Other
|
(12,058
|
)
|
(10,469
|
)
|
(16,199
|
)
|
|||
|
|
(431,618
|
)
|
(458,899
|
)
|
(469,268
|
)
|
|||
F-42
|
15
.
|
Income Taxes
|
The components of income (loss) before provision for (benefit from) income taxes, determined by tax jurisdiction, are as follows:
|
|
For the year ended December 31,
|
||||||||
|
($ thousands)
|
2018
|
2017
|
2016
|
||||||
|
United Kingdom
|
195,629
|
|
(408,595
|
)
|
87,269
|
|
|||
|
United States
|
(363,507
|
)
|
(1,173,601
|
)
|
(355,451
|
)
|
|||
|
Italy
|
535,643
|
|
479,851
|
|
578,221
|
|
|||
|
All other
|
(63,717
|
)
|
125,420
|
|
13,374
|
|
|||
|
|
304,048
|
|
(976,925
|
)
|
323,413
|
|
|||
The provision for (benefit from) income taxes consists of:
|
|
For the year ended December 31,
|
||||||||
|
($ thousands)
|
2018
|
2017
|
2016
|
||||||
|
Current:
|
|
|
|
|
|
|
|||
|
United Kingdom
|
3,579
|
|
733
|
|
711
|
|
|||
|
United States
|
(12,028
|
)
|
80,140
|
|
(16,982
|
)
|
|||
|
Italy
|
186,402
|
|
131,155
|
|
192,712
|
|
|||
|
All other
|
45,942
|
|
54,823
|
|
36,414
|
|
|||
|
|
223,895
|
|
266,851
|
|
212,855
|
|
|||
|
Deferred:
|
|
|
|
|
|
|
|||
|
United Kingdom
|
(282
|
)
|
4,366
|
|
19,232
|
|
|||
|
United States
|
(20,900
|
)
|
(175,539
|
)
|
(109,139
|
)
|
|||
|
Italy
|
(3,186
|
)
|
865
|
|
(5,837
|
)
|
|||
|
All other
|
(10,126
|
)
|
(125,957
|
)
|
(57,905
|
)
|
|||
|
|
(34,494
|
)
|
(296,265
|
)
|
(153,649
|
)
|
|||
|
|
189,401
|
|
(29,414
|
)
|
59,206
|
|
|||
Income taxes paid, net of refunds, were
$239.8 million
,
$296.4 million
and
$183.3 million
in
2018
,
2017
and
2016
, respectively.
On December 22, 2017, the President of the United States signed into law the Tax Cuts and Jobs Act of 2017 (the "Tax Act") which has resulted in significant changes to the U.S. corporate income tax system. Changes include, but are not limited to: a corporate tax rate decrease from
35%
to
21%
effective for tax years beginning after December 31, 2017; the transition of U.S. international taxation from a worldwide tax system to a modified territorial tax system; and a one-time transition tax on the mandatory deemed repatriation of cumulative foreign earnings (the "transition tax") as of December 31, 2017. In accordance with the Tax Act, we recorded a
$114.2 million
income tax benefit in the fourth quarter of 2017, the period in which the legislation was enacted. The total tax benefit included a
$60.5 million
tax expense related to the transition tax and a
$174.7 million
tax benefit related to the remeasurement of deferred tax assets and liabilities.
Additionally, Securities and Exchange Commission ("SEC") Staff Accounting Bulletin ("SAB") No. 118,
Income Tax Accounting Implications of the Tax Cuts and Jobs Act
("SAB 118") was issued to address the application of GAAP in situations when a Company does not have the necessary information available, prepared, or analyzed (including computations) in reasonable detail to complete the accounting for certain income tax effects of the Tax Act. December 22, 2018 marked the end of the measurement period for purposes of SAB 118. In the fourth quarter of 2018, we completed our analysis to determine the effect of the Tax Act and recorded no significant adjustments as of December 31, 2018.
F-43
The Parent is a tax resident in the United Kingdom (the "U.K."). A reconciliation of the provision for (benefit from) income taxes, with the amount computed by applying the weighted average rate of the U.K. statutory main corporation tax rates enacted in each of the Parent’s calendar year reporting periods to income (loss) before provision for (benefit from) income taxes is as follows:
|
|
For the year ended December 31,
|
||||||||
|
($ thousands)
|
2018
|
2017
|
2016
|
||||||
|
Income (loss) before provision for (benefit from) income taxes
|
304,048
|
|
(976,925
|
)
|
323,413
|
|
|||
|
United Kingdom statutory tax rate
|
19.00
|
%
|
19.25
|
%
|
20.00
|
%
|
|||
|
Statutory tax expense (benefit)
|
57,769
|
|
(188,058
|
)
|
64,682
|
|
|||
|
Foreign tax and statutory rate differential
(1)
|
48,040
|
|
(71,050
|
)
|
(17,013
|
)
|
|||
|
IRAP and state taxes
|
38,820
|
|
33,484
|
|
36,754
|
|
|||
|
Nondeductible goodwill impairment
|
22,420
|
|
137,445
|
|
—
|
|
|||
|
Italian tax settlement
|
16,664
|
|
—
|
|
15,256
|
|
|||
|
Foreign tax expense, net of U.S. federal benefit
|
14,930
|
|
14,500
|
|
3,457
|
|
|||
|
BEAT tax
|
13,769
|
|
—
|
|
—
|
|
|||
|
GILTI tax
|
11,079
|
|
—
|
|
—
|
|
|||
|
Change in unrecognized tax benefits
|
9,166
|
|
20,624
|
|
(10,914
|
)
|
|||
|
Tax cost of tax dividends
|
6,613
|
|
3,041
|
|
4,619
|
|
|||
|
Tax impact of tax law and rate changes excluding the Tax Act
|
4,337
|
|
(2,463
|
)
|
(8,422
|
)
|
|||
|
Nondeductible expenses
|
1,251
|
|
1,204
|
|
2,659
|
|
|||
|
Foreign withholding and state taxes on unremitted earnings
|
(880
|
)
|
9,290
|
|
—
|
|
|||
|
Non-controlling interest
|
(1,132
|
)
|
(2,205
|
)
|
(3,605
|
)
|
|||
|
U.S. research and development tax credit
|
(2,823
|
)
|
(5,052
|
)
|
(4,980
|
)
|
|||
|
Provision to return adjustments
|
(2,909
|
)
|
(1,334
|
)
|
(6,705
|
)
|
|||
|
Italian allowance for corporate equity
|
(4,515
|
)
|
(11,761
|
)
|
(9,243
|
)
|
|||
|
Tax impact of Tax Act
|
(10,852
|
)
|
(114,219
|
)
|
—
|
|
|||
|
Nontaxable foreign exchange gain
|
(12,384
|
)
|
—
|
|
—
|
|
|||
|
Change in valuation allowances
|
(13,723
|
)
|
58,672
|
|
3,610
|
|
|||
|
Capital gain taxes on sale of DoubleDown
|
—
|
|
94,303
|
|
—
|
|
|||
|
Non-taxable gains on investments
|
—
|
|
—
|
|
(5,880
|
)
|
|||
|
Other
|
(6,239
|
)
|
(5,835
|
)
|
(5,069
|
)
|
|||
|
|
189,401
|
|
(29,414
|
)
|
59,206
|
|
|||
|
Effective tax rate
|
62.3
|
%
|
3.0
|
%
|
18.3
|
%
|
|||
(1) Includes the effects of foreign subsidiaries' earnings taxed at rates other than the U.K. statutory rate
In 2018, our effective tax rate was higher than the U.K. statutory rate of
19.00%
primarily due to the impact of the international provisions of the Tax Act (the base-erosion and anti-abuse tax or "BEAT" and GILTI), a goodwill impairment with no associated tax benefit, increases in uncertain tax positions and the settlement of an Italian tax audit.
In 2017, our effective tax rate was higher than the U.K. statutory rate of
19.25%
primarily due to a goodwill impairment with no associated tax benefit, capital gain taxes incurred on the sale of DoubleDown, a net increase in valuation allowances in the U.K. and other foreign jurisdictions offset by a favorable net tax benefit recorded related to the impact of the Tax Act.
In 2016, our effective tax rate was lower than the U.K. statutory rate of
20.00%
primarily due to a reduction in operating losses without tax benefits in certain foreign jurisdictions, decrease in uncertain tax positions as a result of a favorable settlement with the Internal Revenue Service (the "IRS"), tax benefits associated with tax law and tax rate changes during the year, offset by an Italian audit settlement.
F-44
The components of deferred tax assets and liabilities are as follows:
|
|
December 31,
|
|||||
|
($ thousands)
|
2018
|
2017
|
||||
|
Deferred tax assets:
|
|
|
|
|
||
|
Net operating losses
|
226,249
|
|
241,702
|
|
||
|
Provisions not currently deductible for tax purposes
|
112,768
|
|
132,365
|
|
||
|
Section 163(j) interest limitation
|
75,778
|
|
—
|
|
||
|
Depreciation and amortization
|
49,548
|
|
72,101
|
|
||
|
Jackpot timing differences
|
42,651
|
|
51,438
|
|
||
|
Inventory reserves
|
10,497
|
|
9,913
|
|
||
|
Stock-based compensation
|
4,077
|
|
2,402
|
|
||
|
Deferred revenue
|
3,946
|
|
5,317
|
|
||
|
Other
|
9,480
|
|
4,155
|
|
||
|
Gross deferred tax assets
|
534,994
|
|
519,393
|
|
||
|
Valuation allowance
|
(170,831
|
)
|
(184,554
|
)
|
||
|
Deferred tax assets, net of valuation allowance
|
364,163
|
|
334,839
|
|
||
|
Deferred tax liabilities:
|
|
|
|
|
||
|
Acquired intangible assets
|
589,993
|
|
635,471
|
|
||
|
Depreciation and amortization
|
157,260
|
|
138,764
|
|
||
|
Other
|
24,876
|
|
10,518
|
|
||
|
Total deferred tax liabilities
|
772,129
|
|
784,753
|
|
||
|
Net deferred income tax liability
|
(407,966
|
)
|
(449,914
|
)
|
||
Our net deferred income taxes are recorded in the consolidated balance sheets as follows:
|
|
December 31,
|
|||||
|
($ thousands)
|
2018
|
2017
|
||||
|
Deferred income taxes - non-current asset
|
38,117
|
|
41,546
|
|
||
|
Deferred income taxes - non-current liability
|
(446,083
|
)
|
(491,460
|
)
|
||
|
|
(407,966
|
)
|
(449,914
|
)
|
||
Net Operating Loss Carryforwards
We have a
$1.021 billion
gross tax loss carryforward, of which
$401.6 million
relates to the U.K.,
$220.3 million
relates to U.S. Federal, and
$398.8 million
relates to other foreign tax jurisdictions. Carryforwards in certain tax jurisdictions begin to expire in 2030, while others have an unlimited carryforward period. A valuation allowance has been provided on
$755.1 million
of the gross net operating loss carryfowards. Portions of the tax loss carryforwards are subject to annual limitations, including Section 382 of the U.S. Internal Revenue Code of 1986, as amended, for U.S. tax purposes, and similar provisions under other countries' laws. In addition, as of December 31, 2018, we had U.S. state tax net operating loss carryforwards, resulting in a deferred tax asset (net of U.S. federal tax benefit) of approximately
$13.9 million
. U.S. state tax net operating loss carryfowards generally expire in the years 2019 through 2038.
Valuation Allowance
A reconciliation of the valuation allowance is as follows:
|
|
December 31,
|
||||||||
|
($ thousands)
|
2018
|
2017
|
2016
|
||||||
|
Balance at beginning of year
|
184,554
|
|
151,653
|
|
139,663
|
|
|||
|
Expiration of tax attributes
|
—
|
|
(25,771
|
)
|
—
|
|
|||
|
Net charges to (income) expense
|
(13,723
|
)
|
58,672
|
|
11,990
|
|
|||
|
Balance at end of year
|
170,831
|
|
184,554
|
|
151,653
|
|
|||
F-45
The valuation allowance primarily relates to U.K. and foreign net operating losses that are not more likely than not expected to be realized. In assessing the need for a valuation allowance, we considered both positive and negative evidence for each jurisdiction including past operating results, estimates of future taxable income and the feasibility of tax planning strategies. When we change our determination as to the amount of deferred tax assets that can be realized, the valuation allowance is adjusted with a corresponding impact to the provision for (benefit from) income taxes in the period in which such determination is made.
In December 2017, we recorded a valuation allowance on the U.K. net operating losses. The net operating losses were primarily due to significant foreign exchange losses relating to euro denominated debt that is recorded on a U.S. dollar functional currency U.K. company.
For the years ended December 31, 2018 and December 31, 2017, we recorded a net valuation (decrease) increase of
$(13.7) million
and
$32.9 million
, respectively.
Unremitted Earnings
Prior to the Tax Act, we considered the earnings in our foreign subsidiaries to be indefinitely reinvested and, accordingly, recorded no deferred income taxes. The Tax Act eliminated the deferral of U.S. income tax on these foreign earnings by imposing the transition tax. As a result, we now intend to repatriate substantially all of our accumulated foreign earnings (not including the earnings of our Italian sub-group of entities). We continue to have significant cash needs outside the United States and, accordingly, the extent and timing of repatriation of these earnings continues to be monitored. The Tax Act, however, has given us more flexibility to manage and deploy cash globally. As of December 31, 2018, we have recorded an
$8.4 million
deferred tax liability associated with foreign withholding and other taxes resulting from our intention to repatriate foreign earnings.
We continue to indefinitely reinvest the earnings of our subsidiary investments held by our Italian parent sub-holding company and, therefore, no deferred income taxes have been provided on these earnings. If we were to change our position with respect to the indefinite reinvestment of earnings on our Italian parent sub-holding company, the estimated deferred tax effects would be
$10.5 million
as of December 31, 2018.
Accounting for Uncertainty in Income Taxes
A reconciliation of the unrecognized tax benefits is as follows:
|
|
December 31,
|
||||||||
|
($ thousands)
|
2018
|
2017
|
2016
|
||||||
|
Balance at beginning of year
|
20,975
|
|
14,340
|
|
37,370
|
|
|||
|
Additions to tax positions - current year
|
11,947
|
|
479
|
|
423
|
|
|||
|
Additions to tax positions - prior years
|
16,973
|
|
7,503
|
|
1,718
|
|
|||
|
Reductions to tax positions - current year
|
—
|
|
(893
|
)
|
(652
|
)
|
|||
|
Reductions to tax positions - prior years
|
(4,610
|
)
|
(41
|
)
|
(12,755
|
)
|
|||
|
Settlements
|
(17,238
|
)
|
—
|
|
(8,750
|
)
|
|||
|
Lapses in statutes of limitations
|
(1,412
|
)
|
(413
|
)
|
(3,014
|
)
|
|||
|
Balance at end of year
|
26,635
|
|
20,975
|
|
14,340
|
|
|||
At
December 31, 2018
,
2017
and
2016
,
$26.6 million
,
$16.6 million
and
$10.8 million
, respectively, of the unrecognized tax benefits, if recognized, would affect our effective tax rates.
We recognize interest expense and penalties related to income tax matters in the provision for income taxes. For
2018
,
2017
and
2016
, we recognized
$0.7 million
,
$12.1 million
and
$(0.1) million
, respectively, in interest expense, penalties, and inflationary adjustments. At
December 31, 2018
,
2017
and
2016
, the gross balance of accrued interest and penalties was
$16.4 million
,
$15.7 million
and
$3.6 million
, respectively.
Unrecognized tax benefits increased during 2018 and 2017 as a result of various international tax audits. Unrecognized tax benefits decreased during 2016 as a result of the settlement with the IRS. For 2016, the additions to unrecognized tax benefits related to the current year are primarily attributable to U.S. tax issues.
F-46
We file income tax returns in various jurisdictions of which the United Kingdom, United States and Italy represent the major tax jurisdictions. All years prior to calendar year 2015 are closed with the IRS. As of December 31, 2018, we are subject to income tax audits in various tax jurisdictions globally, most significantly in Mexico and Italy.
Mexico Tax Audit
In November 2012, GTECH Mexico, S.A. de C.V. ("GTECH Mexico") concluded a tax audit related to tax year 2006. This conclusion resulted in a tax assessment of approximately
424 million
Mexican Pesos, including interest, inflationary adjustments and penalties. As of
December 31, 2018
, this assessment has increased as a result of additional inflationary adjustments to
539 million
Mexican Pesos. The Mexico assessment primarily relates to the deductibility of cost of goods sold (approximately
65%
of the updated total assessment) and to intercompany loan proceeds being treated as taxable income. GTECH Mexico filed appeals of the different components of the assessment and on the issue of the deductibility of cost of goods sold. The Supreme Court ruled against us in 2017. As a result of this loss, an accrual in the amount of
354.8 million
Mexican Pesos (
$18.1 million
at the
December 31, 2018
exchange rate) was recorded to income taxes payable in the consolidated balance sheet at
December 31, 2018
. The other tax issues are still being addressed in the courts in Mexico.
Italy Tax Audits
On December 21, 2017 and on March 29, 2018, the Italian Tax Authority issued a preliminary tax audit report for the 2014 and 2015 fiscal years, respectively. Both audit reports related to the reorganization of the Italian business and the merger of GTECH S.p.A. with and into the Parent effective from April 7, 2015, addressing (i) the non-deductibility of certain transaction costs, (ii) withholding taxes on bridge facility fees, and (iii) the redetermination of the taxable gains associated with the reorganization of the Italian business. The total income tax assessment for fiscal 2014 and fiscal 2015 was
€13.2 million
(
$16.7 million
), which has been settled and fully paid with the Italian Tax Authority as of December 31, 2018.
|
16
.
|
Employee Benefit Plans
|
Defined Contribution Plan
We maintain a salary deferral 401(k) plan that allows eligible employees to contribute a portion of their base pay up to the IRS prescribed limit. We match a portion of the employee’s contribution. Employee and Company matching contributions vest immediately. We recognized expense related to the matching contribution of
$13.6 million
,
$13.8 million
and
$13.7 million
in
2018
,
2017
and
2016
, respectively.
Defined Benefit Plan
We have a defined benefit plan to provide certain post-employment benefits to Italian employees following termination from the Company. These employees may choose to participate in an unfunded plan within the Company or transfer their plan balance to independent external funds. These benefits are funded only to the extent paid to external funds. The cost of providing benefits under the plan, for those employees that participate in the unfunded plan within the Company, is determined using the projected unit credit actuarial valuation method. The cost of providing benefits for those employees that choose to transfer their plan to independent external funds are considered as defined contributions and are accrued as the employees render the related service. Net benefit expense was
$8.4 million
,
$8.1 million
and
$8.8 million
in
2018
,
2017
and
2016
, respectively. The present value of the defined benefit obligation was
$11.5 million
,
$12.3 million
and
$11.3 million
at
December 31, 2018
,
2017
and
2016
, respectively.
|
17
.
|
Commitments and Contingencies
|
Commitments
Lease Commitments
Rent and lease expense was
$118.5 million
,
$106.1 million
and
$95.5 million
for the years ended December 31, 2018, 2017 and
2016
, respectively, and included contingent rent payments of
$28.7 million
,
$24.2 million
and
$23.0 million
for the years ended December 31, 2018, 2017 and
2016
, respectively.
F-47
The future minimum lease payments for the remaining non-cancellable term of our leases at
December 31, 2018
are as follows ($ thousands):
|
Year
|
Operating
|
Capital
|
Total
|
||||||
|
2019
|
69,690
|
|
8,946
|
|
78,636
|
|
|||
|
2020
|
56,204
|
|
8,304
|
|
64,508
|
|
|||
|
2021
|
46,092
|
|
7,499
|
|
53,591
|
|
|||
|
2022
|
41,324
|
|
5,809
|
|
47,133
|
|
|||
|
2023
|
38,155
|
|
6,097
|
|
44,252
|
|
|||
|
Thereafter
|
204,216
|
|
2,978
|
|
207,194
|
|
|||
|
Total future minimum lease payments
|
455,681
|
|
39,633
|
|
495,314
|
|
|||
|
Less imputed interest
|
|
|
(9,529
|
)
|
|
|
|||
|
Present value of future minimum lease payments
|
|
|
30,104
|
|
|
|
|||
Facility Lease
We have a lease for a facility in Providence, Rhode Island. We have the right to terminate the lease after June 30, 2023 if our FMC with the State of Rhode Island is not renewed, in exchange for a termination fee equal to
six months
of base rent plus operating expenses. The lease includes
two
10
-year extension options. We have the unilateral right to extend the lease under the
two
extension options under the same terms as in the initial term. We may not assign the lease or sublease our portion of the facility without the lessor’s approval, which is not to be unreasonably withheld. The lease has been accounted for under the build-to-suit guidance because we were considered the owner of the facility during the construction period. At the end of the construction period, the transaction did not qualify for sale-leaseback accounting because we had continuing involvement. Therefore, we carry the entire cost of the facility as an asset with an offsetting liability that is reduced over time under the financing method. The facility is depreciated over its useful life of
40 years
. The asset associated with this lease, which is classified as PPE in the consolidated balance sheets, is carried at a cost of
$55.6 million
with accumulated depreciation of
$17.0 million
at
December 31, 2018
. The liability and the net book value of the asset will be
$32.5 million
at the end of the non-cancellable lease term. The total future minimum lease payments of
$18.8 million
for this lease are included within the capital lease section of the table above.
Sale and Leaseback Transactions
On March 29, 2017, we entered into a sale-leaseback transaction for our main manufacturing and production facility located in Reno, Nevada. The transaction included a
15.5
year initial lease term, with
four
5
-year additional renewal periods exercisable at our option,
3%
annual rent increases, and payment and performance guarantees. Rent expense was
$13.4 million
for the year ended
December 31, 2018
.
The transaction is accounted for as an operating lease, and future minimum lease payments of
$186.6 million
are included in the operating lease section in the table above.
Communication Equipment Capital Leases
We have capital leases for certain communication equipment that is primarily used to provide services under our FMCs and LMAs. These leases expire between 2019 and 2028. The leases have options to extend and options to purchase the equipment, and do not contain escalation clauses. The future minimum lease payments of
$20.8 million
for these leases are included within the capital lease section in the table above. The assets associated with these leases, which are classified as Systems & Equipment in the consolidated balance sheets, are carried at a cost of
$36.2 million
with accumulated amortization of
$19.1 million
at
December 31, 2018
. Amortization of capital lease assets is included in depreciation expense within cost of services in our consolidated statements of operations.
F-48
Jackpot Commitments
Jackpot liabilities are recorded as current and non-current liabilities as follows:
|
($ thousands)
|
December 31, 2018
|
||
|
Current liabilities
|
76,191
|
|
|
|
Non-current liabilities
|
178,376
|
|
|
|
|
254,567
|
|
|
Future jackpot payments are due as follows ($ thousands):
|
Year
|
Previous Winners
|
Future Winners
|
Total
|
||||||
|
2019
|
34,179
|
|
41,865
|
|
76,044
|
|
|||
|
2020
|
29,119
|
|
9,882
|
|
39,001
|
|
|||
|
2021
|
24,755
|
|
709
|
|
25,464
|
|
|||
|
2022
|
21,982
|
|
709
|
|
22,691
|
|
|||
|
2023
|
19,717
|
|
709
|
|
20,426
|
|
|||
|
Thereafter
|
105,418
|
|
10,641
|
|
116,059
|
|
|||
|
Future jackpot payments due
|
235,170
|
|
64,515
|
|
299,685
|
|
|||
|
Unamortized discounts
|
|
|
|
|
(45,118
|
)
|
|||
|
Total jackpot liabilities
|
|
|
|
|
254,567
|
|
|||
Other Commitments
Yeonama Holdings Co. Limited
In 2013, we invested
€19.8 million
in Yeonama Holdings Co. Limited ("Yeonama"), a shareholder in Emma Delta Limited, the fund that holds a
33%
interest in OPAP S.A. ("OPAP"), the Greek gaming and sports betting operator, with a commitment to invest up to an additional
€10.2 million
. In the first quarter of 2018, our commitment was reduced from
€10.2 million
to
€1.5 million
(
$1.7 million
at the
December 31, 2018
exchange rate) in Yeonama, representing a total potential
€21.3 million
(
$24.4 million
at the
December 31, 2018
exchange rate) investment.
Contingencies
Performance and other bonds
In connection with certain contracts and procurements, we have delivered performance bonds for the benefit of customers and bid and litigation bonds for the benefit of potential customers. These bonds give the beneficiary the right to obtain payment and/or performance from the issuer of the bond if certain specified events occur. In the case of performance bonds, which generally have a term of
one year
, such events include our failure to perform our obligations under the applicable contract. The following table provides information related to potential commitments for bonds outstanding at
December 31, 2018
:
|
($ thousands)
|
Total bonds
|
||
|
Performance bonds
|
480,744
|
|
|
|
Wide Area Progressive bonds
|
240,560
|
|
|
|
Bid and litigation bonds
|
38,411
|
|
|
|
All other bonds
|
3,154
|
|
|
|
|
762,869
|
|
|
Guarantees and Indemnifications
Loxley GTECH Technology Co., LTD Guarantee
We have a
49%
interest in Loxley GTECH Technology Co., LTD ("LGT"). LGT is a joint venture that was formed to provide an online lottery system in Thailand.
F-49
We have guaranteed, along with the
51%
shareholder in LGT, performance bonds provided on behalf of LGT by an unrelated commercial lender. The performance bonds relate to LGT’s performance under the July 2005 contract between the Government Lottery Office of Thailand and LGT should such contract become operational. We are jointly and severally liable with the other shareholder in LGT for this guarantee. There is no scheduled termination date for our guarantee obligation. At
December 31, 2018
, the maximum liability under the guarantee was
Baht 375 million
(
$11.6 million
). We do not have any obligation related to this guarantee because the July 2005 contract to provide the online lottery system is not in operation due to continuing political instability in Thailand.
Zest Gaming Contingent Consideration
On July 25, 2017, we acquired the video bingo subsidiaries and related operating assets of Zest Gaming S.r.l., a leading supplier of multi-card video bingo solutions headquartered in Italy. The acquisition consideration included a fair value estimate of contingent consideration related to existing operations for the twelve month period ending June 30, 2018. As of December 31, 2017, the contingent consideration was remeasured and a
€2.6 million
(
$3.1 million
) gain was recorded within selling, general and administrative expense on the consolidated statements of operations. Upon the conclusion of the contingent consideration period, the threshold for the earn out calculation was not met. The related liability was remeasured and a
€6.5 million
(
$7.5 million
) gain was recorded within selling, general and administrative expense on the consolidated statements of operations for the year ended December 31, 2018.
Legal Proceedings
From time to time, the Parent and/or one or more of its subsidiaries are party to legal, regulatory, or administrative proceedings regarding, among other matters, claims by and against us, and injunctions by third parties arising out of the ordinary course of business. Licenses are also subject to legal challenges by competitors, including Sisal and Stanley International Betting Limited, seeking to annul awards made to the Company. The Parent and/or one or more of its subsidiaries are also, from time to time, subjects of or parties to ethics and compliance inquiries and investigations related to the Company’s ongoing operations. Legal proceedings can be expensive and disruptive to normal business operations. Moreover, the results of legal proceedings are often difficult to predict and our view of these matters may change as the related proceedings and events unfold. At
December 31, 2018
, provisions for litigation matters amounted to
$12.0 million
. With respect to litigation and other legal proceedings where we have determined that a loss is reasonably possible but we are unable to estimate the amount or range of reasonably possible loss, in excess of amounts already accrued, no additional amounts have been accrued, given the uncertainties of litigation and the inherent difficulty of predicting the outcome of legal proceedings.
Texas Fun 5’s Instant Ticket Game
Five
lawsuits have been filed against IGT Global Solutions Corporation (f/k/a GTECH Corporation) in Texas state court arising out of the Fun 5’s instant ticket game sold by the Texas Lottery Commission ("TLC") from September 14, 2014 to October 21, 2014. Plaintiffs allege each ticket’s instruction for Game 5 provided a 5x win (five times the prize box amount) any time the "Money Bag" symbol was revealed in the "5X BOX". However, TLC awarded a 5x win only when (1) the "Money Bag" symbol was revealed and (2) three symbols in a pattern were revealed.
|
(a)
|
Steele, James et al. v. GTECH Corp.
, filed on December 9, 2014, in Travis County (No. D1GN145114). Through intervenor actions, over
1,200
plaintiffs claim damages in excess of
$500.0 million
. GTECH Corporation’s plea to the jurisdiction for dismissal based on sovereign immunity was denied. GTECH Corporation appealed. The appellate court ordered that plaintiffs' sole remaining claim should be reconsidered. On April 27, 2018, IGT Global Solutions Corporation petitioned for Texas Supreme Court review and the Texas Supreme Court has requested briefs.
|
|
(b)
|
Nettles, Dawn v. GTECH Corp. et al.
, filed on January 7, 2015, in Dallas County (No. 051501559CV). Plaintiff claims damages in excess of
$4.0 million
. GTECH Corporation and the Texas Lottery Commission won pleas to the jurisdiction for dismissal based on sovereign immunity. Plaintiff lost her appeal and petitioned for Texas Supreme Court review. The Texas Supreme Court has requested briefs.
|
|
(c)
|
Guerra, Esmeralda v. GTECH Corp. et al.
, filed on June 10, 2016, in Hidalgo County (No. C277716B). Plaintiff claims damages in excess of
$0.5 million
.
|
|
(d)
|
Wiggins, Mario & Kimberly v. IGT Global Solutions Corp.
, filed on September 15, 2016, in Travis County (No. D1GN16004344). Plaintiffs claim damages in excess of
$1.0 million
.
|
|
(e)
|
Campos, Osvaldo Guadalupe et al. v. GTECH Corp.
, filed on October 20, 2016, in Travis County (No. D1GN16005300). Plaintiffs claim damages in excess of
$1.0 million
.
|
We dispute the claims made in each of these cases and continue to defend against these lawsuits.
F-50
Illinois State Lottery
On February 2, 2017, putative class representatives of retailers and lottery ticket purchasers alleged the Illinois Lottery collected millions of dollars from sales of instant ticket games and wrongfully ended certain games before all top prizes had been sold.
Raqqa, Inc. et al. v. Northstar Lottery Group, LLC.
, was filed in Illinois state court, St. Clair County (No. 17L51) against Northstar Lottery Group LLC, a consortium in which the Parent indirectly holds an
80%
controlling interest. The claims include tortious interference with contract, violations of Illinois Consumer Fraud and Deceptive Practices Act, and unjust enrichment. The lawsuit was removed to the U.S. District Court for the Southern District of Illinois. On May 9, 2018, IGT Global Solutions Corporation and Scientific Games International, Inc. were added as defendants. On March 15, 2017, a second lawsuit,
Atteberry, Dennis et al. v. Northstar Lottery Group, LLC
, was filed in Illinois state court, Cook County (No. 2017CHO3755) seeking damages on the same matter. We dispute the claims made in both cases and continue to defend against these lawsuits.
Mexican Inventory Tax
The Mexican Tax Administration Service levied an assessment of income tax, VAT, profit sharing, interest and penalties on GTECH Mexico for the 2006 fiscal year that, as at
December 31, 2018
, amounted to
539 million
Mexican Pesos. Approximately
65%
of the assessment relates to denial of the deductibility of cost of goods sold ("cost of goods sold deduction") by GTECH Mexico to its parent and the remaining assessment relates primarily to intercompany loan proceeds (treated as taxable income) received from GTECH Mexico’s parent. Although lower courts upheld the assessment, the Mexican Appellate Court ruled the loan proceeds non-taxable, but denied our cost of goods sold deduction. The Mexican Supreme Court upheld the Appellate Court’s ruling that the cost of goods sold deduction would not apply. As a result of this loss, an accrual in the amount of
354.8 million
Mexican Pesos (
$18.1 million
at the
December 31, 2018
exchange rate) was recorded to income taxes payable in the consolidated balance sheet at
December 31, 2018
. GTECH Mexico filed a constitutional appeal on November 23, 2017. The other tax issues are still being addressed in the courts in Mexico. We maintain that the assessment is without merit. For a further discussion of the cost of goods sold deduction tax issue, refer to Note
15
,
Income Taxes
.
Previously Disclosed Matters
Set forth below are legal proceedings that were previously disclosed and for which we determined will not have a material impact on our operations, financial position, liquidity, or results of operations.
Brazil ICMS Tax
Since 1997, GTECH Brazil has paid ISS service taxes on its revenues derived from its lottery contract with Caixa Eonomica Federal. On July 26, 2005, the State of São Paulo challenged this tax classification, claiming the higher ICMS tax (Brazilian VAT) should have been applied on the value of printing ribbons, rolls of paper, and wagering slips ("Consumables") distributed to lottery outlets. On February 27, 2017, the Brazilian court ruled that rolls of paper and wagering slips were not subject to ICMS, but printing ribbons were, although at a lower tax rate than the São Paulo tax authorities had applied. Both parties appealed the respective unfavorable aspects of the lower court’s ruling to the Court of Appeals. On March 7, 2018, the Court of Appeals ruled in GTECH Brazil’s favor with respect to its petition to also exclude the printer ribbons from the ICMS tax. The Court of Appeals also ruled against the petition of the tax authority to reverse the lower court’s ruling to exclude rolls of paper and wagering slips from ICMS tax. The Brazilian tax authority has appealed the Court of Appeals' rulings in favor of GTECH Brazil. The proceedings are likely to take several years, and we have determined that a ruling adverse to us will not have a material impact on our operations, financial position, liquidity, or results of operations.
F-51
|
18
.
|
Shareholders’ Equity
|
Shares Authorized and Outstanding
The Board of Directors of the Parent (the "Board") is authorized to issue shares of any class in the capital of the Parent. The authorized ordinary shares of the Parent consists of
1.850 billion
ordinary shares with a
$0.10
per share par value.
Ordinary shares of common stock outstanding were as follows:
|
|
December 31,
|
||||||||
|
|
2018
|
2017
|
2016
|
||||||
|
Balance at beginning of year
|
203,446,572
|
|
202,285,166
|
|
200,244,239
|
|
|||
|
Shares issued under restricted stock plans
|
619,614
|
|
947,709
|
|
1,080,532
|
|
|||
|
Shares issued upon exercise of stock options
|
144,545
|
|
213,697
|
|
960,395
|
|
|||
|
Balance at end of year
|
204,210,731
|
|
203,446,572
|
|
202,285,166
|
|
|||
Repurchases of Ordinary Shares
The Parent has the authority to repurchase, subject to a maximum repurchase price, a maximum of 20% of the aggregate issued share capital of ordinary shares as of April 7, 2015. This authority will expire on July 28, 2020.
The Parent did not repurchase any of its ordinary shares in
2018
,
2017
or
2016
.
Dividends
We declared cash dividends per share during the periods presented as follows:
|
Per share amount ($)
|
2018
|
2017
|
2016
|
||||||
|
First Quarter
|
0.20
|
|
0.20
|
|
0.20
|
|
|||
|
Second Quarter
|
0.20
|
|
0.20
|
|
0.20
|
|
|||
|
Third Quarter
|
0.20
|
|
0.20
|
|
0.20
|
|
|||
|
Fourth Quarter
|
0.20
|
|
0.20
|
|
0.20
|
|
|||
|
Total cash dividends declared
|
0.80
|
|
0.80
|
|
0.80
|
|
|||
Future dividends are subject to Board approval.
The RCF Agreement and Term Loan Facility Agreement limit the aggregate amount of dividends and repurchases of the Parent's ordinary shares in each year to
$300 million
based on our current ratings by Moody’s and S&P provided that the ratio of the sum of total net debt and the aggregate amount of dividends and repurchases to EBITDA does not exceed:
|
•
|
95%
of the applicable ratio of total net debt to EBITDA with respect to the fourth quarter of 2018 and each quarter of 2019; and
|
|
•
|
90%
of the applicable ratio of total net debt to EBITDA for each quarter thereafter.
|
F-52
Accumulated Other Comprehensive Income
The following table details the changes in AOCI:
|
Unrealized Gain (Loss) on:
|
Less: OCI attributable
to non-controlling
interests
|
Total
AOCI
attributable to
IGT PLC
|
||||||||||||||||||||||
|
Foreign
Currency
Translation
|
Cash
Flow
Hedges
|
Hedge of
Net
Investment
|
Available
for Sale
Securities
|
Defined
Benefit
Plans
|
Share of
OCI of
Associate
|
|||||||||||||||||||
|
Balance at December 31, 2015
|
204,186
|
|
387
|
|
(4,563
|
)
|
(1,286
|
)
|
(4,127
|
)
|
(748
|
)
|
989
|
|
194,838
|
|
||||||||
|
Change during period
|
(49,881
|
)
|
8,351
|
|
—
|
|
8,772
|
|
(682
|
)
|
—
|
|
(203
|
)
|
(33,643
|
)
|
||||||||
|
Reclassified to operations
|
118
|
|
(5,218
|
)
|
—
|
|
—
|
|
—
|
|
—
|
|
—
|
|
(5,100
|
)
|
||||||||
|
Tax effect
|
373
|
|
(615
|
)
|
(15
|
)
|
4,723
|
|
82
|
|
—
|
|
—
|
|
4,548
|
|
||||||||
|
OCI
|
(49,390
|
)
|
2,518
|
|
(15
|
)
|
13,495
|
|
(600
|
)
|
—
|
|
(203
|
)
|
(34,195
|
)
|
||||||||
|
Balance at December 31, 2016
|
154,796
|
|
2,905
|
|
(4,578
|
)
|
12,209
|
|
(4,727
|
)
|
(748
|
)
|
786
|
|
160,643
|
|
||||||||
|
Change during period
|
182,791
|
|
(6,610
|
)
|
—
|
|
(678
|
)
|
(120
|
)
|
—
|
|
463
|
|
175,846
|
|
||||||||
|
Reclassified to operations
|
—
|
|
1,744
|
|
—
|
|
—
|
|
—
|
|
—
|
|
—
|
|
1,744
|
|
||||||||
|
Tax effect
|
559
|
|
1,312
|
|
—
|
|
57
|
|
8
|
|
—
|
|
—
|
|
1,936
|
|
||||||||
|
OCI
|
183,350
|
|
(3,554
|
)
|
—
|
|
(621
|
)
|
(112
|
)
|
—
|
|
463
|
|
179,526
|
|
||||||||
|
Balance at December 31, 2017
|
338,146
|
|
(649
|
)
|
(4,578
|
)
|
11,588
|
|
(4,839
|
)
|
(748
|
)
|
1,249
|
|
340,169
|
|
||||||||
|
Change during period
|
(90,309
|
)
|
(163
|
)
|
—
|
|
(5,408
|
)
|
429
|
|
—
|
|
18,691
|
|
(76,760
|
)
|
||||||||
|
Reclassified to operations
|
(4,254
|
)
|
536
|
|
—
|
|
—
|
|
—
|
|
—
|
|
—
|
|
(3,718
|
)
|
||||||||
|
Tax effect
|
3,779
|
|
(964
|
)
|
(940
|
)
|
15
|
|
(44
|
)
|
—
|
|
—
|
|
1,846
|
|
||||||||
|
OCI
|
(90,784
|
)
|
(591
|
)
|
(940
|
)
|
(5,393
|
)
|
385
|
|
—
|
|
18,691
|
|
(78,632
|
)
|
||||||||
|
Balance at December 31, 2018
|
247,362
|
|
(1,240
|
)
|
(5,518
|
)
|
6,195
|
|
(4,454
|
)
|
(748
|
)
|
19,940
|
|
261,537
|
|
||||||||
For the years ended
December 31, 2018
,
2017
and
2016
,
$0.5 million
,
$1.7 million
, and
$(5.2) million
, respectively, were reclassified from AOCI into service revenue in the consolidated statements of operations.
|
19
.
|
Non-Controlling Interests
|
Non-controlling interests’ share of equity in the accompanying consolidated balance sheets was
$944.0 million
and
$349.9 million
at
December 31, 2018
and
2017
, respectively. At
December 31, 2018
our material non-controlling interests were as follows:
|
Name of subsidiary
|
% Ownership held by
the Company
|
||
|
Lotterie Nazionali S.r.l. ("LN")
|
64.00
|
%
|
|
|
Northstar New Jersey Lottery Group, LLC ("Northstar NJ")
|
82.31
|
%
|
|
|
Lottoitalia S.r.l. ("Lottoitalia")
|
61.50
|
%
|
|
LN holds the Scratch & Win license in Italy. In December 2017, the Italian regulator exercised a
nine
-year contract extension option for the Scratch & Win license, extending the license through September 2028. LN was required to pay an upfront license fee of
€800 million
related to the extension, of which
€50 million
(
$59.3 million
) was paid in December 2017 and the remaining
€750 million
(
$878.1 million
) was paid in 2018.
Northstar NJ is a consolidated joint venture which is party to an agreement with the State of New Jersey, Department of the Treasury, Division of Purchase and Property and Division of Lottery (the "Division of Lottery") where Northstar NJ manages a wide range of the Division of Lottery’s marketing, sales, and related functions.
Lottoitalia holds a license for the operation of the Italian Gioco del Lotto game (the "Lotto License"). In March 2016, the Parent, through its subsidiary Lottomatica Holding S.r.l. ("Lottomatica"), Italian Gaming Holding a.s. ("IGH"), Arianna 2001 S.p.A. and Novomatic Italia S.p.A. (collectively the "Members") entered into a consortium ("Lottoitalia") to bid on the Lotto License. In May 2016, Lottoitalia was awarded management of the Lotto License for a
nine
-year term. Under the terms of the consortium agreement, Lottomatica is the principal operating partner fulfilling the requirements of the Lotto License.
In 2016 and 2017, the Members made capital contributions to Lottoitalia totaling
€908.2 million
on a pro rata basis based on each party’s equity ownership interest. These contributions financed
€770.0 million
in upfront license payments and upgrades to the technological infrastructure supporting the Lotto License. The upfront license payments made in 2016 and 2017 were as follows:
F-53
|
Year Paid
|
€
|
$
|
||||
|
2016
|
600.0
|
|
665.3
|
|
||
|
2017
|
170.0
|
|
185.4
|
|
||
|
770.0
|
|
850.7
|
|
|||
Ownership in Lottoitalia at
December 31, 2018
and
2017
is as follows:
|
Name of entity
|
% Ownership
|
||
|
Lottomatica
|
61.50
|
%
|
|
|
IGH
|
32.50
|
%
|
|
|
Arianna 2001 S.p.A.
|
4.00
|
%
|
|
|
Novomatic Italia S.p.A.
|
2.00
|
%
|
|
All annual profits of Lottoitalia are distributed to the Members within five business days of the approval of its annual financial statements. In addition, quarterly for a period of nine years beginning in 2017, Lottoitalia makes equal distributions of cash to the Members in an aggregate amount equal to that additional paid in surplus but excluding any reserves deriving from profits or retained earnings generated in previous quarters ("return of capital"). Each distribution of annual profits and return of capital will be made pro rata to the Members' ownership interest in Lottoitalia.
In connection with the formation of Lottoitalia, Lottomatica entered into an agreement with IGH in May 2016, which contains a deadlock put/call option in which IGH has the right, at its discretion, to sell its interest in Lottoitalia to Lottomatica and Lottomatica has a reciprocal call right, in the event of certain specified events as defined in the agreement. The put/call options expire 60 days following written notice by either party following the applicable event. The strike price of the options is determined based on a specified formula as defined in the agreement.
The agreement with IGH also contained an underperformance put option within the control of IGH. On April 3, 2018, the underperformance put option expired unexercised and the redeemable non-controlling interest of
$377.2 million
(which included
$20.3 million
of income allocated to IGH during the first quarter of 2018) was reclassified to non-controlling interest within shareholders' equity.
The following table reconciles the activity in IGH's redeemable non-controlling interest in
2017
:
|
For the year ended
December 31, |
|||
|
($ thousands)
|
2017
|
||
|
Balance at beginning of year
|
223,141
|
|
|
|
Capital contribution
|
107,457
|
|
|
|
Income allocated to IGH
|
65,665
|
|
|
|
Dividend paid
|
(7,307
|
)
|
|
|
Return of capital
|
(32,039
|
)
|
|
|
Balance at end of year
|
356,917
|
|
|
F-54
|
20
.
|
Variable Interest Entities
|
We consolidate variable interest entities ("VIE") in which we are the primary beneficiary. In determining whether we are the primary beneficiary, we evaluate whether we have the power to direct the activities of the VIE that most significantly impact economic performance and whether we have the right to receive benefits or the obligation to absorb losses that could potentially be significant to the VIE.
We consolidate VIEs because we have the power to direct the activities that significantly affect the VIEs economic performance, typically because of our role as the principal operating partner for the VIE, and because of the risk and rewards of our investment. As of December 31, 2018 and 2017, our consolidated VIEs consist of LN, Northstar NJ, and Lottoitalia.
The carrying amounts and classification of the VIE's assets and liabilities in our consolidated balance sheets at
December 31, 2018
and
2017
are as follows:
|
December 31,
|
||||||
|
($ thousands)
|
2018
|
2017
|
||||
|
Current assets
|
890,664
|
|
773,272
|
|
||
|
Non-current assets
|
1,924,277
|
|
2,261,916
|
|
||
|
Total assets
|
2,814,941
|
|
3,035,188
|
|
||
|
Total liabilities
|
389,853
|
|
1,356,207
|
|
||
|
21
.
|
Segment Information
|
The structure of our internal organization is customer-facing aligned around
four
segments operating in
three
regions as follows:
|
•
|
North America Gaming and Interactive
|
|
•
|
North America Lottery
|
|
•
|
International
|
|
•
|
Italy
|
We monitor the operating results of our segments separately for the purpose of making decisions about resource allocation and performance assessment. Segment performance is evaluated based on operating income. Segment accounting policies are consistent with those of the consolidated financial statements.
Corporate support expenses, which are not allocated to the segments, are principally composed of selling, general and administrative expenses and other expenses that are managed at the corporate level, including restructuring, transaction, corporate headquarters and Board expenses.
Purchase accounting principally represents the depreciation and amortization of acquired tangible and intangible assets in connection with acquired companies.
Long-lived assets are composed of Systems & Equipment and PPE.
F-55
Segment information is as follows ($ thousands):
|
For the year ended
December 31, 2018 |
North
America
Gaming and
Interactive
|
North
America
Lottery
|
International
|
Italy
|
Operating
Segment
Total
|
Corporate
Support
|
Purchase
Accounting
|
Total
|
||||||||||||||||
|
Service revenue
|
624,476
|
|
1,111,069
|
|
495,497
|
|
1,814,549
|
|
4,045,591
|
|
—
|
|
723
|
|
4,046,314
|
|
||||||||
|
Product sales
|
378,693
|
|
80,833
|
|
324,486
|
|
930
|
|
784,942
|
|
—
|
|
—
|
|
784,942
|
|
||||||||
|
Total revenue
|
1,003,169
|
|
1,191,902
|
|
819,983
|
|
1,815,479
|
|
4,830,533
|
|
—
|
|
723
|
|
4,831,256
|
|
||||||||
|
Operating income (loss)
|
218,860
|
|
296,527
|
|
142,077
|
|
541,254
|
|
1,198,718
|
|
(226,231
|
)
|
(325,496
|
)
|
646,991
|
|
||||||||
|
Depreciation and amortization
|
105,295
|
|
152,135
|
|
62,688
|
|
161,758
|
|
481,876
|
|
14,495
|
|
209,089
|
|
705,460
|
|
||||||||
|
Expenditures for long-lived assets
|
(150,440
|
)
|
(163,912
|
)
|
(60,456
|
)
|
(93,252
|
)
|
(468,060
|
)
|
(9,719
|
)
|
—
|
|
(477,779
|
)
|
||||||||
|
Long-lived assets
(at year end)
|
287,795
|
|
717,223
|
|
217,760
|
|
366,997
|
|
1,589,775
|
|
—
|
|
—
|
|
1,589,775
|
|
||||||||
|
Total assets (at year end)
|
3,655,694
|
|
2,467,487
|
|
2,807,234
|
|
4,505,689
|
|
13,436,104
|
|
212,398
|
|
—
|
|
13,648,502
|
|
||||||||
|
For the year ended
December 31, 2017 |
North
America Gaming and Interactive |
North
America Lottery |
International
|
Italy
|
Operating
Segment
Total |
Corporate
Support |
Purchase
Accounting |
Total
|
||||||||||||||||
|
Service revenue
|
780,633
|
|
1,093,048
|
|
557,049
|
|
1,703,901
|
|
4,134,631
|
|
1,203
|
|
722
|
|
4,136,556
|
|
||||||||
|
Product sales
|
377,065
|
|
92,174
|
|
332,015
|
|
1,149
|
|
802,403
|
|
—
|
|
—
|
|
802,403
|
|
||||||||
|
Total revenue
|
1,157,698
|
|
1,185,222
|
|
889,064
|
|
1,705,050
|
|
4,937,034
|
|
1,203
|
|
722
|
|
4,938,959
|
|
||||||||
|
Operating income (loss)
|
278,963
|
|
289,025
|
|
163,799
|
|
478,540
|
|
1,210,327
|
|
(197,089
|
)
|
(1,064,330
|
)
|
(51,092
|
)
|
||||||||
|
Depreciation and amortization
|
81,355
|
|
129,517
|
|
66,745
|
|
161,484
|
|
439,101
|
|
11,554
|
|
351,785
|
|
802,440
|
|
||||||||
|
Expenditures for long-lived assets
|
(147,175
|
)
|
(204,104
|
)
|
(77,815
|
)
|
(188,013
|
)
|
(617,107
|
)
|
(3,964
|
)
|
—
|
|
(621,071
|
)
|
||||||||
|
Long-lived assets
(at year end)
|
271,833
|
|
666,627
|
|
292,962
|
|
396,495
|
|
1,627,917
|
|
—
|
|
—
|
|
1,627,917
|
|
||||||||
|
Total assets (at year end)
|
3,683,258
|
|
2,460,676
|
|
3,038,806
|
|
4,900,130
|
|
14,082,870
|
|
1,076,338
|
|
—
|
|
15,159,208
|
|
||||||||
|
For the year ended
December 31, 2016 |
North
America Gaming and Interactive |
North
America Lottery |
International
|
Italy
|
Operating
Segment
Total |
Corporate
Support |
Purchase
Accounting |
Total
|
||||||||||||||||
|
Service revenue
|
975,206
|
|
1,128,306
|
|
512,668
|
|
1,759,843
|
|
4,376,023
|
|
—
|
|
(437
|
)
|
4,375,586
|
|
||||||||
|
Product sales
|
398,248
|
|
65,269
|
|
314,637
|
|
1,295
|
|
779,449
|
|
—
|
|
(1,139
|
)
|
778,310
|
|
||||||||
|
Total revenue
|
1,373,454
|
|
1,193,575
|
|
827,305
|
|
1,761,138
|
|
5,155,472
|
|
—
|
|
(1,576
|
)
|
5,153,896
|
|
||||||||
|
Operating income (loss)
|
349,275
|
|
299,182
|
|
142,200
|
|
583,504
|
|
1,374,161
|
|
(245,600
|
)
|
(468,125
|
)
|
660,436
|
|
||||||||
|
Depreciation and amortization
|
86,380
|
|
143,941
|
|
50,879
|
|
150,736
|
|
431,936
|
|
12,481
|
|
438,052
|
|
882,469
|
|
||||||||
|
Expenditures for long-lived assets
|
(132,297
|
)
|
(148,641
|
)
|
(97,957
|
)
|
(91,834
|
)
|
(470,729
|
)
|
(3,460
|
)
|
—
|
|
(474,189
|
)
|
||||||||
|
Long-lived assets
(at year end)
|
394,233
|
|
603,927
|
|
284,276
|
|
275,079
|
|
1,557,515
|
|
—
|
|
—
|
|
1,557,515
|
|
||||||||
|
Total assets (at year end)
|
5,577,491
|
|
2,396,557
|
|
3,021,448
|
|
3,724,856
|
|
14,720,352
|
|
339,810
|
|
—
|
|
15,060,162
|
|
||||||||
In connection with the June 2017 sale of DoubleDown, we recorded a
$783.8 million
reduction in assets in the North America Gaming and Interactive segment, principally composed of goodwill and intangible assets.
F-56
Geographical Information
Revenue from external customers, which is based on the geographical location of our customers, is as follows:
|
|
December 31,
|
||||||||
|
($ thousands)
|
2018
|
2017
|
2016
|
||||||
|
United States
|
2,063,477
|
|
2,195,791
|
|
2,472,013
|
|
|||
|
Italy
|
1,824,004
|
|
1,728,472
|
|
1,778,750
|
|
|||
|
United Kingdom
|
59,062
|
|
74,567
|
|
82,271
|
|
|||
|
Rest of Europe
|
312,484
|
|
383,170
|
|
302,388
|
|
|||
|
All other
|
572,229
|
|
556,959
|
|
518,474
|
|
|||
|
Total
|
4,831,256
|
|
4,938,959
|
|
5,153,896
|
|
|||
Revenue from a customer in the Italy segment represented
16.4%
,
14.6%
and
16.3%
of consolidated revenue in
2018
,
2017
and
2016
, respectively.
Long-lived assets based on the geographical location of the assets are as follows:
|
|
December 31,
|
|||||
|
($ thousands)
|
2018
|
2017
|
||||
|
United States
|
993,615
|
|
938,925
|
|
||
|
Italy
|
332,378
|
|
366,990
|
|
||
|
United Kingdom
|
26,256
|
|
43,379
|
|
||
|
Rest of Europe
|
115,345
|
|
117,508
|
|
||
|
All other
|
122,181
|
|
161,115
|
|
||
|
Total
|
1,589,775
|
|
1,627,917
|
|
||
F-57
|
22
.
|
Stock-Based Compensation
|
Incentive Awards
Stock-based incentive awards are provided to directors and employees under the terms of our 2015 Equity Incentive Plan (the "Plan") as administered by the Board. Awards available under the Plan principally include stock options, performance share units, restricted share units or any combination thereof. The maximum number of shares that may be granted under the Plan is
11.5 million
shares. To the extent any award is forfeited, expires, lapses, or is settled for cash, the award is available for reissue under the Plan. We utilize authorized and unissued shares to satisfy all shares issued under the Plan.
Stock Options
Stock options are awards that allow the employee to purchase shares of our stock at a fixed price. Stock options are granted under the Plan at an exercise price not less than the fair market value of a share on the date of grant. In 2018, stock options were granted solely to our Chief Executive Officer, which will vest in 2021 subject to certain performance and other criteria, and have a contractual term of approximately
six
years.
No
stock options were granted in 2017 or 2016.
Stock Awards
Stock awards are principally made in the form of performance share units ("PSUs") and restricted share units ("RSUs"). PSUs are stock awards where the number of shares ultimately received by the employee depends on the Company’s performance against specified targets. PSUs typically vest
50%
over an approximate
three
-year period and
50%
over an approximate
four
-year period. Dividend equivalents are not paid under the Plan. The fair value of each PSU is determined on the grant date, based on the Company’s stock price, adjusted for the exclusion of dividend equivalents, and assumes that performance targets will be achieved. Over the performance period, the number of shares of stock that will be issued is adjusted based upon the probability of achievement of performance targets. The ultimate number of shares issued and the related compensation cost recognized as expense is based on a comparison of the final performance metrics to the specified targets.
RSUs are stock awards granted to directors that entitle the holder to shares of common stock as the award vests, typically over a
one
-year period, and have a contractual term of
10 years
. Dividend equivalents are not paid under the Plan.
Stock Option Activity
A summary of our stock option activity and related information is as follows:
|
|
|
Weighted Average
|
|
||||||||
|
Stock
Options
|
Exercise Price Per Share ($)
|
Remaining Contractual Term (in years)
|
Aggregate Intrinsic Value ($ thousands)
|
||||||||
|
Outstanding at January 1, 2018
|
2,192,707
|
|
19.76
|
|
|
|
|
||||
|
Granted
|
172,500
|
|
30.12
|
|
|||||||
|
Exercised
|
(549,986
|
)
|
18.73
|
|
|
|
|
||||
|
Expired
|
(29,838
|
)
|
20.28
|
|
|
|
|
||||
|
Outstanding at December 31, 2018
|
1,785,383
|
|
21.07
|
|
1.72
|
|
|
||||
|
At December 31, 2018:
|
|
|
|
|
|
|
|
||||
|
Vested and expected to vest
|
1,785,383
|
|
21.07
|
|
1.72
|
—
|
|
||||
|
Exercisable
|
1,612,883
|
|
20.10
|
|
1.33
|
—
|
|
||||
The total intrinsic value of stock options exercised was
$6.0 million
,
$9.3 million
and
$7.8 million
in
2018
,
2017
and
2016
, respectively. The total cash proceeds from stock options exercised was
$12.7 million
in
2016
. There were
no
cash proceeds from stock options exercised in
2018
and
2017
.
F-58
Fair Value of Stock Options Granted
We estimate the fair value of stock options at the date of grant using a valuation model that incorporates key inputs and assumptions as detailed in the table below. The weighted average grant date fair value of stock options granted during 2018 was
$6.84
per share.
|
|
2018
|
||
|
Valuation model
|
Monte Carlo
|
|
|
|
Exercise price ($)
|
30.12
|
|
|
|
Expected option term (in years)
|
2.83
|
|
|
|
Expected volatility of the Company’s stock (%)
|
35.00
|
|
|
|
Risk-free interest rate (%)
|
2.73
|
|
|
|
Dividend yield (%)
|
2.66
|
|
|
The expected volatility assumes the historical volatility is indicative of future trends, which may not be the actual outcome. The expected option term is based on historical data and is not necessarily indicative of exercise patterns that may occur. Estimates of fair value are not intended to predict actual future events or the value ultimately realized by employees who receive equity awards, and subsequent events are not indicative of the reasonableness of our original estimates of fair value.
Stock Award Activity
A summary of our stock award activity and related information is as follows:
|
PSUs
|
Weighted Average Grant Date Fair Value ($)
|
RSUs
|
Weighted Average Grant Date Fair Value ($)
|
|||||||||
|
Nonvested at January 1, 2018
|
4,083,499
|
|
16.35
|
|
106,223
|
|
21.00
|
|
||||
|
Granted
|
1,564,083
|
|
28.93
|
|
68,142
|
|
30.23
|
|
||||
|
Vested
|
(882,426
|
)
|
20.95
|
|
(114,452
|
)
|
21.67
|
|
||||
|
Forfeited
|
(495,109
|
)
|
26.35
|
|
—
|
|
—
|
|
||||
|
Nonvested at December 31, 2018
|
4,270,047
|
|
25.79
|
|
59,913
|
|
30.21
|
|
||||
|
At December 31, 2018:
|
|
|
|
|
|
|
|
|
||||
|
Unrecognized cost for nonvested awards ($ thousands)
|
46,820
|
|
|
|
677
|
|
|
|
||||
|
Weighted average future recognition period (in years)
|
2.05
|
|
|
|
0.37
|
|
|
|
||||
The total vest-date fair value of PSUs vested was
$24.6 million
,
$28.8 million
and
$8.4 million
in
2018
,
2017
and
2016
, respectively. The total vest-date fair value of RSUs vested was
$3.4 million
,
$2.8 million
and
$15.9 million
for
2018
,
2017
and
2016
, respectively.
Fair Value of Stock Awards Granted
We estimated the fair value of PSUs at the date of grant using a Monte Carlo simulation valuation model, as the award includes a market condition.
During
2018
,
2017
and
2016
, we estimated the fair value of RSUs at the date of grant based on our stock price. Details of the grants are as follows:
|
|
2018
|
2017
|
2016
|
||||||
|
PSUs granted during the year
|
1,564,083
|
|
1,723,730
|
|
1,788,050
|
|
|||
|
Weighted average grant date fair value ($)
|
28.93
|
|
17.74
|
|
21.08
|
|
|||
|
RSUs granted during the year
|
68,142
|
|
117,745
|
|
117,551
|
|
|||
|
Weighted average grant date fair value ($)
|
30.23
|
|
21.12
|
|
19.14
|
|
|||
F-59
Modifications
2018
During the first quarter of 2018, we modified the measurement of a performance condition for the outstanding PSUs granted in 2015, as the original vesting conditions were not expected to be satisfied. The modification affected
301
employees and resulted in
$13.2 million
of compensation cost for the year ended December 31, 2018.
During the third quarter of 2018, we modified the measurement of a performance condition for the outstanding PSUs granted in 2016 and 2017, in order to better align the performance conditions with the PSUs granted in 2018. The modification affected
473
employees and resulted in
$10.6 million
of compensation cost for the year ended December 31, 2018.
2017
During the second quarter of 2017, we modified the measurement of a performance condition for the PSUs granted in 2016. The modification affected
974
employees but did not result in any incremental compensation cost.
Stock-Based Compensation Expense
Total compensation cost for our stock-based compensation plans is recorded based on the employees’ respective functions as detailed below.
|
|
For the year ended December 31,
|
||||||||
|
($ thousands)
|
2018
|
2017
|
2016
|
||||||
|
Cost of services
|
1,923
|
|
26
|
|
1,302
|
|
|||
|
Cost of product sales
|
445
|
|
(8
|
)
|
330
|
|
|||
|
Selling, general and administrative
|
27,702
|
|
4,628
|
|
22,304
|
|
|||
|
Research and development
|
3,016
|
|
58
|
|
2,410
|
|
|||
|
Stock-based compensation expense before income taxes
|
33,086
|
|
4,704
|
|
26,346
|
|
|||
|
Income tax benefit
|
7,562
|
|
975
|
|
7,846
|
|
|||
|
Total stock-based compensation, net of tax
|
25,524
|
|
3,729
|
|
18,500
|
|
|||
|
23
.
|
Impairment Loss
|
Impairment loss was recorded for the assets detailed below:
|
December 31,
|
|||||||||
|
2018
|
2017
|
2016
|
|||||||
|
Goodwill
|
118,000
|
|
714,000
|
|
—
|
|
|||
|
Intangible assets, net
|
—
|
|
—
|
|
30,000
|
|
|||
|
Other
|
2,407
|
|
1,220
|
|
7,744
|
|
|||
|
120,407
|
|
715,220
|
|
37,744
|
|
||||
Goodwill
As a result of the change in the date of our annual impairment test, we performed two impairment tests during the fourth quarter of 2018 (November 1 and December 31) which resulted in a
$118.0 million
non-cash impairment loss with no income tax benefit and reduced the carrying amount of our International reporting unit to fair value. The Company determined that there was an impairment in the International reporting unit’s goodwill due to the results of 2018 being lower than forecasted along with a higher weighted average cost of capital.
During the third quarter of 2017, we determined that the North America Gaming and Interactive reporting unit's long-term strategy of improving content and game performance to stabilize and then grow market share was taking longer than expected which resulted in us performing an interim goodwill impairment test. As a result of the interim test, we recorded a
$714.0 million
non-cash impairment loss with no income tax benefit to reduce the carrying amount of this reporting unit to fair value.
F-60
Our assessment of goodwill for impairment includes various inputs, such as cash flow projections. In calculating the fair value of our reporting units using the income approach, we used projections of revenues, operating costs and capital expenditures. The projected cash flows considered historical and estimated future results and general economic and market conditions, as well as the impact of planned business and operational strategies. As a result, the Company classified the International and North America Gaming and Interactive reporting unit measured at fair value on a nonrecurring basis within Level 3 of the fair value hierarchy.
Intangible Assets, Net
Based on the results of our annual indefinite-lived intangible asset impairment test, in the fourth quarter of 2016 we recorded a
$30.0 million
non-cash impairment loss in our North America Gaming and Interactive segment for certain trademarks relating to the forecasted slowing of growth in the social gaming market. We used the Relief from Royalty method to determine the amount of the loss.
|
24
.
|
Other (Expense) Income, Net
|
The components of other (expense) income, net are as follows:
|
|
For the year ended December 31,
|
||||||||
|
($ thousands)
|
2018
|
2017
|
2016
|
||||||
|
Tender and redemption premium
|
(48,935
|
)
|
(37,793
|
)
|
—
|
|
|||
|
Unamortized debt issuance costs
|
(7,059
|
)
|
(7,307
|
)
|
—
|
|
|||
|
Swap
|
(443
|
)
|
4,532
|
|
(5,220
|
)
|
|||
|
Unamortized debt premium
|
3,089
|
|
12,394
|
|
—
|
|
|||
|
Other
|
(1,559
|
)
|
(3,419
|
)
|
—
|
|
|||
|
Total debt related
|
(54,907
|
)
|
(31,593
|
)
|
(5,220
|
)
|
|||
|
Gain on sale of available-for-sale investment
|
—
|
|
—
|
|
20,365
|
|
|||
|
Other
|
300
|
|
(1,800
|
)
|
3,220
|
|
|||
|
|
(54,607
|
)
|
(33,393
|
)
|
18,365
|
|
|||
Debt Related
During 2018, we completed the following debt transactions, which resulted in a
$54.4 million
loss on extinguishment of debt for the year ended December 31, 2018:
|
•
|
Repurchased a portion of the 4.125% Notes;
|
|
•
|
Repurchased a portion of the 4.750% Notes;
|
|
•
|
Redeemed the 5.625% Notes;
|
|
•
|
Redeemed the remaining 7.500% Notes; and
|
|
•
|
Redeemed a portion of the 5.500% Notes.
|
In 2017, we purchased of a portion of the
7.500%
Notes which resulted in a
$25.7 million
loss on extinguishment of debt for the year ended December 31, 2017.
Further details of these transactions are disclosed in Note
14
,
Debt.
Gain on sale of available-for-sale investment
In 2016, we sold an available-for-sale investment in the Italy segment for approximately
$23.9 million
and recognized a gain on sale of
$20.4 million
.
F-61
|
25
.
|
Earnings Per Share
|
The following table presents the computation of basic and diluted (loss) earnings per share:
|
|
For the year ended December 31,
|
||||||||
|
($ and shares in thousands, except per share amounts)
|
2018
|
2017
|
2016
|
||||||
|
Numerator:
|
|
|
|
|
|
|
|||
|
Net (loss) income attributable to IGT PLC
|
(21,350
|
)
|
(1,068,576
|
)
|
211,337
|
|
|||
|
Denominator:
|
|
|
|
|
|
|
|||
|
Weighted-average shares - basic
|
204,083
|
|
203,130
|
|
201,511
|
|
|||
|
Incremental shares under stock based compensation plans
|
—
|
|
—
|
|
703
|
|
|||
|
Weighted-average shares - diluted
|
204,083
|
|
203,130
|
|
202,214
|
|
|||
|
Basic (loss) earnings per share attributable to IGT PLC
|
(0.10
|
)
|
(5.26
|
)
|
1.05
|
|
|||
|
Diluted (loss) earnings per share attributable to IGT PLC
|
(0.10
|
)
|
(5.26
|
)
|
1.05
|
|
|||
Certain stock options to purchase common shares were outstanding, but were excluded from the computation of diluted earnings per share, because the exercise price of the options was greater than the average market price of the common shares for the full year, and therefore, the effect would have been antidilutive.
During years when we are in a net loss position, certain outstanding stock options and unvested restricted stock awards are excluded from the computation of diluted earnings per share because including them would have had an antidilutive effect.
For the years ended
December 31, 2018
and
2017
,
1.6 million
and
0.4 million
stock options and unvested restricted stock awards, respectively, were excluded from the computation of diluted earnings per share because including them would have had an antidilutive effect.
No
stock options or unvested restricted stock awards were excluded from the computation in
2016
.
|
26
.
|
Related Party Transactions
|
We engage in business transactions with certain related parties which include (i) entities and individuals capable of exercising control, joint control, or significant influence over us, (ii) De Agostini S.p.A. ("De Agostini") or entities directly or indirectly controlled by De Agostini and (iii) our unconsolidated subsidiaries or joint ventures. Members of our Board of Directors, executives with authority for planning, directing and controlling the activities of the Company and such Directors' and executives' close family members are also considered related parties. We may make investments in such entities, enter into transactions with such entities, or both.
Investments in and Material Transactions with Related Parties
From time to time, we make strategic investments in publicly traded and privately held companies that develop software, hardware, and other technologies or provide services supporting its technologies. We may also purchase from or make sales to these organizations.
Ringmaster S.r.l.
We have a
50%
interest in Ringmaster S.r.l., an Italian joint venture, that is accounted for using the equity method of accounting. Ringmaster S.r.l. provides software development services for our interactive gaming business pursuant to an agreement dated December 7, 2011.
Telling IGT Information Technology (Shenzhen) Co. Ltd
We have a
49%
interest in Telling IGT Information Technology (Shenzhen) Co. Ltd. ("Telling"), a Chinese joint venture, that is accounted for using the equity method of accounting. Telling was formed to provide innovative lottery products to regulated lottery centers in the People’s Republic of China. In addition to providing innovative lottery products, Telling will have the capability to conduct independent market operations, business development, and technological innovations in China. We had no material investments in Telling at December 31, 2018 and 2017.
F-62
Yeonama Holdings Co. Limited and OPAP S.A.
We have a
30%
interest in Yeonama, which is accounted for at cost. Yeonama is a shareholder in Emma Delta Limited, the fund that holds a
33%
interest in OPAP, the Greek gaming and sports betting operator. Marco Sala, our Chief Executive Officer and a Board member, is a member of the board of directors of OPAP. We provide sports betting and player account management systems to Horse Races S.A., a wholly-owned subsidiary of OPAP. We are also a technology provider of VLT central systems directly to OPAP.
Our investment in Yeonama was
$22.0 million
and
$23.1 million
at
December 31, 2018
and
2017
, respectively.
Connect Ventures One LP and Connect Ventures Two LP
We have held investments in Connect Ventures One LP and Connect Ventures Two LP (the "Connect Ventures") since 2011 and 2015, respectively, that are accounted for as available-for-sale investments. De Agostini also holds investments in the Connect Ventures, and Nicola Drago, the son of director Marco Drago, holds a
10%
ownership interest in Connect Ventures LLP, the fund that manages the Connect Ventures. He is also a non-executive member of with no profit shares in Connect Ventures LLP. The Connect Ventures are venture capital funds that target "early stage" investment operations.
Our investment in Connect Ventures One LP was
$4.3 million
and
$4.7 million
at
December 31, 2018
and
2017
, respectively. Our investment in Connect Ventures Two LP was
$5.3 million
and
$3.8 million
at
December 31, 2018
and
2017
, respectively.
De Agostini Group
We are majority owned by De Agostini. Amounts receivable from De Agostini and subsidiaries of De Agostini (the "De Agostini Group") are non-interest bearing. Transactions with the De Agostini Group include payments for support services provided and office space rented pursuant to a lease entered into prior to the formation of the Company. In addition, certain of our Italian subsidiaries have a tax unit agreement with De Agostini pursuant to which De Agostini consolidates certain Italian subsidiaries of De Agostini for the collection and payment of taxes to the Italian tax authority.
On May 22, 2018, De Agostini entered into a variable forward transaction (the "Variable Forward Transaction") with Credit Suisse International ("Credit Suisse") relating to
18.0 million
of our ordinary shares owned by De Agostini. As part of the Variable Forward Transaction, to hedge its exposure, Credit Suisse or its affiliates borrowed approximately
13.2 million
of our ordinary shares from third-party stock lenders and subsequently sold such ordinary shares in an underwritten public offering through Credit Suisse Securities (USA) LLC, acting as the underwriter, pursuant to an automatically effective registration statement on Form F-3 (including a base prospectus) filed by the Company with the SEC on May 21, 2018 (the "Registration Statement").
We were not a party to the Variable Forward Transaction, did not issue or sell any ordinary shares in connection with the Variable Forward Transaction, and did not receive any proceeds from the sale of the ordinary shares in the Variable Forward Transaction. De Agostini agreed to reimburse us for certain costs and fees incurred by us in connection with the Variable Forward Transaction and the preparation and filing of the Registration Statement. As of
December 31, 2018
, a
$1.9 million
receivable from De Agostini for the reimbursement of such costs and fees was included in trade and other receivables, net in the consolidated balance sheet.
F-63
Summary of Material Related Party Transactions
Amounts receivable from and payable to related parties pursuant to material related party transactions are as follows:
|
|
December 31,
|
|||||
|
($ thousands)
|
2018
|
2017
|
||||
|
Trade receivables
|
||||||
|
OPAP S.A.
|
2,761
|
|
6,888
|
|
||
|
De Agostini Group
|
1,898
|
|
65
|
|
||
|
Total related party receivables
|
4,659
|
|
6,953
|
|
||
|
Tax related trade payables
|
||||||
|
De Agostini Group
|
12,454
|
|
19,673
|
|
||
|
Trade payables
|
||||||
|
De Agostini Group
|
8,131
|
|
10,974
|
|
||
|
Ringmaster S.r.l.
|
5,682
|
|
6,404
|
|
||
|
Total related party payables
|
26,267
|
|
37,051
|
|
||
The following table sets forth material transactions with related parties:
|
|
For the year ended December 31,
|
||||||||
|
($ thousands)
|
2018
|
2017
|
2016
|
||||||
|
Service revenue and product sales
|
|
|
|
|
|
|
|||
|
OPAP S.A.
|
14,101
|
|
37,512
|
|
4,437
|
|
|||
|
|
14,101
|
|
37,512
|
|
4,437
|
|
|||
|
Research and development expenses
|
|
|
|
|
|
|
|||
|
Ringmaster S.r.l.
|
10,412
|
|
10,940
|
|
9,535
|
|
|||
|
|
10,412
|
|
10,940
|
|
9,535
|
|
|||
F-64
TABLE OF CONTENTS
Part IItem 1. Identity Of Directors, Senior Management and AdvisersItem 2. Offer Statistics and Expected TimetableItem 3. Key InformationItem 4. Information on The CompanyItem 4A. Unresolved Staff CommentsItem 5. Operating and Financial Review and ProspectsItem 6. Directors, Senior Management and EmployeesItem 7. Major Shareholders and Related Party TransactionsItem 8. Financial InformationItem 9. The Offer and ListingItem 10. Additional InformationItem 11. Quantitative and Qualitative Disclosures About Market RiskItem 12. Description Of Securities Other Than Equity SecuritiesPart IIItem 13. Defaults, Dividends Arrearages and DelinquenciesItem 14. Material Modifications To The Rights Of Security Holders and Use Of ProceedsItem 15. Controls and ProceduresItem 16A. Audit Committee Financial ExpertItem 16B. Code Of EthicsItem 16C. Principal Accountant Fees and ServicesItem 16D. Exemptions From The Listing Standards For Audit CommitteesItem 16E. Purchases Of Equity Securities By The Issuer and Affiliated PurchasersItem 16F. Change in Registrant S Certifying AccountantItem 16G. Corporate GovernanceItem 16H. Mine Safety DisclosurePart IIIItem 17. Financial StatementsItem 18. Financial StatementsItem 19. ExhibitsItem 18. Financial Statements