UNITED STATES
SECURITIES AND EXCHANGE COMMISSION
Washington, D.C. 20549
FORM 10-
K
|
ý
|
ANNUAL REPORT PURSUANT TO SECTION 13 OR 15(d) OF THE SECURITIES EXCHANGE ACT OF 1934
|
For the fiscal
year ended
December 31, 2018
OR
|
o
|
TRANSITION REPORT PURSUANT TO SECTION 13 OR 15(d) OF THE SECURITIES EXCHANGE ACT OF 1934
|
For the transition period from
to
Commission File Number: 001-38377
|
COLONY CREDIT REAL ESTATE, INC.
(Exact Name of Registrant as Specified in Its Charter)
|
||||
|
Maryland
|
38-4046290
|
|||
|
(State or Other Jurisdiction of
Incorporation or Organization)
|
(I.R.S. Employer
Identification No.)
|
|||
515 S. Flower Street, 44th Floor
Los Angeles, CA 90071
(Address of Principal Executive Offices, Including Zip Code)
(310) 282-8820
(Registrant’s Telephone Number, Including Area Code)
Securities registered pursuant to Section 12(b) of the Act:
|
Class A common stock, par value
$0.01 per share
|
New York Stock Exchange
|
|
|
(Title of each class)
|
(Name of exchange on which registered)
|
|
Securities registered pursuant to Section 12(g) of the Act: None
Indicate by check mark if the registrant is a well-known seasoned issuer, as defined in Rule 405 of the Securities Act.
Yes
ý
No
¨
Indicate by check mark if the registrant is not required to file reports pursuant to Section 13 or Section 15(d) of the Act. Yes
¨
No
ý
Indicate by check mark whether the registrant (1) has filed all reports required to be filed by Section 13 or 15(d) of the Securities Exchange Act of 1934 during the preceding 12 months (or for such shorter period that the registrant was required to file such reports), and (2) has been subject to such filing requirements for the past 90 days. Yes
ý
No
o
Indicate by check mark whether the registrant has submitted electronically every Interactive Data File required to be submitted pursuant to Rule 405 of Regulation S-T (§232.405 of this chapter) during the preceding 12 months (or for such shorter period that the registrant was required to submit such files). Yes
ý
No
o
Indicate by check mark if disclosure of delinquent filers pursuant to Item 405 of Regulation S-K is not contained herein, and will not be contained, to the best of the registrant’s knowledge, in definitive proxy or information statements incorporated by reference in Part III of this Form 10-K or any amendment to this Form 10-K.
ý
Indicate by check mark whether the registrant is a large accelerated filer, an accelerated filer, a non-accelerated filer, smaller reporting company, or an emerging growth company. See the definitions of “large accelerated filer,” “accelerated filer,” “smaller
reporting company,” and “emerging growth company” in Rule 12b-2 of the Exchange Act. (Check one):
|
Large accelerated filer
ý
|
Accelerated filer
o
|
Non-accelerated filer
|
Smaller reporting company
o
Emerging growth company
o
|
|||
If an emerging growth company, indicate by check mark if the registrant has elected not to use the extended transition period for complying with any new or revised financial accounting standards provided pursuant to Section 13(a) of the Exchange Act.
o
Indicate by check mark whether the registrant is a shell company (as defined in Rule 12b-2 of the Exchange Act). Yes
o
No
ý
Indicate the number of shares outstanding of each of the registrant’s classes of common stock, as of the latest practicable date:
The aggregate market value of the registrant’s voting and non-voting common equity held by non-affiliates of the registrant as of June 30, 2018, was approximately
$1.71 billion
. As of
February 26, 2019
, Colony Credit Real Estate, Inc. had
127,809,820
shares of Class A common stock, par value $0.01 per share, outstanding.
DOCUMENTS INCORPORATED BY REFERENCE
Portions of the Company’s Proxy Statement with respect to its 2019 Annual Meeting of Stockholders to be filed not later than 120 days after the end of the Company’s fiscal year ended
December 31, 2018
are incorporated by reference into Part III of this Annual Report on Form 10-K.
EXPLANATORY NOTE
This Annual Report on Form 10-K of Colony Credit Real Estate, Inc., a Maryland corporation (the “Company”), includes the financial statements and other financial information of (i) the Company and (ii) the Company’s accounting predecessor, which are investment entities in which Colony Capital Operating Company, LLC (“CLNY OP”) or its subsidiaries owned interests ranging from approximately 38% to 100% and that were contributed to the Company on January 31, 2018 in connection with the closing of the Combination (as defined below) and certain intercompany balances between those entities and CLNY OP or its subsidiaries (the “CLNY Investment Entities”).
On January 31, 2018, the Company completed the transactions contemplated by that certain Master Combination Agreement, dated as of August 25, 2017, as amended and restated on November 20, 2017 (the “Combination Agreement”), by and among (i) the Company, (ii) Credit RE Operating Company, LLC, a Delaware limited liability company and wholly-owned subsidiary of the Company (the “OP”), (iii) CLNY OP, a Delaware limited liability company and the operating company of Colony Capital, Inc., formerly Colony NorthStar, Inc. (“Colony Capital”), a Maryland corporation, (iv) NRF RED REIT Corp., a Maryland corporation and indirect subsidiary of CLNY OP (“RED REIT”), (v) NorthStar Real Estate Income Trust, Inc., a Maryland corporation (“NorthStar I”), (vi) NorthStar Real Estate Income Trust Operating Partnership, LP, a Delaware limited partnership and the operating partnership of NorthStar I (“NorthStar I OP”), (vii) NorthStar Real Estate Income II, Inc., a Maryland corporation (“NorthStar II”), and (viii) NorthStar Real Estate Income Operating Partnership II, LP, a Delaware limited partnership and the operating partnership of NorthStar II (“NorthStar II OP”).
Pursuant to the Combination Agreement, (i) CLNY OP contributed and conveyed to the Company a select portfolio of assets and liabilities (the “CLNY Contributed Portfolio”) of CLNY OP (the “CLNY OP Contribution”), (ii) RED REIT contributed and conveyed to the OP a select portfolio of assets and liabilities of RED REIT (the “RED REIT Contribution” and, together with the CLNY OP Contribution, the “CLNY Contributions”), (iii) NorthStar I merged with and into the Company, with the Company surviving the merger (the “NorthStar I Merger”), (iv) NorthStar II merged with and into the Company, with the Company surviving the merger (the “NorthStar II Merger” and, together with the NorthStar I Merger, the “Mergers”), and (v) immediately following the Mergers, the Company contributed and conveyed to the OP the CLNY Contributed Portfolio and the equity interests of each of NorthStar I OP and NorthStar II OP then-owned by the Company in exchange for units of membership interest in the OP (the “Company Contribution” and, collectively with the Mergers and the CLNY Contributions, the “Combination”). To satisfy the condition to completion of the Combination that the Company’s Class A common stock, par value $0.01 per share (the “Class A common stock”), be approved for listing on a national securities exchange in connection with either an initial public offering or a listing, the Class A common stock was approved for listing by the New York Stock Exchange and began trading under the ticker “CLNC” on February 1, 2018.
The CLNY Contributions were accounted for as a reorganization of entities under common control, since both the Company and CLNY Investment Entities were under common control of Colony Capital at the time the contributions were made. Accordingly, the Company’s financial statements for prior periods were recast to reflect the consolidation of the CLNY Investment Entities as if the contribution had occurred on the date of the earliest period presented.
As used throughout this document, the terms the “Company,” “we,” “our” and “us” mean:
|
•
|
Colony Credit Real Estate, Inc. and the consolidated CLNY Investment Entities for periods on or prior to the closing of the Combination on January 31, 2018; and
|
|
•
|
The combined operations of Colony Credit Real Estate, Inc., NorthStar I and NorthStar II beginning February 1, 2018, following the closing of the Combination.
|
Accordingly, comparisons of the period to period financial information of the Company as set forth herein may not be meaningful because the CLNY Investment Entities represents only a portion of the assets and liabilities Colony Credit Real Estate, Inc. acquired in the Combination and does not reflect any potential benefits that may result from realization of future cost savings from operating efficiencies, or other incremental synergies expected to result from the Combination.
i
COLONY CREDIT REAL ESTATE, INC.
FORM 10-
K
TABLE OF CONTENTS
|
|
||
|
Index
|
Page
|
|
Special Note Regarding Forward-Looking Statements
This Annual Report on Form 10-K may contain forward-looking statements within the meaning of the federal securities laws. Forward-looking statements relate to expectations, beliefs, projections, future plans and strategies, anticipated events or trends and similar expressions concerning matters that are not historical facts. In some cases, you can identify forward-looking statements by the use of forward-looking terminology such as “may,” “will,” “should,” “expects,” “intends,” “plans,” “anticipates,” “believes,” “estimates,” “predicts,” or “potential” or the negative of these words and phrases or similar words or phrases which are predictions of or indicate future events or trends and which do not relate solely to historical matters. Forward-looking statements involve known and unknown risks, uncertainties, assumptions and contingencies, many of which are beyond our control, and may cause actual results to differ significantly from those expressed in any forward-looking statement. Among others, the following uncertainties and other factors could cause actual results to differ from those set forth in the forward-looking statements:
|
•
|
operating costs and business disruption may be greater than expected;
|
|
•
|
the fair value of our investments may be subject to uncertainties;
|
|
•
|
changes in market and economic conditions may adversely impact the commercial real estate sector and our investments;
|
|
•
|
our use of leverage could hinder our ability to make distributions and may significantly impact our liquidity position;
|
|
•
|
given our dependence on our external manager, an affiliate of Colony Capital, any adverse changes in the financial health or otherwise of our manager or Colony Capital could hinder our operating performance and return on stockholder’s investment;
|
|
•
|
our external manager may not be successful in locating or allocating suitable investments;
|
|
•
|
our external manager may be unable to retain or hire key investment professionals;
|
|
•
|
we may be unable to realize substantial efficiencies as well as anticipated strategic and financial benefits from the Combination;
|
|
•
|
we may be unable to maintain our qualification as a real estate investment trust for U.S. income tax purposes;
|
|
•
|
we may be unable to maintain our exemption from registration as an investment company under the Investment Company Act of 1940, as amended; and
|
|
•
|
changes in laws or regulations governing our operations may impose additional costs on us or increase competition.
|
The foregoing list of factors is not exhaustive. We urge you to carefully review the disclosures we make concerning risks in the sections entitled “Risk Factors” and “Management’s Discussion and Analysis of Financial Condition and Results of Operations” herein.
We caution investors not to unduly rely on any forward-looking statements. The forward-looking statements speak only as of the date of this Annual Report on Form 10-K. The Company is under no duty to update any of these forward-looking statements after the date of this Annual Report on Form 10-K, nor to conform prior statements to actual results or revised expectations, and the Company does not intend to do so.
2
PART I
Item 1. Business
Our Company
References to “we,” “us,” “our,” or the “Company” refer to Colony Credit Real Estate, Inc., a Maryland corporation, together with its consolidated subsidiaries, unless the context specifically requires otherwise. References to the “OP” refer to Credit RE Operating Company, LLC, a Delaware limited liability company, the operating company of the Company. References to “Colony Capital” refers to Colony Capital, Inc. a Maryland corporation, and its subsidiaries.
We are a commercial real estate (“CRE”) credit real estate investment trust (“REIT”) focused on originating, acquiring, financing and managing a diversified portfolio consisting primarily of CRE senior mortgage loans, mezzanine loans, preferred equity, debt securities and net leased properties predominantly in the United States. We are focused on consistently providing attractive risk-adjusted returns to our stockholders primarily through cash distributions and the preservation of invested capital, and secondarily through capital appreciation. The real estate credit markets continually evolve, and we believe the
27
-year track record of Colony Capital and its affiliates of successfully investing across the real estate capital structure uniquely positions us to produce attractive returns across a variety of market conditions and economic cycles.
We are externally managed by a subsidiary of Colony Capital, a NYSE-listed global real estate and investment management firm with over
$22 billion
of total consolidated assets and over
$43 billion
of assets under management. Immediately upon completion of the Combination (as defined below) and related transactions, Colony Capital owned approximately
37%
of our common equity on a fully diluted basis, evidencing a strong alignment of interests between Colony Capital and our stockholders.
Our Formation Transactions
On January 31, 2018, we completed a combination of a select portfolio of Colony Capital Operating Company, LLC (“CLNY OP”) assets and liabilities (the “CLNY OP Contributed Entities”), a select portfolio of assets and liabilities of NRF RED REIT Corp. (“RED REIT”), a Maryland corporation and indirect subsidiary of CLNY OP (the “RED REIT Contributed Entities”), substantially all of the assets and liabilities of NorthStar Real Estate Income Trust, Inc., a Maryland corporation (“NorthStar I”), and all of the assets and liabilities of NorthStar Real Estate Income II, Inc., a Maryland corporation (“NorthStar II”) (collectively, the “Combination”). The Combination consisted of the following steps:
|
•
|
CLNY OP, together with one or more of its subsidiaries, contributed to us and our operating company the CLNY OP Contributed Entities and the RED REIT Contributed Entities, with CLNY OP receiving approximately 44.4 million shares of the Company’s Class B-3 common stock and RED REIT receiving approximately 3.1 million common membership units in the OP (“OP Units”);
|
|
•
|
NorthStar I merged with and into the Company with the Company as the surviving corporation (the “NorthStar I Merger”), with stockholders of NorthStar I (including Colony Capital and its affiliates) receiving approximately 42.1 million shares of our Class A common stock in exchange for outstanding shares of NorthStar I common stock as a result of the NorthStar I Merger in an all-stock transaction;
|
|
•
|
NorthStar II merged with and into the Company with the Company as the surviving corporation (the “NorthStar II Merger” and, together with the NorthStar I Merger, the “Mergers”), with stockholders of NorthStar II (including Colony Capital and its affiliates) receiving approximately 40.4 million shares of our Class A common stock in exchange for the outstanding shares of NorthStar II common stock as a result of the NorthStar II Merger in an all-stock transaction; and
|
|
•
|
We contributed to our operating company (i) the CLNY OP Contributed Entities, (ii) the equity interests of NorthStar Real Estate Income Trust Operating Partnership, LP (“NorthStar I OP”), a Delaware limited partnership and the operating partnership of NorthStar I, and (iii) the equity interests of NorthStar Real Estate Income Operating Partnership II, LP (“NorthStar II OP”), a Delaware limited partnership and the operating partnership of NorthStar II, and in connection with that transaction we received approximately
126.9 million
OP Units.
|
As a result of the Combination, we assumed substantially all of the outstanding assets and liabilities of NorthStar I, all of the assets and liabilities of NorthStar II, the assets and liabilities of the CLNY OP Contributed Entities and the assets and liabilities of the RED REIT Contributed Entities. We conduct substantially all of our business through the OP. The Company owns
97.6%
of the outstanding OP Units in the OP.
Our Relationship with Our Manager and Colony Capital
We are externally managed by our manager, CLNC Manager, LLC (our “Manager”). Our Manager is a subsidiary of Colony Capital and benefits from the expertise and resources of Colony Capital. Colony Capital and its predecessors have a
27
-year track
3
record and have made over
$100 billion
of investments. Colony Capital’s senior management team has a long track record and extensive experience managing and investing in our target assets and other real estate-related investments through a variety of credit cycles and market conditions. Colony Capital’s global footprint and corresponding network provides its investment and asset management teams with proprietary market knowledge, exceptional sourcing capabilities and the local presence required to identify, execute and manage complex transactions, although Colony Capital and its predecessors have not been immune to national and local economic trends that are unrelated to its management of assets. Colony Capital’s successful history of external management includes its previous management of Colony Financial, Inc. (“Colony Financial”), an externally managed commercial mortgage REIT listed on the NYSE and focused on secondary loan acquisitions, high-yielding originations and real estate equity, its current management of NorthStar Realty Europe Corp. (“NorthStar Europe”), a publicly traded REIT listed on the NYSE and focused on European CRE with over
$1 billion
in assets, and its management of various non-traded REITs (previously including NorthStar I and NorthStar II) and registered investment companies with in excess of
$3 billion
of equity commitments.
Colony Capital is headquartered in Los Angeles, California, with over
400
employees in
17
locations in
ten
countries, with key offices in New York, Paris and London. Its operations are broad and diverse and include the management of real estate, both owned and on behalf of a diverse set of institutional and individual investors. Colony Capital has a highly experienced management team of diverse backgrounds with a demonstrated track record of success at asset managers and investment firms, private investment funds, investment banks and other financial service companies, which provides an enhanced perspective for managing our portfolio. Kevin P. Traenkle, a 25-year veteran of Colony Capital, serves as our Chief Executive Officer and President, and Neale W. Redington, a 10-year veteran of Colony Capital, serves as our Chief Financial Officer and Treasurer. In addition, supporting our business, David A. Palamé, a 12-year veteran of Colony Capital, serves as our General Counsel and Secretary, and Frank V. Saracino, a three-year veteran of Colony Capital, serves as our Chief Accounting Officer.
We draw on Colony Capital’s substantial real estate investment platform and relationships to source, underwrite, structure and manage a robust pipeline of investment opportunities as well as to access debt and equity capital to fund our operations. We believe we are able to originate, acquire, finance and manage investments with attractive in-place cash flows and the potential for meaningful capital appreciation over time. We also benefit from Colony Capital’s portfolio management, finance and administration functions, which provide us with legal, compliance, investor relations, asset valuation, risk management and information technology services. Colony Capital also has a captive, fully-functional, separate asset management company that engages primarily in loan servicing for performing, sub-performing and non-performing commercial loans, including senior secured loans, revolving lines of credit, loan participations, subordinated loans, unsecured loans and mezzanine debt. Colony Capital’s asset management company is a commercial special servicer rated by both Standard & Poor’s and Fitch’s rating services.
Our operating segments include the loan portfolio, CRE debt securities, net leased real estate, other, and corporate. Our target assets, as more fully described below, are included in different operating segments. Senior mortgage loans, mezzanine loans and preferred equity are included in the loan portfolio segment. Refer to Note 19, “Segment Reporting” in Item 15. “Exhibits and Financial Statement Schedules” for further discussion of our operating segments.
Our Investment Strategy
Our objective is to generate consistent and attractive risk-adjusted returns to our stockholders. We seek to achieve this objective primarily through cash distributions and the preservation of invested capital and secondarily through capital appreciation. We believe our diversified investment strategy across the CRE capital stack provides flexibility through economic cycles to achieve attractive risk-adjusted returns. This approach is driven by a disciplined investment strategy, focused on:
|
•
|
capitalizing on asset level underwriting experience and market analytics to identify investments with pricing dislocations and attractive risk-return profiles;
|
|
•
|
originating and structuring CRE senior mortgage loans, mezzanine loans and preferred equity with attractive return profiles relative to the underlying value and financial operating performance of the real estate collateral, given the strength and quality of the sponsorship;
|
|
•
|
identifying appropriate CRE debt securities investments based on the performance of the underlying real estate assets, the impact of such performance on the credit return profile of the investments and our expected return on the investments;
|
|
•
|
identifying net leased real estate investments based on property location and purpose, tenant credit quality, market lease rates and potential appreciation of, and alternative uses for, the real estate;
|
|
•
|
creating capital appreciation opportunities through active asset management and equity participation opportunities; and
|
|
•
|
structuring transactions with a prudent amount of leverage, if any, given the risk of the underlying asset’s cash flows, attempting to match the structure and duration of the financing with the underlying asset’s cash flows, including through the use of hedges, as appropriate.
|
The period for which we intend to hold our investments will vary depending on the type of asset, interest rates, investment performance, micro and macro real estate environment, capital markets and credit availability, among other factors. We generally expect to hold debt investments until the stated maturity and equity investments in accordance with each investment’s proposed
4
business plan. We may sell all or a partial ownership interest in an investment before the end of the expected holding period if we believe that market conditions have maximized its value to us or the sale of the asset would otherwise be in the best interests of our stockholders.
Our investment strategy is dynamic and flexible, enabling us to adapt to shifts in economic, real estate and capital market conditions and to exploit market inefficiencies. We may expand or change our investment strategy or target assets over time in response to opportunities available in different economic and capital market conditions. This flexibility in our investment strategy allows us to employ a customized, solutions-oriented approach, which we believe is attractive to borrowers and tenants. We believe that our diverse portfolio, our ability to originate, acquire and manage our target assets and the flexibility of our investment strategy positions us to capitalize on market inefficiencies and generate attractive long-term risk-adjusted returns for our stockholders through a variety of market conditions and economic cycles.
Our Target Assets
Our investment strategy is to originate and selectively acquire our target assets, which consist of the following:
|
•
|
Senior Mortgage Loans.
We focus on originating and selectively acquiring senior mortgage loans that are backed by CRE assets. These loans are secured by a first mortgage lien on a commercial property and provide mortgage financing to a commercial property developer or owner. The loans may vary in duration, bear interest at a fixed or floating rate and amortize, if at all, over varying periods, often with a balloon payment of principal at maturity. Senior mortgage loans include junior participations in our originated senior loans for which we have syndicated the senior participations to other investors and retained the junior participations for our portfolio. We believe these junior participations are more similar to the senior mortgage loans we originate than other loan types given their credit quality and risk profile.
|
|
•
|
Mezzanine Loans.
We may originate or acquire mezzanine loans, which are structurally subordinate to senior loans, but senior to the borrower’s equity position. Mezzanine loans may be structured such that our return accrues and is added to the principal amount rather than paid on a current basis. We may also pursue equity participation opportunities in instances when the risk-reward characteristics of the investment warrant additional upside participation in the possible appreciation in value of the underlying assets securing the investment.
|
|
•
|
Preferred Equity.
We may make investments that are subordinate to senior and mezzanine loans, but senior to the common equity in the mortgage borrower. Preferred equity investments may be structured such that our return accrues and is added to the principal amount rather than paid on a current basis. We also may pursue equity participation opportunities in preferred equity investments, similar to such participations in mezzanine loans.
|
|
•
|
CRE Debt Securities.
We may make investments that consist of bonds comprising certain tranches of CRE securitization pools, such as commercial mortgage backed securities (“CMBS”) (including “B-pieces” of a CMBS securitization pool) or CRE collateralized loan obligations (“CLOs”) (collateralized by pools of CRE debt instruments). These bonds may be investment grade or below investment grade and are collateralized by CRE debt, typically secured by senior mortgage loans and may be fixed rate or floating rate securities. Due to their first-loss position, CMBS B-pieces are typically offered at a discount to par. These investments typically carry a 10-year weighted average life due to prepayment restrictions. We generally intend to hold these investments through maturity, but may, from time to time, opportunistically sell positions should liquidity become available or be required.
|
|
•
|
Net Leased Real Estate.
We may also invest directly in well-located commercial real estate with long-term leases to tenants on a net lease basis, where such tenants generally will be responsible for property operating expenses such as insurance, utilities, maintenance capital expenditures and real estate taxes. In addition, tenants of our properties typically pay rent increases based on: (1) increases in the consumer price index (typically subject to ceilings), (2) fixed increases, or (3) additional rent calculated as a percentage of the tenants’ gross sales above a specified level. We believe that a portfolio of properties under long-term, net lease agreements generally produces a more predictable income stream than many other types of real estate portfolios, while continuing to offer the potential for growth in rental income.
|
The allocation of our capital among our target assets will depend on prevailing market conditions at the time we invest and may change over time in response to different prevailing market conditions. In addition, in the future, we may invest in assets other than our target assets or change our target assets. With respect to all of our investments, we invest so as to maintain our qualification as a REIT for U.S. federal income tax purposes and our exclusion or exemption from regulation under the Investment Company Act of 1940, as amended (the “Investment Company Act”).
We believe that events in the financial markets from time to time have created and will create significant dislocation between price and intrinsic value in certain asset classes as well as a supply and demand imbalance of available credit to finance these assets. We believe that the Company is well positioned to capitalize on such opportunities while remaining flexible to adapt our strategy as market conditions change, including with respect to existing investments that may be directly or indirectly impacted
5
by such events. We believe that our Manager’s in-depth understanding of CRE and real estate-related investments, and in-house underwriting, asset management and resolution capabilities, provides the Company and management with a sophisticated full-service value-add platform to regularly evaluate our investments and determine primary, secondary or alternative disposition strategies. This includes intermediate servicing and complex and creative negotiating, restructuring of non-performing investments, foreclosure considerations, intense management or development of owned real estate, in each case to reposition and achieve optimal value realization for the Company and its stockholders. Depending on the nature of the underlying investment, we may pursue repositioning strategies through judicious capital investment in order to extract maximum value from the investment or recognize unanticipated losses to reinvest resulting liquidity in higher-yielding performing investments.
Our Portfolio
As of
December 31, 2018
, our portfolio consisted of
160
investments representing approximately
$8.4 billion
in book value (excluding cash, cash equivalents and certain other assets). Our loan portfolio consisted of
76
senior mortgage loans, mezzanine loans and preferred equity investments and had a weighted average cash coupon of
6.6%
and a weighted average all-in unlevered yield of
8.3%
. Our CRE debt securities portfolio had a weighted average cash coupon of
3.8%
. Our owned real estate portfolio (including net lease and other real estate) consisted of approximately
16.1 million
total square feet of space and the total annualized base rent of that portfolio was approximately
$135.0 million
(based on leases in place as of
December 31, 2018
).
As of
December 31, 2018
, our portfolio consisted of the following investments (dollars in thousands):
|
Asset
|
Count
|
Book value
|
Noncontrolling interest
(1)
|
Book value at our share
(2)
|
|||||||||||
|
Senior mortgage loans
(3)(4)
|
50
|
|
$
|
2,026,394
|
|
$
|
7,449
|
|
$
|
2,018,945
|
|
||||
|
Mezzanine loans
(3)(5)
|
18
|
|
437,789
|
|
161
|
|
437,628
|
|
|||||||
|
Preferred equity
(3)(6)
|
8
|
|
298,500
|
|
—
|
|
298,500
|
|
|||||||
|
CMBS
(7)
|
53
|
|
371,227
|
|
—
|
|
371,227
|
|
|||||||
|
Mortgage loans held in securitization trusts
(7)
|
—
|
|
2,973,936
|
|
—
|
|
2,973,936
|
|
|||||||
|
Owned real estate-Net lease
(8)
|
12
|
|
1,301,314
|
|
34,490
|
|
1,266,824
|
|
|||||||
|
Owned real estate-Other
(8)(9)
|
13
|
|
792,444
|
|
108,127
|
|
684,317
|
|
|||||||
|
Private equity interests
|
6
|
|
160,851
|
|
—
|
|
160,851
|
|
|||||||
|
Total
|
160
|
|
$
|
8,362,455
|
|
$
|
150,227
|
|
$
|
8,212,228
|
|
||||
_________________________________________
|
(1)
|
Noncontrolling interest (“NCI”) represent interests in assets held by third party partners.
|
|
(2)
|
Book value at our share represents the proportionate book value based on our ownership by asset; book values at our share for securitization assets are net of the accounting impact from consolidation.
|
|
(3)
|
Senior mortgage loans, mezzanine loans, and preferred equity include investments in joint ventures whose underlying investment is in a loan or preferred equity.
|
|
(4)
|
Senior mortgage loans include junior participations in our originated senior mortgage loans for which we have syndicated the senior participations to other investors and retained the junior participations for our portfolio and contiguous mezzanine loans where we own both the senior and junior loan positions. We believe these investments are more similar to the senior mortgage loans we originate than other loan types given their credit quality and risk profile.
|
|
(5)
|
Mezzanine loans include other subordinated loans.
|
|
(6)
|
Preferred equity balances include
$57.1 million
of book value at our share attributable to related equity participation interests.
|
|
(7)
|
Mortgage loans held in securitization trusts includes
$3.1 billion
of book value assets in three securitization trusts in which we own the controlling class of securities and therefore consolidate. The consolidated liabilities related to these consolidated assets are
$3.0 billion
. The difference between the carrying values of the mortgage loans held in securitization trusts and the carrying value of the mortgage obligations issued by the securitization trusts was
$143.0 million
as of
December 31, 2018
and approximates the fair value of our underlying investments in the subordinate tranches of the securitization trusts.
|
|
(8)
|
Owned real estate - net lease and owned real estate - other include deferred leasing costs and intangible assets.
|
|
(9)
|
Owned real estate - other consists of multi-tenant office, multifamily residential and hotel assets.
|
6
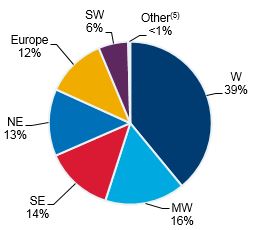
The following charts illustrate the diversification of our portfolio (not including CMBS, mortgage loans held in securitization trusts, and private equity interests) based on investment type, underlying property type, and geography, as of
December 31, 2018
(percentages based on book value at our share, which represents the proportionate book value based on our ownership by asset):
|
Investment Type
|
Property Type
|
|

|

|
|
|
Geography
|
|
_________________________________________
|
(1)
|
Senior mortgage loans include junior participations in our originated senior mortgage loans for which we have syndicated the senior participations to other investors and retained the junior participations for our portfolio and contiguous mezzanine loans where we own both the senior and junior loan positions. We believe these investments are more similar to the senior mortgage loans we originate than other loan types given their credit quality and risk profile.
|
|
(2)
|
Mezzanine loans include other subordinated loans.
|
|
(3)
|
Preferred equity balances include
$57.1 million
of book value at our share attributable to related equity participation interests.
|
|
(4)
|
Other includes: (i) manufactured housing communities, (ii) commercial and residential development and predevelopment and (iii) mixed-use assets.
|
|
(5)
|
Other includes one collateral asset located in Latin America.
|
Underwriting Process
We use a rigorous investment and underwriting process that has been developed and utilized by our Manager’s and its affiliates’ senior management teams leveraging their extensive commercial real estate expertise over many years and real estate cycles. The underwriting process focuses on some or all of the following factors designed to ensure each investment is evaluated appropriately: (i) macroeconomic conditions that may influence operating performance; (ii) fundamental analysis of underlying real estate, including tenant rosters, lease terms, zoning, necessary licensing, operating costs and the asset’s overall competitive position in its market; (iii) real estate market factors that may influence the economic performance of the investment, including leasing conditions and overall competition; (iv) the operating expertise and financial strength and reputation of a tenant, operator, partner or borrower; (v) the cash flow in place and projected to be in place over the term of the investment and potential return; (vi) the appropriateness of the business plan and estimated costs associated with tenant buildout, repositioning or capital improvements; (vii) an internal and third-party valuation of a property, investment basis relative to the competitive set and the ability to liquidate an investment through a sale or refinancing; (viii) review of third-party reports including appraisals, engineering and environmental reports; (ix) physical inspections of properties and markets; (x) the overall legal structure of the investment, contractual implications and the lenders’ rights; and (xi) the tax and accounting impact.
The following section describes the major CRE asset classes in which we may invest and actively manage to maximize value and to protect capital.
7
Loan Portfolio
Our loan portfolio consists of senior mortgage loans, mezzanine loans and preferred equity interests, some of which have equity participation interests.
The following table provides a summary of our loan portfolio as of
December 31, 2018
(dollars in thousands):
|
Weighted Average
(1)
|
|||||||||||||||||||||||
|
Asset
|
Count
|
Book value
|
Principal balance
|
Cash Coupon
(2)
|
All-in unlevered yield
(3)
|
Remaining term
(4)
|
Extended remaining term
(5)
|
||||||||||||||||
|
Senior loans
(6)(7)
|
50
|
|
$
|
2,026,394
|
|
$
|
2,041,235
|
|
6.2
|
%
|
7.5
|
%
|
1.8
|
|
3.7
|
|
|||||||
|
Mezzanine loans
(6)(8)
|
18
|
|
437,789
|
|
526,380
|
|
6.7
|
%
|
10.7
|
%
|
1.8
|
|
3.2
|
|
|||||||||
|
Preferred equity
(6)(9)
|
8
|
|
298,500
|
|
242,974
|
|
9.9
|
%
|
10.8
|
%
|
7.1
|
|
7.5
|
|
|||||||||
|
Total / Weighted average
|
76
|
|
$
|
2,762,683
|
|
$
|
2,810,589
|
|
6.6
|
%
|
8.3
|
%
|
2.4
|
|
4.0
|
|
|||||||
_________________________________________
|
(1)
|
Weighted average metrics weighted by book value at our share, except for cash coupon which is weighted by principal balance value at our share. Book and principal balances at share exclude
$7.6 million
of NCI. See the table located above in “Our Portfolio” for further information.
|
|
(2)
|
Represents the stated coupon on loans; for floating rate loans, assumes USD 1-month London Interbank Offered Rate (“LIBOR”), which was
2.50%
as of
December 31, 2018
.
|
|
(3)
|
In addition to cash coupon, all-in unlevered yield includes non-cash payment in kind interest income and the accrual of both extension and exit fees. All-in yield for the loan portfolio assumes the USD 1-month LIBOR rate as of
December 31, 2018
for weighted average calculations.
|
|
(4)
|
Represents the remaining term based on the current contractual maturity date of loans.
|
|
(5)
|
Represents the remaining term based on a maximum maturity date assuming all extension options on loans are exercised by the borrower.
|
|
(6)
|
Senior mortgage loans, mezzanine loans, and preferred equity include investments in joint ventures whose underlying investment is in a loan or preferred equity.
|
|
(7)
|
Senior mortgage loans include junior participations in our originated senior mortgage loans for which we have syndicated the senior participations to other investors and retained the junior participations for our portfolio and contiguous mezzanine loans where we own both the senior and junior loan positions. We believe these investments are more similar to the senior mortgage loans we originate than other loan types given their credit quality and risk profile.
|
|
(8)
|
Mezzanine loans include other subordinated loans.
|
|
(9)
|
Preferred equity balances include
$57.1 million
of book value at our share attributable to related equity participation interests.
|
The following table details our loan portfolio by rate-type as of
December 31, 2018
(dollars in thousands):
|
Weighted Average
(1)
|
|||||||||||||||||||||||||||
|
Number of loans
|
Book value
|
Principal balance
|
Unfunded loan commitments
|
Spread to LIBOR
|
All-in unlevered yield
(2)
|
Remaining term
(3)
|
Extended remaining term
(4)
|
||||||||||||||||||||
|
Floating rate loans
|
49
|
|
$
|
1,787,011
|
|
$
|
1,840,825
|
|
$
|
123,968
|
|
4.3
|
%
|
6.6
|
%
|
1.7
|
|
3.6
|
|
||||||||
|
Fixed rate loans
(5)
|
27
|
|
975,672
|
|
969,764
|
|
35,050
|
|
—
|
%
|
11.4
|
%
|
3.5
|
|
4.7
|
|
|||||||||||
|
Total/ Weighted average
|
76
|
|
$
|
2,762,683
|
|
$
|
2,810,589
|
|
$
|
159,018
|
|
—
|
%
|
8.3
|
%
|
2.4
|
|
4.0
|
|
||||||||
_________________________________________
|
(1)
|
Weighted average metrics weighted by book value at our share, except for spread to LIBOR which is weighted by principal balance value at our share. Book and principal balances at share exclude
$7.6 million
of NCI. See the table located above in “Our Portfolio” for further information.
|
|
(2)
|
In addition to cash coupon, all-in unlevered yield includes the amortization of deferred origination fees, purchase price premium and discount, loan origination costs and accrual of both extension and exit fees. For weighted average calculations, all-in yield for the loan portfolio assumes the USD 1-month LIBOR as of
December 31, 2018
, which was
2.50%
.
|
|
(3)
|
Represents the remaining term in years based on the original maturity date or current extension maturity date of loans.
|
|
(4)
|
Represents the remaining term in years based on a maximum maturity date assuming all extension options on loans are exercised by the borrower.
|
|
(5)
|
Includes preferred equity investments.
|
8
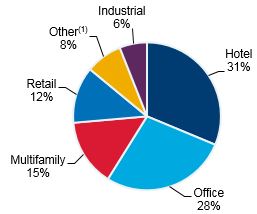
The following table details the types of properties securing our loan portfolio and geographic distribution as of
December 31, 2018
(dollars in thousands):
|
Collateral property type
|
Book value
|
% of total
|
|||||
|
Office
|
$
|
763,419
|
|
27.6
|
%
|
||
|
Multifamily
|
425,741
|
|
15.4
|
%
|
|||
|
Industrial
|
150,498
|
|
5.5
|
%
|
|||
|
Hotel
|
860,834
|
|
31.2
|
%
|
|||
|
Retail
|
337,245
|
|
12.2
|
%
|
|||
|
Other
(1)
|
224,946
|
|
8.1
|
%
|
|||
|
Total
|
$
|
2,762,683
|
|
100.0
|
%
|
||
|
Region
|
Book value
|
% of total
|
|||||
|
West
|
$
|
1,510,928
|
|
54.7
|
%
|
||
|
Northeast
|
405,033
|
|
14.7
|
%
|
|||
|
Southwest
|
207,644
|
|
7.5
|
%
|
|||
|
Southeast
|
259,181
|
|
9.4
|
%
|
|||
|
Midwest
|
127,914
|
|
4.6
|
%
|
|||
|
Europe
|
231,630
|
|
8.4
|
%
|
|||
|
Other
(2)
|
20,353
|
|
0.7
|
%
|
|||
|
Total
|
$
|
2,762,683
|
|
100.0
|
%
|
||
_________________________________________
|
(1)
|
Other includes manufactured housing communities and commercial and residential development and predevelopment assets.
|
|
(2)
|
Other includes one non-U.S. collateral asset.
|
The following charts illustrate the diversification of our loan portfolio based on interest rate category, property type, and geography as of
December 31, 2018
(percentages based on book value at our share, which represents the proportionate book value based on our ownership by asset):
|
Interest Rate Category
|
Property Type
|
|

|
|
|
|
Geography
|

|
9
_________________________________________
|
(1)
|
Other includes manufactured housing communities and commercial and residential development and predevelopment assets.
|
|
(2)
|
Other includes one non-U.S. collateral asset.
|
In
March 2018
, the borrower on our four NY hospitality loans failed to make all required interest payments. These four loans are secured by the same collateral. We placed the loans on non-accrual status and commenced discussions with the borrower to resolve the matter. Interest income was recognized on a cash basis. During the year, we recognized
$3.4 million
in interest income on the loans.
During the third quarter of 2018, discussions with the borrower did not progress as anticipated which led to us exploring additional options for resolution. We prepared a weighted average probability analysis of potential resolutions, which included a recapitalization and earlier than expected receipt and sale of collateral. Based on this analysis, we recorded a
$35.1 million
provision for loan loss on the four NY hospitality loans during the third quarter of 2018.
During the fourth quarter of
2018
, the borrower entered into a listing agreement with a real estate brokerage firm and as a result, we believe sale of the underlying collateral and repayment of the four loans from the sales proceeds is the most likely outcome. As such, we recorded an additional
$18.8 million
of provision for loan loss on the four NY hospitality loans in
2018
to reflect the estimated proceeds to be received from the borrower following the sale.
At
December 31, 2018
and
2017
, there was
one
mezzanine loan previously modified in a troubled debt restructuring (“TDR”) with carrying value before allowance for loan losses of
$28.6 million
. The loan had been modified in 2015. We also have
three
other loans with a combined carrying value before provision for loan losses of
$108.5 million
that are cross-collateralized with the TDR loan to the same borrower.
Two
loans matured in November 2017 and were in default at both
December 31, 2018
and
2017
, while the
third
loan matured in October 2018 and was in default at
December 31, 2018
. All
four
loans are cross-collateralized with
28
office, retail, multifamily and industrial properties.
In February 2018, the borrower entered into a forbearance agreement with us to allow both parties to review the exit strategy. The forbearance agreement was terminated by us in
August 2018
when it became clear that the borrower would not complete its exit strategy. We commenced foreclosure proceedings under the mezzanine loan to take control of the
28
cross-collateralized properties, which was completed in
January 2019
. As such, we recorded a
$31.7 million
provision for loan loss on the four loans to reflect the estimated fair value of the collateral. We recorded an additional
$5.1 million
of provision for loan loss associated with a receivable for operating expenses paid by us on the borrower’s behalf during the year ended
December 31, 2018
. To improve the operating performance of the
28
properties, we have engaged new property managers, working under the perpetual oversight of our asset management team.
During the fourth quarter of
2018
, two separate borrowers on
three
of our regional mall loans with unpaid principal balances of
$29.9 million
,
$26.5 million
, and
$7.0 million
, respectively, notified us of the potential loss of anchor tenants. Following this notification, we concluded that foreclosure or sale of the underlying collateral and repayment for each of these loans is the most likely outcome. As such, we recorded a provision for loan loss of
$8.0 million
,
$8.8 million
and
$7.0 million
respectively, to reflect the estimated fair value of the collateral. We have commenced foreclosure proceedings on
two
of the
three
loans collateralized by one of the regional malls with unpaid principal balances totaling
$36.9 million
. We have been and are continuing to sweep all cash from the operations of the two regional malls.
CRE Debt Securities
The following table presents an overview of our CRE debt securities portfolio as of
December 31, 2018
(dollars in thousands):
|
Weighted Average
(1)
|
||||||||||||||||||
|
CRE Debt Securities by ratings category
(2)
|
Number of Securities
|
Book value
|
Cash coupon
|
Unlevered all-in yield
|
Remaining term
|
Ratings
|
||||||||||||
|
Investment grade rated
|
39
|
|
$
|
203,212
|
|
3.2
|
%
|
6.3
|
%
|
7.6
|
|
BBB-
|
||||||
|
Non-investment grade rated
|
4
|
|
24,972
|
|
3.3
|
%
|
11.9
|
%
|
6.2
|
|
BB / B
|
|||||||
|
“B-pieces” of CMBS securitization pools
|
10
|
|
143,043
|
|
4.5
|
%
|
7.5
|
%
|
5.4
|
|
—
|
|||||||
|
Total/Weighted Average
|
53
|
|
$
|
371,227
|
|
3.8
|
%
|
7.2
|
%
|
6.6
|
|
—
|
||||||
_________________________________________
|
(1)
|
Weighted average metrics weighted by book value, except for cash coupon which is weighted by principal balance.
|
|
(2)
|
As of
December 31, 2018
, all CRE debt securities consisted of CMBS.
|
Owned Real Estate
Our operating real estate investment strategy focuses on direct ownership in commercial real estate with an emphasis on properties with stable cash flow, which may be structurally senior to a third-party partner’s equity. In addition, we may own operating real estate investments through joint ventures with one or more partners. As part of our real estate properties strategy, we explore a
10
variety of real estate investments including multi-tenant office, multifamily, student housing and industrial. These properties are typically well-located with strong operating partners and we believe offer both attractive cash flow and returns.
As of
December 31, 2018
,
$2.1 billion
, or
25.0%
, of our assets were invested in real estate properties and our portfolio was
92.7%
occupied. The following table presents our real estate property investments as of
December 31, 2018
(dollars in thousands):
|
Property Type
|
Book value
|
NCI
|
Book value at our share
(1)
|
% of total
|
Number of Properties
|
Number of Buildings
|
Total Square Feet
|
Units
|
Weighted average % leased
|
Weighted average lease term
(2)
|
Total annualized base rent
(3)
|
|||||||||||||||||||||||||
|
Net lease
|
||||||||||||||||||||||||||||||||||||
|
Industrial
|
$
|
774,850
|
|
$
|
34,490
|
|
$
|
740,360
|
|
38.0
|
%
|
47
|
|
47
|
|
11,577,199
|
|
—
|
|
96
|
%
|
9.9
|
$
|
47,523
|
|
|||||||||||
|
Office
|
463,097
|
|
—
|
|
463,097
|
|
24.0
|
%
|
5
|
|
30
|
|
2,132,616
|
|
—
|
|
93
|
%
|
9.2
|
27,036
|
|
|||||||||||||||
|
Retail
|
63,367
|
|
—
|
|
63,367
|
|
3.0
|
%
|
10
|
|
10
|
|
467,971
|
|
—
|
|
100
|
%
|
5.5
|
5,398
|
|
|||||||||||||||
|
Total net-lease
|
1,301,314
|
|
34,490
|
|
1,266,824
|
|
65.0
|
%
|
62
|
|
87
|
|
14,177,786
|
|
—
|
|
95
|
%
|
9.4
|
79,958
|
|
|||||||||||||||
|
Other
|
||||||||||||||||||||||||||||||||||||
|
Office
|
421,921
|
|
50,832
|
|
371,089
|
|
19.0
|
%
|
14
|
|
14
|
|
1,882,714
|
|
—
|
|
87
|
%
|
4.3
|
32,163
|
|
|||||||||||||||
|
Multifamily
|
252,475
|
|
57,019
|
|
195,456
|
|
10.0
|
%
|
6
|
|
107
|
|
—
|
|
3,721
|
|
91
|
%
|
n/a
|
22,867
|
|
|||||||||||||||
|
Hotel
|
118,048
|
|
276
|
|
117,772
|
|
6.0
|
%
|
3
|
|
3
|
|
n/a
|
|
n/a
|
|
n/a
|
|
n/a
|
n/a
|
|
|||||||||||||||
|
Total other
|
792,444
|
|
108,127
|
|
684,317
|
|
35.0
|
%
|
23
|
|
124
|
|
1,882,714
|
|
3,721
|
|
89
|
%
|
4.3
|
55,030
|
|
|||||||||||||||
|
Total
|
$
|
2,093,758
|
|
$
|
142,617
|
|
$
|
1,951,141
|
|
100.0
|
%
|
85
|
|
211
|
|
16,060,500
|
|
3,721
|
|
93
|
%
|
7.6
|
$
|
134,988
|
|
|||||||||||
__________________________________________
|
(1)
|
Book value at our share represents the proportionate book value based on our ownership by asset.
|
|
(2)
|
The calculation of weighted average lease term is based on leases in-place (defined as occupied and paying leases) as of
December 31, 2018
; assumes that no renewal options are exercised and is weighted by book value at our share.
|
|
(3)
|
Total annualized base rent is based on in-place leases at our share multiplied by 12, excluding straight-line adjustments and rent concessions as of
December 31, 2018
.
|
The following charts illustrate the concentration of our net lease real estate portfolio based on property type and geography as of
December 31, 2018
(percentages based on book value at our share, which represents the proportionate book value based on our ownership by asset):
|
Property Type
|
Geography
|
|

|

|
|
11
The following charts illustrate the diversification of our other real estate portfolio based on property type and geography as of
December 31, 2018
(percentages based on book value at our share, which represents the proportionate book value based on our ownership by asset):
|
Property Type
|
Geography
|
|

|

|
|
Our Competitive Strengths
We believe that we distinguish ourselves from other CRE finance and investment companies in a number of ways, including the following:
Large diversified portfolio.
We are one of the largest publicly traded CRE credit/mortgage REITs. Our portfolio is composed of a diverse set of CRE assets across the capital stack, including senior mortgage loans, mezzanine loans, preferred equity, debt securities, net leased properties and other real estate equity investments, all of which have been underwritten and asset managed by Colony Capital (or its affiliates and predecessors). We believe that the scale of our portfolio gives us a competitive advantage by providing us with significant portfolio diversification, economies of scale and advantageous access to capital.
Nimble and differentiated investment strategy.
We focus on originating, acquiring, financing and managing CRE senior mortgage loans, mezzanine loans, preferred equity, debt securities and net leased properties. Our investment strategy is dynamic and flexible, enabling us to adapt to shifts in economic, real estate and capital market conditions and to exploit market inefficiencies, as demonstrated by Colony Capital’s 27-year history. This flexible investment strategy will allow us to employ a customized, solutions-oriented approach to investment, which we believe is attractive to our borrowers and tenants and which will allow us to deploy capital across a broader opportunity set.
Relationship with Colony Capital.
We believe that our affiliation with Colony Capital, through our Manager, provides us with a number of competitive advantages, including:
|
•
|
Seasoned Management Team.
Colony Capital’s highly experienced senior management team consists of real estate professionals from diverse CRE backgrounds. The Colony Capital team works seamlessly with our senior management team, which is led by Kevin P. Traenkle and Neale W. Redington. Messrs. Traenkle and Redington, as well as other members of our management team, have significant CRE experience through multiple real estate cycles and have been extensively involved in the investment and management of our predecessors’ portfolio of credit assets, including our initial portfolio.
|
|
•
|
Colony Capital Has a Substantial Equity Stake In Us.
Colony Capital owns approximately
37%
of our common equity, on a fully diluted basis, evidencing a strong alignment of interests between Colony Capital and our stockholders. As a result, Colony Capital derives a substantial amount of value from its investment in us through our stock performance and the distributions that we expect to make.
|
|
•
|
Extensive Sourcing Capabilities.
Colony Capital has access to extensive relationships with borrowers and intermediaries, expertise in identifying, evaluating and structuring real estate investments across the capital stack in different market conditions, and real-time information on markets in which it owns and operates real estate assets. Colony Capital and its predecessors have a
27
-year track record and have made over
$100 billion
of investments throughout economic cycles by focusing on opportunities that were often overlooked by or unavailable to other investors. This experience will help
|
12
us identify market trends and conditions to deploy capital successfully and provide us with access to proprietary investment opportunities.
|
•
|
Disciplined Underwriting and Asset Selection.
Colony Capital’s fully integrated in-house operating platform has extensive experience underwriting, conducting due diligence and valuing real estate and real estate-related assets. The foundation of this underwriting platform is Colony Capital’s credit-oriented culture and its in-depth, asset level evaluation of each investment opportunity using rigorous quantitative and qualitative analysis. We believe that these tools provide us with an advantage relative to many of our competitors and enable Colony Capital to better identify attractive investment opportunities and assess the performance, risk and returns that we should expect from any particular investment.
|
|
•
|
Robust Asset Management Capabilities.
Colony Capital maintains best-in-class asset management and risk management capabilities. We expect Colony Capital to maximize the value of our invested capital and create potential capital appreciation opportunities through active management of our portfolio. The senior personnel of Colony Capital and its affiliates are highly experienced in loan, securities and real estate asset management, and have been successful in formulating and executing various asset management strategies through a variety of economic cycles and in complex capital structures. We are able to draw on the experience of Colony Capital’s dedicated asset management professionals, who, in collaboration with the investments team, will formulate a strategic plan to extract the maximum amount of value from each investment through, among other things, repositioning, restructuring, intensive management and, when appropriate, enforcing our rights and remedies.
|
|
•
|
Public Company and REIT Management Experience.
Colony Capital and its predecessors have a successful track record managing publicly registered investment platforms, including Colony Financial, which was an externally managed NYSE-listed commercial mortgage REIT with an investment strategy similar to ours, focused on high-yielding loan originations and acquisitions and real estate equity before consummating a business combination and management internalization transaction with Colony Capital, LLC in April 2015. In addition, Colony Capital currently manages other publicly traded REITs, non-traded REITs and registered investment companies, including NYSE-listed NorthStar Europe and previously managed NorthStar I and NorthStar II prior to the Combination. Through the management of these companies, Colony Capital has developed significant expertise in operating publicly registered companies, including public company reporting, internal controls and risk management, legal and regulatory compliance (including REIT and Investment Company Act compliance), stock exchange requirements, operations, financing and accessing the capital markets.
|
Our Financing Strategy
We have a multi-pronged financing strategy that includes an up to
$560 million
secured revolving credit facility, up to approximately
$2.1 billion
in secured revolving repurchase facilities, non-recourse securitization financing, commercial mortgages and other asset-level financing structures. In addition, we may use other forms of financing, including additional warehouse facilities, public and private secured and unsecured debt issuances and equity or equity-related securities issuances by us or our subsidiaries. We may also finance a portion of our investments through the syndication of one or more interests in a whole loan or securitization. We will seek to match the nature and duration of the financing with the underlying asset’s cash flow, including through the use of hedges, as appropriate.
Leverage Policies
While we limit our use of leverage and believe we can achieve attractive yields on an unleveraged basis, we may use prudent amounts of leverage to increase potential returns to our stockholders and/or to finance future investments. Given current market conditions, to the extent that we use borrowings to finance our assets, we currently expect that such leverage would not exceed on a debt-to-equity basis, a
3-to-1
ratio for us as a whole. We consider these leverage ratios to be prudent for our target asset classes. Our decision to use leverage currently or in the future to finance our assets will be based on our Manager’s assessment of a variety of factors, including, among others, the anticipated credit quality, liquidity and price volatility of the assets in our investment portfolio, the potential for losses and extension risk in our portfolio, the ability to raise additional equity to reduce leverage and create liquidity for future investments, the availability of credit at favorable prices or at all, the credit quality of our assets and our outlook for borrowing costs relative to the interest income earned on our assets. Our decision to use leverage in the future to finance our assets will be at the discretion of our Manager and will not be subject to the approval of our stockholders, and we are not restricted by our governing documents or otherwise in the amount of leverage that we may use. To the extent that we use leverage in the future, we may mitigate interest rate risk through utilization of hedging instruments, primarily interest rate swap and cap agreements, to serve as a hedge against future interest rate increases on our borrowings.
13
Investment Guidelines
We have no prescribed limitation on any particular investment type. However, the Company’s board of directors (“Board of Directors”) has adopted the following investment guidelines:
|
•
|
no investment shall be made that would cause the Company to fail to qualify as a REIT for U.S. federal income tax purposes;
|
|
•
|
no investment shall be made that would cause the Company or any subsidiary to be required to be registered as an investment company under the Investment Company Act;
|
|
•
|
until appropriate investments can be identified, the Manager may invest the proceeds of any future offerings of the Company in interest-bearing, short-term investments, including money market accounts and/or U.S. treasury securities, that are consistent with the Company’s intention to qualify as a REIT and maintain its exemption from registration under the Investment Company Act;
|
|
•
|
no investment shall require prior approval of the Board of Directors or a majority of the independent directors solely because such investment constitutes (1) a co-investment made by and between the Company or any subsidiary, on the one hand, and one or more investment vehicles formed, sponsored and managed by Colony Capital or any of its subsidiaries, on the other hand, regardless of when such co-investment is made, or (2) a transaction related to any such co-investment;
|
|
•
|
any investment with a total net commitment by the OP of greater than 5% of the OP’s net equity (computed using the most recently available publicly filed balance sheet) shall require the approval of the Board of Directors or a duly constituted committee of the Board of Directors (with total net commitment by the OP being the aggregate amount of funds directly or indirectly committed by the OP to such investment net of any upfront fees received by the Company or any subsidiary in connection with such investment); and
|
|
•
|
any investment with a total net commitment by the OP of between 3% and 5% of the OP’s net equity (computed using the most recently available publicly filed balance sheet) shall require the approval of the Board of Directors or a duly constituted committee of the Board of Directors (with total net commitment by the OP being the aggregate amount of funds directly or indirectly committed by the OP to such investment net of any upfront fees received by the Company or any subsidiary in connection with such investment), unless the investment falls within specific parameters approved by the Board of Directors and in effect at the time such commitment is made.
|
The investment guidelines can be amended or waived with the approval of the Board of Directors (which must include a majority of the independent directors) and the Manager.
Operating and Regulatory Structure
REIT Qualification
We intend to elect to be taxed as a REIT for U.S. federal income tax purposes beginning with our taxable year ended
December 31, 2018
. As a REIT, we generally will not be subject to U.S. federal income tax on the “REIT taxable income” that we distribute annually to our stockholders.
Investment Company Act Matters
We and our subsidiaries conduct our operations so that we are not required to register as an investment company under the Investment Company Act.
We believe we are not an investment company under Section 3(a)(1)(A) of the Investment Company Act because we do not engage primarily, or hold ourselves out as being engaged primarily, in the business of investing, reinvesting or trading in securities. Rather, we, through our subsidiaries, are primarily engaged in non-investment company businesses related to real estate. In addition, we intend to conduct our operations so that we do not come within the definition of an investment company under Section 3(a)(1)(C) of the Investment Company Act because less than 40% of our total assets on an unconsolidated basis will consist of “investment securities.” Section 3(a)(1)(C) of the Investment Company Act defines an investment company as any issuer that is engaged or proposes to engage in the business of investing, reinvesting, owning, holding or trading in securities and that owns or proposes to acquire investment securities having a value exceeding 40% of the value of the issuer’s total assets (exclusive of U.S. government securities and cash items). Excluded from the term “investment securities” (as that term is defined in the Investment Company Act) are securities issued by majority-owned subsidiaries that are themselves not investment companies and are not relying on the exclusion from the definition of investment company set forth in Section 3(c)(1) or Section 3(c)(7) of the Investment Company Act. Under the Investment Company Act, a subsidiary is majority-owned if a company owns 50% or more of its outstanding voting securities. To avoid the need to register as an investment company, the securities issued to us by any wholly-owned or majority-
14
owned subsidiaries that we may form in the future that are excluded from the definition of investment company under Section 3(c)(1) or Section 3(c)(7) of the Investment Company Act, together with any other investment securities we may own, may not have a value in excess of 40% of the value of our total assets on an unconsolidated basis. We monitor our holdings to ensure ongoing compliance with this test.
We hold our assets primarily through direct or indirect wholly-owned or majority-owned subsidiaries, certain of which are excluded from the definition of investment company pursuant to Section 3(c)(5)(C) of the Investment Company Act. To qualify for the exclusion pursuant to Section 3(c)(5)(C), based on positions set forth by the staff of the SEC, each such subsidiary generally is required to hold at least (i) 55% of its assets in “qualifying” real estate assets and (ii) at least 80% of its assets in “qualifying” real estate assets and real estate-related assets. For our subsidiaries that maintain this exclusion or another exclusion or exception under the Investment Company Act (other than Section 3(c)(1) or Section 3(c)(7) thereof), our interests in these subsidiaries do not and will not constitute “investment securities.” “Qualifying” real estate assets for this purpose include senior mortgage loans, certain B-notes and certain mezzanine loans that satisfy various conditions as set forth in Securities and Exchange Commission (“SEC”) staff no-action letters and other guidance, and other assets that the SEC staff in various no-action letters and other guidance has determined are the functional equivalent of senior loans for the purposes of the Investment Company Act. We treat as real estate-related assets B-pieces and mezzanine loans that do not satisfy the conditions set forth in the relevant SEC staff no-action letters and other guidance, and debt and equity securities of companies primarily engaged in real estate businesses. Unless a relevant SEC no-action letter or other guidance applies, we expect to treat preferred equity interests as real estate-related assets. The SEC has not published guidance with respect to the treatment of CMBS for purposes of the Section 3(c)(5)(C) exclusion. Unless the SEC or its staff issues guidance with respect to CMBS, we intend to treat CMBS as a real estate-related asset. To the extent that the SEC staff publishes new or different guidance with respect to these matters, we may be required to adjust our strategy accordingly. For our subsidiaries that maintain this exclusion or another exclusion or exception under the Investment Company Act (other than Section 3(c)(1) or Section 3(c)(7) thereof), our interests in these subsidiaries do not and will not constitute “investment securities.”
If we were required to register as an investment company under the Investment Company Act, we would become subject to substantial regulation with respect to our capital structure (including our ability to use leverage), management, operations, transactions with affiliated persons (as defined in the Investment Company Act), portfolio composition, including restrictions with respect to diversification and industry concentration, and other matters.
As a consequence of our seeking to avoid the need to register under the Investment Company Act on an ongoing basis, we and/or our subsidiaries may be restricted from making certain investments or may structure investments in a manner that would be less advantageous to us than would be the case in the absence of such requirements. In particular, a change in the value of any of our assets could negatively affect our ability to avoid the need to register under the Investment Company Act and cause the need for a restructuring of our investment portfolio. For example, these restrictions may limit our and our subsidiaries’ ability to invest directly in mortgage-backed securities that represent less than the entire ownership in a pool of senior loans, debt and equity tranches of securitizations and certain asset-backed securities, noncontrolling equity interests in real estate companies or in assets not related to real estate. In addition, seeking to avoid the need to register under the Investment Company Act may cause us and/or our subsidiaries to acquire or hold additional assets that we might not otherwise have acquired or held or dispose of investments that we and/or our subsidiaries might not have otherwise disposed of, which could result in higher costs or lower proceeds to us than we would have paid or received if we were not seeking to comply with such requirements. Thus, avoiding registration under the Investment Company Act may hinder our ability to operate solely on the basis of maximizing profits.
There can be no assurance that we and our subsidiaries will be able to successfully avoid operating as an unregistered investment company. If it were established that we were an unregistered investment company, there would be a risk that we would be subject to monetary penalties and injunctive relief in an action brought by the SEC, that we would be unable to enforce contracts with third parties, that third parties could seek to obtain rescission of transactions undertaken during the period it was established that we were an unregistered investment company, and that we would be subject to limitations on corporate leverage that would have an adverse impact on our investment returns.
Government Regulation Relating to the Environment
Our properties are subject to various federal, state and local environmental laws, statutes, ordinances and regulations. Such laws and other regulations relate to a variety of environmental hazards, including asbestos-containing materials (“ACM”), toxins or irritants, mold, regulated substances, emissions to the environment, fire codes and other hazardous or toxic substances, materials or wastes. These laws are subject to change and may be more stringent in the future. Under current laws, a current or previous owner or operator of real estate (including, in certain circumstances, a secured lender if it participates in management or succeeds to ownership or control of a property) may become liable for costs and liabilities related to contamination or other environmental issues at or with respect to the property, including in connection with the activities of a tenant. Such cleanup laws typically impose cleanup responsibility and liability without regard to whether the owner or operator party knew of or was responsible for the release or presence of such hazardous or toxic substances. In addition, parties may be liable for costs of remediating contamination at an off-site disposal or treatment facilities where they arrange for disposal or treatment of hazardous substances. These liabilities
15
and costs, including for investigation, remediation or removal of those substances or natural resource damages, third party tort claims resulting from personal injury or property damage, restrictions on the manner in which the property is used, liens in favor of the government for damages and costs the government incurs related to cleanup of contamination, and costs to properly manage or abate asbestos or mold may be substantial. Absent participating in management or succeeding to ownership, operation or other control of real property, a secured lender is not likely to be directly subject to any of these forms of environmental liability, although a borrower could be subject to these liabilities impacting its ability to make loan payments.
Prior to closing any property acquisition, we obtain environmental assessments in a manner we believe prudent in order to attempt to identify potential environmental concerns with respect to such properties. These assessments are carried out in accordance with an appropriate level of due diligence and generally include a physical site inspection, a review of relevant federal, state and local environmental and health agency database records, one or more interviews with appropriate site-related personnel, review of the property’s chain of title and review of historic aerial photographs and other information on past uses of the property. We may also conduct limited subsurface investigations and test for substances of concern where the result of the first phase of the environmental assessments or other information indicates possible contamination or where our consultants recommend such procedures.
We are not currently aware of any environmental liabilities that could materially affect the Company. Refer to the risk factor “Environmental compliance costs and other environmental liabilities associated with our current or former properties or our CRE debt or real estate-related investments may materially impair the value of our investments and expose us to material liability” in the section entitled “Risk Factors—Risks Related to Our Business and Our Investments” for more details regarding potential environmental liabilities and risk related to the Company.
Other Regulation
Our operations are subject, in certain instances, to supervision and regulation by state and federal governmental authorities and may be subject to various laws and judicial and administrative decisions imposing various requirements and restrictions, which, among other things: (1) regulate credit granting activities; (2) establish maximum interest rates, finance charges and other charges; (3) require disclosures to customers; (4) govern secured transactions; (5) set collection, foreclosure, repossession and claims handling procedures and other trade practices; and (6) regulate affordable housing rental activities. Although most states do not regulate commercial finance, certain states impose limitations on interest rates and other charges and on certain collection practices and creditor remedies, and require licensing of lenders and financiers and adequate disclosure of certain contract terms. We are also required to comply with certain provisions of the Equal Credit Opportunity Act that are applicable to commercial loans and the Fair Housing Act. We intend to conduct our business so that we comply with such laws and regulations.
Competition
We are engaged in a competitive business. In our lending and investing activities, we compete for opportunities with a variety of institutional lenders and investors, including other REITs, specialty finance companies, public and private funds (including funds that Colony Capital or its affiliates may in the future sponsor, advise and/or manage), commercial and investment banks, commercial finance and insurance companies and other financial institutions. Several other REITs have raised, or are expected to raise, significant amounts of capital, and may have similar acquisition objectives that overlap with ours. These other REITs will increase competition for the available supply of mortgage assets suitable for purchase and origination. Furthermore, this competition in our target asset classes may lead to the yields of such assets decreasing, which may further limit our ability to generate satisfactory returns.
Some of our competitors may have a lower cost of funds and access to funding sources that are not available to us, such as the U.S. Government. Many of our competitors are not subject to the operating constraints associated with REIT rule compliance or maintenance of an exclusion from registration under the Investment Company Act. In addition, some of our competitors may have higher risk tolerances or different risk assessments, which could allow them to consider a wider variety of loans and investments, offer more attractive pricing or other terms and establish more relationships than us.
Recently proposed changes in the financial regulatory regime could decrease the current restrictions on banks and other financial institutions and may allow them to compete with us for investment opportunities that were previously not available to them. If these legislations are enacted, it could increase competition with our business. In the face of this competition, we believe access to our Manager’s and Colony Capital’s professionals and their industry expertise and relationships provide us with competitive advantages in assessing risks and determining appropriate pricing for potential investments. We believe these relationships enable us to compete more effectively for attractive investment opportunities.
Employees
We do not have any employees. We are externally managed by our Manager pursuant to the Management Agreement between our Manager and us (the “Management Agreement”). Our executive officers are employees of our Manager or one or more of its affiliates.
16
Corporate Information
The Company was formed as a Maryland corporation on August 23, 2017. Our principal executive offices are located at 515 S. Flower Street, 44th Floor, Los Angeles, CA 90071, and our telephone number is (310) 282-8820. Our website is www.clncredit.com. We make available, free of charge, on our website, our Annual Reports on Form 10-K, Quarterly Reports on Form 10-Q, Current Reports on Form 8-K and amendments to these reports filed or furnished pursuant to Section 13(a) or 15(d) of the Securities Exchange Act of 1934, as amended (the “Exchange Act”), as soon as reasonably practicable after these forms are filed with, or furnished to, the SEC. Our website address is included in this Annual Report on Form 10-K as a textual reference only and the information on the website is not incorporated by reference into this Annual Report on Form 10-K. All of our reports, proxy and information statements filed with the SEC can also be obtained at the SEC’s website at www.sec.gov.
The Company emphasizes the importance of professional business conduct and ethics through our corporate governance initiatives. Our board of directors consists of a majority of independent directors; the audit, compensation, and nominating and corporate governance committees of the board of directors are composed exclusively of independent directors. Additionally, the following documents relating to corporate governance are available on our website under “Shareholders—Corporate Governance”:
• Corporate Governance Guidelines
• Code of Business Conduct and Ethics
• Code of Ethics for Principal Executive Officer and Senior Financial Officers
• Complaint Procedures for Accounting and Auditing Matters
• Audit Committee Charter
• Compensation Committee Charter
• Nominating and Corporate Governance Committee Charter
These corporate governance documents are also available in print free of charge to any security holder who requests them in writing to: Colony Credit Real Estate, Inc., Attention: Investor Relations, 515 South Flower Street, 44th Floor, Los Angeles, California, 90071. Within the time period required by the rules of the SEC and the NYSE, we will post on our website any amendment to such corporate governance documents.
Information contained on our website is not incorporated by reference into this Annual Report and such information should not be considered to be part of this report.
17
Item 1A. Risk Factors
The following risk factors and other information included in this Annual Report on Form 10-K should be carefully considered. Set forth below are the risks and uncertainties that we believe are material to stockholders but are not the only ones we face. Additional risks and uncertainties not presently known to us that we currently deem immaterial or that generally apply to all businesses also may adversely impact our business. If any of the following risks occur, our business, financial condition, operating results, cash flow and liquidity could be materially adversely affected. Some statements in this Annual Report on Form 10-K, including statements in the following risk factors, constitute forward-looking statements. Please refer to the section entitled “Special Note Regarding Forward-Looking Statements” at the beginning of this Annual Report on Form 10-K.
Risks Related to Our Manager and Conflicts of Interests
We depend upon our Manager, Colony Capital and their key personnel for our success. The loss of or the inability to obtain key investment professionals at our Manager, Colony Capital or their affiliates, or limits on or the loss of Colony Capital’s support to us or our Manager, could delay or hinder implementation of our investment strategy. We may not find a suitable replacement for our Manager if the Management Agreement is terminated.
Our ability to achieve our investment objectives depends in substantial part upon the performance of our Manager in the origination, acquisition and management of our investments, including the determination of any financing arrangements, as well as the performance of the third-party servicers (including any affiliated Colony Capital servicer) of our real estate debt investments. Subject to investment, leverage and other guidelines or policies adopted by the Board of Directors, our Manager has discretion regarding the implementation of our investment and operating policies and strategies. Accordingly, we believe that our success will depend significantly upon the experience, skill, resources, relationships and contacts of the executive officers and key personnel of our Manager, Colony Capital and their affiliates. Executive officers and key personnel of our Manager and Colony Capital will evaluate, negotiate, close and monitor our investments; therefore, our success will depend on their continued service. We cannot assure stockholders that such key personnel will continue to be associated with our Manager, Colony Capital or their affiliates in the future. The departure of any of these persons could have a material adverse effect on our performance and we can provide no assurance that our Manager, Colony Capital or their affiliates could attract other highly skilled professionals.
Neither our Manager nor Colony Capital is obligated to dedicate any specific personnel exclusively to us, nor are they or their personnel obligated to dedicate any specific portion of their time to the management of our business. As a result, we cannot provide any assurances regarding the amount of time our Manager or Colony Capital will dedicate to the management of our business. Moreover, each of our officers and non-independent directors is also an employee of our Manager, Colony Capital or one of their affiliates, has significant responsibilities for other investment vehicles currently managed by Colony Capital or its affiliates, and may not always be able to devote sufficient time to the management of our business. Consequently, we may not receive the level of support and assistance that we otherwise might receive if we were internally managed.
Uncertainty regarding business events and operations at our Manager, Colony Capital and their affiliates may have an adverse effect on us. These uncertainties could disrupt our business, and cause clients and others that deal with us or our Manager to seek to change existing business relationships, cease doing business with us or our Manager or cause potential new clients to delay doing or elect not to do business with us.
In addition, we can offer no assurance that our Manager will remain our investment manager or that we will continue to have access to our Manager’s and Colony Capital’s officers and key personnel. The current term of the Management Agreement extends to January 31, 2021, the third anniversary of the completion of the Combination and will be automatically renewed for a one-year term each anniversary thereafter; provided, however, that our Manager may terminate the Management Agreement annually upon 180 days’ prior notice following the expiration of the initial three-year term or any subsequent renewal term. If the Management Agreement is terminated and no suitable replacement manager is found to manage us, we may not be able to execute our business plan.
There are various conflicts of interest in our relationship with our Manager, Colony Capital and their affiliates, which could result in decisions which are not in the best interest of our stockholders.
We are subject to conflicts of interest arising out of our relationship with our Manager, Colony Capital and their affiliates. We rely on our Manager’s or its affiliates’ executive officers and investment professionals to identify suitable investment opportunities for our Company. These executive officers and investment professionals may also be executive officers, directors and managers of Colony Capital and its affiliates, including closed-end or open-end investment funds, vehicles (including public non-traded real estate investment trusts, registered investment companies and externally managed public companies), accounts, products and/or other similar arrangements sponsored, branded, advised and/or managed by Colony Capital or any of its affiliates, in existence or subsequently established (including any related successor funds, alternative vehicles, supplemental capital vehicles, co-investment vehicles and other entities formed and managed in connection with Colony Capital’s investment management activities) (collectively, the “Managed Companies”). As a result, those executive officers and investment professionals owe duties to each
18
of these entities, their members and limited partners and investors, which duties may from time-to-time conflict with the duties that they owe to us and our stockholders.
The Manager and its affiliates, including Colony Capital, and their respective officers, directors, employees and personnel may engage in business opportunities that are the same or similar to our activities and provide investment advisory services to others with investment objectives or policies that are similar to ours, including advising Managed Companies. Therefore, many investment opportunities sourced by our Manager or its affiliates that are suitable for us may also be suitable for Colony Capital and/or other Managed Companies. In addition, the activities of other Managed Companies of Colony Capital or its affiliates could restrict our ability to pursue certain asset acquisitions or take other actions related to our business.
As of December 31, 2018, there were
three
other Managed Companies with investment objectives or guidelines that overlapped in part with ours and remain in their investment stage, with approximately
$70
million of uncommitted capital availability in the aggregate as of December 31, 2018. These companies are not raising further investment capital.
Furthermore, our Manager’s associated persons who are responsible for allocating investment opportunities among clients must ensure that allocations comply with the requirements of the investment allocation policy, the Investment Advisers Act of 1940, as amended (the “Advisers Act”), and other applicable laws and regulations, any exemptive relief provided to our Manager or its affiliates or clients, and the terms of each relevant client operating agreement or constituent documents, offering materials and/or advisory agreements. A dedicated mandate may cause certain Managed Companies to have priority over other Managed Companies (including us) with respect to specific investment opportunities. A preference for such a dedicated mandate may result in fewer of such investment opportunities being made available to us to the extent they are within our investment strategy.
If it is determined that an investment is most suitable for a particular client, the investment will be allocated to such client. If it is determined that an investment is equally suitable for two or more clients, then our Manager may allocate the investment among such clients on a rotational basis. In general, a rotational allocation methodology means that if a client has been previously allocated an investment as a result of the rotational process, it may be skipped in the rotation until all other clients for which a particular investment is equally suitable have been allocated an investment. However, there is no guarantee that additional investment opportunities will become available in the future. Subject to regulatory restrictions, SEC guidance and any exemptive orders obtained by one or more Managed Companies (as applicable), our Manager may deem it appropriate for us and one or more other Managed Companies to co-invest in an investment opportunity (based on available capital, among other relevant factors, to the extent required). To the extent that a Managed Company has significant available capital, the likelihood that we may co-invest in a particular asset with such fund could increase significantly. In addition, because affiliates of Colony Capital also manage the Managed Companies, and fees payable to such affiliates by the Managed Companies may be more advantageous than fees payable to our Manager, our interests in such investments may conflict with the interests of the Managed Companies, and our Manager or its affiliates may take actions that may not be most favorable to us, including in the event of a default or restructuring of assets subject to co-investment rights.
The decision of how any potential investment should be allocated among clients in many cases may be a matter of highly subjective judgment, which will be made by our Manager in its sole discretion. Stockholders may not agree with the determination, and such determination could have an adverse effect on our investment strategy. Our right to participate in the investment allocation process described above will terminate once we are no longer advised by our Manager or its affiliates.
In addition, subject to compliance with the Advisers Act, and the rules promulgated thereunder, we may enter into principal transactions with our Manager or its affiliates or cross-transactions with other Managed Companies. For certain cross-transactions, our Manager may receive a fee from us or another Managed Company and conflicts may exist. There is no guarantee that any such transactions will be favorable to us. Because our interests and the interests of Colony Capital and our Manager may not be aligned, we may face conflicts of interest that result in action or inaction that is detrimental to us.
Further, there are conflicts of interest that arise when our Manager makes expense allocation determinations, as well as in connection with any fees payable between us and our Manager. These fees and allocation determinations are sometimes based on estimates or judgments, which may not be correct and could result in our Manager’s failure to allocate certain fees and costs to us appropriately.
In addition, as certain Managed Companies are, and other co-investment funds managed by Colony Capital and its affiliates in the future likely will be, closed-end funds with finite lives, such funds are expected to dispose of substantially all of the assets in their respective portfolios prior to dissolution. As a result, prior to such dissolutions, we may need to sell our interests in the co-investment assets before we otherwise would in order to avoid a potential conflict. Our decision to sell such interests will depend, among other things, on our ability to sell the interests at favorable prices or at all. It is also possible that our Manager or its affiliates, who also manage such funds, may sell such co-investment assets at times or prices that are not in the best interests of us or our stockholders. In addition, to the extent that such funds dispose of co-investment assets that are qualifying assets, we may be required to purchase additional qualifying assets (subject to the availability of capital at favorable prices or at all) or sell non-qualifying assets at inopportune times or prices in order to maintain our qualification as a REIT and our exemption from registration
19
under the Investment Company Act. Even if our interests are not in conflict with those of funds with co-investment rights, we will not realize the full economic benefits of the investment. If any of the foregoing were to occur, our Manager’s ability to operate our business in a manner consistent with our business strategy could be hindered materially, which could have a material adverse effect on our results of operations and our ability to make distributions to our stockholders.
Our Manager and its affiliates receive fees in connection with the management of our investments regardless of their quality or performance. As a result, our Manager may be incentivized to allocate investments that have a greater cost to increase the amount of fees payable to them.
Our Manager and its affiliates receive fees in connection with the management of our investments regardless of their quality or performance or the services provided. Our Manager’s entitlement to base management fees, which are not based upon performance metrics or goals, could reduce its incentive to devote its time and effort to seeking loans and investments that provide attractive risk-adjusted returns for our portfolio. Consequently, we are required to pay our Manager base management fees in a particular period despite experiencing a net loss or a decline in the value of our portfolio during that period.
These management fees could influence the advice given to us by the key personnel of our Manager and its affiliates, including our Manager’s investment committee. Among other matters, these compensation arrangements could affect their judgment with respect to:
|
•
|
the continuation, renewal or enforcement of our agreements with our Manager and its affiliates, including the Management Agreement; and
|
|
•
|
whether we seek approval to internalize our management, which may entail acquiring assets from Colony Capital (such as office space, furnishings and technology costs) and employing our Manager or its affiliates’ professionals performing services for us for consideration that would be negotiated at that time and may result in these investment professionals receiving more compensation from us than they currently receive from our Manager or its affiliates.
|
In addition, our Manager has the ability to earn incentive fees each quarter based on our earnings, which may create an incentive for our Manager to invest in assets with higher yield potential, which are generally riskier or more speculative, or sell an asset prematurely for a gain, in an effort to increase our short-term net income and thereby increase the incentive fees to which it is entitled. If our interests and those of our Manager are not aligned, the execution of our business plan and our results of operations could be adversely affected, which could materially and adversely affect our results of operations and financial condition. Payment of these fees may also result in the immediate dilution of the value of stockholders’ investment and reduces the amount of cash available for investment or distribution to stockholders.
Our ability to achieve our investment objectives and to pay distributions depends in substantial part upon the performance of our Manager and third-party servicers. Any adverse changes in our Manager and its affiliates’ financial health, the public perception of our Manager, or our relationship with our Manager or its affiliates could hinder our operating performance and the return on stockholders’ investment.
We depend on our Manager for the identification and origination or acquisition of investments and the management of our assets and operation of our day-to-day activities. If our Manager performs poorly and as a result is unable to originate and/or acquire our investments successfully, we may be unable to achieve our investment objectives or to pay distributions to stockholders at presently contemplated levels, if at all. Our Manager’s platform may not be scalable if our business grows substantially, it may be unable to make significant investments on a timely basis or at reasonable costs, or its service providers may be strained by our growth, which could disrupt our business and operations. Similarly, if our third-party servicers (including any affiliated Colony Capital servicer) perform poorly, we may be unable to realize all cash flow associated with our real estate debt and debt-like investments.
Because Colony Capital is a publicly traded company, any negative reaction by the stock market reflected in its stock price or deterioration in the public perception of Colony Capital or other publicly traded Managed Companies, such as NorthStar Europe, could result in an adverse effect on our ability to acquire assets and obtain financing from third parties on favorable terms or at all. Any adverse changes in the financial condition of our Manager or its affiliates, including Colony Capital, or our relationship with them could hinder their ability to successfully manage our operations and our portfolio of investments.
Our Manager may not be successful, or there may be delays, in locating or allocating suitable investments, which could limit our ability to make distributions and lower the overall return on stockholders’ investment.
Our Manager may not be successful in locating suitable investments on financially attractive terms. If we, through our Manager, are unable to find and allocate suitable investments promptly, we may hold the funds available for investment in an interest-bearing account or invest the proceeds in short-term assets. We expect that the income we earn on these temporary investments will not be substantial. In the event we are unable to timely locate suitable investments, we may be unable or limited in our ability to pay
20
distributions, and we may not be able to meet our investment objectives. Further, the more money we have available for investment, the more difficult it will be to invest the funds promptly and on attractive terms. If our Manager is able to identify suitable investments, it may not be successful in consummating the investment, resulting in increased costs and diversion in the investment professionals’ time, or if consummated, the returns on the investments may be below expectations.
Our Manager manages our portfolio pursuant to investment guidelines and is not required to seek the approval of our Board of Directors for each investment, financing, asset allocation or hedging decision made by it (subject to the net commitment thresholds set forth in our investment guidelines), which may result in riskier loans and investments and which could adversely affect our results of operations and financial condition.
Our Manager is authorized to follow investment guidelines that provide it with broad discretion in investment, financing, asset allocation and hedging decisions to the extent, generally, that any such investment contemplates a total net commitment by the OP of less than 3% of the OP’s net equity. Our investment guidelines may be changed at any time with the consent of our Board of Directors, but without the consent of our stockholders. Our Board of Directors will periodically review our investment guidelines and our loan and investment portfolio but is not required to review and approve in advance all of our proposed loans and investments or our Manager’s financing, asset allocation or hedging decisions, subject to the net commitment thresholds set forth in our investment guidelines. Subject to maintaining our REIT qualification and our exclusion from registration under the Investment Company Act, our Manager has latitude within the investment guidelines in determining the types of loans and investments it makes for us and how such loans and investments are financed or hedged and there are no limits on geographic or industry concentration, which could result in investment returns that are substantially below expectations or that result in losses, which could adversely affect our results of operations and financial condition.
Colony Capital and/or our Manager may revise our investment allocation policy and may in the future change then-existing, or adopt additional, conflicts of interest resolution policies and procedures designed to support the fair and equitable allocation of investments and to prevent the preferential allocation of investment opportunities among entities with overlapping investment objectives. The result of such a revision to the investment allocation policy may, among other things, be to increase the number of parties who have the right to participate in investment opportunities sourced by our Manager and its affiliates and/or its partners, thereby reducing the number of investment opportunities available to us. The investment allocation policy may not be materially amended in any manner that is reasonably likely to be adverse to us unless such amendment has been approved by a majority of our independent directors. Material changes to the investment allocation policy will be disclosed to clients and in public filings with the SEC, as appropriate. Our independent directors will periodically review our Manager’s and Colony Capital’s compliance with these conflicts of interest and allocation provisions.
The Management Agreement with our Manager was negotiated among related parties and may not be as favorable to us as if it had been negotiated with an unaffiliated third party and may be costly and difficult to terminate.
Certain of our executive officers and directors are executives of Colony Capital. The Management Agreement was negotiated among related parties and its terms, including the fees to be paid to our Manager and its affiliates for services they provide for us were not determined on an arm’s length basis. Subject to certain limitations and exceptions, we also reimburse our Manager for both direct expenses as well as indirect costs, including our allocable share of personnel and employment costs of our Manager and its affiliates, which may include certain executive officers and non-investment personnel of our Manager and its affiliates, as well as expenses related to any office or office facilities, technology, travel and other general and administrative costs and expenses. As a result, the fees and reimbursements may be in excess of amounts that we would otherwise pay to third parties for such services.
Termination of the Management Agreement without cause will be difficult and costly. We may elect not to renew the Management Agreement upon the expiration of the initial three-year term or any subsequent renewal term by providing at least 180 days’ prior written notice to our Manager only if there has been an affirmative vote of at least two-thirds of our independent directors then serving on our Board of Directors that (i) there has been unsatisfactory performance by our Manager that is materially detrimental to us or (ii) the compensation we pay to our Manager, in the form of base management fees and incentive fees, or the amount thereof, is unfair to us, subject to our Manager’s right to prevent any termination due to unfair fees by accepting a reduction of management and/or incentive fees agreed to by at least two-thirds of our independent directors. Upon such a termination, or if we materially breach the Management Agreement and our Manager terminates the Management Agreement, the Management Agreement provides that we will be required to pay our Manager a termination fee, which is equal to three (3) times the sum of (x) the average annual base management fee and (y) the average annual incentive fee, in each case earned by our Manager during the 24-month period immediately preceding the most recently completed calendar quarter prior to the date of termination. Additionally, upon termination of the Management Agreement for any reason, including for cause, we will be required to pay our Manager all accrued and unpaid fees and expense reimbursements earned prior to the date of termination.
To the extent permitted by law, our Manager maintains a contractual as opposed to a fiduciary relationship with us. Our Manager’s liability is limited under the Management Agreement, and we have agreed to indemnify our Manager against certain liabilities.
21
Pursuant to the Management Agreement, our Manager will not assume any responsibility other than to render the services called for thereunder and will not be responsible for any action of our Board of Directors in following or declining to follow its advice or recommendations. To the extent permitted by law, our Manager maintains a contractual as opposed to a fiduciary relationship with us. Under the terms of the Management Agreement, our Manager and its affiliates, including their respective directors, members, officers, managers, employees, trustees, control persons, partners, stockholders and equityholders, will not be liable to us, any of our subsidiaries, our Board of Directors, our stockholders or any of our subsidiaries’ stockholders, members or partners for acts or omissions performed in accordance with and pursuant to the Management Agreement, unless such acts or omissions constitute gross negligence, fraud, willful misconduct, bad faith or reckless disregard of their duties under the Management Agreement. We have agreed to indemnify our Manager and its affiliates, including their respective directors, members, officers, managers, employees, trustees, control persons, partners, stockholders and equityholders from and against any and all expenses, losses, damages, liabilities, demands, charges and claims of any nature, including reasonable legal fees and other expenses reasonably incurred in respect of, arising out of or in connection with our business and operations or any action taken or omitted by any such person in good faith by or on our behalf pursuant to authority granted by the Management Agreement, except where found by a court of competent jurisdiction to be attributable to the gross negligence, fraud, willful misconduct or bad faith by such person or the reckless disregard by such person of their duties under the Management Agreement. As a result, we could experience poor performance or losses for which our Manager would not be liable.
Risks Related to Our Company and Our Structure
We have limited operating history and may not be able to operate our business successfully or generate sufficient revenue to make or sustain distributions to our stockholders.
We were organized in August 2017 and began operations in February 2018, following the closing of the Combination. We cannot assure you that we will be able to operate our business successfully or implement our operating policies and strategies as described in this Annual Report on Form 10-K. The results of our operations depend on several factors, including the availability of opportunities for the acquisition of our target assets, the level and volatility of interest rates, the availability of adequate short and long-term financing, conditions in the financial markets and economic conditions.
We may not realize the anticipated benefits of the Combination.
Our management will have to dedicate substantial effort to integrating the businesses of the CLNY OP Contributed Entities, the RED REIT Contributed Entities, NorthStar I and NorthStar II. These efforts may divert management’s focus and resources from our business, corporate initiatives or strategic opportunities. In addition, the actual integration may result in additional and unforeseen expenses and delays and the anticipated benefits of the integration may not be realized. Actual growth and cost savings, if achieved, may be lower than what we expect and may take longer to achieve than anticipated. Difficulties associated with managing our large and complex portfolio could prevent us from realizing the anticipated benefits of the Combination and have a material adverse effect on our business. If we are not able to address integration challenges adequately, we may be unable to integrate successfully the operations of the CLNY OP Contributed Entities and the RED REIT Contributed Entities, NorthStar I and NorthStar II or to realize the anticipated benefits of the integration of the CLNY OP Contributed Entities, the RED REIT Contributed Entities, NorthStar I and NorthStar II.
We have not established a minimum distribution payment level, and we cannot assure you of our ability to pay distributions in the future.
We are generally required to distribute to our stockholders at least 90% of our REIT taxable income each year for us to qualify as a REIT under the Code, which requirement we currently intend to satisfy through monthly distributions of all or substantially all of our REIT taxable income in such year, subject to certain adjustments. We have not established a minimum distribution payment level, and our ability to make distributions may be materially and adversely affected by a number of factors, including the risk factors described herein. Distributions to our stockholders, if any, will be authorized by our Board of Directors in its sole discretion and declared by us out of funds legally available therefore and will be dependent upon a number of factors, including our targeted distribution rate, access to cash in the capital markets and other financing sources, historical and projected results of operations, cash flows and financial condition, our view of our ability to realize gains in the future through appreciation in the value of our assets, general economic conditions and economic conditions that more specifically impact our business or prospects, our financing covenants, maintenance of our REIT qualification, applicable provisions of the Maryland General Corporation Law (the “MGCL”) and such other factors as our Board of Directors deems relevant.
We believe that a change in any one of the following factors could adversely affect our results of operations and cash flows and impair our ability to make distributions to our stockholders:
|
•
|
our ability to make attractive investments;
|
|
•
|
margin calls or other expenses that reduce our cash flows;
|
22
|
•
|
defaults or prepayments in our investment portfolio or decreases in the value of our investment portfolio; and
|
|
•
|
the fact that anticipated operating expense levels may not prove accurate, as actual results may vary from estimates.
|
As a result, no assurance can be given that we will be able to make distributions to our stockholders at any time in the future or that the level of any distributions we do make to our stockholders will achieve a market yield or increase or even be maintained over time, any of which could materially and adversely affect us.
In addition, distributions out of our current earnings and profits that we make to our stockholders will generally be taxable to our stockholders as ordinary income. However, a portion of our distributions may be designated by us as (i) “capital gain dividends” to the extent that they are attributable to capital gain income recognized by us, (ii) “qualified dividend income,” or (iii) may constitute a return of capital to the extent that they exceed our current earnings and profits as determined for U.S. federal income tax purposes. A return of capital is not taxable, but has the effect of reducing the basis of a stockholder’s investment in our Class A common stock.
Stockholders have limited control over changes in our policies and operations, which increases the uncertainty and risks they face as stockholders.
Our Board of Directors determines our major policies, including our policies regarding growth, REIT qualification and distributions. Our Board of Directors may amend or revise these and other policies without a vote of the stockholders. We may change our investment policies without stockholder notice or consent, which could result in investments that are riskier or different than our current investments. Our Board of Directors’ broad discretion in setting policies and stockholders’ inability to exert control over those policies increases the uncertainty and risks stockholders face.
Certain provisions of Maryland law may limit the ability of a third party to acquire control of us.
Certain provisions of the MGCL may have the effect of inhibiting a third party from acquiring our Company or of impeding a change of control under circumstances that otherwise could provide our Company’s stockholders with the opportunity to realize a premium over the then-prevailing market price of our Class A common stock, including:
|
•
|
“business combination”
provisions that, subject to limitations, prohibit certain business combinations between an “interested stockholder” (defined generally as any person who beneficially owns 10% or more of the voting power of our Company’s outstanding shares of voting stock or an affiliate or associate of the corporation who, at any time within the two-year period immediately prior to the date in question, was the beneficial owner of 10% or more of the voting power of the then-outstanding stock of the corporation) or an affiliate of any interested stockholder and our Company for five years after the most recent date on which the stockholder becomes an interested stockholder and thereafter imposes two super-majority stockholder voting requirements on these combinations; and
|
|
•
|
“control share”
provisions that provide that holders of “control shares” of our Company (defined as outstanding voting shares of stock that, if aggregated with all other shares of stock owned by the acquiror or in respect of which the acquirer is able to exercise or direct the exercise of voting power (except solely by virtue of a revocable proxy), would entitle the acquiror to exercise one of three increasing ranges of voting power in electing directors) acquired in a “control share acquisition” (defined as the acquisition of issued and outstanding “control shares”) have no voting rights except to the extent approved by the affirmative vote of the holders entitled to cast two-thirds of the votes entitled to be cast on the matter, excluding all interested shares.
|
In accordance with Maryland Business Combination Act our Board of Directors has exempted any business combinations between us and any person, provided that any such business combination is first approved by our Board of Directors. Consequently, the five-year prohibition and the super-majority vote requirements will not apply to any future business combinations between us and any of our interested stockholders (or their affiliates) that are first approved by our Board of Directors, including any future business combination with the OP or any current or future affiliates of the OP. Our bylaws contain a provision exempting us from the Maryland Control Share Acquisition Act. There can be no assurance that these resolutions or exemptions will not be amended or eliminated at any time in the future.
Additionally, Title 3, Subtitle 8 of the MGCL permits our Board of Directors, without stockholder approval and regardless of what currently is provided in our charter and our bylaws, to implement certain takeover defenses, such as a classified board, some of which we do not have.
Ownership limitations may delay, defer or prevent a transaction or a change in our control that might involve a premium price for our Class A common stock or otherwise be in the best interest of our stockholders.
In order for us to maintain our qualification as a REIT under the Code, not more than 50% of the value of the outstanding shares of our capital stock may be owned, directly or indirectly, by five or fewer individuals (as defined in the Code to include certain
23
entities) during the last half of a taxable year. Our charter, with certain exceptions, authorizes our Board of Directors to take the actions that are necessary or appropriate to preserve our qualification as a REIT. Unless exempted by our Board of Directors, no person may actually or constructively own more than 9.8% of the aggregate of the outstanding shares of our capital stock (as defined in our charter) by value or 9.8% of the aggregate of the outstanding shares of our common stock (as defined in our charter) by value or by number of shares, whichever is more restrictive. Our Board of Directors, in its sole discretion, may exempt (prospectively or retroactively) a person from this limitation if it obtains such representations, covenants and undertakings as it deems appropriate to conclude that granting the exemption will not cause us to lose our status as a REIT. These ownership limitations in our charter are standard in REIT charters and are intended to provide added assurance of compliance with the tax law requirements, and to reduce administrative burdens. However, these ownership limits might also delay, defer or prevent a transaction or a change in control that might involve a premium price for our Class A common stock or otherwise be in the best interest of our stockholders or result in the transfer of shares acquired in excess of the ownership limits to a trust for the benefit of a charitable beneficiary and, as a result, the forfeiture by the acquirer of the benefits of owning the additional shares.
Our charter contains provisions that make removal of our directors difficult, which makes it more difficult for our stockholders to effect changes to our management and may prevent a change in control of our Company that is otherwise in the best interests of our stockholders.
Our charter provides that a director may be removed only for cause and then only by the affirmative vote of at least two-thirds of the votes entitled to be cast generally in the election of directors. Vacancies on our Board of Directors may be filled only by the affirmative vote of a majority of the remaining directors then in office, even if the remaining directors do not constitute a quorum, and directors elected to fill a vacancy will serve for the full term of the class of directors in which the vacancy occurred. These requirements make it more difficult for our stockholders to effect changes to our management by removing and replacing directors and may prevent a change in control of our company that is otherwise in the best interests of our stockholders.
Our charter permits our Board of Directors to issue stock with terms that may subordinate the rights of our Class A common stockholders or discourage a third party from acquiring us in a manner that could result in a premium price to stockholders.
Our Board of Directors may classify or reclassify any unissued shares of common stock, classify any unissued shares of our preferred stock, as applicable, and reclassify any previously classified but unissued shares of our preferred stock into other classes or series of stock and set the preferences, conversion or other rights, voting powers, restrictions, limitations as to dividends or other distributions, qualifications and terms and conditions of redemption of any such stock. Thus, our Board of Directors could authorize the issuance of preferred stock with priority as to distributions and amounts payable upon liquidation over the rights of the holders of our Class A common stock. Such preferred stock could also have the effect of delaying, deferring or preventing a change in control of us, including an extraordinary transaction (such as a merger, tender offer or sale of all or substantially all of our assets) that might provide a premium price to holders of our Class A common stock. Additionally, our Board of Directors may amend our charter from time to time to increase or decrease the aggregate number of authorized shares of stock or the number of authorized shares of any class or series of stock without stockholder approval.
Our umbrella partnership real estate investment trust, or UPREIT, structure may result in potential conflicts of interest with members of our operating company whose interests may not be aligned with those of stockholders.
Members of our operating company have the right to vote on certain amendments to the limited liability company agreement, as well as on certain other matters. Persons holding such voting rights may exercise them in a manner that conflicts with the interests of our stockholders. As managing member of our operating company, we are obligated to act in a manner that is in the best interest of our operating company. Circumstances may arise in the future when the interests of members in our operating company may conflict with the interests of our stockholders. These conflicts may be resolved in a manner stockholders do not believe are in their best interests.
Failure to obtain, maintain or renew required licenses and authorizations necessary to operate our mortgage-related activities may have a material adverse effect us.
We and our Manager are required to obtain, maintain or renew certain licenses and authorizations (including “doing business” authorizations and licenses to act as a commercial mortgage lender) from U.S. federal or state governmental authorities, government sponsored entities or similar bodies in connection with some or all of our mortgage-related activities. There is no assurance that we or our Manager will be able to obtain, maintain or renew any or all of the licenses and authorizations that we require or that we or our Manager will avoid experiencing significant delays in connection therewith. The failure of our Company or our Manager to obtain, maintain or renew licenses will restrict our options and ability to engage in desired activities, and could subject us to fines, suspensions, terminations and various other adverse actions if it is determined that we or our Manager have engaged without the requisite licenses or authorizations in activities that required a license or authorization, which could have a material adverse effect on us.
24
If we are unable to implement and maintain effective internal controls over financial reporting in the future, investors may lose confidence in the accuracy and completeness of our financial reports and the market price of our Class A common stock could be negatively affected.
As a public company, we will be required to maintain internal controls over financial reporting and to report any material weaknesses in such internal controls. The process of designing, implementing and testing the internal controls over financial reporting required to comply with this obligation is time consuming, costly and complicated. If we identify material weaknesses in our internal controls over financial reporting, if we are unable to comply with the requirements of Section 404 of the Sarbanes-Oxley Act in a timely manner or to assert that our internal controls over financial reporting is effective, or if our independent registered public accounting firm is unable to express an opinion as to the effectiveness of our internal controls over financial reporting, investors may lose confidence in the accuracy and completeness of our financial reports, and the market price of our Class A common stock could be negatively affected. We could also become subject to investigations by the stock exchange on which our securities are listed, the SEC or other regulatory authorities, which could require additional financial and management resources.
Failure to implement effective information and cyber security policies, procedures and capabilities could disrupt our business and harm our results of operations.
Our business is highly dependent on communications and information systems of Colony Capital. We are dependent on the effectiveness of such information and cyber security policies, procedures and capabilities to protect our computer and telecommunications systems and the data that resides on or is transmitted through them. An externally caused information security incident, such as a hacker attack, virus or worm, or an internally caused issue, such as failure to control access to sensitive systems, could materially interrupt business operations or cause disclosure or modification of sensitive or confidential information and could result in material financial loss, loss of competitive position, regulatory actions, breach of contracts, reputational harm or legal liability.
We do not own the Colony Capital name, but have entered into a license agreement with an affiliate of Colony Capital granting us the right to use the Colony Capital name. Use of the name by other parties or the termination of our license agreement may harm our business.
Concurrently with the completion of the Combination, we entered into a license agreement pursuant to which we have a non-exclusive, royalty-free license to use the name “Colony Capital.” Under this agreement, we have a right to use the “Colony Capital” name as long as our Manager is affiliated with Colony Capital. Colony Capital will retain the right to continue using the “Colony Capital” name. We will further be unable to preclude Colony Capital from licensing or transferring the ownership of the “Colony Capital” name to third parties, some of whom may compete against us. Consequently, we will be unable to prevent any damage to goodwill that may occur as a result of the activities of Colony Capital or others. Furthermore, in the event the license agreement is terminated, we will be required to change our name and cease using the “Colony Capital” name. Any of these events could disrupt our recognition in the marketplace, damage any goodwill we may have generated and otherwise harm our business.
Risks Related to Our Business and Our Investments
Our CRE debt, select equity and securities investments are subject to the risks typically associated with real estate.
Our CRE debt, select equity and securities investments are subject to the risks typically associated with real estate, including:
|
•
|
tenant mix;
|
|
•
|
real estate conditions, such as an oversupply of or a reduction in demand for real estate space in an area;
|
|
•
|
lack of liquidity inherent in the nature of the assets;
|
|
•
|
borrower/tenant/operator mix and the success of the borrower/tenant/operator business;
|
|
•
|
success of tenant businesses;
|
|
•
|
ability to collect interest/loan obligation/principal;
|
|
•
|
property management decisions;
|
|
•
|
property location, condition and design;
|
|
•
|
competition from comparable types of properties;
|
|
•
|
changes in laws that increase operating expenses or limit rents that may be charged;
|
|
•
|
changes in national, regional or local economic conditions and/or specific industry segments, including the credit and securitization markets;
|
25
|
•
|
declines in regional or local real estate values;
|
|
•
|
declines in regional or local rental or occupancy rates;
|
|
•
|
increases in interest rates, real estate tax rates and other operating expenses;
|
|
•
|
compliance with environmental laws
|
|
•
|
costs of remediation and liabilities associated with environmental conditions;
|
|
•
|
the potential for uninsured or underinsured property losses;
|
|
•
|
changes in governmental laws and regulations, including fiscal policies, zoning ordinances and environmental legislation and the related costs of compliance; and
|
|
•
|
acts of God, terrorist attacks, social unrest and civil disturbances.
|
The value of each investment is affected significantly by its ability to generate cash flow and net income, which in turn depends on the amount of financing/interest payments, rental or other income that can be generated net of expenses required to be incurred with respect to the investment. Many expenses associated with properties (such as operating expenses and capital expenses) cannot be reduced when there is a reduction in income from the properties. Some of our CRE securities may be subject to the risk of first loss and therefore could be adversely affected by payment defaults, delinquencies and others of these risks.
These factors may have a material adverse effect on the value and the return that we can realize from our assets, as well as the ability of our borrowers to pay their loans and the ability of the borrowers on the underlying loans securing our securities to pay their loans.
The B-Notes that we may acquire may be subject to additional risks related to the privately negotiated structure and terms of the transaction, which may result in significant operating losses to us and may limit our ability to make distributions to our stockholders.
We may acquire B-Notes. A B-Note is a mortgage loan typically (1) secured by a first mortgage on a single large commercial property or group of related properties (and therefore reflect the risks associated with significant concentration) and (2) subordinated to an A-Note secured by the same first mortgage on the same collateral. A privately negotiated intercreditor agreement between the holders of the A-Note and B-Note may restrict the rights of the B-Note holders. In particular, the intercreditor agreement may prohibit the B-Note holder from calling the loan, making modifications with respect to the loan or filing a bankruptcy petition without the consent of the A-Note holder. As a result, to the extent that we acquire B-Notes, the A-Note holder may take actions that we do not agree with and that are not in our stockholders’ best interests.
In addition, because the rights of the B-Note holder are subordinated to the rights of the A-Note holder, the B-Note may be the first to incur loss if the loan does not perform and the collateral value diminishes. As a result, if a borrower defaults, there may not be sufficient funds remaining for B-Note holders after payment to the A-Note holders. If there are insufficient funds after payment to the A-Note holders, we could incur significant losses related to our B-Notes, which would result in operating losses for us and may limit our ability to make distributions to our stockholders.
The mezzanine loan assets that we may acquire will involve greater risks of loss than senior loans secured by income-producing properties.
We may acquire mezzanine loans, which take the form of subordinated loans secured by second mortgages on the underlying property or loans secured by a pledge of the ownership interests of either the entity owning the property or a pledge of the ownership interests of the entity that owns the interest in the entity owning the property. These types of assets involve a higher degree of risk than long-term senior mortgage lending secured by income-producing real property, because the loan may become unsecured as a result of foreclosure by the senior lender. In addition, mezzanine loans may have higher loan-to-value ratios than conventional mortgage loans, resulting in less equity in the property and increasing the risk of loss of principal. If a borrower defaults on our mezzanine loan or debt senior to our loan, or in the event of a borrower bankruptcy, our mezzanine loan will be satisfied only after the senior debt is paid in full. Where debt senior to our loan exists, the presence of intercreditor arrangements between the holder of the mortgage loan and us, as the mezzanine lender, may limit our ability to amend our loan documents, assign our loans, accept prepayments, exercise our remedies and control decisions made in bankruptcy proceedings relating to borrowers. As a result, we may not recover some or all of our investment, which could result in losses. In addition, even if we are able to foreclose on the underlying collateral following a default on a mezzanine loan, we would be substituted for the defaulting borrower and, to the extent income generated on the underlying property is insufficient to meet outstanding debt obligations on the property, may need to commit substantial additional capital to stabilize the property and prevent additional defaults to lenders with existing liens on the property. Significant losses related to our mezzanine loans could have a material adverse effect on our results of operations and our ability to make distributions to our stockholders.
26
Participating interests may not be available and, even if obtained, may not be realized.
In connection with the origination or acquisition of certain structured finance assets, subject to maintaining our qualification as a REIT, we may obtain participating interests, or equity “kickers,” in the owner of the property that entitle us to payments based upon a development’s cash flow or profits or any increase in the value of the property that would be realized upon a refinancing or sale thereof. Competition for participating interests is dependent to a large degree upon market conditions. Participating interests are more difficult to obtain when real estate financing is available at relatively low interest rates. Participating interests are not insured or guaranteed by any governmental entity and are therefore subject to the general risks inherent in real estate investments. Therefore, even if we are successful in making investments that provide for participating interests, there can be no assurance that such interests will result in additional payments to us.
Any distressed loans or investments we make, or loans and investments that later become distressed, may subject us to losses and other risks relating to bankruptcy proceedings.
While our investment strategy focuses primarily on investments in “performing” real estate-related interests, our investment program may include making distressed investments from time to time (e.g., investments in defaulted, out-of-favor or distressed bank loans and debt securities) or may involve investments that become “non-performing” following our acquisition thereof. Certain of our investments may, therefore, include specific securities of companies that typically are highly leveraged, with significant burdens on cash flow and, therefore, involve a high degree of financial risk. During an economic downturn or recession, securities of financially troubled or operationally troubled issuers are more likely to go into default than securities of other issuers. Securities of financially troubled issuers and operationally troubled issuers are less liquid and more volatile than securities of companies not experiencing financial difficulties. The market prices of such securities are subject to erratic and abrupt market movements and the spread between bid and asked prices may be greater than normally expected. Investment in the securities of financially troubled issuers and operationally troubled issuers involves a high degree of credit and market risk.
In certain limited cases (e.g., in connection with a workout, restructuring and/or foreclosing proceedings involving one or more of our debt investments), the success of our investment strategy with respect thereto will depend, in part, on our ability to effectuate loan modifications and/or restructures. Identifying and implementing any such restructuring programs entails a high degree of uncertainty. There can be no assurance that we will be able to successfully identify and implement restructuring programs. Further, such modifications and/or restructuring may entail, among other things, a substantial reduction in the interest rate and a substantial writedown of the principal of such loan, debt securities or other interests. However, even if a restructuring were successfully accomplished, a risk exists that, upon maturity of such real estate loan, debt securities or other interests replacement “takeout” financing will not be available.
These financial difficulties may never be overcome and may cause borrowers to become subject to bankruptcy or other similar administrative proceedings. There is a possibility that we may incur substantial or total losses on our investments and in certain circumstances, become subject to certain additional potential liabilities that may exceed the value of our original investment therein. For example, under certain circumstances, a lender who has inappropriately exercised control over the management and policies of a debtor may have its claims subordinated or disallowed or may be found liable for damages suffered by parties as a result of such actions. In any reorganization or liquidation proceeding relating to our investments, we may lose our entire investment, may be required to accept cash or securities with a value less than our original investment and/or may be required to accept payment over an extended period of time. In addition, under certain circumstances, payments to us and distributions by us to the stockholders may be reclaimed if any such payment or distribution is later determined to have been a fraudulent conveyance, preferential payment or similar transaction under applicable bankruptcy and insolvency laws. Furthermore, bankruptcy laws and similar laws applicable to administrative proceedings may delay our ability to realize on collateral for loan positions held by us or may adversely affect the priority of such loans through doctrines such as equitable subordination or may result in a restructure of the debt through principles such as the “cramdown” provisions of the bankruptcy laws.
Provisions for loan losses and impairment charges are difficult to estimate, particularly in a challenging economic environment and if they turn out to be incorrect, our results of operations and financial condition could be materially and adversely impacted.
In a challenging economic environment, we may experience an increase in provisions for loan losses and asset impairment charges, as borrowers may be unable to remain current in payments on loans and declining property values weaken our collateral. Our determination of provision for loan losses requires us to make certain estimates and judgments based on a number of factors, including projected cash flow from the collateral securing our CRE debt, structure, including the availability of reserves and recourse guarantees, likelihood of repayment in full at the maturity of a loan, potential for refinancing and expected market discount rates for varying property types, all of which remain uncertain and are subjective. Some of our investments have limited liquidity or are not publicly traded and so we estimate the fair value of these investments on a quarterly basis. Also, the analysis of the value or income-producing ability of commercial property is highly subjective. Our estimates and judgments may not be correct, particularly during challenging economic environments when market volatility may make it difficult to determine the fair value of certain of our assets and liabilities or the likelihood of repayment of loans we originate. Subsequent valuations and estimates,
27
in light of factors then prevailing, may result in decreases in the values of our assets resulting in impairment charges or increases in loan loss provisions and therefore our results of operations, financial condition and our ability to make distributions to stockholders could be materially and adversely impacted.
Prepayment rates may adversely affect the value of our portfolio of assets.
Generally, our borrowers may repay their loans prior to their stated final maturities. In periods of declining interest rates and/or credit spreads, prepayment rates on loans generally increase. If general interest rates or credit spreads decline at the same time, the proceeds of such prepayments received during such periods are likely to be reinvested by us in assets yielding less than the yields on the assets that were prepaid. In addition, the value of our assets may be affected by prepayment rates on loans. If we originate or acquire mortgage-related securities or a pool of mortgage securities, we anticipate that the underlying mortgages will prepay at a projected rate generating an expected yield. If we purchase assets at a premium to par value, when borrowers prepay their loans faster than expected, the corresponding prepayments on the mortgage-related securities may reduce the expected yield on such securities because we will have to amortize the related premium on an accelerated basis. Conversely, if we purchase assets at a discount to par value, when borrowers prepay their loans slower than expected, the decrease in corresponding prepayments on the mortgage-related securities may reduce the expected yield on such securities because we will not be able to accrete the related discount as quickly as originally anticipated. In addition, as a result of the risk of prepayment, the market value of the prepaid assets may benefit less than other fixed income securities from declining interest rates.
Prepayment rates on loans may be affected by a number of factors including, but not limited to, the then-current level of interest rates and credit spreads, fluctuations in asset values, the availability of mortgage credit, the relative economic vitality of the area in which the related properties are located, the servicing of the loans, possible changes in tax laws, other opportunities for investment, and other economic, social, geographic, demographic and legal factors and other factors beyond our control. Consequently, such prepayment rates cannot be predicted with certainty and no strategy can completely insulate us from prepayment or other such risks.
We invest in preferred equity interests, which involve a greater risk than conventional senior, junior or mezzanine debt financing.
Our preferred equity investments involve a higher degree of risk than conventional debt financing due to a variety of factors, including their non-collateralized nature and subordinated ranking to other loans and liabilities of the entity in which such preferred equity is held. Accordingly, if the issuer defaults on our investment, we would only be able to proceed against such entity in accordance with the terms of the preferred security, and not against any property owned by such entity. Furthermore, in the event of bankruptcy or foreclosure, we would only be able to recoup our investment after all lenders to, and other creditors of, such entity are paid in full. As a result, we may lose all or a significant part of our investment, which could result in significant losses, have a material adverse effect on our results of operations and our ability to make distributions to our stockholders.
We invest in commercial properties subject to net leases, which could subject us to losses.
We invest in commercial properties subject to net leases. Typically, net leases require the tenants to pay substantially all of the operating costs associated with the properties. As a result, the value of, and income from, investments in commercial properties subject to net leases will depend, in part, upon the ability of the applicable tenant to meet its obligations to maintain the property under the terms of the net lease. If a tenant fails or becomes unable to so maintain a property, we will be subject to all risks associated with owning the underlying real estate. Under many net leases, however, the owner of the property retains certain obligations with respect to the property, including, among other things, the responsibility for maintenance and repair of the property, to provide adequate parking, maintenance of common areas and compliance with other affirmative covenants in the lease. If we were to fail to meet any such obligations, the applicable tenant could abate rent or terminate the applicable lease, which could result in a loss of our capital invested in, and anticipated profits from, the property.
We expect that some commercial properties subject to net leases in which we invest generally will be occupied by a single tenant and, therefore, the success of these investments will be materially dependent on the financial stability of each such tenant. A default of any such tenant on its lease payments to us would cause us to lose the revenue from the property and cause us to have to find an alternative source of revenue to meet any mortgage payment and prevent a foreclosure if the property is subject to a mortgage. In the event of a default, we may experience delays in enforcing our rights as landlord and may incur substantial costs in protecting our investment and re-letting our property. If a lease is terminated, we may also incur significant losses to make the leased premises ready for another tenant and experience difficulty or a significant delay in re-leasing such property.
In addition, net leases typically have longer lease terms and, thus, there is an increased risk that contractual rental increases in future years will fail to result in fair market rental rates during those years.
We may acquire these investments through sale-leaseback transactions, which involve the purchase of a property and the leasing of such property back to the seller thereof. If we enter into a sale-leaseback transaction, our Manager will seek to structure any such sale-leaseback transaction such that the lease will be characterized as a “true lease” for U.S. federal income tax purposes,
28
thereby allowing us to be treated as the owner of the property for U.S. federal income tax purposes. However, we cannot assure you that the Internal Revenue Service (the “IRS”) will not challenge such characterization. In the event that any such sale-leaseback transaction is challenged and recharacterized as a financing transaction or loan for U.S. federal income tax purposes, deductions for depreciation and cost recovery relating to such property would be disallowed. If a sale-leaseback transaction were so recharacterized, we might fail to satisfy the REIT qualification “asset tests” or “income tests” and, consequently, lose our REIT status effective with the year of recharacterization. Alternatively, the amount of our REIT taxable income could be recalculated, which might also cause us to fail to meet the REIT distribution requirement for a taxable year.
We have investments in private equity real estate (“PE”) funds, and there is no assurance these investments will achieve the returns expected upon initial execution of the respective investments.
The success of our PE investments in general is subject to a variety of risks, including, without limitation, risks related to: (i) the quality of the management of the portfolio funds in which we invest and the ability of such management to successfully select manage and dispose of investment opportunities; (ii) general economic conditions; and (iii) the ability of the portfolio funds and, if applicable, us, to liquidate investments on favorable terms or at all. Factors that could cause actual results to differ materially from our expectations include, but are not limited to, the possibility that: (a) the agreed upon net asset value (“NAV”) does not necessarily reflect the fair value of the fund interests on such date and the current fair value could be materially different; (b) the actual amount of future capital commitments underlying all of the fund interests that will be called and funded by us could vary materially from our expectations; and (c) because, among other matters, the sponsors of the private equity funds, rather than us, will control the investments in those funds, we could lose some or all of our investment. Furthermore, the timing in which we will realize proceeds, if any, from our PE investments could differ materially from expectations and our actual yield could be substantially lower than our assumed yield. There can be no assurance that the management team of a portfolio fund or any successor will be able to operate the portfolio fund in accordance with our expectations or that we will be able to recover on our investments. In addition, investments in a real estate private equity fund generally will be illiquid and entail the payment of certain expenses, plus management fees and carried interest to the general partner or investment manager of the fund, which are in addition to the fees and expenses incurred directly by us. In certain cases, the general partner or investment manager of the fund may be Colony Capital. Such fees and expenses reduce our returns. Furthermore, we have and may continue to acquire PE investments as co-investments with Colony Capital or other Managed Companies, which increases the likelihood that our Manager could have conflicts of interest with that company.
We invest in CRE securities, including CMBS and collateralized debt obligations (“CDOs”), which entail certain heightened risks and are subject to losses.
We invest in a variety of CRE securities, including CMBS, CDOs and other subordinate securities. The market for CRE securities is dependent upon liquidity for refinancing and may be negatively impacted by a slowdown in new issuance. For example, the equity interests of CDOs are illiquid and often must be held by a REIT. CRE securities such as CMBS may be subject to particular risks, including lack of standardized terms and payment of all or substantially all of the principal only at maturity rather than regular amortization of principal. The value of CRE securities may change due to interest rates, credit spreads, as well as shifts in the market’s perception of issuers and regulatory or tax changes adversely affecting the CRE debt market as a whole. The exercise of remedies and successful realization of liquidation proceeds relating to CRE securities may be highly dependent upon the performance of the servicer or special servicer. Ratings for CRE securities can also adversely affect their value. Moreover, some CRE securities, such as CDO notes, generally do not qualify as real estate assets for purposes of the gross asset and income requirements that apply to REITs, which could adversely affect our ability to qualify for tax treatment as a REIT.
Our investments in CMBS and CDOs are also subject to losses. In general, losses on a mortgaged property securing a mortgage loan included in a securitization will be borne first by the equity holder of the property, then by a cash reserve fund or letter of credit, if any, then by the holder of a mezzanine loan or B-Note, if any, then by the “first loss” subordinated security holder (generally, the “B-Piece” buyer) and then by the holder of a higher-rated security. In the event of default and the exhaustion of any equity support, reserve fund, letter of credit, mezzanine loans or B-Notes, and any classes of securities junior to those in which we invest, we will not be able to recover all of our investment in the securities we purchase. In addition, if the underlying mortgage portfolio has been overvalued by the originator, or if the values subsequently decline and, as a result, less collateral is available to satisfy interest and principal payments due on the related CMBS or CDO, there would be an increased risk of loss. The prices of lower credit quality securities are generally less sensitive to interest rate changes than more highly rated investments, but more sensitive to adverse economic downturns or individual issuer developments.
Adverse changes in general economic conditions could adversely impact our business, financial condition and results of operations.
Our business is also closely tied to general economic conditions of the areas where our investments are located and in the real estate industry generally. As a result, our economic performance, the value of our CRE debt and debt-like investments, real estate and real estate related investments, and our ability to implement our business strategies may be significantly and adversely affected
29
by changes in economic conditions in the United States where a substantial number of our investments are located and in international geographic areas, as applicable. The condition of the real estate markets in which we operate is cyclical and depends on the condition of the economy in the United States, Europe, China and elsewhere as a whole and to the perceptions of investors of the overall economic outlook. Rising interest rates, declining employment levels, declining demand for real estate, declining real estate values or periods of general economic slowdown or recession, increasing political instability or uncertainty, or the perception that any of these events may occur have negatively impacted the real estate market in the past and may in the future negatively impact our operating performance. Declining real estate values could reduce our level of new loan originations and make borrowers less likely to service the principal and interest on our CRE debt investments. Slower than expected economic growth pressured by a strained labor market, could result in lower occupancy rates and lower lease rates across many property types, which could create obstacles for us to achieve our business plans. In addition, the economic condition of each local market where we operate may depend on one or more key industries within that market, which, in turn, makes our business sensitive to the performance of those industries.
Adverse changes in general economic conditions may also disrupt the debt and equity capital markets and lack of access to capital or prohibitively high costs of obtaining or replacing capital may materially and adversely affect our business.
We have only a limited ability to change our portfolio promptly in response to economic or other conditions. Certain significant expenditures, such as debt service costs, real estate taxes, and operating and maintenance costs, are generally not reduced when market conditions are poor. These factors impede us from responding quickly to changes in the performance of our investments and could adversely impact our business, financial condition and results of operations.
We are subject to significant competition, and we may not be able to compete successfully for investments, which could have a material adverse effect on our business, financial condition and results of operations.
We are subject to significant competition for attractive investment opportunities from other financing institutions and investors, including those focused primarily on real estate and real estate-related investment activities, some of which have greater financial resources than we do, including publicly traded REITs, non-traded REITs, insurance companies, commercial and investment banking firms, private institutional funds, hedge funds, private equity funds and other investors (including other funds managed by Colony Capital). Several of our competitors, including other REITs, have recently raised, or are expected to raise, significant amounts of capital, and may have investment objectives that overlap with our investment objectives, which may create additional competition for lending and other investment opportunities. Some of our competitors may have a lower cost of funds and access to funding sources that may not be available to us or are only available to us on substantially less attractive terms. Many of our competitors are not subject to the operating constraints associated with REIT tax compliance or maintenance of an exclusion or exemption from the Investment Company Act. In addition, some of our competitors may have higher risk tolerances or different risk assessments, which could allow them to consider a wider variety of investments and establish more lending relationships than we can. If we pay higher prices for investments or originate loans on less advantageous terms to us, our returns may be lower and the value of our assets may not increase or may decrease significantly below the amount we paid for such assets. As we reinvest capital, we may not realize risk adjusted returns that are as attractive as those we have realized in the past. In addition, further changes in the financial regulatory regime could decrease the current restrictions on banks and other financial institutions and allow them to compete with us for investment opportunities that were previously not available to them. For example, amendments to the Dodd-Frank Act to diminish or eliminate risk retention requirements, among other things could increase competition with our business.
As a result of this competition, desirable loans and investments in our target assets may be limited in the future, and we may not be able to take advantage of attractive lending and investment opportunities from time to time. In addition, reduced CRE transaction volume could increase competition for available investment opportunities. We can provide no assurance that we will be able to identify and originate loans or make investments that are consistent with our investment objectives. We cannot assure you that the competitive pressures we face will not have a material adverse effect on our business, financial condition and results of operations.
We may not have control over certain of our loans and investments.
Our ability to manage our portfolio of loans and investments may be limited by the form in which they are made. In certain situations, we may:
|
•
|
acquire investments subject to rights of senior classes, special servicers or collateral managers under intercreditor, servicing agreements or securitization documents;
|
|
•
|
pledge our investments as collateral for financing arrangements;
|
|
•
|
acquire only a minority and/or a noncontrolling participation in an underlying investment;
|
30
|
•
|
co-invest with others through partnerships, joint ventures or other entities, thereby acquiring non-controlling interests; or
|
|
•
|
rely on independent third-party management or servicing with respect to the management of an asset.
|
Therefore, we may not be able to exercise control over all aspects of our loans or investments. Such financial assets may involve risks not present in investments where senior creditors, junior creditors, servicers or third parties controlling investors are not involved. Our rights to control the process following a borrower default may be subject to the rights of senior or junior creditors or servicers whose interests may not be aligned with ours. A partner or co-venturer may have financial difficulties resulting in a negative impact on such asset, may have economic or business interests or goals that are inconsistent with ours, or may be in a position to take action contrary to our investment objectives. In addition, we may, in certain circumstances, be liable for the actions of our partners or co-venturers.
Most of the commercial mortgage loans that we originate or acquire are non-recourse loans.
Except for customary non-recourse carve-outs for certain actions and environmental liability, most commercial mortgage loans are effectively non-recourse obligations of the sponsor and borrower, meaning that there is no recourse against the assets of the borrower or sponsor other than the underlying collateral. In the event of any default under a commercial mortgage loan held directly by us, we will bear a risk of loss to the extent of any deficiency between the value of the collateral and the principal of and accrued interest on the mortgage loan, which could materially and adversely affect us. There can be no assurance that the value of the assets securing our commercial mortgage loans will not deteriorate over time due to factors beyond our control, as was the case during the credit crisis and the economic recession that began in 2008. Even if a commercial mortgage loan is recourse to the borrower (or if a non-recourse carve-out to the borrower applies), in most cases, the borrower’s assets are limited primarily to its interest in the related mortgaged property. Further, although a commercial mortgage loan may provide for limited recourse to a principal or affiliate of the related borrower, there is no assurance that any recovery from such principal or affiliate will be made or that such principal’s or affiliate’s assets would be sufficient to pay any otherwise recoverable claim. In the event of the bankruptcy of a borrower, the loan to such borrower will be deemed to be secured only to the extent of the value of the underlying collateral at the time of bankruptcy (as determined by the bankruptcy court), and the lien securing the loan will be subject to the avoidance powers of the bankruptcy trustee or debtor-in-possession to the extent the lien is unenforceable under state law.
We may be subject to risks associated with future advance or capital expenditure obligations, such as declining real estate values and operating performance.
Our CRE debt investments may require us to advance future funds. We may also need to fund capital expenditures and other significant expenses for our real estate property investments. Future funding obligations subject us to significant risks, such as a decline in value of the property, cost overruns and the borrower or tenant may be unable to generate enough cash flow and execute its business plan, or sell or refinance the property, in order to repay its obligations to us. We could determine that we need to fund more money than we originally anticipated in order to maximize the value of our investment even though there is no assurance additional funding would be the best course of action. Further, future funding obligations may require us to maintain higher liquidity than we might otherwise maintain and this could reduce the overall return on our investments. We could also find ourselves in a position with insufficient liquidity to fund future obligations.
We may be unable to restructure our investments in a manner that we believe maximizes value, particularly if we are one of multiple creditors in a large capital structure.
In order to maximize value, we may be more likely to extend and work out an investment rather than pursue other remedies such as taking title to collateral. However, in situations where there are multiple creditors in large capital structures, it can be particularly difficult to assess the most likely course of action that a lender group or the borrower may take and it may also be difficult to achieve consensus among the lender group as to major decisions. Consequently, there could be a wide range of potential principal recovery outcomes, the timing of which can be unpredictable, based on the strategy pursued by a lender group or other applicable parties. These multiple creditor situations tend to be associated with larger loans. If we are one of a group of lenders, we may not independently control the decision-making. Consequently, we may be unable to restructure an investment in a manner that we believe would maximize value.
We may make investments in assets with lower credit quality, which will increase our risk of losses and may reduce distributions to stockholders and may adversely affect the value of our Class A common stock.
We may invest in unrated or non-investment grade CRE securities, enter into leases with unrated tenants or participate in subordinate, unrated or distressed mortgage loans. The non-investment grade ratings for these assets typically result from the overall leverage of the loans, the lack of a strong operating history for the borrower owners or the properties underlying the loans or securities, the borrowers’ credit history, the properties’ underlying cash flow or other factors. Because the ability of obligors of properties and mortgages, including mortgage loans underlying CMBS, to make rent or principal and interest payments may be impaired during
31
an economic downturn, prices of lower credit quality investments and CRE securities may decline. As a result, these investments may have a higher risk of default and loss than investment grade rated assets. The existing credit support in the securitization structure may be insufficient to protect us against loss of our principal on these investments. Any loss we incur may be significant, reduce distributions to stockholders and adversely affect the value of our Class A common stock.
Insurance may not cover all potential losses on CRE investments, which may impair the value of our assets.
We generally require that each of the borrowers under our CRE debt investments obtain comprehensive insurance covering the collateral, including liability, fire and extended coverage. We also generally obtain insurance directly on any property we acquire. However, there are certain types of losses, generally of a catastrophic nature, such as earthquakes, floods and hurricanes that may be uninsurable or not economically insurable. We may not obtain, or require borrowers to obtain, certain types of insurance if it is deemed commercially unreasonable. Inflation, changes in building codes and ordinances, environmental considerations and other factors also might make it infeasible to use insurance proceeds to replace a property if it is damaged or destroyed. Further, it is possible that our borrowers could breach their obligations to us and not maintain sufficient insurance coverage. Under such circumstances, the insurance proceeds, if any, might not be adequate to restore the economic value of the property, which might decrease the value of the property and in turn impair our investment.
We depend on borrowers and tenants for a substantial portion of our revenue and, accordingly, our revenue and our ability to make distributions to stockholders will be dependent upon the success and economic viability of such borrowers and tenants.
The success of our origination or acquisition of investments significantly depends on the financial stability of the borrowers and tenants underlying such investments. Before making a loan to a borrower, we assess the strength and skills of an entity’s management and other factors that we believe are material to the performance of the investment. In making the assessment and otherwise conducting customary due diligence, we rely on the resources available to us and, in some cases, an investigation by third parties. There can be no assurance that our due diligence processes will uncover all relevant facts or that any investment will be successful. The inability of a single major borrower or tenant, or a number of smaller borrowers or tenants, to meet their payment obligations could result in reduced revenue or losses.
The leases at the properties underlying CRE debt investments or the properties held by us may not be relet or renewed on favorable terms, or at all, which may result in a reduction in our net income, and as a result we may be required to reduce or eliminate cash distributions to stockholders.
Our investments in real estate will be pressured if economic conditions and rental markets continue to be challenging. For instance, upon expiration or early termination of leases for space located at our properties, the space may not be relet or, if relet, the terms of the renewal or reletting (including the cost of required renovations or concessions to tenants) may be less favorable than current lease terms. We may be receiving above market rental rates which will decrease upon renewal, which will adversely impact our income and could harm our ability to service our debt and operate successfully. Weak economic conditions would likely reduce tenants’ ability to make rent payments in accordance with the contractual terms of their leases and lead to early termination of leases. Furthermore, commercial space needs may contract, resulting in lower lease renewal rates and longer releasing periods when leases are not renewed. Any of these situations may result in extended periods where there is a significant decline in revenues or no revenues generated by a property. Additionally, to the extent that market rental rates are reduced, property-level cash flow would likely be negatively affected as existing leases renew at lower rates. If we are unable to relet or renew leases for all or substantially all of the space at these properties, if the rental rates upon such renewal or reletting are significantly lower than expected, or if our reserves for these purposes prove inadequate, we will experience a reduction in net income and may be required to reduce or eliminate cash distributions to stockholders.
Because real estate investments are relatively illiquid, we may not be able to vary our portfolio in response to changes in economic and other conditions, which may result in losses to us.
Many of our investments are illiquid. A variety of factors could make it difficult for us to dispose of any of our assets on acceptable terms even if a disposition is in the best interests of stockholders. We cannot predict whether we will be able to sell any property for the price or on the terms set by us or whether any price or other terms offered by a prospective purchaser would be acceptable to us. We also cannot predict the length of time needed to find a willing purchaser and to close the sale of a property. Certain properties may also be subject to transfer restrictions that materially restrict us from selling that property for a period of time or impose other restrictions, such as a limitation on the amount of financing that can be placed or repaid on that property. We may be required to expend cash to correct defects or to make improvements before a property can be sold, and we cannot provide assurance that we will have cash available to correct those defects or to make those improvements. The Code also places limits on our ability as a REIT to sell certain properties held for fewer than two years.
Borrowers under certain of our CRE debt investments may give their tenants or other persons similar rights with respect to the collateral. Similarly, we may also determine to give our tenants a right of first refusal or similar options. Such rights could negatively affect the residual value or marketability of the property and impede our ability to sell the collateral or the property.
32
As a result, our ability to sell investments in response to changes in economic and other conditions could be limited. To the extent we are unable to sell any property for its book value or at all, we may be required to take a non-cash impairment charge or loss on the sale, either of which would reduce our earnings. Limitations on our ability to respond to adverse changes in the performance of our investments may have a material adverse effect on our business, financial condition and results of operations and our ability to make distributions to stockholders.
Environmental compliance costs and other potential environmental liabilities associated with our current or former properties or our CRE debt or real estate-related investments could materially impair the value of our investments and expose us to material liability.
Under various federal, state and local environmental laws, statutes, ordinances and regulations relating to the protection of the environment, a current or previous owner or operator of real property, such as us, our borrowers and our tenants, may be liable in certain circumstances for the costs of investigation, removal or remediation of contamination, or related to hazardous or toxic substances, materials or wastes, including petroleum and materials containing asbestos or, mold, present or released at, under, on, or from such property. In addition, we also may be liable for costs of remediating contamination at off-site disposal or treatment facilities where we arranged for disposal or treatment of hazardous substances at such facilities. Potential liabilities relating to the forgoing also include government fines and penalties, natural resource damages, and damages for injuries to persons and property. In addition, some environmental laws can create a lien on the contaminated site in favor of the government for damages and the costs it incurs in connection with the contamination. These laws often impose liability without regard to whether the owner or operator knew of, or was responsible for, the presence, release or disposal of such substances, may be joint and several, and may be imposed on the current or former owner or operator of a property in connection with the activities of a tenant or a prior owner or operator at the property. The presence of contamination or the failure to remediate contamination may adversely affect our or our tenants’ ability to sell, develop, operate or lease real estate, or to borrow using the real estate as collateral, which, in turn, could reduce our revenues. As an owner or operator of a site, including if we take ownership through foreclosure, we also can be liable under common law to third parties for damages and injuries resulting from environmental contamination at or emanating from the site (e.g., for cleanup costs, natural resource damages, bodily injury or property damage). Some of our properties are or have been used for commercial or industrial purposes involving the use or presence of hazardous substances, materials or waste, which could have resulted in environmental impacts at or from these properties, including contamination of which we are not presently aware.
We are also subject to federal, state and local environmental, health and safety laws and regulations and zoning requirements, including those regarding the handling of regulated substances and wastes, emissions to the environment and fire codes. If we, or our tenants or borrowers, fail to comply with these various laws and requirements, we might incur costs and liabilities, including governmental fines and penalties. Moreover, we do not know whether existing laws and requirements will change or, if they do, whether future laws and requirements will require us to make significant unanticipated expenditures that could have a material adverse effect on our business. Our tenants are subject to the same environmental, health and safety and zoning laws and also may be liable for cleanup or remediation of contamination. Such liability could affect a tenant’s ability to make rental payments to us.
Some of our properties may contain, or may have contained, asbestos-containing building materials. Environmental, health and safety laws require that owners or operators of or employers in buildings with asbestos-containing materials (“ACM”) properly manage and maintain these materials, adequately inform or train those who may come into contact with ACM and undertake special precautions, including removal or other abatement, in the event that ACM is disturbed during building maintenance, renovation or demolition. These laws may impose fines and penalties on employers or, building owners or operators for failure to comply with these requirements. In addition, third parties may seek recovery from employers, owners or operators for personal injury associated with exposure to asbestos.
When excessive moisture accumulates in buildings or on building materials, mold growth may occur, particularly if the moisture problem remains undiscovered or is not addressed over a period of time. Some molds may produce airborne toxins or irritants. Indoor air quality issues also can stem from inadequate ventilation, chemical contamination from indoor or outdoor sources and other biological contaminants such as pollen, viruses and bacteria. Indoor exposure to airborne toxins or irritants above certain levels can be alleged to cause a variety of adverse health effects and symptoms, including allergic or other reactions. As a result, the presence of significant mold or other airborne contaminants at any of our properties could require us to undertake a remediation program to contain or remove the mold or other airborne contaminants from the affected property or increase indoor ventilation. In addition, the presence of significant mold or other airborne contaminants could expose us to liability from our tenants and others if property damage or personal injury occurs.
These costs and liabilities, including for any required investigation, remediation, removal, fines, penalties, costs to comply with environmental law or personal or property injury or damages and our or our tenants’ or borrowers’ liability could significantly exceed the value of the property without any limits.
33
The scope of any indemnification our tenants or borrowers have agreed to provide us for environmental liabilities may be limited. For instance, some of our agreements with our tenants or borrowers do not require them to indemnify us for environmental liabilities arising before such tenant or borrower took possession of the premises. Further, we cannot assure stockholders that any such tenant or borrower would be able to fulfill its indemnification obligations. If we were deemed liable for any such environmental liabilities and were unable to seek recovery against our tenant or borrower, our business, financial condition and results of operations could be materially and adversely affected.
Furthermore, we may invest in real estate, or CRE debt secured by real estate or subordinate interests, with environmental impacts or issues that materially impair the value of the real estate. Even as a lender, if we participate in management or take title to collateral with environmental problems or if other circumstances arise, we could be subject to environmental liability. There are substantial risks associated with such an investment.
Laws, regulations or other issues related to climate change could have a material adverse effect on us.
If we, or other companies with which we do business, particularly utilities that provide our facilities with electricity, become subject to laws or regulations related to climate change, it could have a material adverse effect on us. The United States may enact new laws, regulations and interpretations relating to climate change, including potential cap-and-trade systems, carbon taxes and other requirements relating to reduction of carbon footprints and/or greenhouse gas emissions. Other countries have enacted climate change laws and regulations, and the United States has been involved in discussions and agreements regarding international climate change treaties. The federal government and some of the states and localities in which we operate have enacted certain climate change laws and regulations and/or have begun regulating carbon footprints and greenhouse gas emissions. Although these laws and regulations have not had any known material adverse effect on us to date, they could limit our ability to develop properties or result in substantial costs, including compliance costs, retrofit costs and construction costs, monitoring and reporting costs and capital expenditures for environmental control facilities and other new equipment. In addition, these laws and regulations could lead to increased costs for the electricity that our tenant’s require to conduct operations. Furthermore, our reputation could be damaged if we violate climate change laws or regulations. We cannot predict how future laws and regulations, or future interpretations of current laws and regulations, related to climate change will affect our business, results of operations, liquidity and financial condition. Lastly, the potential physical impacts of climate change on our operations are highly uncertain, and would be particular to the geographic circumstances in areas in which we operate. These may include changes in rainfall and storm patterns and intensities, water shortages, changing sea levels and changing temperatures. Any of these matters could have a material adverse effect on us.
Our joint venture partners could take actions that decrease the value of an investment to us and lower our overall return.
We currently have, and may in the future enter into, joint ventures with third parties, affiliates of our Manager and other Managed Companies to make investments. We may also make investments in partnerships or other co-ownership arrangements or participations. Such investments may involve risks not otherwise present with other methods of investment, including, for instance, the following risks:
|
•
|
our joint venture partner in an investment could become insolvent or bankrupt;
|
|
•
|
fraud or other misconduct by our joint venture partners;
|
|
•
|
we may share decision-making authority with our joint venture partners regarding certain major decisions affecting the ownership of the joint venture and the joint venture investment, such as the management of the CRE debt, sale of the property or the making of additional capital contributions for the benefit of the loan or property, which may prevent us from taking actions that are opposed by our joint venture partner;
|
|
•
|
such joint venture partner may at any time have economic or business interests or goals that are or that become in conflict with our business interests or goals, including for example the management of the CRE debt or operation of the properties;
|
|
•
|
such joint venture partner may be in a position to take action contrary to our instructions or requests or contrary to our policies or objectives;
|
|
•
|
our joint venture partners may be structured differently than us for tax purposes and this could create conflicts of interest and risk to our REIT status;
|
|
•
|
we may rely upon our joint venture partners to manage the day-to-day operations of the joint venture and underlying loans or assets, as well as to prepare financial information for the joint venture and any failure to perform these obligations may have a negative impact our performance and results of operations;
|
|
•
|
our joint venture partner may experience a change of control, which could result in new management of our joint venture partner with less experience or conflicting interests to ours and be disruptive to our business;
|
34
|
•
|
the terms of our joint ventures could restrict our ability to sell or transfer our interest to a third party when we desire on advantageous terms, which could result in reduced liquidity;
|
|
•
|
our joint venture partners may not have sufficient personnel or appropriate levels of expertise to adequately support our initiatives; and
|
|
•
|
to the extent we partner with other Managed Companies, our Manager and Colony Capital may have conflicts of interest that may not be resolved in our favor.
|
Any of the above might subject us to liabilities and thus reduce our returns on our investment with that joint venture partner. In addition, disagreements or disputes between us and our joint venture partner could result in litigation, which could increase our expenses and potentially limit the time and effort our officers and directors are able to devote to our business.
Further, in some instances, we and/or our partner may have the right to trigger a buy-sell arrangement, which could cause us to sell our interest, or acquire our partner’s interest, at a time when we otherwise would not have initiated such a transaction. Our ability to acquire our partner’s interest may be limited if we do not have sufficient cash, available borrowing capacity or other capital resources. In such event, we may be forced to sell our interest in the joint venture when we would otherwise prefer to retain it.
Our investments that are not denominated in U.S. dollars subject us to currency rate exposure and may adversely impact our status as a REIT.
We have investments in triple net leases, other real estate investments and loans that are denominated in euros and the Norwegian kroner, and may in the future have investments denominated in other foreign currencies, which expose us to foreign currency risk due to potential fluctuations in exchange rates between foreign currencies and the U.S. dollar. A change in foreign currency exchange rates may have an adverse impact on the valuation of our equity in foreign investments and loans denominated in currencies other than the U.S. dollar. We may not be able to successfully hedge the foreign currency exposure and may incur losses on these investments as a result of exchange rate fluctuations.
In addition, changes in foreign currency exchange rates used to value a REIT’s foreign assets may be considered changes in the value of the REIT’s assets. These changes may adversely affect our status as a REIT. Further, bank accounts in foreign currency which are not considered cash or cash equivalents may adversely affect our status as a REIT.
We are subject to additional risks from our international investments.
We may purchase real estate investments located internationally or make loans secured by real estate located internationally. These investments may be affected by factors particular to the laws and business practices of the jurisdictions in which the properties are located. These laws and business practices may expose us to risks that are different from and in addition to those commonly found in the United States. Foreign investments are subject to risk, including the following risks:
|
•
|
the burden of complying with multiple and potentially conflicting foreign laws;
|
|
•
|
changing governmental rules and policies, including changes in land use and zoning laws, more stringent environmental laws or changes in such environmental laws;
|
|
•
|
existing or new laws relating to the foreign ownership of real property or loans and laws restricting the ability of foreign persons or companies to remove profits earned from activities within the country to the person’s or company’s country of origin;
|
|
•
|
the potential for expropriation;
|
|
•
|
possible currency transfer restrictions;
|
|
•
|
imposition of adverse or confiscatory taxes;
|
|
•
|
our REIT tax status not being respected under foreign laws, in which case any income or gains from foreign sources could be subject to foreign taxes and withholding taxes;
|
|
•
|
changes in real estate and other tax rates and changes in other operating expenses in particular countries;
|
|
•
|
possible challenges to the anticipated tax treatment of the structures that allow us to acquire and hold investments;
|
|
•
|
adverse market conditions caused by terrorism, civil unrest and changes in national or local governmental or economic conditions;
|
35
|
•
|
the willingness of domestic or foreign lenders to make loans in certain countries and changes in the availability, cost and terms of loan funds resulting from varying national economic policies;
|
|
•
|
general political and economic instability in certain regions; and
|
|
•
|
the potential difficulty of enforcing our contractual rights, including in perfecting our security interests, collecting accounts receivable, foreclosing on secured assets and protecting our interests as a creditor in bankruptcies in certain geographic regions.
|
Each of these risks might adversely affect our performance and impair our ability to make distributions to our stockholders required to qualify and remain qualified as a REIT. In addition, there is generally less publicly available information about foreign companies and a lack of uniform financial accounting standards and practices (including the availability of information in accordance with U.S. GAAP) which could impair our ability to analyze transactions and receive timely and accurate financial information from our investments necessary to meet our reporting obligations to financial institutions or governmental or regulatory agencies.
Concerns persist regarding the debt burden of certain Eurozone countries and their ability to meet future financial obligations, the overall stability of the euro and the suitability of the euro as a single currency, given the diverse economic and political circumstances in individual Eurozone countries and in recent declines and volatility in the value of the euro. These concerns could lead to the re-introduction of individual currencies in one or more Eurozone countries, or, in more extreme circumstances, the possible dissolution of the euro currency entirely. Should the euro dissolve entirely, the legal and contractual consequences for holders of euro-denominated obligations would be uncertain. Such uncertainty would extend to among other things, whether obligations previously expressed to be owed and payable in euros would be re-denominated in a new currency, what laws would govern and the courts of which country would have jurisdiction. These potential developments, or market perceptions concerning these and related issues, could materially adversely affect the value of our euro-denominated assets and obligations.
In addition, there is increased uncertainty in the wake of the “Brexit” referendum in the United Kingdom in June 2016, in which the majority of voters voted in favor of an exit from the European Union. The announcement of Brexit caused significant volatility in global stock markets and currency exchange rate fluctuations that resulted in the strengthening of the U.S. dollar against the U.K. Pound Sterling. Any impact of the Brexit vote depends on the terms of the United Kingdom’s withdrawal from the European Union, which remains under negotiation between the parties despite the upcoming March 29, 2019 deadline. Failure to obtain parliamentary approval of an agreed withdrawal agreement would, absent a revocation of the United Kingdom’s notification to withdraw or some other delay, mean that the United Kingdom would leave the European Union on March 29, 2019, likely with no agreement (a so-called “hard Brexit”). Current discussions between the United Kingdom and the European Union may result in any number of outcomes including an extension or delay of the United Kingdom’s withdrawal from the European Union. The consequences for the economies of the European Union member states as a result of the United Kingdom’s withdrawal from the European Union are unknown and unpredictable, especially in the case of a hard Brexit. Uncertainty about global or regional economic conditions poses a risk as consumers and businesses may postpone spending in response to tighter credit, negative financial news, and declines in income or asset values, which could adversely affect the availability of financing, our business and our results of operations.
Inflation in foreign countries, along with government measures to curb inflation, may have an adverse effect on our investments.
Certain countries have in the past experienced extremely high rates of inflation. Inflation, along with governmental measures to curb inflation, coupled with public speculation about possible future governmental measures to be adopted, has had significant negative effects on these international economies in the past and this could occur again in the future. The introduction of governmental policies to curb inflation can have an adverse effect on our business. High inflation in the countries in which we purchase real estate or make other investments could increase our expenses and we may not be able to pass these increased costs on to our tenants.
Risks Related to Our Financing Strategy
Our indebtedness may subject us to increased risk of loss and could adversely affect our results of operations and financial condition.
We use a variety of structures to finance the origination and acquisition of our investments, including our credit facilities, securitization financing transactions and other term borrowings, including repurchase agreements. Subject to market conditions and availability, we may incur a significant amount of debt through bank credit facilities (including term loans and revolving facilities), warehouse facilities and structured financing arrangements, public and private debt issuances and derivative instruments, in addition to transaction or asset-specific funding arrangements and additional repurchase agreements. We may also issue debt or equity securities to fund our growth. The type and percentage of leverage we employ will vary depending on our available capital, our ability to obtain and access financing arrangements with lenders, the type of asset we are funding, whether the financing is recourse or nonrecourse, debt restrictions contained in those financing arrangements and the lenders’ and rating agencies’ estimate
36
of the stability of our investment portfolio’s cash flow. We may significantly increase the amount of leverage we utilize at any time without approval of our Board of Directors. In addition, we may leverage individual assets at substantially higher levels. We may be unable to obtain necessary additional financing on favorable terms or, with respect to our investments, on terms that parallel the maturities of the debt originated or acquired, if we are unable to obtain additional financing at all. If our strategy is not viable, we will have to find alternative forms of long-term financing for our assets, as secured revolving credit facilities and repurchase agreements may not accommodate long-term financing. If we do obtain additional debt or financing, the substantial debt could subject us to many risks that, if realized, would materially and adversely affect us, including the risk that:
|
•
|
our cash flow from operations may be insufficient to make required payments of principal of and interest on our debt or we may fail to comply with covenants contained in our debt agreements, which is likely to result in (1) acceleration of such debt (and any other debt containing a cross-default or cross-acceleration provision), which we then may be unable to repay from internal funds or to refinance on favorable terms, or at all, (2) our inability to borrow undrawn amounts under our financing arrangements, even if we are current in payments on borrowings under those arrangements, which would result in a decrease in our liquidity, and/or (3) the loss of some or all of our collateral assets to foreclosure or sale;
|
|
•
|
our debt may increase our vulnerability to adverse economic and industry conditions with no assurance that investment yields will increase in an amount sufficient to offset the higher financing costs;
|
|
•
|
we may be required to dedicate a substantial portion of our cash flow from operations to payments on our debt, thereby reducing funds available for operations, future business opportunities, stockholder distributions or other purposes;
|
|
•
|
we may not be able to refinance any debt that matures prior to the maturity (or realization) of an underlying investment it was used to finance on favorable terms or at all; and
|
|
•
|
we will have increased exposure to risks if the counterparties of our debt obligations are impacted by credit market turmoil or exposure to financial or other pressures.
|
There can be no assurance that a leveraging strategy will be successful and may subject us to increased risk of loss, harm our liquidity and could adversely affect our results of operations and financial condition.
Our master repurchase agreements impose, and additional lending facilities may impose, restrictive covenants, which would restrict our flexibility to determine our operating policies and investment strategy and to conduct our business.
We borrow funds under master repurchase agreements with various counterparties. The documents that govern these master repurchase agreements and the related guarantees contain, and additional lending facilities may contain, customary affirmative and negative covenants, including financial covenants applicable to us that may restrict our ability to further incur borrowings, restrict our distributions to stockholders prohibit us from discontinuing insurance coverage, replacing our Manager and restrict our flexibility to determine our operating policies and investment strategy. In particular, our master repurchase agreements require us to maintain a certain amount of cash or set aside assets sufficient to maintain a specified liquidity position that would allow us to satisfy our collateral obligations. As a result, we may not be able to leverage our assets as fully as we would otherwise choose, which could reduce our return on assets. If we fail to meet or satisfy any of these covenants, we would be in default under these agreements, and our lenders could elect to declare outstanding amounts due and payable, terminate their commitments, require the posting of additional collateral and enforce their interests against existing collateral. We may also be subject to cross-default and acceleration rights in our other debt facilities. Further, this could also make it difficult for us to satisfy the requirements necessary to maintain our qualification as a REIT for U.S. federal income tax purposes or to maintain our exclusion from registration under the Investment Company Act. In addition, in the event that the lender files for bankruptcy or becomes insolvent, our loans may become subject to bankruptcy or insolvency proceedings, thus depriving us, at least temporarily, of the benefit of these assets. Such an event could restrict our access to bank credit facilities and increase our cost of capital. Our master repurchase agreements also grant certain consent rights to the lenders thereunder, which give them the right to consent to certain modifications to the pledged collateral. This could limit our ability to manage a pledged investment in a way that we think would provide the best outcome for our stockholders.
These types of financing arrangements also involve the risk that the market value of the assets pledged or sold by us to the provider of the financing may decline in value, in which case the lender or counterparty may require us to provide additional collateral or lead to margin calls that may require us to repay all or a portion of the funds advanced. We may not have the funds available to repay our debt at that time, which would likely result in defaults unless we are able to raise the funds from alternative sources including by selling assets at a time when we might not otherwise choose to do so, which we may not be able to achieve on favorable terms or at all.
Posting additional collateral would reduce our cash available to make other, higher yielding investments (thereby decreasing our return on equity). If we cannot meet these requirements, the lender or counterparty could accelerate our indebtedness, increase the interest rate on advanced funds and terminate our ability to borrow funds from it, which could materially and adversely affect
37
our financial condition and ability to implement our investment strategy. In the case of repurchase transactions, if the value of the underlying security has declined as of the end of that term, or if we default on our obligations under the repurchase agreement, we will likely incur a loss on our repurchase transactions.
Interest rate fluctuations could reduce our ability to generate income on our investments and may cause losses.
Our financial performance is influenced by changes in interest rates, in particular, as such changes may affect our CRE securities, floating-rate borrowings and CRE debt to the extent such debt does not float as a result of floors or otherwise. Changes in interest rates affect our net interest income, which is the difference between the interest income we earn on our interest-earning investments and the interest expense we incur in financing these investments. Changes in the level of interest rates also may affect our ability to originate and acquire assets, the value of our assets and our ability to realize gains from the disposition of assets. Changes in interest rates may also affect borrower default rates. In a period of rising interest rates, our interest expense could increase, while the interest we earn on our fixed-rate debt investments would not change, adversely affecting our profitability. Our operating results depend in large part on differences between the income from our assets, net of credit losses, and our financing costs. We anticipate that for any period during which our assets are not match-funded (when we match maturities and interest rates of our liabilities with our assets to manage risks of being forced to refinance), the income from such assets will respond more slowly to interest rate fluctuations than the cost of our borrowings. We may fail to appropriately employ a match-funded structure on favorable terms or at all. Consequently, changes in interest rates particularly short term interest rates may significantly influence our net income. Interest rates are highly sensitive to many factors, including governmental monetary and tax policies, domestic and international economic and political conditions and other factors beyond our control. Interest rate fluctuations resulting in our interest expense exceeding interest income would result in operating losses for us.
Hedging against interest rate and currency exposure may adversely affect our earnings, limit our gains or result in losses, which could adversely affect cash available for distribution to our stockholders.
We may enter into swap, cap or floor agreements or pursue other interest rate or currency hedging strategies. Our hedging activity will vary in scope based on interest rate levels, currency exposure, the type of investments held and other changing market conditions. Interest rate and/or currency hedging may fail to protect or could adversely affect us because, among other things:
|
•
|
interest rate and/or currency hedging can be expensive, particularly during periods of rising and volatile interest rates;
|
|
•
|
available interest rate and/or currency hedging may not correspond directly with the interest rate risk for which protection is sought;
|
|
•
|
the duration of the hedge may not match the duration of the related liability or asset;
|
|
•
|
our hedging opportunities may be limited by the treatment of income from hedging transactions under the rules determining REIT qualification;
|
|
•
|
the credit quality of the party owing money on the hedge may be downgraded to such an extent that it impairs our ability to sell or assign our side of the hedging transaction;
|
|
•
|
the counterparties with which we trade may cease making markets and quoting prices in such instruments, which may render us unable to enter into an offsetting transaction with respect to an open position;
|
|
•
|
the party owing money in the hedging transaction may default on its obligation to pay;
|
|
•
|
we may purchase a hedge that turns out not to be necessary (i.e., a hedge that is out of the money); and
|
|
•
|
we may enter into hedging arrangements that would require us to fund cash payments in certain circumstances (such as the early termination of the hedging instrument caused by an event of default or other early termination event, or the decision by a counterparty to request margin securities it is contractually owed under the terms of the hedging instrument).
|
Any hedging activity we engage in may adversely affect our earnings, which could adversely affect cash available for distribution to stockholders. Therefore, while we may enter into such transactions to seek to reduce interest rate and/or currency risks, unanticipated changes in interest rates or exchange rates may result in poorer overall investment performance than if we had not engaged in any such hedging transactions. In addition, the degree of correlation between price movements of the instruments used in a hedging strategy and price movements in the portfolio positions being hedged or liabilities being hedged may vary materially. Moreover, for a variety of reasons, we may not be able to establish a perfect correlation between hedging instruments and the investments being hedged. Any such imperfect correlation may prevent us from achieving the intended hedge and expose us to risk of loss. We may also be exposed to liquidity issues as a result of margin calls or settlement of derivative hedges. Our hedging activities, if not undertaken in compliance with certain U.S. federal income tax requirements, could also adversely affect our ability to qualify for taxation as a REIT. In addition, hedging instruments involve risk since they often are not traded on regulated
38
exchanges, guaranteed by an exchange or its clearing house, or regulated by any U.S. or foreign governmental authorities. Consequently, there are no regulatory or statutory requirements with respect to record keeping, financial responsibility or segregation of customer funds and positions. Furthermore, the enforceability of agreements underlying derivative transactions may depend on compliance with applicable statutory, commodity and other regulatory requirements and, depending on the identity of the counterparty, applicable international requirements.
There can be no assurance that our existing hedging arrangements will continue to use LIBOR as a reference rate or that LIBOR will continue as a viable or appropriate reference rate.
Our floating-rate debt and hedging arrangements determine the applicable interest rate or payment amount by reference to a benchmark rate, such as the London Interbank Offered Rate (“LIBOR”), or to another financial metric. In the event any such benchmark rate or other referenced financial metric is significantly changed, replaced or discontinued, or ceases to be recognized as an acceptable market benchmark rate or financial metric, there may be uncertainty or differences in the calculation of the applicable interest rate or payment amount depending on the terms of the governing instrument, and there may be significant work required to transition to any new benchmark rate or other financial metric.
In July 2017, the Chief Executive of the U.K. Financial Conduct Authority (“FCA”) announced that the FCA intends to stop persuading or compelling banks to submit rates for the calculation of LIBOR after 2021. This announcement indicates that the continuation of LIBOR on the current basis cannot and will not be guaranteed after 2021. In response to concerns regarding the reliability and robustness of commonly used reference rates, in particular LIBOR, the Financial Stability Oversight Council and Financial Stability Board called for the development of alternative interest rate benchmarks. In April 2018, the New York Federal Reserve commenced publishing an alternative reference rate, the Secured Overnight Financing Rate (“SOFR”), proposed by a group of major market participants convened by the U.S. Federal Reserve with participation by SEC Staff and other regulators, the Alternative Reference Rates Committee ("ARRC"). SOFR is based on transactions in the more robust U.S. Treasury repurchase market and has been proposed as the alternative to LIBOR for use in derivatives and other financial contracts that currently rely on LIBOR as a reference rate. ARRC has proposed a paced market transition plan to SOFR from LIBOR and organizations are currently working on industry wide and company specific transition plans as it relates to derivatives and cash markets exposed to LIBOR. It is impossible to predict whether and to what extent banks will continue to provide LIBOR submissions to the administrator of LIBOR, whether LIBOR rates will cease to be published or supported before or after 2021 or whether any additional reforms to LIBOR may be enacted in the United Kingdom or elsewhere. At this time, no consensus exists as to what rate or rates may become accepted alternatives to LIBOR, including for purposes of hedging arrangements such as those we currently have in place. Furthermore, the transition from LIBOR to one or more replacement rates could cause uncertainty in what reference rates apply to existing hedging and other arrangements. Additionally, there is some possibility that LIBOR continues to be published, but that the quantity of loans used to calculate LIBOR diminishes significantly enough to reduce the appropriateness of the rate as a reference rate. We can provide no assurance regarding the future of LIBOR, whether our current hedging arrangements will continue to use USD-LIBOR as a reference rate or whether any reliance on such rate will be appropriate. Confusion as to the relevant benchmark reference rate for our hedging instruments could hinder our ability to establish effective hedges.
Despite progress made to date by regulators and industry participants to prepare for the anticipated discontinuation of LIBOR, significant uncertainties still remain. Such uncertainties relate to, for example, whether LIBOR will continue to be viewed as an acceptable market benchmark rate, what rate or rates may become accepted alternatives to LIBOR (various characteristics of SOFR make it uncertain whether it would be viewed by market participants as an appropriate alternative to LIBOR for certain purposes), how any replacement would be implemented across the industry, and the effect of any changes in industry views or movement to alternative benchmarks would have on the markets for LIBOR-linked financial instruments.
The discontinuation of a benchmark rate or other financial metric, changes in a benchmark rate or other financial metric, or changes in market perceptions of the acceptability of a benchmark rate or other financial metric, including LIBOR, could, among other things result in increased interest payments, changes to our risk exposures, or require renegotiation of previous transactions. In addition, any such discontinuation or changes, whether actual or anticipated, could result in market volatility, adverse tax or accounting effects, increased compliance, legal and operational costs, and risks associated with contract negotiations.
We use short-term borrowings to finance our investments, and we may need to use such borrowings for extended periods of time to the extent we are unable to access long-term financing. This may expose us to increased risks associated with decreases in the fair value of the underlying collateral, which could have an adverse impact on our results of operations.
While we have and may continue to seek non-recourse, non-mark-to-market, matched-term, long-term financing through securitization financing transactions or other structures, such financing may be unavailable to us on favorable terms or at all. Consequently, we may be dependent on short-term financing arrangements that are not matched in duration to our financial assets. Short-term borrowing through repurchase arrangements, credit facilities and other types of borrowings may put our assets and financial condition at risk. Repurchase agreements economically resemble short-term, floating rate financing and usually require
39
the maintenance of specific loan-to-collateral value ratios. Posting additional collateral to support our financing arrangements could significantly reduce our liquidity and limit our ability to leverage our assets. Furthermore, the cost of borrowings may increase substantially if lenders view us as having increased credit risk during periods of market distress. Any such short-term financing may also be recourse to us, which will increase the risk of our investments.
In addition, the value of assets underlying any such short-term financing may be marked-to-market periodically by the lender, including on a daily basis. To the extent these financing arrangements contain mark-to-market provisions, if the market value of the investments pledged by us declines due to credit quality deterioration, we may be required by our lenders to provide additional collateral or pay down a portion of our borrowings. In a weakening economic environment, we would generally expect credit quality and the value of the investment that serves as collateral for our financing arrangements to decline, and in such a scenario, it is likely that the terms of our financing arrangements would require partial repayment from us, which could be substantial.
These facilities may also be restricted to financing certain types of assets, such as first mortgage loans, which could impact our asset allocation. In addition, such short-term borrowing facilities may limit the length of time that any given asset may be used as eligible collateral. As a result, we may not be able to leverage our assets as fully as we would choose, which could reduce our return on assets. Further, such borrowings may require us to maintain a certain amount of cash reserves or to set aside unleveraged assets sufficient to maintain a specified liquidity position that would allow us to satisfy our collateral obligations. In the event that we are unable to meet the collateral obligations for our short-term borrowings, our financial condition could deteriorate rapidly.
We are subject to risks associated with obtaining mortgage financing on our real estate, which could materially adversely affect our business, financial condition and results of operations and our ability to make distributions to stockholders.
As of December 31, 2018, our portfolio had
$1.2 billion
of total mortgage financing. We are subject to risks normally associated with financing, including the risks that our cash flow is insufficient to make timely payments of interest or principal, that we may be unable to refinance existing borrowings or support collateral obligations and that the terms of refinancing may not be as favorable as the terms of existing borrowing. If we are unable to refinance or extend principal payments due at maturity or pay them with proceeds from other capital transactions or the sale of the underlying property, our cash flow may not be sufficient in all years to make distributions to stockholders and to repay all maturing borrowings. Furthermore, if prevailing interest rates or other factors at the time of refinancing result in higher interest rates upon refinancing, the interest expense relating to that refinanced borrowing would increase, which could reduce our profitability, result in losses and negatively impact the amount of distributions we are able to pay to stockholders. Moreover, additional financing increases the amount of our leverage, which could negatively affect our ability to obtain additional financing in the future or make us more vulnerable in a downturn in our results of operations or the economy generally.
Any warehouse facilities that we may obtain in the future may limit our ability to acquire assets, and we may incur losses if the collateral is liquidated.
In the event that securitization financings become available, we may utilize, if available, warehouse facilities pursuant to which we would accumulate mortgage loans in anticipation of a securitization financing, which assets would be pledged as collateral for such facilities until the securitization transaction is consummated. In order to borrow funds to acquire assets under any future warehouse facilities, we expect that our lenders thereunder would have the right to review the potential assets for which we are seeking financing. We may be unable to obtain the consent of a lender to acquire assets that we believe would be beneficial to us, and we may be unable to obtain alternate financing for such assets. In addition, no assurance can be given that a securitization structure would be consummated with respect to the assets being warehoused. If the securitization is not consummated, the lender could liquidate the warehoused collateral and we would then have to pay any amount by which the original purchase price of the collateral assets exceeds its sale price, subject to negotiated caps, if any, on our exposure. In addition, regardless of whether the securitization is consummated, if any of the warehoused collateral is sold before the consummation, we would have to bear any resulting loss on the sale. Currently, we have no warehouse facilities in place, and no assurance can be given that we will be able to obtain one or more warehouse facilities on favorable terms, or at all.
Risks Related to Regulatory Matters
Changes in laws or regulations governing our operations, changes in the interpretation thereof or newly enacted laws or regulations and any failure by us to comply with these laws or regulations, could require changes to certain of our business practices, negatively impact our operations, cash flow or financial condition, impose additional costs on us, subject us to increased competition or otherwise adversely affect our business.
The laws and regulations governing our operations, as well as their interpretation, may change from time to time, and new laws and regulations may be enacted. For example, from time to time the market for real estate debt transactions has been adversely affected by a decrease in the availability of senior and subordinated financing for transactions, in part in response to regulatory pressures on providers of financing to reduce or eliminate their exposure to such transactions. Furthermore, if regulatory capital requirements-whether under the Dodd-Frank Act, Basel III (voluntary minimum requirements for internationally active banks) or
40
other regulatory action-are imposed on private lenders that provide us with funds, or were to be imposed on us, they or we may be required to limit, or increase the cost of, financing they provide to us or that we provide to others. Among other things, this could potentially increase our financing costs, reduce our ability to originate or acquire loans and reduce our liquidity or require us to sell assets at an inopportune time or price.
There has been increasing commentary amongst regulators and intergovernmental institutions on the role of nonbank institutions in providing credit and, particularly, so-called “shadow banking,” a term generally referring to credit intermediation involving entities and activities outside the regulated banking system and increased oversight and regulation of such entities. In the United States, the Dodd-Frank Act established the Financial Stability Oversight Council (the “FSOC”), which is comprised of representatives of all the major U.S. financial regulators, to act as the financial system’s systemic risk regulator. The FSOC has the authority to review the activities of non-bank financial companies predominantly engaged in financial activities and designate those companies as “systemically important” for supervision by the Federal Reserve. On April 18, 2016, the FSOC released an update on its multi-year review of asset management products and activities and created an interagency working group to assess potential risks associated with certain leveraged funds. While it cannot be known at this time whether any regulation will be implemented or what form any new law or regulation or amendment will take, compliance with any increased regulation of non-bank credit extension could require changes to certain of our business practices, negatively impact our operations, cash flows or financial condition or impose additional costs on us.
The loss of our Investment Company Act exclusion could require us to register as an investment company or substantially change the way we conduct our business, either of which may have an adverse effect on us and the value of our Class A common stock.
On August 31, 2011, the SEC published a concept release (Release No. 29778, File No. S7-34-11, Companies Engaged in the Business of Acquiring Mortgages and Mortgage Related Instruments), pursuant to which it is reviewing whether certain companies that invest in mortgage-backed securities and rely on the exclusion from registration under Section 3(c)(5)(C) of the Investment Company Act, such as us, should continue to be allowed to rely on such an exclusion from registration. If the SEC or its staff takes action with respect to this exclusion, these changes could mean that certain of our subsidiaries could no longer rely on the Section 3(c)(5)(C) exclusion, and would have to rely on Section 3(c)(1) or 3(c)(7), which would mean that our investment in those subsidiaries would be investment securities. This could result in our failure to maintain our exclusion from registration as an investment company. If we fail to maintain an exclusion from registration as an investment company, either because of SEC interpretational changes or otherwise, we could, among other things, be required either: (i) to substantially change the manner in which we conduct our operations to avoid being required to register as an investment company; or (ii) to register as an investment company, either of which could have an adverse effect on us and the value of our Class A common stock. If we are required to register as an investment company under the Investment Company Act, we would become subject to substantial regulation with respect to our capital structure (including our ability to use leverage), management, operations, transactions with affiliated persons (as defined in the Investment Company Act), portfolio composition, including restrictions with respect to diversification and industry concentration and other matters.
Our Manager is subject to extensive regulation, including as an investment adviser in the United States, which could adversely affect its ability to manage our business.
Certain of Colony Capital’s affiliates, including our Manager, are subject to regulation as investment advisers and/or fund managers by various regulatory authorities that are charged with protecting our interests. Instances of criminal activity and fraud by participants in the investment management industry and disclosures of trading and other abuses by participants in the financial services industry have led the U.S. government and regulators in foreign jurisdictions to consider increasing the rules and regulations governing, and oversight of, the financial system. This activity is expected to result in continued changes to the laws and regulations governing the investment management industry and more aggressive enforcement of the existing laws and regulations. Our Manager could be subject to civil liability, criminal liability, or sanction, including revocation of its registration as an investment adviser in the United States, revocation of the licenses of its employees, censures, fines or temporary suspension or permanent bar from conducting business if it is found to have violated any of these laws or regulations. Any such liability or sanction could adversely affect its ability to manage our business.
Our Manager must continually address conflicts between its interests and those of its Managed Companies, and us. In addition, the SEC and other regulators have increased their scrutiny of potential conflicts of interest. However, appropriately dealing with conflicts of interest is complex and difficult and if our Manager fails, or appears to fail, to deal appropriately with conflicts of interest, it could face litigation or regulatory proceedings or penalties, any of which could adversely affect its ability to manage our business.
41
Risks Related to Taxation
Our qualification as a REIT involves complying with highly technical and complex provisions of the Code.
We elected to be taxed as a REIT under the U.S. federal income tax laws commencing with our taxable year ended December 31, 2018. Our qualification as a REIT involves the application of highly technical and complex provisions of the Internal Revenue Code of 1986 (the “Code”) for which only limited judicial and administrative authorities exist. Even a technical or inadvertent violation could jeopardize our REIT qualification. New legislation, court decisions or administrative guidance, in each case possibly with retroactive effect, may make it more difficult or impossible for us to qualify as a REIT.
Our qualification as a REIT depends on our satisfaction of certain asset, income, organizational, distribution, stockholder ownership and other requirements on a continuing basis:
|
•
|
With respect to the gross income and asset tests, our compliance depends upon our analysis of the characterization and fair market values of our assets, some of which are not susceptible to a precise determination, and for which we will not obtain independent appraisals. Moreover, we invest in certain assets with respect to which the rules applicable to REITs are particularly difficult to interpret or to apply, including, but not limited to, the rules applicable to financing arrangements that are structured as sale and repurchase agreements; mezzanine loans; and investments in real estate mortgage loans that are acquired at a discount, subject to work-outs or modifications, or reasonably expected to be in default at the time of acquisition. If the IRS challenged our treatment of these assets as real estate assets for purposes of the REIT asset tests, and if such a challenge were sustained, we could fail to meet the asset tests applicable to REITs and thus fail to qualify as a REIT.
|
|
•
|
The fact that we own direct or indirect interests in a number of entities that have elected to be taxed as REITs under the U.S. federal income tax laws (a “Subsidiary REIT”), further complicates the application of the REIT requirements for us. Each Subsidiary REIT is subject to the various REIT qualification requirements that are applicable to us. If a Subsidiary REIT were to fail to qualify as a REIT, then (i) that Subsidiary REIT would become subject to regular U.S. federal corporate income tax, (ii) our interest in such Subsidiary REIT would cease to be a qualifying asset for purposes of the REIT asset tests, and (iii) it is possible that we would fail certain of the REIT asset tests, in which event we also would fail to qualify as a REIT unless we could avail ourselves of certain relief provisions.
|
|
•
|
Our ability to satisfy the distribution and other requirements to qualify as a REIT depends in part on the actions of third parties over which we have no control or only limited influence, including in cases where we own limited partner or non-managing member interests in partnerships and limited liability companies that are joint ventures or funds.
|
If we were to fail to qualify as a REIT in any taxable year, we would be subject to U.S. federal income tax on our taxable income at regular corporate rates, and dividends paid to our stockholders would not be deductible by us in computing our taxable income. Any resulting corporate tax liability could be substantial and would reduce the amount of cash available for distribution to our stockholders, which in turn could have an adverse impact on the value of our Class A common stock. In addition, we would no longer be required to make distributions to stockholders. Unless we were entitled to relief under certain Code provisions, we also would be disqualified from taxation as a REIT for the four taxable years following the year in which we failed to qualify as a REIT.
We may incur adverse tax consequences if NorthStar I or NorthStar II were to have failed to qualify as a REIT for U.S. federal income tax purposes prior to the Mergers.
In connection with the closing of the Mergers, we received an opinion of counsel to each of NorthStar I and NorthStar II to the effect that it qualified as a REIT for U.S. federal income tax purposes under the Code through the time of the Mergers. Neither NorthStar I nor NorthStar II, however, requested a ruling from the IRS that it qualified as a REIT. If, notwithstanding these opinions, NorthStar I’s or NorthStar II’s REIT status for periods prior to the Mergers were successfully challenged, we would face serious adverse tax consequences that would substantially reduce our core funds from operations, and cash available for distribution, including cash available to pay dividends to our stockholders, because:
|
•
|
NorthStar I or NorthStar II, as applicable, would be subject to U.S. federal, state and local income tax on its net income at regular corporate rates for the years it did not qualify as a REIT (and, for such years, would not be allowed a deduction for dividends paid to stockholders in computing its taxable income) and we would succeed to the liability for such taxes;
|
|
•
|
if we were considered to be a “successor” of such entity, we would not be eligible to elect REIT status until the fifth taxable year following the year during which such entity was disqualified, unless it were entitled to relief under applicable statutory provisions;
|
42
|
•
|
even if we were eligible to elect REIT status, we would be subject to tax (at the highest corporate rate in effect at the date of the sale) on the built-in gain on each asset of NorthStar I or NorthStar II, as applicable, existing at the time of the Mergers if we were to dispose of such asset for up to five years following the Mergers; and
|
|
•
|
we would succeed to any earnings and profits accumulated by NorthStar I or NorthStar II, as applicable, for tax periods that such entity did not qualify as a REIT and we would have to pay a special dividend and/or employ applicable deficiency dividend procedures (including interest payments to the IRS) to eliminate such earnings and profits to maintain our REIT qualification.
|
As a result of these factors, NorthStar I’s or NorthStar II’s failure to qualify as a REIT prior to the Mergers could impair our ability to expand our business and raise capital and could materially adversely affect the value of our Class A common stock. In addition, even if they qualified as REITs for the duration of their existence, if there is an adjustment to NorthStar I’s or NorthStar II’s taxable income or dividends-paid deductions for periods prior to the Mergers, we could be required to elect to use the deficiency dividend procedure to maintain NorthStar I’s or NorthStar II’s, as applicable, REIT status for periods prior to the Mergers. That deficiency dividend procedure could require us to make significant distributions to our stockholders and to pay significant interest to the IRS.
Dividends payable by REITs do not qualify for the preferential tax rates available for some dividends.
The maximum rate applicable to “qualified dividend income” paid by non-REIT “C” corporations to U.S. stockholders that are individuals, trusts and estates generally is 20%. Dividends payable by REITs to those U.S. stockholders, however, generally are not eligible for the current reduced rate, except to the extent that certain holding requirements have been met and a REIT’s dividends are attributable to dividends received by a REIT from taxable corporations (such as a taxable REIT subsidiary (“TRS”)), to income that was subject to tax at the REIT/corporate level, or to dividends properly designated by the REIT as “capital gains dividends.” Effective for taxable years before January 1, 2026, those U.S. stockholders may deduct 20% of their dividends from REITs (excluding qualified dividend income and capital gains dividends). For those U.S. stockholders in the top marginal tax bracket of 37%, the deduction for REIT dividends yields an effective income tax rate of 29.6% on REIT dividends, which is higher than the 20% tax rate on qualified dividend income paid by non-REIT “C” corporations, but still lower than the effective rate that applied prior to 2018, which is the first year that this special deduction for REIT dividends is available. Although the reduced rates applicable to dividend income from non-REIT “C” corporations do not adversely affect the taxation of REITs or dividends payable by REITs, it could cause investors who are non-corporate taxpayers to perceive investments in REITs to be relatively less attractive than investments in the shares of non-REIT “C” corporations that pay dividends, which could adversely affect the value of our Class A common stock.
REIT distribution requirements could adversely affect our ability to execute our business plan.
We generally must distribute annually at least 90% of our “REIT taxable income” (subject to certain adjustments and excluding any net capital gain), in order to qualify as a REIT, and any REIT taxable income that we do not distribute will be subject to U.S. corporate income tax at regular rates. In addition, from time to time, we may generate taxable income greater than our income for financial reporting purposes prepared in accordance with accounting principles generally accepted in the United States, “U.S. GAAP,” or differences in timing between the recognition of taxable income and the actual receipt of cash may occur. For example,
|
•
|
we may be required to accrue income from mortgage loans, mortgage-backed securities, and other types of debt securities or interests in debt securities before we receive any payments of interest or principal on such assets;
|
|
•
|
we may acquire distressed debt investments that are subsequently modified by agreement with the borrower, which could cause us to have to recognize gain in certain circumstances;
|
|
•
|
we may recognize substantial amounts of “cancellation of debt” income for U.S. federal income tax purposes (but not for U.S. GAAP purposes) due to discount repurchases of our liabilities, which could cause our REIT taxable income to exceed our U.S. GAAP income;
|
|
•
|
we or our TRSs may recognize taxable “phantom income” as a result of modifications, pursuant to agreements with borrowers, of debt instruments that we acquire if the amendments to the outstanding debt are “significant modifications” under the applicable Treasury regulations. In addition, our TRSs may be treated as a “dealer” for U.S. federal income tax purposes, in which case the TRS would be required to mark-to-market its assets at the end of each taxable year and recognize taxable gain or loss on those assets even though there has been no actual sale of those assets;
|
|
•
|
we may deduct our capital losses only to the extent of our capital gains and not against our ordinary income, in computing our REIT taxable income for a given taxable year;
|
|
•
|
certain of our assets and liabilities are marked-to-market for U.S. GAAP purposes but not for tax purposes, which could result in losses for U.S. GAAP purposes that are not recognized in computing our REIT taxable income; and
|
43
|
•
|
under the “Tax Cut and Jobs Act of 2017” (the “TCJA”), we generally must accrue income for U.S. federal income tax purposes no later than when such income is taken into account as revenue in our financial statements, which could create additional differences between REIT taxable income and the receipt of cash attributable to such income.
|
As a result of both the requirement to distribute 90% of our income each year (and to pay tax on any income that we do not distribute) and the fact that our taxable income may well exceed our cash income due to the factors mentioned above as well as other factors, we may find it difficult to meet the REIT distribution requirements in certain circumstances while also having adequate cash resources to execute our business plan. In particular, where we experience differences in timing between the recognition of taxable income and the actual receipt of cash, the requirement to distribute a substantial portion of our taxable income could cause us to: (i) sell assets in adverse market conditions, (ii) borrow on unfavorable terms, (iii) distribute amounts that would otherwise be invested in future acquisitions, capital expenditures or repayment of debt or (iv) make a taxable distribution of our shares of Class A common stock as part of a distribution in which stockholders may elect to receive shares of Class A common stock or (subject to a limit measured as a percentage of the total distribution) cash, in order to comply with REIT requirements. These alternatives could increase our costs, reduce our equity, and/or result in stockholders being taxed on distributions of shares of stock without receiving cash sufficient to pay the resulting taxes. Thus, compliance with the REIT distribution requirements may hinder our ability to grow, which could adversely affect the value of our Class A common stock.
Even if we continue to qualify as a REIT, we may face other tax liabilities that reduce our cash available for distribution to stockholders.
Even if we qualify for taxation as a REIT, we may be subject to certain U.S. federal, state and local taxes on our income and assets, including taxes on any undistributed income, tax on income from some activities conducted as a result of a foreclosure, and state or local income, property and transfer taxes, such as mortgage recording taxes. We also are subject to U.S. federal and state income tax (and any applicable non-U.S. taxes) on the net income earned by our TRSs. In addition, we have substantial operations and assets outside of the U.S. that are subject to tax in those countries - those taxes, unless incurred by a TRS, are not likely to generate an offsetting credit for taxes in the U.S. In addition, if we have net income from “prohibited transactions,” that income will be subject to a 100% tax. In general, “prohibited transactions” are sales or other dispositions of property, other than foreclosure property, but including mortgage loans, held primarily for sale to customers in the ordinary course of business. We might be subject to this tax if we were to dispose of or securitize loans in a manner that was treated as a sale of the loans for U.S. federal income tax purposes that is subject to the prohibited transactions tax. In order to avoid the prohibited transactions tax, we may choose not to engage in certain sales of loans at the REIT-level, and may limit the structures we utilize for our securitization transactions, even though such sales or structures might otherwise be beneficial to us. Finally, we could, in certain circumstances, be required to pay an excise or penalty tax (which could be significant in amount) in order to utilize one or more relief provisions under the Code to maintain our qualification as a REIT. Any of these taxes would decrease cash available for distribution to our stockholders.
Complying with REIT requirements may force us to forgo and/or liquidate otherwise attractive investment opportunities.
To qualify as a REIT, we must ensure that we meet the REIT gross income tests annually and that at the end of each calendar quarter, at least 75% of the value of our assets consists of cash, cash items, government securities and qualified REIT real estate assets, including certain mortgage loans and certain kinds of MBS. The remainder of our investment in securities (other than qualified 75% asset test assets) generally cannot include more than 10% of the outstanding voting securities of any one issuer or more than 10% of the total value of the outstanding securities of any one issuer. In addition, in general, no more than 5% of the value of our assets (other than qualified 75% asset test assets) can consist of the securities of any one issuer, and no more than 20% of the value of our total assets can be represented by stock or securities of one or more TRSs. Debt instruments issued by “publicly offered REITs,” to the extent not secured by real property or interests in real property, qualify for the 75% asset test but the value of such debt instruments cannot exceed 25% of the value of our total assets. The compliance with these limitations, particularly given the nature of some of our investments, may hinder our ability to make, and, in certain cases, maintain ownership of certain attractive investments that might not qualify for the 75% asset test. If we fail to comply with the REIT asset tests requirements at the end of any calendar quarter, we must correct the failure within 30 days after the end of the calendar quarter or qualify for certain statutory relief provisions to avoid losing our REIT qualification and suffering adverse tax consequences. As a result, we may be required to liquidate from our portfolio, or contribute to a TRS, otherwise attractive investments in order to maintain our qualification as a REIT. These actions could have the effect of reducing our income, increasing our income tax liability, and reducing amounts available for distribution to our stockholders. In addition, we may be required to make distributions to stockholders at disadvantageous times or when we do not have funds readily available for distribution, and may be unable to pursue investments (or, in some cases, forego the sale of such investments) that would be otherwise advantageous to us in order to satisfy the source-of-income or asset-diversification requirements for qualifying as a REIT.
44
The “taxable mortgage pool” rules may increase the taxes that we or our stockholders may incur, and may limit the manner in which we effect future securitizations.
Securitizations by us or our subsidiaries could result in the creation of taxable mortgage pools for U.S. federal income tax purposes. As a result, we could have “excess inclusion income.” In general, dividend income that a tax-exempt entity receives from us should not constitute unrelated business taxable income (“UBTI”), as defined in Section 512 of the Code. If, however, we realize excess inclusion income and allocate it to stockholders, then this income would be fully taxable as UBTI to a tax-exempt entity under Section 512 of the Code. A foreign stockholder would generally be subject to U.S. federal income tax withholding on this excess inclusion income without reduction pursuant to any otherwise applicable income tax treaty. U.S. stockholders would not be able to offset such income with their net operating losses.
Although the law is not entirely clear, the IRS has taken the position that we are subject to tax at the highest corporate rate on the portion of our excess inclusion income equal to the percentage of our stock held in record name by “disqualified organizations” (generally tax-exempt investors, such as certain state pension plans and charitable remainder trusts, that are not subject to the tax on unrelated business taxable income). To the extent that our stock owned by “disqualified organizations” is held in street name by a broker-dealer or other nominee, the broker-dealer or nominee would be liable for a tax at the highest corporate rate on the portion of our excess inclusion income allocable to the stock held on behalf of the “disqualified organizations.” A regulated investment company or other pass-through entity owning our stock may also be subject to tax at the highest corporate tax rate on any excess inclusion income allocated to their record name owners that are “disqualified organizations.”
Excess inclusion income could result if a REIT held a residual interest in a real estate mortgage investment conduit (“REMIC”). In addition, excess inclusion income also may be generated if a REIT issues debt with two or more maturities and the terms of the payments of those debt instruments bear a relationship to the payments that the REIT received on mortgage loans or mortgage-backed securities securing those liabilities. If any portion of our dividends is attributable to excess inclusion income, then the tax liability of tax-exempt stockholders, non-U.S. stockholders, stockholders with net operating losses, regulated investment companies and other pass-through entities whose record name owners are disqualified organizations and brokers-dealers and other nominees who hold stock on behalf of disqualified organizations will very likely increase.
Complying with REIT requirements may limit our ability to hedge effectively and may cause us to incur tax liabilities.
The REIT provisions of the Code limit our ability to hedge certain of our liabilities. Under these provisions, any income from a hedging transaction that we enter into to manage risk of interest rate changes with respect to borrowings made or to be made to acquire or carry real estate assets, or to manage the risk of certain currency fluctuations, and that is properly identified under applicable Treasury Regulations, does not constitute “gross income” for purposes of the 75% or 95% gross income tests. To the extent that we enter into other types of hedging transactions, the income from those transactions is likely to be treated as non-qualifying income for purposes of the REIT gross income tests. As a result of these rules, we intend to limit our use of advantageous hedging techniques that do not qualify for the exclusion from the REIT gross income tests or implement those hedges through a TRS. This could increase the cost of our hedging activities because our TRS would be subject to tax on gains or expose us to greater risks associated with changes in interest rates than we would otherwise want to bear. In addition, losses in our TRS will generally not provide any tax benefit, except for being carried forward against future taxable income in the TRS.
There is a risk of changes in the tax law applicable to REITs.
The IRS, the United States Treasury Department and Congress frequently review U.S. federal income tax legislation, regulations and other guidance. We cannot predict whether, when or to what extent new U.S. federal tax laws, regulations, interpretations or rulings will be adopted. Any legislative action may prospectively or retroactively modify our tax treatment and, therefore, may adversely affect our taxation or our stockholders. We urge you to consult with your tax advisor with respect to the status of legislative, regulatory or administrative developments and proposals and their potential effect on an investment in our shares. Although REITs generally receive certain tax advantages compared to entities taxed as C corporations, it is possible that future legislation would result in a REIT having fewer tax advantages, and it could become more advantageous for a company that invests in real estate to elect to be treated for U.S. federal income tax purposes as a C corporation.
Our ownership of assets and conduct of operations through our TRSs is limited and involves certain risks for us.
We use our TRSs to hold assets and earn income that would not be qualifying assets or income if held or earned directly by us. Apart from the fact that income from those TRSs may be subject to U.S. federal, foreign, state and local income tax on their taxable income and only their after-tax net income is available for distribution to us, our use of the TRS for this purpose is subject to certain costs, risks and limitations:
|
•
|
No more than 20% of the value of our gross assets may consist of stock or securities of one or more TRSs.
|
45
|
•
|
The TRS rules limit the deductibility of interest paid or accrued by a TRS to its parent REIT to assure that the TRS is subject to an appropriate level of corporate taxation. The rules also impose a 100% excise tax on certain transactions between a TRS and its parent REIT that are not conducted on an arm’s-length basis.
|
|
•
|
We treat income that we earn from certain foreign TRSs, including issuers in CDO transactions, as qualifying dividend income for purposes of the REIT income tests, based on several private letter rulings that the IRS has issued to other taxpayers (which technically may be relied upon only by those taxpayers), but there can be no assurance that the IRS might not successfully challenge our treatment of such income as qualifying income, in which event we might not satisfy the REIT 95% gross income test, and we either could be subject to a penalty tax with respect to some or all of that income we could fail to continue to qualify as a REIT.
|
|
•
|
We generally structure our foreign TRSs with the intent that their income and operations will not be subject to U.S. federal, state and local income tax. If the IRS successfully challenged that tax treatment, it would reduce the amount that those foreign TRSs would have available to pay to their creditors and to distribute to us.
|
We are mindful of all of these limitations and analyze and structure the income and operations of our TRSs to mitigate these costs and risks to us to the extent practicable, but we may not always be successful in all cases.
We are restricted in our ability to transfer cash from the OP to the Company within two years following the Mergers without incurring adverse tax consequences.
Under the “disguised sale” rules that apply when a member transfers property to a limited liability company and the limited liability company transfers cash to the partner within two years of that transfer, we are restricted in our ability to transfer cash from the OP to the Company within two years following the Mergers, unless that transfer can qualify for an exception provided for the applicable regulations or was not contemplated at the time of the Mergers, without incurring adverse tax consequences. We do not anticipate that these rules will limit our ability to pay regular dividends from the operating cash flow of the OP, but they could restrict our ability to make repurchases of our Class A common stock pursuant to our previously announced stock repurchase program. We believe that we will have the capacity to make substantial repurchases, but we may not have the flexibility to repurchase as much stock as we would otherwise elect, depending upon future market conditions.
Risks Related to Ownership of Our Common Stock
Our Class A common stock may not be actively traded, which could cause our Class A common stock to trade at a discount and make it difficult for holders of our Class A common stock to sell their shares.
Our shares of Class A common stock are newly issued securities that have recently been listed on the NYSE. There can be no assurance that an active trading market for our Class A common stock will develop in the near term, or if one develops, be maintained. If an active trading market does not develop and the value of those shares might be materially impaired. No assurance can be given as to the ability of our stockholders to sell their shares of our common stock or the price that our stockholders may obtain for their shares.
Some of the factors that could negatively affect the market price of our Class A common stock include:
|
•
|
our actual or projected operating results, financial condition, cash flows and liquidity, or changes in business strategy or prospects;
|
|
•
|
actual or perceived conflicts of interest with our Manager, Colony Capital or their affiliates and individuals, including our executives;
|
|
•
|
equity issuances by us, or resales of our shares by our stockholders, or the perception that such issuances or resales may occur;
|
|
•
|
loss of a major funding source;
|
|
•
|
actual or anticipated accounting problems;
|
|
•
|
publication of research reports about us or the real estate industry;
|
|
•
|
changes in market valuations of similar companies;
|
|
•
|
adverse market reaction to the level of leverage we employ;
|
|
•
|
additions to or departures of our Manager’s and/or Colony Capital’s key personnel or adverse effects on the business or operations of our Manager, Colony Capital or their affiliates;
|
46
|
•
|
speculation in the press or investment community;
|
|
•
|
our failure to meet, or the lowering of, our earnings estimates or those of any securities analysts;
|
|
•
|
increases in market interest rates, which may lead investors to demand a higher distribution yield for our Class A common stock and would result in increased interest expenses on our debt;
|
|
•
|
a compression of the yield on our investments and an increase in the cost of our liabilities;
|
|
•
|
failure to operate in a manner consistent with our intention to qualify as a REIT or exclusion from registration under the Investment Company Act;
|
|
•
|
price and volume fluctuations in the overall stock market from time to time;
|
|
•
|
general market and economic conditions and trends including inflationary concerns, and the current state of the credit and capital markets;
|
|
•
|
significant volatility in the market price and trading volume of securities of publicly traded REITs or other companies in our sector, which is not necessarily related to the operating performance of these companies;
|
|
•
|
changes in law, regulatory policies or tax guidelines, or interpretations thereof, particularly with respect to REITs;
|
|
•
|
changes in the value of our portfolio;
|
|
•
|
any shortfall in revenue or net income or any increase in losses from levels expected by investors or securities analysts;
|
|
•
|
operating performance of companies comparable to us;
|
|
•
|
short-selling pressure with respect to shares of our Class A common stock or REITs generally; and
|
|
•
|
uncertainty surrounding the strength of the U.S. economic recovery, particularly in light of the recent debt ceiling and budget deficit concerns, and other U.S. and international political and economic affairs.
|
Any of the foregoing factors could negatively affect our stock price or result in fluctuations in the price or trading volume of our Class A common stock.
Future offerings of debt or equity securities, which would rank senior to our Class A common stock, may adversely affect the market price of our Class A common stock.
If we decide to issue debt or equity securities in the future, which would rank senior to our Class A common stock, it is likely that they will be governed by an indenture or other instrument containing covenants restricting our operating flexibility. Additionally, any convertible or exchangeable securities that we issue in the future may have rights, preferences and privileges more favorable than those of our Class A common stock and may result in dilution to owners of our Class A common stock. We and, indirectly, our stockholders, will bear the cost of issuing and servicing such securities. Because our decision to issue debt or equity securities in any future offering will depend on market conditions and other factors beyond our control, we cannot predict or estimate the amount, timing or nature of our future offerings. Thus holders of our Class A common stock will bear the risk of our future offerings reducing the market price of our Class A common stock and diluting the value of their stock holdings in us.
We may issue additional equity securities, which may dilute your interest in us.
Stockholders do not have preemptive rights to any shares we issue in the future. Our charter authorizes us to issue a total of 1,000,000,000 shares of capital stock, of which 950,000,000 shares are classified as common stock and 50,000,000 shares are classified as preferred stock. Our Board of Directors, with the approval of a majority of our entire Board of Directors and without stockholder approval, may amend our charter to increase or decrease the aggregate number of authorized shares of capital stock or the number of shares of capital stock of any class or series that we are authorized to issue. Our Board of Directors may elect to: (i) sell additional shares in one or more future public offerings; (ii) issue equity interests in private offerings; (iii) issue shares to our Manager, or its successors or assigns, in payment of an outstanding fee obligation; (iv) issue shares of our common stock to sellers of assets we acquire in connection with an exchange of limited partnership interests of our operating company; or (v) issue shares of our common stock to pay distributions to existing stockholders. If we issue and sell additional shares of our Class A common stock, the ownership interests of our existing stockholders will be diluted to the extent they do not participate in the offering.
Item 1B. Unresolved Staff Comments
None.
47
Item 2. Properties
Information regarding our investment properties at
December 31, 2018
are included in “Item 1. Business-Our Portfolio” and “Item 15. Exhibits and Financial Statement Schedules—Schedule III. Real Estate and Accumulated Depreciation” of this Annual Report.
Item 3. Legal Proceedings
Neither the Company nor our Manager is currently subject to any material legal proceedings. We anticipate that we may from time to time be involved in legal actions arising in the ordinary course of business, the outcome of which we would not expect to have a material adverse effect on our financial position, results of operations or cash flow.
Item 4. Mine Safety Disclosures
Not applicable.
48
PART II
Item 5. Market for Registrant’s Common Equity, Related Stockholder Matters and Issuer Purchases of Equity Securities
Market Information
Our Class A common stock began trading on the New York Stock Exchange on February 1, 2018 under the symbol “CLNC.” Prior to February 1, 2018, our Class A common stock was not listed on a national securities exchange and there was no established public trading market for such shares. Our Class B-3 common stock was not listed on a national securities exchange and there was no established public trading market for such shares. On February 1, 2019, each outstanding share of Class B-3 common stock automatically converted to one share of our Class A common stock in accordance with its terms.
As of
February 26, 2019
, the closing price of our Class A common stock was
$17.70
and we had approximately
127.8 million
shares of Class A common stock outstanding held by a total of
4,803
holders of record. This figure does not reflect the beneficial ownership of shares held in nominee name.
Distributions
Holders of our common stock are entitled to receive distributions if and when the board of directors authorizes and declares distribution. The board of directors has not established any minimum distribution level. In order to maintain our qualification as a REIT, we intend to pay dividends to our stockholders that, on an annual basis, will represent at least 90% of our taxable income (which may not necessarily equal net income as calculated in accordance with GAAP), determined without regard to the deduction for dividends paid and excluding net capital gains.
We did not make any distributions on either our Class A common stock or Class B-3 common stock in 2017. On February 26, 2018, our Board of Directors declared its initial monthly cash dividend of $0.145 per share of Class A common stock and Class B-3 common stock for the monthly period ended February 28, 2018. Our Board of Directors declared 11 monthly cash dividends of $0.145 per share of Class A common stock and Class B-3 common stock in 2018. These distributions represent an annualized dividend of $1.74 per share of Class A common stock and Class B-3 common stock.
For the
year ended
December 31, 2018
, the Company paid a dividend of $1.45 per share of Class A common stock and Class B-3 common stock. On a per share basis, the tax treatment of these dividends are
$1.08
of ordinary income and
$0.37
of return of capital.
The credit agreement governing our
$560 million
revolving credit facility limits our ability to make dividends and other payments with respect to our shares of common stock. The credit agreement prohibits us from making distributions in excess of the amount required to maintain our status as a REIT unless we are in compliance with the financial covenants in the credit agreement after giving pro forma effect to such distribution. The credit agreement also generally provides that if a default occurs and is continuing, we will be precluded from making distributions on our common stock (other than those required to allow the Company to qualify and maintain its status as a REIT, so long as such default does not arise from a payment default or event of insolvency).
Recent Sales of Unregistered Securities; Use of Proceeds from Registered Securities
There were no sales of unregistered securities of our Company during the
year ended
December 31, 2018
, other than those previously disclosed in filings with the SEC.
Purchases of Equity Securities by the Issuer and Affiliated Purchasers
The following table presents information related to our purchase of our Class A common stock during the
three months ended
December 31, 2018
.
|
Period
|
Total Number of Shares Purchased
(1)
|
Average Price Paid per Share
|
Total Numbers of Shares Purchased as Part of Publicly Announced Program
|
Maximum Approximate Dollar Value that May Yet Be Purchased Under the Program
|
||||||||||
|
October 1, 2018 to October 31, 2018
|
—
|
|
$
|
—
|
|
—
|
|
$
|
—
|
|
||||
|
November 1, 2018 to November 30, 2018
|
—
|
|
—
|
|
—
|
|
—
|
|
||||||
|
December 1, 2018 to December 31, 2018
|
42,239
|
|
15.60
|
|
—
|
|
—
|
|
||||||
|
Total
|
42,239
|
|
$
|
15.60
|
|
—
|
|
$
|
—
|
|
||||
_________________________________________
|
(1)
|
The numbers of shares purchased represents shares of Class A common stock surrendered by certain of our employees to satisfy their federal and state tax obligations associated with the vesting of restricted common stock. With respect to these shares, the price paid per share is based on the closing price of our Class A common stock as of the date of the determination of the federal income tax.
|
49
Stock Performance Graph
The following graph compares the cumulative total return on our class A common stock with the cumulative total returns on the Russell 2000 Index (the “Russell 2000”) and the Bloomberg REIT Mortgage Index (the “BBREMTG Index”), a published industry index from
February 1, 2018
to
December 31, 2018
. The cumulative total return on our class A common stock as presented is not necessarily indicative of future performance of our class A common stock.

50
Item 6. Selected Financial Data
Selected Historical Financial Information of the Company
For the
year ended
December 31, 2018
, the selected financial data is derived from our audited consolidated financial statements, other than non-GAAP financial measures and selected quarterly financial information, which are unaudited, and should be read in conjunction with the consolidated financial statements and accompanying notes included in “Item 15. Exhibits and Financial Statement Schedules” and “Item 7. Management’s Discussion and Analysis of Financial Condition and Results of Operations” of this Annual Report. The financial condition and results of operations as of and for the
year ended
December 31, 2018
are not necessarily indicative of the financial condition and results of operations that may be expected for any future periods.
Selected Historical Financial Information of CLNY Investment Entities
For the
years ended
December 31, 2017
,
2016
and
2015
, the following tables set forth selected historical combined financial information of the investment entities in which CLNY OP owned interests ranging from 38% to 100%, which includes the CLNY OP Contributed Entities that were contributed to the OP and the RED REIT Contributed Entities. The selected historical combined financial information also includes certain intercompany balances between those entities and CLNY OP or its subsidiaries. These entities and balances are collectively referred to as the “CLNY Investment Entities.” The assets, liabilities and noncontrolling interests of the CLNY Investment Entities have been carved out of the books and records of Colony Capital at their historical carrying amounts. The remaining interests in the CLNY Investment Entities that are owned by Colony Capital-sponsored investment vehicles or third parties were not contributed to the Company. Colony Capital’s interests in the respective underlying assets and liabilities of the CLNY Investment Entities are presented as “CLNY Owner” and the remaining interests are presented as “Other Owners.”
The following selected combined financial information as of and for the
years ended
December 31, 2017
,
2016
and
2015
is derived from the audited combined financial statements of the CLNY Investment Entities.
Selected Annual Financial Information
|
Year Ended December 31,
|
||||||||||||||||
|
(In thousands, except per share data)
|
2018
|
2017
|
2016
|
2015
|
||||||||||||
|
Statements of Operations Data:
|
||||||||||||||||
|
Interest income
|
$
|
295,024
|
|
$
|
140,214
|
|
$
|
140,529
|
|
$
|
112,326
|
|
||||
|
Property operating income
|
178,339
|
|
23,750
|
|
1,138
|
|
99
|
|
||||||||
|
Total revenues
|
477,014
|
|
164,755
|
|
142,203
|
|
112,712
|
|
||||||||
|
Interest expense
|
179,485
|
|
21,019
|
|
26,031
|
|
18,949
|
|
||||||||
|
Property operating expense
|
73,616
|
|
7,978
|
|
905
|
|
67
|
|
||||||||
|
Interest expense on real estate
|
43,437
|
|
5,095
|
|
—
|
|
—
|
|
||||||||
|
Net income (loss)
|
(177,353
|
)
|
127,880
|
|
109,021
|
|
81,608
|
|
||||||||
|
Net income (loss) attributable to Colony Credit Real Estate, Inc. common stockholders
|
(168,498
|
)
|
88,504
|
|
76,051
|
|
58,079
|
|
||||||||
|
Per Share Data:
|
||||||||||||||||
|
Net income (loss) attributable to common stockholders per share - basic and diluted
|
$
|
(1.41
|
)
|
$
|
1.86
|
|
$
|
1.60
|
|
$
|
1.22
|
|
||||
|
Dividends declared per share of common stock
|
$
|
1.60
|
|
$
|
—
|
|
$
|
—
|
|
$
|
—
|
|
||||
|
Balance Sheet Data - at Year End:
|
||||||||||||||||
|
Total assets
|
$
|
8,660,730
|
|
$
|
1,839,402
|
|
$
|
1,802,192
|
|
$
|
2,056,974
|
|
||||
|
Total debt
|
5,594,245
|
|
389,661
|
|
502,413
|
|
826,132
|
|
||||||||
|
Total liabilities
|
5,815,528
|
|
431,832
|
|
566,628
|
|
939,160
|
|
||||||||
|
Total equity attributable to Colony Credit Real Estate, Inc. common stockholders
|
2,706,905
|
|
1,079,808
|
|
884,716
|
|
817,774
|
|
||||||||
|
Total equity
|
2,845,202
|
|
1,407,570
|
|
1,235,564
|
|
1,117,814
|
|
||||||||
51
Selected Quarterly Financial Information (Unaudited)
The following tables present selected quarterly financial information for the
years ended
December 31, 2018
and
2017
(dollars in thousands, except per share data):
|
Three Months Ended
|
||||||||||||||||
|
(In thousands, except per share data)
|
December 31,
|
September 30,
|
June 30,
|
March 31,
|
||||||||||||
|
2018:
|
||||||||||||||||
|
Total revenue
|
$
|
136,461
|
|
$
|
133,337
|
|
$
|
116,150
|
|
$
|
91,066
|
|
||||
|
Net income (loss)
|
(132,160
|
)
|
(58,666
|
)
|
15,874
|
|
(2,401
|
)
|
||||||||
|
Net income (loss) attributable to Colony Credit Real Estate, Inc. common stockholders
|
(127,089
|
)
|
(52,703
|
)
|
16,008
|
|
(4,714
|
)
|
||||||||
|
Net income (loss) per share of common stock, basic/diluted
(1)(2)(3)(4)
|
$
|
(1.00
|
)
|
$
|
(0.42
|
)
|
$
|
0.12
|
|
$
|
(0.05
|
)
|
||||
|
2017:
|
||||||||||||||||
|
Total revenue
|
$
|
38,447
|
|
$
|
42,801
|
|
$
|
43,056
|
|
$
|
40,451
|
|
||||
|
Net income
|
32,051
|
|
31,482
|
|
32,324
|
|
32,023
|
|
||||||||
|
Net income attributable to Colony Credit Real Estate, Inc. common stockholders
|
21,417
|
|
21,252
|
|
22,949
|
|
22,886
|
|
||||||||
|
Net income per share of common stock, basic/diluted
(1)(2)(3)(4)
|
$
|
0.45
|
|
$
|
0.45
|
|
$
|
0.48
|
|
$
|
0.47
|
|
||||
_________________________________________
|
(1)
|
Annual earnings per share (“EPS”) may not equal the sum of each quarter’s EPS due to rounding and other computational factors.
|
|
(2)
|
For EPS for 2017, the Company allocated the OP’s share of net income as if the OP held
3,075,623
CLNC OP Units during the period for comparative purposes. The CLNC OP Units were not issued until
January 31, 2018
.
|
|
(3)
|
For EPS, the Company assumes
44.4 million
shares of Class B-3 common stock were outstanding prior to
January 31, 2018
to reflect the standalone pre-merger financial information of the CLNY Investment Entities, the Company’s predecessor for accounting purposes.
|
|
(4)
|
Excludes
3,075,623
CLNC OP Units, which are redeemable for cash, or at the Company’s option, shares of Class A common stock on a
one
-for-one basis, and therefore would not be dilutive.
|
52
Item 7. Management’s Discussion and Analysis of Financial Condition and Results of Operations
You should read the following discussion of our results of operations and financial condition in conjunction with our financial statements and related notes,“Risk Factors,” “Selected Financial Data,” and “Business” included elsewhere in this Annual Report on Form 10-K. This discussion contains forward-looking statements that involve risks and uncertainties. The forward-looking statements are not historical facts, but rather are based on current expectations, estimates, assumptions and projections about our industry, business and future financial results. Our actual results could differ materially from the results contemplated by these forward-looking statements due to a number of factors, including those discussed in the sections of this Annual Report on Form 10-K entitled “Risk Factors” and “Forward-Looking Statements.”
Introduction
We are a CRE credit REIT focused on originating, acquiring, financing and managing a diversified portfolio consisting primarily of CRE senior mortgage loans, mezzanine loans, preferred equity, debt securities and net leased properties predominantly in the United States. CRE debt investments include senior mortgage loans, mezzanine loans, preferred equity, and participations in such loans and preferred equity interests. CRE debt securities primarily consist of CMBS (including “B-pieces” of a CMBS securitization pool) or CRE CLOs (collateralized by pools of CRE debt investments). Net leased properties consist of CRE properties with long-term leases to tenants on a net-lease basis, where such tenants generally will be responsible for property operating expenses such as insurance, utilities, maintenance capital expenditures and real estate taxes.
We were organized in the state of Maryland on August 23, 2017. On September 15, 2017, Colony Capital, a publicly traded REIT listed on the NYSE under the ticker symbol “CLNY,” made an initial capital contribution of $1,000 to us. We intend to qualify as a REIT under the Internal Revenue Code of 1986, as amended, beginning with our taxable
year ended
December 31, 2018
. We conduct all of our activities and hold substantially all of our assets and liabilities through our operating subsidiary, Credit RE Operating Company, LLC (the “OP”). At
December 31, 2018
, we owned
97.6%
of the OP, as its sole managing member. The remaining
2.4%
is owned primarily by our affiliate as noncontrolling interests.
We are externally managed by a subsidiary of Colony Capital, a NYSE-listed global real estate and investment management firm with over
$22 billion
of total consolidated assets and over
$43 billion
of assets under management. As of
December 31, 2018
,
Colony Capital owned approximately
37%
of our common equity on a fully diluted basis, evidencing a strong alignment of interests between Colony Capital and our other stockholders.
Combination
On January 31, 2018, the Combination among the CLNY Contributed Portfolio, NorthStar I, and NorthStar II was completed in an all-stock exchange.
The Combination created a prominent publicly traded CRE credit REIT. Our senior executives include Kevin P. Traenkle as the Chief Executive Officer and Neale W. Redington as the Chief Financial Officer. Our board of directors consists of seven directors, four of whom are independent.
Refer to Note 3, “Business Combinations” to the Consolidated Financial Statements included in Item 15 of this Annual Report for further information related to the Combination.
Significant Developments
During 2018 and through
February 26, 2019
, significant developments affecting our business and results of operations included the following:
|
•
|
Completed the Combination of the CLNY Contributed Portfolio, NorthStar I and NorthStar II on
January 31, 2018
in an all-stock transaction;
|
|
•
|
Publicly listed on the NYSE under the ticker “CLNC” on
February 1, 2018
;
|
|
•
|
Added to U.S. Small-cap Russell 2000 Index, effective
June 25, 2018
;
|
|
•
|
2018 gross capital allocation of over
$2.0 billion
through
37
new investments, including the following:
|
|
◦
|
Originated
13
senior mortgage loans with a total commitment of
$868.7 million
;
|
|
◦
|
Originated
one
mezzanine loan and
one
preferred equity investment with total commitments of
$76.0 million
as well as the upsize of an existing mezzanine loan investment by
$43.1 million
;
|
|
◦
|
Acquired at par a preferred equity investment totaling
$89.1 million
and a mezzanine loan totaling
$20.0 million
from affiliates of our Manager;
|
|
◦
|
Entered into two joint ventures with affiliates of our Manager to invest in two separate development projects in Dublin, Ireland for a total commitment of
$231.7 million
;
|
|
◦
|
Purchased
two
net lease portfolios for a total of
$618.9 million
;
|
|
◦
|
Purchased
14
CMBS investments with an aggregate face value of
$72.6 million
at a
19.2%
discount;
|
53
|
•
|
Secured a
$400.0 million
corporate revolving credit facility with five relationship banks, and subsequently:
|
|
◦
|
Upsized the revolving credit facility from
$400.0 million
to
$525.0 million
in December 2018;
|
|
◦
|
Completed an amendment that allows for the ability to borrow in foreign currencies, and;
|
|
◦
|
On
February 4, 2019
, increased the revolving credit facility commitment by
$35.0 million
to
$560.0 million
;
|
|
•
|
Increased master repurchase facility by
$1.0 billion
from
$1.1 billion
to
$2.1 billion
;
|
|
•
|
Recorded
$113.9 million
of provision for loan losses on eleven loans;
|
|
•
|
Recorded impairments of operating real estate of
$31.8 million
,
$29.4 million
of which resulted from reductions in the estimated holding periods, rent reductions, tenant vacancies of properties; the remaining
$2.4 million
was the result of the sale of a
$177.0
million multi-tenant office portfolio in October 2018;
|
|
•
|
Declared and paid a monthly dividend of
$0.145
per share of Class A common stock and Class B-3 common stock from February through December, representing an annualized dividend of
$1.74
per share;
|
|
•
|
On
February 1, 2019
, converted all Class B-3 common stock to Class A common stock; and
|
|
•
|
Subsequent to
December 31, 2018
, declared a monthly cash dividend of
$0.145
per share of Class A common stock for January and February, as well as Class B common stock for January.
|
54
Factors Impacting Our Operating Results
Overview
Our results of operations are affected by a number of factors and depend primarily on, among other things, the ability of the borrowers of our assets to service our debt as it is due and payable, the ability of our tenants to pay rent and other amounts due under their leases, our ability to actively and effectively service any sub-performing and non-performing loans and other assets we may have from time to time in our portfolio, the market value of our assets and the supply of, and demand for, CRE senior mortgage loans, mezzanine loans, preferred equity, debt securities, net leased properties and our other assets, and the level of our net operating income. Our net interest income, which includes the amortization of purchase premiums and the accretion of purchase discounts, varies primarily as a result of changes in market interest rates, prepayment rates on our CRE loans, prepayment speeds and the ability of our borrowers to make scheduled interest payments. Interest rates and prepayment rates vary according to the type of investment, conditions in the financial markets, credit-worthiness of our borrowers, competition and other factors, none of which can be predicted with any certainty. Our operating results also may be impacted by credit losses in excess of initial anticipations or unanticipated credit events experienced by borrowers whose mortgage loans are held directly by us or that are included in our CMBS. Our net property operating income depends on our ability to maintain the historical occupancy rates of our real estate equity investments, lease currently available space and continue to attract new tenants.
Changes in fair value of our assets
It is our business strategy to hold our target assets as long-term investments. As a result, we do not expect that changes in the market value of the assets will normally impact our operating results. However, at least on a quarterly basis, we assess both our ability and intent to continue to hold such assets as long-term investments. As part of this process, we monitor our target assets for “other-than-temporary” impairment. A change in our ability and/or intent to continue to hold any of our assets could result in our recognizing an impairment charge or realizing losses upon the sale of such securities.
Changes in market interest rates
With respect to our proposed business operations, increases in interest rates, in general, may over time cause:
|
•
|
the
value
of fixed-rate investments to decrease;
|
|
•
|
prepayments
on certain assets in our portfolio to slow, thereby slowing the amortization of our purchase premiums and the accretion of our purchase discounts;
|
|
•
|
coupons
on our floating and adjustable-rate mortgage loans and CMBS to reset, although on a delayed basis, to higher interest rates;
|
|
•
|
to
the
extent we use leverage to finance our assets, the interest expense associated with our borrowings to increase; and
|
|
•
|
to
the
extent we enter into interest rate swap agreements as part of our hedging strategy, the value of these agreements to increase.
|
Conversely, decreases in interest rates, in general, may over time cause:
|
•
|
the value of the fixed-rate assets in our portfolio to increase;
|
|
•
|
prepayments on certain assets in our portfolio to increase, thereby accelerating the amortization of our purchase premiums and the accretion of our purchase discounts;
|
|
•
|
to the extent we enter into interest rate swap agreements as part of our hedging strategy, the value of these agreements to decrease;
|
|
•
|
coupons on our floating and adjustable-rate mortgage loans and CMBS to reset, although on a delayed basis, to lower interest rates;
|
|
•
|
to the extent we use leverage to finance our assets, the interest expense associated with our borrowings to decrease; and
|
|
•
|
to the extent we enter into interest rate swap agreements as part of our hedging strategy, the value of these agreements
to decrease.
|
Credit risk
One objective of our strategy is to minimize credit losses. However, we are subject to varying degrees of credit risk in connection with our target assets. Our Manager seeks to mitigate this risk by seeking to acquire high quality assets, at appropriate prices given anticipated and unanticipated losses and by deploying a comprehensive review and asset selection process and by careful ongoing
55
monitoring of acquired assets. Nevertheless, unanticipated credit losses could occur, which could adversely impact our operating results.
Size of investment portfolio
The size of our portfolio, as measured by the aggregate principal balance of our commercial mortgage loans, other commercial real estate-related debt investments and the other assets we own, is also a key revenue driver. Generally, as the size of our portfolio grows, the amount of interest income we earn increases. However, a larger portfolio may result in increased expenses to the extent that we incur additional interest expense to finance our assets.
Market conditions
We believe that market conditions impact our operating results and will cause us to adjust our investment and financing strategies over time as new opportunities emerge and risk profiles of our business change. In addition, changes in government programs could impact our ability to acquire our target assets. Except as set forth above, we are not aware of any material trends or uncertainties, other than national economic conditions affecting mortgage loans, mortgage-backed securities and real estate, generally, that may reasonably be expected to have a material impact, favorable or unfavorable, on revenues or income from the acquisition of real estate-related assets, other than those referred to in this Annual Report on Form 10-K.
56
Results of Operations
As a result of the Combination, comparisons of our period to period financial information as set forth herein may not be meaningful. The historical financial information included herein as of any date, or for any periods, on or prior to
January 31, 2018
, represents the pre-merger financial information of the CLNY Investment Entities, our accounting predecessor, on a stand-alone basis. The CLNY Investment Entities represent only a portion of our business following the Combination and therefore do not represent the results of operations we would have had for any period prior to the Combination. As of
February 1, 2018
, our results of operations reflect our operation following the Combination of our accounting predecessor, the CLNY Investment Entities, and NorthStar I and NorthStar II. The results of operations of NorthStar I and NorthStar II are incorporated into ours effective from
February 1, 2018
.
The following table summarizes our results of operations for
years ended
December 31, 2018
,
2017
and
2016
(Dollars in Thousands):
|
Year Ended December 31,
|
Change
|
||||||||||||||||||
|
2018
|
2017
|
2016
|
2018 compared to 2017
|
2017 compared to 2016
|
|||||||||||||||
|
Net interest income
|
|||||||||||||||||||
|
Interest income
|
$
|
151,653
|
|
$
|
140,214
|
|
$
|
140,529
|
|
$
|
11,439
|
|
$
|
(315
|
)
|
||||
|
Interest expense
|
(47,074
|
)
|
(21,019
|
)
|
(26,031
|
)
|
(26,055
|
)
|
5,012
|
|
|||||||||
|
Interest income on mortgage loans held in securitization trusts
|
143,371
|
|
—
|
|
—
|
|
143,371
|
|
—
|
|
|||||||||
|
Interest expense on mortgage obligations issued by securitization trusts
|
(132,411
|
)
|
—
|
|
—
|
|
(132,411
|
)
|
—
|
|
|||||||||
|
Net interest income
|
115,539
|
|
119,195
|
|
114,498
|
|
(3,656
|
)
|
4,697
|
|
|||||||||
|
Property and other income
|
|||||||||||||||||||
|
Property operating income
|
178,339
|
|
23,750
|
|
1,138
|
|
154,589
|
|
22,612
|
|
|||||||||
|
Other income
|
3,651
|
|
791
|
|
536
|
|
2,860
|
|
255
|
|
|||||||||
|
Total property and other income
|
181,990
|
|
24,541
|
|
1,674
|
|
157,449
|
|
22,867
|
|
|||||||||
|
Expenses
|
|
||||||||||||||||||
|
Management fee expense
|
43,190
|
|
—
|
|
—
|
|
43,190
|
|
—
|
|
|||||||||
|
Property operating expense
|
73,616
|
|
7,978
|
|
905
|
|
65,638
|
|
7,073
|
|
|||||||||
|
Transaction, investment and servicing expense
|
36,800
|
|
2,570
|
|
1,767
|
|
34,230
|
|
803
|
|
|||||||||
|
Interest expense on real estate
|
43,437
|
|
5,095
|
|
—
|
|
38,342
|
|
5,095
|
|
|||||||||
|
Depreciation and amortization
|
90,986
|
|
9,137
|
|
146
|
|
81,849
|
|
8,991
|
|
|||||||||
|
Provision for loan losses
|
113,911
|
|
518
|
|
3,386
|
|
113,393
|
|
(2,868
|
)
|
|||||||||
|
Impairment of operating real estate
|
31,813
|
|
—
|
|
—
|
|
31,813
|
|
—
|
|
|||||||||
|
Administrative expense (including $1,822, $0 and $0 of equity-based compensation expense)
|
26,634
|
|
12,669
|
|
15,437
|
|
13,965
|
|
(2,768
|
)
|
|||||||||
|
Total expenses
|
460,387
|
|
37,967
|
|
21,641
|
|
422,420
|
|
16,326
|
|
|||||||||
|
Other income (loss)
|
|||||||||||||||||||
|
Unrealized gain on mortgage loans and obligations held in securitization trusts, net
|
5,003
|
|
—
|
|
—
|
|
5,003
|
|
—
|
|
|||||||||
|
Realized loss on mortgage loans and obligations held in securitization trusts, net
|
(3,447
|
)
|
—
|
|
—
|
|
(3,447
|
)
|
—
|
|
|||||||||
|
Other loss, net
|
(2,766
|
)
|
(390
|
)
|
(56
|
)
|
(2,376
|
)
|
(334
|
)
|
|||||||||
|
Income (loss) before equity in earnings of unconsolidated ventures and income taxes
|
(164,068
|
)
|
105,379
|
|
94,475
|
|
(269,447
|
)
|
10,904
|
|
|||||||||
|
Equity in earnings (losses) of unconsolidated ventures
|
23,774
|
|
24,709
|
|
16,067
|
|
(935
|
)
|
8,642
|
|
|||||||||
|
Income tax expense
|
(37,059
|
)
|
(2,208
|
)
|
(1,521
|
)
|
(34,851
|
)
|
(687
|
)
|
|||||||||
|
Net income (loss)
|
$
|
(177,353
|
)
|
$
|
127,880
|
|
$
|
109,021
|
|
$
|
(305,233
|
)
|
$
|
18,859
|
|
||||
57
Comparison of
Years Ended
December 31, 2018
and
2017
:
Net Interest Income
Interest income
Interest income increased by
$11.4 million
to
$151.7 million
for the
year ended
December 31, 2018
, as compared to the
year ended
December 31, 2017
, primarily as a result of an increase of
$80.4 million
related to the acquisition of NorthStar I and NorthStar II loans, preferred equity, and CMBS and an increase of
$26.4 million
related to originations and acquisitions in 2018, partially offset by a decrease of
$83.8 million
in the CLNY Investment Entities as a result of the deconsolidation of certain investment entities and the repayment of loan investments, as well as a decrease of
$11.5 million
due to placing the four NY hospitality loans on non-accrual status.
Interest expense
Interest expense increased by
$26.1 million
to
$47.1 million
for the
year ended
December 31, 2018
, as compared to the
year ended
December 31, 2017
, primarily due to a
$28.1 million
increase as a result of the acquisition of NorthStar I and NorthStar II, a
$7.6 million
increase related to borrowings on our master repurchase and CMBS credit facilities in 2018, and a
$5.5 million
increase related to the revolving credit facility entered into on February 1, 2018, partially offset by a decrease of
$16.8 million
in the CLNY Investment Entities as a result of the deconsolidation of certain investment entities and the repayment of securitization bonds payable.
Interest income on mortgage loans and obligations held in securitization trusts, net
Interest income on mortgage loans and obligations held in securitization trusts, net of
$11.0 million
during the
year ended
December 31, 2018
is attributable to our investment in the subordinate tranches of the consolidated securitization trusts acquired as a result of the Combination.
Property and other income
Property operating income
Property operating income increased by
$154.6 million
to
$178.3 million
for the
year ended
December 31, 2018
, as compared to the
year ended
December 31, 2017
, primarily as a result of the operating real estate properties acquired in connection with the acquisition of NorthStar I and NorthStar II of $120.7 million, two net lease portfolios acquired during the third quarter of 2018 of $18.0 million and the two real estate properties acquired through the legal foreclosure process of $14.9 million.
Expenses
Management fee expense
Management fee expense represents fees paid to our Manager in accordance with the Management Agreement. During the
year ended
December 31, 2018
, management fee expense was
$43.2 million
. We entered into the Management Agreement on
January 31, 2018
and therefore did not incur any management fee expenses prior to this date.
Property operating expense
Property operating expense increased by
$65.6 million
to
$73.6 million
for the
year ended
December 31, 2018
, as compared to the
year ended
December 31, 2017
, primarily as a result of the operating real estate properties acquired in connection with the acquisition of NorthStar I and NorthStar II of $49.4 million and the two real estate properties acquired through the legal foreclosure process of $11.7 million.
Transaction, investment and servicing expense
Transaction, investment and servicing expense represents costs such as professional fees associated with new investments and transactions. Transaction, investment and servicing expense increased by
$34.2 million
to
$36.8 million
for the
year ended
December 31, 2018
, as compared to the
year ended
December 31, 2017
, primarily as a result of
$31.9 million
of transaction costs associated with the Combination.
Interest expense on real estate
Interest expense on real estate increased by
$38.3 million
to
$43.4 million
for the
year ended
December 31, 2018
, as compared to the
year ended
December 31, 2017
, primarily as a result of the operating real estate properties acquired in connection with the acquisition of NorthStar I and NorthStar II of $30.7 million and the two net lease portfolios acquired during the third quarter of 2018 of $7.4 million.
58
Depreciation and amortization
Depreciation and amortization expense increased by
$81.8 million
to
$91.0 million
for the
year ended
December 31, 2018
, as compared to the
year ended
December 31, 2017
, primarily as a result of the operating real estate properties acquired in connection with the acquisition of NorthStar I and NorthStar II of $72.4 million, the two net lease portfolios acquired during the third quarter of 2018 of $8.2 million and the two hotels acquired through the legal foreclosure process of $2.2 million.
Provision for loan losses
Provision for loan losses increased by
$113.4 million
to
$113.9 million
for the
year ended
December 31, 2018
, as compared to the
year ended
December 31, 2017
, primarily due to provisions for loan losses recorded during the
year ended
December 31, 2018
on our four NY hospitality loans of
$53.8 million
,
four
loans collateralized with
28
office, retail, multifamily and industrial properties of
$36.8 million
, two loans collateralized by retail properties of
$15.0 million
and one loan collateralized by a retail property of $8.8 million. See Note 4 to the consolidated financial statements, “Loans and Preferred Equity Held for Investment, net” for further detail.
Impairment of operating real estate
Impairment of operating real estate of
$31.8 million
for the
year ended
December 31, 2018
is attributable to certain retail and student housing properties in our operating real estate portfolio, as well as the multi-tenant office portfolio sold in October 2018. See Note 7 to the consolidated financial statements, “Real Estate, net” and Note 15, “Fair Value” for further detail.
Administrative expense
Administrative expense increased by
$14.0 million
to
$26.6 million
for the
year ended
December 31, 2018
, as compared to the
year ended
December 31, 2017
, primarily due to additional reimbursable expenses allocated to us by our Manager as a result of the acquisition of NorthStar I and NorthStar II in the Combination. See Note 11 to the consolidated financial statements, “Related Party Arrangements,” for further information on reimbursement of expenses.
Other income (loss)
Unrealized gain on mortgage loans and obligations held in securitization trusts, net
During the
year ended
December 31, 2018
, we recorded an unrealized gain on mortgage loans and obligations held in securitization trusts, net of
$5.0 million
which represents the change in fair value of the assets and liabilities of the securitization trusts consolidated as a result of our investment in the subordinate tranches of these securitization trusts acquired in the Combination.
Realized loss on mortgage loans and obligations held in securitization trusts, net
During the
year ended
December 31, 2018
, we recorded a realized loss on mortgage loans and obligations held in securitization trusts, net of
$3.4 million
which represents a loss incurred from lower than expected future cash flows on a subordinate tranche of a securitization trust.
Other loss, net
Other loss, net increased by
$2.4 million
for the
year ended
December 31, 2018
, as compared to the
year ended
December 31, 2017
, primarily as a result of an unrealized loss on non-designated interest rate contracts of $6.0 million, partially offset by an unrealized gain on non-designated foreign exchange contracts of $2.8 million.
Equity in earnings of unconsolidated ventures
Equity in earnings of unconsolidated ventures decreased by
$0.9 million
to
$23.8 million
for the
year ended
December 31, 2018
, as compared to the
year ended
December 31, 2017
, primarily due to a net loss of
$33.5 million
related to our PE Investments. This is partially offset by an increase of $20.3 million related to equity method investments acquired as a result of the acquisition of NorthStar I and NorthStar II, an increase of $8.1 million related to investments in unconsolidated joint ventures originated in 2018 and an increase of $5.8 million in the CLNY Investment Entities as a result of the deconsolidation of certain investment entities.
Income tax expense
Income tax expense increased by
$34.9 million
to
$37.1 million
for the
year ended
December 31, 2018
, as compared to the
year ended
December 31, 2017
, primarily due to a tax valuation adjustment recorded in 2018 following an analysis that determined it is more likely than not that some portion of the deferred tax asset related to its PE Investments will not be realized. This conclusion was reached following the gross
$55.2 million
unrealized loss recorded during the year on PE Investments, in addition to future income projections. We are currently exploring the potential disposition of our PE Investments.
59
Comparison of
Years Ended
December 31, 2017
and
2016
:
Net Interest Income
Interest income
Interest income decreased by
$0.3 million
to
$140.2 million
for the
year ended
December 31, 2017
, as compared to the
year ended
December 31, 2016
. Interest income from the loan portfolio existing prior to the tri-party merger among Colony Capital, NorthStar Asset Management Group Inc. and NorthStar Realty Finance (“NRF”), which closed on January 10, 2017 (the “CLNY Merger”) decreased $15.2 million primarily due to loan sales and repayments, which more than offset the $14.6 million of incremental interest income from $177.2 million of loans receivable acquired from NRF through the CLNY Merger and additional interest income from draws on development loans in 2017.
Interest expense
Interest expense decreased by
$5.0 million
to
$21.0 million
for the
year ended
December 31, 2017
, as compared to the
year ended
December 31, 2016
, primarily due to the payoff of warehouse facilities in 2017 with proceeds from sales of loan and paydown of securitization bonds through resolutions of underlying loans, partially offset by interest expense incurred on a secured financing transaction in 2017.
Property and other income
Property operating income, property operating expense and depreciation and amortization
These amounts increased significantly in the
year ended
December 31, 2017
, as compared to the
year ended
December 31, 2016
, primarily as a result of Colony Capital’s acquisition of 13 net lease properties from NRF through the CLNY Merger totaling $205.4 million. Prior to the CLNY Merger, the CLNY Investment Entities did not hold any real estate except for two properties comprised of two medical office buildings acquired through foreclosure in October 2015 and sold in March 2017 and a hotel acquired through foreclosure in January 2017.
Other income
Other income increased by
$0.3 million
to
$0.8 million
for the
year ended
December 31, 2017
, as compared to the
year ended
December 31, 2016
, primarily due to higher recovery of expenses from borrowers and other recoveries from resolution of our loan investments.
Expenses
Transaction, investment and servicing expense
Transaction, investment and servicing expense represents costs such as professional fees associated with new investments and transactions. Transaction, investment and servicing expense increased by
$0.8 million
to
$2.6 million
for the
year ended
December 31, 2017
, as compared to the year ended December 31,
2016
, primarily due to increased legal costs incurred in connection with the sales of loans in 2017.
Interest expense on real estate
Interest expense on real estate was
$5.1 million
for the
year ended
December 31, 2017
as a result of the operating real estate properties acquired in connection with the CLNY Merger as compared, to the
year ended
December 31, 2016
, when we did not hold any mortgage notes.
Provision for loan losses
Provision for loan losses decreased by
$2.9 million
to
$0.5 million
for the
year ended
December 31, 2017
, as compared to the
year ended
December 31, 2016
. Provision for loan loss in 2017 was attributed to a mortgage loan that went into maturity default in November 2017, while the provision for loan loss in 2016 was attributed to a decrease in collateral value of a mortgage loan secured by a hotel which was subsequently foreclosed in January 2017.
Administrative expense
Administrative expense decreased by
$2.8 million
to
$12.7 million
for the
year ended
December 31, 2017
, as compared to the
year ended
December 31, 2016
. Prior to the Combination, administrative expenses primarily consisted of corporate-level costs that are either incurred specifically on behalf of the CLNY Investment Entities or an allocation of costs estimated to be applicable to the CLNY Investment Entities, largely based on the relative assets under management of the CLNY Investment Entities to the total assets under management of Colony Capital. The allocated administrative cost was $12.1 million for the
year ended
60
December 31, 2017
, as compared to $15.1 million for the
year ended
December 31, 2016
. The decrease reflects a combination of a lower percentage of costs allocated to the CLNY Investment Entities as a result of the CLNY Merger which increased Colony Capital’s total assets under management and synergies from the CLNY Merger which resulted in overall cost savings to Colony Capital.
Other income (loss)
Other loss, net
Other loss, net increased by
$0.3 million
to $0.4 million for the
year ended
December 31, 2017
, as compared to the
year ended
December 31, 2016
, due to an unrealized loss on non-designated interest rate contracts.
Equity in earnings of unconsolidated ventures
Equity in earnings of unconsolidated ventures increased by $8.6 million to $24.7 million for the
year ended
December 31, 2017
, as compared to the
year ended
December 31, 2016
, primarily due to a $7.2 million increase in 2017 driven by additional draws and sales of land under development by one of the equity method investees and a $1.4 million increase due to net earnings from two private real estate funds acquired through the CLNY Merger.
Income tax expense
Income tax expense increased by $0.7 million to
$2.2 million
for the
year ended
December 31, 2017
, as compared to the
year ended
December 31, 2016
, primarily due to increased earnings from investments in private real estate funds acquired in the CLNY Merger.
Non-GAAP Supplemental Financial Measures
Core Earnings
We present Core Earnings, which is a non-GAAP supplemental financial measure of our performance. We believe that Core Earnings provides meaningful information to consider in addition to our net income and cash flow from operating activities determined in accordance with U.S. GAAP. This supplemental financial measure helps us to evaluate our performance excluding the effects of certain transactions and U.S GAAP adjustments that we believe are not necessarily indicative of our current portfolio and operations. We also use Core Earnings to determine the incentive fees we pay to our Manager. For information on the fees we pay our Manager, see Note 11, “Related Party Arrangements” to our consolidated financial statements included in this Form 10-K. In addition, we believe that our investors also use Core Earnings or a comparable supplemental performance measure to evaluate and compare the performance of us and our peers, and as such, we believe that the disclosure of Core Earnings is useful to our investors.
We define Core Earnings as U.S. GAAP net income (loss) attributable to our common stockholders (or, without duplication, the owners of the common equity of our direct subsidiaries, such as our OP) and excluding (i) non-cash equity compensation expense, (ii) the expenses incurred in connection with our formation, (iii) the incentive fee, (iv) acquisition costs from successful acquisitions, (v) depreciation and amortization, (vi) any unrealized gains or losses or other similar non-cash items that are included in net income for the current quarter, regardless of whether such items are included in other comprehensive income or loss, or in net income, (vii) one-time events pursuant to changes in U.S. GAAP and (viii) certain material non-cash income or expense items that in the judgment of management should not be included in Core Earnings. For clauses (vii) and (viii), such exclusions shall only be applied after discussions between our Manager and our independent directors and after approval by a majority of our independent directors. Core Earnings reflects adjustments to U.S. GAAP net income to exclude impairment of real estate and provision for loan losses. Such impairment and losses may ultimately be realized, in part or full, upon a sale or monetization of the related investments and such realized losses would be reflected in Core Earnings.
Core Earnings does not represent net income or cash generated from operating activities and should not be considered as an alternative to U.S. GAAP net income or an indication of our cash flows from operating activities determined in accordance with U.S. GAAP, a measure of our liquidity, or an indication of funds available to fund our cash needs, including our ability to make cash distributions. In addition, our methodology for calculating Core Earnings may differ from methodologies employed by other companies to calculate the same or similar non-GAAP supplemental financial measures, and accordingly, our reported Core Earnings may not be comparable to the Core Earnings reported by other companies.
61
The following table presents a reconciliation of net income (loss) attributable to our common stockholders to Core Earnings attributable to our common stockholders and noncontrolling interest of the Operating Partnership (dollars and share amounts in thousands, except per share data):
|
|
Year Ended December 31,
|
|||||||||||
|
|
2018
|
2017
|
2016
|
|||||||||
|
Net income (loss) attributable to Colony Credit Real Estate, Inc. common stockholders
|
$
|
(168,498
|
)
|
$
|
88,504
|
|
$
|
76,051
|
|
|||
|
Adjustments:
|
||||||||||||
|
Net income attributable to noncontrolling interest of the Operating Partnership
|
(4,084
|
)
|
—
|
|
—
|
|
||||||
|
Non-cash equity compensation expense
|
7,113
|
|
—
|
|
—
|
|
||||||
|
Transaction costs
|
31,882
|
|
—
|
|
—
|
|
||||||
|
Depreciation and amortization
|
93,272
|
|
9,297
|
|
146
|
|
||||||
|
Net unrealized loss:
|
||||||||||||
|
Provision for loan losses
|
114,428
|
|
—
|
|
—
|
|
||||||
|
Impairment of operating real estate
|
31,813
|
|
—
|
|
—
|
|
||||||
|
Other unrealized loss
|
1,568
|
|
—
|
|
—
|
|
||||||
|
Depreciation, amortization and impairment previously adjusted for Core Earnings (loss) on real estate sold
|
(9,491
|
)
|
—
|
|
—
|
|
||||||
|
Adjustments related to noncontrolling interests in investment entities
|
(11,891
|
)
|
—
|
|
—
|
|
||||||
|
Core Earnings attributable to Colony Credit Real Estate, Inc. common stockholders and noncontrolling interest of the Operating Partnership
|
$
|
86,112
|
|
$
|
97,801
|
|
$
|
76,197
|
|
|||
|
Core Earnings per share
(1)
|
$
|
0.70
|
|
$
|
2.06
|
|
$
|
1.60
|
|
|||
|
Weighted average number of common shares and OP units
(1)
|
123,752
|
|
47,475
|
|
47,475
|
|
||||||
_________________________________________
|
(1)
|
We calculate core earnings per share, a non-GAAP financial measure, based on a weighted-average number of common shares and OP units (held by members other than us or our subsidiaries). For Core Earnings per share, we assume the
44.4 million
shares of Class B-3 common stock and the
3.1 million
OP units (held by members other than us or our subsidiaries) were outstanding prior to January 31, 2018 to reflect the standalone pre-merger financial information of the accounting acquirer. Following January 31, 2018, we assume approximately
131.0 million
of shares of Class A common stock, Class B-3 common stock and OP units (held by members other than us or our subsidiaries) were outstanding. This results in a weighted average share count for the
year ended
December 31, 2018
of approximately
123.8 million
shares.
|
Liquidity and Capital Resources
Overview
Our primary liquidity needs include commitments to repay borrowings, finance our assets and operations, meet future funding obligations, make distributions to our stockholders, repurchase our shares and fund other general business needs. We use significant cash to make additional investments, repay the principal of and interest on our borrowings and pay other financing costs, make distributions to our stockholders and fund our operations, which includes making payments to our Manager in accordance with the management agreement.
Our primary sources of liquidity include cash on hand, cash generated from our operating activities and cash generated from asset sales and investment maturities. However, subject to maintaining our qualification as a REIT and our Investment Company Act exclusion, we may use a number of sources to finance our business, including bank credit facilities (including term loans and revolving facilities), master repurchase facilities and securitizations, as described below. In addition to our current sources of liquidity, we have access to liquidity through public offerings of debt and equity securities. We also expect to invest in a number of our assets through co-investments with other investment vehicles managed by affiliates of our Manager and/or other third parties, which may allow us to pool capital to access larger transactions and diversify investment exposure.
Financing Strategy
We have a multi-pronged financing strategy that includes an up to
$560 million
secured revolving credit facility, up to approximately
$2.1 billion
in secured revolving repurchase facilities, non-recourse securitization financing, commercial mortgages and other asset-level financing structures. In addition, we may use other forms of financing, including additional warehouse facilities, public and private secured and unsecured debt issuances and equity or equity-related securities issuances by us or our subsidiaries. We may also finance a portion of our investments through the syndication of one or more interests in a whole loan or securitization. We will seek to match the nature and duration of the financing with the underlying asset’s cash flow, including through the use of hedges, as appropriate.
62
Debt-to-Equity Ratio
The following table presents our debt-to-equity ratio:
|
December 31, 2018
|
December 31, 2017
|
|||
|
Debt-to-equity ratio
(1)
|
0.9x
|
0.3x
|
||
_________________________________________
|
(1)
|
Represents (i) total outstanding secured debt less cash to (ii) total equity, in each case, at period end.
|
The following table presents our total sources of liquidity as of
December 31, 2018
(dollars in thousands):
|
Total Sources of Corporate Liquidity
|
||||
|
Cash and cash equivalents
|
$
|
77,317
|
|
|
|
Bank credit facility availability
|
230,000
|
|
||
|
Total sources of corporate liquidity
|
$
|
307,317
|
|
|
Potential Sources of Liquidity
Bank Credit Facilities
We use bank credit facilities (including term loans and revolving facilities) to finance our business. These financings may be collateralized or non-collateralized and may involve one or more lenders. Credit facilities typically have maturities ranging from two to five years and may accrue interest at either fixed or floating rates.
On February 1, 2018, the OP (together with certain subsidiaries of the OP from time to time party thereto as borrowers, collectively, the “Borrowers”) entered into a credit agreement (the “Bank Credit Facility”) with JPMorgan Chase Bank, N.A., as administrative agent, and the several lenders from time to time party thereto (the “Lenders”), pursuant to which the Lenders agreed to provide a revolving credit facility in the aggregate principal amount of up to
$400.0 million
. On December 17, 2018, the aggregate amount of revolving commitments was increased to
$525.0 million
. On February 4, 2019, the aggregate amount of revolving commitments was increased to
$560.0 million
.
Advances under the Bank Credit Facility accrue interest at a per annum rate equal to, at the applicable Borrower’s election, either a LIBOR rate plus a margin of
2.25%
, or a base rate determined according to a prime rate or federal funds rate plus a margin of
1.25%
. An unused commitment fee at a rate of
0.25%
or
0.35%
, per annum, depending on the amount of facility utilization, applies to un-utilized borrowing capacity under the Bank Credit Facility. Amounts owing under the Bank Credit Facility may be prepaid at any time without premium or penalty, subject to customary breakage costs in the case of borrowings with respect to which a LIBOR rate election is in effect.
The maximum amount available for borrowing at any time under the Bank Credit Facility is limited to a borrowing base valuation of certain investment assets, with the valuation of such investment assets generally determined according to a percentage of adjusted net book value. As of the date hereof, the borrowing base valuation is sufficient to support the outstanding borrowings. The Bank Credit Facility will mature on February 1, 2022, unless the OP elects to exercise the extension options for up to two (2) additional terms of six (6) months each, subject to the terms and conditions in the Bank Credit Facility, resulting in a latest maturity date of February 1, 2023.
The obligations of the Borrowers under the Bank Credit Facility are guaranteed by substantially all material wholly owned subsidiaries of the OP pursuant to a Guarantee and Collateral Agreement with the OP and certain subsidiaries of the OP in favor of JPMorgan Chase Bank, N.A., as administrative agent (the “Guarantee and Collateral Agreement”) and, subject to certain exceptions, secured by a pledge of substantially all equity interests owned by the Borrowers and the guarantors, as well as by a security interest in deposit accounts of the Borrowers and the Guarantors (as such terms are defined in the Guarantee and Collateral Agreement) in which the proceeds of investment asset distributions are maintained.
The Bank Credit Facility contains various affirmative and negative covenants, including, among other things, the obligation of the Company to maintain REIT status and be listed on the NYSE, and limitations on debt, liens and restricted payments. In addition, the Bank Credit Facility includes the following financial covenants applicable to the OP and its consolidated subsidiaries: (a) consolidated tangible net worth of the OP must be greater than or equal to the sum of (i)
$2.105 billion
and (ii)
50%
of the proceeds received by the OP from any offering of its common equity and of the proceeds from any offering by the Company of its common equity to the extent such proceeds are contributed to the OP, excluding any such proceeds that are contributed to the OP within ninety (90) days of receipt and applied to acquire capital stock of the OP; (b) the OP’s earnings before interest, income tax, depreciation, and amortization plus lease expenses to fixed charges for any period of four (4) consecutive fiscal quarters must be not less than
1.50
to
1.00
; (c) the OP’s interest coverage ratio must be not less than
3.00
to
1.00
; and (d) the OP’s ratio of
63
consolidated total debt to consolidated total assets must be not more than
0.70
to
1.00
. The Bank Credit Facility also includes customary events of default, including, among other things, failure to make payments when due, breach of covenants or representations, cross default to material indebtedness or material judgment defaults, bankruptcy matters involving any Borrower or any Guarantor and certain change of control events. The occurrence of an event of default will limit the ability of the OP and its subsidiaries to make distributions and may result in the termination of the credit facility, acceleration of repayment obligations and the exercise of remedies by the Lenders with respect to the collateral.
Master Repurchase Facilities and CMBS Credit Facilities
Currently, our primary source of financing is our master repurchase facilities, which we use to finance the origination of senior loans, and CMBS credit facilities, which we use to finance the purchase of securities. Repurchase agreements effectively allow us to borrow against loans, participations and securities that we own in an amount generally equal to (i) the market value of such loans, participations and/or securities multiplied by (ii) the applicable advance rate. Under these agreements, we sell our loans, participations and securities to a counterparty and agree to repurchase the same loans and securities from the counterparty at a price equal to the original sales price plus an interest factor. During the term of a repurchase agreement, we receive the principal and interest on the related loans, participations and securities and pay interest to the lender under the master repurchase agreement. We intend to maintain formal relationships with multiple counterparties to obtain master repurchase financing on favorable terms.
The following table presents a summary of our master repurchase facilities as of
December 31, 2018
(dollars in thousands):
|
Maximum Facility Size
|
Current Borrowings
|
Weighted Average Final Maturity (Years)
|
Weighted Average Interest Rate
|
|||||||||||
|
Master Repurchase Facilities
|
||||||||||||||
|
Bank 1
|
$
|
300,000
|
|
$
|
143,400
|
|
4.3
|
|
LIBOR + 2.00%
|
|
||||
|
Bank 2
|
200,000
|
|
22,750
|
|
3.8
|
|
LIBOR + 2.50%
|
|
||||||
|
Bank 3
|
500,000
|
|
352,108
|
|
2.3
|
|
LIBOR + 2.32%
|
|
||||||
|
Bank 7
|
500,000
|
|
308,434
|
|
3.3
|
|
LIBOR + 1.89%
|
|
||||||
|
Bank 8
|
250,000
|
|
53,596
|
|
2.5
|
|
LIBOR + 2.00%
|
|
||||||
|
Bank 9
|
300,000
|
|
—
|
|
4.8
|
|
—
|
|
||||||
|
Total Master Repurchase Facilities
|
2,050,000
|
|
880,288
|
|
||||||||||
|
CMBS Credit Facilities
|
||||||||||||||
|
Bank 1
|
35,779
|
|
35,779
|
|
(1
|
)
|
LIBOR + 1.10%
|
|
||||||
|
Bank 6
|
154,851
|
|
154,851
|
|
(1
|
)
|
LIBOR + 1.20%
|
|
||||||
|
Bank 3
|
—
|
|
—
|
|
—
|
|
—
|
|
||||||
|
Bank 4
|
—
|
|
—
|
|
—
|
|
—
|
|
||||||
|
Bank 5
|
—
|
|
—
|
|
—
|
|
—
|
|
||||||
|
Total CMBS Credit Facilities
|
190,630
|
|
190,630
|
|
||||||||||
|
Bank Credit Facility
|
525,000
|
|
295,000
|
|
4.1
|
|
LIBOR + 2.25%
|
|
||||||
|
Total Facilities
|
$
|
2,765,630
|
|
$
|
1,365,918
|
|
||||||||
_________________________________________
|
(1)
|
The maturity dates on CMBS Credit Facilities are dependent upon asset type and will typically range from one to
two
months.
|
Securitizations
We may seek to utilize non-recourse long-term securitizations of our investments in mortgage loans, especially loan originations, to the extent consistent with the maintenance of our REIT qualification and exclusion from the Investment Company Act in order to generate cash for funding new investments. This would involve conveying a pool of assets to a special purpose vehicle (or the issuing entity), which would issue one or more classes of non-recourse notes pursuant to the terms of an indenture. The notes would be secured by the pool of assets. In exchange for the transfer of assets to the issuing entity, we would receive the cash proceeds on the sale of non-recourse notes and a 100% interest in the equity of the issuing entity. The securitization of our portfolio investments might magnify our exposure to losses on those portfolio investments because any equity interest we retain in the issuing entity would be subordinate to the notes issued to investors and we would, therefore, absorb all of the losses sustained with respect to a securitized pool of assets before the owners of the notes experience any losses.
64
Other potential sources of financing
In the future, we may also use other sources of financing to fund the acquisition of our target assets, including secured and unsecured forms of borrowing and selective wind-down and dispositions of assets. We may also seek to raise equity capital or issue debt securities in order to fund our future investments.
Cash Flows
The following presents a summary of our consolidated statements of cash flows for the
years ended
December 31, 2018
,
2017
and
2016
(dollars in thousands):
|
Year Ended December 31,
|
||||||||||||
|
Cash flow provided by (used in):
|
2018
|
2017
|
2016
|
|||||||||
|
Operating activities
|
$
|
100,722
|
|
$
|
106,982
|
|
$
|
88,508
|
|
|||
|
Investing activities
|
(467,705
|
)
|
439,269
|
|
199,372
|
|
||||||
|
Financing activities
|
487,517
|
|
(551,658
|
)
|
(319,718
|
)
|
||||||
Operating Activities
Cash inflows from operating activities are generated primarily through interest received from loans receivable and securities, property operating income from our real estate portfolio, and distributions of earnings received from unconsolidated ventures. This is partially offset by payment of interest expenses for credit facilities and mortgage payable, and operating expenses supporting our various lines of business, including property management and operations, loan servicing and workout of loans in default, investment transaction costs, as well as general administrative costs.
Our operating activities generated cash flows of
$100.7 million
,
$107.0 million
and
$88.5 million
in
2018
,
2017
and
2016
, respectively. Net cash provided by operating activities decreased
$6.3 million
for the
year ended
December 31, 2018
, primarily as a result of transaction costs paid in connection with the Combination offset by additional cash inflows related to the acquisition of NorthStar I and NorthStar II. Net cash provided by operating activities increased by
$18.5 million
for the
year ended
December 31, 2017
, primarily as a result of additional cash inflows generated by properties acquired in the CLNY Merger.
We believe cash flows from operations, available cash balances and our ability to generate cash through short- and long-term borrowings are sufficient to fund our operating liquidity needs.
Investing Activities
Investing activities include cash outlays for acquisition of real estate, disbursements on new and/or existing loans, and contributions to unconsolidated ventures, which are partially offset by repayments and sales of loan receivables, distributions of capital received from unconsolidated ventures, proceeds from sale of real estate, as well as proceeds from maturity or sale of securities.
Investing activities in 2018 used net cash outflow of
$467.7 million
, resulting from acquisition, origination and funding of loans and preferred equity held for investment, net of
$919.5 million
, acquisition of and additions to real estate, related intangibles and leasing commissions of
$415.1 million
, investment in unconsolidated ventures of
$239.7 million
, acquisition of real estate securities, available for sale of
$58.7 million
, and deposit on investments of
$29.4 million
, partially offset by repayment on loans and preferred equity held for investment of
$626.6 million
, cash received in the Combination of
$328.5 million
, proceeds from sale of real estate of
$167.9 million
, and distributions in excess of cumulative earnings from unconsolidated ventures of
$98.5 million
.
Investing activities in 2017 generated net cash inflow of
$439.3 million
, resulting from repayment on loans and preferred equity held for investment of
$537.5 million
, distributions in excess of cumulative earnings from unconsolidated ventures of
$55.1 million
, cash received in excess of accretion on purchased credit impaired loans of
$52.4 million
, proceeds from sale of loans and preferred equity held for investment, net of
$17.5 million
and proceeds from sale of real estate of
$8.9 million
, partially offset by acquisition, origination and funding of loans and preferred equity held for investment, net of
$200.2 million
and investment in unconsolidated ventures of
$16.3 million
.
Investing activities in 2016 generated net cash inflow of
$199.4 million
, resulting from repayment on loans and preferred equity held for investment of
$357.0 million
, proceeds from sale of loans and preferred equity held for investment, net of
$141.5 million
and cash received in excess of accretion on purchased credit impaired loans of
$18.1 million
, partially offset by acquisition, origination and funding of loans and preferred equity held for investment, net of
$257.6 million
and investment in unconsolidated ventures of
$21.4 million
.
65
Financing Activities
We finance our investing activities largely through borrowings secured by our investments along with capital from third party or affiliated coinvestors. We also have the ability to raise capital in the public markets through issuances of common stock, as well as draw upon our corporate credit facility, to finance our investing and operating activities. Accordingly, we incur cash outlays for payments on third party debt, dividends to our common stockholders as well as distributions to our noncontrolling interests.
Financing activities in 2018 generated net cash inflow of
$487.5 million
, resulting from borrowings from credit facilities in the amount of
$1.7 billion
and borrowings from mortgage notes in the amount of
$246.4 million
, partially offset by repayment of credit facilities in the amount of
$999.3 million
, distributions paid on common stock in the amount of
$189.8 million
, repayment of securitization bonds in the amount of
$108.2 million
, and repayment of mortgage notes in the amount of
$141.8 million
.
Financing activities in 2017 used net cash outflow of
$551.7 million
, resulting from repayment of mortgage notes in the amount of
$342.9 million
, distributions paid to CLNY owners in the amount of
$299.3 million
and distribution paid to noncontrolling interest in the amount of
$113.0 million
, partially offset by contributions from CLNY owners in the amount of
$81.5 million
, borrowings from mortgage notes in the amount of
$72.2 million
and contributions from noncontrolling interest in the amount of
$50.5 million
.
Financing activities in 2016 used net cash outflow of
$319.7 million
, resulting from repayment of mortgage notes in the amount of
$407.3 million
, distributions paid to CLNY owners in the amount of
$122.1 million
and distribution paid to noncontrolling interest in the amount of
$77.8 million
, partially offset by contributions from CLNY owners in the amount of
$113.0 million
, contributions from noncontrolling interest in the amount of
$95.6 million
and borrowings from mortgage notes in the amount of
$81.1 million
.
Contractual Obligations, Commitments and Contingencies of the Company
The following table sets forth the known contractual obligations of the Company on an undiscounted basis. This table excludes obligations of the Company that are not fixed and determinable, including the Management Agreement (dollars in thousands):
|
Payments Due by Period
|
||||||||||||||||||||
|
Total
|
2019
|
2020-2021
|
2022-2023
|
2024 and Thereafter
|
||||||||||||||||
|
Bank credit facility
(1)
|
$
|
340,543
|
|
$
|
14,750
|
|
$
|
29,500
|
|
$
|
296,293
|
|
$
|
—
|
|
|||||
|
Secured debt
(2)
|
2,705,141
|
|
505,946
|
|
723,802
|
|
385,208
|
|
1,090,185
|
|
||||||||||
|
Securitization bonds payable
(3)
|
83,070
|
|
83,070
|
|
—
|
|
—
|
|
—
|
|
||||||||||
|
Ground lease obligations
(4)
|
24,712
|
|
2,821
|
|
5,623
|
|
3,270
|
|
12,998
|
|
||||||||||
|
3,153,466
|
|
$
|
606,587
|
|
$
|
758,925
|
|
$
|
684,771
|
|
$
|
1,103,183
|
|
|||||||
|
Lending commitments
(5)
|
156,440
|
|
||||||||||||||||||
|
Total
|
$
|
3,309,906
|
|
|||||||||||||||||
_________________________________________
|
(1)
|
Future interest payments were estimated based on the applicable index at
December 31, 2018
and unused commitment fee of 0.25% per annum, assuming principal is repaid on the current maturity date of February 2022.
|
|
(2)
|
Amounts include minimum principal and interest obligations through the initial maturity date of the collateral assets. Interest on floating rate debt was determined based on the applicable index at
December 31, 2018
.
|
|
(3)
|
The timing of future principal payments was estimated based on expected future cash flows of underlying collateral loans. Repayments are estimated to be earlier than contractual maturity only if proceeds from underlying loans are repaid by the borrowers.
|
|
(4)
|
The Company assumed noncancellable operating ground leases as lessee or sublessee in connection with net lease properties acquired through the CLNY Contributions. The amounts represent minimum future base rent commitments through initial expiration dates of the respective leases, excluding any contingent rent payments. Rents paid under ground leases are recoverable from tenants.
|
|
(5)
|
Future lending commitments may be subject to certain conditions that borrowers must meet to qualify for such fundings. Commitment amount assumes future fundings meet the terms to qualify for such fundings.
|
Guarantees and Off-Balance Sheet Arrangements
As of
December 31, 2018
, we are not dependent on the use of any off-balance sheet financing arrangements for liquidity. We have made investments in unconsolidated ventures. Refer to Note 5, “Investments in Unconsolidated Ventures” in Item 15. “Exhibits and Financial Statement Schedules” for a discussion of such unconsolidated ventures in our consolidated financial statements. In each case, our exposure to loss is limited to the carrying value of our investment.
Underwriting, Asset and Risk Management
Our Manager closely monitors our portfolio and actively manages risks associated with, among other things, our assets and interest rates. Prior to investing in any particular asset, our Manager’s underwriting team, in conjunction with third party providers, undertakes a rigorous asset-level due diligence process, involving intensive data collection and analysis, to ensure that we
66
understand fully the state of the market and the risk-reward profile of the asset. Prior to making a final investment decision, our Manager focuses on portfolio diversification to determine whether a target asset will cause our portfolio to be too heavily concentrated with, or cause too much risk exposure to, any one borrower, real estate sector, geographic region, source of cash flow for payment or other geopolitical issues. If our Manager determines that a proposed acquisition presents excessive concentration risk, it may determine not to acquire an otherwise attractive asset.
For each asset that we acquire, our Manager’s asset management team engages in active management of the asset, the intensity of which depends on the attendant risks. The asset manager works collaboratively with the underwriting team to formulate a strategic plan for the particular asset, which includes evaluating the underlying collateral and updating valuation assumptions to reflect changes in the real estate market and the general economy. This plan also generally outlines several strategies for the asset to extract the maximum amount of value from each asset under a variety of market conditions. Such strategies may vary depending on the type of asset, the availability of refinancing options, recourse and maturity, but may include, among others, the restructuring of non-performing or sub-performing loans, the negotiation of discounted pay-offs or other modification of the terms governing a loan, and the foreclosure and management of assets underlying non-performing loans in order to reposition them for profitable disposition. Our Manager and its affiliates will continuously track the progress of an asset against the original business plan to ensure that the attendant risks of continuing to own the asset do not outweigh the associated rewards. Under these circumstances, certain assets will require intensified asset management in order to achieve optimal value realization.
Our Manager’s asset management team engages in a proactive and comprehensive on-going review of the credit quality of each asset it manages. In particular for debt investments, on at least an annual basis, the asset management team will evaluate the financial wherewithal of individual borrowers to meet contractual obligations as well as review the financial stability of the assets securing such debt investments. Further, there is ongoing review of borrower covenant compliance including the ability of borrowers to meet certain negotiated debt service coverage ratios and debt yield tests. For equity investments, the asset management team, with the assistance of third party property managers, monitors and reviews key metrics such as occupancy, same store sales, tenant payment rates, property budgets and capital expenditures. If through this analysis of credit quality, the asset management team encounters declines in credit not in accord with the original business plan, the team evaluates the risks and determine what changes, if any, are required to the business plan to ensure that the attendant risks of continuing to hold the investment do not outweigh the associated rewards.
In addition, the audit committee of our board of directors, in consultation with management, periodically reviews our policies with respect to risk assessment and risk management, including key risks to which we are subject, including credit risk, liquidity risk and market risk, and the steps that management has taken to monitor and control such risks.
Inflation
Virtually all of our assets and liabilities are interest rate sensitive in nature. As a result, interest rates and other factors influence our performance significantly more than inflation does. A change in interest rates may correlate with the inflation rate. Substantially all of the leases at our multifamily and student housing properties allow for monthly or annual rent increases which provide us with the opportunity to achieve increases, where justified by the market, as each lease matures. Such types of leases generally minimize the risks of inflation on our multifamily and student housing properties.
Refer to Item 7A, “Quantitative and Qualitative Disclosures About Market Risk” for additional details.
Critical Accounting Policies
Preparation of financial statements in accordance with U.S. generally accepted accounting principles requires the use of estimates and assumptions that involve the exercise of judgment and that affect the reported amounts of assets, liabilities, and the disclosure of contingent assets and liabilities at the date of the financial statements and the reported amounts of revenues and expenses during the reporting period.
Certain accounting policies are considered to be critical accounting policies. Critical accounting policies are those that are most important to the portrayal of our financial condition and results of operations and require subjective and complex judgments, and for which the impact of changes in estimates and assumptions could have a material effect on our financial statements.
Principles of Consolidation
We consolidate entities in which we have a controlling financial interest by first considering if an entity meets the definition of a VIE for which we are deemed to be the primary beneficiary, or if we have the power to control an entity through a majority of voting interest or through other arrangements.
67
Variable Interest Entities-
A VIE is an entity that either (i) lacks sufficient equity to finance its activities without additional subordinated financial support from other parties; (ii) whose equity holders lack the characteristics of a controlling financial interest; or (iii) is established with non-substantive voting rights. A VIE is consolidated by its primary beneficiary, which is defined as the party that has a controlling financial interest in the VIE through (a) the power to direct the activities of the VIE that most significantly affect the VIE’s economic performance, and (b) the obligation to absorb losses or right to receive benefits of the VIE that could be significant to the VIE. We also consider interests held by our related parties, including de facto agents. We assess whether we are members of a related party group that collectively meets the power and benefits criteria and, if so, whether we are most closely associated with the VIE. In performing the related party analysis, we consider both qualitative and quantitative factors, including, but not limited to: the amount and characteristics of their investment relative to the related party; our ability and the related party’s ability to control or significantly influence key decisions of the VIE including consideration of involvement by de facto agents; the obligation or likelihood for us or the related party to fund operating losses of the VIE; and the similarity and significance of the VIE’s business to our activities and to those of the related party. The determination of whether an entity is a VIE, and whether we are the primary beneficiary, may involve significant judgment, including the determination of which activities most significantly affect the entities’ performance, and estimates about the current and future fair values and performance of assets held by the VIE.
Voting Interest Entities-
Unlike VIEs, voting interest entities have sufficient equity to finance their activities and equity investors exhibit the characteristics of a controlling financial interest through their voting rights. We consolidate such entities when we have the power to control these entities through ownership of a majority of the entities’ voting interests or through other arrangements.
At each reporting period, we reassess whether changes in facts and circumstances cause a change in the status of an entity as a VIE or voting interest entity, and/or a change in our consolidation assessment. Changes in consolidation status are applied prospectively. An entity may be consolidated as a result of this reassessment, in which case, the assets, liabilities and noncontrolling interest in the entity are recorded at fair value upon initial consolidation. Any existing equity interest we hold in the entity prior to us obtaining control will be remeasured at fair value, which may result in a gain or loss recognized upon initial consolidation. However, if the consolidation represents an asset acquisition of a voting interest entity, our existing interest in the acquired assets, if any, is not remeasured to fair value but continues to be carried at historical cost. We may also deconsolidate a subsidiary as a result of this reassessment, which may result in a gain or loss recognized upon deconsolidation depending on the carrying values of deconsolidated assets and liabilities compared to the fair value of any interests retained.
Fair Value Measurement
Fair value is based on an exit price, defined as the price that would be received to sell an asset or paid to transfer a liability in an orderly transaction between market participants. Where appropriate, we make adjustments to estimated fair values are made to appropriately reflect counterparty credit risk as well as our own credit-worthiness.
The estimated fair value of financial assets and financial liabilities are categorized into a three-tier hierarchy, prioritized based on the level of transparency in inputs used in the valuation techniques, as follows:
Level 1-
Quoted prices (unadjusted) in active markets for identical assets or liabilities.
Level
2-Observable inputs other than Level 1 prices, such as quoted prices for similar assets or liabilities, quoted prices in non-active markets, or valuation techniques utilizing inputs that are derived principally from or corroborated by observable data directly or indirectly for substantially the full term of the financial instrument.
Level 3-
At least one assumption or input is unobservable and it is significant to the fair value measurement, requiring significant management judgment or estimate.
Where the inputs used to measure the fair value of a financial instrument fall into different levels of the fair value hierarchy, the financial instrument is categorized within the hierarchy based on the lowest level of input that is significant to its fair value measurement.
68
Business Combinations
We evaluate each purchase transaction to determine whether the acquired assets meet the definition of a business. If substantially all of the fair value of gross assets acquired is concentrated in a single identifiable asset or a group of similar identifiable assets, then the set of transferred assets and activities is not a business. If not, for an acquisition to be considered a business, it would have to include an input and a substantive process that together significantly contribute to the ability to create outputs (i.e., there is a continuation of revenue before and after the transaction). A substantive process is not ancillary or minor, cannot be replaced without significant cost, effort or delay or is otherwise considered unique or scarce. To qualify as a business without outputs, the acquired assets would require an organized workforce with the necessary skills, knowledge and experience to perform a substantive process.
Net cash paid to acquire a business or assets is classified as investing activities on the accompanying statements of cash flows.
Business combinations are accounted for by applying the acquisition method. Transaction costs related to acquisition of a business are expensed as incurred and excluded from the fair value of consideration transferred. The identifiable assets acquired, liabilities assumed and noncontrolling interests in acquired entity are recognized and measured at their estimated fair values. The excess of the fair value of consideration transferred over the fair values of identifiable assets acquired, liabilities assumed and noncontrolling interests in an acquired entity, net of fair value of any previously held interest in the acquired entity, is recorded as goodwill. Such valuations require significant estimates and assumptions.
For acquisitions that are not deemed to be businesses, the assets acquired are recognized based on their cost to us as the acquirer, and no gain or loss is recognized unless the fair value of non-cash assets given as consideration differs from the carrying amount of the assets acquired. The cost of assets acquired in a group is allocated to individual assets within the group based on their relative fair values and does not give rise to goodwill. Transaction costs related to acquisition of assets are included in the cost basis of the assets acquired.
The acquisitions of NorthStar I and NorthStar II were each accounted for under the acquisition method for a business combination. See Note 3, “Business Combinations”, to Part IV, Item 15, “Exhibits and Financial Statement Schedules” for further detail.
Loans and Preferred Equity Held for Investment
We originate and purchase loans and preferred equity held for investment. The accounting framework for loans receivable depends on our strategy whether to hold or sell the loan, whether the loan was credit-impaired at the time of acquisition, or whether the lending arrangement is an Acquisition, Development and Construction (“ADC”) loan.
Loans and Preferred Equity Held for Investment
Loans and preferred equity that we have the intent and ability to hold for the foreseeable future are classified as held for investment. Originated loans and preferred equity are recorded at amortized cost, or outstanding unpaid principal balance plus exit fees less net deferred loan fees. Net deferred loan fees include unamortized origination and other fees charged to the borrower less direct incremental loan origination costs incurred by us. Purchased loans are recorded at amortized cost, or unpaid principal balance plus purchase premium or less unamortized discount. Costs to purchase loans and preferred equity are expensed as incurred.
Interest Income-
Interest income is recognized based upon contractual interest rate and unpaid principal balance of the loans. Net deferred loan fees on originated loans are deferred and amortized as adjustments to interest income over the expected life of the loans using the effective yield method. Premium or discount on purchased loans are amortized as adjustments to interest income over the expected life of the loans using the effective yield method. For revolving loans, net deferred loan fees, premium or discount are amortized to interest income using the straight-line method. When a loan is prepaid, prepayment fees and any excess of proceeds over the carrying amount of the loan are recognized as additional interest income.
Nonaccrual-
Accrual of interest income is suspended on nonaccrual loans and preferred equity investments. Loans and preferred equity that are past due 90 days or more as to principal or interest, or where reasonable doubt exists as to timely collection, are generally considered nonperforming and placed on nonaccrual. Interest receivable is reversed against interest income when loans are placed on nonaccrual status. Interest collected is recognized on a cash basis by crediting income when received; or if ultimate collectability of loan and preferred equity principal is uncertain, interest collected is recognized using a cost recovery method by applying interest collected as a reduction to loan and preferred equity carrying value. Loans and preferred equity investments may be restored to accrual status when all principal and interest are current and full repayment of the remaining contractual principal and interest are reasonably assured.
Impairment and Allowance for Loan Losses-
On a periodic basis, we analyze the extent and effect of any credit migration from underwriting and the initial investment review associated with the performance of a loan and preferred equity investment and/or value of its underlying collateral, financial and operating capability of the borrower or sponsor, as well as amount and status of any senior loan, where applicable. Specifically, operating results of collateral properties and any cash reserves are analyzed and
69
used to assess whether cash from operations are sufficient to cover debt service requirements currently and into the future, ability of the borrower to refinance the loan or preferred equity investment, liquidation value of collateral properties, and financial wherewithal of any loan guarantors, as well as the borrower’s competency in managing and operating the collateral properties. Such analysis is performed at least quarterly, or more often as needed when impairment indicators are present. During the year of 2018, we recorded a
$113.9 million
provision for loan loss. See Note 4, “Loans and Preferred Equity Held for Investment, net” to Part IV, Item 15, “Exhibits and Financial Statement Schedules” for further detail.
Loans and preferred equity investments are considered to be impaired when it is probable that we will not be able to collect all amounts due in accordance with contractual terms of the loans and preferred equity investments, including consideration of underlying collateral value. Allowance for loan losses represents the estimated probable credit losses inherent in loans and preferred equity held for investment at balance sheet date. Changes in allowance for loan and preferred equity losses are recorded in the provision for loan losses on the statement of operations. Allowance for loan losses generally exclude interest receivable as accrued interest receivable is reversed when a loan or preferred equity investment is placed on nonaccrual status. Allowance for loan losses is generally measured as the difference between the carrying value of the loan or preferred equity investment and either the present value of cash flows expected to be collected, discounted at the original effective interest rate of the loan or preferred equity investment or an observable market price for the loan or preferred equity investment. Subsequent changes in impairment are recorded as adjustments to the provision for loan losses. Loans and preferred equity investments are charged off against allowance for loan losses when all or a portion of the principal amount is determined to be uncollectible. A loan or preferred equity investment is considered to be collateral-dependent when repayment of the loan or preferred equity investment is expected to be provided solely by the underlying collateral. Impaired collateral-dependent loans and preferred equity investments are written down to the fair value of the collateral less disposal cost, first through a charge-off against allowance for loan losses, if any, then recorded as impairment loss.
Troubled Debt Restructuring-
A loan with contractual terms modified in a manner that grants concession to the borrower who is experiencing financial difficulty is classified as a TDR. Concessions could include term extensions, payment deferrals, interest rate reductions, principal forgiveness, forbearance, or other actions designed to maximize our collection on the loan. As a TDR is generally considered to be an impaired loan, it is measured for impairment based on our allowance for loan losses methodology.
Loans Held for Sale
Loans that we intend to sell or liquidate in the foreseeable future are classified as held for sale. Loans held for sale are carried at the lower of amortized cost or fair value less disposal cost, with valuation changes recognized as impairment loss. Loans held for sale are not subject to allowance for loan losses. Net deferred loan origination fees and loan purchase premiums or discounts are deferred and capitalized as part of the carrying value of the held for sale loan until the loan is sold and are therefore included in the periodic valuation adjustments based on lower of cost or fair value less disposal cost.
ADC Arrangements
We provide loans to third party developers for the acquisition, development and construction of real estate. Under an ADC arrangement, we participate in the expected residual profits of the project through the sale, refinancing or other use of the property. We evaluate the characteristics of each ADC arrangement, including its risks and rewards, to determine whether they are more similar to those associated with a loan or an investment in real estate. ADC arrangements with characteristics implying loan classification are presented as loans held for investment and result in the recognition of interest income. ADC arrangements with characteristics implying real estate joint ventures are presented as investments in unconsolidated joint ventures and are accounted for using the equity method. The classification of each ADC arrangement as either loan receivable or real estate joint venture involves significant judgment and relies on various factors, including market conditions, amount and timing of expected residual profits, credit enhancements in the form of guaranties, estimated fair value of the collateral, and significance of borrower equity in the project, among others. The classification of ADC arrangements is performed at inception, and periodically reassessed when significant changes occur in the circumstances or conditions described above.
70
Operating real estate
Real estate acquisitions-
Real estate acquired in acquisitions that are deemed to be business combinations is recorded at the fair values of the acquired components at the time of acquisition, allocated among land, buildings, improvements, equipment and lease-related tangible and identifiable intangible assets and liabilities, including foregone leasing costs, in-place lease values and above-or below-market lease values. Real estate acquired in acquisitions that are deemed to be asset acquisitions is recorded at the total value of consideration transferred, including transaction costs, allocated to the acquired components based upon relative fair value. The estimated fair value of acquired land is derived from recent comparable sales of land and listings within the same local region based on available market data. The estimated fair value of acquired buildings and building improvements is derived from comparable sales, discounted cash flow analysis using market-based assumptions, or replacement cost, as appropriate. The fair value of site and tenant improvements is estimated based upon current market replacement costs and other relevant market rate information
Real Estate Held for Investment
Real estate held for investment is carried at cost less accumulated depreciation.
Costs Capitalized or Expensed-
Expenditures for ordinary repairs and maintenance are expensed as incurred, while expenditures for significant renovations that improve or extend the useful life of the asset are capitalized and depreciated over their estimated useful lives.
Depreciation-
Real estate held for investment, other than land, are depreciated on a straight-line basis over the estimated useful lives of the assets, as follows:
|
Real Estate Assets
|
Term
|
|
|
Building (fee interest)
|
19 to 48 years
|
|
|
Building leasehold interests
|
Lesser of remaining term of the lease or remaining life of the building
|
|
|
Building improvements
|
Lesser of the useful life or remaining life of the building
|
|
|
Land improvements
|
6 to 15 years
|
|
|
Tenant improvements
|
Lesser of the useful life or remaining term of the lease
|
|
|
Furniture, fixtures and equipment
|
2 to 8 years
|
|
Real Estate Held for Investment
Impairment-
We evaluate our real estate held for investment for impairment periodically or whenever events or changes in circumstances indicate that the carrying amounts may not be recoverable. We evaluate real estate for impairment generally on an individual property basis. If an impairment indicator exists, we evaluate the undiscounted future net cash flows that are expected to be generated by the property, including any estimated proceeds from the eventual disposition of the property. If multiple outcomes are under consideration, we may apply a probability-weighted approach to the impairment analysis. Based upon the analysis, if the carrying value of a property exceeds its undiscounted future net cash flows, an impairment loss is recognized for the excess of the carrying value of the property over the estimated fair value of the property. In evaluating and/or measuring impairment, we consider, among other things, current and estimated future cash flows associated with each property, market information for each sub-market, including, where applicable, competition levels, foreclosure levels, leasing trends, occupancy trends, lease or room rates, and the market prices of similar properties recently sold or currently being offered for sale, and other quantitative and qualitative factors. Another key consideration in this assessment is our assumption about the highest and best use of our real estate investments and our intent and ability to hold them for a reasonable period that would allow for the recovery of their carrying values. If such assumptions change and we shorten its expected hold period, this may result in the recognition of impairment losses. During the year ended
December 31, 2018
, we recorded a
$31.8 million
impairment loss on our operating real estate portfolio. See Note 7, “Real Estate, net” and Note 15, “Fair Value,” to Part IV, Item 15, “Exhibits and Financial Statement Schedules” for further detail.
Real estate held for sale
Classification as held for sale-
Real estate is classified as held for sale in the period when (i) management approves a plan to sell the asset, (ii) the asset is available for immediate sale in its present condition, subject only to usual and customary terms, (iii) a program is initiated to locate a buyer and actively market the asset for sale at a reasonable price, and (iv) completion of the sale is probable within one year. Real estate held for sale is stated at the lower of its carrying amount or estimated fair value less disposal cost, with any write-down to fair value less disposal cost recorded as an impairment loss. For any increase in fair value less disposal cost subsequent to classification as held for sale, the impairment loss may be reversed, but only up to the amount of cumulative loss previously recognized. Depreciation is not recorded on assets classified as held for sale.
71
If circumstances arise that were previously considered unlikely and, as a result, we decide not to sell the real estate asset previously classified as held for sale, the real estate asset is reclassified as held for investment. Upon reclassification, the real estate asset is measured at the lower of (i) its carrying amount prior to classification as held for sale, adjusted for depreciation expense that would have been recognized had the real estate been continuously classified as held for investment, and (ii) its estimated fair value at the time we decide not to sell.
Real estate sales-
We evaluate if real estate sale transactions qualify for recognition under the full accrual method, considering whether, among other criteria, the buyer’s initial and continuing investments are adequate to demonstrate a commitment to pay, any receivable due to us is not subject to future subordination, we have transferred to the buyer the usual risks and rewards of ownership and we do not have a substantial continuing involvement with the sold real estate. At the time the sale is consummated, a gain or loss is recognized as the difference between the sale price less disposal cost and the carrying value of the real estate.
Foreclosed properties
We receive foreclosed properties in full or partial settlement of loans receivable by taking legal title or physical possession of the properties. Foreclosed properties are recognized, generally, at the time the real estate is received at foreclosure sale or upon execution of a deed in lieu of foreclosure. Foreclosed properties are initially measured at fair value. Deficiencies compared to the carrying value of the loan, after reversing any previously recognized loss provision on the loan, are recorded as impairment loss. We periodically evaluate foreclosed properties for subsequent decrease in fair value, which is recorded as additional impairment loss. Fair value of foreclosed properties is generally based on third party appraisals, broker price opinions, comparable sales or a combination thereof.
Real Estate Securities
We classify our CRE securities investments as available for sale on the acquisition date, which are carried at fair value. Unrealized gains (losses) are recorded as a component of accumulated OCI in the consolidated statements of equity. However, we have elected the fair value option for the assets and liabilities of our investments in securitization financing entities (“Investing VIEs”), and as a result, any unrealized gains (losses) on the consolidated Investing VIEs are recorded in unrealized gain (loss) on mortgage loans and obligations held in securitization trusts, net in the consolidated statements of operations. As of December 31, 2018, we held subordinate tranches of three securitization trusts, which represent our retained interest in the securitization trusts, which we consolidate under U.S. GAAP. Refer to Note 6, “Real Estate Securities, Available for Sale” to Part IV, Item 15, “Exhibits and Financial Statement Schedules” for further detail.
Interest Income-
Interest income is recognized using the effective interest method with any premium or discount amortized or accreted through earnings based on expected cash flow through the expected maturity date of the security. Changes to expected cash flow may result in a change to the yield which is then applied retrospectively for high-credit quality securities that cannot be prepaid or otherwise settled in such a way that the holder would not recover substantially all of the investment or prospectively for all other securities to recognize interest income.
Impairment-
CRE securities for which the fair value option is elected are not evaluated for other-than-temporary impairment (“OTTI”) as any change in fair value is recorded in the consolidated statements of operations. Realized losses on such securities are reclassified to realized loss on mortgage loans and obligations held in securitization trust, net as losses occur.
CRE securities for which the fair value option is not elected are evaluated for OTTI quarterly. Impairment of a security is considered to be other-than-temporary when: (i) the holder has the intent to sell the impaired security; (ii) it is more likely than not the holder will be required to sell the security; or (iii) the holder does not expect to recover the entire amortized cost of the security. When a CRE security has been deemed to be other-than-temporarily impaired due to (i) or (ii), the security is written down to its fair value and an OTTI is recognized in the consolidated statements of operations. In the case of (iii), the security is written down to its fair value and the amount of OTTI is then bifurcated into: (a) the amount related to expected credit losses; and (b) the amount related to fair value adjustments in excess of expected credit losses. The portion of OTTI related to expected credit losses is recognized in the consolidated statements of operations. The remaining OTTI related to the valuation adjustment is recognized as a component of accumulated OCI in the consolidated statements of equity. CRE securities which are not high-credit quality are considered to have an OTTI if the security has an unrealized loss and there has been an adverse change in expected cash flow. The amount of OTTI is then bifurcated as discussed above. As of December 31, 2018, we did not have any OTTI recorded on our CRE securities.
Investments in Unconsolidated Ventures
A noncontrolling, unconsolidated ownership interest in an entity may be accounted for using one of (i) equity method where applicable; (ii) fair value option if elected; (iii) fair value through earnings if fair value is readily determinable, including election of NAV practical expedient where applicable; or (iv) for equity investments without readily determinable fair values, the measurement alternative to measure at cost adjusted for any impairment and observable price changes, as applicable.
72
Fair value changes of equity method investments under the fair value option are recorded in earnings from investments in unconsolidated ventures. Fair value changes of other equity investments, including adjustments for observable price changes under the measurement alternative, are recorded in other gain (loss).
Equity Method Investments
We account for investments under the equity method of accounting if they have the ability to exercise significant influence over the operating and financial policies of an entity, but do not have a controlling financial interest. The equity method investment is initially recorded at cost and adjusted each period for capital contributions, distributions and our share of the entity’s net income or loss as well as other comprehensive income or loss. Our share of net income or loss may differ from the stated ownership percentage interest in an entity if the governing documents prescribe a substantive non-proportionate earnings allocation formula or a preferred return to certain investors. For certain equity method investments, we record our proportionate share of income on a one to three month lag. Distributions of operating profits from equity method investments are reported as operating activities, while distributions in excess of operating profits while distributions in excess of operating profits are reported as investing activities in the statement of cash flows under the cumulative earnings approach.
At
December 31, 2018
, our investments in unconsolidated joint ventures consisted of investments in PE Investments, senior loans, mezzanine loans and preferred equity held in joint ventures, as well as ADC loan arrangements accounted for as equity method investments. At
December 31, 2017
, our investments in unconsolidated ventures consisted of investments in PE Investments and ADC loan arrangements accounted for as equity method investments.
Impairment
Evaluation of impairment applies to equity method investments and equity investments under the measurement alternative. If indicators of impairment exist, we will first estimate the fair value of its investment. In assessing fair value, we generally consider, among others, the estimated enterprise value of the investee or fair value of the investee's underlying net assets, including net cash flows to be generated by the investee as applicable.
For investments under the measurement alternative, if carrying value of the investment exceeds its fair value, an impairment is deemed to have occurred.
For equity method investments, further consideration is made if a decrease in value of the investment is other-than-temporary to determine if impairment loss should be recognized. Assessment of other-than-temporary impairment ("OTTI") involves management judgment, including, but not limited to, consideration of the investee’s financial condition, operating results, business prospects and creditworthiness, our ability and intent to hold the investment until recovery of its carrying value, or a significant and prolonged decline in traded price of the investee’s equity security. If management is unable to reasonably assert that an impairment is temporary or believes that we may not fully recover the carrying value of its investment, then the impairment is considered to be other-than-temporary.
Investments that are other-than-temporarily impaired are written down to their estimated fair value. Impairment loss is recorded in earnings from investments in unconsolidated ventures for equity method investments and in other gain (loss) for investments under the measurement alternative.
Transfers of Financial Assets
Sale accounting for transfers of financial assets is limited to the transfer of an entire financial asset, a group of financial assets in their entirety, or a component of a financial asset that meets the definition of a participating interest by having characteristics that are similar to the original financial asset.
Transfers of financial assets are accounted for as sales when control over the assets has been surrendered. If we have any continuing involvement, rights or obligations with the transferred financial asset (outside of standard representations and warranties), sale accounting would require that the transfer meets the following conditions: (1) the transferred asset has been legally isolated; (2) the transferee has the right (free of conditions that constrain it from taking advantage of that right) to pledge or exchange the transferred asset; and (3) we do not maintain effective control over the transferred asset through an agreement that provides for (a) both an entitlement and an obligation by us to repurchase or redeem the asset before its maturity, (b) our unilateral ability to reclaim the asset and a more than trivial benefit attributable to that ability, or (c) the transferee requiring us to repurchase the asset at a price so favorable to the transferee that it is probable the repurchase will occur.
If the criteria for sale accounting are met, the transferred financial asset is removed from the balance sheet and a net gain or loss is recognized upon sale, taking into account any retained interests. Transfers of financial assets that do not meet the criteria for sale are accounted for as financing transactions.
73
Recent Accounting Updates
Recent accounting updates are included in Note 2, “Summary of Significant Accounting Policies” to Part IV, Item 15, “Exhibits and Financial Statement Schedules” in this Annual Report Form 10-K.
Item 7A. Quantitative and Qualitative Disclosures About Market Risk
Our primary market risks are interest rate risk, prepayment risk, extension risk, credit risk, real estate market risk, capital market risk and foreign currency risk, either directly through the assets held or indirectly through investments in unconsolidated ventures.
Interest Rate Risk
Interest rate risk relates to the risk that the future cash flow of a financial instrument will fluctuate because of changes in market interest rates. Interest rate risk is highly sensitive to many factors, including governmental, monetary and tax policies, domestic and international economic and political considerations and other factors beyond our control. Credit curve spread risk is highly sensitive to the dynamics of the markets for loans and securities we hold. Excessive supply of these assets combined with reduced demand will cause the market to require a higher yield. This demand for higher yield will cause the market to use a higher spread over the U.S. Treasury securities yield curve, or other benchmark interest rates, to value these assets.
As U.S. Treasury securities are priced to a higher yield and/or the spread to U.S. Treasuries used to price the assets increases, the price at which we could sell some of our fixed rate financial assets may decline. Conversely, as U.S. Treasury securities are priced to a lower yield and/or the spread to U.S. Treasuries used to price the assets decreases, the value of our fixed rate financial assets may increase. Fluctuations in LIBOR may affect the amount of interest income we earn on our floating rate borrowings and interest expense we incur on borrowings indexed to LIBOR, including under credit facilities and investment-level financing.
We utilize a variety of financial instruments on some of our investments, including interest rate swaps, caps, floors and other interest rate exchange contracts, in order to limit the effects of fluctuations in interest rates on their operations. The use of these types of derivatives to hedge interest-earning assets and/or interest-bearing liabilities carries certain risks, including the risk that losses on a hedge position will reduce the funds available for distribution and that such losses may exceed the amount invested in such instruments. A hedge may not perform its intended purpose of offsetting losses of rising interest rates. Moreover, with respect to certain of the instruments used as hedges, there is exposure to the risk that the counterparties may cease making markets and quoting prices in such instruments, which may inhibit the ability to enter into an offsetting transaction with respect to an open position. Our profitability may be adversely affected during any period as a result of changing interest rates.
As of
December 31, 2018
, a hypothetical 100 basis point increase in the applicable interest rate benchmark on our loan portfolio would increase interest income by
$7.1 million
annually, net of interest expense.
Prepayment risk
Prepayment risk is the risk that principal will be repaid at a different rate than anticipated, resulting in a less than expected return on an investment. As prepayments of principal are received, any premiums paid on such assets are amortized against interest income, while any discounts on such assets are accreted into interest income. Therefore, an increase in prepayment rates has the following impact: (i) accelerates amortization of purchase premiums, which reduces interest income earned on the assets; and conversely, (ii) accelerates accretion of purchase discounts, which increases interest income earned on the assets.
Extension risk
The weighted average life of assets is projected based on assumptions regarding the rate at which borrowers will prepay or extend their mortgages. If prepayment rates decrease or extension options are exercised by borrowers at a rate that deviates significantly from projections, the life of fixed rate assets could extend beyond the term of the secured debt agreements. This in turn could negatively impact liquidity to the extent that assets may have to be sold and losses may be incurred as a result.
Credit risk
Investment in loans held for investment is subject to a high degree of credit risk through exposure to loss from loan defaults. Default rates are subject to a wide variety of factors, including, but not limited to, borrower financial condition, property performance, property management, supply/demand factors, construction trends, consumer behavior, regional economics, interest rates, the strength of the U.S. economy and other factors beyond our control. All loans are subject to a certain probability of default. We manage credit risk through the underwriting process, acquiring investments at the appropriate discount to face value, if any, and establishing loss assumptions. Performance of the loans is carefully monitored, including those held through joint venture investments, as well as external factors that may affect their value.
We are also subject to the credit risk of the tenants in our properties. We seek to undertake a rigorous credit evaluation of the tenants prior to acquiring properties. This analysis includes an extensive due diligence investigation of the tenants’ businesses, as
74
well as an assessment of the strategic importance of the underlying real estate to the respective tenants’ core business operations. Where appropriate, we may seek to augment the tenants’ commitment to the properties by structuring various credit enhancement mechanisms into the underlying leases. These mechanisms could include security deposit requirements or guarantees from entities that are deemed credit worthy.
Real estate market risk
We are exposed to the risks generally associated with the commercial real estate market. The market values of commercial real estate are subject to volatility and may be affected adversely by a number of factors, including, but not limited to, national, regional and local economic conditions, as well as changes or weakness in specific industry segments, and other macroeconomic factors beyond our control, which could affect occupancy rates, capitalization rates and absorption rates. This in turn could impact the performance of tenants and borrowers. We seek to manage these risks through their underwriting due diligence and asset management processes.
Capital markets risk
We are exposed to risks related to the debt capital markets, specifically the ability to finance our business through borrowings under secured revolving repurchase facilities, secured and unsecured warehouse facilities or other debt instruments. We seek to mitigate these risks by monitoring the debt capital markets to inform their decisions on the amount, timing and terms of their borrowings.
Foreign Currency Risk
We have foreign currency rate exposures related to our foreign currency-denominated investments held by our foreign subsidiaries. Changes in foreign currency rates can adversely affect the fair values and earning of our non-U.S. holdings. We generally mitigate this foreign currency risk by utilizing currency instruments to hedge our net investments in our foreign subsidiaries. The type of hedging instruments that we employ on our foreign subsidiary investments are forwards.
At
December 31, 2018
, we had approximately NOK
906.6 million
and
€202.4 million
or a total of
$336.1 million
, in net investments in our European subsidiaries. A
1.0%
change in these foreign currency rates would result in a
$3.4 million
increase or decrease in translation gain or loss included in other comprehensive income in connection with our European subsidiaries.
A summary of the foreign exchange contracts in place at
December 31, 2018
, including notional amount and key terms, is included in Note 16, “Derivatives,” to Part IV, Item 15, “Exhibits and Financial Statement Schedules.” The maturity dates of these instruments approximate the projected dates of related cash flows for specific investments. Termination or maturity of currency hedging instruments may result in an obligation for payment to or from the counterparty to the hedging agreement. We are exposed to credit loss in the event of non-performance by counterparties for these contracts. To manage this risk, we select major international banks and financial institutions as counterparties and perform a quarterly review of the financial health and stability of our trading counterparties. Based on our review at
December 31, 2018
, we do not expect any counterparty to default on its obligations.
75
Item 8. Financial Statements
The financial statements and the supplementary financial data required by this item appear in Item 6 and Item 15 of this Annual Report.
Item 9. Changes in and Disagreements with Accountants on Accounting and Financial Disclosures
None.
Item 9A. Controls and Procedures
Evaluation of Disclosure Controls and Procedures
We maintain disclosure controls and procedures, as defined in Rules 13a-15(e) and 15d-15(e) under the Exchange Act, that are designed to ensure that information required to be disclosed in our Exchange Act reports is recorded, processed, summarized and reported within the time periods specified in the SEC’s rules and forms, and that such information is accumulated and communicated to our management, including our Chief Executive Officer and Chief Financial Officer, as appropriate, to allow timely decisions regarding required disclosure.
As required by Rule 13a-15(b) under the Exchange Act, our management carried out an evaluation, under the supervision and with the participation of our Chief Executive Officer and Chief Financial Officer, of the effectiveness of our disclosure controls and procedures. Based on this evaluation, our Chief Executive Officer and Chief Financial Officer concluded that as of
December 31, 2018
, our disclosure controls and procedures were effective at providing reasonable assurance regarding the reliability of the information required to be disclosed by us in reports that we file under the Exchange Act is recorded, processed, summarized and reported within the time periods specified in SEC rules and forms.
Management Report or Attestation Report Regarding Internal Control
Management is responsible for establishing and maintaining adequate internal control over financial reporting (as defined in 13a-15(f) and 15d-15(f) of the Exchange Act). Our internal control over financial reporting includes policies and procedures that (1) pertain to the maintenance of records that, in reasonable detail, accurately and fairly reflect the transactions and dispositions of our assets; (2) provide reasonable assurance that transactions are recorded as necessary to permit preparation of financial statements in accordance with GAAP, and that receipts and expenditures are being made only in accordance with authorizations of our management and directors; and (3) provide reasonable assurance regarding prevention or timely detection of unauthorized acquisition, use, or disposition of assets that could have a material effect on our financial statements.
Under the supervision and with the participation of our management, we evaluated the effectiveness of our internal control over financial reporting using the criteria set forth in the
Internal Control—Integrated Framework
issued by the Committee of Sponsoring Organizations of the Treadway Commission (COSO) (2013 framework). Our management concluded that our internal control over financial reporting was effective as of
December 31, 2018
.
Our internal control system was designed to provide reasonable assurance to management and our board of directors regarding the preparation and fair presentation of published financial statements. All internal control systems, no matter how well designed, have inherent limitations. Therefore, even those systems determined to be effective can provide only reasonable assurance with respect to financial statement preparation and presentation.
Ernst & Young LLP, our independent registered accounting firm, has audited our financial statements included in this Annual Report and has issued an attestation report on the effectiveness of our internal control over financial reporting, which is included in this Form 10-K.
Changes in Internal Control over Financial Reporting
There have been no changes in our internal control over financial reporting (as defined in Rules 13a-15(f) and 15d-15(f) under the Exchange Act) during the most recent fiscal quarter that materially affected, or are reasonably likely to materially affect, our internal control over financial reporting.
76
REPORT OF INDEPENDENT REGISTERED PUBLIC ACCOUNTING FIRM
To the Shareholders and the Board of Directors of Colony Credit Real Estate, Inc.
Opinion on Internal Control over Financial Reporting
We have audited Colony Credit Real Estate, Inc.’s internal control over financial reporting as of December 31, 2018, based on criteria established in Internal Control-Integrated Framework issued by the Committee of Sponsoring Organizations of the Treadway Commission (2013 framework), (the COSO criteria). In our opinion, Colony Credit Real Estate, Inc. (the Company) maintained, in all material respects, effective internal control over financial reporting as of December 31, 2018, based on the COSO criteria.
We also have audited, in accordance with the standards of the Public Company Accounting Oversight Board (United States) (PCAOB), the consolidated balance sheets of Colony Credit Real Estate, Inc. as of December 31, 2018 and 2017, and the related consolidated statements of operations, comprehensive income (loss), equity and cash flows for each of the three years in the period ended December 31, 2018, and the related notes and schedules listed in the Index at Item 15 and our report dated
February 28, 2019
expressed an unqualified opinion thereon.
Basis for Opinion
The Company’s management is responsible for maintaining effective internal control over financial reporting and for its assessment of the effectiveness of internal control over financial reporting included in the accompanying Management’s Annual Report on Internal Control over Financial Reporting. Our responsibility is to express an opinion on the Company’s internal control over financial reporting based on our audit. We are a public accounting firm registered with the PCAOB and are required to be independent with respect to the Company in accordance with the U.S. federal securities laws and the applicable rules and regulations of the Securities and Exchange Commission and the PCAOB.
We conducted our audit in accordance with the standards of the PCAOB. Those standards require that we plan and perform the audit to obtain reasonable assurance about whether effective internal control over financial reporting was maintained in all material respects.
Our audit included obtaining an understanding of internal control over financial reporting, assessing the risk that a material weakness exists, testing and evaluating the design and operating effectiveness of internal control based on the assessed risk, and performing such other procedures as we considered necessary in the circumstances. We believe that our audit provides a reasonable basis for our opinion.
Definition and Limitations of Internal Control over Financial Reporting
A company’s internal control over financial reporting is a process designed to provide reasonable assurance regarding the reliability of financial reporting and the preparation of financial statements for external purposes in accordance with generally accepted accounting principles. A company’s internal control over financial reporting includes those policies and procedures that (1) pertain to the maintenance of records that, in reasonable detail, accurately and fairly reflect the transactions and dispositions of the assets of the company; (2) provide reasonable assurance that transactions are recorded as necessary to permit preparation of financial statements in accordance with generally accepted accounting principles, and that receipts and expenditures of the company are being made only in accordance with authorizations of management and directors of the company; and (3) provide reasonable assurance regarding prevention or timely detection of unauthorized acquisition, use, or disposition of the company’s assets that could have a material effect on the financial statements.
Because of its inherent limitations, internal control over financial reporting may not prevent or detect misstatements. Also, projections of any evaluation of effectiveness to future periods are subject to the risk that controls may become inadequate because of changes in conditions, or that the degree of compliance with the policies or procedures may deteriorate.
/s/ Ernst & Young LLP
New York, New York
February 28, 2019
77
Item 9B. Other Information
MATERIAL U.S. FEDERAL INCOME TAX CONSIDERATIONS
The following is a discussion of certain material U.S. federal income tax considerations relating to Colony Credit Real Estate, Inc.’s (“Colony Credit”) qualification and taxation as a REIT and the acquisition, holding, and disposition of our Class A common stock (for purposes of this section only “stock”). As used in this section, references to Colony Credit means only Colony Credit Real Estate, Inc. and not its subsidiaries or other lower-tier entities, except as otherwise indicated. This summary is based upon the Internal Revenue Code of 1986, as amended (the “Code), the regulations promulgated by the U.S. Treasury Department (“Treasury Regulations”), rulings and other administrative interpretations and practices of the Internal Revenue Service (the “IRS”) (including administrative interpretations and practices expressed in private letter rulings which are binding on the IRS only with respect to the particular taxpayers who requested and received those rulings), and judicial decisions, all as currently in effect, and all of which are subject to differing interpretations or to change, possibly with retroactive effect. No assurance can be given that the IRS would not assert, or that a court would not sustain, a position contrary to any of the tax consequences described below. Credit RE Operating Company, LLC (the “Operating Partnership”) has not sought and will not seek an advance ruling from the IRS regarding any matter discussed in this section. The summary is also based upon the assumption that Colony Credit has operated and will operate the Operating Partnership and its subsidiaries and affiliated entities in accordance with their applicable organizational documents and various statements made in that section as to Colony Credit’s intended method of operation. This summary is for general information only, and does not purport to discuss all aspects of U.S. federal income taxation that may be important to a particular investor in light of its investment or tax circumstances, or to investors subject to special tax rules, including:
|
•
|
insurance companies;
|
|
•
|
tax-exempt organizations (except to the extent discussed in “Considerations Relating to Colony Credit’s Class A Common Stock-Taxation of Holders of Class A Common Stock-Taxation of Tax-Exempt Holders” below);
|
|
•
|
financial institutions or broker-dealers;
|
|
•
|
non-U.S. individuals and non-U.S. corporations (except to the extent discussed in “Considerations Relating to Colony Credit’s Class A Common Stock-Taxation of Holders of Class A Common Stock-Taxation of Non-U.S. Holders” below);
|
|
•
|
U.S. expatriates;
|
|
•
|
persons who mark-to-market our stock;
|
|
•
|
subchapter S corporations;
|
|
•
|
U.S. holders, as defined below, whose functional currency is not the U.S. dollar;
|
|
•
|
regulated investment companies;
|
|
•
|
REITs;
|
|
•
|
trusts and estates;
|
|
•
|
holders who receive our stock through the exercise of employee stock options or otherwise as compensation;
|
|
•
|
persons holding our stock as part of a “straddle,” “hedge,” “conversion transaction,” “synthetic security” or other integrated investment;
|
|
•
|
persons subject to the alternative minimum tax provisions of the Code;
|
|
•
|
persons holding our stock through a partnership or similar pass-through entity or arrangement; and
|
|
•
|
persons holding a 10% or more (by vote or value) beneficial interest in our stock.
|
This summary assumes that holders hold shares of our stock as capital assets for U.S. federal income tax purposes, which generally means property held for investment.
The statements in this section are based on the current U.S. federal income tax laws, are for general information purposes only and are not tax advice. Colony Credit cannot assure you that new laws, interpretations of law or court decisions, any of which may take effect retroactively, will not cause any statement in this section to be inaccurate.
78
THE U.S. FEDERAL INCOME TAX TREATMENT OF COLONY CREDIT AS A REIT AND OF YOU AS A HOLDER OF OUR STOCK DEPENDS IN SOME INSTANCES ON DETERMINATIONS OF FACT AND INTERPRETATIONS OF COMPLEX PROVISIONS OF U.S. FEDERAL INCOME TAX LAW FOR WHICH NO CLEAR PRECEDENT OR AUTHORITY MAY BE AVAILABLE. IN ADDITION, THE TAX CONSEQUENCES TO ANY PARTICULAR HOLDER OF OUR STOCK WILL DEPEND ON SUCH HOLDER’S PARTICULAR TAX CIRCUMSTANCES.
YOU SHOULD CONSULT YOUR TAX ADVISOR REGARDING THE SPECIFIC TAX CONSEQUENCES TO YOU OF THE OWNERSHIP AND SALE OF OUR STOCK AND OF ITS INTENDED ELECTION TO BE TAXED AS A REIT. SPECIFICALLY, YOU SHOULD CONSULT YOUR TAX ADVISOR REGARDING THE FEDERAL, STATE, LOCAL, NON-U.S. AND OTHER TAX CONSEQUENCES OF SUCH OWNERSHIP, SALE AND ELECTION, AND REGARDING POTENTIAL CHANGES IN APPLICABLE TAX LAWS.
U.S. Holders and Non-U.S. Holders
For purposes of this discussion, a ‘‘U.S. holder’’ is a beneficial holder of stock who is:
|
•
|
a citizen or resident of the United States;
|
|
•
|
a corporation (including an entity treated as a corporation for U.S. federal income tax purposes) created or organized in or under the laws of the U.S. or a political subdivision thereof or the District of Columbia;
|
|
•
|
an estate whose income is subject to U.S. federal income taxation regardless of its source; or
|
|
•
|
a trust if (1) a U.S. court is able to exercise primary supervision over the administration of such trust and one or more U.S. persons have the authority to control all substantial decisions of the trust, or (2) it has a valid election in place to be treated as a U.S. person.
|
For purposes of this discussion, a ‘‘non-U.S. holder’’ is a beneficial holder of stock who is neither a partnership (including an entity treated as a partnership for U.S. federal income tax purposes) nor a U.S. holder.
If an entity or arrangement treated as a partnership for U.S. federal income tax purposes holds stock, the U.S. federal income tax treatment of a partner generally will depend upon the status of the partner as a U.S. holder or non-U.S. holder and the activities of the partnership. A partner of a partnership holding stock should consult its own tax advisor regarding the U.S. federal income tax consequences to the partner of the acquisition, ownership and disposition of stock by the partnership.
CONSIDERATIONS RELATING TO COLONY CREDIT’S CLASS A COMMON STOCK
Taxation of Colony Credit Real Estate, Inc.
Colony Credit intends to elect to be taxed as a REIT under the U.S. federal income tax laws commencing with its taxable year ended
December 31, 2018
. Colony Credit believes that it is organized and has operated, and it intends to continue to operate, in a manner so as to qualify for taxation as a REIT under the Code. This section discusses the laws governing the U.S. federal income tax treatment of a REIT and its holders. These laws are highly technical and complex.
Qualification and taxation as a REIT depends on our ability to meet on a continuing basis, through actual operating results, distribution levels, and diversity of ownership by holders of our securities and asset ownership, and various other qualification requirements imposed upon REITs by the Code. In addition, Colony Credit’s ability to qualify as a REIT may depend in part upon the operating results, organizational structure and entity classification for U.S. federal income tax purposes of certain entities or arrangements in which it invests. Colony Credit’s ability to qualify as a REIT also requires that it satisfy certain asset tests, some of which depend upon the fair market values of assets that it owns directly or indirectly. Such values may not be susceptible to a precise determination, whether for past, current, or future periods, and based upon the types of assets that Colony Credit owns and intends to own, such values can vary rapidly, significantly and unpredictably. Accordingly, no assurance can be given that the actual results of our operations for any taxable year will satisfy such requirements for qualification and taxation as a REIT. Similarly, the income Colony Credit earns from its assets may not be earned when or in the proportions anticipated. For example, Colony Credit may encounter situations in which a relatively small investment generates a higher than expected return in a particular year (or vice versa). A discussion of the tax consequences of the failure to qualify as a REIT and certain alternatives is included below in the section entitled “-Failure to Qualify.”
As indicated above, Colony Credit’s qualification and taxation as a REIT depends upon our ability to meet, on a continuing basis, various qualification requirements imposed upon REITs by the Code. The material qualification requirements are summarized below under “-Requirements for Qualification.” While Colony Credit intends to operate so that it qualifies as a REIT, no assurance can be given that the IRS will not challenge its qualification, or that is has been or will be able to operate in accordance with the REIT requirements in the future. See “-Requirements for Qualification-Failure to Qualify.”
79
New Tax Reform Legislation Enacted December 22, 2017
On December 22, 2017, the President signed into law H.R. 1, which generally took effect for taxable years beginning on or after January 1, 2018. This legislation made many changes to the U.S. federal income tax laws that significantly impact the taxation of individuals, corporations (both non-REIT C corporations as well as corporations that have elected to be taxed as REITs), and the taxation of taxpayers with overseas assets and operations. These changes are generally effective for taxable years beginning after
December 31, 2017
. However, a number of changes that reduced the tax rates applicable to non-corporate taxpayers (including a new 20% deduction for qualified REIT dividends that reduces the effective rate of regular income tax on such income), and also limit the ability of such taxpayers to claim certain deductions, will expire for taxable years beginning after 2025, unless Congress acts to extend them.
These changes impact Colony Credit and our holders in various ways, some of which are adverse relative to prior law, and this summary of material U.S. federal income tax considerations incorporates these changes where material. To date, the IRS has issued only limited guidance with respect to certain provisions of the new law. There are numerous interpretive issues and ambiguities that still require guidance and that are not clearly addressed in the legislative history that accompanied H.R. 1 and additional technical corrections legislation is still needed to clarify certain of the new provisions and give proper effect to Congressional intent. There can be no assurance, however, that technical clarifications or other legislative changes that may be needed to prevent unintended or unforeseen tax consequences will be enacted by Congress anytime soon.
Taxation of REITs in General
Provided that Colony Credit qualifies as a REIT, it will be entitled at the REIT level to a deduction from its taxable income for dividends that it pays and, therefore, will not be subject to U.S. federal corporate income tax at the REIT level on our taxable income that is currently distributed to holders of our securities. This treatment substantially eliminates the “double taxation” at the corporate and holder levels that generally results from an investment in a non-REIT C corporation. A non-REIT C corporation is a corporation that generally is required to pay tax at the corporate level. Double taxation means taxation once at the corporate level when income is earned and once again at the holder level when the income is distributed. In general, the income that it generates is taxed only at the holder level upon a distribution of dividends to our holders.
U.S. holders generally will be subject to taxation on dividends distributed by Colony Credit (other than designated capital gain dividends and “qualified dividend income”) at rates applicable to ordinary income, instead of at lower capital gain rates. For taxable years beginning after
December 31, 2017
, and before January 1, 2026, generally, U.S. holders that are individuals, trusts or estates may deduct 20% of the aggregate amount of ordinary dividends distributed by Colony Credit, subject to certain limitations. Capital gain dividends and qualified dividend income will continue to be subject to a maximum 20% rate. See “-Taxation of Holders of Class A Common Stock--Taxation of Taxable U.S. Holders-Taxation of U.S. Holders on Distributions of Our Stock.”
Any net operating losses, foreign tax credits and other tax attributes of a REIT generally do not pass through to holders, subject to special rules for certain items such as the capital gains that Colony Credit recognizes. See “-Taxation of Holders of Class A Common Stock--Taxation of Taxable U.S. Holders.”
Even if Colony Credit qualifies for taxation as a REIT, Colony Credit will be subject to U.S. federal tax in the following circumstances:
|
•
|
Colony Credit will pay U.S. federal income tax on any taxable income, including net capital gain, that it does not distribute to holders during, or within a specified time period after, the calendar year in which the income is earned.
|
|
•
|
Colony Credit will pay income tax at the highest corporate rate on:
|
|
•
|
net income from the sale or other disposition of property acquired through foreclosure, or foreclosure property, that it holds primarily for sale to customers in the ordinary course of business; and
|
|
•
|
other non-qualifying income from foreclosure property.
|
|
•
|
Colony Credit will pay a 100% tax on net income earned from sales or other dispositions of property, other than foreclosure property, by an entity other than a taxable REIT subsidiary, or a TRS, if such property is held primarily for sale to customers in the ordinary course of business.
|
|
•
|
if Colony Credit fails to satisfy one or both of the 75% gross income test or the 95% gross income test, as described below in the section entitled “-Requirements for Qualification-Gross Income Tests,” and nonetheless continues to qualify as a REIT because it meets other requirements, it will pay a 100% tax on: the greater of the amount by which it fails the 75% gross income test or the 95% gross income test, multiplied, in either case, by
|
|
•
|
a fraction intended to reflect its profitability.
|
80
|
•
|
if Colony Credit fails any of the asset tests (other than a de minimis failure of the 5% asset test or the 10% vote or value test, as described below in the section entitled “-Requirements for Qualification-Asset Tests”), as long as the failure was due to reasonable cause and not to willful neglect, Colony Credit files a description of each asset that caused such failure with the IRS, and Colony Credit disposes of the assets or otherwise complies with the asset tests within six months after the last day of the quarter in which it identifies such failure, it will pay a tax equal to the greater of $50,000 or the highest U.S. federal income tax rate then applicable to U.S. corporations (currently 21%) on the net income from the non-qualifying assets during the period in which it failed to satisfy the asset tests in order to remain qualified as a REIT.
|
|
•
|
if Colony Credit fails to satisfy one or more requirements for REIT qualification, other than the gross income tests and the asset tests, and such failure is due to reasonable cause and not to willful neglect, it will be required to pay a penalty of $50,000 for each such failure in order to remain qualified as a REIT.
|
|
•
|
if Colony Credit fails to distribute during a calendar year at least the sum of: (i) 85% of its REIT ordinary income for the year; (ii) 95% of its REIT capital gain net income for the year; and (iii) any undistributed taxable income required to be distributed from earlier periods, Colony Credit will pay a 4% nondeductible excise tax on the excess of the required distribution over the amount it actually distributed, plus any retained amounts on which income tax has been paid at the corporate level.
|
|
•
|
Colony Credit may elect to retain and pay income tax on its net long-term capital gain. In that case, to the extent that Colony Credit made a timely designation of such gain, a U.S. holder would be taxed on its proportionate share of Colony Credit’s undistributed long-term capital gain and would receive a credit or refund for its proportionate share of the tax Colony Credit paid.
|
|
•
|
Colony Credit will be subject to a 100% excise tax on transactions with a TRS that are not conducted on an arm’s-length basis.
|
|
•
|
if Colony Credit acquires any asset from a non-REIT C corporation in a merger or other transaction in which Colony Credit acquires a basis in the asset that is determined by reference either to the non-REIT C corporation’s basis in the asset or to another asset, Colony Credit will pay tax at the highest regular corporate rate applicable if it recognizes gain on the sale or disposition of the asset during the five-year period after it acquires the asset, provided no election is made for the transaction to be taxable on a current basis. This tax will generally apply to gain recognized with respect to assets that Colony Credit holds as of the effective date of its REIT election if such gain is recognized during the five-year period following such effective date or it may apply if Colony Credit were to engage in (or, potentially, become a successor to an entity that had engaged in) a tax-free spin-off transaction under Section 355 of the Code within 5 years of such effective date. The amount of gain on which Colony Credit would pay tax in the foregoing circumstances is the lesser of:
|
|
•
|
the amount of gain that Colony Credit recognizes at the time of the sale or disposition (or would have recognized if, at the time of a spin-off transaction described above, Colony Credit had disposed of the applicable asset); and
|
|
•
|
the amount of gain that Colony Credit would have recognized if it had sold the asset at the time Colony Credit acquired it, assuming that the non-REIT C corporation will not elect in lieu of this treatment an immediate tax when the asset is acquired.
|
|
•
|
Colony Credit may be required to pay monetary penalties to the IRS in certain circumstances, including if it fails to meet recordkeeping requirements intended to monitor its compliance with rules relating to the composition of a REIT’s holders, as described below in the section entitled “-Requirements for Qualification-Recordkeeping Requirements.”
|
|
•
|
the earnings of Colony Credit’s lower-tier entities that are subchapter C corporations, excluding any qualified REIT subsidiaries, or QRSs, but including domestic TRSs, are subject to U.S. federal corporate income tax.
|
|
•
|
if Colony Credit owns a residual interest in a real estate mortgage investment conduit, or a REMIC, it will be taxable at the highest corporate rate on the portion of any excess inclusion income that it derives from the REMIC residual interests equal to the percentage of our stock that is held in record name by “disqualified organizations.” Although the law is unclear, IRS guidance indicates that similar rules may apply to a REIT that owns an equity interest in a taxable mortgage pool. To the extent that Colony Credit owns a REMIC residual interest or a taxable mortgage pool through a TRS, it will not be subject to this tax. For a discussion of “excess inclusion income,” refer below to the section entitled “-Requirements for Qualification-Taxable Mortgage Pools.” A “disqualified organization” includes:
|
|
•
|
the United States;
|
|
•
|
any state or political subdivision of the United States;
|
81
|
•
|
any foreign government;
|
|
•
|
any international organization;
|
|
•
|
any agency or instrumentality of any of the foregoing;
|
|
•
|
any other tax-exempt organization, other than a farmer’s cooperative described in Section 521 of the Code, that is exempt both from income taxation and from taxation under the unrelated business taxable income provisions of the Code; and
|
|
•
|
any rural electrical or telephone cooperative.
|
In addition, Colony Credit and its subsidiaries may be subject to a variety of taxes, including payroll taxes and state, local and non-U.S. income, property and other taxes on its assets and operations. Colony Credit could also be subject to tax in situations and on transactions not presently contemplated. Moreover, as described further below, Colony Credit’s TRSs will be subject to U.S. federal, state and local corporate income tax on their taxable income.
Requirements for Qualification
A REIT is a corporation, trust or association that meets each of the following requirements:
|
1.
|
It is managed by one or more trustees or directors.
|
|
2.
|
Its beneficial ownership is evidenced by transferable shares or by transferable certificates of beneficial interest.
|
|
3.
|
It would be taxable as a domestic corporation but for the REIT provisions of the U.S. federal income tax laws.
|
|
4.
|
It is neither a financial institution nor an insurance company subject to special provisions of the U.S. federal income tax laws.
|
|
5.
|
At least 100 persons are beneficial owners of its shares or ownership certificates.
|
|
6.
|
Not more than 50% in value of its outstanding shares or ownership certificates is owned, directly or indirectly, by five or fewer individuals, which the Code defines to include certain entities, during the last half of any taxable year.
|
|
7.
|
It elects to be a REIT, or has made such election for a previous taxable year, and satisfies all relevant filing and other administrative requirements established by the IRS that must be met to elect and maintain REIT status.
|
|
8.
|
It meets certain other qualification tests, described below, regarding the nature of its income and assets and the amount of its distributions to holders.
|
|
9.
|
It uses a calendar year for U.S. federal income tax purposes.
|
Colony Credit must meet requirements 1 through 4, 8 and 9 during its entire taxable year and must meet requirement 5 during at least 335 days of a taxable year of 12 months, or during a proportionate part of a taxable year of less than 12 months. Requirements 5 and 6 will begin applying to Colony Credit with its 2019 taxable year. If Colony Credit complies with all the requirements for ascertaining the ownership of its outstanding shares in a taxable year and has no reason to know that it violated requirement 6, it will be deemed to have satisfied requirement 6 for that taxable year. For purposes of determining share ownership under requirement 6, an “individual” generally includes a supplemental unemployment compensation benefits plan, a private foundation or a portion of a trust permanently set aside or used exclusively for charitable purposes. An “individual,” however, generally does not include a trust that is a qualified employee pension or profit-sharing trust under the U.S. federal income tax laws, and beneficiaries of such a trust will be treated as holding our stock in proportion to their actuarial interests in the trust for purposes of requirement 6. Colony Credit believes that it has issued sufficient stock with sufficient diversity of ownership to satisfy requirements 5 and 6. In addition, Colony Credit’s charter restricts the ownership and transfer of our stock so that it should continue to satisfy these requirements. To monitor compliance with the stock ownership requirements, Colony Credit is generally required to maintain records regarding the actual ownership of Colony Credit’s stock. To do so, Colony Credit must demand written statements each year from the record holders of significant percentages of its stock pursuant to which the record holders must disclose the actual owners of the stock (i.e., the persons required to include in gross income the dividends paid by Colony Credit). Colony Credit must maintain a list of those persons failing or refusing to comply with this demand as part of its records. Colony Credit could be subject to monetary penalties if it fails to comply with these record-keeping requirements. A holder that fails or refuses to comply with the demand is required by Treasury Regulations to submit a statement with its tax return disclosing the actual ownership of Colony Credit’s stock and other information. For purposes of requirement 9, Colony Credit has adopted December 31 as its year end, and thereby satisfies this requirement.
82
Relief from Violations; Reasonable Cause
The Code provides relief from violations of the REIT gross income requirements, as described below under “-Requirements for Qualification-Gross Income Tests,” in cases where a violation is due to reasonable cause and not to willful neglect, and other requirements are met, including the payment of a penalty tax that is based upon the magnitude of the violation. In addition, certain Code provisions extend similar relief in the case of certain violations of the REIT asset requirements (see “-Requirements for Qualification-Asset Tests” below) and other REIT requirements, again provided that the violation is due to reasonable cause and not willful neglect, and other conditions are met, including the payment of a penalty tax. If Colony Credit did not have reasonable cause for a failure, Colony Credit would fail to qualify as a REIT. Whether Colony Credit would have reasonable cause for any such failure cannot be known with certainty because the determination of whether reasonable cause exists depends on the facts and circumstances at the time and Colony Credit cannot provide any assurance that Colony Credit in fact would have reasonable cause for a particular failure or that the IRS would not successfully challenge our view that a failure was due to reasonable cause. Moreover, Colony Credit may be unable to actually rectify a failure and restore asset test compliance within the required timeframe due to the inability to transfer or otherwise dispose of assets, including as a result of restrictions on transfer imposed by our lenders or undertakings with our co-investors and/or the inability to acquire additional qualifying assets due to transaction risks, access to additional capital or other considerations. If Colony Credit fails to satisfy any of the various REIT requirements, there can be no assurance that these relief provisions would be available to enable Colony Credit to maintain our qualification as a REIT, and, if such relief provisions are available, the amount of any resultant penalty tax could be substantial.
Effect of Subsidiary Entities
Qualified REIT Subsidiaries
. A corporation that is a QRS is not treated as a corporation separate from its parent REIT. All assets, liabilities and items of income, deduction and credit of a QRS are treated as assets, liabilities and items of income, deduction and credit of the REIT. A QRS is a corporation, other than a TRS, all the stock of which is owned by the REIT. Thus, in applying the requirements described herein, any QRS that Colony Credit owns will be ignored, and all assets, liabilities and items of income, deduction and credit of such subsidiary will be treated as Colony Credit’s assets, liabilities and items of income, deduction and credit.
Other Disregarded Entities and Partnerships
. An unincorporated domestic entity, such as a partnership or limited liability company, that has a single owner for U.S. federal income tax purposes generally is not treated as an entity separate from its owner for U.S. federal income tax purposes. An unincorporated domestic entity with two or more owners is generally treated as a partnership for U.S. federal income tax purposes. In the case of a REIT that is a partner in a partnership that has other partners, the REIT is treated as owning its proportionate share of the assets of the partnership and as earning its allocable share of the gross income of the partnership for purposes of the applicable REIT qualification tests. Thus, Colony Credit’s proportionate share of the assets, liabilities and items of income of the Operating Partnership, and any other partnership, joint venture or limited liability company that is treated as a partnership for U.S. federal income tax purposes in which it has acquired or will acquire an interest, directly or indirectly, or a subsidiary partnership, will be treated as its assets and gross income for purposes of applying the various REIT qualification requirements. For purposes of the 10% value test (described in the section entitled “-Asset Tests”), Colony Credit’s proportionate share is based on its proportionate interest in the equity interests and certain debt securities issued by the partnership. For all of the other asset and income tests, Colony Credit’s proportionate share is based on its proportionate interest in the capital of the partnership.
Colony Credit, through its Operating Partnership, holds and expects to acquire limited partner or non-managing member interests in partnerships and limited liability companies that are joint ventures or investment funds. If a partnership or limited liability company in which Colony Credit owns a direct or indirect interest takes or expects to take actions that could jeopardize its qualification as a REIT or require it to pay tax, Colony Credit may be forced to dispose of its interest in such entity. In addition, it is possible that a partnership or limited liability company could take an action which could cause Colony Credit to fail a REIT gross income or asset test, and that Colony Credit would not become aware of such action in time to dispose of its interest in the partnership or limited liability company or take other corrective action on a timely basis. In that case, Colony Credit could fail to qualify as a REIT unless it was able to qualify for a statutory REIT “savings” provision, which may require it to pay a significant penalty tax to maintain its REIT qualification.
Taxable REIT Subsidiaries
. A REIT may own up to 100% of the stock of one or more TRSs. A TRS is a fully taxable corporation that may earn income that would not be qualifying income if earned directly by its parent REIT or through a disregarded or partnership subsidiary. The subsidiary corporation and the REIT must jointly elect to treat the subsidiary as a TRS. Any corporation of which a TRS directly or indirectly owns more than 35% of the voting power or value of the stock will automatically be treated as a TRS.
A REIT is not treated as holding the assets of a TRS or as receiving any income that the TRS earns. Rather, the stock issued by the TRS is an asset in the hands of the parent REIT and the REIT recognizes as income the dividends, if any, that it receives from the TRS. This treatment can affect the income and asset test calculations that apply to the REIT. Because a parent REIT does not
83
include the assets and income of such TRSs in determining the parent REIT’s compliance with the REIT requirements, TRSs may be used by the parent REIT to undertake indirectly activities that the REIT rules might otherwise preclude it from doing directly or through pass-through subsidiaries (for example, activities that give rise to certain categories of income such as management fees). Other than activities relating to the operation or management of lodging and healthcare facilities, a TRS may generally engage in any business, including the provision of customary or non-customary services to tenants without causing the parent REIT to receive impermissible tenant service income under the REIT gross income tests.
Domestic TRSs are subject to U.S. federal income tax, and state and local income tax, where applicable, on their taxable income. To the extent that a domestic TRS is required to pay taxes, it will have less cash available for distribution to Colony Credit. If dividends are paid to Colony Credit by its domestic TRSs, then the dividends it pays to our holders who are taxed at individual rates, up to the amount of dividends it receives from its domestic TRSs, will generally be eligible to be taxed at the reduced 20% rate applicable to qualified dividend income.
The TRS rules limit the deductibility of interest paid or accrued by a TRS to its parent REIT to assure that the TRS is subject to an appropriate level of corporate taxation. Further, the rules impose a 100% excise tax on transactions between a TRS and its parent REIT or the REIT’s tenants that are not conducted on an arm’s-length basis. See “-New Interest Deduction Limitation Enacted by H.R. 1.”
Colony Credit is subject to the limitation that securities in TRSs may not represent more than 20% of the value of Colony Credit’s total assets. There can be no assurance that we will be able to comply with the 20% limitation.
In general, Colony Credit intends that any loans that are originated or acquired with an intention of selling such loans in a manner that might expose it to a 100% tax on “prohibited transactions” if originated or acquired by Colony Credit directly, will instead be originated or acquired by a TRS. Refer to the section entitled “-Gross Income Tests-Prohibited Transactions.” It is possible that such a TRS through which sales of securities are made may be treated as a “dealer” for U.S. federal income tax purposes. As a dealer, a TRS would generally mark all the securities it holds on the last day of each taxable year to their market value, and will recognize ordinary income or loss on such securities with respect to such taxable year as if they had been sold for that value on that day. In addition, a TRS may further elect to be subject to the mark-to-market regime described above in the event that the TRS is properly classified as a “trader” as opposed to a “dealer” for U.S. federal income tax purposes.
Subsidiary REITs
. Colony Credit owns interests (directly or indirectly) in one or more entities that qualify as REITs. Colony Credit believes that each such REIT has operated, and will continue to operate, in a manner to permit Colony Credit to qualify for taxation as a REIT for U.S. federal income tax purposes and that stock in any such REIT will thus be a qualifying asset for purposes of the 75% asset test. However, if any such REIT fails to qualify as a REIT then (i) the entity would become subject to regular corporate income tax, as described herein (refer below to the section entitled “-Failure to Qualify”) and (ii) Colony Credit’s equity interest in such entity would cease to be a qualifying real estate asset for purposes of the 75% asset test and, if our protective TRS elections were ineffective, would become subject to the 5% asset test and the 10% vote or value test generally applicable to Colony Credit’s ownership in corporations other than REITs, QRSs or TRSs (refer below to the section entitled “-Asset Tests”). If such an entity failed to qualify as a REIT, it is possible that Colony Credit would not meet the 75% asset test, the 5% asset test, and/or the 10% vote or value test with respect to its interest in such entity, in which event Colony Credit would fail to qualify as a REIT, unless Colony Credit qualifies for certain relief provisions.
Taxable Mortgage Pools
. An entity, or a portion of an entity, may be classified as a taxable mortgage pool, or a TMP under the Code if:
|
•
|
substantially all of its assets consist of debt obligations or interests in debt obligations;
|
|
•
|
more than 50% of those debt obligations are real estate mortgages or interests in real estate mortgages as of specified testing dates;
|
|
•
|
the entity has issued debt obligations that have two or more maturities; and
|
|
•
|
the payments required to be made by the entity on its debt obligations “bear a relationship” to the payments to be received by the entity on the debt obligations that it holds as assets.
|
Under the Treasury Regulations, if less than 80% of the assets of an entity (or a portion of an entity) consists of debt obligations, these debt obligations are considered not to comprise “substantially all” of its assets and therefore the entity would not be treated as a TMP. Financing arrangements entered into, directly or indirectly, by Colony Credit may give rise to TMPs, with the consequences described in the next paragraph.
A TMP generally is treated as a corporation for U.S. federal income tax purposes. However, special rules apply to a REIT, a portion of a REIT, or a QRS that is a TMP. If a REIT owns directly, or indirectly through one or more QRSs or other entities that are disregarded as separate entities for U.S. federal income tax purposes, 100% of the equity interests in the TMP, the TMP will be a
84
QRS and, therefore, ignored as an entity separate from the REIT for U.S. federal income tax purposes and would not generally affect the tax qualification of the REIT.
If Colony Credit has an investment in an arrangement that is classified as a TMP, that TMP arrangement will be subject to tax as a separate corporation unless Colony Credit owns 100% of the equity in such TMP arrangement so that it is treated as a QRS, as discussed above. Whether an arrangement is or is not a TMP may not be susceptible to precise determination. If an investment in which Colony Credit owns an interest is characterized as a TMP and thus as a separate corporation, Colony Credit will satisfy the 100% ownership requirement only so long as it owns all classes of securities that for tax purposes are characterized as equity, which is often an uncertain factual issue and in any event is unlikely in Colony Credit’s case given that it generally holds its assets through Colony Credit’s Operating Partnership. Accordingly, if an investment in which Colony Credit owns an interest is characterized as a TMP that does not qualify as a QRS, Colony Credit may be unable to comply with the REIT asset tests that restrict its ability to own most corporations. In addition, a portion of the REIT’s income from a TMP arrangement that is not taxed as a separate corporation, which might be non-cash accrued income, could be treated as “excess inclusion income.” The manner in which excess inclusion income is calculated is not clear under current law. However, as required by IRS guidance, Colony Credit intends to make such determinations based on what it believes to be a reasonable method. Under the IRS guidance, a REIT’s excess inclusion income, including any excess inclusion income from a residual interest in a REMIC, must be allocated among its holders in proportion to dividends paid. A REIT is required to notify holders of the amount of “excess inclusion income” allocated to them. A holder’s share of excess inclusion income:
|
•
|
cannot be offset by any net operating losses otherwise available to the holder;
|
|
•
|
in the case of a holder that is a REIT, a regulated investment company or a common trust fund or other pass-through entity, is considered excess inclusion income of such entity;
|
|
•
|
is subject to tax as unrelated business taxable income in the hands of most types of holders that are otherwise generally exempt from U.S. federal income tax;
|
|
•
|
results in the application of U.S. federal income tax withholding at the maximum rate (30%), without reduction for any otherwise applicable income tax treaty or other exemption, to the extent allocable to most types of non-U.S. holders; and
|
|
•
|
is taxable (at the highest corporate tax rate, currently 21%) to the REIT, rather than its holders, to the extent allocable to the REIT’s stock held in record name by holders that are disqualified organizations (generally, tax-exempt entities not subject to unrelated business income tax, including governmental organizations), in which case such disqualified organization could be obligated to reimburse Colony Credit for that tax.
|
Tax-exempt investors, regulated investment company or REIT investors, non-U.S. investors and taxpayers with net operating losses should carefully consider the tax consequences described above, and are urged to consult their tax advisors.
Gross Income Tests
Colony Credit must satisfy two gross income tests annually to qualify as a REIT. First, at least 75% of Colony Credit’s gross income for each taxable year must consist of defined types of income that it derives, directly or indirectly, from investments relating to real property or mortgages on real property or qualified temporary investment income. Qualifying income for purposes of the 75% gross income test generally includes:
|
•
|
rents from real property;
|
|
•
|
interest on debt secured by mortgages on real property or on interests in real property (including certain types of mortgage backed securities);
|
|
•
|
dividends or other distributions on, and gain from the sale of, shares in other REITs;
|
|
•
|
gain from the sale of real estate assets;
|
|
•
|
income and gain derived from foreclosure property;
|
|
•
|
income derived from a REMIC in proportion to the real estate assets held by the REMIC, unless at least 95% of the REMIC’s assets are real estate assets, in which case all of the income derived from the REMIC; and
|
|
•
|
income derived from the temporary investment of new capital that is attributable to the issuance of our stock or a public offering of our debt with a maturity date of at least five years that is received during the one-year period beginning on the date on which Colony Credit received such new capital.
|
85
Although a debt instrument issued by a “publicly offered REIT” (i.e., a REIT that is required to file annual and periodic reports with the SEC under the Exchange Act) is treated as a “real estate asset” for purposes of the asset tests, the interest income and gain from the sale of such debt instruments is not treated as qualifying income for the 75% gross income test unless the debt instrument is secured by real property or an interest in real property.
Second, in general, at least 95% of Colony Credit’s gross income for each taxable year must consist of income that is qualifying income for purposes of the 75% gross income test, other types of interest and dividends, gain from the sale or disposition of stock or securities or any combination of these. For purposes of the 95% gross income test, gain from the sale of securities includes gain from the sale of a debt instrument issued by a “publicly offered REIT” even if not secured by real property or an interest in real property. Gross income from the sale of property that Colony Credit holds primarily for sale to customers in the ordinary course of business and cancellation of indebtedness, or COD income is excluded from both the numerator and the denominator in both income tests. Income and gain from “qualified hedging transactions,” as defined below in “-Hedging Transactions,” that are clearly and timely identified as such are excluded from both the numerator and the denominator for purposes of the 75% and 95% gross income tests. In addition, certain foreign currency gains are excluded from gross income for purposes of one or both of the gross income tests. Refer below to the section entitled “-Foreign Currency Gain.” The following paragraphs discuss the specific application of the gross income tests to Colony Credit.
Rents from Real Property
Rent that Colony Credit receives from its real property will qualify as “rents from real property” which is qualifying income for purposes of the 75% and 95% gross income tests, only if the following conditions are met:
|
•
|
First, the rent must not be based, in whole or in part, on the income or profits of any person. However, an amount received or accrued generally will not be excluded from rents from real property solely by reason of being based on fixed percentages of receipts or sales.
|
|
•
|
Second, rents Colony Credit receives from a “related party tenant” will not qualify as rents from real property in satisfying the gross income tests unless the tenant is a TRS, and either: (i) at least 90% of the property is leased to unrelated tenants and the rent paid by the TRS is substantially comparable to the rent paid by the unrelated tenants for comparable space; or (ii) the TRS leases a qualified lodging facility or qualified health care property and engages an eligible independent contractor, as defined above in “-Taxable REIT Subsidiaries,” to operate such facility or property on its behalf. A tenant is a related party tenant if the REIT, or an actual or constructive owner of 10% or more of the REIT, actually or constructively owns 10% or more of the tenant.
|
|
•
|
Third, if rent attributable to personal property leased in connection with a lease of real property is 15% or less of the total rent received under the lease, then the rent attributable to personal property will qualify as rents from real property. However, if the 15% threshold is exceeded, the rent attributable to personal property will not qualify as rents from real property.
|
|
•
|
Fourth, Colony Credit generally must not operate or manage its real property or furnish or render services to its tenants, other than through an “independent contractor” who is adequately compensated and from whom Colony Credit does not derive revenue. However, Colony Credit may provide services directly to tenants if the services are “usually or customarily rendered” in connection with the rental of space for occupancy only and are not considered to be provided for the tenants’ convenience. In addition, Colony Credit may directly provide a minimal amount of “noncustomary” services to the tenants of a property as long as its income from the services (valued at not less than 150% of Colony Credit’s direct cost of performing such services) does not exceed 1% of its income from the related property in which case only the amounts for noncustomary services are not treated as rents from real property. If, however, the gross income from such noncustomary services exceeds this 1% threshold, none of the gross income derived from the relevant property will qualify as rents from real property. Furthermore, Colony Credit may own up to 100% of the stock of a TRS that provides customary and noncustomary services to its tenants without tainting the rental income for the related properties. Refer to the section entitled “-Taxable REIT Subsidiaries.”
|
Unless Colony Credit determines that the resulting non-qualifying income under any of the following circumstances, taken together with all other non-qualifying income earned by it in the taxable year, will not jeopardize its qualification as a REIT, Colony Credit does not intend to:
|
•
|
derive rental income attributable to personal property other than personal property leased in connection with the lease of real property, the amount of which is less than 15% of the total rent received under the lease;
|
|
•
|
rent any property to a related party tenant, including, except with respect to qualified health care properties and qualified lodging facilities, a TRS;
|
86
|
•
|
charge rent for any property that is based in whole or in part on the income or profits of any person, except by reason of being based on a fixed percentage or percentages of receipts or sales, as described above; or
|
|
•
|
directly or indirectly perform services considered to be noncustomary or provided for the tenant’s convenience other than through a TRS or independent contractor.
|
Interest
The term “interest,” as defined for purposes of both gross income tests, generally excludes any amount that is based, in whole or in part, on the income or profits of any person. However, interest generally includes the following:
|
•
|
an amount that is based on a fixed percentage or percentages of receipts or sales; and
|
|
•
|
an amount that is based on the income or profits of a debtor, as long as the debtor derives substantially all of its income from the real property securing the debt from leasing substantially all of its interest in the property and only to the extent that the amounts received by the debtor would be qualifying “rents from real property” if received directly by a REIT.
|
If a loan contains a provision that entitles a REIT to a percentage of the borrower’s gain upon the sale of the real property securing the loan or a percentage of the appreciation in the property’s value as of a specific date, income attributable to that loan provision will be treated as gain from the sale of the property securing the loan, which generally is qualifying income for purposes of both gross income tests, provided that the property is not inventory or dealer property in the hands of the borrower or the REIT.
Interest on debt secured by mortgages on real property or on interests in real property (including, in the case of a loan secured by real property and personal property, such personal property to the extent that it does not exceed 15% of the total fair market value of all such property securing the loan), including, for this purpose, prepayment penalties, loan assumption fees and late payment charges that are not compensation for services, generally is qualifying income for purposes of the 75% gross income test. In general, under applicable Treasury Regulations, if a loan is secured by real property and other property and the highest principal amount of the loan outstanding during a taxable year exceeds the fair market value of the real property securing the loan determined as of: (i) the date Colony Credit agreed to acquire or originate the loan; or (ii) as discussed further below, in the event of a “significant modification,” the date Colony Credit modified the loan, then a portion of the interest income from such loan will not be qualifying income for purposes of the 75% gross income test, but will be qualifying income for purposes of the 95% gross income test. The portion of the interest income that will not be qualifying income for purposes of the 75% gross income test will be equal to the portion of the principal amount of the loan that is not secured by real property-that is, the amount by which the loan exceeds the value of the real property that is security for the loan. As discussed further below, IRS guidance provides that Colony Credit does not need to redetermine fair market value of the real property securing the loan in connection with a loan modification that is occasioned by a borrower default or made at a time when Colony Credit reasonably believes that the modification to the loan will substantially reduce a significant risk of default on the loan.
Colony Credit invests in loans secured by real property that is under construction or being significantly improved, in which case the value of the real estate that is security for the loan will be the fair market value of the land plus the reasonably estimated cost of the improvements or developments (including, in the case of a loan secured by real property and personal property, such personal property to the extent that it does not exceed 15% of the total fair market value of all such property securing the loan) which will secure the loans and which are to be constructed from proceeds of the loan.
Colony Credit holds certain mezzanine loans and may originate or acquire other mezzanine loans. Mezzanine loans are loans secured by equity interests in an entity that directly or indirectly owns real property, rather than by a direct mortgage of the real property. In Revenue Procedure 2003-65, the IRS established a safe harbor under which loans secured by a first priority security interest in ownership interests in a partnership or limited liability company owning real property will be treated as real estate assets for purposes of the REIT asset tests described below, and interest derived from those loans will be treated as qualifying income for both the 75% and 95% gross income tests, provided several requirements are satisfied.
Although Revenue Procedure 2003-65 provides a safe harbor on which taxpayers may rely, it does not prescribe rules of substantive tax law. Moreover, Colony Credit expects that some of its mezzanine loans may not meet all of the requirements for reliance on the safe harbor. To the extent any mezzanine loans that Colony Credit originates or acquires do not qualify for the safe harbor described above, the interest income from the loans will be qualifying income for purposes of the 95% gross income test, but there is a risk that such interest income will not be qualifying income for purposes of the 75% gross income test. Colony Credit believes that it currently invests in mezzanine loans, and intends to continue to invest in mezzanine loans, in a manner that will enable it to satisfy the REIT gross income and asset tests.
Colony Credit and its subsidiaries hold certain participation interests, or subordinated mortgage interests, in mortgage loans and mezzanine loans originated by other lenders. A subordinated mortgage interest is an interest created in an underlying loan by virtue of a participation or similar agreement, to which the originator of the loan is a party, along with one or more participants. The
87
borrower on the underlying loan is typically not a party to the participation agreement. The performance of a participant’s investment depends upon the performance of the underlying loan and if the underlying borrower defaults, the participant typically has no recourse against the originator of the loan. The originator often retains a senior position in the underlying loan and grants junior participations, which will be a first loss position in the event of a default by the borrower. Colony Credit expects that its (and its subsidiaries’) participation interests generally will qualify as real estate assets for purposes of the REIT asset tests described below and that interest derived from such investments generally will be treated as qualifying interest for purposes of the 75% gross income test. The appropriate treatment of participation interests for U.S. federal income tax purposes is not entirely certain, however, and no assurance can be given that the IRS will not challenge Colony Credit’s treatment of its participation interests.
Many of the terms of the mortgage loans, mezzanine loans and subordinated mortgage interests and the loans supporting the mortgage-backed securities that Colony Credit holds or expects to acquire have been modified and may in the future be modified. Under the Code, if the terms of a loan are modified in a manner constituting a “significant modification,” such modification triggers a deemed exchange of the original loan for the modified loan. Revenue Procedure 2014-51 provides a safe harbor pursuant to which Colony Credit will not be required to redetermine the fair market value of the real property securing a loan for purposes of the gross income and asset tests in connection with a loan modification that is: (i) occasioned by a borrower default; or (ii) made at a time when Colony Credit reasonably believes that the modification to the loan will substantially reduce a significant risk of default on the original loan. No assurance can be provided that all of Colony Credit’s loan modifications will qualify for the safe harbor in Revenue Procedure 2014-51. To the extent Colony Credit significantly modifies loans in a manner that does not qualify for that safe harbor, it will be required to redetermine the value of the real property securing the loan at the time it was significantly modified. In determining the value of the real property securing such a loan, Colony Credit generally will not obtain third-party appraisals but rather will rely on internal valuations. No assurance can be provided that the IRS will not successfully challenge Colony Credit’s internal valuations. If the terms of Colony Credit’s mortgage loans, mezzanine loans and subordinated mortgage interests and loans supporting its mortgage-backed securities are significantly modified in a manner that does not qualify for the safe harbor in Revenue Procedure 2014-51 and the fair market value of the real property securing such loans has decreased significantly, Colony Credit could fail the 75% gross income test, the 75% asset test and/or the 10% value test.
Colony Credit and its subsidiaries also hold, and may in the future, acquire distressed mortgage loans. Revenue Procedure 2014-51 provides that the IRS will treat distressed mortgage loans acquired by a REIT that are secured by real property and other property as producing in part non-qualifying income for the 75% gross income test. Specifically, Revenue Procedure 2014-51 indicates that interest income on such a distressed mortgage loan will be treated as qualifying income based on the ratio of: (i) the fair market value of the real property securing the debt determined as of the date the REIT committed to acquire the loan; and (ii) the face amount of the loan (and not the purchase price or current value of the debt). The face amount of a distressed mortgage loan will typically exceed the fair market value of the real property securing the mortgage loan on the date the REIT commits to acquire the loan. It is unclear how the safe harbor in Revenue Procedure 2014-51 is affected by the recent legislative changes regarding the treatment of personal property securing a mortgage loan. Colony Credit intends to invest in distressed mortgage loans in a manner that consistent with qualifying as a REIT.
Colony Credit and its subsidiaries have entered into certain sale and repurchase agreements under which it nominally sells certain mortgage assets to a counterparty and simultaneously enters into an agreement to repurchase the sold assets. Based on positions the IRS has taken in analogous situations, Colony Credit believes that it will be treated for purposes of the REIT gross income and asset tests (refer below to the section entitled “-Asset Tests”) as the owner of the mortgage assets that are the subject of any such agreement notwithstanding that record ownership of the assets is transferred to the counterparty during the term of the agreement. It is possible, however, that the IRS could assert that Colony Credit does not own the mortgage assets during the term of the sale and repurchase agreement, in which case its ability to qualify as a REIT could be adversely affected.
Colony Credit may invest in other agency securities that are pass-through certificates. Colony Credit expects that any such agency securities will be treated as either interests in a grantor trust or as interests in a REMIC for U.S. federal income tax purposes and that all interest income from such agency securities will be qualifying income for the 95% gross income test. In the case of agency securities treated as interests in grantor trusts, Colony Credit would be treated as owning an undivided beneficial ownership interest in the mortgage loans held by the grantor trust. The interest on such mortgage loans would be qualifying income for purposes of the 75% gross income test to the extent that such loan is secured by real property, as discussed above. In the case of agency securities treated as interests in a REMIC, income derived from such REMIC interests generally will be treated as qualifying income for purposes of the 75% gross income test. As discussed above, however, if less than 95% of the assets of the REMIC are real estate assets then only a proportionate part of the income derived from Colony Credit’s interest in the REMIC will qualify for purposes of the 75% gross income tests. To the extent that a REMIC interest includes an imbedded interest swap or cap contract or other derivative instrument, such derivative instrument could produce non-qualifying income for purposes of the 75% gross income test. Colony Credit expects that substantially all of its income from agency securities will be qualifying income for purposes of the 75% and 95% gross income tests.
88
Dividends; Subpart F Income
Colony Credit’s share of any dividends received from any corporation (including any TRS, but excluding any REIT) in which it owns an equity interest will qualify for purposes of the 95% gross income test but not for purposes of the 75% gross income test. Colony Credit’s share of any dividends received from any other REIT in which it owns an equity interest, including any subsidiary REIT, will be qualifying income for purposes of both gross income tests.
In addition, Colony Credit may be required to include in gross income its share of “Subpart F income” of one or more foreign (non-U.S.) corporations in which it invests, including its foreign TRSs, regardless of whether it receives distributions from such corporations. Pursuant to Revenue Procedure 2018-48, Colony Credit will treat certain income inclusions received with respect to equity investments in foreign TRSs as qualifying income for purposes of the 95% gross income test but not the 75% gross income test.
Fee Income
Colony Credit expects to receive various fees in connection with its operations. Fee income will be qualifying income for purposes of both the 75% and 95% gross income tests if it is received in consideration for entering into an agreement to make a loan secured by mortgages on or interests in real property, and the fees are not determined by the income and profits of any person. Other fees, such as origination and servicing fees, fees for acting as a broker-dealer and fees for managing investments for third parties, are not qualifying income for purposes of either gross income test. Any fees earned by a TRS are not included for purposes of the gross income tests.
Hedging Transactions
From time to time, Colony Credit and its subsidiaries expect to enter into hedging transactions with respect to one or more of its assets or liabilities. Colony Credit’s hedging activities may include entering into interest rate swaps, caps and floors, options to purchase such items and futures and forward contracts. Income and gain from “qualified hedging transactions” are excluded from gross income for purposes of the 75% and 95% gross income tests. A “qualified hedging transaction” includes: (i) any transaction entered into in the normal course of Colony Credit’s trade or business primarily to manage the risk of interest rate, price changes or currency fluctuations with respect to borrowings made or to be made, or ordinary obligations incurred or to be incurred, to acquire or carry real estate assets; (ii) any transaction entered into primarily to manage the risk of currency fluctuations with respect to any item of income or gain that would be qualifying income under the 75% or 95% gross income test (or any property which generates such income or gain); and (iii) any transaction entered into to “offset” a transaction described in (i) or (ii) if a portion of the hedged indebtedness is extinguished or the related property disposed of. Colony Credit will be required to clearly identify any such hedging transaction before the close of the day on which it was acquired, originated or entered into and to satisfy other identification requirements in order to be treated as a qualified hedging transaction. Colony Credit intends to structure any hedging transactions in a manner that does not jeopardize its qualification as a REIT.
COD Income
From time to time, Colony Credit and its subsidiaries may recognize COD income, in connection with repurchasing debt at a discount. COD income is excluded from gross income for purposes of both the 75% and 95% gross income tests.
Foreign Currency Gain
Certain foreign currency gain is excluded from gross income for purposes of one or both of the gross income tests. “Real estate foreign exchange gain” is excluded from gross income for purposes of the 75% gross income test. Real estate foreign exchange gain generally includes foreign currency gain attributable to any item of income or gain that is qualifying income for purposes of the 75% gross income test, foreign currency gain attributable to the acquisition or ownership of (or becoming or being the obligor under) obligations and certain foreign currency gain attributable to certain “qualified business units” of a REIT. “Passive foreign exchange gain” is excluded from gross income for purposes of the 95% gross income test. Passive foreign exchange gain generally includes real estate foreign exchange gain as described above and also includes foreign currency gain attributable to any item of income or gain that is qualifying income for purposes of the 95% gross income test and foreign currency gain attributable to the acquisition or ownership of (or becoming or being the obligor under) obligations secured by mortgages on real property or on interests in real property. Because passive foreign exchange gain includes real estate foreign exchange gain, real estate foreign exchange gain is excluded from gross income for purposes of both the 75% and 95% gross income tests. These exclusions for real estate foreign exchange gain and passive foreign exchange gain do not apply to certain foreign currency gain derived from dealing, or engaging in substantial and regular trading, in securities, which is treated as non-qualifying income for purposes of both the 75% and 95% gross income tests.
89
Prohibited Transactions
A REIT will incur a 100% tax on the net income derived from any sale or other disposition of property, other than foreclosure property, that the REIT holds primarily for sale to customers in the ordinary course of a trade or business. Colony Credit believes that none of its assets are held or will be held primarily for sale to customers and that a sale of any of its assets has not been, and will not be, in the ordinary course of its business. Whether a REIT holds an asset “primarily for sale to customers in the ordinary course of a trade or business” depends, however, on the facts and circumstances in effect from time to time, including those related to a particular asset. A safe harbor to the characterization of the sale of property by a REIT as a prohibited transaction and the 100% prohibited transaction tax is available if the following requirements are met:
|
•
|
the REIT has held the property for not less than two years;
|
|
•
|
the aggregate expenditures made by the REIT, or any partner of the REIT, during the two-year period preceding the date of the sale that are includable in the basis of the property do not exceed 30% of the net selling price of the property;
|
|
•
|
either: (i) during the year in question, the REIT did not make more than seven sales of property other than foreclosure property or sales to which Section 1031 or 1033 of the Code applies; (ii) the aggregate adjusted bases of all such properties sold by the REIT during the year did not exceed 10% of the aggregate bases of all of the assets of the REIT at the beginning of the year; (iii) the aggregate fair market value of all such properties sold by the REIT during the year did not exceed 10% of the aggregate fair market value of all of the assets of the REIT at the beginning of the year; (iv)(A) the aggregate adjusted tax bases of all such properties sold by the REIT during the year did not exceed 20% of the aggregate adjusted bases of all property of the REIT at the beginning of the year and (B) the three-year average percentage of properties sold by the REIT compared to all the REIT’s properties (measured by adjusted bases) taking into account the current and two prior years did not exceed 10%; or (v)(A) the aggregate fair market value of all such properties sold by the REIT during the year did not exceed 20% of the aggregate fair market value of all property of the REIT at the beginning of the year and (B) the three-year average percentage of properties sold by the REIT compared to all the REIT’s properties (measured by fair market value) taking into account the current and two prior years did not exceed 10%;
|
|
•
|
in the case of property not acquired through foreclosure or lease termination, the REIT has held the property for at least two years for the production of rental income; and
|
|
•
|
if the REIT has made more than seven sales of non-foreclosure property during the taxable year, substantially all of the marketing and development expenditures with respect to the property were made through an independent contractor from whom the REIT derives no income or a TRS.
|
No assurance can be given that any property that Colony Credit sells will not be treated as property held “primarily for sale to customers in the ordinary course of a trade or business” or that Colony Credit will be able to comply with the safe harbor when disposing of assets. The 100% tax will not apply to gains from the sale of property that is held through a TRS or other taxable corporation, although such income will be taxed to the corporation at regular corporate income tax rates. Colony Credit intends to structure its activities to avoid transactions that would result in a material amount of prohibited transaction tax.
Foreclosure Property
Colony Credit will be subject to tax at the maximum corporate rate on any income from foreclosure property, which includes certain foreign currency gains and related deductions recognized, other than income that otherwise would be qualifying income for purposes of the 75% gross income test, less expenses directly connected with the production of that income. However, gross income from foreclosure property will qualify under the 75% and 95% gross income tests. Foreclosure property is any real property, including interests in real property, and any personal property incident to such real property:
|
•
|
that is acquired by a REIT as the result of the REIT having bid on such property at foreclosure or having otherwise reduced such property to ownership or possession by agreement or process of law, after there was a default or default was imminent on a lease of such property or on indebtedness that such property secured;
|
|
•
|
for which the related loan was acquired by the REIT at a time when the default was not imminent or anticipated; and
|
|
•
|
for which the REIT makes a proper election to treat the property as foreclosure property.
|
A REIT will not be considered to have foreclosed on a property where the REIT takes control of the property as a mortgagee-in-possession and cannot receive any profit or sustain any loss except as a creditor of the mortgagor. Property generally ceases to be foreclosure property at the end of the third taxable year following the taxable year in which the REIT acquired the property or longer if an extension is granted by the Secretary of the Treasury. However, this grace period terminates and foreclosure property ceases to be foreclosure property on the first day:
90
|
•
|
on which a lease is entered into for the property that, by its terms, will give rise to income that does not qualify for purposes of the 75% gross income test, or any amount is received or accrued, directly or indirectly, pursuant to a lease entered into on or after such day that will give rise to income that does not qualify for purposes of the 75% gross income test;
|
|
•
|
on which any construction takes place on the property, other than completion of a building or any other improvement, where more than 10% of the construction was completed before default became imminent; or
|
|
•
|
which is more than 90 days after the day on which the REIT acquired the property and the property is used in a trade or business which is conducted by the REIT, other than through an independent contractor from whom the REIT itself does not derive or receive any income or a TRS.
|
Colony Credit may acquire properties as a result of foreclosure or otherwise reducing the property to ownership when default has occurred or is imminent and may make foreclosure property elections with respect to some or all of those properties if such election is available (which may not be the case with respect to acquired “distressed loans”).
Cash/Income Differences/Phantom Income
Due to the nature of the assets in which Colony Credit invests, Colony Credit may be required to recognize taxable income from those assets in advance of its receipt of cash flow on or proceeds from disposition of such assets, and may be required to report taxable income in early periods that exceeds the economic income ultimately realized on such assets.
Colony Credit may acquire debt instruments in the secondary market for less than their face amount. The amount of such discount generally will be treated as “market discount” for U.S. federal income tax purposes. Colony Credit may elect to include in taxable income accrued market discount as it accrues rather than as it is realized for economic purposes, resulting in phantom income. Principal payments on certain loans are made monthly, and consequently accrued market discount may have to be included in income each month as if the debt instrument were assured of ultimately being collected in full. If Colony Credit collects less on the debt instrument than its purchase price plus the market discount it had previously reported as income, it may not be able to benefit from any offsetting loss deductions.
Colony Credit may acquire mortgage-backed securities that have been issued with original issue discount. In general, Colony Credit will be required to accrue original issue discount based on the constant yield to maturity of the mortgage-backed security, and to treat it as taxable income in accordance with applicable U.S. federal income tax rules even though smaller or no cash payments are received on such debt instrument. As in the case of the market discount discussed in the preceding paragraph, the constant yield in question will be determined and Colony Credit will be taxed based on the assumption that all future payments due on the mortgage-backed security in question will be made. If all payments on the mortgage-backed securities are not made, Colony Credit may not be able to benefit from any offsetting loss deductions.
In addition, pursuant to its investment strategy, Colony Credit may acquire distressed debt instruments and subsequently modify such instruments by agreement with the borrower. If the amendments to the outstanding debt are “significant modifications” under the applicable Treasury Regulations, the modified debt may be considered to have been reissued to Colony Credit in a debt-for-debt exchange with the borrower. In that event, Colony Credit may be required to recognize income to the extent the principal amount of the modified debt exceeds its adjusted tax basis in the unmodified debt, and would hold the modified loan with a cost basis equal to its principal amount for U.S. federal tax purposes. To the extent that such modifications are made with respect to a debt instrument held by a TRS treated as a dealer, as described above, such a TRS would be required at the end of each taxable year, including the taxable year in which such modification was made, to mark the modified debt instrument to its fair market value as if the debt instrument were sold. In that case, the TRS generally would recognize a loss at the end of the taxable year in which the modifications were made to the extent the fair market value of such debt instrument were less than its principal amount after the modification.
In addition, in the event that any debt instruments or mortgage-backed securities acquired by Colony Credit are delinquent as to mandatory principal and interest payments, or in the event payments with respect to a particular debt instrument are not made when due, Colony Credit may nonetheless be required to continue to recognize the unpaid interest as taxable income. Similarly, Colony Credit may be required to accrue interest income with respect to subordinate mortgage-backed securities at the stated rate regardless of whether corresponding cash payments are received.
Colony Credit may also be required under the terms of indebtedness that it incurs to private lenders or otherwise to use cash received from interest payments to make principal payments on that indebtedness, with the effect of recognizing income but not having a corresponding amount of cash available for distribution to holders of its securities.
Due to each of these potential timing differences between income recognition or expense deduction and cash receipts or disbursements, there is a significant risk that Colony Credit may have substantial taxable income in excess of cash available for
91
distribution. In that event, Colony Credit may need to borrow funds or take other action to satisfy the REIT distribution requirements for the taxable year in which this “phantom income” is recognized. Refer below to the section entitled “-Distribution Requirements.”
Failure to Satisfy the Gross Income Tests
If Colony Credit fails to satisfy one or both of the gross income tests for any taxable year, it nevertheless may qualify as a REIT for that year if it qualifies for relief under certain provisions of the U.S. federal income tax laws. Those relief provisions are available if:
|
•
|
Colony Credit’s failure to meet those tests is due to reasonable cause and not to willful neglect; and
|
|
•
|
following such failure for any taxable year, Colony Credit files a schedule of the sources of its income with the IRS.
|
Colony Credit cannot predict, however, whether in all circumstances it would qualify for the relief provisions. In addition, as discussed above in the section entitled “-Taxation of Colony Credit Real Estate, Inc.” even if the relief provisions apply, Colony Credit would incur a 100% tax on the gross income attributable to the greater of the amount by which it fails the 75% or 95% gross income test, in each case, multiplied by a fraction intended to reflect its profitability.
Asset Tests
To qualify as a REIT, Colony Credit also must satisfy the following asset tests at the end of each quarter of each taxable year. First, at least 75% of the value of its total assets must consist of:
|
•
|
cash or cash items, including certain receivables and money market funds;
|
|
•
|
government securities;
|
|
•
|
interests in real property, including leaseholds, options to acquire real property and leaseholds, and personal property to the extent such personal property is leased in connection with real property and rents attributable to such personal property are treated as “rents from real property”;
|
|
•
|
interests in mortgage loans secured by real property;
|
|
•
|
stock in other REITs and debt instruments issued by “publicly offered REITs”;
|
|
•
|
investments in stock or debt instruments during the one-year period following Colony Credit’s receipt of new capital that it raises through equity offerings or public offerings of debt with at least a five-year term; and
|
|
•
|
regular or residual interests in a REMIC. However, if less than 95% of the assets of a REMIC consist of assets that are qualifying real estate-related assets under the U.S. federal income tax laws, determined as if Colony Credit held such assets, Colony Credit will be treated as holding directly its proportionate share of the assets of such REMIC.
|
Second, of Colony Credit’s investments not included in the 75% asset class, the value of its interest in any one issuer’s securities may not exceed 5% of the value of its total assets, or the 5% asset test.
Third, of Colony Credit’s investments not included in the 75% asset class, it may not own more than 10% of the voting power or value of any one issuer’s outstanding securities, or the 10% vote or value test.
Fourth, no more than 20% of the value of Colony Credit’s total assets may consist of the securities of one or more TRSs.
Fifth, no more than 25% of the value of Colony Credit’s total assets may consist of securities that are not qualifying assets for purposes of the 75% asset test described above, or the 25% securities test.
Sixth, no more than 25% of the value of Colony Credit’s total assets may consist of debt instruments issued by “publicly offered REITs” to the extent such debt instruments are not secured by real property or interests in real property.
For purposes of the 5% asset test, the 10% vote or value test and the 25% securities test, the term “securities” does not include stock in another REIT, debt of a “publicly offered REIT,” equity or debt securities of a QRS or, in the case of the 5% asset test and 10% vote or value test, TRS debt or equity, mortgage loans or mortgage-backed securities that constitute real estate assets, or equity interests in a partnership. The term “securities,” however, generally includes debt securities issued by a partnership or another REIT (other than a “publicly offered REIT”), except, for purposes of the 10% value test, the term “securities” does not include:
|
•
|
“Straight debt” securities, which is defined as a written unconditional promise to pay on demand or on a specified date a sum certain in money if: (i) the debt is not convertible, directly or indirectly, into equity; and (ii) the interest rate and interest payment dates are not contingent on profits, the borrower’s discretion, or similar factors. “Straight debt” securities
|
92
do not include any securities issued by a partnership or a corporation in which Colony Credit or any TRS in which Colony Credit owns more than 50% of the voting power or value of the shares hold non-“straight debt” securities that have an aggregate value of more than 1% of the issuer’s outstanding securities. However, “straight debt” securities include debt subject to the following contingencies:
|
•
|
a contingency relating to the time of payment of interest or principal, as long as either: (i) there is no change to the effective yield of the debt obligation, other than a change to the annual yield that does not exceed the greater of 0.25% or 5% of the annual yield; or (ii) neither the aggregate issue price nor the aggregate face amount of the issuer’s debt obligations held by Colony Credit exceeds $1 million and no more than 12 months of unaccrued interest on the debt obligations can be required to be prepaid; and
|
|
•
|
a contingency relating to the time or amount of payment upon a default or prepayment of a debt obligation, as long as the contingency is consistent with customary commercial practice.
|
|
•
|
Any loan to an individual or an estate;
|
|
•
|
Any “section 467 rental agreement” other than an agreement with a related party tenant;
|
|
•
|
Any obligation to pay “rents from real property”;
|
|
•
|
Certain securities issued by governmental entities;
|
|
•
|
Any security issued by a REIT;
|
|
•
|
Any debt instrument issued by an entity treated as a partnership for U.S. federal income tax purposes in which Colony Credit is a partner to the extent of its proportionate interest in the equity and debt securities of the partnership; and
|
|
•
|
Any debt instrument issued by an entity treated as a partnership for U.S. federal income tax purposes not described in the preceding bullet points if at least 75% of the partnership’s gross income, excluding income from prohibited transactions, is qualifying income for purposes of the 75% gross income test described above in the section entitled “-Gross Income Tests.”
|
For purposes of the 10% value test, Colony Credit’s proportionate share of the assets of a partnership is its proportionate interest in any securities issued by the partnership, without regard to the securities described in the last two bullet points above.
Colony Credit’s holdings of securities and other assets have complied, and will continue to comply, with the foregoing asset tests, and Colony Credit intends to monitor its compliance on an ongoing basis. However, independent appraisals have not been obtained to support Colony Credit’s conclusions as to the value of its assets or the value of any particular security or securities. Moreover, values of some assets, including instruments issued in collateralized debt obligation transactions, may not be susceptible to a precise determination, and values are subject to change in the future.
Furthermore, the proper classification of an instrument as debt or equity for U.S. federal income tax purposes may be uncertain in some circumstances, which could affect the application of the asset tests. Accordingly, there can be no assurance that the IRS will not contend that Colony Credit’s interests in its subsidiaries or in the securities of other issuers will not cause a violation of the asset tests.
As described above, Revenue Procedure 2003-65 provides a safe harbor pursuant to which certain mezzanine loans secured by a first priority security interest in ownership interests in a partnership or limited liability company will be treated as qualifying assets for purposes of the 75% asset test (and therefore, are not subject to the 5% asset test and the 10% vote or value test). Refer to the section entitled “-Gross Income Tests.” Colony Credit expects that some of its mezzanine loans may not qualify for that safe harbor. To the extent that Colony Credit determines that a mezzanine loan likely would not qualify for the safe harbor and also would not be excluded from the definition of securities for purposes of the 10% vote or value test or could cause Colony Credit not to satisfy the 75% or 5% assets tests, it would hold that mezzanine loan through a TRS.
Colony Credit owns stock in several REITS and expects to invest in the stock of other entities that intend to qualify as REITs in the future. Colony Credit believes that any stock that it has acquired or will acquire in other REITs has been, or will be, qualifying assets for purposes of the 75% asset test. If a REIT in which Colony Credit owns stock fails to qualify as a REIT in any year, however, the stock in such REIT will not be a qualifying asset for purposes of the 75% asset test. Instead, Colony Credit would be subject to the 5% asset test, the 10% vote or value test and the 25% securities test described above with respect to its investment in such a disqualified REIT. Consequently, if a REIT in which Colony Credit owns stock fails to qualify as a REIT, Colony Credit could fail one or more of the asset tests described above. To the extent Colony Credit invests in other REITs, it intends to do so in a manner that will enable it to continue to satisfy the REIT asset tests.
93
As discussed above in the section entitled “-Gross Income Tests,” Colony Credit and its subsidiaries may invest in distressed mortgage loans. In general, under the applicable Treasury Regulations, if a loan is secured by real property and other property and the highest principal amount of the loan outstanding during a taxable year exceeds the fair market value of the real property securing the loan as of: (i) the date Colony Credit agreed to acquire or originate the loan; or (ii) in the event of a significant modification, the date Colony Credit modified the loan, then a portion of the interest income from such a loan will not be qualifying income for purposes of the 75% gross income test but will be qualifying income for purposes of the 95% gross income test. Although the law is not entirely clear, a portion of the loan will also likely be a non-qualifying asset for purposes of the 75% asset test. The non-qualifying portion of such a loan would be subject to, among other requirements, the 10% vote or value test. IRS Revenue Procedure 2014-51 provides a safe harbor under which the IRS has stated that it will not challenge a REIT’s treatment of a loan as being, in part, a qualifying real estate asset in an amount equal to the lesser of: (i) the fair market value of the loan on the relevant quarterly REIT asset testing date; or (ii) the greater of (A) the fair market value of the real property securing the loan on the relevant quarterly REIT asset testing date or (B) the fair market value of the real property securing the loan determined as of the date the REIT committed to originate or acquire the loan. It is unclear how the safe harbor in Revenue Procedure 2014-51 is affected by the recent legislative changes regarding the treatment of loans secured by both real property and personal property where the fair market value of the personal property does not exceed 15% of the sum of the fair market values of the real property and the personal property securing the loan. There can be no assurance that later interpretations of or any clarifications to this Revenue Procedure will be consistent with how Colony Credit currently is applying it to its REIT compliance analysis. Colony Credit intends to invest in distressed mortgage loans in a manner consistent with qualifying as a REIT.
Also as discussed above, Colony Credit intends to invest in agency securities that are pass-through certificates. Colony Credit expects that the agency securities will be treated either as interests in grantor trusts or as interests in REMICs for U.S. federal income tax purposes. In the case of agency securities treated as interests in grantor trusts, Colony Credit would be treated as owning an undivided beneficial ownership interest in the mortgage loans held by the grantor trust. Such mortgage loans generally will qualify as real estate assets to the extent that they are secured by real property. Colony Credit expects that substantially all of its agency securities treated as interests in a grantor trust will qualify as real estate assets. In the case of agency securities treated as interests in a REMIC, such interests generally will qualify as real estate assets. If less than 95% of the assets of a REMIC are real estate assets, however, then only a proportionate part of Colony Credit’s interest in the REMIC will qualify as a real estate asset. To the extent that Colony Credit holds mortgage participations or mortgage-backed securities that do not represent interests in a grantor trust or REMIC interests, such assets may not qualify as real estate assets depending upon the circumstances and the specific structure of the investment.
Failure to Satisfy the Asset Tests
Colony Credit has monitored, and will continue to monitor, the status of its assets for purposes of the various asset tests. If Colony Credit fails to satisfy the asset tests at the end of a calendar quarter, it will not lose its REIT qualification if:
|
•
|
Colony Credit satisfied the asset tests at the end of the preceding calendar quarter; and
|
|
•
|
the discrepancy between the value of Colony Credit’s assets and the asset test requirements arose from changes in the market values of its assets and was not wholly or partly caused by the acquisition of one or more non-qualifying assets.
|
If Colony Credit does not satisfy the condition described in the second item, above, it still could avoid disqualification by eliminating any discrepancy within 30 days after the close of the calendar quarter in which it arose.
If at the end of any calendar quarter Colony Credit violates the 5% asset test or the 10% vote or value test described above, it will not lose its REIT qualification if: (i) the failure is de minimis (up to the lesser of 1% of its assets or $10 million); and (ii) it disposes of assets causing the failure or otherwise complies with the asset tests within six months after the last day of the quarter in which it identifies such failure. In the event of a failure of any of the asset tests (other than de minimis failures described in the preceding sentence), as long as the failure was due to reasonable cause and not to willful neglect, Colony Credit will not lose its REIT status if it: (i) disposes of assets or otherwise complies with the asset tests within six months after the last day of the quarter in which it identifies the failure; (ii) it files a description of each asset causing the failure with the IRS; and (iii) pays a tax equal to the greater of $50,000 or 35% of the net income from the non-qualifying assets during the period in which Colony Credit failed to satisfy the asset tests.
Distribution Requirements
Each taxable year, Colony Credit must distribute dividends, other than capital gain dividends and deemed distributions of retained capital gain, to our holders in an aggregate amount at least equal to the sum of:
|
•
|
90% of its “REIT taxable income,” computed without regard to the dividends paid deduction and its net capital gain or loss; and
|
94
|
•
|
90% of its after-tax net income, if any, from foreclosure property; minus
|
|
•
|
the sum of certain items of non-cash income.
|
Generally, Colony Credit must pay such distributions in the taxable year to which they relate, or in the following taxable year if: (i) Colony Credit declares the distribution before it timely files its U.S. federal income tax return for the year and pays the distribution on or before the first regular dividend payment date after such declaration; or (ii) Colony Credit declares the distribution in October, November or December of the taxable year, payable to holders of record on a specified day in any such month, and it actually pays the dividend before the end of January of the following year. The distributions under clause (i) are taxable to the holders in the year in which paid and the distributions in clause (ii) are treated as paid on December 31 of the prior taxable year in which they were declared. In both instances, these distributions relate to Colony Credit’s prior taxable year for purposes of the 90% distribution requirement.
Unless Colony Credit qualifies as a “publicly offered REIT,” in order for its distributions to be counted as satisfying the annual distribution requirement for REITs and to provide it with the REIT-level tax deduction, such distributions must not have been “preferential dividends.” A dividend is not a preferential dividend if that distribution is: (i) pro rata among all outstanding shares within a particular class; and (ii) in accordance with the preferences among different classes of stock as set forth in Colony Credit’s organizational documents. Colony Credit believes that it qualifies as “publicly offered REIT,” and so long as it qualifies as a “publicly offered REIT,” the preferential dividend rule will not apply to it.
Colony Credit will pay U.S. federal income tax on taxable income, including net capital gain, that it does not distribute to holders. Furthermore, if Colony Credit fails to distribute during a calendar year, or by the end of January following the calendar year in the case of distributions with declaration and record dates falling in the last three months of the calendar year, at least the sum of:
|
•
|
85% of its REIT ordinary income for such year;
|
|
•
|
95% of its REIT capital gain income for such year; and
|
|
•
|
any undistributed taxable income from prior periods,
|
Colony Credit will incur a 4% nondeductible excise tax on the excess of such required distribution over the amounts it actually distributes and the amounts of income retained on which Colony Credit has paid corporate income tax.
Colony Credit may elect to retain and pay income tax on the net long-term capital gain it receives in a taxable year. If Colony Credit so elects, it will be treated as having distributed any such retained amount for purposes of the 4% nondeductible excise tax described above. Colony Credit intends to make timely distributions sufficient to satisfy the annual distribution requirements and to avoid corporate income tax and the 4% nondeductible excise tax.
It is possible that, from time to time, Colony Credit may experience timing differences between the actual receipt of income and/or payment of deductible expenses and the inclusion of that income or deduction in arriving at its REIT taxable income. Refer to, for example, the discussion of excess inclusion income above in the section entitled “-Requirements for Qualification-Taxable Mortgage Pools.” Other potential sources of non-cash taxable income include gain recognized on the deemed exchange of distressed debt that has been modified, real estate and securities that have been financed through securitization structures, such as the collateralized debt obligation structure, which require some or all of available cash flow to be used to service borrowings, loans or mortgage-backed securities that Colony Credit holds that have been issued at a discount and require the accrual of taxable economic interest in advance of its receipt in cash and distressed loans on which Colony Credit may be required to accrue taxable interest income even though the borrower is unable to make current servicing payments in cash. Furthermore, under amendments to Section 451 of the Code made by H.R. 1, subject to certain exceptions, Colony Credit must accrue income for U.S. federal income tax purposes no later than when such income is taken into account as revenue in our financial statements, which could create additional differences between REIT taxable income and the receipt of cash attributable to such income. In addition, Section 162(m) of the Code places a per-employee limit of $1 million on the amount of compensation that a publicly held corporation may deduct in any one year with respect to its chief executive officer and certain other highly compensated executive officers. Recent changes to Section 162(m) made by H.R. 1 eliminated an exception that formerly permitted certain performance-based compensation to be deducted even if in excess of $1 million, which may have the effect of increasing our REIT taxable income. In the event that such timing differences occur, it might be necessary to arrange borrowings or other means of raising capital to meet the distribution requirements. Additionally, Colony Credit may, if possible, pay taxable dividends of our stock or debt to meet the distribution requirements.
The IRS recently issued Revenue Procedure 2017-45, authorizing elective stock dividends to be made by public REITs. Pursuant to this revenue procedure, effective for distributions declared on or after August 11, 2017, the IRS will treat the distribution of stock pursuant to an elective stock dividend as a distribution of property under Section 301 of the Code (i.e., as a dividend to the
95
extent of our earnings and profits), as long as at least 20% of the total dividend is available in cash and certain other requirements outlined in the revenue procedure are met.
Under certain circumstances, Colony Credit may be able to correct a failure to meet the distribution requirement for a year by paying “deficiency dividends” to our holders in a later year. Colony Credit may include such deficiency dividends in its deduction for dividends paid for the earlier year. Although Colony Credit may be able to avoid income tax on amounts distributed as deficiency dividends, it will be required to pay interest to the IRS based upon the amount of any deduction it takes for deficiency dividends.
In addition, a REIT is required to distribute all accumulated earnings and profits attributable to non-REIT years by the close of its first taxable year in which it has non-REIT earnings and profits to distribute.
New Interest Deduction Limitation Enacted by H.R. 1
Commencing in taxable years beginning after
December 31, 2017
, Section 163(j) of the Code, as amended by H.R. 1, limits the deductibility of net interest expense paid or accrued on debt properly allocable to a trade or business to 30% of “adjusted taxable income,” subject to certain exceptions. Any deduction in excess of the limitation is carried forward and may be used in a subsequent year, subject to the 30% limitation. Adjusted taxable income is determined without regard to certain deductions, including those for net interest expense, net operating loss carryforwards and, for taxable years beginning before January 1, 2022, depreciation, amortization and depletion. Provided the taxpayer makes a timely election (which is irrevocable), the 30% limitation does not apply to a trade or business involving real property development, redevelopment, construction, reconstruction, rental, operation, acquisition, conversion, disposition, management, leasing or brokerage, within the meaning of Section 469(c)(7)(C) of the Code. If this election is made, depreciable real property (including certain improvements) held by the relevant trade or business must be depreciated under the alternative depreciation system under the Code, which is generally less favorable than the generally applicable system of depreciation under the Code. If Colony Credit does not make the election or if the election is determined not to be available with respect to all or certain of our business activities, the new interest deduction limitation could result in us having more REIT taxable income and thus increase the amount of distributions Colony Credit must make to comply with the REIT requirements and avoid incurring corporate level tax. Similarly, the limitation could cause Colony Credit’s TRSs to have greater taxable income and thus potentially greater corporate tax liability.
Recordkeeping Requirements
Colony Credit is required to maintain certain records under the REIT rules. In addition, to avoid a monetary penalty, Colony Credit must request on an annual basis information from our holders designed to disclose the actual ownership of its outstanding shares of beneficial interest. Colony Credit intends to continue to comply with these requirements.
Foreign Investments
Colony Credit and its subsidiaries have acquired, and expect to acquire in the future, investments in foreign countries that will require it to pay taxes to foreign countries. Taxes that Colony Credit pays in foreign jurisdictions may not be passed through to, or used by, our holders as a foreign tax credit or otherwise. Colony Credit could be subject to U.S. federal income tax rules intended to prevent or minimize the value of the deferral of the recognition by it of passive-type income of foreign entities in which it owns a direct or indirect interest. As a result, Colony Credit could be required to recognize taxable income for U.S. federal income tax purposes prior to receiving cash distributions with respect to that income or, in certain circumstances, pay an interest charge on U.S. federal income tax that it is deemed to have deferred. Colony Credit’s foreign investments might also generate foreign currency gains and losses. Certain foreign currency gains may be excluded from gross income for purposes of one or both of the gross income tests, as discussed above. Refer above to the section entitled “-Requirements for Qualification-Gross Income Tests.”
Failure to Qualify
If Colony Credit fails to satisfy one or more requirements for REIT qualification, other than the gross income tests and the asset tests, it could avoid disqualification if its failure is due to reasonable cause and not to willful neglect and Colony Credit pays a penalty of $50,000 for each such failure. In addition, there are relief provisions for a failure of the gross income tests and asset tests, as described in the sections entitled “-Gross Income Tests-Failure to Satisfy the Gross Income Tests” and “-Asset Tests-Failure to Satisfy the Asset Tests.”
If Colony Credit fails to qualify as a REIT in any taxable year, and no relief provision applies, it would be subject to U.S. federal income tax on its taxable income at regular corporate rates. In calculating its taxable income in a year in which it fails to qualify as a REIT, Colony Credit would not be able to deduct amounts paid out to holders. In fact, Colony Credit would not be required to distribute any amounts to holders in that year. In such event, to the extent of Colony Credit’s current and accumulated earnings and profits, distributions to most holders taxed at individual rates would generally be taxable at capital gains tax rates. For taxable years beginning after
December 31, 2017
, and before January 1, 2026, generally U.S. holders that are individuals, trusts or estates may deduct 20% of the aggregate amount of ordinary dividends distributed by us, subject to certain limitations. Alternatively,
96
such dividends paid to U.S. holders that are individuals, trusts and estates may be taxable at the preferential income tax rates (i.e., the 20% maximum U.S. federal rate) for qualified dividends. In addition, subject to the limitations of the Code, corporate distributees may be eligible for the dividends-received deduction.
Unless Colony Credit qualified for relief under specific statutory provisions, it also would be disqualified from taxation as a REIT for the four taxable years following the year during which it ceased to qualify as a REIT. Colony Credit cannot predict whether in all circumstances it would qualify for such statutory relief.
Taxation of Holders of Class A Common Stock
Taxation of Taxable U.S. Holders.
The following is a summary of certain U.S. federal income tax considerations related to the ownership and disposition of stock applicable to U.S. holders
.
Taxation of U.S. Holders on Distributions on Our Stock
As long as Colony Credit qualifies as a REIT, a taxable U.S. holder must generally take into account as ordinary income distributions made out of Colony Credit’s current or accumulated earnings and profits that Colony Credit does not designate as capital gain dividends or retained long-term capital gain. However, for tax years prior to 2026, generally U.S. holders that are individuals, trusts or estates may deduct 20% of the aggregate amount of ordinary dividends distributed by Colony Credit, subject to certain limitations. For purposes of determining whether a distribution is made out of its current or accumulated earnings and profits, Colony Credit’s earnings and profits will be allocated first to its preferred stock dividends and then to its common stock dividends.
Dividends paid to U.S. holders will not qualify for the dividends-received deduction generally available to corporations. In addition, dividends paid to a U.S. holder generally will not qualify for the 20% tax rate for qualified dividend income. The maximum tax rate for qualified dividend income is 20%. Qualified dividend income generally includes dividends paid to U.S. holders taxed at individual rates by domestic C corporations and certain qualified foreign corporations. Because Colony Credit will not generally be subject to U.S. federal income tax on the portion of its REIT taxable income distributed to Colony Credit’s holders (refer above to the section entitled “-Taxation of Colony Credit Real Estate, Inc.”), its dividends generally will not be eligible for the 20% rate on qualified dividend income. As a result, Colony Credit’s ordinary REIT dividends will be taxed at the higher tax rate applicable to ordinary income, which is currently a maximum rate of 37%. However, the 20% tax rate for qualified dividend income will apply to Colony Credit’s ordinary REIT dividends to the extent attributable: (i) to income retained by it in a prior non-REIT taxable year in which it or a predecessor was subject to corporate income tax (less the amount of tax); (ii) to dividends received by it from non-REIT corporations, such as domestic TRSs; and (iii) to the extent attributable to income upon which it has paid corporate income tax (e.g., to the extent that Colony Credit distributes less than 100% of its net taxable income). In general, to qualify for the reduced tax rate on qualified dividend income, a holder must hold Colony Credit’s stock for more than 60 days during the 121-day period beginning on the date that is 60 days before the date on which Colony Credit’s stock becomes ex-dividend. In addition, dividends paid to certain individuals, trusts and estates whose income exceeds certain thresholds are subject to a 3.8% Medicare tax.
A U.S. holder generally will take into account as long-term capital gain any distributions that Colony Credit designates as capital gain dividends without regard to the period for which the U.S. holder has held Colony Credit’s stock. Colony Credit generally will designate its capital gain dividends as either 20% or 25% rate distributions. Refer below to the section entitled “-Capital Gains and Losses.” A corporate U.S. holder, however, may be required to treat up to 20% of certain capital gain dividends as ordinary income.
Colony Credit may elect to retain and pay income tax on the net long-term capital gain that it receives in a taxable year. In that case, to the extent that Colony Credit designates such amount in a timely notice to such holder, a U.S. holder would be treated as receiving its proportionate share of Colony Credit’s undistributed long-term capital gain and would receive a credit for its proportionate share of the tax Colony Credit paid. The U.S. holder would increase the basis in its stock by the amount of its proportionate share of Colony Credit’s undistributed long-term capital gain, minus its share of the tax Colony Credit paid.
To the extent that Colony Credit makes a distribution in excess of its current and accumulated earnings and profits, such distribution will not be taxable to a U.S. holder to the extent that it does not exceed the adjusted tax basis of the U.S. holder’s stock. Instead, such distribution will reduce the adjusted tax basis of such stock. To the extent that Colony Credit makes a distribution in excess of both its current and accumulated earnings and profits and the U.S. holder’s adjusted tax basis in its stock, such holder will recognize long-term capital gain or short-term capital gain if the stock has been held for one year or less, assuming the stock is a capital asset in the hands of the U.S. holder. In addition, if Colony Credit declares a distribution in October, November or December of any year that is payable to a U.S. holder of record on a specified date in any such month, such distribution shall be treated as both paid by Colony Credit and received by the U.S. holder on December 31 of such year, provided that Colony Credit actually pays the distribution during January of the following calendar year.
97
Holders may not include in their individual income tax returns any of Colony Credit’s net operating losses or capital losses. Instead, Colony Credit would carry over such losses for potential offset against Colony Credit’s future income. Under amendments made by H.R. 1 to Section 172 of the Code, Colony Credit’s deduction for any net operating loss carryforwards arising from losses it sustains in taxable years beginning after
December 31, 2017
, is limited to 80% of its REIT taxable income (determined without regard to the deduction for dividends paid), and any unused portion of losses arising in taxable years ending after December 31, 2017, may not be carried back, but may be carried forward indefinitely.
Taxable distributions from Colony Credit and gain from the disposition of Colony Credit’s stock will not be treated as passive activity income, and, therefore, holders generally will not be able to apply any “passive activity losses,” such as losses from certain types of limited partnerships in which the holder is a limited partner, against such income. In addition, taxable distributions from Colony Credit and gain from the disposition of Colony Credit’s stock generally may be treated as investment income for purposes of the investment interest limitations (although any capital gains so treated will not qualify for the lower 20% tax rate applicable to capital gains of U.S. holders taxed at individual rates). Colony Credit will notify holders after the close of Colony Credit’s taxable year as to the portions of its distributions attributable to that year that constitute ordinary income, return of capital and capital gain.
If excess inclusion income from a TMP or REMIC residual interest is allocated to any U.S. holder, that income will be taxable in the hands of the U.S. holder and would not be offset by any net operating losses of the U.S. holder that would otherwise be available. Refer to the section entitled “-Requirements for Qualification-Taxable Mortgage Pools.” As required by IRS guidance, Colony Credit intends to notify its U.S. holders if a portion of a dividend paid by it is attributable to excess inclusion income.
Taxation of U.S. Holders on the Disposition of Colony Credit’s Stock
In general, a U.S. holder will realize gain or loss upon the sale, redemption or other taxable disposition of Colony Credit’s stock in an amount equal to the difference between the sum of the fair market value of any property and the amount of cash received in such disposition and the U.S. holder’s adjusted tax basis in the common stock at the time of the disposition. In general, a U.S. holder who is not a dealer in securities must treat any gain or loss realized upon a taxable disposition of Colony Credit’s stock as long-term capital gain or loss if the U.S. holder has held the stock for more than one year and otherwise as short-term capital gain or loss. However, a U.S. holder must treat any loss upon a sale or exchange of stock held by such holder for six months or less as a long-term capital loss to the extent of any actual or deemed distributions from Colony Credit that such U.S. holder previously has characterized as long-term capital gain. All or a portion of any loss that a U.S. holder realizes upon a taxable disposition of the stock may be disallowed if the U.S. holder purchases other substantially identical shares of Colony Credit’s stock within 30 days before or after the disposition (in which case, the basis of the shares acquired would be adjusted to reflect the disallowed loss).
Capital Gains and Losses
A taxpayer generally must hold a capital asset for more than one year for gain or loss derived from its sale or exchange to be treated as long-term capital gain or loss. The highest marginal individual income tax rate is currently 37%. However, the maximum tax rate on long-term capital gain applicable to U.S. holders taxed at individual rates is 20%. The maximum tax rate on long-term capital gain from the sale or exchange of “Section 1250 property,” or depreciable real property, is 25% computed on the lesser of the total amount of the gain or the accumulated Section 1250 depreciation. In addition, capital gains recognized by certain individuals, trusts and estates whose income exceeds certain thresholds are subject to a 3.8% Medicare tax. With respect to distributions that Colony Credit designates as capital gain dividends and any retained capital gain that it is deemed to distribute, Colony Credit generally may designate whether such a distribution is taxable to its U.S. holders taxed at individual rates at a 20% or 25% rate. Thus, the tax rate differential between capital gain and ordinary income for those taxpayers may be significant. In addition, the characterization of income as capital gain or ordinary income may affect the deductibility of capital losses. A non-corporate taxpayer may deduct capital losses not offset by capital gains against its ordinary income only up to a maximum annual amount of $3,000. A non-corporate taxpayer may carry forward unused capital losses indefinitely. A corporate taxpayer must pay tax on its net capital gain at ordinary corporate rates. A corporate taxpayer may deduct capital losses only to the extent of capital gains, with unused losses being carried back three years and forward five years.
Expansion of Medicare Tax
The Health Care and Reconciliation Act of 2010 requires that, in certain circumstances, certain U.S. holders that are individuals, estates, and trusts pay a 3.8% tax on “net investment income,” which includes, among other things, dividends on and gains from the sale or other disposition of REIT shares. The temporary 20% deduction allowed by Section 199A of the Code, as added by H.R. 1, with respect to ordinary REIT dividends received by non-corporate taxpayers is allowed only for purposes of Chapter 1 of the Code and thus is apparently not allowed as a deduction allocable to such dividends for purposes of determining the amount of net investment income subject to the 3.8% Medicare tax, which is imposed under Chapter 2A of the Code. Prospective investors should consult their own tax advisors regarding this legislation.
98
Taxation of Tax-Exempt Holders
Tax-exempt entities, including qualified employee pension and profit-sharing trusts and individual retirement accounts and annuities, generally are exempt from U.S. federal income taxation. However, they are subject to taxation on their unrelated business taxable income, or UBTI. While many investments in real estate generate UBTI, the IRS has issued a published ruling that dividend distributions from a REIT to an exempt employee pension trust do not constitute UBTI, provided that the exempt employee pension trust does not otherwise use the shares of the REIT in an unrelated trade or business of the pension trust. Based on that ruling, amounts that Colony Credit distributes to tax-exempt holders generally should not constitute UBTI. However, if a tax-exempt holder were to finance its investment in Colony Credit’s stock with debt, a portion of the income that it receives from Colony Credit would constitute UBTI pursuant to the “debt-financed property” rules. In addition, Colony Credit’s dividends that are attributable to excess inclusion income will constitute UBTI in the hands of most tax-exempt holders. Refer to the section entitled “-Requirements for Qualification-Taxable Mortgage Pools.” Furthermore, social clubs, voluntary employee benefit associations, supplemental unemployment benefit trusts and qualified group legal services plans that are exempt from taxation under special provisions of the U.S. federal income tax laws are subject to different UBTI rules, which generally will require them to characterize distributions that they receive from Colony Credit as UBTI. Finally, in certain circumstances, a qualified employee pension or profit-sharing trust that owns more than 10% of Colony Credit’s stock is required to treat a percentage of the dividends that it receives from Colony Credit as UBTI if Colony Credit is a “pension-held REIT.” Such percentage is equal to the gross income that Colony Credit derives from an unrelated trade or business, determined as if Colony Credit were a pension trust, divided by Colony Credit’s total gross income for the year in which Colony Credit pays the dividends. That rule applies to a pension trust holding more than 10% of Colony Credit’s stock only if:
|
•
|
the percentage of Colony Credit’s dividends that the tax-exempt trust would be required to treat as UBTI is at least 5%;
|
|
•
|
Colony Credit qualifies as a REIT by reason of the modification of the rule requiring that no more than 50% of Colony Credit’s stock be owned by five or fewer individuals that allows the beneficiaries of the pension trust to be treated as holding Colony Credit’s stock in proportion to its actuarial interests in the pension trust (refer to the section entitled “-Requirements for Qualification”); and
|
|
•
|
either: (i) one pension trust owns more than 25% of the value of Colony Credit’s stock; or (ii) a group of pension trusts individually holding more than 10% of the value of Colony Credit’s stock collectively owns more than 50% of the value of Colony Credit’s stock.
|
Taxation of Non-U.S. Holders
The rules governing U.S. federal income taxation of non-U.S. holders of stock are complex. This section is only a summary of such rules. Non-U.S. holders are urged to consult their tax advisors to determine the impact of U.S. federal, state, local and foreign income tax laws on the ownership of Colony Credit’s stock, including any reporting requirements.
A non-U.S. holder that receives a distribution that is not attributable to gain from Colony Credit’s sale or exchange of a USRPI, and that Colony Credit does not designate as a capital gain dividend or retained capital gain, will recognize ordinary income to the extent that Colony Credit pays such distribution out of its current or accumulated earnings and profits. A withholding tax equal to 30% of the gross amount of the distribution ordinarily will apply to such distribution unless an applicable tax treaty reduces or eliminates the tax. Colony Credit’s dividends that are attributable to excess inclusion income will be subject to the 30% withholding tax, without reduction for any otherwise applicable income tax treaty. Refer to the section entitled “-Requirements for Qualification-Taxable Mortgage Pools.” If a distribution is treated as effectively connected with the non-U.S. holder’s conduct of a U.S. trade or business, the non-U.S. holder generally will be subject to U.S. federal income tax on the distribution at graduated rates, in the same manner as U.S. holders are taxed with respect to such distribution, and a non-U.S. holder that is a corporation also may be subject to the 30% branch profits tax with respect to the distribution. Colony Credit plans to withhold U.S. income tax at the rate of 30% on the gross amount of any such distribution paid to a non-U.S. holder unless either:
|
•
|
a lower treaty rate applies and the non-U.S. holder provides an IRS Form W-8BEN or W-8BEN-E to Colony Credit evidencing eligibility for that reduced rate; or
|
|
•
|
the non-U.S. holder files an IRS Form W-8ECI with Colony Credit claiming that the distribution is effectively connected income.
|
A non-U.S. holder will not incur tax on a distribution in excess of Colony Credit’s current and accumulated earnings and profits if the excess portion of such distribution does not exceed the holder’s adjusted basis of its stock. Instead, the excess portion of such distribution will reduce the adjusted basis of such stock. A non-U.S. holder will be subject to tax on a distribution that exceeds both Colony Credit’s current and accumulated earnings and profits and the holder’s adjusted basis of its stock, if the non-U.S. holder otherwise would be subject to tax on gain from the sale or disposition of its stock, as described below. Because Colony Credit generally cannot determine at the time it makes a distribution whether the distribution will exceed its current and accumulated
99
earnings and profits, Colony Credit normally will withhold tax on the entire amount of any distribution at the same rate as it would withhold on a dividend. However, a non-U.S. holder may claim a refund of amounts that Colony Credit withholds if Colony Credit later determines that a distribution in fact exceeded Colony Credit’s current and accumulated earnings and profits.
If Colony Credit is treated as a “United States real property holding corporation,” as described below, it will be required to withhold 15% of any distribution that exceeds its current and accumulated earnings and profits. Consequently, although Colony Credit intends to withhold at a rate of 30% on the entire amount of any distribution, to the extent that it does not do so, Colony Credit may withhold at a rate of 15% on any portion of a distribution not subject to withholding at a rate of 30%.
For any year in which Colony Credit qualifies as a REIT, a non-U.S. holder will incur tax on distributions that are attributable to gain from Colony Credit’s sale or exchange of a USRPI under FIRPTA. A USRPI includes certain interests in real property and stock in “United States real property holding corporations,” which are corporations at least 50% of whose assets consist of interests in real property. Under FIRPTA, a non-U.S. holder is taxed on distributions attributable to gain from sales of USRPIs as if such gain were effectively connected with a U.S. business of the non-U.S. holder. A non-U.S. holder thus would be taxed on such a distribution at the normal capital gains rates applicable to U.S. holders, subject to applicable alternative minimum tax and a special alternative minimum tax in the case of a nonresident alien individual. A non-U.S. corporate holder not entitled to treaty relief or an exemption also may be subject to the 30% branch profits tax on such a distribution. Colony Credit must withhold 21% of any distribution that it could designate as a capital gain dividend. A non-U.S. holder may receive a credit against its tax liability for the amount Colony Credit withholds.
Capital gain distributions to a non-U.S. holder that are attributable to Colony Credit’s sale of real property will be treated as ordinary dividends rather than as gain from the sale of a USRPI, as long as: (i)(A) such class of Colony Credit’s stock is “regularly traded” on an established securities market in the United States; and (B) the non-U.S. holder did not own more than 10% of the applicable class of Colony Credit’s stock at any time during the one-year period prior to the distribution; or (ii) the non-U.S. holder was treated as a “qualified shareholder” as discussed below. As a result, non-U.S. holders owning 10% or less of the applicable class of Colony Credit’s stock that is “regularly traded” generally will be subject to withholding tax on such capital gain distributions in the same manner as they are subject to withholding tax on ordinary dividends. If a class of Colony Credit’s stock is not regularly traded on an established securities market in the United States or the non-U.S. holder owned more than 10% of Colony Credit’s stock at any time during the one-year period prior to the distribution, capital gain distributions that are attributable to Colony Credit’s sale of real property would be subject to tax under FIRPTA, as described in the preceding paragraph. Moreover, if a non-U.S. holder disposes of Colony Credit’s stock during the 30-day period preceding a dividend payment, and such non-U.S. holder (or a person related to such non-U.S. holder) acquires or enters into a contract or option to acquire Colony Credit’s stock within 61 days of the first day of the 30-day period described above, and any portion of such dividend payment would, but for the disposition, be treated as a USRPI capital gain to such non-U.S. holder, then such non-U.S. holder shall be treated as having USRPI capital gain in an amount that, but for the disposition, would have been treated as USRPI capital gain.
Although the law is not clear on the matter, it appears that amounts Colony Credit designates as retained capital gains in respect of the stock held by U.S. holders generally should be treated with respect to non-U.S. holders in the same manner as actual distributions by Colony Credit of capital gain dividends. Under this approach, a non-U.S. holder would be able to offset as a credit against its U.S. federal income tax liability its proportionate share of the tax paid by Colony Credit on such retained capital gains, and to receive from the IRS a refund to the extent the non-U.S. holder’s proportionate share of such tax paid by Colony Credit exceeds its actual U.S. federal income tax liability, provided that the non-U.S. holder furnishes required information to the IRS on a timely basis, which may require the filing of a tax return with the IRS.
A non-U.S. holder generally will not incur tax under FIRPTA with respect to gain realized upon a disposition of Colony Credit’s stock as long as Colony Credit: (i) is not a “United States real property holding corporation” during a specified testing period; or (ii) is a domestically controlled qualified investment entity. A domestically controlled qualified investment entity includes a REIT, less than 50% of the value of which is held directly or indirectly by foreign persons at all times during a specified testing period. Colony Credit believes that it will be a domestically controlled qualified investment entity, but because Colony Credit’s stock will be publicly traded, it cannot assure you that it in fact will be a domestically controlled qualified investment entity. However, even if Colony Credit were a “United States real property holding corporation” and it were not a domestically controlled qualified investment entity, a non-U.S. holder that owned, actually or constructively, 10% or less of the applicable class of Colony Credit’s stock at all times during a specified testing period would not incur tax under FIRPTA if that class of Colony Credit’s stock is “regularly traded” on an established securities market. Because Colony Credit’s common and preferred stock will be regularly traded on an established securities market, a non-U.S. holder will not incur tax under FIRPTA with respect to any such gain unless it owns, actually or constructively, more than 10% of the applicable class of Colony Credit’s stock. If the gain on the sale of Colony Credit’s stock were taxed under FIRPTA, a non-U.S. holder would be taxed in the same manner as U.S. holders with respect to such gain, subject to applicable alternative minimum tax or a special alternative minimum tax in the case of nonresident alien individuals. Furthermore, a non-U.S. holder will incur tax on gain not subject to FIRPTA if: (i) the gain is effectively connected with the non-U.S. holder’s U.S. trade or business, in which case the non-U.S. holder will be subject to the same treatment as U.S.
100
holders with respect to such gain; or (ii) the non-U.S. holder is a nonresident alien individual who was present in the United States for 183 days or more during the taxable year and has a “tax home” in the United States, in which case the non-U.S. holder will incur a 30% tax on his capital gains.
Qualified Shareholders
Subject to the exception discussed below, any distribution to a “qualified shareholder,” as defined below, who holds Colony Credit’s stock directly or indirectly (through one or more partnerships) will not be subject to U.S. tax as income effectively connected with a U.S. trade or business and thus will not be subject to special withholding rules under FIRPTA. While a “qualified shareholder” will not be subject to FIRPTA withholding on REIT distributions, certain investors of a “qualified shareholder” (i.e., non-U.S. persons who hold interests in the “qualified shareholder” (other than interests solely as a creditor), and hold more than 10% of Colony Credit’s stock (whether or not by reason of the investor’s ownership in the “qualified shareholder”)) may be subject to FIRPTA withholding.
In addition, a sale of Colony Credit’s stock by a “qualified shareholder” who holds such stock directly or indirectly (through one or more partnerships) will not be subject to U.S. federal income taxation under FIRPTA. As with distributions, certain investors of a “qualified shareholder” (i.e., non-U.S. persons who hold interests in the “qualified shareholder” (other than interests solely as a creditor), and hold more than 10% of Colony Credit’s stock (whether or not by reason of the investor’s ownership in the “qualified shareholder”)) may be subject to FIRPTA withholding on a sale of Colony Credit’s stock.
A “qualified shareholder” is a foreign person that: (i) either is eligible for the benefits of a comprehensive income tax treaty which includes an exchange of information program and whose principal class of interests is listed and regularly traded on one or more recognized stock exchanges (as defined in such comprehensive income tax treaty), or is a foreign partnership that is created or organized under foreign law as a limited partnership in a jurisdiction that has an agreement for the exchange of information with respect to taxes with the United States and has a class of limited partnership units representing greater than 50% of the value of all the partnership units that are regularly traded on the NYSE or NASDAQ markets; (ii) is a qualified collective investment vehicle, as defined below; and (iii) maintains records on the identity of each person who, at any time during the foreign person’s taxable year, is the direct owner of 5% or more of the class of interests or units, as applicable, described in (i), above.
A qualified collective investment vehicle is a foreign person that: (i) would be eligible for a reduced rate of withholding under the comprehensive income tax treaty described above, even if such entity holds more than 10% of the stock of such REIT; (ii) is publicly traded, is treated as a partnership under the Code, is a withholding foreign partnership, and would be treated as a “United States real property holding corporation” if it were a domestic corporation; or (iii) is designated as such by the Secretary of the Treasury and is either (A) fiscally transparent within the meaning of Section 894 of the Code or (B) required to include dividends in its gross income, but is entitled to a deduction for distributions to its investors.
Qualified Foreign Pension Funds
Any distribution to a “qualified foreign pension fund” (or an entity all of the interests of which are held by a “qualified foreign pension fund”) who holds Colony Credit’s stock directly or indirectly (through one or more partnerships) will not be subject to U.S. tax as income effectively connected with a U.S. trade or business and thus will not be subject to special withholding rules under FIRPTA. In addition, a sale of Colony Credit’s stock by a “qualified foreign pension fund” that holds such stock directly or indirectly (through one or more partnerships) will not be subject to U.S. federal income taxation under FIRPTA.
A qualified foreign pension fund is any trust, corporation or other organization or arrangement: (i) which is created or organized under the law of a country other than the United States; (ii) which is established to provide retirement or pension benefits to participants or beneficiaries that are current or former employees (or persons designated by such employees) of one or more employers in consideration for services rendered; (iii) which does not have a single participant or beneficiary with a right to more than 5% of its assets or income; (iv) which is subject to government regulation and provides annual information reporting about its beneficiaries to the relevant tax authorities in the country in which it is established or operates; and (v) with respect to which, under the laws of the country in which it is established or operates, (A) contributions to such organization or arrangement that would otherwise be subject to tax under such laws are deductible or excluded from the gross income of such entity or taxed at a reduced rate or (B) taxation of any investment income of such organization or arrangement is deferred or such income is taxed at a reduced rate.
FATCA Withholding
Under the Foreign Account Tax Compliance Act, or FATCA, a U.S. withholding tax at a 30% rate will be imposed on dividends paid on Colony Credit’s stock received by certain non-U.S. holders if certain disclosure requirements related to U.S. accounts or ownership are not satisfied. In addition, if those disclosure requirements are not satisfied, a U.S. withholding tax at a 30% rate will be imposed on proceeds from the sale of Colony Credit’s stock received after
December 31, 2018
by certain non-U.S. holders. If payment of withholding taxes is required, non-U.S. holders that are otherwise eligible for an exemption from, or reduction of,
101
U.S. withholding taxes with respect to such dividends and proceeds will be required to seek a refund from the IRS to obtain the benefit of such exemption or reduction. Colony Credit will not pay any additional amounts in respect of any amounts withheld.
Information Reporting Requirements and Backup Withholding; Shares Held Offshore
Colony Credit will report to its holders and to the IRS the amount of distributions it pays during each calendar year, and the amount of tax it withholds, if any. Under the backup withholding rules, a holder may be subject to backup withholding at a rate of 28% with respect to distributions unless the holder:
|
•
|
is a corporation or qualifies for certain other exempt categories and, when required, demonstrates this fact; or
|
|
•
|
provides a taxpayer identification number, certifies as to no loss of exemption from backup withholding, and otherwise complies with the applicable requirements of the backup withholding rules.
|
A holder who does not provide Colony Credit with its correct taxpayer identification number also may be subject to penalties imposed by the IRS. Any amount paid as backup withholding will be creditable against the holder’s income tax liability. In addition, Colony Credit may be required to withhold a portion of capital gain distributions to any U.S. holders who fail to certify their non-foreign status to Colony Credit.
Backup withholding will generally not apply to payments of dividends made by Colony Credit or its paying agents, in their capacities as such, to a non-U.S. holder, provided that the non-U.S. holder furnishes to Colony Credit or its paying agent the required certification as to its non-U.S. status, such as providing a valid IRS Form W-8BEN, W-8BEN-E or W-8ECI, or certain other requirements are met. Notwithstanding the foregoing, backup withholding may apply if either Colony Credit or its paying agent has actual knowledge, or reason to know, that the holder is a U.S. person that is not an exempt recipient. Payments of the net proceeds from a disposition or a redemption effected outside the United States by a non-U.S. holder made by or through a foreign office of a broker generally will not be subject to information reporting or backup withholding. However, information reporting (but not backup withholding) generally will apply to such a payment if the broker has certain connections with the U.S. unless the broker has documentary evidence in its records that the beneficial owner is a non-U.S. holder and specified conditions are met or an exemption is otherwise established. Payment of the net proceeds from a disposition by a non-U.S. holder of Colony Credit’s stock made by or through the U.S. office of a broker is generally subject to information reporting and backup withholding unless the non-U.S. holder certifies under penalties of perjury that it is not a U.S. person and satisfies certain other requirements or otherwise establishes an exemption from information reporting and backup withholding.
Backup withholding is not an additional tax. Any amounts withheld under the backup withholding rules may be refunded or credited against the holder’s U.S. federal income tax liability if certain required information is furnished to the IRS. Holders are urged to consult their own tax advisors regarding application of backup withholding to them and the availability of, and procedure for obtaining an exemption from, backup withholding.
Under FATCA, a U.S. withholding tax at a 30% rate will be imposed on dividends paid on Colony Credit’s stock received by U.S. holders who own their stock through foreign accounts or foreign intermediaries if certain disclosure requirements related to U.S. accounts or ownership are not satisfied. In addition, if those disclosure requirements are not satisfied, a U.S. withholding tax at a 30% rate will be imposed on proceeds from the sale of Colony Credit’s stock received after
December 31, 2018
by U.S. holders who own their shares through foreign accounts or foreign intermediaries. Colony Credit will not pay any additional amounts in respect of any amounts withheld.
Other Tax Consequences
Tax Aspects of Colony Credit’s Investments in the Operating Partnership and the Subsidiary Partnerships
The following discussion summarizes certain U.S. federal income tax considerations applicable to Colony Credit’s direct or indirect investments in Colony Credit’s Operating Partnership and any subsidiary partnerships or limited liability companies that Colony Credit forms or acquires interests in and that are treated as partnerships for U.S. federal income tax purposes (individually, “Partnership” and, collectively, as the “Partnerships”). The discussion does not cover state or local tax laws or any U.S. federal tax laws other than income tax laws. Colony Credit will include in its income its proportionate share of Partnership items of income, gain, loss, deduction or credit for purposes of the REIT income tests, and will include Colony Credit’s proportionate share of assets held by the Partnerships based on Colony Credit’s capital interest in such partnerships (other than for purposes of the 10% value test, for which the determination of Colony Credit’s interest in partnership assets will be based on Colony Credit’s proportionate interest in any securities issued by the partnership, other than certain securities specifically excluded under the Code). Consequently, to the extent that Colony Credit holds an equity interest in a Partnership, the Partnership’s assets and operations may affect Colony Credit’s ability to qualify as a REIT, even though Colony Credit may have no control, or have only limited influence, over the Partnership.
102
Classification as Partnerships
. Colony Credit is entitled to include in its income its distributive share of each Partnership’s income and to deduct its distributive share of each Partnership’s losses only if such Partnership is classified for U.S. federal income tax purposes as a partnership (or an entity that is disregarded for U.S. federal income tax purposes if the entity has only one owner or member) rather than as a corporation or an association taxable as a corporation. An unincorporated domestic entity with at least two owners or members will be classified as a partnership, rather than as a corporation, for U.S. federal income tax purposes if it:
|
•
|
is treated as a partnership under the Treasury Regulations relating to entity classification or the check-the-box regulations, as described below; and
|
|
•
|
is not a “publicly traded” partnership, as defined below.
|
Under the check-the-box regulations, an unincorporated domestic entity with at least two owners or members may elect to be classified either as an association taxable as a corporation or as a partnership. If such an entity fails to make an election, it generally will be treated as a partnership (or as an entity that is disregarded for U.S. federal income tax purposes if the entity has only one owner or member) for U.S. federal income tax purposes. Each Partnership intends to be classified as a partnership for U.S. federal income tax purposes and no Partnership will elect to be treated as an association taxable as a corporation under the check-the-box regulations.
A publicly traded partnership is a partnership whose interests are traded on an established securities market or are readily tradable on a secondary market or the substantial equivalent thereof. A publicly traded partnership will not, however, be treated as a corporation for any taxable year if, for each taxable year beginning after December 31, 1987 in which it was classified as a publicly traded partnership, 90% or more of the partnership’s gross income for such year consists of certain passive-type income, including real property rents, gains from the sale or other disposition of real property, interest and dividends, or the 90% passive income exception. Treasury Regulations provide additional limited safe harbors from the definition of a publicly traded partnership. Pursuant to the private placement exclusion safe harbor, interests in a partnership will not be treated as readily tradable on a secondary market or the substantial equivalent thereof if: (i) all interests in the partnership were issued in a transaction or transactions that were not required to be registered under the Securities Act; and (ii) the partnership does not have more than 100 partners at any time during the partnership’s taxable year. In determining the number of partners in a partnership, a person owning an interest in a partnership, grantor trust or S corporation that owns an interest in the partnership is treated as a partner in such partnership only if: (i) substantially all of the value of the owner’s interest in the entity is attributable to the entity’s direct or indirect interest in the partnership; and (ii) a principal purpose of the use of the entity is to permit the partnership to satisfy the 100-partner limitation. Each Partnership is expected to qualify for treatment as a partnership for U.S. federal income tax purposes pursuant to the 90% passive income exception or the private placement safe harbor. Colony Credit has not requested, and does not intend to request, a ruling from the IRS that the Partnerships will be classified as partnerships for U.S. federal income tax purposes.
If, for any reason, a Partnership in which Colony Credit owned more than 10% of the equity were taxable as a corporation, rather than as a partnership, for U.S. federal income tax purposes, Colony Credit likely would not be able to qualify as a REIT unless it qualified for certain relief provisions. Refer to the sections entitled “-Requirements for Qualification-Gross Income Tests” and “-Requirements for Qualification-Asset Tests.” In addition, any change in a Partnership’s status for tax purposes might be treated as a taxable event, in which case Colony Credit might incur tax liability without any related cash distribution. Refer to the section entitled “-Requirements for Qualification-Distribution Requirements.” Further, items of income and deduction of such Partnership would not pass through to its partners, and its partners would be treated as holders for tax purposes. Consequently, such Partnership would be required to pay income tax at corporate rates on its net income and distributions to its partners would constitute dividends that would not be deductible in computing such Partnership’s taxable income.
Income Taxation of the Partnerships and their Partners
Partners, Not the Partnerships, Subject to Tax
. A partnership generally is not a taxable entity for U.S. federal income tax purposes. Rather, Colony Credit is required to take into account its allocable share of each Partnership’s income, gains, losses, deductions and credits for any taxable year of such Partnership ending within or with Colony Credit’s taxable year, without regard to whether Colony Credit has received or will receive any distribution from such Partnership. For taxable years beginning after December 31, 2017, however, the tax liability for adjustments to a Partnership’s tax returns made as a result of an audit by the IRS will be imposed on the Partnership itself in certain circumstances absent an election to the contrary.
Partnership Allocations
. Although a partnership agreement generally will determine the allocation of income and losses among partners, such allocations will be disregarded for tax purposes if they do not comply with the provisions of the U.S. federal income tax laws governing partnership allocations. If an allocation is not recognized for U.S. federal income tax purposes, the item subject to the allocation will be reallocated in accordance with the partners’ interests in the partnership, which will be determined by taking into account all of the facts and circumstances relating to the economic arrangement of the partners with respect to such item.
103
Each Partnership’s allocations of taxable income, gain and loss are intended to comply with the requirements of the U.S. federal income tax laws governing partnership allocations.
Tax Allocations With Respect to Contributed Properties
. Income, gain, loss and deduction attributable to appreciated or depreciated property that is contributed to a partnership in a tax-deferred transaction or contributed property in exchange for an interest in the partnership must be allocated in a manner such that the contributing partner is charged with, or benefits from, respectively, the unrealized gain or unrealized loss associated with the property at the time of the contribution. The amount of such unrealized gain or unrealized loss, or built-in gain or built-in loss, respectively, is generally equal to the difference between the fair market value of the contributed property at the time of contribution and the adjusted tax basis of such property at the time of contribution, or a book-tax difference. Such allocations are solely for U.S. federal income tax purposes and do not affect the book capital accounts or other economic or legal arrangements among the partners. The U.S. Treasury Department has issued regulations requiring partnerships to use a “reasonable method” for allocating items with respect to which there is a book-tax difference and outlining several reasonable allocation methods.
Basis in Partnership Interest
. Colony Credit’s adjusted tax basis in any Partnership generally is equal to:
|
•
|
the amount of cash and the basis of any other property contributed by Colony Credit to the Partnership;
|
|
•
|
increased by Colony Credit’s allocable share of the Partnership’s income and its allocable share of indebtedness of the Partnership; and
|
|
•
|
reduced, but not below zero, by Colony Credit’s allocable share of the Partnership’s loss and the amount of cash distributed to Colony Credit and by constructive distributions resulting from a reduction in Colony Credit’s share of indebtedness of the Partnership.
|
If the allocation of Colony Credit’s distributive share of the Partnership’s loss would reduce the adjusted tax basis of Colony Credit’s partnership interest below zero, the recognition of such loss will be deferred until such time as the recognition of such loss would not reduce Colony Credit’s adjusted tax basis below zero. To the extent that the Partnership’s distributions or any decrease in Colony Credit’s share of the indebtedness of the Partnership, which is considered a constructive cash distribution to the partners, would reduce Colony Credit’s adjusted tax basis below zero, such distributions or decreases will constitute taxable income to Colony Credit. Such distributions and constructive distributions normally will be characterized as long-term capital gain.
Depreciation Deductions Available to Partnerships
. The initial tax basis of property is the amount of cash and the basis of property given as consideration for the property. The Partnership’s initial basis in contributed properties acquired in exchange for units of the Partnership should be the same as the transferor’s basis in such properties on the date of acquisition. Although the law is not entirely clear, the Partnership generally will depreciate such property for U.S. federal income tax purposes over the same remaining useful lives and under the same methods used by the transferors. The Partnership’s tax depreciation deductions will be allocated among the partners in accordance with their respective interests in the Partnership, except to the extent that the Partnership is required under the U.S. federal income tax laws governing partnership allocations to use another method for allocating tax depreciation deductions attributable to contributed or revalued properties, which could result in Colony Credit receiving a disproportionate share of such deductions.
Legislative or Other Actions Affecting REITs
The rules dealing with U.S. federal income taxation are constantly under review by persons involved in the legislative process and by the IRS and the U.S. Treasury Department. Colony Credit cannot give you any assurances as to whether, or in what form, any proposals affecting REITs or their holders will be enacted. Changes to the U.S. federal tax laws and interpretations thereof could adversely affect an investment in Colony Credit’s stock. Holders should consult their tax advisors regarding the effect of potential changes to the U.S. federal tax laws and on an investment in Colony Credit’s stock.
State, Local and Foreign Taxes
Colony Credit and/or you may be subject to taxation by various states, localities and foreign jurisdictions, including those in which Colony Credit or a holder transacts business, owns property or resides. The state, local and foreign tax treatment may differ from the U.S. federal income tax treatment described above. Consequently, you are urged to consult your tax advisors regarding the effect of state, local and foreign tax laws upon an investment in Colony Credit’s stock.
104
PART III
Item 10. Directors, Executive Officers and Corporate Governance.
The information required by Item 10 is hereby incorporated by reference to the definitive proxy statement to be filed with the SEC pursuant to Regulation 14A within 120 days after our fiscal
year ended
December 31, 2018
.
Item 11. Executive Compensation.
The information required by Item 11 is hereby incorporated by reference to the definitive proxy statement to be filed with the SEC pursuant to Regulation 14A within 120 days after our fiscal
year ended
December 31, 2018
.
Item 12. Security Ownership of Certain Beneficial Owners and Management Related Stockholder Matters.
The information required by Item 12 is hereby incorporated by reference to the definitive proxy statement to be filed with the SEC pursuant to Regulation 14A within 120 days after our fiscal
year ended
December 31, 2018
.
Item 13. Certain Relationships and Related Transactions, and Director Independence.
The information required by Item 13 is hereby incorporated by reference to the definitive proxy statement to be filed with the SEC pursuant to Regulation 14A within 120 days after our fiscal
year ended
December 31, 2018
.
Item 14. Principal Accounting Fees and Services
The information required by Item 13 is hereby incorporated by reference to the definitive proxy statement to be filed with the SEC pursuant to Regulation 14A within 120 days after our fiscal
year ended
December 31, 2018
.
105
PART IV
Item 15. Exhibits and Financial Statement Schedules
(a)(1) and (2). Financial Statement and Schedules of Colony Credit Real Estate, Inc.
All other schedules are omitted because they are not applicable, or the required information is included in the consolidated financial statements or notes thereto.
(a)(3) Exhibits
F-1
REPORT OF INDEPENDENT REGISTERED PUBLIC ACCOUNTING FIRM
To the Shareholders and the Board of Directors of Colony Credit Real Estate, Inc.
Opinion on the Financial Statements
We have audited the accompanying consolidated balance sheets of Colony Credit Real Estate, Inc. (the Company) as of December 31, 2018 and 2017, and the related consolidated statements of operations, comprehensive income (loss), equity and cash flows for each of the three years in the period ended December 31, 2018, and the related notes and financial statement schedules listed in the Index at Item 15 (collectively referred to as the “consolidated financial statements”). In our opinion, the consolidated financial statements present fairly, in all material respects, the financial position of the Company at December 31, 2018 and 2017, and the results of its operations and its cash flows for each of the three years in the period ended December 31, 2018, in conformity with U.S. generally accepted accounting principles.
We also have audited, in accordance with the standards of the Public Company Accounting Oversight Board (United States) (PCAOB), the Company’s internal control over financial reporting as of December 31, 2018, based on criteria established in Internal Control-Integrated Framework issued by the Committee of Sponsoring Organizations of the Treadway Commission (2013 framework) and our report dated
February 28, 2019
expressed an unqualified opinion thereon.
Basis for Opinion
These financial statements are the responsibility of the Company’s management. Our responsibility is to express an opinion on the Company’s financial statements based on our audits. We are a public accounting firm registered with the PCAOB and are required to be independent with respect to the Company in accordance with the U.S. federal securities laws and the applicable rules and regulations of the Securities and Exchange Commission and the PCAOB.
We conducted our audits in accordance with the standards of the PCAOB. Those standards require that we plan and perform the audit to obtain reasonable assurance about whether the financial statements are free of material misstatement, whether due to error or fraud. Our audits included performing procedures to assess the risks of material misstatement of the financial statements, whether due to error or fraud, and performing procedures that respond to those risks. Such procedures included examining, on a test basis, evidence regarding the amounts and disclosures in the financial statements. Our audits also included evaluating the accounting principles used and significant estimates made by management, as well as evaluating the overall presentation of the financial statements. We believe that our audits provide a reasonable basis for our opinion.
/s/ Ernst & Young LLP
We have served as the Company’s auditor since 2017.
New York, New York
February 28, 2019
F-2
COLONY CREDIT REAL ESTATE, INC.
CONSOLIDATED BALANCE SHEETS
(in Thousands, Except Share and Per Share Data)
|
December 31, 2018
|
December 31, 2017
|
||||||
|
Assets
|
|||||||
|
Cash and cash equivalents
|
$
|
77,317
|
|
$
|
25,204
|
|
|
|
Restricted cash
|
110,146
|
|
41,901
|
|
|||
|
Loans and preferred equity held for investment, net
|
2,020,497
|
|
1,300,784
|
|
|||
|
Real estate securities, available for sale, at fair value
|
228,185
|
|
—
|
|
|||
|
Real estate, net
|
1,959,690
|
|
219,740
|
|
|||
|
Investments in unconsolidated ventures ($160,851 and $24,417 at fair value, respectively)
|
903,037
|
|
203,720
|
|
|||
|
Receivables, net
|
48,806
|
|
35,512
|
|
|||
|
Deferred leasing costs and intangible assets, net
|
134,068
|
|
11,014
|
|
|||
|
Other assets
|
62,006
|
|
1,527
|
|
|||
|
Mortgage loans held in securitization trusts, at fair value
|
3,116,978
|
|
—
|
|
|||
|
Total assets
|
$
|
8,660,730
|
|
$
|
1,839,402
|
|
|
|
Liabilities
|
|||||||
|
Securitization bonds payable, net
|
$
|
81,372
|
|
$
|
108,679
|
|
|
|
Mortgage and other notes payable, net
|
1,173,019
|
|
280,982
|
|
|||
|
Credit facilities
|
1,365,918
|
|
—
|
|
|||
|
Due to related party (Note 11)
|
15,019
|
|
—
|
|
|||
|
Accrued and other liabilities
|
106,187
|
|
5,175
|
|
|||
|
Intangible liabilities, net
|
15,096
|
|
36
|
|
|||
|
Escrow deposits payable
|
65,995
|
|
36,960
|
|
|||
|
Dividends payable
|
18,986
|
|
—
|
|
|||
|
Mortgage obligations issued by securitization trusts, at fair value
|
2,973,936
|
|
—
|
|
|||
|
Total liabilities
|
5,815,528
|
|
431,832
|
|
|||
|
Commitments and contingencies (Note 18)
|
|
|
|||||
|
Equity
|
|||||||
|
Stockholders’ equity
|
|||||||
|
Preferred stock, $0.01 par value, 50,000,000 shares authorized, no shares issued and outstanding as of December 31, 2018 and 2017
|
—
|
|
—
|
|
|||
|
Common stock, $0.01 par value per share
|
|||||||
|
Class A, 905,000,000 shares authorized, 83,410,376 and 100 shares issued and outstanding as of December 31, 2018 and 2017, respectively
|
834
|
|
—
|
|
|||
|
Class B-3, 45,000,000 shares authorized, 44,399,444 and no shares issued and outstanding as of December 31, 2018 and 2017, respectively
|
444
|
|
—
|
|
|||
|
Additional paid-in capital
|
2,899,353
|
|
821,031
|
|
|||
|
Retained earnings (accumulated deficit)
|
(193,327
|
)
|
258,777
|
|
|||
|
Accumulated other comprehensive loss
|
(399
|
)
|
—
|
|
|||
|
Total stockholders’ equity
|
2,706,905
|
|
1,079,808
|
|
|||
|
Noncontrolling interests in investment entities
|
72,683
|
|
327,762
|
|
|||
|
Noncontrolling interests in the Operating Partnership
|
65,614
|
|
—
|
|
|||
|
Total equity
|
2,845,202
|
|
1,407,570
|
|
|||
|
Total liabilities and equity
|
$
|
8,660,730
|
|
$
|
1,839,402
|
|
|
The accompanying notes are an integral part of these consolidated financial statements.
F-3
COLONY CREDIT REAL ESTATE, INC.
CONSOLIDATED BALANCE SHEETS
(in Thousands)
The following table presents assets and liabilities of securitization trusts and certain real estate properties that have noncontrolling interests as variable interest entities for which the Company is determined to be the primary beneficiary.
|
December 31, 2018
|
December 31, 2017
|
||||||
|
Assets
|
|||||||
|
Cash and cash equivalents
|
$
|
12,561
|
|
$
|
1,320
|
|
|
|
Restricted cash
|
18,464
|
|
24,928
|
|
|||
|
Loans and preferred equity held for investment, net
|
167,219
|
|
379,305
|
|
|||
|
Real estate, net
|
547,444
|
|
8,073
|
|
|||
|
Receivables, net
|
17,811
|
|
11,994
|
|
|||
|
Deferred leasing costs and intangible assets, net
|
38,681
|
|
—
|
|
|||
|
Other assets
|
1,698
|
|
38
|
|
|||
|
Mortgage loans held in securitization trusts, at fair value
|
3,116,978
|
|
—
|
|
|||
|
Total assets
|
$
|
3,920,856
|
|
$
|
425,658
|
|
|
|
Liabilities
|
|||||||
|
Securitization bonds payable, net
|
$
|
43,870
|
|
$
|
108,679
|
|
|
|
Mortgage and other notes payable, net
|
325,187
|
|
—
|
|
|||
|
Accrued and other liabilities
|
32,452
|
|
3,764
|
|
|||
|
Intangible liabilities, net
|
11,993
|
|
—
|
|
|||
|
Escrow deposits payable
|
9,603
|
|
24,928
|
|
|||
|
Mortgage obligations issued by securitization trusts, at fair value
|
2,973,936
|
|
—
|
|
|||
|
Total liabilities
|
$
|
3,397,041
|
|
$
|
137,371
|
|
|
The accompanying notes are an integral part of these consolidated financial statements.
F-4
COLONY CREDIT REAL ESTATE, INC.
CONSOLIDATED STATEMENTS OF OPERATIONS
(in Thousands, Except Per Share Data)
|
Year Ended December 31,
|
||||||||||||
|
2018
|
2017
|
2016
|
||||||||||
|
Net interest income
|
||||||||||||
|
Interest income
|
$
|
151,653
|
|
$
|
140,214
|
|
$
|
140,529
|
|
|||
|
Interest expense
|
(47,074
|
)
|
(21,019
|
)
|
(26,031
|
)
|
||||||
|
Interest income on mortgage loans held in securitization trusts
|
143,371
|
|
—
|
|
—
|
|
||||||
|
Interest expense on mortgage obligations issued by securitization trusts
|
(132,411
|
)
|
—
|
|
—
|
|
||||||
|
Net interest income
|
115,539
|
|
119,195
|
|
114,498
|
|
||||||
|
Property and other income
|
||||||||||||
|
Property operating income
|
178,339
|
|
23,750
|
|
1,138
|
|
||||||
|
Other income
|
3,651
|
|
791
|
|
536
|
|
||||||
|
Total property and other income
|
181,990
|
|
24,541
|
|
1,674
|
|
||||||
|
Expenses
|
||||||||||||
|
Management fee expense
|
43,190
|
|
—
|
|
—
|
|
||||||
|
Property operating expense
|
73,616
|
|
7,978
|
|
905
|
|
||||||
|
Transaction, investment and servicing expense
|
36,800
|
|
2,570
|
|
1,767
|
|
||||||
|
Interest expense on real estate
|
43,437
|
|
5,095
|
|
—
|
|
||||||
|
Depreciation and amortization
|
90,986
|
|
9,137
|
|
146
|
|
||||||
|
Provision for loan losses
|
113,911
|
|
518
|
|
3,386
|
|
||||||
|
Impairment of operating real estate
|
31,813
|
|
—
|
|
—
|
|
||||||
|
Administrative expense (including $7,113, $0, and $0 of equity-based compensation expense, respectively)
|
26,634
|
|
12,669
|
|
15,437
|
|
||||||
|
Total expenses
|
460,387
|
|
37,967
|
|
21,641
|
|
||||||
|
Other income (loss)
|
||||||||||||
|
Unrealized gain on mortgage loans and obligations held in securitization trusts, net
|
5,003
|
|
—
|
|
—
|
|
||||||
|
Realized loss on mortgage loans and obligations held in securitization trusts, net
|
(3,447
|
)
|
—
|
|
—
|
|
||||||
|
Other loss, net
|
(2,766
|
)
|
(390
|
)
|
(56
|
)
|
||||||
|
Income (loss) before equity in earnings of unconsolidated ventures and income taxes
|
(164,068
|
)
|
105,379
|
|
94,475
|
|
||||||
|
Equity in earnings of unconsolidated ventures
|
23,774
|
|
24,709
|
|
16,067
|
|
||||||
|
Income tax expense
|
(37,059
|
)
|
(2,208
|
)
|
(1,521
|
)
|
||||||
|
Net income (loss)
|
(177,353
|
)
|
127,880
|
|
109,021
|
|
||||||
|
Net (income) loss attributable to noncontrolling interests:
|
||||||||||||
|
Investment entities
|
4,771
|
|
(39,376
|
)
|
(32,970
|
)
|
||||||
|
Operating Partnership
|
4,084
|
|
—
|
|
—
|
|
||||||
|
Net income (loss) attributable to Colony Credit Real Estate, Inc. common stockholders
|
$
|
(168,498
|
)
|
$
|
88,504
|
|
$
|
76,051
|
|
|||
|
Net income (loss) per common share - basic and diluted
(Note 20)
|
$
|
(1.41
|
)
|
$
|
1.86
|
|
$
|
1.60
|
|
|||
|
|
||||||||||||
|
Weighted average shares of common stock outstanding - basic and diluted
(Note 20)
|
120,677
|
|
44,399
|
|
44,399
|
|
||||||
The accompanying notes are an integral part of these consolidated financial statements.
F-5
COLONY CREDIT REAL ESTATE, INC.
CONSOLIDATED STATEMENTS OF COMPREHENSIVE INCOME (LOSS)
(in Thousands)
|
Year Ended December 31,
|
||||||||||||
|
2018
|
2017
|
2016
|
||||||||||
|
Net income (loss)
|
$
|
(177,353
|
)
|
$
|
127,880
|
|
$
|
109,021
|
|
|||
|
Other comprehensive income (loss)
|
||||||||||||
|
Unrealized loss on real estate securities, available for sale
|
(1,327
|
)
|
—
|
|
—
|
|
||||||
|
Change in fair value of net investment hedges
|
11,305
|
|
—
|
|
—
|
|
||||||
|
Foreign currency translation loss
|
(10,387
|
)
|
—
|
|
—
|
|
||||||
|
Total other comprehensive income
|
(409
|
)
|
—
|
|
—
|
|
||||||
|
Comprehensive income (loss)
|
(177,762
|
)
|
127,880
|
|
109,021
|
|
||||||
|
Comprehensive (income) loss attributable to noncontrolling interests:
|
||||||||||||
|
Investment entities
|
4,771
|
|
(39,376
|
)
|
(32,970
|
)
|
||||||
|
Operating Partnership
|
4,094
|
|
—
|
|
—
|
|
||||||
|
Comprehensive income (loss) attributable to common stockholders
|
$
|
(168,897
|
)
|
$
|
88,504
|
|
$
|
76,051
|
|
|||
The accompanying notes are an integral part of these consolidated financial statements.
F-6
COLONY CREDIT REAL ESTATE, INC.
CONSOLIDATED STATEMENTS OF EQUITY
(in Thousands)
|
Common Stock
|
Additional
Paid-in
Capital
|
Retained
Earnings
(Accumulated
Deficit)
|
Accumulated
Other
Comprehensive
Income
|
Total
Stockholders’ Equity |
Noncontrolling Interests in Investment Entities
|
Noncontrolling Interests in the Operating Partnership
|
Total
Equity
|
||||||||||||||||||||||||||||||||||
|
Class A
|
Class B-3
|
||||||||||||||||||||||||||||||||||||||||
|
Shares
|
Amount
|
Shares
|
Amount
|
||||||||||||||||||||||||||||||||||||||
|
Balance as of December 31, 2015
|
—
|
|
$
|
—
|
|
—
|
|
$
|
—
|
|
$
|
723,552
|
|
$
|
94,222
|
|
$
|
—
|
|
$
|
817,774
|
|
$
|
300,040
|
|
$
|
—
|
|
$
|
1,117,814
|
|
||||||||||
|
Contributions
|
—
|
|
—
|
|
—
|
|
—
|
|
113,024
|
|
—
|
|
—
|
|
113,024
|
|
95,618
|
|
—
|
|
208,642
|
|
|||||||||||||||||||
|
Distributions
|
—
|
|
—
|
|
—
|
|
—
|
|
(122,133
|
)
|
—
|
|
—
|
|
(122,133
|
)
|
(77,780
|
)
|
—
|
|
(199,913
|
)
|
|||||||||||||||||||
|
Net income
|
—
|
|
—
|
|
—
|
|
—
|
|
—
|
|
76,051
|
|
—
|
|
76,051
|
|
32,970
|
|
—
|
|
109,021
|
|
|||||||||||||||||||
|
Balance as of December 31, 2016
|
—
|
|
$
|
—
|
|
—
|
|
$
|
—
|
|
$
|
714,443
|
|
$
|
170,273
|
|
$
|
—
|
|
$
|
884,716
|
|
$
|
350,848
|
|
$
|
—
|
|
$
|
1,235,564
|
|
||||||||||
|
Equity contribution from the Combination
|
—
|
|
—
|
|
—
|
|
—
|
|
324,358
|
|
—
|
|
—
|
|
324,358
|
|
—
|
|
—
|
|
324,358
|
|
|||||||||||||||||||
|
Contributions
|
—
|
|
—
|
|
—
|
|
—
|
|
81,549
|
|
—
|
|
—
|
|
81,549
|
|
50,503
|
|
—
|
|
132,052
|
|
|||||||||||||||||||
|
Distributions
|
—
|
|
—
|
|
—
|
|
—
|
|
(299,319
|
)
|
—
|
|
—
|
|
(299,319
|
)
|
(112,965
|
)
|
—
|
|
(412,284
|
)
|
|||||||||||||||||||
|
Net income
|
—
|
|
—
|
|
—
|
|
—
|
|
—
|
|
88,504
|
|
—
|
|
88,504
|
|
39,376
|
|
—
|
|
127,880
|
|
|||||||||||||||||||
|
Balance as of December 31, 2017
|
—
|
|
$
|
—
|
|
—
|
|
$
|
—
|
|
$
|
821,031
|
|
$
|
258,777
|
|
$
|
—
|
|
$
|
1,079,808
|
|
$
|
327,762
|
|
$
|
—
|
|
$
|
1,407,570
|
|
||||||||||
|
Contributions
|
—
|
|
—
|
|
—
|
|
—
|
|
—
|
|
—
|
|
—
|
|
—
|
|
290
|
|
—
|
|
290
|
|
|||||||||||||||||||
|
Distributions
|
—
|
|
—
|
|
—
|
|
—
|
|
—
|
|
—
|
|
—
|
|
—
|
|
(20,104
|
)
|
—
|
|
(20,104
|
)
|
|||||||||||||||||||
|
Adjustments related to the Combination
|
82,484
|
|
825
|
|
44,399
|
|
444
|
|
2,072,865
|
|
(79,774
|
)
|
—
|
|
1,994,360
|
|
(230,494
|
)
|
73,626
|
|
1,837,492
|
|
|||||||||||||||||||
|
Issuance and amortization of equity-based compensation
|
968
|
|
10
|
|
—
|
|
—
|
|
7,103
|
|
—
|
|
—
|
|
7,113
|
|
—
|
|
—
|
|
7,113
|
|
|||||||||||||||||||
|
Other comprehensive loss
|
—
|
|
—
|
|
—
|
|
—
|
|
—
|
|
—
|
|
(399
|
)
|
(399
|
)
|
—
|
|
(10
|
)
|
(409
|
)
|
|||||||||||||||||||
|
Dividends and distributions declared ($1.60 per share)
|
—
|
|
—
|
|
—
|
|
—
|
|
—
|
|
(203,832
|
)
|
—
|
|
(203,832
|
)
|
—
|
|
(4,905
|
)
|
(208,737
|
)
|
|||||||||||||||||||
|
Shares canceled for tax withholding on vested stock awards
|
(42
|
)
|
(1
|
)
|
—
|
|
—
|
|
(659
|
)
|
—
|
|
—
|
|
(660
|
)
|
—
|
|
—
|
|
(660
|
)
|
|||||||||||||||||||
|
Reallocation of equity
|
—
|
|
—
|
|
—
|
|
—
|
|
(987
|
)
|
—
|
|
—
|
|
(987
|
)
|
—
|
|
987
|
|
—
|
|
|||||||||||||||||||
|
Net income (loss)
|
—
|
|
—
|
|
—
|
|
—
|
|
—
|
|
(168,498
|
)
|
—
|
|
(168,498
|
)
|
(4,771
|
)
|
(4,084
|
)
|
(177,353
|
)
|
|||||||||||||||||||
|
Balance as of December 31, 2018
|
83,410
|
|
$
|
834
|
|
44,399
|
|
$
|
444
|
|
$
|
2,899,353
|
|
$
|
(193,327
|
)
|
$
|
(399
|
)
|
$
|
2,706,905
|
|
$
|
72,683
|
|
$
|
65,614
|
|
$
|
2,845,202
|
|
||||||||||
The accompanying notes are an integral part of these consolidated financial statements.
F-7
COLONY CREDIT REAL ESTATE, INC.
CONSOLIDATED STATEMENTS OF CASH FLOWS
(in Thousands)
|
Year Ended December 31,
|
|||||||||||
|
2018
|
2017
|
2016
|
|||||||||
|
Cash flows from operating activities:
|
|||||||||||
|
Net income (loss)
|
$
|
(177,353
|
)
|
$
|
127,880
|
|
$
|
109,021
|
|
||
|
Adjustments to reconcile net income (loss) to net cash provided by operating activities:
|
|||||||||||
|
Equity in earnings of unconsolidated ventures
|
(23,774
|
)
|
(24,709
|
)
|
(16,067
|
)
|
|||||
|
Depreciation and amortization
|
90,986
|
|
9,137
|
|
146
|
|
|||||
|
Straight-line rental income
|
(6,520
|
)
|
—
|
|
—
|
|
|||||
|
Amortization of above/below market lease values, net
|
(44
|
)
|
—
|
|
—
|
|
|||||
|
Amortization of premium/accretion of discount and fees on investments and borrowings, net
|
(7,907
|
)
|
(8,551
|
)
|
(8,112
|
)
|
|||||
|
Amortization of deferred financing costs
|
4,794
|
|
3,637
|
|
5,975
|
|
|||||
|
Paid-in-kind interest
|
(5,837
|
)
|
(1,802
|
)
|
(7,884
|
)
|
|||||
|
Distributions of cumulative earnings from unconsolidated ventures
|
43,481
|
|
7,563
|
|
1,058
|
|
|||||
|
Unrealized gain on mortgage loans and obligations held in securitization trusts, net
|
(5,003
|
)
|
—
|
|
—
|
|
|||||
|
Realized loss on mortgage loans and obligations held in securitization trusts, net
|
3,447
|
|
—
|
|
—
|
|
|||||
|
Provision for loan losses
|
113,911
|
|
518
|
|
3,386
|
|
|||||
|
Impairment of operating real estate
|
31,813
|
|
—
|
|
—
|
|
|||||
|
Amortization of equity-based compensation
|
7,113
|
|
—
|
|
—
|
|
|||||
|
Mortgage notes above/below market value amortization
|
(576
|
)
|
—
|
|
—
|
|
|||||
|
Deferred income tax expense
|
28,354
|
|
1,744
|
|
—
|
|
|||||
|
Other loss
|
114
|
|
—
|
|
—
|
|
|||||
|
Changes in assets and liabilities:
|
|||||||||||
|
Receivables, net
|
11,062
|
|
—
|
|
—
|
|
|||||
|
Deferred costs and other assets
|
(27,931
|
)
|
(7,743
|
)
|
671
|
|
|||||
|
Due to related party
|
5,710
|
|
—
|
|
—
|
|
|||||
|
Other liabilities
|
14,882
|
|
(692
|
)
|
314
|
|
|||||
|
Net cash provided by operating activities
|
100,722
|
|
106,982
|
|
88,508
|
|
|||||
|
Cash flows from investing activities:
|
|||||||||||
|
Acquisition, origination and funding of loans and preferred equity held for investment, net
|
(919,461
|
)
|
(200,203
|
)
|
(257,641
|
)
|
|||||
|
Repayment on loans and preferred equity held for investment
|
626,622
|
|
537,532
|
|
357,043
|
|
|||||
|
Proceeds from sale of loans and preferred equity held for investment
|
—
|
|
17,509
|
|
141,500
|
|
|||||
|
Cash and restricted cash received in the Combination
|
328,454
|
|
—
|
|
—
|
|
|||||
|
Cash and restricted cash received through the CLNY Merger
|
—
|
|
6,203
|
|
—
|
|
|||||
|
Cash and restricted cash related to the deconsolidation of certain CLNY Contributed Portfolio investments
|
(26,112
|
)
|
—
|
|
—
|
|
|||||
|
Cash received related to foreclosure of loans held for investment
|
4,900
|
|
—
|
|
—
|
|
|||||
|
Proceeds from sale of real estate
|
167,877
|
|
8,872
|
|
—
|
|
|||||
|
Acquisition of and additions to real estate, related intangibles and leasing commissions
|
(415,117
|
)
|
(312
|
)
|
(67
|
)
|
|||||
|
Investments in unconsolidated ventures
|
(239,663
|
)
|
(16,333
|
)
|
(21,433
|
)
|
|||||
|
Distributions in excess of cumulative earnings from unconsolidated ventures
|
98,501
|
|
55,107
|
|
1,331
|
|
|||||
|
Acquisition of real estate securities, available for sale
|
(58,665
|
)
|
—
|
|
—
|
|
|||||
|
Cash received in excess of accretion on purchased credit impaired loans
|
—
|
|
52,435
|
|
18,121
|
|
|||||
|
Deposit on investments
|
(29,423
|
)
|
—
|
|
—
|
|
|||||
|
Change in escrow deposits
|
(5,618
|
)
|
(21,541
|
)
|
(39,482
|
)
|
|||||
|
Net cash provided by (used in) investing activities
|
(467,705
|
)
|
439,269
|
|
199,372
|
|
|||||
|
Cash flows from financing activities:
|
|||||||||||
|
Distributions paid on common stock
|
(185,291
|
)
|
—
|
|
—
|
|
|||||
|
Distributions paid on common stock to noncontrolling interests
|
(4,460
|
)
|
—
|
|
—
|
|
|||||
|
Shares canceled for tax withholding on vested stock awards
|
(659
|
)
|
—
|
|
—
|
|
|||||
|
Borrowings from mortgage notes
|
246,365
|
|
72,189
|
|
81,077
|
|
|||||
|
Repayment of mortgage notes
|
(141,818
|
)
|
(342,898
|
)
|
(407,282
|
)
|
|||||
|
Borrowings from credit facilities
|
1,716,362
|
|
—
|
|
—
|
|
|||||
|
Repayment of credit facilities
|
(999,312
|
)
|
(717
|
)
|
(2,242
|
)
|
|||||
|
Repayment of securitization bonds
|
(108,246
|
)
|
—
|
|
—
|
|
|||||
|
Payment of deferred financing costs
|
(15,610
|
)
|
—
|
|
—
|
|
|||||
|
Contributions from CLNY owners
|
—
|
|
81,549
|
|
113,024
|
|
|||||
|
Distributions to CLNY owners
|
—
|
|
(299,319
|
)
|
(122,133
|
)
|
|||||
|
Contributions from noncontrolling interests
|
290
|
|
50,503
|
|
95,618
|
|
|||||
|
Distributions to noncontrolling interests
|
(20,104
|
)
|
(112,965
|
)
|
(77,780
|
)
|
|||||
|
Net cash provided by (used in) financing activities
|
487,517
|
|
(551,658
|
)
|
(319,718
|
)
|
|||||
|
Effect of exchange rates on cash, cash equivalents and restricted cash
|
(176
|
)
|
—
|
|
—
|
|
|||||
|
Net increase (decrease) in cash, cash equivalents and restricted cash
|
120,358
|
|
(5,407
|
)
|
(31,838
|
)
|
|||||
|
Cash, cash equivalents and restricted cash - beginning of period
|
67,105
|
|
72,512
|
|
104,350
|
|
|||||
|
Cash, cash equivalents and restricted cash - end of period
|
$
|
187,463
|
|
$
|
67,105
|
|
$
|
72,512
|
|
||
The accompanying notes are an integral part of these consolidated financial statements.
F-8
COLONY CREDIT REAL ESTATE, INC.
CONSOLIDATED STATEMENTS OF CASH FLOWS (Continued)
(in Thousands)
|
Year Ended December 31,
|
|||||||||||
|
2018
|
2017
|
2016
|
|||||||||
|
Reconciliation of cash, cash equivalents, and restricted cash to consolidated balance sheets
|
|||||||||||
|
Beginning of the period
|
|||||||||||
|
Cash and cash equivalents
|
$
|
25,204
|
|
$
|
13,982
|
|
$
|
6,338
|
|
||
|
Restricted cash
|
41,901
|
|
58,530
|
|
98,012
|
|
|||||
|
Total cash, cash equivalents and restricted cash, beginning of period
|
$
|
67,105
|
|
$
|
72,512
|
|
$
|
104,350
|
|
||
|
End of the period
|
|||||||||||
|
Cash and cash equivalents
|
$
|
77,317
|
|
$
|
25,204
|
|
$
|
13,982
|
|
||
|
Restricted cash
|
110,146
|
|
41,901
|
|
58,530
|
|
|||||
|
Total cash, cash equivalents and restricted cash, end of period
|
$
|
187,463
|
|
$
|
67,105
|
|
$
|
72,512
|
|
||
|
Year Ended December 31,
|
|||||||||||
|
2018
|
2017
|
2016
|
|||||||||
|
Supplemental disclosure of cash flow information:
|
|||||||||||
|
Cash paid for interest
|
$
|
81,683
|
|
$
|
22,885
|
|
$
|
20,134
|
|
||
|
Cash paid for income taxes
|
$
|
27,178
|
|
$
|
10,497
|
|
$
|
1,292
|
|
||
|
Supplemental disclosure of non-cash investing and financing activities:
|
|||||||||||
|
Assets acquired in the Combination (Note 3)
|
$
|
6,651,614
|
|
$
|
—
|
|
$
|
—
|
|
||
|
Liabilities assumed in the Combination (Note 3)
|
4,821,133
|
|
—
|
|
—
|
|
|||||
|
Noncontrolling interests assumed in the Combination (Note 3)
|
82,542
|
|
—
|
|
—
|
|
|||||
|
Common stock issued for acquisition of NorthStar I and NorthStar II (Note 3)
|
2,021,373
|
|
—
|
|
—
|
|
|||||
|
Deconsolidation of certain CLNY Contributed Portfolio investments (Note 2)
|
287,021
|
|
—
|
|
—
|
|
|||||
|
Secured Financing (Note 4)
|
50,314
|
|
—
|
|
—
|
|
|||||
|
Noncontrolling interests in the Operating Partnership
|
73,626
|
|
—
|
|
—
|
|
|||||
|
Consolidation of securitization trust (VIE asset / liability)
|
211,778
|
|
—
|
|
—
|
|
|||||
|
Accrual of distribution payable
|
18,986
|
|
—
|
|
—
|
|
|||||
|
Foreclosure of loans held for investment
|
117,878
|
|
20,204
|
|
—
|
|
|||||
|
Assets acquired through the CLNY Merger (Note 2)
|
—
|
|
485,891
|
|
—
|
|
|||||
|
Liabilities assumed through the CLNY Merger (Note 2)
|
—
|
|
161,533
|
|
—
|
|
|||||
|
Debt assumed related to acquisition of real estate
|
200,153
|
|
—
|
|
—
|
|
|||||
|
Deferred tax liabilities assumed related to acquisition of real estate
|
35,958
|
|
—
|
|
—
|
|
|||||
|
Loans held for investment payoff held by servicer
|
10,201
|
|
9,720
|
|
—
|
|
|||||
The accompanying notes are an integral part of these consolidated financial statements.
F-9
COLONY CREDIT REAL ESTATE, INC.
NOTES TO CONSOLIDATED FINANCIAL STATEMENTS
|
1.
|
Business and Organization
|
Colony Credit Real Estate, Inc. (together with its consolidated subsidiaries, the “Company”) is a commercial real estate (“CRE”) credit real estate investment trust (“REIT”) focused on originating, acquiring, financing and managing a diversified portfolio consisting primarily of CRE senior mortgage loans, mezzanine loans, preferred equity, debt securities and net leased properties predominantly in the United States. CRE debt investments include senior mortgage loans, mezzanine loans, preferred equity, and participations in such loans and preferred equity interests. CRE debt securities consist of commercial mortgage-backed securities (“CMBS”) (including “B-pieces” of a CMBS securitization pool). Net leased properties consist of CRE properties with long-term leases to tenants on a net-lease basis, where such tenants generally will be responsible for property operating expenses such as insurance, utilities, maintenance capital expenditures and real estate taxes.
The Company was organized in the state of Maryland on August 23, 2017. On September 15, 2017, Colony Capital, Inc., formerly Colony NorthStar, Inc. (“Colony Capital”), a publicly traded REIT listed on the New York Stock Exchange (“NYSE”) under the ticker symbol “CLNY,” made an initial capital contribution of
$1,000
to the Company. On January 31, 2018, the Company completed the transactions contemplated by that certain Master Combination Agreement, dated as of August 25, 2017, as amended and restated on November 20, 2017 (the “Combination Agreement,” as further discussed below). The Company intends to qualify as a REIT under the Internal Revenue Code of 1986, as amended (the “Code”), beginning with its taxable year ended
December 31, 2018
. Effective
June 25, 2018
, the Company changed its name from Colony NorthStar Credit Real Estate, Inc. to Colony Credit Real Estate, Inc. Also on
June 25, 2018
, Colony NorthStar, Inc. changed its name to Colony Capital, Inc. The Company conducts all of its activities and holds substantially all of its assets and liabilities through its operating subsidiary, Credit RE Operating Company, LLC (the “Operating Partnership” or “OP”). At
December 31, 2018
, the Company owned
97.6%
of the OP, as its sole managing member. The remaining
2.4%
is owned by an affiliate of the Company as noncontrolling interests.
The Company is externally managed and has no employees. The Company is managed by CLNC Manager, LLC (the “Manager”), a Delaware limited liability company and a wholly-owned and indirect subsidiary of Colony Capital Operating Company, LLC (“CLNY OP”), a Delaware limited liability company and the operating company of Colony Capital. Colony Capital manages capital on behalf of its stockholders, as well as institutional and retail investors in private funds, non-traded and traded REITs and registered investment companies.
The Combination
Pursuant to the Combination Agreement, (i) CLNY OP contributed and conveyed to the Company a select portfolio of assets and liabilities (the “CLNY OP Contributed Portfolio”) of CLNY OP (the “CLNY OP Contribution”), (ii) NRF RED REIT Corp., a Maryland corporation and indirect subsidiary of CLNY OP (“RED REIT”) contributed and conveyed to the OP a select portfolio of assets and liabilities (the “RED REIT Contributed Portfolio” and, together with the CLNY OP Contributed Portfolio, the “CLNY Contributed Portfolio”) of RED REIT (the “RED REIT Contribution” and, together with the CLNY OP Contribution, the “CLNY Contributions”), (iii) NorthStar Real Estate Income Trust, Inc. (“NorthStar I”), a publicly registered non-traded REIT sponsored and managed by a subsidiary of Colony Capital, merged with and into the Company, with the Company surviving the merger (the “NorthStar I Merger”), (iv) NorthStar Real Estate Income II, Inc. (“NorthStar II”), a publicly registered non-traded REIT sponsored and managed by a subsidiary of Colony Capital, merged with and into the Company, with the Company surviving the merger (the “NorthStar II Merger” and, together with the NorthStar I Merger, the “Mergers”), and (v) immediately following the Mergers, the Company contributed and conveyed to the OP the CLNY OP Contributed Portfolio and the equity interests of each of NorthStar Real Estate Income Trust Operating Partnership, LP, a Delaware limited partnership and the operating partnership of NorthStar I, and NorthStar Real Estate Income Operating Partnership II, LP, a Delaware limited partnership and the operating partnership of NorthStar II, then-owned by the Company in exchange for units of membership interest in the OP (the “Company Contribution” and, collectively with the Mergers and the CLNY Contributions, the “Combination”).
On
January 18, 2018
, the Combination was approved by the stockholders of NorthStar I and NorthStar II. The Combination closed on
January 31, 2018
(the “Closing Date”) and the Company’s Class A common stock, par value
$0.01
per share (the “Class A common stock”), began trading on the NYSE on
February 1, 2018
under the symbol “CLNC.”
The Combination is accounted for under the acquisition method for business combinations pursuant to Accounting Standards Codification (“ASC”) Topic 805,
Business Combinations
, with the Company as the accounting acquirer.
Details of the Combination are described more fully in Note 3, “Business Combinations” and the accounting treatment thereof in Note 2, “Summary of Significant Accounting Policies.”
F-10
COLONY CREDIT REAL ESTATE, INC.
NOTES TO CONSOLIDATED FINANCIAL STATEMENTS (Continued)
|
2.
|
Summary of Significant Accounting Policies
|
The significant accounting policies of the Company are described below. The accounting policies of the Company’s unconsolidated ventures are substantially similar to those of the Company.
Basis of Presentation
The consolidated financial statements include the results of operations of Colony Credit Real Estate, Inc. and certain consolidated investment entities contributed by CLNY (the “CLNY Investment Entities”) for periods on or prior to the closing of the Combination on
January 31, 2018
and the combined operations of Colony Credit Real Estate, Inc., NorthStar I and NorthStar II beginning
February 1, 2018
, following the closing of the Combination.
The assets and liabilities contributed by CLNY to the Company consisted of its ownership interests in the CLNY Investment Entities, ranging from
38%
to
100%
. The remaining interests in the CLNY Investment Entities are owned by investment vehicles sponsored by Colony Capital or third parties and were not contributed to the Company.
The CLNY Contributions were accounted for as a reorganization of entities under common control, since both the Company and the CLNY Investment Entities were under common control of Colony Capital at the time the contributions were made. Accordingly, the contributed assets and liabilities were recorded at carryover basis and the Company’s financial statements for prior periods were recast to reflect the consolidation of the CLNY Investment Entities as if the contribution had occurred on the date of the earliest period presented. The assets, liabilities and noncontrolling interests of the CLNY Investment Entities in the consolidated financial statements for periods prior to the Combination were carved out of the books and records of Colony Capital at their historical carrying amounts. Accordingly, the historical consolidated financial statements were prepared giving consideration to the rules and regulations of the Securities and Exchange Commission (“SEC”) and related guidance provided by the SEC Staff with respect to carve-out financial statements and reflect allocations of certain corporate costs from Colony Capital. These charges were based on either specifically identifiable costs incurred on behalf of the CLNY Investment Entities or an allocation of costs estimated to be applicable to the CLNY Investment Entities, primarily based on the relative assets under management of the CLNY Investment Entities to Colony Capital’s total assets under management. Such costs do not necessarily reflect what the actual costs would have been if the Company had been operating as a separate stand-alone public entity for periods prior to the Combination.
Following the Combination, the Company reconsidered whether it was the primary beneficiary of certain variable interest entities (“VIEs”), which resulted in the deconsolidation of certain of the CLNY Investment Entities and the consolidation of certain securitization trusts in which NorthStar I or NorthStar II held an interest, as more fully described below. Accordingly, comparisons of financial information for periods prior to the Combination with subsequent periods may not be meaningful.
The Combination
The Combination is accounted for under the acquisition method for business combinations pursuant to ASC Topic 805,
Business Combinations
. In the Combination, the Company was considered to be the accounting acquirer so all of its assets and liabilities immediately prior to the closing of the Combination are reflected at their historical carrying values. The consideration transferred by the Company established a new accounting basis for the assets acquired, liabilities assumed and noncontrolling interests of NorthStar I and NorthStar II, which were measured at their respective fair values on the Closing Date.
Formation of Colony Capital
Colony Capital was formed through a tri-party merger (the “CLNY Merger”) among Colony Capital, NorthStar Asset Management Group Inc. and NorthStar Realty Finance Corp. (“NRF”), which closed on
January 10, 2017
(the “CLNY Merger Closing Date”). Colony Capital was determined to be the accounting acquirer in the CLNY Merger. Accordingly, the combined financial information of the CLNY Investment Entities included herein as of any date or for any periods on or prior to the CLNY Merger Closing Date represent the CLNY Investment Entities from Colony Capital. On the CLNY Merger Closing Date, the CLNY Investment Entities were reflected by Colony Capital at their pre-CLNY Merger carrying values, while the CLNY Investment Entities from NRF were reflected by Colony Capital at their CLNY Merger fair values. The results of operations of the CLNY Investment Entities from NRF are included in these pre-Combination financial statements effective from
January 11, 2017
.
Use of Estimates
The preparation of consolidated financial statements in conformity with generally accepted accounting principles in the United States (“U.S. GAAP”) requires management to make estimates and assumptions that affect the amounts reported in the consolidated financial statements and accompanying notes. Actual results could differ from those estimates and assumptions.
F-11
COLONY CREDIT REAL ESTATE, INC.
NOTES TO CONSOLIDATED FINANCIAL STATEMENTS (Continued)
Principles of Consolidation
The accompanying consolidated financial statements include the accounts of the Company and its controlled subsidiaries. The portions of the equity, net income and other comprehensive income of consolidated subsidiaries that are not attributable to the parent are presented separately as amounts attributable to noncontrolling interests in the consolidated financial statements.
The Company consolidates entities in which it has a controlling financial interest by first considering if an entity meets the definition of a VIE for which the Company is deemed to be the primary beneficiary, or if the Company has the power to control an entity through a majority of voting interest or through other arrangements.
Variable Interest Entities
Variable Interest Entities—
A VIE is an entity that either (i) lacks sufficient equity to finance its activities without additional subordinated financial support from other parties; (ii) whose equity holders lack the characteristics of a controlling financial interest; or (iii) is established with non-substantive voting rights. A VIE is consolidated by its primary beneficiary, which is defined as the party who has a controlling financial interest in the VIE through (a) power to direct the activities of the VIE that most significantly affect the VIE’s economic performance, and (b) obligation to absorb losses or right to receive benefits of the VIE that could be significant to the VIE. The Company also considers interests held by its related parties, including de facto agents. The Company assesses whether it is a member of a related party group that collectively meets the power and benefits criteria and, if so, whether the Company is most closely associated with the VIE. In performing the related party analysis, the Company considers both qualitative and quantitative factors, including, but not limited to: the amount and characteristics of its investment relative to the related party; the Company’s and the related party's ability to control or significantly influence key decisions of the VIE including consideration of involvement by de facto agents; the obligation or likelihood for the Company or the related party to fund operating losses of the VIE; and the similarity and significance of the VIE’s business activities to those of the Company and the related party. The determination of whether an entity is a VIE, and whether the Company is the primary beneficiary, may involve significant judgment, including the determination of which activities most significantly affect the entities’ performance, and estimates about the current and future fair values and performance of assets held by the VIE.
Voting Interest Entities—
Unlike VIEs, voting interest entities have sufficient equity to finance their activities and equity investors exhibit the characteristics of a controlling financial interest through their voting rights. The Company consolidates such entities when it has the power to control these entities through ownership of a majority of the entities' voting interests or through other arrangements.
At each reporting period, the Company reassesses whether changes in facts and circumstances cause a change in the status of an entity as a VIE or voting interest entity, and/or a change in the Company's consolidation assessment.
Changes in consolidation status are applied prospectively. An entity may be consolidated as a result of this reassessment, in which case, the assets, liabilities and noncontrolling interest in the entity are recorded at fair value upon initial consolidation. Any existing equity interest held by the Company in the entity prior to the Company obtaining control will be remeasured at fair value, which may result in a gain or loss recognized upon initial consolidation. However, if the consolidation represents an asset acquisition of a voting interest entity, the Company's existing interest in the acquired assets, if any, is not remeasured to fair value but continues to be carried at historical cost. The Company may also deconsolidate a subsidiary as a result of this reassessment, which may result in a gain or loss recognized upon deconsolidation depending on the carrying values of deconsolidated assets and liabilities compared to the fair value of any interests retained.
As of
December 31, 2018
, the Company has identified certain consolidated and unconsolidated VIEs. Assets of each of the VIEs, other than the OP, may only be used to settle obligations of the respective VIE. Creditors of each of the VIEs have no recourse to the general credit of the Company.
Consolidated VIEs
The Company’s operating subsidiary, the OP, is a limited liability company that has governing provisions that are the functional equivalent of a limited partnership. The Company holds the majority of membership interest in the OP, is the managing member of the OP and exercises full responsibility, discretion and control over the day-to-day management of the OP. The noncontrolling interests in the OP do not have substantive liquidation rights, substantive kick-out rights without cause, or substantive participating rights that could be exercised by a simple majority of noncontrolling interest members (including by such a member unilaterally). The absence of such rights, which represent voting rights in a limited partnership equivalent structure, would render the OP to be a VIE. The Company, as managing member, has the power to direct the core activities of the OP that most significantly affect the OP’s performance, and through its majority interest in the OP, has both the right to receive benefits from and the obligation to absorb losses of the OP. Accordingly, the Company is the primary beneficiary of the OP and consolidates the OP. As the Company
F-12
COLONY CREDIT REAL ESTATE, INC.
NOTES TO CONSOLIDATED FINANCIAL STATEMENTS (Continued)
conducts its business and holds its assets and liabilities through the OP, the total assets and liabilities of the OP represent substantially all of the total consolidated assets and liabilities of the Company
.
Other consolidated VIEs include the Investing VIEs (as defined and discussed below) and certain operating real estate properties that have noncontrolling interests. The noncontrolling interests in the operating real estate properties represent third party joint venture partners with ownership ranging from
5.0%
to
20.0%
. These noncontrolling interests do not have substantive kick-out nor participating rights.
Investing VIEs
The Company’s investments in securitization financing entities (“Investing VIEs”) include subordinate first-loss tranches of securitization trusts, which represent interests in such VIEs. Investing VIEs are structured as pass through entities that receive principal and interest payments from the underlying debt collateral assets and distribute those payments to the securitization trust’s certificate holders, including the most subordinate tranches of the securitization trust. Generally, a securitization trust designates the most junior subordinate tranche outstanding as the controlling class, which entitles the holder of the controlling class to unilaterally appoint and remove the special servicer for the trust, and as such may qualify as the primary beneficiary of the trust.
If it is determined that the Company is the primary beneficiary of an Investing VIE as a result of acquiring the subordinate first-loss tranches of the securitization trust, the Company would consolidate the assets, liabilities, income and expenses of the entire Investing VIE. The assets held by an Investing VIE are restricted and can only be used to fulfill its own obligations. The obligations of an Investing VIE have neither any recourse to the general credit of the Company as the consolidating parent entity of an Investing VIE, nor to any of the Company’s other consolidated entities.
As of
December 31, 2018
, the Company held subordinate tranches of securitization trusts in
three
Investing VIEs for which the Company has determined it is the primary beneficiary because it has the power to direct the activities that most significantly impact the economic performance of the securitization trusts. The Company’s subordinate tranches of the securitization trusts, which represent the retained interest and related interest income, are eliminated in consolidation. As a result, all of the assets, liabilities (obligations to the certificate holders of the securitization trusts, less the Company’s retained interest from the subordinate tranches of the securitization trusts), income and expenses of the Investing VIEs are presented in the consolidated financial statements of the Company although the Company legally owns the subordinate tranches of the securitization trusts only. Regardless of the presentation, the Company’s consolidated financial statements of operations ultimately reflect the net income attributable to its retained interest in the subordinate tranches of the securitization trusts. Refer to Note 6, “Real Estate Securities, Available for Sale” for further discussion.
The Company elected the fair value option for the initial recognition of the assets and liabilities of its consolidated Investing VIEs. Interest income and interest expense associated with the Investing VIEs are presented separately on the consolidated statements of operations, and the assets and liabilities of the Investing VIEs are separately presented as “Mortgage loans held in securitization trusts, at fair value” and “Mortgage obligations issued by securitization trusts, at fair value,” respectively, on the consolidated balance sheets. Refer to Note 15, “Fair Value” for further discussion.
The Company has adopted guidance issued by the Financial Accounting Standards Board (“FASB”), allowing the Company to measure both the financial assets and liabilities of a qualifying collateralized financing entity (“CFE”), such as its Investing VIEs, using the fair value of either the CFE’s financial assets or financial liabilities, whichever is more observable. A CFE is a VIE that holds financial assets, issues beneficial interests in those assets and has no more than nominal equity, and the beneficial interests have contractual recourse only to the related assets of the CFE. As the liabilities of the Company’s Investing VIEs are marketable securities with observable trade data, their fair value is more observable and is referenced to determine fair value of the assets of its Investing VIEs. Refer to Note 15, “Fair Value” for further discussion.
Unconsolidated VIEs
As of
December 31, 2018
, the Company identified unconsolidated VIEs related to its securities investments, indirect interests in real estate through real estate private equity funds (“PE Investments”) and CRE debt investments. Based on management’s analysis, the Company determined that it is not the primary beneficiary of the above VIEs. Accordingly, the VIEs are not consolidated in the Company’s financial statements as of
December 31, 2018
.
Assets of each of the VIEs may only be used to settle obligations of the respective VIE. Creditors of each of the VIEs have no recourse to the general credit of the Company.
F-13
COLONY CREDIT REAL ESTATE, INC.
NOTES TO CONSOLIDATED FINANCIAL STATEMENTS (Continued)
The following table presents the Company’s classification, carrying value and maximum exposure of unconsolidated VIEs as of
December 31, 2018
(dollars in thousands):
|
Carrying Value
|
Maximum Exposure to Loss
|
|||||||
|
Real estate securities, available for sale
|
$
|
228,185
|
|
$
|
229,512
|
|
||
|
Investments in unconsolidated ventures
|
561,754
|
|
583,160
|
|
||||
|
Loans and preferred equity held for investment, net
|
225,691
|
|
225,691
|
|
||||
|
Total assets
|
$
|
1,015,630
|
|
$
|
1,038,363
|
|
||
The Company did not provide financial support to the unconsolidated VIEs during the
year ended
December 31, 2018
. As of
December 31, 2018
, there were
no
explicit arrangements or implicit variable interests that could require the Company to provide financial support to the unconsolidated VIEs. The maximum exposure to loss of real estate securities, available for sale was determined as the amortized cost, which represents the purchase price of the investments adjusted by any unamortized premiums or discounts as of the reporting date. The maximum exposure to loss of investments in unconsolidated ventures and loans and preferred equity held for investment, net was determined as the carrying value plus any future funding commitments. Refer to Note 4, “Loans and Preferred Equity Held for Investment, net” and Note 18, “Commitments and Contingencies” for further discussion.
Deconsolidation of the CLNY Investment Entities
Certain CLNY Investment Entities were joint ventures between Colony Capital and private funds or other investment vehicles managed by Colony Capital (the “Co-Investment Funds”). Colony Capital consolidated such CLNY Investment Entities as it was deemed to have a controlling financial interest in these CLNY Investment Entities. After assuming Colony Capital’s ownership interests in these CLNY Investment Entities and upon the merger with NorthStar I and NorthStar II, the Company does not have a controlling financial interest in these CLNY Investment Entities. The Company does not have the ability to direct key decisions made by the directors of these entities nor is it the primary beneficiary of these entities as Colony Capital continues to be the investment manager of the Co-Investment Funds and the directors and officers of these entities continue to be employees of Colony Capital. The Company itself is managed by a subsidiary of Colony Capital and does not have any employees of its own. Therefore, upon closing of the Combination, the Company deconsolidated the CLNY Investment Entities that are joint ventures with Co-Investment Funds.
The deconsolidation of these CLNY Investment Entities did not result in any gain or loss to the Company. The following table presents the deconsolidation of the assets and liabilities of certain of the CLNY Investment Entities, and accounting for the Company’s interests in these CLNY Investment Entities as equity method investments as of the Closing Date (dollars in thousands):
|
As of the Closing Date
|
|||
|
Assets
|
|||
|
Cash and cash equivalents
|
$
|
(11,408
|
)
|
|
Restricted cash
|
(14,704
|
)
|
|
|
Loans and preferred equity held for investment, net
|
(553,678
|
)
|
|
|
Investments in unconsolidated ventures
|
127,062
|
|
|
|
Receivables, net
|
(4,344
|
)
|
|
|
Other assets
|
(114
|
)
|
|
|
Total assets
|
$
|
(457,186
|
)
|
|
Liabilities
|
|||
|
Mortgage and other notes payable, net
|
$
|
(128,709
|
)
|
|
Accrued and other liabilities
|
(640
|
)
|
|
|
Escrow deposits payable
|
(14,704
|
)
|
|
|
Total liabilities
|
(144,053
|
)
|
|
|
Stockholders’ equity
|
(313,133
|
)
|
|
|
Total liabilities and equity
|
$
|
(457,186
|
)
|
Prior to the deconsolidation of the CLNY Investment Entities, noncontrolling interest as recorded in the CLNY Investment Entities combined financial statements consisted of interests in the held by third party joint ventures. Following the deconsolidation of the
F-14
COLONY CREDIT REAL ESTATE, INC.
NOTES TO CONSOLIDATED FINANCIAL STATEMENTS (Continued)
CLNY Investment Entities, the noncontrolling interest in the Company’s consolidated financial statements additionally consists of Colony Capital ownership interests in joint ventures. These interests were previously classified as other owners in the CLNY Investment Entities combined financial statements, but have been reclassified to noncontrolling interests in the Company’s consolidated financial statements.
Noncontrolling Interests
Noncontrolling Interests in Investment Entities—
This represents interests in consolidated investment entities held by third party joint venture partners and prior to the closing of the Combination, such interests held by private funds managed by Colony Capital. Allocation of net income or loss is generally based upon relative ownership interests held by equity owners in each investment entity, or based upon contractual arrangements that may provide for disproportionate allocation of economic returns among equity interests, including using a hypothetical liquidation at book value basis, where applicable and substantive.
Noncontrolling Interests in the Operating Partnership—
This represents membership interests in the OP held by RED REIT. Noncontrolling interests in the OP are allocated a share of net income or loss in the OP based on their weighted average ownership interest in the OP during the period. Noncontrolling interests in the OP have the right to require the OP to redeem part or all of the membership units in the OP for cash based on the market value of an equivalent number of shares of Class A common stock at the time of redemption, or at the Company’s election as managing member of the OP, through the issuance of shares of Class A common stock on a
one
-for-one basis. Refer to Note 3, “Business Combinations,” for further discussion of OP membership units. At the end of each reporting period, noncontrolling interests in the OP is adjusted to reflect their ownership percentage in the OP at the end of the period, through a reallocation between controlling and noncontrolling interests in the OP, as applicable.
Comprehensive Income (Loss)
The Company reports consolidated comprehensive income (loss) in separate statements following the consolidated statements of operations. Comprehensive income (loss) is defined as the change in equity resulting from net income (loss) and other comprehensive income (“OCI”). The components of OCI include unrealized gain (loss) on CRE debt securities available for sale for which the fair value option was not elected, gain (loss) on derivative instruments used in the Company’s risk management activities used for economic hedging purposes (“designated hedges”), and gain (loss) on foreign currency translation.
Fair Value Measurement
Fair value is based on an exit price, defined as the price that would be received to sell an asset or paid to transfer a liability in an orderly transaction between market participants. Where appropriate, the Company makes adjustments to estimated fair values to appropriately reflect counterparty credit risk as well as the Company’s own credit-worthiness.
The estimated fair value of financial assets and financial liabilities are categorized into a three-tier hierarchy, prioritized based on the level of transparency in inputs used in the valuation techniques, as follows:
Level 1—
Quoted prices (unadjusted) in active markets for identical assets or liabilities.
Level 2—
Observable inputs other than Level 1 prices, such as quoted prices for similar assets or liabilities, quoted prices in non-active markets, or valuation techniques utilizing inputs that are derived principally from or corroborated by observable data directly or indirectly for substantially the full term of the financial instrument.
Level 3—
At least one assumption or input is unobservable and it is significant to the fair value measurement, requiring significant management judgment or estimate.
Where the inputs used to measure the fair value of a financial instrument fall into different levels of the fair value hierarchy, the financial instrument is categorized within the hierarchy based on the lowest level of input that is significant to its fair value measurement.
Fair Value Option
The fair value option provides an option to elect fair value as an alternative measurement for selected financial instruments. Gains and losses on items for which the fair value option has been elected are reported in earnings. The fair value option may be elected only upon the occurrence of certain specified events, including when the Company enters into an eligible firm commitment, at initial recognition of the financial instrument, as well as upon a business combination or consolidation of a subsidiary. The election is irrevocable unless a new election event occurs.
The Company has elected the fair value option for PE Investments. The Company has also elected the fair value option to account for the eligible financial assets and liabilities of its consolidated Investing VIEs in order to mitigate potential accounting mismatches
F-15
COLONY CREDIT REAL ESTATE, INC.
NOTES TO CONSOLIDATED FINANCIAL STATEMENTS (Continued)
between the carrying value of the instruments and the related assets and liabilities to be consolidated. The Company has adopted guidance issued by the FASB allowing the Company to measure both the financial assets and liabilities of a qualifying CFE it consolidates using the fair value of either the CFE’s financial assets or financial liabilities, whichever is more observable.
Business Combinations
Definition of a Business—
The Company evaluates each purchase transaction to determine whether the acquired assets meet the definition of a business. If substantially all of the fair value of gross assets acquired is concentrated in a single identifiable asset or a group of similar identifiable assets, then the set of transferred assets and activities is not a business. If not, for an acquisition to be considered a business, it would have to include an input and a substantive process that together significantly contribute to the ability to create outputs (i.e., there is a continuation of revenue before and after the transaction). A substantive process is not ancillary or minor, cannot be replaced without significant costs, effort or delay or is otherwise considered unique or scarce. To qualify as a business without outputs, the acquired assets would require an organized workforce with the necessary skills, knowledge and experience that performs a substantive process.
Asset Acquisitions—
For acquisitions that are not deemed to be businesses, the assets acquired are recognized based on their cost to the Company as the acquirer and no gain or loss is recognized unless the fair value of non-cash assets given as consideration differs from the carrying amount of the assets acquired. The cost of assets acquired in a group is allocated to individual assets within the group based on their relative fair values and does not give rise to goodwill. Transaction costs related to the acquisition of assets are included in the cost basis of the assets acquired.
Business Combinations—
The Company accounts for acquisitions that qualify as business combinations by applying the acquisition method. Transaction costs related to the acquisition of a business are expensed as incurred and excluded from the fair value of consideration transferred. The identifiable assets acquired, liabilities assumed and noncontrolling interests in an acquired entity are recognized and measured at their estimated fair values. The excess of the fair value of consideration transferred over the fair values of identifiable assets acquired, liabilities assumed and noncontrolling interests in an acquired entity, net of fair value of any previously held interest in the acquired entity, is recorded as goodwill. Such valuations require management to make significant estimates and assumptions.
Cash and Cash Equivalents
Short-term, highly liquid investments with original maturities of three months or less are considered to be cash equivalents. The Company did not have any cash equivalents at
December 31, 2018
or
December 31, 2017
. The Company’s cash is held with major financial institutions and may at times exceed federally insured limits.
Restricted Cash
Restricted cash consists primarily of borrower escrow deposits, tenant escrow deposits and real estate capital expenditure reserves.
Loans and Preferred Equity Held for Investment
The Company originates and purchases loans and preferred equity held for investment. The accounting framework for loans and preferred equity held for investment depends on the Company’s strategy whether to hold or sell the loan, whether the loan was credit-impaired at the time of acquisition, or if the lending arrangement is an acquisition, development and construction loan.
Loans and Preferred Equity Held for Investment
Loans and preferred equity that the Company has the intent and ability to hold for the foreseeable future are classified as held for investment. Originated loans and preferred equity are recorded at amortized cost, or outstanding unpaid principal balance plus exit fees less net deferred loan fees. Net deferred loan fees include unamortized origination and other fees charged to the borrower less direct incremental loan origination costs incurred by the Company. Purchased loans and preferred equity are recorded at amortized cost, or unpaid principal balance plus purchase premium or less unamortized discount. Costs to purchase loans and preferred equity are expensed as incurred.
Interest Income—
Interest income is recognized based upon contractual interest rate and unpaid principal balance of the loans and preferred equity investments. Net deferred loan fees on originated loans and preferred equity investments are deferred and amortized as adjustments to interest income over the expected life of the loans and preferred equity investments using the effective yield method. Premium or discount on purchased loans and preferred equity investments are amortized as adjustments to interest income over the expected life of the loans and preferred equity investments using the effective yield method. When a loan or preferred equity investment is prepaid, prepayment fees and any excess of proceeds over the carrying amount of the loan or preferred equity investment is recognized as additional interest income.
F-16
COLONY CREDIT REAL ESTATE, INC.
NOTES TO CONSOLIDATED FINANCIAL STATEMENTS (Continued)
Nonaccrual—
Accrual of interest income is suspended on nonaccrual loans and preferred equity investments. Loans and preferred equity investments that are past due 90 days or more as to principal or interest, or where reasonable doubt exists as to timely collection, are generally considered nonperforming and placed on nonaccrual. Interest receivable is reversed against interest income when loans and preferred equity investments are placed on nonaccrual status. Interest collected is recognized on a cash basis by crediting income when received; or if ultimate collectability of loan and preferred equity principal is uncertain, interest collected is recognized using a cost recovery method by applying interest collected as a reduction to loan and preferred equity carrying value. Loans and preferred equity investments may be restored to accrual status when all principal and interest are current and full repayment of the remaining contractual principal and interest are reasonably assured.
Impairment and Allowance for Loan Losses—
On a periodic basis, the Company analyzes the extent and effect of any credit migration from underwriting and the initial investment review associated with the performance of a loan and preferred equity investment and/or value of its underlying collateral, financial and operating capability of the borrower or sponsor, as well as amount and status of any senior loan, where applicable. Specifically, operating results of collateral properties and any cash reserves are analyzed and used to assess whether cash from operations are sufficient to cover debt service requirements currently and into the future, ability of the borrower to refinance the loan or preferred equity investment, liquidation value of collateral properties, and financial wherewithal of any loan guarantors, as well as the borrower’s competency in managing and operating the collateral properties. Such analysis is performed at least quarterly, or more often as needed when impairment indicators are present. During the
year ended
December 31, 2018
, the Company recorded
$113.9 million
of provision for loan loss. See Note 4, “Loans and Preferred Equity Held for Investment, net” for further detail.
Loans and preferred equity investments are considered to be impaired when it is probable that the Company will not be able to collect all amounts due in accordance with contractual terms of the loans and preferred equity investments, including consideration of underlying collateral value. Allowance for loan losses represents the estimated probable credit losses inherent in loans and preferred equity held for investment at balance sheet date. Changes in allowance for loan and preferred equity losses are recorded in the provision for loan losses on the statement of operations. Allowance for loan losses generally exclude interest receivable as accrued interest receivable is reversed when a loan or preferred equity investment is placed on nonaccrual status. Allowance for loan losses is generally measured as the difference between the carrying value of the loan or preferred equity investment and either the present value of cash flows expected to be collected, discounted at the original effective interest rate of the loan or preferred equity investment or an observable market price for the loan or preferred equity investment. Subsequent changes in impairment are recorded as adjustments to the provision for loan losses. Loans and preferred equity investments are charged off against allowance for loan losses when all or a portion of the principal amount is determined to be uncollectible. A loan or preferred equity investment is considered to be collateral-dependent when repayment of the loan or preferred equity investment is expected to be provided solely by the underlying collateral. Impaired collateral-dependent loans and preferred equity investments are written down to the fair value of the collateral less disposal cost, first through a charge-off against allowance for loan losses, if any, then recorded as impairment loss.
Troubled Debt Restructuring (“TDR”)—
A loan with contractual terms modified in a manner that grants concession to the borrower who is experiencing financial difficulty is classified as a TDR. Concessions could include term extensions, payment deferrals, interest rate reductions, principal forgiveness, forbearance, or other actions designed to maximize the Company’s collection on the loan. As a TDR is generally considered to be an impaired loan, it is measured for impairment based on the Company’s allowance for loan losses methodology.
Loans Held for Sale
Loans that the Company intends to sell or liquidate in the foreseeable future are classified as held for sale. Loans held for sale are carried at the lower of amortized cost or fair value less disposal cost, with valuation changes recognized as impairment loss. Loans held for sale are not subject to allowance for loan losses. Net deferred loan origination fees and loan purchase premiums or discounts are deferred and capitalized as part of the carrying value of the held for sale loan until the loan is sold, therefore included in the periodic valuation adjustments based on lower of cost or fair value less disposal cost.
Acquisition, Development and Construction (“ADC”) Arrangements
The Company provides loans to third party developers for the acquisition, development and construction of real estate. Under an ADC arrangement, the Company participates in the expected residual profits of the project through the sale, refinancing or other use of the property. The Company evaluates the characteristics of each ADC arrangement, including its risks and rewards, to determine whether they are more similar to those associated with a loan or an investment in real estate. ADC arrangements with characteristics implying loan classification are presented as loans held for investment and result in the recognition of interest income. ADC arrangements with characteristics implying real estate joint ventures are presented as investments in unconsolidated joint ventures and are accounted for using the equity method. The classification of each ADC arrangement as either loan receivable
F-17
COLONY CREDIT REAL ESTATE, INC.
NOTES TO CONSOLIDATED FINANCIAL STATEMENTS (Continued)
or real estate joint venture involves significant judgment and relies on various factors, including market conditions, amount and timing of expected residual profits, credit enhancements in the form of guaranties, estimated fair value of the collateral, and significance of borrower equity in the project, among others. The classification of ADC arrangements is performed at inception, and periodically reassessed when significant changes occur in the circumstances or conditions described above.
Operating Real Estate
Real Estate Acquisitions—
Real estate acquired in acquisitions that are deemed to be business combinations is recorded at the fair values of the acquired components at the time of acquisition, allocated among land, buildings, improvements, equipment and lease-related tangible and identifiable intangible assets and liabilities, including forgone leasing costs, in-place lease values and above- or below-market lease values. Real estate acquired in acquisitions that are deemed to be asset acquisitions is recorded at the total value of consideration transferred, including transaction costs, and allocated to the acquired components based upon relative fair value. The estimated fair value of acquired land is derived from recent comparable sales of land and listings within the same local region based on available market data. The estimated fair value of acquired buildings and building improvements is derived from comparable sales, discounted cash flow analysis using market-based assumptions, or replacement cost, as appropriate.
The fair value of site and tenant improvements is estimated based upon current market replacement costs and other relevant market rate information.
Real Estate Held for Investment
Real estate held for investment is carried at cost less accumulated depreciation.
Costs Capitalized or Expensed—
Expenditures for ordinary repairs and maintenance are expensed as incurred, while expenditures for significant renovations that improve or extend the useful life of the asset are capitalized and depreciated over their estimated useful lives.
Depreciation—
Real estate held for investment, other than land, is depreciated on a straight-line basis over the estimated useful lives of the assets, as follows:
|
Real Estate Assets
|
Term
|
|
|
Building (fee interest)
|
19 to 48 years
|
|
|
Building leasehold interests
|
Lesser of remaining term of the lease or remaining life of the building
|
|
|
Building improvements
|
Lesser of the useful life or remaining life of the building
|
|
|
Land improvements
|
6 to 15 years
|
|
|
Tenant improvements
|
Lesser of the useful life or remaining term of the lease
|
|
|
Furniture, fixtures and equipment
|
2 to 8 years
|
|
Impairment—
The Company evaluates its real estate held for investment for impairment periodically or whenever events or changes in circumstances indicate that the carrying amounts may not be recoverable. The Company evaluates real estate for impairment generally on an individual property basis. If an impairment indicator exists, the Company evaluates the undiscounted future net cash flows that are expected to be generated by the property, including any estimated proceeds from the eventual disposition of the property. If multiple outcomes are under consideration, the Company may apply a probability-weighted approach to the impairment analysis. Based upon the analysis, if the carrying value of a property exceeds its undiscounted future net cash flows, an impairment loss is recognized for the excess of the carrying value of the property over the estimated fair value of the property. In evaluating and/or measuring impairment, the Company considers, among other things, current and estimated future cash flows associated with each property, market information for each sub-market, including, where applicable, competition levels, foreclosure levels, leasing trends, occupancy trends, lease or room rates, and the market prices of similar properties recently sold or currently being offered for sale, and other quantitative and qualitative factors. Another key consideration in this assessment is the Company’s assumptions about the highest and best use of its real estate investments and its intent and ability to hold them for a reasonable period that would allow for the recovery of their carrying values. If such assumptions change and the Company shortens its expected hold period, this may result in the recognition of impairment losses. During the
year ended
December 31, 2018
, the Company recorded a
$31.8 million
impairment loss on its operating real estate portfolio. See Note 7, “Real Estate, net” and Note 15, “Fair Value,” for further detail.
Real Estate Held for Sale
Real estate is classified as held for sale in the period when (i) management approves a plan to sell the asset, (ii) the asset is available for immediate sale in its present condition, subject only to usual and customary terms, (iii) a program is initiated to locate a buyer and actively market the asset for sale at a reasonable price, and (iv) completion of the sale is probable within one year. Real estate
F-18
COLONY CREDIT REAL ESTATE, INC.
NOTES TO CONSOLIDATED FINANCIAL STATEMENTS (Continued)
held for sale is stated at the lower of its carrying amount or estimated fair value less disposal cost, with any write-down to fair value less disposal cost recorded as an impairment loss. For any increase in fair value less disposal cost subsequent to classification as held for sale, the impairment loss may be reversed, but only up to the amount of cumulative loss previously recognized. Depreciation is not recorded on assets classified as held for sale. At the time a sale is consummated, the excess, if any, of sale price less selling costs over carrying value of the real estate is recognized as a gain.
If circumstances arise that were previously considered unlikely and, as a result, the Company decides not to sell the real estate asset previously classified as held for sale, the real estate asset is reclassified as held for investment. Upon reclassification, the real estate asset is measured at the lower of (i) its carrying amount prior to classification as held for sale, adjusted for depreciation expense that would have been recognized had the real estate been continuously classified as held for investment, and (ii) its estimated fair value at the time the Company decides not to sell.
Foreclosed Properties
The Company receives foreclosed properties in full or partial settlement of loans held for investment by taking legal title or physical possession of the properties. Foreclosed properties are recognized, generally, at the time the real estate is received at foreclosure sale or upon execution of a deed in lieu of foreclosure. Foreclosed properties are initially measured at fair value. Deficiencies compared to the carrying value of the loan, after reversing any previously recognized loss provision on the loan, are recorded as impairment loss. The Company periodically evaluates foreclosed properties for subsequent decrease in fair value, which is recorded as an additional impairment loss. Fair value of foreclosed properties is generally based on third party appraisals, broker price opinions, comparable sales or a combination thereof.
Real Estate Securities
The Company classifies its CRE securities investments as available for sale on the acquisition date, which are carried at fair value. Unrealized gains (losses) are recorded as a component of accumulated OCI in the consolidated statements of equity. However, the Company has elected the fair value option for the assets and liabilities of its consolidated Investing VIEs, and as a result, any unrealized gains (losses) on the consolidated Investing VIEs are recorded in unrealized gain (loss) on mortgage loans and obligations held in securitization trusts, net in the consolidated statements of operations. As of
December 31, 2018
, the Company held subordinate tranches of
three
securitization trusts, which represent the Company’s retained interest in the securitization trusts, which the Company consolidates under U.S. GAAP. Refer to Note 6, “Real Estate Securities, Available for Sale” for further discussion.
Impairment
CRE securities for which the fair value option is elected are not evaluated for other-than-temporary impairment (“OTTI”) as any change in fair value is recorded in the consolidated statements of operations. Realized losses on such securities are reclassified to realized loss on mortgage loans and obligations held in securitization trust, net as losses occur.
CRE securities for which the fair value option is not elected are evaluated for OTTI quarterly. Impairment of a security is considered to be other-than-temporary when: (i) the holder has the intent to sell the impaired security; (ii) it is more likely than not the holder will be required to sell the security; or (iii) the holder does not expect to recover the entire amortized cost of the security. When a CRE security has been deemed to be other-than-temporarily impaired due to (i) or (ii), the security is written down to its fair value and an OTTI is recognized in the consolidated statements of operations. In the case of (iii), the security is written down to its fair value and the amount of OTTI is then bifurcated into: (a) the amount related to expected credit losses; and (b) the amount related to fair value adjustments in excess of expected credit losses. The portion of OTTI related to expected credit losses is recognized in the consolidated statements of operations. The remaining OTTI related to the valuation adjustment is recognized as a component of accumulated OCI in the consolidated statements of equity. CRE securities which are not high-credit quality are considered to have an OTTI if the security has an unrealized loss and there has been an adverse change in expected cash flow. The amount of OTTI is then bifurcated as discussed above. As of
December 31, 2018
, the Company did
no
t have any OTTI recorded on its CRE securities.
Investments in Unconsolidated Ventures
A noncontrolling, unconsolidated ownership interest in an entity may be accounted for using one of (i) equity method where applicable; (ii) fair value option if elected; (iii) fair value through earnings if fair value is readily determinable, including election of net asset value ("NAV") practical expedient where applicable; or (iv) for equity investments without readily determinable fair values, the measurement alternative to measure at cost adjusted for any impairment and observable price changes, as applicable.
F-19
COLONY CREDIT REAL ESTATE, INC.
NOTES TO CONSOLIDATED FINANCIAL STATEMENTS (Continued)
Fair value changes of equity method investments under the fair value option are recorded in earnings from investments in unconsolidated ventures. Fair value changes of other equity investments, including adjustments for observable price changes under the measurement alternative, are recorded in other gain (loss).
Equity Method Investments
The Company accounts for investments under the equity method of accounting if it has the ability to exercise significant influence over the operating and financial policies of an entity, but does not have a controlling financial interest. The equity method investment is initially recorded at cost and adjusted each period for capital contributions, distributions and the Company’s share of the entity’s net income or loss as well as other comprehensive income or loss. The Company’s share of net income or loss may differ from the stated ownership percentage interest in an entity if the governing documents prescribe a substantive non-proportionate earnings allocation formula or a preferred return to certain investors. For certain equity method investments, the Company records its proportionate share of income on a one to three month lag. Distributions of operating profits from equity method investments are reported as operating activities, while distributions in excess of operating profits are reported as investing activities in the statement of cash flows under the cumulative earnings approach.
At
December 31, 2018
, the Company’s investments in unconsolidated joint ventures consisted of investments in PE Investments, senior loans, mezzanine loans and preferred equity held in joint ventures, as well as ADC arrangements accounted for as equity method investments. At
December 31, 2017
, the Company’s investments in unconsolidated ventures consisted of investments in PE Investments and ADC arrangements accounted for as equity method investments.
Impairment
Evaluation of impairment applies to equity method investments and equity investments under the measurement alternative. If indicators of impairment exist, the Company will first estimate the fair value of its investment. In assessing fair value, the Company generally considers, among others, the estimated enterprise value of the investee or fair value of the investee's underlying net assets, including net cash flows to be generated by the investee as applicable.
For investments under the measurement alternative, if carrying value of the investment exceeds its fair value, an impairment is deemed to have occurred.
For equity method investments, further consideration is made if a decrease in value of the investment is other-than-temporary to determine if impairment loss should be recognized. Assessment of OTTI involves management judgment, including, but not limited to, consideration of the investee’s financial condition, operating results, business prospects and creditworthiness, the Company’s ability and intent to hold the investment until recovery of its carrying value, or a significant and prolonged decline in traded price of the investee’s equity security. If management is unable to reasonably assert that an impairment is temporary or believes that the Company may not fully recover the carrying value of its investment, then the impairment is considered to be other-than-temporary.
Investments that are other-than-temporarily impaired are written down to their estimated fair value. Impairment loss is recorded in earnings from investments in unconsolidated ventures for equity method investments and in other gain (loss) for investments under the measurement alternative.
Identifiable Intangibles
In a business combination or asset acquisition, the Company may recognize identifiable intangibles that meet either or both the contractual-legal criterion or the separability criterion. An indefinite-lived intangible is not subject to amortization until such time that its useful life is determined to no longer be indefinite, at which point, it will be assessed for impairment and its adjusted carrying amount amortized over its remaining useful life. Finite-lived intangibles are amortized over their useful life in a manner that reflects the pattern in which the intangible is being consumed if readily determinable, such as based upon expected cash flows; otherwise they are amortized on a straight line basis. The useful life of all identified intangibles will be periodically reassessed and if useful life changes, the carrying amount of the intangible will be amortized prospectively over the revised useful life.
Lease Intangibles—
Identifiable intangibles recognized in acquisitions of operating real estate properties generally include in-place leases, above- or below-market leases and deferred leasing costs, all of which have finite lives. In-place leases generate value over and above the tangible real estate because a property that is occupied with leased space is typically worth more than a vacant building without an operating lease contract in place. The estimated fair value of acquired in-place leases is derived based on management’s assessment of costs avoided from having tenants in place, including lost rental income, rent concessions and tenant allowances or reimbursements, that hypothetically would be incurred to lease a vacant building to its actual existing occupancy level on the valuation date. The net amount recorded for acquired in-place leases is included in intangible assets and amortized on
F-20
COLONY CREDIT REAL ESTATE, INC.
NOTES TO CONSOLIDATED FINANCIAL STATEMENTS (Continued)
a straight-line basis as an increase to depreciation and amortization expense over the remaining term of the applicable leases. If an in-place lease is terminated, the unamortized portion is charged to depreciation and amortization expense.
The estimated fair value of the above- or below-market component of acquired leases represents the present value of the difference between contractual rents of acquired leases and market rents at the time of the acquisition for the remaining lease term, discounted for tenant credit risks. Above- or below-market operating lease values are amortized on a straight-line basis as a decrease or increase to rental income, respectively, over the applicable lease terms. This includes fixed rate renewal options in acquired leases that are below-market, which are amortized to decrease rental income over the renewal period. Above- or below-market ground lease obligations are amortized on a straight-line basis as a decrease or increase to rent expense, respectively, over the applicable lease terms. If the above- or below-market operating lease values or above- or below-market ground lease obligations are terminated, the unamortized portion of the lease intangibles are recorded in rental income or rent expense, respectively.
Deferred leasing costs represent management’s estimate of the avoided leasing commissions and legal fees associated with an existing in-place lease. The net amount is included in intangible assets and amortized on a straight-line basis as an increase to depreciation and amortization expense over the remaining term of the applicable lease.
Transfers of Financial Assets
Sale accounting for transfers of financial assets requires the transfer of an entire financial asset, a group of financial assets in its entirety or if a component of the financial asset is transferred, that the component meets the definition of a participating interest with characteristics that mirror the original financial asset.
Transfers of financial assets are accounted for as sales when control over the assets has been surrendered. If the Company has any continuing involvement, rights or obligations with the transferred financial asset (outside of standard representations and warranties), sale accounting requires that the transfer meets the following sale conditions: (1) the transferred asset has been legally isolated; (2) the transferee has the right (free of conditions that constrain it from taking advantage of that right) to pledge or exchange the transferred asset; and (3) the Company does not maintain effective control over the transferred asset through an agreement that provides for (a) both an entitlement and an obligation by the Company to repurchase or redeem the asset before its maturity, (b) the unilateral ability by the Company to reclaim the asset and a more than trivial benefit attributable to that ability, or (c) the transferee requiring the Company to repurchase the asset at a price so favorable to the transferee that it is probable the repurchase will occur.
If sale accounting is met, the transferred financial asset is removed from the balance sheet and a net gain or loss is recognized upon sale, taking into account any retained interests. Transfers of financial assets that do not meet the criteria for sale are accounted for as financing transactions, or secured borrowing.
Derivative Instruments and Hedging Activities
The Company uses derivative instruments to manage its foreign currency risk and interest rate risk. The Company does not use derivative instruments for speculative or trading purposes. All derivative instruments are recorded at fair value and included in other assets or other liabilities on a gross basis on the balance sheet. The accounting for changes in fair value of derivatives depends upon whether or not the Company has elected to designate the derivative in a hedging relationship and the derivative qualifies for hedge accounting. The Company has economic hedges that have not been designated for hedge accounting.
Changes in fair value of derivatives not designated as accounting hedges are recorded in the statement of operations in other gain (loss), net.
For designated accounting hedges, the relationships between hedging instruments and hedged items, risk management objectives and strategies for undertaking the accounting hedges as well as the methods to assess the effectiveness of the derivative prospectively and retrospectively, are formally documented at inception. Hedge effectiveness relates to the amount by which the gain or loss on the designated derivative instrument exactly offsets the change in the hedged item attributable to the hedged risk. If it is determined that a derivative is not expected to be or has ceased to be highly effective at hedging the designated exposure, hedge accounting is discontinued.
Cash Flow Hedges—
The Company uses interest rate caps and swaps to hedge its exposure to interest rate fluctuations in forecasted interest payments on floating rate debt. The effective portion of the change in fair value of the derivative is recorded in accumulated other comprehensive income, while hedge ineffectiveness is recorded in earnings. If the derivative in a cash flow hedge is terminated or the hedge designation is removed, related amounts in accumulated other comprehensive income (loss) are reclassified into earnings.
F-21
COLONY CREDIT REAL ESTATE, INC.
NOTES TO CONSOLIDATED FINANCIAL STATEMENTS (Continued)
Net Investment Hedges—
The Company uses foreign currency hedges to protect the value of its net investments in foreign subsidiaries or equity method investees whose functional currencies are not U.S. dollars. Changes in the fair value of derivatives used as hedges of net investment in foreign operations, to the extent effective, are recorded in the cumulative translation adjustment account within accumulated other comprehensive income (loss).
At the end of each quarter, the Company reassesses the effectiveness of its net investment hedges and as appropriate, dedesignates the portion of the derivative notional amount that is in excess of the beginning balance of its net investments as undesignated hedges.
Release of accumulated other comprehensive income related to net investment hedges occurs upon losing a controlling financial interest in an investment or obtaining control over an equity method investment. Upon sale, complete or substantially complete liquidation of an investment in a foreign subsidiary, or partial sale of an equity method investment, the gain or loss on the related net investment hedge is reclassified from accumulated other comprehensive income to earnings.
Financing Costs
Financing costs primarily include debt discounts and premiums as well as deferred financing costs. Deferred financing costs represent commitment fees, legal and other third-party costs associated with obtaining financing. Costs related to revolving credit facilities are recorded in other assets and are amortized to interest expense using the straight-line basis over the term of the facility. Costs related to other borrowings are recorded net against the carrying value of such borrowings and are amortized to interest expense using the effective interest method. Unamortized deferred financing costs are expensed to realized gain (loss) when the associated facility is repaid before maturity. Costs incurred in seeking financing transactions, which do not close, are expensed in the period in which it is determined that the financing will not occur.
Revenue Recognition
Property Operating Income
Property operating income includes the following:
Rental Income—
Rental income is recognized on a straight-line basis over the noncancelable term of the related lease which includes the effects of minimum rent increases and rent abatements under the lease. Rents received in advance are deferred.
When it is determined that the Company is the owner of tenant improvements, the cost to construct the tenant improvements, including costs paid for or reimbursed by the tenants, is capitalized. For tenant improvements owned by the Company, the amount funded by or reimbursed by the tenants are recorded as deferred revenue, which is amortized on a straight-line basis as additional rental income over the term of the related lease. Rental income recognition commences when the leased space is substantially ready for its intended use and the tenant takes possession of the leased space.
When it is determined that the tenant is the owner of tenant improvements, the Company’s contribution towards those improvements is recorded as a lease incentive, included in deferred leasing costs and intangible assets on the balance sheet, and amortized as a reduction to rental income on a straight-line basis over the term of the lease. Rental income recognition commences when the tenant takes possession of the lease space.
Tenant Reimbursements—
In net lease arrangements, the tenant is generally responsible for operating expenses related to the property, including real estate taxes, property insurance, maintenance, repairs and improvements. Costs reimbursable from tenants and other recoverable costs are recognized as revenue in the period the recoverable costs are incurred. When the Company is the primary obligor with respect to purchasing goods and services for property operations and has discretion in selecting the supplier and retains credit risk, tenant reimbursement revenue and property operating expenses are presented on a gross basis in the statements of operations. For certain triple net leases where the lessee self-manages the property, hires its own service providers and retains credit risk for routine maintenance contracts, no reimbursement revenue and expense are recognized.
Hotel Operating Income—
Hotel operating income includes room revenue, food and beverage sales and other ancillary services. Revenue is recognized upon occupancy of rooms, consummation of sales and provision of services.
F-22
COLONY CREDIT REAL ESTATE, INC.
NOTES TO CONSOLIDATED FINANCIAL STATEMENTS (Continued)
Real Estate Securities
Interest income is recognized using the effective interest method with any premium or discount amortized or accreted through earnings based on expected cash flow through the expected maturity date of the security. Changes to expected cash flow may result in a change to the yield which is then applied retrospectively for high-credit quality securities that cannot be prepaid or otherwise settled in such a way that the holder would not recover substantially all of the investment or prospectively for all other securities to recognize interest income.
Foreign Currency
Assets and liabilities denominated in a foreign currency for which the functional currency is a foreign currency are translated using the exchange rate in effect at the balance sheet date and the corresponding results of operations for such entities are translated using the average exchange rate in effect during the period. The resulting foreign currency translation adjustments are recorded as a component of accumulated other comprehensive income or loss in stockholders’ equity. Upon sale, complete or substantially complete liquidation of a foreign subsidiary, or upon partial sale of a foreign equity method investment, the translation adjustment associated with the investment, or a proportionate share related to the portion of equity method investment sold, is reclassified from accumulated other comprehensive income or loss into earnings.
Assets and liabilities denominated in a foreign currency for which the functional currency is the U.S. dollar are remeasured using the exchange rate in effect at the balance sheet date and the corresponding results of operations for such entities are remeasured using the average exchange rate in effect during the period. The resulting foreign currency remeasurement adjustments are recorded in other gain (loss), net on the consolidated statements of operations.
Disclosures of non-U.S. dollar amounts to be recorded in the future are translated using exchange rates in effect at the date of the most recent balance sheet presented.
Equity-Based Compensation
Equity-classified stock awards granted to executive officers and both independent and non-independent directors are based on the closing price of the Class A common stock on the grant date and recognized on a straight-line basis over the requisite service period of the awards.
The compensation expense is adjusted for actual forfeitures upon occurrence. Equity-based compensation is classified within administrative expense in the consolidated statement of operations.
Earnings Per Share
The Company presents both basic and diluted earnings per share (“EPS”) using the two-class method. Basic EPS is calculated by dividing earnings allocated to common shareholders, as adjusted for unallocated earnings attributable to certain participating securities, if any, by the weighted-average number of common shares outstanding during the period. Diluted EPS is based on the weighted-average number of common shares and the effect of potentially dilutive common share equivalents outstanding during the period. The two-class method is an allocation formula that determines earnings per share for each share of common stock and participating securities according to dividends declared and participation rights in undistributed earnings. Under this method, all earnings (distributed and undistributed) are allocated to common shares and participating securities based on their respective rights to receive dividends. The Company has certain share-based payment awards that contain nonforfeitable rights to dividends, which are considered participating securities for the purposes of computing EPS pursuant to the two-class method.
Income Taxes
The Company intends to elect to be taxed as a REIT and to comply with the related provisions of the Code beginning with its taxable year ended
December 31, 2018
. Accordingly, the Company will generally not be subject to U.S. federal income tax to the extent of its distributions to stockholders as long as certain asset, income, distribution and share ownership tests are met. The Company believes that all of the criteria to maintain the Company’s REIT qualification have been met for the applicable periods, but there can be no assurance that these criteria will continue to be met in subsequent periods. If the Company were to fail to meet these requirements, it would be subject to U.S. federal income tax and potential interest and penalties, which could have a material adverse impact on its results of operations and amounts available for distributions to its stockholders. The Company’s accounting policy with respect to interest and penalties is to classify these amounts as a component of income tax expense, where applicable.
The Company may also be subject to certain state, local and franchise taxes. Under certain circumstances, U.S. federal income and excise taxes may be due on its undistributed taxable income.
F-23
COLONY CREDIT REAL ESTATE, INC.
NOTES TO CONSOLIDATED FINANCIAL STATEMENTS (Continued)
The Company made joint elections to treat certain subsidiaries as taxable REIT subsidiaries (“TRS”) which may be subject to U.S. federal, state and local income taxes. In general, a TRS of the Company may perform non-customary services for tenants, hold assets that the REIT cannot hold directly and engage in most real estate or non-real estate-related business. The Company also holds investments in Europe which are subject to tax in each local jurisdiction.
Certain subsidiaries of the Company are subject to taxation by U.S. federal, state and local authorities for the periods presented. Income taxes are accounted for by the asset/liability approach in accordance with U.S. GAAP. Deferred taxes, if any, represent the expected future tax consequences when the reported amounts of assets and liabilities are recovered or paid. Such amounts arise from differences between the financial reporting and tax bases of assets and liabilities and are adjusted for changes in tax laws and tax rates in the period which such changes are enacted. A provision for income tax represents the total of income taxes paid or payable for the current period, plus the change in deferred taxes. Current and deferred taxes are recorded on the portion of earnings (losses) recognized by the Company with respect to its interest in TRSs. Deferred income tax assets and liabilities are calculated based on temporary differences between the Company’s U.S. GAAP consolidated financial statements and the U.S. federal, state and local tax basis of assets and liabilities as of the consolidated balance sheet date. The Company evaluates the realizability of its deferred tax assets (e.g., net operating loss and capital loss carryforwards) and recognizes a valuation allowance if, based on the available evidence, it is more likely than not that some portion or all of its deferred tax assets will not be realized. When evaluating the realizability of its deferred tax assets, the Company considers estimates of expected future taxable income, existing and projected book/tax differences, tax planning strategies available and the general and industry specific economic outlook. This realizability analysis is inherently subjective, as it requires the Company to forecast its business and general economic environment in future periods. Changes in estimate of deferred tax asset realizability, if any, are included in income tax benefit (expense) in the consolidated statements of operations.
On
December 22, 2017
, the Tax Cuts and Jobs Act was enacted, which provides for a reduction in the U.S. federal corporate income tax rate from
35%
to
21%
effective
January 1, 2018
. At
December 31, 2017
, the Company recognized a provisional amount of approximately
$2.0 million
of income tax expense relating to the remeasurement of its deferred tax balances based on the rate at which they are expected to reverse in the future, which is generally
21%
. During the fourth quarter of 2018, the Company completed its analysis of the Tax Cuts and Jobs Act, which resulted in a reduction in the provisional amount by
$0.1 million
to
$1.9 million
of income tax expense.
For the
years ended
December 31, 2018
, 2017 and 2016, the Company recorded income tax expense of
$37.1 million
,
$2.2 million
and
$1.5 million
, respectively.
Reclassifications
In addition to reclassifications on the statements of cash flows resulting from the adoption of ASU No 2016-18 as discussed below, certain prior period amounts have been reclassified in the consolidated financial statements to conform to current period presentation.
Accounting Standards Adopted in 2018
At the end of fiscal 2018, the Company lost its status as an emerging growth company (“EGC”) as defined in the Jumpstart Our Business Startups Act of 2012 (the “JOBs Act”). As a result, the Company was no longer able to take advantage of the extended transition period for complying with new or revised financial accounting standards and was required to adopt certain standards in 2018 upon loss of EGC status and apply such standards retrospectively to January 1, 2018.
Revenue Recognition—
In May 2014, the FASB issued ASU No. 2014-09,
Revenue from Contracts with Customers,
which amends existing revenue recognition standards by establishing principles for a single comprehensive model for revenue measurement and recognition, along with enhanced disclosure requirements. Key provisions include, but are not limited to, determining which goods or services are capable of being distinct in a contract to be accounted for separately as a performance obligation and recognizing variable consideration only to the extent that it is probable a significant revenue reversal would not occur. The FASB has subsequently issued several amendments to the standard, including clarifying the guidance on assessing principal versus agent based on the notion of control, which affects recognition of revenue on a gross or net basis.
The Company adopted the standard using the modified retrospective approach upon loss of its EGC status and applied the standard retrospectively to
January 1, 2018
. The adoption of the standard did not have any impact on the Company requiring a cumulative adjustment. The standard excludes from its scope the areas of accounting that most significantly affect revenue recognition for the core activities of the Company, including accounting for financial instruments and leases. The standard is applicable to certain property operating income streams of the Company, as discussed below.
F-24
COLONY CREDIT REAL ESTATE, INC.
NOTES TO CONSOLIDATED FINANCIAL STATEMENTS (Continued)
Hotel Operating Income
—
Revenue is recognized upon occupancy of rooms, consummation of sales and provision of services. The Company determined that there is no change to revenue recognized under the new guidance as revenue is recognized over time based on the transaction price.
Financial Instruments—
In January 2016, the FASB issued ASU No. 2016-01,
Recognition and Measurement of Financial Assets and Financial Liabilities
, which affects accounting for investments in equity securities, financial liabilities under the fair value option, as well as presentation and disclosures, but does not affect accounting for investments in debt securities and loans
.
Investments in equity securities, other than equity method investments, will be measured at fair value through earnings, except for equity securities without readily determinable fair values which may be measured at cost less impairment and adjusted for observable price changes under application of the measurement alternative, unless these equity securities qualify for the NAV practical expedient. This provision eliminates cost method accounting and recognition of unrealized holding gains or losses on equity investments in other comprehensive income. For financial liabilities under the fair value option, changes in fair value resulting from the Company’s own instrument-specific credit risk will be recorded separately in other comprehensive income. Fair value disclosures of financial instruments measured at amortized cost are based on exit price and corresponding disclosures of valuation methodology and significant inputs are no longer be required. In February 2018, the FASB issued ASU 2018-03,
Technical Corrections and Improvements to Financial Instruments, Recognition and Measurement of Financial Assets and Financial Liabilities,
which provided several clarifications and amendments to the standard. These include specifying that for equity instruments without readily determinable fair values for which the measurement alternative is applied: (i) adjustments made when an observable transaction occurs for a similar security are intended to reflect the fair value as of the observable transaction date, not as of current reporting date; (ii) the measurement alternative may be discontinued upon an irrevocable election to change to a fair value measurement approach under fair value guidance, which would apply to all identical and similar investments of the same issuer; and (iii) the prospective transition approach for equity securities without readily determinable fair values is applicable only when the measurement alternative is applied. ASU 2016-01 was applied retrospectively with cumulative effect as of the beginning of the first reporting period adopted recognized in retained earnings, except for provisions related to equity investments without readily determinable fair values for which the measurement alternative is applied and exit price fair value disclosures for financial instruments measured at amortized cost, which are to be applied prospectively.
The Company adopted the standard upon loss of its EGC status and applied the standard retrospectively to
January 1, 2018
. It had no impact to the Company. All of the Company’s investments in unconsolidated ventures were equity method investments and the Company does not have any cost method investments nor has the Company elected the fair value option on its financial liabilities which fall under the scope of this guidance.
Cash Flow Classifications—
In August 2016, the FASB issued ASU No. 2016-15,
Statement of Cash Flows: Classification of Certain Cash Receipts and Cash Payments
, which is intended to reduce diversity in practice in certain classifications on the statement of cash flows. This guidance addresses eight types of cash flows, clarifies how the predominance principle should be applied when cash receipts and cash payments have aspects of more than one class of cash flows, and requires an accounting policy election for classification of distributions received from equity method investees using either the cumulative earnings or nature of distributions approach, among others. The Company adopted the new guidance upon the loss of its EGC status and applied the standard retrospectively to
January 1, 2018
. Upon adoption, the Company made an accounting policy election for classification of distributions from its equity method investees using the cumulative earnings approach. The adoption of this standard did not have a material impact on the Company’s financial statements.
Restricted Cash—
In November 2016, the FASB issued ASU No. 2016-18,
Statement of Cash Flows: Restricted Cash
, which requires that cash and cash equivalent balances in the statement of cash flows include restricted cash and restricted cash equivalent amounts, and therefore, changes in restricted cash and restricted cash equivalents be presented in the statement of cash flows. This eliminated the presentation of transfers between cash and cash equivalents with restricted cash and restricted cash equivalents in the statement of cash flows. When cash, cash equivalents, restricted cash and restricted cash equivalents are presented in more than one line item on the balance sheet, this ASU requires disclosure of a reconciliation between the totals in the statement of cash flows and the related captions in the balance sheet. The new guidance also requires disclosure of the nature of restricted cash and restricted cash equivalents, similar to existing requirements under Regulation S-X; however, it does not define restricted cash and restricted cash equivalents. The Company adopted this guidance upon loss of its EGC status and applied the standard retrospectively to
January 1, 2018
. The Company adjusted the presentation of the cash flows retrospectively. The required retrospective application of this new standard resulted in changes to the previously reported statements of cash flow as follows:
F-25
COLONY CREDIT REAL ESTATE, INC.
NOTES TO CONSOLIDATED FINANCIAL STATEMENTS (Continued)
|
Year Ended December 31, 2017
|
Year Ended December 31, 2016
|
|||||||||||
|
(In thousands)
|
As previously Reported
|
After Adoption of ASU 2016-18
|
As previously Reported
|
After Adoption of ASU 2016-18
|
||||||||
|
Net cash provided by operating activities
|
107,922
|
|
106,982
|
|
88,508
|
|
88,508
|
|
||||
|
Net cash provided by investing activities
|
454,958
|
|
439,269
|
|
238,854
|
|
199,372
|
|
||||
|
Net cash used in financing activities
|
(551,658
|
)
|
(551,658
|
)
|
(319,718
|
)
|
(319,718
|
)
|
||||
The decrease in net cash provided by investing activities is primarily due to the return of borrower funds from escrow deposits related to loans and preferred equity held for investment. This was previously classified as noncash investing activities.
Derecognition and Partial Sales of Nonfinancial Assets—
In February 2017, the FASB issued ASU 2017-05,
Clarifying the Scope of Asset Derecognition and Accounting for Partial Sales of Nonfinancial Assets
, which clarifies the scope and application of ASC 610-20,
Other Income
-
Gains and Losses from Derecognition of Nonfinancial Assets
, and defines in substance nonfinancial assets. ASC 610-20 applies to derecognition of all nonfinancial assets which are not contracts with customers or revenue transactions under ASC 606,
Revenue from Contracts with Customers
. Derecognition of a business is governed by ASC 810,
Consolidation
, while derecognition of financial assets, including equity method investments, even if the investee holds predominantly nonfinancial assets, is governed by ASC 860,
Transfers and Servicing
. The ASU also aligns the accounting for partial sales of nonfinancial assets to be more consistent with accounting for sale of a business. Specifically, in a partial sale to a noncustomer, when a noncontrolling interest is received or retained, the latter is considered a noncash consideration and measured at fair value in accordance with ASC 606, which results in full gain or loss recognized upon sale. This ASU removes guidance on partial exchanges of nonfinancial assets in ASC 845,
Nonmonetary Transactions
, and eliminates the real estate sales guidance in ASC 360-20,
Property, Plant and Equipment
-
Real Estate Sales
.
The Company adopted the new guidance as of
January 1, 2018
using the modified retrospective approach, consistent with the adoption of the new revenue standard. Under the new standard, if a partial interest in real estate is sold to noncustomers or contributed to unconsolidated ventures, and a noncontrolling interest in the asset is retained, such transactions could result in a larger gain on sale. The adoption of this standard could have a material impact on the results of operations in a period that a significant partial interest in real estate is sold. There were no such sales during the
year ended
December 31, 2018
.
Share-Based Payments—
In June 2018, the FASB issued ASU 2018-07,
Improvements to Nonemployee Share-Based Payment Accounting
, which simplifies the accounting for share-based payments to nonemployees by generally aligning it with the accounting for share-based payments to employees, with certain exceptions. The new guidance applies to nonemployee awards issued in exchange for goods or services used in an entity’s own operations and to awards granted by an investor to an equity method investee, but does not apply to equity instruments issued to a lender or investor in a financing transaction or equity instruments issued when selling goods or services to customers, which is under the revenue recognition model. Key changes in the guidance include measuring nonemployee awards based on fair value of the equity instrument issued, rather than fair value of goods or services received or equity instrument issued, whichever is more reliably measured. In terms of timing, equity-classified nonemployee awards that were previously remeasured through performance completion date will now have a fixed measurement on grant date, which will reduce volatility on the income statement. For nonemployee awards with performance conditions, compensation cost will be recognized when achievement of the performance condition is probable, rather than upon actual achievement of the performance condition. Similar to employee awards, forfeitures may be recognized as they occur or based on an estimate under an accounting policy election, but the guidance allows separate elections for employee and nonemployee awards. The accounting model for nonemployee awards, however, remains different for attribution of share-based payment costs over the vesting period, in which compensation cost for nonemployee awards continues to be recognized in the same period and in the same manner (i.e., capitalized or expensed) as if the grantor had paid cash for the goods or services. No changes to disclosure requirements were prescribed. Transition is on a modified retrospective basis, with a remeasurement at fair value as of the adoption date through a cumulative effect adjustment to opening retained earnings, applied to all equity-classified nonemployee awards where a measurement date has not been established by the adoption date and unsettled liability-classified nonemployee awards. The transition provisions eliminate the need to retrospectively determine fair values at historical grant dates. The Company early adopted this guidance on
October 1, 2018
. The adoption of this standard did not have a material impact on the Company’s financial condition, results of operations or cash flows.
Future Application of Accounting Standards
Leases—
In February 2016, the FASB issued ASU No. 2016-02,
Leases
, which amends existing lease accounting standards, primarily requiring lessees to recognize most leases on balance sheet, as well as making targeted changes to lessor accounting. As lessee, a right-of-use asset and corresponding liability for future obligations under a leasing arrangement would be recognized on balance
F-26
COLONY CREDIT REAL ESTATE, INC.
NOTES TO CONSOLIDATED FINANCIAL STATEMENTS (Continued)
sheet. As lessor, gross leases will be subject to allocation between lease and non-lease service components, with the latter accounted for under the new revenue recognition standard. As the new lease standard requires congruous accounting treatment between lessor and lessee in a sale-leaseback transaction, if the seller/lessee does not achieve sale accounting, it would be considered a financing transaction to the buyer/lessor. Additionally, under the new lease standard, only incremental initial direct costs incurred in the execution of a lease can be capitalized by the lessor and lessee.
The Company will adopt the standard effective January 1, 2019 using a modified retrospective approach for all leases existing at, or entered into after, beginning of the earliest comparative period presented. The Company will adopt the package of practical expedients under the guidance, which provides exemptions from having to reassess whether any expired or expiring contracts contain leases, revisit lease classification for any expired or expiring leases and reassess initial direct costs for any existing leases. The Company implemented an accounting policy election to treat lease and related non-lease components in a contract as a single performance obligation to the extent that the timing and pattern of revenue recognition are the same for the lease and non-lease components and the combined single lease component is classified as an operating lease. The Company is in the process of finalizing the aggregation and evaluation of its leasing arrangements, and implementing a lease module in its accounting system to address the new accounting model for leases, including any transition adjustments. The most significant change to the Company, as lessee, will be the gross-up of the right of use asset and lease liability on the balance sheet, estimated to be between
$15.0 million
to
$20.0 million
for ground leases, discounted using incremental borrowing rates ranging from
5.0%
to
5.8%
. The impact of the new standard to the Company, as lessor, is not expected to have a material effect on its financial condition or results of operations.
Credit Losses—
In June 2016, the FASB issued ASU No. 2016-13,
Financial Instruments
-
Credit Losses
, which amends the credit impairment model for financial instruments. The existing incurred loss model will be replaced with a lifetime current expected credit loss (“CECL”) model for financial instruments carried at amortized cost and off-balance sheet credit exposures, such as loans, loan commitments, held-to-maturity (“HTM”) debt securities, financial guarantees, net investment in leases, reinsurance and trade receivables, which will generally result in earlier recognition of allowance for losses. For available-for-sale (“AFS”) debt securities, unrealized credit losses will be recognized as allowances rather than reductions in amortized cost basis and elimination of the OTTI concept will result in more frequent estimation of credit losses. The accounting model for purchased credit impaired loans and debt securities will be simplified, including elimination of some of the asymmetrical treatment between credit losses and credit recoveries, to be consistent with the CECL model for originated and purchased non-credit impaired assets. The existing model for beneficial interests that are not of high credit quality will be amended to conform to the new impairment models for HTM and AFS debt securities. Expanded disclosures on credit risk include credit quality indicators by vintage for financing receivables and net investment in leases. Transition will generally be on a modified retrospective basis, with prospective application for other-than-temporarily impaired debt securities and purchased credit impaired assets. ASU No. 2016-13 is effective for fiscal years and interim periods beginning after December 15, 2019. Early adoption is permitted for annual and interim periods beginning after December 15, 2018. The Company expects that recognition of credit losses will generally be accelerated under the CECL model. Evaluation of the impact of this new guidance is ongoing.
Hedge Accounting—
In August 2017, the FASB issued ASU No. 2017-12,
Targeted Improvements to Accounting for Hedging Activities
, which simplifies and expands the application of hedge accounting. This standard amends hedge accounting recognition and presentation, including eliminating the requirement to separately measure and present hedge ineffectiveness as well as presenting the entire fair value change of a hedging instrument in the same income statement line as the hedged item. The new guidance also provides alternatives for applying hedge accounting to additional hedging strategies, and easing requirements for effectiveness testing and hedging documentation, although the "highly effective" threshold for a qualifying hedging relationship has not changed. Revised disclosures include tabular disclosures that focus on the effect of hedge accounting by income statement line item. Transition will generally be on a modified retrospective basis applied to existing hedging relationships as of date of adoption, with prospective application for income statement presentation and disclosure, and specific transition elections are available to modify existing hedge documentation. ASU 2017-12 is effective for fiscal years and interim periods beginning after December 15, 2018. Early adoption is permitted, with adjustments to be reflected as of the beginning of the fiscal year of adoption if early adopted in an interim period.
The Company plans to adopt the standard on its effective date. Upon adoption, as it relates to the Company’s net investment hedges, the Company will record the entire change in fair value of the hedging instrument (other than amounts excluded from assessment of hedge effectiveness for net investment hedges) in other comprehensive income and there will be no hedge ineffectiveness recorded in earnings. Additionally, subsequent to initial quantitative hedge assessment, the Company may elect to perform effectiveness testing qualitatively so long as the Company can reasonably support an expectation that the hedge is highly effective now and in subsequent periods. As the standard allows more flexibility in hedging interest rate risk in cash flow hedges beyond a specified benchmark rate, the Company may be able to designate in the future other contractually specified variable interest rate as the hedged risk, which if effective, could decrease fluctuations in earnings. The Company continues to evaluate
F-27
COLONY CREDIT REAL ESTATE, INC.
NOTES TO CONSOLIDATED FINANCIAL STATEMENTS (Continued)
the impact of this new guidance but at this time, does not expect the adoption of this standard to have a material effect on its financial condition or results of operations.
Fair Value Disclosures—
In August 2018, the FASB issued ASU No. 2018-13,
Fair Value Measurement (Topic 820):Disclosure Framework-Changes to the Disclosure Requirements for Fair Value Measurements
. The ASU requires new disclosures of changes in unrealized gains and losses in other comprehensive income for recurring Level 3 fair value of instruments held at the balance sheet date, as well as the range and weighted average or other quantitative information, if more relevant, of significant unobservable inputs for recurring and nonrecurring Level 3 fair values. Certain disclosures are now eliminated, specifically around the valuation process required for Level 3 fair values, policy for timing of transfers between levels of the fair value hierarchy, as well as amounts and reason for transfers between Levels 1 and 2. ASU No. 2018-13 is effective for fiscal years and interim periods beginning after December 15, 2019. The adoption of this standard is not expected to have a material effect on the Company's existing disclosures.
|
3.
|
Business Combination
|
Business Combination
On the Closing Date, the Combination of the CLNY Contributed Portfolio, NorthStar I and NorthStar II was completed, creating the Company.
In consideration for the contribution of the CLNY Contributed Portfolio, CLNY OP received approximately
44.4 million
shares of the Company’s Class B-3 common stock, par value
$0.01
per share (the “Class B-3 common stock”), and a subsidiary of CLNY OP received approximately
3.1 million
common membership units in the OP (“CLNC OP Units”). The Class B-3 common stock automatically converted to Class A common stock of the Company on a
one
-for-one basis upon the close of trading on
February 1, 2019
. The CLNC OP Units are redeemable for cash, or, at the Company’s election, the Class A common stock on a
one
-for-one basis, in the sole discretion of the Company. Subject to certain limited exceptions, CLNY OP has agreed that it and its affiliates will not make any transfers of the CLNC OP Units to non-affiliates of CLNY OP until the one year anniversary of the closing of the Combination, unless such transfer is approved by a majority of the Company’s board of directors, including a majority of the independent directors. In connection with the merger of NorthStar I and NorthStar II into the Company, their respective stockholders received shares of the Class A common stock based on pre-determined exchange ratios. Following the foregoing transaction, the Company contributed the CLNY Contributed Portfolio and the operating partnerships of NorthStar I and NorthStar II to the OP in exchange for ownership interests in the OP. Upon the closing of the Combination, CLNY OP and its affiliates, NorthStar I stockholders and NorthStar II stockholders each owned approximately
37%
,
32%
and
31%
, respectively, of the Company on a fully diluted basis.
Prior to the closing of the Combination, a special dividend was declared by NorthStar I, which generated the lesser amount of cash leakage, in order to true up the agreed contribution values of NorthStar I and NorthStar II in relation to each other. In addition, following the CLNY Contributions, but prior to the effective time of the Combination, there was a cash settlement between the Company and Colony Capital for the difference between (i) the sum of (a) the loss in value of NorthStar I and NorthStar II as a result of the distributions made by NorthStar I and NorthStar II in excess of funds from operations (“FFO”) (as such term is defined in the Combination Agreement) from
July 1, 2017
through the day immediately preceding the Closing Date (excluding the dividend payment made by each of NorthStar I and NorthStar II on
July 1, 2017
), (b) FFO for the CLNY Investment Entities from
July 1, 2017
through the day immediately preceding the Closing Date, (c) cash contributions or contributions of certain intercompany receivables made to the CLNY Investment Entities from
July 1, 2017
through the day immediately preceding the Closing Date, and (d) the expected present value of certain unreimbursed operating expenses of NorthStar I and NorthStar II paid on each company’s behalf by their respective advisors, and (ii) cash distributions made by the CLNY Investment Entities from
July 1, 2017
through the day immediately preceding the Closing Date, excluding that certain distribution made by the CLNY Investment Entities in
July 2017
relating to the partial repayment of a certain investment (collectively, “CLNY true-up adjustment”). The settlement of the CLNY true-up adjustment resulted in a payment of approximately
$55 million
from Colony Capital to the Company.
The Combination is accounted under the acquisition method for business combinations with the CLNY Investment Entities as the accounting acquirer for purposes of the financial information set forth herein. Refer to Note 2, “Summary of Significant Accounting Policies” for further discussion on the accounting treatment of the Combination.
Combination Consideration
Each share of NorthStar I and NorthStar II common stock issued and outstanding immediately prior to the effective time of the Combination was converted into the right to receive
0.3532
shares (the “NorthStar I Exchange Ratio”) and
0.3511
shares (the “NorthStar II Exchange Ratio”), respectively, of the Class A common stock, plus cash in lieu of fractional shares. Approximately
21,000
shares of NorthStar I restricted common stock and
25,000
shares of NorthStar II restricted common stock automatically
F-28
COLONY CREDIT REAL ESTATE, INC.
NOTES TO CONSOLIDATED FINANCIAL STATEMENTS (Continued)
vested in connection with the Combination and the holders thereof were entitled to receive the same equity exchange as the other holders of NorthStar I and NorthStar II common stock, respectively.
The Company acquired all of the common stock of NorthStar I and NorthStar II through the exchange of all such outstanding shares into shares of Class A common stock based on the pre-determined NorthStar I Exchange Ratio and NorthStar II Exchange Ratio, respectively. As the Combination was a stock-for-stock exchange (except for cash consideration for fractional shares), fair value of the consideration to be transferred was dependent upon the fair value of the Company at the Closing Date.
Fair value of the merger consideration was determined as follows (in thousands, except exchange ratio and price per share):
|
NorthStar I
|
NorthStar II
|
Total
|
||||||||||
|
Outstanding shares of common stock at January 31, 2018
(1)
|
119,333
|
|
114,943
|
|
||||||||
|
Exchange ratio
(2)
|
0.3532
|
|
0.3511
|
|
||||||||
|
Shares of Class A common stock issued in the mergers
(3)
|
42,149
|
|
40,356
|
|
82,505
|
|
||||||
|
Fair value consideration per share
(4)
|
$
|
24.50
|
|
$
|
24.50
|
|
$
|
24.50
|
|
|||
|
Fair value of NorthStar I and NorthStar II consideration
|
$
|
1,032,651
|
|
$
|
988,722
|
|
$
|
2,021,373
|
|
|||
_________________________________________
|
(1)
|
Includes
21,000
and
25,000
shares of common stock of NorthStar I and NorthStar II equity awards, respectively, that vested in connection with the consummation of the Combination.
|
|
(2)
|
Represents the pre-determined exchange ratio of
0.3532
NorthStar I shares and
0.3511
NorthStar II shares per one share of the Class A common stock.
|
|
(3)
|
Includes the issuance of fractional shares, aggregating to approximately
21,000
shares, for which holders received cash in lieu of the fractional shares.
|
|
(4)
|
Represents the estimated per share fair value of the Company at the Closing Date.
|
The following table presents an allocation of the Combination consideration to assets acquired, liabilities assumed and noncontrolling interests of NorthStar I and NorthStar II based on their respective estimated fair values.
The estimated fair values and allocation of the Combination consideration are subject to adjustments during the measurement period, not to exceed one year, based upon new information obtained about facts and circumstances that existed as of the Closing Date. During the measurement period, no material adjustments were made to the allocation of the Combination consideration. Final adjusted fair values assigned to the assets acquired, liabilities assumed and noncontrolling interests of NorthStar I and NorthStar II were as follows (dollars in thousands):
F-29
COLONY CREDIT REAL ESTATE, INC.
NOTES TO CONSOLIDATED FINANCIAL STATEMENTS (Continued)
|
Final Adjusted Amounts at December 31, 2018
|
||||||||||||
|
NorthStar I
|
NorthStar II
|
Total
|
||||||||||
|
Merger consideration
|
$
|
1,032,651
|
|
$
|
988,722
|
|
$
|
2,021,373
|
|
|||
|
Allocation of merger consideration:
|
||||||||||||
|
Assets acquired
|
||||||||||||
|
Cash and cash equivalents
|
$
|
130,197
|
|
$
|
51,360
|
|
$
|
181,557
|
|
|||
|
Restricted cash
|
30,564
|
|
61,313
|
|
91,877
|
|
||||||
|
Loans and preferred equity held for investment
|
521,462
|
|
728,271
|
|
1,249,733
|
|
||||||
|
Real estate securities, available for sale, at fair value
|
100,731
|
|
64,793
|
|
165,524
|
|
||||||
|
Real estate, net
|
792,999
|
|
494,324
|
|
1,287,323
|
|
||||||
|
Investments in unconsolidated ventures
|
67,899
|
|
375,694
|
|
443,593
|
|
||||||
|
Receivables, net
|
12,363
|
|
11,479
|
|
23,842
|
|
||||||
|
Deferred leasing costs and intangible assets, net
|
74,243
|
|
37,090
|
|
111,333
|
|
||||||
|
Other assets
|
18,666
|
|
24,401
|
|
43,067
|
|
||||||
|
Mortgage loans held in securitization trusts, at fair value
|
1,894,404
|
|
1,432,795
|
|
3,327,199
|
|
||||||
|
Total assets acquired
|
3,643,528
|
|
3,281,520
|
|
6,925,048
|
|
||||||
|
Liabilities assumed
|
||||||||||||
|
Securitization bonds payable, net
|
—
|
|
80,825
|
|
80,825
|
|
||||||
|
Mortgage and other notes payable, net
|
399,131
|
|
382,485
|
|
781,616
|
|
||||||
|
Credit facilities
|
293,340
|
|
355,529
|
|
648,869
|
|
||||||
|
Due to related party
|
4,533
|
|
1,842
|
|
6,375
|
|
||||||
|
Accrued and other liabilities
|
25,680
|
|
22,959
|
|
48,639
|
|
||||||
|
Intangible liabilities, net
|
17,931
|
|
1,808
|
|
19,739
|
|
||||||
|
Escrow deposits payable
|
12,994
|
|
36,362
|
|
49,356
|
|
||||||
|
Mortgage obligations issued by securitization trusts, at fair value
|
1,784,223
|
|
1,401,491
|
|
3,185,714
|
|
||||||
|
Total liabilities assumed
|
2,537,832
|
|
2,283,301
|
|
4,821,133
|
|
||||||
|
Noncontrolling interests
|
73,045
|
|
9,497
|
|
82,542
|
|
||||||
|
Fair value of net assets acquired
|
$
|
1,032,651
|
|
$
|
988,722
|
|
$
|
2,021,373
|
|
|||
Fair value of other assets acquired, liabilities assumed and noncontrolling interests were estimated as follows:
Real Estate and Related Intangibles
—Fair value is based on the income approach which includes a direct capitalization method with overall capitalization rates ranging between
6.5%
and
8.3%
. Real estate fair value was allocated to tangible assets such as land, building and leaseholds, tenant and land improvements as well as identified intangible assets and liabilities such as above- and below-market leases, and in-place lease value. Useful lives of the intangibles acquired range from
1
year to
10
years.
Loans and preferred equity held for investment
—Fair value is determined by comparing the current yield to the estimated yield for newly originated loans with similar credit risk or the market yield at which a third party might expect to purchase such investment; or based on discounted cash flow projections of principal and interest expected to be collected, which include consideration of borrower or sponsor credit, as well as operating results of the underlying collateral. For certain loans and preferred equity held for investment, NorthStar II has a contractual right to equity-like participation or other ownership interests in the underlying collateral which was considered in calculating the fair value of the loans and preferred equity held for investment.
Investments in Unconsolidated Ventures
—Fair value is based on timing and amount of expected future cash flows for income as well as realization events of the underlying assets of the investees. Investments in unconsolidated ventures includes a preferred equity investment, as well as an investment in a joint venture which holds a mezzanine loan. The fair value for both investments was based on the outstanding principal value plus the undiscounted value of any applicable contractual exit fees associated with the investments. The preferred equity investment has an equity-like participation which was considered in its fair value. The capitalization rate used was
6.8%
.
Securities
—Fair value is based on quotations from brokers or financial institutions that act as underwriters of the debt securities, third-party pricing service or discounted cash flows depending on the type of debt securities.
Debt
—The fair value of debt was determined by either comparing the contractual interest rate to the interest rate for newly originated debt with similar credit risk or the market rate at which a third party might expect to assume such debt or based on discounted cash flow (“DCF”) projections of principal and interest expected to be collected, which include consideration of borrower or sponsor credit, as well as operating results of the underlying collateral. All of the debt was priced consistent with current interest
F-30
COLONY CREDIT REAL ESTATE, INC.
NOTES TO CONSOLIDATED FINANCIAL STATEMENTS (Continued)
rates attainable for similarly situated investments, and therefore was attributed a value equal to each debt’s outstanding principal amount less any applicable premium or discount on the secured debt.
Noncontrolling Interests
—NorthStar I’s noncontrolling interests are attributable to the minority ownership interests of its operating partners in its CRE properties. The estimated value of NorthStar I’s noncontrolling interests represents the minority owner’s pro rata share of the estimated net book value of the CRE properties, as determined in accordance with the above description of the valuation process for real estate and related intangibles. NorthStar II’s noncontrolling interest is attributable to the minority ownership interest of its operating partner in its Bothell, Washington office portfolio. The estimated value of NorthStar II’s noncontrolling interest represents the operating partner’s pro rata share of the estimated net book value of the portfolio, as determined in accordance with the above description of the valuation process for real estate and related intangibles. The major classes of intangible assets and liabilities include leasing commissions, above- and below-market lease values and in-place lease values.
Results of NorthStar I and NorthStar II
For the period from February 1, 2018 (the Closing Date) through
December 31, 2018
, the Company’s results of operations included contributions from the acquired business of NorthStar I and NorthStar II as follows (dollars in thousands):
|
February 1, 2018 to December 31, 2018
|
||||||||||||
|
NorthStar I
|
NorthStar II
|
Total
|
||||||||||
|
Total revenues
|
$
|
200,582
|
|
$
|
160,917
|
|
$
|
361,499
|
|
|||
|
Net income (loss) attributable to common stockholders
(1)
|
(37,480
|
)
|
(31,791
|
)
|
(69,271
|
)
|
||||||
______________________________
|
(1)
|
Includes
$24.7 million
of impairment of operating real estate,
$18.8 million
provision for loan loss, and
$45.0 million
of mark-to-market adjustments on PE Investments recorded from the Closing Date through
December 31, 2018
.
|
Combination-Related Costs
Transaction costs of
$31.9 million
were incurred in connection with the Combination in the
year ended
December 31, 2018
, consisting largely of professional fees for legal, financial advisory, accounting and consulting services. Approximately
$24.3 million
of the transaction costs for the
year ended
December 31, 2018
represent fees paid to investment bankers that were contingent upon consummation of the Combination.
Combination-related costs are expensed as incurred and such costs expensed by NorthStar I and NorthStar II prior to the Closing Date were excluded from the Company's results of operations.
Pro Forma Financial Information (Unaudited)
The following table presents pro forma financial information of the Company as if the Combination had been consummated on
January 1, 2017
. The pro forma financial information includes the pro forma impact of purchase accounting adjustments primarily related to fair value adjustments and depreciation and amortization, and excludes Combination-related transaction costs of
$31.9 million
for the
year ended
December 31, 2018
. The pro forma financial information, however, does not reflect any potential benefits that may result from realization of future cost savings from operating efficiencies, or other incremental synergies expected to result from the Combination.
The pro forma financial information is presented for illustrative purposes only and is not necessarily indicative of the results of operations of the Company had the Combination been completed on
January 1, 2017
, nor indicative of future results of operations of the Company (dollars in thousands, except per share data):
|
Year Ended December 31,
|
||||||||
|
2018
|
2017
|
|||||||
|
Pro forma:
|
||||||||
|
Total revenues
|
$
|
504,713
|
|
$
|
507,961
|
|
||
|
Net income (loss) attributable to Colony Credit Real Estate, Inc.
|
(135,621
|
)
|
87,958
|
|
||||
|
Net income (loss) attributable to common stockholders
|
(126,852
|
)
|
85,438
|
|
||||
|
Earnings per common share:
|
||||||||
|
Basic
|
$
|
(0.99
|
)
|
$
|
0.67
|
|
||
|
Diluted
|
$
|
(0.99
|
)
|
$
|
0.67
|
|
||
F-31
COLONY CREDIT REAL ESTATE, INC.
NOTES TO CONSOLIDATED FINANCIAL STATEMENTS (Continued)
|
4.
|
Loans and Preferred Equity Held for Investment, net
|
The following table provides a summary of the Company’s loans and preferred equity held for investment, net (dollars in thousands):
|
December 31, 2018
|
December 31, 2017
|
||||||||||||||||||||||||||
|
Unpaid Principal Balance
|
Carrying
Value
|
Weighted Average Coupon
(1)
|
Weighted Average Maturity in Years
|
Unpaid Principal Balance
(2)
|
Carrying
Value
(2)
|
Weighted Average Coupon
|
Weighted Average Maturity in Years
|
||||||||||||||||||||
|
Fixed rate
|
|||||||||||||||||||||||||||
|
Senior loans
|
$
|
15,000
|
|
$
|
15,000
|
|
16.0
|
%
|
0.5
|
$
|
493,113
|
|
$
|
484,592
|
|
8.2
|
%
|
2.4
|
|
||||||||
|
Mezzanine loans
|
175,448
|
|
174,830
|
|
12.7
|
%
|
4.9
|
141,931
|
|
141,828
|
|
13.2
|
%
|
3.2
|
|
||||||||||||
|
Preferred equity interests
|
113,860
|
|
113,687
|
|
12.6
|
%
|
7.7
|
—
|
|
—
|
|
—
|
|
—
|
|
||||||||||||
|
304,308
|
|
303,517
|
|
635,044
|
|
626,420
|
|
||||||||||||||||||||
|
Variable rate
|
|||||||||||||||||||||||||||
|
Senior loans
|
1,432,416
|
|
1,430,635
|
|
6.3
|
%
|
4.2
|
260,366
|
|
260,932
|
|
8.1
|
%
|
2.3
|
|
||||||||||||
|
Securitized loans
(3)
|
302,868
|
|
305,106
|
|
7.9
|
%
|
1.1
|
377,939
|
|
379,670
|
|
6.7
|
%
|
0.3
|
|
||||||||||||
|
Mezzanine loans
|
90,265
|
|
90,567
|
|
12.2
|
%
|
2.0
|
34,391
|
|
34,279
|
|
9.8
|
%
|
1.3
|
|
||||||||||||
|
1,825,549
|
|
1,826,308
|
|
672,696
|
|
674,881
|
|
||||||||||||||||||||
|
2,129,857
|
|
2,129,825
|
|
1,307,740
|
|
1,301,301
|
|
||||||||||||||||||||
|
Allowance for loan losses
(4)
|
NA
|
|
(109,328
|
)
|
NA
|
|
(517
|
)
|
|||||||||||||||||||
|
Loans and preferred equity held for investment, net
|
$
|
2,129,857
|
|
$
|
2,020,497
|
|
$
|
1,307,740
|
|
$
|
1,300,784
|
|
|||||||||||||||
_________________________________________
|
(1)
|
Calculated based on contractual interest rate.
|
|
(2)
|
Includes
four
purchased credit-impaired loans with combined unpaid principal balance of
$21.4 million
and carrying value of
$20.8 million
.
|
|
(3)
|
Represents loans transferred into securitization trusts that are consolidated by the Company.
|
|
(4)
|
Allowance for loan losses does not include
$5.1 million
of provision for loan loss associated with a receivable for operating expenses paid by the Company on the borrower’s behalf in connection with four loans which were foreclosed upon in
January 2019
.
|
As of
December 31, 2018
, the weighted average maturity, including extensions, of loans and preferred equity investments was
3.9
years.
The Company had
$8.6 million
and
$10.0 million
of interest receivable related to its loans and preferred equity held for investment, net as of
December 31, 2018
and
2017
, respectively.
Activity relating to the Company’s loans and preferred equity held for investment, net was as follows (dollars in thousands):
|
Carrying Value
|
||||
|
Balance at January 1, 2018
|
$
|
1,300,784
|
|
|
|
Loans and preferred equity held for investment acquired in the Combination (Note 3)
|
1,249,733
|
|
||
|
Deconsolidation of investment entities
(1)
|
(553,678
|
)
|
||
|
Acquisitions/originations/additional funding
|
919,461
|
|
||
|
Loan maturities/principal repayments
|
(627,219
|
)
|
||
|
Foreclosure of loans held for investment
|
(117,878
|
)
|
||
|
Combination adjustment
(2)
|
(50,314
|
)
|
||
|
Discount accretion/premium amortization
|
2,582
|
|
||
|
Capitalized interest
|
5,837
|
|
||
|
Change in allowance for loan loss
|
(108,811
|
)
|
||
|
Balance at December 31, 2018
|
$
|
2,020,497
|
|
|
_________________________________________
|
(1)
|
Represents loans and preferred equity held for investment, net which were deconsolidated as a result of the Combination. Refer to Note 2, “Summary of Significant Accounting Policies,” for further detail.
|
F-32
COLONY CREDIT REAL ESTATE, INC.
NOTES TO CONSOLIDATED FINANCIAL STATEMENTS (Continued)
|
(2)
|
Represents a loan held for investment, net that was previously sold by the CLNY Investment Entities to NorthStar I and was treated as a secured financing by the CLNY Investment Entities. This loan was eliminated as a result of the Combination.
|
Nonaccrual and Past Due Loans and Preferred Equity
Loans and preferred equity that are 90 days or more past due as to principal or interest, or where reasonable doubt exists as to timely collection, are generally considered nonperforming and placed on nonaccrual status. At
December 31, 2018
, other than the NY hospitality loans discussed below, all other loans and preferred equity held for investment remain current on interest payments.
In
March 2018
, the borrower on the Company’s
four
NY hospitality loans failed to make all required interest payments. These
four
loans are secured by the same collateral. The Company placed the loans on non-accrual status and commenced discussions with the borrower to resolve the matter. Interest income was recognized on a cash basis. During the year, the Company recognized
$3.4 million
in interest income on the loans.
During the third quarter of 2018, discussions with the borrower did not progress as anticipated which led to the Company exploring additional options for resolution. The Company prepared a weighted average probability analysis of potential resolutions, which included a recapitalization and earlier than expected receipt and sale of collateral. Based on this analysis, the Company recorded a
$35.1 million
provision for loan loss on the
four
NY hospitality loans during the third quarter of 2018.
During the fourth quarter of
2018
, the borrower entered into a listing agreement with a real estate brokerage firm and as a result, the Company believes sale of the underlying collateral and repayment of the
four
loans from the sales proceeds is the most likely outcome. As such, the Company recorded an additional
$18.8 million
of provision for loan loss on the
four
NY hospitality loans in
2018
to reflect the estimated proceeds to be received from the borrower following the sale.
During the fourth quarter of
2018
,
two
separate borrowers on
three
of the Company’s regional mall loans with unpaid principal balances of
$29.9 million
,
$26.5 million
, and
$7.0 million
, respectively, notified us of the potential loss of anchor tenants. Following this notification, the Company concluded that foreclosure or sale of the underlying collateral and repayment for each of these loans is the most likely outcome. As such, the Company recorded a provision for loan loss of
$8.0 million
,
$8.8 million
, and
$7.0 million
respectively, to reflect the estimated fair value of the collateral. The Company has commenced foreclosure proceedings on
two
of the
three
loans collateralized by
one
of the regional malls with unpaid principal balances totaling
$36.9 million
. The Company has been and is continuing to sweep all cash from the operations of the two regional malls.
The following table provides an aging summary of loans and preferred equity held for investment at carrying values before allowance for loan losses, if any (dollars in thousands):
|
Current or Less Than 30 Days Past Due
|
30-59 Days Past Due
(1)
|
60-89 Days Past Due
(2)
|
90 Days or More Past Due
(3)(4)
|
Total Loans
|
||||||||||||||||
|
December 31, 2018
|
$
|
1,632,817
|
|
$
|
58,751
|
|
$
|
42,995
|
|
$
|
395,262
|
|
$
|
2,129,825
|
|
|||||
|
December 31, 2017
|
1,122,366
|
|
144,241
|
|
7,929
|
|
26,765
|
|
1,301,301
|
|
||||||||||
_________________________________________
|
(1)
|
Subsequent to
December 31, 2018
, the Company and the borrower on one loan with a carrying value of
$21.8 million
included in 30-59 days past due reached an agreement that extended the loan’s maturity until
April 2019
. The loan was in maturity default as of
December 31, 2018
.
|
|
(2)
|
At
December 31, 2018
, 60-89 days past due loans consists of
two
loans to the same borrower and secured by the same collateral which were refinanced in January 2019 into a
$37.0 million
senior mortgage loan.
|
|
(3)
|
At
December 31, 2018
, 90 days or more past due loans includes
four
loans to the same borrower and secured by the same collateral with combined carrying value before allowance for loan losses of $
258.1 million
on non-accrual status. All other loans in this table remain current on interest payments.
|
|
(4)
|
At
December 31, 2018
, 90 days or more past due loans includes
four
loans to the same borrower and secured by the same collateral with a combined carrying value before allowance for loan losses of
$137.1 million
. The Company foreclosed on these
four
loans in
January 2019
.
|
Troubled Debt Restructuring
At
December 31, 2018
and
December 31, 2017
, there was
one
mezzanine loan previously modified in a TDR with carrying value before allowance for loan losses of
$28.6 million
. The loan had been modified in 2015. The Company also has
three
other loans with a combined carrying value before provision for loan loss of
$108.5 million
that are cross-collateralized with the TDR loan to the same borrower.
Two
loans matured in November 2017 and were in default at both
December 31, 2018
and
December 31, 2017
, while the
third
loan matured in October 2018 and was in default at
December 31, 2018
. All
four
loans are cross-collateralized with
28
office, retail, multifamily and industrial properties.
In February
2018
, the borrower entered into a forbearance agreement with the Company to allow both parties to review the exit strategy. The forbearance agreement was terminated by the Company in August 2018 when it became clear that the borrower would not complete its exit strategy. The Company commenced foreclosure proceedings under the mezzanine loan to take control of the
28
cross-collateralized properties, which was completed in January 2019. As such, the Company recorded a
$31.7 million
provision
F-33
COLONY CREDIT REAL ESTATE, INC.
NOTES TO CONSOLIDATED FINANCIAL STATEMENTS (Continued)
for loan loss on the four loans to reflect the estimated fair value of the collateral. The Company recorded an additional
$5.1 million
provision for loan loss associated with a receivable for operating expenses paid on behalf of the borrower during the year ended
December 31, 2018
. At
December 31, 2017
,
no
provision for loan loss was recorded. To improve the operating performance of the
28
properties, the Company has engaged new property managers, working under the perpetual oversight of its asset management team.
There were
no
loans modified as TDRs during the
years ended
December 31, 2018
,
2017
and
2016
.
Impaired Loans
Loans are identified as impaired when it is no longer probable that interest or principal will be collected according to the contractual terms of the original loan agreement. Impaired loans include predominantly loans under nonaccrual, performing and nonperforming TDRs. The following table presents impaired loans at the respective reporting dates (dollars in thousands):
|
Unpaid Principal Balance
(1)
|
Gross Carrying Value
|
|||||||||||||||||||
|
With Allowance for Loan Losses
|
Without Allowance for Loan Losses
|
Total
|
Allowance for Loan Losses
(2)
|
|||||||||||||||||
|
December 31, 2018
|
$
|
456,703
|
|
$
|
458,942
|
|
$
|
—
|
|
$
|
458,942
|
|
$
|
109,328
|
|
|||||
|
December 31, 2017
|
237,441
|
|
42,176
|
|
195,934
|
|
238,110
|
|
517
|
|
||||||||||
_________________________________________
|
(1)
|
At
December 31, 2018
, includes
four
loans to the same borrower and secured by the same collateral with combined unpaid principal balance of
$257.2 million
and gross carrying value of
$258.1 million
on non-accrual status. All other loans included in this table remain current on interest payments.
|
|
(2)
|
Allowance for loan losses does not include
$5.1 million
of provision for loan loss associated with a receivable for operating expenses paid by the Company on the borrower’s behalf in connection with
four
loans which were foreclosed upon in
January 2019
.
|
The average carrying value and interest income recognized on impaired loans were as follows (dollars in thousands):
|
Year Ended December 31,
|
||||||||||||
|
2018
|
2017
|
2016
|
||||||||||
|
Average carrying value before allowance for loan losses
|
$
|
463,043
|
|
$
|
124,743
|
|
$
|
126,476
|
|
|||
|
Interest income
|
21,105
|
|
12,431
|
|
11,384
|
|
||||||
Allowance for Loan Losses
As of
December 31, 2018
, the allowance for loan losses was
$109.3 million
related to
$458.9 million
in carrying value of loans. As of
December 31, 2017
the allowance for loan losses was
$0.5 million
related to
$42.2 million
in carrying value of loans.
Changes in allowance for loan losses on loans are presented below (dollars in thousands):
|
Year Ended December 31,
|
||||||||||||
|
2018
|
2017
|
2016
|
||||||||||
|
Allowance for loan losses at beginning of period
|
$
|
517
|
|
$
|
3,386
|
|
$
|
—
|
|
|||
|
Provision for loan losses
|
109,328
|
|
518
|
|
3,386
|
|
||||||
|
Charge-off
|
—
|
|
(3,387
|
)
|
—
|
|
||||||
|
Recoveries
|
(517
|
)
|
—
|
|
—
|
|
||||||
|
Allowance for loan losses at end of period
(1)
|
$
|
109,328
|
|
$
|
517
|
|
$
|
3,386
|
|
|||
_________________________________________
|
(1)
|
Allowance for loan losses does not include
$5.1 million
of provision for loan loss associated with a receivable for operating expenses paid by the Company on the borrower’s behalf in connection with
four
loans which were foreclosed upon in
January 2019
.
|
Credit Quality Monitoring
Loan and preferred equity investments are typically loans secured by direct senior priority liens on real estate properties or by interests in entities that directly own real estate properties, which serve as the primary source of cash for the payment of principal and interest. The Company evaluates its loan and preferred equity investments at least quarterly and differentiates the relative credit quality principally based on: (i) whether the borrower is currently paying contractual debt service in accordance with its contractual terms; and (ii) whether the Company believes the borrower will be able to perform under its contractual terms in the future, as well as the Company’s expectations as to the ultimate recovery of principal at maturity.
F-34
COLONY CREDIT REAL ESTATE, INC.
NOTES TO CONSOLIDATED FINANCIAL STATEMENTS (Continued)
As of
December 31, 2018
, there were
13
loans held for investment to five borrowers with contractual payments past due. With the exception of the NY hospitality loans previously discussed, all other loans and preferred equity held for investment remain current on interest payments. The remaining loans and preferred equity investments were performing in accordance with the contractual terms of their governing documents and were categorized as performing loans. There were
seven
loans held for investment with contractual payments past due as of
December 31, 2017
. For the
year ended
December 31, 2018
,
no
debt investment contributed more than
10.0%
of interest income.
Lending Commitments
The Company has lending commitments to borrowers pursuant to certain loan agreements in which the borrower may submit a request for funding contingent on achieving certain criteria, which must be approved by the Company as lender, such as leasing, performance of capital expenditures and construction in progress with an approved budget. At
December 31, 2018
, assuming the terms to qualify for future fundings, if any, have been met, total unfunded lending commitments was $
135.0 million
. Refer to Note 18, “Commitments and Contingencies” for further details.
|
5.
|
Investments in Unconsolidated Ventures
|
Summary
The Company’s investments in unconsolidated ventures represent noncontrolling equity interests in various entities, as follows (dollars in thousands):
|
December 31, 2018
|
December 31, 2017
|
|||||||
|
Equity method investments
|
$
|
742,186
|
|
$
|
179,303
|
|
||
|
Investments under fair value option
|
160,851
|
|
24,417
|
|
||||
|
Investments in Unconsolidated Ventures
|
$
|
903,037
|
|
$
|
203,720
|
|
||
Equity Method Investments
Investment Ventures
Certain of the Company’s equity method investments are structured as joint ventures with one or more private funds or other investment vehicles managed by Colony Capital with third party joint venture partners. These investment entities are generally capitalized through equity contributions from the members, although certain investments are leveraged through various financing arrangements.
The assets of the equity method investment entities may only be used to settle the liabilities of these entities and there is no recourse to the general credit of the Company nor the other investors for the obligations of these investment entities. Neither the Company nor the other investors are required to provide financial or other support in excess of their capital commitments. The Company’s exposure to the investment entities is limited to its equity method investment balance as of
December 31, 2018
and
2017
, respectively.
As discussed in Note 2, “Summary of Significant Accounting Policies,” certain of the CLNY Investment Entities were deconsolidated by the Company upon closing of the Combination and accounted for as investments in unconsolidated ventures.
The Company’s investments accounted for under the equity method are summarized below (dollars in thousands):
|
Ownership Interest
(1)
at December 31, 2018
|
Carrying Value
|
|||||||||||
|
Investments
|
Description
|
December 31, 2018
|
December 31, 2017
|
|||||||||
|
ADC investments
|
Interests in seven acquisition, development and construction loans in which the Company participates in residual profits from the projects, and the risk and rewards of the arrangements are more similar to those associated with investments in joint ventures
|
Various
(2)
|
$
|
165,823
|
|
$
|
179,303
|
|
||||
|
Other investment ventures
|
Interests in thirteen investments, each with less than $165.7 million carrying value at December 31, 2018
|
Various
|
576,363
|
|
—
|
|
||||||
_________________________________________
|
(1)
|
The Company’s ownership interest represents capital contributed to date and may not be reflective of the Company’s economic interest in the entity because of provisions in operating agreements governing various matters, such as classes of partner or member interests, allocations of profits and losses, preferential returns and guaranty of debt. Each equity method investment has been determined to be a VIE for which the Company was not deemed to be the primary
|
F-35
COLONY CREDIT REAL ESTATE, INC.
NOTES TO CONSOLIDATED FINANCIAL STATEMENTS (Continued)
beneficiary or a voting interest entity in which the Company does not have the power to control through a majority of voting interest or through other arrangements.
|
(2)
|
The Company owns varying levels of stated equity interests in certain ADC investments, as well as profit participation interests in real estate ventures without a stated ownership interest in other ADC investments.
|
Investments under Fair Value Option
Private Funds
The Company elected to account for its limited partnership interests, which range from
0.1%
to
30.3%
, in PE Investments under the fair value option. The Company records equity in earnings for these investments based on a change in fair value of its share of projected future cash flows.
Summarized Financial Information
The combined balance sheets for unconsolidated ventures determined to be significant for the respective periods, as of
December 31, 2018
and
2017
are as follows (dollars in thousands):
|
December 31, 2018
|
December 31, 2017
|
|||||||
|
Assets
|
||||||||
|
Total assets
|
$
|
403,112
|
|
$
|
186,475
|
|
||
|
Liabilities and equity
|
||||||||
|
Total liabilities
|
$
|
316,650
|
|
$
|
167,435
|
|
||
|
Equity
|
86,462
|
|
19,040
|
|
||||
|
Total liabilities and equity
|
$
|
403,112
|
|
$
|
186,475
|
|
||
The combined statement of operations for unconsolidated ventures determined to be significant for the respective periods, from acquisition date through the year ended
December 31, 2018
and
2017
are as follows (dollars in thousands):
|
Year Ended December 31,
|
||||||||
|
2018
|
2017
|
|||||||
|
Total revenues
|
$
|
36,708
|
|
$
|
37,800
|
|
||
|
Net income
|
$
|
11,296
|
|
$
|
2,265
|
|
||
For the year ended
December 31, 2016
,
one
ADC investment was deemed to be significant. The investee is engaged in real estate development and did not hold any operating real estate or generate any sales during the year ended
December 31, 2016
, and all interest was capitalized. Therefore, results of operations for the period were negligible.
|
6.
|
Real Estate Securities, Available for Sale
|
Investments in CRE Securities
CRE securities are composed of CMBS backed by a pool of CRE loans which are typically well-diversified by type and geography. The following table presents CMBS investments as of
December 31, 2018
(dollars in thousands):
|
Weighted Average
|
|||||||||||||||||||||||||||||||
|
Principal
Amount (1) |
Total Discount
|
Amortized
Cost |
Cumulative Unrealized
on Investments |
Fair
Value |
Coupon
(2)
|
Unleveraged
Current Yield |
|||||||||||||||||||||||||
|
As of Date:
|
Count
|
Gain
|
(Loss)
|
||||||||||||||||||||||||||||
|
December 31, 2018
|
43
|
$
|
292,284
|
|
$
|
(62,772
|
)
|
$
|
229,512
|
|
$
|
2,167
|
|
$
|
(3,494
|
)
|
$
|
228,185
|
|
3.19
|
%
|
7.10
|
%
|
||||||||
_________________________________________
|
(1)
|
Certain CRE securities serve as collateral for financing transactions including carrying value of
$226.6 million
for the CMBS Credit Facilities (refer to Note 10). The remainder is unleveraged.
|
|
(2)
|
All CMBS are fixed rate.
|
F-36
COLONY CREDIT REAL ESTATE, INC.
NOTES TO CONSOLIDATED FINANCIAL STATEMENTS (Continued)
The Company acquired
29
CRE securities from NorthStar I and NorthStar II in the Combination and invested in
14
CRE securities throughout the
year ended
December 31, 2018
. The Company held
no
CRE Securities as of
December 31, 2017
.
The Company recorded an unrealized loss in OCI for the
year ended
December 31, 2018
of
$1.3 million
. As of
December 31, 2018
, the Company held
30
securities with an aggregate carrying value of
$136.4 million
with an unrealized loss of
$3.5 million
. Based on management’s quarterly evaluation,
no
OTTI was identified related to these securities. The Company does not intend to sell these securities and it is more likely than not that the Company will not be required to sell these securities prior to recovery of its amortized cost basis, which may be at expected maturity.
As of
December 31, 2018
, the weighted average contractual maturity of CRE securities was
31.2 years
with an expected maturity of
7.4 years
.
The Company had
$0.8 million
of interest receivable related to its real estate securities, available for sale as of
December 31, 2018
.
Investments in Investing VIEs
The Company is the directing certificate holder of
three
securitization trusts and has the ability to appoint and replace the special servicer on all mortgage loans. As such, U.S. GAAP requires the Company to consolidate the assets, liabilities, income and expenses of the securitization trusts as Investing VIEs. Refer to Note 2, “Summary of Significant Accounting Policies” for further discussion on Investing VIEs.
Other than the securities represented by the Company’s subordinate tranches of the securitization trusts, the Company does not have any claim to the assets or exposure to the liabilities of the securitization trusts. The original issuers, who are unrelated third parties, guarantee the interest and principal payments related to the investment grade securitization bonds in the securitization trusts, therefore these obligations do not have any recourse to the general credit of the Company as the consolidator of the securitization trusts. The Company’s maximum exposure to loss would not exceed the carrying value of its retained investments in the securitization trusts, or the subordinate tranches of the securitization trusts.
As of
December 31, 2018
, the mortgage loans and the related mortgage obligations held in the securitization trusts had an unpaid principal balance of
$3.1 billion
and
$2.9 billion
, respectively. As of
December 31, 2018
, across the three consolidated securitization trusts, the underlying collateral consisted of
158
underlying commercial mortgage loans, with a weighted average coupon of
4.9%
and a weighted average loan to value ratio of
57.3%
.
The following table presents the assets and liabilities recorded on the consolidated balance sheets attributable to the securitization trust as of
December 31, 2018
(dollars in thousands):
|
December 31, 2018
|
||||
|
Assets
|
||||
|
Mortgage loans held in a securitization trust, at fair value
|
$
|
3,116,978
|
|
|
|
Receivables, net
|
13,178
|
|
||
|
Total assets
|
$
|
3,130,156
|
|
|
|
Liabilities
|
||||
|
Mortgage obligations issued by a securitization trust, at fair value
|
$
|
2,973,936
|
|
|
|
Accrued and other liabilities
|
12,233
|
|
||
|
Total liabilities
|
$
|
2,986,169
|
|
|
The Company elected the fair value option to measure the assets and liabilities of the securitization trusts, which requires that changes in valuations of the securitization trusts be reflected in the Company’s consolidated statements of operations.
The difference between the carrying values of the mortgage loans held in securitization trusts and the carrying value of the mortgage obligations issued by securitization trusts was
$143.0 million
as of
December 31, 2018
and approximates the fair value of the Company’s retained investments in the subordinate tranches of the securitization trusts, which are eliminated in consolidation. Refer to Note 15, “Fair Value” for a description of the valuation techniques used to measure fair value of assets and liabilities of the Investing VIEs.
F-37
COLONY CREDIT REAL ESTATE, INC.
NOTES TO CONSOLIDATED FINANCIAL STATEMENTS (Continued)
The below table presents net income attributable to the Company’s common stockholders for the
year ended
December 31, 2018
generated from the Company’s investments in the subordinate tranches of the securitization trusts (dollars in thousands). The Company had no investments in subordinate tranches for the
years ended
December 31, 2017
and
2016
.
|
Year Ended December 31, 2018
|
||||
|
Statement of Operations
|
||||
|
Interest income on mortgage loans held in securitization trusts
|
$
|
143,371
|
|
|
|
Interest expense on mortgage obligations issued by securitization trusts
|
(132,411
|
)
|
||
|
Net interest income
|
10,960
|
|
||
|
Administrative expenses
|
(1,528
|
)
|
||
|
Unrealized gain (loss) on mortgage loans and obligations held in securitization trusts, net
|
5,003
|
|
||
|
Realized loss on mortgage loans and obligations held in securitization trusts, net
|
(3,447
|
)
|
||
|
Net income attributable to Colony Credit Real Estate, Inc. common stockholders
|
$
|
10,988
|
|
|
|
7.
|
Real Estate, net
|
The following table presents the Company’s net lease portfolio, net, as of
December 31, 2018
and
2017
(dollars in thousands):
|
December 31, 2018
|
December 31, 2017
|
|||||||
|
Land and improvements
|
$
|
226,141
|
|
$
|
25,262
|
|
||
|
Buildings, building leaseholds, and improvements
|
1,010,339
|
|
178,109
|
|
||||
|
Tenant improvements
|
24,060
|
|
2,316
|
|
||||
|
Construction-in-progress
|
437
|
|
21
|
|
||||
|
Subtotal
|
$
|
1,260,977
|
|
$
|
205,708
|
|
||
|
Less: Accumulated depreciation
|
(34,532
|
)
|
(5,516
|
)
|
||||
|
Less: Impairment
(1)
|
(7,094
|
)
|
—
|
|
||||
|
Net lease portfolio, net
|
$
|
1,219,351
|
|
$
|
200,192
|
|
||
______________________________
|
(1)
|
See Note 15, “Fair Value,” for discussion of impairment of real estate.
|
The following table presents the Company’s other portfolio, net, including foreclosed properties, as of
December 31, 2018
and
2017
(dollars in thousands):
|
December 31, 2018
|
December 31, 2017
|
|||||||
|
Land and improvements
|
$
|
113,495
|
|
$
|
667
|
|
||
|
Buildings, building leaseholds, and improvements
|
627,612
|
|
18,477
|
|
||||
|
Tenant improvements
|
24,001
|
|
36
|
|
||||
|
Furniture, fixtures and equipment
|
17,910
|
|
680
|
|
||||
|
Construction-in-progress
|
2,635
|
|
—
|
|
||||
|
Subtotal
|
$
|
785,653
|
|
$
|
19,860
|
|
||
|
Less: Accumulated depreciation
|
(23,030
|
)
|
(312
|
)
|
||||
|
Less: Impairment
(1)
|
(22,284
|
)
|
—
|
|
||||
|
Other portfolio, net
|
$
|
740,339
|
|
$
|
19,548
|
|
||
|
(1)
|
See Note 15, “Fair Value,” for discussion of impairment of real estate.
|
For the
year ended
December 31, 2018
, the Company had
no
single property with rental and other income equal to or greater than
10.0%
of total revenue.
At
December 31, 2018
and
2017
, the Company held foreclosed properties included in real estate, net with a carrying value of
$128.8 million
and
$19.5 million
, respectively.
F-38
COLONY CREDIT REAL ESTATE, INC.
NOTES TO CONSOLIDATED FINANCIAL STATEMENTS (Continued)
Depreciation Expense
Depreciation expense on real estate was
$56.3 million
,
$5.8 million
, and
$0.1 million
for the years ended
December 31, 2018
,
2017
and
2016
, respectively.
Minimum Future Rents
Minimum rental amounts due under leases are generally either subject to scheduled fixed increases or adjustments. The following table presents approximate future minimum rental income under non-cancellable operating leases to be received over the next five years and thereafter as of
December 31, 2018
(dollars in thousands):
|
2019
|
$
|
113,525
|
|
|
|
2020
|
107,413
|
|
||
|
2021
|
98,343
|
|
||
|
2022
|
88,270
|
|
||
|
2023
|
73,257
|
|
||
|
2024 and thereafter
|
765,652
|
|
||
|
Total
|
$
|
1,246,460
|
|
|
The rental properties owned at
December 31, 2018
are leased under non-cancellable operating leases with current expirations ranging from
2019
to
2038
, with certain tenant renewal rights. For certain properties, the tenants pay the Company, in addition to the contractual base rent, their pro rata share of real estate taxes and operating expenses. Certain lease agreements provide for periodic rental increases and others provide for increases based on the consumer price index.
Commitments and Contractual Obligations
Ground Lease Obligation
In connection with real estate acquisitions, the Company assumed certain noncancelable operating ground leases as lessee or sublessee with expiration dates through
2050
. Rents on certain ground leases are paid directly by the tenants. Ground rent expense for the
years ended
December 31, 2018
and
2017
was approximately
$2.8 million
and
$2.1 million
, respectively. The Company was not a lessee to any ground leases in
2016
.
Refer to Note 18, “Commitments and Contingencies” for the details of future minimum rental payments on noncancelable ground lease on real estate as of
December 31, 2018
.
Real Estate Asset Acquisitions
The following table summarizes the Company’s real estate asset acquisitions for the
year ended
December 31, 2018
(dollars in thousands):
|
Purchase Price Allocation
|
|||||||||||||||||||||||||||||||
|
Acquisition Date
|
Property Type and Location
|
Number of Buildings
|
Purchase Price
(1)
|
Land and Improvements
(2)
|
Building and Improvements
(2)
|
Furniture, Fixtures and Equipment
|
Lease Intangible Assets
(2)
|
Other Assets
|
Other Liabilities
|
||||||||||||||||||||||
|
July
|
Office - Norway
|
26
|
|
$
|
318,860
|
|
$
|
60,510
|
|
$
|
271,983
|
|
$
|
—
|
|
$
|
25,287
|
|
$
|
—
|
|
$
|
(38,920
|
)
|
|||||||
|
August
|
Hotel - Dallas, TX
|
1
|
|
75,663
|
|
8,216
|
|
61,580
|
|
3,947
|
|
465
|
|
2,023
|
|
(568
|
)
|
||||||||||||||
|
August
|
Industrial - Various in U.S.
|
2
|
|
292,000
|
|
66,844
|
|
189,105
|
|
—
|
|
36,051
|
|
—
|
|
—
|
|
||||||||||||||
|
September
|
Hotel - Pittsburgh, PA
|
1
|
|
42,315
|
|
7,247
|
|
26,363
|
|
3,025
|
|
1,408
|
|
4,392
|
|
(120
|
)
|
||||||||||||||
|
$
|
728,838
|
|
$
|
142,817
|
|
$
|
549,031
|
|
$
|
6,972
|
|
$
|
63,211
|
|
$
|
6,415
|
|
$
|
(39,608
|
)
|
|||||||||||
______________________________
|
(1)
|
Dollar amounts of purchase price and allocation to assets acquired and liabilities assumed are translated using foreign exchange rate as of the respective dates of acquisitions, where applicable.
|
|
(2)
|
Useful life of real estate acquired is
30
to
40
years for buildings,
8
to
15
years for site improvements,
15
to
20
years for tenant improvements,
2
to
3
years for furniture, fixtures and equipment, and
1.5
to
20
years for lease intangibles.
|
F-39
COLONY CREDIT REAL ESTATE, INC.
NOTES TO CONSOLIDATED FINANCIAL STATEMENTS (Continued)
Real Estate Sale
In
October 2018,
the Company completed the sale of the real estate held for sale for a sales price of
$177.0 million
. In connection with the sale, the Company recorded a
$2.4 million
impairment loss for the
year ended
December 31, 2018
. The write down to fair value less cost to sell was calculated based on contracted sales price. Refer to Note 15, “Fair Value” for further detail.
The real estate sold during the year ended
December 31, 2018
did not constitute discontinued operations, as the Company is not entirely exiting markets or property types and such sale did not represent a strategic shift.
|
8.
|
Deferred Leasing Costs and Other Intangibles
|
The Company’s deferred leasing costs, other intangible assets and intangible liabilities at
December 31, 2018
and
2017
are as follows (dollars in thousands):
|
December 31, 2018
|
||||||||||||
|
Carrying Amount
|
Accumulated Amortization
|
Net Carrying Amount
|
||||||||||
|
Deferred Leasing Costs and Intangible Assets
|
||||||||||||
|
In-place lease values
|
$
|
115,778
|
|
$
|
(27,120
|
)
|
$
|
88,658
|
|
|||
|
Deferred leasing costs
|
39,130
|
|
(6,848
|
)
|
32,282
|
|
||||||
|
Above-market lease values
|
16,203
|
|
(3,883
|
)
|
12,320
|
|
||||||
|
Other intangibles
|
906
|
|
(134
|
)
|
772
|
|
||||||
|
Below-market ground lease obligations
|
52
|
|
(16
|
)
|
36
|
|
||||||
|
$
|
172,069
|
|
$
|
(38,001
|
)
|
$
|
134,068
|
|
||||
|
Intangible Liabilities
|
||||||||||||
|
Below-market lease values
|
$
|
19,374
|
|
$
|
(4,278
|
)
|
$
|
15,096
|
|
|||
|
December 31, 2017
|
||||||||||||
|
Carrying Amount
|
Accumulated Amortization
|
Net Carrying Amount
|
||||||||||
|
Deferred Leasing Costs and Intangible Assets
|
||||||||||||
|
In-place lease values
|
$
|
9,214
|
|
$
|
(2,657
|
)
|
$
|
6,557
|
|
|||
|
Deferred leasing costs
|
3,671
|
|
(657
|
)
|
3,014
|
|
||||||
|
Above-market lease values
|
1,682
|
|
(283
|
)
|
1,399
|
|
||||||
|
Below-market ground lease obligations
|
52
|
|
(8
|
)
|
44
|
|
||||||
|
$
|
14,619
|
|
$
|
(3,605
|
)
|
$
|
11,014
|
|
||||
|
Intangible Liabilities
|
||||||||||||
|
Below-market lease values
|
$
|
51
|
|
$
|
(15
|
)
|
$
|
36
|
|
|||
F-40
COLONY CREDIT REAL ESTATE, INC.
NOTES TO CONSOLIDATED FINANCIAL STATEMENTS (Continued)
The following table summarizes the amortization of deferred leasing costs, intangible assets and intangible liabilities for the
years ended
December 31, 2018
and
2017
(dollars in thousands):
|
Year Ended December 31,
|
||||||||
|
2018
|
2017
|
|||||||
|
Above-market lease values
|
$
|
(4,277
|
)
|
$
|
(283
|
)
|
||
|
Below-market lease values
|
4,329
|
|
15
|
|
||||
|
Net increase (decrease) to property operating income
|
$
|
52
|
|
$
|
(268
|
)
|
||
|
Below-market ground lease obligations
|
$
|
8
|
|
$
|
8
|
|
||
|
Increase to property operating expense
|
$
|
8
|
|
$
|
8
|
|
||
|
In-place lease values
|
$
|
27,239
|
|
$
|
2,657
|
|
||
|
Deferred leasing costs
|
7,343
|
|
655
|
|
||||
|
Other intangibles
|
134
|
|
—
|
|
||||
|
Amortization expense
|
$
|
34,716
|
|
$
|
3,312
|
|
||
The following table presents the amortization of deferred leasing costs, intangible assets and intangible liabilities for each of the next five years and thereafter as of
December 31, 2018
(dollars in thousands):
|
2019
|
2020
|
2021
|
2022
|
2023
|
2024 and thereafter
|
Total
|
||||||||||||||||||||||
|
Above-market lease values
|
$
|
3,771
|
|
$
|
3,162
|
|
$
|
1,998
|
|
$
|
1,422
|
|
$
|
744
|
|
$
|
1,223
|
|
$
|
12,320
|
|
|||||||
|
Below-market lease values
|
(4,498
|
)
|
(4,052
|
)
|
(3,848
|
)
|
(2,415
|
)
|
(177
|
)
|
(106
|
)
|
(15,096
|
)
|
||||||||||||||
|
Net increase (decrease) to property operating income
|
$
|
(727
|
)
|
$
|
(890
|
)
|
$
|
(1,850
|
)
|
$
|
(993
|
)
|
$
|
567
|
|
$
|
1,117
|
|
$
|
(2,776
|
)
|
|||||||
|
Below-market ground lease obligations
|
$
|
8
|
|
$
|
8
|
|
$
|
8
|
|
$
|
8
|
|
$
|
4
|
|
$
|
—
|
|
$
|
36
|
|
|||||||
|
Increase to property operating expense
|
$
|
8
|
|
$
|
8
|
|
$
|
8
|
|
$
|
8
|
|
$
|
4
|
|
$
|
—
|
|
$
|
36
|
|
|||||||
|
In-place lease values
|
$
|
16,540
|
|
$
|
13,892
|
|
$
|
10,905
|
|
$
|
7,758
|
|
$
|
4,935
|
|
$
|
34,628
|
|
$
|
88,658
|
|
|||||||
|
Deferred leasing costs
|
7,083
|
|
6,227
|
|
4,992
|
|
3,711
|
|
2,477
|
|
7,792
|
|
32,282
|
|
||||||||||||||
|
Other intangibles
|
472
|
|
300
|
|
—
|
|
—
|
|
—
|
|
—
|
|
772
|
|
||||||||||||||
|
Amortization expense
|
$
|
24,095
|
|
$
|
20,419
|
|
$
|
15,897
|
|
$
|
11,469
|
|
$
|
7,412
|
|
$
|
42,420
|
|
$
|
121,712
|
|
|||||||
F-41
COLONY CREDIT REAL ESTATE, INC.
NOTES TO CONSOLIDATED FINANCIAL STATEMENTS (Continued)
|
9.
|
Restricted Cash, Other Assets and Accrued and Other Liabilities
|
The following table presents a summary of restricted cash as of
December 31, 2018
and
2017
(dollars in thousands):
|
December 31, 2018
|
December 31, 2017
|
|||||||
|
Restricted cash:
|
||||||||
|
Borrower escrow deposits
|
$
|
65,995
|
|
$
|
36,960
|
|
||
|
Capital expenditure reserves
|
17,440
|
|
4,875
|
|
||||
|
Working capital and other reserves
|
8,396
|
|
66
|
|
||||
|
Real estate escrow reserves
|
7,304
|
|
—
|
|
||||
|
Tenant lock boxes
|
5,642
|
|
—
|
|
||||
|
Restricted cash of consolidated Securitization 2016-1
|
3,293
|
|
—
|
|
||||
|
Other
|
2,076
|
|
—
|
|
||||
|
Total
|
$
|
110,146
|
|
$
|
41,901
|
|
||
The following table presents a summary of other assets as of
December 31, 2018
and
2017
(dollars in thousands):
|
December 31, 2018
|
December 31, 2017
|
|||||||
|
Other assets:
|
||||||||
|
Prepaid taxes and deferred tax assets
|
$
|
32,878
|
|
$
|
1,050
|
|
||
|
Derivative asset
|
14,139
|
|
117
|
|
||||
|
Deferred financing costs, net - credit facilities
|
9,415
|
|
—
|
|
||||
|
Prepaid expenses
|
5,574
|
|
360
|
|
||||
|
Total
|
$
|
62,006
|
|
$
|
1,527
|
|
||
The following table presents a summary of accrued and other liabilities as of
December 31, 2018
and
2017
(dollars in thousands):
|
December 31, 2018
|
December 31, 2017
|
|||||||
|
Accrued and other liabilities:
|
||||||||
|
Current and deferred tax liability
|
$
|
36,730
|
|
$
|
120
|
|
||
|
Accounts payable, accrued expenses and other liabilities
|
29,151
|
|
3,532
|
|
||||
|
Interest payable
|
21,576
|
|
924
|
|
||||
|
Prepaid rent and unearned revenue
|
10,481
|
|
481
|
|
||||
|
Derivative liability
|
6,042
|
|
—
|
|
||||
|
Tenant security deposits
|
2,207
|
|
118
|
|
||||
|
Total
|
$
|
106,187
|
|
$
|
5,175
|
|
||
|
10.
|
Debt
|
The following table presents debt as of
December 31, 2018
and
2017
(dollars in thousands):
|
December 31, 2018
|
December 31, 2017
|
||||||||||||||||||||||||
|
Capacity ($)
|
Recourse vs.
Non-Recourse (1) |
Final
Maturity |
Contractual
Interest Rate |
Principal
Amount (2) |
Carrying
Value (2) |
Principal
Amount (2) |
Carrying
Value (2) |
||||||||||||||||||
|
Securitization bonds payable, net
|
|||||||||||||||||||||||||
|
2014 FL1
(3)
|
|
|
Non-recourse
|
Apr-31
|
LIBOR + 3.28%
|
$
|
25,549
|
|
$
|
25,549
|
|
$
|
27,119
|
|
$
|
27,004
|
|
||||||||
|
2014 FL2
(3)
|
|
|
Non-recourse
|
Nov-31
|
LIBOR + 4.25%
|
18,320
|
|
18,320
|
|
55,430
|
|
55,430
|
|
||||||||||||
|
2015 FL3
(3)
|
|
|
Non-recourse
|
NA
|
NA
|
—
|
|
—
|
|
26,245
|
|
26,245
|
|
||||||||||||
|
Securitization 2016-1
(3)
|
|
|
Non-recourse
|
Sep-31
|
LIBOR + 4.12%
|
37,503
|
|
37,503
|
|
—
|
|
—
|
|
||||||||||||
|
Subtotal securitization bonds payable, net
|
81,372
|
|
81,372
|
|
108,794
|
|
108,679
|
|
|||||||||||||||||
|
Mortgage and other notes payable, net
|
|||||||||||||||||||||||||
|
Net lease 1
|
Non-recourse
|
Oct-27
|
4.45%
|
24,606
|
|
24,606
|
|
25,074
|
|
25,022
|
|
||||||||||||||
|
Net lease 2
|
Non-recourse
|
Nov-26
|
4.45%
|
3,484
|
|
3,378
|
|
3,544
|
|
3,425
|
|
||||||||||||||
|
Net lease 3
|
Non-recourse
|
Nov-26
|
4.45%
|
7,519
|
|
7,290
|
|
7,647
|
|
7,390
|
|
||||||||||||||
F-42
COLONY CREDIT REAL ESTATE, INC.
NOTES TO CONSOLIDATED FINANCIAL STATEMENTS (Continued)
|
December 31, 2018
|
December 31, 2017
|
||||||||||||||||||||||||
|
Capacity ($)
|
Recourse vs.
Non-Recourse (1) |
Final
Maturity |
Contractual
Interest Rate |
Principal
Amount (2) |
Carrying
Value (2) |
Principal
Amount (2) |
Carrying
Value (2) |
||||||||||||||||||
|
Net lease 4
|
Non-recourse
|
Jun-21
|
4.00%
|
12,786
|
|
12,648
|
|
13,133
|
|
12,939
|
|
||||||||||||||
|
Net lease 5
|
Non-recourse
|
Jul-23
|
LIBOR + 2.15%
|
2,078
|
|
2,024
|
|
2,482
|
|
2,416
|
|
||||||||||||||
|
Net lease 6
|
Non-recourse
|
Aug-26
|
4.08%
|
32,378
|
|
32,054
|
|
32,600
|
|
32,234
|
|
||||||||||||||
|
Net lease 7
(4)
|
Non-recourse
|
Nov-26
|
4.45%
|
18,917
|
|
18,342
|
|
19,241
|
|
18,593
|
|
||||||||||||||
|
Net lease 8
|
Non-recourse
|
Mar-28
|
4.38%
|
12,434
|
|
11,920
|
|
—
|
|
—
|
|
||||||||||||||
|
Net lease 9
|
Non-recourse
|
Apr-21
(5)
|
LIBOR+2.50%
|
73,702
|
|
73,696
|
|
—
|
|
—
|
|
||||||||||||||
|
Net lease 10
|
Non-recourse
|
Jul-25
|
4.31%
|
250,000
|
|
246,522
|
|
—
|
|
—
|
|
||||||||||||||
|
Net lease 11
(6)
|
Non-recourse
|
Jun-25
|
3.91%
|
184,320
|
|
186,934
|
|
—
|
|
—
|
|
||||||||||||||
|
Net lease 12
|
Non-recourse
|
Sep-33
|
4.77%
|
200,000
|
|
198,449
|
|
—
|
|
—
|
|
||||||||||||||
|
Multifamily 1
|
Non-recourse
|
Dec-23
|
4.84%
|
43,500
|
|
44,008
|
|
—
|
|
—
|
|
||||||||||||||
|
Multifamily 2
|
Non-recourse
|
Dec-23
|
4.94%
|
43,000
|
|
43,501
|
|
—
|
|
—
|
|
||||||||||||||
|
Multifamily 3
|
Non-recourse
|
Jan-24
|
5.15%
|
16,000
|
|
16,561
|
|
—
|
|
—
|
|
||||||||||||||
|
Multifamily 4
(7)
|
Non-recourse
|
Dec-20
|
5.27%
|
11,964
|
|
12,228
|
|
—
|
|
—
|
|
||||||||||||||
|
Multifamily 5
|
Non-recourse
|
Nov-26
|
3.98%
|
24,289
|
|
23,485
|
|
—
|
|
—
|
|
||||||||||||||
|
Office 1
|
Non-recourse
|
Oct-24
|
4.47%
|
108,850
|
|
109,779
|
|
—
|
|
—
|
|
||||||||||||||
|
Office 2
|
Non-recourse
|
Jan-25
|
4.30%
|
76,448
|
|
75,620
|
|
—
|
|
—
|
|
||||||||||||||
|
Office 3
|
Non-recourse
|
Apr-23
|
LIBOR + 4.00%
|
31,126
|
|
29,974
|
|
—
|
|
—
|
|
||||||||||||||
|
Hotel development loan
(8)
|
Non-recourse
|
NA
|
NA
|
—
|
|
—
|
|
130,000
|
|
128,649
|
|
||||||||||||||
|
Hotel A-Note
(9)
|
Non-recourse
|
NA
|
NA
|
—
|
|
—
|
|
50,314
|
|
50,314
|
|
||||||||||||||
|
Subtotal mortgage and other notes payable, net
|
1,177,401
|
|
1,173,019
|
|
284,035
|
|
280,982
|
|
|||||||||||||||||
|
Bank credit facility
|
|||||||||||||||||||||||||
|
Bank credit facility
|
$
|
525,000
|
|
Recourse
|
Feb-23
(10)
|
LIBOR + 2.25%
|
295,000
|
|
295,000
|
|
—
|
|
—
|
|
|||||||||||
|
Subtotal bank credit facility
|
295,000
|
|
|
295,000
|
|
—
|
|
—
|
|
||||||||||||||||
|
Master repurchase facilities
|
|||||||||||||||||||||||||
|
Bank 1 facility 3
|
$
|
300,000
|
|
Limited Recourse
(11)
|
Apr-23
(12)
|
LIBOR + 2.00%
|
(13)
|
143,400
|
|
143,400
|
|
—
|
|
—
|
|
||||||||||
|
Bank 2 facility 3
|
200,000
|
|
Limited Recourse
(11)
|
Oct-22
(14)
|
LIBOR + 2.50%
|
(13)
|
22,750
|
|
22,750
|
|
—
|
|
—
|
|
|||||||||||
|
Bank 3 facility 3
|
500,000
|
|
Limited Recourse
(11)
|
Apr-21
|
LIBOR + 2.32%
|
(13)
|
352,108
|
|
352,108
|
|
—
|
|
—
|
|
|||||||||||
|
Bank 7 facility 1
|
500,000
|
|
Limited Recourse
(11)
|
Apr-22
(15)
|
LIBOR + 1.89%
|
(13)
|
308,434
|
|
308,434
|
|
—
|
|
—
|
|
|||||||||||
|
Bank 8 facility 1
|
250,000
|
|
Limited Recourse
(11)
|
Jun-21
(16)
|
LIBOR + 2.00%
|
(13)
|
53,596
|
|
53,596
|
|
—
|
|
—
|
|
|||||||||||
|
Bank 9 facility 1
|
300,000
|
|
Limited Recourse
(11)
|
Nov-23
(17)
|
(18)
|
—
|
|
—
|
|
—
|
|
—
|
|
||||||||||||
|
Subtotal master repurchase facilities
|
$
|
2,050,000
|
|
880,288
|
|
880,288
|
|
—
|
|
—
|
|
||||||||||||||
|
CMBS credit facilities
|
|||||||||||||||||||||||||
|
Bank 1 facility 1
|
Recourse
|
(19)
|
LIBOR + 1.10%
|
(13)
|
18,542
|
|
|
18,542
|
|
—
|
|
—
|
|
||||||||||||
|
Bank 1 facility 2
|
Recourse
|
(19)
|
LIBOR + 1.10%
|
(13)
|
17,237
|
|
|
17,237
|
|
—
|
|
—
|
|
||||||||||||
|
Bank 3 facility
|
|
|
Recourse
|
(19)
|
NA
|
—
|
|
—
|
|
—
|
|
—
|
|
||||||||||||
|
Bank 4 facility
|
Recourse
|
(19)
|
NA
|
—
|
|
—
|
|
—
|
|
—
|
|
||||||||||||||
|
Bank 5 facility 1
|
Recourse
|
(19)
|
NA
|
—
|
|
—
|
|
—
|
|
—
|
|
||||||||||||||
|
Bank 5 facility 2
|
Recourse
|
(19)
|
NA
|
—
|
|
—
|
|
—
|
|
—
|
|
||||||||||||||
|
Bank 6 facility 1
|
Recourse
|
(19)
|
LIBOR + 1.29%
|
(13)
|
80,838
|
|
80,838
|
|
—
|
|
—
|
|
|||||||||||||
|
Bank 6 facility 2
|
Recourse
|
(19)
|
LIBOR + 1.12%
|
(13)
|
74,013
|
|
74,013
|
|
—
|
|
—
|
|
|||||||||||||
|
Subtotal CMBS credit facilities
|
190,630
|
|
190,630
|
|
—
|
|
—
|
|
|||||||||||||||||
|
Subtotal credit facilities
|
1,365,918
|
|
1,365,918
|
|
—
|
|
—
|
|
|||||||||||||||||
F-43
COLONY CREDIT REAL ESTATE, INC.
NOTES TO CONSOLIDATED FINANCIAL STATEMENTS (Continued)
|
December 31, 2018
|
December 31, 2017
|
||||||||||||||||||||||||
|
Capacity ($)
|
Recourse vs.
Non-Recourse (1) |
Final
Maturity |
Contractual
Interest Rate |
Principal
Amount (2) |
Carrying
Value (2) |
Principal
Amount (2) |
Carrying
Value (2) |
||||||||||||||||||
|
Total
|
|
|
$
|
2,624,691
|
|
$
|
2,620,309
|
|
$
|
392,829
|
|
$
|
389,661
|
|
|||||||||||
_________________________________________
|
(1)
|
Subject to customary non-recourse carveouts.
|
|
(2)
|
Difference between principal amount and carrying value of securitization bonds payable, net and mortgage and other notes payable, net is attributable to deferred financing costs, net and premium/discount on mortgage notes payable.
|
|
(3)
|
The Company, through indirect Cayman subsidiaries, securitized commercial mortgage loans originated by the Company. Senior notes issued by the securitization trusts were generally sold to third parties and subordinated notes retained by the Company. These securitizations are accounted for as secured financing with the underlying mortgage loans pledged as collateral. Principal payments from underlying collateral loans must be applied to repay the notes until fully paid off, irrespective of the contractual maturities on the notes. Underlying collateral loans have initial terms of
two
to
three
years.
|
|
(4)
|
Payment terms are periodic payment of principal and interest for debt on
two
properties and periodic payment of interest only with principal at maturity (except for principal repayments to release collateral properties disposed) for debt on
one
property.
|
|
(5)
|
The current maturity of the mortgage payable is April 2019, with
two
one
-year extensions available at the Company’s option, which may be subject to the satisfaction of certain customary conditions set forth in the governing documents.
|
|
(6)
|
As of December 31, 2018, the outstanding principal of the mortgage payable was NOK
1.6 billion
, which translated to
$184.3 million
. The mortgage payable was assumed in July 2018.
|
|
(7)
|
Represents
two
separate senior mortgage notes with a weighted average maturity of December 1, 2020 and weighted average interest rate of
5.27%
.
|
|
(8)
|
A development loan originated by the Company was restructured into a senior and junior note, with the senior note assumed by a third-party lender. The Company accounted for the transfer of the senior note as a financing transaction. The senior note bore interest at one-month London Interbank Offered Rate (“LIBOR”) plus
3.5%
, with a
4.0%
floor, and was subject to
two
one
-year extension options on its initial term, exercisable by the borrower. The investment entity that held the debt was deconsolidated upon closing of the Combination (refer to Note 2, “Summary of Significant Accounting Policies”).
|
|
(9)
|
Represents the Company’s senior participation interest in a first mortgage loan that was transferred at cost into a securitization trust with the transfer accounted for as a secured financing transaction. The Company did not retain any legal interest in the senior participation and retained the junior participation on an unleveraged basis.
|
|
(10)
|
The abilities to borrow additional amounts terminates on February 1, 2022 at which time the Company may, at its election, extend the termination date for
two
additional
six
-month terms.
|
|
(11)
|
Recourse solely with respect to
25.0%
of the financed amount.
|
|
(12)
|
The next maturity date is April 2021, with
two
one
-year extensions available at the option of the Company, which may be exercised upon the satisfaction of certain customary conditions set forth in the governing documents.
|
|
(13)
|
Represents the weighted average spread as of
December 31, 2018
. The contractual interest rate depends upon asset type and characteristics and ranges from
one
-month to
three
-month LIBOR plus
1.10%
to
2.63%
.
|
|
(14)
|
The next maturity date is October 2019, with
three
one
-year extension options available, which may be subject to the satisfaction of certain customary conditions set forth in the governing documents.
|
|
(15)
|
The next maturity date is April 2021, with a
one
-year extension available, which may be subject to the satisfaction of certain customary conditions set forth in the governing documents.
|
|
(16)
|
The next maturity date is June 2020, with a
one
-year extension available, which may be subject to the satisfaction of certain customary conditions set forth in the governing documents.
|
|
(17)
|
The next maturity date is November, 2021, with
two
one
-year extension options available, which may be subject to the satisfaction of certain customary conditions set forth in the governing documents.
|
|
(18)
|
The interest rate will be determined by the lender in its sole discretion.
|
|
(19)
|
The maturity dates on the CMBS Credit Facilities are dependent upon asset type and will typically range from
one
to
two
months.
|
Future Minimum Principal Payments
The following table summarizes future scheduled minimum principal payments at
December 31, 2018
based on initial maturity dates or extended maturity dates to the extent criteria are met and the extension option is at the borrower’s discretion (dollars in thousands):
|
Year Ending December 31,
|
Total
|
Securitization Bonds Payable, Net
|
Mortgage Notes Payable, Net
|
Credit
Facilities |
|||||||||||
|
2019
|
$
|
193,174
|
|
$
|
—
|
|
$
|
2,544
|
|
$
|
190,630
|
|
|||
|
2020
|
14,607
|
|
—
|
|
14,607
|
|
—
|
|
|||||||
|
2021
|
493,930
|
|
—
|
|
88,226
|
|
405,704
|
|
|||||||
|
2022
|
333,704
|
|
—
|
|
2,520
|
|
331,184
|
|
|||||||
|
2023
|
471,945
|
|
—
|
|
120,045
|
|
438,400
|
|
|||||||
|
2024 and thereafter
|
1,117,331
|
|
81,372
|
|
949,459
|
|
—
|
|
|||||||
|
Total
|
$
|
2,624,691
|
|
$
|
81,372
|
|
$
|
1,177,401
|
|
$
|
1,365,918
|
|
|||
F-44
COLONY CREDIT REAL ESTATE, INC.
NOTES TO CONSOLIDATED FINANCIAL STATEMENTS (Continued)
Bank Credit Facility
On
February 1, 2018
, the Company, through subsidiaries, including the OP, entered into a credit agreement with several lenders to provide a revolving credit facility in the aggregate principal amount of up to
$400.0 million
(the “Bank Credit Facility”). On December 17, 2018, the aggregate amount of revolving commitments was increased to
$525.0 million
. The Bank Credit Facility will mature on
February 1, 2022
, unless the OP elects to extend the maturity date for up to
two
additional
six
-month terms.
The maximum amount available for borrowing at any time under the Bank Credit Facility is limited to a borrowing base valuation of certain investment assets, with the valuation of such investment assets generally determined according to a percentage of adjusted net book value. At
December 31, 2018
, the borrowing base valuation was sufficient to support the outstanding principal amount of
$295.0 million
.
Advances under the Bank Credit Facility accrue interest at a per annum rate equal to, at the applicable borrower’s election, either a LIBOR rate plus a margin of
2.25%
, or a base rate determined according to a prime rate or federal funds rate plus a margin of
1.25%
. The Company pays a commitment fee of
0.25%
or
0.35%
per annum of the unused amount (
0.25%
at
December 31, 2018
), depending upon the amount of facility utilization.
Substantially all material wholly owned subsidiaries of the Company guarantee the obligations of the Company and any other borrowers under the Bank Credit Facility. As security for the advances under the Bank Credit Facility, the Company pledged substantially all equity interests it owns and granted a security interest in deposit accounts in which the proceeds of investment asset distributions are maintained.
The Bank Credit Facility contains various affirmative and negative covenants including financial covenants that require the Company to maintain minimum tangible net worth, liquidity levels and financial ratios, as specified in the Bank Credit Facility. At
December 31, 2018
, the Company was in compliance with all of the financial covenants.
Subsequent to
December 31, 2018
, the total commitment of the Bank Credit Facility was increased to
$560.0 million
. See Note 21, “Subsequent Events,” for further discussion.
Securitization Financing Transactions
Securitization bonds payable, net represent debt issued by securitization vehicles consolidated by the Company. Senior notes issued by these securitization trusts were generally sold to third parties and subordinated notes retained by the Company. Payments from underlying collateral loans must be applied to repay the notes until fully paid off, irrespective of the contractual maturities of the loans.
As of
December 31, 2018
, the Company had
$286.2 million
carrying value of CRE debt investments financed with
$81.4 million
of securitization bonds payable, net.
Master Repurchase Facilities
As of
December 31, 2018
, the Company, through subsidiaries, had entered into repurchase agreements with multiple global financial institutions to provide an aggregate principal amount of up to
$2.1 billion
to finance the origination of first mortgage loans and senior loan participations secured by CRE debt investments (“Master Repurchase Facilities”). The Company agreed to guarantee certain obligations under the Master Repurchase Facilities, which contain representations, warranties, covenants, conditions precedent to funding, events of default and indemnities that are customary for agreements of this type. The Master Repurchase Facilities act as revolving loan facilities that can be paid down as assets are repaid or sold and re-drawn upon for new investments. As of
December 31, 2018
, the Company was in compliance with all of its financial covenants under the Master Repurchase Facilities.
As of
December 31, 2018
, the Company had
$1.2 billion
carrying value of CRE debt investments financed with
$880.3 million
under the master repurchase facilities.
On April 20, 2018, the Company, through subsidiaries, consolidated two prior master purchase agreements by entering into an Amended and Restated Master Repurchase and Securities Contract Agreement (“Bank 3 Facility 3”). The Repurchase Agreement provides up to
$500.0 million
to finance first mortgage loans, senior loan participations and other commercial mortgage loan debt instruments secured by commercial real estate.
On April 23, 2018, the Company, through subsidiaries, entered into a Master Repurchase Agreement (“Bank 1 Facility 3”). The Repurchase Agreement provides up to
$300.0 million
to finance first mortgage loans, senior loan participations and other commercial mortgage loan debt instruments secured by commercial real estate.
F-45
COLONY CREDIT REAL ESTATE, INC.
NOTES TO CONSOLIDATED FINANCIAL STATEMENTS (Continued)
On April 26, 2018, the Company entered into a Master Repurchase Agreement with a major financial institution through a subsidiary (“Bank 7 Facility 1”). This agreement provides up to
$500.0 million
to finance the Company’s lending activities.
On June 19, 2018, the Company entered into a Master Repurchase Agreement with a major financial institution through a subsidiary (“Bank 8 Facility 1”). This agreement provides up to
$250.0 million
to finance the Company’s lending activities.
On October 23, 2018, the Company, through subsidiaries, terminated Bank 2 Facility 2 and entered into a Master Repurchase Agreement with Bank 2 (“Bank 2 Facility 3”). This agreement provides up to
$200.0 million
to finance the Company’s lending activities.
On November 2, 2018, the Company entered into a Master Repurchase and Securities Contract with a major financial institution through a subsidiary (“Bank 9 Facility 1”). This agreement provides up to
$300.0 million
to finance the Company’s lending activities.
CMBS Credit Facilities
As of
December 31, 2018
, the Company has entered into
eight
master repurchase agreements (collectively the “CMBS Credit Facilities”) to finance CMBS investments. The CMBS Credit Facilities are on a recourse basis and contain representations, warranties, covenants, conditions precedent to funding, events of default and indemnities that are customary for agreements of this type. As of
December 31, 2018
, the Company had
$226.6 million
carrying value of CRE securities financed with
$164.3 million
under its CMBS Credit Facilities. As of
December 31, 2018
, the Company had
$49.9 million
carrying value of underlying investments in the subordinate tranches of the securitization trusts financed with
$26.3 million
under its CMBS Credit Facilities.
|
11.
|
Related Party Arrangements
|
Management Agreement
On
January 31, 2018
, the Company and the OP entered into a management agreement (the “Management Agreement”) with the Manager, pursuant to which the Manager manages the Company’s assets and its day-to-day operations. The Manager will be responsible for, among other matters, (1) the selection, origination, acquisition, management and sale of the Company’s portfolio investments, (2) the Company’s financing activities and (3) providing the Company with investment advisory services. The Manager is also responsible for the Company’s day-to-day operations and will perform (or will cause to be performed) such services and activities relating to the Company’s investments and business and affairs as may be appropriate. The Management Agreement requires the Manager to manage the Company’s business affairs in conformity with the investment guidelines and other policies that are approved and monitored by the board of directors. Each of the Company’s executive officers is also an employee of the Manager or its affiliates. The Manager’s role as Manager will be under the supervision and direction of the Company’s board of directors.
The initial term of the Management Agreement expires on the third anniversary of the Closing Date and will be automatically renewed for a one-year term each anniversary date thereafter unless earlier terminated as described below. The Company’s independent directors review the Manager’s performance and the fees that may be payable to the Manager annually and, following the initial term, the Management Agreement may be terminated if there has been an affirmative vote of at least two-thirds of the Company’s independent directors determining that (1) there has been unsatisfactory performance by the Manager that is materially detrimental to the Company or (2) the compensation payable to the Manager, in the form of base management fees and incentive fees taken as a whole, or the amount thereof, is not fair to the Company, subject to the Manager’s right to prevent such termination due to unfair fees by accepting reduced compensation as agreed to by at least two-thirds of the Company’s independent directors. The Company must provide the Manager
180
days’ prior written notice of any such termination.
The Company may also terminate the Management Agreement for cause (as defined in the Management Agreement) at any time, including during the initial term, without the payment of any termination fee, with at least
30
days’ prior written notice from the Company’s board of directors. Unless terminated for cause, the Manager will be paid a termination fee as described below. The Manager may terminate the Management Agreement if the Company becomes required to register as an investment company under the Investment Company Act with such termination deemed to occur immediately before such event, in which case the Company would not be required to pay a termination fee. The Manager may decline to renew the Management Agreement by providing the Company with
180
days’ prior written notice, in which case the Company would not be required to pay a termination fee. The Manager may also terminate the Management Agreement with at least
60
days’ prior written notice if the Company breaches the Management Agreement in any material respect or otherwise is unable to perform its obligations thereunder and the breach continues for a period of
30
days after written notice to the Company, in which case the Manager will be paid a termination fee as described below.
F-46
COLONY CREDIT REAL ESTATE, INC.
NOTES TO CONSOLIDATED FINANCIAL STATEMENTS (Continued)
Fees to Manager
Base Management Fee
The base management fee payable to the Manager is equal to
1.5%
of the Company’s stockholders’ equity (as defined in the Management Agreement), per annum (
0.375%
per quarter), payable quarterly in arrears in cash. For purposes of calculating the base management fee, the Company’s stockholders’ equity means: (a) the sum of (1) the net proceeds received by the Company (or, without duplication, the Company’s direct subsidiaries, such as the OP) from all issuances of the Company’s or such subsidiaries’ common and preferred equity securities since inception (allocated on a pro rata basis for such issuances during the calendar quarter of any such issuance), plus (2) the Company’s cumulative core earnings (as defined in the Management Agreement) from and after the Closing Date to the end of the most recently completed calendar quarter, less (b)(1) any distributions to the Company’s common stockholders (or owners of common equity of the Company’s direct subsidiaries, such as the OP, other than the Company or any of such subsidiaries), (2) any amount that the Company or any of the Company’s direct subsidiaries, such as the OP, have paid to (x) repurchase for cash the Company’s common stock or common equity securities of such subsidiaries or (y) repurchase or redeem for cash the Company’s preferred equity securities or preferred equity securities of such subsidiaries, in each case since the Closing Date and (3) any incentive fee (as described below) paid to the Manager since the Closing Date.
For the
year ended
December 31, 2018
, the total management fee expense incurred was
$43.2 million
. As of
December 31, 2018
there was
$11.5 million
of unpaid management fee included in due to related party in the Company’s consolidated balance sheets.
Incentive Fee
The incentive fee payable to the Manager is equal to the difference between (i) the product of (a)
20%
and (b) the difference between (1) core earnings (as defined in the Management Agreement) for the most recent 12-month period (or the Closing Date if it has been less than 12 months since the Closing Date), including the current quarter, and (2) the product of (A) common equity (as defined in the Management Agreement) in the most recent 12-month period (or the Closing Date if it has been less than 12 months since the Closing Date), and (B)
7%
per annum and (ii) the sum of any incentive fee paid to the Manager with respect to the first three calendar quarters of the most recent 12-month period (or the Closing Date if it has been less than 12 months since the Closing Date), provided, however, that no incentive fee is payable with respect to any calendar quarter unless core earnings (as defined in the Management Agreement) is greater than zero for the most recently completed 12 calendar quarters (or the Closing Date if it has been less than 12 calendar quarters since the Closing Date).
The Company did not incur any incentive fees during the
year ended
December 31, 2018
.
Reimbursements of Expenses
Reimbursement of expenses related to the Company incurred by the Manager, including legal, accounting, financial, due diligence and other services are paid on the Company’s behalf by the OP or its designee(s). The Company reimburses the Manager for the Company’s allocable share of the salaries and other compensation of the Company’s chief financial officer and certain of its affiliates’ non-investment personnel who spend all or a portion of their time managing the Company’s affairs, and the Company’s share of such costs are based upon the percentage of such time devoted by personnel of our Manager (or its affiliates) to the Company’s affairs. The Company may be required to pay the Company’s pro rata portion of rent, telephone, utilities, office furniture, equipment, machinery and other office, internal and overhead expenses of the Manager and its affiliates required for the Company’s operations.
For the
year ended
December 31, 2018
, the total reimbursements of expenses incurred by the Manager on behalf of the Company and reimbursable in accordance with the Management Agreement was
$10.4 million
and is included in administrative expense on the consolidated statements of operations. As of
December 31, 2018
, there was
$3.5 million
unpaid expenses included in due to related party in the Company’s consolidated balance sheets.
Other Payables to Manager
Other payables to the Manager include Combination related adjustments that consist of certain cash contributions from and distributions to Colony Capital or its subsidiaries on behalf of the CLNY Contributed Portfolio.
For the
year ended
December 31, 2018
, the other payables to Manager was
$6.9 million
and the net liabilities assumed in the Combination was
$6.4 million
. Both of these were paid during the
year ended
December 31, 2018
.
F-47
COLONY CREDIT REAL ESTATE, INC.
NOTES TO CONSOLIDATED FINANCIAL STATEMENTS (Continued)
Manager Equity Plan
In March 2018, the Company granted
978,946
shares to its non-independent directors, officers and the Manager and/or employees thereof under the 2018 Equity Incentive Plan (the “2018 Plan”), of which
864,841
remain granted and unvested as of
December 31, 2018
. In connection with this grant, the Company recognized share-based compensation expense of
$6.8 million
to its Manager within administrative expense in the consolidated statement of operations for the
year ended
December 31, 2018
. See Note 12, “Equity-Based Compensation” for further discussion of the 2018 Plan.
Expense Allocations
For the
years ended
December 31, 2017
and
2016
, the Company’s consolidated financial statements present the operations of the CLNY Investment Entities as carved out from the financial statements of Colony Capital. Certain general and administrative costs borne by Colony Capital, including, but not limited to, compensation and benefits, and corporate overhead, have been allocated to the CLNY Investment Entities using reasonable allocation methodologies. Such costs do not necessarily reflect what the actual general and administrative costs would have been if the CLNY Investment Entities had been operating as a separate stand-alone public company. For the
years ended
December 31, 2017
and
2016
, a total of
$12.7 million
and
$15.4 million
, respectively, of allocated expenses are included as a component of administrative expenses in the Company’s consolidated statements of operations.
Investment Activity
All investment acquisitions are approved in accordance with the Company’s investment and related party guidelines, which may include approval by either the audit committee or disinterested members of the Company’s board of directors. No investment by the Company will require approval under the related party transaction policy solely because such investment constitutes a co-investment made by and between the Company and any of its subsidiaries, on the one hand, and one or more investment vehicles formed, sponsored, or managed by an affiliate of the Manager on the other hand.
In November 2016, NorthStar II entered into a
$284.2 million
securitization financing transaction (“Securitization 2016-1”). Securitization 2016-1 was collateralized by a pool of
10
CRE debt investments with a committed aggregate principal balance of
$254.7 million
primarily originated by NorthStar II and
three
senior participations with a committed aggregate principal balance of
$29.5 million
originated by NorthStar I. An affiliate of the Manager was appointed special servicer of Securitization 2016-1. The transaction was approved by the NorthStar II’s board of directors, including all of its independent directors. Securitization 2016-1 was assumed by the Company in connection with the Combination.
In July 2017, NorthStar II entered into a joint venture with an affiliate of the Manager to make a
$60.0 million
investment in a
$180.0 million
mezzanine loan which was originated by such affiliate of the Manager. The transaction was approved by NorthStar II’s board of directors, including all of its independent directors. The investment was purchased by the Company in connection with the Combination. In
June 2018
, the Company increased its commitment to
$101.8 million
in connection with the joint venture bifurcating the mezzanine loan into a mezzanine loan and a preferred equity investment. As of
December 31, 2018
, the Company had an unfunded commitment of
$18.4 million
remaining. The Company’s interest in both the underlying mezzanine loan and preferred equity investment is
31.8%
, and the affiliate entities own the remaining
68.2%
. Both the underlying mezzanine loan and preferred equity investment carry a fixed
12.9%
interest rate. This investment is recorded in investments in unconsolidated ventures in the Company’s consolidated balance sheets.
In
May 2018
, the Company acquired an
$89.1 million
(at par) preferred equity investment in an investment vehicle that owns a seven-property office portfolio located in the New York metropolitan area from an affiliate of the Company’s Manager. The affiliate has a
27.2%
ownership interest in the borrower. The preferred equity investment carries a fixed
12.0%
interest rate. This investment is recorded in loans and preferred equity held for investment, net in the Company’s consolidated balance sheets.
In
July 2018
, the Company acquired a
$326.8 million
Class A office campus located in Norway from an affiliate of the Company’s Manager. In connection with the purchase, the Company assumed senior mortgage financing from a private bond issuance of
$197.7 million
. The bonds have a
seven
-year term remaining, and carry a fixed interest rate of
3.91%
.
In
July 2018
, the Company entered into a joint venture to invest in a development project for land and a Grade A office building in Ireland. The Company agreed to invest up to
$69.9 million
of the
$139.7 million
total commitment. The Company co-invested along with two affiliates of the Manager, with the Company owning
50.0%
of the joint venture and the affiliate entities owning the remaining
50.0%
. The joint venture invested in a senior mortgage loan of
$66.7 million
with a fixed interest rate of
12.5%
and a maturity date of
3.5 years
from origination and common equity.
In
October 2018
, the Company entered into a joint venture to invest in a mixed-use development project in Ireland. The Company agreed to invest up to
$162.4 million
of the
$266.5 million
total commitment. The Company co-invested along with two affiliates
F-48
COLONY CREDIT REAL ESTATE, INC.
NOTES TO CONSOLIDATED FINANCIAL STATEMENTS (Continued)
of the Manager, with the Company owning
61.0%
of the joint venture and the affiliate entities owning the remaining
39.0%
. The joint venture will invest in a senior mortgage loan with a fixed interest rate of
15.0%
and a maturity date of
2.0
years from origination.
In
October 2018
, the Company acquired a
$20.0 million
mezzanine loan from an affiliate of the Company’s Manager, secured by a pledge of an ownership interest in a luxury condominium development project located in New York, NY. The loan bears interest at
9.5%
plus LIBOR.
|
12.
|
Equity-Based Compensation
|
On
January 29, 2018
the Company’s board of directors adopted the 2018 Plan. The 2018 Plan permits the grant of awards with respect to
4.0 million
shares of the Class A common stock, subject to adjustment pursuant to the terms of the 2018 Plan. Awards may be granted under the 2018 Plan to (x) the Manager or any employee, officer, director, consultant or advisor (who is a natural person) providing services to the Company, the Manager or their affiliates and (y) any other individual whose participation in the 2018 Plan is determined to be in the best interests of the Company. The following types of awards may be made under the 2018 Plan, subject to the limitations set forth in the plan: (i) stock options (which may be either incentive stock options or non-qualified stock options); (ii) stock appreciation rights; (iii) restricted stock awards; (iv) stock units; (v) unrestricted stock awards; (vi) dividend equivalent rights; (vii) performance awards; (viii) annual cash incentive awards; (ix) long-term incentive units; and (x) other equity-based awards.
Shares subject to an award granted under the 2018 Plan will be counted against the maximum number of shares of Class A common stock available for issuance thereunder as one share of Class A common stock for every one share of Class A common stock subject to such an award. Shares subject to an award granted under the 2018 Plan will again become available for issuance under the 2018 Plan if the award terminates by expiration, forfeiture, cancellation, or otherwise without the issuance of such shares (except as set forth in the following sentence). The number of shares of Class A common stock available for issuance under the 2018 Plan will not be increased by (i) any shares tendered or withheld in connection with the purchase of shares upon exercise of a stock option, (ii) any shares deducted or delivered in connection with the Company’s tax withholding obligations, or (iii) any shares purchased by the Company with proceeds from stock option exercises. The shares granted to the independent directors of the Company under the 2018 Plan vest in
May 2019
. Shares granted to non-independent directors, officers and the Manager under the 2018 Plan vest ratably in three annual installments beginning in
March 2018
.
The table below summarizes our awards granted, forfeited or vested under the
2018
Plan during the
year ended
December 31, 2018
:
|
Number of Shares
|
|||||||||
|
Restricted Stock
|
Total
|
Weighted Average Grant Date Fair Value
|
|||||||
|
Unvested Shares at December 31, 2017
|
—
|
|
—
|
|
$
|
—
|
|
||
|
Granted
|
1,003,818
|
|
1,003,818
|
|
19.39
|
|
|||
|
Vested
|
(79,368
|
)
|
(79,368
|
)
|
19.39
|
|
|||
|
Forfeited
|
(34,737
|
)
|
(34,737
|
)
|
19.39
|
|
|||
|
Unvested shares at December 31, 2018
|
889,713
|
|
889,713
|
|
$
|
19.39
|
|
||
Fair value of equity awards that vested during the
year ended
December 31, 2018
, determined based on their respective fair values at vesting date, was
$1.5 million
. There was
no
equity-based compensation plan for the
years ended
December 31, 2017
and
2016
. Fair value of vested awards is determined based on the closing price of the Class A common stock on the date of grant of the awards. Equity-based compensation is classified within administrative expense in the consolidated statement of operations.
At
December 31, 2018
, aggregate unrecognized compensation cost for all unvested equity awards was
$12.4 million
, which is expected to be recognized over a weighted-average period of
2.2
years.
|
13.
|
Stockholders’ Equity
|
Authorized Capital
As of
December 31, 2018
, the Company had the authority to issue up to
1.0 billion
shares of stock, at
$0.01
par value per share, consisting of
905.0 million
shares of Class A common stock,
45.0 million
shares of Class B-3 common stock, and
50.0 million
shares of preferred stock. On February 1, 2019, the Class B-3 common stock converted to Class A common stock.
The Company had
no
shares of preferred stock issued and outstanding as of
December 31, 2018
.
F-49
COLONY CREDIT REAL ESTATE, INC.
NOTES TO CONSOLIDATED FINANCIAL STATEMENTS (Continued)
Dividends
During the
year ended
December 31, 2018
, the Company declared the following dividends on its common stock:
|
Declaration Date
|
Record Date
|
Payment Date
|
Per Share
|
|||
|
February 26, 2018
|
March 8, 2018
|
March 16, 2018
|
$0.145
|
|||
|
March 15, 2018
|
March 29, 2018
|
April 10, 2018
|
$0.145
|
|||
|
April 16, 2018
|
April 30, 2018
|
May 10, 2018
|
$0.145
|
|||
|
May 7, 2018
|
May 31, 2018
|
June 11, 2018
|
$0.145
|
|||
|
June 14, 2018
|
June 29, 2018
|
July 10, 2018
|
$0.145
|
|||
|
July 16, 2018
|
July 31, 2018
|
August 10, 2018
|
$0.145
|
|||
|
August 1, 2018
|
August 31, 2018
|
September 10, 2018
|
$0.145
|
|||
|
September 17, 2018
|
September 28, 2018
|
October 10, 2018
|
$0.145
|
|||
|
October 17, 2018
|
October 31, 2018
|
November 9, 2018
|
$0.145
|
|||
|
November 1, 2018
|
November 30, 2018
|
December 10, 2018
|
$0.145
|
|||
|
December 17, 2018
|
December 31, 2018
|
January 10, 2019
|
$0.145
|
|||
Stock Repurchase Program
The Company’s board of directors authorized a stock repurchase program (the “Stock Repurchase Program”), under which the Company may repurchase up to
$300.0 million
of its outstanding Class A common stock until
March 31, 2019
. Under the Stock Repurchase Program, the Company may repurchase shares in open market purchases, through tender offers or otherwise in accordance with all applicable securities laws and regulations, including Rule 10b-18 of the Securities Exchange Act of 1934, as amended.
As of
December 31, 2018
, the Company had not repurchased any shares under the Stock Repurchase Program. On
February 22, 2019
, the Company’s board of directors voted to extend the Stock Repurchase Program through
March 31, 2020
.
Accumulated Other Comprehensive Income (Loss)
The following tables present the changes in each component of Accumulated Other Comprehensive Income (“AOCI”) attributable to stockholders and noncontrolling interests in the OP, net of immaterial tax effect. There was no AOCI component in 2017 or 2016.
Changes in Components of AOCI - Stockholders
|
(in thousands)
|
Unrealized loss on real estate securities, available for sale
|
Unrealized gain on net investment hedges
|
Foreign currency translation loss
|
Total
|
|||||||||||
|
AOCI at December 31, 2017
|
$
|
—
|
|
$
|
—
|
|
$
|
—
|
|
$
|
—
|
|
|||
|
Other comprehensive income (loss)
|
(1,295
|
)
|
11,037
|
|
(10,141
|
)
|
(399
|
)
|
|||||||
|
AOCI at December 31, 2018
|
$
|
(1,295
|
)
|
$
|
11,037
|
|
$
|
(10,141
|
)
|
$
|
(399
|
)
|
|||
Changes in Components of AOCI - Noncontrolling Interests in the OP
|
(in thousands)
|
Unrealized loss on real estate securities, available for sale
|
Unrealized gain on net investment hedges
|
Foreign currency translation loss
|
Total
|
|||||||||||
|
AOCI at December 31, 2017
|
$
|
—
|
|
|
$
|
—
|
|
$
|
—
|
|
$
|
—
|
|
||
|
Other comprehensive income (loss)
|
(32
|
)
|
268
|
|
(246
|
)
|
(10
|
)
|
|||||||
|
AOCI at December 31, 2018
|
$
|
(32
|
)
|
$
|
268
|
|
$
|
(246
|
)
|
$
|
(10
|
)
|
|||
F-50
COLONY CREDIT REAL ESTATE, INC.
NOTES TO CONSOLIDATED FINANCIAL STATEMENTS (Continued)
|
14.
|
Noncontrolling Interests
|
Operating Partnership
Noncontrolling interests include the aggregate limited partnership interests in the OP held by RED REIT. Net loss attributable to the noncontrolling interests is based on the limited partners’ ownership percentage of the OP and was
$4.1 million
for the
year ended
December 31, 2018
.
Investment Entities
Noncontrolling interests in investment entities represent third-party equity interests in ventures that are consolidated with the Company’s financial statements. Net loss attributable to noncontrolling interests in the investment entities for the
year ended
December 31, 2018
was
$4.8 million
. Net income attributable to noncontrolling interests in the investment entities for the
years ended
December 31, 2017
and
2016
was
$39.4 million
and
$33.0 million
, respectively.
|
15.
|
Fair Value
|
Determination of Fair Value
The following is a description of the valuation techniques used to measure fair value of assets accounted for at fair value on a recurring basis and the general classification of these instruments pursuant to the fair value hierarchy.
PE Investments
The Company accounts for PE Investments at fair value which is determined based on a valuation model using assumptions for the timing and amount of expected future cash flow for income and realization events for the underlying assets in the funds and discount rate. This fair value measurement is generally based on unobservable inputs and, as such, is classified as Level 3 of the fair value hierarchy. The Company considers cash flow and NAV information provided by general partners of the underlying funds (“GP NAV”) and the implied yields of those funds in valuing its PE Investments. The Company also considers the values derived from the valuation model as a percentage of GP NAV, and compares the resulting percentage of GP NAV to precedent transactions, independent research, industry reports as well as pricing discovery from a potential outcome related to the disposition of its PE Investments. The Company may, as a result of that comparison, apply a mark-to-market adjustment. The Company has not elected the practical expedient to measure the fair value of its PE Investments using the NAV of the underlying funds.
Real Estate Securities
CRE securities are generally valued using a third-party pricing service or broker quotations. These quotations are not adjusted and are based on observable inputs that can be validated, and as such, are classified as Level 2 of the fair value hierarchy. Certain CRE securities may be valued based on a single broker quote or an internal price which may have less observable pricing, and as such, would be classified as Level 3 of the fair value hierarchy. Management determines the prices are representative of fair value through a review of available data, including observable inputs, recent transactions as well as its knowledge of and experience in the market.
Investing VIEs
As discussed in Note 6, “Real Estate Securities, Available for Sale,” the Company has elected the fair value option for the financial assets and liabilities of the consolidated Investing VIEs. The Investing VIEs are “static,” that is no reinvestment is permitted and there is very limited active management of the underlying assets. The Company is required to determine whether the fair value of the financial assets or the fair value of the financial liabilities of the Investing VIEs are more observable, but in either case, the methodology results in the fair value of the assets of the securitization trusts being equal to the fair value of their liabilities. The Company has determined that the fair value of the liabilities of the securitization trusts are more observable, since market prices for the liabilities are available from a third-party pricing service or are based on quoted prices provided by dealers who make markets in similar financial instruments. The financial assets of the securitization trusts are not readily marketable and their fair value measurement requires information that may be limited in availability.
In determining the fair value of the trusts’ financial liabilities, the dealers will consider contractual cash payments and yields expected by market participants. Dealers also incorporate common market pricing methods, including a spread measurement to the treasury curve or interest rate swap curve as well as underlying characteristics of the particular security including coupon, periodic and life caps, collateral type, rate reset period and seasoning or age of the security. The Company’s collateralized mortgage obligations are classified as Level 2 of the fair value hierarchy, where a third-party pricing service or broker quotations are available, and as Level 3 of the fair value hierarchy, where internal price is utilized which may have less observable pricing. In accordance with ASC 810,
Consolidation
, the assets of the securitization trusts are an aggregate value derived from the fair value of the trust’s
F-51
COLONY CREDIT REAL ESTATE, INC.
NOTES TO CONSOLIDATED FINANCIAL STATEMENTS (Continued)
liabilities, and the Company has determined that the valuation of the trust’s assets in their entirety including its retained interests from the securitizations (eliminated in consolidation in accordance with U.S. GAAP) should be classified as Level 3 of the fair value hierarchy.
Derivatives
Derivative instruments consist of interest rate contracts and foreign exchange contracts that are generally traded over-the-counter, and are valued using a third-party service provider. Quotations on over-the counter derivatives are not adjusted and are generally valued using observable inputs such as contractual cash flows, yield curve, foreign currency rates and credit spreads, and are classified as Level 2 of the fair value hierarchy. Although credit valuation adjustments, such as the risk of default, rely on Level 3 inputs, these inputs are not significant to the overall valuation of its derivatives. As a result, derivative valuations in their entirety are classified as Level 2 of the fair value hierarchy.
Fair Value Hierarchy
Financial assets recorded at fair value on a recurring basis are classified in their entirety based on the lowest level of input that is significant to the fair value measurement. The following table presents financial assets that were accounted for at fair value on a recurring basis as of
December 31, 2018
and
2017
by level within the fair value hierarchy (dollars in thousands):
|
December 31, 2018
|
December 31, 2017
|
||||||||||||||||||||||||||||||
|
Level 1
|
Level 2
|
Level 3
|
Total
|
Level 1
|
Level 2
|
Level 3
|
Total
|
||||||||||||||||||||||||
|
Assets:
|
|||||||||||||||||||||||||||||||
|
Investments in unconsolidated ventures
(1)
|
$
|
—
|
|
$
|
—
|
|
$
|
160,851
|
|
$
|
160,851
|
|
$
|
—
|
|
$
|
—
|
|
$
|
24,417
|
|
$
|
24,417
|
|
|||||||
|
Real estate securities, available for sale
|
—
|
|
228,185
|
|
—
|
|
228,185
|
|
—
|
|
—
|
|
—
|
|
—
|
|
|||||||||||||||
|
Mortgage loans held in securitization trusts, at fair value
|
—
|
|
—
|
|
3,116,978
|
|
3,116,978
|
|
—
|
|
—
|
|
—
|
|
—
|
|
|||||||||||||||
|
Other assets - derivative assets
|
—
|
|
14,139
|
|
—
|
|
14,139
|
|
—
|
|
—
|
|
—
|
|
—
|
|
|||||||||||||||
|
Liabilities:
|
|||||||||||||||||||||||||||||||
|
Mortgage obligations issued by securitization trusts, at fair value
|
$
|
—
|
|
$
|
2,973,936
|
|
$
|
—
|
|
$
|
2,973,936
|
|
$
|
—
|
|
$
|
—
|
|
$
|
—
|
|
$
|
—
|
|
|||||||
|
Other liabilities - derivative liabilities
|
—
|
|
6,042
|
|
—
|
|
6,042
|
|
—
|
|
—
|
|
—
|
|
—
|
|
|||||||||||||||
|
(1)
|
Represents PE Investments for which the Company elected the fair value option.
|
The following table presents the changes in fair value of financial assets which are measured at fair value on a recurring basis using Level 3 inputs to determine fair value for the
years ended
December 31, 2018
and
2017
(dollars in thousands):
|
Year Ended December 31, 2018
|
Year Ended December 31, 2017
|
||||||||||
|
PE Investments
|
Mortgage loans held in securitization trusts
(1)
|
PE Investments
|
|||||||||
|
Beginning balance
|
$
|
24,417
|
|
$
|
—
|
|
$
|
—
|
|
||
|
Contributions
(2)
/purchases
|
248,390
|
|
3,327,199
|
|
72,325
|
|
|||||
|
Distributions/paydowns
|
(78,424
|
)
|
(147,824
|
)
|
(49,344
|
)
|
|||||
|
Equity in earnings
|
21,709
|
|
—
|
|
6,829
|
|
|||||
|
Unrealized loss in earnings
|
(55,241
|
)
|
(58,950
|
)
|
(5,393
|
)
|
|||||
|
Realized loss in earnings
|
—
|
|
(3,447
|
)
|
—
|
|
|||||
|
Ending balance
|
$
|
160,851
|
|
$
|
3,116,978
|
|
$
|
24,417
|
|
||
_________________________________________
|
(1)
|
For the
year ended
December 31, 2018
, unrealized loss of
$59.0 million
related to mortgage loans held in securitization trusts, at fair value was offset by unrealized gain of
$64.0 million
related to mortgage obligations issued by securitization trusts, at fair value.
|
|
(2)
|
Includes initial investments, before distribution and contribution closing statement adjustments, and subsequent contributions, including deferred purchase price fundings.
|
F-52
COLONY CREDIT REAL ESTATE, INC.
NOTES TO CONSOLIDATED FINANCIAL STATEMENTS (Continued)
For the
years ended
December 31, 2018
and
2017
, the Company utilized a discounted cash flow model, comparable precedent transactions and other market information to quantify Level 3 fair value measurements on a recurring basis. For the
years ended
December 31, 2018
and
2017
, the key unobservable inputs used in the analysis of PE Investments included discount rates with a range of
11.0%
to
15.0%
and
11.1%
to
12.4%
, respectively, and timing and amount of expected future cash flows. For the
years ended
December 31, 2018
and
2017
, the Company applied additional mark-to-market adjustments based on a percentage of GP NAV with a weighted average of
11.2%
and
1.0%
, respectively. For the
year ended
December 31, 2018
, the key unobservable inputs used in the valuation of mortgage obligations issued by securitization trusts included yields ranging from
14.5%
to
19.0%
and a weighted average life of
5.4
years. Significant increases or decreases in any one of the inputs described above in isolation may result in significantly different fair value of the financial assets and liabilities using such Level 3 inputs.
For the
years ended
December 31, 2018
and
2017
, the Company recorded an unrealized loss on PE Investments of
$55.2 million
and
$5.4 million
, respectively. These amounts, when incurred, are recorded as equity in earnings of unconsolidated ventures in the consolidated statements of operations.
For the
year ended
December 31, 2018
, the Company recorded a net unrealized gain of
$5.0 million
related to mortgage loans held in and mortgage obligations issued by securitization trusts, at fair value, respectively. These amounts, when incurred, are recorded as unrealized gain (loss) on mortgage loans and obligations held in securitization trusts, net in the consolidated statements of operations.
For the
year ended
December 31, 2018
, the Company recorded a realized loss of
$3.4 million
on mortgage loans held in securitization trusts, at fair value. The loss was due to lower than expected future cash flows on a subordinate tranche of a securitization trust. This amount is recorded as realized loss on mortgage loans and obligations held in securitization trusts, net in the consolidated statements of operations.
Fair Value Option
The Company may elect to apply the fair value option of accounting for certain of its financial assets or liabilities due to the nature of the instrument at the time of the initial recognition of the investment. The Company elected the fair value option for PE Investments and eligible financial assets and liabilities of its consolidated Investing VIEs because management believes it is a more useful presentation for such investments. The Company determined recording the PE Investments based on the change in fair value of projected future cash flow from one period to another better represents the underlying economics of the respective investment. As of
December 31, 2018
and
2017
, the Company has elected not to apply the fair value option for any other eligible financial assets or liabilities.
Fair Value of Financial Instruments
In addition to the above disclosures regarding financial assets or liabilities which are recorded at fair value, U.S. GAAP requires disclosure of fair value about all financial instruments. The following disclosure of estimated fair value of financial instruments was determined by the Company using available market information and appropriate valuation methodologies. Considerable judgment is necessary to interpret market data and develop estimated fair value. Accordingly, the estimates presented herein are not necessarily indicative of the amounts the Company could realize on disposition of the financial instruments. The use of different market assumptions and/or estimation methodologies may have a material effect on estimated fair value.
The following table presents the principal amount, carrying value and fair value of certain financial assets and liabilities as of
December 31, 2018
and
2017
(dollars in thousands):
|
December 31, 2018
|
December 31, 2017
|
||||||||||||||||||||||
|
Principal Amount
|
Carrying Value
|
Fair Value
|
Principal Amount
|
Carrying Value
|
Fair Value
|
||||||||||||||||||
|
Financial assets:
(1)
|
|||||||||||||||||||||||
|
Loans and preferred equity held for investment, net
|
$
|
2,129,857
|
|
(2)
|
$
|
2,020,497
|
|
$
|
2,025,216
|
|
$
|
1,307,740
|
|
(2)
|
$
|
1,300,784
|
|
$
|
1,311,783
|
|
|||
|
Financial liabilities:
(1)
|
|||||||||||||||||||||||
|
Securitization bonds payable, net
|
$
|
81,372
|
|
$
|
81,372
|
|
$
|
81,372
|
|
$
|
108,794
|
|
$
|
108,679
|
|
$
|
108,974
|
|
|||||
|
Mortgage notes payable, net
|
1,177,401
|
|
1,173,019
|
|
1,177,669
|
|
284,035
|
|
280,982
|
|
282,333
|
|
|||||||||||
|
Master repurchase facilities
|
1,365,918
|
|
1,365,918
|
|
1,365,918
|
|
—
|
|
—
|
|
—
|
|
|||||||||||
_________________________________________
|
(1)
|
The fair value of other financial instruments not included in this table is estimated to approximate their carrying value.
|
|
(2)
|
Excludes future funding commitments of
$135.0 million
and
$19.2 million
as of
December 31, 2018
and
2017
, respectively.
|
F-53
COLONY CREDIT REAL ESTATE, INC.
NOTES TO CONSOLIDATED FINANCIAL STATEMENTS (Continued)
Disclosure about fair value of financial instruments is based on pertinent information available to management as of the reporting date. Although management is not aware of any factors that would significantly affect fair value, such amounts have not been comprehensively revalued for purposes of these consolidated financial statements since that date and current estimates of fair value may differ significantly from the amounts presented herein.
Loans and Preferred Equity Held for Investment, Net
For loans and preferred equity held for investment, net, fair values were determined: (i) by comparing the current yield to the estimated yield for newly originated loans with similar credit risk or the market yield at which a third party might expect to purchase such investment; or (ii) based on discounted cash flow projections of principal and interest expected to be collected, which includes consideration of the financial standing of the borrower or sponsor as well as operating results of the underlying collateral. These fair value measurements of CRE debt are generally based on unobservable inputs and, as such, are classified as Level 3 of the fair value hierarchy. Carrying values of loans and preferred equity held for investment are presented net of allowance for loan losses, where applicable.
Securitization Bonds Payable, Net
Securitization bonds payable, net are valued using quotations from nationally recognized financial institutions that generally acted as underwriter for the transactions. These quotations are not adjusted and are generally based on observable inputs that can be validated, and as such, are classified as Level 2 of the fair value hierarchy.
Mortgage and Other Notes Payable, Net
For mortgage and other notes payable, net, the Company primarily uses rates currently available with similar terms and remaining maturities to estimate fair value. These measurements are determined using comparable U.S. Treasury rates as of the end of the reporting period. These fair value measurements are based on observable inputs, and as such, are classified as Level 2 of the fair value hierarchy.
Master Repurchase Facilities
The Company has amounts outstanding under Master Repurchase Facilities. The Master Repurchase Facilities bear floating rates of interest. As of the reporting date, the Company believes the carrying value approximates fair value. These fair value measurements are based on observable inputs, and as such, are classified as Level 2 of the fair value hierarchy.
Other
The carrying values of cash and cash equivalents, receivables, and accrued and other liabilities approximate fair value due to their short term nature and credit risk, if any, are negligible.
Nonrecurring Fair Values
The Company measures fair value of certain assets on a nonrecurring basis when events or changes in circumstances indicate that the carrying value of the assets may not be recoverable. Adjustments to fair value generally result from the application of lower of amortized cost or fair value accounting for assets held for sale or write-down of asset values due to impairment.
The following table summarizes assets carried at fair value on a nonrecurring basis, measured at the time of impairment (dollars in thousands):
|
December 31, 2018
|
|||||||||||||||
|
Level 1
|
Level 2
|
Level 3
|
Total
|
||||||||||||
|
Real estate, net
|
$
|
—
|
|
$
|
—
|
|
$
|
78,312
|
|
$
|
78,312
|
|
|||
There were no assets carried at fair value on a nonrecurring basis at
December 31, 2017
.
The following table summarizes the fair value write-downs to assets carried at nonrecurring fair values during the periods presented (dollars in thousands):
F-54
COLONY CREDIT REAL ESTATE, INC.
NOTES TO CONSOLIDATED FINANCIAL STATEMENTS (Continued)
|
Year Ended December 31, 2018
|
|||
|
Impairment of operating real estate:
|
|||
|
Real estate, net
|
$
|
29,378
|
|
|
Real estate held for sale
|
2,435
|
|
|
There was no impairment loss recorded for the
year ended
December 31, 2017
.
Real Estate, net—Impaired real estate held for investment consisted of
three
properties in the Company’s net lease and other segments, resulting from one or more changes including the reduction in the estimated holding period of these properties, tenant vacancy, rent reductions as well as exposure to the retail and student housing markets. Fair value of the impaired properties were determined using a future cash flow analysis that included an eventual sale of the properties, with expected sale price generally based on broker price opinions, and applying terminal capitalization rates ranging from
6.0%
to
12.0%
and discount rates ranging from
8.0%
to
12.0%
.
Real Estate Held For Sale—The write down to fair value less cost to sell was recorded based on contracted sales price and classified as Level 2 of the fair value hierarchy. In October 2018, the Company completed the sale of the real estate held for sale for a sales price of
$177.0 million
.
Impairment is discussed in further detail in Note 7, “Real Estate, net.”
|
16.
|
Derivatives
|
The Company uses derivative instruments to manage the risk of changes in interest rates and foreign exchange rates, arising from both its business operations and economic conditions. Specifically, the Company enters into derivative instruments to manage differences in the amount, timing, and duration of the Company’s known or expected cash receipts and cash payments, the values of which are driven by interest rates, principally relating to the Company’s investments. Additionally, the Company’s foreign operations expose the Company to fluctuations in foreign exchange rates. The Company enters into derivative instruments to protect the value or fix certain of these foreign denominated amounts in terms of its functional currency, the U.S. dollar. Derivative instruments used in the Company’s risk management activities may be designated as qualifying hedge accounting relationships (“designated hedges”) or non-designated hedges.
As of
December 31, 2018
, fair value of derivative assets and derivative liabilities were as follows (dollars in thousands):
|
Designated Hedges
|
Non-Designated Hedges
|
Total
|
||||||||||
|
Derivative Assets
|
||||||||||||
|
Foreign exchange contracts
|
$
|
11,312
|
|
$
|
2,796
|
|
$
|
14,108
|
|
|||
|
Interest rate contracts
|
—
|
|
31
|
|
31
|
|
||||||
|
Included in other assets
|
$
|
11,312
|
|
$
|
2,827
|
|
$
|
14,139
|
|
|||
|
Derivative Liabilities
|
||||||||||||
|
Foreign exchange contracts
|
$
|
(10
|
)
|
$
|
—
|
|
$
|
(10
|
)
|
|||
|
Interest rate contracts
|
—
|
|
(6,032
|
)
|
(6,032
|
)
|
||||||
|
Included in accrued and other liabilities
|
$
|
(10
|
)
|
$
|
(6,032
|
)
|
$
|
(6,042
|
)
|
|||
As of
December 31, 2018
, counterparties held
$5.5 million
in cash collateral for the derivative contracts.
The following table summarizes the foreign exchange and interest rate contracts as of
December 31, 2018
:
|
Type of Derivatives
|
Notional Currency
|
Notional Amount (in thousands)
|
Range of Maturity Dates
|
|||||||||
|
Designated
|
Non-Designated
|
|||||||||||
|
FX Forward
|
EUR
|
€
|
194,495
|
|
€
|
—
|
|
December 2019 - June 2023
|
||||
|
FX Forward
|
NOK
|
NOK 585,600
|
|
NOK 322,100
|
|
July 2019 - July 2023
|
||||||
|
Interest Rate Swap
|
USD
|
$
|
—
|
|
$
|
374,258
|
|
April 2019 - August 2028
|
||||
The table below represents the effect of the derivative financial instruments on the consolidated statements of operations and of comprehensive income (loss) for the
year ended
December 31, 2018
(dollars in thousands):
F-55
COLONY CREDIT REAL ESTATE, INC.
NOTES TO CONSOLIDATED FINANCIAL STATEMENTS (Continued)
|
Year Ended December 31, 2018
|
|||||
|
Other gain (loss), net
|
|||||
|
Non-designated foreign exchange contracts
|
$
|
2,796
|
|
||
|
Non-designated interest rate contracts
|
(6,001
|
)
|
|||
|
$
|
(3,205
|
)
|
|||
|
Accumulated other comprehensive income (loss)
|
|||||
|
Designated foreign exchange contracts
|
11,305
|
|
|||
|
Designated interest rate contracts
|
—
|
|
|||
|
$
|
11,305
|
|
|||
|
Interest Income
|
|||||
|
Non-designated interest rate contracts
|
$
|
2,176
|
|
||
At the end of each quarter, the Company reassesses the effectiveness of its net investment hedges and as appropriate, dedesignates the portion of the derivative notional that is in excess of the beginning balance of its net investments as non-designated hedges. Any unrealized gain or loss on the dedesignated portion of net investment hedges is transferred into earnings, recorded in other gain (loss), net. During the
year ended
December 31, 2018
, no gain (loss) was transferred from accumulated other comprehensive income (loss).
Offsetting Assets and Liabilities
The Company enters into agreements subject to enforceable netting arrangements with its derivative counterparties that allow the Company to offset the settlement of derivative assets and liabilities in the same currency by derivative instrument type or, in the event of default by the counterparty, to offset all derivative assets and liabilities with the same counterparty. The Company has elected not to net derivative asset and liability positions, notwithstanding the conditions for right of offset may have been met. The Company presents derivative assets and liabilities with the same counterparty on a gross basis on the consolidated balance sheets.
The following table sets forth derivative positions where the Company has a right of offset under netting arrangements with the same counterparty as of
December 31, 2018
(dollars in thousands):
|
Gross Amounts of Assets (Liabilities) Included on Consolidated Balance Sheets
|
Gross Amounts Not Offset on Consolidated Balance Sheets
|
Net Amounts of Assets (Liabilities)
|
||||||||||||||
|
(Assets) Liabilities
|
Cash Collateral Pledged
|
|||||||||||||||
|
Derivative Assets
|
||||||||||||||||
|
Foreign exchange contracts
|
$
|
14,108
|
|
$
|
(10
|
)
|
$
|
—
|
|
$
|
14,098
|
|
||||
|
Interest rate contracts
|
31
|
|
—
|
|
—
|
|
31
|
|
||||||||
|
$
|
14,139
|
|
$
|
(10
|
)
|
$
|
—
|
|
$
|
14,129
|
|
|||||
|
Derivative Liabilities
|
||||||||||||||||
|
Foreign exchange contracts
|
$
|
(10
|
)
|
$
|
10
|
|
$
|
—
|
|
$
|
—
|
|
||||
|
Interest rate contracts
|
(6,032
|
)
|
—
|
|
5,490
|
|
(542
|
)
|
||||||||
|
$
|
(6,042
|
)
|
$
|
10
|
|
$
|
5,490
|
|
$
|
(542
|
)
|
|||||
17. Income Taxes
The Company is subject to income tax laws of the various jurisdictions in which it operates, including U.S. federal, state and local non-U.S. jurisdictions, primarily in Europe. The Company’s current primary sources of income subject to tax are income from its PE Investments, as well as its net lease and other portfolios.
F-56
COLONY CREDIT REAL ESTATE, INC.
NOTES TO CONSOLIDATED FINANCIAL STATEMENTS (Continued)
The following table provides a summary of the Company’s tax provisions (dollars in thousands):
|
Year Ended December 31,
|
||||||||||||
|
2018
|
2017
|
2016
|
||||||||||
|
Current
|
||||||||||||
|
Federal
|
$
|
(7,534
|
)
|
(389
|
)
|
(1,248
|
)
|
|||||
|
State and local
|
(583
|
)
|
(75
|
)
|
(273
|
)
|
||||||
|
Foreign
|
(588
|
)
|
—
|
|
—
|
|
||||||
|
Total current tax benefit (expense)
|
(8,705
|
)
|
(464
|
)
|
(1,521
|
)
|
||||||
|
Deferred
|
||||||||||||
|
Federal
|
(27,817
|
)
|
(1,760
|
)
|
—
|
|
||||||
|
State and local
|
—
|
|
16
|
|
—
|
|
||||||
|
Foreign
|
(537
|
)
|
—
|
|
—
|
|
||||||
|
Total deferred tax benefit (expense)
|
(28,354
|
)
|
(1,744
|
)
|
—
|
|
||||||
|
Total income tax benefit (expense)
|
$
|
(37,059
|
)
|
$
|
(2,208
|
)
|
$
|
(1,521
|
)
|
|||
Deferred Income Tax Assets and Liabilities
Deferred tax asset is included in other assets while deferred tax liability is included in accrued and other liabilities on the consolidated balance sheets.
During the
year ended
December 31, 2018
, the Company recorded a valuation allowance of
$43.1 million
following an analysis that determined it is more likely than not that some portion of the deferred tax asset related to its PE Investments will not be realized. This conclusion was reached following the
$55.2 million
unrealized loss recorded during the year on PE Investments, in addition to future income projections. If assumptions or actual conditions change, the deferred tax asset, net of valuation allowance, will be adjusted properly to reflect the expected tax benefit.
The components of deferred tax assets and deferred tax liabilities arising from temporary differences are as follows (dollars in thousands):
|
December 31,
|
||||||||
|
2018
|
2017
|
|||||||
|
Deferred tax assets
|
||||||||
|
Basis difference - investment in partnerships
|
$
|
40,205
|
|
$
|
2,830
|
|
||
|
Disallowed interest expense carry forwards
|
2,659
|
|
720
|
|
||||
|
Net operating and capital loss carry forwards
(1)
|
3,974
|
|
3,410
|
|
||||
|
Other
|
746
|
|
478
|
|
||||
|
Gross deferred tax asset
|
47,584
|
|
7,438
|
|
||||
|
Valuation allowance
|
(46,842
|
)
|
(3,764
|
)
|
||||
|
Deferred tax assets, net of valuation allowance
|
$
|
742
|
|
$
|
3,674
|
|
||
|
Deferred tax liabilities
|
||||||||
|
Basis difference - real estate
|
(34,418
|
)
|
—
|
|
||||
|
Gross deferred tax liabilities
|
(34,418
|
)
|
—
|
|
||||
|
Net deferred tax asset (liability)
|
$
|
(33,676
|
)
|
$
|
3,674
|
|
||
_________________________________________
(1) As of
December 31, 2018
and 2017, deferred tax asset was recognized on net operating losses of
$15.6 million
and
$15.4 million
, respectively. Net operating losses attributable to U.S. federal and state, where applicable, generally begin to expire in 2034, or can be carried forward indefinitely.
F-57
COLONY CREDIT REAL ESTATE, INC.
NOTES TO CONSOLIDATED FINANCIAL STATEMENTS (Continued)
Effective Income Tax
The Company’s income tax expense varied from the amount computed by applying the statutory income tax rate to income before income taxes. A reconciliation of the statutory U.S. income tax to the Company’s effective income tax is presented as follows (dollars in thousands):
|
Year Ended December 31,
|
||||||||||||
|
2018
|
2017
|
2016
|
||||||||||
|
Pre-tax income (loss) attributable to taxable entities
|
$
|
(39,843
|
)
|
$
|
548
|
|
$
|
5,308
|
|
|||
|
Federal tax expense (benefit) at statutory tax rate (21%, 35% and 35%, respectively)
|
(8,367
|
)
|
192
|
|
1,858
|
|
||||||
|
State and local taxes, net of federal income tax benefit
|
(644
|
)
|
12
|
|
270
|
|
||||||
|
Non-deductible expenses
|
41
|
|
—
|
|
(1
|
)
|
||||||
|
Foreign income tax differential
|
24
|
|
—
|
|
—
|
|
||||||
|
Valuation allowance, net
|
43,078
|
|
—
|
|
—
|
|
||||||
|
Revaluation of deferred taxes due to "Tax Cuts and Jobs Act"
|
1,725
|
|
212
|
|
—
|
|
||||||
|
Other
|
1,202
|
|
1,792
|
|
(606
|
)
|
||||||
|
Income tax expense
|
$
|
37,059
|
|
$
|
2,208
|
|
$
|
1,521
|
|
|||
Tax Examinations and Uncertainty in Income Tax
The Company is no longer subject to U.S. federal, state and local tax examinations by tax authorities for years prior to
2015
.
There were no material uncertain tax positions as of
December 31, 2018
. For the
years ended
December 31, 2018
, 2017 and 2016, the Company has not recognized any interest or penalties related to uncertain tax positions.
|
18.
|
Commitments and Contingencies
|
Lending Commitments
The Company has lending commitments to borrowers pursuant to certain loan agreements in which the borrower may submit a request for funding contingent on achieving certain criteria, which must be approved by the Company as lender, such as leasing, performance of capital expenditures and construction in progress with an approved budget. At
December 31, 2018
, assuming the terms to qualify for future fundings, if any, have been met, total unfunded lending commitments for loans and preferred equity held for investment was $
105.6 million
for senior loans, $
18.3 million
for securitized loans and
$11.1 million
for mezzanine loans. Total unfunded commitments for equity method investments was
$21.5 million
.
Ground Lease Obligation
The following table presents future minimum rental payments, excluding contingent rents, on noncancelable ground leases on real estate as of
December 31, 2018
(dollars in thousands):
|
2019
|
$
|
2,821
|
|
|
|
2020
|
2,819
|
|
||
|
2021
|
2,804
|
|
||
|
2022
|
1,882
|
|
||
|
2023
|
1,388
|
|
||
|
2024 and thereafter
|
12,998
|
|
||
|
Total
|
$
|
24,712
|
|
|
Litigation and Claims
The Company may be involved in the litigation and claims in the ordinary course of the business. As of
December 31, 2018
, the Company was not involved in any legal proceedings that are expected to have a material adverse effect on the Company’s results of operations, financial position or liquidity.
F-58
COLONY CREDIT REAL ESTATE, INC.
NOTES TO CONSOLIDATED FINANCIAL STATEMENTS (Continued)
|
19.
|
Segment Reporting
|
The Company currently conducts its business through the following
five
segments, which are based on how management reviews and manages its business:
|
•
|
Loan Portfolio—
Focused on originating, acquiring and asset managing CRE debt investments including first mortgage loans, mezzanine loans, and preferred equity interests as well as participations in such loans. The CRE debt segment also includes ADC loan arrangements accounted for as equity method investments.
|
|
•
|
CRE Debt Securities—
Focused on investing in CMBS (including “B-pieces” of a CMBS securitization pool) or CRE CLOs (collateralized by pools of CRE debt instruments).
|
|
•
|
Net Leased Real Estate—
Focused on direct investments in commercial real estate with long-term leases to tenants on a net lease basis, where such tenants generally will be responsible for property operating expenses such as insurance, utilities, maintenance capital expenditures and real estate taxes.
|
|
•
|
Other—
The other segment includes direct investments in non-core operating real estate such as multi-tenant office and multifamily residential assets as well as PE Investments. The other segment also includes real estate acquired in settlement of loans.
|
|
•
|
Corporate—
The corporate segment includes corporate level asset management and other fees, related party and general and administrative expenses.
|
The Company may also own investments indirectly through a joint venture.
Following the Combination, the following changes were made to the Company’s operating segments:
|
•
|
The acquired CRE securities formed the new CRE Debt Securities segment.
|
|
•
|
The Net Leased Real Estate of the combined organization is aggregated into the Net Leased Real Estate segment.
|
|
•
|
All non-core operating real estate and PE Investments of the combined organization is aggregated into the Other segment.
|
|
•
|
The Corporate segment consists of corporate level cash and corresponding interest income, fixed assets, corporate level financing and related interest expense, expense for management fees and cost reimbursement to the Manager, as well as Combination-related transaction costs.
|
The Company primarily generates revenue from net interest income on the loan, preferred equity and securities portfolios, rental and other income from its net leased, multi-tenant office and multifamily real estate assets, as well as equity in earnings of unconsolidated ventures, including from PE Investments. CRE debt securities include the Company’s investment in the subordinate tranches of the securitization trusts which are eliminated in consolidation. The Company’s income is primarily derived through the difference between revenue and the cost at which the Company is able to finance its investments. The Company may also acquire investments which generate attractive returns without any leverage.
F-59
COLONY CREDIT REAL ESTATE, INC.
NOTES TO CONSOLIDATED FINANCIAL STATEMENTS (Continued)
The following tables present segment reporting for the
years ended
December 31, 2018
,
2017
and
2016
(dollars in thousands):
|
Year Ended December 31, 2018
|
Loan
|
CRE Debt Securities
|
Net Leased Real Estate
|
Other
|
Corporate
(1)
|
Total
|
||||||||||||||||||
|
Net interest income (expense)
|
$
|
99,661
|
|
$
|
24,778
|
|
$
|
—
|
|
$
|
—
|
|
$
|
(8,900
|
)
|
$
|
115,539
|
|
||||||
|
Property and other income
|
171
|
|
84
|
|
79,460
|
|
101,144
|
|
1,131
|
|
181,990
|
|
||||||||||||
|
Management fee expense
|
—
|
|
—
|
|
—
|
|
—
|
|
(43,190
|
)
|
(43,190
|
)
|
||||||||||||
|
Property operating expense
|
—
|
|
—
|
|
(21,293
|
)
|
(52,323
|
)
|
—
|
|
(73,616
|
)
|
||||||||||||
|
Transaction, investment and servicing expense
|
(2,278
|
)
|
(80
|
)
|
(490
|
)
|
(452
|
)
|
(33,500
|
)
|
(36,800
|
)
|
||||||||||||
|
Interest expense on real estate
|
—
|
|
—
|
|
(26,159
|
)
|
(17,278
|
)
|
—
|
|
(43,437
|
)
|
||||||||||||
|
Depreciation and amortization
|
—
|
|
—
|
|
(40,804
|
)
|
(50,182
|
)
|
—
|
|
(90,986
|
)
|
||||||||||||
|
Provision for loan loss
|
(113,911
|
)
|
—
|
|
—
|
|
—
|
|
—
|
|
(113,911
|
)
|
||||||||||||
|
Impairment of operating real estate
|
—
|
|
—
|
|
(7,094
|
)
|
(24,719
|
)
|
—
|
|
(31,813
|
)
|
||||||||||||
|
Administrative expense
|
(583
|
)
|
(1,617
|
)
|
(159
|
)
|
(37
|
)
|
(24,238
|
)
|
(26,634
|
)
|
||||||||||||
|
Unrealized gain on mortgage loans and obligations held in securitization trusts, net
|
—
|
|
1,642
|
|
—
|
|
—
|
|
3,361
|
|
5,003
|
|
||||||||||||
|
Realized loss on mortgage loans and obligations held in securitization trusts, net
|
—
|
|
(3,447
|
)
|
—
|
|
—
|
|
—
|
|
(3,447
|
)
|
||||||||||||
|
Other gain (loss), net
|
—
|
|
(6,032
|
)
|
2,812
|
|
454
|
|
—
|
|
(2,766
|
)
|
||||||||||||
|
Income (loss) before equity in earnings of unconsolidated ventures and income taxes
|
(16,940
|
)
|
15,328
|
|
(13,727
|
)
|
(43,393
|
)
|
(105,336
|
)
|
(164,068
|
)
|
||||||||||||
|
Equity in earnings (losses) of unconsolidated ventures
|
57,306
|
|
—
|
|
—
|
|
(33,532
|
)
|
—
|
|
23,774
|
|
||||||||||||
|
Income tax expense
|
—
|
|
—
|
|
(1,125
|
)
|
(35,934
|
)
|
—
|
|
(37,059
|
)
|
||||||||||||
|
Net income (loss)
|
$
|
40,366
|
|
$
|
15,328
|
|
$
|
(14,852
|
)
|
$
|
(112,859
|
)
|
$
|
(105,336
|
)
|
$
|
(177,353
|
)
|
||||||
_________________________________________
|
(1)
|
Includes income earned from the CRE securities purchased at a discount, recognized using the effective interest method had the transaction been recorded as an available for sale security, at amortized cost. During the
year ended
December 31, 2018
,
$3.4 million
was attributable to discount accretion income and was eliminated in consolidation in the corporate segment. The corresponding interest expense is recorded in net interest income in the Corporate column.
|
|
Year Ended December 31, 2017
|
Loan
|
Net Leased Real Estate
|
Other
|
Corporate
|
Total
|
|||||||||||||||
|
Net interest income
|
$
|
119,195
|
|
$
|
—
|
|
$
|
—
|
|
$
|
—
|
|
$
|
119,195
|
|
|||||
|
Property and other income
|
3,139
|
|
21,402
|
|
—
|
|
—
|
|
24,541
|
|
||||||||||
|
Property operating expense
|
(2,291
|
)
|
(5,687
|
)
|
—
|
|
—
|
|
(7,978
|
)
|
||||||||||
|
Transaction, investment and servicing expense
|
(2,303
|
)
|
(250
|
)
|
(17
|
)
|
—
|
|
(2,570
|
)
|
||||||||||
|
Interest expense on real estate
|
—
|
|
(5,095
|
)
|
—
|
|
—
|
|
(5,095
|
)
|
||||||||||
|
Depreciation and amortization
|
(329
|
)
|
(8,808
|
)
|
—
|
|
—
|
|
(9,137
|
)
|
||||||||||
|
Provision for loan loss
|
(518
|
)
|
—
|
|
—
|
|
—
|
|
(518
|
)
|
||||||||||
|
Administrative expense
|
(858
|
)
|
(83
|
)
|
(7
|
)
|
(11,721
|
)
|
(12,669
|
)
|
||||||||||
|
Other gain (loss), net
|
(400
|
)
|
10
|
|
—
|
|
—
|
|
(390
|
)
|
||||||||||
|
Income (loss) before equity in earnings of unconsolidated ventures and income taxes
|
115,635
|
|
1,489
|
|
(24
|
)
|
(11,721
|
)
|
105,379
|
|
||||||||||
|
Equity in earnings of unconsolidated ventures
|
23,273
|
|
—
|
|
1,436
|
|
—
|
|
24,709
|
|
||||||||||
|
Income tax expense
|
(87
|
)
|
—
|
|
(2,121
|
)
|
—
|
|
(2,208
|
)
|
||||||||||
|
Net income (loss)
|
$
|
138,821
|
|
$
|
1,489
|
|
$
|
(709
|
)
|
$
|
(11,721
|
)
|
$
|
127,880
|
|
|||||
F-60
COLONY CREDIT REAL ESTATE, INC.
NOTES TO CONSOLIDATED FINANCIAL STATEMENTS (Continued)
|
Year Ended December 31, 2016
|
Loan
|
Corporate
|
Total
|
|||||||||
|
Net interest income
|
$
|
114,498
|
|
$
|
—
|
|
$
|
114,498
|
|
|||
|
Property and other income
|
1,674
|
|
—
|
|
1,674
|
|
||||||
|
Property operating expense
|
(905
|
)
|
—
|
|
(905
|
)
|
||||||
|
Transaction, investment and servicing expense
|
(1,767
|
)
|
—
|
|
(1,767
|
)
|
||||||
|
Interest expense on real estate
|
—
|
|
—
|
|
—
|
|
||||||
|
Depreciation and amortization
|
(146
|
)
|
—
|
|
(146
|
)
|
||||||
|
Provision for loan loss
|
(3,386
|
)
|
—
|
|
(3,386
|
)
|
||||||
|
Administrative expense
|
(318
|
)
|
(15,119
|
)
|
(15,437
|
)
|
||||||
|
Other loss, net
|
(56
|
)
|
—
|
|
(56
|
)
|
||||||
|
Income (loss) before equity in earnings of unconsolidated ventures and income taxes
|
109,594
|
|
(15,119
|
)
|
94,475
|
|
||||||
|
Equity in earnings of unconsolidated ventures
|
16,067
|
|
—
|
|
16,067
|
|
||||||
|
Income tax expense
|
(1,521
|
)
|
—
|
|
(1,521
|
)
|
||||||
|
Net income (loss)
|
$
|
124,140
|
|
$
|
(15,119
|
)
|
$
|
109,021
|
|
|||
The following table presents total assets by segment as of
December 31, 2018
and
2017
(dollars in thousands):
|
Total Assets
|
Loan
(1)
|
CRE Debt Securities
|
Net Leased Real Estate
|
Other
(2)
|
Corporate
(3)
|
Total
|
||||||||||||||||||
|
December 31, 2018
|
$
|
2,840,267
|
|
$
|
3,507,404
|
|
$
|
1,354,051
|
|
$
|
1,029,014
|
|
$
|
(70,006
|
)
|
$
|
8,660,730
|
|
||||||
|
December 31, 2017
|
1,573,714
|
|
—
|
|
241,271
|
|
24,417
|
|
—
|
|
1,839,402
|
|
||||||||||||
_________________________________________
|
(1)
|
Includes investments in unconsolidated ventures totaling
$742.2 million
and
$179.3 million
as of
December 31, 2018
and
2017
, respectively.
|
|
(2)
|
Includes PE Investments totaling
$160.9 million
and
$24.4 million
as of
December 31, 2018
and
2017
, respectively.
|
|
(3)
|
Includes cash, unallocated receivables, deferred costs and other assets, net and the elimination of the subordinate tranches of the securitization trusts in consolidation.
|
Geography
Geography is generally defined as the location in which the income producing assets reside or the location in which income generating services are performed. Geography information on total income includes equity in earnings of unconsolidated ventures. Geography information on total income and long lived assets are presented as follows (dollars in thousands):
|
Year Ended December 31,
|
||||||||||||
|
2018
|
2017
|
2016
|
||||||||||
|
Total income by geography:
|
||||||||||||
|
United States
|
$
|
481,404
|
|
$
|
185,853
|
|
$
|
154,418
|
|
|||
|
Europe
|
17,487
|
|
—
|
|
—
|
|
||||||
|
Other
|
1,897
|
|
3,611
|
|
3,852
|
|
||||||
|
Total
(1)
|
$
|
500,788
|
|
$
|
189,464
|
|
$
|
158,270
|
|
|||
|
December 31, 2018
|
|||
|
Long-lived assets by geography:
|
|||
|
United States
|
$
|
1,764,247
|
|
|
Europe
|
329,511
|
|
|
|
Total
(2)
|
$
|
2,093,758
|
|
_________________________________________
|
(1)
|
Includes interest income, interest income on mortgage loans held in securitization trusts, property and other income and equity in earnings of unconsolidated ventures.
|
|
(2)
|
Long-lived assets comprise real estate, real estate related intangible assets, and exclude financial instruments and assets held for sale. As of
December 31, 2017
, all long-lived assets are located in United States.
|
F-61
COLONY CREDIT REAL ESTATE, INC.
NOTES TO CONSOLIDATED FINANCIAL STATEMENTS (Continued)
|
20.
|
Earnings Per Share
|
The Company’s net income (loss) and weighted average shares outstanding for the
years ended
December 31, 2018
,
2017
and
2016
consist of the following (dollars in thousands, except per share data):
|
Year Ended December 31,
|
||||||||||||
|
2018
|
2017
|
2016
|
||||||||||
|
Net income (loss)
|
$
|
(177,353
|
)
|
$
|
127,880
|
|
$
|
109,021
|
|
|||
|
Net (income) loss attributable to noncontrolling interests:
|
||||||||||||
|
Investment Entities
|
4,771
|
|
(39,376
|
)
|
(32,970
|
)
|
||||||
|
Operating Partnership
(1)
|
4,084
|
|
(5,734
|
)
|
(4,927
|
)
|
||||||
|
Net income (loss) attributable to Colony Credit Real Estate, Inc. common stockholders
|
$
|
(168,498
|
)
|
$
|
82,770
|
|
$
|
71,124
|
|
|||
|
Numerator:
|
||||||||||||
|
Net income allocated to participating securities (nonvested shares)
|
$
|
(1,439
|
)
|
$
|
—
|
|
$
|
—
|
|
|||
|
Net income (loss) attributable to common stockholders
|
$
|
(169,937
|
)
|
$
|
82,770
|
|
$
|
71,124
|
|
|||
|
Denominator:
|
||||||||||||
|
Weighted average shares outstanding
(2)(3)
|
120,677
|
|
44,399
|
|
44,399
|
|
||||||
|
Net income (loss) per common share - basic and diluted
(3)
|
$
|
(1.41
|
)
|
$
|
1.86
|
|
$
|
1.60
|
|
|||
_________________________________________
|
(1)
|
For earnings per share for the
years ended
December 31, 2017
and
2016
, the Company allocated the OP’s share of net income as if the OP held
3,075,623
CLNC OP Units during the period for comparative purposes. The CLNC OP Units were not issued until
January 31, 2018
.
|
|
(2)
|
For earnings per share, the Company assumes
44.4 million
shares of Class B-3 common stock were outstanding prior to
January 31, 2018
to reflect the standalone pre-merger financial information of the CLNY Investment Entities, the Company’s predecessor for accounting purposes.
|
|
(3)
|
Excludes
3,075,623
CLNC OP Units, which are redeemable for cash, or at the Company’s option, shares of Class A common stock on a
one
-for-one basis, and therefore would not be dilutive.
|
|
21.
|
Subsequent Events
|
Dividends
On
January 17, 2019
, the Company’s board of directors declared a monthly cash dividend of
$0.145
per share of Class A common stock and Class B-3 common stock for the month ended
January 31, 2019
. The common stock dividend was paid on
February 11, 2019
to stockholders of record on
January 31, 2019
. These distributions represent an annualized dividend of
$1.74
per share of Class A common stock and Class B-3 common stock.
On
February 15, 2019
, the Company’s board of directors declared a monthly cash dividend of
$0.145
per share of Class A common stock for the month ended
February 28, 2019
. The common stock dividend will be paid on
March 11, 2019
to stockholders of record on
February 28, 2019
. These distributions represent an annualized dividend of
$1.74
per share of Class A common stock.
Common Stock
On
February 1, 2019
, the Company’s Class B-3 common stock converted to Class A common stock.
Stock Repurchase Program
On
February 22, 2019
, the Company extended the Stock Repurchase Program until
March 31, 2020
.
New Investments
Subsequent to
December 31, 2018
, the Company originated and/or refinanced
seven
senior loans with a total commitment of
$246.6
million and a weighted average spread of
3.38%
plus LIBOR.
Bank Credit Facility
On
February 4, 2019
, the Company completed a
$35.0 million
increase of its Bank Credit Facility commitment. The total aggregate amount of revolving commitments of the Bank Credit Facility is now
$560.0 million
.
F-62
COLONY CREDIT REAL ESTATE, INC.
NOTES TO CONSOLIDATED FINANCIAL STATEMENTS (Continued)
Other
In January 2019, the Company foreclosed on
four
loans with a combined carrying value of
$105.4 million
that are cross-collateralized with
28
office, retail, multifamily and industrial properties.
F-63
COLONY CREDIT REAL ESTATE, INC. AND SUBSIDIARIES
SCHEDULE III - REAL ESTATE AND ACCUMULATED DEPRECIATION
December 31, 2018
(Dollars in Thousands)
|
Initial Cost
(1)
|
Gross Amount Carried at December 31, 2018
(2)
|
|||||||||||||||||||||||||||||||||||||||||
|
Property Description / Location
|
Number of Properties
|
Encumbrances
|
Land
|
Building and Improvements
|
Costs Capitalized Subsequent to Acquisition
(2)(3)
|
Land
|
Building and Improvements
|
Total
|
Accumulated Depreciation
(4)
|
Total
|
Date of Acquisition
(5)
|
Life on Which Depreciation is Computed
|
||||||||||||||||||||||||||||||
|
Hotel-North Dakota
|
1
|
$
|
—
|
|
$
|
667
|
|
$
|
7,678
|
|
$
|
20
|
|
$
|
667
|
|
$
|
7,698
|
|
$
|
8,365
|
|
$
|
555
|
|
$
|
7,810
|
|
2017
|
39 years
|
||||||||||||
|
Hotel-Pennsylvania
|
1
|
—
|
|
6,527
|
|
27,083
|
|
3,515
|
|
6,527
|
|
30,598
|
|
37,125
|
|
635
|
|
36,490
|
|
2018
|
30 years
|
|||||||||||||||||||||
|
Hotel-Texas
|
1
|
—
|
|
7,896
|
|
65,847
|
|
380
|
|
7,896
|
|
66,227
|
|
74,123
|
|
1,435
|
|
72,688
|
|
2018
|
36 years
|
|||||||||||||||||||||
|
Industrial-Arizona
|
1
|
77,864
|
|
14,494
|
|
59,991
|
|
77
|
|
14,494
|
|
60,069
|
|
74,563
|
|
716
|
|
73,847
|
|
2018
|
31 years
|
|||||||||||||||||||||
|
Industrial-California
|
1
|
122,136
|
|
32,552
|
|
148,911
|
|
79
|
|
32,552
|
|
148,990
|
|
181,542
|
|
1,893
|
|
179,649
|
|
2018
|
28 years
|
|||||||||||||||||||||
|
Industrial-Ohio
|
23
|
73,702
|
|
13,946
|
|
132,910
|
|
2,765
|
|
13,946
|
|
135,675
|
|
149,621
|
|
5,383
|
|
144,238
|
|
2018
|
39 years
|
|||||||||||||||||||||
|
Industrial-Various
|
22
|
250,000
|
|
28,092
|
|
307,154
|
|
1,308
|
|
28,092
|
|
308,462
|
|
336,554
|
|
11,584
|
|
324,970
|
|
2018
|
40 years
|
|||||||||||||||||||||
|
Multifamily-Louisiana
|
1
|
43,500
|
|
3,646
|
|
70,190
|
|
454
|
|
3,646
|
|
70,644
|
|
74,290
|
|
1,550
|
|
72,740
|
|
2018
|
30 years
|
|||||||||||||||||||||
|
Multifamily-Michigan
|
2
|
59,000
|
|
5,520
|
|
119,880
|
|
1,722
|
|
5,520
|
|
121,602
|
|
127,122
|
|
4,237
|
|
122,885
|
|
2018
|
30 years
|
|||||||||||||||||||||
|
Multifamily-South Carolina
|
2
|
36,253
|
|
4,649
|
|
64,454
|
|
(22,033
|
)
|
4,649
|
|
42,421
|
|
47,070
|
|
1,921
|
|
45,149
|
|
2018
|
30 years
|
|||||||||||||||||||||
|
Multifamily-Wyoming
|
1
|
—
|
|
1,193
|
|
10,282
|
|
583
|
|
1,249
|
|
10,809
|
|
12,058
|
|
280
|
|
11,778
|
|
2017
|
39 years
|
|||||||||||||||||||||
|
Office-Colorado
|
1
|
32,378
|
|
2,359
|
|
41,410
|
|
2,982
|
|
2,359
|
|
44,392
|
|
46,751
|
|
2,594
|
|
44,157
|
|
2017
|
40 years
|
|||||||||||||||||||||
|
Office-Indiana
|
1
|
24,606
|
|
3,773
|
|
26,916
|
|
3,520
|
|
3,773
|
|
30,436
|
|
34,209
|
|
2,084
|
|
32,125
|
|
2017
|
40 years
|
|||||||||||||||||||||
|
Office-Missouri
|
1
|
108,850
|
|
25,723
|
|
127,003
|
|
3,582
|
|
25,723
|
|
130,585
|
|
156,308
|
|
6,003
|
|
150,305
|
|
2018
|
39 years
|
|||||||||||||||||||||
|
Office-New Jersey
|
1
|
12,786
|
|
4,956
|
|
13,429
|
|
1,696
|
|
4,956
|
|
15,125
|
|
20,081
|
|
1,062
|
|
19,019
|
|
2017
|
40 years
|
|||||||||||||||||||||
|
Office-Norway
|
1
|
184,320
|
|
55,054
|
|
277,439
|
|
(21,858
|
)
|
55,054
|
|
255,581
|
|
310,635
|
|
3,811
|
|
306,824
|
|
2018
|
37 years
|
|||||||||||||||||||||
|
Office-Ohio
|
1
|
—
|
|
4,431
|
|
29,363
|
|
960
|
|
4,431
|
|
30,323
|
|
34,754
|
|
1,707
|
|
33,047
|
|
2017
|
40 years
|
|||||||||||||||||||||
|
Office-Pennsylvania
|
1
|
76,448
|
|
11,019
|
|
131,676
|
|
—
|
|
11,019
|
|
131,676
|
|
142,695
|
|
3,983
|
|
138,712
|
|
2018
|
40 years
|
|||||||||||||||||||||
|
Office-Virginia
|
2
|
31,126
|
|
20,955
|
|
61,620
|
|
3,576
|
|
20,955
|
|
65,196
|
|
86,151
|
|
2,434
|
|
83,717
|
|
2018
|
39 years
|
|||||||||||||||||||||
|
Retail-Illinois
|
1
|
4,449
|
|
—
|
|
7,338
|
|
64
|
|
—
|
|
7,402
|
|
7,402
|
|
384
|
|
7,018
|
|
2017
|
40 years
|
|||||||||||||||||||||
|
Retail-Indiana
|
1
|
3,484
|
|
—
|
|
5,171
|
|
68
|
|
—
|
|
5,239
|
|
5,239
|
|
270
|
|
4,969
|
|
2017
|
40 years
|
|||||||||||||||||||||
|
Retail-Kansas
|
1
|
5,540
|
|
1,048
|
|
7,023
|
|
352
|
|
1,048
|
|
7,375
|
|
8,423
|
|
427
|
|
7,996
|
|
2017
|
40 years
|
|||||||||||||||||||||
|
Retail-Maine
|
1
|
2,078
|
|
—
|
|
6,317
|
|
100
|
|
—
|
|
6,417
|
|
6,417
|
|
339
|
|
6,078
|
|
2017
|
40 years
|
|||||||||||||||||||||
|
Retail-Massachusetts
|
2
|
8,455
|
|
—
|
|
12,254
|
|
186
|
|
—
|
|
12,440
|
|
12,440
|
|
648
|
|
11,792
|
|
2017
|
40 years
|
|||||||||||||||||||||
|
Retail-New Hampshire
|
2
|
16,447
|
|
1,495
|
|
21,488
|
|
(6,095
|
)
|
1,495
|
|
15,393
|
|
16,888
|
|
1,294
|
|
15,594
|
|
2017
|
40 years
|
|||||||||||||||||||||
|
Retail-New York
|
1
|
3,979
|
|
—
|
|
6,372
|
|
54
|
|
—
|
|
6,426
|
|
6,426
|
|
333
|
|
6,093
|
|
2017
|
40 years
|
|||||||||||||||||||||
|
Total operating real estate, net
|
74
|
$
|
1,177,401
|
|
$
|
249,995
|
|
$
|
1,789,199
|
|
$
|
(21,943
|
)
|
$
|
250,051
|
|
$
|
1,767,201
|
|
$
|
2,017,252
|
|
$
|
57,562
|
|
$
|
1,959,690
|
|
||||||||||||||
______________________________
|
(1)
|
The purchase price allocations for certain 2018 acquisitions are provisional and subject to retrospective adjustments during the measurement period, not to exceed one year, based upon new information obtained about facts and circumstances that existed as of the date of acquisition.
|
|
(2)
|
The aggregate gross cost of total real estate assets for federal income tax purposes is
$2.0 billion
as of
December 31, 2018
.
|
|
(3)
|
Gross amount carried is shown net of impairment and net of the effect of changes in foreign exchange rates.
|
|
(4)
|
Depreciation is calculated using a useful life of
2
to
48
years for buildings and improvements.
|
|
(5)
|
Properties consolidated upon the Combination reflect an acquisition date of February 1, 2018, the effective date of consolidation.
|
F-64
COLONY CREDIT REAL ESTATE, INC. AND SUBSIDIARIES
SCHEDULE III - REAL ESTATE AND ACCUMULATED DEPRECIATION
December 31, 2018
(Dollars in Thousands)
Changes in the Company’s operating real estate portfolio gross of accumulated depreciation for the
years ended
December 31, 2018
,
2017
and
2016
are as follows:
|
2018
|
2017
|
2016
|
||||||||||
|
Beginning balance
|
$
|
225,710
|
|
$
|
9,083
|
|
$
|
9,016
|
|
|||
|
Real estate acquired in the Combination (Note 3)
|
1,287,515
|
|
205,376
|
|
—
|
|
||||||
|
Property acquisitions
(1)
|
695,794
|
|
—
|
|
—
|
|
||||||
|
Improvements and capitalized costs
|
23,417
|
|
20,193
|
|
77
|
|
||||||
|
Impairment
|
(31,813
|
)
|
—
|
|
(10
|
)
|
||||||
|
Dispositions
|
(161,513
|
)
|
(8,942
|
)
|
—
|
|
||||||
|
Effect of changes in foreign exchange rates
|
(21,858
|
)
|
—
|
|
—
|
|
||||||
|
Ending balance
|
$
|
2,017,252
|
|
$
|
225,710
|
|
$
|
9,083
|
|
|||
__________________________________________________
|
(1)
|
Includes real estate owned (“REO”) foreclosures of
$107.0 million
.
|
Changes in accumulated depreciation for the
years ended
December 31, 2018
,
2017
and
2016
are as follows:
|
2018
|
2017
|
2016
|
||||||||||
|
Beginning balance
|
$
|
5,970
|
|
$
|
145
|
|
$
|
—
|
|
|||
|
Depreciation expense
|
56,270
|
|
5,825
|
|
145
|
|
||||||
|
Dispositions
|
(4,272
|
)
|
—
|
|
—
|
|
||||||
|
Effect of changes in foreign exchange rates
|
(406
|
)
|
—
|
|
—
|
|
||||||
|
Ending balance
|
$
|
57,562
|
|
$
|
5,970
|
|
$
|
145
|
|
|||
F-65
COLONY CREDIT REAL ESTATE, INC. AND SUBSIDIARIES
SCHEDULE IV - MORTGAGE LOANS ON REAL ESTATE
December 31, 2018
(Dollars in Thousands)
|
Loan Type / Collateral / Location
(1) (2)
|
Number of Loans
|
Interest Rate Range
(3)
|
Maturity Date Range
(4)
|
Periodic Payment Terms
(5)
|
Prior Liens
(6)
|
Unpaid Principal Amount
|
Carrying Value
(7)(8)
|
Principal Amount Subject to Delinquent Principal or Interest
(9)
|
|||||||||||||||||
|
First mortgage:
|
|||||||||||||||||||||||||
|
Hotel-California, USA
|
1
|
|
6.64%
|
January 2020
|
I/O
|
$
|
—
|
|
$
|
166,585
|
|
$
|
166,585
|
|
$
|
—
|
|
||||||||
|
Hotel-California, USA
|
1
|
|
5.59%
|
July 2023
|
I/O
|
—
|
|
104,619
|
|
103,631
|
|
—
|
|
||||||||||||
|
Hotel-California, USA
|
1
|
|
7.19%
|
November 2022
|
I/O
|
—
|
|
136,499
|
|
135,110
|
|
—
|
|
||||||||||||
|
Hotel-New York, USA
(10)
|
1
|
|
3.99%
|
May 2023
|
P&I
|
—
|
|
75,976
|
|
76,868
|
|
75,976
|
|
||||||||||||
|
Hotel-New York, USA
(10)
|
1
|
|
8.18%
|
May 2023
|
I/O
|
—
|
|
70,145
|
|
70,145
|
|
70,145
|
|
||||||||||||
|
Hotel-Colorado, USA
|
1
|
|
5.89%
|
July 2021
|
I/O
|
—
|
|
71,380
|
|
71,305
|
|
—
|
|
||||||||||||
|
Hotel-Various, USA
|
2
|
|
7.34% - 8.39%
|
January 2019 to August 2019
|
I/O
|
—
|
|
42,278
|
|
42,575
|
|
—
|
|
||||||||||||
|
Office-California, USA
|
1
|
|
5.26%
|
June 2020
|
I/O
|
—
|
|
67,161
|
|
66,978
|
|
—
|
|
||||||||||||
|
Office-California, USA
|
1
|
|
5.19%
|
July 2020
|
I/O
|
—
|
|
68,261
|
|
67,804
|
|
—
|
|
||||||||||||
|
Office-California, USA
|
1
|
|
6.09%
|
December 2020
|
I/O
|
—
|
|
112,750
|
|
111,861
|
|
—
|
|
||||||||||||
|
Office-Various, USA
(11)
|
5
|
|
4.89% - 7.99%
|
November 2017 to January 2021
|
I/O
|
—
|
|
183,927
|
|
182,435
|
|
72,713
|
|
||||||||||||
|
Multifamily-Tennessee, USA
|
1
|
|
6.39%
|
December 2019
|
I/O
|
—
|
|
77,073
|
|
77,911
|
|
—
|
|
||||||||||||
|
Multifamily -Various, USA
|
9
|
|
5.37% - 7.59%
|
January 2019 to January 2021
|
I/O
|
—
|
|
251,368
|
|
251,173
|
|
—
|
|
||||||||||||
|
Retail-Various, USA
(11)
|
15
|
|
5.28% - 11.30%
|
October 2018 to May 2020
|
I/O
|
—
|
|
299,262
|
|
283,412
|
|
34,720
|
|
||||||||||||
|
Industrial-Tennessee, USA
|
1
|
|
6.64%
|
September 2021
|
I/O
|
—
|
|
8,000
|
|
8,080
|
|
—
|
|
||||||||||||
|
42
|
|
|
—
|
|
1,735,284
|
|
1,715,873
|
|
253,554
|
|
|||||||||||||||
|
Subordinated mortgage and mezzanine:
|
|||||||||||||||||||||||||
|
Hotel-New York, USA
(10)
|
1
|
|
14.47%
|
May 2023
|
I/O
|
146,121
|
|
61,750
|
|
57,306
|
|
61,750
|
|
||||||||||||
|
Hotel-New York, USA
(10)
|
3
|
|
11.63% - 13.39%
|
September 2019 to May 2023
|
I/O
|
306,621
|
|
77,866
|
|
28,785
|
|
49,366
|
|
||||||||||||
|
Multifamily -Various, USA
|
3
|
|
9.45% - 13.50%
|
August 2020 to August 2024
|
Both
|
203,046
|
|
68,150
|
|
67,606
|
|
—
|
|
||||||||||||
|
Retail-Various, USA
|
3
|
|
10.09% - 13.59%
|
December 2018 to April 2024
|
Both
|
172,942
|
|
29,329
|
|
22,241
|
|
—
|
|
||||||||||||
|
Office-Various, USA
(11)
|
1
|
|
11.59%
|
November 2017
|
I/O
|
107,433
|
|
28,618
|
|
—
|
|
28,618
|
|
||||||||||||
|
11
|
|
|
936,163
|
|
265,713
|
|
175,938
|
|
139,734
|
|
|||||||||||||||
|
Preferred equity:
|
|||||||||||||||||||||||||
|
Office-New York, USA
|
1
|
|
12.00%
|
June 2027
|
I/O
|
439,204
|
|
92,315
|
|
92,315
|
|
—
|
|
||||||||||||
|
Office-Nevada, USA
|
1
|
|
15.00%
|
September 2020
|
I/O
|
67,400
|
|
21,545
|
|
21,371
|
|
—
|
|
||||||||||||
|
2
|
|
|
506,604
|
|
113,860
|
|
113,686
|
|
—
|
|
|||||||||||||||
|
Total
|
55
|
|
$
|
1,442,767
|
|
$
|
2,114,857
|
|
$
|
2,005,497
|
|
$
|
393,288
|
|
|||||||||||
______________________________________________________________________________________
|
(1)
|
Loans with carrying values that are individually less than
3%
of the total carrying value have been aggregated according to collateral type and location.
|
|
(2)
|
Does not include a senior loan with an unpaid principal amount and carrying value of
$15.0 million
that is not related to real estate.
|
|
(3)
|
Variable rate loans are determined based on the applicable index in effect as of
December 31, 2018
.
|
|
(4)
|
Represents contractual maturity that does not contemplate exercise of extension option.
|
|
(5)
|
Payment terms: P&I = Periodic payment of principal and interest; I/O = Periodic payment of interest only with principal at maturity.
|
|
(6)
|
Prior liens represent loan amounts owned by third parties that are senior to the Company’s mezzanine or preferred equity positions and are approximate.
|
|
(7)
|
Carrying amounts as of
December 31, 2018
are presented net of
$109.3 million
of allowance for loan losses.
|
|
(8)
|
The aggregate cost of loans and preferred equity held for investment is approximately
$2.1 billion
for federal tax purposes as of
December 31, 2018
.
|
|
(9)
|
Represents principal balance of loans which are 90 days or more past due as to principal or interest.
|
|
(10)
|
Principal amount subject to delinquent principal or interest includes
four
loans to the same borrower and secured by the same collateral with combined unpaid principal amount of
$257.2 million
.
|
|
(11)
|
Principal amount subject to delinquent principal or interest includes
four
loans to the same borrower and secured by the same collateral with combined unpaid principal amount of
$136.1 million
.
|
F-66
COLONY CREDIT REAL ESTATE, INC. AND SUBSIDIARIES
SCHEDULE IV - MORTGAGE LOANS ON REAL ESTATE (CONTINUED)
December 31, 2018
(Dollars in Thousands)
Activity in mortgage loans on real estate is summarized below:
|
Year Ended December 31,
|
||||||||||||
|
2018
|
2017
|
2016
|
||||||||||
|
Balance at January 1
|
$
|
1,300,784
|
|
$
|
1,523,426
|
|
$
|
1,797,525
|
|
|||
|
Loans and preferred equity held for investment acquired in the Combination (Note 3)
|
1,249,733
|
|
—
|
|
—
|
|
||||||
|
Deconsolidation of investment entities
|
(553,678
|
)
|
—
|
|
—
|
|
||||||
|
Acquisitions/originations/additional funding
(1)
|
904,461
|
|
374,981
|
|
247,080
|
|
||||||
|
Loan maturities/principal repayments
|
(627,219
|
)
|
(547,252
|
)
|
(345,730
|
)
|
||||||
|
Foreclosure of loans held for investment
|
(117,878
|
)
|
(20,204
|
)
|
—
|
|
||||||
|
Combination adjustment
|
(50,314
|
)
|
—
|
|
—
|
|
||||||
|
Discount accretion/premium amortization
|
2,582
|
|
8,551
|
|
8,112
|
|
||||||
|
Capitalized interest
|
5,837
|
|
1,802
|
|
7,884
|
|
||||||
|
Change in allowance for loan loss
|
(108,811
|
)
|
(518
|
)
|
(3,386
|
)
|
||||||
|
Payments received from PCI loans
|
—
|
|
(56,832
|
)
|
(25,790
|
)
|
||||||
|
Accretion on PCI loans
|
—
|
|
4,396
|
|
7,670
|
|
||||||
|
Consolidation of loans receivable held by investment entities
|
—
|
|
12,434
|
|
—
|
|
||||||
|
Carrying value of loans sold
|
—
|
|
—
|
|
(113,582
|
)
|
||||||
|
Transfer to loans held for sale
|
—
|
|
—
|
|
(56,357
|
)
|
||||||
|
Balance at December 31
|
$
|
2,005,497
|
|
$
|
1,300,784
|
|
$
|
1,523,426
|
|
|||
______________________________________________________________________________________
(1) Excludes origination of a senior loan with an unpaid principal amount and carrying value of
$15.0 million
that is not related to real estate.
F-67
Item 16. Form 10-K Summary
Omitted at Registrant’s option.
EXHIBIT INDEX
|
Exhibit Number
|
Description of Exhibit
|
|
|
2.1
|
||
|
3.1
|
||
|
3.2
|
||
|
10.1
|
||
|
10.2
|
||
|
10.3*
|
||
|
10.4*
|
||
|
10.5
|
||
|
10.6
|
||
|
10.7
|
||
|
10.8†
|
||
|
10.9†
|
||
|
10.10 †
|
||
|
10.11
|
||
|
10.12
|
||
|
10.13
|
||
|
10.14
|
||
|
10.15
|
||
|
10.16
|
||
|
Exhibit Number
|
Description of Exhibit
|
|
|
10.17
|
||
|
10.18
|
||
|
10.19
|
||
|
10.20
|
||
|
10.21
|
||
|
10.22
|
||
|
10.23
|
||
|
10.24
|
||
|
10.25
|
||
|
10.26
|
||
|
10.27
|
||
|
10.28
|
||
|
10.29
|
||
|
10.30
|
||
|
10.31
|
||
|
10.32
|
||
|
10.33
|
||
|
10.34
|
||
|
10.35
|
||
|
10.36
|
||
|
Exhibit Number
|
Description of Exhibit
|
|
|
10.37
|
||
|
10.38
|
||
|
10.39
|
||
|
10.40
|
||
|
10.41
|
||
|
10.42
|
||
|
10.43
|
||
|
10.44
|
||
|
21.1*
|
||
|
23.1*
|
||
|
31.1*
|
||
|
31.2*
|
||
|
32.1*
|
||
|
32.2*
|
||
|
101*
|
The following materials from the Colony Credit Real Estate, Inc. Annual Report on Form 10-K for the year ended December 31, 2018, formatted in XBRL (eXtensible Business Reporting Language): (i) Consolidated Balance Sheets as of December 31, 2018 and December 31, 2017; (ii) Consolidated Statements of Operations for the years ended December 31, 2018, 2017 and 2016; (iii) Consolidated Statements of Comprehensive Income (Loss) for the years ended December 31, 2018, 2017 and 2016;(iv) Consolidated Statements of Equity for the years ended December 31, 2018, 2017 and 2016; (v) Consolidated Statements of Cash Flows for the years ended December 31, 2018, 2017 and 2016; and (vi) Notes to Consolidated Financial Statements
|
|
______________________________________
* Filed herewith
† Denotes a management contract or compensatory plan, contract or arrangement.
SIGNATURES
Pursuant to the requirements of Section 13 or 15(d) of the Securities Exchange Act of 1934, the Registrant has duly caused this report to be signed on its behalf by the undersigned thereunto duly authorized.
|
Colony Credit Real Estate, Inc.
|
|||
|
Date:
|
February 28, 2019
|
/s/ Kevin P. Traenkle
|
|
|
Kevin P. Traenkle
|
|||
|
Chief Executive Officer and President
|
|||
POWER OF ATTORNEY
KNOW ALL PERSONS BY THESE PRESENTS, that each person whose signature appears below constitutes and appoints Kevin P. Traenkle and Neale W. Redington and each of them severally, her or his true and lawful attorney-in-fact with power of substitution and re-substitution to sign in her or his name, place and stead, in any and all capacities, to do any and all things and execute any and all instruments that such attorney may deem necessary or advisable under the Securities Exchange Act of 1934 and any rules, regulations and requirements of the U.S. Securities and Exchange Commission in connection with this Annual Report on Form 10-K and any and all amendments hereto, as fully for all intents and purposes as she or he might or could do in person, and hereby ratifies and confirms all said attorneys-in-fact and agents, each acting alone, and her or his substitute or substitutes, may lawfully do or cause to be done by virtue hereof. Pursuant to the requirements of Section 13 or 15(d) of the Securities Exchange Act of 1934, this report has been signed below on behalf of the Registrant in the capacities and on the dates indicated.
|
SIGNATURE
|
TITLE
|
DATE
|
||
|
/s/ Kevin P. Traenkle
|
Chief Executive Officer and President and Director
|
February 28, 2019
|
||
|
Kevin P. Traenkle
|
(Principal Executive Officer)
|
|||
|
/s/ Neale W. Redington
|
Chief Financial Officer
|
February 28, 2019
|
||
|
Neale W. Redington
|
(Principal Financial Officer)
|
|||
|
/s/ Frank V. Saracino
|
Chief Accounting Officer
|
February 28, 2019
|
||
|
Frank V. Saracino
|
(Principal Accounting Officer)
|
|||
|
/s/ Richard B. Saltzman
|
Chairman of the Board of Directors
|
February 28, 2019
|
||
|
Richard B. Saltzman
|
||||
|
/s/ Darren J. Tangen
|
Director
|
February 28, 2019
|
||
|
Darren J. Tangen
|
||||
|
/s/ Catherine D. Rice
|
Director
|
February 28, 2019
|
||
|
Catherine D. Rice
|
||||
|
/s/ Vernon B. Schwartz
|
Director
|
February 28, 2019
|
||
|
Vernon B. Schwartz
|
||||
|
/s/ John E. Westerfield
|
Director
|
February 28, 2019
|
||
|
John E. Westerfield
|
||||
|
/s/ Winston W. Wilson
|
Director
|
February 28, 2019
|
||
|
Winston W. Wilson
|
||||
TABLE OF CONTENTS
Part IItem 1. BusinessItem 1A. Risk FactorsItem 1B. Unresolved Staff CommentsItem 2. PropertiesItem 3. Legal ProceedingsItem 4. Mine Safety DisclosuresPart IIItem 5. Market For Registrant S Common Equity, Related Stockholder Matters and Issuer Purchases Of Equity SecuritiesItem 6. Selected Financial DataItem 7. Management S Discussion and Analysis Of Financial Condition and Results Of OperationsItem 7A. Quantitative and Qualitative Disclosures About Market RiskItem 8. Financial StatementsItem 9. Changes in and Disagreements with Accountants on Accounting and Financial DisclosuresItem 9A. Controls and ProceduresItem 9B. Other InformationPart IIIItem 10. Directors, Executive Officers and Corporate GovernanceItem 11. Executive CompensationItem 12. Security Ownership Of Certain Beneficial Owners and Management Related Stockholder MattersItem 13. Certain Relationships and Related Transactions, and Director IndependenceItem 14. Principal Accounting Fees and ServicesPart IVItem 15. Exhibits and Financial Statement SchedulesItem 16. Form 10-k Summary