|
|
o |
REGISTRATION STATEMENT PURSUANT TO SECTION 12(b) OR (g) OF THE SECURITIES EXCHANGE ACT OF 1934
|
|
x
|
ANNUAL REPORT PURSUANT TO SECTION 13 OR 15(d) OF THE SECURITIES EXCHANGE ACT OF 1934
|
|
|
for the fiscal year ended December 31, 2011
|
|
o
|
TRANSITION REPORT PURSUANT TO SECTION 13 OR 15(d) OF THE SECURITIES EXCHANGE ACT OF 1934
|
|
|
for the transition period from ________________ to ________________
|
|
o
|
SHELL COMPANY REPORT PURSUANT TO SECTION 13 OR 15(d) OF THE SECURITIES EXCHANGE ACT OF 1934
|
|
|
Date of event requiring this shell company report
|
|
Title of each class
|
Name of each exchange on which registered
|
|
|
American Depositary Shares, each representing the right to receive 55 common shares, no par value, and 50 preferred shares, no par value, of Banco Santander (Brasil) S.A.
|
New York Stock Exchange
|
|
Large accelerated filer
x
|
Accelerated filer
o
|
Non-accelerated filer
o
|
|
US GAAP
o
|
International Financial Reporting Standards as
issued by the International Accounting Standards Board
x
|
Other
o
|
|
|
·
|
increases in defaults by our customers and in impairment losses;
|
|
|
·
|
decreases in deposits, customer loss or revenue loss;
|
|
|
·
|
increases in provisions for legal claims;
|
|
|
·
|
our ability to sustain or improve our performance;
|
|
|
·
|
changes in interest rates which may, among other effects, adversely affect margins;
|
|
|
·
|
competition in the banking, financial services, credit card services, insurance, asset management and related industries;
|
|
|
·
|
government regulation and tax matters;
|
|
|
·
|
adverse legal or regulatory disputes or proceedings;
|
|
|
·
|
credit, market and other risks of lending and investment activities;
|
|
|
·
|
decreases in our level of capitalization;
|
|
|
·
|
changes in market value of Brazilian securities, particularly Brazilian government securities;
|
|
|
·
|
changes in regional, national and international business and economic conditions and inflation;
|
|
|
·
|
the ongoing effects of recent volatility in global financial markets crisis; and
|
|
|
·
|
other risk factors as set forth under “Item 3. Key Information—D. Risk Factors”.
|
|
Directors and Senior Management
|
|
Advisers
|
|
Auditors
|
|
Offer Statistics
|
|
Method and Expected Timetable
|
|
Selected Financial Data
|
|
Santander Brasil
|
||||||||||||||||||||||||
|
For the year ended December 31,
|
||||||||||||||||||||||||
|
2011
|
2011
|
2010
|
2009
|
2008
|
2007
|
|||||||||||||||||||
|
(in millions of U.S.$, except as otherwise indicated)
(1)
|
(in millions of R$, except as otherwise indicated)
|
|||||||||||||||||||||||
|
Interest and similar income
|
27,581 | 51,736 | 40,909 | 39,343 | 23,768 | 13,197 | ||||||||||||||||||
|
Interest expense and similar charges
|
(12,706 | ) | (23,834 | ) | (16,814 | ) | (17,176 | ) | (12,330 | ) | (7,002 | ) | ||||||||||||
|
Net interest income
|
14,875 | 27,902 | 24,095 | 22,167 | 11,438 | 6,195 | ||||||||||||||||||
|
Income from equity instruments
|
50 | 94 | 52 | 30 | 37 | 36 | ||||||||||||||||||
|
Income from companies accounted for by the equity method
|
29 | 54 | 44 | 295 | 112 | 6 | ||||||||||||||||||
|
Fee and commission income
|
4,675 | 8,769 | 7,833 | 7,148 | 4,809 | 3,364 | ||||||||||||||||||
|
Fee and commission expense
|
(762 | ) | (1,430 | ) | (998 | ) | (910 | ) | (555 | ) | (266 | ) | ||||||||||||
|
Gains (losses) on financial assets and liabilities (net)
|
(61 | ) | (114 | ) | 1,458 | 2,716 | (1,286 | ) | 1,517 | |||||||||||||||
|
Exchange differences (net)
|
(65 | ) | (121 | ) | 417 | (51 | ) | 1,476 | 382 | |||||||||||||||
|
Other operating income (expenses)
|
(202 | ) | (379 | ) | (348 | ) | (115 | ) | (60 | ) | 133 | |||||||||||||
|
Total income
|
18,539 | 34,775 | 32,553 | 31,280 | 15,971 | 11,367 | ||||||||||||||||||
|
Administrative expenses
|
(6,596 | ) | (12,373 | ) | (11,231 | ) | (10,947 | ) | (7,185 | ) | (4,460 | ) | ||||||||||||
|
Depreciation and amortization
|
(779 | ) | (1,462 | ) | (1,237 | ) | (1,249 | ) | (846 | ) | (580 | ) | ||||||||||||
|
Provisions (net)
(2)
|
(1,632 | ) | (3,061 | ) | (1,974 | ) | (3,481 | ) | (1,230 | ) | (1,196 | ) | ||||||||||||
|
Impairment losses on financial assets (net)
(3)
|
(5,001 | ) | (9,382 | ) | (8,234 | ) | (9,966 | ) | (4,100 | ) | (2,160 | ) | ||||||||||||
|
Impairment losses on other assets (net)
|
(21 | ) | (39 | ) | (21 | ) | (901 | ) | (77 | ) | (298 | ) | ||||||||||||
|
Gains (losses) on disposal of assets not classified as non-current assets held for sale
|
3 | 5 | (59 | ) | 3,369 | 7 | 1 | |||||||||||||||||
|
Gains (losses) on non-current assets held for sale not classified as discontinued operations
|
238 | 447 | 199 | 32 | 9 | 13 | ||||||||||||||||||
|
Operating profit before tax
|
4,751 | 8,911 | 9,997 | 8,137 | 2,549 | 2,687 | ||||||||||||||||||
|
Income taxes
|
(616 | ) | (1,155 | ) | (2,614 | ) | (2,629 | ) | (170 | ) | (784 | ) | ||||||||||||
|
Profit for the year
|
4,135 | 7,756 | 7,383 | 5,508 | 2,379 | 1,903 | ||||||||||||||||||
|
Earnings per share
|
||||||||||||||||||||||||
|
Basic and diluted earnings per 1,000 shares
|
||||||||||||||||||||||||
|
Common shares (
reais
)
|
18.55 | 17.67 | 15.32 | 11.59 | 14.02 | |||||||||||||||||||
|
Preferred shares (
reais
)
|
20.41 | 19.44 | 16.85 | 12.75 | 15.43 | |||||||||||||||||||
|
Common shares (U.S. dollars)
(1)
|
9.89 | 10.61 | 9.19 | 6.69 | 8.41 | |||||||||||||||||||
|
Preferred shares (U.S. dollars)
(1)
|
10.88 | 11.67 | 10.11 | 7.65 | 9.26 | |||||||||||||||||||
|
Santander Brasil
|
||||||||||||||||||||||||
|
For the year ended December 31,
|
||||||||||||||||||||||||
|
2011
|
2011
|
2010
|
2009
|
2008
|
2007
|
|||||||||||||||||||
|
(in millions of U.S.$, except as otherwise indicated)
(1)
|
(in millions of R$, except as otherwise indicated)
|
|||||||||||||||||||||||
|
Dividends and interest on capital per 1,000 shares
(4)
|
||||||||||||||||||||||||
|
Common shares (
reais
)
|
7.61 | 8.47 | 4.11 | 4.26 | 16.30 | |||||||||||||||||||
|
Preferred shares (
reais
)
|
8.37 | 9.32 | 4.52 | 4.69 | 17.93 | |||||||||||||||||||
|
Common shares (U.S. dollars)
(1)
|
4.06 | 5.08 | 2.47 | 2.56 | 9.78 | |||||||||||||||||||
|
Preferred shares (U.S. dollars)
(1)
|
4.46 | 5.59 | 2.71 | 2.81 | 10.76 | |||||||||||||||||||
|
Weighted average shares outstanding (in thousands) – basic and diluted
|
||||||||||||||||||||||||
|
Common shares
|
212,841,732 | 212,841,732 | 183,650,861 | 104,926,194 | 69,383,705 | |||||||||||||||||||
|
Preferred shares
|
186,202,385 | 186,202,385 | 159,856,132 | 91,168,064 | 60,285,449 | |||||||||||||||||||
|
(1)
|
Translated for convenience only using the selling rate as reported by the Brazilian Central Bank at December 31, 2011 for
reais
into U.S. dollars of R$1.87 to U.S.$1.00.
|
|
(2)
|
Mainly provisions for legal obligations, tax and social security, labor and civil litigations.
|
|
(3)
|
Net provisions to the credit loss allowance less recovery of loans previously written off.
|
|
(4)
|
Includes dividends based on net income and dividends based on reserves.
|
|
Santander Brasil
|
||||||||||||||||||||||||
|
At December 31,
|
||||||||||||||||||||||||
|
2011
|
2011
|
2010
|
2009
|
2008
|
2007
|
|||||||||||||||||||
|
(in millions of U.S.$)
(1)
|
(in millions of R$)
|
|||||||||||||||||||||||
|
Assets
|
||||||||||||||||||||||||
|
Cash and balances with the Brazilian Central Bank
|
35,152 | 65,938 | 56,800 | 27,269 | 23,700 | 22,277 | ||||||||||||||||||
|
Financial assets held for trading
|
15,941 | 29,901 | 24,821 | 20,116 | 19,986 | 12,293 | ||||||||||||||||||
|
Other financial assets at fair value through profit or loss
(2)
|
355 | 665 | 17,940 | 16,295 | 5,575 | 1,648 | ||||||||||||||||||
|
Available-for-sale financial assets
|
23,781 | 44,608 | 47,206 | 46,406 | 30,736 | 9,303 | ||||||||||||||||||
|
Loans and receivables
|
108,091 | 202,757 | 174,107 | 152,163 | 162,725 | 55,034 | ||||||||||||||||||
|
Hedging derivatives
|
43 | 81 | 116 | 163 | 106 | – | ||||||||||||||||||
|
Non-current assets held for sale
|
71 | 132 | 67 | 172 | 113 | 32 | ||||||||||||||||||
|
Investments in associates
|
225 | 422 | 371 | 419 | 634 | 55 | ||||||||||||||||||
|
Tangible assets
|
2,670 | 5,008 | 4,518 | 3,702 | 3,829 | 1,111 | ||||||||||||||||||
|
Intangible assets
|
16,758 | 31,435 | 31,963 | 31,618 | 30,995 | 1,799 | ||||||||||||||||||
|
Tax assets
|
8,663 | 16,250 | 14,842 | 15,779 | 12,920 | 4,223 | ||||||||||||||||||
|
Other assets
|
1,432 | 2,687 | 1,912 | 1,871 | 2,871 | 544 | ||||||||||||||||||
|
Total assets
|
213,182 | 399,886 | 374,663 | 315,973 | 294,190 | 108,319 | ||||||||||||||||||
|
Liabilities
|
||||||||||||||||||||||||
|
Financial liabilities held for trading
|
2,691 | 5,047 | 4,785 | 4,435 | 11,210 | 4,650 | ||||||||||||||||||
|
Other financial liabilities at fair value through profit or loss
|
– | – | – | 2 | 307 | 690 | ||||||||||||||||||
|
Financial liabilities at amortized cost
|
155,375 | 291,452 | 253,341 | 203,568 | 213,973 | 84,781 | ||||||||||||||||||
|
Deposits from the Brazilian Central Bank and deposits from credit institutions
|
27,469 | 51,527 | 42,392 | 21,196 | 26,510 | 18,217 | ||||||||||||||||||
|
Customer deposits
|
93,013 | 174,474 | 167,949 | 149,440 | 155,495 | 55,147 | ||||||||||||||||||
|
Marketable debt securities
|
20,573 | 38,590 | 20,087 | 11,439 | 12,086 | 2,806 | ||||||||||||||||||
|
Subordinated liabilities
|
5,815 | 10,908 | 9,695 | 11,305 | 9,197 | 4,210 | ||||||||||||||||||
|
Other financial liabilities
|
8,504 | 15,952 | 13,218 | 10,188 | 10,685 | 4,401 | ||||||||||||||||||
|
Hedging derivatives
|
19 | 36 | – | 10 | 265 | – | ||||||||||||||||||
|
Liabilities for insurance contracts
|
– | – | 19,643 | 15,527 | – | – | ||||||||||||||||||
|
Provisions
(3)
|
5,073 | 9,515 | 9,395 | 9,480 | 8,915 | 4,816 | ||||||||||||||||||
|
Santander Brasil
|
||||||||||||||||||||||||
|
At December 31,
|
||||||||||||||||||||||||
|
2011
|
2011
|
2010
|
2009
|
2008
|
2007
|
|||||||||||||||||||
|
(in millions of U.S.$)
(1)
|
(in millions of R$)
|
|||||||||||||||||||||||
|
Tax liabilities
|
6,331 | 11,876 | 10,530 | 9,457 | 6,156 | 1,719 | ||||||||||||||||||
|
Other liabilities
|
2,094 | 3,928 | 3,605 | 4,228 | 3,527 | 1,454 | ||||||||||||||||||
|
Total liabilities
|
171,582 | 321,854 | 301,299 | 246,707 | 244,353 | 98,111 | ||||||||||||||||||
|
Shareholders’ equity
|
41,073 | 77,045 | 72,572 | 68,706 | 49,318 | 8,671 | ||||||||||||||||||
|
Valuation adjustments
|
516 | 968 | 784 | 559 | 514 | 1,537 | ||||||||||||||||||
|
Non-controlling interests
|
10 | 19 | 8 | 1 | 5 | – | ||||||||||||||||||
|
Total equity
|
41,599 | 78,032 | 73,364 | 69,266 | 49,837 | 10,208 | ||||||||||||||||||
|
Total liabilities and equity
|
213,182 | 399,886 | 374,663 | 315,973 | 294,190 | 108,319 | ||||||||||||||||||
|
Average assets
|
210,429 | 394,722 | 341,285 | 298,174 | 163,621 | 100,243 | ||||||||||||||||||
|
Average interest-bearing liabilities
|
130,316 | 244,446 | 198,456 | 184,332 | 109,455 | 69,204 | ||||||||||||||||||
|
Average shareholders’ equity
|
40,365 | 75,716 | 71,875 | 56,192 | 23,110 | 10,521 | ||||||||||||||||||
|
(1)
|
Translated for convenience only using the selling rate as reported by the Brazilian Central Bank at December 31, 2011 for
reais
into U.S. dollars of R$1.87 to U.S.$1.00.
|
|
(2)
|
In 2010 and 2009, this item includes Investment fund units of Guarantors of Benefit Plans—PGBL/VGBL, in the amount of R$17,426 million and R$14,184 million, respectively, related to the liabilities for insurance contracts held by Santander Seguros, which were no longer included in the scope of consolidation in 2011, following the sale of Santander Seguros. See “Item 4. Information on the Company—A. History and Development of the Company—Important Events—Sale of Santander Seguros”.
|
|
(3)
|
Mainly legal obligations, tax and social security, labor and civil litigation.
|
|
At and for the year ended December 31,
|
||||||||||||||||||||
|
2011
|
2010
|
2009
|
2008
|
2007
|
||||||||||||||||
|
Profitability and performance
|
||||||||||||||||||||
|
Net yield
(1)
|
8.6 | % | 8.8 | % | 9.7 | % | 8.6 | % | 7.2 | % | ||||||||||
|
Return on average total assets
|
2.0 | % | 2.2 | % | 1.8 | % | 1.5 | % | 1.9 | % | ||||||||||
|
Return on average shareholders’ equity
|
10.2 | % | 10.3 | % | 9.8 | % | 10.3 | % | 18.1 | % | ||||||||||
|
Adjusted return on average shareholders’ equity
(2)
|
16.2 | % | 16.9 | % | 19.3 | % | 16.8 | % | 18.1 | % | ||||||||||
|
Capital adequacy
|
||||||||||||||||||||
|
Average shareholders’ equity as a percentage of average total assets
|
19.2 | % | 21.1 | % | 18.8 | % | 14.1 | % | 10.5 | % | ||||||||||
|
Average shareholders’ equity excluding goodwill as a percentage of average total assets excluding goodwill
(2)
|
13.0 | % | 13.9 | % | 10.5 | % | 9.2 | % | 10.5 | % | ||||||||||
|
Basel capital adequacy ratio
(3)
|
19.9 | % | 22.1 | % | 25.6 | % | 14.7 | % | 14.2 | % | ||||||||||
|
Asset quality
|
||||||||||||||||||||
|
Non-performing assets as a percentage of total loans
(4)
|
6.7 | % | 5.8 | % | 7.2 | % | 5.4 | % | 4.1 | % | ||||||||||
|
Non-performing assets as a percentage of total assets
(4)
|
3.3 | % | 2.7 | % | 3.1 | % | 2.6 | % | 2.2 | % | ||||||||||
|
Non-performing assets as a percentage of computable credit risk
(4)(5)
|
6.0 | % | 5.1 | % | 6.2 | % | 4.7 | % | 3.2 | % | ||||||||||
|
Allowance for credit losses as a percentage of non-performing assets
(4)
|
85.5 | % | 98.3 | % | 101.7 | % | 105.8 | % | 107.5 | % | ||||||||||
|
Allowance for credit losses as a percentage of total loans
|
5.7 | % | 5.8 | % | 7.2 | % | 5.4 | % | 4.4 | % | ||||||||||
|
Net loan charge-offs as a percentage of total loans
|
4.7 | % | 6.2 | % | 6.2 | % | 2.3 | % | 4.7 | % | ||||||||||
|
Non-performing assets as a percentage of shareholders’ equity
(4)
|
17.0 | % | 12.9 | % | 14.4 | % | 15.7 | % | 24.1 | % | ||||||||||
|
At and for the year ended December 31,
|
||||||||||||||||||||
|
2011
|
2010
|
2009
|
2008
|
2007
|
||||||||||||||||
|
Non-performing assets as a percentage of shareholders’ equity excluding goodwill
(2)(4)
|
26.2 | % | 21.1 | % | 24.5 | % | 35.4 | % | 24.1 | % | ||||||||||
|
Liquidity
|
||||||||||||||||||||
|
Total loans, net as a percentage of total funding
|
66.4 | % | 63.0 | % | 66.4 | % | 66.0 | % | 60.7 | % | ||||||||||
|
Deposits as a percentage of total funding
|
82.0 | % | 87.6 | % | 88.2 | % | 89.5 | % | 91.3 | % | ||||||||||
|
Other Information
|
||||||||||||||||||||
|
Efficiency
|
||||||||||||||||||||
|
Efficiency ratio
(6)
|
35.6 | % | 34.5 | % | 35.0 | % | 45.0 | % | 39.2 | % | ||||||||||
|
(1)
|
Net yield is defined as net interest income (including dividends on equity securities) divided by average interest earning assets.
|
|
(2)
|
“Adjusted return on average shareholders’ equity”, “Average shareholders’ equity excluding goodwill as a percentage of average total assets excluding goodwill” and “Non-performing assets as a percentage of shareholders’ equity excluding goodwill” are non-GAAP financial measurements which adjust “Return on average shareholders’ equity”, “Average shareholders’ equity as a percentage of average total assets” and “Non-performing assets as a percentage of shareholders’ equity”, to exclude the R$27 billion goodwill arising from the acquisition of Banco Real in 2008.
|
|
At and for the year ended December 31,
|
||||||||||||||||
|
2011
|
2010
|
2009
|
2008
|
|||||||||||||
|
(in millions of R$, except as otherwise indicated)
|
||||||||||||||||
|
Return on average shareholders’ equity:
|
||||||||||||||||
|
Consolidated profit for the year
|
7,756 | 7,383 | 5,508 | 2,379 | ||||||||||||
|
Average shareholders’ equity
|
75,716 | 71,875 | 56,192 | 23,110 | ||||||||||||
|
Return on average shareholders’ equity
|
10.2 | % | 10.3 | % | 9.8 | % | 10.3 | % | ||||||||
|
Adjusted return on average shareholders’ equity:
|
||||||||||||||||
|
Consolidated profit for the year
|
7,756 | 7,383 | 5,508 | 2,379 | ||||||||||||
|
Average shareholders’ equity
|
75,716 | 71,875 | 56,192 | 23,110 | ||||||||||||
|
Average goodwill
|
27,975 | 28,312 | 27,714 | 8,925 | ||||||||||||
|
Average shareholders’ equity excluding goodwill
|
47,741 | 43,562 | 28,478 | 14,185 | ||||||||||||
|
Adjusted return on average shareholders’ equity
|
16.2 | % | 16.9 | % | 19.3 | % | 16.8 | % | ||||||||
|
Average shareholders’ equity as a percentage of average total assets:
|
||||||||||||||||
|
Average shareholders’ equity
|
75,716 | 71,875 | 56,192 | 23,110 | ||||||||||||
|
Average total assets
|
394,722 | 341,284 | 298,173 | 163,621 | ||||||||||||
|
Average shareholders’ equity as a percentage of average total assets
|
19.2 | % | 21.1 | % | 18.8 | % | 14.1 | % | ||||||||
|
Average shareholders’ equity excluding goodwill as a percentage of average total assets excluding goodwill:
|
||||||||||||||||
|
Average shareholders’ equity
|
75,716 | 71,875 | 56,192 | 23,110 | ||||||||||||
|
Average goodwill
|
27,975 | 28,312 | 27,714 | 8,925 | ||||||||||||
|
Average shareholders’ equity excluding goodwill
|
47,741 | 43,562 | 28,478 | 14,185 | ||||||||||||
|
Average total assets
|
394,722 | 341,284 | 298,173 | 163,621 | ||||||||||||
|
Average goodwill
|
27,975 | 28,312 | 27,714 | 8,925 | ||||||||||||
|
Average total assets excluding goodwill
|
366,746 | 312,972 | 270,460 | 154,696 | ||||||||||||
|
Average shareholders’ equity excluding goodwill as a percentage of average total assets excluding goodwill
|
13.0 | % | 13.9 | % | 10.5 | % | 9.2 | % | ||||||||
|
At and for the year ended December 31,
|
||||||||||||||||
|
2011
|
2010
|
2009
|
2008
|
|||||||||||||
|
(in millions of R$, except as otherwise indicated)
|
||||||||||||||||
|
Non-performing assets as a percentage of shareholders’ equity:
|
||||||||||||||||
|
Non-performing assets
|
13,073 | 9,349 | 9,900 | 7,730 | ||||||||||||
|
Shareholders’ equity
|
77,045 | 72,572 | 68,706 | 49,318 | ||||||||||||
|
Non-performing assets as a percentage of shareholders’ equity
|
17.0 | % | 12.9 | % | 14.4 | % | 15.7 | % | ||||||||
|
Non-performing assets as a percentage of shareholders’ equity excluding goodwill:
|
||||||||||||||||
|
Non-performing assets
|
13,073 | 9,349 | 9,900 | 7,730 | ||||||||||||
|
Shareholders’ equity
|
77,045 | 72,572 | 68,706 | 49,318 | ||||||||||||
|
Goodwill
|
27,218 | 28,312 | 28,312 | 27,488 | ||||||||||||
|
Shareholders’ equity excluding goodwill
|
49,827 | 44,259 | 40,394 | 21,829 | ||||||||||||
|
Non-performing assets as a percentage of shareholders’ equity excluding goodwill
|
26.2 | % | 21.1 | % | 24.5 | % | 35.4 | % | ||||||||
|
(3)
|
In July 2008, new regulatory capital measurement rules, which implement the Basel II standardized approach, went into effect in Brazil, including a new methodology for credit risk and operational risk measurement, analysis and management. As a result, our capital adequacy ratios as of any date after July 2008 are not comparable to our capital ratios as of any prior date. Our Basel capital adequacy ratios are calculated excluding goodwill, in accordance with the Basel II standardized approach (provided by the “International Convergence of Capital Measurement and Capital Standards—A Revised Framework Comprehensive Version” issued by the Basel Committee on Banking Supervision from the Bank for International Settlements). In December 2010, the Brazilian Central Bank issued the Circular 3,515 that introduced the rule weight of 150% for lending operations over 24 months, allowing some exceptions given the type of operation, maturity and guarantees. In November 2011, the Circular 3,515 was revoked and the Brazilian Central Bank issued the Circular 3,563 that required the application of 150% ask weight for financing vehicles, risk weight reduction for payroll loans originated up to July 2011 from 150% to 75% or 100%, and raised the risk weight to 300% for payroll and personal loans that have no specific purpose and a term over 60 months, originated as from November 14, 2011.
|
|
(4)
|
Non-performing assets include all credits past due by more than 90 days and other doubtful credits. For further information see “Item 4. Information on the Company—Selected Statistical Information—Impaired Assets”.
|
|
(5)
|
Computable credit risk is the sum of the face amounts of loans and leases (including non-performing assets), guarantees and documentary credits.
|
|
(6)
|
Efficiency ratio is defined as administrative expenses divided by total income. Our calculation for the efficiency ratio disclosed herein differs from another, with similar name, used by us in our quarterly managerial reports, due to an adjustment made in those quarterly reports in light of the results of the hedge of the investment in the Cayman Islands branch, which is included in our total income. The adjustment, which impacts the line items income tax, gains (losses) on financial assets and liabilities and exchange rate differences, does not affect net profit. Our management believes that the adjusted efficiency ratio provides a more consistent framework for evaluating and conducting business, as a result of excluding from our revenues the effect of the volatility caused by possible gains and losses on our hedging strategies for tax purposes. For example, in 2011, the effects of the devaluation of the
real
against the U.S. dollar impacted our hedging of the investments held in our Cayman Islands branch generating losses of R$1,646 million recorded under “gains/losses on
|
|
At and for the years ended December 31,
|
||||||||||||||||||||
|
2011
|
2010
|
2009
|
2008
|
2007
|
||||||||||||||||
|
(in millions of R$, except as otherwise indicated)
|
||||||||||||||||||||
|
Efficiency ratio
|
||||||||||||||||||||
|
Administrative expenses
|
12,373 | 11,231 | 10,947 | 7,185 | 4,460 | |||||||||||||||
|
Total income
|
34,775 | 32,553 | 31,280 | 15,971 | 11,367 | |||||||||||||||
|
of which:
|
||||||||||||||||||||
|
Gains (losses) on financial assets and liabilities (net)
|
(235 | ) | 1,875 | 2,665 | 190 | 1,899 | ||||||||||||||
|
Efficiency ratio
|
35.6 | % | 34.5 | % | 35.0 | % | 45.0 | % | 39.2 | % | ||||||||||
|
Total Income
|
34,775 | 32,553 | 31,280 | 15,971 | 11,367 | |||||||||||||||
|
Income tax including effects of Cayman tax hedge
|
1,646 | 272 | 1,146 | – | – | |||||||||||||||
|
Total income excluding effects of Cayman tax hedge
|
36,421 | 32,281 | 30,134 | 15,971 | 11,367 | |||||||||||||||
|
Administrative expenses
|
12,373 | 11,231 | 10,947 | 7,185 | 4,460 | |||||||||||||||
|
Total income excluding effects of Cayman tax hedge
|
36,421 | 32,281 | 30,134 | 15,971 | 11,367 | |||||||||||||||
|
of which:
|
||||||||||||||||||||
|
Gains (losses) on financial assets and liabilities (net) excluding effects of Cayman tax hedge
|
1,411 | 1,603 | 1,519 | 190 | 1,899 | |||||||||||||||
|
Efficiency ratio adjusted for effects of Cayman tax hedge
|
34.0 | % | 34.8 | % | 36.3 | % | 45.0 | % | 39.2 | % | ||||||||||
|
Period-end
|
Average
(1)
|
Low
|
High
|
|||||||||||||
|
(per U.S. dollar)
|
||||||||||||||||
|
Year:
|
||||||||||||||||
|
2007
|
1.77 | 1.95 | 1.73 | 2.15 | ||||||||||||
|
2008
|
2.33 | 1.84 | 1.56 | 2.50 | ||||||||||||
|
2009
|
1.74 | 1.99 | 1.70 | 2.42 | ||||||||||||
|
2010
|
1.66 | 1.76 | 1.65 | 1.88 | ||||||||||||
|
2011
|
1.87 | 1.67 | 1.53 | 1.90 | ||||||||||||
|
Period-end
|
Average
(1)
|
Low
|
High
|
|||||||||||||
|
(per U.S. dollar)
|
||||||||||||||||
|
Month Ended:
|
||||||||||||||||
|
October 2011
|
1.69 | 1.77 | 1.69 | 1.89 | ||||||||||||
|
November 2011
|
1.81 | 1.79 | 1.73 | 1.89 | ||||||||||||
|
December 2011
|
1.87 | 1.84 | 1.78 | 1.88 | ||||||||||||
|
January 2012
|
1.74 | 1.79 | 1.74 | 1.87 | ||||||||||||
|
February 2012
|
1.71 | 1.72 | 1.70 | 1.74 | ||||||||||||
|
March 2012 (through March 29)
|
1.83 | 1.79 | 1.72 | 1.83 | ||||||||||||
|
(1)
|
Represents the average of the exchange rates on the closing of each business day during the period.
|
|
|
|
Reasons for the Offer and Use of Proceeds
|
|
Risk Factors
|
|
|
·
|
interest rates;
|
|
|
·
|
exchange rates and controls and restrictions on the movement of capital out of Brazil (such as those briefly imposed in 1989 and early 1990);
|
|
|
·
|
currency fluctuations;
|
|
|
·
|
inflation;
|
|
|
·
|
liquidity of the domestic capital and lending markets; and
|
|
|
·
|
tax and regulatory policies.
|
|
|
·
|
minimum capital requirements;
|
|
|
·
|
compulsory deposit and/or reserve requirements;
|
|
|
·
|
requirements for investments in fixed rate assets;
|
|
|
·
|
lending limits and other credit restrictions, including compulsory allocations;
|
|
|
·
|
limits and other restrictions on fees;
|
|
|
·
|
limits on the amount of interest banks can charge or the period for capitalizing interest;
|
|
|
·
|
accounting and statistical requirements; and
|
|
|
·
|
other requirements or limitations in the context of the global financial crisis.
|
|
|
·
|
limiting our ability to increase our customer base and expand our operations;
|
|
|
·
|
reducing our profit margins on the banking, insurance, leasing and other services and products we offer; and
|
|
|
·
|
increasing competition for investment opportunities.
|
|
|
·
|
elect a majority of our directors that appoint our executive officers, set our management policies and exercise overall control over our company and subsidiaries;
|
|
|
·
|
agree to sell or otherwise transfer its controlling stake in our company; and
|
|
|
·
|
determine the outcome of substantially all actions requiring shareholder approval, including transactions with related parties, corporate reorganizations, acquisitions and dispositions of assets, and dividends.
|
|
History and Development of the Company
|
|
Business Overview
|
|
|
·
|
leverage the Santander Group’s global information systems platform, reducing our technology development costs, providing operational synergies with the Santander Group and enhancing our ability to provide international products and services to our customers;
|
|
|
·
|
access the Santander Group’s multinational client base;
|
|
|
·
|
take advantage of the Santander Group’s global presence, in particular in other countries in Latin America, to offer international solutions for our Brazilian corporate customers’ financial needs as they expand their operations globally;
|
|
|
·
|
selectively replicate or adapt the Santander Group’s successful product offerings from other countries in Brazil;
|
|
|
·
|
benefit from the Santander Group’s operational expertise in areas such as internal controls and risk management, which practices have been developed in response to a wide range of market conditions across the world and which we believe will enhance our ability to expand our business within desired risk limits;
|
|
|
·
|
leverage the Santander Group’s experience with integrations to maximize and accelerate the generation of synergies from any future acquisitions; and
|
|
|
·
|
benefit from the Santander Group’s management training and development which is composed of a combination of in-house training and development with access to managerial expertise in other Santander Group units outside Brazil.
|
|
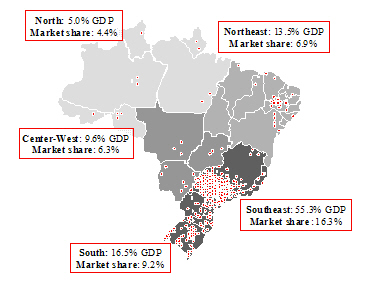
At November 30, 2011
Market share (%)
|
||||
|
Payroll/individual loans
|
11.9 | |||
|
Individual loans
|
19.2 | |||
|
Payroll
|
7.8 | |||
|
Auto leasing/CDC
|
15.0 | |||
|
Credit cards
|
11.8 | |||
|
Branches*
|
12.4 | |||
|
Southeast*
|
16.2 | |||
|
South*
|
9.3 | |||
|
|
·
|
Full consolidation of the operational databases;
|
|
|
·
|
Leverage the fact that we are a well prepared bank with products and services that suit different segments;
|
|
|
·
|
Aggressively reposition the bank within target markets;
|
|
|
·
|
Improve our strategic position and relationships with clients and other markets;
|
|
|
·
|
Value our brand
|
|
Commercial Banking
|
Global Wholesale Banking
|
Asset Management and Insurance
|
||
|
·
Retail banking
– Individuals
– SMEs
·
Enterprises with annual gross revenues in excess of R$30 million but less than R$250 million
·
Corporations with annual gross revenues in excess of R$250 million (other than global corporate clients)
·
Consumer finance
|
·
Global corporate clients, or GB&M
·
Treasury
|
·
Asset management
·
Insurance brokerage
|
|
For the year ended December 31,
|
||||||||||||||||||||||||
|
2011
|
2010
|
2009
|
2011
|
2010
|
2009
|
|||||||||||||||||||
|
Net interest income
|
Profit before tax
|
|||||||||||||||||||||||
|
(in millions of R$)
|
||||||||||||||||||||||||
|
Commercial Banking
|
24,971 | 21,301 | 20,091 | 5,128 | 6,347 | 4,898 | ||||||||||||||||||
|
Global Wholesale Banking
|
2,589 | 2,501 | 1,943 | 2,947 | 2,818 | 2,689 | ||||||||||||||||||
|
Asset Management and Insurance
|
342 | 292 | 133 | 835 | 832 | 550 | ||||||||||||||||||
|
Total
|
27,902 | 24,095 | 22,167 | 8,911 | 9,997 | 8,137 | ||||||||||||||||||
|
|
·
|
Private banking
: We seek to provide our private banking customers personal service from a highly trained team in exclusive offices, with the objective of providing privacy and individualized service.
|
|
|
·
|
High-income customers
: Our model includes differentiated areas in our regular branches (Van Gogh area) and is based on personal relationships with our account managers.
|
|
|
·
|
Mid-income customers
: We use a multi-channel service model, supported by our account managers. We provide differentiated services to customers we view as upwardly mobile.
|
|
|
·
|
Low-income customers
: Our emphasis is on serving customers through alternative channels. In our branches, these customers are served under a standardized model through pools of managers, with a sales-oriented approach. Differentiated services are offered to customers we view as upwardly mobile.
|
|
|
·
|
SMEs
: For medium-sized enterprises, our model is centered on a relationship with the account manager while for small-sized enterprises, we rely more on multi-channel distribution. Special platforms are used to offer differentiated services to clients with a high earnings potential.
|
|
|
·
|
current accounts, saving accounts and time deposits;
|
|
|
·
|
loans to individual customers, including consumer finance, personal loans and payroll loans;
|
|
|
·
|
credit cards;
|
|
|
·
|
loans to SMEs;
|
|
|
·
|
agricultural loans;
|
|
|
·
|
mortgages;
|
|
|
·
|
leasing;
|
|
|
·
|
insurance and asset management products;
|
|
|
·
|
private retirement plans; and
|
|
|
·
|
cash management services for SMEs.
|
|
|
·
|
current accounts (also referred to as demand deposits), which do not bear interest;
|
|
|
·
|
traditional savings accounts, which currently earn the Brazilian reference rate for savings accounts (
taxa referencial
) plus 0.5% per month, as set by the federal government; and
|
|
|
·
|
time deposits, also known as certificates of bank deposits, or “CDBs”, which are highly liquid and earn interest at a fixed or floating rate.
|
|
At December 31,
|
||||||||||||
|
2011
|
2010
|
2009
|
||||||||||
|
(in millions of R$)
|
||||||||||||
|
Customer deposits
|
||||||||||||
|
Current accounts
|
13,561 | 16,132 | 15,140 | |||||||||
|
Savings accounts
|
23,293 | 30,303 | 25,216 | |||||||||
|
Time deposits
|
83,942 | 68,916 | 74,634 | |||||||||
|
Repurchase Agreements
|
53,678 | 52,598 | 34,450 | |||||||||
|
Total customer deposits
|
174,474 | 167,949 | 149,440 | |||||||||
|
Deposits from the Brazilian Central Bank and credit institutions
|
||||||||||||
|
Time deposits
|
27,023 | 28,867 | 20,838 | |||||||||
|
Demand deposits
|
133 | 344 | 195 | |||||||||
|
Repurchase Agreements
|
24,371 | 13,180 | 164 | |||||||||
|
Total
|
51,527 | 42,391 | 21,197 | |||||||||
|
At December 31,
|
Change, at December 31, 2011 vs. December 31, 2010
|
|||||||||||||||||||
|
2011
|
2010
|
2009
|
R$ million
|
%
|
||||||||||||||||
|
(in millions of R$)
|
||||||||||||||||||||
|
Individuals
|
63,413 | 50,981 | 43,200 | 12,432 | 24.4 | |||||||||||||||
|
Consumer finance
|
30,459 | 26,969 | 25,101 | 3,490 | 12.9 | |||||||||||||||
|
Small and Medium Enterprises
(1)
|
47,940 | 38,178 | 31,448 | 9,762 | 25.6 | |||||||||||||||
|
Corporations
(2)
|
52,373 | 44,431 | 38,645 | 7,942 | 17.9 | |||||||||||||||
|
Total
|
194,184 | 160,558 | 138,394 | 33,626 | 20.9 | |||||||||||||||
|
(1)
|
Companies with annual gross revenues of up to R$250 million.
|
|
(2)
|
Companies with annual gross revenues exceeding R$250 million, including our global corporate clients.
|
|
At December 31,
|
Change, at December 31, 2011 vs. December 31, 2010
|
|||||||||||||||||||
|
2011
|
2010
|
2009
|
R$ million
|
%
|
||||||||||||||||
|
(in millions of R$)
|
||||||||||||||||||||
|
Leasing/Auto Loans
(1)
|
2,277 | 2,471 | 2,121 | (194 | ) | (7.9 | ) | |||||||||||||
|
Credit cards
|
14,144 | 10,760 | 8,472 | 3,384 | 31.5 | |||||||||||||||
|
Payroll loans
(2)
|
12,248 | 9,600 | 7,864 | 2,648 | 27.6 | |||||||||||||||
|
Mortgages
|
10,018 | 6,698 | 5,226 | 3,320 | 49.6 | |||||||||||||||
|
Agricultural Loans
|
2,492 | 2,817 | 3,073 | (325 | ) | (11.5 | ) | |||||||||||||
|
Personal loans/Other
|
22,234 | 18,635 | 16,445 | 3,599 | 19.3 | |||||||||||||||
|
Total
|
63,413 | 50,981 | 43,200 | 12,432 | 24.4 | |||||||||||||||
|
(1)
|
Including the loans to individuals in the consumer finance segment, the auto loan portfolio totaled R$27,556 million in the fourth quarter of 2011, R$24,173 million in the fourth quarter of 2010, and R$22,575 million in the fourth quarter of 2009.
|
|
(2)
|
Including Payroll Loan acquired portfolio, Payroll loans totaled R$15,142 million in the fourth quarter of 2011, R$13,800 million in the fourth quarter of 2010 and R$10,084 million in the fourth quarter of 2009.
|
|
At December 31,
|
Change, December 31, 2011 vs. December 31, 2010
|
|||||||||||||||||||
|
2011
|
2010
|
2009
|
R$ million
|
%
|
||||||||||||||||
|
(in millions of R$)
|
||||||||||||||||||||
|
Agricultural lending
|
117 | 112 | 156 | 5 | 4.3 | |||||||||||||||
|
Working capital loans
|
16,776 | 12,442 | 9,138 | 4,324 | 34.8 | |||||||||||||||
|
Buyer financing
|
85 | 38 | 31 | 47 | 123.0 | |||||||||||||||
|
Vendor financing
|
3 | 2 | 10 | 1 | 37.2 | |||||||||||||||
|
Discounted receivables
|
740 | 533 | 428 | 207 | 38.8 | |||||||||||||||
|
Comex
|
302 | 202 | 201 | 100 | 49.4 | |||||||||||||||
|
Overdraft facility
|
4,029 | 3,647 | 3,084 | 381 | 10.5 | |||||||||||||||
|
Refinancing
|
3,189 | 2,793 | 3,169 | 396 | 14.2 | |||||||||||||||
|
Resolution 2,770
|
38 | 58 | 115 | (20 | ) | (35.1 | ) | |||||||||||||
|
Account overdraft loans
|
2,638 | 1,798 | 1,341 | 839 | 46.7 | |||||||||||||||
|
CDC/leasing
(1)
|
2,323 | 2,551 | 2,466 | (228 | ) | (8.9 | ) | |||||||||||||
|
Other
(2)
|
2,191 | 2,141 | 2,072 | 50 | 2.3 | |||||||||||||||
|
Total
(3)
|
32,419 | 26,318 | 22,210 | 6,102 | 23.2 | |||||||||||||||
|
(1)
|
Does not include Consumer Finance.
|
|
(2)
|
Includes credit cards, mortgage finance products and other products.
|
|
(3)
|
Includes small and medium companies with annual gross revenues of up to R$30 million.
|
|
|
·
|
“
Crédito Rural
” and “CPR” (
Cédula de Crédito Rural)
are
products to finance working capital. Basically, CPR is an advanced sale of future production in what essentially amounts to a futures contract. We are the main private bank to offer these products which provide credit based on future revenues and may be used to provide funds to buy agribusiness inputs and to cover storage and sales expenses. Loans are usually secured by mortgages on crops and equipment.
|
|
|
·
|
We act as an agent to lend funds provided by BNDES through government agricultural programs to fund machinery and equipment, fixed assets and permanent plantations such as sugar cane fields, orange groves and coffee plantations.
|
|
|
·
|
We also provide products to fund low carbon agricultural activities in order to stimulate sustainable activities that will increase the share of production with a low environmental impact.
|
|
|
·
|
Global Transaction Banking, which includes cash management, local loans and bank guarantees, trade finance, global custody and securities services and guarantees (both trade and non-trade) and trade services;
|
|
|
·
|
Credit Markets, which includes origination units, distribution of structured credit and debt products, debt capital markets, project finance and asset and capital structuring;
|
|
|
·
|
Corporate Finance, which includes mergers and acquisitions and equity capital markets;
|
|
|
·
|
Equities, which includes equity derivatives, exchange traded derivatives, cash equities and equity research;
|
|
|
·
|
Rates, which offer our customers derivative products, foreign exchange transactions (including for individuals) and other financial products and structures;
|
|
|
·
|
Market Making, which is responsible for the pricing of client deals originated by the sales force from our corporate, institutional, private banking and retail operations; and
|
|
|
·
|
Proprietary Trading, which is responsible for the management of our proprietary books and the establishment of a relevant presence as a leading liquidity provider across all local markets.
|
|
At December 31, 2011
|
||||
|
Branches
|
2,355 | |||
|
PABs (on-site service units)
|
1,420 | |||
|
ATMs
|
18,419 | |||
|
At December 31,
|
Change, At December 31, 2011 vs. December 31, 2010
|
|||||||||||||||||||
|
2011
|
2010
|
2009
|
# |
%
|
||||||||||||||||
|
Central West
|
93 | 86 | 72 | 7 | 8 | |||||||||||||||
|
Northeast
|
196 | 183 | 176 | 13 | 7 | |||||||||||||||
|
North
|
36 | 31 | 31 | 5 | 16 | |||||||||||||||
|
Southeast
|
1,707 | 1,606 | 1,533 | 101 | 6 | |||||||||||||||
|
South
|
323 | 295 | 279 | 28 | 9 | |||||||||||||||
|
Total
|
2,355 | 2,201 | 2,091 | 154 | 7 | |||||||||||||||
|
At December 31,
|
Change, December 31, 2011 vs. December 31, 2010
|
|||||||||||||||||||
|
2011
|
2010
|
2009
|
# |
%
|
||||||||||||||||
|
Central West
|
98 | 100 | 101 | (2 | ) | (2 | ) | |||||||||||||
|
Northeast
|
130 | 159 | 159 | (29 | ) | (18 | ) | |||||||||||||
|
North
|
53 | 59 | 59 | (6 | ) | (10 | ) | |||||||||||||
|
Southeast
|
970 | 1,001 | 1,018 | (31 | ) | (3 | ) | |||||||||||||
|
South
|
169 | 176 | 177 | (7 | ) | (4 | ) | |||||||||||||
|
Total
|
1,420 | 1,495 | 1,514 | (75 | ) | (5 | ) | |||||||||||||
|
At December 31,
|
Change, December 31, 2011 vs. December 31, 2010
|
|||||||||||||||||||
|
2011
|
2010
|
2009
|
# |
%
|
||||||||||||||||
|
Central West
|
759 | 746 | 714 | 13 | 1.7 | |||||||||||||||
|
Northeast
|
1,666 | 1,683 | 1,647 | (17 | ) | (1.0 | ) | |||||||||||||
|
North
|
393 | 398 | 390 | (5 | ) | (1.3 | ) | |||||||||||||
|
Southeast
|
13,406 | 13,407 | 13,336 | (1 | ) | 0.0 | ||||||||||||||
|
South
|
2,195 | 2,078 | 2,041 | 117 | 5.6 | |||||||||||||||
|
Total
|
18,419 | 18,312 | 18,128 | 107 | 0.6 | |||||||||||||||
|
At December 31,
|
Change, December 31, 2011 vs. December 31, 2010
|
|||||||||||||||||||
|
2011
|
2010
|
2009
|
# |
%
|
||||||||||||||||
|
Number of individual customers (in thousands)
|
2,525 | 2,436 | 2,216 | 89 | 3.7 | |||||||||||||||
|
PAS
(1)
|
3,631 | 4,150 | 3,976 | (519 | ) | (12.5 | ) | |||||||||||||
|
Headcount
|
6,588 | 6,882 | 6,516 | (294 | ) | (4.3 | ) | |||||||||||||
|
Percentage of using customers per month
|
27 | % | 29 | % | 27 | % | ||||||||||||||
|
(1)
|
Work stations set up for call center activities.
|
|
At December 31,
|
Change, December 31, 2011 vs. December 31, 2010
|
|||||||||||||||||||
|
2011
|
2010
|
2009
|
# |
%
|
||||||||||||||||
|
Number of individual customers (in thousands)
|
2,448 | 2,025 | 1,790 | 423 | 20.9 | |||||||||||||||
|
Percentage of using customers
|
28 | % | 23 | % | 22 | % | ||||||||||||||
|
|
·
|
consolidation of our operational base;
|
|
|
·
|
leverage our full range of products and services in all business segments;
|
|
|
·
|
strategic repositioning in markets of interest with favorable growth prospects;
|
|
|
·
|
improve our strategic positioning and relationships with clients in other markets; and
|
|
|
·
|
increase our brand value.
|
|
|
·
|
Data Centers
. We currently have data centers in two locations. Our security environment entails an authentication and authorization system based on mainframe infrastructure, a secure internal network protected by a complex set of firewalls, continuous monitoring of incoming traffic and protection of work stations with anti-virus software. We are currently building a latest generation technology, research and data processing center, in the city of Campinas, State of São Paulo.
|
|
|
·
|
Data Communications
. Our data communications infrastructure has been upgraded to provide for faster broadband speeds at all of our branches.
|
|
|
·
|
Call Centers
. In addition to customer service, our call centers perform recovery and sales activities.
|
|
|
·
|
Branches/ATMs
. The integration of our retail operations was implemented in two steps. The first step, completed in February 2011, was the full integration of all clients and channels excluding cash management operations. The second step was the integration of cash management operations, which was completed in March 2011. In 2012, we expect to open 100 to 120 new branches and we expect to replace 4,000 ATMs (more than 20% of our total ATMs).
|
|
|
·
|
End-user systems
. We maintained the end-user systems, with the goal of standardizing hardware and operating systems at all workstations for all employees.
|
|
|
·
|
to contribute towards developing the future professional citizen giving the student, through practice in the community, the opportunity to work systematically with the knowledge acquired at the university;
|
|
|
·
|
to make the knowledge of the institution of higher education available to low-income communities , contributing towards improving their living conditions; and
|
|
|
·
|
to support university extension courses, encouraging knowledge sharing and integration into the community.
|
|
At December 31,
|
||||||||||||||||||||||||||||||||||||
|
2011
|
2010
|
2009
|
||||||||||||||||||||||||||||||||||
|
Average Balance
|
Interest
|
Average Rate
|
Average Balance
|
Interest
|
Average Rate
|
Average Balance
|
Interest
|
Average Rate
|
||||||||||||||||||||||||||||
|
(in millions of R$, except percentages)
|
||||||||||||||||||||||||||||||||||||
|
Assets and Interest Income
|
||||||||||||||||||||||||||||||||||||
|
Cash and balances with the Brazilian Central Bank
|
55,100 | 6,297 | 11.4 | % | 37,421 | 3,590 | 9.6 | % | 17,879 | 1,667 | 9.3 | % | ||||||||||||||||||||||||
|
Loans and amounts due from credit institutions
|
19,017 | 1,219 | 6.4 | % | 22,815 | 1,398 | 6.1 | % | 31,122 | 2,901 | 9.3 | % | ||||||||||||||||||||||||
|
Loans and advances to customers
|
163,046 | 35,398 | 21.7 | % | 137,046 | 29,290 | 21.4 | % | 126,712 | 29,470 | 23.3 | % | ||||||||||||||||||||||||
|
Debt instruments
|
68,770 | 8,084 | 11.8 | % | 57,830 | 6,442 | 11.1 | % | 45,530 | 5,202 | 11.4 | % | ||||||||||||||||||||||||
|
Other interest-earning assets
|
– | 738 | – | – | 189 | – | – | 103 | – | |||||||||||||||||||||||||||
|
Total interest-earning assets
|
305,934 | 51,736 | 16.9 | % | 255,112 | 40,909 | 16.0 | % | 221,243 | 39,343 | 17.8 | % | ||||||||||||||||||||||||
|
Equity instruments
|
17,324 | 94 | 0.5 | % | 19,684 | 52 | 0.3 | % | 7,746 | 30 | 0.4 | % | ||||||||||||||||||||||||
|
Investments in associates
|
402 | – | – | 421 | – | – | 506 | – | – | |||||||||||||||||||||||||||
|
Total earning assets
|
323,660 | 51,830 | 16.0 | % | 275,217 | 40,961 | 14.9 | % | 229,495 | 39,373 | 17.2 | % | ||||||||||||||||||||||||
|
At December 31,
|
||||||||||||||||||||||||||||||||||||
|
2011
|
2010
|
2009
|
||||||||||||||||||||||||||||||||||
|
Average Balance
|
Interest
|
Average Rate
|
Average Balance
|
Interest
|
Average Rate
|
Average Balance
|
Interest
|
Average Rate
|
||||||||||||||||||||||||||||
|
(in millions of R$, except percentages)
|
||||||||||||||||||||||||||||||||||||
|
Cash and balances with the Brazilian Central Bank
|
6,830 | – | – | 6,549 | – | – | 6,250 | – | – | |||||||||||||||||||||||||||
|
Loans and amounts due from credit institutions
|
3,082 | – | – | 1,064 | – | – | 3,152 | – | – | |||||||||||||||||||||||||||
|
Impairment losses
|
(10,359 | ) | – | – | (9,119 | ) | – | – | (8,765 | ) | – | – | ||||||||||||||||||||||||
|
Other assets
|
35,089 | – | – | 31,889 | – | – | 33,007 | – | – | |||||||||||||||||||||||||||
|
Tangible assets
|
4,647 | – | – | 4,025 | – | – | 3,690 | – | – | |||||||||||||||||||||||||||
|
Intangible assets
|
31,772 | – | – | 31,660 | – | – | 31,345 | – | – | |||||||||||||||||||||||||||
|
Total average assets
|
394,722 | 51,830 | 13.1 | % | 341,285 | 40,961 | 12.0 | % | 298,174 | 39,373 | 13.2 | % | ||||||||||||||||||||||||
|
Liabilities and Interest Expense
|
||||||||||||||||||||||||||||||||||||
|
Deposits from the Brazilian Central Bank and Deposits from credit institutions
|
41,670 | 2,006 | 4.8 | % | 35,274 | 1,147 | 3.3 | % | 22,319 | 1,208 | 5.4 | % | ||||||||||||||||||||||||
|
Customer deposits
|
161,159 | 16,494 | 10.2 | % | 139,825 | 12,774 | 9.1 | % | 139,917 | 13,164 | 9.4 | % | ||||||||||||||||||||||||
|
Marketable debt securities
|
31,330 | 3,227 | 10.3 | % | 13,404 | 1,213 | 9.0 | % | 11,420 | 1,048 | 9.2 | % | ||||||||||||||||||||||||
|
Subordinated liabilities
|
10,288 | 1,213 | 11.8 | % | 9,953 | 999 | 10.0 | % | 10,676 | 1,077 | 10.1 | % | ||||||||||||||||||||||||
|
Other interest-bearing liabilities
|
– | 893 | – | – | 682 | – | – | 679 | – | |||||||||||||||||||||||||||
|
Total interest-bearing liabilities
|
244,446 | 23,834 | 9.8 | % | 198,456 | 16,815 | 8.5 | % | 184,332 | 17,176 | 9.3 | % | ||||||||||||||||||||||||
|
Deposits from credit institutions
|
321 | – | – | 196 | – | – | 100 | – | – | |||||||||||||||||||||||||||
|
Customer deposits – demand deposits
|
13,648 | – | – | 14,287 | – | – | 13,000 | – | – | |||||||||||||||||||||||||||
|
Other liabilities
|
60,579 | – | – | 56,467 | – | – | 44,546 | – | – | |||||||||||||||||||||||||||
|
Non-controlling interests
|
11 | – | – | 4 | – | – | 4 | – | – | |||||||||||||||||||||||||||
|
Equity
|
75,716 | – | – | 71,875 | – | – | 56,192 | – | – | |||||||||||||||||||||||||||
|
Total average liabilities and equity
|
394,722 | 23,834 | 6.0 | % | 341,285 | 16,815 | 4.9 | % | 298,174 | 17,176 | 5.8 | % | ||||||||||||||||||||||||
|
For the years ended 2011/2010
|
For the years ended 2010/2009
|
|||||||||||||||||||||||
|
Increase (decrease) due to changes in
|
||||||||||||||||||||||||
|
Volume
|
Rate
|
Net change
|
Volume
|
Rate
|
Net change
|
|||||||||||||||||||
|
Interest and Similar Income
|
(In millions of R$)
|
|||||||||||||||||||||||
|
Interest-earning assets
|
||||||||||||||||||||||||
|
Cash and balances with the Brazilian Central Bank
|
1,927 | 781 | 2,708 | 1,873 | 50 | 1,923 | ||||||||||||||||||
|
Loans and amounts due from credit institutions
|
(241 | ) | 63 | (179 | ) | (658 | ) | (845 | ) | (1,503 | ) | |||||||||||||
|
Loans and advances to customers
|
5,638 | 470 | 6,108 | 2,306 | (2,485 | ) | (179 | ) | ||||||||||||||||
|
Debt instruments
|
1,271 | 371 | 1,642 | 1,373 | (133 | ) | 1,240 | |||||||||||||||||
|
Other interest-earning assets
|
549 | – | 549 | 86 | – | 86 | ||||||||||||||||||
|
Total interest-earning assets
|
9,143 | 1,684 | 10,827 | 4,980 | (3,413 | ) | 1,567 | |||||||||||||||||
|
Investments in associates
|
(7 | ) | 49 | 42 | 34 | (12 | ) | 22 | ||||||||||||||||
|
Total earning assets
|
9,136 | 1,733 | 10,869 | 5,014 | (3,425 | ) | 1,589 | |||||||||||||||||
|
For the years ended 2011/2010
|
For the years ended 2010/2009
|
|||||||||||||||||||||||
|
Increase (decrease) due to changes in
|
||||||||||||||||||||||||
|
Volume
|
Rate
|
Net change
|
Volume
|
Rate
|
Net change
|
|||||||||||||||||||
|
(in millions of R$)
|
||||||||||||||||||||||||
|
Interest Expense and Similar Charges
|
||||||||||||||||||||||||
|
Interest-bearing liabilities
|
||||||||||||||||||||||||
|
Deposits from the Brazilian Central Bank and Deposits from credit institutions
|
238 | 622 | 859 | 563 | (624 | ) | (61 | ) | ||||||||||||||||
|
Customer deposits
|
2,080 | 1,641 | 3,721 | (9 | ) | (382 | ) | (391 | ) | |||||||||||||||
|
Marketable debt securities
|
1,825 | 189 | 2,014 | 180 | (14 | ) | 166 | |||||||||||||||||
|
Subordinated liabilities
|
35 | 179 | 214 | (73 | ) | (4 | ) | (77 | ) | |||||||||||||||
|
Other interest-bearing liabilities
|
212 | – | 212 | 1 | – | 1 | ||||||||||||||||||
|
Total interest-bearing liabilities
|
4,390 | 2,631 | 7,020 | 662 | (1,024 | ) | (362 | ) | ||||||||||||||||
|
For the year ended December 31,
|
||||||||||||
|
2011
|
2010
|
2009
|
||||||||||
|
(in millions of R$, except percentages)
|
||||||||||||
|
Average earning assets
|
323,660 | 275,217 | 229,495 | |||||||||
|
Interest and dividends on equity securities
(1)
|
51,830 | 40,961 | 39,373 | |||||||||
|
Net interest income
|
27,902 | 24,095 | 22,167 | |||||||||
|
Gross yield
(2)
|
16.0 | % | 14.9 | % | 17.2 | % | ||||||
|
Net yield
(3)
|
8.6 | % | 8.8 | % | 9.7 | % | ||||||
|
Yield spread
(4)
|
6.3 | % | 6.4 | % | 7.8 | % | ||||||
|
(1)
|
Dividends on equity securities include dividends from companies accounted for by the equity method.
|
|
(2)
|
Gross yield is the quotient of interest and dividends on equity securities divided by average earning assets.
|
|
(3)
|
Net yield is the quotient of net interest income divided by average earning assets.
|
|
(4)
|
Yield spread is the difference between gross yield on earning assets and the average cost of interest-bearing liabilities.
|
|
For the year ended December 31,
|
||||||||||||
|
2011
|
2010
|
2009
|
||||||||||
|
ROA: Return on average total assets
|
2.0 | % | 2.2 | % | 1.8 | % | ||||||
|
ROE: Return on average shareholders’ equity
|
10.2 | % | 10.3 | % | 9.8 | % | ||||||
|
Average shareholders’ equity as a percentage of average total assets
|
19.2 | % | 21.1 | % | 18.8 | % | ||||||
|
Payout
(1)
|
41.0 | % | 47.9 | % | 26.8 | % | ||||||
|
(1)
|
Divided payout ratio (dividends declared per share divided by net income per share).
|
|
For the year ended December 31,
|
||||||||||||
|
2011
|
2010
|
2009
|
||||||||||
|
Cash and balances with the Brazilian Central Bank
|
18.0 | % | 14.7 | % | 8.1 | % | ||||||
|
Loans and amounts due from credit institutions
|
6.2 | % | 8.9 | % | 14.1 | % | ||||||
|
Loans and advances to customers
|
53.3 | % | 53.7 | % | 57.2 | % | ||||||
|
Debt instruments
|
22.5 | % | 22.7 | % | 20.6 | % | ||||||
|
Total interest-earning assets
|
100.0 | % | 100.0 | % | 100.0 | % | ||||||
|
At December 31,
|
||||||||||||
|
2011
|
2010
|
2009
|
||||||||||
|
(in millions of R$)
|
||||||||||||
|
Time deposits
|
7,136 | 9,110 | 9,945 | |||||||||
|
Reverse repurchase agreements
|
1,040 | 600 | 6,160 | |||||||||
|
Escrow deposits
|
6,869 | 7,317 | 6,192 | |||||||||
|
Cash and Foreign currency investments
|
4,247 | 5,827 | 3,493 | |||||||||
|
Other accounts
|
459 | 144 | 412 | |||||||||
|
Total
|
19,751 | 22,998 | 26,202 | |||||||||
|
At December 31,
|
||||||||||||
|
2011
|
2010
|
2009
|
||||||||||
|
(in millions of R$)
|
||||||||||||
|
Debt securities
|
||||||||||||
|
Government securities—Brazil
|
56,833 | 55,444 | 53,620 | |||||||||
|
Government securities—other countries
|
– | 379 | 366 | |||||||||
|
Other debt securities
|
12,058 | 6,433 | 3,554 | |||||||||
|
Total domestic
|
68,891 | 62,256 | 57,540 | |||||||||
|
Less-allowance for credit losses
|
– | – | (30 | ) | ||||||||
|
Total debt securities
|
68,891 | 62,256 | 57,510 | |||||||||
|
Equity securities
|
||||||||||||
|
Shares of Brazilian companies
|
1,002 | 1,153 | 1,471 | |||||||||
|
Shares of foreign companies
|
1 | 1 | 68 | |||||||||
|
Investment fund units and shares
(1)
|
1,128 | 21,282 | 16,453 | |||||||||
|
Total equity securities
|
2,131 | 22,436 | 17,992 | |||||||||
|
Total investment securities
|
71,022 | 84,692 | 75,502 | |||||||||
|
(1)
|
In 2010 and 2009, includes Investment fund units Guarantors of Benefit Plans—PGBL/VGBL, related to the liabilities for insurance contracts. For further details see Note 3a to our audited consolidated financial statements.
|
|
At December 31, 2011
|
||||||||||||||||||||||||
|
Maturing within 1 year
|
Maturing between 1 and 5 years
|
Maturing between 5 and 10 years
|
Maturing after 10 years
|
Total
|
Average Yield
|
|||||||||||||||||||
|
(in millions of R$)
|
||||||||||||||||||||||||
|
Debt Securities
|
||||||||||||||||||||||||
|
Government securities—Brazil
|
10,196 | 35,009 | 9,041 | 2,587 | 56,833 | 11.7 | % | |||||||||||||||||
|
Other debt securities
|
4,080 | 3,347 | 4,615 | 16 | 12,058 | 11.8 | % | |||||||||||||||||
|
Total debt investment securities
|
14,276 | 38,356 | 13,656 | 2,603 | 68,891 | 11.0 | % | |||||||||||||||||
|
At December 31,
|
||||||||||||||||||||
|
2011
|
2010
|
2009
|
2008
|
2007
|
||||||||||||||||
|
(in millions of R$)
|
||||||||||||||||||||
|
Commercial, financial and industrial
(1)
|
94,922 | 78,101 | 66,601 | 76,407 | 32,879 | |||||||||||||||
|
Real estate-construction
(2)
|
6,280 | 5,392 | 3,828 | 2,469 | 301 | |||||||||||||||
|
Real estate-mortgage
(3)
|
10,018 | 6,698 | 5,226 | 4,472 | 1,692 | |||||||||||||||
|
Installment loans to individuals
(4)
|
76,459 | 60,251 | 49,103 | 46,857 | 16,178 | |||||||||||||||
|
Lease financing
(5)
|
6,506 | 10,116 | 13,636 | 12,444 | 402 | |||||||||||||||
|
Loans and advances to customers, gross
(6)
|
194,184 | 160,558 | 138,394 | 142,649 | 51,452 | |||||||||||||||
|
Impairment losses
|
(11,118 | ) | (9,192 | ) | (10,070 | ) | (8,181 | ) | (2,249 | ) | ||||||||||
|
Loans and advances to customers, net
|
183,066 | 151,366 | 128,324 | 134,468 | 49,203 | |||||||||||||||
|
(1)
|
Includes primarily loans to small and medium-size businesses, or SMEs in our Commercial Banking segment, and to Global Banking & Markets, or GB&M, corporate and business enterprise customers in our Wholesale Global Banking segment. The principal products offered to SMEs in this category include revolving loans, overdraft facilities, installment loans, working capital and equipment finance loans. Credit approval for SMEs is based on customer income, business activity, collateral coverage and internal and external credit scoring tools. Collateral on commercial, financial and industrial lending to SMEs generally includes receivables, liens, pledges, guarantees and mortgages, with coverage generally ranging from 100% to 150% of the loan value depending on the risk profile of the loan. Our Wholesale Global Banking customers are offered a range of loan products ranging from typical corporate banking products (installment loans, working capital and equipment finance loans) to more sophisticated products (derivative and capital markets transactions). As Wholesale Global Banking customers tend to be larger businesses, credit approval is based on customer credit quality as evaluated by a specialized teams of risk analysts taking account of, among other things, business revenues and credit history of each customer. Underwriting policies for this category of loans to our Wholesale Global Banking customers are focused on the type of guarantee or collateral provided. Certain loans (BNDES products) are generally secured by liens on financed machinery and equipment, though guarantees may also be provided as additional security.
|
|
(2)
|
Includes construction loans made principally to real estate developers that are SMEs and corporate customers in our Wholesale Global Banking Segment. Credit approval is carried out by a specialized team of risk analysts which follows a specific set of underwriting standards and analysis of each customer based on, among other things, business revenues and credit history. Loans in this category are generally secured by mortgages and receivables, though guarantees may also be provided as additional security.
|
|
(3)
|
Includes loans on residential real estate to individuals. Credit approval policies in this category are determined by reference to the type of lending product being offered, the type and location of the real estate, the revenue or income of the business or customer, respectively, requesting the loan and internal and external credit scoring information. All loans granted under this category are secured by the financed real estate. Loan-to-value ratios for loans in this category are generally limited to 80% and the average loan to value ratio for new loans is approximately between 50% and 60%.
|
|
(4)
|
Consists primarily of unsecured personal installment loans (including loans the payments for which are automatically deducted from a customer’s payroll), revolving loans, overdraft facilities, consumer finance
|
|
(5)
|
Includes primarily automobile leases and loans to individuals. Credit approval is based both on an automatic scoring model using external credit scores and on evaluation by our branch personnel following our risk management policies. The vehicle financed acts as collateral for the particular loan granted.
|
|
(6)
|
Includes the debit balances (financial assets) of all the credit and loans granted by us, including money market operations through central counterparties, except for credit of any nature in the name of credit institutions or those represented by securities.
|
|
Maturity
|
||||||||||||||||||||||||||||||||
|
Less than one year
|
One to five years
|
Over five years
|
Total
|
|||||||||||||||||||||||||||||
|
Balance
|
% of Total
|
Balance
|
% of Total
|
Balance
|
% of Total
|
Balance
|
% of Total
|
|||||||||||||||||||||||||
|
(in millions of R$, except percentages)
|
||||||||||||||||||||||||||||||||
|
Commercial, financial and industrial
|
58,952 | 51.5 | % | 32,901 | 46.1 | % | 3,069 | 36.9 | % | 94,922 | 48.9 | % | ||||||||||||||||||||
|
Real estate
|
5,683 | 5.0 | % | 6,036 | 8.5 | % | 4,579 | 55.1 | % | 16,298 | 8.4 | % | ||||||||||||||||||||
|
Installment loans to individuals
|
46,200 | 40.4 | % | 29,600 | 41.4 | % | 658 | 8.0 | % | 76,459 | 39.4 | % | ||||||||||||||||||||
|
Lease financing
|
3,614 | 3.1 | % | 2,890 | 4.0 | % | 3 | 0.0 | % | 6,506 | 3.3 | % | ||||||||||||||||||||
|
Loans and advances to customers, gross
|
114,449 | 100.0 | % | 71,427 | 100.0 | % | 8,308 | 100 | % | 194,184 | 100.0 | % | ||||||||||||||||||||
|
Fixed and variable rate loans having a maturity of more than one year
|
||||
|
(in millions of R$)
|
||||
|
Fixed rate
|
50,824 | |||
|
Variable rate
|
28,912 | |||
|
Total
|
79,736 | |||
|
At December 31,
|
||||||||||||||||||||||||
|
2011
|
2010
|
2009
|
||||||||||||||||||||||
|
Balance
|
% of Total Assets
|
Balance
|
% of Total Assets
|
Balance
|
% of Total Assets
|
|||||||||||||||||||
|
(in millions of R$, except percentages)
|
||||||||||||||||||||||||
|
OECD countries
(1)
|
||||||||||||||||||||||||
|
Austria
|
366 | 0.1 | % | 379 | 0.1 | % | 571 | 0.2 | % | |||||||||||||||
|
Spain
|
256 | 0.1 | % | 954 | 0.3 | % | 1,289 | 0.4 | % | |||||||||||||||
|
United States
|
8,305 | 2.1 | % | 1,630 | 0.4 | % | 2,383 | 0.8 | % | |||||||||||||||
|
Netherlands
|
5,675 | 1.4 | % | 3,825 | 1.0 | % | – | – | ||||||||||||||||
|
Other OECD countries
(2)
|
583 | 0.1 | % | 227 | 0.1 | % | 673 | 0.2 | % | |||||||||||||||
|
Total OECD
|
15,186 | 3.8 | % | 7,015 | 1.9 | % | 4,916 | 1.6 | % | |||||||||||||||
|
Non-OECD countries
|
||||||||||||||||||||||||
|
Latin American countries
(2)
|
60 | – | 66 | – | 79 | – | ||||||||||||||||||
|
Cayman Islands
|
4,081 | 1.0 | % | 4,175 | 1.1 | % | 3,615 | 1.1 | % | |||||||||||||||
|
Other
(2)
|
354 | 0.1 | % | 135 | – | 258 | 0.1 | % | ||||||||||||||||
|
Total non-OECD
|
4,495 | 1.1 | % | 4,376 | 1.2 | % | 3,952 | 1.2 | % | |||||||||||||||
|
Total
|
19,681 | 4.9 | % | 11,391 | 3.0 | % | 8,868 | 2.8 | % | |||||||||||||||
|
(1)
|
The Organization for Economic Cooperation and Development.
|
|
(2)
|
Aggregate outstandings in any single country in this category do not exceed 0.75% of our total assets.
|
|
Government
|
Banks and Other Financial Institutions
|
Commercial and Industrial
|
Other Loans
|
Total
|
||||||||||||||||
|
(in millions of R$)
|
||||||||||||||||||||
|
2009
|
||||||||||||||||||||
|
United States
|
– | 2,239 | – | 144 | 2,383 | |||||||||||||||
|
Cayman Islands
|
496 | – | 3,075 | 44 | 3,615 | |||||||||||||||
|
Total
|
496 | 2,239 | 3,075 | 188 | 5,998 | |||||||||||||||
|
2010
|
||||||||||||||||||||
|
United States
|
– | 1,314 | – | 316 | 1,630 | |||||||||||||||
|
Netherlands
|
– | 120 | 3,705 | – | 3,825 | |||||||||||||||
|
Cayman Islands
|
542 | 12 | 3,621 | – | 4,175 | |||||||||||||||
|
Total
|
542 | 1,446 | 7,326 | 316 | 9,630 | |||||||||||||||
|
2011
|
||||||||||||||||||||
|
United States
|
– | 8,048 | 257 | – | 8,305 | |||||||||||||||
|
Netherlands
|
– | – | 5,675 | – | 5,675 | |||||||||||||||
|
Cayman Islands
|
– | – | 4,081 | – | 4,081 | |||||||||||||||
|
Total
|
– | 8,048 | 10,013 | – | 18,061 | |||||||||||||||
|
For the year ended December 31,
|
||||||||||||||||||||
|
2011
|
2010
|
2009
|
2008
|
2007
|
||||||||||||||||
|
|
(in millions of R$)
|
|||||||||||||||||||
|
Balance at beginning of year
|
9,192 | 10,070 | 8,181 | 2,249 | 2,170 | |||||||||||||||
|
Inclusion of entities in the Bank in the year
|
– | – | – | 4,717 | – | |||||||||||||||
|
Impairment losses charged to income for the year
|
11,191 | 9,051 | 10,520 | 4,534 | 2,474 | |||||||||||||||
|
Write-off of impaired balances against recorded impairment allowance
|
(9,203 | ) | (9,929 | ) | (8,631 | ) | (3,319 | ) | (2,395 | ) | ||||||||||
|
Balance at end of year
|
11,180 | 9,192 | 10,070 | 8,181 | 2,249 | |||||||||||||||
|
Of which:
|
||||||||||||||||||||
|
Loans and advances to customers
|
11,118 | 9,192 | 10,070 | 8,181 | 2,249 | |||||||||||||||
|
Loans and amounts due from credit institutions
|
62 | – | – | – | – | |||||||||||||||
|
For the year ended December 31,
|
||||||||||||||||||||
|
2011
|
2010
|
2009
|
2008
|
2007
|
||||||||||||||||
|
(in millions of R$)
|
||||||||||||||||||||
|
Recoveries of loans previously charged off
(1)
|
1,809 | 819 | 537 | 430 | 294 | |||||||||||||||
|
Commercial, financial and industrial
|
353 | 89 | 42 | 144 | 101 | |||||||||||||||
|
Real estate – mortgage
|
65 | 69 | 58 | 29 | 11 | |||||||||||||||
|
Installment loans to individuals
|
1,331 | 635 | 420 | 246 | 163 | |||||||||||||||
|
Lease finance
|
60 | 26 | 17 | 11 | 19 | |||||||||||||||
|
Acquired companies
|
– | – | – | 4,717 | – | |||||||||||||||
|
Commercial, financial and industrial
|
– | – | – | 1,988 | – | |||||||||||||||
|
Real estate – mortgage
|
– | – | – | 48 | – | |||||||||||||||
|
Installment loans to individuals
|
– | – | – | 2,610 | – | |||||||||||||||
|
Lease finance
|
– | – | – | 71 | – | |||||||||||||||
|
Impairment losses charged to income for the year
(1)
|
11,191 | 9,051 | 10,520 | 4,534 | 2,474 | |||||||||||||||
|
Commercial, financial and industrial
|
2,943 | 3,098 | 3,071 | 1,453 | 261 | |||||||||||||||
|
Real estate – mortgage
|
98 | 71 | 28 | 26 | 6 | |||||||||||||||
|
Installment loans to individuals
|
7,972 | 5,780 | 7,198 | 2,951 | 2,180 | |||||||||||||||
|
Lease finance
|
178 | 102 | 223 | 104 | 27 | |||||||||||||||
|
Write-off of impaired balances against recorded impairment losses
|
(9,203 | ) | (9,929 | ) | (8,631 | ) | (3,319 | ) | (2,395 | ) | ||||||||||
|
Commercial, financial and industrial
|
(2,470 | ) | (3,209 | ) | (3,073 | ) | (739 | ) | (310 | ) | ||||||||||
|
Real estate – mortgage
|
(36 | ) | (42 | ) | (31 | ) | (13 | ) | (7 | ) | ||||||||||
|
Installment loans to individuals
|
(6,484 | ) | (6,509 | ) | (5,377 | ) | (2,513 | ) | (2,028 | ) | ||||||||||
|
Lease finance
|
(212 | ) | (169 | ) | (150 | ) | (54 | ) | (50 | ) | ||||||||||
|
(1)
|
Impairment losses on financial assets, net, as reported in our consolidated financial statements, reflect net provisions for credit losses less recoveries of loans previously charged off.
|
|
At December 31,
|
||||||||||||||||||||||||
|
2011
|
% of total loans
|
2010
|
% of total loans
|
2009
|
% of total loans
|
|||||||||||||||||||
|
(in millions of R$, except percentages)
|
||||||||||||||||||||||||
|
Borrowers
|
||||||||||||||||||||||||
|
Commercial, financial and industrial
|
3,748 | 52.1 | % | 3,274 | 52.0 | % | 3,386 | 50.9 | % | |||||||||||||||
|
Mortgage loans
|
180 | 5.2 | % | 119 | 4.2 | % | 90 | 3.8 | % | |||||||||||||||
|
Installment loans to individuals
|
7,096 | 39.4 | % | 5,608 | 37.5 | % | 6,336 | 35.5 | % | |||||||||||||||
|
Lease financing
|
157 | 3.3 | % | 191 | 6.3 | % | 258 | 9.9 | % | |||||||||||||||
|
Total
|
11,180 | 100.0 | % | 9,192 | 100.0 | % | 10,070 | 100.0 | % | |||||||||||||||
|
At December 31,
|
||||||||||||||||||||
|
2011
|
2010
|
2009
|
2008
|
2007
|
||||||||||||||||
|
(in millions of R$, except percentages)
|
||||||||||||||||||||
|
Non-performing assets
|
||||||||||||||||||||
|
Past-due and other non-performing assets
(1)
|
13,073 | 9,348 | 9,899 | 7,730 | 2,093 | |||||||||||||||
|
Non-performing assets as a percentage of total loans
|
6.7 | % | 5.8 | % | 7.2 | % | 5.4 | % | 4.1 | % | ||||||||||
|
Net loan charge-offs as a percentage of total loans
|
4.7 | % | 6.2 | % | 6.2 | % | 2.3 | % | 4.7 | % | ||||||||||
|
(1)
|
Includes at December 31, 2011, R$689 million of doubtful loans (2010 – R$927 million, 2009 - R$484 million, 2008 - R$1,260 million and 2007 - R$66 million) that were not past-due and therefore were accounted for on an accrual basis. The amount of interest owed on non-accruing assets that would have been recorded had such assets accrued interest in the year ended December 31, 2011 would have been R$2,769 million, in the year ended December 31, 2010 would have been R$2,049 million, in the year ended December 31, 2009 would have been R$2,005 million and the year ended December 31, 2008 would have been R$658 million. No loan that was more than 60 days past due was accounted for on an accrual basis.
|
|
As of December 31,
|
||||||||||||||||||||
|
2011
|
2010
|
2009
|
2008
|
2007
|
||||||||||||||||
|
(in millions of R$)
|
||||||||||||||||||||
|
Balance at beginning of year
|
9,348 | 9,899 | 7,730 | 2,093 | 2,010 | |||||||||||||||
|
Net additions
|
12,927 | 9,378 | 10,800 | 5,035 | 2,478 | |||||||||||||||
|
Write-offs
|
(9,203 | ) | (9,929 | ) | (8,631 | ) | (3,319 | ) | (2,395 | ) | ||||||||||
|
Increase in scope of consolidation
|
– | – | – | 3,921 | – | |||||||||||||||
|
Balance at end of year
|
13,073 | 9,348 | 9,899 | 7,730 | 2,093 | |||||||||||||||
|
At December 31,
|
||||||||||||||||||||
|
2011
|
2010
|
2009
|
2008
|
2007
|
||||||||||||||||
|
(in millions of R$)
|
||||||||||||||||||||
|
Impaired assets
|
||||||||||||||||||||
|
Commercial, financial and industrial
|
4,775 | 3,563 | 3,618 | 2,730 | 502 | |||||||||||||||
|
Real estate – mortgage
|
172 | 150 | 109 | 74 | 23 | |||||||||||||||
|
Installment loans to individuals
|
7,720 | 4,863 | 5,335 | 4,528 | 1,558 | |||||||||||||||
|
Lease financing
|
406 | 772 | 837 | 398 | 10 | |||||||||||||||
|
Total
|
13,073 | 9,348 | 9,899 | 7,730 | 2,093 | |||||||||||||||
|
At December 31,
|
||||||||||||||||||||
|
2011
|
2010
|
2009
|
2008
|
2007
|
||||||||||||||||
|
(in millions of R$, except percentages)
|
||||||||||||||||||||
|
Computable credit risk
(1)
|
216,756 | 183,121 | 159,362 | 164,695 | 64,558 | |||||||||||||||
|
Non-performing assets
|
13,073 | 9,348 | 9,899 | 7,730 | 2,093 | |||||||||||||||
|
Allowances for credit losses
|
11,180 | 9,192 | 10,070 | 8,181 | 2,249 | |||||||||||||||
|
Ratios
|
||||||||||||||||||||
|
Non-performing assets to computable credit risk
|
6.0 | % | 5.1 | % | 6.2 | % | 4.7 | % | 3.2 | % | ||||||||||
|
Coverage ratio
(2)
|
85.5 | % | 98.3 | % | 101.7 | % | 105.8 | % | 107.5 | % | ||||||||||
|
(1)
|
Computable credit risk is the sum of the face amounts of loans and leases (including non-performing assets but excluding country risk loans), guarantees and documentary credits.
|
|
(2)
|
Allowances for non-performing assets as a percentage of non-performing assets.
|
|
At December 31,
|
||||||||||||
|
2011
|
2010
|
2009
|
||||||||||
|
(in millions of R$, except percentages)
|
||||||||||||
|
Balance at beginning of year
|
168 | 356 | 291 | |||||||||
|
Foreclosures loans and other assets transferred
(1)
|
24,875 | 38 | 229 | |||||||||
|
Disposals
(1)
|
(24,820 | ) | (226 | ) | (183 | ) | ||||||
|
Acquired companies
|
– | – | 19 | |||||||||
|
Final balance, gross
|
223 | 168 | 356 | |||||||||
|
Impairment losses
|
(91 | ) | (101 | ) | (184 | ) | ||||||
|
Impairment as a percentage of foreclosed assets
|
40.8 | % | 60.1 | % | 51.7 | % | ||||||
|
Balance at end of year
|
132 | 67 | 172 | |||||||||
|
(1)
|
In 2011, includes R$24.7 billion of assets of Santander Seguros. Additionally, in 2011 we sold R$22.3 billion of liabilities that were associated with non-current assets held for sale of Santander Seguros. For further details see Note 3.a to our audited consolidated financial statements.
|
|
At December 31,
|
||||||||||||
|
2011
|
2010
|
2009
|
||||||||||
|
(in millions of R$)
|
||||||||||||
|
Deposits from central banks and credit institutions
|
||||||||||||
|
Time deposits
|
27,023 | 28,867 | 20,838 | |||||||||
|
Demand deposits
|
133 | 344 | 195 | |||||||||
|
Repurchase agreements
|
24,371 | 13,180 | 164 | |||||||||
|
Total
|
51,527 | 42,391 | 21,197 | |||||||||
|
Customer deposits
|
||||||||||||
|
Current accounts
|
13,561 | 16,132 | 15,140 | |||||||||
|
Savings accounts
|
23,293 | 30,303 | 25,216 | |||||||||
|
Time deposits
|
83,942 | 68,916 | 74,634 | |||||||||
|
Repurchase agreements
|
53,678 | 52,598 | 34,450 | |||||||||
|
Total
|
174,474 | 167,949 | 149,440 | |||||||||
|
Total deposits
|
226,001 | 210,340 | 170,637 | |||||||||
|
At December 31, 2011
|
||||||||
|
Domestic
|
International
|
|||||||
|
(in millions of R$)
|
||||||||
|
Under 3 months
|
9,822 | 2,545 | ||||||
|
3 to 6 months
|
766 | 21 | ||||||
|
6 to 12 months
|
2,259 | 853 | ||||||
|
Over 12 months
|
19,059 | 19 | ||||||
|
Total
|
31,906 | 3,438 | ||||||
|
As of December 31,
|
||||||||||||||||||||||||
|
2011
|
2010
|
2009
|
||||||||||||||||||||||
|
Amount
|
Average Rate
|
Amount
|
Average Rate
|
Amount
|
Average Rate
|
|||||||||||||||||||
|
(in millions of R$, except percentages)
|
||||||||||||||||||||||||
|
Securities sold under agreements to repurchase
|
||||||||||||||||||||||||
|
At December 31
|
78,048 | 10.9 | % | 65,778 | 9.8 | % | 34,614 | 9.9 | % | |||||||||||||||
|
Average during the period
|
64,510 | 11.9 | % | 53,623 | 10.3 | % | 32,493 | 11.5 | % | |||||||||||||||
|
Maximum month-end balance
|
76,693 | 68,734 | 37,214 | |||||||||||||||||||||
|
Total short-term borrowings at year end
|
78,048 | 65,778 | 34,614 | |||||||||||||||||||||
|
|
·
|
Banco do Brasil
, a multi service bank offering a wide range of banking products to both the public and private sectors, and the Brazilian government’s main financial agent;
|
|
|
·
|
Caixa Econômica Federal
, the federal savings bank, a multi service bank involved mainly in taking deposits, providing home loans and financing urban infrastructure projects; and
|
|
|
·
|
BNDES
, which offers medium and long term financing to the Brazilian private sector, particularly the industrial sector. BNDES offers financing directly and indirectly through on-lending to other financial institutions in the public and private sectors.
|
|
|
·
|
full service banks, which are licensed to provide a full range of commercial and investment banking, including distributing and trading securities, consumer finance and other services;
|
|
|
·
|
commercial banks, which are primarily engaged in wholesale and retail banking, some of which have relevant regional distribution networks or significant participation in specific niche markets. They are particularly active in accepting demand and time deposits as well as providing working capital loans; and
|
|
|
·
|
investment banks, which are primarily engaged in underwriting securities and structuring transactions.
|
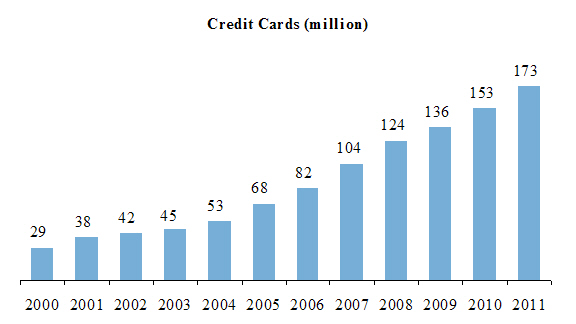
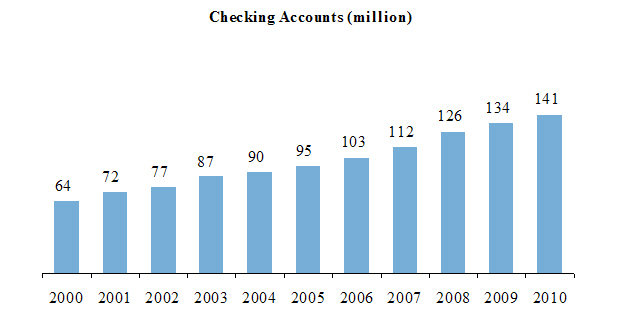
|
2011
|
2010
|
2009
|
||||||||||
|
(in Billions of Reais)
|
||||||||||||
|
Total Credit Outstanding
|
2,030 | 1,706 | 1,414 | |||||||||
|
Earmarked credit
(1)
|
727 | 590 | 460 | |||||||||
|
Market based credit
|
1,303 | 1,116 | 955 | |||||||||
|
of which:
|
||||||||||||
|
corporate
|
651 | 556 | 485 | |||||||||
|
individuals (retail)
|
652 | 560 | 470 | |||||||||
|
(1)
|
Includes loans that are subject to government controlled interest rates and the funding of which are targeted toward specific programs or industries as mandated by rule (for example, BNDES loans).
|
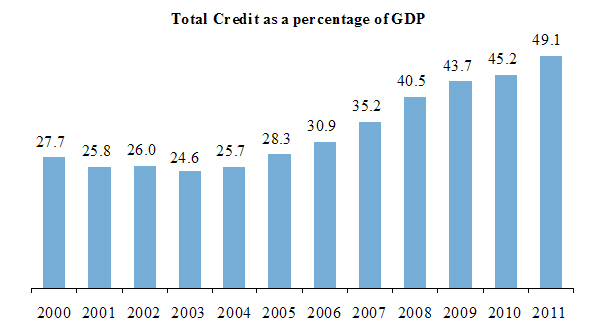
|
2011
|
2010
|
2009
|
% Change (2011 vs. 2010)
|
|||||||||||||
|
(in billions of R$, except percentages)
|
||||||||||||||||
|
Overdraft Accounts
|
18.9 | 16.3 | 15.8 | 16.5 | % | |||||||||||
|
Personal Credit
|
244.1 | 204.9 | 164.3 | 19.1 | % | |||||||||||
|
Credit Card
|
35.7 | 29.2 | 25.7 | 22.2 | % | |||||||||||
|
Mortgage Financing
|
13.9 | 7.4 | 4.5 | 89.4 | % | |||||||||||
|
Consumer Goods (excluding autos)
|
9.4 | 10.4 | 9.4 | (9.5 | %) | |||||||||||
|
Autos
|
172.9 | 140.3 | 94.1 | 23.2 | % | |||||||||||
|
Leasing
|
27.7 | 45.6 | 63.2 | (39.3 | %) | |||||||||||
|
Others
|
129.4 | 106.0 | 92.9 | 22.0 | % | |||||||||||
|
Total
|
652.0 | 560.0 | 469.9 | 16.4 | % | |||||||||||
|
|
·
|
tax incentives and exemptions;
|
|
|
·
|
increasing house builders’ security by offering guarantees on properties; and
|
|
|
·
|
increasing home buyers’ security through a special tax system that separates the house builders’ assets from the specific building projects’ assets; and simplifying and intensifying the enforcement of foreclosure laws.
|
|
|
·
|
economic stability in Brazil and increased disposable income and savings;
|
|
|
·
|
expansion of the insurance and private pension markets influenced, in part, by the growth of products such as private pension plans (for example, both VGBL and PGBL) whose assets increased the volume of assets under management of the Brazilian mutual fund industry;
|
|
|
·
|
improved credit ratings of Brazilian issuers;
|
|
|
·
|
increased access to financial products offered over the internet;
|
|
|
·
|
refinements to Brazilian mutual fund regulations; and
|
|
|
·
|
improved conditions in the Brazilian capital markets.
|
|
Based on Data Available
|
||||||||||||||||
|
Santander Brasil
|
Bradesco
|
Itaú Unibanco
|
Banco do Brasil
|
|||||||||||||
|
(In percentages)
|
||||||||||||||||
|
Total assets
(1)
|
8.4 | 12.6 | 16.1 | 18.0 | ||||||||||||
|
Total loans
(2)
|
10.5 | 14.2 | 18.7 | 20.5 | ||||||||||||
|
Total deposits
(2)
|
7.8 | 14.8 | 15.7 | 26.6 | ||||||||||||
|
Demand
(2)
|
7.0 | 17.7 | 17.4 | 31.5 | ||||||||||||
|
Saving
(2)
|
6.5 | 13.8 | 15.4 | 23.3 | ||||||||||||
|
Time
(2)
|
8.7 | 14.7 | 15.4 | 27.0 | ||||||||||||
|
Mutual funds
(3)
|
6.7 | 17.0 | 17.2 | 21.6 | ||||||||||||
|
Retail
(3)
|
13.5 | 12.5 | 19.4 | 24.7 | ||||||||||||
|
(1)
|
According to the Brazilian Central Bank’s report of the 50 largest banks in Brazil (September 2011).
|
|
(2)
|
According to the Brazilian Central Bank, reported and presented in accordance with Brazilian GAAP (November 2011).
|
|
(3)
|
According to ANBIMA (December, 2011).
|
|
|
·
|
Banco do Brasil
, which is a federal government-controlled bank and provides a full range of banking products to the public and private sectors. Banco do Brasil is the primary financial agent of the federal government.
|
|
|
·
|
BNDES
, which is the federal government-controlled development bank, primarily engaged in the provision of medium- and long-term finance to the Brazilian private sector, particularly to industry, either directly or indirectly, through other public and private-sector financial institutions.
|
|
|
·
|
Caixa Econômica Federal
, which is the federal government-controlled multiple-service bank and the principal agent of the National Housing Finance System. Caixa Econômica Federal is involved principally in deposit-taking and the provision of finance for housing and urban infrastructure.
|
|
|
·
|
Other public sector development and multiple-service banks, including those controlled by the various state governments.
|
|
|
·
|
Commercial banks
— 21 commercial banks operated in Brazil, engaged mainly in wholesale and retail banking and particularly in taking demand deposits and lending for working capital purposes.
|
|
|
·
|
Investment banks
— 14 investment banks operated in Brazil, engaged primarily in taking time deposits, specialized lending and securities underwriting and trading.
|
|
|
·
|
Bancos Múltiplos (Multiple-service banks)
— 139 multiple-service banks operated in Brazil providing, through a full range of commercial banking, investment banking (including securities underwriting and trading), consumer financing and other services including fund management and real estate finance pursuant to CMN Resolution No. 2,099 of August 17, 1994, as amended. Certain public sector banks such as Caixa Econômica Federal are also multiple-service banks.
|
|
|
·
|
In addition to the institutions mentioned above, the Brazilian Central Bank also supervises the operations of consumer credit companies
(financeiras)
, securities dealers
(distribuidoras de títulos e valores mobiliários)
, stock brokerage companies (
corretoras de valores
), leasing companies
(sociedades de arrendamento mercantil)
, savings and credit associations (
associações de poupança e empréstimo
) and real estate credit companies
(sociedades de crédito imobiliário)
.
|
|
|
·
|
No financial, banking or credit institution may operate in Brazil without the prior approval of the Brazilian Central Bank. In addition, foreign banks, in order to operate in Brazil, must be expressly authorized to do so by Presidential decrees.
|
|
|
·
|
A financial, banking or credit institution may not invest in the equity of any other company except where such investment receives Brazilian Central Bank approval based upon certain standards established by the CMN. Such investments may, however, be made without restriction through the investment banking unit of a multiple-service bank or through an investment bank subsidiary.
|
|
|
·
|
A financial, banking or credit institution may not own real estate, except where it occupies such property and subject to certain limitations imposed by the CMN. If a financial, banking or credit institution receives
real estate in satisfaction of a debt, such property must be sold within one year, unless otherwise authorized by the Brazilian Central Bank.
|
|
|
·
|
Financial institutions are prohibited from carrying out transactions that fail to comply with the principles of selectivity, guarantee, liquidity and risk diversification.
|
|
|
·
|
Financial institutions are prohibited from granting loans or advances without constituting an appropriate deed representing such debt.
|
|
|
·
|
A financial, banking or credit institution may not lend more than 25.0% of its net worth to any single person or group.
|
|
|
·
|
A financial, banking or credit institution may not grant loans to or guarantee transactions of any company in which it holds more than 10.0% of the share capital.
|
|
|
·
|
A financial, banking or credit institution may not grant loans to or guarantee transactions of its executive officers and directors (including the immediate and extended families of executive officers and directors) or to any company in which executive officers and directors (including the immediate and extended families of executive officers and directors) hold more than 10.0% of the share capital.
|
|
|
·
|
Financial institutions are prohibited from carrying out conditional operations, namely those involving assets that are sold or purchased based on the occurrence of a number of specific conditions, in excess of an amount corresponding to thirty times their reference assets.
|
|
|
·
|
The administration of third-party funds should be segregated from other activities and in compliance with the relevant rules imposed by the CVM.
|
|
|
·
|
The registered capital and total net assets of financial institutions should always be compatible with the rules governing share capital and minimum capitalization imposed by the Brazilian Central Bank for each type of financial institution.
|
|
|
·
|
The total amount of funds applied in the fixed assets of financial institutions cannot exceed 50.0% of the respective amount of reference assets.
|
|
|
·
|
Financial institutions may not expose themselves to gold, assets or liabilities referenced in currency exchange variations in excess of 30.0% of their reference equity, pursuant to CMN Resolution No. 3,488, dated August 29, 2007.
|
|
|
·
|
Financial institutions are subject to anti-money laundering regulations.
|
|
|
·
|
the CMN;
|
|
|
·
|
the Brazilian Central Bank; and
|
|
|
·
|
the CVM.
|
|
|
·
|
SUSEP;
|
|
|
·
|
CNSP; and
|
|
|
·
|
The Complementary Pension Secretariat
(Superintendência Nacional de Previdência Complementar-Previc)
.
|
|
|
·
|
coordinating monetary, credit, budget, tax and public debt policies;
|
|
|
·
|
establishing foreign exchange and interest rate policies;
|
|
|
·
|
protecting the liquidity and solvency of financial institutions;
|
|
|
·
|
overseeing activities related to the stock exchange markets;
|
|
|
·
|
regulating the constitution and operation of financial institutions;
|
|
|
·
|
granting authority to the Brazilian Central Bank to issue currency and establishing reserve requirement levels; and
|
|
|
·
|
establishing general directives for banking and financial markets.
|
|
|
·
|
managing the day-to-day control over foreign capital flow in and out of Brazil (risk capital and loans in any form);
|
|
|
·
|
setting forth the administrative rules and regulations for registering investments;
|
|
|
·
|
monitoring foreign currency remittances;
|
|
|
·
|
allowing repatriation of funds. In the event of a serious deficit in Brazilian balance of payment, the Brazilian Central Bank may limit profit remittances and prohibit remittances as capital repatriation for a limited period of time;
|
|
|
·
|
receiving compulsory withholdings and voluntary demand deposits from financial institutions;
|
|
|
·
|
executing rediscount transactions and loans to banking financial institutions and other institutions authorized to operate by the Brazilian Central Bank;
|
|
|
·
|
acting as a depository of gold and foreign currency reserves; and
|
|
|
·
|
controlling and approving the incorporation, functioning, transfer of control and equity reorganization of financial institutions and other institutions authorized to operate by the Brazilian Central Bank.
|
|
|
·
|
implementing and regulating the securities and exchange policies established by the CMN; and
|
|
|
·
|
controlling and supervising the Brazilian securities market by:
|
|
|
–
|
approving, suspending and canceling the registration of public companies, the authorization for brokers and dealers to operate in the securities market and public offerings of securities;
|
|
|
–
|
supervising the activities of public companies, stock exchanges, commodities and futures exchanges, market members, and financial investment funds and variable income funds;
|
|
|
–
|
requiring full disclosure of material events affecting the market, as well as annual and quarterly reporting by public companies; and
|
|
|
–
|
imposing penalties.
|
|
|
·
|
approving all corporate documents of a financial institution, any amendments thereto, any increase in capital, the setting up or transfer of its main location of business or any branch (whether in Brazil or abroad) and changes of control and equity reorganization;
|
|
|
·
|
determining the minimum capital requirements, compulsory deposit requirements and operational limits of financial institutions;
|
|
|
·
|
overseeing the filing by financial institutions of annual and semi-annual financial statements audited by independent auditors, formal audit opinions and monthly unaudited financial statements prepared in compliance with the standard accounting rules established by the Brazilian Central Bank for each type of financial institution;
|
|
|
·
|
requiring financial institutions to make full disclosure of credit transactions, foreign exchange transactions, destination of proceeds raised from export and import transactions and any other related economic activity on a daily basis through computer systems and written reports and statements; and
|
|
|
·
|
approving the election of the members of statutory bodies of a financial institution.
|
|
Parameters
|
January 1, 2013
|
January 1, 2014
|
January 1, 2015
|
January 1, 2016
|
January 1, 2017
|
January 1, 2018
|
As from January 1, 2019
|
|||||||||||||||||||||
|
Common Equity
|
4.5 | % | 4.5 | % | 4.5 | % | 4.5 | % | 4.5 | % | 4.5 | % | 4.5 | % | ||||||||||||||
|
Tier I
|
5.5 | % | 5.5 | % | 6.0 | % | 6.0 | % | 6.0 | % | 6.0 | % | 6.0 | % | ||||||||||||||
|
Regulatory Capital
|
11.0 | % | 11.0 | % | 11.0 | % | 9.9 | % | 9.3 | % | 8.6 | % | 8.0 | % | ||||||||||||||
|
Conservative Capital
|
– | – | – | 0.6 | % | 1.3 | % | 1.9 | % | 2.5 | % | |||||||||||||||||
|
Countercyclical Capital
|
– |
Up to
0.6
|
% |
Up to
1.3
|
% |
Up to
1.9
|
% |
Up to
2.5
|
% |
Up to
2.5
|
% |
Up to
2.5
|
% | |||||||||||||||
|
|
·
|
imposes a minimum capital requirement of 11.0% instead of 8.0% as defined by the Basel Accord;
|
|
|
·
|
requires an additional amount of capital with respect to off-balance sheet interest rate and foreign currency swap operations;
|
|
|
·
|
assigns different risk weighting and credit conversion factors to some assets, including a risk weighting of 300% on deferred tax assets other than temporary differences;
|
|
|
·
|
requires calculation and report on minimum capital requirements and capital ratios on a consolidated basis;
|
|
|
·
|
requires banks to set aside a portion of their equity to cover operational risks as of July 1, 2008. The required portion of the equity varies from 12.0% to 18.0% of average gross income amounts from financial intermediation. Circular No. 3,476 of December 24, 2009 establishes a formula to calculate the operational risk of non-financial institutions which are part of the bank;
|
|
|
·
|
does not allow the use of external rating to calculate the minimum capital required. The Brazilian Central Bank adopts a conservative approach to defining the capital demand of corporate exposures; and
|
|
|
·
|
requires banks to establish specific internal structures to identify, measure, control and mitigate operational and credit risks.
|
|
|
·
|
Tier I
: Corresponds to the core capital comprised of equity capital and net profits minus (1) expense accounts, (2) revaluation reserves, (3) contingency reserves, (4) non-distributed dividends reserves, (5) preferred cumulative stock and preferred redeemable stock, (6) specific deferred tax assets, (7) unrealized gain and losses of financial instruments recorded as equity, and (8) specific deferred assets.
|
|
|
·
|
Tier II
: Consists of revaluation reserves, contingency reserves, non-distributed dividends reserves, hybrid debt capital instruments, subordinated term debt, unrealized gain and losses of financial instruments recorded as equity, preferred cumulative stock and preferred redeemable stock issued by financial institutions.
|
|
|
·
|
subordinated debt in Tier II capital, plus the amount of preferred redeemable stock originally maturing in less than ten years, cannot exceed 50.0% of the Tier I capital;
|
|
|
·
|
revaluation reserves in Tier II capital cannot exceed 25.0% of the Tier I capital; and
|
|
|
·
|
a 20.0% to 100.0% reduction shall be applied to the amount of the subordinated debt and preferred redeemable stock in Tier II capital annually for the five years preceding the respective maturities.
|
|
|
·
|
Increases in the rate for demand deposit reserve requirements from 42.0% by July 2010 to a rate of 43.0% from July 2010 to July 2012, 44.0% from July 2012 to July 2014 and 45.0% as of July 2014;
|
|
|
·
|
Increases in the additional rate for demand and time deposit reserve requirements from 8.0% to 12.0% (for savings deposits the rate was maintained at 10.0%);
|
|
|
·
|
Limitation on deductibility from the additional rate for demand, savings and time deposit reserve requirements for financial institutions with consolidated Tier 1 Capital of (1) less than R$2 billion has been increased to R$3 billion, (2) equal to or greater than R$2 billion and less than R$5 billion has been increased from R$1.5 billion to R$2 billion, (3) equal to or greater than R$5 billion and less than R$15 billion has been set at R$1 billion, and (4) greater than R$15 billion has been established at zero;
|
|
|
·
|
Increase in the reserve requirement for time deposits from 15.0% to 20.0%;
|
|
|
·
|
Limitation on deductibility from time deposit reserve requirements for financial institutions with consolidated Tier 1 Capital of (i) less than R$2 billion has been increased from R$2 billion to R$3 billion, (ii) equal to or greater than R$2 billion and less than R$5 billion has been increased from R$1.5 billion to R$2 billion, (iii) greater than R$5 billion and less than R$15 billion has been set at R$1 billion, and (iv) greater than R$15 billion has been established at zero;
|
|
|
·
|
Financial bills issued by financial institutions have been exempted from reserve requirements; and
|
|
|
·
|
Creation of a cash reserve requirement for independent financial institutions with foreign exchange operations, corresponding to 60.0% of the assessment base over the average amount calculated based on the daily short position taken in foreign currencies in excess of the lower of (1) U.S.$1 billion or (2) the Tier I regulatory capital of the financial institution. On October 24, 2008, pursuant to Circular No. 3,416, the Brazilian Central Bank enacted regulations permitting financial institutions to deduct the amount of voluntary installments of the ordinary contribution to the FGC from compulsory demand deposits.
|
|
Product
|
December 31, 2010
|
As of December 31, 2011
|
Form of Required Reserve
|
Yield
|
||||||||
|
Demand deposits
|
||||||||||||
|
Rural credit loans
(1)
|
29 | % | 28 | % |
Loans and Cash
|
6.75% p.a. and Zero for Cash
|
||||||
|
Microcredit loans
(2)
|
2 | % | 2 | % |
Loans and Cash
|
Cap rate: 2% p.m. and Zero for Cash
|
||||||
|
Reserve requirements
|
43 | % | 43 | % |
Cash
|
Zero
|
||||||
|
Additional reserve requirements
|
12 | % | 12 | % |
Cash
|
SELIC
|
||||||
|
Free funding
(3)
|
14 | % | 15 | % | ||||||||
|
Savings accounts
|
||||||||||||
|
Mortgage loans
|
65 | % | 65 | % |
Loans and Cash
|
Cap of TR + 12% p.a. and TR + 6.17% for Cash
|
||||||
|
Reserve requirements
|
20 | % | 20 | % |
Cash
|
TR + 6.17% p.a.
|
||||||
|
Additional reserve requirements
|
10 | % | 10 | % |
Cash
|
SELIC
|
||||||
|
Free funding
(3)
|
5 | % | 5 | % | ||||||||
|
Time deposits
|
||||||||||||
|
Reserve requirements
|
20.0 | % | 20.0 | % | ||||||||
|
In cash or credit
(4)
|
7.2 | % | 7.2 | % |
Cash or Credit
|
SELIC for Cash
|
||||||
|
In cash
|
12.8 | % | 12.8 | % |
Cash
|
SELIC
|
||||||
|
Additional reserve requirements
|
12 | % | 12 | % |
Cash
|
SELIC
|
||||||
|
Free funding
(3)
|
68.0 | % | 68.0 | % | ||||||||
|
(1)
|
Rural credit loans are loans to agricultural customers, of which R$4.3 billion and R$4.9 billion were outstanding as of December 31, 2011 and December 31, 2010, respectively. On July 01, 2011, there was a reduction in the interest rate of 29% to 28%, which had been expected pursuant to CMN Resolution No. 3,746 dated as of June 30, 2009. This rate will continue to decrease in coming years to 27% on July 07, 2012 and 26% on July 7, 2013.
|
|
(2)
|
Microcredit loans are loans to very small businesses, of which R$209.8 million and R$216.1 million were outstanding as of December 31, 2011 and December 31, 2010, respectively.
|
|
(3)
|
Free funding is the amount of each category of funding we are free to use for any purpose.
|
|
(4)
|
Includes only credit acquired up to December 31, 2011 from financial institutions having net capital of less than R$2.5 billion.
|
|
|
·
|
monthly, in the event of a delay in the payment of any installment of principal or interest, in accordance with the following maximum risk classifications:
|
|
|
(1)
|
1 to 14 days overdue: risk level A;
|
|
|
(2)
|
15 to 30 days overdue: risk level B;
|
|
|
(3)
|
31 to 60 days overdue: risk level C;
|
|
|
(4)
|
61 to 90 days overdue: risk level D;
|
|
|
(5)
|
91 to 120 days overdue: risk level E;
|
|
|
(6)
|
121 to 150 days overdue: risk level F;
|
|
|
(7)
|
151 to 180 days overdue: risk level G; and
|
|
|
(8)
|
more than 180 days overdue: risk level H;
|
|
|
·
|
every six months, in the case of transactions involving the same customer, economic group or group of companies, the amount of which exceeds 5.0% of the adjusted net worth of the financial institution in question; and
|
|
|
·
|
once every twelve months, in all circumstances, except in the case of credit transactions with a customer whose total liability is lower than R$50 thousand, the classification of which may be reviewed as provided in above. Such R$50 thousand limit may be amended by the Brazilian Central Bank from time to time.
|
|
|
·
|
0.5% of the total amount of credit transactions classified as level A;
|
|
|
·
|
1.0% of the total amount of credit transactions classified as level B;
|
|
|
·
|
3.0% of the total amount of credit transactions classified as level C;
|
|
|
·
|
10.0% of the total amount of credit transactions classified as level D;
|
|
|
·
|
30.0% of the total amount of credit transactions classified as level E;
|
|
|
·
|
50.0% of the total amount of credit transactions classified as level F;
|
|
|
·
|
70.0% of the total amount of credit transactions classified as level G; and
|
|
|
·
|
100.0% of the total amount of credit transactions classified as level H.
|
|
|
·
|
their financial, operational and management information systems; and
|
|
|
·
|
their compliance with all applicable regulations.
|
|
|
·
|
the existence of two main payment and settlement systems: real time gross settlements, using the reserves deposited with the Brazilian Central Bank; and deferred net settlements, through the clearinghouses;
|
|
|
·
|
the clearinghouses, with some exceptions, will be liable for the payment orders they accept; and
|
|
|
·
|
bankruptcy laws do not affect the payment orders made through the credits of clearinghouses nor the collateral granted to secure those orders. However, clearinghouses have ordinary credits against any participant under bankruptcy laws.
|
|
|
·
|
due to mismanagement, the financial institution has suffered losses leaving creditors at risk;
|
|
|
·
|
the financial institution has consistently violated Brazilian banking laws or regulations; or
|
|
|
·
|
intervention is a feasible alternative to the liquidation of the financial institution.
|
|
|
·
|
the institution’s economic or financial situation is at risk, particularly when the institution ceases to meet its obligations as they become due, or upon the occurrence of an event that could indicate a state of insolvency under the rules of the NBRL;
|
|
|
·
|
management seriously violates Brazilian banking laws, regulations or rulings;
|
|
|
·
|
the institution suffers a loss which subjects its unprivileged and unsecured creditors to severe risk; and/or
|
|
|
·
|
upon revocation of the authorization to operate, the institution does not initiate ordinary liquidation proceedings within ninety days or, if initiated, the Brazilian Central Bank determines that the pace of the liquidation may harm the institution’s creditors.
|
|
|
·
|
by discretionary decision of the Brazilian Central Bank if the parties involved undertake the administration of the financial institution after having provided the necessary guarantees; or
|
|
|
·
|
when the final accounts of the receiver are delivered and approved and subsequently registered in the relevant public records; or
|
|
|
·
|
when converted into ordinary liquidation; or
|
|
|
·
|
when a financial institution is declared bankrupt.
|
|
|
·
|
continually enters into recurrent operations which are against economic or financial policies set forth in federal law;
|
|
|
·
|
faces a shortage of assets;
|
|
|
·
|
fails to comply with the compulsory reserves rules;
|
|
|
·
|
reveals the existence of hidden liabilities;
|
|
|
·
|
experiences the occurrence of situations that cause receivership pursuant to current legislation;
|
|
|
·
|
has reckless or fraudulent management; or
|
|
|
·
|
carries out activities which call for an intervention.
|
|
|
·
|
labor credits capped at an amount equal to 150 times the minimum wages per employee, and claims relating to occupational accidents,
|
|
|
·
|
secured credits up to the encumbered asset value,
|
|
|
·
|
tax credits, except tax penalties,
|
|
|
·
|
credits with special privileges,
|
|
|
·
|
credits with general privileges,
|
|
|
·
|
unsecured credits,
|
|
|
·
|
contractual fines and pecuniary penalties for breach of administrative or criminal laws, including those of a tax nature, and
|
|
|
·
|
subordinated credits.
|
|
|
·
|
review during the execution of audit procedures, to the extent deemed necessary, the financial institution’s internal risk management controls and procedures, including in relation to its electronic data processing system, and identify any potential failings;
|
|
|
·
|
report on the financial institution’s non-compliance with any applicable regulation to the extent it is material to its consolidated financial statements or activities; and
|
|
|
·
|
report presenting non-compliance to any applicable rules and regulations which may have a significant impact on the consolidated financial statements or operations of the entity (Report of Circular 3,467), revision of the criteria adopted to the classification of the credit operations and constitution of allowance for loan losses (Report of CMN Resolution 2,682), revision of the structure, systems and procedures defined to the Ombudsman Department, according the criteria established by the Institute of Independent Auditors of Brazil (
Instituto dos Auditores Independentes do Brasil – Ibracon
) (Ombusdman report) and limited review report on quarterly information (IFT and ITR). These reports must be available for inspection by the Brazilian Central Bank and CVM, when applicable.
|
|
|
·
|
non-compliance with rules and regulations that place the continuity of the audited entity at risk;
|
|
|
·
|
fraud of any amount perpetrated by the management of the institution;
|
|
|
·
|
material fraud perpetrated by the institution’s employees or third parties; and
|
|
|
·
|
material errors in the accounting records of the audited entity.
|
|
|
·
|
have more than 10.0% of their net worth invested in securities of a single issuer that is not a financial institution, its controlling shareholders, subsidiaries and affiliates or of a federal, state, municipality or other investment fund; and
|
|
|
·
|
have more than 20.0% of their net worth invested in securities issued by a financial institution (including the fund manager), its controlling shareholders, subsidiaries and affiliates.
|
|
|
·
|
execute operations that may be qualified as the granting of loans to their customers, including the assignment of rights with limited exceptions;
|
|
|
·
|
collect commissions from their customers related to transactions of securities during the primary distribution;
|
|
|
·
|
acquire real estate which is not for their own use; or
|
|
|
·
|
obtain loans from financial institutions, except for (1) loans for the acquisition of goods for use in connection with the firm’s corporate purpose or (2) loans the amount of which does not exceed two times the relevant firm’s net worth.
|
|
|
·
|
appoint at least one representative in Brazil that will be responsible for complying with registration and reporting requirements and reporting procedures with the Brazilian Central Bank and the CVM. If the representative is an individual or a non-financial company, the investor must also appoint an institution duly authorized by the Brazilian Central Bank that will be jointly and severally liable for the representative’s obligations;
|
|
|
·
|
complete the appropriate foreign investor registration form;
|
|
|
·
|
register as a foreign investor with the CVM;
|
|
|
·
|
register the foreign investment with the Brazilian Central Bank;
|
|
|
·
|
appoint a tax representative in Brazil; and
|
|
|
·
|
obtain a taxpayer identification number from the Brazilian federal tax authorities.
|
|
Transaction
(1)
|
Maximum Legal Rate
|
Present Rate
|
||
|
Credit extended by financial institutions and non-financial entities
|
1.5% per day
|
Up to 0.0041% per day for loans contracted by legal entities and 0.0068% per day for individuals. An additional 0.38% rate is applicable.
|
||
|
Transactions relating to securities
(2)
|
1.5% per day
|
0.5% per day for certain investment funds
0% on transactions with equity securities and certain debt securities, such as debentures and real estate receivables notes (CRIs)
1.0% per day on transactions with fixed income derived from federal, state, or municipal bonds, and fixed income investment funds limited to certain percentages of the income raised from investment
1.5% on the assignment of securities to permit the issuance of Depositary Receipts abroad
|
||
|
Transactions relating to derivatives
|
1%
|
1% on the notional value of the adjusted purchase sale or maturity of financial derivative contract in the country that individually result in an increased foreign exchange exposure on a short position
0% on derivative contracts to hedge risks inherent to the price fluctuation of foreign exchange resulting from export contracts signed by an individual or legal entity resident or domiciled in the country
0% other transactions with financial derivative contracts not expressly mentioned by the tax law
|
||
|
Insurance transactions entered into by insurance companies
|
25.0%
|
2.38% for health insurance and life insurance
7.38% for other types of insurance
|
|
Foreign exchange transactions
(2)
|
25.0%
|
0.38% (general rule)
6.38% on credit card transactions as from April 27, 2011
|
|
Transaction
(1)
|
Maximum Legal Rate
|
Present Rate
|
|
0% for outflow of funds related to loans obtained from abroad (irrespective of the term) and for inflow of funds related to loans obtained from abroad for a period greater than 1,800 days.
6.0% for remittances from abroad related to loans that will remain in Brazil for a period lower than or equal to 1,800 days.
0% for interbank transactions
0% for exchange transactions in connection with the outflow of proceeds from Brazil for the remittance of interest on net equity and dividends to be received by foreign investors
6.0% for exchange transactions, including by means of simultaneous foreign exchange transactions, for the inflow of funds by foreign investors in the Brazilian financial and capital markets, except that variable income investments in stock exchanges and share acquisitions as part of an initial public offering, as well as investments in certain private equity funds, are not subject to an IOF rate
6.0% for exchange transactions, including by means of simultaneous foreign exchange transactions, for the inflow of funds by foreign investors for purposes of initial or additional margin requirements in connection with transactions in stock exchanges
0% for exchange transactions for the outflow of funds invested by foreign investors in the Brazilian financial and capital markets
0% for exchange transactions for the inflow and outflow of funds invested by foreign investors, including by means of simultaneous foreign exchange transactions, in certificates of deposit of securities, known as Brazilian Depositary Receipts, or BDRs.
|
|
Transaction
(1)
|
Maximum Legal Rate
|
Present Rate
|
|
0% for exchange transactions by means of simultaneous foreign exchange transactions effected on or after December 1, 2011, for the inflow of funds by foreign investors derived from the conversion of direct investments in Brazil made pursuant to Law 4,131/62 into investments in stock tradable in stock exchanges
0% for revenues related to the export of goods and services transactions
|
|
(1)
|
The transactions mentioned in the table are for illustration purposes and do not reflect an exhaustive list of transactions subject to the IOF.
|
|
(2)
|
There are some exemptions or specific cases in which the applicable rate is zero.
|
|
|
·
|
financial institutions must ensure that customers are fully aware of all contractual clauses, including responsibilities and penalties applicable to both parties, providing timely copies of contracts, receipts, extracts and other documents related to transactions and services rendered in order to enable customers to freely take their decisions;
|
|
|
·
|
financial institutions must adopt in all contracts and related documents clear wording, which is not misleading, adequate to the complexity and nature of the transaction or service rendered, in order to enable the understanding of the content and identification of terms, amounts, charges, penalties, dates, places and other conditions;
|
|
|
·
|
financial institutions are prohibited from refusing or hindering customers and users of their products and services access to conventional channels of assistance, including cashier services (personal counter assistance), even in cases of alternative electronic assistance;
|
|
|
·
|
financial institutions are prohibited from postponing withdrawals up to R$5 thousand. For higher amounts, financial institutions may postpone the transaction to the next business day; and
|
|
|
·
|
financial institutions are prohibited from making loans from deposit accounts without prior authorization from the customer.
|
|
|
·
|
Local reinsurer
. Reinsurer with head office in Brazil, incorporated as a corporation (
sociedade por ações
) and having as exclusive purpose the performance of reinsurance and retrocession transactions;
|
|
|
·
|
Admitted reinsurer
. Nonresident reinsurer, registered with the SUSEP to carry out reinsurance and retrocession transactions, with a representative office in Brazil, which complies with the requirements of Complementary Law No. 126/07 and the applicable rules regarding reinsurance and retrocession activities; and
|
|
|
·
|
Eventual reinsurer
. Nonresident reinsurer, registered with the SUSEP to carry out reinsurance and retrocession transactions, without a representative office in Brazil, which complies with the requirements of Complementary Law No. 126/07 and the applicable rules regarding reinsurance and retrocession activities.
|
|
|
·
|
to be duly incorporated, according to the laws of their countries of origin, in order to underwrite local and international reinsurance in the fields that they intend to operate in Brazil and present evidence that they have carried out their operations in their respective countries of origin for at least five years;
|
|
|
·
|
to have economic and financial capacity not inferior to the minimum to be established by CNSP;
|
|
|
·
|
to have a rating issued by rating agencies recognized by the SUSEP equal to or higher than the minimum established by CNSP;
|
|
|
·
|
to have a duly appointed resident attorney-in-fact in Brazil with full administrative and judicial powers;
|
|
|
·
|
to comply with current and future additional requirements established by CNSP and the SUSEP.
|
|
|
·
|
at least 40.0% of the risk being ceded by insurance companies must be placed with local reinsurers (the same undertaking applies to local reinsurers); and
|
|
|
·
|
not more than 20.0% of the total premium of each product coverage it offers may be ceded to local or foreign reinsurers belonging to its own economic group (that is, companies directly or indirectly related,
|
|
Organizational Structure
|
|
Ownership Interest %
|
||||||||||||
|
Direct and Indirect subsidiaries of Banco Santander (Brasil) S.A.
|
Activity
|
Country of Residence
|
Direct
|
Indirect
|
||||||||
|
Santander Brasil Asset Management Distribuidora de Títulos e Valores Mobiliários S.A.
|
Asset manager
|
Brazil
|
99.99 | % | 100.00 | % | ||||||
|
Banco BANDEPE S.A.
|
Bank
|
Brazil
|
100.00 | % | 100.00 | % | ||||||
|
Santander Leasing S.A. Arrendamento Mercantil
|
Leasing
|
Brazil
|
78.57 | % | 99.99 | % | ||||||
|
Aymoré Crédito, Financiamento e Investimento S.A.
|
Financial
|
Brazil
|
100.00 | % | 100.00 | % | ||||||
|
Santander Administradora de Consórcios Ltda.
|
Buying club
|
Brazil
|
100.00 | % | 100.00 | % | ||||||
|
Santander Brasil Administradora de Consórcio Ltda.
|
Buying club
|
Brazil
|
100.00 | % | 100.00 | % | ||||||
|
Santander Microcrédito Assessoria Financeira S.A.
|
Microcredit
|
Brazil
|
100.00 | % | 100.00 | % | ||||||
|
Santander Brasil Advisory Services S.A
(1)
.
|
Other Activities
|
Brazil
|
96.56 | % | 96.56 | % | ||||||
|
Ownership Interest %
|
||||||||||||
|
Direct and Indirect subsidiaries of Banco Santander (Brasil) S.A.
|
Activity
|
Country of Residence
|
Direct
|
Indirect
|
||||||||
|
CRV Distribuidora de Títulos e Valores Mobiliários S.A.
(3)
|
Dealer
|
Brazil
|
100.00 | % | 100.00 | % | ||||||
|
Santander Corretora de Câmbio e Valores Mobiliários S.A.
|
Broker
|
Brazil
|
99.99 | % | 100.00 | % | ||||||
|
Webmotors S.A.
|
Other Activities
|
Brazil
|
100.00 | % | 100.00 | % | ||||||
|
Santander Participações S.A.
(1)(3)
|
Holding
|
Brazil
|
100.00 | % | 100.00 | % | ||||||
|
Santander Getnet Serviços para Meios de Pagamento S.A.
|
Other Activities
|
Brazil
|
50.00 | % | 50.00 | % | ||||||
|
Sancap Investimentos e Participações S.A. (“Sancap”)
|
Holding
|
Brazil
|
100.00 | % | 100.00 | % | ||||||
|
Mantiq Investimentos Ltda.
(5)
|
Other Activities
|
Brazil
|
100.00 | % | 100.00 | % | ||||||
|
Santos Energia Participações S.A.
(5)
|
Holding
|
Brazil
|
100.00 | % | 100.00 | % | ||||||
|
MS Participações Societárias S.A
(5)
|
Holding
|
Brazil
|
78.35 | % | 78.35 | % | ||||||
|
Controlled by Sancap
|
||||||||||||
|
Santander Capitalização S.A.
(2)
|
Savings and annuities
|
Brazil
|
- | 100.00 | % | |||||||
|
Controlled by Santander Participações S.A.
|
||||||||||||
|
Santander S.A. Serviços Técnicos, Administrativos e de Corretagem de Seguros
(4)
|
Insurance
|
Brazil
|
- | 100.00 | % | |||||||
|
Brazil Foreign Diversified Payment Rights Finance Company
|
Securitization
|
Cayman Islands
|
- |
(a)
|
||||||||
|
(a)
|
Company over which effective control is exercised and there is no interest.
|
|
(1)
|
On August 26, 2011 the following was approved (1) name change of Santander Advisory Services S.A. to Santander Participações S.A.; (2) name change of Santander CHPS S.A. to Santander Brasil Advisory Services S.A.; and (3) amendment of their by-laws in order to change their legal purposes.
|
|
(2)
|
Participation transferred to Sancap through the partial spin-off of Santander Seguros.
|
|
(3)
|
On August 31, 2011 the following was approved: (1) partial spin-off of CRV DTVM by Santander Participações, and the version of the separated part refers exclusively to the entire stake held by CRV DTVM in the capital of Santander Securities (Brasil) Corretora de Valores Mobiliários S.A. (Santander Securities) to Santander Participações and; (2) merger of Santander Securities into Santander Participações.
|
|
(4)
|
On October 29, 2010, shareholders of Real Corretora de Seguros S.A. (“Real Corretora”) and Santander S.A. Serviços Técnicos, Administrativos e de Corretagem de Seguros (“Santander Corretora”) approved the merger of Real Corretora into Santander Corretora, based on their net book values at the base date of September 30, 2010
|
|
(5)
|
Investment acquired in 2011.
|
|
Property, Plant and Equipment
|
|
At December 31, 2011
|
|||||
|
Number
|
Leased/Owned
|
||||
|
Branches (1)
|
2,355 |
1,835 leased / 520 owned
|
|||
|
Commercial sites (consumer finance)
|
84 |
84 leased
|
|||
|
Administrative buildings
|
13 |
4 leased/ 9 owned
|
|||
|
(1)
|
For information about the location of our branches, see – “Item 4. Information on the Company - B. Business Overview - Distribution Network”. Our headquarters are located in Torre São Paulo, located at Av. Presidente Juscelino Kubitschek, 2,041 and 2,235 – Bloco A, Vila Olímpia, São Paulo, SP, Brazil.
|
|
Operating
Results
|
|
For the Year ended December 31,
|
||||||||||||
|
2011
|
2010
|
2009
|
||||||||||
|
GDP growth
(1)
|
2.7 | % | 7.5 | % | (0.3 | %) | ||||||
|
CDI rate
(2)
|
11.6 | % | 9.7 | % | 9.9 | % | ||||||
|
TJLP
(3)
|
6.0 | % | 6.0 | % | 6.1 | % | ||||||
|
SELIC rate
(4)
|
11.00 | % | 10.75 | % | 8.75 | % | ||||||
|
Increase (decrease) in Real value against the U.S. dollar
|
(12.6 | %) | 4.3 | % | 25.5 | % | ||||||
|
Selling exchange rate (at period end) R$ per U.S.$1.00
|
R$1.88 | R$1.67 | R$1.74 | |||||||||
|
Average exchange rate R$ per U.S.$1.00
(5)
|
R$1.67 | R$1.76 | R$1.99 | |||||||||
|
Inflation (IGP-M)
(6)
|
5.1 | % | 11.3 | % | (1.7 | %) | ||||||
|
Inflation (IPCA)
(7)
|
6.5 | % | 5.9 | % | 4.3 | % | ||||||
|
(1)
|
Revised series. Source: IBGE.
|
|
(2)
|
The CDI rate is the average daily interbank deposit rate in Brazil (at the end of each month and annually).
|
|
(3)
|
Represents the interest rate applied by the BNDES for long-term financing (at the end of the period).
|
|
(4)
|
The benchmark interest rate payable to holders of some securities issued by the Brazilian government and traded on the SELIC.
|
|
(5)
|
Average of the selling exchange rate for the last day of each month during the period.
|
|
(6)
|
The inflation rate is the general index of market prices (
Índice Geral de Preços-Mercado
, or “IGP-M”), as calculated by FGV.
|
|
(7)
|
The inflation rate is the consumer price index (
Índice de Preços ao Consumidor – Amplo
, or “IPCA”), as calculated by the IBGE.
|
|
Low
|
High
|
Average
(1)
|
Period-End
|
|||||||||||||
|
Year
|
||||||||||||||||
|
2007
|
11.25 | 13.00 | 11.98 | 11.25 | ||||||||||||
|
2008
|
11.25 | 13.75 | 12.54 | 13.75 | ||||||||||||
|
2009
|
8.75 | 12.75 | 9.92 | 8.75 | ||||||||||||
|
2010
|
8.75 | 10.75 | 10.00 | 10.75 | ||||||||||||
|
2011
|
11.00 | 12.50 | 11.71 | 11.00 | ||||||||||||
|
(1)
|
Average of month-end rates during the period.
|
|
2011
|
2010
|
2009
|
||||||||||
|
(in Billions of Reais)
|
||||||||||||
|
Total Credit Outstanding
|
2,030 | 1,706 | 1,414 | |||||||||
|
Earmarked credit
|
727 | 590 | 460 | |||||||||
|
Market based credit
|
1,303 | 1,116 | 955 | |||||||||
|
of which:
|
||||||||||||
|
corporate
|
651 | 556 | 485 | |||||||||
|
individuals (retail)
|
652 | 560 | 470 | |||||||||
|
Product
|
As of December 31, 2010
|
As of December 31, 2011
|
Form of Required Reserve
|
Yield
|
||||||||
|
Demand deposits
|
||||||||||||
|
Rural credit loans
(1)
|
29 | % | 28 | % |
Loans and Cash
|
6.75% p.a. and Zero for Cash
|
||||||
|
Microcredit loans
(2)
|
2 | % | 2 | % |
Loans and Cash
|
Cap rate: 2% p.m. and Zero for Cash
|
||||||
|
Reserve requirements
|
43 | % | 43 | % |
Cash
|
Zero
|
||||||
|
Additional reserve requirements
|
12 | % | 12 | % |
Cash
|
SELIC
|
||||||
|
Free funding
(3)
|
14 | % | 15 | % | ||||||||
|
Savings accounts
|
||||||||||||
|
Mortgage loans
|
65 | % | 65 | % |
Loans and Cash
|
Cap of TR + 12% p.a. and TR + 6.17% for Cash
|
||||||
|
Reserve requirements
|
20 | % | 20 | % |
Cash
|
TR + 6.17% p.a.
|
||||||
|
Additional reserve requirements
|
10 | % | 10 | % |
Cash
|
SELIC
|
||||||
|
Free funding
(3)
|
5 | % | 5 | % | ||||||||
|
Time deposits
|
||||||||||||
|
Reserve requirements
|
20.0 | % | 20.0 | % | ||||||||
|
In cash or credit
(4)
|
7.2 | % | 7.2 | % |
Cash or Credit
|
SELIC for Cash
|
||||||
|
In cash
|
12.8 | % | 12.8 | % |
Cash
|
SELIC
|
||||||
|
Additional reserve requirements
|
12 | % | 12 | % |
Cash
|
SELIC
|
||||||
|
Free funding
(3)
|
68.0 | % | 68.0 | % | ||||||||
|
(1)
|
Rural credit loans are loans to agricultural customers, of which R$4.3 billion and R$4.9 billion were outstanding as of December 31, 2011 and December 31, 2010, respectively. On July 01, 2011, there was a reduction in the rate of 29% to 28%, which had been expected pursuant to CMN Resolution No. 3,746 dated as of June 30, 2009. This rate will continue to decrease in coming years to 27% on July 07, 2012 and 26% on July 07, 2013.
|
|
(2)
|
Microcredit loans are loans to very small businesses, of which R$209.8 million and R$216.1 million were outstanding as of December 31, 2011 and December 31, 2010, respectively.
|
|
(3)
|
Free funding is the amount of each category of funding we are free to use for any purpose.
|
|
(4)
|
Includes only credit acquired up to December 31, 2011 from financial institutions having net capital of less than R$2.5 billion.
|
|
Main Assumptions
|
2011
|
2010
|
2009
|
|||||||||
|
Basis of valuation
|
Value in use: cash flows
|
|||||||||||
|
Period of the projections of cash flows
(1)
|
10 years
|
10 years
|
10 years
|
|||||||||
|
Growth rate
|
5.0 | % | 5.0 | % | 4.5 | % | ||||||
|
Discount rate
(2)
|
15.2 | % | 15.5 | % | 15.2 | % | ||||||
|
(1)
|
The projections of cash flow are prepared using internal budget and growth plans of management, based on historical data, market expectations and conditions such as industry growth, interest rates and inflation.
|
|
(2)
|
The discount rate is calculated based on the capital asset pricing model.
|
|
|
·
|
The present value method for valuing financial instruments permitting static hedging (principally, forwards and swaps) and loans and advances. Expected future cash flows are discounted using the interest rate curves of the applicable currencies. The interest rate curves are generally observable market data.
|
|
|
·
|
The Black-Scholes model for valuing financial instruments requiring dynamic hedging (principally structured options and other structured instruments). Certain observable market inputs are used in the Black-Scholes model to generate variables such as the bid-offer spread, exchange rates, volatility, correlation between indexes and market liquidity, as appropriate.
|
|
|
·
|
Each of the present value methods and the Black-Scholes models are used for valuing financial instruments exposed to interest rate risk, such as interest rate futures, caps and floors. The main inputs used in these models are principally observable market data, including appropriate interest rate curves, volatilities, correlations and exchange rates.
|
|
|
·
|
We use dynamic models similar to those used in the measurement of interest rate risk for measuring credit risk of linear instruments (such as bonds and fixed-income derivatives). In the case of non-linear instruments, if the portfolio exposed to credit risk (such as credit derivatives), the joint probability of default is determined using the Standard Gaussian Copula model. The main inputs used to determine the underlying cost of credit for credit derivatives are quoted credit risk spreads, and the correlation between quoted credit derivatives of various issuers.
|
|
|
·
|
The determination of fair value requires us to make certain estimates and assumptions. If quoted market prices are not available, fair value is calculated using widely accepted pricing models that consider contractual prices of the underlying financial instruments, yield curves, contract terms, observable market data, and other relevant factors. The use of different estimates or assumptions in these pricing models could lead to a different valuation being recorded in our consolidated financial statements.
|
|
|
·
|
assumed interest rates;
|
|
|
·
|
mortality tables;
|
|
|
·
|
annual social security pension revision rate;
|
|
|
·
|
price inflation;
|
|
|
·
|
annual salary growth rate, and
|
|
|
·
|
the method used to calculate vested commitments to current employees
|
|
For the Year ended December 31
|
||||||||||||||||
|
2011
|
2010
|
% Change
|
Change
|
|||||||||||||
|
(in millions of R$, except percentages)
|
||||||||||||||||
|
Net interest income
|
27,902 | 24,095 | 15.8 | % | 3,807 | |||||||||||
|
Income from equity instruments
|
94 | 52 | 81.2 | % | 42 | |||||||||||
|
Income from companies accounted for by the equity method
|
54 | 44 | 23.4 | % | 10 | |||||||||||
|
Net fee and commissions
|
7,339 | 6,836 | 7.4 | % | 503 | |||||||||||
|
Gains/losses on financial assets and liabilities (net) and exchange differences (net)
|
(235 | ) | 1,875 | (112.5 | )% | (2,110 | ) | |||||||||
|
Other operating income (expenses)
|
(379 | ) | (348 | ) | 9.2 | % | (31 | ) | ||||||||
|
Total income
|
34,775 | 32,553 | 6.8 | % | 2,222 | |||||||||||
|
Administrative expenses
|
(12,373 | ) | (11,231 | ) | 10.2 | % | (1,142 | ) | ||||||||
|
Depreciation and amortization
|
(1,462 | ) | (1,237 | ) | 18.2 | % | (225 | ) | ||||||||
|
Provisions (net)
|
(3,061 | ) | (1,974 | ) | 55.1 | % | (1,087 | ) | ||||||||
|
Impairment losses on financial assets (net):
|
(9,382 | ) | (8,234 | ) | 14.0 | % | (1,148 | ) | ||||||||
|
Impairment losses on other assets (net)
|
(39 | ) | (21 | ) | 85.7 | % | (18 | ) | ||||||||
|
Other non-financial gains/losses
|
452 | 140 |
n.a.
|
312 | ||||||||||||
|
Profit before tax
|
8,911 | 9,997 | (10.9 | )% | (1,086 | ) | ||||||||||
|
Income taxes
|
(1,155 | ) | (2,614 | ) | (55.8 | )% | 1,459 | |||||||||
|
Net income
|
7,756 | 7,383 | 5.1 | % | 373 | |||||||||||
|
|
·
|
A 15.8 %, or R$3.8 billion, increase in net interest income for the year ended December 31, 2011 compared to the year ended December 31, 2010, mainly due to an increase of R$3.4 billion in revenues from lending activities, driven by loans to individuals and SME customers.
|
|
|
·
|
An increase of 7.4%, or R$503 million, in net fee and commissions income for the year ended December 31, 2011 as compared to the year ended December 31 2010. This increase was primarily driven by a growth in commissions from sales of insurance and capitalization products and commissions from credit and debit cards in the same period.
|
|
|
·
|
Income tax expenses declined by R$1,459 million in the year ended December 31, 2011, compared to the year ended December 31, 2010. In the year ended December 31, 2011, the effect of the appreciation of the dollar against the
real
on the net equity of our Cayman Islands Branch, and the negative hedge results, caused lower tax expenses of R$1,646 million, compared to higher tax expenses of R$272 million in 2010. See “
—
Other Factors Affecting Our Financial Condition and Results of Operations—Cayman Offshore Hedging”. Disregarding these effect, tax expenses were R$2,801 million and R$2,342 million, respectively, for 2011 and 2010 due to lower goodwill tax amortizations (other than Banco Real), and to lower interest on capital.
|
|
|
·
|
A R$2.1 billion decrease in gains (losses) on financial assets and liabilities (net) plus exchange differences to a loss of R$235 million in the year ended December 31, 2011 compared to gains of R$1.9 billion in the year ended December 31, 2010. The decrease was mainly due to the effect of the appreciation of the U.S. dollar against the
real
on the net equity of our Cayman Islands Branch. For the year ended December 31, 2011, the hedging result totaled net losses of R$1,646 million, offset by net gains in the same amount in tax expenses, compared to gains of R$272 million in 2010, offset by losses in the same amount in tax expenses. This hedge position, composed of derivatives, was established to mitigate the exchange rate variation and the effects of offshore investments on our net profit. Excluding the effects of the hedging results of our Cayman Islands branch, gains (losses) on financial assets and liabilities (net) and exchange differences (net) for the year ended December 31, 2011 totaled net gains of R$1,412 million, a R$192 million decrease from gains of R$1,603 million for the year ended December 31, 2010. This variation is partially explained by the early redemption of certain debt at a discount, which resulted in a gain of R$64 million in January 2010 and which did not recur in 2011, lower results of R$17 million from hedge operations and lower results of R$111 million from derivatives transactions with customers and others.
|
|
|
·
|
An increase of 10.2% or R$1.1 billion in administrative expenses for the year ended December 31, 2011 compared to the year ended December 31, 2010, mainly due to labor cost increases tied to inflation and the expansion of our branch network, with the addition of 154 new branches in 2011.
|
|
|
·
|
An increase in impairment losses on financial assets (net) of R$1,148 million for the year ended December 31, 2011 compared to the year ended December 31, 2010, principally due to an increase in the delinquency ratio.
|
|
|
·
|
An increase in provisions expenses of R$1,087 million for the year ended December 31, 2011 compared to the year ended December 31, 2010, mainly due to an increase in provisions for labor claims and tax litigations, partially offset by a decrease in civil claims. Provisions for labor claims increased R$648.7 million in 2011, primarily due to our efforts during the fourth quarter to accelerate the settlement of outstanding labor claims to reduce the volume of open claims. Concurrently, we have been implementing measures to reduce the level of new labor disputes with new controls on labor outsourcing, among other measures.
|
|
For the year ended December 31
|
||||||||||||||||
|
2011
|
2010
|
% Change
|
Change
|
|||||||||||||
|
(in millions of R$, except percentages)
|
||||||||||||||||
|
Banking fees
|
2,465 | 2,369 | 4.0 | % | 96 | |||||||||||
|
Receiving Services
|
515 | 506 | 1.8 | % | 9 | |||||||||||
|
Insurance and Capitalization
|
1,560 | 1,230 | 26.8 | % | 330 | |||||||||||
|
Asset Management and Pension Funds
|
1,204 | 1,132 | 6.4 | % | 72 | |||||||||||
|
Credit and debit cards
|
1,298 | 969 | 33.9 | % | 329 | |||||||||||
|
Capital markets
|
419 | 502 | (16.6 | )% | (83 | ) | ||||||||||
|
Trade finance
|
400 | 456 | (12.3 | )% | (56 | ) | ||||||||||
|
Tax on services
|
(364 | ) | (357 | ) | 2.1 | % | (7 | ) | ||||||||
|
Others
|
(158 | ) | 27 | — | (185 | ) | ||||||||||
|
Total
|
7,339 | 6,836 | 7.4 | % | 503 | |||||||||||
|
For the year ended December 31
|
||||||||||||||||
|
2011
|
2010
|
% Change
|
Change
|
|||||||||||||
|
(in millions of R$, except percentages)
|
||||||||||||||||
|
Salaries
|
4,192 | 3,731 | 12.3 | % | 461 | |||||||||||
|
Social security
|
1,092 | 994 | 9.9 | % | 98 | |||||||||||
|
Benefits
|
866 | 792 | 9.3 | % | 74 | |||||||||||
|
Training
|
116 | 93 | 24.7 | % | 23 | |||||||||||
|
Others
|
378 | 316 | 20.1 | % | 62 | |||||||||||
|
Total
|
6,644 | 5,926 | 12.1 | % | 718 | |||||||||||
|
For the year ended December 31,
|
||||||||||||||||
|
2011
|
2010
|
% Change
|
Change
|
|||||||||||||
|
(in millions of R$, except percentages)
|
||||||||||||||||
|
Specialized and technical services
|
1,564 | 1,504 | 4.0 | % | 60 | |||||||||||
|
Property, fixtures and supplies
|
1,087 | 966 | 12.6 | % | 121 | |||||||||||
|
Technology and systems
|
1,006 | 889 | 13.2 | % | 117 | |||||||||||
|
Advertising
|
493 | 422 | 16.9 | % | 71 | |||||||||||
|
Communications
|
566 | 555 | 2.0 | % | 11 | |||||||||||
|
Per diems and travel expenses
|
174 | 151 | 15.4 | % | 23 | |||||||||||
|
Surveillance and cash courier services
|
521 | 513 | 1.6 | % | 8 | |||||||||||
|
Other administrative expenses
|
316 | 304 | 3.9 | % | 12 | |||||||||||
|
Total
|
5,729 | 5,304 | 8.0 | % | 425 | |||||||||||
|
At December 31,
|
||||||||
|
2011
|
2010
|
|||||||
|
(in millions of R$, except percentages)
|
||||||||
|
Computable credit risk
(1)
|
216,756 | 183,121 | ||||||
|
Nonperforming assets
|
13,073 | 9,348 | ||||||
|
Allowances for nonperforming assets
|
11,180 | 9,192 | ||||||
|
Ratios
|
||||||||
|
Nonperforming assets to computable credit risk
|
6.0 | % | 5.1 | % | ||||
|
Coverage ratio
(2)
|
85.5 | % | 98.3 | % | ||||
|
(1)
|
Computable credit risk is the sum of the face amounts of loans and leases (including nonperforming assets but excluding country risk loans), guarantees and documentary credits.
|
|
(2)
|
Allowances for credit losses as a percentage of nonperforming assets.
|
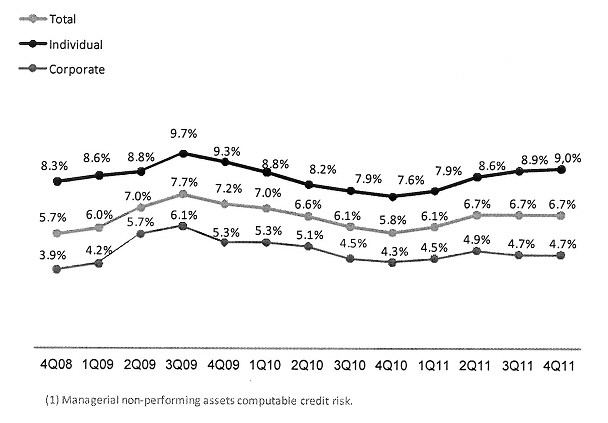
|
At December 31,
|
||||||||
|
2011
|
2010
|
|||||||
|
(in millions of R$)
|
||||||||
|
Commercial, financial and industrial
|
4,775 | 3,563 | ||||||
|
Real estate – mortgage
|
172 | 150 | ||||||
|
Installment loans to individuals
|
7,720 | 4,863 | ||||||
|
Lease financing
|
406 | 772 | ||||||
|
Total
|
13,073 | 9,348 | ||||||
|
For the year ended December 31, 2011
|
||||||||||||||||||||||||||||
|
Commercial Banking
|
% of Total
|
Global
Wholesale Banking |
% of Total
|
Asset
Management and Insurance |
% of Total
|
Total
|
||||||||||||||||||||||
|
(millions of R$, except percentages)
|
||||||||||||||||||||||||||||
|
Net interest income
|
24,971 | 89.5 | % | 2,589 | 9.3 | % | 342 | 1.2 | % | 27,902 | ||||||||||||||||||
|
Income from equity instruments
|
94 | 100.0 | % | 0 | 0.0 | % | 0 | 0.0 | % | 94 | ||||||||||||||||||
|
Income from companies accounted for by the equity method
|
54 | 100.0 | % | 0 | 0.0 | % | 0 | 0.0 | % | 54 | ||||||||||||||||||
|
Net fee and commission income
|
6,192 | 84.4 | % | 796 | 10.8 | % | 351 | 4.8 | % | 7,339 | ||||||||||||||||||
|
Gains/losses on financial assets and liabilities and exchange differences (net)
|
(753 | ) |
n.a.
|
513 | (217.6 | )% | 5 | (2.2 | )% | (235 | ) | |||||||||||||||||
|
Other operating income/expenses
|
(695 | ) |
n.a.
|
(29 | ) | 7.7 | % | 345 |
n.a.
|
(379 | ) | |||||||||||||||||
|
Personnel expenses
|
(6,031 | ) | 90.8 | % | (526 | ) | 7.9 | % | (87 | ) | 1.3 | % | (6,644 | ) | ||||||||||||||
|
Other administrative expenses
|
(5,431 | ) | 94.8 | % | (242 | ) | 4.2 | % | (56 | ) | 1.0 | % | (5,729 | ) | ||||||||||||||
|
Depreciation and amortization
|
(1,331 | ) | 91.1 | % | (106 | ) | 7.2 | % | (25 | ) | 1.7 | % | (1,462 | ) | ||||||||||||||
|
Provisions (net)
|
(3,024 | ) | 98.8 | % | 3 | (0.1 | )% | (40 | ) | 1.3 | % | (3,061 | ) | |||||||||||||||
|
Impairment losses on financial assets (net)
|
(9,334 | ) | 99.5 | % | (47 | ) | (0.5 | )% | 0 | 0.0 | % | (9,382 | ) | |||||||||||||||
|
Impairment losses on other assets (net)
|
(34 | ) | 87.8 | % | (5 | ) | 12.2 | % | 0 | 0.0 | % | (39 | ) | |||||||||||||||
|
Other nonfinancial gain (losses)
|
452 | 100.0 | % | 0 | 0.0 | % | 0 | 0.0 | % | 452 | ||||||||||||||||||
|
Profit before tax
|
5,128 | 57.5 | % | 2,947 | 33.0 | % | 835 | 9.4 | % | 8,911 | ||||||||||||||||||
|
For the year ended December 31
|
||||||||||||||||
|
2011
|
2010
|
% Change
|
Change
|
|||||||||||||
|
(in millions of R$, except percentages)
|
||||||||||||||||
|
Net interest income
|
24,971 | 21,301 | 17.2 | % | 3,670 | |||||||||||
|
Income from equity instruments
|
94 | 52 | 81.2 | % | 42 | |||||||||||
|
Income from companies accounted for by the equity method
|
54 | 44 | 23.4 | % | 10 | |||||||||||
|
For the year ended December 31
|
||||||||||||||||
|
2011
|
2010
|
% Change
|
Change
|
|||||||||||||
|
(in millions of R$, except percentages)
|
||||||||||||||||
|
Net fee and commission income
|
6,192 | 5,530 | 12.0 | % | 662 | |||||||||||
|
Gains/losses on financial assets and liabilities (net) and exchange differences (net)
|
(753 | ) | 1,550 | (148.6 | )% | (2,303 | ) | |||||||||
|
Other operating income/expenses
|
(695 | ) | (596 | ) | 16.6 | % | (99 | ) | ||||||||
|
Total income
|
29,863 | 27,881 | 7.1 | % | 1,982 | |||||||||||
|
Personnel expenses
|
(6,031 | ) | (5,354 | ) | 12.7 | % | (677 | ) | ||||||||
|
Other administrative expenses
|
(5,431 | ) | (5,003 | ) | 8.6 | % | (428 | ) | ||||||||
|
Depreciation and amortization
|
(1,331 | ) | (1,130 | ) | 17.8 | % | (201 | ) | ||||||||
|
Provisions (net)
|
(3,024 | ) | (1,941 | ) | 55.8 | % | (1,083 | ) | ||||||||
|
Impairment losses on financial assets (net)
|
(9,334 | ) | (8,225 | ) | 13.5 | % | (1,109 | ) | ||||||||
|
Impairment losses on other assets (net)
|
(34 | ) | (21 | ) | 63.8 | % | (13 | ) | ||||||||
|
Other nonfinancial gain (losses)
|
452 | 140 |
n.a.
|
312 | ||||||||||||
|
Profit before tax
|
5,128 | 6,347 | (19.2 | )% | (1,219 | ) | ||||||||||
|
For the year ended December 31
|
||||||||||||||||
|
2011
|
2010
|
% Change
|
Change
|
|||||||||||||
|
(in millions of R$, except percentages)
|
||||||||||||||||
|
Net interest income
|
2,589 | 2,501 | 3.5 | % | 88 | |||||||||||
|
Net fee and commission income
|
796 | 892 | (10.8 | )% | (96 | ) | ||||||||||
|
Gains/losses on financial assets and liabilities (net) and exchange differences (net)
|
513 | 244 | 109.9 | % | 269 | |||||||||||
|
Other operating income/expenses
|
(29 | ) | (30 | ) | (2.3 | )% | 1 | |||||||||
|
Total income
|
3,869 | 3,607 | 7.2 | % | 262 | |||||||||||
|
Personnel expenses
|
(526 | ) | (512 | ) | 2.6 | % | (14 | ) | ||||||||
|
Other administrative expenses
|
(242 | ) | (215 | ) | 12.3 | % | (27 | ) | ||||||||
|
Depreciation and amortization
|
(106 | ) | (58 | ) | 83.3 | % | (48 | ) | ||||||||
|
Provisions (net)
|
3 | 4 | (25.0 | )% | (1 | ) | ||||||||||
|
Impairment losses on financial assets (net)
|
(47 | ) | (8 | ) |
n.a.
|
(39 | ) | |||||||||
|
Impairment losses on other assets (net)
|
(5 | ) | 0 |
n.a.
|
(5 | ) | ||||||||||
|
Profit before tax
|
2,947 | 2,818 | 4.6 | % | 129 | |||||||||||
|
For the year ended December 31
|
||||||||||||||||
|
2011
|
2010
|
% Change
|
Change
|
|||||||||||||
|
(in millions of R$, except percentages)
|
||||||||||||||||
|
Net interest income
|
342 | 292 | 16.7 | % | 50 | |||||||||||
|
Net fee and commission income
|
351 | 414 | (15.2 | )% | (63 | ) | ||||||||||
|
Gains/losses on financial assets and liabilities (net) and exchange differences (net)
|
5 | 80 | (93.6 | )% | (75 | ) | ||||||||||
|
Other operating income/expenses
|
345 | 278 | 24.1 | % | 67 | |||||||||||
|
Total income
|
1,043 | 1,065 | (2.1 | )% | (22 | ) | ||||||||||
|
Personnel expenses
|
(87 | ) | (60 | ) | 44.7 | % | (27 | ) | ||||||||
|
Other administrative expenses
|
(56 | ) | (86 | ) | (35.1 | )% | 30 | |||||||||
|
Depreciation and amortization
|
(25 | ) | (50 | ) | (49.8 | )% | 25 | |||||||||
|
Provisions (net)
|
(40 | ) | (38 | ) | 6.8 | % | (2 | ) | ||||||||
|
Profit before tax
|
835 | 832 | 0.4 | % | 3 | |||||||||||
|
|
·
|
An increase of 17.2%, or R$3,670 million, in net interest income for the year ended December 31, 2011 compared to the year ended December 31, 2010, mainly due to growth of R$3.4 billion in revenues from lending activities, driven by lending to individuals and SME customers.
|
|
|
·
|
An increase of 12.0%, or R$662 million, in net fee and commission income for the year ended December 31, 2011 compared to the year ended December 31, 2010, principally due to (1) an increase in revenues from credit and debit cards which mainly reflects the increase in fees from our merchant acquisition business, and also the adoption of a strategy based on innovation and a focus on customer needs, resulting in an increase in the card base and in product penetration, (2) an increase in the commissions from sales of insurance and capitalization products paid by our insurance business to the Commercial Banking segment and (3) the change of the effective term of life and personal accident premiums, which in 2011 ceased to be renewed on a monthly basis and began to be renewed on an annual basis.
|
|
|
·
|
A R$2,303 million decrease in gains (losses) on financial assets and liabilities (net) plus exchange differences to a loss of R$753 million in the year ended December 31, 2011 compared to gains of R$1,550 million in the year ended December 31, 2010. The decrease was mainly due to the effect of the appreciation of the U.S. dollar against the
real
on the net equity of our Cayman Islands Branch. In the year ended December 31, 2011, the hedging result totaled losses of R$1,646 million, which were offset by net gains in the same amount in tax expenses, compared to gains of R$272 million in 2010. A hedge position, composed of derivatives, was established to mitigate the exchange rate variation and the effects of offshore investments on our net profit. Excluding the effects of the hedging results of our Cayman Islands Branch, gains (losses) on financial assets and liabilities (net) plus exchange differences for the Commercial Banking segment for the year ended December 31, 2011 totaled gains of R$893 million, a R$385 million decrease from gains of R$1,278 million for the year ended December 31, 2010. This variation is partially explained by the liquidation of a R$64 million subordinated liability in January 2010, which did not occur in 2011, lower results of R$17 million from hedge operations and lower results of R$305 million from derivatives transactions with customers and others.
|
|
|
·
|
A 12.7%, or R$677 million, increase in personnel expenses in the year ended December 31, 2011 as compared to the year ended December 31, 2010, mainly due to the recruitment of employees for our new branches and the impact of our collective bargaining agreement. This agreement requires certain adjustments in fixed and variable income, linked to the official consumer price inflation index (IPCA).
|
|
|
·
|
An increase in the commissions from insurance and capitalization products paid by our insurance business to the Commercial Banking segment; and
|
|
|
·
|
The change of the effective term of life and personal accident premiums, which in 2011 ceased to be renewed on a monthly basis and began to be renewed on an annual basis.
|
|
|
·
|
A 3.5%, or R$88 million, increase in net interest income in the year ended December 31, 2011 as compared to the year ended December 31, 2010, due to an increase in revenues from loans and public bonds; and
|
|
|
·
|
A R$269 million increase in gains on financial assets and liabilities (net) and Exchange Differences in the year ended December 31, 2011 compared to the year ended December 31, 2010, mainly due to higher gains in market making and trading, which were partially offset by a decrease in the amount of derivatives transactions with customers.
|
|
|
·
|
A R$96 million decrease in net fee and commission income in the year ended December 31, 2011 as compared to the year ended December 31, 2010, mainly due to a decrease in commissions from capital markets and trade finance operations driven by lower activity in these segments in 2011 compared to 2010.
|
|
|
·
|
A R$39 million increase in impairment losses on financial assets (net) in the year ended December 31, 2011, mainly due to higher provisions in 2011.
|
|
|
·
|
A 12.3%, or R$27 million, increase in other administrative expenses in the year ended December 31, 2011 as compared to 2010, mainly due to an increase in technology costs.
|
|
|
·
|
A R$48 million increase in depreciation and amortization in the year ended December 31, 2011 compared to the year ended December 2010, principally due to the amortization of technological systems and other non-technological assets that were classified as tangible assets.
|
|
|
·
|
An increase of R$50 million in net interest income in the year ended December 31, 2011. This increase was mainly due to the impact of our line-by-line consolidation of the investment funds from capitalization resources that after January 2011 began to be allocated in the net interest income. Prior to January 2011, the results of the capitalization products were allocated in gains/losses on financial assets instead of net interest income and one of the pension funds was allocated in other operating income/expenses. The result was affected by a decline in results during the fourth quarter of 2011 as a consequence of the sale of Santander Seguros to ZS Insurance; and
|
|
|
·
|
An increase of R$67 million in other operating income/expenses for the Asset Management and Insurance segment for the year ended December 31, 2011 as compared to the year ended December 31, 2010. This
|
|
|
|
increase was mainly due to an increase in revenues from insurance activities, partially offset by the impact of our line-by-line consolidation of investment funds from capitalization resources that after January 2011 began to be allocated in net interest income, in order to better demonstrate the economic characteristics of these assets.
|
|
|
·
|
A R$75 million decrease in gains/losses on financial assets and liabilities (net) plus exchange differences in the year ended December 31, 2011 as compared to 2010. This decrease is mainly due to the line-by-line consolidation of the investment fund from capitalization resources are invested beginning in January 2011, in order to better demonstrate the economic characteristics of these assets. After January 2011, the results of the investment fund, mainly composed of publicly-traded securities, are allocated in net interest income instead of in gains/losses on financial assets.
|
|
At December 31,
|
||||||||||||||||
|
2011
|
2010
|
Change
|
Change
|
|||||||||||||
|
(in millions of R$, except percentages)
|
||||||||||||||||
|
Individuals
|
63,413 | 50,981 | 24.4 | % | 12,432 | |||||||||||
|
Consumer Finance
|
30,459 | 26,969 | 12.9 | % | 3,490 | |||||||||||
|
SMEs
|
47,940 | 38,178 | 25.6 | % | 9,762 | |||||||||||
|
Corporate
|
52,373 | 44,431 | 17.9 | % | 7,942 | |||||||||||
|
Total
|
194,184 | 160,559 | 20.9 | % | 33,625 | |||||||||||
|
Year ended December 31,
|
||||||||||||||||
|
2010
|
2009
|
% Change
|
Change
|
|||||||||||||
|
(in millions of R$)
|
||||||||||||||||
|
Net interest income
|
24,095 | 22,167 | 8.7 | % | 1,928 | |||||||||||
|
Income from equity instruments
|
52 | 30 | 73.0 | % | 22 | |||||||||||
|
Net fee and commissions
|
6,836 | 6,238 | 9.6 | % | 598 | |||||||||||
|
Income from companies accounted by the
equity method
|
44 | 295 | (85.1 | %) | (251 | ) | ||||||||||
|
Gains/(losses) on financial assets and liabilities (net) plus Exchange differences (net)
|
1,875 | 2,665 | (29.6 | %) | (790 | ) | ||||||||||
|
Other operating income (expenses)
|
(348 | ) | (116 | ) | 200.0 | % | (232 | ) | ||||||||
|
Gross income
|
32,553 | 31,280 | 4.1 | % | 1,273 | |||||||||||
|
Administrative expenses
|
(11,231 | ) | (10,947 | ) | 2.6 | % | (284 | ) | ||||||||
|
Depreciation and amortization
|
(1,237 | ) | (1,249 | ) | (0.9 | %) | (12 | ) | ||||||||
|
Provisions (net)
|
(1,974 | ) | (3,481 | ) | (43.3 | %) | 1,507 | |||||||||
|
Impairment losses on financial assets (net)
|
(8,234 | ) | (9,966 | ) | (17.4 | %) | 1,732 | |||||||||
|
Impairment losses on other assets (net)
|
(21 | ) | (901 | ) | (97.7 | %) | 880 | |||||||||
|
Gains/(losses) on disposal of assets not classified as noncurrent assets held for sale plus Gains/(losses) on disposal of noncurrent assets held for sale
|
140 | 3,401 | (95.9 | %) | (3,261 | ) | ||||||||||
|
Profit before tax
|
9,997 | 8,137 | 22.9 | % | 1,860 | |||||||||||
|
|
·
|
An 8.7% increase in net interest income or R$1.9 billion in the year ended December 31, 2010. This increase was mainly due to growth in our lending activities and the revenues from the utilization of the proceeds of our IPO in late 2009.
|
|
|
·
|
A 9.6% increase in net fee and commission income or R$598 million in 2010. This increase was mainly due to a growth in the commissions on sale of insurance and capitalization products and pension funds, credit and debit cards and in the investment funds segment.
|
|
|
·
|
A decrease in provisions for litigations of R$1.5 billion, reflecting, mainly, provisions for restructuring costs related to Banco Real acquisition that did occur in 2009 but not in 2010.
|
|
Year ended December 31
|
||||||||||||||||
|
2010
|
2009
|
% Change
|
Change
|
|||||||||||||
|
(in million of R$)
|
||||||||||||||||
|
Banking fees
|
2,369 | 2,458 | (3.6 | %) | (89 | ) | ||||||||||
|
Receiving Services
|
506 | 502 | 0.8 | % | 4 | |||||||||||
|
Sale of insurance plus Capitalization plus Pension Funds
|
1,497 | 1,042 | 43.7 | % | 455 | |||||||||||
|
Investment funds
|
865 | 737 | 17.4 | % | 128 | |||||||||||
|
Credit and debit cards
|
969 | 782 | 24.0 | % | 187 | |||||||||||
|
Capital markets
|
502 | 539 | (6.8 | %) | (37 | ) | ||||||||||
|
Trade finance
|
456 | 384 | 18.8 | % | 72 | |||||||||||
|
Tax on services
|
(357 | ) | (350 | ) | 1.9 | % | (7 | ) | ||||||||
|
Others
|
27 | 143 | (81.3 | )% | (116 | ) | ||||||||||
|
Total
|
6,836 | 6,238 | 9.6 | % | 598 | |||||||||||
|
Year ended December 31,
|
||||||||||||||||
|
2010
|
2009
|
Change %
|
Change
|
|||||||||||||
|
(in millions of R$)
|
||||||||||||||||
|
Salaries
|
3,731 | 3,364 | 10.9 | % | 367 | |||||||||||
|
Social Security
|
994 | 971 | 2.4 | % | 23 | |||||||||||
|
Benefits
|
792 | 749 | 5.7 | % | 43 | |||||||||||
|
Training
|
93 | 88 | 5.7 | % | 5 | |||||||||||
|
Others
(1)
|
316 | 339 | (6.8 | %) | (23 | ) | ||||||||||
|
Total
|
5,926 | 5,511 | 7.5 | % | 415 | |||||||||||
|
(1)
|
Includes the Share-based payments cost. See note 38 to our audited consolidated financial statements.
Other administrative expenses decreased from R$5.4 billion for the year ended December 31, 2009 to R$5.3 billion for the year ended December 31, 2010. The decrease was primarily due to the cost of synergies obtained from the merger between Santander Brasil and Banco Real, particularly from maintenance of properties and marketing, partially offset by technical services that were outsourced. As a result, our efficiency ratio, which we calculate as total administrative expenses divided by total income, improved from 35.0% for the year ended December 31, 2009 to 34.5% for the year ended December 31, 2010.
|
|
At December 31,
|
||||||||
|
2010
|
2009
|
|||||||
|
(in millions of R$, except for percentages)
|
||||||||
|
Computable credit risk(1)
|
183,121 | 159,362 | ||||||
|
Non-performing assets
|
9,348 | 9,899 | ||||||
|
Allowances for non-performing assets
|
9,192 | 10,070 | ||||||
|
Ratios
|
||||||||
|
Non-performing assets to computable credit risk
|
5.1 | % | 6.2 | % | ||||
|
Coverage ratio(2)
|
98.3 | % | 101.7 | % | ||||
|
(1)
|
Computable credit risk is the sum of the face amounts of loans and leases (including non-performing assets but excluding country risk loans), guarantees and documentary credits.
|
|
(2)
|
Allowances for credit losses as a percentage of non-performing assets.
|
| 4Q08 | 1Q09 | 2Q09 | 3Q09 | 4Q09 | 1Q10 | 2Q10 | ||||||||||||||||||||||
| Individual | 8.30 | % | 8.60 | % | 8.80 | % | 9.70 | % | 9.30 | % | 8.80 | % | 8.20 | % | ||||||||||||||
| Total | 5.70 | % | 6.00 | % | 7.00 | % | 7.70 | % | 7.20 | % | 7.00 | % | 6.60 | % | ||||||||||||||
| Corporate | 3.90 | % | 4.20 | % | 5.70 | % | 6.10 | % | 5.30 | % | 5.30 | % | 5.10 | % |
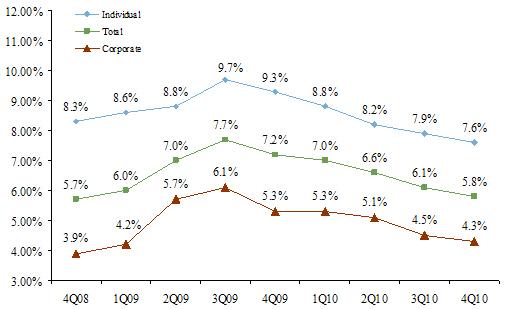
|
(1)
|
Managerial non-performing assets to computable credit risk.
|
|
At December 31,
|
||||||||
|
2010
|
2009
|
|||||||
|
(in millions of R$)
|
||||||||
|
Commercial, financial and industrial
|
3,563 | 3,618 | ||||||
|
Real estate – mortgage
|
150 | 109 | ||||||
|
Installment loans to individuals
|
4,863 | 5,335 | ||||||
|
Lease financing
|
772 | 837 | ||||||
|
Total
|
9,348 | 9,899 | ||||||
|
For the year ended December 31, 2010
|
||||||||||||||||||||||||||||
|
Commercial Banking
|
% of Total
|
Global
Wholesale Banking
|
% of Total
|
Asset Management
and Insurance
|
% of Total
|
Total
|
||||||||||||||||||||||
|
(millions of R$, except percentages)
|
||||||||||||||||||||||||||||
|
Net interest income
|
21,301 | 88.4 | % | 2,501 | 10.4 | % | 292 | 1.2 | % | 24,095 | ||||||||||||||||||
|
Income from equity instruments
|
52 | 100.0 | % | – | 0.0 | % | – | 0.0 | % | 52 | ||||||||||||||||||
|
Income from companies accounted by the equity method
|
44 | 100.0 | % | – | 0.0 | % | – | 0.0 | % | 44 | ||||||||||||||||||
|
Net fee and commission income
|
5,530 | 80.9 | % | 892 | 13.0 | % | 414 | 6.1 | % | 6,836 | ||||||||||||||||||
|
Gains/losses on financial assets and liabilities plus Exchange Differences
|
1,550 | 82.7 | % | 244 | 13.0 | % | 80 | 4.3 | % | 1,875 | ||||||||||||||||||
|
Other operating income/(expenses)
|
(596 | ) | 171.3 | % | (30 | ) | 8.6 | % | 278 | (80.0 | %) | (348 | ) | |||||||||||||||
|
Personnel expenses
|
(5,354 | ) | 90.3 | % | (512 | ) | 8.6 | % | (60 | ) | 1.0 | % | (5,926 | ) | ||||||||||||||
|
Other administrative expenses
|
(5,003 | ) | 94.3 | % | (215 | ) | 4.1 | % | (86 | ) | 1.6 | % | (5,304 | ) | ||||||||||||||
|
Depreciation and amortization of tangible and intangible assets
|
(1,130 | ) | 91.3 | % | (58 | ) | 4.7 | % | (50 | ) | 4.0 | % | (1,237 | ) | ||||||||||||||
|
Provisions (net)
|
(1,941 | ) | 98.3 | % | 4 | (0.2 | %) | (38 | ) | 1.9 | % | (1,974 | ) | |||||||||||||||
|
Impairment losses on financial assets (net)
|
(8,225 | ) | 99.9 | % | (8 | ) | 0.1 | % | – | 0.0 | % | (8,234 | ) | |||||||||||||||
|
Impairment losses on other assets (net)
|
(21 | ) | 100.0 | % | – | 0.0 | % | – | 0.0 | % | (21 | ) | ||||||||||||||||
|
Other nonfinancial gains/(losses)
|
140 | 100.0 | % | – | 0.0 | % | – | 0.0 | % | 140 | ||||||||||||||||||
|
Profit (loss) before tax
|
6,347 | 63.5 | % | 2,818 | 28.2 | % | 832 | 8.3 | % | 9,997 | ||||||||||||||||||
|
For the year ended December 31,
|
||||||||||||||||
|
2010
|
2009
|
% Change
|
Change
|
|||||||||||||
|
(in millions of R$, except percentages)
|
||||||||||||||||
|
Net interest income
|
21,301 | 20,260 | 5.1 | % | 1,041 | |||||||||||
|
Income from equity instruments
|
52 | 30 | 73.0 | % | 22 | |||||||||||
|
Income from companies accounted by the equity method
|
44 | 295 | (85.1 | %) | (251 | ) | ||||||||||
|
Net fee and commission income
|
5,530 | 4,970 | 11.3 | % | 560 | |||||||||||
|
For the year ended December 31,
|
||||||||||||||||
|
2010
|
2009
|
% Change
|
Change
|
|||||||||||||
|
(in millions of R$, except percentages)
|
||||||||||||||||
|
Gains/losses on financial assets and liabilities (net plus Exchange Differences)
|
1,550 | 1,751 | (11.5 | %) | (201 | ) | ||||||||||
|
Other operating income (expenses)
|
(596 | ) | (281 | ) |
n.a.
|
(315 | ) | |||||||||
|
Gross income
|
27,881 | 27,026 | 3.2 | % | 855 | |||||||||||
|
Personnel expenses
|
(5,354 | ) | (4,972 | ) | 7.7 | % | (382 | ) | ||||||||
|
Other administrative expenses
|
(5,003 | ) | (5,213 | ) | (4.0 | %) | 210 | |||||||||
|
Depreciation and amortization of tangible and intangible assets
|
(1,130 | ) | (1,176 | ) | (3.9 | %) | 46 | |||||||||
|
Provisions (net)
|
(1,941 | ) | (3,390 | ) | (42.8 | %) | 1,449 | |||||||||
|
Impairment losses on financial assets (net)
|
(8,225 | ) | (9,884 | ) | (16.8 | %) | 1,659 | |||||||||
|
Impairment losses on other assets (net)
|
(21 | ) | (900 | ) |
n.a.
|
879 | ||||||||||
|
Other nonfinancial gains (losses)
|
140 | 3,403 | (95.9 | %) | (3,263 | ) | ||||||||||
|
Profit (loss) before tax
|
6,347 | 4,894 | 29.7 | % | 1,453 | |||||||||||
|
For the year ended December 31,
|
||||||||||||||||
|
2010
|
2009
|
% Change
|
Change
|
|||||||||||||
|
(in millions of R$, except percentages)
|
||||||||||||||||
|
Net interest income
|
2,501 | 1,767 | 41.6 | % | 734 | |||||||||||
|
Income from equity instruments
|
– | – | 0.0 | % | – | |||||||||||
|
Income from companies accounted by the equity method
|
– | – | 0.0 | % | – | |||||||||||
|
Net fee and commission income
|
892 | 863 | 3.3 | % | 29 | |||||||||||
|
Gains/losses on financial assets and liabilities (net) plus Exchange Differences
|
244 | 859 | (71.5 | %) | (615 | ) | ||||||||||
|
Other operating income (expenses)
|
(30 | ) | (23 | ) | 30.4 | % | (7 | ) | ||||||||
|
Gross income
|
3,608 | 3,467 | 4.1 | % | 141 | |||||||||||
|
Personnel expenses
|
(512 | ) | (474 | ) | 8.0 | % | (38 | ) | ||||||||
|
Other administrative expenses
|
(215 | ) | (175 | ) | 23.1 | % | (40 | ) | ||||||||
|
Depreciation and amortization of tangible and intangible assets
|
(58 | ) | (39 | ) | 48.0 | % | (19 | ) | ||||||||
|
Provisions (net)
|
4 | (45 | ) | (109.0 | %) | 49 | ||||||||||
|
Impairment losses on financial assets (net)
|
(8 | ) | (83 | ) |
n.a.
|
75 | ||||||||||
|
Profit (loss) before tax
|
2,818 | 2,651 | 6.3 | % | 167 | |||||||||||
|
For the year ended December 31,
|
||||||||||||||||
|
2010
|
2009
|
% Change
|
Change
|
|||||||||||||
|
(in millions of R$, except percentages)
|
(in millions of R$)
|
|||||||||||||||
|
Net interest income
|
292 | 140 | 108.9 | % | 152 | |||||||||||
|
Income from equity instruments
|
– | – | 0.0 | % | – | |||||||||||
|
Income from companies accounted by the equity method
|
– | – | 0.0 | % | – | |||||||||||
|
Net fee and commission income
|
414 | 405 | 2.2 | % | 9 | |||||||||||
|
Gains/losses on financial assets and liabilities (net) plus Exchange Differences
|
80 | 54 | 48.7 | % | 26 | |||||||||||
|
Other operating income (expenses)
|
278 | 188 | 48.0 | % | 90 | |||||||||||
|
For the year ended December 31,
|
||||||||||||||||
|
2010
|
2009
|
% Change
|
Change
|
|||||||||||||
|
(in millions of R$, except percentages)
|
(in millions of R$)
|
|||||||||||||||
|
Gross income
|
1,065 | 787 | 35.3 | % | 278 | |||||||||||
|
Personnel expenses
|
(60 | ) | (65 | ) | (7.7 | %) | 5 | |||||||||
|
Other administrative expenses
|
(86 | ) | (48 | ) | 78.6 | % | (38 | ) | ||||||||
|
Depreciation and amortization of tangible and intangible assets
|
(50 | ) | (34 | ) | 46.4 | % | (16 | ) | ||||||||
|
Provisions (net)
|
(38 | ) | (46 | ) | (18.2 | %) | 8 | |||||||||
|
Profit (loss) before tax
|
832 | 592 | 40.5 | % | 240 | |||||||||||
|
|
·
|
Net interest income increased 5.1% or R$1.0 billion in the year ended December 31, 2010. This increase was mainly due to growth in our lending activities and the revenues from the utilization of the proceeds of the IPO in late 2009.
|
|
|
·
|
Net fee and commission income had increased 11.3% or R$560 million in 2010. This growth is principally due to increased commissions from the sale of insurance and capitalization products, and credit and debit cards driven by strong penetration of products and the expansion on our card base.
|
|
At December 31,
(1)
|
||||||||||||||||||||||||
|
2011
|
2010
|
2009
|
||||||||||||||||||||||
|
Amount
|
Ratio
|
Amount
|
Ratio
|
Amount
|
Ratio
|
|||||||||||||||||||
|
Tier 1 capital
|
48,327 | 17.5 | % | 44,884 | 19.0 | % | 42,353 | 20.7 | % | |||||||||||||||
|
Tier 2 capital
|
6,642 | 2.4 | % | 7,433 | 3.1 | % | 9,973 | 4.9 | % | |||||||||||||||
|
Tier 1 and 2 capital
|
54,969 | 19.9 | % | 52,317 | 22.1 | % | 52,325 | 25.6 | % | |||||||||||||||
|
Required Regulatory Capital
(2)
|
30,431 |
n.a.
|
26,020 |
n.a.
|
22,483 |
n.a.
|
||||||||||||||||||
|
(1)
|
Disregarding the effect of goodwill.
|
|
(2)
|
Includes credit, market and operational risk capital required.
|
|
As of December 31,
|
||||||||||||
|
2011
|
2010
|
2009
|
||||||||||
|
(in millions of R$)
|
||||||||||||
|
Deposits from the Brazilian Central Bank and credit institutions
|
||||||||||||
|
Time deposits
|
27,023 | 28,867 | 20,838 | |||||||||
|
Other demand accounts
|
134 | 344 | 195 | |||||||||
|
Repurchase agreements
|
24,371 | 13,180 | 164 | |||||||||
|
Total
|
51,527 | 42,391 | 21,197 | |||||||||
|
Customer deposits
|
||||||||||||
|
Current accounts
|
13,561 | 16,132 | 15,140 | |||||||||
|
Savings accounts
|
23,293 | 30,303 | 25,216 | |||||||||
|
Time deposits
|
83,942 | 68,916 | 74,634 | |||||||||
|
Repurchase agreements
|
53,678 | 52,598 | 34,450 | |||||||||
|
Total
|
174,474 | 167,949 | 149,440 | |||||||||
|
Total deposits
|
226,001 | 210,340 | 170,637 | |||||||||
|
As of December 31,
|
||||||||||||||||||||||||
|
2011
|
2010
|
2009
|
||||||||||||||||||||||
|
Amount
|
Average Rate
|
Amount
|
Average Rate
|
Amount
|
Average Rate
|
|||||||||||||||||||
|
(in millions of R$, except percentages)
|
||||||||||||||||||||||||
|
Securities sold under agreements to repurchase
|
||||||||||||||||||||||||
|
At December 31
|
78,048 | 10.9 | % | 65,778 | 9.8 | % | 34,614 | 9.9 | % | |||||||||||||||
|
Average during year
|
64,510 | 11.9 | % | 53,623 | 10.3 | % | 32,493 | 11.5 | % | |||||||||||||||
|
Maximum month-end balance
|
76,693 | 0.0 | % | 68,734 | 0.0 | % | 37,214 | 0.0 | % | |||||||||||||||
|
Total short-term borrowings at year-end
(1)
|
78,048 | 65,778 | 34,614 | |||||||||||||||||||||
|
(1)
|
Includes in Deposits from the Brazilian Central Bank and credit institutions and customer deposits.
|
|
|
·
|
Borrowings.
We have relationships with banks all over the world, providing credit lines as foreign currency-linked (either to the U.S. dollar or to a basket of foreign currencies). We apply the proceeds from these transactions mainly to U.S. dollar-linked lending operations and in particular to trade finance operations.
|
|
|
·
|
Domestic Onlendings.
We onlend from public institutions, mainly BNDES and FINAME, for which we act as a financial agent. Funding from these sources in Brazil represents a method of providing long-term loans with attractive average interest rates to certain sectors of the economy. Loans from these funds are allocated by BNDES through banks to specific sectors targeted for economic development. This type of lending is known as “repassing” or “onlending”. Under this arrangement, we borrow funds from BNDES
|
|
|
|
or FINAME, the equipment financing subsidiary of BNDES, and pass the funds to the targeted sector of the economy. These loans are generally granted at rates below the average market rates and have an average maturity of up to five years. Because the repassed funds are generally matched and/or funded by loans from a federal government agency, we take no interest rate or maturity mismatch risk nor charge interest at a fixed margin over its cost of funds. We, however, retain the commercial credit risk of the borrower and therefore have discretion in the lending decision and application of the credit criteria. This type of funding is not affected by compulsory deposit requirements. The onlending is generally secured or guaranteed, although this is not required by the terms of the onlending.
|
|
|
·
|
Financial problems in certain countries in Europe could lead to another international financial crisis. If this occurs, Brazilian GDP growth in future periods may be depressed and, as a result, our credit portfolio may not grow or could decrease and our provisions for loan losses would increase;
|
|
|
·
|
Inflation increases that causes an increase in interest rates and lower growth in lending;
|
|
|
·
|
Continued market volatility and instability could affect our revenues;
|
|
|
·
|
Restrictive regulations or government intervention in the banking business would affect our margins and/or lending growth;
|
|
|
·
|
Regulatory capital changes towards more restrictive rules as a response to potential financial crisis or general macroeconomic conditions;
|
|
|
·
|
Decreased liquidity in domestic capital market;
|
|
|
·
|
Tax policies that could decrease our profitability;
|
|
|
·
|
Currency fluctuation and exchange rate controls that could have an adverse impact on international investors.
|
|
At December 31,
|
||||||||||||
|
2011
|
2010
|
2009
|
||||||||||
|
(millions of R$)
|
||||||||||||
|
Contingent liabilities
|
||||||||||||
|
Financial guarantees and other securities
|
21,872 | 22,122 | 20,506 | |||||||||
|
Documentary credits
|
700 | 441 | 461 | |||||||||
|
Total contingent liabilities
|
22,572 | 22,563 | 20,967 | |||||||||
|
Commitments
|
||||||||||||
|
Loan commitments drawable by third parties
(1)
|
98,553 | 93,472 | 77,789 | |||||||||
|
Total commitments
|
98,553 | 93,472 | 77,789 | |||||||||
|
Total
|
121,125 | 116,035 | 98,757 | |||||||||
|
(1)
|
Includes the approved limits and unused overdraft, credit card and others.
|
|
At December 31, 2011
|
||||||||||||||||||||
|
Total
|
Less than 1 year
|
1-3 years
|
3-5 years
|
More than 5 years
|
||||||||||||||||
|
(in millions of R$)
|
||||||||||||||||||||
|
Contractual Obligations
|
||||||||||||||||||||
|
Deposits from the Brazilian Central Bank and credit institutions(1)
|
51,527 | 43,590 | 5,954 | 1,028 | 955 | |||||||||||||||
|
Customer deposits
|
174,474 | 104,802 | 56,086 | 13,530 | 56 | |||||||||||||||
|
Marketable debt securities
|
38,590 | 17,289 | 15,922 | 4,263 | 1,116 | |||||||||||||||
|
Subordinated liabilities
|
10,908 | – | 5,402 | 5,269 | 237 | |||||||||||||||
|
Total
|
275,499 | 165,681 | 83,364 | 24,090 | 2,364 | |||||||||||||||
|
(1)
|
Includes R$23,925 million of repurchase agreements with maturity on January 2, 2012.
The above table does not reflect amounts that we may have to pay on derivative contracts. The amounts ultimately payable will depend upon movements in the financial markets. The aggregate fair value of all our derivative contracts at December 31, 2011 was R$511 million, compared to R$378 million at December 31, 2010.
In addition, we lease many properties under standard real estate lease contracts, which leases can be canceled at our option and include renewal options and escalation clauses. Total future minimum payments of non-
cancelable operating leases as of December 31, 2011 was R$2,019 million, of which R$602.5 million matures in up to one year, R$1,361.3 million from one year to up to five years and R$55.2 million after five years. Additionally, we have contracts with indeterminate maturities totaling R$2.3 million per month.
|
|
Name
|
Position
|
Date of Birth
|
||
|
Celso Clemente Giacometti
|
Chairman (Independent member)
|
October 13, 1943
|
||
|
Marcial Angel Portela Alvarez
|
Vice Chairman
|
March 24, 1945
|
||
|
José Antonio Alvarez Alvarez
|
Member
|
January 6, 1960
|
||
|
José Manuel Tejón Borrajo
|
Member
|
July 11, 1951
|
||
|
José de Menezes Berenguer Neto
|
Member
|
September 10, 1966
|
||
|
José de Paiva Ferreira
|
Member
|
March 1, 1959
|
||
|
José Roberto Mendonça de Barros
|
Independent Member
|
February 7, 1944
|
||
|
Viviane Senna Lalli
|
Independent Member
|
June 14, 1957
|
|
Name
|
Position
|
Date of Birth
|
||
|
Marcial Angel Portela Alvarez
(1)
|
Chief Executive Officer
|
March 24, 1945
|
||
|
Conrado Engel
(1)
|
Senior Vice President Executive Officer
|
May 30, 1957
|
||
|
Angel Oscar Agallano
(1)
|
Vice President Executive Officer
|
March 18, 1957
|
||
|
Carlos Alberto López Galán
(1)
|
Vice President Executive Officer
|
November 6, 1962
|
||
|
Ignacio Dominguez-Adame Bozzano
(1)
|
Vice President Executive Officer
|
August 20, 1968
|
||
|
João Guilherme de Andrade So Consiglio
(1)
|
Vice President Executive Officer
|
December 7, 1968
|
||
|
Juan Manuel Hoyos Mart
í
nez de Irujo
(1)(2)(3)
|
Vice President Executive Officer
|
January 7, 1953
|
||
|
Lilian Maria Ferezim Guimarães
(1)
|
Vice President Executive Officer
|
August 26, 1960
|
||
|
Luís Felix Cardamone Neto
(1)
|
Vice President Executive Officer
|
March 16, 1964
|
||
|
Marco Antonio Martins de Araújo Filho
(1)
|
Vice President Executive Officer
|
June 19, 1965
|
||
|
Oscar Rodrigues Herrero
(1)
|
Vice President Executive Officer
|
October 4, 1971
|
||
|
Pedro Carlos Araújo Coutinho
(1)
|
Vice President Executive Officer
|
April 2, 1966
|
||
|
Pedro Paulo Longuini
(1)
|
Vice President Executive Officer
|
June 7, 1957
|
||
|
José Roberto Machado Filho
|
Executive Officer
|
August 25, 1968
|
||
|
Luciane Ribeiro
|
Executive Officer
|
June 7, 1963
|
||
|
Maria Luiza de Oliveira Pinto e Paiva
|
Executive Officer
|
July 14, 1963
|
||
|
Jose Alberto Zamorano Hernandez
|
Executive Officer
|
May 9, 1962
|
||
|
Amancio Acúrcio Gouveia
|
Officer
|
March 31, 1963
|
||
|
André Fernandes Berenguer
|
Officer
|
January 13, 1968
|
||
|
Antonio Pardo de Santayana Montes
|
Officer
|
November 5, 1971
|
||
|
Cassio Schmitt
|
Officer
|
April 23, 1971
|
||
|
Cassius Schymura
|
Officer
|
February 19, 1965
|
||
|
Clovis Hideaki Ikeda
|
Officer
|
September 23, 1963
|
||
|
Ede Ilson Viani
|
Officer
|
September 5, 1967
|
||
|
Eduardo Müller Borges
|
Officer
|
September 12, 1967
|
||
|
Flávio Tavares Valadão
|
Officer
|
July 1, 1963
|
||
|
Gilberto Duarte de Abreu Filho
|
Officer
|
August 7, 1973
|
||
|
Gilson Finkelsztain
|
Officer
|
December 22, 1972
|
||
|
Jamil Habibe Hannouche
|
Officer
|
June 23, 1960
|
||
|
Luis Alberto Citon
|
Officer
|
May 17, 1963
|
||
|
Luis Carlos Guimarães de Carvalho Morais
(3)
|
Officer
|
June 7, 1966
|
||
|
Luiz Carlos da Silva Cantidio Jr.
|
Officer
|
July 11, 1958
|
||
|
Luiz Felipe Taunay Ferreira
|
Officer
|
March 18, 1967
|
||
|
Mara Regina Lima Alves Garcia
|
Officer
|
December 28, 1966
|
||
|
Marcelo Audi
(2)
|
Officer
|
January 18, 1967
|
||
|
Marcelo Malanga
|
Officer
|
May 18, 1969
|
||
|
Marcelo Zerbinatti
|
Officer
|
February 5, 1974
|
||
|
Marcio Aurelio de Nobrega
|
Officer
|
August 23, 1967
|
||
|
Marco André Ferreira da Silva
|
Officer
|
December 3, 1965
|
||
|
Marcos Adriano Ferreira Zoni
|
Officer
|
December 10, 1964
|
||
|
Maria Eugênia Andrade Lopez Santos
|
Officer
|
January 23, 1966
|
||
|
Mauro Siequeroli
|
Officer
|
March 24, 1957
|
||
|
Miguel Angel Albero Ocerin
|
Officer
|
February 23, 1960
|
||
|
Nilo Sérgio Silveira Carvalho
|
Officer
|
February 26, 1961
|
||
|
Paulo de Tarso Marques Rosa
(2)
|
Officer
|
September 16, 1972
|
||
|
Ramón Sanchez Díez
|
Officer
|
October 29, 1968
|
|
Name
|
Position
|
Date of Birth
|
||
|
Reginaldo Antonio Ribeiro
|
Officer
|
May 19, 1969
|
||
|
Roberto de Oliveira Campos Neto
|
Officer
|
June 28, 1969
|
||
|
Ronaldo Yassuyuki Morimoto
|
Officer
|
May 5, 1977
|
||
|
Sérgio Augusto Costantini
|
Officer
|
June 19, 1970
|
||
|
Sergio Gonçalves
|
Officer
|
August 7, 1956
|
||
|
Thomas Gregor Ilg
|
Officer
|
September 12, 1968
|
||
|
Ulisses Gomes Guimarães
|
Officer
|
March 14, 1971
|
||
|
Wilson Luiz Matar
|
Officer
|
November 28, 1958
|
|
(1)
|
Member of the executive committee, which is a non-statutory committee involved in making policy decisions related to business management and operational support, human resources, allocation of capital and major technological, infrastructure and services projects.
|
|
(2)
|
Members elected at the board of directors meeting held on February 29, 2012, whose appointment is subject to Brazilian Central Bank approval.
|
|
(3)
|
Member whose appointment is subject to obtaining a Brazilian permanent visa, until which time such individual is not authorized to act as an officer of the Bank.
|
|
|
·
|
Supervised Collective
. The program is for members of our executive committee and other executives who manage significant risks for the Bank and are responsible for internal control. Unlike the plans described above, for which compensation is paid in cash based on the market performance of our shares, compensation under this plan is paid 50% in cash, indexed to 100% of the CDI, and 50% in shares.
|
|
|
·
|
Collective Unsupervised
–
Statutory Directors
. Eligible officers for this program include statutory officers that are not participants in the Supervised Collective program. Unlike the plans described above, for which compensation is paid in cash based on the market performance of our shares, compensation under this plan is paid 100% in units of the Company (trading symbol “SANB11”).
|
|
|
·
|
Collective Unsupervised
–
Employees
. Individuals eligible for this program include manager employees and certain other employees of the organization that will be benefited by this compensation plan. Deferred compensation will be 100% in cash, indexed to 120% of the CDI.
|
|
SOP Plan,
PI12 – PSP Plan
and PI13 – PSP
(1)
|
SOP 2014
(2)
|
|||||||
|
(% of Shares exercisable)
|
||||||||
|
1
st
|
50 | % | 100 | % | ||||
|
2
nd
|
35 | % | 75 | % | ||||
|
3
rd
|
25 | % | 50 | % | ||||
|
4
th
|
0 | % | 25 | % | ||||
|
(1)
|
Associated with the TSR, the remaining 50% of the shares subject to exercise relate to the achievement of net income versus budgeted profit.
|
|
(2)
|
The percentage of shares determined at the position of TSR is subject to a penalty according to the implementation of the RORAC.
|
|
PI13 PSP(1)
Binomial
|
PI12 PSP(1)
Binomial
|
|||||||
|
Volatility
|
57.37 | % | 57.37 | % | ||||
|
Likelihood of Occurrence
|
37.58 | % | 60.93 | % | ||||
|
Risk-Free Rate
|
10.50 | % | 11.18 | % | ||||
|
(1)
|
Associated with the TSR, the remaining 50% of the shares subject to exercise relate to the achievement of net income versus budgeted profit.
|
|
SOP 2014
Black-Scholes
|
SOP Plan
Binomial
|
|||||||
|
Volatility
|
40.00 | % | 57.37 | % | ||||
|
Dividend Rate
|
3.00 | % | 5.43 | % | ||||
|
Period of “Vesting”
|
2 years
|
2,72 years
|
||||||
|
Moment “Medium” Exercise
|
5 years
|
3,72 years
|
||||||
|
Risk-Free Rate
|
10.50 | % | 11.18 | % | ||||
|
Likelihood of Occurrence
|
53.43 | % | 60.93 | % | ||||
|
Fair Value for Stock
|
R$ | 5.81 | R$ | 7.19 | ||||
|
Santander Spain’s Place
in the TSR Ranking
|
Percentage of Maximum Shares to Be Delivered
|
Santander Spain’s Place in the EPS Growth Ranking
|
Percentage of Maximum Shares to Be Delivered
|
|||
|
1st to 5th
|
100%
|
1st to 5th
|
100%
|
|||
|
6th
|
82%
|
6th
|
82%
|
|||
|
7th
|
65.0%
|
7th
|
65.0%
|
|||
|
8th
|
47.5%
|
8th
|
47.5%
|
|||
|
9th
|
30.0%
|
9th
|
30.0%
|
|||
|
10th and below
|
0%
|
10th and below
|
0%
|
|
|
·
|
It was assumed that the beneficiaries will not terminate the employment with the bank during the term of each plan.
|
|
|
·
|
The fair value of the 50% linked to Santander Spain’s relative TSR position was calculated, on the grant date, on the basis of the report provided by external valuators whose assessment was carried out using a Monte Carlo valuation model, performing 10 thousand simulations to determine the TSR of each of the companies in the benchmark group, taking into account the variables set forth below. The results (each of which represents the delivery of a number of shares) are classified in decreasing order by calculating the weighted average and discounting the amount at the risk-free interest rate.
|
|
PI10
|
PI11
|
PI12
|
PI13
|
PI14
|
||||||||||||||||
|
Expected volatility
(1)
|
15.67 | % | 19.31 | % | 42.36 | % | 49.64 | % | 51.35 | % | ||||||||||
|
Annual dividend yield based on last few years
|
3.24 | % | 3.47 | % | 4.88 | % | 6.33 | % | 6.06 | % | ||||||||||
|
Risk-free interest rate (Treasury Bond yield – zero coupon) over the period of the plan
|
4.50 | % | 4.84 | % | 2.04 | % | 3.33 | % | 4.07 | % | ||||||||||
|
(1)
|
Calculated on the basis of historical volatility over the corresponding period (two or three years).
|
|
|
1.
|
sets forth the operating rules for its operation;
|
|
|
2.
|
advises the board of directors on the engagement or replacement of the external auditor;
|
|
|
3.
|
assesses the quality of the accounting statements for the periods ended March 31, June 30, September 30, and December 31 each year, of the senior management reports, of the explanatory notes and of the independent auditor’s report, as well as of other material financial information disclosed and sent to the regulatory bodies;
|
|
|
4.
|
evaluates the effectiveness of the normative provisions applicable to us, in addition to internal regulation and codes;
|
|
|
5.
|
evaluates the fulfillment by our management of the recommendations made by the external or internal auditors;
|
|
|
6.
|
sets forth and disclose procedures to receive and treat information on the non-fulfillment of the legal and normative provisions applicable to us, in addition to internal codes and regulations, including provisions of specific procedures for the protection of the discloser and confidentiality of information;
|
|
|
7.
|
advises the executive committee to correct or improve policies, practices and procedures related to their own assignments;
|
|
|
8.
|
meets, at least on a quarterly basis, with the executive committee, the internal and external audits, in order to verify the implementation of the recommendations, including as to the planning of the respective audit works, and formalizing, by means of minutes, the contents of such meetings;
|
|
|
9.
|
meets with the tax committee, if operating, and with the board of directors, upon their request, to address policies, practices and procedures identified in the scope of their work;
|
|
|
10.
|
prepares, at the end of the six-month period ended on June 30 and December 31 every year, the report of the audit committee, meeting the applicable legal and regulatory provisions; and
|
|
|
11.
|
receives and reviews the reports required by the regulatory bodies concerning the activities of the ombudsman office of Santander Brasil, on the base dates of June 30 and December 31 or when a material event is identified.
|
|
|
1.
|
sets internal committee policy and governing rules;
|
|
|
2.
|
develops internal compensation policies applicable to our directors and makes proposals to our board of directors regarding policies for variable and fixed compensation, benefits, and special programs for recruiting and terminations;
|
|
|
3.
|
supervises the implementation and operation of our internal director compensation policy;
|
|
|
4.
|
annually reviews our internal director compensation policy and recommends changes to our board of directors;
|
|
|
5.
|
recommends to the board of executive officer directors revisions to our internal compensation policy and related practices and procedures;
|
|
|
6.
|
proposes to the board of directors the aggregate compensation of the directors to be submitted to the general meeting, pursuant to article 152 of Law No. 6,404 of 1976;
|
|
|
7.
|
analyzes possible internal and external factors that may impact our internal director compensation policy;
|
|
|
8.
|
analyzes our internal officer compensation policy and procedures in comparison with market practice, and recommends changes to align our policies with market practice if significant differences from market practice are identified;
|
|
|
9.
|
meets with our board of directors to discuss and identified responsibilities for our internal compensation policy, practices and procedures;
|
|
|
10.
|
annually prepares, within ninety days as from December 31 of each year, the compensation and appointment committee report, in accordance with applicable statutory and regulatory provisions; and
|
|
|
11.
|
ensures that the internal director compensation policy is compatible with our risk management rules, with performance targets and with our current and expected financial condition, and pursuant to the applicable regulatory provisions and regulations published by the Brazilian Central Bank.
|
|
At December 31, 2011
|
At December 31, 2010
|
At December 31, 2009
|
At December 31, 2008
|
|||||||||||||
|
Branch employees
|
36,382 | 35,863 | 32,938 | 35,046 | ||||||||||||
|
Administration employees
|
18,220 | 18,543 | 18,303 | 18,362 | ||||||||||||
|
Total
|
54,602 | 54,406 | 51,241 | 53,408 | ||||||||||||
|
Shareholder
|
Common Shares
|
Percentage of Outstanding Common Shares
|
Preferred Shares
|
Percentage of Outstanding Preferred Shares
|
Percentage of Total Share Capital
|
|||||||||||||||
|
André Fernandes Berenguer
|
702,075 | (1 | ) | 638,250 | (1 | ) | (1 | ) | ||||||||||||
|
Angel Oscar Agallano
|
941,985 | (1 | ) | 856,350 | (1 | ) | (1 | ) | ||||||||||||
|
Cassio Schmitt
|
297,165 | (1 | ) | 270,150 | (1 | ) | (1 | ) | ||||||||||||
|
Celso Clemente Giacometti
|
1 | (1 | ) | (1 | ) | (1 | ) | |||||||||||||
|
Jamil Habibe Hannouche
|
187,220 | (1 | ) | 170,200 | (1 | ) | (1 | ) | ||||||||||||
|
João Guilherme de Andrade So Consiglio
|
234,025 | (1 | ) | 212,750 | (1 | ) | (1 | ) | ||||||||||||
|
José Antonio Alvarez Alvarez
|
1 | (1 | ) | (1 | ) | (1 | ) | |||||||||||||
|
José de Menezes Berenguer Neto
|
351,011 | (1 | ) | 319,100 | (1 | ) | (1 | ) | ||||||||||||
|
José de Paiva Ferreira
|
468,051 | (1 | ) | 425,500 | (1 | ) | (1 | ) | ||||||||||||
|
José Manuel Tej
ó
n Borrajo
|
1 | (1 | ) | (1 | ) | (1 | ) | |||||||||||||
|
José Roberto Machado Filho
|
702,075 | (1 | ) | 638,250 | (1 | ) | (1 | ) | ||||||||||||
|
José Roberto Mendonça de Barros
|
1 | (1 | ) | (1 | ) | (1 | ) | |||||||||||||
|
Lilian Maria Ferezim Guimarães
|
351,010 | (1 | ) | 319,100 | (1 | ) | (1 | ) | ||||||||||||
|
Luciane Ribeiro
|
702,076 | (1 | ) | 638,251 | (1 | ) | (1 | ) | ||||||||||||
|
Luis Alberto Citon
|
70,180 | (1 | ) | 63,800 | (1 | ) | (1 | ) | ||||||||||||
|
Luiz Carlos da Silva Cantidio Junior
|
7 | (1 | ) | 8 | (1 | ) | (1 | ) | ||||||||||||
|
Mara Regina Lima Alves Garcia
|
60,445 | (1 | ) | 54,950 | (1 | ) | (1 | ) | ||||||||||||
|
Marcelo Malanga
|
116,985 | (1 | ) | 106,350 | (1 | ) | (1 | ) | ||||||||||||
|
Marcelo Zerbinatti
|
244,420 | (1 | ) | 222,200 | (1 | ) | (1 | ) | ||||||||||||
|
Marcial Angel Portela Alvarez
|
1,556,501 | (1 | ) | 1,415,000 | (1 | ) | (1 | ) | ||||||||||||
|
Marcio Aurelio de Nobrega
|
46,805 | (1 | ) | 42,550 | (1 | ) | (1 | ) | ||||||||||||
|
Marco Antônio Martins de Araújo Filho
|
390,500 | (1 | ) | 355,000 | (1 | ) | (1 | ) | ||||||||||||
|
Marcos Adriano Ferreira Zoni
|
234,025 | (1 | ) | 212,750 | (1 | ) | (1 | ) | ||||||||||||
|
Marcos Matioli de Souza Vieira
|
207,434 | (2 | ) | 181,157 | (2 | ) | (2 | ) | ||||||||||||
|
Maria Luiza de Oliveira Pinto e Paiva
|
234,025 | (1 | ) | 212,750 | (1 | ) | (1 | ) | ||||||||||||
|
Mauro Siequeroli
|
23,375 | (1 | ) | 21,250 | (1 | ) | (1 | ) | ||||||||||||
|
Shareholder
|
Common Shares
|
Percentage of Outstanding Common Shares
|
Preferred Shares
|
Percentage of Outstanding Preferred Shares
|
Percentage of Total Share Capital
|
|||||||||||||||
|
Miguel Angel Albero Ocerin
|
275,000 | (1 | ) | 250,000 | (1 | ) | (1 | ) | ||||||||||||
|
Oscar Rodriguez Herrero
|
600,160 | (1 | ) | 545,600 | (1 | ) | (1 | ) | ||||||||||||
|
Pedro Carlos Araújo Coutinho
|
473,000 | (1 | ) | 430,000 | (1 | ) | (1 | ) | ||||||||||||
|
Reginaldo Antonio Ribeiro
|
234,025 | (1 | ) | 212,750 | (1 | ) | (1 | ) | ||||||||||||
|
Sérgio Gonçalves
|
702,075 | (1 | ) | 638,250 | (1 | ) | (1 | ) | ||||||||||||
|
Thomas Gregor Ilg
|
471,625 | (1 | ) | 428,750 | (1 | ) | (1 | ) | ||||||||||||
|
Ulisses Gomes Guimarães
|
52,690 | (1 | ) | 47,900 | (1 | ) | (1 | ) | ||||||||||||
|
Viviane Senna Lalli
|
1 | (1 | ) | (1 | ) | (1 | ) | |||||||||||||
|
Wilson Luiz Matar
|
65,725 | (1 | ) | 59,750 | (1 | ) | (1 | ) | ||||||||||||
|
Other Employees
|
200,431,370 | (1 | ) | 183,469,564 | (1 | ) | (1 | ) | ||||||||||||
|
(1)
|
Owns less than 0.01%.
|
|
(2)
|
No longer an officer.
|
|
Principal Shareholders
|
Common Shares
|
Percentage of Outstanding Common Shares
|
Preferred Shares
|
Percentage of Outstanding Preferred Shares
|
Percentage of Total Share Capital
|
|||||||||||||||
|
(in thousands, except percentages)
|
||||||||||||||||||||
|
Grupo Empresarial Santander S.L.
|
72,876,994 | 34.24 | % | 61,631,776 | 33.10 | % | 33.71 | % | ||||||||||||
|
Sterrebeeck
|
99,527,083 | 46.76 | % | 86,492,330 | 46.45 | % | 46.62 | % | ||||||||||||
|
Santander Insurance Holding S.L.
|
206,664 | 0.10 | % | – | 0.00 | % | 0.05 | % | ||||||||||||
|
Banco Santander, S.A.
|
2,090,231 | 0.98 | % | 1,900,210 | 1.02 | % | 1.00 | % | ||||||||||||
|
Treasury Shares
|
391,254 | 0.18 | % | 355,685 | 0.19 | % | 0.19 | % | ||||||||||||
|
Employees(1)
|
211,427 | 0.10 | % | 193,458 | 0.10 | % | 0.10 | % | ||||||||||||
|
Minority Shareholders
|
37,538,079 | 17.64 | % | 35,628,926 | 19.13 | % | 18.34 | % | ||||||||||||
|
Total
|
212,841,732 | 100.0 | % | 186,202,385 | 100.0 | % | 100.0 | % |
|
(1)
|
Includes members of senior management. See “Item 6. Directors, Senior Management and Employees—E. Share Ownership”.
|
|
December 31, 2011
|
December 31, 2010
|
|||||||||||||||||||||||
|
Parent(1)
|
Joint–controlled companies
|
Other Related–Party(2)
|
Parent(1)
|
Joint–controlled companies
|
Other Related–Party(2)
|
|||||||||||||||||||
|
(in thousands of R$)
|
||||||||||||||||||||||||
|
Assets
|
||||||||||||||||||||||||
|
Trading derivatives, net
|
(25,639 | ) | – | (442,496 | ) | 35,513 | – | (125,147 | ) | |||||||||||||||
|
Banco Santander S.A. – Spain
|
(25,639 | ) | – | – | 35,513 | – | – | |||||||||||||||||
|
Santander Benelux, S.A., N.V.
|
– | – | (308,821 | ) | – | – | (118,521 | ) | ||||||||||||||||
|
Abbey National Treasury Services Plc
|
– | – | (39,102 | ) | – | – | (33,076 | ) | ||||||||||||||||
|
Real Fundo de Investimento Multimercado Santillana Cr
é
dito Privado
|
– | – | (94,573 | ) | – | – | 26,450 | |||||||||||||||||
|
Loans and amounts due from credit institutions – Cash and overnight operations in foreign currency
|
227,724 | – | 1,097 | 4,245,332 | – | 729 | ||||||||||||||||||
|
Banco Santander S.A. – Spain(3)
|
227,724 | – | – | 4,245,332 | – | – | ||||||||||||||||||
|
Banco Santander Totta, S.A.
|
– | – | 1,097 | – | – | 729 | ||||||||||||||||||
|
Loans and amounts due from credit institutions – Others
|
95,539 | 822,928 | 266,568 | 16,922 | 269,667 | 279,535 | ||||||||||||||||||
|
Banco Santander S.A. – Spain
|
95,539 | – | – | 16,922 | – | – | ||||||||||||||||||
|
Santander Benelux, S.A., N.V.
|
– | – | 262,818 | – | – | 258,261 | ||||||||||||||||||
|
Companhia de Crédito, Financiamento e Investimento RCI Brasil
|
– | 822,606 | – | – | 263,559 | – | ||||||||||||||||||
|
Companhia de Arrendamento Mercantil RCI Brasil
|
– | 322 | – | – | 6,108 | – | ||||||||||||||||||
|
Abbey National Treasury Services Plc
|
– | – | 1,369 | – | – | 18,817 | ||||||||||||||||||
|
Santander Overseas Bank, Inc – Puerto Rico
|
– | – | 2,381 | – | – | 2,457 | ||||||||||||||||||
|
Other Assets
|
5,438 | 615 | 383,271 | 27,090 | 795 | – | ||||||||||||||||||
|
Banco Santander S.A. – Spain
|
5,438 | – | – | 27,090 | – | – | ||||||||||||||||||
|
Companhia de Crédito, Financiamento e Investimento RCI Brasil
|
– | 615 | – | – | 529 | – | ||||||||||||||||||
|
Companhia de Arrendamento Mercantil RCI Brasil
|
– | – | – | – | 266 | – | ||||||||||||||||||
|
Santander Seguros
|
– | – | 326,637 | – | – | – | ||||||||||||||||||
|
Others
|
– | – | 57,234 | – | – | – | ||||||||||||||||||
|
Liabilities
|
||||||||||||||||||||||||
|
Deposits from credit institutions
|
(1,200,207 | ) | (15,213 | ) | (171,371 | ) | (2,167,452 | ) | (76,340 | ) | (1,940,158 | ) | ||||||||||||
|
Banco Santander S.A. – Spain(4)
|
(1,200,207 | ) | – | – | (2,167,452 | ) | – | – | ||||||||||||||||
|
Grupo Banesto: Sociedades consolidables
|
– | – | (167,081 | ) | – | – | (75,477 | ) | ||||||||||||||||
|
Banco Madesant – Sociedade Unipessoal, S.A.(5)
|
– | – | – | – | – | (1,857,963 | ) | |||||||||||||||||
|
December 31, 2011
|
December 31, 2010
|
|||||||||||||||||||||||
|
Parent(1)
|
Joint–controlled companies
|
Other Related–Party(2)
|
Parent(1)
|
Joint–controlled companies
|
Other Related–Party(2)
|
|||||||||||||||||||
|
(in thousands of R$)
|
||||||||||||||||||||||||
|
Companhia de Crédito, Financiamento e Investimento RCI Brasil
|
– | (10,348 | ) | – | – | (73,270 | ) | – | ||||||||||||||||
|
Companhia de Arrendamento Mercantil RCI Brasil
|
– | (4,865 | ) | – | – | (3,070 | ) | – | ||||||||||||||||
|
Others
|
– | – | (4,290 | ) | – | – | (6,718 | ) | ||||||||||||||||
|
Customer Deposits
|
– | – | (422,753 | ) | – | – | (375,869 | ) | ||||||||||||||||
|
ISBAN Brasil S.A
|
– | – | (110,341 | ) | – | – | (129,500 | ) | ||||||||||||||||
|
Produban Serviços de Informática S.A.
|
– | – | (47,970 | ) | – | – | (43,439 | ) | ||||||||||||||||
|
Universia Brasil S.A.
|
– | – | (310 | ) | – | – | (3,218 | ) | ||||||||||||||||
|
Real Fundo de Investimento Multimercado Santillana Credito Privado
|
– | – | (223,367 | ) | – | – | (198,236 | ) | ||||||||||||||||
|
Fundo de Investimento Multimercado Menorca Crédito Privado
|
– | – | (31,062 | ) | – | – | – | |||||||||||||||||
|
Others
|
– | – | (9,703 | ) | – | – | (1,476 | ) | ||||||||||||||||
|
Other liabilities – Dividends and Bonuses Payable
|
(908,004 | ) | – | (3,615 | ) | (1,703,847 | ) | – | (1,037 | ) | ||||||||||||||
|
Banco Santander, S.A. – Spain(4)
|
(7,772 | ) | – | – | – | – | – | |||||||||||||||||
|
Grupo Empresarial Santander S.L.(1)
|
(379,617 | ) | – | – | (726,925 | ) | – | – | ||||||||||||||||
|
Santander Insurance Holding S.L.
|
– | – | (553 | ) | – | – | (1,037 | ) | ||||||||||||||||
|
Sterrebeeck B.V.(1)
|
(520,615 | ) | – | – | (976,922 | ) | – | – | ||||||||||||||||
|
Banco Madesant – Sociedade Unipessoal S.A.
|
– | – | (3,062 | ) | – | – | – | |||||||||||||||||
|
Other payables
|
(3,972 | ) | – | (85,979 | ) | (6,353 | ) | – | (52,586 | ) | ||||||||||||||
|
Banco Santander S.A. – Spain
|
(3,972 | ) | – | – | (6,353 | ) | – | – | ||||||||||||||||
|
Santander Insurance Holding S.L.
|
– | – | (9,257 | ) | – | – | (52,358 | ) | ||||||||||||||||
|
Santander Seguros
|
– | – | (74,772 | ) | – | – | – | |||||||||||||||||
|
Others
|
– | – | (1,950 | ) | – | – | (228 | ) | ||||||||||||||||
|
(*)
|
All loans and amounts to related parties were made in the ordinary course of business and on a sustainable basis, including interest rates and collateral and did not involve more than the normal risk of collectability or present other unfavorable features.
|
|
(1)
|
Santander Brasil is indirectly controlled by Santander Spain, through its subsidiaries Grupo Empresarial Santander, S.L. and Sterrebeeck B.V.
|
|
(2)
|
Refers to subsidiaries of Santander Spain.
|
|
(3)
|
In 2011, includes cash (which in 2010 was R$315 thousand). In 2010, refers to overnight operations in foreign currency, amounting R$3.9 billion with interest of 0.22% per year.
|
|
(4)
|
In 2011, refers to fund raising operations through transfers abroad amounting R$1.2 billion with maturity date until January 2015 and interest between 0.39% and 5.82% per year. In 2010, includes raising funds through operations overseas transfers totaling R$2.0 billion with maturity until January, 2015 and interest between 0.25% and 7.89% per year.
|
|
(5)
|
In 2010, refers to raising funds through time deposit with maturity on February 28, 2011 and interest of 1.76% per year.
|
|
December 31, 2011
|
December 31, 2010
|
|||||||||||||||||||||||
|
Parent(1)
|
Joint-controlled companies
|
Other Related-Party(2)
|
Parent(1)
|
Joint-controlled companies
|
Other Related-Party(2)
|
|||||||||||||||||||
|
(in thousands of R$)
|
||||||||||||||||||||||||
|
Income
|
||||||||||||||||||||||||
|
Interest and similar income – Loans and amounts due from credit institutions
|
5,046 | 50,771 | 267 | 2,384 | 39,395 | 1,029 | ||||||||||||||||||
|
Banco Santander, S.A. – Spain
|
5,046 | – | – | 2,384 | – | – | ||||||||||||||||||
|
Abbey National Treasury Services Plc
|
– | – | 14 | – | – | 1,029 | ||||||||||||||||||
|
Companhia de Crédito, Financiamento e Investimento RCI Brasil
|
– | 50,771 | – | – | 38,545 | – | ||||||||||||||||||
|
Companhia de Arrendamento Mercantil RCI Brasil
|
– | – | – | – | 850 | – | ||||||||||||||||||
|
Santander Benelux, S.A., N.V.
|
– | – | 253 | – | – | – | ||||||||||||||||||
|
Interest expense and similar charges – Customer deposits
|
– | – | (37,974 | ) | – | – | (28,827 | ) | ||||||||||||||||
|
ISBAN Brasil S.A.
|
– | – | (10,551 | ) | – | – | (9,359 | ) | ||||||||||||||||
|
Produban Serviços de Informática S.A.
|
– | – | (3,841 | ) | – | – | (2,736 | ) | ||||||||||||||||
|
Real Fundo de Investimento Multimercado Santillana Cr
é
dito Privado
|
– | – | (21,777 | ) | – | – | (16,166 | ) | ||||||||||||||||
|
Others
|
– | – | (1,805 | ) | – | – | (566 | ) | ||||||||||||||||
|
Interest expenses and similar charges – Deposits from credit institutions
|
(15,311 | ) | (620 | ) | (5,044 | ) | (47,134 | ) | (526 | ) | (32,676 | ) | ||||||||||||
|
Banco Santander S.A. – Spain
|
(15,311 | ) | – | – | (47,134 | ) | – | – | ||||||||||||||||
|
Abbey National Beta Investments Limited
|
– | – | – | – | – | (7,415 | ) | |||||||||||||||||
|
Companhia de Crédito, Financiamento e Investimento RCI Brasil
|
– | (620 | ) | – | – | (526 | ) | – | ||||||||||||||||
|
Banco Madesant – Sociedade Unipessoal,S.A
|
– | – | (5,013 | ) | – | – | (25,143 | ) | ||||||||||||||||
|
Others
|
– | – | (31 | ) | – | – | (118 | ) | ||||||||||||||||
|
Expense and similar charges – Marketable debt securities
|
(1,789 | ) | – | – | – | – | – | |||||||||||||||||
|
Banco Santander S.A. – Spain
|
(1,789 | ) | – | – | – | – | – | |||||||||||||||||
|
Fee and commission income (expense)
|
(14,820 | ) | 13,262 | 56,224 | 73,975 | 6,770 | 9,449 | |||||||||||||||||
|
December 31, 2011
|
December 31, 2010
|
|||||||||||||||||||||||
|
Parent(1)
|
Joint-controlled companies
|
Other Related-Party(2)
|
Parent(1)
|
Joint-controlled companies
|
Other Related-Party(2)
|
|||||||||||||||||||
|
(in thousands of R$)
|
||||||||||||||||||||||||
|
Companhia de Crédito, Financiamento e Investimento RCI Brasil
|
– | 10,118 | – | – | 6,327 | – | ||||||||||||||||||
|
Banco Santander S.A. – Spain
|
(14,820 | ) | – | – | 73,975 | – | – | |||||||||||||||||
|
Aviación Antares, A.I.E
|
– | – | – | – | – | 9,449 | ||||||||||||||||||
|
Aviación Centaurus, A.I.E
|
– | – | 11,928 | – | – | – | ||||||||||||||||||
|
Santander Seguros
|
– | – | 35,785 | – | – | – | ||||||||||||||||||
|
Others
|
– | 3,144 | 8,511 | – | 443 | – | ||||||||||||||||||
|
Gains (losses) on financial assets and liabilities (net) and Exchange differences (net)
|
(245,096 | ) | 6,522 | (505,726 | ) | (44,953 | ) | – | (42,090 | ) | ||||||||||||||
|
Banco Santander S.A. – Spain
|
(245,096 | ) | – | – | (44,953 | ) | – | – | ||||||||||||||||
|
Santander Benelux, S.A., N.V.
|
– | – | (38,238 | ) | – | – | 32,489 | |||||||||||||||||
|
Santander Overseas Bank, Inc – Puerto Rico
|
– | – | 160 | – | – | 188 | ||||||||||||||||||
|
Fundo de Investimento Multimercado Santillana Cr
é
dito Privado
|
– | – | (342,975 | ) | – | – | (86,572 | ) | ||||||||||||||||
|
Abbey National Beta Investments Limited
|
– | – | (91,726 | ) | – | – | 14,763 | |||||||||||||||||
|
Santander Investment Securities Inc.
|
– | – | (11,714 | ) | – | – | – | |||||||||||||||||
|
Companhia de Crédito, Financiamento e Investimento RCI Brasil
|
– | 6,522 | – | – | – | – | ||||||||||||||||||
|
Others
|
– | – | (21,233 | ) | – | – | (2,958 | ) | ||||||||||||||||
|
Administrative expenses and amortization
|
(152 | ) | – | (256,681 | ) | – | – | (226,127 | ) | |||||||||||||||
|
ISBAN Brasil S.A.
|
– | – | (54,104 | ) | – | – | (50,320 | ) | ||||||||||||||||
|
Produban Serviços de Informática S.A.
|
– | – | (103,991 | ) | – | – | (108,741 | ) | ||||||||||||||||
|
ISBAN Chile S.A.
|
– | – | (4,814 | ) | – | – | (5,491 | ) | ||||||||||||||||
|
Aquanima Brasil Ltda
|
– | – | (21,500 | ) | – | – | (21,256 | ) | ||||||||||||||||
|
Ingeniería de Software Bancario, S.L.
|
– | – | (32,209 | ) | – | – | (19,722 | ) | ||||||||||||||||
|
Produban Servicios Inform
á
ticos Generales, S.L
|
– | – | (23,629 | ) | – | – | (15,868 | ) | ||||||||||||||||
|
Santander Seguros
|
– | – | (89 | ) | – | – | – | |||||||||||||||||
|
Zurich Santander Insurance America, S.L.
|
– | – | (12,151 | ) | – | – | – | |||||||||||||||||
|
Others
|
(152 | ) | – | (4,194 | ) | – | – | (4,729 | ) | |||||||||||||||
|
Gain (losses) on non-current assets held for sale not classified as discontinued operations
|
– | – | 424,292 | – | – | – | ||||||||||||||||||
|
Zurich Santander Insurance America, S.L(3).
|
– | – | 424,292 | – | – | – | ||||||||||||||||||
|
(1)
|
Santander Brasil is indirectly controlled by Santander Spain, through its subsidiaries Grupo Empresarial Santander, S.L. and Sterrebeeck B.V.
|
|
(2)
|
Refers to subsidiaries of Santander Spain.
|
|
(3)
|
In 2011, we sold our wholly-owned subsidiary, Santander Seguros to a joint enterprise of Santander Spain and Zurich Financial, though we will continue to distribute the products offered by Santander Seguros. See “Item 4. Information on the Company—A. History and Development of the Company—Important Events—Sale of Santander Seguros”.
|
|
|
·
|
administrative and judicial actions relating to taxes;
|
|
|
·
|
indemnification suits for damage related to consumer rights, in particular with respect to credit cards, checking accounts, collection and loan disputes;
|
|
|
·
|
suits involving dispute of contractual clauses of existing agreements;
|
|
|
·
|
civil suits, including from depositors relating to the alleged effects of our implementation of various government economic plans (seeking differences for monetary adjustments on remuneration of several deposits, such as saving accounts and judicial deposits) and consumer law (that is, breach of contract and foreign currency indexation, including administrative proceedings) and to the privatization of Banespa;
|
|
|
·
|
class actions involving agreements and settlement of debts with the public sector; and
|
|
|
·
|
suits brought by employees, former employees and unions relating to alleged labor rights violations.
|
|
|
·
|
Equal tax treatment
. We filed a lawsuit challenging the application of an increased Social Contribution on Net Income (
Contribuição Social sobre o Lucro Líquido
) or “CSLL” rate of 18.0% for financial institutions, applicable until 1998, compared to the CSLL rate of 8.0% for non-financial institutions on the basis of the constitutional principle of equal tax treatment. As of December 31, 2011, the amount related to this claim totaled R$49 million and is fully provisioned.
|
|
|
·
|
Tax rate increase
. We filed for an injunction to avoid the increase in the CSLL tax rate established by Executive Act No. 413/2008, subsequently codified into Law No. 11,727/2008. Financial institutions were formerly subject to a CSLL tax rate of 9.0%; however, Law No. 11,727/2008 established a 15.0% CSLL tax rate as from April 2008. Judicial proceedings are pending judgment. As of December 31, 2011, the amount related to this injunction totaled R$980 million and is fully provisioned.
|
|
|
·
|
Tax on services for financial institutions
. Certain municipalities levy Service Tax (
Imposto Sobre Serviços
–
ISS
) taxes on certain revenues derived from transactions not usually classified as the rendering of services. In such cases, we have argued in administrative and judicial proceedings against the payment of ISS. As of December 31, 2011, amounts related to these proceedings totaled R$542 million and are fully provisioned.
|
|
|
·
|
Social security contribution
. We are involved in administrative and judicial proceedings regarding the collection of income tax on social security and education allowance contributions as we believe that these benefits do not constitute salary. As of December 31, 2011, amounts related to these proceedings totaled R$288 million and are fully provisioned.
|
|
|
·
|
Legal Reserve
. We are required to maintain a legal reserve to which we must allocate 5% of our net profits for each fiscal year until the aggregate amount of the reserve equals 20% of our capital stock. However, we are not required to make any allocations to our legal reserve in a year in which the legal reserve, when added to our other established capital reserves, exceeds 30% of our capital stock. The amounts allocated to such reserve must be approved by our shareholders in a shareholders’ meeting, and may be used only to increase our capital stock or to offset any net losses. Therefore, they are not available for the payment of dividends.
|
|
|
·
|
By-laws Reserve
. Pursuant to Brazilian corporate law, we are permitted to provide for the allocation of part of our net income to discretionary reserve accounts that may be established in accordance with our by-laws, which must also indicate the purpose, allotment criteria and maximum amount of the reserve. An allocation of our net income to discretionary reserve accounts may not be made if it serves to prevent distribution of the mandatory distributable amount. Our by-laws currently establish that after the deduction of the amount allocated to the legal reserve and mandatory dividends, we may allocate the balance of our adjusted net income to a reserve for equalization of dividends, which is limited to 50% of our capital stock, whose purpose is to secure funds for the payment of dividends or interest attributable to shareholder’s equity, or any advance payment thereof, so as to ensure a continuous flow of dividends.
|
|
|
·
|
Unrealized Profit Reserve
. Pursuant to Brazilian corporate law, the amount by which the mandatory dividend exceeds the “realized” net profits in a given year may be allocated to an unrealized profit reserve account. Brazilian corporate law defines “realized” net profits as the amount by which our net profits exceeds the sum of (1) our net positive results, if any, from the equity method of accounting; and (2) the profits, gains or income that will be received by our company after the end of the next fiscal year. Profits recorded in the unrealized profit reserve, if realized and not absorbed by losses in subsequent years, must be added to the next mandatory dividend distributed after the recognition. Currently, we do not have an unrealized profit reserve.
|
|
|
·
|
Retained Profit Reserve
. Pursuant to Brazilian corporate law, a portion of our net income may be reserved for investment projects in an amount based on a capital expenditure budget approved by our shareholders. If such budget covers more than one fiscal year, it must be reviewed annually at the shareholders’ general meeting. The allocation of this reserve cannot jeopardize the payment of the mandatory dividends. Currently, we do not have a retained profit reserve.
|
|
|
·
|
Contingency Reserve
. Under Brazilian corporate law, a percentage of our net income may be allocated to a contingency reserve for anticipated losses that are deemed probable in future years. Management must indicate the cause of the anticipated loss and justify an allocation to the contingency reserve. Any amount so allocated in a prior year either must be reversed in the year in which the loss had been anticipated, if the loss does not occur as projected, or charged off in the event that the anticipated loss occurs. Allocations to the contingency reserve are subject to the approval of our shareholders at a shareholders’ general meeting. Currently, we do not have a contingency reserve.
|
|
|
·
|
50% of our net income (after the deduction of any allowances for social contribution taxes on net profits but before taking into account allowances for income tax and the interest attributable to shareholders’ equity) for the period in respect of which the payment is made; and
|
|
|
·
|
50% of our accumulated profits.
|
|
Year ended December 31,
|
||||||||||||||||||||
|
2011
|
2010
|
2009
|
2008
|
2007
|
||||||||||||||||
|
(in millions of R$)
|
||||||||||||||||||||
|
Dividends
|
1,625 | 1,780 | 750 | 973 | 1,737 | |||||||||||||||
|
Interest attributable to shareholders’ equity.
|
1,550 | 1,760 | 825 | 480 | 528 | |||||||||||||||
|
Total
|
3,175 | 3,540 | 1,575 | 1,453 | 2,265 | |||||||||||||||
|
Dividends and interest on capital per 1,000 shares (reais)
|
||||||||||||||||||||
|
Common shares
|
7.61 | 7.84 | 3.77 | 4.26 | 16.30 | |||||||||||||||
|
Preferred shares
|
8.37 | 8.63 | 4.15 | 4.69 | 17.93 | |||||||||||||||
|
Free Float
|
BM&FBOVESPA
|
NYSE
|
||||||
|
Ordinary shares
|
15,651,827,552 | 22,086,682,695 | ||||||
|
Preferred shares
|
15,733,592,770 | 20,078,802,450 | ||||||
|
Total
|
31,385,420,322 | 42,165,485,145 | ||||||
|
Reais per share–SANB3 (Common Shares)
|
|||||
|
High
|
Low
|
Last
|
|||
|
2007 Annual
|
n.a.
|
n.a.
|
n.a.
|
||
|
2008 Annual
|
n.a.
|
n.a.
|
n.a.
|
||
|
2009 Annual
|
0.25
|
0.11
|
0.24
|
||
|
2010 Annual
|
0.30
|
0.17
|
0.28
|
||
|
1st Quarter
|
0.24
|
0.18
|
0.21
|
||
|
2nd Quarter
|
0.21
|
0.18
|
0.21
|
||
|
3rd Quarter
|
0.25
|
0.17
|
0.25
|
||
|
4th Quarter
|
0.30
|
0.22
|
0.28
|
||
|
2011 Annual
|
0.25
|
0.12
|
0.16
|
||
|
1st Quarter
|
0.25
|
0.17
|
0.20
|
||
|
2nd Quarter
|
0.21
|
0.16
|
0.17
|
||
|
3rd Quarter
|
0.18
|
0.12
|
0.13
|
||
|
4th Quarter
|
0.16
|
0.12
|
0.16
|
||
|
LAST 6 MONTHS
|
0.19
|
0.12
|
0.16
|
||
|
October 2011
|
0.15
|
0.12
|
0.14
|
||
|
November 2011
|
0.15
|
0.12
|
0.13
|
||
|
December 2011
|
0.16
|
0.13
|
0.16
|
||
|
January 2012
|
0.17
|
0.14
|
0.15
|
||
|
February 2012
|
0.18
|
0.15
|
0.17
|
||
|
March 2012 (through March 28)
|
0.19
|
0.16
|
0.16
|
||
|
Reais per share–SANB4 (Preferred Shares)
|
|||||
|
High
|
Low
|
Last
|
|||
|
2007 Annual
|
n.a.
|
n.a.
|
n.a.
|
||
|
2008 Annual
|
n.a.
|
n.a.
|
n.a.
|
||
|
2009 Annual
|
0.26
|
0.12
|
0.22
|
||
|
2010 Annual
|
0.22
|
0.16
|
0.21
|
||
|
1st Quarter
|
0.22
|
0.18
|
0.20
|
||
|
2nd Quarter
|
0.20
|
0.16
|
0.19
|
||
|
3rd Quarter
|
0.21
|
0.16
|
0.20
|
||
|
4th Quarter
|
0.21
|
0.18
|
0.21
|
||
|
2011 Annual
|
0.19
|
0.12
|
0.14
|
||
|
1st Quarter
|
0.19
|
0.16
|
0.18
|
||
|
2nd Quarter
|
0.19
|
0.16
|
0.18
|
||
|
3rd Quarter
|
0.18
|
0.12
|
0.14
|
||
|
4th Quarter
|
0.16
|
0.12
|
0.14
|
||
|
LAST 6 MONTHS
|
0.18
|
0.12
|
0.16
|
||
|
October 2011
|
0.16
|
0.12
|
0.14
|
||
|
November 2011
|
0.15
|
0.12
|
0.13
|
||
|
December 2011
|
0.15
|
0.12
|
0.14
|
||
|
Reais per share–SANB4 (Preferred Shares)
|
|||||
|
High
|
Low
|
Last
|
|||
|
January 2012
|
0.16
|
0.13
|
0.16
|
||
|
February 2012
|
0.18
|
0.15
|
0.18
|
||
|
March 2012 (through March 28)
|
0.18
|
0.16
|
0.16
|
||
|
BMF&BOVESPA
Units – SANB11
|
||||||||||||
|
High
|
Low
|
Last
|
||||||||||
|
R$ per share
|
||||||||||||
|
2007 Annual
|
n.a.
|
n.a.
|
n.a.
|
|||||||||
|
2008 Annual
|
n.a.
|
n.a.
|
n.a.
|
|||||||||
|
2009 Annual
|
n.a.
|
n.a.
|
n.a.
|
|||||||||
|
2010 Annual
|
26.05 | 17.93 | 24.85 | |||||||||
|
1st Quarter
|
24.05 | 21.08 | 21.97 | |||||||||
|
2nd Quarter
|
22.25 | 18.31 | 20.49 | |||||||||
|
3rd Quarter
|
23.61 | 17.93 | 23.08 | |||||||||
|
4th Quarter
|
26.05 | 22.88 | 24.85 | |||||||||
|
2011 Annual
|
22.95 | 12.51 | 14.96 | |||||||||
|
1st Quarter
|
22.95 | 18.05 | 19.80 | |||||||||
|
2nd Quarter
|
20.34 | 16.90 | 18.30 | |||||||||
|
3rd Quarter
|
18.32 | 12.95 | 13.72 | |||||||||
|
4th Quarter
|
16.15 | 12.51 | 14.96 | |||||||||
|
LAST 6 MONTHS
|
19.31 | 12.51 | 17.29 | |||||||||
|
October 2011
|
16.15 | 12.72 | 16.00 | |||||||||
|
November 2011
|
15.40 | 12.51 | 15.21 | |||||||||
|
December 2011
|
15.51 | 14.10 | 15.36 | |||||||||
|
January 2012
|
17.05 | 14.96 | 16.82 | |||||||||
|
February 2012
|
18.74 | 16.11 | 18.61 | |||||||||
|
March 2012 (through March 28)
|
19.31
|
17.23
|
17.29
|
|||||||||
|
NYSE
ADS - BSBR
|
||||||||||||
|
High
|
Low
|
Last
|
||||||||||
|
U.S.$ per share
|
||||||||||||
|
2007 Annual
|
n.a.
|
n.a.
|
n.a.
|
|||||||||
|
2008 Annual
|
n.a.
|
n.a.
|
n.a.
|
|||||||||
|
2009 Annual
|
14.28 | 12.59 | 13.05 | |||||||||
|
2010 Annual
|
15.66 | 9.82 | 13.60 | |||||||||
|
1st Quarter
|
12.67 | 11.55 | 12.43 | |||||||||
|
2nd Quarter
|
12.82 | 9.82 | 10.33 | |||||||||
|
3rd Quarter
|
13.78 | 10.00 | 13.77 | |||||||||
|
4th Quarter
|
15.66 | 12.72 | 13.60 | |||||||||
|
NYSE
ADS - BSBR
|
||||||||||||
|
High
|
Low
|
Last
|
||||||||||
|
U.S.$ per share
|
||||||||||||
|
2011 Annual
|
13.98 | 6.73 | 8.14 | |||||||||
|
1st Quarter
|
13.98 | 10.86 | 12.26 | |||||||||
|
2nd Quarter
|
12.60 | 10.54 | 11.71 | |||||||||
|
3rd Quarter
|
11.85 | 7.23 | 7.32 | |||||||||
|
4th Quarter
|
9.59 | 6.73 | 8.14 | |||||||||
|
LAST 6 MONTHS
|
11.30 | 6.73 | 9.43 | |||||||||
|
October 2011
|
9.59 | 7.07 | 9.10 | |||||||||
|
November 2011
|
8.93 | 6.73 | 7.72 | |||||||||
|
December 2011
|
8.46 | 7.47 | 8.14 | |||||||||
|
January 2012
|
9.74 | 8.05 | 9.12 | |||||||||
|
February 2012
|
10.93 | 9.24 | 10.85 | |||||||||
|
March 2012 (through March 28)
|
11.30 | 9.31 | 9.43 | |||||||||
|
|
·
|
appoint a representative in Brazil with powers to take actions relating to the investment;
|
|
|
·
|
obtain a taxpayer identification number from the Brazilian tax authorities;
|
|
|
·
|
appoint an authorized custodian in Brazil for the investments, which must be a financial institution duly authorized by the Brazilian Central Bank and CVM; and
|
|
|
·
|
through its representative, register itself as a foreign investor with the CVM and the investment with the Brazilian Central Bank.
|
|
|
·
|
register as a foreign direct investor with the Brazilian Central Bank;
|
|
|
·
|
obtain a taxpayer identification number from the Brazilian tax authorities;
|
|
|
·
|
appoint a tax representative in Brazil; and
|
|
|
·
|
appoint a representative in Brazil for service of process in respect of suits based on the Brazilian corporate law.
|
|
|
·
|
At any time, unit holders may order us to cancel the units and transfer the underlying shares to the share deposit account kept by the custodian in the name of the holder. The unit holder shall bear any transfer and cancellation costs for cancelling the units. Units encumbered in any way, however, may not be cancelled. The right to cancel units may be suspended upon the announcement of the commencement of an offering of units, in Brazil or abroad, in which event the suspension period may not exceed 180 days. Cancellation cannot be requested for those units that are subject to any encumbrances or liens.
|
|
|
·
|
Dividends and other cash distributions, including the proceeds from redemption or amortization of shares issued by us, will be transferred to us and BM&FBOVESPA, in the capacity as depositaries of the shares, which will then deliver the funds to unit holders;
|
|
|
·
|
Only shareholders registered as such in our corporate books, and, in the case of the ADS holders, only the custodian, are entitled to attend shareholders’ meetings and exercise their voting rights;
|
|
|
·
|
In the event of a stock split, cancellation, reverse stock split or new issues of shares by us while the units are in existence, the following rules will be observed:
|
|
|
(1)
|
In the event there is a change in the number of shares represented by units as a result of a reverse stock split or cancellation of shares, we, as custodian, will debit from the unit accounts the number of cancelled shares of each unit holder, and proceed to cancel the relevant units. The custodian must maintain a ratio of 55 common shares to 50 preferred shares issued by us and represented by units and will deliver to holders those shares that are insufficient to constitute a unit at the BM&FBOVESPA in the form of shares, rather than units; and
|
|
|
(2)
|
In the event there is a change in the number of shares represented by the units as a result of a reverse stock split or cancellation of shares, the custodian will register the deposit of the new shares and issue new units, registering them in the accounts of their respective holders, so as to reflect the new number of shares held by unit holders. The custodian must maintain a ratio of 55 common shares to 50 preferred shares issued by us and represented by units and will deliver to holders those shares that are insufficient to constitute a unit at the BM&FBOVESPA in the form of shares, rather than units;
|
|
|
·
|
In the event there is an increase in our capital stock as a result of the issue of new shares, therefore permitting the creation of new units, unit holders will be entitled to exercise preemptive rights with respect to the shares underlying the units. In such circumstances, we will create new units in the book-entry registry of units and credit the units to their holders so as to reflect the new number of common and preferred shares issued by us. The custodian must maintain a ratio of 55 common shares to 50 preferred shares issued by us and represented by units and will deliver to holders those shares that are insufficient to constitute a unit at the BM&FBOVESPA in the form of shares, rather than units. There will be no automatic credit of units in the event of exercise of preemptive rights over the issuance of securities other than shares; and
|
|
|
·
|
Unit holders will be entitled to receive any shares issued as a result of our consolidation or merger.
|
|
|
(1)
|
during the periods between the date in which such persons become aware of material information that could affect the value of our securities until the date that such information is disclosed to the public; during the period between the decision taken by the competent corporate body to increase the corporate
|
|
|
|
capital, issue securities, distribute dividends, pay dividends, carry out share splits or reverse splits and the publication of the respective public notices or announcements made to the market;
|
|
|
(2)
|
when there is an intention to carry out a merger, total or partial spin-off, transformation or corporate restructuring;
|
|
|
(3)
|
during the 30-days elapsed from the date we release the half-yearly and yearly balance sheets until the date that we publish our consolidated financial statements and the release of our quarterly financial information, or “ITR”; and
|
|
|
(4)
|
during the time elapsed from the date we decide to increase our capital, to float new securities, to allot dividends, to grant bonuses, to split or group shares until we publish the respective public notices or announcements thereabout.
|
|
|
·
|
our transformation, incorporation, merger or a spin-off of our assets;
|
|
|
·
|
the approval of contracts which would have been subject to approval in general shareholders’ meeting entered into by and between us and our controlling shareholder, directly or indirectly, and contracts of other companies in which our controlling shareholder may hold an interest, whenever, pursuant to a statutory or bylaw provision, action is required to be taken on such contracts at a shareholders’ meeting;
|
|
|
·
|
the appraisal of assets to be contributed to increase our capital stock;
|
|
|
·
|
appointment of an appraisal company to appraise our economic value in case of cancellation of our registration as a publicly-held company or the cancellation of our Level 2 status (except in the case we adhere to the Novo Mercado listing segment rules of BM&FBOVESPA, which imply adoption of additional corporate governance practices);
|
|
|
·
|
amendment or revocation of applicable regulations that alter or modify any of the requirements of Section 4.1 of the Level 2 Regulation; provided that such right shall only be effective as long as the Level 2 Regulation Agreement remains in force.
|
|
|
·
|
the right to participate with priority in the distribution of dividends and interest on shareholders own equity in an amount 10% higher than those attributed to common shares;
|
|
|
·
|
the right to participate, on the same terms and conditions attributed to holders of common shares, in capital increases as a result of capitalization of reserves and profits, and in the issuance of bonus shares resulting from the capitalization of retained profits, reserves or other funds;
|
|
|
·
|
the right to a priority reimbursement of capital stock; and
|
|
|
·
|
tag-along rights, in the event of the disposition of our control in one or a series of successive transactions, under the same terms and conditions extended to our controlling shareholder.
|
|
|
·
|
the right to vote during our shareholders’ meetings, for our common stock shareholders and for specific matters for our preferred stock shareholders;
|
|
|
·
|
the right to participate in the distribution of income and the right to participate equally and proportionally in any remaining assets upon our liquidation;
|
|
|
·
|
the preferential right to subscribe shares under certain circumstances;
|
|
|
·
|
the right to monitor the management of our business pursuant to the provisions of Brazilian corporate law; and
|
|
|
·
|
the right to withdraw from our company in those circumstances set forth under Brazilian corporate law, including (1) our merger or consolidation and (2) our spin-off, among other circumstances.
|
|
|
·
|
any shareholder, if our board of directors fail to call a shareholders’ general meeting within 60 days after the date they were required to do so under applicable laws and our by-laws;
|
|
|
·
|
shareholders holding at least 5% of our share capital if our board of directors fail to call a meeting within eight days after receipt of a request to call the meeting by those shareholders, and such request must indicate the proposed agenda;
|
|
|
·
|
shareholders holding at least 5% of our common shares or shareholders holding at least 5% of our preferred shares if our board of directors fail to call a meeting within eight days after receipt of a request to call the meeting to convene a fiscal council; and
|
|
|
·
|
our fiscal council, if one is in place, if our board of directors delays calling an annual shareholders’ meeting for more than one month. The fiscal council may also call a special general shareholders’ meeting any time if it believes that there are significant or urgent matters to be addressed.
|
|
|
·
|
a modification in preferences, privileges or a condition of redemption or amortization conferred upon our preferred shares or creation of a new, more favored class of preferred shares (in which case, only the shareholders adversely affected by such modification or creation will have withdrawal rights);
|
|
|
·
|
a spin-off (
cisão
) of our company (in the specific circumstances described below);
|
|
|
·
|
a reduction in the percentage of our mandatory dividends;
|
|
|
·
|
a change in our corporate purpose;
|
|
|
·
|
an acquisition of a controlling stake in our company if the acquisition price is outside of the limits established by the Brazilian corporate law;
|
|
|
·
|
a merger (
fusão
) of our company with another company if we are not the surviving entity or our consolidation (
incorporação
) with another company; or
|
|
|
·
|
an approval of our participation in a group of companies (as defined in the Brazilian corporate law).
|
|
|
·
|
causes a change in our corporate purpose, except if the equity is spun-off to a company whose primary activities are consistent with our corporate purposes;
|
|
|
·
|
reduces our mandatory dividends;
|
|
|
·
|
causes us to join a group of companies (as defined in the Brazilian corporate law); or
|
|
|
·
|
will entitle shareholders to withdraw.
|
|
|
·
|
In cases where (1) our company merges with another company in circumstances in which we are not the surviving company or (2) we are consolidated with another company or (3) we participate in a group of companies (as defined in the Brazilian corporate law), our shareholders will not be entitled to withdraw from our company if their respective shares are (i) liquid, defined as part of the BM&FBOVESPA index or some other traded stock exchange index (as defined by the CVM) and (ii) widely held, such that the controlling shareholder or companies it controls hold less than 50% of our shares.
|
|
|
·
|
The right to withdraw expires 30 days after publication of the minutes of the relevant shareholders’ general meeting. We are entitled to reconsider any action giving rise to withdrawal rights for 10 days after the expiration of those rights if the redemption of shares of dissenting or non-voting shareholders would jeopardize our financial stability.
|
|
|
·
|
If shareholders exercise withdrawal rights, they are entitled to receive net book value for the shares, based on the last balance sheet approved by the shareholders. If the resolution giving rise to the rights is made later than 60 days after the date of the last approved balance sheet, the shareholder may demand that his or her shares be valued according to a new balance sheet dated no less than 60 days before the resolution date. In this case, we must immediately pay 80% of the equity value of the shares according to the most recent balance sheet approved by our shareholders, and the balance must be paid within 120 days after the date of the resolution of the shareholders’ general meeting.
|
|
|
·
|
before the public disclosure of any material act or fact with respect to our business;
|
|
|
·
|
persons that are no longer members of our management team are prohibited from trading in our securities before the disclosure of material information regarding us that occurred during their term of office. This prohibition is extended for (1) a period of six months as from the date on which such persons quit their positions or (2) up to the date of disclosure to the public of such material information unless the trading in our securities may interfere in the conditions of the business in detriment to us or our shareholders;
|
|
|
·
|
during the period preceding an established plan to merge with another company, consolidate, spin-off part or all of our assets or reorganize;
|
|
|
·
|
during the 15-day period before the disclosure of our quarterly report, or “ITR” and annual consolidated financial statements, the “
Formulário de Referência
” and Consolidated Financial Statements (
Demonstrações Financeiras Padronizadas–DFP
); and
|
|
|
·
|
with respect to our directors and executive officers, in the event of acquisition or sale of our shares by us or the acquisition or sale of our shares by any of our controlled or affiliated companies or any other company under our common control.
|
|
|
·
|
we must, no later than four months after the end of each fiscal year, pursuant to CVM Instruction No. 457/07, as amended to CVM Instruction 485/10, release financial statements or consolidated financial statements in accordance with International Financing Report Accounting Standards, or IFRS, which must be disclosed in their entirety together with (a) the management report, (b) an explanatory note stating that the consolidated financial statements are in accordance with IFRS and Brazilian GAAP, and (c) the independent auditors’ report; and
|
|
|
·
|
after the disclosure of information as established above, by no later than 15 days following the term established by Brazilian law for disclosure of our quarterly information, we must: (1) disclose our full quarterly information translated into the English language, or (2) disclose our financial statements or consolidated financial statements in accordance with IFRS, accompanied by the independent auditors’ review report.
|
|
|
·
|
no later than six months following the listing of our shares on the Level 2 segment of the BM&FBOVESPA, we must disclose our financial statements and consolidated financial statements to be prepared at the end of each quarter (except for the last quarter of each year) and at the end of each year, including a statement of our cash flow, which must indicate, at least, the changes in our cash and cash equivalents, divided into operational, finance and investment cash flow for the relevant quarter or year;
|
|
|
·
|
we must send to the BM&FBOVESPA and disclose information regarding every agreement entered into between us and our controlled and associated companies, our controlling shareholders, directors and officers, and subsidiaries and affiliates of our controlling shareholder and directors and officers, as well as other companies in the same group as those persons or entities, in one instrument or successive documents that have the same or different purposes, which amounts to, or is greater than, R$200 thousand or 1.0% of our net equity, whichever is greater, for any one-year period.
|
|
|
·
|
appoint at least one representative in Brazil that will be responsible for complying with registration and reporting requirements and reporting procedures with the Brazilian Central Bank and the CVM. If the representative is an individual or a non-financial company, the investor must also appoint an institution duly authorized by the Brazilian Central Bank that will be jointly and severally liable for the representative’s obligations;
|
|
|
·
|
complete the appropriate foreign investor registration form;
|
|
|
·
|
register as a foreign investor with the CVM;
|
|
|
·
|
register the foreign investment with the Brazilian Central Bank;
|
|
|
·
|
appoint a tax representative in Brazil; and
|
|
|
·
|
obtain a taxpayer identification number from the Brazilian federal tax authorities.
|
|
|
·
|
50.0% of the net income (after the deduction of social contribution on net profit but before taking into account allowances for income tax and the interest attributable to shareholders’ equity) for the period in respect of which the payment is made; and
|
|
|
·
|
50.0% of our accumulated profits.
|
|
|
·
|
are subject to the withholding of income tax at a zero percent rate, when realized by a Non-Resident Holder that (1) has registered its investment in Brazil before the Brazilian Central Bank under the rules of the Brazilian Monetary Counsel (“Registered Holder”) and (2) is not a Tax Haven resident; and
|
|
|
·
|
are subject to income tax at a rate of 15% with respect to gains realized by a Non-Resident Holder that is not a Registered Holder or by a Tax Haven resident that is a Registered Holder. In this case, withholding income tax of 0.005% will be applied by the intermediary institution (that is, a broker) that receives the order directly from the Non-Resident Holder, which can be later offset against the 15% income tax due on the capital gain, which will be collected by the Non-Resident Holder’s tax representative in Brazil.
|
|
|
·
|
are subject to income tax at a rate of 15% when realized by any Non-Resident Holder that is not a Tax Haven resident, regardless of whether such person is a Registered Holder; and
|
|
|
·
|
are subject to income tax at a rate of 25% when realized by a Tax Haven resident, regardless of whether such person is a Registered Holder.
|
|
|
·
|
certain financial institutions;
|
|
|
·
|
insurance companies;
|
|
|
·
|
dealers and traders in securities that use a mark-to-market method of tax accounting;
|
|
|
·
|
persons holding ADSs or units as part of a hedge, “straddle,” conversion transaction or integrated transaction;
|
|
|
·
|
holders whose “functional currency” is not the U.S. dollar;
|
|
|
·
|
holders liable for the alternative minimum tax;
|
|
|
·
|
tax exempt entities, including “individual retirement accounts” and “Roth IRAs”;
|
|
|
·
|
partnerships or other entities classified as partnerships for U.S. federal income tax purposes;
|
|
|
·
|
holders that own or are deemed to own ten percent or more of our voting shares; and
|
|
|
·
|
persons holding ADSs or units in connection with a trade or business conducted outside the United States.
|
|
Authorization Required
|
Amount
|
|
|
Branch
(1)
|
Up to R$2 million
|
|
|
Business Committees
(2)
|
Up to R$2 million
|
|
|
Network Committees
(3)
|
Up to R$4 million
|
|
|
Decision centers
(4)
|
Up to R$8 million
|
|
|
Retail Risk Committee
(5)
|
Up to R$15 million
|
|
|
Superior Risk Committee for Retail
(6)
|
Up to R$60 million
|
|
|
Superior Risk Committee
(7)
|
Up to U.S.$70 million
|
|
|
Brazil Executive Risk Committee
(8)
|
Up to €100 million
|
|
(1)
|
For individuals, the maximum value is R$2.0 million for mortgages; for other credit lines, the maximum is R$110 thousand. For SMEs the maximum value is R$600 thousand.
|
|
(2)
|
Members of Business Committees include a credit risk consultant.
|
|
(3)
|
Members of Network Committees include a credit risk consultant.
|
|
(4)
|
Members of the Decision Centers of Risk includes Superintendents and other representatives of the Risk area.
|
|
(5)
|
Members of the Retail Risk Committee include a Retail Risk Superintendent and other representatives of the Risk area.
|
|
(6)
|
Members of the Superior Risk Committee for Retail include the Retail Risk Director.
|
|
(7)
|
Members of the Superior Risk Committee include the Director of Wholesale, Retail Risk Director, Director of Market Risk, Director of Billing and representatives from each Risk department.
|
|
(8)
|
Realized jointly with the Corporate Risk Committee, with members from Brazil and Spain, among them: Risk General Director/Madrid, Risk Executive Vice President/Brazil, Market Risk Director/Brazil, Risk Officers of Wholesale, Retail, Recovery and Solvency.
|
|
Authorization Required
|
Amount Corporate Customers (GB&M)
|
Amount Corporate Customers
|
||
|
Regional approval committee
|
N.A.
|
Up to R$6 million
|
||
|
Regional Wholesale Risk Committee
|
N.A.
|
Up to R$15 million
|
||
|
Territorial Risk Committee
|
N.A.
|
Up to R$40 million
|
||
|
Wholesale Risk Committee
|
N.A.
|
Up to R$60 million
|
||
|
Superior Risk Committee
(1)
|
Up to U.S.$40 million
|
Up from U.S.$70 million
|
||
|
Brazil Executive Risk Committee
(2)
|
Up to €100 million
|
Up to €100 million
|
|
(1)
|
Members of the Superior Risk Committee include, among others, Officers of Wholesale, Retail, Market Risk, Recovery and representatives from the Risk departments.
|
|
(2)
|
Realized jointly with the Corporate Risk Committee, with members from Brazil and Spain, among them: Risk General Director/Madrid, Risk Executive Vice President/Brazil, Market Risk Director/Brazil, Risk Officers of Wholesale, Retail, Recovery and Solvency.
|
|
|
·
|
the conditions of the debtor and any guarantor, such as the debtor’s and/or guarantor’s economic and financial situation, level of indebtedness, capacity for generating profits, cash flow, administration, corporate governance and quality of internal controls, payment history, the sector in which such debtor or guarantor is active, contingencies and credit limits; and
|
|
|
·
|
characteristics of the transaction, such as its nature and purpose, type, sufficiency and level of liquidity of collateral and the total amount of the credit.
|
|
Brazilian Central Bank Classification
(Risk level)
|
Minimum
Provision in %
|
Days Past Due Classification
(days past due)
|
||
|
AA
|
—
|
None
|
||
|
A
|
0.5
|
<15
|
||
|
B
|
1.0
|
15-30
|
||
|
C
|
3.0
|
30-60
|
||
|
D
|
10.0
|
60-90
|
||
|
E
|
30.0
|
90-120
|
||
|
F
|
50.0
|
120-150
|
||
|
G
|
70.0
|
150-180
|
||
|
H
|
100.0
|
180-210
|
|
|
·
|
Trading in financial instruments, which involves interest rate, foreign exchange rate, equity price and volatility risks.
|
|
|
·
|
Engaging in retail banking activities, which involves interest rate risk because a change in interest rates affects interest income, interest expense and customer behavior.
|
|
|
·
|
Investing in assets (including subsidiaries) whose returns or accounts are denominated in currencies other than the
real
, which involves foreign exchange rate risk.
|
|
|
·
|
Investing in subsidiaries and other companies, which subjects us to equity price risk.
|
|
|
·
|
All trading and non-trading activities, which involve liquidity risk.
|
|
|
·
|
Identify and define the main types of risk incurred in a manner consistent with our business strategy.
|
|
|
·
|
Quantify and report to our business segments with respect to appropriate risk levels and risk profile in line with senior management’s assessment of risks to help avoid any of our business segments taking undesired risks.
|
|
|
·
|
Provide flexibility to our business segments to timely and efficiently establish risk positions responsive to market changes and our business strategies, and always within acceptable Santander Group risk levels.
|
|
|
·
|
Allow the individuals and teams originating new business to take prudent risks that will help attain budgeted results.
|
|
|
·
|
Establish investment alternatives by limiting equity consumption.
|
|
|
·
|
Define the range of products and underlying assets within each unit of treasury can operate, taking into consideration our risk modeling and valuation systems and our liquidity tools. This will help to constrain all market risk within the business management and defined risk strategy.
|
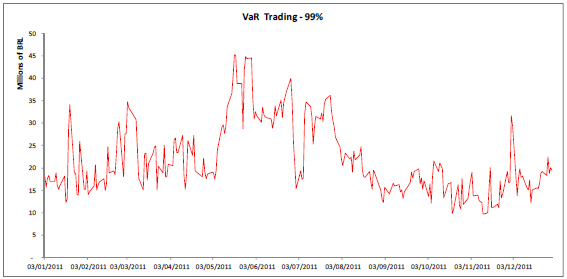
|
|
* Date format used is day/month/year
|
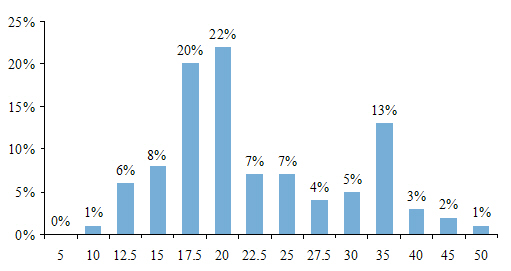
|
Minimum
|
Average
|
Maximum
|
Last
|
|||||||||||||
|
(in Million of R$)
|
||||||||||||||||
|
Total Trading
|
||||||||||||||||
|
Total VaR
|
9.63 | 21.74 | 45.29 | 19.52 | ||||||||||||
|
Diversification Effect
|
(1.88 | ) | (11.73 | ) | (36.72 | ) | (5.67 | ) | ||||||||
|
IR VaR
|
9.07 | 19.94 | 41.31 | 18.72 | ||||||||||||
|
Equity VaR
|
1.46 | 5.71 | 14.19 | 4.80 | ||||||||||||
|
FX VaR
|
0.98 | 7.82 | 26.52 | 1.68 | ||||||||||||
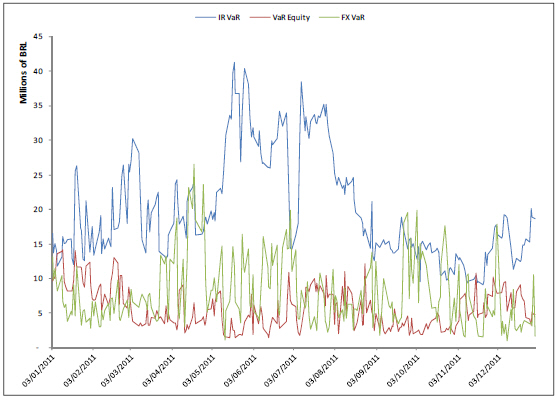
|
|
* Date format used is day/month/year
|
|
Fixed Income
|
Equities
|
Exchange Rate
|
Total
|
|||||||||||||
|
(in millions of R$)
|
||||||||||||||||
|
Total trading
|
(18.5 | ) | (6.0 | ) | (7.6 | ) | (32.1 | ) | ||||||||
|
Total
|
0-1 month
|
1-3 months
|
3-6 months
|
6-12 months
|
1-3 years
|
3-5 years
|
> 5 years
|
Not Sensitive
|
||||||||||||||||||||||||||||
|
Structural Gap
|
(in millions of R$)
|
|||||||||||||||||||||||||||||||||||
|
Money Market
|
161,496 | 66,851 | 8,484 | 7,813 | 11,616 | 25,182 | 15,985 | 18,076 | 7,491 | |||||||||||||||||||||||||||
|
Loans
|
173,890 | 37,776 | 21,976 | 26,507 | 29,071 | 47,057 | 7,035 | 4,332 | 137 | |||||||||||||||||||||||||||
|
Permanent
|
28,208 | – | – | – | – | – | – | – | 28,208 | |||||||||||||||||||||||||||
|
Other
|
104,007 | 39,015 | – | – | – | – | – | – | 64,992 | |||||||||||||||||||||||||||
|
Total Assets
|
467,602 | 143,642 | 30,460 | 34,320 | 40,687 | 72,239 | 23,020 | 22,408 | 100,828 | |||||||||||||||||||||||||||
|
Money Market
|
(162,619 | ) | (125,071 | ) | (1,390 | ) | (536 | ) | (2,137 | ) | (14,381 | ) | (7,474 | ) | (11,630 | ) | – | |||||||||||||||||||
|
Deposits
|
(120,571 | ) | (69,866 | ) | (1,140 | ) | (417 | ) | (46,344 | ) | (1,362 | ) | (730 | ) | (350 | ) | (362 | ) | ||||||||||||||||||
|
Equity and Other
|
(184,412 | ) | (40,457 | ) | (4,557 | ) | (4,417 | ) | (3,537 | ) | (204 | ) | (8 | ) | – | (131,232 | ) | |||||||||||||||||||
|
Total Liabilities
|
(467,602 | ) | (235,393 | ) | (7,087 | ) | (5,370 | ) | (52,018 | ) | (15,948 | ) | (8,212 | ) | (11,981 | ) | (131,594 | ) | ||||||||||||||||||
|
Balance Gap
|
– | (91,751 | ) | 23,373 | 28,949 | (11,331 | ) | 56,291 | 14,808 | 10,427 | (30,766 | ) | ||||||||||||||||||||||||
|
Off Balance Gap
|
– | 17,270 | (14,950 | ) | (2,710 | ) | (925 | ) | 3,761 | (3,106 | ) | 660 | – | |||||||||||||||||||||||
|
Total Structural Gap
|
– | (74,482 | ) | 8,423 | 26,240 | (12,256 | ) | 60,052 | 11,702 | 11,087 | (30,766 | ) | ||||||||||||||||||||||||
|
Accumulated Gap
|
– | (74,482 | ) | (66,059 | ) | (39,819 | ) | (52,075 | ) | 7,978 | 19,679 | 30,766 | – | |||||||||||||||||||||||
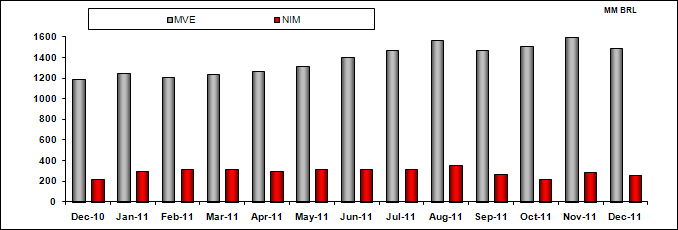
|
Total
|
0-1 month
|
1-3 months
|
3-6 months
|
6-12 months
|
1-3 years
|
3-5 years
|
> 5 years
|
Not Sensitive
|
||||||||||||||||||||||||||||
|
Gaps in local currency
|
||||||||||||||||||||||||||||||||||||
|
Money Market
|
138,859 | 61,000 | 8,359 | 7,795 | 10,593 | 22,172 | 11,919 | 9,572 | 7,448 | |||||||||||||||||||||||||||
|
Loans
|
148,663 | 35,254 | 18,374 | 18,234 | 22,130 | 45,347 | 5,059 | 4,246 | 18 | |||||||||||||||||||||||||||
|
Permanent
|
28,051 | – | – | – | – | – | – | – | 28,051 | |||||||||||||||||||||||||||
|
Others
|
70,853 | 5,699 | – | – | – | – | – | – | 65,154 | |||||||||||||||||||||||||||
|
Total Assets
|
386,425 | 101,953 | 26,733 | 26,030 | 32,723 | 67,520 | 16,978 | 13,818 | 100,671 | |||||||||||||||||||||||||||
|
Money Market
|
(137,175 | ) | (122,339 | ) | (491 | ) | (435 | ) | (495 | ) | (10,722 | ) | 21 | (2,714 | ) | – | ||||||||||||||||||||
|
Deposits
|
(117,060 | ) | (67,286 | ) | (312 | ) | (354 | ) | (46,325 | ) | (1,362 | ) | (708 | ) | (350 | ) | (362 | ) | ||||||||||||||||||
|
Equity and Other
|
(135,440 | ) | (4,035 | ) | – | (350 | ) | – | – | – | – | (131,055 | ) | |||||||||||||||||||||||
|
Total Liabilities
|
(389,674 | ) | (193,659 | ) | (803 | ) | (1,139 | ) | (46,821 | ) | (12,085 | ) | (687 | ) | (3,064 | ) | (131,417 | ) | ||||||||||||||||||
|
Off-Balance Gap
|
16,588 | 6,078 | 708 | (1,996 | ) | (2,350 | ) | 4,270 | (2,497 | ) | (800 | ) | 13,174 | |||||||||||||||||||||||
|
Gap
|
13,339 | (85,628 | ) | 26,638 | 22,895 | (16,447 | ) | 59,705 | 13,794 | 9,954 | (17,572 | ) | ||||||||||||||||||||||||
|
Total
|
0-1 month
|
1-3 months
|
3-6 months
|
6-12 months
|
1-3 years
|
3-5 years
|
> 5 years
|
Not Sensitive
|
||||||||||||||||||||||||||||
|
Gaps in foreign currency
|
||||||||||||||||||||||||||||||||||||
|
Money Market
|
22,638 | 5,851 | 124 | 18 | 1,023 | 3,010 | 4,066 | 8,504 | 43 | |||||||||||||||||||||||||||
|
Loans
|
25,227 | 2,522 | 3,602 | 8,272 | 6,941 | 1,709 | 1,976 | 86 | 119 | |||||||||||||||||||||||||||
|
Permanent
|
158 | – | – | – | – | – | – | – | 158 | |||||||||||||||||||||||||||
|
Others
|
33,154 | 33,316 | – | – | – | – | – | – | (152 | ) | ||||||||||||||||||||||||||
|
Total Assets
|
81,177 | 41,689 | 3,727 | 8,290 | 7,963 | 4,719 | 6,042 | 8,590 | 157 | |||||||||||||||||||||||||||
|
Money Market
|
(25,444 | ) | (2,732 | ) | (899 | ) | (101 | ) | (1,642 | ) | (3,659 | ) | (7,495 | ) | (8,916 | ) | – | |||||||||||||||||||
|
Deposits
|
(3,512 | ) | (2,580 | ) | (828 | ) | (63 | ) | (19 | ) | – | (22 | ) | – | – | |||||||||||||||||||||
|
Equity and Other
|
(48,973 | ) | (36,422 | ) | (4,557 | ) | (4,068 | ) | (3,537 | ) | (204 | ) | (8 | ) | – | (177 | ) | |||||||||||||||||||
|
Total Liabilities
|
(77,928 | ) | (41,734 | ) | (6,284 | ) | (4,232 | ) | (5,197 | ) | (3,863 | ) | (7,525 | ) | (8,916 | ) | (177 | ) | ||||||||||||||||||
|
Off-Balance Gap
|
(16,588 | ) | 11,191 | (15,658 | ) | (714 | ) | 1,425 | (509 | ) | (609 | ) | 1,460 | (13,174 | ) | |||||||||||||||||||||
|
Gap
|
(13,339 | ) | 11,146 | (18,215 | ) | 3,344 | 4,192 | 347 | (2,092 | ) | 1,133 | (13,194 | ) | |||||||||||||||||||||||
|
At December 30,
|
||||||||||||||||||||
|
2011
|
2010
|
|||||||||||||||||||
|
Low
|
Average
|
High
|
Period End
|
Period End
|
||||||||||||||||
|
(in millions of R$)
|
||||||||||||||||||||
|
Trading
|
9.63 | 21.74 | 45.29 | 19.52 | 20.60 | |||||||||||||||
|
Non-trading
|
251.8 | 303.12 | 362.70 | 251.8 | 351.86 | |||||||||||||||
|
Diversification effect
|
– | – | – | – | – | |||||||||||||||
|
Total
|
261.43 | 324.86 | 407.99 | 271.32 | 372.46 | |||||||||||||||
|
Note:
|
VaR figures for trading and non-trading portfolios were added, thus disregarding the diversification effect.
|
|
At December 30,
|
||||||||||||||||||||
|
2011
|
2010
|
|||||||||||||||||||
|
Low
|
Average
|
High
|
Period End
|
Period End
|
||||||||||||||||
|
(in millions of R$)
|
||||||||||||||||||||
|
Interest rate risk
|
||||||||||||||||||||
|
Trading
|
9.07 | 19.94 | 41.31 | 18.72 | 20.18 | |||||||||||||||
|
Non-trading
|
251.8 | 303.12 | 362.70 | 251.8 | 351.86 | |||||||||||||||
|
Diversification effect
|
– | – | – | – | – | |||||||||||||||
|
Total
|
260.87 | 323.06 | 404.01 | 270.52 | 372.04 | |||||||||||||||
|
Note:
|
VaR figures for trading and non-trading portfolios were added, thus disregarding the diversification effect.
|
|
At December 30,
|
||||||||||||||||||||
|
2011
|
2010
|
|||||||||||||||||||
|
Low
|
Average
|
High
|
Period End
|
Period End
|
||||||||||||||||
|
(in millions of R$)
|
||||||||||||||||||||
|
Exchange rate risk
|
||||||||||||||||||||
|
Trading
|
0.98 | 7.82 | 26.52 | 1.68 | 14.41 | |||||||||||||||
|
Non–trading
|
N.A.
|
N.A.
|
N.A.
|
N.A.
|
N.A.
|
|||||||||||||||
|
Diversification effect
|
– | – | – | – | – | |||||||||||||||
|
Total
|
0.98 | 7.82 | 26.52 | 1.68 | 14.41 | |||||||||||||||
|
Note:
|
VaR figures for trading and non-trading portfolios were added, thus disregarding the diversification effect.
|
|
At December 30,
|
||||||||||||||||||||
|
2011
|
2010
|
|||||||||||||||||||
|
Low
|
Average
|
High
|
Period End
|
Period End
|
||||||||||||||||
|
(in millions of R$)
|
||||||||||||||||||||
|
Equity price risk
|
||||||||||||||||||||
|
Trading
|
1.46 | 5.71 | 14.19 | 4.80 | 3.80 | |||||||||||||||
|
Non-trading
|
N.A.
|
N.A.
|
N.A.
|
N.A.
|
N.A.
|
|||||||||||||||
|
Diversification effect
|
1.46 | 5.71 | 14.19 | 4.80 | 3.80 | |||||||||||||||
|
Note:
|
VaR figures for trading and non-trading portfolios were added, thus disregarding the diversification effect.
|
|
At December 30,
|
||||||||||||||||||||
|
2011
|
2010
|
|||||||||||||||||||
|
Low
|
Average
|
High
|
Period End
|
Period End
|
||||||||||||||||
|
(in millions of R$)
|
||||||||||||||||||||
|
Trading
|
||||||||||||||||||||
|
Interest rate risk
|
9.07 | 19.94 | 41.31 | 18.72 | 20.18 | |||||||||||||||
|
Exchange rate risk
|
0.98 | 7.82 | 26.52 | 1.68 | 14.41 | |||||||||||||||
|
Equity
|
1.46 | 5.71 | 14.19 | 4.80 | 7.63 | |||||||||||||||
|
Total
|
9.63 | 21.74 | 45.29 | 19.52 | 20.60 | |||||||||||||||
|
Non-trading interest rate
|
||||||||||||||||||||
|
Interest rate
|
251.80 | 303.12 | 362.7 | 251.8 | 351.86 | |||||||||||||||
|
Non-trading foreign exchange
|
||||||||||||||||||||
|
Exchange rate
|
N.A.
|
N.A.
|
N.A.
|
N.A.
|
N.A.
|
|||||||||||||||
|
Non-trading equity
|
||||||||||||||||||||
|
Equity
|
N.A.
|
N.A.
|
N.A.
|
N.A.
|
N.A.
|
|||||||||||||||
|
Total
|
261.43 | 324.86 | 407.99 | 271.32 | 372.46 | |||||||||||||||
|
Interest rate
|
260.87 | 323.06 | 404.01 | 270.52 | 372.04 | |||||||||||||||
|
Exchange rate
|
0.98 | 7.82 | 26.52 | 1.68 | 14.41 | |||||||||||||||
|
Equity
|
1.46 | 5.71 | 14.19 | 4.80 | 7.63 | |||||||||||||||
|
Note:
|
VaR figures for trading and non-trading portfolios were added, thus disregarding the diversification effect.
|
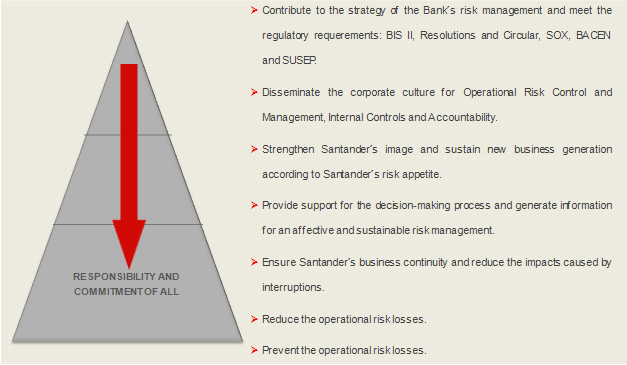
|
|
·
|
Executive Operational Risks Committee —The Committee is an independent senior committee, with decision-making autonomy. This committee is responsible for defining the strategies and guidelines throughout Santander Brasil for the management and control of operational, technological and business continuity risks;
|
|
|
·
|
Operational Risk Unit — The Operational Risk Unit is comprised of four departments: Information Security, Special Occurrences (fraud investigation), Intelligence and Fraud Prevention and Operational and Technological Risks. Responsibilities include a commitment to disseminate the culture, defining methodologies, standards, policies, tools, training and procedures applicable to and required for the effective and efficient management and control of the operational risk; and
|
|
|
·
|
Operational and Technological Risks Department — The Department is responsible for ensuring the soundness of operational and technological risk management practices throughout the organization in addition to guarantying business continuity management for contingencies. The area assists managerial staff in meeting their strategic objectives, strengthening the decision-making process and optimizing execution of daily activities. The Department contributes to preventing and reducing operational risk losses, and also provides the best practices for operational risk management as well as to be in compliance with regulatory requirements.
|
|
|
·
|
a fee of U.S.$1.50 per ADR for transfers of certificated or direct registration ADRs;
|
|
|
·
|
a fee of up to U.S.$0.05 per ADS for any cash distribution made pursuant to the deposit agreement;
|
|
|
·
|
a fee of U.S.$0.05 per ADS per calendar year (or portion thereof) for services performed by the depositary in administering our ADR program (which fee may be charged on a periodic basis during each calendar year and shall be assessed against holders of ADRs as of the record date or record dates set by the depositary during each calendar year and shall be payable in the manner described in the next succeeding provision);
|
|
|
·
|
any other charge payable by any of the depositary, any of the depositary’s agents, including, without limitation, the custodian, or the agents of the depositary’s agents in connection with the servicing of our units or other deposited securities (which charge shall be assessed against registered holders of our ADRs as of the record date or dates set by the depositary and shall be payable at the sole discretion of the depositary by billing such registered holders or by deducting such charge from one or more cash dividends or other cash distributions);
|
|
|
·
|
a fee for the distribution of securities (or the sale of securities in connection with a distribution), such fee being in an amount equal to the fee for the execution and delivery of ADSs that would have been charged as a result of the deposit of such securities (treating all such securities as if they were units) but which securities or the net cash proceeds from the sale thereof are instead distributed by the depositary to those holders entitled thereto;
|
|
|
·
|
stock transfer or other taxes and other governmental charges;
|
|
|
·
|
cable, telex and facsimile transmission and delivery charges incurred at the holder’s request;
|
|
|
·
|
transfer or registration fees for the registration of transfer of deposited securities on any applicable register in connection with the deposit or withdrawal of deposited securities;
|
|
|
·
|
expenses of the depositary in connection with the conversion of foreign currency into U.S. dollars; and
|
|
|
·
|
such fees and expenses as are incurred by the depositary (including, without limitation, expenses incurred in connection with compliance with foreign exchange control regulations or any law or regulation relating to foreign investment) in delivery of deposited securities or otherwise in connection with the depositary’s or its custodian’s compliance with applicable laws, rules or regulations.
|
|
|
·
|
Pertain to the maintenance of records that in reasonable detail accurately and fairly reflect the transactions and dispositions of our assets;
|
|
|
·
|
Provide reasonable assurance that transactions are recorded as necessary to permit preparation of consolidated financial statements in accordance with generally accepted accounting principles, and that our receipts and expenditures are being made only in accordance with authorizations of our management and officers; and
|
|
|
·
|
Provide reasonable assurance prevention or timely detection of unauthorized acquisition, use or disposition of our assets that could have a material effect on the consolidated financial statements.
|
|
2011
|
2010
|
|||||||
|
(in millions of R$)
|
||||||||
|
Audit of the annual financial statements of the companies audited by Deloitte (constant scope of consolidation)
|
8.83 | 9.05 | ||||||
|
2011
|
Total Number of Units Purchased
|
Average Price Paid per Unit
in U.S.$
|
Total Number of Units Purchased as Part of Publicly Announced Plans or Programs
|
Maximum Number (or Approximate Dollar Value) of Units that May Yet Be Purchased Under the Plans or Programs
|
||||||||||||
|
January 1 to January 31
|
— | — | — | — | ||||||||||||
|
February 1 to February 28
|
2,000,501 | 11.8 | — | — | ||||||||||||
|
March 1 to March 31
|
999,499 | 11.5 | — | — | ||||||||||||
|
April 1 to April 30
|
1,000,000 | 11.5 | — | — | ||||||||||||
|
May 1 to May 31
|
9,090,844 | 11.0 | — | — | ||||||||||||
|
June 1 to June 30
|
1,190,000 | 10.6 | — | — | ||||||||||||
|
July 1 to July 31
|
2,717,008 | 9.2 | — | — | ||||||||||||
|
August 1 to August 31
|
14,278,096 | 8.8 | — | — | ||||||||||||
|
September 1 to September 30
|
3,046,114 | 7.9 | — | — | ||||||||||||
|
October 1 to October 31
|
— | — | — | — | ||||||||||||
|
November 1 to November 30
|
— | — | — | — | ||||||||||||
|
December 1 to December 31
|
— | — | — | — | ||||||||||||
|
Total
|
34,322,062 | 10.3 | — | — | ||||||||||||
|
2011
|
Total Number of Units Purchased
|
Average Price Paid per Unit in U.S.$
|
Total Number of Units Purchased as Part of Publicly Announced Plans or Programs
|
Maximum Number (or Approximate Dollar Value) of Units that May Yet Be Purchased Under the Plans or Programs
|
||||||||||||
|
January 1 to January 31
|
— | — | — | — | ||||||||||||
|
February 1 to February 28
|
— | — | — | — | ||||||||||||
|
March 1 to March 31
|
— | — | — | — | ||||||||||||
|
April 1 to April 30
|
— | — | — | — | ||||||||||||
|
May 1 to May 31
|
— | — | — | — | ||||||||||||
|
June 1 to June 30
|
— | — | — | — | ||||||||||||
|
July 1 to July 31
|
— | — | — | — | ||||||||||||
|
August 1 to August 31
|
1,773,000 | 14.67 | 1,773,000 | — | ||||||||||||
|
September 1 to September 30
|
2,927,600 | 14.98 | 2,927,600 | — | ||||||||||||
|
October 1 to October 31
|
— | — | — | — | ||||||||||||
|
November 1 to November 30
|
324,600 | 14.84 | 324,600 | — | ||||||||||||
|
December 1 to December 31
|
355,600 | 14.51 | 355,600 | — | ||||||||||||
|
Total
|
5,380,800 | — | 5,380,800 | 49,892,602 | ||||||||||||
|
2011
|
Total Number of Units Purchased
|
Average Price Paid per Unit
in U.S.$
|
Total Number of Units Purchased as Part of Publicly Announced Plans or Programs
|
Maximum Number (or Approximate Dollar Value) of Units that May Yet Be Purchased Under the Plans or Programs
|
||||||||||||
|
January 1 to January 31
|
— | — | — | — | ||||||||||||
|
February 1 to February 28
|
— | — | — | — | ||||||||||||
|
March 1 to March 31
|
— | — | — | — | ||||||||||||
|
April 1 to April 30
|
— | — | — | — | ||||||||||||
|
May 1 to May 31
|
— | — | — | — | ||||||||||||
|
June 1 to June 30
|
— | — | — | — | ||||||||||||
|
July 1 to July 31
|
— | — | — | — | ||||||||||||
|
August 1 to August 31
|
— | — | — | — | ||||||||||||
|
September 1 to September 30
|
1,732,900 | 10.21 | 1,732,900 | — | ||||||||||||
|
October 1 to October 31
|
— | — | — | — | ||||||||||||
|
November 1 to November 30
|
— | — | — | — | ||||||||||||
|
December 1 to December 31
|
— | — | — | — | ||||||||||||
|
Total
|
1,732,900 | — | — | 49,892,602 | ||||||||||||
|
Page
|
|
|
Report of Deloitte Touche Tohmatsu
|
F-1
|
|
Report of Deloitte Touche Tohmatsu regarding internal control
|
F-3
|
|
Consolidated Balance Sheets for the years ended December 31, 2011, 2010 and 2009
|
F-5
|
|
Consolidated Income Statements for the years ended December 31, 2011, 2010 and 2009
|
F-7
|
|
Consolidated Statements of Recognized Income and Expense for the years ended December 31, 2011, 2010 and 2009
|
F-8
|
|
Consolidated Statements of Changes in Total Equity for the years ended December 31, 2011, 2010 and 2009
|
F-9
|
|
Consolidated Cash Flow Statements for the years ended December 31, 2011, 2010 and 2009
|
F-10
|
|
Notes to the Consolidated Financial Statements for the years ended December 31, 2011, 2010 and 2009
|
F-11
|
|
Exhibit Number
|
Description
|
|
|
1.1
|
English translation of By-laws of Santander Brasil, amended and restated on May 21, 2010. (Incorporated by reference to Exhibit 1.1 to our annual report on Form 20-F (file no. 001-34476) filed with the SEC on June 9, 2010.)
|
|
|
2.1
|
Form of Deposit Agreement among Santander Brasil, JPMorgan Chase Bank, N.A., as depositary, and the holders from time to time of American depositary shares issued thereunder, including the form of American depositary receipts. (Incorporated by reference to our Registration Statement on Form F-6 (file no. 333-162027) filed with the SEC on September 21, 2009)
|
|
|
2.2
|
Amendment No. 1 to Deposit Agreement dated as of February 10, 2011 among Santander Brasil, JPMorgan Chase Bank, N.A., as depositary, and holders from time to time of American depositary receipts issued thereunder. (Incorporated by reference to Exhibit (a)(2) to our Registration Statement on Form F-6 (file no. 333-172167) filed with the SEC on February 11, 2011.)
|
|
|
4.1
|
Option Plan to Purchase Share deposit Certificate of Santander Brasil (Incorporated by reference to Attachment I to our Form 6-K/A filed with the SEC on January 6, 2010.)
|
|
|
8.1
|
List of Subsidiaries (Incorporated by reference as Appendix I of our Consolidated Financial Statements filed with this Form 20-F.)
|
|
11.1
|
English translation of the Code of Ethics of Santander Brasil, amended and restated on October 8, 2010. (Incorporated by reference to Exhibit 11.1 to our annual report on Form 20-F (file no. 001-34476) filed with the SEC on April 8, 2011.)
|
|
|
12.1
|
Section 302 Certification by the principal executive officer.
|
|
|
12.2
|
Section 302 Certification by the principal financial officer.
|
|
|
13.1
|
Section 906 Certification by the chief executive officer.
|
|
|
13.2
|
Section 906 Certification by the chief financial officer.
|
|
|
15.1
|
Consent of Deloitte Touche Tohmatsu Auditores Independentes.
|
|
BANCO SANTANDER (Brasil) S.A.
|
|||
|
By:
|
/s/ Marcial Angel Portela Alvarez
|
||
|
Name:
|
Marcial Angel Portela Alvarez
|
||
|
Title:
|
Chief Executive Officer
|
||

|
Deloitte Touche Tohmatsu
Rua José Guerra, 127
04719-030 - São Paulo - SP
Brasil
Tel.: +55 (11) 5186-1000
Fax: +55 (11) 5181-2911
www.deloitte.com.br
|
|
Deloitte refers to one or more of Deloitte Touche Tohmatsu, a Swiss Verein, and its network of member firms,
each of which is a legally separate and independent entity. Please see www.deloitte.com/about for a detailed
description of the legal structure of Deloitte Touche Tohmatsu and its member firms.
|
Member of
Deloitte Touche Tohmatsu
|
We have also audited, in accordance with the standards of the Public Company Accounting Oversight Board (United States) - PCAOB, the Bank’s internal control over financial reporting as of December 31, 2011, based on the criteria established in Internal Control - Integrated Framework issued by the Committee of Sponsoring Organizations of the Treadway Commission - COSO, and our report dated March 30, 2012 expressed an unqualified opinion on the Bank’s internal control over financial reporting.
|
/s/ DELOITTE TOUCHE TOHMATSU
|
/s/ Gilberto Bizerra de Souza
|
|
DELOITTE TOUCHE TOHMATSU
|
Gilberto Bizerra de Souza
|
|
Auditores Independentes
|
Engagement Partner
|
F-2
|
Deloitte Touche Tohmatsu
Rua José Guerra, 127
04719-030 - São Paulo - SP
Brasil
Tel.: +55 (11) 5186-1000
Fax: +55 (11) 5181-2911
www.deloitte.com.br
|
We have also audited, in accordance with the standards of the Public Company Accounting Oversight Board (United States) - PCAOB, the consolidated financial statements as of and for the year ended December 31, 2011 of Banco Santander (Brasil) S.A. and subsidiaries (“Bank”) and our report dated March 30, 2012 expressed an unqualified opinion on those consolidated financial statements.
|
|
|
|
CONSOLIDATED BALANCE SHEETS FOR THE YEARS ENDED DECEMBER 31, 2011, 2010 AND 2009 |
|
|
(Thousands of Brazilian Reais - R$) |
|
| ASSETS | Note | 2011 | 2010 | 2009 |
| CASH AND BALANCES WITH THE BRAZILIAN CENTRAL BANK | 4 | 65,938,003 | 56,800,151 | 27,269,012 |
| FINANCIAL ASSETS HELD FOR TRADING | 29,901,495 | 24,821,365 | 20,115,652 | |
|
Loans and amounts due from credit institutions |
5 | - | 47,662 | 67,170 |
|
Debt instruments |
6 | 25,298,804 | 16,472,413 | 12,554,035 |
|
Equity instruments |
7 | 448,209 | 3,283,931 | 2,544,441 |
|
Trading derivatives |
8 | 4,154,482 | 5,017,359 | 4,950,006 |
| OTHER FINANCIAL ASSETS AT FAIR VALUE THROUGH PROFIT OR LOSS | 665,369 | 17,939,781 | 16,294,460 | |
|
Loans and amounts due from credit institutions |
5 | 60,813 | 292,034 | 1,907,265 |
|
Loans and advances to customers |
9 | - | - | 389,113 |
|
Debt instruments |
6 | 230,037 | 224,388 | 210,973 |
|
Equity instruments |
7 | 374,519 | 17,423,359 | 13,787,109 |
| AVAILABLE-FOR-SALE FINANCIAL ASSETS | 44,608,201 | 47,206,019 | 46,406,120 | |
|
Debt instruments |
6 | 43,300,354 | 45,477,982 | 44,745,924 |
|
Equity instruments |
7 | 1,307,847 | 1,728,037 | 1,660,196 |
| LOANS AND RECEIVABLES | 202,757,191 | 174,106,525 | 152,162,954 | |
|
Loans and amounts due from credit institutions |
5 | 19,628,861 | 22,658,520 | 24,228,143 |
|
Loans and advances to customers |
9 | 183,066,268 | 151,366,561 | 127,934,811 |
|
Debt instruments |
6 | 62,062 | 81,444 | - |
| HEDGING DERIVATIVES | 8 | 80,708 | 115,640 | 163,425 |
| NON-CURRENT ASSETS HELD FOR SALE | 10 | 132,388 | 66,821 | 171,464 |
| INVESTMENTS IN ASSOCIATES | 11 | 422,225 | 370,586 | 419,122 |
| TANGIBLE ASSETS | 12 | 5,008,306 | 4,518,109 | 3,701,769 |
| INTANGIBLE ASSETS | 31,435,080 | 31,962,619 | 31,617,939 | |
|
Goodwill |
13 | 27,217,565 | 28,312,236 | 28,312,236 |
|
Other intangible assets |
14 | 4,217,515 | 3,650,383 | 3,305,703 |
| TAX ASSETS | 16,250,373 | 14,842,066 | 15,779,222 | |
|
Current |
2,077,224 | 1,217,186 | 2,162,063 | |
|
Deferred |
23 | 14,173,149 | 13,624,880 | 13,617,159 |
| OTHER ASSETS | 15 | 2,686,743 | 1,913,001 | 1,871,437 |
| TOTAL ASSETS | 399,886,082 | 374,662,683 | 315,972,576 | |
* For a better disclosure, are being released compared the Balance Sheet of the last two years, even without any adjustments or retrospective restatement of previously disclosed information.
The accompanying Notes and Appendix I are an integral part of these consolidated financial statements.
F-5
|
|
|
|
BANCO SANTANDER (BRASIL) S.A.
|
|
|
(Thousands of Brazilian Reais - R$) |
|
| LIABILITIES AND EQUITY | Note | 2011 | 2010 | 2009 |
| FINANCIAL LIABILITIES HELD FOR TRADING | 5,047,288 | 4,784,653 | 4,434,734 | |
|
Trading derivatives |
8 | 4,709,660 | 4,755,314 | 4,401,709 |
|
Short positions |
8 | 337,628 | 29,339 | 33,025 |
| OTHER FINANCIAL LIABILITIES AT FAIR VALUE THROUGH PROFIT OR LOSS | - | - | 1,795 | |
|
Deposits from credit institutions |
16 | - | - | 1,795 |
| FINANCIAL LIABILITIES AT AMORTISED COST | 291,451,686 | 253,340,771 | 203,567,734 | |
|
Deposits from Central Bank and deposits from credit institutions |
16 | 51,527,021 | 42,391,572 | 21,195,959 |
|
Customer deposits |
17 | 174,473,891 | 167,949,201 | 149,440,156 |
|
Marketable debt securities |
18 | 38,590,423 | 20,086,645 | 11,439,010 |
|
Subordinated liabilities |
19 | 10,908,344 | 9,695,105 | 11,304,445 |
|
Other financial liabilities |
20 | 15,952,007 | 13,218,248 | 10,188,164 |
| HEDGING DERIVATIVES | 8 | 36,071 | 112 | 9,806 |
| LIABILITIES FOR INSURANCE CONTRACTS | 21 | - | 19,643,129 | 15,527,197 |
| PROVISIONS | 9,515,295 | 9,395,161 | 9,480,262 | |
|
Provisions for pensions funds and similar obligations |
22 | 1,246,040 | 1,190,108 | 1,096,799 |
|
Provisions for judicial and administrative proceedings, commitments and other provisions |
22 | 8,269,255 | 8,205,053 | 8,383,463 |
| TAX LIABILITIES | 11,875,899 | 10,529,625 | 9,456,537 | |
|
Current |
8,127,795 | 6,249,466 | 5,588,680 | |
|
Deferred |
23 | 3,748,104 | 4,280,159 | 3,867,857 |
| OTHER LIABILITIES | 24 | 3,927,851 | 3,605,838 | 4,227,768 |
| TOTAL LIABILITIES | 321,854,090 | 301,299,289 | 246,705,833 | |
| SHAREHOLDERS' EQUITY | 27 | 77,044,886 | 72,571,563 | 68,706,363 |
|
Share capital |
62,634,585 | 62,634,585 | 62,612,455 | |
|
Reserves |
9,950,144 | 6,094,885 | 2,161,302 | |
|
Treasury shares |
(112,768) | - | - | |
|
Profit for the year attributable to the Parent |
7,747,925 | 7,382,093 | 5,507,606 | |
|
Less: dividends and remuneration |
(3,175,000) | (3,540,000) | (1,575,000) | |
| VALUATION ADJUSTMENTS | 25 | 968,146 | 783,755 | 559,042 |
|
Available-for-sale financial assets |
960,199 | 949,597 | 791,966 | |
|
Cash flow hedges |
7,947 | (165,842) | (232,924) | |
| NON-CONTROLLING INTERESTS | 26 | 18,960 | 8,076 | 1,338 |
| TOTAL EQUITY | 78,031,992 | 73,363,394 | 69,266,743 | |
| TOTAL LIABILITIES AND EQUITY | 399,886,082 | 374,662,683 | 315,972,576 | |
* For a better disclosure, are being released compared the Balance Sheet of the last two years, even without any adjustments or retrospective restatement of previously disclosed information.
The accompanying Notes and Appendix I are an integral part of these consolidated financial statements.
F-6
|
|
|
|
BANCO SANTANDER (BRASIL) S.A.
|
|
|
(Thousands of Brazilian Reais - R$ , except for per share data) |
|
| Note | 2011 | 2010 | 2009 | |
| Interest and similar income | 29 | 51,736,080 | 40,909,204 | 39,342,956 |
| Interest expense and similar charges | 30 | (23,834,316) | (16,814,126) | (17,175,865) |
| NET INTEREST INCOME | 27,901,764 | 24,095,078 | 22,167,091 | |
| Income from equity instruments | 31 | 93,727 | 51,721 | 29,903 |
| Income from companies accounted for by the equity method | 11 | 54,216 | 43,942 | 295,414 |
| Fee and commission income | 32 | 8,769,170 | 7,833,293 | 7,148,164 |
| Fee and commission expense | 33 | (1,429,672) | (997,785) | (910,402) |
| Gains (losses) on financial assets and liabilities (net) | 34 | (113,659) | 1,458,150 | 2,716,323 |
|
Financial assets held for trading |
(902,167) | 1,159,058 | 2,032,272 | |
|
Other financial instruments at fair value through profit or loss |
57,039 | (26,828) | (10,132) | |
|
Financial instruments not measured at fair value through profit or loss |
705,279 | 254,162 | 755,916 | |
|
Other |
26,190 | 71,758 | (61,733) | |
| Exchange differences (net) | 35 | (121,364) | 416,900 | (51,191) |
| Other operating income (expense) | 36 | (379,418) | (347,999) | (115,624) |
| TOTAL INCOME | 34,774,764 | 32,553,300 | 31,279,678 | |
| Administrative expenses | (12,372,632) | (11,230,602) | (10,947,217) | |
|
Personnel expenses |
37 | (6,643,731) | (5,926,176) | (5,510,972) |
|
Other administrative expenses |
38 | (5,728,901) | (5,304,426) | (5,436,245) |
| Depreciation and amortization | (1,462,034) | (1,237,410) | (1,248,612) | |
|
Tangible assets |
12 | (570,132) | (487,626) | (447,138) |
|
Intangible assets |
14 | (891,902) | (749,784) | (801,474) |
| Provisions (net) | 22 | (3,061,463) | (1,974,326) | (3,480,693) |
| Impairment losses on financial assets (net) | (9,381,549) | (8,233,810) | (9,966,404) | |
|
Loans and receivables |
9 | (9,381,549) | (8,232,912) | (9,982,881) |
|
Other financial instruments not measured at fair value through profit or loss |
- | (898) | 16,477 | |
| Impairment losses on other assets (net) | (38,646) | (20,600) | (900,554) | |
|
Other intangible assets |
14.b | (17,070) | (813) | (859,216) |
|
Other assets |
(21,576) | (19,787) | (41,338) | |
| Gains (losses) on disposal of assets not classified as non-current assets held for sale | 39 | 5,320 | (59,186) | 3,369,301 |
| Gains (losses) on non-current assets held for sale not classified as discontinued operations | 40 | 446,776 | 199,137 | 31,630 |
| OPERATING PROFIT BEFORE TAX | 8,910,536 | 9,996,503 | 8,137,129 | |
| Income taxes | 23 | (1,154,683) | (2,613,929) | (2,629,165) |
| CONSOLIDATED PROFIT FOR THE YEAR | 7,755,853 | 7,382,574 | 5,507,964 | |
| Profit attributable to the Parent | 7,747,925 | 7,382,093 | 5,507,606 | |
| Profit attributable to non-controlling interests | 26 | 7,928 | 481 | 358 |
| EARNINGS PER SHARE (Reais) | 27 | |||
| Basic and Diluted earnings per 1,000 share (Reais - R$) | ||||
|
Common shares |
18.55 | 17.67 | 15.32 | |
|
Preferred shares |
20.41 | 19.44 | 16.85 | |
| Profit attributable (Reais - R$) | ||||
|
Common shares |
3,948,342 | 3,761,914 | 2,813,623 | |
|
Preferred shares |
3,799,583 | 3,620,179 | 2,693,983 | |
| Weighted average shares outstanding (in thousands) - basic and diluted | ||||
|
Common shares |
212,841,732 | 212,841,732 | 183,650,861 | |
|
Preferred shares |
186,202,385 | 186,202,385 | 159,856,132 | |
| The accompanying Notes and Appendix I are an integral part of these consolidated financial statements. | ||||
F-7
|
|
|
|
BANCO SANTANDER (BRASIL) S.A.
|
|
|
(Thousands of Brazilian Reais - R$) |
|
| 2011 | 2010 | 2009 | |
| CONSOLIDATED PROFIT FOR THE YEAR | 7,755,853 | 7,382,574 | 5,507,964 |
| OTHER RECOGNIZED INCOME AND EXPENSE | 184,391 | 224,713 | 45,425 |
| Available-for-sale financial assets | 102,092 | 328,349 | 62,088 |
|
Valuation adjustments |
807,371 | 582,511 | 818,004 |
|
Amounts transferred to income statement |
(705,279) | (254,162) | (755,916) |
| Cash flow hedges | 276,752 | 121,335 | 65,017 |
|
Valuation adjustments |
15,149 | 121,335 | 65,017 |
|
Amounts transferred to income statement |
261,603 | - | - |
| Income taxes | (194,453) | (224,971) | (81,680) |
| TOTAL RECOGNIZED INCOME AND EXPENSE | 7,940,244 | 7,607,287 | 5,553,389 |
| Attributable to the Parent | 7,932,316 | 7,606,806 | 5,553,031 |
| Attributable to non-controlling interests | 7,928 | 481 | 358 |
| TOTAL | 7,940,244 | 7,607,287 | 5,553,389 |
| The accompanying Notes and Appendix I are an integral part of these consolidated financial statements. | |||
F-8
|
|
|
|
BANCO SANTANDER (BRASIL) S.A.
|
|
|
(Thousands of Brazilian Reais - R$) |
|
|
Equity Attributable to the Parent |
|||||||||||
| Shareholders' Equity | |||||||||||
| Note |
Share
Capital |
Reserves |
Treasury
Shares |
Profit
Attributed to the Parent |
Dividends and
Remuneration |
Total
Shareholders' Equity |
Valuation
Adjustments |
Total |
Non-controlling
Interests |
Total
Equity |
|
| Balances at December 31, 2008 | 47,152,201 | 1,240,031 | - | 2,378,395 | (1,453,045) | 49,317,582 | 513,617 | 49,831,199 | 5,279 | 49,836,478 | |
| Total recognized income and expense | - | - | - | 5,507,606 | - | 5,507,606 | 45,425 | 5,553,031 | 358 | 5,553,389 | |
| Other changes in Equity | |||||||||||
|
Appropriation of profit for the year |
- | 2,378,395 | - | (2,378,395) | - | - | - | - | - | - | |
|
Dividends and interest on capital |
27.b | - | (1,453,045) | - | - | (121,955) | (1,575,000) | - | (1,575,000) | - | (1,575,000) |
|
Capital increase |
27.a | 15,460,254 | - | - | - | - | 15,460,254 | - | 15,460,254 | (4,046) | 15,456,208 |
|
Acquisition of own shares |
27.e | - | - | (1,948) | - | - | (1,948) | - | (1,948) | - | (1,948) |
|
Other |
- | (4,079) | 1,948 | - | - | (2,131) | - | (2,131) | (253) | (2,384) | |
| Balances at December 31, 2009 | 62,612,455 | 2,161,302 | - | 5,507,606 | (1,575,000) | 68,706,363 | 559,042 | 69,265,405 | 1,338 | 69,266,743 | |
| Total recognized income and expense | - | - | - | 7,382,093 | - | 7,382,093 | 224,713 | 7,606,806 | 481 | 7,607,287 | |
| Other changes in Equity | |||||||||||
|
Appropriation of profit for the year |
- | 5,507,606 | - | (5,507,606) | - | - | - | - | - | - | |
|
Dividends and interest on capital |
27.b | - | (1,575,000) | - | - | (1,965,000) | (3,540,000) | - | (3,540,000) | - | (3,540,000) |
|
Capital increase |
27.a | 22,130 | (22,130) | - | - | - | - | - | - | - | - |
|
Equity-instruments-based payments |
37.b | - | 20,976 | - | - | - | 20,976 | - | 20,976 | - | 20,976 |
|
Other |
- | 2,131 | - | - | - | 2,131 | - | 2,131 | 6,257 | 8,388 | |
| Balances at December 31, 2010 | 62,634,585 | 6,094,885 | - | 7,382,093 | (3,540,000) | 72,571,563 | 783,755 | 73,355,318 | 8,076 | 73,363,394 | |
| Total recognized income and expense | - | - | - | 7,747,925 | - | 7,747,925 | 184,391 | 7,932,316 | 7,928 | 7,940,244 | |
| Other changes in Equity | |||||||||||
|
Appropriation of profit for the year |
- | 7,382,093 | - | (7,382,093) | - | - | - | - | - | - | |
|
Dividends and interest on capital |
27.b | - | (3,540,000) | - | - | 365,000 | (3,175,000) | - | (3,175,000) | - | (3,175,000) |
|
Equity-instruments-based payments |
37.b | - | 13,153 | - | - | - | 13,153 | - | 13,153 | - | 13,153 |
|
Treasury shares |
27.e | - | - | (112,768) | - | - | (112,768) | - | (112,768) | - | (112,768) |
|
Results of treasury shares |
27.e | - | 13 | - | - | - | 13 | - | 13 | - | 13 |
|
Other |
- | - | - | - | - | - | - | - | 2,956 | 2,956 | |
| Balances at December 31, 2011 | 62,634,585 | 9,950,144 | (112,768) | 7,747,925 | (3,175,000) | 77,044,886 | 968,146 | 78,013,032 | 18,960 | 78,031,992 | |
| The accompanying Notes and Appendix I are an integral part of these consolidated financial statements. | |||||||||||
F-9
|
|
|
|
BANCO SANTANDER (BRASIL) S.A.
CONSOLIDATED CASH FLOW STATEMENTS FOR THE YEARS ENDED DECEMBER 31, 2011, 2010 AND 2009 |
|
| (Thousands of Brazilian Reais - R$) | |
| Note | 2011 | 2010 | 2009 | |
| 1. CASH FLOWS FROM OPERATING ACTIVITIES | ||||
| Consolidated profit for the year | 7,755,853 | 7,382,574 | 5,507,964 | |
| Adjustments to profit | 11,915,926 | 11,415,282 | 10,885,192 | |
|
Depreciation of tangible assets |
12 | 570,132 | 487,626 | 447,138 |
|
Amortization of intangible assets |
14.b | 891,902 | 749,784 | 801,474 |
|
Impairment losses on other assets (net) |
38,646 | 20,600 | 859,216 | |
|
Provisions and Impairment losses on financial assets (net) |
12,443,012 | 10,208,136 | 13,463,574 | |
|
Gains (losses) on disposal of tangible assets, investments and non-current assets held for sale |
(452,096) | (139,951) | (3,369,301) | |
|
Share of results of entities accounted for using the equity method |
11 | (54,216) | (43,942) | (295,414) |
|
Changes in deferred tax assets and liabilities |
(1,534,607) | 112,053 | (1,021,495) | |
|
Others |
13,153 | 20,976 | - | |
| Net (increase) decrease in operating assets | (57,373,896) | (74,520,336) | (11,978,247) | |
|
Cash and Bank with the brazilian central bank |
(8,824,495) | (45,103,539) | (1,588,979) | |
|
Financial assets held for trading |
(5,080,130) | (4,705,713) | 2,129,972 | |
|
Other financial assets at fair value through profit or loss |
(4,277,011) | (1,645,321) | 78,642 | |
|
Available-for-sale financial assets |
2,696,868 | (471,550) | (13,703,838) | |
|
Loans and receivables |
(39,864,486) | (24,059,733) | 1,029,639 | |
|
Other assets |
(2,024,642) | 1,465,520 | 76,317 | |
| Net increase (decrease) in operating liabilities | 28,524,361 | 46,406,369 | (14,648,437) | |
|
Financial liabilities held for trading |
262,635 | 349,919 | (6,776,832) | |
|
Other financial liabilities at fair value through profit or loss |
- | (1,795) | (305,581) | |
|
Financial liabilities at amortized cost |
24,290,139 | 46,469,159 | (9,656,576) | |
|
Other liabilities |
3,971,587 | (410,914) | 2,090,552 | |
| Payments of income tax | (1,932,317) | (1,043,419) | (1,973,257) | |
| Total net cash flows from operating activities (1) | (11,110,073) | (10,359,530) | (12,206,785) | |
| 2. CASH FLOWS FROM INVESTING ACTIVITIES | ||||
| Investments | (2,547,692) | (2,372,866) | (3,129,033) | |
|
Tangible assets |
12 | (1,074,509) | (1,319,869) | (1,815,803) |
|
Intangible assets |
14.b | (1,478,802) | (1,086,208) | (1,466,411) |
|
Capital Increase in affiliates |
(6,356) | - | - | |
|
Dividends and Interest on Capital Received |
11-b | 11,975 | 33,211 | 153,181 |
| Divestments | 2,758,295 | 38,757 | 5,862,334 | |
|
Subsidiaries, jointly controlled entities and associates |
3.a | 2,741,102 | - | 4,436,325 |
|
Tangible assets |
17,193 | 38,757 | 1,426,009 | |
|
Non-current assets held for sale; net |
- | - | - | |
| Total net cash flows from investing activities (2) | 210,603 | (2,334,109) | 2,733,301 | |
| 3. CASH FLOWS FROM FINANCING ACTIVITIES | ||||
| Capital increase | 27 | - | - | 12,986,710 |
| Acquisition of own shares | 27 | (112,755) | - | (1,948) |
| Issuance of subordinated liabilities | 19 | - | - | 1,507,000 |
| Issuance of other long-term financial liabilities | 18 | 29,501,246 | 21,402,252 | 14,746,518 |
| Dividends paid and interest on capital | (3,926,417) | (2,734,666) | (1,540,914) | |
| Payments of subordinated liabilities | 19 | - | (2,534,750) | (159,905) |
| Payments of other long-term financial liabilities | 18 | (14,895,052) | (12,828,958) | (16,080,145) |
| Increase/Decrease in non-controlling interests | 26 | 2,956 | 6,257 | (4,299) |
| Total net cash flows from financing activities (3) | 10,569,978 | 3,310,135 | 11,453,017 | |
| NET INCREASE/DECREASE IN CASH AND CASH EQUIVALENTS (1+2+3) | (329,492) | (9,383,504) | 1,979,533 | |
| Cash and cash equivalents at beginning of year | 9,346,899 | 18,730,403 | 16,750,870 | |
| Cash and cash equivalents at end of year | 9,017,407 | 9,346,899 | 18,730,403 | |
| Cash and cash equivalents components | ||||
| Cash | 4 | 3,542,707 | 3,158,003 | 3,630,669 |
| Loans and other | 5.a | 5,474,700 | 6,188,896 | 15,099,734 |
| Total of cash and cash equivalents | 9,017,407 | 9,346,899 | 18,730,403 | |
| Non-cash transactions | ||||
| Foreclosures loans and other assets transferred to non-current assets held for sale | 143,511 | 38,037 | 183,195 | |
| Shares issued in connection with acquisition of Santander Seguros S.A., Banco Comercial e de Investimento Sudameris S.A. and Santander Brasil Asset Management Distribuidora de Títulos e Valores Mobiliários S.A. | - | - | 2,471,413 | |
| Dividends and interest on capital declared but not paid | 1,175,000 | 2,166,714 | 1,451,529 | |
| Supplemental information | ||||
| Interest received | 50,042,248 | 40,437,556 | 37,399,672 | |
| Interest paid | 22,901,817 | 16,799,971 | 16,860,547 | |
| The accompanying Notes and Appendix I are an integral part of these consolidated financial statements. | ||||
F-10
|
|
|
|
BANCO SANTANDER (BRASIL) S.A.
NOTES TO THE CONSOLIDATED FINANCIAL STATEMENTS FOR THE YEARS ENDED DECEMBER 31, 2011, 2010 AND 2009 |
|
| (Amounts in thousands of Brazilian Reais - R$, unless otherwise stated) | |
1. Introduction, basis of presentation of the consolidated financial statements and other information
a) Introduction
Banco Santander (Brasil) S.A. (Banco Santander or Bank), indirectly controlled by Banco Santander, S.A., with headquarters in Spain (Banco Santander Spain or Santander Group), is the lead institution of the financial and non-financial group (Conglomerate Santander) with the Central Bank of Brazil (Bacen), established as a corporation, with main offices at Avenida Presidente Juscelino Kubitschek, 2041 e 2235 - Bloco A - Vila Olímpia - São Paulo - SP. Banco Santander operates as multiple bank and through its subsidiaries carries out its operations through three segments (note 42): (i) Commercial Bank, (ii) Global Wholesale Bank, which operate with commercial, exchange, investment, credit and financing, mortgage lending, leasing, credit cards and securities brokerage, and (iii) Asset Management, capitalization, asset management and insurance brokerage. Its operations are conducted as part of a set of institutions that operate on an integrated financial markets and capital.
The financial statements for the year ended on December 31, 2011 was approved by the Board of Directors at the meeting held on February 29, 2012.
b) Basis of presentation of the consolidated financial statements
The consolidated financial statements have been prepared in accordance with International Financial Reporting Standards (IFRS) as issued by the International Accounting Standards Board (IASB), and interpretations issued by the International Financial Reporting Interpretations Committee (IFRIC).
All accounting policies and measurement bases with a material effect on the consolidated financial statements were applied in their preparation. There were no changes in accounting policies and estimates during the year ended on December 31, 2011. The adoption of the new standards and interpretation of IFRS in 2011 did not have any impact to the comparability with the financial statements for the period ended on December 31, 2010 and 2009.
Adoption of new standards and interpretations
All standards and interpretations which came into force were adopted by the Bank in 2011. Following are the standards and interpretations applicable to the Bank:
• Revision to IAS 32 - Classification of Rights Issues: otherwise meeting the definition of equity instruments in IAS 32.11 – issued to acquire a fixed number of an entity’s own non-derivative equity instrument for a fixed amount in any currency are classified as equity instruments, provided the offer is made pro-rata to all existing owners of the same class of the entity’s own non-derivative equity instruments.
• Amendment to IAS 39 – Eligible hedged Items – This amendment provides clarification how to determinate which part can be designated as hedge accounting related to inflation and options.
• Amendments to IFRS 3 - (1) Measurement of non-controlling interests: Specifies that the option to measure non-controlling interests either at fair value or at the proportionate share of the acquiree’s net identifiable assets at the acquisition date under IFRS 3 applies only to non-controlling interests that are present ownership interests and entitle their holders to a proportionate share of the acquiree’s net assets in the event of liquidation. All other components of non-controlling interests should be measured at their acquisition date fair value, unless another measurement basis is required by IFRSs, (2) Un-replaced and voluntary replaced share based payment awards, specifies that the current requirement to measure awards of the acquirer that replace acquiree share-based payment transactions in accordance with IFRS 2 at the acquisition date (‘market-based measure’) applies also to share-based payment transactions of the acquiree that are not replaced and also specifies that the current requirement to allocate the market-based measure of replacement awards between the consideration transferred for the business combination and post-combination remuneration applies to all replacement awards regardless of whether the acquirer is obliged to replace the awards or does so voluntarily, (3) transitional requirements for contingent consideration from a business combination that occurred before the effective date clarifies that IAS 32, IAS 39 and IFRS 7 do not apply to contingent consideration that arose from business combinations whose acquisition dates preceded the application of IFRS 3.
• Amendments to IAS 27 - Requirements for transition to the upgrade of IAS 27: clarifies that the update made by IAS 21, IAS 28 and IAS 31 as a result of IAS 27 should be applied prospectively (with the exception of paragraph 35 of IAS 28 and paragraph 46 of IAS 31) in which must be applied retrospectively.
• Amendment to IAS 34 - significant events and transactions: emphasises the principle in IAS 34 that the disclosure about significant events and transactions in interim periods should update the relevant information presented in the most recent annual financial report, also clarifies how to apply this principle in respect of financial instruments and their fair values.
• Amendment to IFRIC 13 - fair value of award credit: clarifies that the ‘fair value’ of award credits should take into account: (1) the amount of discounts or incentives that would otherwise be offered to customers who have not earned award credits from an initial sale; and (2) any expected forfeitures.
• Amendment to IFRIC 14 - The Limit on a Defined Benefit Asset, Minimum Funding Requirements and their Interaction- This IFRIC has been amended to remedy an unintended consequence of IFRIC 14 where entities are in some circumstances not permitted to recognize prepayments of minimum funding contributions, as an asset. Entities shall apply this Interpretation prospectively for annual periods beginning on or after January 1, 2011.
Standards and interpretations effective subsequent to December 31, 2011
The Bank has not yet adopted the following new or revised IFRS or Interpretations, which have been issued but their effective date is subsequent to the date of these financial statements:
• IFRS 9 – Financial Instruments: Recognition and Measurement – The main changes of IFRS 9 compared to IAS 39 are: (i) All recognized financial assets that are currently in the scope of IAS 39 will be measured at either amortized cost or fair value; (ii) IFRS 9 does not retain IAS 39’s concept of embedded derivatives for hybrid contracts if the host contract is a financial asset within the scope of IFRS 9; (iii) the guidance included in IFRS 9 retains the classification criteria for financial liabilities currently contained in IAS 39. However, there are two key differences, relating to presentation and measurement, compared to IAS 39: (a) the presentation of the effects of changes in fair value attributable to a liability’s credit risk; and (b) the elimination of the cost exemption for derivative liabilities to be settled by delivery of unquoted equity instruments. This standard is effective for annual periods beginning on or after January 1, 2013.
• Amendment to IFRS 7 - clarifications of disclosures: encourages qualitative disclosures in the context of the quantitative disclosure required to help users in comparing the financial statements. Entities shall apply this Interpretation prospectively for annual periods beginning on or after 1 January 2013.
F-11
|
|
|
|
BANCO SANTANDER (BRASIL) S.A.
NOTES TO THE CONSOLIDATED FINANCIAL STATEMENTS FOR THE YEARS ENDED DECEMBER 31, 2011, 2010 AND 2009 |
|
|
(Amounts in thousands of Brazilian Reais - R$, unless otherwise stated) |
|
• The amendments to IAS 1 - clarifications of disclosures: comprehensive income (OCI) - and their classification within OCI. Because of anticipated changes in IFRS 9, IAS 19 among others, the IASB explains how to display the components that fit the requirements of this standard. The amendments are effective for reporting periods beginning on or later 1 July 2012.
• IFRS 10 - Consolidated Financial Statements replaces the consolidation guidance in IAS 27 Consolidated and Separate Financial Statements (2008) and SIC-12 Consolidation — Special Purpose Entities by introducing a single consolidation model for all entities based on control, irrespective of the nature of the investee (so whether an entity is controlled through voting rights of investors or through other contractual arrangements as is common in special purpose entities). Under IFRS 10, control is based on whether an investor has i) power over the investee; ii) exposure, or rights, to variable returns from its involvement with the investee; and iii) the ability to use its power over the investee to affect the amount of the returns.
• IFRS 11 -Joint Arrangements introduces new accounting requirements for joint arrangements, which replaces IAS 31 - Interests in Joint Ventures. According to IFRS 11, will be obligatory to use the equity method and is not allowed to choose the method of accounting for jointly controlled entity. The fundamental principle of IFRS 11 is that parts of a joint venture agreement must determine the type of joint venture in question, based on the assessment of rights and obligations and, according to the accounting for the type of joint venture. There are two types of joint ventures:
- Joint Operations: Rights and obligations on the assets and liabilities related to the agreement. The parties acknowledge their assets, liabilities and related income and expenses.
- Joint Venture: Rights to the net assets of the Agreement. The parties acknowledge their investments by the equity method.
• IFRS 12 - Disclosures of Involvement with Other Entities requires enhanced disclosures about both consolidated entities and unconsolidated entities in which an entity has involvement. The objective of IFRS 12 is to require information so that financial statement users may evaluate the basis of control, any restrictions on consolidated assets and liabilities, risk exposures arising from involvements with unconsolidated structured entities and non-controlling interest holders' involvement in the activities of consolidated entities.
• IAS 27 - Separate Financial Statements (2011) keeps the requirements relating to separate financial statements. The other portions of IAS 27(2008) are replaced by IFRS 10.
• IAS 28 - Investments in Associates and Joint Ventures (2011) amended IAS 28 Investments in Associates (2008) to conform changes based on the issuance of IFRS 10, IFRS 11 and IFRS 12.
The standards previously mentioned have an effective date for annual periods beginning on January 2013, with earlier application permitted so long as each of the other standards mentioned are also early applied. The early adoption for financial institutions in Brazil is subject to the pronouncements issued by the IASB, translated into Portuguese by a Brazilian entity accredited by the International Accounting Standards Committee Foundation (IASC Foundation). However, entities are permitted to incorporate any of the disclosure requirements in IFRS 12 into their financial statements without technically early applying of the others items of IFRS.
On 12 May 2011, the IASB also issued IFRS 13 - Fair Value Measurement, which replaces the guidance on fair value measurement in existing IFRS accounting literature with a single standard. IFRS 13 defines fair value, provides guidance on how to determine fair value and requires disclosures about fair value measurements. However, IFRS 13 does not change the requirements regarding which items should be measured or disclosed at fair value. IFRS 13 is effective for annual periods beginning on January 2013 with early application permitted.
On 16 June 2011, the IASB issued amendments to IAS 19 - Employee Benefits (2011) (the “amendments”) that change the accounting for defined benefit plans and termination benefits. The amendments require the recognition of changes in the defined benefit obligation and in plan assets when those changes occur, eliminating the corridor approach and accelerating the recognition of past service costs. Changes in the defined benefit obligation and plan assets are disaggregated into three components: service costs, net interest on the net defined benefit liabilities (assets) and remeasurements of the net defined benefit (assets). Net interest is calculated using high quality corporate Bond yield. This may be lower than the rate currently used to calculate the expected return on plan assets, resulting in a decrease in net income. The amendments are effective for annual periods beginning on 1 January 2013, with earlier application permitted. Retrospective application is required with certain exceptions.
On 16 June 2011, the IASB also issued “Presentation of Items of Other Comprehensive Income” (amendments to IAS 1). The amendments to IAS 1 are the result of a joint Project with the US Financial Accounting Standards Board and provide guidance on the presentation of items contained in the comprehensive income (OCI) and their classification within OCI. The amendments are effective for reporting periods beginning on or later 1 July 2012, with earlier application permitted.
On December 16, 2011, the IASB has postponed the date for mandatory adoption of IFRS 9 and their disclosure items referred to transient changes in IFRS 7 to January 2015.
The Bank does not expect the adoption of the above-mentioned standards and interpretations to have a material effect on the consolidated financial statements taken as a whole, except to IFRS 9, which the Bank is analyzing the impacts from the adoption of this standard.
c) Estimates made
The consolidated results and the determination of consolidated equity are influenced by the accounting policies, assumptions, estimates and measurement bases used by the management of the Bank in preparing the consolidated financial statements. The Bank makes estimates and assumptions that affect the reported amounts of assets and liabilities of future periods. All estimates and assumptions required, in conformity with IFRS, are best estimates undertaken in accordance with the applicable standard.
In the consolidated financial statements estimates were made by the management of the Bank and of the consolidated entities in order to quantify certain of the assets, liabilities, income, expenses and disclosure notes. These estimates, which were made on the basis of the best information available, relate mainly to the following:
• Fair value measurement of certain financial instruments are further discussed in note 2-d.
• Allowance for loan losses are further discussed in note 2-h.
F-12
|
|
|
|
BANCO SANTANDER (BRASIL) S.A.
NOTES TO THE CONSOLIDATED FINANCIAL STATEMENTS FOR THE YEARS ENDED DECEMBER 31, 2011, 2010 AND 2009 |
|
|
(Amounts in thousands of Brazilian Reais - R$, unless otherwise stated) |
|
• Impairment losses on certain assets other than loans (including goodwill and other tangible and intangible assets) are further discussed in note 2-m and 2-n.
• Measurement of goodwill in a business combination are further discussed in note 2-n.
• The useful life of tangible and intangible assets are further discussed in note 2-m, 2-n and 14.
• Other assets are further discussed in note 2-k and 2-o.
• Provisions, contingent assets and liabilities are further discussed in note 2-q.
• Post-employment benefits are further discussed in note 2-w.
• Recognition and evaluation of deferred taxes are further discussed in note 2-z.
These estimates are based on current expectations and estimates on projections of future events and trends, which may affect the consolidated financial statements.
The principal assumptions that may affect these estimates, in addition to those previously mentioned above, relate to the following factors:
• Changes in deposit amounts, customer basis and defaults by borrowers;
• Changes in interest rates;
• Changes in inflation rates;
• Government regulation and tax matters;
• Adverse legal or regulatory disputes or proceedings;
• Credit, market and other risks of lending and investment activities;
• Changes in market values of Brazilian securities, particularly Brazilian government securities; and
• Changes in regional, national and international business and economic conditions.
d) Capital management
Capital management considers the regulatory and economic levels. The objective is to achieve an efficient capital structure in terms of cost and compliance, meeting the requirements of the regulatory body and contributing to achieving the goals of the classification of rating agencies and investors' expectations. The capital management includes securitization, sale of assets, raising capital through issue of shares, subordinated liabilities and hybrid instruments.
From an economic standpoint, capital management seeks to optimize value creation at the Bank and at its different business segment. To this end, the economic capital, RORAC (return on risk-adjusted capital) and value creation data for each business segment are generated, analyzed and reported to the management committee on a quarterly basis. Within the framework of the internal capital adequacy assessment process (Pillar 2 of the Basel Capital Accord), the Group uses an economic capital measurement model with the objective of ensuring that there is sufficient capital available to support all the risks of its activity in different economic scenarios, with the solvency levels agreed upon by the Group.
In order to adequately manage the Bank’s capital, it is essential to estimate and analyze future needs, in anticipation of the various phases of the business cycle. Projections of regulatory and economic capital are made based in financial projections (balance sheet, income statement, etc.) and on macroeconomic scenarios estimated by the Economic Research Service. These estimates are used by the Bank as a reference to plan the management actions (issues, securitizations, etc.) required to achieve its capital targets.
2. Accounting policies and measurement bases
The accounting policies and measurement bases applied in preparing the consolidated financial statements were as follows:
a) Foreign currency transactions
The individual financial statements of each entity are presented in the currency of the primary economic environment in which the entity operates (its functional currency). For the purpose of the consolidated financial statements, the results and financial position of each entity are expressed in Brazilian Reais, the functional currency of the Bank and subsidiaries and the presentation currency for the consolidated financial statements. The assets and liabilities that are monetary items are converted by exchange rates at the end of the period, the non-monetary items are stated at historical cost in foreign exchange rates at the date of such transactions and the income statement balances is converted by the average exchange rates for the period.
The exchange differences arising on the translation of foreign currency balances to the functional currency are generally recognized at their net amount under “Exchange differences” in the consolidated income statement, except for exchange differences arising on financial instruments at fair value through profit or loss, which are recognized in the consolidated income statement without distinguishing them from other changes in fair value.
b) Basis of consolidation
i. Subsidiaries
“Subsidiaries” are defined as entities over which the Bank has the control. It is understood as defining control the power designated the Bank as controller to govern the financial and operating policies of an entity, as stipulated by the law, the Bylaws or agreement, so as to obtain benefits from its activities.
The financial statements of the subsidiaries are fully consolidated with those of the Bank. Accordingly, all balances and transactions between consolidated entities are eliminated on consolidation.
F-13
|
|
|
|
BANCO SANTANDER (BRASIL) S.A.
NOTES TO THE CONSOLIDATED FINANCIAL STATEMENTS FOR THE YEARS ENDED DECEMBER 31, 2011, 2010 AND 2009 |
|
|
(Amounts in thousands of Brazilian Reais - R$, unless otherwise stated) |
|
On acquisition of a subsidiary, its assets, liabilities and contingent liabilities are recognized at fair value at the date of acquisition. Any positive differences between the acquisition cost and the fair values of the identifiable net assets acquired are recognized as goodwill (note 13). Negative differences are charged to income on the date of acquisition.
Additionally, the share of third parties of the Bank’s equity is presented under “Non-controlling interests” in the consolidated balance sheet (note 26). Their share of the profit for the year is presented under “Profit attributable to non-controlling interests” in the consolidated income statement. Changes in the Bank’s interest in a subsidiary that do not result in a loss of control are accounted for as equity transactions. The carrying amounts of the Bank’s interests and the non-controlling interests are adjusted to reflect the changes in their relative interests in the subsidiary.
The results of subsidiaries acquired during the year are included in the consolidated income statement from the date of acquisition to year-end. Similarly, the results of subsidiaries disposed of during the year are included in the consolidated income statement from the beginning of the year to the date of disposal.
The Appendix I contains significant information on these entities.
ii. Interests in joint ventures (jointly controlled entities) and associates
“Joint ventures” are deemed to be ventures that are not subsidiaries but which are jointly controlled by two or more unrelated entities. This is evidenced by contractual arrangements whereby two or more entities (“ventures”) acquire interests in entities (jointly controlled entities) or undertake operations or hold assets so that strategic financial and operating decisions affecting the joint venture require the unanimous consent of the venturers.
Associates are entities over which the Bank is in a position to exercise significant influence, but not control or joint control, usually because it holds 20% or more of the voting power of the investee.
In the consolidated financial statements, interest in joint ventures and investments in associates are accounted for using the equity method, i.e. at the Bank’s share of net assets of the investee, after taking into account the dividends received there from and other equity eliminations. In the case of transactions with an associate, the related profits or losses are eliminated to the extent of the Bank’s investment in the associate. Relevant information regarding companies accounted for under the equity method by the Bank is provided in note 11.
iii. Special purpose entities
When the Bank incorporates special purpose entities, or holds ownership interests therein, to enable its customers to access certain investments, or for the transfer of risks or other purposes, Bank assesses, using internal criteria and procedures, and taking into consideration the applicable legislation, whether control (as defined above) exists and, therefore, whether these entities should be consolidated. These criteria and procedures take into account, among other things, the risks and rewards retained by the Bank and, accordingly, all relevant matters are taken into consideration, including any guarantees granted or any losses associated with the collection of the related assets retained by the Bank. These entities include the securitization special purpose vehicles, which are fully consolidated in the case of the SPVs over which, based on the aforementioned analysis, it is considered that the Bank continues to exercise control.
iv. Business combinations, acquisitions and disposalsA business combination is the bringing together of two or more separate entities or economic units into one single entity or group of entities and is accounted for in accordance with IFRS 3, “Business Combinations”.
Business combinations are performed whereby the Bank obtains control over an entity are recognized for accounting purposes as follows:
• The Bank measures the cost of the business combination, defined as the fair value of the assets given, the liabilities incurred and the equity instruments issued, if any.
• The fair values of the assets, liabilities and contingent liabilities of the acquired entity or business, including any intangible assets which might not have been recognized by the acquiree, are estimated and recognized in the consolidated balance sheet.
• Any positive difference between the net fair value of the assets, liabilities and contingent liabilities of the acquiree and the cost of the business combination is recognized as Goodwill based on future economic benefits.
Also, note 3 below includes a description of the most significant transaction carried out in 2011.
c) Definitions and classification of financial instruments
i. Definitions
A “financial instrument” is any contract that gives rise to a financial asset of one entity and, simultaneously, to a financial liability or equity instrument of another entity.
An “equity instrument” is any agreement that evidences a residual interest in the assets of the issuing entity after deducting all of its liabilities.
A “financial derivative” is a financial instrument whose value changes in response to the change in an observable market variable (such as an interest rate, foreign exchange rate, financial instrument price, market index or credit rating), whose initial investment is very small compared with other financial instruments with a similar response to changes in market factors, and which is generally settled at a future date.
“Hybrid financial instruments” are contracts that simultaneously include a non-derivative host contract together with a derivative, known as an embedded derivative, that is not separately transferable and has the effect that some of the cash flows of the hybrid contract vary in a way similar to a stand-alone derivative.
The following transactions are not treated for accounting purposes as financial instruments:
• Investments in subsidiaries, jointly controlled entities and associates (note 11).
• Rights and obligations under employee benefit plans (note 22).
F-14
|
|
|
|
BANCO SANTANDER (BRASIL) S.A.
NOTES TO THE CONSOLIDATED FINANCIAL STATEMENTS FOR THE YEARS ENDED DECEMBER 31, 2011, 2010 AND 2009 |
|
|
(Amounts in thousands of Brazilian Reais - R$, unless otherwise stated) |
|
ii. Classification of financial assets for measurement purposes
Financial assets are initially classified into the various categories used for management and measurement purposes, unless they have to be presented as “Non-current assets held for sale” or they relate to “Cash and balances with the Brazilian Central Bank”, “Hedging derivatives” and “Investment in associates”, which are reported separately.
Financial assets are included for measurement purposes in one of the following categories:
• Financial assets held for trading (at fair value through profit or loss): this category includes the financial assets acquired for the purpose of generating a profit in the near term from fluctuations in their prices and financial derivatives that are not designated as hedging instruments.
• Other financial assets at fair value through profit or loss: this category includes hybrid financial assets not held for trading that are measured entirely at fair value and financial assets not held for trading that are included in this category in order to obtain more relevant information, either because this eliminates or significantly reduces recognition or measurement inconsistencies (“accounting mismatches”) that would arise from measuring assets or liabilities or recognizing the gains orlossesonthem on different bases, or because a group of financial assets or financial liabilities or both is managed and its performance is evaluated on a fair value basis, in accordance with a documented risk management or investment strategy, and information about the group is provided on that basis to the Bank’s key management personnel.
Financial instruments included in this category (and “Other financial liabilities at fair value through profit or loss”) are permanently subject to a consistent system of measuring, managing and controlling risks and returns that enables all the financial instruments involved to be monitored and identified and allows the effective reduction of risk to be checked. Financial assets may only be included in this category on the date they are acquired or originated.
• Available-for-sale financial assets: this category includes debt instruments not classified as “Held-to-maturity investments”, “Loans and receivables” or “Financial assets at fair value through profit or loss”, and equity instruments issued by entities other than subsidiaries, associates and jointly controlled entities, provided that such instruments have not been classified as “Financial assets held for trading” or as “Other financial assets at fair value through profit or loss”.
Available-for-sale financial assets are stated at fair value. This category includes debt instruments not classified as “Held-to-maturity investments”, “Loans and receivables” or “Financial assets at fair value through profit or loss”, and equity instruments issued by entities other than subsidiaries, associates and jointly controlled entities, provided that such instruments have not been classified as “Financial assets held for trading” or as “Other financial assets at fair value through profit or loss”. Gains and losses arising from changes in fair value are recognized in "Equity" in the line item "Valuation Adjustment" with the exception of impairment losses, which are recognized in profit or loss. When the investment is disposed of or is determined to be impaired, the cumulative gain or loss previously accumulated in "Equity -Valuation Adjustments" is reclassified to profit or loss.
• Loans and receivables: this category includes financing granted to third parties, based on their nature, irrespective of the type of borrower and the form of financing, including finance lease transactions in which the consolidated entities act as lessors. The consolidated entities generally intend to hold the loans and credits granted by them until their final maturity and, therefore, they are presented in the consolidated balance sheet at their amortized cost (which includes the required adjustments to reflect estimated impairment losses).
• Held-to-maturity investments: this category includes debt instruments traded in an active market, with fixed maturity and with fixed or determinable payments, for which the Bank has both the intention and proven ability to hold to maturity. These investments are measured at amortized cost less any impairment, with revenue recognized on an effective yield basis.
iii. Classification of financial assets for presentation purposes
Financial assets are classified by nature into the following items in the consolidated balance sheet:
• Cash and balances with the Brazilian Central Bank: cash balances and balances receivable on demand relating to deposits with the Brazilian Central Bank.
• Loans and receivables: includes the balance of loans granted by the Bank, other than those represented by securities, as well as finance lease receivables and other debit balances of a financial nature in favor of the Bank, such as checks drawn on credit institutions, balances receivable from clearing houses and settlement agencies for transactions on the stock exchange and organized markets, bonds given in cash, capital calls, fees and commissions receivable for financial guarantees and debit balances arising from transactions not originated in banking transactions and services, such as the collection of rentals and similar items.
• Loans and amounts due from credit institutions: credit of any nature in the name of credit institutions.
• Loans and advances to customers: includes the debit balances of all the remaining credit and loans granted by the Bank, other than those represented by securities, including money market operations through central counterparties.
• Debt instruments: bonds and other securities that represent a debt for their issuer, that generate an interest return, and that are in the form of certificates or book entries.
• Equity instruments: financial instruments issued by other entities, such as shares, which have the nature of equity instruments for the issuer, unless they are investments in subsidiaries, jointly controlled entities or associates. Investment fund units are included in this item.
• Trading derivatives: includes the fair value in favor of the Bank of derivatives which do not form part of hedge accounting.
• Hedging derivatives: includes the fair value in favor of the Bank of derivatives designated as hedging instruments in hedge accounting.
• Investments in associates: includes the investments in the share capital of associates.
F-15
|
|
|
|
BANCO SANTANDER (BRASIL) S.A.
NOTES TO THE CONSOLIDATED FINANCIAL STATEMENTS FOR THE YEARS ENDED DECEMBER 31, 2011, 2010 AND 2009 |
|
|
( Amounts in thousands of Brazilian Reais - R$, unless otherwise stated) |
|
iv. Classification of financial liabilities for measurement purposes
Financial liabilities are classified for measurement purposes into one of the following categories:
• Financial liabilities held for trading (at fair value through profit or loss): this category includes the financial liabilities issued for the purpose of generating a profit in the short term from fluctuations in their prices, financial derivatives not considered to qualify for hedge accounting and financial liabilities arising from the outright sale of financial assets purchased under resale agreements or borrowed (“Short positions”).
• Other financial liabilities at fair value through profit or loss: financial liabilities are included in this category when more relevant information is obtained, either because this eliminates or significantly reduces recognition or measurement inconsistencies (“accounting mismatches”) that would arise from measuring assets or liabilities or recognizing the gains or losses on them on different bases, or because a group of financial liabilities or financial assets and liabilities is managed and its performance is evaluated on a fair value basis, in accordance with a documented risk management or investment strategy, and information about the Bank is provided on that basis to the Bank’s key management personnel.
• Financial liabilities at amortized cost: financial liabilities, irrespective of their instrumentation and maturity, not included in any of the above-mentioned categories which arise from the funding-taking activities carried on by financial institutions.
v. Classification of financial liabilities for presentation purposes
Financial liabilities are classified by nature into the following items in the consolidated balance sheet:
• Deposits from the Brazilian Central Bank: deposits of any nature received from the Brazilian Central Bank.
• Deposits from credit institutions: deposits of any nature, including Borrowings and Onlendings and money market funding received from credit institutions.
• Customer deposits: includes deposits of any nature such as demand deposits, saving deposits and time deposits including money market operation received from customer.
• Marketable debt securities: includes the amount of bonds and other debt represented by marketable securities, other than subordinated liabilities.
• Trading derivatives: includes the fair value, with a negative balance for the Bank, of derivatives which do not form part of hedge accounting.
• Short positions: includes the amount of financial liabilities arising from the outright sale of financial assets purchased under reverse repurchase agreements or borrowed.
• Subordinated liabilities: amount of financing received which, for the purposes of payment priority, ranks behind ordinary debt. This category also includes the financial instruments issued by the Bank which, although equity for legal purposes, do not meet the requirements for classification as equity.
• Other financial liabilities: includes the amount of payment obligations having the nature of financial liabilities not included in other items, and liabilities under financial guarantee contracts, unless they have been classified as doubtful.
• Hedging derivatives: includes the fair value of the Bank’s liability in respect of derivatives designated as hedging instruments in hedge accounting.
d) Measurement of financial assets and liabilities and recognition of fair value changes
In general, financial assets and liabilities are initially recognized at fair value which, in the absence of evidence to the contrary, is deemed to be the transaction price. Financial instruments not measured at fair value through profit or loss are, adjusted by the transaction costs. Financial assets and liabilities are subsequently measured at each period-end as follows:
i. Measurement of financial assets
Financial assets are measured at fair value, without deducting any transaction costs that may be incurred on their disposal, except for loans and receivables, held-to-maturity investments, equity instruments whose fair value cannot be determined in a sufficiently objective manner and financial derivatives that have those equity instruments as their underlying and are settled by delivery of those instruments.
The “fair value” of a financial instrument on a given date is taken to be the amount for which it could be bought or sold on that date by two knowledgeable, willing parties in an arm's length transaction acting prudently. The most objective and common reference for the fair value of a financial instrument is the price that would be paid for it on an active, transparent and deep market (“quoted price” or “market price”).
If there is no market price for a given financial instrument, its fair value is estimated on the basis of valuation techniques commonly used by the international financial community, taking into account the specific features of the instrument to be measured and, particularly, the various types of risk associated with it.
All derivatives are recognized in the balance sheet at fair value from the trade date. If the fair value is positive, they are recognized as an asset and if the fair value is negative, they are recognized as a liability. The changes in the fair value of derivatives from the trade date are recognized in “Gains/losses on financial assets and liabilities” in the consolidated income statement. Specifically, the fair value of standard financial derivatives included in the portfolios of financial assets or liabilities held for trading is deemed to be their daily quoted price and if, for exceptional reasons, the quoted price cannot be determined on a given date, these financial derivatives are measured using methods similar to those used to measure over the counter “OTC” derivatives.
The fair value of OTC derivatives is taken to be the sum of the future cash flows arising from the instrument, discounted to present value at the date of measurement (“present value” or “theoretical close”) using valuation techniques commonly used by the financial markets: “net present value” (NPV), option pricing models and other methods.
“Loans and receivables” and “Held-to-maturity investments” are measured at amortized cost using the effective interest method. “Amortized cost” is the acquisition cost of a financial asset or liability plus or minus, as appropriate, the principal repayments and the cumulative amortization (taken to the income statement) of the difference between the initial cost and the maturity amount. In the case of financial assets, amortized cost furthermore includes any reductions for impairment or uncollectibility. In the case of loans and receivables hedged in fair value hedges, the changes in the fair value of these assets related to the risk or risks being hedged are recognized.
F-16
|
|
|
|
BANCO SANTANDER (BRASIL) S.A.
NOTES TO THE CONSOLIDATED FINANCIAL STATEMENTS FOR THE YEARS ENDED DECEMBER 31, 2011, 2010 AND 2009 |
|
|
(Amounts in thousands of Brazilian Reais - R$, unless otherwise stated) |
|
The “effective interest rate” is the discount rate that exactly matches the initial amount of a financial instrument to all its estimated cash flows of all kinds over its remaining life. For fixed rate financial instruments, the effective interest rate coincides with the contractual interest rate established on the acquisition date plus, where applicable, the fees and transaction costs that, because of their nature, form part of their financial return. In the case of floating rate financial instruments, the effective interest rate coincides with the rate of return prevailing in all connections until the next benchmark interest reset date.
Equity instruments whose fair value cannot be determined in a sufficiently objective manner are measured at acquisition cost adjusted, where appropriate, by any related impairment loss.
The amounts at which the financial assets are recognized represent, in all material respects, the Bank’s maximum exposure to credit risk at each reporting date. Also, the Bank has received collateral and other credit enhancements to mitigate its exposure to credit risk, which consist mainly of mortgage guarantees, cash collateral, equity instruments and personal security, assets leased out under leasing and renting agreements, assets acquired under repurchase agreements, securities loans and derivatives.
ii. Measurement of financial liabilities
In general, financial liabilities are measured at amortized cost, as defined above, except for those included under “Financial liabilities held for trading” and “Other financial liabilities at fair value through profit or loss” and financial liabilities designated as hedged items (or hedging instruments) in fair value hedges, which are measured at fair value.
iii. Valuation techniques
The following table shows a summary of the fair values of the financial assets and liabilities on the period ended December 31, 2011, 2010 and 2009 indicated below, classified on the basis of the various measurement methods used by the Bank to determine their fair value:
| Thousands of Reais | 2011 | 2010 | ||||
|
Published
Price Quotations in Active Markets (Level 1) |
Internal
Models (Level 2) |
Total |
Published
Price Quotations in Active Markets (Level 1) |
Internal
Models (Level 2) |
Total | |
| Financial assets held for trading | 448,210 | 29,453,285 | 29,901,495 | 3,283,931 | 21,537,434 | 24,821,365 |
| Other financial assets at fair value through profit or loss | 374,519 | 290,850 | 665,369 | 17,423,359 | 516,422 | 17,939,781 |
| Available-for-sale financial assets | 608,901 | 43,999,300 | 44,608,201 | 1,348,989 | 45,857,030 | 47,206,019 |
| Hedging derivatives (assets) | - | 80,708 | 80,708 | - | 115,640 | 115,640 |
| Financial liabilities held for trading | 337,628 | 4,709,660 | 5,047,288 | 29,339 | 4,755,314 | 4,784,653 |
| Hedging derivatives (liabilities) | - | 36,071 | 36,071 | - | 112 | 112 |
| Thousands of Reais | 2009 | |||||
|
Published
Price Quotations in Active Markets (Level 1) |
Internal
Models (Level 2) |
Total | ||||
| Financial assets held for trading | 2,544,441 | 17,571,211 | 20,115,652 | |||
| Other financial assets at fair value through profit or loss | 13,787,109 | 2,507,351 | 16,294,460 | |||
| Available-for-sale financial assets | 1,633,945 | 44,772,175 | 46,406,120 | |||
| Hedging derivatives (assets) | - | 163,425 | 163,425 | |||
| Financial liabilities held for trading | 33,025 | 4,401,709 | 4,434,734 | |||
| Other financial liabilities at fair value through profit or loss | - | 1,795 | 1,795 | |||
| Hedging derivatives (liabilities) | - | 9,806 | 9,806 | |||
Financial instruments at fair value, determined on the basis of public price quotations in active markets (Level 1), include government debt securities, private-sector debt securities, securitized assets, shares, short positions and fixed-income securities issued.
In cases where price quotations cannot be observed, management makes its best estimate of the price that the market would set using its own internal models. In most cases, these models use data based on observable market parameters as significant inputs (Level 2). In order to make these estimates, various techniques are employed, including the extrapolation of observable market data and extrapolation techniques. The best evidence of the fair value of a financial instrument on initial recognition is the transaction price, unless the fair value of the instrument can be obtained from other market transactions performed with the same or similar instruments or can be measured by using a valuation technique in which the variables used include only observable market data, mainly interest rates.
There were no reclassifications between the Level 1 and Level 2 in the exercise ended on December 31, 2011, 2010 and 2009.
The Level 3 records financial assets and liabilities which are not used observable market data to make the measurement. On December 31, 2011, 2010 and 2009 the Bank did not have any financial instrument classified as Level 3.
F-17
|
|
|
|
BANCO SANTANDER (BRASIL) S.A.
NOTES TO THE CONSOLIDATED FINANCIAL STATEMENTS FOR THE YEARS ENDED DECEMBER 31, 2011, 2010 AND 2009 |
|
|
(Amounts in thousands of Brazilian Reais - R$, unless otherwise stated) |
|
The main techniques used at December 31, 2011 by the Bank’s internal models (Level 2) to determine the fair value of the financial instruments detailed in the foregoing table are as follows:
• In the valuation of financial instruments permitting static hedging (basically forwards and swaps) and in the valuation of loans and advances to customers, the “present value” method is used. Estimated future cash flows are discounted using the interest rate curves of the related currencies. The interest rate curves are generally observable market data.
• In the valuation of financial instruments requiring dynamic hedging (basically structured options and other structured instruments), the Black-Scholes model is normally used. Where appropriate, observable market inputs are used to obtain factors such as the bid-offer spread, exchange rates, volatility, correlation between indexes and market liquidity.
• In the valuation of certain financial instruments exposed to interest rate risk, such as interest rate futures, caps and floors, the present value method (futures) and the Black-Scholes model (plain vanilla options) are used. The main inputs used in these models are basically observable market data, including the related interest rate curves, volatilities, correlations and exchange rates.
• In the case of linear instruments (e.g. credit risk and fixed-income derivatives), credit risk is measured using dynamic models similar to those used in the measurement of interest rate risk. In the case of non-linear instruments, if the portfolio is exposed to credit risk (e.g. credit derivatives), the joint probability of default is determined using the Standard Gaussian Copula model. The main inputs used to determine the underlying cost of credit of credit derivatives are quoted credit risk premiums and the correlation between the quoted credit derivatives of various issuers.
The fair value of the financial instruments arising from the aforementioned internal models takes into account, inter alia, the contract terms and observable market data, which include interest rates, credit risk, exchange rates, the quoted market price of raw materials and shares, volatility and prepayments. The valuation models are not significantly subjective, since these methodologies can be adjusted and gauged, as appropriate, through the internal calculation of fair value and the subsequent comparison with the related actively traded price.
| Thousands of Reais | |||||
| Fair Values Calculated Using Internal | |||||
| Models | |||||
| 2011 | 2010 | 2009 |
Valuation
Techniques |
Main Assumptions | |
| ASSETS: | |||||
| Financial assets held for trading | 29,453,285 | 21,537,434 | 17,571,211 | ||
| Loans and amounts due from credit institutions | - | 47,662 | 67,170 | Present Value Method | Observable market data (interest and discount rates) |
| Debt and equity instruments | 25,298,803 | 16,472,413 | 12,554,035 | Present Value Method | Observable market data (interest and discount rates) |
| Trading derivatives | 4,154,482 | 5,017,359 | 4,950,006 | ||
| Hedging derivatives | 80,708 | 115,640 | 163,425 | ||
| Swaps | 80,708 | 115,640 | 163,425 | Present Value Method | Observable market data (interest rates) |
| Other financial assets at fair value through profit or loss | 290,850 | 516,422 | 2,507,351 | ||
| Loans and amounts due from credit institutions | 60,813 | 292,034 | 1,907,265 | Present Value Method | Observable market data (interest and discount rates) |
| Loans and advances to customers | - | - | 389,113 | Present Value Method | Observable market data (interest and discount rates) |
| Debt instruments | 230,037 | 224,388 | 210,973 | Present Value Method | Observable market data (interest and discount rates) |
| Available-for-sale financial assets | 43,999,300 | 45,857,030 | 44,772,175 | ||
| Debt and equity instruments | 43,999,300 | 45,857,030 | 44,772,175 | Present Value Method | Observable market data (interest and discount rates) |
| LIABILITIES: | |||||
| Financial liabilities held for trading | 4,709,660 | 4,755,314 | 4,401,709 | ||
| Trading derivatives | 4,709,660 | 4,755,314 | 4,401,709 | ||
| Hedging derivatives | 36,071 | 112 | 9,806 | ||
| Swaps | 36,071 | 112 | 9,806 | Present Value Method | Observable market data (interest and exchange rates) |
| Other financial liabilities at fair value through profit or loss | - | - | 1,795 | Present Value Method | Observable market data (interest and exchange rates) |
F-18
|
|
|
|
BANCO SANTANDER (BRASIL) S.A.
NOTES TO THE CONSOLIDATED FINANCIAL STATEMENTS FOR THE YEARS ENDED DECEMBER 31, 2011, 2010 AND 2009 |
|
|
(Amounts in thousands of Brazilian Reais - R$, unless otherwise stated) |
|
| Thousands of Reais | 2011 | ||||
|
Effect of reasonable changes
of assumptions on fair values |
|||||
| (1) | |||||
|
More
favorable |
Less
favorable |
||||
| Trading derivatives (net) |
2011 |
Valuation Techniques | Main Assumptions | ||
| Swaps |
(285,167) |
Present Value Method | Observable market data, liquidity (interest and exchange rates) | 53,554 | (53,554) |
| Exchange rate options |
167,556 |
Black-Scholes Model | Observable market data, liquidity (exchange rates) | 507 | (507) |
| Interest rate options |
(347,913) |
Black-Scholes Model | Observable market data, liquidity, correlation (interest rates) | 212 | (212) |
| Exchange rate futures |
108,987 |
Present Value Method | Observable market data, liquidity (exchange rates) | - | - |
| Stock options |
(198,641) |
Black-Scholes Model | Observable market data, liquidity, correlation (shares and ratios) | 5,334 | (5,334) |
(1) The methodology applied is related to the assumptions of changes in fair value in case of necessity to discard a position, which is directly related to the liquidity of each market. In this context, instruments / markets with high liquidity are exempted from such estimates, for the other instruments such estimates are based on internal methodologies that generate multiplier, taking into consideration one or more of the following, as applicable: (i) observed spread between the Bid / Offer (ii) liquidity factor (trading) in different risk factors; (iii) term of the position; (iv) size of the position; and (v) in the case of options, the price in relation to changes in the parameters of volatility (vega). For linear products, the Effect of reasonable changes of assumptions on fair values symmetrically (more favorable and less favorable) refers to the variability of price in relation to changes in interest rate used in their pricing and in the case of options, the variability of its price in relation to changes in the parameters of volatility (vega).
The use of observable market data assumes that the markets in which the Bank operates are functioning efficiently and, therefore, that these data are representative. The main assumptions used in the measurement of the financial instruments included in the foregoing table that were valued by means of internal models employing unobservable market data are as follows:
• Correlation: the assumptions relating to the correlation between the value of quoted and unquoted assets are based on historical correlations between the impact of adverse changes in market variables and the corresponding valuation of the associated unquoted assets. The measurement of the assets will vary depending on whether a more or less conservative scenario is selected.
• Dividends: the estimates of the dividends used as inputs in the internal models are based on the expected dividend payments of the issuers. Since the dividend expectations can change or vary depending on the source of the price (normally historical data or market consensus for the measurement of options) and the companies’ dividend policies can vary, the valuation is adjusted to the best estimate of the reasonable dividend level expected in more or less conservative scenarios.
• Liquidity: the assumptions include estimates in response to market liquidity. For example, they take market liquidity into consideration when very long-term estimates of exchange rates or interest rates are used, or when the instrument is part of a new or developing market where, due to the absence of market prices that reflect a reasonable price for these products, the standard valuation methods and the estimates available might give rise to less precise results in the measurement of these instruments at that time.
iv. Recognition of fair value changes
As a general rule, changes in the carrying amount of financial assets and liabilities are recognized in the consolidated income statement, distinguishing between those arising from the accrual of interest and similar items -which are recognized under “Interest and similar income” or “Interest expense and similar charges”, as appropriate-and those arising for other reasons, which are recognized at their net amount under “Gains (losses) on financial assets and liabilities (net)”.
Adjustments due to changes in fair value arising from Available-for-sale financial assets are recognized temporarily in stockholders equity under “Valuation adjustments”. Items charged or credited to this account remain in the Bank’s consolidated stockholders equity until the related assets are derecognized, whereupon they are charged to the consolidated income statement.
v. Hedging transactions
The consolidated entities use financial derivatives for the following purposes: i) to facilitate these instruments to customers who request them in the management of their market and credit risks; ii) to use these derivatives in the management of the risks of the Bank entities' own positions and assets and liabilities (“hedging derivatives”); and iii) to obtain gains from changes in the prices of these derivatives (“financial derivatives”).
Financial derivatives that do not qualify for hedge accounting are treated for accounting purposes as trading derivatives.
A derivative qualifies for hedge accounting if all the following conditions are met:
| 1. |
The derivative hedges one of the following three types of exposure: |
|
|
|
| a. |
Changes in the fair value of assets and liabilities due to fluctuations, among others, in the interest rate and/or exchange rate to which the position or balance to be hedged is subject (“fair value hedge”); |
|
|
|
| b. |
Changes in the estimated cash flows arising from financial assets and liabilities, commitments and highly probable forecast transactions (“cash flow hedge”); |
|
|
|
| c. |
The net investment in a foreign operation (“hedge of a net investment in a foreign operation”). |
|
|
|
| 2. |
It is effective in offsetting exposure inherent in the hedged item or position throughout the expected term of the hedge, which means that: |
|
|
|
| a. |
At the date of arrangement the hedge is expected, under normal conditions, to be highly effective (“prospective effectiveness”). |
|
|
|
| b. |
There is sufficient evidence that the hedge was actually effective during the whole life of the hedged item or position (“retrospective effectiveness”). |
F-19
|
|
|
|
BANCO SANTANDER (BRASIL) S.A.
NOTES TO THE CONSOLIDATED FINANCIAL STATEMENTS FOR THE YEARS ENDED DECEMBER 31, 2011, 2010 AND 2009 |
|
|
(Amounts in thousands of Brazilian Reais - R$, unless otherwise stated) |
|
3. There must be adequate documentation evidencing the specific designation of the financial derivative to hedge certain balances or transactions and how this effective hedge was expected to be achieved and measured, provided that this is consistent with the Bank’s management of own risks.
The changes in value of financial instruments qualifying for hedge accounting are recognized as follows:
a. In fair value hedges, the gains or losses arising on both the hedging instruments and the hedged items (attributable to the type of risk being hedged) are recognized directly in the consolidated income statement.
b. In cash flow hedges, the effective portion of the change in value of the hedging instrument is recognized temporarily in stockholders equity under “Valuation adjustments - Cash flow hedges” until the forecast transactions occur, when it is recognized in the consolidated income statement, unless, if the forecast transactions result in the recognition of non-financial assets or liabilities, it is included in the cost of the non-financial asset or liability. The ineffective portion of the change in value of hedging derivatives is recognized directly in the consolidated income statement.
c. The ineffective portion of the gains and losses on the hedging instruments of cash flow hedges and hedges of a net investment in a foreign operation are recognized directly under “Gains (losses) on financial assets and liabilities (net)” in the consolidated income statement.
If a derivative designated as a hedge no longer meets the requirements described above due to expiration, ineffectiveness or for any other reason, the derivative is classified as a trading derivative.
When fair value hedge accounting is discontinued, the adjustments previously recognized on the hedged item are transferred to profit or loss at the effective interest rate re-calculated at the date of hedge discontinuation. The adjustments must be fully amortized at maturity.
When cash flow hedges are discontinued, any cumulative gain or loss on the hedging instrument recognized in stockholders equity under “Valuation adjustments” (from the period when the hedge was effective) remains recognized in stockholders equity until the forecast transaction occurs at which time it is recognized in profit or loss, unless the transaction is no longer expected to occur, in which case any cumulative gain or loss is recognized immediately in profit or loss.
e) Derecognition of financial assets and liabilities
The accounting treatment of transfers of financial assets depends on the extent to which the risks and rewards associated with the transferred assets are transferred to third parties:
1. If the Bank transfers substantially all the risks and rewards to third parties -unconditional sale of financial assets, sale of financial assets under an agreement to repurchase them at their fair value at the date of repurchase, sale of financial assets with a purchased call option or written put option that is deeply out of the money, securitization of assets in which the transferor does not retain a subordinated debt or grant any credit enhancement to the new holders, and other similar cases-, the transferred financial asset is written off and any rights or obligations retained or created in the transfer are recognized simultaneously.
2. If the Bank retains substantially all the risks and rewards associated with the transferred financial asset -sale of financial assets under an agreement to repurchase them at a fixed price or at the sale price plus interest, a securities lending agreement in which the borrower undertakes to return the same or similar assets, and other similar cases-, the transferred financial asset is not written off and continues to be measured by the same criteria as those used before the transfer. However, the following items are recognized:
a. An associated financial liability, for an amount equal to the consideration received; this liability is subsequently measured at amortized cost.b. The income from the transferred financial asset not written off and any expense incurred on the new financial liability.
3. If the Bank neither transfers nor retains substantially all the risks and rewards associated with the transferred financial asset -sale of financial assets with a purchased call option or written put option that is not deeply in or out of the money, securitization of assets in which the transferor retains a subordinated debt or other type of credit enhancement for a portion of the transferred asset, and other similar cases-, the following distinction is made:
a. If the transferor does not retain control of the transferred financial asset, the asset is written off and any rights or obligations retained or created in the transfer are recognized.
b. If the transferor retains control, it continues to recognize the transferred financial asset for an amount equal to its exposure to changes in value and recognizes a financial liability associated with the transferred financial asset. The net carrying amount of the transferred asset and the associated liability is the amortized cost of the rights and obligations retained, if the transferred asset is measured at amortized cost, or the fair value of the rights and obligations retained, if the transferred asset is measured at fair value.
Accordingly, financial assets are only written off when the rights on the cash flows they generate have been extinguished or when substantially all the inherent risks and rewards have been transferred to third parties. Similarly, financial liabilities are only written off when the obligations they generate have been extinguished or when they are acquired, with the intention either to cancel them or to resell them.
f) Offsetting of financial instruments
Financial asset and liability balances are offset, i.e. reported in the consolidated balance sheet at their net amount, only if the Bank and their subsidiaries currently have a legally enforceable right to set off the recognized amounts and intend either to settle on a net basis, or to realize the asset and settle the liability simultaneously.
g) Regular way purchases of financial assets
Regular way purchases of financial assets are recognized on trade date. The assets are derecognized when the rights to receive cash flows have expired or the Bank has transferred substantially all the risks and rewards of ownership.
F-20
|
|
|
|
BANCO SANTANDER (BRASIL) S.A.
NOTES TO THE CONSOLIDATED FINANCIAL STATEMENTS FOR THE YEARS ENDED DECEMBER 31, 2011, 2010 AND 2009 |
|
|
(Amounts in thousands of Brazilian Reais - R$, unless otherwise stated) |
|
h) Impairment of financial assets
i. Definition
A financial asset is considered to be impaired and therefore its carrying amount is adjusted to reflect the effect of impairment when there is objective evidence that events have occurred which:• Give rise to an adverse impact on the future cash flows that were estimated at the transaction date, in the case of debt instruments (loans and debt securities).
• Mean that their carrying amount cannot be fully recovered, in the case of equity instruments.
As a general rule, when the events above are observed, the carrying amount of impaired financial instruments is adjusted by recording a provision for losses on debts expense as "Losses on financial assets (net)" in the consolidated income statement. The reversal of previously recorded losses is recognized in the consolidated income statement in the period in which the impairment and decrease can be related objectively to an event of recovery.
Balances are deemed to be impaired, and the interest accrual is suspended, normally, after 60 days late, when there are reasonable doubts as to their full recovery and/or the collection of the related interest for the amounts and on the dates initially agreed upon, after taking into account the guarantees received by the consolidated entities to secure (fully or partially) collection of the related balances. The amount of the financial assets that would be deemed to be impaired had the conditions thereof not been renegotiated is not material with respect to the Bank’s financial statements taken as a whole.
When the recovery of any recognized amount is considered unlikely, the amount is fully written off. Usually this occurs when the write off have low delay exceeds 360 days. In the case of long-term operations (over 3 years), loans are written off when they complete 540 days late. The loss is recorded in memorandum accounts for a minimum period of 5 years and until they are exhausted all the procedures and collection actions and their contractual rights are extinguished.
ii. Debt instruments carried at amortized cost
The amount of an impairment loss incurred for determination of the recoverable amount on a debt instrument measured at amortized cost is equal to the difference between its carrying amount and the present value of its estimated future cash flows, and is presented as a reduction of the balance of the asset adjusted.
In estimating the future cash flows of debt instruments the following factors are taken into account:
• All the amounts that are expected to be obtained over the remaining life of the instrument, in this case, the provided guarantees. The impairment loss takes into account the likelihood of collecting accrued interest receivable.
• The various types of risk to which each instrument is subject; and
• The circumstances in which collections will foreseeably be made.
These cash flows are subsequently discounted using the instrument's effective interest rate.
Specifically in regards to recoverable amount losses resulting from materialization of the insolvency risk of the obligors (credit risk), a debt instrument is impaired due to insolvency when there is evidence of a deterioration of the obligor's ability to pay, either because it is in arrears or for other reasons.
The Bank has certain policies, methods and procedures for covering its credit risk arising both from insolvency allocable to counterparties.
These policies, methods and procedures are applied in the granting, examination and documentation of debt instruments, and contingent liabilities and commitments, the identification of their recoverable amount and the calculation of the amounts necessary to cover the related credit risk.
The procedures applied in the identification, measurement, control and reduce the exposure to credit risk, are based on an individual basis or grouped by similarity.
• Customers with individual management: Wholesale segment customers, financial institutions and certain companies. Risk management is performed through an analysis complemented by tools to support decision-making model-based risk assessment internal procedure.
• Customers with standardized management: individuals and companies not classified as individual clients. Risk management models based on automated decision-making and risk assessment procedure, complemented, when the model is not comprehensive or accurate enough, by teams of analysts specializing in this type of risk. the credits related to customers standardized, are usually considered when they have not recoverable delay greater than 90 days.
With respect to the allowance for loss arising from credit risk, the Bank makes the following distinction:
a. Specific allowance:
The Bank classifies our credit transactions according to their level of risk and the number of days such transaction is past due. Such credit classifications are determined in accordance with:
• The conditions of the debtor and any guarantor, such as their economic and financial situation, level of indebtedness, capacity for generating profits, cash flow, administration, corporate governance and quality of internal controls, payments history, the sector in which they are active, contingencies and credit limits; and
• The characteristics of the transaction, such as its nature and purpose, type, sufficiency and level of liquidity of collateral and the total amount of the credit.
Based on the rules above are calculated the minimum allowance requirements. Additionally, the Bank evaluate the need for further provision, as considered necessary, following the requirements of IAS 39, based on our historical experience of impairment and other circumstances known at the time of assessment.
F-21
|
|
|
|
BANCO SANTANDER (BRASIL) S.A.
NOTES TO THE CONSOLIDATED FINANCIAL STATEMENTS FOR THE YEARS ENDED DECEMBER 31, 2011, 2010 AND 2009 |
|
|
(Amounts in thousands of Brazilian Reais - R$, unless otherwise stated) |
|
b. Allowance for incurred losses not specifically identified:
The Bank covers its losses inherent in debt instruments not measured at fair value through profit or loss and in contingent liabilities taking into account the historical experience of impairment and other circumstances known at the time of assessment. For these purposes, inherent losses are losses incurred at the reporting date, calculated using statistical methods that have not yet been allocated to specific transactions.
The Bank uses the concept of incurred loss to quantify the cost of the credit risk and include it in the calculation of the risk-adjusted return of its transactions.
The incurred loss is the expected cost of the credit risk of a transaction, that will manifest itself within a one year (business cycle) lead time from the balance sheet date considering the characteristics of the counterparty and the guarantees and collateral associated with the transaction.
The loss is calculated by using statistical models that consider the following three factors:
• Exposure at default (EAD) is the amount of risk Exposure at the date of default by the counterparty. In accordance with IFRS, the exposure at default used for this calculation is the current exposure, as reported in the balance sheet.
• Probability of default (PD) is the probability of the counterparty failing to meet its principal and/or interest payment obligations. The probability of default is associated with the rating/scoring of each counterparty/transaction. PD is measured using a time horizon of one year; i.e. it quantifies the probability of the counterparty defaulting in the coming year. The definition of default used includes past-dues by 90 days or more and cases in which there is no default but there are doubts as to the solvency of the counterparty (subjective doubtful assets).
• Loss given default (LGD) is the loss arising in the event of default. LGD calculation is based on the observation of the recoveries of defaulted loans, taking into account the guarantees/collateral associated with the transaction, the income and expenses associated with the recovery process, and also the timing thereof and the indirect costs arising from the recovery process.
The methodology used by the Bank for determining the loans allowance for incurred losses not specifically identified intends to identify the amount of incurred losses as of the balance sheet date of loans that have not yet been identified as impaired, but it is estimate based on our past history and specific facts that will manifest within a one year lead time period from the balance sheet date. The above demonstrates those loans were having problems as of the balance sheet date. That is, what the Bank calls inherent losses in the context of our internal models in which loan loss allowances are calculated.
The approach described above is used as a general rule. However, in certain cases, as a result of its particular characteristics, this approach is not applied and alternative approaches are used:
• Low default portfolios: In certain portfolios (credit institutions or large corporations) the number of defaults observed is very small or zero. In these cases, the Bank opted to use the data contained in the credit derivative spreads to estimate the incurred loss discounted by the market and break it down into PD and LGD.
• Top-down units: In the exceptional cases in which the Bank does not have sufficient data to construct asufficiently robust credit risk measurement model, the incurred loss on the loan portfolios is estimated based on a top-down approximation in which the historically observed average cost of the loan portfolios is used as the best estimate of the incurred loss. As the credit models are developed and bottom-up measurements are obtained, the top-down measurements used for these units are gradually replaced.
iii. Debt or equity instruments classified as available for sale
The difference between the amortized cost and adjustment value of debt or equity instruments classified as available for sale are recorded in stockholders equity under "Valuation adjustments - financial assets available for sale".
When there is objective evidence that the aforementioned differences are considerate a loss to permanent, they are no longer recognized in stockholders equity and are reclassified, for the cumulative amount at that date, to the consolidated income statement. Losses considered like a permanent on investment in equity instruments are not reversed in subsequent periods.
iv. Equity instruments measured at cost
The recoverable amount loss on equity instruments measured at cost is the difference between the carrying amount and the present value of the expected future cash flows discounted at the market rate of return for similar securities.
Losses of recoverable amounts are recognized in the consolidated financial income statement for the period in which they arise as a direct reduction of the cost of the instrument. These losses can only be reversed subsequently if related assets are sold.
i) Repurchase agreements
Purchases (disposal) of financial assets under a non-optional resale (repurchase) agreement at a fixed price are recognized in the consolidated balance sheet as Investment (funding), in repurchase agreements based on the nature of the debtor (creditor), under “Cash and balances with the Brazilian Central Bank”, “Loans and amounts due from credit institutions” or “Loans and advances to customers” (“Deposits from the Brazilian Central Bank”, “Deposits from credit institutions” or “Customer deposits”).
Differences between the purchase and sale prices are recognized as interest over the contract term.
j) Accounting for leases
i. Financial leases
Financial leases are leases that transfer substantially all the risks and rewards incidental to ownership of the leased asset to the lessee.
When the consolidated entities act as the lessors of an asset, the sum of thepresent valueof the lease payments receivable from the lessee plus the guaranteed residual value which is generally the exercise price of the purchase option of the lessee at the end of the lease term is recognized as lending to third parties and is therefore included under “Loans and receivables” in the consolidated balance sheet.
F-22
|
|
|
|
BANCO SANTANDER (BRASIL) S.A.
NOTES TO THE CONSOLIDATED FINANCIAL STATEMENTS FOR THE YEARS ENDED DECEMBER 31, 2011, 2010 AND 2009 |
|
|
(Amounts in thousands of Brazilian Reais - R$, unless otherwise stated) |
|
The finance income arising from these contracts is credited to “Interest and similar income” in the consolidated income statement so as to achieve a constant rate of return over the lease term.
ii. Operational Leases
In operational leases, ownership of the leased asset and substantially all the risks and rewards incidental thereto remain with the lessor.
When the consolidated entities act as the lessors, they present the acquisition cost of the leased assets under “Tangible assets” (note 12). The depreciation policy for these assets is consistent with that for similar items of property, plant and equipment for own use and income from operational leases is recognized on a straight-line basis under “Other operating income (expense)” in the consolidated income statement.
When the consolidated entities act as the lessees, the lease expenses, including any incentives granted by the lessor, are charged on a straight-line basis to “Other administrative expenses” in their consolidated income statements.
k) Non-current assets held for sale
“Non-current assets held for sale” includes the carrying amount of individual items or disposal groups or items forming part of a business unit earmarked for disposal (“Discontinued operations”), whose sale in their present condition is highly probable and is expected to occur within one year, the property or other non-current assets received by the consolidated entities as total or partial settlement of their debtors' payment obligations to them are deemed to be non-current assets held for sale through the completion of actions which normally occurs up to one year.
Non-current assets held for sale are measured at the lower of fair value less costs to sell and their carrying amount at the date of classification in this category. Non-current assets held for sale are not depreciated.
Impairment losses on an asset or disposal group arising from a reduction in its carrying amount to its fair value (less costs to sell) are recognized under “Gains (losses) on non-current assets held for sale not classified as discontinued operations” in the consolidated income statement. The gains on a non-current asset held for sale resulting from subsequent increases in fair value (less costs to sell) increase its carrying amount and are recognized in the consolidated income statement up to an amount equal to the impairment losses previously recognized.
l) Residual maturity periods and average interest rates
The analysis of the maturities of the balances of certain items in the consolidated balance sheets and the average interest rates at 2011, 2010 and 2009 year-end is provided in note 41-d.
m) Tangible assets
“Tangible assets” includes the amount of buildings, land, furniture, vehicles, computer hardware and other fixtures owned by the Bank, including tangible assets received by the Bank in full or partial satisfaction of financial assets representing receivables from third parties which are intended to be held for continuing use and tangible assets acquired under finance leases are presented at acquisition cost, less the related accumulated depreciation and any impairment losses (net carrying amount higher than recoverable amount).
Depreciation is calculated, using the straight-line method, on the basis of the acquisition cost of the assets less their residual value. The land on which the buildings and other structures stand has an indefinite life and, therefore, is not depreciated.
The tangible asset depreciation charge is recognized in the consolidated income statement and is calculated basically using the following depreciation rates (based on the average years of estimated useful life of the various assets):
|
Annual
Rate |
|
| Buildings for own use | 4% |
| Furniture | 10% |
| Fixtures | 10% |
| Office and IT equipment | 20% |
| Leasehold improvements | 10% or up to contractual maturity |
The Bank assesses at end of each period, if there is no indication that the items of tangible assets may present an impairment loss, ie an asset that presents the carrying amount higher than the value of achievement, either for use or sale. The assessment of property is done through reports prepared by independent companies.
Once identified a reduction in the impairment loss of tangible assets, this is adjusted to reach its realizable value by recognizing an impairment loss recorded in "Impairment loss on other assets. " Additionally the value of depreciation of that asset is recalculated in order to adjust the value of the life of the asset.
In case of evidence or indication of an impairment loss of a tangible asset, the Bank recognizes the reversal of impairment loss recorded in prior years and should adjust the future depreciation expenses according to the lifetime value of the property. Under no circumstances will a reversal of impairment loss of an asset may increase its carrying amount higher than the amount that would have no impairment loss had been recognized in prior years.
Upkeep and maintenance expenses relating to property, plant and equipment for own use are recognized as an expense in the period in which they are incurred.
n) Intangible assets
Intangible assets are identifiable non-monetary assets (separable from other assets) without physical substance which arise as a result of a legal transaction or software are developed internally. Only assets whose cost can be estimated reliably and from which the consolidated entities consider it probable that future economic benefits will be generated are recognized.
F-23
|
|
|
|
BANCO SANTANDER (BRASIL) S.A.
NOTES TO THE CONSOLIDATED FINANCIAL STATEMENTS FOR THE YEARS ENDED DECEMBER 31, 2011, 2010 AND 2009 |
|
|
(Amounts in thousands of Brazilian Reais - R$, unless otherwise stated) |
|
Intangible assets are recognized initially at acquisition or production cost and are subsequently measured deducted any accumulated amortization and any accumulated impairment losses.
i. Goodwill
In the acquisition of investment in subsidiary, any difference between the investment cost and the investor's share in net fair value of assets, liabilities and contingent liabilities of the investee (subsidiary or affiliate) is accounted for in accordance with IFRS 3 "Business Combination ".
Goodwill is recognized only when the amount of the consideration of the investee acquired exceeds the fair value at the acquisition date, and therefore represents a payment made by the acquirer in anticipation of future economic benefits of assets of the acquired entity that can not be individually identified and recognized separately.
The amortization of this goodwill is not allowed, and also tested for the purpose of "impairment". The goodwill impairment test is performed at the end of each period presented, or a lesser period if any indication of a reduction in the recoverable amount and the amount considered irrecoverable is written off and debited as "Impairment losses on other assets (net) - Other intangible assets "in the consolidated income statement. A loss of recoverable value of goodwill is not reversed in subsequent periods;
The net fair value adjustments of assets, liabilities and contingent liabilities of the investee in relation to its carrying amount are allocated to individual identifiable assets acquired and liabilities assumed that compose based on their respective fair values at the date of purchase.
In the case of a business combination achieved in stages, is measured again prior involvement in the acquiree at fair value at date of acquisition that obtains control of the acquiree.
A business combination involving entities or businesses under common control is a business combination in which all the combining entities or businesses are controlled by the same party or parties before and after the business combination, and this control is not transitory and therefore are trademarks of their carrying amount.
ii. Other intangible assets
It is a non-monetary asset without physical substance. It is basically due to software development and acquisition of rights (such as customer list acquired) that can generate benefits for the Bank. They can have characteristics of definite or indefinite period.
Other intangible assets are considered to have indefinite useful life when, based on an analysis of all relevant factors, it is concluded that there is no foreseeable limit to the period over which the asset is expected to generate cash inflows for the Bank, or a finite useful life, in all other cases.
Intangible assets with indefinite useful lives are not amortized, but instead, at the end of each period, the entity reviews the remaining useful life of assets to determine if they are still undefined and, if this is not the case, the change should be accounted for as a change in accounting estimate.
Intangible assets with definite useful life are amortized over its useful life by using methods similar to those used to depreciate tangible assets. The amortization expense is recognized under "Depreciation and amortization" in the consolidated income statement.
The Bank assesses at the end of each period, if there is no indication that the items of intangible assets may present an impairment loss, i.e. an asset that presents the carrying amount higher than the net realizable value. Identifying any reduction in impairment loss, this is adjusted to reach its fair value.
Measuring the recoverable amount of other intangible assets - software is made based on value in use, as well as the analysis of the discontinuity of the asset in relation to the activities of the Bank.
The Bank uses the value in use of other intangible assets - customer lists as a basis for measuring the impairment since it is not reasonably possible to determine the net value of sales, because there is no basis for making a reliable estimate of the value be obtained by selling the asset in a transaction at cumulative basis, between knowledgeable, willing parties. The value in use of customer lists acquired related to the purchase of the "payroll" will be determined individually. It is prepared by the business areas a "Business Case" that aims to demonstrate the expectation of generating future economic benefit and the present value of expected cash flows. Quarterly, these "Business Case" are reviewed based on the actual cash flows of each business (value in use), which are compared with book value, checking whether there is a need to record a loss on non-recoverability.
o) Other assets
It includes the balance of all prepayments and accrued income (excluding accrued interest), the net amount of the difference between pension plan obligations and the value of the plan assets with a balance in the entity’s favor, when this net amount is to be reported in the consolidated balance sheet, and the amount of any other assets not included in other items.
p) Liabilities for insurance contracts
The liabilities for insurance contracts are comprised substantially by mathematical reserves for current and future benefits (PMBaC and PMBC). Insurance contracts are contracts under which the Bank accepts a significant risk – other than a financial risk – from a policyholder by agreeing to compensate the beneficiary on the occurrence of an uncertain future event by which the policyholder will be adversely affected.
Insurance liabilities are recognized when the contract is entered into and the premiums are charged. Contracts that have been classified as insurance are not reclassified subsequently. The liability is derecognized when the contract expires or is cancelled.
Mathematical reserves for current and future benefits are recognized based on contributions made under the capitalization financial system. The mathematical reserves for current benefits represent commitments under continued income plans which are recognized through actuarial calculation for the traditional, pension plan (PGBL) and cash value life insurance (VGBL) plans.
F-24
|
|
|
|
BANCO SANTANDER (BRASIL) S.A.
NOTES TO THE CONSOLIDATED FINANCIAL STATEMENTS FOR THE YEARS ENDED DECEMBER 31, 2011, 2010 AND 2009 |
|
|
(Amounts in thousands of Brazilian Reais - R$, unless otherwise stated) |
|
All valuation methods used by the subsidiaries are based on the general principle that the carrying amount of the net liability must be sufficient to meet any reasonably foreseeable obligation resulting from the insurance contracts. Investment assumptions are either determined by the local regulator or based on management's future expectations. In the latter case, the anticipated future investment returns are set by management, considering the available market information and economic indicators. A significant assumption related to estimated gross profits on variable annuities, is the annual long-term growth rate of the underlying assets.
At each balance sheet date an assessment is made of whether the provisions for Mathematical reserves are adequate.
q) Provision of contingent assets and liabilities
Banco Santander and its subsare involved in judicial and administrative proceedings related to tax, labor and civil, in the normal course of their activities.
The judicial and administrative proceedings are recognized in the accounts based on the nature, complexity and history of actions and beliefs of the internal and external legal advisors.
Provisions are made when the risk of loss of judicial or administrative action is assessed as probable and the amounts involved can be measured with sufficient accuracy, based on best available information. The provisions include legal obligations, judicial and administrative proceedings related to tax and social security obligations, whose object is to challenge their legality or constitutionality, regardless of the assessment that the probability of success, the amounts are fully recognized in the financial statements. They are fully or partially reversed when the obligations cease to exist or are reduced.
Contingent liabilities are possible obligations that arise from past events and whose existence will be confirmed only by theoccurrenceor nonoccurrence of one or more future events that are not totally under the control of the consolidated entities. Under accounting rules, contingent liabilities classified as possible losses are not recognized, but disclosed in the notes to the financial statements.
Contingent assets are not accounting recognized , except when there are guarantees or favorable judicial decisions, about which no longer fit features, characterizing the gain as practically certain. Assets with probable success, if any, are only disclosed in the financial statements.
Management believes that the provisions made are sufficient to cover losses from judicial proceedings, and believe that, in aggregate, will not have significant impacts on results, cash flow or financial condition of the Bank.
Given the uncertainties arising from the proceedings is not practicable to determine the time of any outflow (cash disbursement).
r) Other liabilities
“Other liabilities” includes the balance of all accrued expenses and deferred income, excluding accrued interest, and the amount of any other liabilities not included in other categories.
s) Share-based compensation
Settlement in shares
It refers to options to purchase shares of the Bank promoting a commitment of the executives with the long-term results. The number of shares granted to executives vary according to certain performance parameters.
At the beginning of the plan is made an estimate of the likely amount of options to be granted and the fair value amount is recorded in Personal expenses against "Equity - Reserves - Share-Based Payment" throughout the vesting period.
Settlement in cash
At the beginning of the Plan is made an estimate of the likely amount of shares "hypothetical" that will be received by the executives. It is determined the fair value of the shares "hypothetical" and accounted throughout the vesting period a provision in Other liabilities against Personal expenses.
t) Recognition of income and expenses
The most significant criteria used by the Bank to recognize its income and expenses are summarized as follows:
i. Interest income, interest expenses and similar items
Interest income, interest expenses and similar items are generally recognized on an accrual basis using the effective interest method. Dividends received from other companies are recognized as income when the consolidated entities' right to receive them arises.
However, the recognition of accrued interest in the consolidated income statement is suspended for debt instruments and loans and advances individually classified as impaired and for the instruments for which impairment losses have been assessed collectively because they have payments more than two months past due. This interest is recognized as income, when collected, as a reversal of the related impairment losses.
ii. Commissions, fees and similar items
Fee and commission income and expenses are recognized in the consolidated income statement using criteria that vary according to their nature. The main criteria are as follows:
• Fee and commission income and expenses relating to financial assets and financial liabilities measured at fair value through profit or loss are recognized when paid;
• Those arising from transactions or services that are performed over a period of time are recognized over the life of these transactions or services; and
• Those relating to services provided in a single act are recognized when the single act has been performed.
F-25
|
|
|
|
BANCO SANTANDER (BRASIL) S.A.
NOTES TO THE CONSOLIDATED FINANCIAL STATEMENTS FOR THE YEARS ENDED DECEMBER 31, 2011, 2010 AND 2009 |
|
|
(Amounts in thousands of Brazilian Reais - R$, unless otherwise stated) |
|
iii. Non-financial income and expenses
These are recognized for accounting purposes on an accrual basis.
iv. Deferred collections and payments
These are recognized for accounting purposes at the amount resulting from discounting the expected cash flows at market rates.
v. Loan arrangement fees
Loan arrangement fees, mainly loan origination and application fees, are accrued and recognized in income over the term of the loan. In the case of loan origination fees, the portion relating to the associated direct costs incurred in the loan arrangement is recognized immediately in the consolidated income statement.
u) Financial guarantees
“Financial guarantees” are defined as contracts whereby an entity undertakes to make specific payments for a third party if the latter does not do so, irrespective of the various legal forms they may have, such as guarantees, irrevocable documentary credits issued or confirmed by the entity, among others.
The Bank initially recognizes the financial guarantees provided on the liability side of the consolidated balance sheet at fair value, which is generally thepresent valueof the fees, commissions and similar interest receivable from these contracts over the term thereof, and simultaneously the Bank recognizes, on the asset side of the consolidated balance sheet, the amount of the fees, commissions and interest received at the start of the transactions and the amounts receivable at the present value of the fees, commissions and interest receivable.
Financial guarantees, regardless of the guarantor, instrumentation or other circumstances, are reviewed periodically so as to determine the credit risk to which they are exposed and, if appropriate, to consider whether a provision is required. The credit risk is determined by application of criteria similar to those established for quantifying impairment losses on debt instruments measured at amortized cost.
The provisions made for these transactions are recognized under “Provisions - Provisions for contingent liabilities, commitments and other provisions” in the consolidated balance sheet (note 22).
If a specific provision is required for financial guarantees, the related unearned commissions recognized under “Financial liabilities at amortized cost – Other financial liabilities” in the consolidated balance sheet are reclassified to the appropriate provision.
v) Assets under management and investment and pension funds managed by the Bank
Assets owned by third parties and managed by the consolidated entities are not presented on the face of the consolidated balance sheet. Management fees are included in “Fee and commission income” in the consolidated income statement. Note 41-b contains information on the third-party assets managed by the Bank.
The investment funds and pension funds managed by the consolidated entities are not recorded in the consolidated balance sheet since the related assets are owned by third parties. The fees and commissions earned in the year for the services rendered by the Bank entities to these funds (asset management and custody services) are recognized under “Fee and commission income” in the consolidated income statement.
w) Post-employment benefits
Post-employment benefit plans include the commitments of the Bank: (i) addition to the benefits of public pension plan; and (ii) medical assistance in case of retirement, permanent disability or death for that employees eligible and their direct beneficiaries.
Defined contribution plans
Defined benefit plans is the post-employment benefit plan which the Bank and its subsidiaries as the sponsoring entity pays fixed contributions into a pension fund, not having a legal or constructive obligation to pay further contributions if the fund does not hold sufficient assets to pay all benefits relating to services provided in the current and in previous periods.
The contributions made in this connection are recognized under personnel expenses in the consolidated income statement. The amounts not yet contributed at each year-end are recognized, at their present value in balance sheets like "Provisions - provisions for pension funds and similar obligations" in the consolidated balance sheet.
Defined benefit plans
Defined benefit plan is the post-employment benefit plan which is not defined contribution plan and are shown ate Note 22.
The presentvalueof obligations of defined benefit plans are recorded, net (i) the fair value of plan assets,(ii) of gains and / or net unrecognized actuarial losses, which are deferred using the corridor method, and (iii) the costs of past service, which is deferred over time. The obligations are recorded in the balance sheet as "Provisions -provisions for pension funds and similar obligations" in the consolidated balance sheet.
In case the net amount represents an asset, the actuarial asset is recorded in the consolidated balance sheet as “Other assets” when: (i) the excess funds represent future economic benefits in the shape of a return of funds to the sponsor or a reduction in future contributions, according to the conditions set forth in Resolution 26/2008 of the Supplementary Pension Plan Management Board (CGPC); and (ii) resulting from any accrued, net and unrecorded actuarial losses and costs of past services that will be offset in the long term by their respective record.
The plan’s assets are defined as those that will be used directly in the settlement of obligations, and: (i) whose ownership is sponsored; and (ii) that can only be used to pay or finance post-employment benefits and cannot be returned to the consolidated entities, unless the assets remaining in the plan are sufficient to meet all of the plan’s obligations.
F-26
|
|
|
|
BANCO SANTANDER (BRASIL) S.A.
NOTES TO THE CONSOLIDATED FINANCIAL STATEMENTS FOR THE YEARS ENDED DECEMBER 31, 2011, 2010 AND 2009 |
|
|
(Amounts in thousands of Brazilian Reais - R$, unless otherwise stated) |
|
Actuarial gains and losses are those resulting from differences between previous actuarial assumptions and what effectively took place, and from the effects of those changes on actuarial assumptions. The Bank uses the corridor method and records the net amount of accrued actuarial gains and/or losses exceeding the higher between 10% of the present value of the obligations and 10% of the fair value of the plan’s assets.
The cost of past services results either from changes in the current post-employment benefits or from the introduction of new benefits, and is recorded according to the straight-line method over the period between the time when the new commitments arise and the date when the employee acquired the irrevocable right to receive new benefits.
Post-employment benefits are recorded in the income statement as follows:
• Cost of the current service – increase in the present value of the obligations resulting from employee services in the current periods – “Personnel expenses”.
• Cost of interest – increase in the present value of the obligations as a result of the passing of time - "Interest and similar expenses."
• The expected return on the plan’s assets and the gains or losses on the value of those assets – “Interest and similar revenues”.
• The actuarial gains and losses calculated by using the corridor method and the unrecorded cost of past services – “ Provisions (Net)".
Defined benefit plans are recorded based on an actuarial study conducted annually by an external consulting firm at the end of each fiscal year and effective for the subsequent period. The actuarial valuation of these plans depends on a number of assumptions, including the following stand:
• Assumed interest rates;
• Boards of mortality;
• Annual index applied to the review of pensions;
• Index of inflation;
• Annual index salary readjustments; and
• Method used to calculate the commitments relating to acquired rights of active employees.
x) Other long-term employee benefits
“Other long-term employee benefits”, defined as obligations to early retirees taken to be those who have ceased to render services at the entity but who, without being legally retired, continue to have economic rights relating to the entity until they acquire the legal status of retiree, long-service bonuses, obligations for death of spouse or disability before retirement that depend on the employee's length of service at the entity and other similar items, are treated for accounting purposes, where applicable, as established above for defined benefit post-employment plans, except that all past service costs and actuarial gains and losses are recognized immediately (note 22).
y) Termination benefits
Termination benefits are recognized when there is a detailed formal plan identifying the basic changes to be made, provided that implementation of the plan has begun, its main features have been publicly announced or objective facts concerning its implementation have been disclosed.
z) Income taxes
Income tax is calculated at the rate of 15% plus a 10% surtax; social contribution tax is calculated at the rate of 15% for financial institutions, and for non-financial companies the social contribution tax rate is 9%, after adjustments determined by tax legislation.
The expense for corporation income tax is recognized in the consolidated income statement, except when it results from a transaction recognized directly in equity, in which case the tax effect is also recognized in equity.
The current income tax expense is calculated as the sum of the current tax resulting from application of the appropriate tax rate to the taxable profit for the year (net of any deductions allowable for tax purposes), and of the changes in deferred tax assets and liabilities recognized in the consolidated income statement.
“Tax assets” includes the amount of all tax assets, which are broken down into “current” amounts of tax to be recovered within the next twelve months and “deferred” amounts of tax to be recovered in future years, including those arising from unused tax losses or tax credits.
“Tax liabilities” includes the amount of all tax liabilities (except provisions for taxes), which are broken down into “current” the amount payable in respect of the income tax on the taxable profit for the year and other taxes in the next twelve months and “deferred” the amount of income tax payable in future years.
Deferred tax assets and liabilities include temporary differences, which are identified as the amounts expected to be payable or recoverable on differences between the carrying amounts of assets and liabilities and their related tax bases, and tax loss and tax credit carryforwards. These amounts are measured at the tax rates that are expected to apply in the period when the asset is realized or the liability is settled.
Deferred tax assets are only recognized for temporary differences to the extent that it is considered probable that the consolidated entities will have sufficient future taxable profits against which the deferred tax assets can be utilized, and the deferred tax assets do not arise from the initial recognition (except in a business combination) of other assets and liabilities in a transaction that affects neither taxable profit or accounting profit. Other deferred tax assets (tax loss and tax credit carryforwards) are only recognized if it is considered probable that the consolidated entities will have sufficient future taxable profits against which they can be utilized.
Income and expenses recognized directly in stockholders equity are accounted for as temporary differences.
F-27
|
|
|
|
BANCO SANTANDER (BRASIL) S.A.
NOTES TO THE CONSOLIDATED FINANCIAL STATEMENTS FOR THE YEARS ENDED DECEMBER 31, 2011, 2010 AND 2009 |
|
|
(Amounts in thousands of Brazilian Reais - R$, unless otherwise stated) |
|
The deferred tax assets and liabilities recognized are reassessed at each balance sheet date in order to ascertain whether they still exist, and the appropriate adjustments are made on the basis of the findings of the analyses performed.
Under the current regulation, the expected realization of tax credits based on the Bank's projections of future results and based on technical study, as shown in Note 23.
PIS (Social Integration Program) and COFINS (Tax for Social Security Financing) taxes have been computed at a combined rate of 4.65% on certain gross revenues and expenses. Financial institutions may deduct financial expenses in determining the PIS/COFINS tax basis. PIS and COFINS are considered a profit-base component (net basis of certain revenues and expenses), therefore and accordingly to IAS 12 it is recorded as income taxes.
aa) Consolidated cash flow statements
The following terms are used in the consolidated cash flow statements with the meanings specified:
• Cash flows: inflows and outflows of cash and cash equivalents, which are short-term, highly liquid investments that are subject to an insignificant risk of changes in value.
• Operating activities: the principal revenue-producing activities of credit institutions and other activities that are not investing or financing activities.
• Investing activities: the acquisition and disposal of long-term assets and other investments not included in cash and cash equivalents.
• Financing activities: activities that result in changes in the size and composition of the equity and liabilities that are not operating activities.
In preparing the consolidated cash flows statement, the high liquidity investments with insignificant risk of changes in their values were classified as "Cash and cash equivalents". The Bank classifies as cash and cash equivalents balances recorded under "Cash and balance with the Brazilian Central Bank" and "Loans and amounts due from credit institutions" in the consolidated balance sheet, except restricted resources and long-term transactions.
The interest paid and received correspond basically to operating activities of Banco Santander.
3. Change in the scope of consolidation
a) Sale of Santander Seguros
Based on the approval issued by Superintendence of Private Insurance (Susep) on August 23, 2011, on October 5, 2011 was held the closing of the sale (the "Transaction") of all shares issued by its wholly owned subsidiary Santander Seguros for (i) Zurich Santander Insurance America, SL, a holding company based in Spain (Zurich Santander) held, directly or indirectly, 51% (fifty one percent) by the Zurich Financial Services Ltd. and its affiliates (Zurich) and 49% (forty nine percent) by Banco Santander Spain, and (ii) Inversiones ZS America SPA, a company established in Chile and held by Zurich Santander (Inversiones ZS).
Referred closing understood the actual transfer, (i) by Banco Santander to ZS Insurance of 11,251,174,948 common shares of Santander Seguros, and (ii) Banco Santander to Inversiones ZS of 3 common shares of Santander Seguros, and payment of the purchase sale price preliminary to Banco Santander, net amounts R$2,741,102 thousand (received in October 5,2011). The assets of Santander Seguros R$24,731,463 thousand, main represented by R$21,551,422 thousand of debts instruments and equity (public securities, private and fund units specially constituted - guarantors of benefit plans - PGBL / VGBL). The Santander Seguros liabilities amounts R$22,349,428 thousand, main represented by R$21,278,718 thousand of liabilities for securities agreements - technical provision for insurance operations and pension plans. The income recognized in this operation was R$424,292 thousand, recorded as a result on disposal of non-current assets held for sale not classified as discontinued operations.
The final sale and purchase price will be set appropriately based on the balance sheet to be specially prepared by Santander Seguros for the period ended September 30, 2011 to be released at the first half of 2012 and the price adjustment mechanisms expressly provided for in the Purchase and Sale Agreement dated July 14, 2011, and once set, Banco Santander will disclose it to the general public and make the offering of preemptive rights to shareholders, in accordance with Article 253 of Law 6.404/1976.
The transaction fits into the context of the strategic partnership between Santander Spain and Zurich, involving the acquisition by Zurich Santander, all property and casualty insurers and life and welfare of Santander Spain in Argentina, Brazil, Chile, Mexico and Uruguay.
As part of the arrangement of the transaction, Banco Santander exclusively distribute the insurance products in the next 25 years, through its network branch, with the exception of automobile insurance that are not included in the exclusivity scope in the arrangement of the transaction. As a result of these contracts, Banco Santander will receive a payment equivalent to the currently received.
The operation aims to promote and strengthen Banco Santander activities in the insurance market, providing a greater range of products, including classes of customers not currently exploited and leveraging the distribution capabilities of Banco Santander, among others.
The operation, according to the regulations, subject to the approval of Susep.
b) Partial spin-off of Santander Seguros with the transfer of the split portion constitution to Sancap Investimentos e Participações S.A.
In the context of sale transaction of Santander Seguros, at the extraordinary stockholders' meeting held on April 29, 2011, was approved the Partial spin-off of Santander Seguros with the transfer of its equity to a new company, constituted in the act of the partial spin-off, under the company name of Sancap Investimentos e Participações S.A. (“Sancap”). The spun-off assets to Sancap is total amounting of R$511,774 thousands and refers only and exclusively to the totality of the participation held by Santander Seguros on Santander Capitalização's capital.
The Sancap is in the process of formation and operation of the Partial Split is in the process of approval in Susep on August 9, 2011.
F-28
|
|
|
|
BANCO SANTANDER (BRASIL) S.A.
NOTES TO THE CONSOLIDATED FINANCIAL STATEMENTS FOR THE YEARS ENDED DECEMBER 31, 2011, 2010 AND 2009 |
|
|
(Amounts in thousands of Brazilian Reais - R$, unless otherwise stated) |
|
| 4. Cash and balances with the Brazilian Central Bank | |||
| Thousands of Reais | 2011 | 2010 | 2009 |
| Cash and cash equivalents | 3,542,707 | 3,158,003 | 18,730,403 |
|
of which: |
|||
|
Cash |
3,542,707 | 3,158,003 | 3,630,669 |
|
Money market investments (1) |
- | - | 15,099,734 |
| Money market investments (2) | 17,607,917 | 12,456,450 | - |
| Central bank compulsory deposits (3) | 44,787,379 | 41,185,698 | 8,538,609 |
| Total | 65,938,003 | 56,800,151 | 27,269,012 |
|
(1) Includes securities purchased under agreements to resell, short-term and present insignificant risk of changes in value. |
|||
|
(2) Includes securities purchased under agreements to resell, long term and not considered cash equivalents. |
|||
|
(3) Central bank compulsory deposits relate to a minimum balance financial institutions are required to maintain with the Brazilian Central Bank based on a percentage of deposits received from third parties, regarded as restricted use of resources. |
|
| 5. Loans and amounts due from credit institutions | |
| a) Breakdown |
The breakdown, by classification, type and currency, of the balances of “Loans and amounts due from credit institutions” in the consolidated balance sheets is as follows:
| Thousands of Reais | 2011 | 2010 | 2009 |
| Classification: | |||
| Financial assets held for trading | - | 47,662 | 67,170 |
| Other financial assets at fair value through profit or loss | 60,813 | 292,034 | 1,907,265 |
| Loans and receivables | 19,628,861 | 22,658,520 | 24,228,143 |
|
Of which: |
|||
|
Loans and amounts due from credit institutions, gross |
19,690,528 | 22,658,520 | 24,228,143 |
|
Impairment losses (note 9.c) |
(61,667) | - | - |
| Loans and amounts due from credit institutions, net | 19,689,674 | 22,998,216 | 26,202,578 |
| Loans and amounts due from credit institutions, gross | 19,751,341 | 22,998,216 | 26,202,578 |
| Type: | |||
| Time deposits (2) | 7,136,037 | 9,110,447 | 9,945,047 |
| Reverse repurchase agreements (1)(2) | 1,039,551 | 599,999 | 6,160,397 |
| Escrow deposits | 6,868,943 | 7,316,926 | 6,192,292 |
| Cash and Foreign currency investments (2) | 4,247,179 | 5,826,715 | 3,493,254 |
| Other accounts | 459,631 | 144,129 | 411,588 |
| Total | 19,751,341 | 22,998,216 | 26,202,578 |
| Currency: | |||
| Brazilian Real | 15,067,109 | 17,412,613 | 20,775,625 |
| US dollar | 4,300,075 | 5,100,831 | 5,086,320 |
| Euro | 354,078 | 455,831 | 293,329 |
| Pound sterling | 4,519 | 3,046 | 14,729 |
| Other currencies | 25,560 | 25,895 | 32,725 |
| Impairment losses | - | - | (150) |
| Total | 19,751,341 | 22,998,216 | 26,202,578 |
| (1) Collateralized by debt instruments. | |||
| (2) Includes R$5,474,700 thousand (2010 - R$6,188,896 thousand), of transactions short-term transactions and low risk of change its value, considered cash equivalents. | |||
| Note 41-d contains a detail of the residual maturity periods of loans and receivables and of the related average interest rates. | |||
F-29
|
|
|
|
BANCO SANTANDER (BRASIL) S.A.
|
|
|
(Amounts in thousands of Brazilian Reais - R$, unless otherwise stated) |
|
| 6. Debt instruments | |||
| The breakdown, by classification, type and currency, of the balances of “Debt instruments” is as follows: | |||
| Thousands of Reais | 2011 | 2010 | 2009 |
| Classification: | |||
| Financial assets held for trading | 25,298,804 | 16,472,413 | 12,554,035 |
| Other financial assets at fair value through profit or loss | 230,037 | 224,388 | 210,973 |
| Available-for-sale financial assets | 43,300,354 | 45,477,982 | 44,745,924 |
| Loans and receivables | 62,062 | 81,444 | - |
| Total | 68,891,257 | 62,256,227 | 57,510,932 |
| Type: | |||
| Government securities - Brazil (1) | 56,833,361 | 55,443,469 | 53,620,439 |
| Government securities - others | - | 379,341 | 366,252 |
| Debentures and Promissory notes | 8,281,136 | 4,523,111 | 2,301,584 |
| Other debt securities | 3,776,760 | 1,910,306 | 1,252,332 |
| Impairment losses (2) | - | - | (29,675) |
| Total | 68,891,257 | 62,256,227 | 57,510,932 |
| Currency: | |||
| Brazilian Real | 68,187,067 | 61,329,205 | 56,782,142 |
| US dollar | 704,191 | 547,681 | 392,213 |
| Euro | - | 379,341 | 366,252 |
| Impairment losses (2) | - | - | (29,675) |
| Total | 68,891,257 | 62,256,227 | 57,510,932 |
| (1) Includes, substantially, National Treasury Bills (LTN), Treasury Bills (LFT) e National Treasury Notes (NTN-B, NTN-C e NTN-F). | |||
| (2) It was settled in 2010 the position in debentures and therefore written off the respective impairment loss. | |||
At December 31, 2011, includes R$34,521,029 thousand (2010 - R$27,348,766 thousand e 2009 - R$2,590,485 thousand) of debt securities totaling had been assigned to repurchase agreements, R$2,221,258 thousand (2010 - R$7,259,356 thousand e 2009 - R$ 17,994,443 thousand) to compulsory deposits in Central Bank, R$8,851,981 thousand (2010 - R$4,316,863 thousand e 2009 - R$2,392,715 thousand) to guarantee BM&FBovespa transactions and R$3,066,458 thousand (2010 -R$5,130,939 thousand e 2009 - R$3,973,566 thousand) to escrow deposits and other guarantee. Additionally, in 2010 - R$17,425,576 thousand and 2009 -R$14,183,647 thousand related coverage of PGBL/VGBL and in 2010 - R$1,502,934 thousand and 2009 - R$1,563,334 thousand related to other investment funds.
Note 41-d contains a detail of the residual maturity periods of available-for-sale financial assets and of loans and receivables and of the related average interest rates.
7. Equity instruments
| a) Breakdown | |||
| The breakdown, by classification and type, of the balances of “Equity instruments” is as follows: | |||
| Thousands of Reais | 2011 | 2010 | 2009 |
| Classification: | |||
| Financial assets held for trading | 448,209 | 3,283,931 | 2,544,441 |
| Other financial assets at fair value through profit or loss (1) | 374,519 | 17,423,359 | 13,787,109 |
| Available-for-sale financial assets | 1,307,847 | 1,728,037 | 1,660,196 |
| Total | 2,130,575 | 22,435,327 | 17,991,746 |
| Type: | |||
| Shares of Brazilian companies | 1,001,644 | 1,153,037 | 1,470,918 |
| Shares of foreign companies | 1,229 | 503 | 67,876 |
| Investment fund units and shares (1) | 1,127,702 | 21,281,787 | 16,452,952 |
| Total | 2,130,575 | 22,435,327 | 17,991,746 |
| (1) In 2010 and 2009, includes Investment fund units Guarantors of Benefit Plans - PGBL/VGBL, related to the liabilities for insurance contracts (note 3.a). | |||
| b) Changes | |||
| The changes in the balance of “Equity instruments – Financial assets held for trading” were as follows: | |||
| Thousands of Reais | 2011 | 2010 | 2009 |
| Balance at beginning of year | 3,283,931 | 2,544,441 | 678,993 |
| Changes in the scope of consolidation (note 3.a) | (1,643,066) | - | 1,722,965 |
| Net additions /disposals | (1,193,006) | 360,610 | (9,148) |
| Valuation adjustments | 350 | 378,880 | 151,631 |
| Balance at end of year | 448,209 | 3,283,931 | 2,544,441 |
F-30
|
|
|
|
BANCO SANTANDER (BRASIL) S.A.
NOTES TO THE CONSOLIDATED FINANCIAL STATEMENTS FOR THE YEARS ENDED DECEMBER 31, 2011, 2010 AND 2009 |
|
|
(Amounts in thousands of Brazilian Reais - R$, unless otherwise stated) |
|
| The changes in the balance of “Equity instruments – Other financial assets at fair value through profit or loss” were as follows: | |||
| Thousands of Reais | 2011 | 2010 | 2009 |
| Balance at beginning of year | 17,423,359 | 13,787,109 | - |
| Changes in the scope of consolidation (note 3.a) | (19,819,585) | - | 11,257,572 |
| Net additions /disposals | 374,518 | 2,480,188 | - |
| Valuation adjustments (1) | 2,396,227 | 1,156,062 | 2,529,537 |
| Balance at end of year | 374,519 | 17,423,359 | 13,787,109 |
(1) Refers to variation of the Investment fund units Guarantors of Benefit Plans - PGBL/VGBL are accounted as income in "Other operating income (expense) - Expense from insurance contracts" net of the variations of their technical provisions.
| The changes in the balance of “Equity instruments – Available-for-sale financial assets” were as follows: | ||||||
| Thousands of Reais | 2011 | 2010 | 2009 | |||
| Balance at beginning of year | 1,728,037 | 1,660,196 | 1,244,490 | |||
| Net changes in the scope of consolidation (note 3.a) | (18,539) | - | 4,526 | |||
| Net additions /disposals | (319,221) | (22,584) | 192,600 | |||
| Valuation adjustments | (82,430) | 90,425 | 218,580 | |||
| Balance at end of year | 1,307,847 | 1,728,037 | 1,660,196 | |||
| 8. Derivative financial instruments and Short positions | ||||||
| a) Notional amounts and market values of trading and hedging derivatives | ||||||
| The breakdown of the notional and/or contractual amounts and the market values of the trading and hedging derivatives held by the Bank is as follows: | ||||||
| Thousands of Reais | 2011 | 2010 | 2009 | |||
|
Notional
Amount |
Market Value |
Notional
Amount |
Market Value |
Notional
Amount |
Market Value | |
| Trading derivatives | ||||||
| Interest rate risk and other: | ||||||
|
Interest rate swaps |
51,472,807 | 2,808,157 | 53,050,746 | 15,076,839 | 50,761,630 | 12,646,099 |
|
Options - purchase and sales |
258,827,369 | (343,371) | 351,261,588 | (136,695) | 181,501,740 | 33,762 |
|
Forward and futures contracts |
64,819,935 | 16,780 | 81,921,145 | 10,289 | 32,263,081 | - |
| Foreign currency risk: | ||||||
|
Currency swaps (1) |
47,621,292 | (3,004,037) | 36,923,396 | (14,522,887) | 40,616,308 | (11,648,297) |
|
Options - purchase and sales |
7,785,211 | 14,014 | 12,351,165 | 2,193 | 28,983,489 | (333,259) |
|
Forward and futures contracts |
58,267,968 | (46,721) | 26,713,978 | (167,694) | 22,063,175 | (150,008) |
| 488,794,582 | (555,178) | 562,222,018 | 262,045 | 356,189,423 | 548,297 | |
| Hedging derivatives | ||||||
| Interest rate risk: | ||||||
|
Futures contracts (2) (3) |
1,794,034 | - | 7,165,189 | - | 15,294,094 | - |
|
Interest rate swaps (4) |
417,731 | 44,637 | 549,276 | 115,528 | 1,249,645 | 153,619 |
| 2,211,765 | 44,637 | 7,714,465 | 115,528 | 16,543,739 | 153,619 | |
| Total | 491,006,347 | (510,541) | 569,936,483 | 377,573 | 372,733,162 | 701,916 |
(1) Includes credit derivatives, which the Bank uses to reduce or eliminate its exposure to specific risks arising from the purchase or sale of assets associated with the credit portfolio management. In 2011, the volume of credit derivatives with total return rate – credit risk received corresponds to R$500,425 thousand (2010 - R$444,330 thousand and 2009 – R$527,532 thousand) of fair value. During the period there were no credit events related to events provided for in the contracts. Required base capital used amounted to R$3,291 thousand (2010 - R$8,121 thousand and 2009 – R$7,498 thousand).
(2) Futures contracts registered at BM&FBovespa has positions receivables and payables settled daily.
(3) In the first quarter of 2011, due to the business strategy, the structures of hedge cash flow as they had hedged certificates of deposit (CDB) were discontinued. The net effect of the outstanding debt in equity will be repaid by January 2012, the remaining term of the hedging instruments.
(4) The curve value and the fair value of loans and advance to customers classified as hedge market risk item is R$342,437 thousand (December 31, 2010 - R$429,896 thousand) and R$346,260 thousand (December 31, 2010 - R$443,446 thousand), respectively.
The notional and/or contractual amounts of the contracts entered into do not reflect the actual risk assumed by the Bank, since the net position in these financial instruments is the result of offsetting and/or combining them. This net position is used by the Bank basically to hedge the interest rate, underlying asset price or foreign currency risk; the results on these financial instruments are recognized under “Gains/losses on financial assets and liabilities (net)” in the consolidated income statements and increase or offset, as appropriate, the gains or losses on the investments hedged.
Additionally, in order to interpret correctly the results on the “Securities and Commodities Derivatives” shown in the foregoing table, it should be considered that these items relate mostly to securities options for which a premium has been received which offsets their negative market value. Also, this market value is offset by positive market values generated by symmetrical positions in the Bank’s held-for-trading portfolio.
The Bank manages the credit risk exposure of these contracts through netting arrangements with its main counterparties and by receiving assets as collateral for its risk positions.
F-31
|
|
|
|
BANCO SANTANDER (BRASIL) S.A.
NOTES TO THE CONSOLIDATED FINANCIAL STATEMENTS FOR THE YEARS ENDED DECEMBER 31, 2011, 2010 AND 2009 |
|
|
(Amounts in thousands of Brazilian Reais - R$, unless otherwise stated) |
|
| b) Trading derivatives | ||||||
| The breakdown of the notional and/or contractual amounts of trading derivative by maturity is as follows: | ||||||
| Thousands of Reais | 2011 | 2010 | 2009 | |||
|
Up to 3
months |
From 3 to 12
months |
Over 12
months |
Total | Total | Total | |
| Swap | 26,822,206 | 20,790,385 | 51,481,508 | 99,094,099 | 89,974,142 | 91,377,938 |
| Options | 205,148,983 | 46,243,577 | 15,220,020 | 266,612,580 | 363,612,753 | 210,485,229 |
| Futures contracts | 61,622,162 | 6,299,968 | 32,438,882 | 100,361,012 | 94,302,441 | 44,886,986 |
| Forward contracts and Others | 14,871,654 | 4,105,167 | 3,750,070 | 22,726,891 | 14,332,682 | 9,439,270 |
| Total | 308,465,005 | 77,439,097 | 102,890,480 | 488,794,582 | 562,222,018 | 356,189,423 |
| Thousands of Reais | 2011 | 2010 | 2009 | |||
| Exchange (1) | Cetip (2) |
Over the
Counter |
Total | Total | Total | |
| Swap | 31,839,671 | 41,448,124 | 25,806,304 | 99,094,099 | 89,974,142 | 91,377,938 |
| Options | 266,092,016 | 377,701 | 142,863 | 266,612,580 | 363,612,753 | 210,485,229 |
| Futures contracts | 100,361,012 | - | - | 100,361,012 | 94,302,441 | 44,886,986 |
| Forward contracts and Others | 17,427 | 14,680,915 | 8,028,549 | 22,726,891 | 14,332,682 | 9,439,270 |
| Total | 398,310,126 | 56,506,740 | 33,977,716 | 488,794,582 | 562,222,018 | 356,189,423 |
| (1) Includes trades with the BM&FBovespa and other securities and commodities exchanges. | ||||||
| (2) Includes amount traded on other clearinghouses. | ||||||
| The detail of the fair value of the trading derivatives reported in assets and liabilities: | ||||||
| Thousands of Reais | 2011 | 2010 | 2009 | |||
| Assets | Liabilities | Assets | Liabilities | Assets | Liabilities | |
| Swap Differentials Receivable/Payable (1) | 3,254,929 | 3,512,724 | 4,328,952 | 3,775,000 | 3,998,568 | 3,000,766 |
| Option Premiums to Exercise | 208,117 | 537,474 | 210,232 | 344,734 | 570,923 | 870,420 |
| Forward Contracts and others | 691,436 | 659,462 | 478,175 | 635,580 | 380,515 | 530,523 |
| Total | 4,154,482 | 4,709,660 | 5,017,359 | 4,755,314 | 4,950,006 | 4,401,709 |
| (1) Includes swap options, credit and embedded derivatives. | ||||||
| c) Market risk hedge | ||||||
| 2011 | 2010 | |||||
| Thousands of Reais | Cost |
Fair
value |
Adjustment
to fair value |
Cost |
Fair
value |
Adjustment
to fair value |
| Hedge instruments | ||||||
| Swap Contracts | 74,928 | 76,175 | 1,247 | 118,348 | 115,528 | (2,820) |
| Asset | 417,731 | 453,595 | 35,864 | 549,276 | 557,766 | 8,490 |
| Interbank Deposit Rates - CDI | 145,940 | 146,711 | 771 | 424,211 | 426,852 | 2,641 |
| Indexed to Foreign Currency - Libor - Dollar | 271,791 | 306,884 | 35,093 | 125,065 | 130,914 | 5,849 |
| Liabilities | (342,803) | (377,420) | (34,617) | (430,928) | (442,238) | (11,310) |
| Indexed to Foreign Currency - Dollar | (101,410) | (102,318) | (908) | (305,837) | (311,367) | (5,530) |
| Indexed to Foreign Currency - Fixed - Dollar | (55,498) | (60,565) | (5,067) | (125,091) | (130,871) | (5,780) |
| Interbank Deposit Rates - CDI | (185,895) | (214,537) | (28,642) | - | - | - |
| Hedge Object | 342,473 | 346,260 | 3,787 | 429,896 | 443,446 | 13,550 |
| Credit Portfolio | 342,473 | 346,260 | 3,787 | 429,896 | 443,446 | 13,550 |
| Indexed to Foreign Currency - Dollar | 100,871 | 102,321 | 1,450 | 304,794 | 311,381 | 6,587 |
| Indexed to Foreign Currency - Fixed - Dollar | 55,663 | 60,565 | 4,902 | 125,102 | 132,065 | 6,963 |
| Interbank Deposit Rates - CDI | 185,939 | 183,374 | (2,565) | - | - | - |
F-32
|
|
|
|
BANCO SANTANDER (BRASIL) S.A.
NOTES TO THE CONSOLIDATED FINANCIAL STATEMENTS FOR THE YEARS ENDED DECEMBER 31, 2011, 2010 AND 2009 |
|
|
(Amounts in thousands of Brazilian Reais - R$, unless otherwise stated) |
|
| 2009 | |||||||
| Thousands of Reais | Cost |
Fair
value |
Adjustment
to fair value |
||||
| Hedge instruments | |||||||
| Swap Contracts | 169,931 | 153,619 | (16,312) | ||||
| Asset | 1,249,645 | 1,259,020 | 9,375 | ||||
| Interbank Deposit Rates - CDI | 862,027 | 867,810 | 5,783 | ||||
| Indexed to Foreign Currency - Pound | 387,618 | 391,210 | 3,592 | ||||
| Liabilities | (1,079,714) | (1,105,401) | (25,687) | ||||
| Indexed to Foreign Currency - Dollar | (1,075,922) | (1,101,588) | (25,666) | ||||
| Fixed Interest Rate - Reais | (3,792) | (3,813) | (21) | ||||
| Hedge Object | 1,073,020 | 1,100,046 | 27,026 | ||||
| Credit Portfolio | 685,405 | 708,566 | 23,161 | ||||
| Indexed to Foreign Currency - Dollar | 681,613 | 704,753 | 23,140 | ||||
| Fixed Interest Rate - Reais | 3,792 | 3,813 | 21 | ||||
| Borrowings | 387,615 | 391,480 | 3,865 | ||||
| Indexed to Foreign Currency - Pound | 387,615 | 391,480 | 3,865 | ||||
| d) Cash flow hedge | |||||||
| 2011 | 2010 | ||||||
| Thousands of Reais |
Reference
Value |
Cost | Fair Value |
Adjustment
to Fair Value |
Reference
Value |
Cost/
Market |
Adjustment
to Fair Value |
| Hedge instruments | |||||||
| Swap Contracts | - | (30,354) | (31,538) | (1,184) | - | - | - |
| Asset | 651,490 | 651,490 | 678,479 | 26,989 | - | - | - |
| Indexed to Foreign Currency - Swiss Franc (1) | 300,488 | 300,488 | 326,280 | 25,792 | - | - | - |
| Indexed to Pre Interest Rate- Real (2) | 351,002 | 351,002 | 352,199 | 1,197 | - | - | - |
| Liabilities | (681,844) | (681,844) | (710,017) | (28,173) | - | - | - |
| Indexed to Foreign Currency - Pre Dolar | (681,844) | (681,844) | (710,017) | (28,173) | - | - | - |
| Future Contracts (3) (4) | (1,794,034) | - | - | - | (6,850,698) | - | - |
| DI1 Rate | (1,794,034) | - | - | - | (6,850,698) | - | - |
| 2009 | |||||||
| Thousands of Reais |
Reference
Value |
Cost/
Market |
Adjustment
to Fair Value |
||||
| Hedge instruments | |||||||
| Future Contracts (4) | (15,294,094) | - | - | ||||
| DI1 Rate | (15,294,094) | - | - | ||||
| Thousands of Reais | 2011 | 2010 | 2009 | ||||
| Hedge Object - Cost | 2,518,986 | 7,385,636 | 15,337,856 | ||||
| Eurobonds | 300,803 | - | - | ||||
| Foreign Loans | 351,002 | - | - | ||||
| Bank Deposit Certificate- CDB | 1,867,181 | 7,385,636 | 15,337,856 | ||||
|
(1) Operation with maturing on December 1, 2014, whose object of hedge transactions are eurobonds. |
|||||||
|
(2) Operation with maturing on June 15, 2012, whose object of hedge transactions are obligations with foreign loans. |
|||||||
(3) In 2011, operation with maturing on January 2, 2014, and the updated amount of instruments is R$1,812,796 (2010 - R$7,165,189) whose object of hedge are Bank deposits certificates (CDB).
(4) The opened operations in 2010 and 2009, in the first quarter of 2011, due to business strategy, the structures of hedge cash flow which had the object are hedge bank deposits certificates (CDB) have been discontinued in the first quarter of 2011. The net effect of the outstanding equity will be amortized up to January 2012, the remaining term of the hedging instruments.
The effect of marking to market the swaps and future contracts amounts R$15,149 is recorded in stockholders' equity, net of tax effects.
e) Short positions
Short positions for 2011, 2010 and 2009 are related to Equity instruments from borrowed securities.
F-33
|
|
|
|
BANCO SANTANDER (BRASIL) S.A.
NOTES TO THE CONSOLIDATED FINANCIAL STATEMENTS FOR THE YEARS ENDED DECEMBER 31, 2011, 2010 AND 2009 |
|
|
(Amounts in thousands of Brazilian Reais - R$, unless otherwise stated) |
|
| 9. Loans and advances to customers | |||
| a) Breakdown | |||
| The breakdown, by classification, of the balances of “Loans and advances to customers” in the consolidated balance sheets is as follows: | |||
| Thousands of Reais | 2011 | 2010 | 2009 |
| Other financial assets at fair value through profit or loss | - | - | 389,113 |
| Loans and receivables (1) | 183,066,268 | 151,366,561 | 127,934,811 |
| Of which: | |||
| Loans and receivables at amortized cost | 194,184,437 | 160,558,323 | 138,005,290 |
| Impairment losses | (11,118,169) | (9,191,762) | (10,070,479) |
| Loans and advances to customers, net | 183,066,268 | 151,366,561 | 128,323,924 |
| Loans and advances to customers, gross | 194,184,437 | 160,558,323 | 138,394,403 |
(1) In 2011, the Bank, through its Grand Cayman branch, acquired from Banco Santander Spain, under commutative conditions, asset portfolio of contracts for financing export and import credit, related to operations contracted with brazilian clients or their affiliates abroad, amounting to US$943 million (2010 - US$808 million).
| Thousands of Reais | 2011 | 2010 | 2009 |
| Type: | |||
| Loans operations (1) | 192,681,804 | 159,184,714 | 137,062,083 |
| Repurchase agreements | 337,986 | 167,163 | 72,555 |
| Other receivables | 1,164,647 | 1,206,446 | 1,259,765 |
| Total | 194,184,437 | 160,558,323 | 138,394,403 |
| (1) Includes loans, leasing and other loans with credit characteristics. | |||
Note 41-d contains a detail of the residual maturity periods of loans and receivables and of the related average interest rates.
There are no loans and advances to customers for material amounts without fixed maturity dates.
b) Detail
Following is a detail, by loan type and status, borrower sector and interest rate formula, of the loans and advances to customers, which reflect the Bank’s exposure to credit risk in its core business, gross of impairment losses:
| Thousands of Reais | 2011 | 2010 | 2009 |
| Loan borrower sector: | |||
| Commercial, financial and industrial | 94,921,748 | 78,101,177 | 66,600,944 |
| Real estate-construction | 6,280,168 | 5,392,015 | 3,828,675 |
| Real estate-mortgage | 10,017,772 | 6,698,125 | 5,225,798 |
| Installment loans to individuals | 76,458,873 | 60,250,581 | 49,103,083 |
| Lease financing | 6,505,876 | 10,116,425 | 13,635,903 |
| Total (1) | 194,184,437 | 160,558,323 | 138,394,403 |
| (1) It includes commercial credit, secured loans, reverse repurchase agreements, finance leases, other term loans and impaired assets. | |||
| Interest rate formula: | |||
| Fixed interest rate | 133,503,436 | 98,669,915 | 90,663,927 |
| Floating rate | 60,681,001 | 61,888,408 | 47,730,476 |
| Total | 194,184,437 | 160,558,323 | 138,394,403 |
| c) Impairment losses | |||
| The changes in the allowances for the impairment losses on the balances of “Loans and receivables” were as follows: | |||
| Thousands of Reais | 2011 | 2010 | 2009 |
| Balance at beginning of year | 9,191,762 | 10,070,479 | 8,181,156 |
| Impairment losses charged to income for the year | 11,190,886 | 9,050,547 | 10,520,390 |
|
Of which: |
|||
|
Commercial, financial and industrial |
2,943,221 | 3,097,195 | 3,071,839 |
|
Real estate-mortgage |
97,472 | 70,538 | 27,531 |
|
Installment loans to individuals |
7,972,084 | 5,780,316 | 7,197,954 |
|
Lease finance |
178,109 | 102,498 | 223,066 |
| Write-off of impaired balances against recorded impairment allowance | (9,202,812) | (9,929,264) | (8,631,067) |
|
Of which: |
|||
|
Commercial, financial and industrial |
(2,469,617) | (3,209,180) | (3,072,849) |
|
Real estate-mortgage |
(36,447) | (42,026) | (31,177) |
|
Installment loans to individuals |
(6,484,338) | (6,508,585) | (5,377,097) |
|
Lease finance |
(212,410) | (169,473) | (149,944) |
| Balance at end of year | 11,179,836 | 9,191,762 | 10,070,479 |
|
Of which: |
|||
|
Loans and advances to customers |
11,118,169 | 9,191,762 | 10,070,479 |
|
Loans and amounts due from credit institutions (Note 5.a) |
61,667 | - | - |
F-34
|
|
|
|
BANCO SANTANDER (BRASIL) S.A.
NOTES TO THE CONSOLIDATED FINANCIAL STATEMENTS FOR THE YEARS ENDED DECEMBER 31, 2011, 2010 AND 2009 |
|
|
(Amounts in thousands of Brazilian Reais - R$, unless otherwise stated) |
|
| Thousands of Reais | 2011 | 2010 | 2009 |
| Recoveries of loans previously charged off | 1,809,337 | 817,635 | 537,509 |
|
Of which: |
|||
|
Commercial, financial and industrial |
352,638 | 88,507 | 41,995 |
|
Real estate-mortgage |
65,323 | 68,792 | 57,757 |
|
Installment loans to individuals |
1,331,104 | 634,779 | 420,366 |
|
Lease finance |
60,272 | 25,557 | 17,391 |
Taking into account these amounts recognized in “Impairment losses charged to income for the year” and the "Recoveries of loans previously charged off", the "Impairment losses on financial assets - Loans and receivables” amounted to R$9,381,549 thousand in 2011, R$8,232,912 thousand in 2010, R$9,982,881 thousand in 2009.
d) Impaired assets
The detail of the changes in the balance of the financial assets classified as “Loans and receivables – loans and advances to customers” and considered to be impaired due to credit risk is as follows:
| Thousands of Reais | 2011 | 2010 | 2009 |
| Balance at beginning of year | 9,348,648 | 9,899,884 | 7,730,464 |
| Net additions | 12,926,857 | 9,378,028 | 10,800,487 |
| Written-off assets | (9,202,812) | (9,929,264) | (8,631,067) |
| Balance at end of year | 13,072,693 | 9,348,648 | 9,899,884 |
| This amount, after deducting the related allowances, represents the Bank’s best estimate of the fair value of the impaired assets. | |||
| Following is a detail of the financial assets considered to be impaired classified by age of the oldest past-due amount: | |||
| Thousands of Reais | 2011 | 2010 | 2009 |
| With no Past-Due Balances or Less than 3 Months Past Due | 5,480,930 | 3,002,651 | 1,725,651 |
| With Balances Past Due by | |||
| 3 to 6 Months | 2,473,485 | 2,450,311 | 2,813,568 |
| 6 to 12 Months | 4,342,172 | 3,171,528 | 4,818,827 |
| 12 to 18 Months | 445,032 | 372,151 | 493,371 |
| 18 to 24 Months | 311,679 | 293,796 | 30,770 |
| More than 24 Months | 19,395 | 58,211 | 17,697 |
| Total | 13,072,693 | 9,348,648 | 9,899,884 |
Normally, the Bank writes-off its loans when they have arrears of more than 360 days. In the case of long term loans (over 3 years), they are written-off when they complete 540 days of delay. The loss is recorded in a compensation account for a minimum of 5 years and while not exhausted all procedures for collection.
| e) Lease portfolio at present value | |||
| Thousands of Reais | 2011 | 2010 | 2009 |
| Gross investment in lease transactions | 7,991,849 | 12,921,149 | 18,199,753 |
|
Lease receivables |
5,720,996 | 8,721,847 | 11,165,564 |
|
Unrealized residual values (1) |
2,270,853 | 4,199,302 | 7,034,189 |
| Unearned income on lease | (5,570,537) | (8,496,306) | (10,858,258) |
| Offsetting residual values | (2,270,853) | (4,199,302) | (7,034,188) |
| Leased property and equipment | 16,485,919 | 21,304,308 | 24,214,659 |
| Accumulated depreciation | (11,346,459) | (12,324,135) | (10,041,819) |
| Excess depreciation | 8,049,256 | 9,805,118 | 8,781,285 |
| Losses on unamortized lease | 198,119 | 166,451 | 154,887 |
| Advances for guaranteed residual value | (7,050,545) | (9,107,457) | (9,824,700) |
| Other assets | 19,127 | 46,599 | 44,284 |
| Total | 6,505,876 | 10,116,425 | 13,635,903 |
| (1) Guaranteed residual value of lease agreements. | |||
Leasing unrealized financial income (Income to appropriate related to Minimum payments to receive) is R$1,485,973 thousand (2010 - R$2,804,729 thousand and 2009 -R$4,563,850 thousand).
As of December 31, 2011, 2010 and 2009 there were no material agreements for lease contracts.
F-35
|
|
|
|
BANCO SANTANDER (BRASIL) S.A.
NOTES TO THE CONSOLIDATED FINANCIAL STATEMENTS FOR THE YEARS ENDED DECEMBER 31, 2011, 2010 AND 2009 |
|
|
(Amounts in thousands of Brazilian Reais - R$, unless otherwise stated) |
|
| Breakdown by maturity | |||
| Gross investment in lease transactions | |||
| Thousands of Reais | 2011 | 2010 | 2009 |
| Overdue | 214,378 | 322,851 | 339,103 |
| Due to: | |||
|
Up to 1 year |
3,728,746 | 5,207,603 | 6,330,608 |
|
From 1 to 5 years |
4,042,054 | 7,384,925 | 11,523,166 |
|
Over 5 years |
6,671 | 5,770 | 6,876 |
| Total | 7,991,849 | 12,921,149 | 18,199,753 |
| Report per lease portfolio maturity at present value | |||
| Thousands of Reais | 2011 | 2010 | 2009 |
| Overdue | 143,337 | 228,222 | 258,589 |
| Due to: | |||
|
Up to 1 year |
3,427,190 | 4,796,604 | 5,733,608 |
|
From 1 to 5 years |
2,932,795 | 5,089,299 | 7,639,674 |
|
Over 5 years |
2,554 | 2,300 | 4,032 |
| Total | 6,505,876 | 10,116,425 | 13,635,903 |
f) Transfer of financial assets with retention of risks and benefits
In December 2011, the Bank made a credit assignment with recourse amounting R$688,821 thousand, with retention of risks and benefits; this sale was not written off. The agreements and parts there of purpose of the assignment refer to real estate financing maturing up to October 2041. On December 31, 2011, the amount recorded on “Loans and advances to customers” referring to those assigned operations is R$686,587 thousand, and R$R$686,015 thousand of “Financial Liabilities Associated with the Transfer of Assets”.
The assignment operation was conducted with a co-obligation clause and the mandatory repurchase is provided for in the following events:
- agreements in default for longer than 90 consecutive days;
- agreements under renegotiation;
- agreements subject to portability, pursuant to Resolution 3,401 of the Brazilian Monetary Council (CMN);
- agreements subject to intervenience.
The amount of mandatory repurchase will be calculated based on the outstanding balance of credit duly updated on the date of said repurchase.
As of the date of assignment, the cash flows of assigned operations will be paid directly to the assigning entity.
10. Non-current assets held for sale
At December 31, 2011, 2010 and 2009, the total amount of non-current assets held for sale includes foreclosed assets and other tangible assets. The change in the "Non-current assets held for sale" is as follows:
| Thousands of Reais | 2011 | 2010 | 2009 |
| Balance at beginning of year | 167,526 | 355,285 | 291,002 |
| Foreclosures loans and other assets transferred (1) | 24,874,974 | 38,037 | 228,267 |
| Sales (1) (2) | (24,819,126) | (225,796) | (183,195) |
| Acquired companies | - | - | 19,211 |
| Final balance, gross (3) | 223,374 | 167,526 | 355,285 |
| Impairment losses | (90,986) | (100,705) | (183,821) |
| Impairment as a percentage of foreclosed assets | 40.73% | 60.11% | 51.74% |
| Balance at end of year | 132,388 | 66,821 | 171,464 |
(1) In 2011, includes R$24,731,463 thousand of assets of Santander Seguros. Additionally, were sold R$22,349,428 thousand of liabilities directly associated with non-current assets held for sale of Santander Seguros. The assets and liabilities related to the sale of Santander Seguros (note 3.a) are presents at net by cash flow statement.
(2) Includes sale of administrative buildings, and in 2010, mainly related to the move to new headquarter.
(3) Refers mainly to buildings and vehicles due to executions of loans.
F-36
|
|
|
|
BANCO SANTANDER (BRASIL) S.A.
NOTES TO THE CONSOLIDATED FINANCIAL STATEMENTS FOR THE YEARS ENDED DECEMBER 31, 2011, 2010 AND 2009 |
|
|
(Amounts in thousands of Brazilian Reais - R$, unless otherwise stated) |
|
| 11. Investments in associates | ||||||
| a) Breakdown | ||||||
| The breakdown, by company, of the balance of “Investments in associates” (see note 2-b) is as follows: | ||||||
| Thousands of Reais | Participation % | Investments | ||||
| 2011 | 2010 | 2009 | 2011 | 2010 | 2009 | |
| Norchem Holding e Negócios S.A. | 21.75% | 21.75% | 21.75% | 24,200 | 22,325 | 24,056 |
| Norchem Participações e Consultoria S.A. (1) | 50.00% | 50.00% | 50.00% | 22,528 | 28,525 | 28,918 |
| Companhia de Crédito, Financiamento e Investimento RCI Brasil (1) (6) | 39.64% | 39.58% | 39.58% | 132,514 | 106,939 | 101,303 |
| Companhia de Arrendamento Mercantil RCI Brasil (1) | 39.88% | 39.88% | 39.88% | 232,017 | 202,825 | 189,088 |
| Celta Holding S.A. (2) | - | - | 26.00% | - | - | 65,612 |
| Cibrasec - Companhia Brasileira de Securitização (2) | 13.64% | 13.64% | 13.64% | 10,287 | 9,972 | 10,145 |
| Estruturadora Brasileira de Projetos S.A. - EBP (2) | 11.11% | - | - | 679 | - | - |
| Total | 422,225 | 370,586 | 419,122 | |||
|
Results from companies accounted
for by the equity method |
||||||
| 2011 | 2010 | 2009 | ||||
| Norchem Holding e Negócios S.A. (3) | 4,074 | 1,780 | 2,870 | |||
| Norchem Participações e Consultoria S.A. (1) (3) | (2,973) | 2,432 | 1,297 | |||
| Companhia de Crédito, Financiamento e | ||||||
| Investimento RCI Brasil (1) | 25,424 | 21,025 | 16,720 | |||
| Companhia de Arrendamento Mercantil RCI Brasil (1) | 29,102 | 18,017 | 13,133 | |||
| Celta Holding S.A. (4) | - | 522 | 4,267 | |||
| ABN AMRO Brasil Dois Participações S.A. (5) | - | - | 126,442 | |||
| Companhia Brasileira de Meios de Pagamento - Visanet (5) | - | - | 115,796 | |||
| Cibrasec - Companhia Brasileira de Securitização (2) (3) | 909 | 166 | 475 | |||
| Estruturadora Brasileira de Projetos S.A. - EBP (2) (3) | (2,320) | - | - | |||
| Others (2) | - | - | 14,414 | |||
| Total | 54,216 | 43,942 | 295,414 | |||
| (1) Joint-controlled company. | ||||||
|
(2) Although the participations was less than 20%, the Bank exercises control over the entity together with other major shareholders through a shareholders' agreement where no business decision can be taken by a single shareholder. |
||||||
|
(3) Companies delayed by one month for the calculation of equity; |
||||||
|
(4) Investment sold in 2010. |
||||||
|
(5) Investment sold in 2009. |
||||||
|
(6) The new composition of the Board of Directors is in approval process in the Bacen. Participation will be changed to 39.58% after approval of the Bacen. |
||||||
|
(*) Associates companies do not have their shares listed on the Stock Exchange. |
||||||
|
(**) The Bank does not have collateral with associates. |
||||||
|
(***) The Bank does not have contingent liabilities with significant risk of possible losses related to investments in affiliates. |
||||||
| b) Changes | ||||||
| The changes in the balance of this item were as follows: | ||||||
| Thousands of Reais | 2011 | 2010 | 2009 | |||
| Balance at beginning of year | 370,586 | 419,122 | 633,595 | |||
| Capital increase | 6,107 | - | - | |||
| Additions | 2,999 | - | - | |||
| Changes in the scope of consolidation | - | - | 338,715 | |||
| Disposals and capital reductions (1) | - | (59,267) | (698,988) | |||
| Effect of equity accounting | 54,216 | 43,942 | 295,414 | |||
| Dividends received/proposed | (11,975) | (33,211) | (153,181) | |||
| Other | 292 | - | 3,567 | |||
| Balance at end of year | 422,225 | 370,586 | 419,122 | |||
(1) In 2009, the Bank made a disposal of investment of Companhia Brasileira de Meios de Pagamentos - (VisaNet), Tecban - Tecnologia Bancária S.A. and Companhia Brasileira de Soluções e Serviços - CBSS accounting a net gain of R$3,315 million recorded in Gains/losses on disposal of assets not classified as non-current asset held for sale.
c) Impairment losses
No impairment was accounted for with respect to investments in associates in 2011, 2010 and 2009.
F-37
|
|
|
|
BANCO SANTANDER (BRASIL) S.A.
NOTES TO THE CONSOLIDATED FINANCIAL STATEMENTS FOR THE YEARS ENDED DECEMBER 31, 2011, 2010 AND 2009 |
|
|
(Amounts in thousands of Brazilian Reais - R$, unless otherwise stated) |
|
| d) Other disclosures | |||
| Following is a summary of the financial information on the associates (obtained from the information available at the reporting date). | |||
| Thousands of Reais | 2011 | 2010 | 2009 |
| Total assets | 6,344,404 | 3,786,154 | 6,040,977 |
| Total liabilities | 5,190,461 | 2,721,128 | 5,087,708 |
| Total revenues | 1,389,839 | 1,087,588 | 605,491 |
| Total profit | 156,549 | 134,577 | 101,906 |
12. Tangible assets
Tangible assets of the Bank relate to property, plant and equipment for own use. The Bank does not have tangible assets held as investment property nor leased out under operating leases. The Bank is also not a part of any financial lease contracts as of and during fiscal years ended December 31, 2011, 2010 and 2009.
The detail, by class of asset, of the tangible assets in the consolidated balance sheets is as follows:
| Thousands of Reais | Cost |
Accumulated
Depreciation |
Impairment
Losses |
Net Balance |
| Land and buildings | 2,098,622 | (220,186) | (86,053) | 1,792,383 |
| IT equipment and fixtures | 1,233,776 | (747,826) | - | 485,950 |
| Furniture and vehicles | 2,068,058 | (644,622) | - | 1,423,436 |
| Balance at December 31, 2009 | 5,400,456 | (1,612,634) | (86,053) | 3,701,769 |
| Land and buildings | 2,226,175 | (269,553) | (61,304) | 1,895,318 |
| IT equipment and fixtures | 1,317,006 | (852,129) | - | 464,877 |
| Furniture and vehicles | 3,000,988 | (844,337) | - | 2,156,651 |
| Works in progress and others | 1,263 | - | - | 1,263 |
| Balance at December 31, 2010 | 6,545,432 | (1,966,019) | (61,304) | 4,518,109 |
| Land and buildings | 2,409,478 | (311,518) | (51,348) | 2,046,612 |
| IT equipment and fixtures | 1,529,811 | (999,913) | - | 529,899 |
| Furniture and vehicles | 3,586,082 | (1,157,120) | - | 2,428,962 |
| Works in progress and others | 2,833 | - | - | 2,833 |
| Balance at December 31, 2011 | 7,528,204 | (2,468,550) | (51,348) | 5,008,306 |
| Changes | ||||
| The changes in “Tangible assets” in the consolidated balance sheets were as follows: | ||||
| Thousands of Reais | 2011 | 2010 | 2009 | |
| Cost: | ||||
| Balance at beginning of the year | 4,518,109 | 3,701,769 | 3,829,074 | |
| Changes in the scope of consolidation (note 3) | (1,727) | - | 4,072 | |
| Additions | 1,074,509 | 1,319,869 | 1,815,803 | |
| Write-off | (22,102) | (15,356) | (1,552,876) | |
| Depreciation | (570,132) | (487,626) | (447,138) | |
| Impairment losses | 9,642 | 1,317 | 4,566 | |
| Other net items | 7 | (1,864) | 48,268 | |
| Balance at end of the year | 5,008,306 | 4,518,109 | 3,701,769 | |
The depreciation expenses has been included in the line item “Depreciation and amortization” in the income statement.
13. Intangible assets - Goodwill
The goodwill recorded is subject to impairment test at least annually or in a short period, whenever there are indications of impairment and was allocated according to the operating segments (note 42).
The base used to evaluate the impairment test is the value in use, for this purpose, management estimates cash flow that is subject to several factors, including: (i) macro-economic projections of interest rates, inflation, exchange rate and other, (ii) the conduct and growth estimates (iii) increased costs, returns, synergies and investment plan, (iv) the behavior of customers, and (v) growth rate and adjustments applied to flows in perpetuity. The adoption of these estimates involves the likelihood of future events and changing some of these factors could have a different result.
F-38
|
|
|
|
BANCO SANTANDER (BRASIL) S.A.
NOTES TO THE CONSOLIDATED FINANCIAL STATEMENTS FOR THE YEARS ENDED DECEMBER 31, 2011, 2010 AND 2009 |
|
|
(Amounts in thousands of Brazilian Reais - R$, unless otherwise stated) |
|
| Based on the assumptions described above the tests carried out did not identify any impairment to goodwill in 2011, 2010 e 2009. | ||||
| Thousands of Reais | 2011 | 2010 | 2009 | |
| Breakdown: | ||||
| Banco ABN Amro Real S.A. | 27,217,565 | 27,217,565 | 27,217,565 | |
| Real Seguros Vida e Previdência (3) | - | 1,094,671 | 1,094,671 | |
| Total | 27,217,565 | 28,312,236 | 28,312,236 | |
| Operating segments: | ||||
| Commercial Banking | 27,217,565 | 27,217,565 | 27,217,565 | |
| Asset Management and Insurance | - | 1,094,671 | 1,094,671 | |
| Total | 27,217,565 | 28,312,236 | 28,312,236 | |
| Commercial Banking |
Asset
Management and Insurance (3) |
|||
| 2011 | 2010 | 2009 | 2010 | |
| Main assumptions: | ||||
| Basis of valuation | Value in use: cash flows | |||
| Period of the projections of cash flows (1) | 10 years | 10 years | 3 years | 7 years |
| Growth rate | 5.0% | 5.0% | 4.5% | 5.0% |
| Discount rate (2) | 15.2% | 15.5% | 15.2% | 16.7% |
| (1) The projections of cash flow are prepared using internal budget and growth plans of the administration, based on historical data, market expectations and conditions such as industry growth, interest hate and inflation. | ||||
| (2) The discount rate is calculated based on the capital asset pricing model (CAPM). | ||||
(3) In 2011, the amount of Real Seguros Vida and Previdência was redeemed based on the process of the sale of the Santander Seguros (note 3.a). In 2009, due to the merger of shares of Santander Seguros completed later this year and the result of calculating the economic value assessment made recently, the Bank has not detected and therefore not recognized losses for non-recovery of value (impairment).
| Sensitivity test was carried out of the main premises, reasonable possible change, and was not identified any impairment to goodwill. | |||
| The changes of goodwill in December, 31 2011, 2010 and 2009 were as follows: | |||
| Thousands of Reais | 2011 | 2010 | 2009 |
| Balance at beginning of the year | 28,312,236 | 28,312,236 | 27,488,426 |
|
Acquisitions: |
|||
|
Banco ABN Amro Real S.A. (1) |
- | - | 124,684 |
|
Real Seguros Vida e Previdência |
- | - | 1,094,671 |
|
Disposals: |
|||
|
Banco ABN Amro Real S.A. (2) |
- | - | (395,545) |
|
Real Seguros Vida e Previdência (3) |
(1,094,671) | - | - |
| Balance at end of the year | 27,217,565 | 28,312,236 | 28,312,236 |
(1) In 2009 includes the adjusted amount of R$124,684 thousand, related to fair value´s final determination, as allowed by IFRS 3.
(2) In 2009, includes the partial write-off of the goodwill on investments on ABN Amro Brasil Dois Participações S.A. and Companhia Brasileira de Meios de Pagamento - Visanet.
(3) In 2011, includes the write-off of the goodwill related to Real Seguros Vida e Previdência, due the sale of the all shares of Santander Seguros (note 3.a).
F-39
|
|
|
|
BANCO SANTANDER (BRASIL) S.A.
NOTES TO THE CONSOLIDATED FINANCIAL STATEMENTS FOR THE YEARS ENDED DECEMBER 31, 2011, 2010 AND 2009 |
|
|
(Amounts in thousands of Brazilian Reais - R$, unless otherwise stated) |
|
| 14. Intangible assets - Other intangible assets | |||||
| a) Breakdown | |||||
| The details by asset category of the "other intangible assets" of the consolidated balance sheets are as follow: | |||||
| Thousands of Reais |
Estimated
Useful Life |
Cost |
Accumulated
Depreciation |
Impairment
Losses (1) |
Net Balance |
| IT developments | 3 years | 1,711,000 | (655,186) | (65,046) | 990,768 |
| Customer relationship | (2) | 4,288,031 | (1,468,512) | (742,101) | 2,077,418 |
| Other assets | Up to 5 years | 237,517 | - | - | 237,517 |
| Balance at December 31, 2009 | 6,236,548 | (2,123,698) | (807,147) | 3,305,703 | |
| IT developments | 3 years | 2,405,493 | (782,054) | (64,695) | 1,558,744 |
| Customer relationship | (2) | 4,616,136 | (2,033,146) | (740,748) | 1,842,242 |
| Other assets | Up to 5 years | 249,397 | - | - | 249,397 |
| Balance at December 31, 2010 | 7,271,026 | (2,815,200) | (805,443) | 3,650,383 | |
| IT developments | 3 years | 2,981,909 | (985,676) | (335) | 1,995,898 |
| Customer relationship | (2) | 4,514,257 | (1,874,746) | (623,392) | 2,016,119 |
| Other assets | Up to 5 years | 205,498 | - | - | 205,498 |
| Balance at December 31, 2011 | 7,701,664 | (2,860,422) | (623,727) | 4,217,515 | |
(1) Includes impairment loss of the asset recorded for the purchase of the payroll of public entities. This loss was recognized due to: (i) change in the law of the portability of the current account that allowed customers to choose the bank which they want to receive their salaries, (ii) reduction on the market value of payrolls And (iii) contracts termination history.
(2) Includes accrued payments related to the commercial partnership contracts with the private and public sectors to secure exclusivity for banking services of payroll credit processing and payroll loans, maintenance of collection portfolio, supplier payment services and other banking services. Banco Real’s customer relationship is amortized in 10 years and exclusivity contracts for provision of banking services are amortized over the term of the respective agreements.
| b) The changes in “Other intangible assets” were as follows: | |||
| Thousands of Reais | 2011 | 2010 | 2009 |
| Balance at beginning of year | 3,650,383 | 3,305,703 | 3,506,861 |
| Change in the scope of consolidation (note 3.a) | (2,754) | - | 8,296 |
| Additions/Disposals | 1,478,802 | 1,086,208 | 1,466,411 |
| Amortization | (891,902) | (749,784) | (801,474) |
| Impairment losses (1) | (17,070) | (813) | (859,216) |
| Other net changes | 56 | 9,069 | (15,175) |
| Balance at end of year | 4,217,515 | 3,650,383 | 3,305,703 |
|
(1) In 2009, includes a provision for impairment losses over the purchase of contracts for providing banking services in the amount of R$818,843 thousand. This impairment was recognized due to: (i) change in the Law of the portability of current accounts which allowed customers to choose the bank which they want to receive their salaries; (ii) reduction on the market value of contracts for provision of banking services; and (iii) the contracts termination experience. |
|||
| The amortization expenses has been included in the line item “Depreciation and amortization” in the income statement. | |||
| 15. Other assets | |||
| The breakdown of the balance of “Other assets” is as follows: | |||
| Thousands of Reais | 2011 | 2010 | 2009 |
| Prepayments and accrued income | 641,098 | 870,276 | 1,059,738 |
| Contractual guarantees of former controlling stockholders (Note 22.d iv) | 992,687 | - | - |
| Actuarial asset (Note 22.b) | 86,751 | - | - |
| Other receivables | 966,207 | 1,042,725 | 811,699 |
| Total | 2,686,743 | 1,913,001 | 1,871,437 |
F-40
|
|
|
|
BANCO SANTANDER (BRASIL) S.A.
NOTES TO THE CONSOLIDATED FINANCIAL STATEMENTS FOR THE YEARS ENDED DECEMBER 31, 2011, 2010 AND 2009 |
|
|
(Amounts in thousands of Brazilian Reais - R$, unless otherwise stated) |
|
| 16. Deposits from the Brazilian Central Bank and Deposits from credit institutions | |||
| The breakdown, by classification, type and currency, of the balances of these items is as follows: | |||
| Thousands of Reais | 2011 | 2010 | 2009 |
| Classification: | |||
| Other financial liabilities at fair value through profit or loss | - | - | 1,795 |
| Financial liabilities at amortized cost | 51,527,021 | 42,391,572 | 21,195,959 |
| Total | 51,527,021 | 42,391,572 | 21,197,754 |
| Type: | |||
| Demand deposits (1) | 133,567 | 344,072 | 195,081 |
| Time deposits (2) | 27,022,696 | 28,867,406 | 20,838,179 |
| Repurchase agreements | 24,370,758 | 13,180,094 | 164,494 |
| Total | 51,527,021 | 42,391,572 | 21,197,754 |
| Currency: | |||
| Reais | 33,811,322 | 26,794,663 | 10,706,908 |
| Euro | 437,811 | 307,022 | 236,572 |
| US dollar | 15,141,075 | 14,065,828 | 10,004,349 |
| Other currencies | 2,136,183 | 1,224,059 | 249,925 |
| Total | 51,527,021 | 42,391,572 | 21,197,754 |
| (1) Non-interest bearing accounts. | |||
| (2) It includes the operation with credit institution arising from export and import financing lines, BNDES and Finame on-lending and abroad and other credit lines abroad. | |||
| Note 41-d contains a detail of the residual maturity periods of financial liabilities at amortized cost and of the related average interest rates. | |||
| 17. Customer deposits | |||
| The breakdown, by classification and type, of the balance of “Customer deposits” is as follows: | |||
| Thousands of Reais | 2011 | 2010 | 2009 |
| Classification: | |||
| Financial liabilities at amortized cost | 174,473,891 | 167,949,201 | 149,440,156 |
| Total | 174,473,891 | 167,949,201 | 149,440,156 |
| Type: | |||
| Demand deposits | |||
|
Current accounts (1) |
13,561,003 | 16,131,836 | 15,139,942 |
|
Savings accounts |
23,293,434 | 30,303,463 | 25,216,924 |
| Time deposits | 83,941,820 | 68,916,301 | 74,633,544 |
| Repurchase agreements | 53,677,634 | 52,597,601 | 34,449,746 |
| Total | 174,473,891 | 167,949,201 | 149,440,156 |
| (1) Non-interest bearing accounts. | |||
| Note 41-d contains a detail of the residual maturity periods of financial liabilities at amortized cost and of the related average interest rates. | |||
| 18. Marketable debt securities | |||
| The breakdown, by classification and type, of the balance of “Marketable debt securities” is as follows: | |||
| Thousands of Reais | 2011 | 2010 | 2009 |
| Classification: | |||
| Financial liabilities at amortized cost | 38,590,423 | 20,086,645 | 11,439,010 |
| Total | 38,590,423 | 20,086,645 | 11,439,010 |
| Type: | |||
| Real estate credit notes - LCI | 8,550,108 | 7,614,891 | 5,985,385 |
| Bonds and other securities | 6,539,765 | 3,351,137 | 2,850,777 |
| Treasury Bills (1) | 19,926,031 | 6,638,936 | - |
| Securitization notes (MT100) (2) | 2,152,543 | 1,577,181 | 1,371,588 |
| Agribusiness credit notes - LCA | 1,341,232 | 904,500 | 1,231,260 |
| Debenture (3) | 80,744 | - | - |
| Total | 38,590,423 | 20,086,645 | 11,439,010 |
(1) In 2010, National Monetary Council (CMN) allowed financial institutions to issue Treasury Bills. This instrument can be used to expand the long-term financing market; its main features are: minimum term of two years, minimum notional amount of R$300 thousand and only 5% of the issued amount may be early redeemed by the issuer. On December 31, 2011, have a maturity between 2012 to 2016.
(2) Issuance of bonds tied to the right to receive of future flow of payment orders receivable from foreign correspondent banks.
(3) Debentures issued with remuneration indexed CDI + 1.77%p.a. interest rate and maturity November 21, 2012, issued by subsidiaries MS Participações Societárias S.A.
F-41
|
|
|
|
BANCO SANTANDER (BRASIL) S.A.
NOTES TO THE CONSOLIDATED FINANCIAL STATEMENTS FOR THE YEARS ENDED DECEMBER 31, 2011, 2010 AND 2009 |
|
|
(Amounts in thousands of Brazilian Reais - R$, unless otherwise stated) |
|
| The breakdown, by currency, of the balance of this account is as follows: | ||||||
| Thousands of Reais | Average interest (%) | |||||
| Currency: | 2011 | 2010 | 2009 | 2011 | 2010 | 2009 |
| Reais | 32,681,252 | 16,174,057 | 9,718,114 | 10.2% | 10.5% | 9.0% |
| US dollar | 5,608,368 | 3,905,890 | 1,671,530 | 3.8% | 2.4% | 3.3% |
| Swiss Francs | 300.803 | - | - | 3.0% | - | - |
| Euro | - | 6,698 | 49,366 | - | 0.3% | 0.4% |
| Total | 38,590,423 | 20,086,645 | 11,439,010 | 8.8% | 10.4% | 7.9% |
| The changes in the balance of Marketable debt instruments were as follows: | ||||||
| Thousands of Reais | 2011 | 2010 | 2009 | |||
| Balance at beginning of the period | 20,086,645 | 11,439,010 | 12,085,655 | |||
| Issues | 29,501,246 | 21,402,252 | 14,746,518 | |||
| Payments | (14,895,052) | (12,828,958) | (16,080,145) | |||
| Interest (Note 30) | 3,226,644 | 1,212,962 | 1,047,750 | |||
| Exchange differences and Others | 670,940 | (1,138,621) | (360,768) | |||
| Balance at end of the period | 38,590,423 | 20,086,645 | 11,439,010 | |||
At December 31, 2011, 2010 and 2009, none of these issues was convertible into Bank shares or granted privileges or rights which, in certain circumstances, make them convertible into shares.
| Issuance | Maturity | Currency |
Interest rate
(p.a) |
2011 | 2010 | 2009 | |
| Eurobonds | March-11 | March-14 | R$ | Libor + 2.1% | 2,252,536 | - | - |
| Eurobonds |
April and
November-10 |
April-15 | US$ | 4.5% | 1,617,341 | 1,447,210 | - |
| Eurobonds |
January and
June-11 |
January-16 | US$ | 4.3% | 1,608,424 | - | - |
| Eurobonds | November-05 | November-13 | R$ | 17.1% | 333,182 | 471,849 | 471,849 |
| Eurobonds | June-11 | December-14 | CHF$ (2) | 3.1% | 300,803 | - | - |
| Eurobonds | December-10 | December-11 | US$ | Zero Cupom | - | 730,948 | - |
| Eurobonds | March-05 | March-13 | R$ | 17.0% | 169,223 | 169,299 | 169,299 |
| Eurobonds | December-11 | January-12 | US$ | Zero Cupom | 73,017 | - | - |
| Eurobonds (1) | June-07 | May-17 | R$ | FDIC | 28,196 | 31,347 | 25,676 |
| Eurobonds | February-05 | February-10 | R$ | 16.2% | - | - | 803,154 |
| Structured notes | April-09 | April-10 | R$ | 102.5% CDI | - | - | 179,494 |
| Others | 157,043 | 500,484 | 1,201,305 | ||||
| Total | 6,539,765 | 3,351,137 | 2,850,777 | ||||
| (1) Indexed to Credit Event Notes. | |||||||
| (2) Swiss Francs. | |||||||
| The composition of "securitization notes - MT100" is as follows: | |||||||
| Issuance | Maturity | Currency |
Interest rate
(p.a) |
2011 | 2010 | 2009 | |
| Series 2004-1 (1) | September-04 | September-11 | US$ | 5.5% | - | 33,457 | 334,070 |
| Series 2008-1 (1) | May-08 | March-15 | US$ | 6.2% | 265,203 | 294,133 | 336,599 |
| Series 2008-2 (1) (2) | August-08 | September-17 | US$ | Libor (6 months) + 0.8% | 753,126 | 668,916 | 524,595 |
| Series 2009-1 (1) (3) | August-09 | September-14 | US$ | Libor (6 months) + 2.1% | 94,494 | 83,924 | 87,752 |
| Series 2009-2 (1) (4) | August-09 | September-19 | US$ | 6.3% | 95,435 | 84,771 | 88,572 |
| Series 2010-1 (1) (5) | December-10 | March-16 | US$ | Libor (6 months) + 1.5% | 471,594 | 411,980 | - |
| Series 2011-1 (1) (6) | May-11 | March-18 | US$ | 4.2% | 189,790 | - | - |
| Series 2011-2 (1) (7) | May-11 | March-16 | US$ | Libor (6 months) + 1.4% | 282,901 | - | - |
| Total | 2,152,543 | 1,577,181 | 1,371,588 | ||||
| (1) With charges payable semiannually. | |||||||
|
(2) Principal is payable in 6 semiannual installments from March, 2015 (the period of this series was extended by three years in August, 2011). |
|||||||
| (3) The principal will be paid semiannually in 6 installments from March 2012. | |||||||
| (4) The principal will be paid semiannually in 14 installments from March 2013. | |||||||
| (5) The principal will be paid semiannually in 7 installments from March 2013. | |||||||
| (6) The principal will be paid semiannually in 9 installments from March 2014. | |||||||
| (7) The principal will be paid semiannually in 5 installments from March 2014. | |||||||
F-42
|
|
|
|
BANCO SANTANDER (BRASIL) S.A.
NOTES TO THE CONSOLIDATED FINANCIAL STATEMENTS FOR THE YEARS ENDED DECEMBER 31, 2011, 2010 AND 2009 |
|
|
(Amounts in thousands of Brazilian Reais - R$, unless otherwise stated) |
|
| 19. Subordinated liabilities | |||||||
| The detail of the balance of “Subordinated liabilities” is as follows: | |||||||
| Thousands of Reais | |||||||
| Issuance | Maturity (1) |
Amount
(millions) |
Interest rate | 2011 | 2010 | 2009 | |
| Subordinated Certificates | June-06 | July-16 | R$1.500 | 105.0% CDI | 2,801,102 | 2,495,990 | 2,263,856 |
| Subordinated Certificates (4) (6) | March-09 | March-19 | R$1.507 | 13,8% | - | - | 1,667,219 |
| Subordinated Certificates | R$850 | 104.5% CDI | 1,516,018 | 1,351,627 | 1,226,492 | ||
| October-06 | September-16 | ||||||
| Subordinated Certificates | July-07 | July-14 | R$885 | 104.5% CDI | 1,427,982 | 1,273,137 | 1,155,269 |
| Perpetual Bonds (5)(6) | September-05 | Indeterminate | US$500 | 8,7% | - | - | 870,259 |
| 100.0% CDI + | |||||||
| Subordinated Certificates | April-08 | April-13 | R$600 | 1.3% | 920,870 | 814,922 | 733,444 |
| 100.0% CDI + | |||||||
| Subordinated Certificates | April-08 | April-13 | R$555 | 1.0% | 848,876 | 753,066 | 679,443 |
| July-06 to | July-16 to July- | ||||||
| Subordinated Certificates | October-06 | 18 | R$447 | 104.5% CDI | 822,956 | 733,718 | 665,790 |
| Subordinated Certificates | January-07 | January-13 | R$300 | 104.0% CDI | 516,217 | 460,494 | 418,055 |
| 100.0% CDI + | |||||||
| Subordinated Certificates | August-07 | August-13 | R$300 | 0.4% | 482,026 | 430,041 | 390,192 |
| Subordinated Certificates | January-07 | January-14 | R$250 | 104.5% CDI | 431,194 | 384,437 | 348,846 |
| May-08 to | May-13 to May- | ||||||
| Subordinated Certificates | June-08 | 18 | R$283 | CDI (2) | 422,628 | 374,705 | 338,366 |
| May-08 to | May-13 to | ||||||
| Subordinated Certificates | June-08 | June-18 | R$268 | IPCA (3) | 431,919 | 372,952 | 325,676 |
| Subordinated Certificates (1) | R$100 | 120.5% CDI | 146,183 | 128,062 | 114,490 | ||
| November-08 | November-14 | ||||||
| Subordinated Certificates (1) | February-08 | February-13 | R$85 | IPCA +7.9% | 140,373 | 121,954 | 107,048 |
| Total | 10,908,344 | 9,695,105 | 11,304,445 | ||||
(1) Subordinated certificates of deposit issued by Banco Santander S.A. with yield paid at the end of the term together with the principal.
(2) Indexed to 109% and 112% of the CDI or CDI plus interest of 1.16% p.a. to 1.53% p.a.
(3) Indexed to the IPCA (extended consumer price index) plus interest of 8.28% p.a. to 8.65% p.a.
(4) On January 22, 2010, the Bank redeemed in advance the Subordinate CDB (bank certificate of deposit), whose creditor was Banco Santander Spain, pursuant to authorization granted by the Central Bank of Brazil on January 8, 2010. In addition, in the redeemed of the Subordinate CDB, it was established a discount of R$ 64,188 thousand accounted in "Gains/losses on financial assets and liabilities".
(5) On September 20, 2010, was redeemed in advance the Perpetual Bonds, issued by the Grand Cayman branch pursuant to authorization by the Bacen in August 4, 2010.
(6) The purpose of the anticipated redemption was to improve the funding structure of the Bank, accordingly to the strategy informed in the use of proceeds of the "Final Global Offering Prospect for the Initial Public Offering of Certificates of Deposit Shares (Units) Issuance of Banco Santander (Brasil) S.A" and Form F-1.
| The detail by currency, of the balance of “Subordinated liabilities” is as follows: | ||||||
| Thousands of Reais | Average Interest Rate (%) | |||||
| Currency: | 2011 | 2010 | 2009 | 2011 | 2010 | 2009 |
| Reais | 10,908,344 | 9,695,105 | 10,434,186 | 11.2% | 10.9% | 9.7% |
| US Dollar | - | - | 870,259 | - | - | 8.7% |
| Total | 10,908,344 | 9,695,105 | 11,304,445 | 11.2% | 10.9% | 9.7% |
| The changes in “Subordinated liabilities” were as follows: | ||||||
| 2011 | 2010 | 2009 | ||||
| Balance at beginning of year | 9,695,105 | 11,304,445 | 9,197,429 | |||
| Issues | - | - | 1,507,000 | |||
|
Subordinated Certificates (maturity in May 2019 and 13.5% fixed interest rate) |
- | - | 1,507,000 | |||
| Payments | - | (2,598,938) | (159,905) | |||
|
Redemption |
||||||
|
Subordinated Certificates (maturity in May 2019 and 13.5% fixed interest rate) |
- | (1,680,461) | - | |||
|
Perpetual Non-Cumulative Junior Subordinated Securities (indeterminate maturity 8.7% fixed interest rate and amount of issuance U$500 million) |
- | (879,294) | - | |||
|
Interest payments |
- | (39,183) | (159,905) | |||
| Interest (Note 30) | 1,213,239 | 999,423 | 1,076,557 | |||
| Foreign exchange | - | (9,825) | (316,636) | |||
| Balance at end of year | 10,908,344 | 9,695,105 | 11,304,445 | |||
Note 41-d contains a detail of the residual maturity periods of subordinated liabilities at each year-end and of the related average interest rates in each year.
F-43
|
|
|
|
BANCO SANTANDER (BRASIL) S.A.
NOTES TO THE CONSOLIDATED FINANCIAL STATEMENTS FOR THE YEARS ENDED DECEMBER 31, 2011, 2010 AND 2009 |
|
|
(Amounts in thousands of Brazilian Reais - R$, unless otherwise stated) |
|
| 20. Other financial liabilities | ||||||
| The breakdown of the balances of these items is as follows: | ||||||
| Thousands of Reais | 2011 | 2010 | 2009 | |||
| Credit card obligations | 11,000,043 | 7,332,714 | 5,293,202 | |||
| Unsettled financial transactions | 1,914,897 | 2,370,678 | 2,060,835 | |||
| Dividends payable | 1,182,284 | 2,166,714 | 1,623,885 | |||
| Tax collection accounts - Tax payables | 579,413 | 621,510 | 482,544 | |||
| Liability associated with the transfer of assets (Note 9.f) | 686,015 | - | - | |||
| Other financial liabilities | 589,355 | 726,632 | 727,698 | |||
| Total | 15,952,007 | 13,218,248 | 10,188,164 | |||
|
|
||||||
| 21. Liabilities for insurance contracts | ||||||
| In 2010 and 2009 consisted mainly of technical provisions - Individual Life and Life covering survival (note 3.a). | ||||||
| 22. Provisions | ||||||
| a) Breakdown | ||||||
| The breakdown of the balance of “Provisions” is as follows: | ||||||
| Thousands of Reais | 2011 | 2010 | 2009 | |||
| Provisions for pensions and similar obligations | 1,246,040 | 1,190,108 | 1,096,799 | |||
| Provisions for judicial and administrative proceedings, commits and other provisions | 8,269,255 | 8,205,053 | 8,383,463 | |||
|
Of which: |
||||||
|
Provisions for judicial and administrative proceedings, commitments and other provisions (1) |
7,276,568 | 8,205,053 | 8,383,463 | |||
|
Provisions for judicial and administrative proceedings under the responsibility of former controlling stockholders (note 22.d iv) |
992,687 | - | - | |||
| Total | 9,515,295 | 9,395,161 | 9,480,262 | |||
| (1) Includes mainly provisions for taxes and others legal, civil and labor contingencies. | ||||||
|
|
||||||
| b) Changes | ||||||
| The changes in “Provisions” were as follows: | ||||||
| Thousands of Reais | 2011 | 2010 | ||||
| Pensions |
Other
Provisions (1) |
Total | Pensions |
Other
Provisions (1) |
Total | |
| Balance at beginning of year | 1,190,108 | 8,205,053 | 9,395,161 | 1,096,799 | 8,383,463 | 9,480,262 |
| Net change in the scope of consolidation (Note 3.a) | - | (127,419) | (127,419) | - | - | - |
| Additions charged to income: | ||||||
| Interest income and similar charges (Note 29) | (55,103) | - | (55,103) | - | - | - |
| Interest expense and similar charges (Note 30) | 145,181 | - | 145,181 | 156,419 | - | 156,419 |
| Personnel Expenses (Note 37.a & 22.d) | 19,460 | - | 19,460 | 16,212 | - | 16,212 |
| Additions to provisions (2) | 118,502 | 2,942,961 | 3,061,463 | 179,265 | 1,795,061 | 1,974,326 |
| Payments to pensioners and early retirees with a charge to internal provisions | (39,596) | - | (39,596) | (38,200) | - | (38,200) |
| Payments to external funds | (219,263) | - | (219,263) | (220,387) | - | (220,387) |
| Amount used | - | (2,672,142) | (2,672,142) | - | (2,233,557) | (2,233,557) |
| Transfer to other assets - actuarial assets (Note 15) | 86,751 | - | 86,751 | - | - | - |
| Transfers, exchange differences and other changes | - | (79,198) | (79,198) | - | 260,086 | 260,086 |
| Balance at end of year | 1,246,040 | 8,269,255 | 9,515,295 | 1,190,108 | 8,205,053 | 9,395,161 |
F-44
|
|
|
|
BANCO SANTANDER (BRASIL) S.A.
NOTES TO THE CONSOLIDATED FINANCIAL STATEMENTS FOR THE YEARS ENDED DECEMBER 31, 2011, 2010 AND 2009 |
|
|
(Amounts in thousands of Brazilian Reais - R$, unless otherwise stated) |
|
| Thousands of Reais | 2009 | ||
| Pensions |
Other
Provisions (1) |
Total | |
| Balance at beginning of year | 1,078,916 | 7,836,329 | 8,915,245 |
| Net change in the scope of consolidation | - | 96,459 | 96,459 |
| Additions charged to income: | |||
| Interest expense and similar charges (Note 30) | 100,567 | - | 100,567 |
| Personnel Expenses (Note 37.a & 22.d) | 36,534 | - | 36,534 |
| Additions to provisions | 43,464 | 3,437,229 | 3,480,693 |
| Payments to pensioners and early retirees with a charge to internal provisions | (35,752) | - | (35,752) |
| Payments to external funds | (130,095) | - | (130,095) |
| Amount used (3) | - | (2,726,181) | (2,726,181) |
| Transfers, exchange differences and other changes | 3,165 | (260,373) | (257,208) |
| Balance at end of year | 1,096,799 | 8,383,463 | 9,480,262 |
(1) Includes, primarily, legal obligations, tax and social security, labor and civil contingencies.
(3) In 2009, includes payment for the adhesion to the program of installments and payment of tax, debts and social security established by Law 11,941/2009. The main processes included in this program were: (i) Deductibility of CSLL, in which the Conglomerate Santander's entities were claiming the deduction of CSLL in the calculation of IRPJ. (ii) CSLL equal tax treatment lawsuit filed by several companies of the Conglomerate Santander's entities challenging the application of an increased CSLL rate (18% - 30%) for financial institutions as compared to the rate for non-financial companies (8% - 10%) and (iii) Concurrency IRPJ, in which ABN Leasing intended to reconcile for income tax depreciation expense in the same period of leasing revenue recognition. Considering the regulations established in this Law, the accounting effects in the case of processes including tax and social security in the form of cash payments were recorded at the time of joining the program.
c) Provisions for pensions and similar obligations
The Banco Santander and its subsidiaries sponsor private pension entities and plans exclusive to employees and former employees, pension funds and cash assistance with the purpose of providing retirement and pension benefits that supplement those provided by the government, as defined in the basic regulations of each plan.
• Banesprev - Fundo Banespa de Seguridade Social (Banesprev)
- defined benefit plan fully defrayed by Banco Santander, covers employees hired after May 22, 1975 called Participants Recipients, and those hired until May 22, 1975 called Participants Aggregates, who are also entitled to death benefits. Plan is closed to new entrants since March 28, 2005.
- Plan II: defined benefit plan, constituted from July 27, 1994, effective of the new text of the Statute and Regulations of the Basic Plan II, Plan I participants who chose the new plan began to contribute to the rate of 44.9% stipulated by the actuary for funding each year. Plan is closed to new entrants since June 3, 2005.
- Plan V: defined benefit plan fully defrayed by Banco Santander, covers employees hired until after May 22, 1975.
- Supplemental Pension Plan: defined benefit plan was created in view of the privatization of Banespa and is managed by Banesprev and offered only to employees hired before May 22, 1975, this Plan effective January 1, 2000. Plan is closed to new entrants since April 28, 2000.
- Plan III: variable contribution plan, for employees hired after May 22,1975, previously served by the Plans I and II. Under this plan contributions are made by the sponsor and the participants. The benefits are in the form of defined contribution during the period of contribution and defined benefit during the receipt of benefit, if paid as monthly income for life.
- Plan IV: variable contribution plan, designed for employees hired as of November 27, 2000, in which the sponsor only contributes to the risk benefits and administrative expenses. In this plan the benefit is set in the form of defined contribution during the period of contribution and defined benefit during the receipt of benefits in the form of monthly income for life, in whole or in part of the benefit. The risk benefits of the plan are in the form of defined benefit. Plan is closed to new entrants since July 23, 2010.
• Sanprev - Santander Associação de Previdência (Sanprev)
- Plan I: defined benefit plan, established on September 27, 1979, covering employees of the sponsor enrolled in the plan and is in process of termination since June 30, 1996.
- Plan II: plan that provides insurance risk, pension supplement temporary, disability retirement annuity and the supplemental death and sickness allowance and birth, including employees enrolled in the plan sponsor and is funded solely by sponsors through monthly contributions, as indicated by the actuary. Plan is closed to new entrants since March 10, 2010.
- Plan III: variable contribution plan covering employees of the sponsors who made the choice to contribute, by contributing freely chosen by participants from 2% of salary contribution. That the benefit plan is a defined contribution during the contribution and defined benefit during the receipt of the benefit, being in the form of monthly income for life, in whole or in part of the benefit. Plan is closed to new entrants since March 10, 2010.
• Bandeprev - Bandepe Previdência Social (Bandeprev)
Defined benefit plan, sponsored by Banco Bandepe and Banco Santander, managed by Bandeprev. The plans are divided into basic plan and special retirement supplement plan, with different eligibility requirements, contributions and benefits by subgroups of participants. Both plans are closed to new entrants.
F-45
|
|
|
|
BANCO SANTANDER (BRASIL) S.A.
NOTES TO THE CONSOLIDATED FINANCIAL STATEMENTS FOR THE YEARS ENDED DECEMBER 31, 2011, 2010 AND 2009 |
|
|
(Amounts in thousands of Brazilian Reais - R$, unless otherwise stated) |
|
• Other plans
SantanderPrevi - Sociedade de Previdência Privada (SantanderPrevi): defined contribution plan, which was redesigned since June 2009, with shared contribution between employee and company. SantanderPrevi is a private pension entity engaged in providing social security benefit plans which are supplementary to the government social security plan, in accordance with prevailing legislation.
Fundação América do Sul de Assistência e Seguridade Social (Fasass): In July, 2009, after the approval of the Supplementary Pension Plan Secretariat (SPC), the individual reserves of defined benefit and variable contribution private pension plans, under the responsibility of Fasass, were transferred to the private pension plan company which is not a member of the Santander Group. The purpose of this operation is to offer to the assisted members and beneficiaries the option of receiving a benefit equivalent to that of the PGBL (pension plan similar to a life insurance), in view of the cancellation of the sponsorship by the Bank, approved by SPC on February 27, 2009. For the members who joined the new plans (PGBLs), Banco Santander transferred R$26,963 thousand, to form the Mathematical Reserve for Benefits Granted.
Previban - Previdência Privada Paraiban (Previban): In March de 2009, the withdrawal of Previban sponsoring was completed with the settlement of R$213 thousand in actuarial obligations.
Banco Santander and subsidiary companies are the sponsor of the welfare plans, supplemental retirement plan and of pension plans for associated employees, structured as defined benefit plans.
ii. Actuarial Techniques
The amount of the defined benefit obligations was determined by independent actuaries using the following actuarial techniques:
• Valuation method:
Projected unit credit method, which sees each year of service as giving rise to an additional unit of benefit entitlement and measures each unit separately.
• Nominal discount rate for actuarial obligation:
- Banesprev, Sanprev, SantanderPrevi, Bandeprev and Other Plans - 10.4% (2010 - 10.7% and 2009 - 11.1%).
• Expected rate of return on plan assets:
- Banesprev - Plan I - 10.9% (2010 - 11.3% and 2009 -12.1%).
- Banesprev - Plan II - 12.4% (2010 - 11.1% and 2009 -12.5%).
- Banesprev - Plan III - 12.4% (2010 - 11.3% and 2009 -12.5%).
- Banesprev - Plan IV - 10.7% (2010 - 12.2% and 2009 -10.6%).
- Banesprev - Supplementary retirement and pension plan - 10.7% (2010 - 11.4% and 2009 -11.1%).
- Banesprev - Plan V - 10.7% (2010 - 11.0% and 2009 - 10.8%).
- Sanprev - 10.6% (2010 - 11.1% and 2009 - 10.6%).
- Bandeprev - 10.5% (2010 - 11.0% and 2009 -10.0%).
- SantaderPrevi - 10.7% (2010 - 10.8% and 2009 - 9.7%).
- Other Plans: null - the plan does not have assets.
• Estimated long-term inflation rate:
- Banesprev, Sanprev, SantanderPrevi, Bandeprev and Other Plans - 4.4% (2010 - 4.4% and 2009 - 4.2%).
• Estimate salary increase rate:
- Banesprev, Sanprev, SantanderPrevi, Bandeprev Básico and Other Plans - 4.9% (2010 - 4.9% and 2009 - 4.7%).
iii. Health and Dental Care Plan
• Cabesp - Caixa Beneficente dos Funcionários do Banco do Estado de São Paulo S.A.
The Banco Santander contributes to Cabesp, an entity that covers health and dental care expenses of employees hired until Banespa privatization in 2000.
• SantanderPrevi’s Retirees
SantanderPrevi’s retirees’ health care plan is a lifetime benefit and receives a subsidy of 30% of the basic plan cost from the sponsor, payable only to beneficiaries entitled to the benefits through December 31, 2002. Costing is made directly by the sponsor.
• Former employees of Banco Real S.A. (retiree by Circulares)
The health care plan of the former employees of Banco Real is a lifetime benefit and receives a subsidy of 90% of the basic plan cost from the sponsor.
• Bandeprev’s retirees
The health care plan of Bandeprev’s pension plan beneficiaries is a lifetime benefit, for which the Banco Santander is responsible for defraying 50% of the benefits of employees retired before the date the sponsor Banco Bandepe was privatized and 30% of the benefits of employees retired after privatization.
F-46
|
|
|
|
BANCO SANTANDER (BRASIL) S.A.
NOTES TO THE CONSOLIDATED FINANCIAL STATEMENTS FOR THE YEARS ENDED DECEMBER 31, 2011, 2010 AND 2009 |
|
|
(Amounts in thousands of Brazilian Reais - R$, unless otherwise stated) |
|
• Officer with Lifetime Benefits (Lifetime Officers)
Lifetime health care benefit granted to former officers of Banco Sudameris Brasil S.A. who held an officer position at Banco Sudameris Brasil S.A. for a period of 10 years or more (closed group).
• Life insurance for Banco Real’s retirees
Life insurance policy for former employees of Banco Real. Upon the death of the beneficiary, his/her dependent receives a lump-sum death benefit and, upon the death of the beneficiary’s spouse, the beneficiary receives 50% of such amount. Banco subsidizes 45% of the total premium (closed group).
• Free clinic
The health care plan "free clinic" is a lifetime plan offered to the retirees who have contributed to Fundação Sudameris for at least 25 years and is funded by the users. The plan is offered only for hospitalization in wards.
• Plasas
Voluntary health plan, created on July 1, 1989, supplementary to the health care plan and only for cases of hospitalization. It includes a reserve made up by participants’ and Fasass’ contributions, which are suspended since August 1999. The Plan is closed to new entrants since July 1999.
Additionally, it is assured to retired employees, since they meet to certain legal requirements and full pays their respective contributions, the right to be maintaining as a beneficiary of the Bank health plan, in the same conditions for healthcare coverage, taken place during their employment contract. The Bank’s provisions related to this retired employees are accrued using actuarial calculations based in the present value of the current cost.
| Thousands of Reais | 2011 | 2010 | 2009 | 2008 | 2007 |
| Present value of the obligations - Post-employment plans: | |||||
| To current employees | 1,312,325 | 1,212,603 | 1,078,765 | 954,321 | 798,056 |
| Vested obligations to retired employees | 15,268,283 | 14,009,689 | 12,644,915 | 11,676,568 | 9,205,628 |
| 16,580,608 | 15,222,292 | 13,723,680 | 12,630,889 | 10,003,684 | |
| Less: | |||||
|
Fair value of plan assets |
15,051,746 | 14,522,452 | 13,324,387 | 12,390,745 | 10,117,296 |
|
Unrecognized actuarial (gains)/losses |
1,181,202 | 439,175 | 223,152 | (180,135) | (576,868) |
|
Unrecognized assets (1) |
(525,613) | (581,833) | (619,308) | (378,950) | (314,201) |
|
Unrecognized past service cost |
- | - | 358 | - | - |
| Provisions – Post-employment plans, net | 873,273 | 842,498 | 795,091 | 799,229 | 777,457 |
| Present value of the obligations - Other similar obligations: | |||||
| To current employees | 601,549 | 530,858 | 23,053 | 26,806 | - |
| Vested obligations to retired employees | 4,569,371 | 3,759,378 | 3,842,505 | 2,684,670 | 2,786,207 |
| To beneficiaries of early retirement | - | - | - | 44 | 181 |
| 5,170,920 | 4,290,236 | 3,865,558 | 2,711,520 | 2,786,388 | |
| Less: | |||||
|
Fair value of plan assets |
4,535,896 | 4,142,589 | 3,683,450 | 2,897,569 | 2,782,114 |
|
Unrecognized actuarial (gains)/losses |
447,397 | (6,600) | 282,858 | (223,100) | 148,346 |
|
Unrecognized assets (1) |
(98,389) | (193,363) | (402,457) | (242,636) | (144,254) |
| Provisions – Other similar obligations, net | 286,016 | 347,610 | 301,707 | 279,687 | 182 |
| Total provisions for pension plans, net | 1,159,289 | 1,190,108 | 1,096,798 | 1,078,916 | 777,639 |
|
Of which: |
|||||
|
Actuarial provisions |
1,246,040 | 1,190,108 | 1,096,799 | 1,078,916 | 777,639 |
|
Actuarial assets (note 15) |
86,751 | - | - | - | - |
| (1) Refers to fully funded plans Banesprev I, III and IV, Sanprev I,II and III, Bandeprev and Plasas. | |||||
| The amounts recognized in the consolidated income statement in relation to the aforementioned defined benefit obligations are as follows: | |||||
| Thousands of Reais | Post-Employment Plans | ||||
| 2011 | 2010 | 2009 | 2008 | 2007 | |
| Current service cost (note 37 & 22.b) | 19,460 | 16,212 | 22,051 | 21,284 | 24,745 |
| Interest cost | 1,561,367 | 1,460,199 | 1,362,265 | 1,362,586 | 1,195,156 |
| Expected return on plan assets | (1,543,051) | (1,337,358) | (1,291,696) | (1,278,663) | (1,082,537) |
| Extraordinary charges: | |||||
|
Actuarial (gains)/losses recognized in the year |
135,628 | 61,699 | 36,552 | 16,726 | 8,305 |
|
Past service cost |
- | - | 57 | - | - |
|
Early retirement cost |
89 | 32 | - | - | - |
| Total | 173,493 | 200,784 | 129,229 | 121,933 | 145,669 |
F-47
|
|
|
|
BANCO SANTANDER (BRASIL) S.A.
NOTES TO THE CONSOLIDATED FINANCIAL STATEMENTS FOR THE YEARS ENDED DECEMBER 31, 2011, 2010 AND 2009 |
|
|
(Amounts in thousands of Brazilian Reais - R$, unless otherwise stated) |
|
| Thousands of Reais | Other Similar Obligations | ||||
| 2011 | 2010 | 2009 | 2008 | 2007 | |
| Current service cost (note 37 & 22.b) | - | - | 14,483 | 23,776 | 13,732 |
| Interest cost | 445,405 | 424,157 | 307,459 | 311,758 | 269,275 |
| Expected return on plan assets | (469,625) | (390,579) | (277,461) | (304,244) | (269,275) |
| Extraordinary charges: | |||||
| Actuarial (gains)/losses recognized in the year | 2,310 | 58,958 | 6,857 | - | - |
| Early retirement cost | 38,335 | 58,576 | - | 1,633 | 8,426 |
| Total | 16,425 | 151,112 | 51,338 | 32,923 | 22,158 |
|
|
|||||
| Thousands of Reais | Post-Employment Plans | ||||
| 2011 | 2010 | 2009 | 2008 | 2007 | |
| Present value of the obligations at beginning of year | 15,222,292 | 13,723,680 | 12,630,889 | 10,003,684 | 8,732,563 |
| Changes in the scope of consolidation | - | - | - | 1,372,869 | - |
| Current service cost | 19,460 | 16,212 | 22,051 | 21,284 | 24,745 |
| Interest cost | 1,561,367 | 1,460,199 | 1,362,265 | 1,362,586 | 1,195,156 |
| Early retirement cost | 89 | 32 | - | - | - |
| Benefits paid | (1,171,279) | (1,064,412) | (1,394,064) | (922,771) | (843,702) |
| Actuarial (gains)/losses | 924,447 | 1,085,254 | 1,102,539 | 931,691 | 989,648 |
| Others | 24,232 | 1,327 | - | (138,454) | (94,726) |
| Present value of the obligations at end of year | 16,580,608 | 15,222,292 | 13,723,680 | 12,630,889 | 10,003,684 |
| Thousands of Reais | Other Similar Obligations | ||||
| 2011 | 2010 | 2009 | 2008 | 2007 | |
| Present value of the obligations at beginning of year | 4,290,236 | 3,865,558 | 2,711,520 | 2,786,388 | 2,047,784 |
| Changes in the scope of consolidation | - | - | - | 291,755 | - |
| Current service cost | - | - | 14,483 | 23,776 | 13,732 |
| Interest cost | 445,405 | 424,157 | 307,459 | 311,758 | 269,275 |
| Early retirement cost | (4,411) | 1,026 | - | 1,633 | 8,426 |
| Benefits paid | (220,030) | (177,674) | (178,875) | (157,266) | (157,685) |
| Actuarial (gains)/losses | 633,116 | 132,301 | 1,010,971 | (539,867) | 651,450 |
| Other | 26,604 | 44,868 | - | (6,657) | (46,594) |
| Present value of the obligations at end of year | 5,170,920 | 4,290,236 | 3,865,558 | 2,711,520 | 2,786,388 |
| The changes in the fair value of the plan assets were as follows: | |||||
| Thousands of Reais | Post-Employment Plans | ||||
| 2011 | 2010 | 2009 | 2008 | 2007 | |
| Fair value of plan assets at beginning of year | 14,522,452 | 13,324,387 | 12,390,745 | 10,117,296 | 3,745,220 |
| Changes in the scope of consolidation (1) | - | - | - | 1,574,595 | - |
| Expected return on plan assets | 1,543,051 | 1,337,358 | 1,291,696 | 1,278,663 | 1,082,537 |
| Actuarial gains/(losses) | (16,316) | 778,074 | 684,445 | 230,194 | 1,373,486 |
| Contributions | 173,838 | 129,051 | 106,837 | 83,055 | 4,730,968 |
|
Of which: |
|||||
|
By the Bank (2) |
153,744 | 108,501 | 84,495 | 67,513 | 4,712,879 |
|
By plan participants |
20,094 | 20,550 | 22,341 | 15,542 | 18,089 |
| Benefits paid | (1,171,279) | (1,051,854) | (1,149,336) | (893,058) | (814,915) |
| Exchange differences and other items | - | 5,436 | - | - | - |
| Fair value of plan assets at end of year | 15,051,746 | 14,522,452 | 13,324,387 | 12,390,745 | 10,117,296 |
| Thousands of Reais | Other Similar Obligations | ||||
| 2011 | 2010 | 2009 | 2008 | 2007 | |
| Fair value of plan assets at beginning of year | 4,142,589 | 3,683,450 | 2,897,569 | 2,782,114 | 2,430,500 |
| Changes in the scope of consolidation (1) | - | - | - | 93,401 | - |
| Expected return on plan assets | 469,625 | 390,579 | 277,461 | 304,244 | 269,275 |
| Actuarial gains/(losses) | 94,361 | 188,771 | 638,240 | (169,057) | 169,143 |
| Contributions | 64,878 | 58,833 | 42,751 | 41,487 | 42,860 |
|
Of which: |
|||||
|
By the Bank (2) |
59,576 | 53,944 | 37,635 | 36,021 | 36,184 |
|
By plan participants |
5,301 | 4,889 | 5,116 | 5,466 | 6,676 |
| Benefits paid | (218,173) | (192,371) | (172,571) | (153,225) | (129,664) |
| Exchange differences and other items | (17,384) | 13,327 | - | (1,395) | - |
| Fair value of plan assets at end of year | 4,535,896 | 4,142,589 | 3,683,450 | 2,897,569 | 2,782,114 |
| (1) In 2008, refers mainly to Banco Real. | |||||
| (2) In 2007, includes the initial transfer and the monthly amounts paid to Banesprev for the plan V. | |||||
| In 2012 the Bank expects to make contributions to fund these obligations for amounts similar to those made in 2011. | |||||
F-48
|
|
|
|
BANCO SANTANDER (BRASIL) S.A.
NOTES TO THE CONSOLIDATED FINANCIAL STATEMENTS FOR THE YEARS ENDED DECEMBER 31, 2011, 2010 AND 2009 |
|
|
(Amounts in thousands of Brazilian Reais - R$, unless otherwise stated) |
|
| The main categories of plan assets as a percentage of total plan assets are as follows: | |||||
| 2011 | 2010 | 2009 | 2008 | 2007 | |
| Equity instruments | 2.77% | 5.05% | 2.55% | 5.47% | 8.66% |
| Debt instruments | 93.38% | 92.91% | 96.58% | 92.85% | 89.33% |
| Properties | 0.50% | 0.47% | 0.12% | 0.10% | 0.01% |
| Other | 3.36% | 1.57% | 0.75% | 1.58% | 2.00% |
| The expected return on plan assets was determined on the basis of the market expectations for returns over the duration of the related obligations. | |||||
| The following table shows the estimated benefits payable at December 31, 2011 for the next ten years: | |||||
| Thousands of Reais | |||||
| 2012 | 1,472,012 | ||||
| 2013 | 1,553,172 | ||||
| 2014 | 1,631,184 | ||||
| 2015 | 1,712,929 | ||||
| 2016 to 2020 | 12,052,042 | ||||
| Total | 18,421,339 | ||||
Presumptions about the rates related to medical care costs have a significant impact on the amounts recognized in income. A change of one percentage point in the medical care cost rates would have the effects as
follows:
| Thousands of Reais | Sensitivity | |
| (+) 1.0% increase | (-) 1.0% decrease | |
| Effect on current service cost and interest on actuarial liabilities | 4,723 | (3,544) |
| Effects on present value of obligation | 841,994 | (683,696) |
d) Provisions for judicial and administrative proceedings, commitments and other provisions
i. Legal obligations and tax and social security contingencies (probable loss risk)
The main judicial and administrative proceedings involving tax and social security that remains are:
• PIS and Cofins - R$6,833,010 thousand (2010 - R$5,119,731 thousand and 2009 - R$3,734,078 thousand): lawsuit filed by several companies of the conglomerate against the provisions of Law 9,718/98, pursuant to which PIS and COFINS must be levied on all revenues of legal entities. Prior to said provisions, already overruled by several recent decisions by the Federal Supreme Court, PIS and Cofins were levied only on revenues from services and sale of goods.
• CSLL - equal tax treatment - R$49,314 thousand (2010 - R$278,194 thousand and 2009 - R$258,985 thousand) - lawsuits filed by several companies of the Group challenging the application of an increased CSLL rate (18% - 30%) for financial institutions as compared to the rate for non-financial companies (8% - 10%). These proceedings were not subject of the application of Law 11,941/2009.
•IncreaseinCSLLtax rate - R$979,938 thousand (2010 - R$848,734 thousand and 2009 - R$548,550 thousand) - The Bank and other companies of the Group filed for an injunction to avoid the increase in the CSLL tax rate established by Executive Act 413/2008, converted into Law 11,727/2008. Financial institutions were subject to a CSLL tax rate of 9%, however the new legislation established a 15% tax rate.
• Service Tax (ISS) - Financial Institutions - R$542,443 thousand (2010 - R$473,371 thousand and 2009 - R$268,845 thousand): refers to discussions to administrative and judicial proceedings against several counties require the payment of ISS on several revenues from operations that are not usually qualified as service on several companies of the Consolidated.
• Social Security Contribution (INSS) - R$288,137 thousand (2010 - R$259,526 thousand and 2009 - R$209,045 thousand): refers to discussions to administrative and judicial proceedings seeking collection of social security contribution and education allowance on amounts that normally are not considered as wage which is the basis for application of the percentage of Social Security contribution on several companies of the Consolidated.
ii. Provisions for judicial and administrative proceedings - labor lawsuits
These are lawsuits brought by labor Unions, Associations, Public Prosecutors and former employees claiming labor rights they understand are due, especially payment for overtime and other labor rights, including retirement benefit lawsuits.
For claims considered to be similar and usual, provisions are recognized based on the history of payments made. Claims that do not fit into the previous criterion are accrued according to the escrow deposits made for the lawsuits or are assessed individually, and provision are recognized based on the status of each lawsuit, law and previous court decisions according to the assessment of the likelihood of a favorable outcome, and the risk assessment made by the legal counsel.
F-49
|
|
|
|
BANCO SANTANDER (BRASIL) S.A.
|
|
|
(Amounts in thousands of Brazilian Reais - R$, unless otherwise stated) |
|
ii. Provisions for judicial and administrative proceedings - civil lawsuits
Refer to judicial proceedings related to civil lawsuits classified, are:
Lawsuits for indemnity - seek indemnity for property damage and/or moral, relating to the consumer relationship on matters related to credit cards, consumer credit, bank accounts, collection and loans and other operations. In the civil lawsuits considered to be similar and usual, provisions are recognized based on the history of payments made. Civil lawsuits that do not fit into the previous criterion are accrued according to the individual assessment made, and provisions are recognized based on the status of each lawsuit, law and previous court decisions according to the assessment of the likelihood of a favorable outcome, and the risk assessment made by the legal counsel.
Economic Plans - efforts to recover the deficient inflation adjustments in savings accounts and judicial deposits arising from Economic Plans (Bresser, Verão, Collor I and II). These refer to the lawsuits filed by savings accountholders disputing the interest credited by Banco Santander under such plans as they considered that such legal amendments infringed on the rights acquired with regard to the application of the inflation indexes. Provisions are set aside for such lawsuits based on the average payments made historically. Civil lawsuits that do not fit into the previous criterion are accrued according to the individual assessment made, and provisions are recognized based on the status of each lawsuit, law and previous court decisions according to the assessment of the likelihood of a favorable outcome, and classification of the legal counsel. Banco Santander is also party in public class action suits on the same issue filed by consumer rights organizations, Public Prosecutor’s Offices and Public Defender’s Offices. In these cases, the provision is made only after the final unappealable sentence is handed down on the lawsuits, based on the individual execution orders. The Superior Court of Justice (STJ) position’s by the moment is against the banks. The Supreme Court is still analyzing the subject and has already ordered the suspension of all cases except those which have not yet been judged or those which are in an execution stage. The Supreme Court has decided favorably to the banks in similar cases involving CDBs (Bank Deposit Certificates) and the revision of agreements (Tablita). However it has not definitively decided about the constitutionality of the rules involving Economic Plans. On April 14, 2010, the Superior Court decided that the period of prescription for class actions regarding Economic plans is five years from each Economic Plan dates. With this decision, most actions, such as were proposed after a period of 5 years will probably be dismissed, reducing the involved values. Still, in October 2011 the Supreme Court decided that the deadline for individual savers qualify in civil class actions, it is also five years, counted from the res judicata of the respective sentence. Banco Santander believes that its defense’s arguments can be well succeed.
iv. Other lawsuits under the responsibility of former controlling stockholders
Refer to tax, labor and civil lawsuits in the amounts of R$969,485 thousand, R$14,150 thousand and R$9,052 thousand (2010 - R$455,841 thousand, R$30,764 thousand and R$7,180 thousand and 2009 - R$430,357 thousand, R$61,141 thousand and R$33,601 thousand), with responsibility of the former controlling stockholders of the banks and acquired entities. Based on the agreements signed these lawsuits have guarantees of integral reimbursement by the former controlling stockholders, whose respective rights were recorded under other assets.
v. Contingent liabilities classified as possible loss risk
Refer to judicial and administrative proceedings involving tax, civil and labor matters assessed by legal counsels as possible losses, which were not accounted for. The main lawsuits are:
• CPMF (tax on banking transactions) on Customer Operations - in May 2003, the Federal Revenue Service issued an Infraction Notice against Santander Distribuidora de Títulos e Valores Mobiliários Ltda. (Santander DTVM), actual Produban Serviços de Informática S.A. and another Infraction Notice against the former Banco Santander Brasil S.A., both in the amount of R$290 million. The notices refer to the collection of a CPMF tax credit on transactions conducted by Santander DTVM in the management of its customers’ funds and clearance services provided by the Bank to Santander DTVM, according to the agreement between these two companies, in 2000, 2001 and the first two months of 2002. Both companies consider that the tax treatment adopted was adequate since said transactions were subject to CPMFat zero rate. The Board of Tax Appeals (CARF) judged the administrative proceedings, annulling the infraction notice of Santander DTVM and maintaining the infraction notice of the Bank. All these administrative proceedings are pending of decisions at the end of their resources to the last instance of CARF. The updated amount of each proceeding is approximately R$564 million.
• IRPJ and CSLL on Reimbursement Arising from Contractual Guarantees - The Federal Revenue Service issued infraction notices against Banco Santander, whose objects are the collection of IRPJ and CSLL taxes for tax years 2002 to 2006 on amounts reimbursed by the former controlling shareholder of the Bozano Simonsen group arising from acts of management responsibility, which payments were paid by the consolidated entities. The tax authority deemed the amounts deposited on behalf of these entities to be taxable income and not reimbursements. In December 2011 the CARF judged the administrative process for the 2002 base period (R$438.7 million), offsetting the full assessment notice. The decision may be appealed by the Authority by the last instance of CARF. The updated amount is approximately R$644 million.
• Addition to the Price on the Purchase of Shares of Banco do Estado de São Paulo S.A. - Banespa - Filed an ordinary action claiming the inexistence of legal relationship before the National Treasury in relation to item 3.1 of the Banespa’s Share Purchase and Sale Agreement. Such item provided for the payment of an addition to the minimum price should Banespa be released from the tax contingency recognized at the time of the privatization upon the setting of the minimum price. After an unfavorable lower court decision, on April 23, 2008, the 1st Region Federal Court accepted the appeal filed by the Bank and declared undue the collection. At these moment, awaits the decision on the appeal trial by the Union. The updated amount involved is approximately R$422 million.
• Credit Losses - Administrative collection by the Federal Revenue Service in view of the deduction from the IRPJ and CSLL basis of credit losses once they would not have met the conditions and terms laid down in the current legislation. The updated amount involved is approximately R$335 million.
• CSLL - equal tax treatment - Constitutional Amendment 10 from 1996 - Lawsuit regarding the difference from social contribution tax rate applied to financial institutions and equivalent entities in the first half of 1996, as such tax rate was higher than the rates applied to other legal entities, which is contrary to the precedence and non-retroactivity constitutional principle. The adjusted amount involved is approximately R$108 million.
• CSLL - Favorable and unappealable decision - This lawsuit claims to remove the requirements of the tax credit claimed by the Federal Revenue Service related to alleged irregularities in the payment of CSLL. The Bank has granted a favorable final and unappealable decision that overrule the collection of CSLL under Law 7,689/1988 and Law 7,787/1989 in the period required by Federal Revenue Service. The updated amount involved is approximately R$170 million.
• IRPJ and CSLL - Capital Gain - the Brazilian Federal Revenue Service issued a tax assessment against Santander Seguros (legal successor of ABN AMRO Brasil Dois Participações S.A. (AAB Dois Par)) charging income tax and social contribution related to 2005 tax year, their understanding was that the capital gain should be paid on tax rate an aliquot of lower than supposed due on the sale of the Real Seguros S.A. and Real Vida e Previdência S.A by AAB Dois Par . The assessment was appealed at the administrative level as the Company understanding is that the tax treatment adopted in the transaction was in compliance with the current tax law and the capital gain was properly taxed. The administrative process is to be trial. Banco Santander is responsible for any adverse outcome in this process as a former controlling stock holders of Santander Seguros. The amount involved is R$212 million.
• INSS on Profit Sharing (PLR) - refers to administrative and legal proceedings arising from tax assessments, which aim to collect social security contributions on payments made by the Bank and the consolidated companies, as a PLR. The Tax Authorities have concluded that the requirements were not met the law. Against these charges were brought the applicable appeals, because the Management believes that all procedures have been adopted under the law to characterize the nature of payment of PLR. The updated amount involved is approximately R$273 million.
F-50
|
|
|
|
BANCO SANTANDER (BRASIL) S.A.
NOTES TO THE CONSOLIDATED FINANCIAL STATEMENTS FOR THE YEARS ENDED DECEMBER 31, 2011, 2010 AND 2009 |
|
|
(Amounts in thousands of Brazilian Reais - R$, unless otherwise stated) |
|
• Semiannual Bonus or Profit Sharing - Labor lawsuit relating to the payment of a semiannual bonus or, successively, profit sharing to retired employees from the former Banco do Estado de São Paulo S.A. - Banespa, hired by May 22, 1975. This lawsuit was filed by Banespa’s Retirees Association and was judged by the Superior Labor Court and the Banco Santander has filed an appeal, which the admissibility of the Supreme Court has been granted. The involved amount is not disclosed due to the current stage of the lawsuit and the possibility of affecting its progress.
| 23. Tax assets and liabilities | |||
| a) Income and Social Contribution Taxes | |||
| The total charge for the year can be reconciled to accounting profit as follows: | |||
| Thousands of Reais | 2011 | 2010 | 2009 |
| Operating profit before tax, net of profit sharing | 8,910,536 | 9,996,503 | 8,137,129 |
| Interest on capital (1) | (1,550,000) | (1,760,000) | (825,122) |
| Unrealized profits | (914) | (6,614) | (4,707) |
| Income before taxes | 7,359,622 | 8,229,889 | 7,307,300 |
| Rates (25% income and contribution tax and 15% social contribution tax) | (2,943,849) | (3,291,956) | (2,922,920) |
| PIS and COFINS (net of income and social contribution taxes) (2) | (1,037,570) | (856,107) | (993,057) |
| Permanent differences: | |||
|
Equity in subsidiaries |
21,687 | 17,577 | 118,166 |
|
Goodwill (3) |
1,241,381 | 1,391,527 | 1,462,386 |
|
Exchange variation - foreign branches (4) |
767,921 | (196,941) | (634,492) |
| Adjustments: | |||
|
Constitution of income and social contribution taxes on temporary differences |
602,394 | 165,083 | 195,529 |
|
Effects of change in rate of social contribution taxes (5) |
9,439 | 19,911 | 29,140 |
|
Other adjustments |
183,915 | 136,977 | 116,083 |
| Income and social contribution taxes | (1,154,683) | (2,613,929) | (2,629,165) |
|
Of which: |
|||
|
Current tax |
(2,732,999) | (2,501,876) | (3,650,660) |
|
Deferred taxes |
1,578,316 | (112,053) | 1,021,495 |
| Taxes paid in the year | (1,932,317) | (1,043,419) | (1,973,257) |
(1) Amount distributed to shareholders as interest attributable to shareholders’ equity. For accounting purposes, although the interest should be reflected in the statement of income for tax deduction, the charge is reversed before the calculation of the net income in the statutory financial statements and deducted from the shareholders’ equity since is considered as dividend.
(2) PIS and COFINS are considered a profit-base component (net basis of certain revenues and expenses), therefore and accordingly to IAS 12 it is recorded as income taxes.
(3) The difference between the tax basis and accounting basis of goodwill on acquisition of Banco ABN Amro Real S.A. is a difference of a permanent nature and definitive, since the possibility of future use of resources to settle a tax liability is considered remote by the Administration in this case the possibility of loss on impairment or disposal only applies to the entity as a whole and according to the characteristics of the business combination performed, it is not possible to segregate and identify the business originally acquired. Therefore, amortization of goodwill tax creates a permanent differences and there is not record of the deferred tax liability (note 45).
(4) Relates to gain (net loss in 2010 and 2009) arising from the economic hedge of the Bank’s position in Cayman, which is a non-autonomous subsidiary, offset by a loss (gain in 2010 and 2009) recorded on “Gain/Losses on Financial Assets and Liabilities (Net)” (note 34), the latter being taxable/deductible.
(5) Effect of rate differences for the other non-financial corporations, which the social contribution tax rate is 9%.
| Thousands of Reais | 2011 | 2010 | 2009 |
| Operating profit before tax | 8,910,536 | 9,996,503 | 8,137,129 |
| Income tax | 1,154,683 | 2,613,929 | 2,629,165 |
| Effective tax rate (1) | 12.96% | 26.15% | 32.31% |
(1) In 2011, 2010 and 2009, considering the tax effect of the exchange variation over foreign branches and the economic hedge, accounted in the Gains (losses) on financial assets and liabilities (net) (note 34) the effective tax rate would have been 23.5%, 23.2% and 25%, respectively.
| c) Tax recognized in equity | |||
|
In addition to the income tax recognized in the consolidated income statement, the Bank recognized the following amounts in consolidated equity: |
|||
| Thousands of Reais | 2011 | 2010 | 2009 |
| Tax credited to equity | 97,498 | 94,911 | 149,851 |
|
Measurement of available-for-sale securities |
97,498 | 90,888 | - |
|
Measurement of cash flow hedges |
- | 4,023 | 149,851 |
| Tax charged to equity | (852,474) | (692,881) | (568,155) |
|
Measurement of available-for-sale securities |
(845,109) | (681,097) | (568,155) |
|
Measurement of cash flow hedges |
(7,365) | (11,784) | - |
| Total | (754,976) | (597,970) | (418,304) |
F-51
|
|
|
|
BANCO SANTANDER (BRASIL) S.A.
NOTES TO THE CONSOLIDATED FINANCIAL STATEMENTS FOR THE YEARS ENDED DECEMBER 31, 2011, 2010 AND 2009 |
|
|
(Amounts in thousands of Brazilian Reais - R$, unless otherwise stated) |
|
| d) Deferred taxes | |||||
| The detail of the balances of “Tax assets – Deferred” and “Tax liabilities – Deferred” is as follows: | |||||
| Thousands of Reais | 2011 | 2010 | 2009 | ||
| Tax assets deferred | 14,171,076 | 13,415,298 | 13,617,159 | ||
|
Of which: |
|||||
|
Temporary differences (1) |
12,121,076 | 11,211,372 | 11,947,404 | ||
|
Tax loss carryforwards |
1,352,273 | 1,462,490 | 1,669,755 | ||
|
Social contribution taxes 18% |
697,727 | 741,436 | - | ||
| Tax offset | 2,073 | 209,582 | - | ||
| Total deferred tax assets | 14,173,149 | 13,624,880 | 13,617,159 | ||
| Tax liabilities deferred | 3,748,104 | 4,280,159 | 3,867,857 | ||
|
Of which: |
|||||
|
Excess depreciation of leased assets |
2,012,314 | 2,454,253 | 2,153,120 | ||
|
Adjustment to fair value of trading securities and derivatives |
1,735,790 | 1,825,906 | 1,714,737 | ||
| Total deferred tax liabilities | 3,748,104 | 4,280,159 | 3,867,857 | ||
| (1) Temporary differences relate mainly to impairment losses on loans and receivables and provisions for judicial and administrative proceedings. | |||||
| In 2011, were not recorded tax assets amounting R$995,838 thousand. | |||||
| The changes in the balances of “Tax Assets – Deferred” and “Tax Liabilities – Deferred” in the last two years were as follows: | |||||
| Thousands of Reais |
Balances at
December 31, 2010 |
Adjustment
to Income |
Valuation
adjustments (1) |
Acquisitions
for the Year (Net of disposals) |
Balances at
December 31, 2011 |
| Deferred tax assets | 13,415,298 | 827,601 | (2,873) | (68,950) | 14,171,076 |
|
Temporary differences |
11,211,372 | 981,527 | (2,873) | (68,950) | 12,121,076 |
|
Tax loss carryforwards |
1,462,490 | (110,217) | - | - | 1,352,273 |
|
Social contribution taxes 18% |
741,436 | (43,709) | - | - | 697,727 |
| Deferred tax liabilities | 4,280,159 | (707,006) | 276,494 | (101,543) | 3,748,104 |
|
Temporary differences |
4,280,159 | (707,006) | 276,494 | (101,543) | 3,748,104 |
| Total | 9,135,139 | 1,534,607 | (279,367) | 32,593 | 10,422,972 |
|
|
|||||
| Thousands of Reais |
Balances at
December 31, 2009 |
Adjustment
to Income |
Valuation
adjustments (1) |
Acquisitions
for the Year (Net of disposals) |
Balances at
December 31, 2010 |
| Deferred tax assets | 13,617,159 | 212,960 | (205,239) | - | 13,624,880 |
| Deferred tax liabilities | 3,867,857 | 325,013 | 87,289 | - | 4,280,159 |
| Total | 9,749,302 | (112,053) | (292,528) | - | 9,344,721 |
| Thousands of Reais |
Balances at
December 31, 2009 |
Adjustment
to Income |
Valuation
adjustments (1) |
Acquisitions
for the Year (Net of disposals) |
Balances at
December 31, 2010 |
| Deferred tax assets | 11,769,157 | 1,753,146 | 107,989 | (13,133) | 13,617,159 |
| Deferred tax liabilities | 3,130,894 | 731,651 | 3,960 | 1,352 | 3,867,857 |
| Total | 8,638,263 | 1,021,495 | 104,029 | (14,485) | 9,749,302 |
| (1) It relates to tax recognized in equity. | |||||
| e) Expected realization of tax loss carryforwards | |||||
| Year | Temporary differences |
Tax loss
carryforwards |
Social
contribution taxes 18% |
||
| 2012 | 6,427,415 | 359,626 | 14,146 | ||
| 2013 | 2,833,213 | 657,469 | 162,471 | ||
| 2014 | 1,675,781 | 204,696 | 100,278 | ||
| 2015 | 271,989 | 76,785 | 25,949 | ||
| 2016 | 260,824 | 53,697 | 207,524 | ||
| 2017 to 2019 | 310,804 | - | 187,359 | ||
| After 2019 | 341,050 | - | - | ||
| Total | 12,121,076 | 1,352,273 | 697,727 | ||
F-52
|
|
|
|
BANCO SANTANDER (BRASIL) S.A.
NOTES TO THE CONSOLIDATED FINANCIAL STATEMENTS FOR THE YEARS ENDED DECEMBER 31, 2011, 2010 AND 2009 |
|
|
(Amounts in thousands of Brazilian Reais - R$, unless otherwise stated) |
|
| 24. Other liabilities | |||
| The breakdown of the balance of “Other Liabilities” is as follows: | |||
| Thousands of Reais | 2011 | 2010 | 2009 |
| Accrued expenses and deferred income | 1,930,290 | 1,646,121 | 1,751,717 |
| Transactions in transit | 695,880 | 411,426 | 349,097 |
| Provision for share-based payment | 158,543 | 86,568 | 33,221 |
| Other | 1,143,138 | 1,461,723 | 2,093,733 |
| Total | 3,927,851 | 3,605,838 | 4,227,768 |
25. Valuation adjustments
The balances of “Valuation adjustments” include the amounts, net of the related tax effect, of the adjustments to assets and liabilities recognized temporarily in equity stated in the statement of changes in equity and recognized income and expense until they are extinguished or realized, when they are recognized in the consolidated income statement. The amounts arising from subsidiaries and jointly controlled entities are presented, on a line by line basis, in the appropriate items according to their nature.
It should be noted that the statement of recognized income and expense includes the changes to “Valuation adjustments” as follows:
- Revaluation gains/losses: includes the amount of the income, net of the expenses incurred in the year, recognized directly in equity. The amounts recognized in equity in the year remain under this item, even if in the same year they are transferred to the income statement or to the initial carrying amount of the assets or liabilities or are reclassified to another line item.
- Amounts transferred to income statement: includes the amount of the revaluation gains and losses previously recognized in equity, even in the same year, which are recognized in the income statement.
- Amounts transferred to the initial carrying amount of hedged items: includes the amount of the revaluation gains and losses previously recognized in equity, even in the same year, which are recognized in the initial carrying amount of assets or liabilities as a result of cash flow hedges.
- Other reclassifications: includes the amount of the transfers made in the year between the various valuation adjustment items.
In the Consolidated Statements of Recognized Income and Expense the amounts in "Valuation adjustments" are recognized gross, including the amount relating to non-controlling interests, and the corresponding tax effect is presented under a separate item, except in the case of entities accounted for using the equity method, the amounts for which are presented net of the tax effect.
a) Available-for-sale financial assets
This item includes the net amount of unrealized changes in the fair value of assets classified as available-for-sale financial assets.
b) Cash flow hedges
This item includes the gains or losses attributable to hedging instruments that qualify as effective hedges. These amounts will remain under this heading until they are recognized in the consolidated income statement in the periods in which the hedged items affect it (see note 8-d).
Accordingly, amounts representing valuation losses will be offset in the future by gains generated by the hedged instruments.
26. Non-controlling interests
“Non-controlling interests” include the net amount of the equity of subsidiaries attributable to equity instruments that do not belong, directly or indirectly, to the Bank, including the portion attributed to them of profit for the year.
F-53
|
|
|
|
BANCO SANTANDER (BRASIL) S.A.
NOTES TO THE CONSOLIDATED FINANCIAL STATEMENTS FOR THE YEARS ENDED DECEMBER 31, 2011, 2010 AND 2009 |
|
|
(Amounts in thousands of Brazilian Reais - R$, unless otherwise stated) |
|
| a) Breakdown | |||
| The detail, by company, of the balance of “Equity - Non-controlling interests” is as follows: | |||
| Thousands of Reais | 2011 | 2010 | 2009 |
| Agropecuária Tapirapé S.A. | - | 67 | 63 |
| Santander Leasing S.A. Arrendamento Mercantil | 784 | 987 | 910 |
| Santander CHP S.A. | 1,712 | 409 | 297 |
| Brasil Foreign Diversified Payment Rights Finance Company | 2 | 2 | 67 |
| Santander Getnet Serviços para Meios de Pagamentos S.A. (1) | 13,061 | 6,611 | - |
| MS Participações Societárias S.A. (2) | 3,401 | - | - |
| Other companies | - | - | 1 |
| Total | 18,960 | 8,076 | 1,338 |
| Profit attributable to non-controlling interests | 7,928 | 481 | 358 |
|
Of which: |
|||
|
Agropecuária Tapirapé S.A. |
- | 3 | 3 |
|
Santander Leasing S.A. Arrendamento Mercantil |
83 | 77 | 94 |
|
Santander CHP S.A. |
1,302 | 276 | 261 |
|
Santander Getnet Serviços para Meios de Pagamentos S.A. (1) |
6,450 | 111 | - |
|
MS Participações Societárias S.A. (2) |
93 | - | - |
|
Other companies |
- | 14 | - |
| b) Changes | |||
| The changes in the balance of “Non-controlling interests” are summarized as follows: | |||
| Thousands of Reais | 2011 | 2010 | 2009 |
| Balance at beginning of year | 8,076 | 1,338 | 5,279 |
| Inclusion of companies (1) (2) | 3,308 | 6,500 | - |
| Dividends paid | (352) | (164) | (297) |
| Profit attributable to non-controlling interests | 7,928 | 481 | 358 |
| Others (3) | - | (79) | (4,002) |
| Balance at end of year | 18,960 | 8,076 | 1,338 |
|
(1) On January 14, 2010, the Bank signed the contractual and bylaw instruments with GetNet to explore, develop and market transaction capture and processing services involving credit and/or debit cards in the Brazilian market. Santander holds veto power in decisions related to business strategy also enables the Bank to Getnet the use of the branch network the Bank's brand and marketing products, which among other factors determines the Bank's control under the authority. |
|
(2) Refers to minority interests in MS Participações Societárias S.A. |
|
(3) In 2009, refers substantially to the reduction of minority interest in Banco Comercial e de Investimento S.A. Sudameris (BCIS) and Banco ABN AMRO Real S.A., due to the incorporation of these institutions by Banco Santander. In these transactions the Bank's shares were given to the minority shareholders, which now directly participate in Banco Santander. |
27. Shareholders’ equity
a) Capital
According to the Banco Santander’s bylaws, the Banco Santander's capital may be increased to the limit of authorized capital, regardless of statutory, by resolution of the Board of Directors and through the issuance of up to 500 billion new shares, within the limits legally established as the number of preferred shares. Any increase in capital in excess of this limit will require the approval of the stockholders. The paid-up capital is represented as follows:
| Thousands of shares | ||||||
| 2011 | 2010 | |||||
| Common | Preferred | Total | Common | Preferred | Total | |
| Brazilian residents | 16,000,704 | 16,052,894 | 32,053,598 | 38,084,679 | 36,130,149 | 74,214,828 |
| Foreign residents | 196,841,028 | 170,149,491 | 366,990,519 | 174,757,053 | 150,072,236 | 324,829,289 |
| Total shares | 212,841,732 | 186,202,385 | 399,044,117 | 212,841,732 | 186,202,385 | 399,044,117 |
| (-) Treasury shares | (391,254) | (355,685) | (746,939) | - | - | - |
| Total outstanding | 212,450,478 | 185,846,700 | 398,297,178 | 212,841,732 | 186,202,385 | 399,044,117 |
| Thousands of shares | ||||||
| 2009 | ||||||
| Common | Preferred | Total | ||||
| Brazilian residents | 33,546,259 | 32,004,313 | 65,550,572 | |||
| Foreign residents | 179,295,473 | 154,198,072 | 333,493,545 | |||
| Total shares | 212,841,732 | 186,202,385 | 399,044,117 | |||
On April 27, 2010, the Extraordinary Stockholders' Meeting approved the proposal of capital increase amounting to R$22,130 thousand, without the issuance of new shares, through the incorporation of capital reserves, which was ratified by Bacen on June 24, 2010.
F-54
|
|
|
|
BANCO SANTANDER (BRASIL) S.A.
NOTES TO THE CONSOLIDATED FINANCIAL STATEMENTS FOR THE YEARS ENDED DECEMBER 31, 2011, 2010 AND 2009 |
|
|
(Amounts in thousands of Brazilian Reais - R$, unless otherwise stated) |
|
On October 13, 2009, as a result of the Global Share Offering, the capital of Banco Santander was increased by 525,000.000 Units (totaling 55,125,000 thousand shares, out of which 28,875,000 thousand are common shares and 26,250,000 thousand are preferred shares), each Unit represents 55 common shares and 50 preferred shares, all registered shares, without par value. On October 29, 2009 the number of shares initially offered in the Global Share Offering was increased by 6.85%, i.e., 35,955,648, (3,775,343 thousand shares, of which 1,977,561 thousand are ordinary shares and 1,797,782 thousand are preferred shares). The capital increase totaled R$ 12,988,842 thousand net of issuances costs of R$ 193,616 thousand.
The Extraordinary Shareholders' Meeting held on August 14, 2009 approved the capital increase of Banco Santander in the amount of R$2,471,413, with the issuance of 14,410,886 thousand shares (7,710,343 thousand are common shares and 6,700,543 thousand are preferred share) ,all of them registered and without par value, related to the share merger of Santander Seguros, Santander Brasil Asset and BCIS.
b) Dividends and Interest on Capital
In accordance with the Bank’s bylaws, stockholders are entitled to a minimum dividend equivalent to 25% of net income for the year, adjusted according to legislation. Preferred shares are nonvoting and nonconvertible, but have the same rights and advantages granted to common shares, in addition to priority in the payment of dividends 10% higher than those paid on common shares, and in the capital reimbursement, without premium, in the event of liquidation of the Banco Santander.
Dividend payments have been prepared and will continue to be prepared in accordance with Brazilian Corporate Law.
Before the annual shareholders meeting, the Board of Directors may establish the amount of dividends out of earnings based on (i) balance sheets or earning reserves from the last balance sheet; or (ii) balance sheets issued in the period shorter than 6 months, in which case the payment of dividends shall not exceed the amount of capital reserves. These payments are fully input into the mandatory dividend.
| 2011 | ||||
|
Thousands of
Reais |
Reais per Thousand Shares / Units | |||
| Common | Preferred | Units | ||
| Interest on capital (1)(5)(9) | 600,000 | 1.4366 | 1.5802 | 158.0216 |
| Reserve for equalization dividend (2) (5) | 273,840 | 0.6556 | 0.7212 | 72.1211 |
| Interim Dividends (2)(5)(9) | 476,160 | 1.1401 | 1.2541 | 125.4059 |
| Interest on capital (3)(5)(9) | 550,000 | 1.3168 | 1.4485 | 144.8532 |
| Interim Dividends (4)(5)(9) | 100,000 | 0.2394 | 0.2634 | 26.3369 |
| Interest on capital (6)(8)(9) | 400,000 | 0.9592 | 1.0551 | 105.5127 |
| Interim Dividends (7) (8) (9) | 775,000 | 1.8590 | 2.0449 | 204.4944 |
| Total in December 31, 2011 | 3,175,000 | |||
|
(1) Established by the Board of Directors in March, 2011, Common Shares - R$1.2211, and Preferred Shares - R$1.3432 and Units - R$134.3184, net of taxes.
(2) Established by the Board of Directors in May, 2011. (3) Established by the Board of Directors in June, 2011, Common Shares - R$1.1193, and Preferred Shares - R$1.2313 and Units - R$123.1252, net of taxes. (4) Established by Board of Directors in June, 2011. (5) The amount of interest on capital and dividends intermediate / intermediate was paid on August 29, 2011. (6) Established by the Board of Directors in September, 2011, Common Shares - R$0.8153, and Preferred Shares - R$0.8969 and Units - R$89.6858, net of taxes. (7) Established by Board of Directors in December 2011. (8) The amount of interest on capital will be paid on a date to be timely informed, without any compensation as monetary. (9) The amount of interim dividends and interest on capital will be allocated entirely to the mandatory distribution of income for the year 2011. |
||||
| 2010 | ||||
|
Thousands of
Reais (9) |
Reais per Thousand Shares / Units | |||
| Common | Preferred | Units | ||
| Interest on capital (1)(4) | 400,000 | 0.9577 | 1.0535 | 105.3477 |
| Intermediate dividends (2)(4) | 500,000 | 1.1917 | 1.3168 | 131.6847 |
| Interest on capital (3)(4) | 400,000 | 0.9577 | 1.0535 | 105.3477 |
| Interest on capital (5)(8) | 530,000 | 1.2690 | 1.3959 | 139.5858 |
| Interest on capital (6)(8) | 430,000 | 1.0295 | 1.1325 | 113.2488 |
| Intermediate dividends (7)(8) | 1,280,000 | 3.0647 | 3.3711 | 337.1128 |
| Total in December 31, 2010 | 3,540,000 | |||
|
(1) Established by the Board of Directors in March, 2010, Common Shares - R$0.8141 and Preferred Shares - R$0.8955 and Units - R$89.5456, net of taxes.
(2) Established by the Board of Directors in June, 2010. (3) Established by the Board of Directors in June, 2010, Common Shares - R$0.8141 and Preferred Shares - R$0.8955 and Units - R$89.5456, net of taxes. (4) The Amounts for the Interest on Capital were paid on August 25, 2010. (5) Established by the Board of Directors in September, 2010, Common Shares - R$1.0786 and Preferred Shares - R$1.1865 and Units - R$118.6479, net of taxes. (6) Established by the board of Directors in December, 2010, Common Shares - R$0.8751, and Preferred Shares - R$0.9626 and Units - R$96.2615, net of taxes. (7) Established by the Board of Directors in December 2010. (8) The amounts for the Interest on Capital and Dividends were paid on February 25, 2011, without any additional amount for monetary correction. (9) The amount for to the intermediate dividends and interest on capital are fully input into the mandatory dividends, recognized in income for the period ended December 31, 2010. |
||||
F- 55
|
|
|
|
BANCO SANTANDER (BRASIL) S.A.
NOTES TO THE CONSOLIDATED FINANCIAL STATEMENTS FOR THE YEARS ENDED DECEMBER 31, 2011, 2010 AND 2009 |
|
|
(Amounts in thousands of Brazilian Reais - R$, unless otherwise stated) |
|
| 2009 | ||||
| Thousands of | Reais per Thousand Shares / Units | |||
| Reais (5) | Common | Preferred | Units | |
| Interest on capital (1) | 340,000 | 0.9974 | 1.0972 | n.a. |
| Interest on capital (2) | 285,000 | 0.8361 | 0.9197 | n.a. |
| Intermediate Dividends (3) | 327,400 | 0.7839 | 0.8623 | 86.2271 |
| Intercalary Dividends (3) | 422,600 | 1.0118 | 1.1130 | 111.2999 |
| Interest on capital (3)(4) | 200,000 | 0.4789 | 0.5267 | 52.6738 |
| Total in December 31, 2009 | 1,575,000 | |||
|
(1) Established by Board of Directors in April 2009. Common shares - R$0.8478 and Preferred shares - R$0.9326, net of taxes.
|
||||
c) Reserves
The reserves are allocated as follows after the deductions and statutory provisions, from the net income:
Legal reserve
In accordance with BR GAAP, 5% in transferred to the legal reserve, until it reaches 20% of the share capital. This reserve is designed to ensure the integrity of the capital and can only be used to offset losses or increase capital.
Capital reserve
The Bank´s capital reserve consists of: reserve of goodwill for the subscription of shares and other capital reserves, and can only be used to absorb losses that exceed retained earnings and profit reserves, redemption, repayment or purchase of shares of our treasury; incorporation of the capital, or payment of dividends to preferred shares in certain circumstances.
Reserve for equalization dividend
After the destination of dividends, the remaining balance if any, may, upon proposal of the Executive Board and approved by the Board of Directors, be destinated to constitute a reserve for equalization of dividends, which is limited to 50% of the Capital. This reserve aims to ensure funds for the payment of dividends, including the form of Interest on Capital, or any interim payment to maintain the flow of shareholders remuneration.
d) Global offering of shares
TheBoardof Directors’ meeting held on September 18, 2009 approved the implementation of the public offering, which includes the issuance of 525,000,000 Units, each representing one of 55 common shares and 50 preferred shares, all registered shares, without par value, free and clear of any liens or encumbrances, consisting of the simultaneous initial public offering of Units in Brazil and Units abroad, included in the form of ADRs representing ADSs.
At the same meeting the listing of Banco Santander was approved and the trade of the Units in BM&FBovespa - Securities, Commodities and Futures Exchange (BM&FBovespa) level 2 Corporate Governance Practices.
The Global Offering was coordinated on a firm commitment of settlement. Under the Instruction 400/2003 of Brazilian Securities Commission (CVM), the total number of Units/ADSs initially offered in the Global Offering was increased in 6.85 %, i.e., which means 35,955,648 Units, in the form of ADSs, designed to meet a possible excess of demand over the Global Offering (Supplemental Option).
On October 6, 2009, the global offered shares were priced at R$23.50 per Unit. The Units are traded on the BM&FBovespa and the New York Stock Exchange (NYSE) since October 7, 2009.
The other characteristics and terms set out in the Final Global Offering Prospect for the Initial Public Offering of Certificates of Deposit Shares (Units) Issuance of Banco Santander dated October 6, 2009, available at www.santander.com.br and the CVM website and its english version on Form F-1, available on the SEC website.
The ratification, by Bacen, of the Bank's capital increase due to the completion of the Global Offering and Supplemental Option occurred on October 14, 2009 and on October 29, 2009, respectively.
The results of the Global Offering were disclosed under the closing announcement published in issues of Valor Econômico on November 10, 2009.
e) Treasury shares
On February, 2009 the Bank acquired 25,395 thousands own shares for the amount R$1,948 thousand. The Extraordinary shareholders' Meeting held on August, 2009 decided the cancellation of shares of its own issuance held in treasury, without reducing capital, through the absorption of R$1,948 thousand of the Capital Reserves account.
On November 9, 2010, the Board of Directors approved the Buyback Units Program issued by Banco Santander allowed purchase up to 1,452,282 Units, representing 79,875,510 common shares and 72,614,100 preferred shares, valid until November 9, 2011. However, in the meeting of Board Directors on August 24, 2011, the Buyback Program was canceled and a new Buyback Units Program issued by the Bank was approved, for held in treasury or subsequent sale valid up to August 24, 2012.
The new Buyback Program aims to: (1) maximize value creations for shareholders through efficient management of capital structure and (2) enable the management of risk arising from the provision , by the Bank, of market maker services in Brazil for certain index funds, where the Units are included in the index theoretical portfolio of reference of such funds, according to the rules. Part of repurchased Units will be used by the Bank for protection (“hedge”) against the price fluctuation of securities comprising the benchmark index, and should be bought and sold in accordance with the policy of the Bank’s risk management.
The Buyback Program will cover the procurement of over to 57,006,302 Units, representing 3,135,346,633 common shares and 2,850,315,121 preferred shares, or ADRs (American Depositary Receipts) by the Bank, or by its Cayman branch.
F-56
|
|
|
|
BANCO SANTANDER (BRASIL) S.A.
NOTES TO THE CONSOLIDATED FINANCIAL STATEMENTS FOR THE YEARS ENDED DECEMBER 31, 2011, 2010 AND 2009 |
|
|
(Amounts in thousands of Brazilian Reais - R$, unless otherwise stated) |
|
Still in November 9, 2010, the BMF&Bovespa has authorized the purchase of ADRs by Santander Madrid or its affiliates until 3% of the total shares issued by the Bank. Therefore, adding the number of Units/ADRs that may be acquired by the Company and Santander Madrid and its affiliates, that on July 31, 2011 was 18.63%, and shares outstanding could be reduced until 14.13%. This authorization does not imply in losses to the obligation assumed by Santander to reach a free float of 25% until October 7, 2012 (extendable under certain conditions until October 7, 2014), provided in the Contract for Adoption of Corporate Governance Practices Level 2 signed with BMF&Bovespa.
Until December 31, 2011, was acquired and held in treasury 5,380,800 Units, amounting to R$79,547 thousand. The minimum, weighted average and maximum cost per Unit is, respectively, R$14.10, R$14.78 and R$16.06. The Bank also acquired and held in treasury 1,732,900 ADRs, amounting to R$33,221 thousand. The minimum cost, weighted average and maximum price per ADR is US$10.21 . The market value of these shares on December 31, 2011 was R$14,96 per Unit and US$8.14 per ADR.
Additionally, during the period of 12 months ended in December 31, 2011, treasury shares were traded, refer to the services of a market maker that resulted ina gainof R$13, recorded directly in equity in capital reserves.
f) Strategic Partner of Santander Conglomerate in Brazil and Latin America
On October 28, 2010 Santander Spain and Qatar Holding Luxembourg S.à rl II (QHL) signed a contract in terms of the Acquisition of convertible bonds, regarding the subscription and payment by QHL the amount of US$ 2,718.8 million in bonds issued by Banco Santander Spain. These securities are mandatorily exchangeable for shares of Banco Santander and amount to 5.00024% of its capital. These shares are paid an interest rate of 6.75% pa in dollars and mature by October 29, 2013.
This investment reflects the inclusion of QHL as a strategic partner of Group Santander Spain in Brazil and in the remaining of Latin America. This operation allows Banco Santander to advance in its commitment of 25% of capital free float . On December 31, 2011, except for convertible bonds, the QHL does not own, directly or indirectly, any shares, warrants, subscription rights or options over the share capital of Banco Santander.
28. Operational Ratios
Financial institutions are required to maintain regulatory capital consistent with their activities, higher to the minimum of 11% of required capital. In July 2008 new regulatory capital measurement rules, under the Basel II Standardized Approach, went into effect, including a new methodology for credit risks and operational risks measurement, analysis and management. This ratio must be calculated on a consolidated basis, as shown below:
| Financial Consolidated (1) | |||
| Thousands of Reais | 2011 | 2010 | 2009 |
| Adjusted Tier I Regulatory Capital (2) | 48,327,406 | 44,883,986 | 42,352,612 |
| Tier II Regulatory Capital | 6,642,092 | 7,433,493 | 9,972,644 |
| Adjusted Regulatory Capital (Tier I and II) (2) | 54,969,498 | 52,317,479 | 52,325,256 |
| Required Regulatory Capital | 30,431,245 | 26,019,647 | 22,483,494 |
| Adjusted Portion of Credit Risk (2) (3) | 26,952,908 | 23,480,589 | 20,607,792 |
| Market Risk Portions (4) | 1,757,599 | 1,077,100 | 844,882 |
| Operational Risk Portion | 1,720,738 | 1,461,958 | 1,030,820 |
| Basel II Ratio | 19.9% | 22.1% | 25.6% |
|
(1) Amounts calculated based on the consolidated information of the financial institutions (Financial Conglomerate).
|
|||
Banco Santander, according to Bacen Circular 3,477/2009, will publish information relating to risk management and Regulatory Capital (PRE). A report with further details of the structure and methodology will be disclosed in the legal deadline, at the website www.santander.com.br\ri.
Financial institutions are required to maintain investments in permanent assets compatible with adjusted regulatory capital. Funds invested in permanent assets, calculated on a consolidated basis, are limited to 50% of regulatory capital, as per prevailing regulation. On December 31, 2011, 2010 and 2009, Banco Santander classifies for said index.
29. Interest and similar income
“Interest and similar income” in the consolidated income statement comprises the interest accruing in the year on all financial assets with an implicit or explicit return, calculated by applying the effective interest method, irrespective of measurement at fair value; and the rectifications of income as a result of hedge accounting. Interest is recognized gross, without deducting any tax withheld at source.
| The breakdown of the main interest and similar income items earned in 2011, 2010 and 2009 is as follows: | |||
| Thousands of Reais | 2011 | 2010 | 2009 |
| Cash and balances with the Brazilian Central Bank | 6,297,438 | 3,589,924 | 1,666,931 |
| Loans and amounts due from credit institutions | 1,219,218 | 1,397,840 | 2,901,054 |
| Loans and advances to customers | 35,397,614 | 29,290,024 | 29,469,976 |
| Debt instruments | 8,084,155 | 6,442,288 | 5,201,840 |
| Pension plans (Note 22.b) | 55,103 | - | - |
| Other interest | 682,552 | 189,128 | 103,155 |
| Total | 51,736,080 | 40,909,204 | 39,342,956 |
F-57
|
|
|
|
BANCO SANTANDER (BRASIL) S.A.
NOTES TO THE CONSOLIDATED FINANCIAL STATEMENTS FOR THE YEARS ENDED DECEMBER 31, 2011, 2010 AND 2009 |
|
|
(Amounts in thousands of Brazilian Reais - R$, unless otherwise stated) |
|
30. Interest expense and similar charges
“Interest expense and similar charges” in the consolidated income statement includes the interest accruing in the year on all financial liabilities with an implicit or explicit return, including remuneration in kind, calculated by applying the effective interest method, irrespective of measurement at fair value; the rectifications of cost as a result of hedge accounting; and the interest cost attributable to pension funds.
|
The breakdown of the main items of interest expense and similar charges accrued in 2011, 2010 and 2009 is as follows:
|
|||
| Thousands of Reais | 2011 | 2010 | 2009 |
| Deposits from the Brazilian Central Bank | - | - | 29,340 |
| Deposits from credit institutions | 2,006,136 | 1,146,688 | 1,179,130 |
| Customer deposits | 16,494,482 | 12,773,546 | 13,164,015 |
| Marketable debt securities and subordinated liabilities: | |||
|
Marketable debt securities (note 18) |
3,226,644 | 1,212,962 | 1,047,750 |
|
Subordinated liabilities (note 19) |
1,213,239 | 999,423 | 1,076,557 |
| Pensions (note 22.b) | 145,181 | 156,419 | 100,567 |
| Other interest | 748,634 | 525,088 | 578,506 |
| Total | 23,834,316 | 16,814,126 | 17,175,865 |
| 31. Income from equity instruments | |||
“Income from equity instruments” includes the dividends and payments on equity instruments out of profits generated by investees after the acquisition of the equity interest.
|
The breakdown of the balance of this item is as follows:
|
|||
| Thousands of Reais | 2011 | 2010 | 2009 |
| Equity instruments classified as: | |||
| Financial assets held for trading | 5,187 | 9,762 | 6,714 |
| Available-for-sale financial assets | 88,540 | 41,959 | 23,189 |
| Total | 93,727 | 51,721 | 29,903 |
32. Fee and commission income
“Fee and commission income” comprises the amount of all fees and commissions accruing in favor of the Bank in the year, except those that form an integral part of the effective interest rate on financial instruments.
|
The breakdown of the balance of this item is as follows:
|
|||
| Thousands of Reais | 2011 | 2010 | 2009 |
| Collection and payment services: | |||
| Bills | 374,103 | 384,942 | 378,519 |
| Demand accounts | 1,624,466 | 1,600,182 | 1,570,356 |
| Cards | 1,940,239 | 1,322,444 | 1,056,791 |
| Checks and other | 606,142 | 597,102 | 800,784 |
| Orders | 223,354 | 233,100 | 251,790 |
| Total | 4,768,304 | 4,137,770 | 4,058,241 |
| Marketing of non-banking financial products: | |||
| Investment funds | 1,189,527 | 1,108,586 | 851,766 |
| Insurance | 1,273,137 | 992,088 | 794,234 |
| Capitalization | 266,620 | 238,777 | 136,144 |
| Total | 2,729,284 | 2,339,451 | 1,782,144 |
| Securities services: | |||
| Securities underwriting and placement | 272,714 | 374,368 | 252,236 |
| Securities trading | 101,104 | 136,916 | 148,244 |
| Administration and custody | 102,603 | 109,353 | 129,241 |
| Asset management | 2,963 | 2,932 | 1,960 |
| Total | 479,384 | 623,569 | 531,681 |
| Other: | |||
| Foreign exchange | 351,768 | 310,311 | 314,720 |
| Financial guarantees | 232,688 | 248,127 | 219,549 |
| Other fees and commissions | 207,742 | 174,065 | 241,829 |
| Total | 792,198 | 732,503 | 776,098 |
| Total | 8,769,170 | 7,833,293 | 7,148,164 |
F-58
|
|
|
|
BANCO SANTANDER (BRASIL) S.A.
NOTES TO THE CONSOLIDATED FINANCIAL STATEMENTS FOR THE YEARS ENDED DECEMBER 31, 2011, 2010 AND 2009 |
|
|
(Amounts in thousands of Brazilian Reais - R$, unless otherwise stated) |
|
33. Fee and commission expense
“Fee and commission expense” shows the amount of all fees and commissions paid or payable by the Bank in the year, except those that form an integral part of the effective interest rate on financial instruments.
| The breakdown of the balance of this item is as follows: | |||
| Thousands of Reais | 2011 | 2010 | 2009 |
| Fees and commissions assigned to third parties | 1,015,786 | 660,802 | 485,182 |
|
Of which: Credit cards |
834,412 | 463,391 | 349,874 |
| Other fees and commissions (1) | 413,886 | 336,983 | 425,220 |
| Total | 1,429,672 | 997,785 | 910,402 |
| (1) Refers mainly to expenditure on services of the financial system. | |||
34. Gains (losses) on financial assets and liabilities (net)
“Gains (losses) on financial assets and liabilities (net)” includes the amount of the valuation adjustments of financial instruments, except those attributable to interest accrued as a result of application of the effective interest method and to allowances, and the gains or losses obtained from the sale and purchase thereof.
| a) Breakdown | |||
| The breakdown of the balance of this item, by type of instrument, is as follows: | |||
| Thousands of Reais | 2011 | 2010 | 2009 |
| Held for trading (1) | (902,167) | 1,159,058 | 2,032,272 |
| Other financial instruments at fair value through profit or loss (2) | 57,039 | (26,828) | (10,132) |
| Financial instruments not measured at fair value through profit or loss | 705,279 | 254,162 | 755,916 |
|
Of which: Available-for-sale financial assets |
|||
|
Debt instruments |
452,972 | 31,397 | 122,886 |
|
Equity instruments |
256,694 | 204,592 | 559,080 |
| Hedging derivatives and other | 26,190 | 71,758 | (61,733) |
| Total | (113,659) | 1,458,150 | 2,716,323 |
|
(1) Includes the economic hedge of the Bank’s position in Cayman, which is a non-autonomous subsidiary. See note 23 for the income tax impact of such hedge.
|
|||
| b) Financial assets and liabilities at fair value through profit or loss | |||
| The detail of the amount of the asset balances is as follows: | |||
| Thousands of Reais | 2011 | 2010 | 2009 |
| Loans and amounts due from credit institutions | 60,813 | 339,696 | 1,974,435 |
| Loans and advances to customers | - | - | 389,113 |
| Debt instruments | 25,528,841 | 16,696,801 | 12,765,008 |
| Equity instruments | 822,728 | 20,707,290 | 16,331,550 |
| Derivatives | 4,154,482 | 5,017,359 | 4,950,006 |
| Total | 30,566,864 | 42,761,146 | 36,410,112 |
| The detail of the amount of the liability balances is as follows: | |||
| Thousands of Reais | 2011 | 2010 | 2009 |
| Deposits from credit institutions | - | - | 1,795 |
| Trading derivatives | 4,709,660 | 4,755,314 | 4,401,709 |
| Short positions | 337,628 | 29,339 | 33,025 |
| Total | 5,047,288 | 4,784,653 | 4,436,529 |
| 35. Exchange differences (net) | |||
“Exchange differences (net)” shows basically the gains or losses on currency dealings, the differences that arise on translations of monetary items in foreign currencies to the functional currency, and those disclosed on non-monetary assets in foreign currency at the time of their disposal.
F-59
|
|
|
|
BANCO SANTANDER (BRASIL) S.A.
NOTES TO THE CONSOLIDATED FINANCIAL STATEMENTS FOR THE YEARS ENDED DECEMBER 31, 2011, 2010 AND 2009 |
|
|
(Amounts in thousands of Brazilian Reais - R$, unless otherwise stated) |
|
| 36. Other operating income (expense) | |||
| The breakdown of "Other operating income (expense)" is as follows: | |||
| Thousands of Reais | 2011 | 2010 | 2009 |
| Profit from insurance contracts | 432,135 | 311,835 | 232,976 |
|
Of which: |
|||
|
Income from insurance contracts |
4,132,663 | 6,830,524 | 3,591,713 |
|
Expense from insurance contracts |
(3,700,528) | (6,518,689) | (3,358,737) |
| Other operating income | 539,737 | 148,337 | 189,067 |
| Other operating expense | (1,167,571) | (642,970) | (355,776) |
| Contributions to fund guarantee of credit - FGC | (183,719) | (165,201) | (181,891) |
| Total | (379,418) | (347,999) | (115,624) |
| 37. Personnel expenses | |||
| a) Breakdown | |||
| The breakdown of “Personnel expenses” is as follows: | |||
|
Thousands of Reais |
2011 | 2010 | 2009 |
|
|
|||
| Wages and salaries | 4,191,813 | 3,731,340 | 3,363,877 |
| Social security costs | 1,091,585 | 993,971 | 971,245 |
| Benefits | 865,517 | 791,361 | 749,366 |
| Defined benefit pension plans (note 22.b) | 19,460 | 16,212 | 36,534 |
| Contributions to defined contribution pension plans | 55,425 | 49,641 | 49,976 |
| Share-based payment costs | 95,689 | 90,461 | 19,990 |
| Training | 115,725 | 92,974 | 88,084 |
| Other personnel expenses | 208,517 | 160,216 | 231,900 |
| Total | 6,643,731 | 5,926,176 | 5,510,972 |
| b) Share-Based Compensation | |||
Banco Santander has two long-term compensation plans linked to the market price of the shares – the Global Program and the Local Program. The members of the Executive Board and other key employees of Banco Santander are eligible for these plans, besides the members selected by the Board of Directors and informed to the Human Resources, which selection may fall according to the seniority of the group. For the Board of Directors members in order to be eligible, it is necessary to exercise Executive Board functions.
b.1) Local Program
The Extraordinary Shareholders’ Meeting of Banco Santander held on February 3, 2010 approved the Share-Based Compensation Program - Units of Banco Santander (Local Plan), consisting of two independent plans: Stock Option Plan for Share Deposit Certificates - Units (SOP) and Long-Term Incentive Plan - Investment in Share Deposit Certificates - Units (PSP).
On 25 October 2011, Banco Santander held an Extraordinary General Meeting, which approved the grant of the Incentive Plan Long Term (SOP 2014) - Investment in Certificates of Deposit Shares ("Units") to certain directors and Managerial level employees of the Company and companies under its control.
The characteristic of each plan are:
SOP Plan: It is a three-year Stock Option Plan by which new shares of the Banco Santander are issued, as a manner of retaining the officers’ commitment to long-term results. The period for exercising the options starts on June 30, 2012 and is two years longer than the vesting period. The volume equivalent to 1/3 of the Units resulting from the exercise of options cannot be sold by the participant during a period of one year from the exercise date.
Long-Term Incentive Plan - SOP 2014: It is a three-year Stock Option Plan. The period for exercise begins on June 30, 2014 until June 30, 2016. The number of Units exercisable by the participants will be determined according to the result of the determination of a performance parameter of the Company: total Shareholder Return (TSR) and may be reduced if failure to achieve the goals of reducing the Return on Risk Adjusted Capital (RORAC), comparison between realized and budgeted in each year, as determined by the Board of Directors. Additionally, it is necessary that the participant remains in the Company during the term of the Plan to acquire a position to exercise the corresponding Units.
PSP Plan: It is a compensation plan based on shares settled in cash, launched in three-year cycles, retaining the executives’ commitment to long-term results. The minimum amount, corresponding to 50% of the compensation settled in cash, should be used by the participant to acquire Units, which cannot be sold during a period of 1 year from the exercise date.
b.1.1) Fair Value and Plans Performance Parameters
For accounting of the Local Program plans, an independent consultant promoted simulations based on Monte Carlo methodology's, as presented the performance parameters used to calculate the shares to be granted. Such parameters are associated with their respective probabilities of occurrence, which are updated at the close of each period.
F-60
|
|
|
|
BANCO SANTANDER (BRASIL) S.A.
NOTES TO THE CONSOLIDATED FINANCIAL STATEMENTS FOR THE YEARS ENDED DECEMBER 31, 2011, 2010 AND 2009 |
|
|
(Amounts in thousands of Brazilian Reais - R$, unless otherwise stated) |
|
|
SOP, PI12 -
PSP and PI13 -
PSP Plans (1) |
SOP 2014 (2) | |
| Total Shareholder Return (TSR) rank | % of Exercisable Shares | |
| 1st | 50% | 100% |
| 2nd | 35% | 75% |
| 3th | 25% | 50% |
| 4th | 0% | 25% |
|
(1) Associated with the TSR, the remaining 50% of the shares subject to exercise refer to the realization of net income vs. budgeted profit.
|
||
| For measurement of the fair value the following premises was used: | ||
| PI13 - PSP | PI12 - PSP | |
| Method of Assessment | Binomial | Binomial |
| Volatility | 57.37% | 57.37% |
| Probability of Occurrence | 37.58% | 60.93% |
| Risk-Free Rate | 10.50% | 11.18% |
| SOP 2014 | SOP plan | |
| Method of Assessment | Black&Scholes | Binomial |
| Volatility | 40.00% | 57.37% |
| Rate of Dividends | 3.00% | 5.43% |
| Vesting Period | 2 years | 2,72 years |
| Average Exercise Time | 5 years | 3,72 years |
| Risk-Free Rate | 10.50% | 11.18% |
| Probability of Occurrence | 53.43% | 60.93% |
| Fair Value of the Option Shares | R$5,81 | R$7,19 |
The average value of shares SANB11 in the end of the year is R$14.96 (2010 - R$21.90).
On December 31, daily pro-rata expenses amounting R$13,153 (2010 - R$20,976), relating to the SOP plan and R$15,910 (2010 - R$6,525) relating to the PSP plan. Also recorded in the period a gain with the movement of the market value of the share of the PSP Plan in the amount of R$5.650 as "Gains (losses) on financial assets and liabilities (net) - Others".
The stock options of Plan SOP may dilute the basic earnings per share in the future. On December 31, 2011, these options were not included in the calculation of diluted earnings per share because they are anti-dilutive for the presented years.
|
Number of
Shares |
Exercise
Price in Reais |
Concession
Year |
Employees |
Date of
Commenceme
nt
of Exercise Period |
Expiration Date of Exercise Period | |
| Balance on December 31, 2009 | - | |||||
| Granted SOP options | 15,500,000 | 23.50 | 2010 | Managers | 02/03/10 | 06/30/14 |
| Granted PSP options | 1,471,475 | - | 2010 | Managers | 02/03/10 | 06/30/12 |
| Cancelled SOP options | (2,877,141) | 23.50 | 2010 | Managers | 02/03/10 | 06/30/14 |
| Cancelled PSP options | (179,802) | - | 2010 | Managers | 02/03/10 | 06/30/12 |
| Final Balance on December 31, 2010 | 13,914,532 | |||||
| Cancelled PI12 - PSP options | (106,718) | - | 2010 | Managers | 02/03/10 | 06/30/12 |
| Cancelled PI12 - SOP options | 40,479 | 23.50 | 2010 | Managers | 02/03/10 | 06/30/14 |
| Granted PI13 - PSP options | 1,498,700 | - | 2011 | Managers | 02/03/10 | 06/30/13 |
| Cancelled PI13 - PSP options | (130,493) | - | 2011 | Managers | 02/03/10 | 06/30/13 |
| Granted SOP 2014 options | 14,450,000 | 14.31 | 2011 | Managers | 10/26/11 | 12/31/13 |
| Final Balance on December 31, 2011 | 29,666,500 | |||||
| SOP | 12,663,338 | - | 2011 | Managers | 02/03/10 | 06/30/14 |
| PI12 - PSP | 1,184,955 | - | 2011 | Managers | 02/03/10 | 06/30/12 |
| PI13 - PSP | 1,368,207 | - | 2011 | Managers | 02/03/10 | 06/30/13 |
| SOP 2014 | 14,450,000 | - | 2011 | Managers | 10/26/11 | 12/31/13 |
| Total | 29,666,500 | |||||
| b.2) Global Program | ||||||
| Long-Term Incentive Policy | ||||||
The meeting of the Board of Directors’ of Santander Spain held on March 26, 2008, approved the long-term incentive policy intended for the executives of Banco Santander Spain and the Santander Group companies (except Banco Español de Crédito, S.A. - Banesto). This policy provides for compensation tied to the performance of the stock of Santander Spain, as established in the Annual Stockholders’ Meeting.
Among the plans of Banco Santander Spain, Conglomerate Santander's executives in Brazil already participate in the Stock Plan Tied to Goals: multiyear plan paid in shares of Banco Santander Spain. This plan’s beneficiaries are the Executive Officers and other members of Top Management, as well as any other group of executives appointed by the Executive Board or the Executive Committee.
F-61
|
|
|
|
BANCO SANTANDER (BRASIL) S.A.
NOTES TO THE CONSOLIDATED FINANCIAL STATEMENTS FOR THE YEARS ENDED DECEMBER 31, 2011, 2010 AND 2009 |
|
|
(Amounts in thousands of Brazilian Reais - R$, unless otherwise stated) |
|
This plan involves three-years cycles for the delivery of shares to the beneficiaries, so that each cycle is started within a year, and starting 2009, ends in the following year. The purpose is to establish an appropriate sequence between the end of the incentive program, tied to the previous plan, I-06, and the successive cycles of this plan. Accordingly, the first two cycles started in July 2007, with the first cycle lasting two years (Plan I09) and the other cycles lasting three years, on average (Plan I10/Plan I11/Plan I12/Plan I13 and Plan l14).
Each of these parameters has a weight of 50% in the determination of the percentage of shares to be granted. The number of shares to be granted is determined in each cycle by the goal attainment level on the third anniversary of the start of each cycle (except the first cycle, for which the second anniversary will be considered).
From the plan Pl12 the purpose determines the number of actions relate just one performance condition, which has 100% weight in the percentage of shares tobe distributed: the TSR Group.
Global Plan Fair Value
It was assumed that the beneficiaries will not leave the Bank’s employ during the term of each plan. The fair value of the 50% linked to the Bank’s relative TSR position was calculated, on the grant date, on the basis of the report provided by external valuators whose assessment was carried out using a Monte Carlo valuation model, performing 10 thousand simulations to determine the TSR of each of the companies in the Benchmark Group, taking into account the variables set forth below. The results (each of which represents the delivery of a number of shares) are classified in decreasing order by calculating the weighted average and discounting the amount at the risk-free interest rate.
| PI10 | PI11 | PI12 | PI13 | PI14 | |
| Expected volatility (*) | 15.67% | 19.31% | 42.36% | 49.64% | 51.35% |
| Annual dividend yield based on last few years | 3.24% | 3.47% | 4.88% | 6.33% | 6.06% |
| Risk-free interest rate (Treasury Bond yield –zero coupon) over the period of the plan | 4.50% | 4.84% | 2.04% | 3.33% | 4.07% |
|
(*) calculated on the basis of historical volatility over the corresponding period (two or three years) |
|||||
In view of the high correlation between TSR and EPS, it was considered feasible to extrapolate that (in a high percentage of cases) the TSR value is also valid for EPS. Therefore, it was initially determined that the fair value of the portion of the plans linked to the Bank’s relative EPS position, i.e. of the remaining 50% of the options granted, was the same as that of the 50% corresponding to the TSR. Since this valuation refers to a non-market condition, it is reviewed and adjusted on a yearly basis.
|
Number of
Shares |
Granted Year | Employees |
Data of
Commenceme nt of Exercise Period |
Data of Expiry
of Exercise Period |
|
| Final Balance on December 31, 2007 | 7,996,687 | ||||
| Options Exercised (Plan I06) | (4,657,550) | - | Managers | 01/15/08 | 01/15/09 |
| Options Granted (Plan I11) | 2,311,231 | 2008 | Managers | 06/21/08 | 07/31/11 |
| Final Balance on December 31, 2008 | 5,650,368 | ||||
| Options Cancelled (Plan I06) | (1,261,450) | - | Managers | 01/15/08 | 01/15/09 |
| Exercised Options (Plan I09) | (681,767) | 2007 | Managers | 06/23/07 | 07/31/09 |
| Cancelled Options (Plan I09) | (152,565) | 2007 | Managers | 06/23/07 | 07/31/09 |
| Options Granted (Plan I12) | 455,008 | 2009 | Managers | 06/19/09 | 07/31/12 |
| Final Balance on December 31, 2009 | 4,009,594 | ||||
| Exercised Options (PI10) | (1,161,014) | 2007 | Managers | 06/23/07 | 07/31/10 |
| Cancelled Options (PI10) | (82,341) | 2007 | Managers | 06/23/07 | 07/31/10 |
| Granted Options (PI12) | 86,198 | 2009 | Managers | 06/19/09 | 07/31/12 |
| Granted Options (PI13) | 597,811 | 2010 | Managers | 07/01/10 | 07/31/13 |
| Final Balance on December 31, 2010 | 3,450,248 | ||||
| Exercised Options (PI11) | (1,783,945) | 2008 | Managers | 06/21/08 | 07/31/11 |
| Cancelled Options (PI11) | (527,286) | 2008 | Managers | 06/21/08 | 07/31/11 |
| Granted Options (PI14) | 531,684 | 2011 | Managers | 07/01/11 | 07/31/14 |
| Final Balance on December 31, 2011 | 1,670,701 | ||||
| Plan I12 | 541,206 | 2009 | Managers | 06/19/09 | 07/31/12 |
| Plan I13 | 597,811 | 2010 | Managers | 07/01/10 | 07/31/13 |
| Plan I14 | 531,684 | 2011 | Managers | 07/01/11 | 07/31/14 |
| Total | 1,670,701 | ||||
On 2011, pro-rata expenses were registered in the amount of R$10,147 thousand (2010 - R$14,393 thousand and 2009 - R$19,893 thousand), related to the costs of the cycles mentioned above, regarding the total amount of the Global Program Plans. In 2010, include the "pro rata" expenses for PI10, which had its last cycle closed in July, 2010. Expenses related to these plans are recognized in contrast to "Other liabilities - Provision for share-based payment" (note 24) because they are settled in cash.
Plans do not cause dilution of the share capital of the Bank, because they are paid in shares of Banco Santander Spain.
b.3) Share-Based Bonus
The Annual Shareholders’ Meeting of Banco Santander Spain, held on June 11, 2010, approved the new policy for executive compensation through a share-based bonus plan effective for all the companies of the Group, including Santander Brasil. This new policy, subject to adjustments applicable to Santander Brasil, were approved by Appointment and Compensation Committee and Board of Directors at the meeting to be held on February 2, 2011.
F-62
|
|
|
|
BANCO SANTANDER (BRASIL) S.A.
NOTES TO THE CONSOLIDATED FINANCIAL STATEMENTS FOR THE YEARS ENDED DECEMBER 31, 2011, 2010 AND 2009 |
|
|
(Amounts in thousands of Brazilian Reais - R$, unless otherwise stated) |
|
The plan's objectives are: (i) to align the compensation program with the principles of the “Financial Stability Board” (FSB) agreed upon at the G20; (ii) to align Banco Santander’s interests with those of the plan’s participants (to achieve the sustainable and recurring growth and profitability of Banco Santander’s businesses and to recognize the participants’ contributions); (iii) to allow the retention of participants; and (iv) to improve Banco Santander’s performance and defend the interests of shareholders via a long-term commitment.
The purpose of the plan is the cash payment of part of the variable compensation owed by Banco Santander to the plan’s participants pursuant to the bank’s compensation policy, based on the future performance of the bank’s shares.
The payment of share-based bonus is within the limits of the overall management compensation approved by Banco Santander's Annual Shareholders' Meeting.
The total number of shares on which the compensation plan is based will be settled in three installments and equally allocated to each of the three fiscal years following the reference year.
On December 31, 2011, was recorded daily pro-rata expenses amounting R$56,479 (2010 - R$48,544 thousand) referring to the provision for Share-Based Bonus and Gain was recorded with the oscillation of the market value of the share of the plan of R$14,287 as personnel expenses.
On December 21, 2011, the Board of Directors approved the proposed new incentive plan (deferred) for payment of the variable remuneration of directors and certain employees, which will be subject to resolution of the ordinary general meeting February 7, 2012.
This proposal are certain requirements for deferred payment of part of the future variable compensation due to its managers and other employees, given the financial basis for sustainable long-term adjustments in future payments due to the risks assumed and fluctuations in cost of capital.
The plan is divided into 3 programs:
• Supervised Collective - Participants of the Executive Committee and other executives who take significant risks in the Bank and responsible for the control areas. The deferral will be half in cash, indexed to 100% of CDI and half in shares.
• Collective unsupervised - Statutory Directors - not part of the Statutory Directors' Collective Supervised ", the amount deferred will be 100% in Units" SANB11".
• Unsupervised Collective - Employees - managerial employees and other employees of the organization that will be benefited from the deferral plan. The deferred amount will be 100% cash, indexed to 120% of CDI.
| 38. Other administrative expenses | |||
| a) Breakdown | |||
| The breakdown of the balance of this item is as follows: | |||
| Thousands of Reais | 2011 | 2010 | 2009 |
| Property, fixtures and supplies | 1,087,222 | 965,633 | 1,043,498 |
| Technology and systems | 1,006,015 | 888,922 | 897,581 |
| Advertising | 493,630 | 421,643 | 497,246 |
| Communications | 566,083 | 554,713 | 612,904 |
| Per diems and travel expenses | 174,166 | 150,875 | 167,954 |
| Taxes other than income tax | 58,633 | 88,833 | 54,208 |
| Surveillance and cash courier services | 521,462 | 513,325 | 468,833 |
| Insurance premiums | 10,234 | 8,811 | 8,888 |
| Specialized and technical services | 1,563,545 | 1,504,306 | 1,448,984 |
|
Technical reports |
363,525 | 380,866 | 377,331 |
|
Others specialized and technical services |
1,200,020 | 1,123,440 | 1,071,653 |
| Other administrative expenses | 247,912 | 207,365 | 236,149 |
| Total | 5,728,901 | 5,304,426 | 5,436,245 |
| b) Other information | |||
The balance of “Technical reports” includes the fees paid by the consolidated companies (detailed in the accompanying Appendix I) to their respective auditors, the detail being as follows:
| Thousands of Reais | 2011 | 2010 | 2009 |
|
Audit of the annual financial statements and audit related services of the companies audited by Deloitte (constant scope of consolidation) |
8,828 | 9,054 | 6,180 |
| Audit of the annual financial statements audit related services of the companies audited by Deloitte (additions to scope of consolidation) | - | - | 373 |
Additionally to the expenses with audit of the financial statements, the Bank had an fee paid to Deloitte in 2009 related to the audit of the Global Offering in the amount of R$8.8 million, after taxes and was recorded as transaction cost net of capital increase.
Services provided by others audit firms totaled R$5,4 million (2010 - R$15,0 million and 2009 - R$2,5 million).
F-63
|
|
|
|
BANCO SANTANDER (BRASIL) S.A.
NOTES TO THE CONSOLIDATED FINANCIAL STATEMENTS FOR THE YEARS ENDED DECEMBER 31, 2011, 2010 AND 2009 |
|
|
(Amounts in thousands of Brazilian Reais - R$, unless otherwise stated) |
|
| 39. Gains (losses) on disposal of assets not classified as non-current assets held for sale | |||
| The breakdown of the balance of this item is as follows: | |||
| Thousands of Reais | 2011 | 2010 | 2009 |
| Gains | 6,759 | 341 | 3,377,953 |
| On disposal of tangible assets | 6,759 | 229 | 36,161 |
| On disposal of investments (1) | - | 112 | 3,341,792 |
| Losses | (1,439) | (59,527) | (8,652) |
| On disposal of tangible assets | (1,439) | (260) | (8,652) |
| On disposal of investments | - | (59,267) | - |
| Total | 5,320 | (59,186) | 3,369,301 |
(1) In 2009, the Bank made a disposal of investment of Companhia Brasileira de Meios de Pagamentos - (VisaNet), Tecban - Tecnologia Bancária S.A. and Companhia Brasileira de Soluções e Serviços - CBSS accounting a net gain of R$3,315 million.
40. Gains (losses) on non-current assets held for sale not classified as discontinued operations
It refers basically to the result on disposal of property received in the processes of recovery of loans to customers and the provision of the recoverable value of these assets. In 2011, includes R$424,292 thousand gain on sale of Santander Insurance (note 3.a). In 2010, includes R$106,827 thousand of gain on sale of office buildings, mainly related to the move to new headquarter (2009 - R$63,000 thousand).
41. Other disclosures
a) Guarantees and commitments
The Bank provides a variety of guarantees to its customers to improve their credit standing and allow them to compete. The following table summarizes at December 31, 2011, 2010 and 2009 all of the guarantees.
As required, the “maximum potential amount of future payments” represents the notional amounts that could be lost if there were a total default by the guaranteed parties, without consideration of possible recoveries from collateral held or pledged, or recoveries under recourse provisions. There is no relationship between these amounts and probable losses on these guarantees. In fact, maximum potential amount of future payments significantly exceeds inherent losses.
| Thousands of Reais | 2011 | 2010 | 2009 |
| Maximum potential amount of future payments | |||
| Contingent liabilities | |||
| Guarantees and other sureties | |||
|
Financial guarantees |
17,818,624 | 18,117,260 | 17,379,109 |
|
Performance guarantees |
910,655 | 907,676 | 695,099 |
|
Financial standby letters of credit |
2,213,135 | 2,823,715 | 2,189,135 |
|
Other |
929,378 | 273,759 | 243,406 |
| Other contingent exposures | 700,160 | 440,702 | 460,621 |
|
Documentary Credits |
700,160 | 440,702 | 460,621 |
| Total Contingent Liabilities | 22,571,952 | 22,563,112 | 20,967,370 |
| Commitments | |||
| Loan commitments drawable by third parties (1) | 98,552,891 | 93,472,343 | 77,789,371 |
| Total Commitments | 98,552,891 | 93,472,343 | 77,789,371 |
| Total | 121,124,843 | 116,035,455 | 98,756,741 |
| (1) Includes the approved limits and unused overdraft, credit card and others. | |||
Financial guarantees are provided to our clients in obligations with third parties. We have the right to seek reimbursement from our clients for any amount we shall have to pay under such guarantee. Additionally, we may hold cash or other highly liquid collateral for these obligations. These agreements are subject to the same credit evaluation performed on the origination of loans.
We expect many of these guarantees to expire without the need to disburse any cash. Therefore, in the ordinary course of business, we expect that these transactions will have virtually no impact on our liquidity.
Performance guarantees are issued to guarantee customers obligations such as to make contractually specified investments, to supply specified products, commodities, or maintenance or warranty services to a third party, completion of projects in accordance with contract terms, etc. Financial standby letters of credit include guarantees of payment of loans, credit facilities, promissory notes and trade acceptances. The Bank always requires collateral to grant this kind of financial guarantees. In Documentary Credits, the Bank acts as a payment mediator between trading companies located in different countries (import-export transactions). Under a documentary credit transaction, the parties involved deal with the documents rather than the commodities to which the documents may relate. Usually the traded commodities are used as collateral to the transaction and the Bank may provide some credit facilities. Loan commitments drawable by third parties include mostly credit card lines and commercial commitments. Credit card lines are unconditionally cancelable by the issuer. Commercial commitments are mostly 1 year facilities subject to information requirements to be provided by our customers.
The risk criteria followed to issue all kinds of guarantees, financial standby letters of credit, documentary credits and any risks of signature are in general the same as those used for other products of credit risk, and therefore subject to the same admission and tracking standards. The guarantees granted on behalf of our customers are subject to the same credit quality review process as any other risk product. On a regular basis, at least once a year, the solvency of the mentioned customers is checked as well as the probability of those guarantees to be executed. In case that any doubt on the customer’s solvency may arise we create allowances with charge to net income, by the amount of the inherent losses even if there is no claim to us.
F-64
|
|
|
|
BANCO SANTANDER (BRASIL) S.A.
NOTES TO THE CONSOLIDATED FINANCIAL STATEMENTS FOR THE YEARS ENDED DECEMBER 31, 2011, 2010 AND 2009 |
|
|
(Amounts in thousands of Brazilian Reais - R$, unless otherwise stated) |
|
The provision for losses on the non-recovery guarantees and other securities (Note 9.c) is recorded as "Impairment losses on financial assets (net)” on consolidated income statement and its calculation is described in note 2.h.
Additionally, the liability recognized as deferred revenue for the premium received for providing the above guarantees, which is being amortized into income over the life of the related guarantees is R$76,324 thousand (2010 - R$R$80,056 thousand and 2009 - R$65,041 thousand).
| b) Off-balance-sheet funds under management | |||
|
The detail of off-balance-sheet funds managed by the Bank is as follows: |
|||
| Thousands of Reais | 2011 | 2010 | 2009 |
| Investment funds | 104,877,454 | 102,516,308 | 95,324,100 |
| Assets under management | 8,144,334 | 8,822,049 | 3,083,043 |
| Total | 113,021,788 | 111,338,357 | 98,407,143 |
c) Third-party securities held in custody
At December 31, 2011, the Bank held in custody debt securities and equity instruments totaling R$122,198,361 thousand (2010 - R$194,063,773 thousand and 2009 -R$94,949,464 thousand) entrusted to it by third parties.
| d) Residual maturity periods and Average interest rates | ||||||||
| The breakdown, by maturity, of the balances of certain items in the consolidated balance sheets is as follows: | ||||||||
| December 31, 2011 | ||||||||
| Thousands of Reais | ||||||||
|
On
Demand |
Up to
3 Months |
3 to
12 Months |
1 to
3 Years |
3 to
5 Years |
After 5
Years |
Total |
Average
Interest Rate |
|
| Assets: | ||||||||
| Cash and balances with the Brazilian Central Bank | 48,330,086 | 10,073,723 | 7,534,194 | - | - | - | 65,938,003 | 11.3% |
| Debt instruments | - | 6,498,289 | 5,795,261 | 25,972,025 | 12,507,634 | 18,118,048 | 68,891,257 | 11.0% |
| Equity instruments | 2,130,575 | - | - | - | - | - | 2,130,575 | |
| Loans and amounts due from credit institutions | 5,731,172 | 2,309,372 | 2,199,399 | 1,189,022 | 1,919,282 | 6,341,427 | 19,689,674 | 9.7% |
| Loans and advances to customer, gross | 10,113,580 | 44,546,345 | 59,788,958 | 52,036,749 | 19,390,744 | 8,308,061 | 194,184,437 | 23.7% |
| Total | 66,305,413 | 63,427,729 | 75,317,812 | 79,197,796 | 33,817,660 | 32,767,536 | 350,833,946 | 18.0% |
| Liabilities: | ||||||||
| Financial liabilities at amortized cost: | ||||||||
|
Deposits from credit institutions |
618,585 | 29,430,719 | 12,555,672 | 6,923,632 | 1,043,065 | 955,348 | 51,527,021 | 9.2% |
|
Customer deposits |
37,035,145 | 40,490,745 | 19,044,846 | 56,390,445 | 15,123,854 | 6,388,857 | 174,473,891 | 9.6% |
|
Marketable debt securities |
- | 3,389,679 | 16,130,779 | 15,781,068 | 3,204,393 | 84,505 | 38,590,423 | 8.8% |
|
Subordinated liabilities |
- | - | - | 5,402,364 | 5,269,434 | 236,546 | 10,908,344 | 11.2% |
|
Other financial liabilities |
176,974 | 15,461,434 | 45,819 | 267,780 | - | - | 15,952,007 | |
| Total | 37,830,704 | 88,772,577 | 47,777,115 | 84,765,289 | 24,640,746 | 7,665,256 | 291,451,687 | 9.5% |
| Difference (assets less liabilities) | 28,474,709 | (25,344,848) | 27,540,696 | (5,567,493) | 9,176,914 | 25,102,280 | 59,382,259 | |
F-65
|
|
|
|
BANCO SANTANDER (BRASIL) S.A.
NOTES TO THE CONSOLIDATED FINANCIAL STATEMENTS FOR THE YEARS ENDED DECEMBER 31, 2011, 2010 AND 2009 |
|
|
(Amounts in thousands of Brazilian Reais - R$, unless otherwise stated) |
|
| December 31, 2010 | ||||||||
| Thousands of Reais | ||||||||
|
On
Demand |
Up to
3 Months |
3 to
12 Months |
1 to
3 Years |
3 to
5 Years |
After 5
Years |
Total |
Average
Interest Rate |
|
| Assets: | ||||||||
| Cash and balances with the Brazilian Central Bank | 44,343,701 | 7,966,178 | 4,490,272 | - | - | - | 56,800,151 | 11.0% |
| Debt instruments | - | 6,705,785 | 3,455,031 | 36,393,309 | 6,947,815 | 8,754,287 | 62,256,227 | 11.5% |
| Equity instruments | 22,435,327 | - | - | - | - | - | 22,435,327 | |
| Loans and amounts due from credit institutions | 5,735,109 | 1,747,182 | 2,319,266 | 946,794 | 3,716,619 | 8,533,246 | 22,998,216 | 6.7% |
| Loans and advances to customer, gross | 9,744,791 | 37,616,374 | 51,095,094 | 45,347,623 | 10,536,509 | 6,217,932 | 160,558,323 | 21.3% |
| Total | 82,258,928 | 54,035,519 | 61,359,663 | 82,687,726 | 21,200,943 | 23,505,465 | 325,048,244 | 15.1% |
| Liabilities: | ||||||||
| Financial liabilities at amortized cost: | ||||||||
|
Deposits from credit institutions |
856,322 | 19,304,849 | 10,358,095 | 10,669,471 | 524,889 | 677,946 | 42,391,572 | 6.0% |
|
Customer deposits |
46,603,707 | 28,910,116 | 26,300,047 | 58,599,472 | 4,401,853 | 3,134,006 | 167,949,201 | 9.7% |
|
Marketable debt securities |
- | 3,194,214 | 6,446,755 | 7,422,491 | 2,482,347 | 540,838 | 20,086,645 | 10.4% |
|
Subordinated liabilities |
- | - | - | 3,010,208 | 1,902,811 | 4,782,086 | 9,695,105 | 10.9% |
|
Other financial liabilities |
2,432,612 | 10,608,134 | 20,440 | 157,062 | - | - | 13,218,248 | |
| Total | 49,892,641 | 62,017,313 | 43,125,337 | 79,858,704 | 9,311,900 | 9,134,876 | 253,340,771 | 9.2% |
| Difference (assets less liabilities) | 32,366,287 | (7,981,794) | 18,234,326 | 2,829,022 | 11,889,043 | 14,370,589 | 71,707,473 | |
|
December 31, 2009
Thousands of Reais |
||||||||
|
On
Demand |
Up to
3 Months |
3 to
12 Months |
1 to
3 Years |
3 to
5 Years |
After 5
Years |
Total |
Average
Interest Rate |
|
| Assets: | ||||||||
| Cash and balances with the Brazilian Central Bank | 12,169,277 | 6,828,836 | 8,270,899 | - | - | - | 27,269,012 | 8.9% |
| Debt instruments | - | 14,279,921 | 1,784,616 | 13,049,117 | 20,751,920 | 7,645,358 | 57,510,932 | 10.8% |
| Equity instruments | 17,991,746 | - | - | - | - | - | 17,991,746 | |
| Loans and amounts due from credit institutions | 3,246,260 | 8,375,243 | 4,313,669 | 1,308,300 | 2,477,758 | 6,481,348 | 26,202,578 | 9.2% |
| Loans and advances to customer, gross | 6,716,360 | 25,651,927 | 41,119,405 | 47,045,584 | 12,505,072 | 5,356,055 | 138,394,403 | 23.8% |
| Total | 40,123,643 | 55,135,927 | 55,488,589 | 61,403,001 | 35,734,750 | 19,482,761 | 267,368,671 | 16.4% |
| Liabilities: | ||||||||
| Financial liabilities at amortized cost: | ||||||||
|
Deposits from credit institutions |
189,858 | 5,237,243 | 7,437,307 | 7,486,135 | 742,446 | 104,765 | 21,197,754 | 8.5% |
|
Customer deposits |
40,358,100 | 33,634,930 | 30,639,047 | 40,770,381 | 4,032,168 | 5,530 | 149,440,156 | 8.8% |
|
Marketable debt securities |
- | 3,242,520 | 4,882,803 | 936,678 | 1,532,956 | 844,053 | 11,439,010 | 7.9% |
|
Subordinated liabilities |
- | 2,104 | - | - | 4,330,919 | 6,971,422 | 11,304,445 | 9.6% |
|
Other financial liabilities |
3,650,259 | 6,340,210 | (33,470) | 249,391 | (18,226) | - | 10,188,164 | |
| Total | 44,198,217 | 48,457,007 | 42,925,687 | 49,442,585 | 10,620,263 | 7,925,770 | 203,569,529 | 8.8% |
| Difference (assets less liabilities) | (4,074,574) | 6,678,920 | 12,562,902 | 11,960,416 | 25,114,487 | 11,556,991 | 63,799,142 | |
| e) Equivalent Reais value of assets and liabilities | ||||||||
| The detail of the main foreign currency balances in the consolidated balance sheet, based on the nature of the related items, is as follows: | ||||||||
| Equivalent Value in Thousands of Reais | 2011 | 2010 | 2009 | |||||
| Assets | Liabilities | Assets | Liabilities | Assets | Liabilities | |||
| Cash and balances with the Brazilian Central Bank | 71,341 | - | 66,065 | - | 2,069,530 | - | ||
| Financial assets/liabilities held for trading | 1,441,332 | 1,370,402 | 1,127,863 | 1,050,380 | 1,981,386 | 1,048,742 | ||
| Available-for-sale financial assets | 701,636 | - | 1,057,000 | - | 713,042 | - | ||
| Loans and receivables | 22,060,787 | - | 21,437,906 | - | 15,092,956 | - | ||
| Financial liabilities at amortized cost | - | 27,087,602 | - | 22,926,205 | - | 17,469,224 | ||
| Total | 24,275,667 | 28,458,004 | 23,688,834 | 23,976,585 | 19,856,914 | 18,517,966 | ||
f) Fair value of financial assets and liabilities not measured at fair value
The financial assets owned by the Bank are measured at fair value in the accompanying consolidated balance sheet, except for loans and receivables.
F-66
|
|
|
|
BANCO SANTANDER (BRASIL) S.A.
NOTES TO THE CONSOLIDATED FINANCIAL STATEMENTS FOR THE YEARS ENDED DECEMBER 31, 2011, 2010 AND 2009 |
|
|
(Amounts in thousands of Brazilian Reais - R$, unless otherwise stated) |
|
Similarly, the Bank’s financial liabilities except for financial liabilities held for trading and those measured at fair value - are measured at amortized cost inthe consolidated balance sheet.
i) Financial assets measured at other than fair value
Following is a comparison of the carrying amounts of the Bank’s financial assets measured at other than fair value and their respective fair values at year-end:
| Thousands of Reais | 2011 | 2010 | 2009 | |||
| Assets |
Carrying
Amount |
Fair Value |
Carrying
Amount |
Fair Value |
Carrying
Amount |
Fair Value |
| Loans and receivables: | ||||||
| Loans and amounts due from credit institutions (note 5) | 19,628,861 | 19,535,160 | 22,658,520 | 22,658,520 | 24,228,143 | 24,228,143 |
| Loans and advances to customers (note 9) | 183,066,268 | 183,202,428 | 151,366,561 | 151,536,439 | 127,934,811 | 128,065,076 |
| Debt instruments (note 6) | 62,062 | 58,043 | 81,444 | 87,208 | - | - |
| Total | 202,757,191 | 202,795,631 | 174,106,525 | 174,282,167 | 152,162,954 | 152,293,219 |
ii) Financial liabilities measured at other than fair value
Following is a comparison of the carrying amounts of the Bank’s financial liabilities measured at other than fair value and their respective fair values at year-end:
| Thousands of Reais | 2011 | 2010 | 2009 | |||
| Liabilities |
Carrying
Amount |
Fair Value |
Carrying
Amount |
Fair Value |
Carrying
Amount |
Fair Value |
| Financial liabilities at amortized cost: | ||||||
| Deposits from credit institutions (note 16) | 51,527,021 | 51,524,429 | 42,391,572 | 42,391,572 | 21,195,959 | 21,195,959 |
| Customer deposits (note 17) (*) | 174,473,891 | 174,496,664 | 167,949,201 | 167,953,896 | 149,440,156 | 149,448,949 |
| Marketable debt securities (note 18) | 38,590,423 | 38,564,263 | 20,086,645 | 20,054,667 | 11,439,010 | 11,435,722 |
| Subordinated liabilities (note 19) | 10,908,344 | 10,908,344 | 9,695,105 | 9,695,105 | 11,304,445 | 11,304,445 |
| Other financial liabilities (note 20) | 15,952,007 | 15,952,007 | 13,218,248 | 13,218,248 | 10,188,164 | 10,188,164 |
| Total | 291,451,686 | 291,445,707 | 253,340,771 | 253,313,488 | 203,567,734 | 203,573,239 |
|
(*) For these purposes, the fair value of customer demand deposits, which are included within customer deposits, are taken to be the same as their carrying amount. |
||||||
| The methods and assumptions to estimate the fair value are defined below: | ||||||
- Short-term investments - The short-term investments includes the interbank deposits and the repurchase agreements. The carrying amount is approximated to the fair value.
- Loans operations – Fair value are estimated for groups of loans with similar characteristics. The fair value was measured by discounting estimated cash flow using the interest rate of new contracts.
- Deposits – The fair value of deposits was calculated by discounting the difference between the cash flows on a contractual basis and current market rates for instruments with similar maturities. For variable-rate deposits, the carrying amount was considered to approximate fair value.
- Long-term loans – The fair value of long-term loans were estimated by cash flow discounted at the interest rate offered on the market with similar terms and maturities.
g) Other Obligations
The Bank rents properties, mainly used for branches, based on a standard contract which may be cancelled at its own criterion and includes the right to opt for renewals and adjustment clauses, classified as operating lease. Total future minimum payments of non-cancelable operating leases as of December 31, 2011 is R$2,019,005 thousand, of which R$602,554 thousand matures in up to 1 year, R$1,361,285 thousand from 1 year to up to 5 years and R$55,166 thousand after 5 years. Additionally, the Banco Santander has contracts for a matures indeterminate, totaling R$2,273 thousand monthly rent corresponding to the contracts with this feature. Payment of operating leases recognized as expenses for the period were R$633,342 thousand.
Monthly rental contracts will be adjusted on an annual basis, as per prevailing legislation, at Índice Geral de Preços do Mercado (IGPM) variation. The lessee is entitled to unilaterally rescind the agreement, at any time, without paying fines, encumbrances or penalties, through a written communication to the lesser upon 30 days prior notice, without prejudice to rent payment and charges due until then.
h) Obligation offset and settlement agreements
Obligation offset and settlement agreements - Resolution CMN 3.263/2005 – The Bank has an obligation offset and settlement agreement within the ambit of national financial institutions (SFN), entered into with individuals and legal entities which may or may not be members of SFN, resulting in improved assurance of financial settlement, with the parties with which it has this type of agreement. These agreements establish that payment obligations with the Bank, arising from loans and derivative transactions, in case of default of the counterparty, will be offset against payment obligations of the Bank with the counterparty.
i) Contingent assets
On December 31, 2011, 2010 and 2009 no contingent assets were accounted.
F-67
|
|
|
|
BANCO SANTANDER (BRASIL) S.A.
NOTES TO THE CONSOLIDATED FINANCIAL STATEMENTS FOR THE YEARS ENDED DECEMBER 31, 2011, 2010 AND 2009 |
|
|
(Amounts in thousands of Brazilian Reais - R$, unless otherwise stated) |
|
| j) Statements of value added | ||||||
|
The following Statements of value added is not required under IFRS but being presented as supplementary information as required by Brazilian Corporate Law for publicly-held companies, and has been derived from the Bank´s consolidated financial statements prepared in accordance with IFRS. |
||||||
| Thousands of Reais | 2011 | 2010 | 2009 | |||
| Interest and similar income | 51,736,080 | 40,909,204 | 39,342,956 | |||
| Net fee and commission income | 7,339,498 | 6,835,508 | 6,237,762 | |||
| Impairment losses on financial assets (net) | (9,381,549) | (8,233,810) | (9,966,404) | |||
| Other income and expense | (520,714) | 1,578,772 | 2,579,411 | |||
| Interest expense and similar charges | (23,834,316) | (16,814,126) | (17,175,865) | |||
| Third-party input | (7,771,693) | (6,605,215) | (5,969,602) | |||
|
Materials, energy and others |
(540,634) | (500,280) | (650,747) | |||
|
Third-party services |
(4,150,734) | (3,882,909) | (3,925,548) | |||
|
Impairment of assets |
(38,646) | (20,600) | (900,554) | |||
|
Other |
(3,041,679) | (2,201,426) | (492,753) | |||
| Gross added value | 17,567,306 | 17,670,333 | 15,048,258 | |||
| Retention | ||||||
|
Depreciation and amortization |
(1,462,034) | (1,237,410) | (1,248,612) | |||
| Added value produced | 16,105,272 | 16,432,923 | 13,799,646 | |||
| Added value received from transfer | ||||||
|
Investments in affiliates and subsidiaries |
54,216 | 43,942 | 295,414 | |||
| Added value to distribute | 16,159,488 | 16,476,865 | 14,095,060 | |||
| Added value distribution | ||||||
| Employee | 5,834,177 | 36.1% | 5,176,648 | 31.4% | 4,874,983 | 34.6% |
|
Compensation |
4,277,355 | 3,807,408 | 3,365,593 | |||
|
Benefits |
950,549 | 871,607 | 854,150 | |||
|
Government severance indemnity funds for employees - FGTS |
319,941 | 285,373 | 246,238 | |||
|
Other |
286,332 | 212,260 | 409,002 | |||
| Taxes | 2,022,870 | 12.5% | 3,452,290 | 21.0% | 3,319,362 | 23.5% |
|
Federal |
1,971,489 | 3,402,502 | 3,294,845 | |||
|
State |
877 | 410 | 453 | |||
|
Municipal |
50,504 | 49,378 | 24,064 | |||
| Compensation of third-party capital - rental | 546,588 | 3.4% | 465,353 | 2.8% | 392,751 | 2.8% |
| Remuneration of interest on capital | 7,755,853 | 48.0% | 7,382,574 | 44.8% | 5,507,964 | 39.1% |
|
Dividends and interest on capital |
2,901,160 | 3,540,000 | 1,575,000 | |||
|
Profit Reinvestment |
4,846,765 | 3,842,093 | 3,932,606 | |||
|
Profit (loss) attributable to non-controlling interests |
7,928 | 481 | 358 | |||
| Total | 16,159,488 | 100.0% | 16,476,865 | 100.0% | 14,095,060 | 100.0% |
| 42. Operating segments | ||||||
| In accordance with IFRS 8, an operating segment is a component of an entity: | ||||||
(a) that engages in business activities from which it may earn revenues and incur expenses (including revenues and expenses relating to transactions with other components of the same entity),
(b) whose operating results are regularly reviewed by the entity’s chief operating decision maker to make decisions about resources to be allocated to the segment and assess its performance, and
(c) for which discrete financial information is available.
Following such guidance, the Bank has identified the following business segments as its operating segments:
• Commercial Banking,
• Global Wholesale Banking,
• Asset Management and Insurance.
The Bank operates in Brazil and abroad, through the Cayman branch, with Brazilian clients and therefore has no geographical segments.
The Commercial Banking segment encompasses the entire commercial banking business (except for the Corporate Banking business managed globally using the Global Relationship Model). The Asset Management and Insurance segment includes the contribution to the Bank arising from the design and management of the investment fund, pension and insurance businesses of the various units. The Global Wholesale Banking segment reflects the returns on the Global Corporate Banking business, those on Investment Banking and Markets worldwide, including all the globally managed treasury departments and the equities business.
F-68
|
|
|
|
BANCO SANTANDER (BRASIL) S.A.
NOTES TO THE CONSOLIDATED FINANCIAL STATEMENTS FOR THE YEARS ENDED DECEMBER 31, 2011, 2010 AND 2009 |
|
|
(Amounts in thousands of Brazilian Reais - R$, unless otherwise stated) |
|
| The condensed income statements and other significant data are as follows: | ||||
| Thousands of Reais | 2011 | |||
| (Condensed) Income Statement | Commercial Banking (2) | Global Wholesale Banking | Asset Management and Insurance | Total |
| NET INTEREST INCOME | 24,971,366 | 2,589,070 | 341,328 | 27,901,764 |
| Income from equity instruments | 93,727 | - | - | 93,727 |
| Income from companies accounted for by the equity method | 54,216 | - | - | 54,216 |
| Net fee and commission income | 6,191,891 | 796,350 | 351,257 | 7,339,498 |
| Gains (losses) on financial assets and liabilities (net) and Exchange differences (net) (1) | (753,198) | 513,041 | 5,134 | (235,023) |
| Other operating income (expense) | (695,387) | (29,304) | 345,273 | (379,418) |
| TOTAL INCOME | 29,862,615 | 3,869,157 | 1,042,992 | 34,774,764 |
| Personnel expenses | (6,031,433) | (525,525) | (86,773) | (6,643,731) |
| Other administrative expenses | (5,431,219) | (242,032) | (55,650) | (5,728,901) |
| Depreciation and amortization | (1,331,287) | (105,780) | (24,967) | (1,462,034) |
| Provisions (net) | (3,024,150) | 2,866 | (40,179) | (3,061,463) |
| Impairment losses on financial assets (net) | (9,334,483) | (47,066) | - | (9,381,549) |
| Impairment losses on non-financial assets (net) | (33,743) | (4,707) | (196) | (38,646) |
| Other non-financial gains (losses) | 452,096 | - | - | 452,096 |
| OPERATING PROFIT BEFORE TAX (1) | 5,128,396 | 2,946,913 | 835,227 | 8,910,536 |
| Other: | ||||
| Total assets | 345,579,236 | 51,045,367 | 3,261,479 | 399,886,082 |
| Loans and advances to customers | 148,372,380 | 34,653,359 | 40,529 | 183,066,268 |
| Customer deposits | 150,404,639 | 22,471,578 | 1,597,674 | 174,473,891 |
| Thousands of Reais | 2010 | |||
| (Condensed) Income Statement | Commercial Banking | Global Wholesale B anking | Asset Management and Insurance | Total |
| NET INTEREST INCOME | 21,301,329 | 2,501,318 | 292,431 | 24,095,078 |
| Income from equity instruments | 51,721 | - | - | 51,721 |
| Income from companies accounted for by the equity method | 43,942 | - | - | 43,942 |
| Net fee and commission income | 5,529,572 | 891,897 | 414,039 | 6,835,508 |
| Gains (losses) on financial assets and liabilities (net) and Exchange differences (net) (1) | 1,550,319 | 244,408 | 80,323 | 1,875,050 |
| Other operating income (expense) | (596,271) | (29,992) | 278,264 | (347,999) |
| TOTAL INCOME | 27,880,612 | 3,607,631 | 1,065,057 | 32,553,300 |
| Personnel expenses | (5,354,100) | (512,097) | (59,979) | (5,926,176) |
| Other administrative expenses | (5,003,189) | (215,499) | (85,738) | (5,304,426) |
| Depreciation and amortization | (1,129,919) | (57,718) | (49,773) | (1,237,410) |
| Provisions (net) | (1,940,727) | 4,039 | (37,638) | (1,974,326) |
| Impairment losses on financial assets (net) | (8,225,451) | (8,359) | - | (8,233,810) |
| Impairment losses on non-financial assets (net) | (20,601) | - | 1 | (20,600) |
| Other non-financial gains (losses) | 139,951 | - | - | 139,951 |
| OPERATING PROFIT BEFORE TAX (1) | 6,346,576 | 2,817,997 | 831,930 | 9,996,503 |
| Other: | ||||
| Total assets | 308,973,195 | 40,139,949 | 25,549,539 | 374,662,683 |
| Loans and advances to customers | 121,175,888 | 30,149,793 | 40,880 | 151,366,561 |
| Customer deposits | 144,385,872 | 22,180,522 | 1,382,807 | 167,949,201 |
F-69
|
|
|
|
BANCO SANTANDER (BRASIL) S.A.
NOTES TO THE CONSOLIDATED FINANCIAL STATEMENTS FOR THE YEARS ENDED DECEMBER 31, 2011, 2010 AND 2009 |
|
|
(Amounts in thousands of Brazilian Reais - R$, unless otherwise stated) |
|
| Thousands of Reais | 2009 | |||
| (Condensed) Income Statement | Commercial Banking | Global Wholesale Banking |
Asset
Management
and Insurance |
Total |
| NET INTEREST INCOME | 20,260,381 | 1,766,812 | 139,898 | 22,167,091 |
| Income from equity instruments | 29,903 | - | - | 29,903 |
| Income from companies accounted for by the equity method | 295,414 | - | - | 295,414 |
| Net fee and commission income | 4,969,848 | 863,326 | 404,588 | 6,237,762 |
| Gains (losses) on financial assets and liabilities (net) and Exchange differences (net) (1) | 1,751,572 | 859,209 | 54,351 | 2,665,132 |
| Other operating income (expense) | (280,861) | (22,540) | 187,777 | (115,624) |
| TOTAL INCOME | 27,026,257 | 3,466,807 | 786,614 | 31,279,678 |
| Personnel expenses | (4,971,773) | (474,295) | (64,904) | (5,510,972) |
| Other administrative expenses | (5,213,092) | (175,017) | (48,136) | (5,436,245) |
| Depreciation and amortization | (1,175,995) | (38,635) | (33,982) | (1,248,612) |
| Provisions (net) | (3,389,253) | (45,050) | (46,390) | (3,480,693) |
| Impairment losses on financial assets (net) | (9,883,382) | (83,022) | - | (9,966,404) |
| Impairment losses on non-financial assets (net) | (899,172) | - | (1,382) | (900,554) |
| Other non-financial gains (losses) | 3,400,931 | - | - | 3,400,931 |
| OPERATING PROFIT BEFORE TAX (1) | 4,894,521 | 2,650,788 | 591,820 | 8,137,129 |
| Other: | ||||
| Total assets | 253,639,547 | 40,738,892 | 21,594,137 | 315,972,576 |
| Loans and advances to customers | 99,511,366 | 28,571,262 | 241,296 | 128,323,924 |
| Customer deposits | 124,296,966 | 23,872,581 | 1,270,609 | 149,440,156 |
(1) Includes in the Commercial Bank, the fiscal hedge of investment on Cayman branch (a strategy to mitigate the effects of fiscal and exchange rate changes on investments offshore over the net income), which result is recorded in “Gains/losses on financial assets and liabilities (net)” fully offset the tax line. The effects of the devaluation of the Real against the Dollar in 2011 generated losses of R$1,646,212 thousand. In 2010 were recorded gains of R$272,131 thousand and 2009 earnings of R$936,528 thousand.
(2) Institutional results, such as the gain on the sale of Santander Seguros in 2011, are allocated in the Commercial Banking segment.
To allow a better assessment of the operating segment, from 2010, the assets related to insurance activities are presented in the insurance segment and asset management. For purposes of comparison, in 2009 we made the reclassification of these assets, since they were assigned to other operating segments. The insurance assets were incorporated into the Bank in the third quarter of 2009 with the merger of shares of Santander Seguros.
Additionally, the Bank does not have any customers that individually accounted for 10% or greater of our interest and similar income for 2011, 2010 and 2009.
43. Related party transactions
The parties related to the Bank are deemed to include, in addition to its subsidiaries, associates and jointly controlled entities, the Bank’s key management personnel and the entities over which the key management personnel may exercise significant influence or control.
Following is a detail of the ordinary business transactions performed by the Bank with its related parties on December 31, 2011, 2010 and 2009:
a) Key-person management compensation
At the meeting held on April 26, 2011, was approved the global compensation proposal of directors (Board of Directors and Executive Officers) for the year 2011, amounting to R$283,540 thousand, covering fixed remuneration, variable and equity-based and other benefits. Additionally, was approved the global compensation of the Audit Committee members for the period of 12 months from March 24, 2011, in the amount of up to R$3,960 thousand.
i) Long-term benefits
The Santander Brazil as well as Santander Spain, as other subsidiaries of Santander Group, have long-term compensation programs tied to its share's performance, based on the achievement of goals.
| ii) Short-term benefits | |||
| The following table shows the Board of Directors’, Executive Board’s and Audit Committee compensation: | |||
| Thousands of Reais | 2011 | 2010 | 2009 |
| Fixed compensation | 48,997 | 45,078 | 35,258 |
| Variable compensation | 162,154 | 133,649 | 118,240 |
| Share based payments | 18,067 | 29,083 | 3,250 |
| Other | 11,818 | 8,659 | 6,294 |
| Total (1) (2) | 241,036 | 216,469 | 163,042 |
(1) Refers to the amount paid by Banco Santander to its executives officers for the positions which they hold in the Bank and other companies of the conglomerate. And in 2011, includes the share incurred with the changes in administrative structure and governance in the completion of the Bank's integration process.
(2) In 2011, they were paid to the Directors of Santander Seguros and Santander Asset the amount of R$8,312 thousand (2010 - R$6,667 thousand).
Additionally, in 2011, charges were collected on key-person management compensation amounting R$22,768 thousand (2010 - R$23,547 thousand and 2009 - R$12,294 thousand).
iii) Contract termination
Employment contracts have an undefined period. The termination of the employment relationship for non-fulfillment of obligations or voluntarily does not entitle executives to any financial compensation.
F-70
|
|
|
|
BANCO SANTANDER (BRASIL) S.A.
NOTES TO THE CONSOLIDATED FINANCIAL STATEMENTS FOR THE YEARS ENDED DECEMBER 31, 2011, 2010 AND 2009 |
|
|
(Amounts in thousands of Brazilian Reais - R$, unless otherwise stated) |
|
b) Lending operations
Under current law, it is not granted loans or advances involving:
I - officers, members of board of directors and audit committee as well as their spouses and relatives up to the 2nd degree;
II - individuals or legal entities of Banco Santander, which hold more than 10% of the share capital;
III - Legal entities which hold more than 10% of the share capital, Banco Santander and its subsidiaries;
IV - - legal entities which hold more than 10% of the share capital, any of the directors or members of the Board of Directors and Audit Committee or management's own financial institution, as well as their spouses or relatives up to the second degree.
c) Ownership Interest
The table below shows the direct interest (common shares and preferred shares) as of December 31, 2011, 2010 and 2009:
| December 31, 2011 | ||||||
| Stockholders' |
Common Shares
(thousands) |
Common Shares (%) |
Preferred
Shares
(thousands) |
Preferred Shares (%) |
Total
Shares
(thousands) |
Total Shares (%) |
| Grupo Empresarial Santander, S.L. (1) | 72,876,994 | 34.2% | 61,631,776 | 33.1% | 134,508,770 | 33.7% |
| Sterrebeeck B.V. (1) | 99,527,083 | 46.8% | 86,492,330 | 46.5% | 186,019,413 | 46.6% |
| Banco Santander, S.A. (1) | 2,090,231 | 1.0% | 1,900,210 | 1.0% | 3,990,441 | 1.0% |
| Santander Insurance Holding (1) | 206,664 | 0.1% | - | 0.0% | 206,664 | 0.1% |
| Employees | 211,427 | 0.1% | 193,458 | 0.1% | 404,885 | 0.1% |
| Members of the Board of Directors | (*) | (*) | (*) | (*) | (*) | (*) |
| Members of the Executive Board | (*) | (*) | (*) | (*) | (*) | (*) |
| Other | 37,929,333 | 17.8% | 35,984,611 | 19.3% | 73,913,944 | 18.5% |
| Total | 212,841,732 | 100.0% | 186,202,385 | 100.0% | 399,044,117 | 100.0% |
|
(1) Companies of the Santander Spain Group.
(*) None of the members of the Board of Directors and the Executive Board holds 1.0% or more of any class of shares. |
||||||
| December 31, 2010 | ||||||
| Stockholders' |
Common
Shares
(thousands) |
Common Shares (%) |
Preferred
Shares
(thousands) |
Preferred Shares (%) |
Total
Shares
(thousands) |
Total Shares (%) |
| Grupo Empresarial Santander, S.L. (1) | 74,967,225 | 35.2% | 63,531,986 | 34.1% | 138,499,211 | 34.7% |
| Sterrebeeck B.V. (1) | 99,527,083 | 46.8% | 86,492,330 | 46.5% | 186,019,413 | 46.6% |
| Santander Insurance Holding (1) (2) | 206,663 | 0.1% | - | 0.0% | 206,663 | 0.1% |
| Employees | 240,934 | 0.1% | 220,512 | 0.1% | 461,446 | 0.1% |
| Members of the Board of Directors | (*) | (*) | (*) | (*) | (*) | (*) |
| Members of the Executive Board | (*) | (*) | (*) | (*) | (*) | (*) |
| Other | 37,899,827 | 17.8% | 35,957,557 | 19.3% | 73,857,384 | 18.5% |
| Total | 212,841,732 | 100.0% | 186,202,385 | 100.0% | 399,044,117 | 100.0% |
(*) None of the members of the Board of Directors and the Executive Board holds 1.0% or more of any class of shares.
(1) Companies of the Santander Spain Group.
(2) On August, 2010, a F-1 filling took place at CVM and SEC, which reported on the intention of sale of equity interest held by Santander Insurance Holding, SL, in the form of ADRs, in the United States market. Therefore, 4,538,420,040 common shares and 4,125,836,400 preferred shares were converted to compose 82,516,728 Units/ADRs (equivalent to ownership position of 2.17% in Banco Santander). Between the months of August to December 2010, the equity position owned by SIH in the form of ADRs were totally alienated; 77,627,222 in the third quarter and 4,889,506 in the fourth quarter.
| December 31, 2009 | ||||||
| Stockholders' |
Common
Shares (thousands) |
Common
Shares (%) |
Preferred
Shares (thousands) |
Preferred
Shares (%) |
Total
Shares (thousands) |
Total
Shares (%) |
| Grupo Empresarial Santander, S.L. (1) | 74,967,225 | 35.2% | 63,531,986 | 34.1% | 138,499,211 | 34.7% |
| Sterrebeeck B.V. (1) | 99,527,083 | 46.8% | 86,492,330 | 46.5% | 186,019,413 | 46.6% |
| Santander Seguros S/A (2) | 7,241 | 0.0% | 9,525 | 0.0% | 16,766 | 0.0% |
| Santander Insurance Holding (1) | 4,745,084 | 2.2% | 4,125,836 | 2.2% | 8,870,920 | 2.2% |
| Employees | 311,840 | 0.1% | 284,366 | 0.2% | 596,206 | 0.1% |
| Members of the Board of Directors | (*) | (*) | (*) | (*) | (*) | (*) |
| Members of the Executive Board | (*) | (*) | (*) | (*) | (*) | (*) |
| Other | 33,283,259 | 15.7% | 31,758,342 | 17.0% | 65,041,601 | 16.4% |
| Total | 212,841,732 | 100.0% | 186,202,385 | 100.0% | 399,044,117 | 100.0% |
(*) None of the members of the Board of Directors and the Executive Board holds 1.0% or more of any class of shares.
(1) Companies of the Santander Spain Group.
(2) The Merger of Santander Seguros' shares, mentioned in note 3, led to mutual participation between Banco Santander and Santander Seguros. On May 26, 2010, the Santander Seguros sold the participation in Banco Santander corresponding to
16,767 thousand shares (7,241 thousand ordinary shares and 9,526 thousand preference shares) traded at BM&FBovespa, eliminating the mutual participation between Banco Santander and Santander Seguros.
F-71
|
|
|
|
BANCO SANTANDER (BRASIL) S.A.
NOTES TO THE CONSOLIDATED FINANCIAL STATEMENTS FOR THE YEARS ENDED DECEMBER 31, 2011, 2010 AND 2009 |
|
|
(Amounts in thousands of Brazilian Reais - R$, unless otherwise stated) |
|
Amendment to Form F-3 and sales of ADS by Santander Group
On November 14, 2011, Banco Santander filed the application for registration of an amendment number 2 to the Registration Statement on Form F-3, which is valid automatically, with the Securities and Exchange Commission (SEC), to allow the sale of ADS or Units of Banco Santander by the Santander Group companies orown Banco Santander. Additionally, in terms of a prospectus supplement filed on November 16, 2011, any one shareholder of Banco Santander SA (Santander Spain), Grupo Empresarial Santander SL (GES), and Banco Madesant - Sociedade Unipessoal S.A. (an affiliate company of the group) may offer for sale, periodically, to 310,832,288 ADS or Units of Banco Santander. The purpose of these documents is to have available for sale on a registered basis, by Banco Santander and certain companies belonging to Grupo Santander, about 8% of the share capital of Banco Santander. As reported by Banco Santander Spain, is the intention of Grupo Santander the record is used to: (i) allow greater flexibility to the Santander Group in relation to the fulfillment of its commitment to deliver about 5% of its shareholding in Banco Santander on the terms of the exchangeable securities issued; and (ii) comply with the commitment of Santander Spain to reach a free float of 25% in Banco Santander before October, 2012 (or subject to an agreement with BM&FBOVESPA, before October 2014), when market conditions are appropriate. No registration with the CVM public offering of securities in Brazil was requested. On 9 January, 2012 the GES transferred to Santander Spain ADRs representing approximately 5.18% of the capital of Santander Brasil, in an internal reorganization at the Santander Group, for the transfer of approximately 4.41% of the capital of Santander Brasil to a third party that will deliver the same share to investors in the exchangeable securities issued by Santander Spain in October 2010 when due and as provided in such securities. The exchangeable securities issued by Santander Spain has been the subject of a Material Fact dated October 29, 2010. As a result of these transfers Santander Spain, directly or indirectly, now holds 78.14% of voting capital and 76.97% of the total capital of Santander Brasil, and the free float rose to 22.75% of total capital.
d) Related-Party Transactions
Transactions among the entities of Banco Santander are carried out under usual market value, rates and terms, and under commutative condition.
Santander has the Policy on Related Party Transactions approved by theBoardof Directors, which aim to ensure that all transactions are made on the policy typified in view the interests of Banco Santander and its shareholders. The policy defines powers to approve certain transactions by the Board of Directors. The rules laid down are also applied to all employees and directors of Banco Santander and its subsidiaries.
The operations and remuneration of services with related parties are made in the ordinary course of business and under reciprocal conditions, including interest rates, terms and guarantees, and involve no greater risk than the normal billing or have other disadvantages.
F-72
|
|
|
|
BANCO SANTANDER (BRASIL) S.A.
NOTES TO THE CONSOLIDATED FINANCIAL STATEMENTS FOR THE YEARS ENDED DECEMBER 31, 2011, 2010 AND 2009 |
|
|
(Amounts in thousands of Brazilian Reais - R$, unless otherwise stated) |
|
| The principal transactions and balances are as follows: | ||||||
| Thousands of Reais | 2011 | 2010 | ||||
| Parent (1) |
Joint-
controlled
companies |
Other Related- Party (2) | Parent (1) |
Joint-
controlled
companies |
Other Related- Party (2) | |
| Assets | ||||||
| Trading derivatives, net | (25,639) | - | (442,496) | 35,513 | - | (125,147) |
|
Banco Santander, S.A. – Spain |
(25,639) | - | - | 35,513 | - | - |
|
Santander Benelux, S.A., N.V. |
- | - | (308,821) | - | - | (118,521) |
|
Abbey National Treasury Services Plc |
- | - | (39,102) | - | - | (33,076) |
|
Real Fundo de Investimento Multimercado Santillana Credito Priv |
- | - | (94,573) | - | - | 26,450 |
| Loans and amounts due from credit institutionso - Cash and | ||||||
| overnight operations in foreign currency | 227,724 | - | 1,097 | 4,245,332 | - | 729 |
|
Banco Santander, S.A. – Spain (3) |
227,724 | - | - | 4,245,332 | - | - |
|
Banco Santander Totta, S.A. |
- | - | 1,097 | - | - | 729 |
| Loans and amounts due from credit institutions - Others | 95,539 | 822,928 | 266,568 | 16,922 | 269,667 | 279,535 |
|
Banco Santander, S.A. – Spain |
95,539 | - | - | 16,922 | - | - |
|
Santander Benelux, S.A., N.V. |
- | - | 262,818 | - | - | 258,261 |
|
Companhia de Crédito, Financiamento e Investimento RCI Brasil |
- | 822,606 | - | - | 263,559 | - |
|
Companhia de Arrendamento Mercantil RCI Brasil |
- | 322 | - | - | 6,108 | - |
|
Abbey National Treasury Services Plc |
- | - | 1,369 | - | - | 18,817 |
|
Santander Overseas Bank, Inc – Puerto Rico |
- | - | 2.381 | - | - | 2.457 |
| Other Assets | 5,438 | 615 | 383,871 | 27,090 | 795 | - |
|
Banco Santander, S.A. – Spain |
5,438 | - | - | 27,090 | - | - |
|
Companhia de Crédito, Financiamento e Investimento RCI Brasil |
- | 615 | - | - | 529 | - |
|
Companhia de Arrendamento Mercantil RCI Brasil |
- | - | - | - | 266 | - |
|
Santander Seguros |
- | - | 326,637 | - | - | - |
|
Others |
- | - | 57,234 | - | - | - |
| Liabilities | ||||||
| Deposits from credit institutions | (1,200,207) | (15,213) | (171,371) | (2,167,452) | (76,340) | (1,940,158) |
|
Banco Santander, S.A. – Spain (4) |
(1,200,207) | - | - | (2,167,452) | - | - |
|
Grupo Banesto: Sociedades consolidables |
- | - | (167,081) | - | - | (75,477) |
|
Banco Madesant - Sociedade Unipessoal, S.A. (5) |
- | - | - | - | - | (1,857,963) |
|
Companhia de Crédito, Financiamento e Investimento RCI Brasil |
- | (10,348) | - | - | (73,270) | - |
|
Companhia de Arrendamento Mercantil RCI Brasil |
- | (4,865) | - | - | (3,070) | - |
|
Others |
- | - | (4,290) | - | - | (6,718) |
| Customer deposits | - | - | (422,753) | - | - | (375,869) |
|
ISBAN Brasil S.A. |
- | - | (110,341) | - | - | (129,500) |
|
Produban Serviços de Informática S.A. |
- | - | (47,970) | - | - | (43,439) |
|
Universia Brasil S.A. |
- | - | (310) | - | - | (3,218) |
|
Real Fundo de Investimento Multimercado Santillana Credito Priv |
- | - | (223,367) | - | - | (198,236) |
|
Fundo de Investimento Multimercado Menorca Crédito Privado |
- | - | (31,062) | - | - | - |
|
Others |
- | - | (9,703) | - | - | (1,476) |
| Other Liabilities - Dividends and Bonuses Payable | (908,004) | - | (3,615) | (1,703,847) | - | (1,037) |
|
Banco Santander, S.A. – Spain (4) |
(7,772) | - | - | - | - | - |
|
Grupo Empresarial Santander, S.L. (1) |
(379,617) | - | - | (726,925) | - | - |
|
Santander Insurance Holding, S.L. |
- | - | (553) | - | - | (1,037) |
|
Sterrebeeck B.V. (1) |
(520,615) | - | - | (976,922) | - | - |
|
Banco Madesant - Sociedade Unipessoal, S.A. |
- | - | (3,062) | - | - | - |
| Other Payables | (3,972) | - | (85,979) | (6,353) | - | (52,586) |
|
Banco Santander, S.A. – Spain |
(3,972) | - | - | (6,353) | - | - |
|
Santander Insurance Holding, S.L. |
- | - | (9,257) | - | - | (52,358) |
|
Santander Seguros |
- | - | (74,772) | - | - | - |
|
Others |
- | - | (1,950) | - | - | (228) |
F-73
|
|
|
|
BANCO SANTANDER (BRASIL) S.A.
NOTES TO THE CONSOLIDATED FINANCIAL STATEMENTS FOR THE YEARS ENDED DECEMBER 31, 2011, 2010 AND 2009 |
|
|
(Amounts in thousands of Brazilian Reais - R$, unless otherwise stated) |
|
| Thousands of Reais | Parent (1) |
2009
Joint-
controlled
companies |
Other Related- Party (2) |
| Assets | |||
| Trading derivatives, net | 35,331 | - | (84,068) |
|
Banco Santander, S.A. – Spain |
35,331 | - | - |
|
Santander Benelux, S.A., N.V. |
- | - | (66,259) |
|
Abbey National Treasury Services Plc |
- | - | (24,028) |
|
Others |
- | - | 6,219 |
| Loans and amounts due from credit institutionso - Cash and overnight operations in foreign currency | - | - | 909 |
|
Banco Santander Totta, S.A. |
- | - | 901 |
|
Others |
- | - | 8 |
| Loans and amounts due from credit institutions - Others | - | 335,526 | - |
|
Companhia de Crédito, Financiamento e Investimento RCI Brasil |
- | 297,772 | - |
|
Companhia de Arrendamento Mercantil RCI Brasil |
- | 37,754 | - |
| Other Assets | 115 | 541 | 27 |
|
Banco Santander, S.A. – Spain |
115 | - | - |
|
Companhia de Crédito, Financiamento e Investimento RCI Brasil |
- | 323 | - |
|
Companhia de Arrendamento Mercantil RCI Brasil |
- | 218 | - |
|
Others |
- | - | 27 |
| Liabilities | |||
| Deposits from credit institutions | (2,741,547) | (15,142) | (546,805) |
|
Banco Santander, S.A. – Spain (4) |
(2,741,547) | - | - |
|
Grupo Banesto: Sociedades consolidables |
- | - | (157,283) |
|
Abbey National Beta Investments Limited |
- | - | (387,616) |
|
Companhia de Crédito, Financiamento e Investimento RCI Brasil |
- | (12,516) | - |
|
Others |
- | (2,626) | (1,906) |
| Customer deposits | - | - | (455,733) |
|
ISBAN Brasil S.A. |
- | - | (112,134) |
|
Produban Serviços de Informática S.A. |
- | - | (43,138) |
|
Real Fundo de Investimento Multimercado Santillana Credito Privado |
- | - | (192,139) |
|
Fundo de Investimento Multimercado Menorca Crédito Privado |
- | - | (106,506) |
|
Others |
- | - | (1,816) |
| Other Liabilities - Dividends and Bonuses Payable | (1,310,097) | - | (81,701) |
|
Grupo Empresarial Santander, S.L. (1) |
(570,414) | - | - |
|
Santander Insurance Holding, S.L. |
- | - | (81,701) |
|
Sterrebeeck B.V. (1) |
(739,683) | - | - |
| Other Payables | (9,266) | - | (60,203) |
|
Banco Santander, S.A. – Spain |
(9,266) | - | - |
|
Santander Insurance Holding, S.L. |
- | - | (59,922) |
|
Others |
- | - | (281) |
(*) All loans and amounts to related parties were made in our ordinary course of business and on sustainable basis, including interest rates and collateral and did not involve more than the normal risk of collectability or present other unfavorable features.
(1) Banco Santander (Brasil) S.A. is indirectly controlled by Banco Santander Spain (note 1-a), through its subsidiary Grupo Empresarial Santander, S.L. and Sterrebeeck B.V.
(2) Refers to the Company's subsidiaries (Banco Santander, S.A .- Spain).
(3) In 2011, includes cash (2010 - R$315,203). In 2010, refers to overnight operations in foreign currency, amounting R$3,930,129 with interest of 0.22% p.a. and 2009 - R$ 993,768 thousand with interest of 0.07% p.a.
(4) In 2011, refers to fund raising operations through transfers abroad amounting R$1,200,207 thousand with maturity until January 2015 and interest between 0.39% and 5.82% p.a. In 2010, includes raising funds through operations overseas transfers totaling R$1,995,608 thousand with maturity date until January 2015 and interest between 0.25% and 7.89% p.a. (2009 - R$2,663,465 thousand with maturity until July 2014 and interest between 0.43% and 6.8% p.a.).
(5) In 2010, refers to raising funds through time deposits with maturity on February 28, 2011 and interest of R$1.76% p.a.
F-74
|
|
|
|
BANCO SANTANDER (BRASIL) S.A.
NOTES TO THE CONSOLIDATED FINANCIAL STATEMENTS FOR THE YEARS ENDED DECEMBER 31, 2011, 2010 AND 2009 |
|
|
(Amounts in thousands of Brazilian Reais - R$, unless otherwise stated) |
|
| Thousands of Reais | Parent (1) | 2011 Joint- controlled companies | Other Related- Party (2) | Parent (1) |
2010
Joint-
controlled
companies |
Other Related-
Party (2) |
| Income | ||||||
| Interest and similar income - Loans and amounts due from credit institutions | 5,046 | 50,771 | 267 | 2,384 | 39,395 | 1,029 |
|
Banco Santander, S.A. – Spain |
5,046 | - | - | 2,384 | - | - |
|
Abbey National Treasury Services Plc |
- | - | 14 | - | - | 1,029 |
|
Companhia de Crédito, Financiamento e Investimento RCI Brasil |
- | 50,771 | - | - | 38,545 | - |
|
Companhia de Arrendamento Mercantil RCI Brasil |
- | - | - | - | 850 | - |
|
Santander Benelux, S.A., N.V. |
- | - | 253 | - | - | - |
| Interest expense and similar charges - Customer deposits | - | - | (37,974) | - | - | (28,827) |
|
ISBAN Brasil S.A. |
- | - | (10,551) | - | - | (9,359) |
|
Produban Serviços de Informática S.A. |
- | - | (3,841) | - | - | (2,736) |
|
Real Fundo de Investimento Multimercado Santillana Credito Priv |
- | - | (21,777) | - | - | (16,166) |
|
Others |
- | - | (1,805) | - | - | (566) |
| Interest expense and similar charges - Deposits from credit institutions | (15,311) | (620) | (5,044) | (47,134) | (526) | (32,676) |
|
Banco Santander, S.A. – Spain |
(15,311) | - | - | (47,134) | - | - |
|
Abbey National Beta Investments Limited |
- | - | - | - | - | (7,415) |
|
Companhia de Crédito, Financiamento e Investimento RCI Brasil |
- | (620) | - | - | (526) | - |
|
Banco Madesant - Sociedade Unipessoal, S.A. |
- | - | (5,013) | - | - | (25,143) |
|
Others |
- | - | (31) | - | - | (118) |
| Expense and similar charges - Marketable debt securities | (1,789) | - | - | - | - | - |
|
Banco Santander, S.A. – Spain |
(1,789) | - | - | - | - | - |
| Fee and commission income (expense) | (14,820) | 13,262 | 56,224 | 73,975 | 6,770 | 9,449 |
|
Companhia de Crédito, Financiamento e Investimento RCI Brasil |
- | 10,118 | - | - | 6,327 | - |
|
Banco Santander, S.A. – Spain |
(14,820) | - | - | 73,975 | - | - |
|
Aviación Antares, A.I.E. |
- | - | - | - | - | 9,449 |
|
Aviación Centaurus, A.I.E. |
- | - | 11,928 | - | - | - |
|
Santander Seguros |
- | - | 35,785 | - | - | - |
|
Others |
- | 3,144 | 8,511 | - | 443 | - |
| Gains (losses) on financial assets and liabilities (net) and exchange differences (net) | (245,096) | 6,522 | 505,726 | (44,953) | - | (42,090) |
|
Banco Santander, S.A. – Spain |
(245,096) | - | - | (44,953) | - | - |
|
Santander Benelux, S.A., N.V. |
- | - | (38,238) | - | - | 32,489 |
|
Santander Overseas Bank, Inc – Puerto Rico |
- | - | 160 | - | - | 188 |
|
Fundo de Investimento Multimercado Santillana Cred. Privado |
- | - | (342,975) | - | - | (86,572) |
|
Abbey National Treasury Services Plc |
- | - | (91,726) | - | - | 14,763 |
|
Santander Investment Securities Inc. |
- | - | (11,714) | - | - | - |
|
Companhia de Crédito, Financiamento e Investimento RCI Brasil |
- | 6,522 | - | - | - | - |
|
Others |
- | - | (21,233) | - | - | (2,958) |
| Administrative expenses and Amortization | (152) | - | (256,681) | - | - | (226,127) |
|
ISBAN Brasil S.A. |
- | - | (54,104) | - | - | (50,320) |
|
Produban Serviços de Informática S.A. |
- | - | (103,991) | - | - | (108,741) |
|
ISBAN Chile S.A. |
- | - | (4,814) | - | - | (5,491) |
|
Aquanima Brasil Ltda. |
- | - | (21,500) | - | - | (21,256) |
|
Ingeniería de Software Bancario, S.L. |
- | - | (32,209) | - | - | (19,722) |
|
Produban Servicios Informaticos Generales, S.L. |
- | - | (23,629) | - | - | (15,868) |
|
Santander Seguros |
- | - | (89) | - | - | - |
|
Zurich Santander Insurance America, S.L. |
- | - | (12,151) | - | - | - |
|
Others |
(152) | - | (4,194) | - | - | (4,729) |
|
Gains (losses) on non-current assets held for sale not classified as discontinued operations |
- | - | 424,292 | - | - | - |
|
Zurich Santander Insurance America, S.L. |
- | - | 424,292 | - | - | - |
F-75
|
|
|
|
BANCO SANTANDER (BRASIL) S.A.
NOTES TO THE CONSOLIDATED FINANCIAL STATEMENTS FOR THE YEARS ENDED DECEMBER 31, 2011, 2010 AND 2009 |
|
|
(Amounts in thousands of Brazilian Reais - R$, unless otherwise stated) |
|
| Thousands of Reais | Parent (1) |
2009
Joint-
controlled
companies |
Other Related- Party (2) |
| Income | |||
| Interest and similar income - Loans and amounts due from | |||
| credit institutions | 2,463 | 40,034 | 2,487 |
|
Banco Santander, S.A. – Spain |
2,463 | - | - |
|
Abbey National Treasury Services Plc |
- | - | 2,487 |
|
Companhia de Crédito, Financiamento e Investimento RCI Brasil |
- | 33,674 | - |
|
Companhia de Arrendamento Mercantil RCI Brasil |
- | 6,360 | - |
| Interest expense and similar charges - Customer deposits | - | - | (39,482) |
|
ISBAN Brasil S.A. |
- | - | (8,112) |
|
Produban Serviços de Informática S.A. |
- | - | (4,820) |
|
Real Fundo de Investimento Multimercado Santillana Credito Privado |
- | (7,922) | |
|
Fundo de Investimento Multimercado Menorca Crédito Privado |
- | - | (11,940) |
|
Cia Brasileira de Soluções e Serviços – CBSS |
- | - | (5,051) |
|
Others |
- | - | (1,637) |
| Interest expense and similar charges - Deposits from credit institutions | (240,448) | (7,630) | (12,156) |
|
Banco Santander, S.A. – Spain |
(240,448) | - | - |
|
Santander Overseas Bank, Inc – Puerto Rico |
- | - | (9,062) |
|
Abbey National Beta Investments Limited |
- | - | (1,869) |
|
Companhia de Crédito, Financiamento e Investimento RCI Brasil |
- | (1,253) | - |
|
Companhia de Arrendamento Mercantil RCI Brasil |
- | (6,377) | - |
|
Banco Madesant - Sociedade Unipessoal, S.A. |
- | - | - |
|
Others |
- | - | (1,225) |
| Fee and commission income (expense) | 20,963 | 6,861 | 13,407 |
|
Companhia de Crédito, Financiamento e Investimento RCI Brasil |
- | 6,134 | - |
|
Banco Santander, S.A. – Spain |
20,963 | - | - |
|
Santander Capitalização |
- | - | 12,597 |
|
Others |
- | 727 | 810 |
| Gains (losses) on financial assets and liabilities (net) | 51,758 | 2 | (512,920) |
|
Banco Santander, S.A. – Spain |
51,758 | - | - |
|
Santander Benelux, S.A., N.V. |
- | - | (320,972) |
|
Santander Overseas Bank, Inc – Puerto Rico |
- | - | (6,001) |
|
Fundo de Investimento Multimercado Menorca Crédito Privado |
- | - | 46,022 |
|
Fundo de Investimento Multimercado Santillana Cred. Privado |
- | - | (182,833) |
|
Abbey National Treasury Services Plc |
- | - | (2,836) |
|
Santander Investment Securities Inc. |
- | - | (44,757) |
|
Others |
- | 2 | (1,543) |
| Administrative expenses and Amortization | - | - | (211,796) |
|
ISBAN Brasil S.A. |
- | - | (42,061) |
|
Produban Serviços de Informática S.A. |
- | - | (99,548) |
|
Aquanima Brasil Ltda. |
- | - | (22,239) |
|
Ingeniería de Software Bancario, S.L. |
- | - | (20,689) |
|
Produban Servicios Informaticos Generales, S.L. |
- | - | (15,318) |
|
Others |
- | - | (11,941) |
| Gains on disposal of assets not classified as non-current assets held for sale | - | - | 2,376,460 |
|
Santusa Holding, S.L. |
- | - | 2,376,460 |
(1) Banco Santander (Brasil) S.A. is indirectly controlled by Banco Santander Spain (note 1-a), through its subsidiary Grupo Empresarial Santander, S.L. and Sterrebeeck B.V. (2) Refers to the Company's subsidiaries (Banco Santander, S.A .- Spain).
44. Risk management
Risk management at the Santander Brazil follow that same principles that are set at the Group level:
• Independence of the risk function with respect to the business. The head of the Bank’s Risk Division, reports directly to the executive committee and the board. The local risk unit keeps its independence with a direct report to the Corporate risk Unit.
• Commitment to supporting the business by contributing, without undermining the preceding principle, to the achievement of commercial objectives whilst safeguarding risk quality. To this end, the risk organizational structure is adapted to the commercial structure so as to encourage cooperation between business and risk managers.
• Collective decisions (even at branch level), which ensure that different opinions are taken into account and avoid decisions are taken individually.
• Well-established tradition of using internal rating and statistical tools to predict delinquency , internal rating, credit scoring and scoring Behavior, return on risk-adjusted capital (RORAC), value-at-risk (VaR), economic capital, extreme scenario analyses, etc.
• Global approach, achieved by addressing on an integrated basis all the risk factors in all the business units and geographical locations, and using the concept of economic capital as a consistent measure of the risk assumed and as the basis for assessing the management performed.
F-76
|
|
|
|
BANCO SANTANDER (BRASIL) S.A.
NOTES TO THE CONSOLIDATED FINANCIAL STATEMENTS FOR THE YEARS ENDED DECEMBER 31, 2011, 2010 AND 2009 |
|
|
(Amounts in thousands of Brazilian Reais - R$, unless otherwise stated) |
|
• Maintenance of a medium-low risk profile, and low volatility and its predictability, by:
- seeking to achieve a high degree of risk diversification, thus limiting risk concentration on particular customers, groups, sectors, products or geographical locations;
- maintaining a low level of complexity in Markets operations;
- paying ongoing attention to risk monitoring in order to prevent potential portfolio impairment sufficiently in advance.
At Bank, the risk management and control process has been structured using as reference the framework defined at corporate level and described according to the following phases:
• Adaptation of corporate management frameworks and policies that reflect Group Santander’s risk management principles.
The Bank adopts a series of risk policies and procedures that constitute its regulatory framework, which, taking the form of circulars, policies and operating rules, regulates the risk activities and processes.
Within this regulatory framework, the Corporate Risk Management Framework, approved by Senior Management (Risks), regulates the principles and standards governing the Santander Brazil´s risk activities, based on the corporate organizational and a management models.
The organizational model comprises the management map, the risk function and governance, and the regulatory framework itself. The management model contains the basic pillars for risk management, the channels for the planning and setting of targets, the budgeting and risk limit setting process, the control of operations, the framework for risk reporting to senior management and the technological reference model for risk management.
• Identification of risks, through the constant review and monitoring of exposures, the assessment of new products and businesses and the specific analysis of singular transactions;
• Measurement of risks using periodically tested methods and models;
• Preparation and distribution of a complete set of reports that are reviewed daily by the heads at all levels of Santander management.
Implementation of a risk control system which checks, on a daily basis, the degree to which Bank´s risk profile matches the risk policies approved and the risk limits set. The most noteworthy corporate tools and techniques (abovementioned) already in use in Santander Bank are in different stages of maturity regarding the level of implementation and use in Bank. For wholesale segment, these techniques are quite in line with the corporate level development. For local segments, internal ratings and scorings based models, VaR and market risk scenario analysis and stress testing have been already embbebed in risk management routine while Expected loss, Economic Capital and RORAC have been integrated in risk management.
• Internal ratings- and scorings-based models which, by assessing the various qualitative and quantitative risk components by customer and transaction, make it possible to estimate, firstly, the probability of default and, subsequently, the expected loss, based on LGD estimates.
• Economic capital, as a homogeneous measure of the risk assumed and a basis for the measurement of the management performed.
• RORAC, which is used both as a transaction pricing tool in the whole sale segment, more precisely in global ranking and markets(bottom-up approach) and in the analysis of portfolios and units (top-down approach).
• VaR, which is used for controlling and setting the market risk limits for the various treasury portfolios.
• Scenario analysis and stress testing to supplement market and credit risk analyses in order to assess the impact of alternative scenarios, even on provisions and capital.
The Bank intends to use the internal Models for the calculation of regulatory capital (regulatory) and for this has agreed a timetable with the local supervisor. The Bank has defined a Basel2 governance structure and has assigned for this purpose, the necessary human and technology resources to meet the stringent requirements established by the regulators.
a) Corporate Governance of the Risk Function
The risk committee framework of Santander Brazil is set based on corporate risk standards and are structured by type of business and risk segment.
Brazil Executive Risk Committee (Comitê Executivo de Riscos Brasil) has their level of approvals delegated by the Risk Committee of Banco Santander in Spain and has the following responsibilities:
- Integrate and adapt the risk functions in Santander, the strategy, the arrangements for the risk tolerance level, accordingly to existing corporate standards.
- Approve proposals and operations and limits customers and portfolios.
- Set references on general themes related to Market Risk, Country Risk, wholesale segment customers (including a global relationship) and retail themes (Credit Management Programs).
- Keep informed, evaluate and follow any comments and recommendations that may be made periodically by supervisors in discharging its functions;
- Ensure that the performance of Santander is consistent with the level of risk tolerance, previously approved by the Executive Committee and Council, and aligned with the policies of the Santander Group;
- Authorize the use of management tools and models of local risks and know the result of its internal validity.
The risk function at Bank is performed through an Executive Risk Unit, which is independent from the business areas from both a hierarchical and a functional standpoint, and reports directly to the President of Santander and the Director of Corporate Risk Group Santander.
More details of the structure, methodology and control system related to risk management is described in the report, available on the site www.santander.com.br.
F-77
|
|
|
|
BANCO SANTANDER (BRASIL) S.A.
NOTES TO THE CONSOLIDATED FINANCIAL STATEMENTS FOR THE YEARS ENDED DECEMBER 31, 2011, 2010 AND 2009 |
|
|
(Amounts in thousands of Brazilian Reais - R$, unless otherwise stated) |
|
b) Credit Risk
The Bank develops Credit Risk Management policies and strategies with the support of several business departments, which are responsible for guaranteeing the appropriate validation of the systems and internal procedures applied in the credit risk management. These systems and procedures are applied to the identification, measurement, control, and mitigation of exposure to credit risk, by individual transaction or aggregate of similar transactions.
The goal is to maintain a risk profile and adequate minimum return that outweighs the risk of default and estimated customer and portfolio, as defined by the Executive Committee.
The specialization of the Bank’s risk function is based on the type of customer and, accordingly, a distinction is made between individualized customers and standardized customers in the risk management process:
• Customers with individual management: Customers with individual management: the wholesale segment customers, financial institutions and certain companies. Risk management is implemented through a risk analyst set. The client is linked to risk analyst who prepares the analysis, the Committee directs and monitors the progress of the client.
• Customers with standardized management: individuals and companies not classified as individual clients. The management of this risk models based on automated decision-making and risk assessment of local risks, complemented by commercial competencies and teams of analysts to handle exceptions.
Collection of documentation and information necessary for a comprehensive analysis of the risk involved, the identification of the decision-maker, the counterparty, the risk involved in the transactions, the classification of the risk level into different categories, credit granting, periodic assessments of risk levels; these procedures are applied by the Bank to determine the volumes of guarantees and allowances necessary so that lending transactions are conducted according to existing standards and with the necessary security. Policies, systems and procedures used are reassessed annually to ensure they are consistent with the risk management requirements and current market scenarios.
The profile of credit risk assumed by the Bank is characterized by a diversity of clients and the large volume of retail operations. Aspects Macroeconomic and market conditions, as well as sector and geographical concentration, customer profiling, economic prospects are also evaluated and considered in the appropriate measuring of credit risk.
b.2) Measures and measurement tools
Rating tools
The Bank has used proprietary internal rating models to measure the credit quality of a given customer or transaction. Each rating relates to a certain probability of default or non-payment, determined on the basis of the Entity’s historical experience, with the exception of certain portfolios classified as “low default portfolios”. Rating/Scores models are used in the Bank’s loan approval and risk monitoring process.
Global rating tools are applied to the sovereign risk, financial institutions and global wholesale clients (GBM). Management of these segments is centralized at Bank level. These tools assign a rating to each customer, which is obtained from a quantitative or automatic module, based on balance sheet ratios or macroeconomic variables, supplemented by the analyst’s judgment.
For the corporate and individualized institutions segments, it was defined a single methodology for the construction of a rating system in each country, based on the same modules as the above-mentioned ratings: a quantitative or automatic module (analyzing the credit performance of a sample of customers and the correlation with their financial statements), a qualitative or analyst judgment module, and final reviews.
Ratings assigned to customers are reviewed periodically to include any new financial information available and the experience in the banking relationship. The frequency of the reviews is increased in the case of customers that reach certain levels in the automatic warning systems and of customers classified as requiring special monitoring. The rating tools themselves are also reviewed in order to progressively fine-tune the ratings they provide.
For customers with standardized management, both legal entities and individuals, scoring tools that automatically assign a score to the proposed transactions.
These loan approval systems are supplemented by performance rating models. These tools provide enhanced predictability of the risk assumed and are used for preventive and marketing activities.
Credit risk parameters
The estimates of the risk parameters (PD and LGD) should be based on internal experience, i.e. on default observations and on the experience in defaulted loan recoveries.
For low portfolios, such as banks, sovereign risk or global wholesale clients, the parameters are based on CDS market data and with global broadness, using Santander´s world presence.
For the other portfolios, parameter estimates are based on the Bank’s internal experience. In retail portfolios, the internal rating is estimated based on models that use client behavior data and available external bureau information; PDs are then calculated based on default rates, which is defined as up to 90 days past due.
LGD calculation is based on the observation of the recoveries of defaulted loans, taking into account not only the income and expenses associated with the recovery process, but also the timing thereof and the indirect costs arising from the recovery process.
The estimated parameters are then assigned to performing, i.e. non-defaulted, loans. For low-default portfolios, which are managed globally, the assignment process follows the same patterns in all Santander units.
By contrast, the retail portfolios have specific scoring systems in each of the Bank’s units, which require the development of separate estimates and the assignation of parameters in a particular manner in each case.
F-78
|
|
|
|
BANCO SANTANDER (BRASIL) S.A.
NOTES TO THE CONSOLIDATED FINANCIAL STATEMENTS FOR THE YEARS ENDED DECEMBER 31, 2011, 2010 AND 2009 |
|
|
(Amounts in thousands of Brazilian Reais - R$, unless otherwise stated) |
|
Master rating scale
In order to achieve equivalent internal ratings in the different models available –corporate, sovereign risk, financial institutions and other segments– and to make them comparable with the external ratings of rating agencies, the Bank has a so-called master rating scale.
The equivalence is established through the probability of default associated with each rating. Internally calibrated PDs are compared against the default rates associated with the external ratings, which are published periodically by rating agencies.
| Equivalence with: | ||||
| Internal rating | Probability of Default | Standard & Poor's | Moody's | |
| 9.3 | 0.017% | AAA | Aaa | |
| 9.2 | 0.018% | AA+ | Aa1 | |
| 9.0 | 0.022% | AA | Aa2 | |
| 8.5 | 0.035% | AA- | Aa3 | |
| 8.0 | 0.06% | A+ | A1 | |
| 7.5 | 0.09% | A | A2 | |
| 7.0 | 0.14% | A- | A3 | |
| 6.5 | 0.23% | BBB+ | Baa1 | |
| 6.0 | 0.36% | BBB+ | Baa2 | |
| 5.5 | 0.57% | BBB- | Baa3 | |
| 5.0 | 0.92% | BB+ | Ba1 | |
| 4.5 | 1.46% | BB | Ba2 | |
| 4.0 | 2.33% | BB/BB- | Ba2/Ba3 | |
| 3.5 | 3.71% | BB-/BB+ | Ba3/B1 | |
| 3.0 | 5.92% | B+/B | B1/B2 | |
| 2.5 | 9.44% | B | B2 | |
| 2.0 | 15.05% | B- | B3 | |
| 1.5 | 24.00% | CCC | Caa1 | |
| 1.0 | 38.26% | CC/C | Caa1/Caa2 | |
| b.3) Observed loss: measures of cost of credit | ||||
To supplement the use of the advanced models described above (see related data in the “Economic Capital” section), other habitual measures are used to facilitate prudent and effective management of credit risk based on observed loss.
The cost of credit is mainly measured by performance indicators such as the variation in the provision for credit losses, nonperforming loans in the process of recovery and net credits written off as losses.
b.4) Credit risk cycle
The risk management process consists of identifying, measuring, analyzing, controlling, negotiating and deciding on, as appropriate, the risks incurred in the Bank’s operations. The parties involved in this process are the risk taking areas, senior management and the risk function.
The process begins at senior management level, through the board of directors and the risk committee, which establishes the risk policies and procedures, and the limits and delegations of powers, and approves and supervises the scope of action of the risk function.
The risk cycle comprises three different phases: pre-sale, sale and post-sale:
• Pre-sale: this phase includes the risk planning and target setting processes, determination of the Bank’s risk appetite, approval of new products, risk analysis and credit rating process, and limit setting.
• Sale: this is the decision-making phase for both pre-classified and specific transactions.
• Post-sale: this phase comprises the risk monitoring, measurement and control processes and the recovery process.
Risk limit planning and setting
Risk limit setting is a dynamic process that identifies the Banco Santander’s risk appetite by assessing business proposals and the attitude to risk. This process is defined in the global risk limit plan, an agreed-upon comprehensive document for the integrated management of the balance sheet and the inherent risks, which establishes risk appetite on the basis of the various factors involved.
The risk limits are founded on two basic structures: customers/segments and products.
For individualized risks, customers represent the most basic level, for which individual limits are established (pre-classification).
For large corporate groups a pre-classification model, based on an economic capital measurement and monitoring system, is used. As regards the corporate segment, a simplified pre-classification model is applied for customers meeting certain requirements (thorough knowledge, rating, and others).
Inthecaseof standardized risks, the risk limits are planned and set using the credit management programs (PGC), a document agreed upon by the business areas and the risk units and approved by the Risk Executive Committee, which contains the expected results of transactions in terms of risk and return, as well as the limits applicable to the activity and the related risk management.
F-79
|
|
|
|
BANCO SANTANDER (BRASIL) S.A.
NOTES TO THE CONSOLIDATED FINANCIAL STATEMENTS FOR THE YEARS ENDED DECEMBER 31, 2011, 2010 AND 2009 |
|
|
(Amounts in thousands of Brazilian Reais - R$, unless otherwise stated) |
|
Risk analysis and credit rating process
Risk analysis is a pre-requisite for the approval of loans to customers by the Bank. This analysis consists of examining the counterparty’s ability to meet its contractual obligations to the Banco Santander, which involves analyzing the customer’s credit quality, its risk transactions, solvency, and sustainability of business and the return to be obtained in view of the risk assumed.
The risk analysis is conducted yearly, at least, and can be held shortly when client profile indicates (through systems with centralized alerts, managers visits to clients or specific credit analysis), or when operations are not covered by pre-classification.
Transaction decision-making
The purpose of the transaction decision-making process is to analyze transactions and adopt resolutions thereon, taking into account the interest risk (risk appetite) and any transaction elements that are important in achieving a balance the relation between risk and return.
The Bank has been using, among others, the RORAC (return on risk-adjusted capital) methodology for the risk analysis and pricing in the decision-making process on transactions and deals.
Risk monitoring and control
In addition to the tasks performed by the Internal Audit Division, the Risks Vice Presidency has a specific risk monitoring function for adequate credit quality control, which consists of local and global teams to which specific resources and persons in charge have been assigned.
This monitoring function is based on process of permanent observation to enable early detection of any incidents that might arise in the evolution of the risk, the transactions, the customers and their environment, and the adoption of mitigating actions. The risk monitoring function is specialized by customer segment.
For this purpose a system called “special surveillance firms” (FEVE, using the Spanish acronym) has been designed that distinguishes four categories based on the degree of concern raised by the circumstances observed (extinguish, secure, reduce and monitor). The inclusion of a company in the FEVE system does not mean that there has been a default, but rather that it is deemed advisable to adopt a specific policy for this company, to place a person in charge and to set the policy implementation period. Customers classified as FEVE are revised at least every six months, or every three months for those classified in the most severe categories. A company is classified as FEVE as a result of the monitoring process itself, a review performed by Internal Audit, a decision made by the sales manager responsible for that company or the triggering of the automatic warning system.
Assigned ratings are reviewed at least annually, but should any weakness be detected, or depending on the rating itself, more frequent reviews are performed.
For exposures to standardized customers, the key indicators are monitored in order to detect any variance in the performance of the loan portfolio with respect to the forecasts contained in the credit management programs.
b.5) Risk control function
Supplementing the management process, the risk control function obtains a global view of the Bank’s loan portfolio, through the various phases of the risk cycle, with a level of detail sufficient to permit the assessment of the current situation of the risk process, its qualities and any changes therein.
Any changes in the Bank’s risk exposure are controlled on an ongoing and systematic basis against budgets, limits and benchmarks, and the impacts of these changes in certain future situations, both of an exogenous nature and those arising from strategic decisions, are assessed in order to establish measures that place the profile and amount of the loss portfolio within the parameters set by Executive Commission.
The risk control function is performed by assessing risks from various complementary perspectives, the main pillars being control by geographical location, business area, management model, product and process, thus facilitating the detection of specific areas warranting action and for which decisions have to be taken.
b.5.1) Credit recovery
The Credit Recovery department works in the credit collection and recovery of Bank Santander clients. The strategies and channels of collection operation are defined according analysis which showed the greatest efficiency in the recovery. In the early days of delinquency, is adopted a more enhanced recovery model, with specific strategies, with a closer internal monitoring. Call centers, negativation in the organs of credit protection (credit bureaus), letters of collection and collection through the branches network are used during this phase, in order to recover the loan and maintain customer relationship. In cases with arrears exceeding 60 days past due and higher values, come into play internal teams specialized in restructuring and credit recovery with direct management of delinquent customers. Lower values or more severe delays have the recovery carried out through third party collection administrative (friendly) or judicial, according to internal criteria, receiving a commission for any amounts recovered.
Tools are used, such as behavioral score, to study the performance of collecting certain groups, in an attempt to reduce costs and increase recoveries. The customers probability of payment are classified as low risk, and greater attention is paid to maintaining a healthy relationship with them. Customers with little chance of making the payment, in turn, are classified as high risk, and are being monitored more closely . All customers, with overdue amounts or restructured credits, have internal restrictions.
Sales of portfolios of defaulted loans, with a focus on operations in write-off status, are also held periodically through an auction process, in which are assessed conditions and characteristics of operations for its evaluation, without retention of risk.
b.6) Credit risk from other standpoints
Certain areas and/or specific views of credit risk deserve specialist attention, complementary to global risk management.
Concentration risk
Concentration risk is an essential factor in the area of credit risk management. The Bank constantly monitors the degree of concentration of its credit risk portfolios, by geographical area/country, economic sector, product and customer group.
F-80
|
|
|
|
BANCO SANTANDER (BRASIL) S.A.
NOTES TO THE CONSOLIDATED FINANCIAL STATEMENTS FOR THE YEARS ENDED DECEMBER 31, 2011, 2010 AND 2009 |
|
|
(Amounts in thousands of Brazilian Reais - R$, unless otherwise stated) |
|
The risk committee establishes the risk policies and reviews the exposure limits required to ensure adequate management of credit risk portfolio concentration.
From the sectorial standpoint, the distribution of the corporate portfolio is adequately diversified.
The Bank’s Risk Area works closely with the Finance Area in the active management of credit portfolios, which includes reducing the concentration of exposures through several techniques, such as the arrangement of credit derivatives for hedging purposes or the performance of securitization transactions, in order to optimize the risk/return ratio of the total portfolio.
Credit risk from financial market operations
This heading includes the credit risk arising in treasury operations with customers, mainly credit institutions. These operations are performed both via money market financing products with different financial institutions and via derivative instruments arranged for the purpose of serving our customers.
Risk control is performed using an integrated, real-time system that enables the Bank to know at any time the unused exposure limit with respect to any counterparty, any product and maturity and at any Bank unit.
Credit risk is measured at its current market value and its potential value (exposure value considering the future variation in the underlying market factors). Therefore, the credit risk equivalent (CRE) is defined as the sum of net replacement value plus the maximum potential value of the contracts in the future.
Environmental risk
Are in place Environmental Risk Practice for the Bank Santander for the Wholesale Bank which in addition to lending, provides analysis of environmental issues in accepting clients. The Environmental Risk area analyzes the social management of the client and its value chain by checking items such as contaminated areas, deforestation, labor violations and other problems for which there is the risk of penalties.
A specialized team with a background in Biology, Geology, Chemistry, Health and Safety Engineering monitors the social and environmental practices of clients and a team of financial analysts studying the probability of damages related to such practices that may affect the guarantees and the financial condition of Banks' customers. Our experience shows that the company cares for the well-being of its employees and the environment in which it operates tend to have a more efficient and therefore more likely to honor their commitments and generate good business.
b.7) Variations in main aggregates in 2011
Systems integration and search for speed and simplicity in our day to day operations resulted in a new risk model, consolidated in 2011 into a single technology platform, which allowed us to streamline processes and improve the approval period for our credit customers. The new model has brought significant synergy gains for credit analysis as more scope to the team's commercial retail and new models score without losing credit quality and prudence that has characterized our political risk.
Thus, we reinforce our regionalized structure and were better prepared to grow and gain market share, supporting the business strategy of Santander in Brazil. Thus, we end the year with above-market results, reversing the trend of the first month.
In 2011, we also work on credit recovery, especially due to the increase in defaults. Reinforce controls and guidance we offer to our customers in order to ensure they have access to products and services commensurate with their income. For this, we created a team of experts prepared to understand the reality of customers and thus offer solutions for all types of situations.
Even before this, we are still adopting a strategy of expanding credit, supported by the positive momentum of the Brazilian economy and our political risk. One of the differences of this policy is the involvement of top management in decision making. The discussions take place in the Risk Committee and the resolutions are defined in a collegiate manner to ensure maximum alignment. Another important point is the independence of staff in relation to the business, which allows more assertive decisions and reduces credit risk.
On the environmental risk, the year 2011 was important to consolidate our practices and improve processes, increasing the rigor of the controls the most critical areas of the productive sector.
The following table shows the key indicators of credit risk:
|
2011 |
2010 |
2009 |
|
|
|
|
|
|
| Credit risk exposure - customers (*) (Thousand of Reais) | 216,756,389 | 183,121,435 | 159,465,631 |
| Non-performing loans ratio (%) | 6.73% | 5.82% | 7.15% |
| Impairment coverage ratio (%) | 85.52% | 98.32% | 101.72% |
| Specific credit loss provisions, net of RAWO (**) (Thousand of Reais) | 11,179,835 | 9,191,762 | 10,070,479 |
| Cost of credit (% of risk) | 4.76% | 4.86% | 6.24% |
| Data prepared on the basis of management criteria and the accounting criteria of the controller unit. | |||
|
(*) Includes gross loans and advances to customers, guarantees and documentary credits. |
|
(**) RAWO = Recoveries of Assets Written Off. |
|
|
|
c) Market Risk |
Market risk is the exposure to risks such as interest rates, exchange rates, prices of goods, prices in the stock market and others according to the type of product, volume of operations, term and conditions of the agreement and underlying volatility.
The Bank operates according to global policies, within the Group’s risk tolerance level, aligned with the objectives in Brazil and in the world.
With this purpose, it has developed its own Risk Management model, according to the following principles:
- Functional independence;
F-81
|
|
|
|
BANCO SANTANDER (BRASIL) S.A.
NOTES TO THE CONSOLIDATED FINANCIAL STATEMENTS FOR THE YEARS ENDED DECEMBER 31, 2011, 2010 AND 2009 |
|
|
(Amounts in thousands of Brazilian Reais - R$, unless otherwise stated) |
|
- Executive capacity sustained by knowledge and proximity with the client;
- Global and far-reaching of the function (different types of risk);
- Collective decision-making, which evaluate a variety of possible scenarios and do not compromise the results with individual decision, including Brazil Executive Risk Committee (Comitê Executivo de Riscos Brasil), which delimits and approves the operations and the Asset and Liabilities Committee, which responds for the capital management and structural risks, including country-risk, liquidity and interest rates.
- Management and improvement of the equation risk/return; and
- Advanced methodologies for risk management, such as Value at Risk – VaR (historical simulation of 521 days with a confidence level of 99¨and time horizon of one day), scenarios, financial margin sensibility, book value and contingency plan.
The Market Risks structure is part of the Vice Presidency of Credit and Market Risks, an independent area that aligns risk policies taking into consideration the guidelines of the Board of Directors and the Risks Division of Santander in Spain.
c.1) Activities subject to market risk
The measurement, control and monitoring of the market risk area comprises all operations in which net worth risk is assumed. This risk arises from changes in the risk factors –interest rate, exchange rate, equities, commodity prices and the volatility thereof– and from the solvency and liquidity risk of the various products and markets in which the Bank operates.
The activities are segmented by risk type as follows:
- Trading: this item includes financial services for customers, trading operations and positioning mainly in fixed-income, equity , foreign currency products and shares.
- Balance sheet management: A risk management assessment aims to give stability to interest income from the commercial and economic value of the Bank, maintaining adequate levels of liquidity and solvency. The risk is measured by the balance sheet exposure to movements in interest rates and level of liquidity.
- Structural risks:
i. Structural foreign currency risk/hedges of results: foreign currency risk arising from the currency in which investments in consolidable and non-consolidable are made (structural exchange rate). This item also includes the positions taken to hedge the foreign currency risk on future results generated in currencies than the Real (hedges of results).
ii. Structural equities risk: this item includes equity investments in non-consolidated financial and non-financial companies that give rise to equities risk.
The Treasury area is responsible for managing the positions taken in the trading activity.
The Financial Management area is responsible for managing the balance sheet management risk and structural risks centrally through the application of uniform methodologies adapted to the situation of each market in which the Bank operates. Thus, in the convertible currencies area, Financial Management directly manages the Parent's risks and coordinates the management of the other units operating in these currencies. Decisions affecting the management of these risks are taken through the ALCO committees in the respective countries and, ultimately, by the Parent's markets committee.
The aim pursued by Financial Management is to ensure the stability and recurring nature of both the net interest margin of the commercial activity and the Bank’s economic value, whilst maintaining adequate liquidity and solvency levels.
Each of these activities is measured and analyzed using different tools in order to reflect their risk profiles as accurately as possible.
c.2) Methodologies Trading
The Bank calculates trading market risk capital requirement using a standard model provided by Bacen.
The standard methodology applied to trading activities by the Santander Bank and the value at risk (VaR), which measures the maximum expected loss with a given confidence level and time horizon. This methodology was based on a standard historical simulation with a 99% confidence level and a one-day time horizon. Statistical adjustments were made to enable the swift and efficient incorporation of the most recent events that condition the level of risk assumed.
Specifically, the Bank uses a time window of two years or 521 daily data obtained retrospectively from the reference date of the VaR calculation. Two figures are calculated each day, one by applying an exponential decline factor which gives a lesser weighting to more distant observations in time, and another with uniform weightings for all observations. The VaR reported is the higher of these two figures.
VaR is not the only measure. It is used because it is easy to calculate and because it provides a good reference of the level of risk incurred by the Bank. However, other measures are simultaneously being implemented to enable the Bank to exercise greater risk control in all the markets in which it operates.
One of these measures is scenario analysis, which consists of defining behavior scenarios for various financial variables and determining the impact on results of applying them to the Bank’s activities. These scenarios can replicate past events (such as crises) or, conversely, determine plausible scenarios that are unrelated to past events. A minimum of three types of scenarios are defined (plausible, severe and extreme) which, together with VaR, make it possible to obtain a much more complete spectrum of the risk profile.
The positions are monitored daily through an exhaustive control of changes in the portfolios, the aim being to detect possible incidents and correct them immediately. The daily preparation of an income statement is an excellent risk indicator, insofar as it allows us to observe and detect the impact of changes in financial variables on the portfolios.
F-82
|
|
|
|
BANCO SANTANDER (BRASIL) S.A.
NOTES TO THE CONSOLIDATED FINANCIAL STATEMENTS FOR THE YEARS ENDED DECEMBER 31, 2011, 2010 AND 2009 |
|
|
(Amounts in thousands of Brazilian Reais - R$, unless otherwise stated) |
|
Lastly, due to their atypical nature, derivatives and credit trading management (actively traded credit – Trading Book) activities are controlled by assessing specific measures on a daily basis. In the case of derivatives, these measures are sensitivities to fluctuations in the price of the underlying (delta and gamma), in volatility (vega) and in time (theta). For credit trading management activities, the measures controlled include sensitivity to spread, jump-to-default and position concentrations by rating level.
With respect to the credit risk inherent in the trading portfolios (Credit Trading portfolios), and in keeping with the recommendations made by the Basel Committee of Banking Supervision, an additional measure has been introduced, the Incremental Default Risk (IDR), in order to cover the default risk which is not properly captured in the VaR, through the variation of the related market prices of credit spreads. The instruments affected are basically fixed-income bonds, , derivatives on bonds (forwards, options, etc.) and credit derivatives (credit default swaps, asset-backed securities, etc.). The method used to calculate the IDR, is defined globally at Group level.
c.3) Balance-sheet management
Interest rate risk
The Bank analyses the sensitivity of the net interest margin and market value of equity to changes in interest rates. This sensitivity arises from maturity and interest rate repricing gaps in the various balance sheet items.
On the basis of the balance-sheet interest rate position, and considering the market situation and outlook, the necessary financial measures are adopted to align this position with that desired by the Bank. These measures can range from the taking of positions on markets to the definition of the interest rate features of commercial products.
The measures used by the Bank to control interest rate risk in these activities are the interest rate gap, the sensitivity of net interest margin (NIM) and market value of equity (MVE) to changes in interest rates, the duration of capital, value at risk (VaR) and scenario analysis.
Interest rate gap of assets and liabilities
The interest rate gap analysis focuses on the mismatches between the interest reset periods of on-balance-sheet assets and liabilities and of off-balance-sheet items. This analysis facilitates a basic snapshot of the balance sheet structure and enables concentrations of interest rate risk in the various maturities to be detected. Additionally, it is a useful tool for estimating the possible impact of potential changes in interest rates on the entity's net interest margin and market value of equity.
The flows of all the on- and off-balance-sheet aggregates must be broken down and placed at the point of repricing or maturity. The duration and sensitivity of aggregates that do not have a contractual maturity date are analyzed and estimated using an internal model.
Net interest margin (NIM) sensitivity
The sensitivity of the net interest margin measures the change in the expected accruals for a specific period (12 months) given a shift in the interest rate curve.
The sensitivity of the net interest margin is calculated by simulating the margin both for a scenario of changes in the interest rate curve and for the current scenario, the sensitivity being the difference between the two margins so calculated.
Market value of equity (MVE) sensitivity
The sensitivity of the market value of equity is a complementary measure to the sensitivity of the net interest margin.
This sensitivity measures the interest rate risk implicit in the market value of equity based on the effect of changes in interest rates on the present values of financial assets and liabilities.
Value at risk (VaR)
The value at risk for balance sheet aggregates and investment portfolios is calculated by applying the same standard as that used for trading: historical simulation with a confidence interval of 99% . Statistical adjustments were made to enable the swift and efficient incorporation of the most recent events that condition the level of risk assumed.
c.4) Liquidity risk
Liquidity risk is associated with the Bank’s ability to finance its commitments at reasonable market prices and to carry out its business plans with stable sources of funding. The Bank permanently monitors maximum gap profiles.
The measures used to control liquidity risk in balance sheet management are the liquidity gap, liquidity ratios, stress scenarios and contingency plans.
Liquidity gap
The liquidity gap determines the inflow and outflow of funds for assets, liabilities and off-balance sheet accounts at a given time horizon, making it possible to analyze mismatches between the Bank's expected inflow and outflow of funds.
A liquidity gap may be prepared and analyzed as divided into local currency liquidity gap and foreign currency liquidity gap, under which cash and cash equivalents, inflows and outflows and strategies are segregated into local and foreign currency, respectively.
The Bank prepares three types of Liquidity Gap analyses:
1 - Contractual liquidity gap
The Contractual Liquidity Gap determines the contractual maturity flows of the Bank’s major products on a consolidated basis, and any existing mismatches. It also informs the available liquidity in one day and the consumption of or increase in liquidity in the period.
F-83
|
|
|
|
BANCO SANTANDER (BRASIL) S.A.
NOTES TO THE CONSOLIDATED FINANCIAL STATEMENTS FOR THE YEARS ENDED DECEMBER 31, 2011, 2010 AND 2009 |
|
|
(Amounts in thousands of Brazilian Reais - R$, unless otherwise stated) |
|
2 - Operational liquidity gap
Daily cash monitoring and management considering the market situation, maturities and renewal of assets and liabilities, liquidity requirement and specific events.
3 - Projected liquidity gap
Based on the Contractual Liquidity Gap, new maturity flows are projected considering the Bank’s budget plan.
Liquidity ratios
In addition to the Liquidity Gap analysis, a Structure Liquidity model is also prepared to assess the structure profile of the sources and uses of the Bank’s funds, which includes Liquidity Ratio studies.
The key Liquidity Ratios analyzed are as follows:
• Deposits / Lending operations – measures the Institution’s ability to finance lending operations with more stable and lower-cost funding.
• Stable Liabilities / Permanent Assets – measures the ration between Capital + Other Stable Liabilities and Investments + Other Permanent Assets.
• Market Funding / Total Assets – measures the percentage of the Group’s assets financed with less stable and higher-cost funding.
• Short-term market funding / Market Funding – measures the percentage of probable liquidity loss (less than 90 days) on total less stable funding.
• Net Assets / Short-term Market Funding – measures the commitment ratio of highly-liquid assets and probable liquidity loss(less than 90 days).
Scenario analysis / Contingency plan
Liquidity management requires an analysis of financial scenarios where possible liquidity issues are evaluated. For this, crisis scenarios are built and then studied. The model used for this analysis is the Liquidity Stress Test.
The Liquidity Stress Test assesses the institution’s financial structure and ability to resist and respond to the most extreme situations.
The purpose of the Liquidity Stress Test is to simulate adverse market conditions, making it possible assess impacts on the institution’s liquidity and payment ability, so as to take preventive actions or avoid positions that may adversely affect liquidity in worst-case scenarios.
Scenarios are determined based on an analysis of the market commitment during prior crises and future estimates. Four scenarios with different intensity levels are prepared.
Based on an analysis of the stress models, the Minimum Liquidity concept was determined, which is the minimum liquidity required to support the liquidity losses of up to 90% for 90 days in all crisis scenarios simulated.
Based on the results obtained through the Liquidity Stress Test, the Bank prepares its Liquidity Contingency Plan, which is a formal combination of preventive and corrective actions to be taken in liquidity crisis scenarios.
The Liquidity Contingency Plan is primarily intended to the following:
• Crisis identification – the preparation of a Liquidity Contingency Plan requires the determination in advance of a measurable parameter determining the institution’s liquidity condition and structure. This parameter is the Liquidity Minimum Limit determined by the Liquidity Stress Test. When this limit is exceeded, there is a liquidity crisis environment, and thus, the Contingency Plan is used.
• Internal Communication – after the crisis is identified, it is necessary to establish clear communication channels to mitigate the problems raised. People held accountable for taking these contingency actions should be notified of the extent of the contingency and measures to be taken.
• Corrective actions – Actions intended to actually generate the funds required to solve or mitigate the effects of crisis, as follows:
- Assess the type and severity of the crisis;
- Identify the most impacted segment;
- Put in practice the measures planned to generate funds, considering the required amount and cost of the additional resource, either financial or image cost.
ALCO reviews and approves stress models, Minimum Liquidity and Contingency Plan on a semi-annual basis.
If adverse market conditions occur, ALCO may review and approve new models, Minimum Liquidity and Contingency Plan on a need basis.
c.5) Structural foreign currency risk / Hedges of results / Structural equities risk
These activities are monitored by measuring positions, VaR and results.
c.5.1) Complementary measures
Calibration and test measures
Back-testing consists of performing a comparative analysis between VaR estimates and daily “clean” results (profit or loss on the portfolios at the end of the preceding day valued at following-day prices). The aim of these tests is to verify and provide a measure of the accuracy of the models used to calculate VaR.
F-84
|
|
|
|
BANCO SANTANDER (BRASIL) S.A.
NOTES TO THE CONSOLIDATED FINANCIAL STATEMENTS FOR THE YEARS ENDED DECEMBER 31, 2011, 2010 AND 2009 |
|
|
(Amounts in thousands of Brazilian Reais - R$, unless otherwise stated) |
|
Back-testing analyses performed at the Santander Bank comply, at the very least, with the BIS recommendations regarding the verification of the internal systems used to measure and manage financial risks. Additionally, the Santander Bank also conducts hypothesis tests: excess tests, normality tests, Spearman’s rank correlation, average excess measures, etc.
The assessment models are regularly calibrated and tested by a specialized unit.
c.6) Control system
Limit setting
The limit setting process is performed together with the budgeting activity and is the tool used to establish the assets and liabilities available to each business activity. Limit setting is a dynamic process that responds to the level of risk considered acceptable by senior management.
The limits structure requires a process to be performed that pursues, inter alia, the following objectives:
1. To identify and delimit, in an efficient and comprehensive manner, the main types of financial risk incurred, so that they are consistent with business management and the defined strategy.
2. To quantify and communicate to the business areas the risk levels and profile deemed acceptable by senior management so as to avoid undesired risks.
3. To give flexibility to the business areas for the efficient and timely assumption of financial risks, depending on market changes, and for the implementation of the business strategies, provided that the acceptable levels of risk are not exceeded.
4. To allow business makers to assume risks which, although prudent, are sufficient to obtain the budgeted results.
5. To delimit the range of products and underlyings with which each Treasury unit can operate, taking into account features such as assessment model and systems, liquidity of the instruments involved, etc.
c.7) Risks and results in 2011
Trading
The average VaR of the Bank’s trading portfolio in 2011 at R$21.73 (2010 - R$27.19 million and R$38.0 million for 2009). The dynamic management of this profile enables the Bank to change its strategy in order to capitalize on the opportunities offered by an environment of uncertainty.
c.7.1) Balance sheet management (1)
Interest rate risk
Convertible currencies
At 2011 year-end, the sensitivity of the net interest margin at one year to parallel increases of 100 basis points applied to Banco Santander portfolios was concentrated on the BRL interest rate curve was negative by R$263.02 million.
Also at 2011 year-end, the sensitivity market value of equity to parallel increases of 100 basis points applied to the Banco Santander in the BRL interest rate curve was negative by R$1,491.78 million.
Quantitative risk analysis
The interest rate risk in balance sheet management portfolios, measured in terms of sensitivity of the net interest margin (NIM) at one year to a parallel increase of 100 b.p. in the interest rate curve, increased R$40 million over 2011, reaching a maximum of R$263 million in the month in December. The sensitivity value increased R$299 million during 2011, reaching maximum level in November to R$1,596 million. The main factors that occurred in 2011 and influenced the growth of this sensitivity, we increase the loan portfolio of approximately R$18 billion (generating an increase of R$194 million MVE) and the sale of Santander Seguros.
| Thousands of Reais | |
|
2011 |
|
| Sensibilities | |
| Net Interest Margin | 263 |
| Market Value of Equity | 1,492 |
| Value at Risk - Balance | |
| VaR | 252 |
| (1) Includes the balance sheet total, except for the financial assets and liabilities held for trading. | |
| Structural liquidity management | |
Structural liquidity management seeks to finance the Bank’s recurring business with optimal maturity and cost conditions, avoiding the need to assume undesired liquidity risks.
The main features of the structural liquidity management in 2011 were as follows:
• Ample structural liquidity position. Since Santander is basically a commercial bank, customer deposits constitute the main source of liquidity in its financing structure. These deposits, combined with capital and other similar instruments, enable the Bank to cover most of its liquidity requirements and, as a result, the financing raised in wholesale markets is moderate with respect to the size of its balance sheet.
• In Brazil, the legal reserve requirement takes a considerable part of the funding.
• Obtainment of liquidity through diversification in instruments. Additionally, subordinated and senior debts have an overall long maturity.
F-85
|
|
|
|
BANCO SANTANDER (BRASIL) S.A.
NOTES TO THE CONSOLIDATED FINANCIAL STATEMENTS FOR THE YEARS ENDED DECEMBER 31, 2011, 2010 AND 2009 |
|
|
(Amounts in thousands of Brazilian Reais - R$, unless otherwise stated) |
|
• The local balance sheet should be self-funded.
• Based on stress test results, a minimum liquidity buffer is maintained.
• Santander reliance in international funding is not considerable.
• The aim is that hard currency related activities be funded with third parties hard currency funding.
• Though, given that potential disruptions in this market, Banco Santander has mechanisms to use the local liquidity in order to support hard currency activities.
• High capacity to obtain on-balance-sheet liquidity. Government bond positions are held for liquidity management purposes.
• The Bank performs control and management functions, which involves planning its funding requirements, structuring the sources of financing to achieve optimum diversification in terms of maturities and instruments, and defining contingency plans.
In practice, the liquidity management performed by the Bank consists of the following:
• Each year, a liquidity plan is prepared on the basis of the financing needs arising from the budgets of each business. Based on these liquidity requirements and taking into account certain prudential limits on the obtainment of short-term market financing, the Bank establishes an issue and securitization plan for the year.
• Throughout the year the Bank periodically monitors the actual changes in financing requirements and updates this plan accordingly.
• Control and analysis of liquidity risk. The primary objective is to guarantee that the Bank has sufficient liquidity to meet its short- and long-term financing requirements in normal market situations. To this end, the Bank employs certain balance-sheet control measures, such as the liquidity gap and liquidity ratios.
Simultaneously, various scenario (or stress-scenario) analyses are conducted which consider the additional requirements that could arise if certain extreme but plausible events occur. The aim pursued is to cover a broad spectrum of situations that are more or less likely to affect the Bank, thus enabling it to prepare the related contingency plans.
c.8) Trading book sensitivity analysis
From a local regulatory point of view, Banco Santander’s trading risk management is focused on portfolios and risk factors pursuant to the requirements of regulators and good international practices.
As in the management of market risk exposure, financial instruments are segregated into trading and banking portfolios according to the best market practices and the transaction classification and capital management criteria of the Basel II New Standardized Approach of Bacen. The trading portfolio consists of all transactions with financial instruments and products, including derivatives, held for trading, and the banking portfolio consists of core business transactions arising from the different Banco Santander business lines and their possible hedges. Accordingly, based on the nature of the Banco Santander’s activities, the sensitivity analysis was presented for trading and banking portfolios.
The table below summarizes the stress amounts generated by Banco Santander’s corporate systems, related to the banking portfolio, for each one of the portfolio scenarios as at December 31, 2011.
| Trading portfolio | |||
| 2011 | |||
| Risk Factor | Scenario 1 | Scenario 2 | Scenario 3 |
| Coupon - US Dollar | (12,977) | (7,553) | 84,447 |
| Coupon - Other Currencies | (4,533) | (45,334) | (226,670) |
| Fixed Interest Rate - Reais | (4,590) | (45,899) | (229,495) |
| Shares and Indices | (5,990) | (14,974) | (29,948) |
| Inflation | 6,037 | 60,370 | 301,848 |
| Others | (1,413) | (14,128) | (70,640) |
| Total (1) | (23,466) | (67,518) | (170,458) |
| (1) Capital market value was calculated with 1.5 year maturity. |
The table below summarizes the stress values generated by the Banco Santander’s corporate systems, related to the banking portfolio, for each one of the portfolio scenarios as of December 31, 2011.
| Portfolio Banking | |||
| 2011 | |||
| Risk Factor | Scenario 1 | Scenario 2 | Scenario 3 |
| Coupon - US Dollar | (964) | (9,643) | (48,217) |
| TR and Long-term Interest Rate (TJLP) | (3,502) | (35,025) | (175,125) |
| Fixed Interest Rate - Reais | (36,903) | (369,034) | (1,845,171) |
| Inflation | (1,496) | (14,959) | (74,793) |
| Total (1) (2) | (42,865) | (428,661) | (2,143,306) |
(1) Capital market value was calculated with 1.5 year maturity.
(2) Amounts net of tax effects.
F-86
|
|
|
|
BANCO SANTANDER (BRASIL) S.A.
NOTES TO THE CONSOLIDATED FINANCIAL STATEMENTS FOR THE YEARS ENDED DECEMBER 31, 2011, 2010 AND 2009 |
|
|
(Amounts in thousands of Brazilian Reais - R$, unless otherwise stated) |
|
Scenarios 2 and 3 above consider the deterioration situations considered as of low probability. According to the strategy defined by Management, if signs of deterioration are detected, actions are taken to minimize possible negative impacts.
Scenario 1: usually reported in our daily reports and corresponds to an upward shock of 10 basis points on the local and foreign currencies coupon curves, plus a shock of 10% on the currency rates (upwards) and stock market (downwards) spot prices, and an upward shock of ten basis points on the volatility surface of currencies used to price options.
Scenario 2: corresponds to an upward shock of 100 basis points on the local and foreign currency coupon curves, plus a shock of 25% on the currency rates (upwards) and stock market (downwards) spot prices, and an upward shock of 100 base points on the volatility surface of currencies used to price options.
Scenario 3: corresponds to an upward shock of 500 basis points on the local and foreign currency coupon curves, plus a shock of 50% on the currency rates (upwards) and stock market (downwards) spot prices, and an upward shock of 500 basis points on the volatility surface of currencies used to price options.
IR USD: all products with price changes tied to changes in the US currency and the US dollar interest rate.
IR Other Currency: all products with price changes tied to changes in any currency other than the US dollar and the US dollar interest rate.
Fixed rate (BRL): in Brazilian Reais: all products with price changes tied to changes in interest rate in Brazilian reais.
TR and TJLP: all products with price changes in the TR and TJLP.
Equities and indices: stock market indices, shares and options tied to share indices or the shares themselves.
Inflation: all products with price changes tied to changes in inflation coupons and inflation indices.
Other: any other product that does not fit in the classifications above.
d) Operational Risks Technological Business Continuity, Internal Controls and Sarbanes-Oxley Law Management
Banco Santander´s corporative areas, responsible for Technologic and Operational Risk Management and Internal Controls - SOX, are subject to different vice presidents, with structure, procedure, methodologies, tools and specific internal model guarantying through, managerial models, an adequate identification, capture, assessment, control, monitoring, mitigation and loss events reduction. In addition, management and prevention of operational, technological and business continuity plan risks, besides the improvement of the internal control model, satisfies the determinations of regulators, New Basel Accord - BIS II, and Sarbanes-Oxley requirements. Banco Santander also complies with the guidelines set out by Banco Santander Spain, which are based on the COSO - Committee of Sponsoring Organizations of the Treadway Commission – Enterprise Risk Management – Integrated Framework.
The procedures developed and adopted are intended to put and maintain Banco Santander among the financial institutions recognized as the entities with the best practices for the management of operational risks, contributing to continuously improve the reputation, soundness and reliability in the local and international markets.
Senior management is an acting party, aligned with the function’s mission, by recognizing, participating and sharing responsibility for the continuous improvement of this culture and framework of the technologic and operational risk management risk and the internal control system, in order to ensure the fulfillment of defined objectives and goals, as well as the security and quality of the products and services provided.
The Board of Directors of Banco Santander opted for the Alternative Standardized Approach (ASA) to calculate the regulatory capital ratio required for operational risk.
d.1) Operational and Technological Risks Department
The Operational and Technological Risks Department is responsible for implementing best practices for the management and control of operational risks, technological risks and business continuity. The department assists managerial and operational staff in meeting their strategic objectives, strengthening the robustness of the decision-making process, optimizing execution of daily activities, in addition to complying with regulatory obligations. Overall, the joint effort results in maintaining the Bank’s soundness, reliability and reputation.
The foundations of the operational and technological risk management and control model combine two approaches: centralized and decentralized.
Centralized Approach
As per the centralized approach, the Operational and Technological Risks Department is responsible for the control of operational and technological risks. Departmental responsibilities include: identify, assess, capture, monitor, control, analyze, consolidate, model and assist in mitigating not only relevant operational risks but also loss events resulting from operational and technological risks. The scope of the Department’s responsibility comprises organizational units, processes and entities belonging to the Bank.
F-87
|
|
|
|
BANCO SANTANDER (BRASIL) S.A.
NOTES TO THE CONSOLIDATED FINANCIAL STATEMENTS FOR THE YEARS ENDED DECEMBER 31, 2011, 2010 AND 2009 |
|
|
(Amounts in thousands of Brazilian Reais - R$, unless otherwise stated) |
|
Decentralized Approach
As per the decentralized approach, each individual organizational unit along with the corresponding managers is responsible for operational and technological risk management. Internal Control and Operational Risk Agents in conjunction with the Operational and Technological Risks Department provide support through policies, methodologies and tools.
The Santander Brazil strives to integrate and consolidate best practices for operational risk management and control. In conjunction with the centralized and decentralized management approaches, the Bank adopts complementary approaches. Such additional practices are based on qualitative and quantitative elements, technological risk management and control, and business continuity management.
d.2) Qualitative and Quantitative Approaches
The objective of the qualitative approach is to identify and mitigate the materialization of operational risk. Moreover, through qualitative analysis, risk profiles are determined for departments, processes and products. The goal is to strengthen the internal control environment and monitor corporate key risk indicators.
The quantitative and qualitative approaches correlate. The quantitative approach aids in detecting, remedying and mitigating operational risk. In addition, quantitative techniques provide tools for analysis and decision-making whether strategic or operational.
The main methodological tools for the qualitative and quantitative approaches are as follows:
• Operational and technological risk tools
• Operational and technological risk matrix for processes and new products
• Self-assessment questionnaires
• Internal historical database for operational risk events and losses
• Projecting forecasts and monitoring limits for operational risk losses
• Analysis and treatment of operational risk failures and events, including corrective action plans
• Key risk indicators for operational risks
By combining the qualitative and quantitative approaches, the Bank optimizes operational, technological and business continuity risk management. Consequently, this reflects on economic and regulatory capital requirements.
d.3) Technological Risk Management and Control
With regards to technological risks, the responsibility is to assist managers in identifying and evaluating risks and the respective internal controls as they specifically pertain to information technology (IT) processes and activities. The scope of activities comprises defining methodologies, tools and systems for corporate technological risk management in addition to coordinating efforts with IT managers to prevent and reduce the frequency and severity of technological risk events.
d.4) Business Continuity Risk Management and Control
With regards to business continuity management, the responsibility is to coordinate and control the implementation, maintenance and upkeep of the methodology as it pertains to the Bank. Key elements of the methodology are:
• Business Impact Analysis
• Business Continuity Plan: Development and Simulation
• Crisis Response Group
d.5) Scope and Sustainability
By acting in an ethical and professional manner, risk management and control result in important achievements that contribute to the continuity of the Institution and its sustainable development. Accomplishments include:
• Improved operational efficiency, productivity enhancements, optimized economic and regulatory capital allocations.
• Strengthening the Bank’s reputation and improving the stakeholders’ risk versus reward relationship.
• Timely compliance with new regulatory requirements.
• Preserve the quality and reliability of the product and service offering
• Timely correction of vulnerabilities identified in processes.
• Timely follow-up and compliance with specific regulatory requests.
• Acculturation of risk management awareness and accountability.
• Develop and deliver both on-line and face-to-face training programs.
• Create awareness of operational risk management and control through internal communication channels.
F-88
|
|
|
|
BANCO SANTANDER (BRASIL) S.A.
NOTES TO THE CONSOLIDATED FINANCIAL STATEMENTS FOR THE YEARS ENDED DECEMBER 31, 2011, 2010 AND 2009 |
|
|
(Amounts in thousands of Brazilian Reais - R$, unless otherwise stated) |
|
This framework allows the Bank to continuously improve its methodologies and to embed a cultural awareness throughout the Organization with respect to the responsibility for managing and controlling operational risk.
d.6) Differential
In line with the rest of the Bank, the Operational Risk Unit maintains its staff professionally up-to-date and trained to face a changing business environment. Moreover, the Unit offers both Intranet and face-to-face training programs to other staff members throughout the Bank.
Noteworthy accomplishments include:
• Annual Operational and Technological Risk Prevention and Control Week.
• Integration program for new employees, consisting of lectures that focus on each individual’s responsibility within the context of operational risk management.
• Training on how to assess the internal control environment.
• Elaborate, publish and maintain policy manuals that reinforce cultural awareness and employee involvement in operational risk management practices.
• Coordinate the annual operational risk loss forecast, identify action plan initiatives to reduce losses and improve accountability.
• Expansion / extension of the scope of Business Continuity Management, incorporating testing Disaster Recovery.
• Interact with other units throughout the Bank and elect representatives within the most risk-prone areas including the department of Information Technology.
d.7) Outlook
Based upon the framework, methodologies, and modus operandi that are in place, the Banco Santander aims to strengthen its position both locally and internationally. As such, the Bank strives to consolidate its strategy and remain in the forefront of operational, technological and business continuity risk management and control. Further substantiating this claim is the implementation of not only an efficient and effective internal control environment but also a risk exposure identification process.
Key accomplishments and additional information, such as the establishment of the Operational Risk Executive Committee, which can be found at.
Internal Controls area and Sarbanes-Oxley (Sox) Act
The Bank implemented the Internal Controls SOX area to constantly fortify, improve and monitor the Internal Control environment. To reach this objective, implemented a Internal Control Model – MCI that aims to mitigate risks on the preparation and disclosure of the financial statements risk mitigation.
It is a corporative area responsible for the Internal Controls Model - SOX (MCI) implementation and maintenance. This consolidated model has information registered in a database, named “System SOX”, that allows access only by authorized responsible managers and other users, also auditors, via local Intranet or electronic address access.
The system provides support to senior management to perform the Internal Control Model management, beyond documenting sub processes, risks and related controls. It also allows the control activities, sub processes, processes, activities and sub-groups certification by the responsible managers, that provides comfort / support for the Chief Executive Officer and Executive Vice President to certify the financial statements.
The methodology applied in the Bank establishes a periodic internal controls environmental evaluation, with the objective of:
- Obtain, from the established and performed control activities tests registered in the Internal Control Model, a reasonable design and effectiveness’s assurance;
- Assure that control activities are operating in a appropriate manner, for all transactions and during all accounting year;
- Obtain information to support corrective action plans aiming at to remediate internal controls deficiencies; and
- Develop a sustainable test program to support periodic Santander´s management evaluations.
Internal Controls Sox area attributions
Contribution to reinforce the Internal Controls SOX Model, with efficient attendance, to fulfill American “Sarbanes-Oxley” law, that was promulgated in 2002.
To comply with the requirements demanded in the related law, Santander adjusted its MCI - Model of Internal Controls to highest international standards, which complies with the direction lines established by COSO - Committee of Sponsoring Organizations of the Treadway Commission, covering strategical, operational, financial statements disclosure and compliance components.
The methodology contemplates the following internal certification periods:
- Half-year certification - beginning of second Semester: design and effectiveness control activities evaluation related to de first Semester.
- Annual certification - beginning of the next accounting year: design and effectiveness control activities evaluation related to the second Semester or during the exercise to verify annual controls or not first semester contemplated controls.
Additionally, elaborates a semiannually report to evaluate the quality and adequacy of the internal controls system and to identify risks of relevant distortion that may impact the Financial Statements as well as evaluating the quality of the internal controls environment that allows a adequate elaboration and disclosure of the Financial Statements and thus to attend the requirements of regulators. The internal controls report considers the entire developed, applied and monitored Internal Controls Model of the Sox System methodology.
F-89
|
|
|
|
BANCO SANTANDER (BRASIL) S.A.
NOTES TO THE CONSOLIDATED FINANCIAL STATEMENTS FOR THE YEARS ENDED DECEMBER 31, 2011, 2010 AND 2009 |
|
|
(Amounts in thousands of Brazilian Reais - R$, unless otherwise stated) |
|
Main area Objectives:
• Spread the culture of risks and internal controls management at the different layers of the organization;
• Implement and provide formal maintenance of the Risks and Controls Model based in consistent methodology (COSO and COBIT) accepted by regulators and considering relevant areas;
• Document the operational flow, allowing a process vision as part of all, identification of relevant risks and controls that involve the business and processes improvement;
• Endorse conclusion if the Internal Controls Model is adequate to the nature and the complexity of its businesses;
• Validate the controls identified and registered to mitigate relevant potential risks of the activities, through design and effectiveness tests.
e) Reputational Risk
e. 1) Reputational Risk
A key component of risk management is to ensure that the bank’s reputation is preserved and enhanced.
The Bank believes that the fundamental precept of its long-term business sustainability and shareholder value creation requires proper conduct of the business activities in accordance with Santander Corporate Values. A good way to do that is to engage responsibly in the right business, with the right clients.
The Bank defines reputational risk as a risk arising from negative public opinion, irrespective of whether this opinion is based on facts or merely on public perception.
Such risk can result from either:
• Actions and behavior of the organization or its staff like products sold, services provided or interactions with stakeholders, which constitutes direct risk.
• Actions and behavior of external parties, which constitutes indirect risk.
e.2) Organization and independence of the Compliance function
Compliance risk has been defined as the risk of legal or regulatory sanctions, material financial loss, or reputational harm Banco Santander may suffer as a result of its failure to comply with relevant laws, regulations, principles and rules, standards and codes of conduct applicable to its activities, in letter and in spirit.
The Compliance Department is responsible for assisting the bank to identify, to measure and to mitigate a significant part of the compliance risk but not in its entirety. Other key stakeholders in the process include the Supervisory Board, Senior Management and Finance Departments, Human Resources, Risk Department and Legal.
The compliance function within the bank is the independent oversight on behalf of senior management of those core processes and related policies and procedures that seek to ensure the bank is in conformity with industry-specific laws and regulations in letter and spirit, thereby helping to maintain the bank’s reputation.
Risk management compliance has proactive approach to compliance risk, with monitoring, education and communication.
e.3) Directives
a. Compliance principles – Ethics and Conduct in the Securities Markets
• The Bank’s ethical principles and conduct parameters are established in internal policies which are made available and formally adhered to by all employees. Proper communication channels are in place to clarify doubts and complaints from staff, and monitoring and controls are conducted in a way that adherence is secured.
b. Anti-money laundering
• The Bank’s anti-money laundering policies are based on the knowledge and rigorousness of the acceptance of new clients, complemented by the continuous scrutiny of all transactions where the Bank are involved in. The importance given to the theme is reflected on the direct involvement of senior management, namely the Executive Committee for AML and Compliance, which meets each trimester to deliberate on issues regarding the theme and to be directly involved with new clients acceptance and suspicious transactions reporting.
c. New products and services and suitability
• All new products and services are debated/analyzed in internal committees on several levels until their risks are completely minimized, the Corporate Commercialization Committee (Comité Corporativo de Comercialización - CCC) , integrated by senior executives of Santander (Spain), being the ultimate approval instance.
f) Compliance with the new regulatory framework
The Santander Bank has assumed from the outset a firm commitment to the principles underlying the “Revised Framework of International Convergence of Capital Measurement and Capital Standards” (Basel II). This framework allows entities to make internal estimates of the capital they are required to hold in order to safeguard their solvency against events caused by various types of risk. As a result of this commitment, the Santander Bank has devoted all the human and material resources required to ensure the success of the Basel II implementation plan. For this purpose, a Basel II team was created in the past, consisting of qualified professionals from the Bank’s different areas: mainly Risks, Technology and Operations, the Controller’s Unit, Financial Management, Internal Audit to verify the whole process, as the last layer of control at the entity , and Business particularly as regards the integration of the internal models into management. Additionally, specific work teams have been set up to guarantee the proper management of the most complex aspects of the implementation.
Supplementing the efforts of the Basel II operating team, Santander Bank senior management has displayed total involvement from the very beginning. Thus, the progress of the project and the implications of the implementation of the New Capital Accord for the Santander Bank have been reported to the management committee and to the board of directors on a regular basis.
F-90
|
|
|
|
BANCO SANTANDER (BRASIL) S.A.
NOTES TO THE CONSOLIDATED FINANCIAL STATEMENTS FOR THE YEARS ENDED DECEMBER 31, 2011, 2010 AND 2009 |
|
|
(Amounts in thousands of Brazilian Reais - R$, unless otherwise stated) |
|
In the specific case of credit risk, the implementation of Basel II entails the recognition, for regulatory capital purposes, of the internal models that have been used for management purposes.
The Bank intends to apply, over the next few years, the advanced internal ratings-based (AIRB) approach under Basel II for substantially all its banks, until the percentage of net exposure of the loan portfolio covered by this approach is close to 100%.
Given the medium-low risk profile characterizing Santander’s business activities, since it focuses primarily on commercial banking (corporations, SMEs and individuals), and the significant diversification of the Bank’s risk and business profiles will enable it to offset the additional capital requirements arising from the Internal Capital Adequacy Assessment Process (presented under Pillar 2), which takes into account the impact of risks not addressed under Pillar 1 and the benefits arising from the diversification among risks, businesses and geographical locations.
In addition to the supervisory validation and approval process, the Santander Bank continued in 2010 with the project for the progressive implementation of the technology platforms and methodological developments required for the roll-out of the AIRB approaches for regulatory capital calculation purposes. Therefore, the Bank expects to apply advanced approaches for the calculation of regulatory capital requirements at its business units in Brazil in 2014, after the required approval from the supervisory authorities has been obtained.
Regarding the other risks addressed under Pillar Iof Basel II, the Banco Santander is developing internal models for market risk and will remain using the standardized method for operational risk, since it considers the premature use of advanced models (AMA) for this purpose . Regarding the Market Risk, Banco Santander Brazil presented his candidacy in the second half of 2011, pending approval with the regulators for the use of internal models for calculating regulatory capital.
Pillar 2 is another significant line of action under the Basel II Corporate Framework. In addition to reviewing and strengthening the methodology supporting the economic capital model, the technology was brought into line with the platform supporting Pillar 1, so that all the information on credit risk will come from this source when Brazil implement internal models under Pillar I.
f.1) Internal validation of risk models
Internal validation is a pre-requisite for the supervisory validation process. A specialized unit of the Entity, with sufficient independence, obtains a technical opinion on the adequacy of the internal models for the intended internal or regulatory purposes, and concludes on their usefulness and effectiveness. This unit must also assess whether the risk management and control procedures are adequate for the Entity’s risk strategy and profile.
In addition to complying with the regulatory requirement, the internal validation function provides an essential support to the risk committee and the local risk committees in the performance of their duties to authorize the use of the models (for management and regulatory purposes) and in their regular reviews, since senior management must ensure that the Entity has appropriate procedures and systems in place for the monitoring and control of credit risk.
Internal model validation at the Santander Bank encompasses credit risk models, market risk models, option pricing models and the economic capital model. The scope of the validation includes not only the more theoretical or methodological aspects, but also the technology systems and the quality of the data they provide, on which their effective operation relies, and, in general, all the relevant aspects of advanced risk management (controls, reporting, uses, involvement of senior management, etc.). Therefore, the aim of internal validation is to review quantitative, qualitative, technological and corporate governance-related aspects.
The internal validation function is located, at corporate level, within the Integrated Risk Control and Internal Risk Validation area (CIVIR) and reports directly to head office (the third deputy chairman of the Bank and to the chairman of the risk committee) in Madrid. This function is performed at a global and corporate level in order to ensure uniformity of application. The need to validate models implemented at thirteen different units subject to nine different local supervisors, combining efficiency and effectiveness, made it advisable to create four corporate validation centers located in Madrid, London, New York and Sao Paulo. This facilitates the application of a corporate methodology that is supported by a set of tools developed internally by the Santander Bank which provide a robust corporate framework for application at all the Bank’s units and which automate certain verifications to ensure efficient reviews.
It should be noted that the Santander Bank’s corporate internal validation framework is fully consistent with the internal validation criteria for advanced approaches issued by regulators. Accordingly, the Bank maintains the segregation of functions between internal validation and internal audit, which, in its role as the last layer of control at the Bank, is responsible for reviewing the methodology, tools and work performed by internal validation and for giving its opinion on the degree of effective independence.
f.2) Capital Management
Capital management considers the regulatory and economic levels. The objective is to achieve an efficient capital structure in terms of cost and compliance, meeting the requirements of the regulatory body and contributing to achieving the goals of the classification of rating agencies and investors' expectations. The capital management includes securitization, sale of assets, raising capital through issue of shares, subordinated liabilities and hybrid instruments.
From an economic standpoint, capital management seeks to optimize value creation at the Bank and at its different business segment. To this end, the economic capital, RORAC (return on risk-adjusted capital) and value creation data for each business segment are generated, analyzed and reported to the management committee on a quarterly basis. Within the framework of the internal capital adequacy assessment process (Pillar 2 of the Basel Capital Accord), the Group uses an economic capital measurement model with the objective of ensuring that there is sufficient capital available to support all the risks of its activity in different economic scenarios, with the solvency levels agreed upon by the Group.
In order to adequately manage the Bank’s capital, it is essential to estimate and analyze future needs, in anticipation of the various phases of the business cycle. Projections of regulatory and economic capital are made based in financial projections (balance sheet, income statement, etc.) and on macroeconomic scenarios estimated by the Economic Research Service. These estimates are used by the Bank as a reference to plan the management actions (issues, securitizations, etc.) required to achieve its capital targets.
|
g) Economic capital |
|
|
|
g.1) Main objectives |
The emergence of economic capital models across the financial world was aimed at addressing a fundamental problem of regulatory capital, Risk Sensitiveness.
By contrast, economic capital models are primarily designed to yield risk sensitive estimations with two objectives in mind: managing risk more accurately and allocating economic capital among different units within the organization.
F-91
|
|
|
|
BANCO SANTANDER (BRASIL) S.A.
NOTES TO THE CONSOLIDATED FINANCIAL STATEMENTS FOR THE YEARS ENDED DECEMBER 31, 2011, 2010 AND 2009 |
|
|
(Amounts in thousands of Brazilian Reais - R$, unless otherwise stated) |
|
Taking into consideration the importance of developing risk sensitive capital models, Santander has been making all the efforts to build a robust economic capital model and integrate it fully in the management of the business.
The main objectives of Bank’s Economic capital framework are:
1 – Consolidate Pillar I and other risks impinging business activities into a single quantitative model, as well as fine tune capital estimations by establishing correlations between the different risks;
2 – Quantify and monitor variations on different types of risk;
3 – Distribute capital consumption for the main portfolios and manage its return on capital efficiency (RoRAC);
4 – Estimate the Economic Value Added for each business unit. The Economic profit must surpass the group’s Cost of Capital;
5 – Compliance with the home and host regulators in the process of the supervisory review of Pillar II.
g.2) The Model
When calculating economic capital the Bank must decide the levels of losses it wants to cover. This is defined by the level of confidence with which it wants to ensure the continuation of its business. Santander’s adopted confidence level is at 99.97% which is considerably above the 99.90% required by Basel II.
| As a result of its prudent economic capital model, Santander meets the criteria for receiving a global AA rating. | |||
| Brazil’s Risk profile | |||
| The risk profile of Brazil is distributed by the following types of risks: | |||
| % Capital | 2011 | 2010 | 2009 |
| Risk Type | |||
| Credit | 63% | 53% | 54% |
| Market | 4% | 7% | 7% |
| ALM | 7% | 12% | 12% |
| Business | 9% | 11% | 10% |
| Operational | 16% | 16% | 15% |
| Fixed Assets | 1% | 1% | 1% |
| TOTAL | 100% | 100% | 100% |
The Credit activity, which in Dec 2010 required 58% of Brazil’s economic capital, had increased its stake to 63% in December 2011, mainly because of higher loan portfolio presented in this same period and continued to be the main source of risk. This was followed by Operational , ALM and Business Risk respectively.
Operational Risk uses as its basis the Standardized approach. As such, it applies Beta factors to the Gross Income which is and it is very punitive for countries with high spreads.
The estimated RoRAC (risk adjusted return) for Dec 11 is 30.2%.
The Bank periodically assesses the level and evolution of the RORAC of its main business units. The RORAC is the profit generated over its economic capital employed, and is calculated using the following formula:
RoRAC=Profit/Economic Capital
The Bank also conducts capital planning based on stress test scenarios with the purpose of obtaining future projections of economic and regulatory capital. Results forecasts for the Bank are incorporated into the various scenarios in a coherent way, including their strategic objectives (organic growth, M&A, pay-out ratio, debt issues, etc). Possible capital management strategies are identified to enable the Bank’s solvency and return on capital to be optimized.
RoRAC
The Bank has been using RoRAC, with the following purposes:
1 – To analyze and set a minimum price for operations (admissions) and clients (monitoring);
2 – To estimate the capital consumption of each client, economic groups, portfolio or business segments in order to optimize the allocation of economic capital thus maximizing the bank’s efficiency;
3 – To measure and follow the performance of its businesses.
For assessing each transaction with our global clients the economic capital takes into consideration some variables in order to calculate the Expected and Unexpected Losses:
1 – Counterparty rating;
2 – Maturity;
3 – Guarantees;
4 – Type of financing;
F-92
|
|
|
|
BANCO SANTANDER (BRASIL) S.A.
NOTES TO THE CONSOLIDATED FINANCIAL STATEMENTS FOR THE YEARS ENDED DECEMBER 31, 2011, 2010 AND 2009 |
|
|
(Amounts in thousands of Brazilian Reais - R$, unless otherwise stated) |
|
The return on capital is determined by the cost of capital. In order to create value for the shareholders the minimum return that a transaction must yield must be higher than Santander’s cost of capital. A transaction which does not cover the cost of capital is not approved.
45. Supplementary information – Conciliation of shareholders’ equity and net income of the Bank
Following the CVM Instruction 485/2010, we present a reconciliation of shareholders’ equity and net income attributed to the parent between Brazilian GAAP and IFRS, for each of the periods presented, below:
| Thousands of Reais | Note | 2011 | 2010 | 2009 |
| Shareholders' equity attributed under Brazilian GAAP | 65,578,565 | 64,850,978 | 64,492,693 | |
| IFRS adjustments, net of taxes, when applicable: | ||||
| Pension plan discount rate | c | - | - | (174,218) |
| Classification of financial instruments at fair value through profit or loss | d | 13,840 | (251) | 19,440 |
| Redesignation of financial instruments to available-for-sale | a | 303,686 | 558,032 | 555,104 |
| Impairment on loans and receivables | b | 1,128,106 | 220,590 | 960 |
| Deferral of financial fees, commissions and inherent costs under effective interest rate method | e | 545,763 | 300,000 | 217,205 |
| Reversal of goodwill amortization | f | 9,786,227 | 6,682,775 | 3,441,629 |
| Realization on purchase price adjustments | g | 708,533 | 639,520 | 727,101 |
| Share based payments | h | 34,132 | 20,976 | - |
| Others | (85,820) | 82,698 | (14,509) | |
| Shareholders' equity attributed to the parent under IFRS | 78,013,032 | 73,355,318 | 69,265,405 | |
| Non-controlling interest under IFRS | 18,960 | 8,076 | 1,338 | |
| Shareholders' equity (including non-controlling interest) under IFRS | 78,031,992 | 73,363,394 | 69,266,743 | |
| Thousands of Reais | Note | 2011 | 2010 | 2009 |
| Net income attributed under Brazilian GAAP | 3,557,203 | 3,863,298 | 1,805,899 | |
| IFRS adjustments, net of taxes, when applicable: | ||||
| Pension plan discount rate | c | - | (1,082) | 5,125 |
| Classification of financial instruments at fair value through profit or loss | d | 18,918 | (17,887) | (6,687) |
| Redesignation of financial instruments to available-for-sale | a | 18,402 | (16,300) | (15,243) |
| Impairment on loans and receivables | b | 907,516 | 219,630 | 235,260 |
| Deferral of financial fees, commissions and inherent costs under effective interest rate method | e | 245,763 | 82,795 | 43,089 |
| Reversal of goodwill amortization | f | 3,103,452 | 3,241,146 | 3,064,864 |
| Realization on purchase price adjustments | g | 69,013 | (87,581) | 411,109 |
| Others | (172,342) | 98,074 | (35,810) | |
| Net income attributed to the parent under IFRS | 7,747,925 | 7,382,093 | 5,507,606 | |
| Non-controlling interest under IFRS | 7,928 | 481 | 358 | |
| Net income (including non-controlling interest) under IFRS | 7,755,853 | 7,382,574 | 5,507,964 | |
| a) Redesignation of financial instruments to available-for-sale: | ||||
Under BRGAAP, the Bank accounts some investments as for example in debt securities at amortized cost and equity instruments at cost. Under IFRS, the Bank has classified these investments as available-for-sale, measuring them at fair value with the changes recognized in consolidated statements of recognized income and expense, under the scope of IAS 39 “Financial Instruments: Recognition and Measurement”.
b) Impairment on loans and receivables:
On the income refers to the adjust based on estimated losses on loans and receivables portfolio, which was established with based on historical loss of impairment and other circumstances known at the time of evaluation, according to the guidance provided by IAS 39 "Financial Instruments: Recognition and Measurement. These criteria differ in certain aspects of the criteria adopted under BRGAAP, which uses certain regulatory limits set by the Central Bank. Additionally, the equity accumulated adjustments of the allocation of purchase price when the acquisition of Banco Real, according to the requirements of IFRS 3 "Business Combinations".
c) Pension plan discount rate:
In 2010, the BRGAAP used the discount rate used for benefit obligations reflects the nominal interest rate while IFRS, in accordance with IAS 19 “Employee Benefits” used the rate to market yields of debts instruments. In December 2010, BRGAAP began to adopt CVM Resolution 600/2009, which eliminated the asymmetry with the international standard.
d) Classification of financial instruments at fair value through profit or loss:
Under BRGAAP, all loans and receivables and deposits are accounted for at amortized cost. Under IFRS, in accordance with IAS 39 Financial Instruments: Recognition and Measurement” the financial assets can be measured at fair value and included in the category as “other financial assets at fair value through profit or loss” to eliminate or significantly reduce the accounting mismatch the recognition or measurement derived from measuring assets or liabilities or recognizing gains or losses on them on different bases, which are managed and their performance evaluated on the basis of fair value. Thus, the Bank classified loans, deposits and loans that meet these parameters, as the "other financial assets at fair value through profit or loss", as well as certain debt instruments classified as “available for sale” under BRGAAP. The Bank has selected such classification basis as it eliminates an accounting mismatch in the recognition of income and expenses.
e) Deferral of financial fees, commissions and inherent costs under effective interest rate method:
Under IFRS, in accordance with IAS 39 “Financial Instruments: Recognition and Measurement”, financial fees, commissions and inherent costs that are integral part of effective interest rate of financial instruments measured at amortized cost are recognized in profit or loss over the term of the corresponding contracts. Under BRGAAP these fees and expenses are recognizes directly at income when received or paid.
F-93
|
|
|
|
BANCO SANTANDER (BRASIL) S.A.
NOTES TO THE CONSOLIDATED FINANCIAL STATEMENTS FOR THE YEARS ENDED DECEMBER 31, 2011, 2010 AND 2009 |
|
|
(Amounts in thousands of Brazilian Reais - R$, unless otherwise stated) |
|
f) Reversal of goodwill amortization:
Under BRGAAP, goodwill is amortized systematically over a period until 10 years and additionally, the goodwill recorded is measured annually or whenever there is any indication that the asset may be impaired. Under IFRS, in accordance with IAS 38 “Intangible Assets”, goodwill is not amortized, but instead, is tested for impairment, at least annually, and whenever there is an indication that the goodwill may be impaired; comparing its recoverable amount with its carrying value. The tax amortization of goodwill of Banco ABN Amro Real SA represents a difference between book and tax basis of a permanent nature and definitive as the possibility of future use of resources to settle a tax liability is considered remote by management, supported by the opinion of expert external advisors. The tax amortization of goodwill is permanent and definitive, and therefore does not apply to the recognition of a deferred tax liability in accordance with IAS 12, on temporary differences.
g) Realization on purchase price adjustments:
As part of the allocation of the purchase price when the acquisition of Banco Real, following the requirements of IFRS 3, the Bank has revalued its assets and liabilities of the acquired to fair value, including identifiable intangible assets with finite lives. Under BRGAAP, in a business combination, the assets and liabilities are kept at their book value. This purchase price adjustment relates substantially to the following items:
• The appropriation related to the value of assets in the loan portfolio. The initial registration of value of the loans at fair value, adjustment to the yield curve of the loan portfolio in comparison to its nominal value, which is appropriated by its average realization period.
• The amortization of the identified intangible assets with finite lives over their estimated useful lives.
h) Share based payments:
Banco Santander has a local long-term compensation plans linked to payments based in shares. According to IFRS 2 "share based payments", the amount of shares to be paid should be measured at the fair value and accounted in equity, while in BRGAAP it is accounted in "Other Payables - Other".
| APPENDIX I – SUBSIDIARIES OF BANCO SANTANDER (BRASIL) S.A. | |||||
| Thousands of Reais | |||||
| Direct and Indirect controlled by Banco Santander (Brasil) S.A. | Activity | Participation % | Adjusted Stockholders' Equity (5) | Net Income (5) | |
| Direct | Indirect | ||||
| Santander Brasil Asset Management Distribuidora de Títulos e Valores Mobiliários S.A. (4) | Asset Manager | 99.99% | 100.00% | 187,770 | 73,977 |
| Banco Bandepe S.A. (4) | Bank | 100.00% | 100.00% | 4,408,918 | 378,659 |
| Santander Leasing S.A. Arrendamento Mercantil (4) | Leasing | 78.57% | 99.99% | 9,999,296 | 969,827 |
| Aymoré Crédito, Financiamento e Investimento S.A. (4) | Financial | 100.00% | 100.00% | 1,221,515 | 347,494 |
| Santander Administradora de Consórcios Ltda. (4) | Buying club | 100.00% | 100.00% | 4,231 | 173 |
| Santander Brasil Administradora de Consórcio Ltda. (4) | Buying club | 100.00% | 100.00% | 147,715 | 38,876 |
| Santander Microcrédito Assessoria Financeira S.A. (6) | Microcredit | 100.00% | 100.00% | 17,556 | 5,882 |
| Santander Brasil Advisory Services S.A. (1) (6) | Other Activities | 96.56% | 96.56% | 40,659 | 37,837 |
| CRV Distribuidora de Títulos e Valores Mobiliários S.A. (CRV DTVM) (4) (7) | Dealer Broker | 100.00% | 100.00% | 22,394 | 13,224 |
| Santander Corretora de Câmbio e Valores Mobiliários S.A. (4) | Other Activities | 99.99% | 100.00% | 253,076 | 60,353 |
| Webmotors S.A. (6) | Holding | 100.00% | 100.00% | 60,514 | 11,207 |
| Santander Participações S.A. (1) (6) (7) | Other Activities | 100.00% | 100.00% | 268,730 | 39,191 |
| Santander Getnet Serviços para Meios de Pagamento S.A. (6) | Holding | 50.00% | 50.00% | 26,122 | 12,899 |
| Sancap Investimentos e Participações S.A. (Sancap) (2) (6) | Other Activities | 100.00% | 100.00% | 241,716 | 146,248 |
| Mantiq Investimentos Ltda (6) (9) | Holding | 100.00% | 100.00% | 50 | - |
| Santos Energia Participações S.A. (6) (9) | Holding | 100.00% | 100.00% | 1,311 | (144) |
| MS Participações Societárias S.A (6) (9) | Holding | 78.35% | 78.35% | 15,712 | 397 |
| Controlled by Sancap | |||||
| Santander Capitalização S.A. (3) (5) | Savings and annuities | - | 100.00% | 276,449 | 135,050 |
| Controlled by Santander Advisory Services S.A. | |||||
| Santander S.A. Serviços Técnicos, Administrativos e de Corretagem de Seguros (6) (8) | Insurance | 100.00% | 166,876 | 34,469 | |
| Brazil Foreign Diversified Payment Rights Finance Company | Securitisation | - | (a) | - | - |
|
(a) Company over which effective control is exercised and there is no equity.
|
|||||
***
F-94