UNITED STATES
SECURITIES AND EXCHANGE COMMISSION
Washington, D.C. 20549
FORM 20-F
(Mark One)
|
|
☐
|
REGISTRATION STATEMENT PURSUANT TO SECTION 12(b) OR (g) OF THE SECURITIES
|
|
|
EXCHANGE ACT OF 1934
|
OR
|
|
☒
|
ANNUAL REPORT PURSUANT TO SECTION 13 OR 15(d) OF THE SECURITIES EXCHANGE
|
|
|
ACT OF 1934
|
|
|
for the fiscal year ended December 31, 2013
|
OR
|
|
☐
|
TRANSITION REPORT PURSUANT TO SECTION 13 OR 15(d) OF THE SECURITIES EXCHANGE
|
|
|
ACT OF 1934
|
|
|
For the transition period from
to
.
|
OR
|
|
☐
|
SHELL COMPANY REPORT PURSUANT TO SECTION 13 OR 15(d) OF THE SECURITIES
|
|
|
EXCHANGE ACT OF 1934
|
|
|
Date of event requiring this shell company report
|
Commission file number: 001-34476
BANCO SANTANDER (Brasil) S.A.
(
Exact name of Registrant as specified in its charter
)
Federative
Republic of Brazil
(Jurisdiction of incorporation)
Avenida Presidente Juscelino Kubitschek, 2,041 and 2,235 – Bloco A
Vila Olímpia
São Paulo, SP 04543-011
Federative Republic of Brazil
(Address of principal executive offices)
James H. Bathon, Managing Director - Legal and Compliance
Banco Santander, S.A.
New York Branch
45 E. 53rd Street
New York, New York 10022
(212) 350-3604
(Name, Telephone, E-mail and/or Facsimile number and Address of Company Contact Person)
Securities registered or to be registered pursuant to Section 12(b) of the Act:
|
Title of each class
|
Name of each exchange on which registered
|
|
|
Units, each composed of 55 common shares, no par value, and 50 preferred shares, no par value
|
New York Stock Exchange*
|
|
|
Common Shares, no par value
|
New York Stock Exchange*
|
|
|
Preferred Shares, no par value
|
New York Stock Exchange*
|
|
|
American Depositary Shares, each representing the right to receive one unit which is composed of 55 common shares, no par value, and 50 preferred shares, no par value, of Banco Santander (Brasil) S.A.
|
New York Stock Exchange
|
|
|
7.375% Tier 1 Subordinated Perpetual Notes
|
N/A
|
|
|
6.000% Tier 2 Subordinated Notes due 2024
|
N/A
|
|
*
|
Not for trading purposes, but only in connection with the listing of American Depositary Shares pursuant to the requirements of the Securities and Exchange Commission.
|
Securities registered or to be registered pursuant to Section 12(g) of the Act:
None
(Title of Class)
Securities for which there is a reporting obligation pursuant to Section 15(d) of the Act:
None
(Title of Class)
Indicate the number of outstanding shares of each of the issuer’s classes of capital stock or common stock as of the close of the period covered by the annual report.
212,841,732 common shares
186,202,385 preferred shares
Indicate by check mark if the registrant is a well-known seasoned issuer, as defined in Rule 405 of the Securities Act.
Yes
☒
No
☐
If this report is an annual or transition report, indicate by check mark if the registrant is not required to file reports pursuant to Section 13 or 15(d) of the Securities Exchange Act of 1934.
Yes
☐
No
☒
Indicate by check mark whether the registrant (1) has filed all reports required to be filed by Section 13 or 15(d) of the Securities Exchange Act of 1934 during the preceding 12 months (or for such shorter period that the registrant was required to file such reports), and (2) has been subject to such filing requirements for the past 90 days.
Yes
☒
No
☐
Indicate by check mark whether the registrant has submitted electronically and posted on its corporate Web site, if any, every Interactive Data File required to be submitted and posted pursuant to Rule 405 of Regulation S-T during the preceding 12 months (or for such shorter period that the registrant was required to submit and post such files).
Yes
☐
No
☐
Indicate by check mark whether the registrant is a large accelerated filer, an accelerated filer, or a non-accelerated filer. See definition of “accelerated filer and large accelerated filer” in Rule 12b-2 of the Exchange Act. (Check one):
|
Large accelerated filer
☒
|
Accelerated filer
☐
|
Non-accelerated filer
☐
|
Indicate by check mark which basis of accounting the registrant has used to prepare the financial statements included in this filing:
|
US GAAP
☐
|
International Financial Reporting Standards as issued by the International Accounting Standards Board
☒
|
Other
☐
|
If “Other” has been checked in response to the previous question indicate by check mark which financial statement item the registrant has elected to follow.
☐
Item 17
☐
Item 18
If this is an annual report, indicate by check mark whether the registrant is a shell company (as defined in Rule 12b-2 of the Exchange Act).
Yes
☐
No
☒
TABLE OF CONTENTS
Page
In this annual report, the terms “Santander Brasil,” the “Bank,” “we,” “us,” “our” and “our company” means Banco Santander (Brasil) S.A. and its consolidated subsidiaries, unless otherwise indicated. References to “Banco Real” mean Banco ABN AMRO Real S.A. and ABN AMRO Brasil Dois Participações S.A. and their respective consolidated subsidiaries, unless otherwise indicated. References to “Banespa” mean Banco do Estado de São Paulo S.A. – Banespa, one of our predecessor entities. The terms “Santander Spain” and “our parent” mean Banco Santander, S.A. References to “Santander Group” or “Grupo Santander” mean the worldwide operations of the Santander Spain conglomerate, as indirectly controlled by Santander Spain and its consolidated subsidiaries, including Santander Brasil.
All references herein to the “
real
,” “
reais
” or “R$” are to the Brazilian
real
, the official currency of Brazil. All references to “U.S. dollars,” “dollars” or “U.S.$” are to United States dollars. All references to the “
euro
,” “
euros
” or “€” are to the common legal currency of the member states participating in the European Economic and Monetary Union. References to “CI$” are to Cayman Islands dollars. References to “£” are to United Kingdom pounds sterling. See “Item 3. Key Information—A. Selected Financial Data—Exchange Rates” for information regarding exchange rates for the Brazilian currency.
Solely for the convenience of the reader, we have translated certain amounts included in “Item 3. Key Information—A. Selected Financial Data” and elsewhere in this annual report from
reais
into U.S. dollars using the exchange rate as reported by the Brazilian Central Bank, the “Brazilian Central Bank” or “BACEN,” as of December 31, 2013, which was R$2.3426 to U.S.$1.00, or on the indicated dates (subject to rounding adjustments). We make no representation that the
real
or U.S. dollar amounts actually represent or could have been or could be converted into U.S. dollars at the rates indicated, at any particular exchange rate or at all.
Certain figures included in this annual report have been subject to rounding adjustments. Accordingly, figures shown as totals in certain tables may not be an arithmetic aggregation of the figures that precede them.
Consolidated Financial Statements
We maintain our books and records in
reais
, our functional currency and presentation currency for the consolidated financial statements.
This annual report contains our consolidated financial statements as of December 31, 2013, 2012 and 2011, and for the years ended December 31, 2013, 2012 and 2011. Such consolidated financial statements have been prepared in accordance with International Financial Reporting Standards (“IFRS”), as issued by the International Accounting Standards Board (“IASB”) and interpretations issued by the IFRS Interpretation Committee (current name of “IFRIC”), and have been audited by Deloitte Touche Tohmatsu Auditores Independentes, an independent registered public accounting firm, whose report is included herein.
IFRS differs in certain significant respects from generally accepted accounting principles in the United States (“U.S. GAAP”). IFRS also differs in certain significant respects from Brazilian GAAP (as defined below). Note 46 to our audited consolidated financial statements for the years ended December 31, 2013, 2012 and 2011, included herein, contains information relating to certain differences between IFRS and Brazilian GAAP.
For statutory purposes, under National Monetary Council (
Conselho Monetário Nacional
or “CMN”) Resolution 3,786, dated September 24, 2009, we are required by the Brazilian Central Bank to prepare consolidated financial statements according to IFRS. However, we will also continue to prepare statutory financial statements in accordance with accounting practices established by the Law 6,404, dated December 15, 1976 (“Brazilian Corporate Law”) and standards established by the CMN, the Brazilian Central Bank and document template provided in the Accounting Chart for National Financial System Institutions (
Plano Contábil das Instituições do Sistema Financeiro Nacional
) or “Cosif” and the Brazilian Securities Commission (
Comissão de Valores Mobiliários
) or “CVM” to the extent such practices do not conflict with the rules of BACEN, the Accounting Pronouncements Committee (
Comitê de Pronunciamentos Contábeis
) or “CPC” to the extent approved by the Brazilian Central Bank, the National Council of Private Insurance (
Conselho Nacional de Seguros Privados
) or “CNSP” and the Superintendency of Private Insurance (
Superintendência de Seguros Privados
) or “SUSEP.” We refer to such Brazilian accounting
practices as “Brazilian GAAP.” See “Item 4. Information on the Company—B. Business Overview—Regulatory Overview—Auditing Requirements.”
Market Share and Other Information
We obtained the market and competitive position data, including market forecasts, used throughout this annual report from internal surveys, market research, publicly available information and industry publications. This data is updated to the latest available information for 2013. We have made these statements on the basis of information from third-party sources that we believe are reliable, such as the Brazilian association of savings and mortgage financing entities (
Associação Brasileira das Entidades de Crédito Imobiliário e Poupança
), or “ABECIP;” the Brazilian association of credit card companies (
Associação Brasileira de Empresas de Cartões de Crédito e Serviços
), or “ABECS;” the Brazilian association of leasing companies (
Associação Brasileira de Empresas de Leasing
), or “ABEL;” the national association of credit institutions, financing and investment (
Associação Nacional das Instituições de Crédito, Financiamento e Investimento
) or “ACREFI;” the national association of financial and capital markets entities (
Associação Brasileira das Entidades dos Mercados Financeiro e de Capitais
), or “ANBIMA;” the Brazilian Central Bank; the Brazilian social and economic development bank (
Banco Nacional de Desenvolvimento Econômico e Social
), or “BNDES;” the Brazilian Institute of Geography and Statistics, or the “IBGE;” the Brazilian bank federation (
Federação Brasileira de Bancos
), or “FEBRABAN;” the national federation of private retirement and life insurance (
Federação Nacional de Previdência Privada e Vida
), or “FENAPREVI;” the Getúlio Vargas Foundation (
Fundação Getúlio Vargas
), or “FGV;” the Brazilian Central Bank system (Sistema do Banco Central), or “SISBACEN,” a Brazilian Central Bank database; the SUSEP; the CVM; among others.
This annual report contains estimates and forward-looking statements, principally in “Item 3. Key Information—D. Risk Factors,” “Item 5. Operating and Financial Review and Prospects” and “Item 4. Information on the Company—B. Business Overview.” Some of the matters discussed concerning our business operations and financial performance include estimates and forward-looking statements within the meaning of the U.S. Private Securities Litigation Reform Act of 1995.
Our estimates and forward-looking statements are based mainly on our current expectations and estimates on projections of future events and trends, which affect or may affect our businesses and results of operations. Although we believe that these estimates and forward-looking statements are based upon reasonable assumptions, they are subject to certain risks and uncertainties and are made in light of information currently available to us. Our estimates and forward-looking statements may be influenced by the following factors, among others:
|
·
|
a deterioration of Brazilian political or economic conditions;
|
|
·
|
exposure to various types of inflation and interest rate risks, and Brazilian government efforts to control inflation and interest rates;
|
|
·
|
exposure to the sovereign debt of Brazil;
|
|
·
|
the effect of interest rate fluctuations on our obligations under employee pension funds;
|
|
·
|
exchange rate volatility;
|
|
·
|
infrastructure and labor force deficiencies in Brazil;
|
|
·
|
economic developments and perception of risk in other countries;
|
|
·
|
increasing competition and consolidation in the Brazilian financial services industry;
|
|
·
|
extensive regulation by the Brazilian government and the Brazilian Central Bank, among others;
|
|
·
|
changes in reserve requirements;
|
|
·
|
changes in taxes or other fiscal assessments;
|
|
·
|
potential losses associated with non-performing loans or non-performance by counterparties to other types of financial instruments;
|
|
·
|
a decrease in the rate of growth of our loan portfolio;
|
|
·
|
potential prepayment of our loan and investment portfolio;
|
|
·
|
potential increase in our cost of funding, in particular with relation to short-term deposits;
|
|
·
|
a default on, or a ratings downgrade of, the sovereign debt of Brazil or of our controlling shareholder;
|
|
·
|
the effectiveness of our credit risk management policies;
|
|
·
|
our ability to adequately manage market and operational risks;
|
|
·
|
potential deterioration in the value of the collateral securing our loan portfolio;
|
|
·
|
our dependence on proper functioning of information technology systems;
|
|
·
|
our ability to protect personal data;
|
|
·
|
our ability to protect our reputation;
|
|
·
|
our ability to detect and prevent money laundering and other illegal activity;
|
|
·
|
our ability to manage the growth of our operations; and
|
|
·
|
other risk factors as set forth under “Item 3. Key Information—D. Risk Factors.”
|
The words “believe,” “may,” “will,” “estimate,” “continue,” “anticipate,” “intend,” “expect” and similar words are intended to identify estimates and forward-looking statements. Estimates and forward-looking statements are intended to be accurate only as of the date they were made, and we undertake no obligation to update or to review any estimate and/or forward-looking statement because of new information, future events or other factors. Estimates and forward-looking statements involve risks and uncertainties and are not guarantees of future performance. Our future results may differ materially from those expressed in these estimates and forward-looking statements. You should therefore not make any investment decision based on these estimates and forward-looking statements.
The forward-looking statements contained in this report speak only as of the date of this report. We do not undertake to update any forward-looking statement to reflect events or circumstances after that date or to reflect the occurrence of unanticipated events.
|
Directors and Senior Management
|
Not applicable.
|
Advisers
|
Not applicable.
|
Auditors
|
Not applicable.
|
Offer Statistics
|
Not applicable.
|
Method and Expected Timetable
|
Not applicable.
|
Selected Financial Data
|
Financial information for Santander Brasil at and for the years ended December 31, 2013, 2012, 2011, 2010 and 2009 has been derived from our audited consolidated financial statements prepared in accordance with IFRS. See “Item 18. Financial Statements.” This financial information should be read in conjunction with our audited consolidated financial statements and the related notes and “Item 5. Operating and Financial Review and Prospects” included elsewhere in this annual report.
The income statement data and balance sheet data for 2013, 2012, 2011, 2010 and 2009 was adjusted due to changes in accounting policies related to the adoption of International Accounting Standards IAS 19—Employee Benefits and IFRS 5—Discontinued Operations.
The adoption of IAS 19 applies to financial years beginning on or after January 1, 2013, with the effects accounted for retrospectively as a change in accounting policies. The adoption of this new accounting policy resulted in the full recognition of liabilities on account of actuarial losses (actuarial deficit) not yet recognized due to the corridor approach, in contrast to the stockholders’ equity (other comprehensive income). For further information, see note 3 of our audited consolidated financial statements.
On December 17, 2013, we sold our asset management business through the disposal of all of our shares in Santander Brasil Asset Management Distribuidora de Títulos e Valores Mobiliários S.A. (“DTVM”), The gains/losses with the sale of the asset management business, thus the gains/losses of DTVM are recorded in “Discontinued Operations,” in accordance with IFRS 5—Discontinued Operations. For further information, see notes 3.a and 42 of our audited consolidated financial statements.
Income Statement Data
|
For the year ended December 31,
|
||||||||||||||||||||||||
|
2013
|
2013
|
2012
|
2011
|
2010
|
2009
|
|||||||||||||||||||
|
(in millions of U.S.$)(1)
|
(in millions of R$)
|
|||||||||||||||||||||||
|
Interest and similar income
|
21,863 | 51,217 | 52,644 | 51,716 | 40,887 | 39,324 | ||||||||||||||||||
|
Interest expense and similar charges
|
(9,706 | ) | (22,738 | ) | (21,057 | ) | (23,920 | ) | (16,823 | ) | (17,182 | ) | ||||||||||||
|
Net interest income
|
12,157 | 28,479 | 31,587 | 27,796 | 24,064 | 22,142 | ||||||||||||||||||
|
Income from equity instruments
|
35 | 81 | 94 | 94 | 52 | 30 | ||||||||||||||||||
|
Income from companies accounted for by the equity method
|
39 | 91 | 73 | 54 | 44 | 295 | ||||||||||||||||||
|
Fee and commission income
|
4,586 | 10,742 | 9,611 | 8,629 | 7,668 | 7,013 | ||||||||||||||||||
|
Fee and commission expense
|
(1,127 | ) | (2,641 | ) | (2,001 | ) | (1,429 | ) | (998 | ) | (910 | ) | ||||||||||||
|
Gains (losses) on financial assets and liabilities (net)
|
(489 | ) | (1,146 | ) | (548 | ) | (134 | ) | 1,458 | 2,716 | ||||||||||||||
|
Exchange differences (net)
|
235 | 551 | 378 | (121 | ) | 417 | (51 | ) | ||||||||||||||||
|
Other operating income (expenses)
|
(190 | ) | (445 | ) | (623 | ) | (378 | ) | (348 | ) | (115 | ) | ||||||||||||
|
Total income
|
15,246 | 35,712 | 38,571 | 34,511 | 32,357 | 31,120 | ||||||||||||||||||
|
Administrative expenses
|
(5,912 | ) | (13,850 | ) | (13,773 | ) | (12,783 | ) | (11,769 | ) | (11,483 | ) | ||||||||||||
|
Depreciation and amortization
|
(534 | ) | (1,252 | ) | (1,201 | ) | (1,000 | ) | (655 | ) | (680 | ) | ||||||||||||
|
Provisions (net)(2)
|
(1,149 | ) | (2,692 | ) | (2,057 | ) | (2,985 | ) | (1,922 | ) | (3,459 | ) | ||||||||||||
|
Impairment losses on financial assets (net)(3)
|
(6,027 | ) | (14,118 | ) | (16,476 | ) | (9,382 | ) | (8,234 | ) | (9,966 | ) | ||||||||||||
|
Impairment losses on other assets (net)
|
(147 | ) | (345 | ) | (38 | ) | (39 | ) | (21 | ) | (901 | ) | ||||||||||||
|
Gains (losses) on disposal of assets not classified as non-current assets held for sale
|
196 | 460 | 501 | 5 | (59 | ) | 3,369 | |||||||||||||||||
|
Gains (losses) on non-current assets held for sale not classified as discontinued operations
|
44 | 103 | (52 | ) | 447 | 199 | 32 | |||||||||||||||||
|
Operating profit before tax
|
1,717 | 4,018 | 5,475 | 8,774 | 9,896 | 8,032 | ||||||||||||||||||
|
Income taxes
|
(100 | ) | (233 | ) | (37 | ) | (1,101 | ) | (2,572 | ) | (2,583 | ) | ||||||||||||
|
Net Profit from Continuing Operations
|
1,617 | 3,785 | 5,438 | 7,673 | 7,323 | 5,450 | ||||||||||||||||||
|
Discontinued Operations
|
879 | 2,063 | 55 | 74 | 85 | 66 | ||||||||||||||||||
|
Consolidated Profit for the Year
|
2,496 | 5,848 | 5,493 | 7,747 | 7,408 | 5,516 | ||||||||||||||||||
|
(1)
|
Translated for convenience only using the selling rate as reported by the Brazilian Central Bank at December 31, 2013, for
reais
into U.S. dollars of R$2.3426 to U.S.$1.00.
|
|
(2)
|
Mainly provisions for tax risks and legal obligations, and judicial and administrative proceedings of labor and civil lawsuits.
|
|
(3)
|
Net provisions to the credit loss allowance less recovery of loans previously written off.
|
Earnings and Dividend per Share Information
|
For the year ended December 31,
|
||||||||||||||||||||
|
2013
|
2012
|
2011
|
2010
|
2009
|
||||||||||||||||
|
Basic Earnings per 1,000 shares
|
||||||||||||||||||||
|
From continuing and discontinued operations
|
||||||||||||||||||||
|
Basic Earnings per shares (
reais
)
|
14.39 | 13.77 | 19.39 | 18.50 | 16.03 | |||||||||||||||
|
Diluted Earnings per shares (
reais
)
|
14.38 | 13.77 | 19.39 | 18.50 | 16.03 | |||||||||||||||
|
Basic Earnings per shares (U.S. dollars)(1)
|
6.14 | 6.74 | 10.34 | 11.10 | 9.21 | |||||||||||||||
|
Diluted Earnings per shares (U.S. dollars)(1)
|
6.14 | 6.74 | 10.34 | 11.10 | 9.21 | |||||||||||||||
|
From continuing operations
|
||||||||||||||||||||
|
Basic Earnings per shares (
reais
)
|
9.20 | 13.63 | 19.21 | 18.29 | 15.84 | |||||||||||||||
|
Diluted Earnings per shares (
reais
)
|
9.20 | 13.63 | 19.21 | 18.29 | 15.84 | |||||||||||||||
|
Basic Earnings per shares (U.S. dollars)(1)
|
3.93 | 6.67 | 10.24 | 10.97 | 9.10 | |||||||||||||||
|
Diluted Earnings per shares (U.S. dollars)(1)
|
3.93 | 6.67 | 10.24 | 10.97 | 9.10 | |||||||||||||||
|
From discontinued operations
|
||||||||||||||||||||
|
Basic Earnings per shares (
reais
)
|
5.19 | 0.14 | 0.18 | 0.21 | 0.19 | |||||||||||||||
|
Diluted Earnings per shares (
reais
)
|
5.18 | 0.14 | 0.18 | 0.21 | 0.19 | |||||||||||||||
|
Basic Earnings per shares (U.S. dollars)(1)
|
2.21 | 0.07 | 0.10 | 0.13 | 0.11 | |||||||||||||||
|
Diluted Earnings per shares (U.S. dollars)(1)
|
2.21 | 0.07 | 0.10 | 0.13 | 0.11 | |||||||||||||||
|
Dividends and interest on capital
per shares(2)
|
||||||||||||||||||||
|
Dividends and interest on capital per shares - Units (
reais
)
|
634,54 | 705,06 | 836,75 | 932,33 | 250,20 | |||||||||||||||
|
Dividends and interest on capital per shares - Units (U.S. dollars)(1)
|
270,87 | 344,98 | 446,12 | 559,28 | 143,72 | |||||||||||||||
|
Weighted average share outstanding (in thousands) – basic
|
397,875,180 | 398,046,965 | 399,044,117 | 399,044,117 | 343,506,993 | |||||||||||||||
|
Weighted average share outstanding (in thousands) – diluted
|
398,035,046 | 398,291,052 | 399,044,117 | 399,044,117 | 343,506,993 | |||||||||||||||
|
(1)
|
Translated for convenience only using the selling rate as reported by the Brazilian Central Bank at December 31, 2013, for
reais
into U.S. dollars of R$2.3426 to U.S.$1.00.
|
|
(2)
|
Includes dividends based on net income and dividends based on reserves.
|
Balance Sheet Data
|
At December 31,
|
||||||||||||||||||||||||
|
2013
|
2013
|
2012
|
2011
|
2010
|
2009
|
|||||||||||||||||||
|
(in millions of U.S.$)(1)
|
(in millions of R$)
|
|||||||||||||||||||||||
|
Assets
|
||||||||||||||||||||||||
|
Cash and balances with the Brazilian Central Bank
|
22,075 | 51,714 | 55,535 | 65,938 | 56,800 | 27,269 | ||||||||||||||||||
|
Financial assets held for trading
|
12,887 | 30,189 | 31,638 | 29,901 | 24,821 | 20,116 | ||||||||||||||||||
|
Other financial assets at fair value through profit or loss(2)
|
554 | 1,298 | 1,228 | 665 | 17,940 | 16,295 | ||||||||||||||||||
|
Available-for-sale financial assets
|
19,759 | 46,287 | 44,149 | 44,608 | 47,206 | 46,406 | ||||||||||||||||||
|
Loans and receivables
|
110,466 | 258,778 | 226,957 | 202,757 | 174,106 | 152,163 | ||||||||||||||||||
|
Hedging derivatives
|
151 | 353 | 156 | 81 | 116 | 163 | ||||||||||||||||||
|
Non-current assets held for sale
|
117 | 275 | 166 | 132 | 67 | 172 | ||||||||||||||||||
|
Investments in associates and joint ventures
|
454 | 1,064 | 472 | 422 | 371 | 419 | ||||||||||||||||||
|
Tax assets
|
9,417 | 22,060 | 21,497 | 17,017 | 15,117 | 15,960 | ||||||||||||||||||
|
Other assets
|
2,171 | 5,085 | 5,601 | 4,803 | 3,915 | 4,087 | ||||||||||||||||||
|
Tangible assets
|
2,939 | 6,886 | 5,938 | 5,008 | 4,518 | 3,702 | ||||||||||||||||||
|
Intangible assets
|
12,407 | 29,064 | 29,271 | 29,245 | 29,960 | 29,402 | ||||||||||||||||||
|
Total assets
|
193,398 | 453,053 | 422,608 | 400,579 | 374,937 | 316,154 | ||||||||||||||||||
|
Average assets
|
185,813 | 435,286 | 408,143 | 394,788 | 341,956 | 298,355 | ||||||||||||||||||
|
At December 31,
|
||||||||||||||||||||||||
|
2013
|
2013
|
2012
|
2011
|
2010
|
2009
|
|||||||||||||||||||
|
(in millions of U.S.$)(1)
|
(in millions of R$)
|
|||||||||||||||||||||||
|
Liabilities
|
||||||||||||||||||||||||
|
Financial liabilities held for trading
|
5,786 | 13,554 | 5,352 | 5,047 | 4,785 | 4,435 | ||||||||||||||||||
|
Other financial liabilities at fair value through profit or loss
|
— | — | — | — | — | 2 | ||||||||||||||||||
|
Financial liabilities at amortized cost
|
140,741 | 329,701 | 306,976 | 291,452 | 253,341 | 203,568 | ||||||||||||||||||
|
Deposits from the Brazilian Central Bank and deposits from credit institutions
|
14,527 | 34,032 | 35,074 | 51,527 | 42,391 | 21,196 | ||||||||||||||||||
|
Customer deposits
|
85,442 | 200,156 | 188,595 | 174,474 | 167,949 | 149,440 | ||||||||||||||||||
|
Marketable debt securities
|
27,875 | 65,301 | 54,012 | 38,590 | 20,087 | 11,439 | ||||||||||||||||||
|
Subordinated debts
|
3,802 | 8,906 | 11,919 | 10,908 | 9,695 | 11,305 | ||||||||||||||||||
|
Other financial liabilities
|
9,095 | 21,306 | 17,376 | 15,952 | 13,218 | 10,188 | ||||||||||||||||||
|
Hedging derivatives
|
269 | 629 | 282 | 36 | — | 10 | ||||||||||||||||||
|
Liabilities for insurance contracts
|
— | — | 19,643 | 15,527 | ||||||||||||||||||||
|
Provisions(3)
|
4,650 | 10,892 | 12,775 | 11,358 | 10,082 | 9,933 | ||||||||||||||||||
|
Tax liabilities
|
4,991 | 11,693 | 13,784 | 11,876 | 10,530 | 9,457 | ||||||||||||||||||
|
Other liabilities
|
2,105 | 4,928 | 4,303 | 3,928 | 3,606 | 4,228 | ||||||||||||||||||
|
Total liabilities
|
158,542 | 371,397 | 343,472 | 323,696 | 301,986 | 247,160 | ||||||||||||||||||
|
Stockholders’ equity
|
35,575 | 83,340 | 79,921 | 77,117 | 72,653 | 68,762 | ||||||||||||||||||
|
Other Comprehensive Income
|
(842 | ) | (1,973 | ) | (1,022 | ) | (254 | ) | 290 | 231 | ||||||||||||||
|
Non-controlling interests
|
123 | 289 | 237 | 19 | 8 | 1 | ||||||||||||||||||
|
Total Stockholders’ Equity
|
34,856 | 81,655 | 79,136 | 76,882 | 72,951 | 68,994 | ||||||||||||||||||
|
Total liabilities and stockholders’ equity
|
193,398 | 453,053 | 422,608 | 400,578 | 374,937 | 316,154 | ||||||||||||||||||
|
Average interest-bearing liabilities
|
122,676 | 287,382 | 265,328 | 244,453 | 198,453 | 184,332 | ||||||||||||||||||
|
Average stockholders’ equity
|
34,541 | 80,916 | 77,886 | 75,606 | 72,495 | 55,920 | ||||||||||||||||||
|
(1)
|
Translated for convenience only using the selling rate as reported by the Brazilian Central Bank at December 31, 2013, for
reais
into U.S. dollars of R$2.3426 to U.S.$1.00.
|
|
(2)
|
In 2010 and 2009, this item includes investment fund units of guarantors of benefit plans – PGBL/VGBL, in the amount of R$17,426 million and R$14,184 million, respectively, related to the liabilities for insurance contracts held by Zurich Santander Brasil Seguros e Previdência S.A., formerly Santander Seguros S.A. (“Santander Seguros”), which were no longer included in the consolidation in 2011, following the sale of Santander Seguros. See “Item 5. Operating and Financial Review and Prospects—A. Operating Results—Factors Affecting the Comparability of Our Results of Operation—Sale of Zurich Santander Brasil Seguros e Previdência S.A. (the new corporate name of Santander Seguros S.A.”).
|
|
(3)
|
Mainly provisions for tax risks and legal obligations, and judicial and administrative proceedings of labor and civil lawsuits.
|
Selected Consolidated Ratios
|
At and for the Year Ended December 31,
|
||||||||||||||||||||
|
2013
|
2012
|
2011
|
2010
|
2009
|
||||||||||||||||
|
in (%)
|
||||||||||||||||||||
|
Profitability and performance
|
||||||||||||||||||||
|
Net yield(1)
|
8.0 | 9.5 | 8.6 | 8.8 | 9.7 | |||||||||||||||
|
Return on average total assets
|
1.3 | 1.3 | 2.0 | 2.2 | 1.8 | |||||||||||||||
|
Return on average stockholders’ equity
|
7.3 | 7.1 | 10.3 | 10.2 | 9.9 | |||||||||||||||
|
Adjusted return on average stockholders’ equity(2)
|
10.9 | 10.8 | 16.3 | 16.7 | 19.6 | |||||||||||||||
|
Capital adequacy
(3)
|
||||||||||||||||||||
|
Average stockholders’ equity as a percentage of average total assets
|
18.5 | 19.1 | 19.2 | 21.2 | 18.7 | |||||||||||||||
|
Average stockholders’ equity excluding goodwill as a percentage of average total assets excluding goodwill(2)
|
13.1 | 13.3 | 13.0 | 14.1 | 10.4 | |||||||||||||||
|
Basel capital adequacy ratio(4)
|
19.2 | 20.8 | 24.8 | 28.4 | 33.4 | |||||||||||||||
|
Asset quality
|
||||||||||||||||||||
|
Non-performing assets as a percentage of loans and advances to customers (gross)(5)
|
6.2 | 7.6 | 6.7 | 5.8 | 7.2 | |||||||||||||||
|
Non-performing assets as a percentage of total assets(5)
|
3.1 | 3.8 | 3.3 | 2.5 | 3.1 | |||||||||||||||
|
Non-performing assets as a percentage of computable credit risk(5)(6)
|
5.4 | 6.7 | 6.0 | 5.1 | 6.2 | |||||||||||||||
|
Impairment losses as a percentage of non-performing assets(5)
|
96.1 | 87.0 | 85.0 | 98.3 | 101.7 | |||||||||||||||
|
Impairment losses as a percentage of loans and advances to customers (gross)
|
6.0 | 6.6 | 5.7 | 5.7 | 7.2 | |||||||||||||||
|
Derecognized assets as a percentage of loans and advances to customers (gross)
|
6.5 | 7.2 | 4.7 | 6.2 | 6.2 | |||||||||||||||
|
Non-performing assets as a percentage of stockholders’ equity(5)
|
17.2 | 20.4 | 17.0 | 12.9 | 14.4 | |||||||||||||||
|
Non-performing assets as a percentage of stockholders’ equity excluding goodwill(2)(5)
|
25.9 | 31.1 | 26.3 | 21.1 | 24.5 | |||||||||||||||
|
Liquidity
|
||||||||||||||||||||
|
Total loans, net as a percentage of total funding(7)
|
69.0 | 67.9 | 66.4 | 63.0 | 66.4 | |||||||||||||||
|
Other Information
|
||||||||||||||||||||
|
Efficiency
|
||||||||||||||||||||
|
Efficiency ratio(8)
|
38.8 | 35.7 | 37.0 | 36.3 | 36.8 | |||||||||||||||
|
Adjusted efficiency ratio
|
36.4 | 34.4 | 35.4 | 36.6 | 38.2 | |||||||||||||||
|
(1)
|
Net yield is defined as net interest income (including dividends on equity securities) divided by average interest earning assets.
|
|
(2)
|
“Adjusted return on average stockholders’ equity,” “Average stockholders’ equity excluding goodwill as a percentage of average total assets excluding goodwill” and “Non-performing assets as a percentage of stockholders’ equity excluding goodwill” are non-GAAP financial measures which adjust “Return on average stockholders’ equity,” “Average stockholders’ equity as a percentage of average total assets” and “Non-performing assets as a percentage of stockholders’ equity,” to exclude the goodwill arising from the acquisition of Banco Real in 2008.
|
|
(3)
|
The average annual balance sheet data has been calculated based upon the average of the monthly of balances at 13 dates: at December 31 of the prior year and each of the month-end balances of the 12 subsequent months.
|
|
(4)
|
Basel III capital adequacy ratio as measured pursuant to Brazilian Central Bank rules in effect as from December 31, 2013. In March 2013, the Brazilian Central Bank published a set of four resolutions and 15 circulars implementing Basel III. The regulations came into effect in October 2013, and apply to all banks operating in Brazil. This new set of regulations covers the revised definition of capital, capital requirements, capital buffers, credit valuation adjustments and exposures to central counterparties. Additional regulations and some important amendments were issued in late October 2013 to clarify and improve the risk-based capital framework. Some of the revisions came into effect in December 2013. The changes are especially relating to the definition of capital and other aspects of Pillar 1. The most important difference is the phase-in of the deduction of goodwill from regulatory capital. According to the new rules on regulatory capital in Brazil, the value of goodwill for the calculation of capital base will be deducted from the capital base according to the “phase-in” for implementation of Basel III in Brazil which will be completed by 2019. In December 2013, The Basel Committee on Banking Supervision issued a report presenting the findings of the Basel Committee’s RCAP Assessment Team on the domestic adoption of Basel III risk-based capital standards in Brazil and their consistency with Basel Committee requirements: Brazil’s capital regulations were found to be Compliant with the internationally agreed minimum Basel III standards. The set of regulations published in October 2013 has strengthened the Brazilian capital regulation. The final requirements of liquidity and leverage were not defined yet. The leverage ratio, the liquidity ratios and the framework for global systemically important banks (G-SIBs) will be assessed at a later date once those standards become effective as per the internationally agreed “phase-in” arrangements. For more information see “Item 4. Information on the Company—B. Business Overview—Regulatory Overview—Capital Adequacy and Leverage—Basel.”
|
|
(5)
|
Non-performing assets include all loans and advances past due by more than 90 days and other doubtful credits. For further information see “Item 4. Information on the Company—B. Business Overview—Selected Statistical Information—Impaired Assets”
|
|
(6)
|
Computable credit risk is the sum of the face amounts of loans and leases (including non-performing assets), guarantees and documentary credits.
|
|
(7)
|
Total funding is the sum of financial liabilities at amortized cost, excluding the other financial liabilities, for further information see “Item 5B.Liquidity and Capital Resources - Liquidity and Funding.”
|
|
(8)
|
Efficiency ratio is defined as administrative expenses divided by total income. The adjustment, which impacts the line items income tax, gains (losses) on financial assets and liabilities and exchange rate differences, does not affect net profit. Our management believes that the adjusted efficiency ratio provides a more consistent framework for evaluating and conducting business, as a result of excluding from our revenues the effect of the volatility caused by possible gains and losses on our hedging strategies for tax purposes. For example, in 2013, the effects of the devaluation of the
real
against foreign currency impacted our tax hedging of the investments denominated in dollars generating losses of R$2,367 million recorded under “gains/losses on financial assets and liabilities (net),” equivalent to 2.8 percentage points variance in the efficiency ratio. In 2012 the impact of tax hedging in dollars was a loss of R$1,437 million and a gain of R$1,646 million in 2011, which corresponded to a variation in the efficiency ratio of 1.3 percentage points in 2012.
|
The information below presents the calculation of these non-GAAP financial measures from each of their most directly comparable financial measures.
|
At and for the year ended December 31,
|
||||||||||||||||||||
|
2013
|
2012
|
2011
|
2010
|
2009
|
||||||||||||||||
|
(in millions of R$, except as otherwise indicated)
|
||||||||||||||||||||
|
Return on average stockholders’ equity:
|
||||||||||||||||||||
|
Consolidated profit for the year
|
5,848 | 5,493 | 7,747 | 7,408 | 5,516 | |||||||||||||||
|
Average stockholders’ equity
|
80,916 | 77,886 | 75,606 | 72,495 | 55,920 | |||||||||||||||
|
Return on average stockholders’ equity
|
7.3 | % | 7.1 | % | 10.3 | % | 10.2 | % | 9.9 | % | ||||||||||
|
Adjusted return on average stockholders’ equity:
|
||||||||||||||||||||
|
Consolidated profit for the year
|
5,848 | 5,493 | 7,747 | 7,408 | 5,516 | |||||||||||||||
|
Average stockholders’ equity
|
80,916 | 77,886 | 75,606 | 72,495 | 55,920 | |||||||||||||||
|
Average goodwill
|
27,218 | 27,218 | 27,975 | 28,312 | 27,714 | |||||||||||||||
|
Average stockholders’ equity excluding goodwill
|
53,698 | 50,668 | 47,631 | 44,183 | 28,206 | |||||||||||||||
|
Adjusted return on average stockholders’ equity
|
10.9 | % | 10.8 | % | 16.3 | % | 16.7 | % | 19.6 | % | ||||||||||
|
Average stockholders’ equity as a percentage of average total assets:
|
||||||||||||||||||||
|
Average stockholders’ equity
|
80,916 | 77,886 | 75,606 | 72,495 | 55,920 | |||||||||||||||
|
Average total assets
|
435,283 | 408,143 | 394,788 | 341,956 | 298,355 | |||||||||||||||
|
Average stockholders’ equity as a percentage of average total assets
|
18.5 | % | 19.1 | % | 19.2 | % | 21.2 | % | 18.7 | % | ||||||||||
|
Average stockholders’ equity excluding goodwill as a percentage of average total assets excluding goodwill:
|
||||||||||||||||||||
|
Average stockholders’ equity
|
80,916 | 77,886 | 75,606 | 72,495 | 55,920 | |||||||||||||||
|
Average goodwill
|
27,218 | 27,218 | 27,975 | 28,312 | 27,714 | |||||||||||||||
|
Average stockholders’ equity excluding goodwill
|
53,698 | 50,668 | 47,631 | 44,183 | 28,206 | |||||||||||||||
|
Average total assets
|
435,283 | 408,143 | 394,788 | 341,956 | 298,355 | |||||||||||||||
|
Average goodwill
|
27,218 | 27,218 | 27,975 | 28,312 | 27,714 | |||||||||||||||
|
Average total assets excluding goodwill
|
408,065 | 380,925 | 366,813 | 313,644 | 270,641 | |||||||||||||||
|
Average stockholders’ equity excluding goodwill as a percentage of average total assets excluding goodwill
|
13.1 | % | 13.3 | % | 13.0 | % | 14.1 | % | 10.4 | % | ||||||||||
|
Non-performing assets as a percentage of stockholders’ equity:
|
||||||||||||||||||||
|
Non-performing assets
|
14,022 | 16,057 | 13,073 | 9,349 | 9,900 | |||||||||||||||
|
Stockholders’ equity
|
81,366 | 78,899 | 76,863 | 72,653 | 68,762 | |||||||||||||||
|
Non-performing assets as a percentage of stockholders’ equity
|
17.2 | % | 20.4 | % | 17.0 | % | 12.9 | % | 14.4 | % | ||||||||||
|
Non-performing assets as a percentage of stockholders’ equity excluding goodwill:
|
||||||||||||||||||||
|
Non-performing assets
|
14,022 | 16,057 | 13,073 | 9,349 | 9,900 | |||||||||||||||
|
Stockholders’ equity
|
81,366 | 78,899 | 76,863 | 72,653 | 68,762 | |||||||||||||||
|
Goodwill
|
27,218 | 27,218 | 27,218 | 28,312 | 28,312 | |||||||||||||||
|
Stockholders’ equity excluding goodwill
|
54,148 | 51,681 | 49,645 | 44,341 | 40,450 | |||||||||||||||
|
Non-performing assets as a percentage of stockholders’ equity excluding goodwill
|
25.9 | % | 31.1 | % | 26.3 | % | 21.1 | % | 24.5 | % | ||||||||||
Our calculation of these non-GAAP measures may differ from the calculation of similarly titled measures used by other companies. We believe that these non-GAAP financial measures supplement the
GAAP
information provided to investors regarding the substantial impact of the R$27 billion goodwill arising from the acquisition of Banco Real during the year ended December 31, 2008 and the significance of other factors affecting stockholders’ equity and the related ratios. Accordingly, we believe that the non-GAAP measures presented are useful to investors, because they reflect the economic substance of our capital. The limitation associated with the exclusion of goodwill from stockholders’ equity is that it has the effect of excluding a portion of the total investment in our assets. We compensate for this limitation by also considering stockholders´ equity including goodwill, as set forth in the above tables.
The table below presents the reconciliation of our adjusted efficiency ratio to the most directly comparable GAAP financial measures for each of the periods presented.
|
At and for the year ended December 31,
|
||||||||||||||||||||
|
2013
|
2012
|
2011
|
2010
|
2009
|
||||||||||||||||
|
(in millions of R$, except as otherwise indicated)
|
||||||||||||||||||||
|
Efficiency ratio
|
||||||||||||||||||||
|
Administrative expenses
|
13,850 | 13,773 | 12,783 | 11,813 | 11,516 | |||||||||||||||
|
Total income
|
35,712 | 38,570 | 34,510 | 32,544 | 31,274 | |||||||||||||||
|
of which:
|
||||||||||||||||||||
|
Gains (losses) on financial assets and liabilities (net) and exchange differences (net)
|
(595 | ) | (170 | ) | (255 | ) | 1,875 | 2,665 | ||||||||||||
|
Efficiency ratio
|
38.8 | % | 35.7 | % | 37.0 | % | 36.3 | % | 36.8 | % | ||||||||||
|
Total Income
|
35,712 | 38,570 | 34,510 | 32,544 | 31,274 | |||||||||||||||
|
Effects of the tax hedge for investments held abroad
|
2,367 | 1,437 | 1,646 | (272 | ) | (1,146 | ) | |||||||||||||
|
Total income excluding effects of the tax hedge for investments held abroad
|
38,079 | 40,007 | 36,156 | 32,272 | 30,128 | |||||||||||||||
|
Administrative expenses
|
13,850 | 13,773 | 12,783 | 11,813 | 11,516 | |||||||||||||||
|
Total income excluding effects of the tax hedge for investments held abroad
|
38,079 | 40,007 | 36,156 | 32,272 | 30,128 | |||||||||||||||
|
of which:
|
||||||||||||||||||||
|
Gains (losses) on financial assets and liabilities (net) excluding effects of the tax hedge for investments held abroad
|
1,772 | 1,267 | 1,411 | 1,603 | 1,519 | |||||||||||||||
|
Efficiency ratio adjusted for effects of the tax hedge for investments held abroad
|
36.37 | % | 34.4 | % | 35.4 | % | 36.6 | % | 38.2 | % | ||||||||||
Exchange Rates
The Brazilian foreign exchange system allows the purchase and sale of foreign currency and the international transfer of
reais
by any person or legal entity, regardless of the amount, subject to certain regulatory procedures.
Since 1999, the Brazilian Central Bank has allowed the
real
/U.S. dollar exchange rate to float freely, which resulted in increased foreign exchange rate volatility. Until early 2003, the value of the
real
declined in relation to the U.S. dollar. Between 2006 and 2008, the
real
strengthened, except during the most severe period of the global economic crisis. Given the recent turmoil in international markets, the
real
has been depreciating since mid-2011. The Brazilian Central Bank has intervened in the foreign exchange market to control unstable movements of exchange rates. The
real
may fluctuate against the U.S. dollar substantially in the future. For further information on these risks, see “—D. Risk Factors—Risks Relating to Brazil and Macroeconomic Conditions in Brazil and Globally—Exchange rate volatility may have a material adverse effect on the Brazilian economy and on our business.”
The following tables set forth the selling rate, expressed in
reais
per U.S. dollar (R$/U.S.$), for the periods indicated:
|
Period-end
|
Average(1)
|
Low
|
High
|
|||||||||||||
|
(per U.S. dollar)
|
||||||||||||||||
|
Year:
|
||||||||||||||||
|
2009
|
1.74 | 1.99 | 1.70 | 2.42 | ||||||||||||
|
2010
|
1.67 | 1.76 | 1.65 | 1.88 | ||||||||||||
|
2011
|
1.87 | 1.67 | 1.53 | 1.90 | ||||||||||||
|
2012
|
2.04 | 1.96 | 1.70 | 2.11 | ||||||||||||
|
2013
|
2.34 | 2.16 | 1.95 | 2.45 | ||||||||||||
|
Period-end
|
Average(1)
|
Low
|
High
|
|||||||||||||
|
(per U.S. dollar)
|
||||||||||||||||
|
Month Ended:
|
||||||||||||||||
|
September 2013
|
2.23 | 2.27 | 2.20 | 2.39 | ||||||||||||
|
October 2013
|
2.20 | 2.19 | 2.16 | 2.21 | ||||||||||||
|
November 2013
|
2.32 | 2.30 | 2.24 | 2.34 | ||||||||||||
|
December 2013
|
2.34 | 2.35 | 2.31 | 2.38 | ||||||||||||
|
January 2014
|
2.43 | 2.38 | 2.33 | 2.44 | ||||||||||||
|
February 2014
|
2.33 | 2.38 | 2.33 | 2.42 | ||||||||||||
|
March 2014
|
2.26 | 2.33 | 2.26 | 2.36 | ||||||||||||
|
April 2014 (through April 29)
|
2.22
|
2.23
|
2.20
|
2.28
|
||||||||||||
|
Source: Brazilian Central Bank
|
|
(1)
|
Represents the average of the exchange rates on the close of each business day during the period.
|
Our parent company, Santander Spain, reports its financial condition and results of operations in
euros
. As of December 31, 2013, the exchange rate for
euro
to
real
was R$3.2265 per €1.00.
|
|
Not applicable.
|
Reasons for the Offer and Use of Proceeds
|
Not applicable.
|
Risk Factors
|
Our business, financial condition and results of operations could be materially and adversely affected if any of the risks described below occur. As a result, the market price of our units and the American Depositary Shares (“ADSs”) could decline, and you could lose all or part of your investment.
Risks Relating to Brazil and Macroeconomic Conditions in Brazil and Globally
The Brazilian government has exercised significant influence over the Brazilian economy. The Brazilian government’s macro-economic management strategies, as well as Brazilian political and economic conditions, could adversely affect us and the trading price of our securities.
The Brazilian government has frequently intervened in the Brazilian economy and has on occasion made significant changes in policy and regulations. In the past, the Brazilian government has adopted measures, including, among others, changes in regulation, price controls, capital controls, change in the exchange rate regime and limitations on imports, which have affected Brazilian asset prices. Recently, the Brazilian government has adopted measures, including changes in tax policies and constraints that have affected Brazilian asset prices and the trading price of our securities. We and the trading price of our securities may be adversely affected by changes in policy or regulations at the federal, state and municipal levels involving or affecting factors such as:
|
|
·
|
interest rates;
|
|
|
·
|
currency volatility;
|
|
|
·
|
inflation;
|
|
|
·
|
reserve requirements;
|
|
|
·
|
capital requirements;
|
|
|
·
|
liquidity of capital and lending markets
|
|
|
·
|
non-performing loans;
|
|
|
·
|
tax policies;
|
|
|
·
|
exchange rate controls and restrictions on remittances abroad, such as those that were briefly imposed in 1989 and early 1990;
|
|
|
·
|
outcome of the elections being held in October 2014; and
|
|
|
·
|
other political, social and economic developments in or affecting Brazil.
|
Uncertainty over whether the Brazilian government will implement changes in policy or regulation creates instability in the Brazilian economy, increasing the volatility of the Brazilian securities markets, which may have an adverse effect on us and our securities. Recent economic and political instability has led to a negative perception of the Brazilian economy and higher volatility in the Brazilian securities markets, which also may adversely affect us and our securities.
Between the end of 2010 and the beginning of 2011, the Brazilian Central Bank adopted certain measures in order to control outstanding credit growth, known as macro prudential measures. These measures focused on controlling the issuance of new loans, such as increasing the down payment required for new loans, increasing the minimum payment of credit card bills, as well as implementing a higher minimum capital requirement for certain types of loans, and increasing reserve requirements. Additionally, the government increased tax on foreign capital inflow in order to control the trend of exchange rate appreciation. These measures negatively impacted the results of all Brazilian banks. Since the beginning of 2012, the Brazilian Central Bank has loosened certain of these measures, including reducing the reserve requirements of demand and time deposits.
In 2012, the Brazilian government decided to promote credit growth at state-owned banks, increasing their market share mainly in the market for lending to individuals, which also adversely affected the results of operations for private-owned banks.
In addition, over the past twelve months, there has been an increase in volatility in all Brazilian markets due to, among other factors, uncertainties about how monetary policy adjustments in the United States will affect the international financial markets, the recent increasing risk aversion to emerging market countries, and the uncertainties regarding Brazilian macroeconomic conditions. These uncertainties adversely affect us and the market value of our securities.
Political demonstrations in Brazil also have affected the development of the Brazilian economy and investors’ perception about Brazil. For example, the street protests in mid-2013 in Brazil demonstrated the public’s dissatisfaction with corruption and certain political measures, and represent a potential risk to the Brazilian economic and social outlook.
We are not able to fully estimate the impact of economic shocks and economic regulatory policy changes on our business and lending activity, nor we are able to predict how current or future measures implemented by regulatory policy-makers may impact our business. Any changes in regulatory capital requirements for lending, reserve requirements, or product and service regulations, among others, may materially adversely affect our business.
Government efforts to control inflation and changes in interest rates may hinder the growth of the Brazilian economy and could harm our business.
Brazil has experienced extremely high rates of inflation in the past and has therefore implemented monetary policies that have resulted in one of the highest interest rates in the world. The Brazilian government’s measures to fight inflation, principally through the Brazilian Central Bank, have had and may in the future have significant effects on the Brazilian economy and our business. Tight monetary policies with high interest rates and high compulsory reserve requirements may restrict Brazil’s growth and the availability of credit, reduce our loan volumes and increase our loan loss provisions. Conversely, less strict government and Brazilian Central Bank policies and interest rate decreases may trigger increases in inflation, and, consequently, growth volatility and the need for sudden and significant interest rate increases, which could negatively affect our credit spreads.
From January 2000 to August 2005, the average annual interest rate in Brazil was 18.9%, with the minimum rate of 15.25% and maximum of 26.50% during this period. With the favorable macroeconomic environment and inflation stability, the Brazilian Central Bank began a cycle of reducing the SELIC rate (the benchmark interest rate payable to holders of certain Brazilian government securities, based on bank’s overnight rate), starting at a rate of 19.5% in September 2005 and lowering it to 8.75% in March 2010, when the SELIC rate reached then a historical low. At the end of 2010, in order to balance domestic demand, the Brazilian Central Bank started to increase the SELIC rate again, reaching 12.5% in July 2011. However, the Brazilian Central Bank revised its monetary policy in August 2011, when it implemented a monetary easing policy to mitigate the spillover effects of the then ongoing international financial crisis (particularly in Europe). As a result of this change in policy, the SELIC rate was decreased a number of times during the second half of 2011 and throughout 2012, reaching 7.25% (the lowest rate on record) by the end of 2012. The Brazilian Central Bank tightened monetary policy once more in 2013, progressively increasing the SELIC rate starting in April 2013, and reaching 10.0% in November 2013. The SELIC rate continued to be increased, reaching 11.00% in April, 2014.
The majority of our income, expenses, assets and liabilities are directly tied to interest rates. Therefore, our results of operations and financial condition are significantly affected by inflation, interest rate fluctuations and related government monetary policies, all of which may materially and adversely affect the growth of the Brazilian economy, our loan portfolios, our cost of funding and our income from credit operations. We estimate that in 2013, a 1.0% increase or decrease in the base interest rate would have resulted in a decrease or increase, respectively, in our net interest income of R$383 million. Any changes in interest rates may negatively impact our business, financial condition and results of operations. In addition, increases in base interest rates may adversely affect us by reducing the demand for our credit and investment products, increasing funding costs and increasing in the short run the risk of default by our customers.
Inflation adversely affects our personnel and other administrative expenses that are directly or indirectly tied to inflation indexes, generally the consumer price index (
Índice de Preços ao Consumidor – Amplo)
, or “IPCA,” and the general index of market prices (
Índice Geral de Preços-Mercado)
, or IGP-M. For example, considering the amounts in 2013, each additional percentage point change in inflation, would impact our personnel and other administrative expenses by approximately R$70 million and R$63 million, respectively.
Exposure to Brazilian federal government debt could have a material adverse effect on us.
We invest in Brazilian government sovereign bonds. As of December 31, 2013, approximately 11% of our total assets, and 76% of our securities portfolio, was comprised of debt securities issued by the Brazilian government. Any failure by the Brazilian government to make timely payments under the terms of these securities, or a significant decrease in their market value, will have a material adverse effect on us.
Fluctuations in interest rates and other factors may affect our obligations under legacy employee pension funds.
We sponsor certain defined benefit pension plans and a health care plan that benefit certain of our former and current employees, most of which were inherited from Banespa (though we discontinued the use of defined benefit pension plans for our employees in 2005).
In order to determine the funded status of each legacy defined benefit pension plan and consequently the carried reserves necessary to pay future beneficiaries, we use certain actuarial techniques and assumptions which are inherently uncertain and involve the exercise of significant judgment, including with respect to interest rates, which
are a key assumption in determining our current obligations under the legacy pension plans as interest rates are used to calculate the present value of such obligations.
Changes in the present value of our obligations under our legacy defined benefit pension plans, due to a reduction in the value of the pension fund assets (depending on the performance of financial markets) or an increase in the pension fund liabilities due to changes in mortality assumptions, the rate of increase of salaries, discount rate assumptions (primarily based on yield levels of high graded securities), inflation, the expected rate of return on plan assets, or other factors, could cause us to have to increase contributions to reduce or satisfy the deficits which would divert resources from use in other areas of our business and reduce our capital resources. While we can control a number of the above factors, there are some over which we have no or limited control. Increases in our pension liabilities and obligations could have a material adverse effect on our business, financial condition and results of operations.
For example, in an effort to stimulate economic growth, during 2012, the Brazilian Central Bank progressively decreased the SELIC rate to a historic low of 7.25% by the end of 2012. The real annual interest rate on government-linked bonds was also decreased from around 6% as of December 31, 2011 to approximately 4% by the end of 2012. In order to control inflation, in April 2013, the Brazilian Central Bank initiated an adjustment process of the SELIC rate, increasing the rate from 7.25% to 10.0% during 2013. The real annual interest rate (after inflation) on government-linked bonds was approximately 6.5% by the end of 2013.
Decreases in interest rates can increase the present value of obligations under our legacy defined benefit pension plans, such as occurred during 2012, and may materially and adversely affect the funded status of our legacy defined benefit plans and require us to make additional contributions to these plans to meet our pension funding obligations.
Exchange rate volatility may have a material adverse effect on the Brazilian economy and on our business.
The Brazilian currency has during the past decades experienced frequent and substantial variations in relation to the U.S. dollar and other foreign currencies. For example, as a result of the 2008 global financial markets crisis, the
real
depreciated 31.9% against the U.S. dollar, reaching R$2.34 per U.S.$1.00 on December 31, 2008. The
real
recovered in the second half of 2009 and continued to appreciate in 2010, reaching R$1.74 per U.S.$1.00 on December 31, 2009 and R$1.67 per U.S.$1.00 on December 31, 2010, mainly due to the recovery of consumer confidence and exports and foreign investments in the second half of 2009. These effects continued through 2010. In 2011, due to the ongoing international financial crisis (particularly in Europe) the exchange rate reached R$1.88 per U.S.$1.00 as of December 31, 2011. Since 2012, the
real
continued to depreciate, reaching R$2.04 per U.S.$1.00 on December 31, 2012 and R$2.34 per U.S.$1.00 on December 31, 2013.
Depreciation of the
real
against the U.S. dollar also could create inflationary pressures in Brazil and cause increases in interest rates, which could negatively affect the growth of the Brazilian economy as a whole and harm our financial condition and results of operations. Additionally, depreciation of the
real
could make our foreign currency-linked obligations and funding more expensive, negatively affect the market price of our securities portfolios and have similar consequences for our borrowers. Conversely, appreciation of the
real
relative to the U.S. dollar and other foreign currencies could lead to a deterioration of the Brazilian foreign exchange currency accounts, as well as dampen export-driven growth. Depending on the circumstances, either depreciation or appreciation of the
real
could materially and adversely affect the growth of the Brazilian economy and our business, financial condition and results of operations.
In the year ended December 31, 2013, a variation of 1
.0%
in the exchange rate of
reais
to U.S. dollars would have resulted in a variation of expenses on our net foreign exchange position denominated in U.S. dollars of R$4.6 million.
Infrastructure and workforce deficiency in Brazil may impact economic growth and have a material adverse effect on our business.
Our performance depends on the overall health and growth of the Brazilian economy. GDP growth slowed since 2011, from 2.7% in 2011, to 1.0% in 2012 and 2.3% in 2013. Continued growth is limited by inadequate infrastructure, including potential energy shortages and deficient transportation, logistics and telecommunication sectors, the lack of a qualified labor force, and the lack of private and public investments in these areas, which limit productivity and efficiency. Any of these factors could lead to labor market volatility, and generally impact the
availability of income, purchasing power and consumption levels, which could limit growth, increase delinquency rates and ultimately have a material adverse effect on our business.
Developments and the perception of risk in other countries may adversely affect the Brazilian economy and market price of Brazilian issuers’ securities.
The market value of securities of Brazilian issuers is affected by economic and market conditions in other countries, including the United States, European countries (including Spain, where Santander Spain, our indirect controlling stockholder, is based), as well as in other Latin American and emerging market countries. Although economic conditions in Europe and the United States may differ significantly from economic conditions in Brazil, investors’ reactions to developments in these other countries may have an adverse effect on the market value of securities of Brazilian issuers. In particular, investor perceptions of the risks associated with our securities may be affected by perception of risk conditions in Spain. Additionally, crises in other emerging market countries may diminish investor interest in securities of Brazilian issuers, including our securities. This could adversely affect the market price of our securities, restrict our access to the capital markets and compromise our ability to finance our operations in the future on favorable terms, or at all.
In addition, we continue to be exposed to disruptions and volatility in the global financial markets because of their effects on the financial and economic environment in the countries in which we operate, particularly Brazil, such as a slowdown in the economy, an increase in the unemployment rate, a decrease in the purchasing power of consumers and the lack of credit availability. We lend primarily to Brazilian borrowers, and these effects could materially and adversely affect our customers and increase our non-performing loans, resulting in increased risk associated with our lending activity and requiring us to make corresponding revisions to our risk management and loan loss reserve models. For example, we experienced an increase in our non-performing loans overdue past 90 days, which reached 6.7% in December 2011 and 7.6% in December 2012, due in part to increasing economic uncertainty globally and a slowdown in the Brazilian economy. However, as of December 31, 2013, this indicator decreased to 6.2% representing improved performance compared to the prior two years.
Continued or worsening disruption or volatility in the global financial markets could further increase negative effects on the financial and economic environment in Brazil and the other countries in which we operate, which could have a material adverse effect on us.
Risks Relating to the Brazilian Financial Services Industry and our Business
The increasingly competitive environment and recent consolidations in the Brazilian financial services market may adversely affect our business prospects.
The Brazilian financial markets, including the banking, insurance and asset management sectors, are highly competitive. We face significant competition in all of our main areas of operation from other Brazilian and international banks, as well as state-owned institutions. In recent years, the competition has increased in the sectors of banking and insurance. Furthermore, the consolidation of the Brazilian financial sector, with the merger of large banks, especially in 2008 and 2009, and the privatization of state-owned banks have also increased competition in the Brazilian market for banking and financial services.
In 2012 and 2013, the Brazilian economy grew less than in prior years, while inflation and currency depreciation increased. The Brazilian government, in an attempt to foster economic growth, stimulated the availability of credit through large state-owned banks, sustaining the pace of the previous years’ growth. Such state-owned banks started to offer credit at significantly lower interest rates. The private-owned banks followed the lead by reducing interest rates for their customers, while tightening customer credit approval policies in an effort to control potential increases in delinquency rates. Due to these measures, margins and spread were reduced, and credit risk increased.
Increasing competition could require that we increase our rates offered on deposits or lower the rates we charge on loans, which could also have a material adverse effect on us.
In addition, if our customer service levels in our retail or wholesale businesses were perceived by the market to be materially below those of our competitor financial institutions, we could lose existing and prospective business opportunities. If we are not successful in retaining and strengthening customer relationships, we may lose market
share, incur losses on some or all of our activities or fail to attract new or retain existing deposits, which would have a material adverse effect on us.
We are subject to substantial regulation which could adversely affect our business and operations.
The Brazilian financial markets are subject to extensive and continuous regulatory control by the Brazilian government, principally by the Brazilian Central Bank, the CVM and CMN, which, in each case, materially affects our business. We have no control over the issuance of new regulations that may affects our operations, including in respect of:
|
|
·
|
minimum capital requirements;
|
|
|
·
|
reserve and compulsory deposit requirements;
|
|
|
·
|
limits on investments in fixed assets;
|
|
|
·
|
lending limits and other credit restrictions, including compulsory allocations;
|
|
|
·
|
limits and other restrictions on fees;
|
|
|
·
|
limits on the amount of interest banks can charge or the period for capitalizing interest;
|
|
|
·
|
accounting and statistical requirements; and
|
|
|
·
|
other requirements or limitations in the context of the global financial crisis.
|
The regulatory structure governing Brazilian financial institutions is continuously evolving, and the Brazilian Central Bank has been known to react actively and extensively to developments in our industry.
Changes in regulations in Brazil and international market may also expose us to increased compliance costs and limitations on our ability to pursue certain business opportunities and provide certain products and services. As some of the banking laws and regulations have been recently issued or become effective, the manner in which those laws and related regulations are applied to the operations of financial institutions is still evolving. Moreover, to the extent these recently adopted regulations are implemented inconsistently in the various jurisdictions in which we operate, we may face higher compliance costs. The measures of the Brazilian Central Bank and the amendment of existing laws and regulations, or the adoption of new laws or regulations could adversely affect our ability to provide loans, make investments or render certain financial services. No assurance can be given generally that laws or regulations will be adopted, enforced or interpreted in a manner that will not have a material adverse effect on our business and results of operations.
We may also be subject to potential impacts relating to regulatory changes affecting our controlling shareholder due to regulatory changes implemented as a result of the unification of the European banking system under a European Banking Union. We cannot predict the final outcome of any proposed regulations from the European Banking Union or their effects on our controlling shareholder and, consequently, their effects on us.
Increases in reserve, compulsory deposit and minimum capital requirements may have a material adverse effect on our business, financial condition and results of operations.
The Brazilian Central Bank has periodically changed the level of reserves and compulsory deposits that financial institutions in Brazil are required to maintain with the Brazilian Central Bank, as well as determine compulsory allocation requirements to finance government programs. The Brazilian Central Bank may increase the reserve and compulsory deposit or allocation requirements in the future or impose new requirements. Increases in reserve and compulsory deposit or allocation requirements reduce our liquidity to fund our loan portfolio and other investments and, as a result, may have a material adverse effect on our business, financial condition and results of operations.
Compulsory deposits and allocations generally do not yield the same return as other investments and deposits because a portion of compulsory deposits and allocations:
|
|
·
|
do not bear interest;
|
|
|
·
|
must be held in Brazilian federal government securities; and
|
|
|
·
|
compulsory allocation which must be used to finance government programs, including a federal housing program and rural sector subsidies.
|
In 2013, the Brazilian Central Bank published several rules to implement Basel III in Brazil. This new set of regulations covers the revised definition of capital, capital requirements, capital buffers, credit valuation adjustments and exposures to central counterparties. For more information on the rules implementing Basel III, see “Item 4. Information on the Company—4B. Business Overview—Regulatory Overview—Capital Adequacy and Leverage—Basel” and “Item 5. Operating and Financial Review and Prospects—5B. Liquidity and Capital Resources—Capital Management.” No assurance can be given that the Basel III will be adopted, enforced or interpreted in a manner that will not have an adverse effect on us.
Changes in taxes and other fiscal assessments may adversely affect us.
The Brazilian government regularly enacts reforms to the tax and other assessment regimes to which we and our customers are subject. Such reforms include changes in the rate of assessments and, occasionally, enactment of temporary taxes, the proceeds of which are earmarked for designated governmental purposes. The effects of these changes and any other changes that result from enactment of additional tax reforms have not been, and cannot be, quantified and there can be no assurance that these reforms will not, once implemented, have an adverse effect upon our business. Furthermore, such changes may produce uncertainty in the financial system, increasing the cost of borrowing and contributing to the increase in our non-performing credit portfolio.
Future changes in tax policy that may affect financial operations include the creation of new taxes. For example, with the 2011 enactment of Provisional Measure 539, the Brazilian government established the Tax on Financial Transactions (“IOF Tax”) at a 1.0% rate per day on the notional value of the increased foreign exchange exposure, though with the publication of Decree 8,027 on June 12, 2013, the tax rate was reduced to zero. Also, in March 2012 the government changed the rules applicable to the tax assessed on the settlement of exchange transactions for the inflow of funds related to foreign loans, setting forth that loans with terms of less than 1,800 days would be subject to taxation at a rate of 6.0%. In June 2012, said rules were changed by the Brazilian government, so that the 1,800 days tenor was reduced to 720 days. In December 2012, the rule was changed again, stating that only foreign loans with tenors of less than 360 days would be subject to a 6.0% tax. Furthermore, the rules applicable to the tax assessed on local loans borrowed by individuals have also been changed in recent years: the tax rate (1.5%) was increased to 3.0% (April 2011) and subsequently decreased to 1.5% (0.5% in December 2011 and 1% in May 2012). While the IOF Tax is a tax on financial transactions used by the Brazilian government to control economic activity and does not directly impact our results of operations, changes in the IOF Tax can impact business volumes generally. It is not possible to quantify the impact of the Tax on business volumes because the influence of this one variable on our clients’ level of borrowing cannot be isolated.
Until 2007, certain financial transactions were subject to the provisional contribution on financial transactions (
Contribuição Provisória sobre a Movimentação ou Transmissão de Valores e de Créditos e Direitos de Natureza Financeira
, or “CPMF”). However, uncertainty remains as to whether the CPMF or a similar tax will be re-introduced in the future. Also, the Brazilian Congress may discuss broad tax reforms in Brazil to improve the efficiency of allocation of the economic resources, as proposed by the executive branch of the Brazilian federal government. Major tax reforms in Brazil have been discussed over the last few years. We cannot predict if tax reforms will be implemented in the future. The effects of these changes, if enacted, and any other changes that could result from the enactment of additional tax reforms, cannot be quantified.
If we are unable to effectively control the level of non-performing or poor credit quality loans in the future, or if our loan loss reserves are insufficient to cover future loan losses, this could have a material adverse effect on us.
Risks arising from changes in credit quality and the recoverability of loans and amounts due from counterparties are inherent in a wide range of our businesses. Non-performing or low credit quality loans have in the past and can continue to negatively impact our results of operations. We cannot assure you that we will be able to effectively control the level of the impaired loans in our total loan portfolio. In particular, the amount of our reported non-performing loans may increase in the future at a faster rate than the growth in our total loan portfolio. In 2013, our loan portfolio increased 7.3% as compared to 8.5% in 2012 and our non-performing credit portfolio decreased 12.7% compared to the increase of 22.8% in 2012, which increased in 2012 in large part due to the slowdown in economic activity in this period. The decrease in the non-performing credit portfolio was mainly
due to the measures adopted by the Bank in 2012, such as revising the limits of new loans and requiring higher level of collateral on new loans and the review of collection practices. These and other actions done in the period brought quality improvement in the credit portfolio, though there can be no assurance that all of these measure will continue to be effective or that our non-performing credit portfolio will not increase again in the future due to factors outside of our control.
Our current loan loss reserves may not be adequate to cover any increase in the amount of non-performing loans or any future deterioration in the overall credit quality of our total loan portfolio. Our loan loss reserves are based on our current assessment of and expectations concerning various factors affecting the quality of our loan portfolio. These factors include, among other things, our borrowers’ financial condition, repayment abilities and repayment intentions, the realizable value of any collateral, the prospects for support from any guarantor, government macroeconomic policies, interest rates and the legal and regulatory environment. As the recent global financial crisis has demonstrated, many of these factors, including the trends described above, are beyond our control. As a result, there is no precise method for predicting loan and credit losses, and we cannot assure you that our loan loss reserves will be sufficient to cover future losses. If our assessment and expectations concerning the factors mentioned above differ from actual developments, if the quality of our total loan portfolio deteriorates, for any reason, we may be required to increase our loan loss reserves, which may adversely affect us. If we were unable to control or reduce the level of our non-performing or poor credit quality loans, this could have a material adverse effect on us.
Our loan portfolio may not continue to grow at the same rate and economic uncertainty may lead to a contraction in our loan portfolio.
There can be no assurance that our loan portfolio will continue to grow at rates similar to the historical growth rate we have experienced. A reversal of the rate of growth of the Brazilian economy, a slowdown in the growth of customer demand, an increase in market competition or changes in governmental regulation and an increase of the SELIC rate, could adversely affect the rate of growth of our loan portfolio and our risk index and, accordingly, increase our required allowances for impairment losses. As a result of the slowdown in economic growth in Brazil in 2013, our loan portfolio increased 7.3% in 2013, as compared to 8.5% in 2012. Ongoing economic uncertainty could materially adversely affect the liquidity, businesses and financial condition of our customers as well as lead to a general decline in consumer spending and a rise in unemployment. All this could in turn lead to decreased demand for borrowings in general, which could have a material adverse effect on our business.
Our loan and investment portfolios are subject to risk of prepayment, which could have a material adverse effect on us.
Our fixed rate loan and investment portfolios are subject to prepayment risk, which results from the ability of a borrower or issuer to pay a debt obligation prior to maturity. Generally, in a declining interest rate environment, prepayment activity increases, this reduces the weighted average lives of our earning assets and could have a material adverse effect on us. We would also be required to amortize net premiums into income over a shorter period of time, thereby reducing the corresponding asset yield and net interest income. Prepayment risk also has a significant adverse impact on credit card and collateralized mortgage loans, since prepayments could shorten the weighted average life of these assets, which may result in a mismatch in our funding obligations and reinvestment at lower yields. Prepayment risk is inherent to our commercial activity and an increase in prepayments could have a material adverse effect on us.
Since our principal sources of funds are short-term deposits, a sudden shortage of funds could cause an increase in costs of funding and an adverse effect on our revenues and our liquidity levels.
Customer deposits are our primary source of funding. As of December 31, 2013, 62.5% of our customer deposits had remaining maturities of one year or less, or were payable on demand while 39.9% of our assets have longer maturities, resulting in a mismatch between the maturities of liabilities and the maturities of assets. The ongoing availability of this type of funding is sensitive to a variety of factors outside our control, such as general economic conditions and the confidence of commercial depositors in the economy, in general, and the financial services industry in particular, and the availability and extent of deposit guarantees, as well as competition between banks for deposits. If a substantial number of our depositors withdraw their demand deposits or do not roll over their time deposits upon maturity, our liquidity position, results of operations and financial condition may be materially and adversely affected. We cannot assure you that in the event of a sudden or unexpected shortage of funds in the banking system, any money markets in which we operate will be able to maintain levels of funding without
incurring higher funding costs or the liquidation of certain assets. If this were to happen, our results of operations and financial condition may be materially adversely affected.
Credit, market and liquidity risks may have an adverse effect on our credit ratings and our cost of funds. Any downgrading in Brazil’s, our controlling stockholder’s, or our credit rating, would likely increase our cost of funding, require us to post additional collateral under some of our derivative contracts and adversely affect our interest margins and results of operations.
Credit ratings affect the cost and other terms upon which we are able to obtain funding. Rating agencies regularly evaluate us and their ratings of our long-term debt are based on a number of factors, including our financial strength, conditions that affect the financial services industry generally and the economic environment in which we operate.
Any downgrade in Brazil’s sovereign credit ratings, those of our controlling stockholder, or in our ratings, would likely increase our borrowing costs. For example, a ratings downgrade could adversely affect our ability to sell or market certain of our products, such as subordinated securities, engage in certain longer-term and derivatives transactions, and retain our customers, particularly customers who need a minimum rating threshold in order to invest. This, in turn, could reduce our liquidity and have an adverse effect on our operating results and financial condition
While certain potential impacts of any ratings downgrade may be quantifiable, the full consequences of a credit rating downgrade are inherently uncertain, as they depend upon numerous dynamic, complex and inter-related factors and assumptions, including market conditions at the time of any downgrade, whether any downgrade of a firm’s long-term credit rating precipitates downgrades to its short-term credit rating, and assumptions about the potential behaviors of various customers, investors and counterparties. Actual outflows could be higher or lower than any hypothetical example, depending upon certain factors including which credit rating agency downgrades our credit rating, any management or restructuring actions that could be taken to reduce cash outflows and the potential liquidity impact from loss of unsecured funding (such as from money market funds) or loss of secured funding capacity.
During 2012, the three major risk rating agencies, Standard & Poor’s Rating Services (“S&P”), Fitch Ratings Ltd. (“Fitch”) and Moody’s Investor Services, Inc. (“Moody’s”) downgraded the sovereign Spain rating due to the fiscal crises in Spain and in several other European countries. As a result, Santander Spain also had its credit rating downgraded by the three major rating agencies: Fitch (on June 11, 2012) from A to BBB+, Moody’s (on June 25, 2012) to Baa2 and S&P (on October 15, 2012) to BBB, which in each case was one notch above Spain’s sovereign rating. In the second half of 2013 and in early 2014, the Spanish economy demonstrated increased economic stability and improved growth prospects, which led to a revision in its credit rating outlook to stable from negative by the three major risk rating agencies mentioned above (S&P on November 29, Fitch on November 1 and Moody’s on December 4). Subsequently, Moody’s upgraded Spain’s sovereign rating to Baa2 from Baa3 with a positive outlook on February 21, 2014. Consequently, Santander Spain’s credit rating was upgraded and currently the credit ratings of Santander Spain are BBB+ by Fitch, BBB by S&P and Baa1 by Moody’s, with a stable outlook in each case.
In 2013, the Brazilian sovereign debt had its outlook revised downward by the three major risk rating agencies: Fitch and Moody’s from positive to stable and S&P from stable to negative. The main reasons for the downgrade were the extended period of decreased growth in the economy, an outlook for annual GDP growth of just over 2% in 2013 and 2014 and an expansionary fiscal policy that could lead to an increase in the Brazilian government’s debt levels. On March 24, 2014, S&P lowered the Brazilian sovereign foreign currency rating to BBB- from BBB, chiefly due to the performance of fiscal accounts. Currently the sovereign Brazilian rating is: BBB- by S&P and Fitch Ratings and Baa2 by Moody’s.
Our long-term debt in foreign currency is currently rated BBB- with a stable outlook by S&P, BBB with stable outlook by Fitch and Baa2 with a stable outlook by Moody’s. We estimate that any downgrade in our credit rating could increase our cost of international funding by around 200 basis points, in which case we expect we would concentrate our funding efforts in the domestic market.
We cannot assure you that the rating agencies will maintain their current ratings or outlooks, or with regard to those rating agencies that have a negative outlook with respect to us or our controlling stockholder, there can be no
assurances that such agencies will revise such outlooks upward. Our failure to maintain favorable ratings and outlooks would likely increase our cost of funding and adversely affect our interest margins and results of operations.
The effectiveness of our credit risk management is affected by the quality and scope of information available in Brazil.
In assessing customers’ creditworthiness, we rely largely on the credit information available from our own internal databases, certain publicly available customer credit information and other sources. Due to limitations in the availability of information and the developing information infrastructure in Brazil, our assessment of credit risk associated with a particular customer may not be based on complete, accurate or reliable information. In addition, we cannot assure that our credit scoring systems collect complete or accurate information reflecting the actual behavior of customers or that their credit risk can be assessed correctly. Without complete, accurate and reliable information, we have to rely on other publicly available resources and our internal resources, which may not be effective. As a result, our ability to effectively manage our credit risk and subsequently our loan loss allowances may be materially adversely affected.
Failure to successfully implement and continue to improve our risk management policies, procedures and methods, including our credit risk management system, could materially and adversely affect us, and we may be exposed to unidentified or unanticipated risks.
The management of risk is an integral part of our activities. We seek to monitor and manage our risk exposure through a variety of separate but complementary financial, credit, market, operational, compliance and legal reporting systems. While we employ a broad and diversified set of risk monitoring and risk mitigation techniques, such techniques and strategies may not be fully effective in mitigating our risk exposure in all economic market environments or against all types of risk, including risks that we fail to identify or anticipate. We use certain qualitative tools and metrics for managing market risk, including our use of value at risk, or “VaR,” and statistical modeling tools, which are based upon observed historical market behavior. We apply statistical and other tools to these observations to arrive at quantifications of our risk exposures. These qualitative tools and metrics may fail to predict future risk exposures. These risk exposures could, for example, arise from factors we did not anticipate or correctly evaluate in our statistical models. This would limit our ability to manage our risks. Our losses thus could be significantly greater than the historical measures indicate. In addition, our quantified modeling does not take all risks into account. Our more qualitative approach to managing those risks could prove insufficient, exposing us to material unanticipated losses. If existing or potential customers believe our risk management is inadequate, they could take their business elsewhere. This could harm our reputation as well as our revenues and profits. We also face risks from operational losses that may occur due to inadequate processes, people and systems failures or even from external events like natural disasters, terrorism, robbery and vandalism. Despite the operational risk management process supported by the Board and the internal audit tests, the internal controls and procedures effectiveness may not be fully adequate or sufficient to avoid all the known and unknown operational risks. We have suffered losses from operational risk in the past, including losses related to the migration of customer accounts in connection with acquisitions, phishing scams perpetuated by third parties, and information system platform upgrades. There can be no assurance that we will not suffer material losses from operational risk in the future, including losses related to cyber-attacks or other such security breaches. Further, as cyber-attacks continue to evolve, we may incur significant costs in the attempt to modify or enhance our protective measures or investigate or remediate any vulnerability.
In addition, as a commercial bank, one of the main types of risks inherent in our business is credit risk. For example, an important feature of our credit risk management system is to employ an internal credit rating system to assess the particular risk profile of a customer. As this process involves detailed analyses of the customer, taking into account both quantitative and qualitative factors, it is subject to human error. In exercising their judgment, our employees may not always be able to assign an accurate credit rating to a customer or credit risk, which may result in our exposure to higher credit risks than indicated by our risk rating system.
We have been trying to refine our credit policies and guidelines to address potential risks associated with particular industries or types of customers. However, we may not be able to timely detect these risks before they occur, or due to limited tools available to us, our employees may not be able to effectively implement them, which may increase our credit risk. Failure to effectively implement, consistently follow or continuously refine our credit risk management system may result in an increase in the level of non-performing loans and a higher risk exposure for us, which could have a material adverse effect on us.
The value of the collateral securing our loans may not be sufficient, and we may be unable to realize the full value of the collateral securing our loan portfolio.
The value of the collateral securing our loan portfolio may fluctuate or decline due to factors beyond our control, including macroeconomic factors globally and in Brazil. We may also not have sufficiently recent information on the value of collateral, which may result in an inaccurate assessment for impairment losses of our loans secured by such collateral. If this were to occur, we may need to make additional provisions to cover actual impairment losses of our loans, which may materially and adversely affect our results of operations and financial condition.
We are subject to market, operational and other related risks associated with our derivative transactions and our investment positions that could have a material adverse effect on us.
We enter into derivative transactions for trading purposes as well as for hedging purposes. We are subject to market, credit and operational risks associated with these transactions, including basis risk (the risk of loss associated with variations in the spread between the asset yield and the funding and/or hedge cost) and credit or default risk (the risk of insolvency or other inability of the counterparty to a particular transaction to perform its obligations thereunder, including providing sufficient collateral). We also hold securities in our own portfolio as part of our investment and hedging strategies.
Financial instruments, including derivative instruments and securities represented 17.2% of our total assets as of December 31, 2013. Any realized or unrealized future gains or losses from these investments or hedging strategies could have a significant impact on our income. These gains and losses, which we account for when we sell or mark-to-market investments in financial instruments can vary considerably from one period to another. If, for example, we enter into derivatives transactions to protect ourselves against decreases in the value of the
real
or in interest rates and the
real
instead increases in value or interest rates increase, we may incur financial losses. We cannot forecast the amount of gains or losses in any future period, and the variations experienced from one period to another do not necessarily provide a meaningful forward-looking reference point. Gains or losses in our investment portfolio may create volatility in net revenue levels, and we may not earn a return on our consolidated investment portfolio, or on a part of the portfolio in the future. Any losses on our securities and derivative financial instruments could materially and adversely affect our operating income and financial condition. In addition, any decrease in the value of these securities and derivatives portfolios may result in a decrease in our capital ratios, which could impair our ability to engage in lending activity at the levels we currently anticipate.
We are subject to counterparty risk in our banking business.
We are exposed to counterparty risks in addition to credit risks associated with lending activities. Counterparty risk may arise from, for example, investing in securities of third parties, entering into derivative contracts under which counterparties have obligations to make payments to us, or executing securities, futures, currency or commodity trades from proprietary trading activities that fail to settle at the required time due to non-delivery by the counterparty or systems failure by clearing agents, exchanges, clearing houses or other financial intermediaries.
We engage in transactions with counterparties in the financial services industry, including brokers and dealers, commercial banks, investment banks, mutual funds, hedge funds and other institutional clients. Defaults by, and even rumors or questions about the solvency of, certain financial institutions and the financial services industry generally have led to market-wide liquidity problems and could lead to losses or defaults by other institutions. Many of the routine transactions we enter into expose us to significant credit risk in the event of default by one of our significant counterparties.
If these risks give rise to losses, this could materially and adversely affect our results of operations and financial condition. We have a diversified loan portfolio, with no specific concentration exceeding 10
.0%
of total loans, however we cannot assure this will continue to be the case. If counterparty risks give rise to losses, this could materially and adversely affect our results of operations and financial condition.
We engage in transactions with related parties that others may not consider to be on an arm’s-length basis.
We are likely to continue to engage in transactions with related parties (including our controlling stockholder) that others may not consider to be on an arm’s length basis. Conflicts of interest between us and related parties may
arise. These conflicts are not required to be and may not be resolved in our favor. See “Item 7. Major Shareholders and Related Party Transactions.”
Our business is highly dependent on proper functioning of information technology systems
Our business is highly dependent on the ability of our information technology systems to accurately process a large number of transactions across numerous and diverse markets and products in a timely manner. The proper functioning of our financial control, risk management, accounting, customer service and other data processing systems is critical to our business and our ability to compete effectively. We have backup data for our key data processing systems that could be used in the event of a catastrophe or a failure of our primary systems, and have established alternative communication networks where available. However, we do not operate all of our redundant systems on a real-time basis and cannot assure you that our business activities would not be materially disrupted if there were a partial or complete failure of any of these primary information technology systems or communication networks. Such failures could be caused by, among other things, major natural catastrophes, software bugs, computer virus attacks or conversion errors due to system upgrading. In addition, any security breach caused by unauthorized access to information or systems, or intentional malfunctions or loss or corruption of data, software, hardware or other computer equipment, could have a material adverse effect on our business, results of operations and financial condition.
Our ability to remain competitive and achieve further growth will depend in part on our ability to upgrade our information technology systems and increase our capacity on a timely and cost effective basis. Any substantial failure to improve or upgrade information technology systems effectively or on a timely basis could materially and adversely affect our competitiveness, results of operations and financial condition.
Failure to protect personal information could adversely affect us.
We manage and hold confidential personal information of customers in the ordinary course of our banking operations. Although we have procedures and controls to safeguard personal information in our possession, unauthorized disclosures or security breaches could subject us to legal actions and administrative sanctions as well as damages that could materially and adversely affect our results of operations and financial condition.
Damage to our reputation could cause harm to our business prospects.
Maintaining a positive reputation is critical to attracting and maintaining customers, investors and employees. Damage to our reputation can therefore cause significant harm to our business and prospects. Harm to our reputation may arise from numerous sources, including, among others, employee misconduct, litigation or regulatory outcomes, failure to deliver minimum standards of service and quality, compliance failures, unethical behavior, and the activities of customers and counterparties. Furthermore, negative publicity regarding us, whether true or not, may result in harm to our business prospects.
Actions by the financial services industry generally or by certain members of, or individuals in, the industry may also affect our reputation. For example, the role played by financial services firms in the financial crisis and the seeming shift toward increasing regulatory supervision and enforcement has caused public perception of us and others in the financial services industry to decline. Any failure to establish or preserve a favorable reputation among our customers and in the market in general could have a material adverse effect on our business, financial condition and results of operations.
We may not be able to detect money laundering and other illegal or improper activities fully or on a timely basis, which could expose us to additional liability and could have a material adverse effect on us.
We are required to comply with applicable anti-money laundering, anti-terrorism and other laws and regulations in the jurisdictions in which we operate. These laws and regulations require us, among other things, to adopt and enforce “know-your-customer” policies and procedures and to report suspicious and large transactions to the applicable regulatory authorities. These laws and regulations have become increasingly complex and detailed, requiring improved systems, demanding sophisticated monitoring and compliance personnel and becoming the subject of enhanced regulatory supervision. In addition, laws such as the U.S. Foreign Corrupt Practices Act and the recently enacted Brazilian Anti-Corruption Law require us, among other things, to institute policies and procedures aimed at preventing any unlawful offer or promise, or give anything of value, to government officials in order to secure a business advantage, and require us to maintain accurate books and records and a system of internal controls to ensure accuracy of our books and records and prevent illegal activity.
While we have adopted policies and procedures aimed at detecting and preventing the use of our banking network for money laundering and related activities, as well as policies and procedures aimed at preventing
bribery and other corrupt practices by our employees and agents, such policies and procedures have in some cases only been recently adopted and may not completely eliminate instances where our banking network may be used by other parties to engage in money laundering and other illegal or improper activities, or may not prevent our employees and agents from engaging in corrupt dealings. To the extent we fail to fully comply with applicable laws and regulations, the relevant government agencies to which we report have the power and authority to impose fines and other penalties on us, including the revocation of licenses. In addition, our business and reputation could suffer if customers use our banking network for money laundering or illegal or improper purposes.
In addition, while we review our significant counterparties’ internal policies and procedures with respect to such matters, we, to a large degree, rely upon these counterparties to maintain and properly apply their own appropriate anti-money laundering and anticorruption procedures. Such measures, procedures and compliance may not be completely effective in preventing third parties from using our (and our relevant counterparties’) services as a conduit for money laundering (including illegal cash operations) or other corrupt practices without our (and our relevant counterparties’) knowledge. If we are associated with, or even accused of being associated with, or become a party to, money laundering or other corrupt practices, then our reputation could suffer and/or we could become subject to fines, sanctions and/or legal enforcement (including being added to any “black lists” that would prohibit certain parties from engaging in transactions with us), any one of which could have a material adverse effect on our operating results, financial condition and prospects.
We plan to continue to expand our operations and we may not be able to manage such growth effectively, which could have an adverse impact on our profitability.
We allocate management and planning resources to develop strategic plans for organic growth and to identify possible acquisitions, disposals and areas for restructuring our businesses. We cannot provide assurance that we will, in all cases, be able to manage our growth effectively or achieve our strategic growth objectives. Challenges that may result from the strategic growth decisions include our ability to:
|
|
·
|
efficiently manage the operations and employees of expanding businesses;
|
|
|
·
|
maintain or grow our existing customer base;
|
|
|
·
|
assess the value, strengths and weaknesses of investment or acquisition candidates;
|
|
|
·
|
fully integrate strategic investments, or newly-established entities or acquisitions in line with our strategy;
|
|
|
·
|
align our current information technology systems adequately with those of a larger group;
|
|
|
·
|
apply our risk management policy effectively to a larger group; and
|
|
|
·
|
manage a growing number of entities without over-committing management or losing key personnel.
|
Any failure to manage growth effectively, including relating to any or all of the above challenges associated with our growth plans, could have a material adverse effect on our operating results, financial condition and business prospects.
Risks Relating to Our Controlling Shareholder, Our Units and American Depositary Shares (ADSs)
Our ultimate controlling shareholder has a great deal of influence over our business.
Santander Spain, our ultimate controlling shareholder, currently owns, directly and indirectly, approximately 74.9% of our total capital. Due to its share ownership, our controlling shareholder has the power to control us and our subsidiaries, including the power to:
|
|
·
|
elect a majority of our directors that appoint our executive officers, set our management policies and exercise overall control over our company and subsidiaries;
|
|
|
·
|
influence the appointment of our principal officers;
|
|
|
·
|
declare the payment of any dividends;
|
|
|
·
|
agree to sell or otherwise transfer its controlling stake in our company; and
|
|
|
·
|
determine the outcome of substantially all actions requiring shareholder approval, including transactions with related parties, corporate reorganizations, acquisitions and dispositions of assets, and dividends.
|
In December 2012, primarily in response to the requirements of the European Banking Authority, Santander Spain adopted a corporate governance framework (
Marco de Gobierno Interno del Group Santander
). The purpose of the framework is to organize and standardize the corporate governance practices of certain companies of Santander Group (including us). We adopted this corporate governance framework in May 2013, subject to the precedence of applicable Brazilian laws and regulations and the limitations imposed thereby such as banking secrecy laws, as well as our corporate governance practices, including our policies for related-party transactions and for disclosure of material acts and fact
s
. See “Item 16G. Corporate Governance.” We operate as a stand-alone subsidiary within the Santander Group. Our controlling shareholder has no liability for our banking operations, except for the amount of its holdings of our capital stock and for other specific limited circumstances. The interests of Santander Spain may differ from the interests of our other shareholders, and the concentration of control in Santander Spain will limit other stockholders’ ability to influence corporate matters. As a result, we may take actions that our other shareholders do not view as beneficial.
Our status as a controlled company and a foreign private issuer exempts us from certain of the corporate governance standards of the New York Stock Exchange (“NYSE”), limiting the protections afforded to investors.
We are a “controlled company” and a “foreign private issuer” within the meaning of the NYSE corporate governance standards. Under the NYSE rules, a controlled company is exempt from certain NYSE corporate governance requirements. In addition, a foreign private issuer may elect to comply with the practice of its home country and not to comply with certain NYSE corporate governance requirements, including the requirements that (1) a majority of the board of directors consists of independent directors, (2) a nominating and corporate governance committee be established that is composed entirely of independent directors and has a written charter addressing the committee’s purpose and responsibilities, (3) a compensation committee be established that is composed entirely of independent directors and has a written charter addressing the committee’s purpose and responsibilities and (4) an annual performance evaluation of the nominating and corporate governance and compensation committees be undertaken. Although we have similar practices, they do not entirely conform to the NYSE requirements, therefore we currently use these exemptions and intend to continue using them. Accordingly, you will not have the same protections afforded to shareholders of companies that are subject to all NYSE corporate governance requirements.
Cancellation of units may have a material and adverse effect on the market for the units and on the value of the units.
Holders of units may present these units or some of these units for cancellation in Brazil in exchange for the common shares and preferred shares underlying these units. If unit holders present a significant number of units for cancellation in exchange for the underlying common shares and preferred shares, the liquidity and price of the units may be materially and adversely affected.
The relative volatility and limited liquidity of the Brazilian securities markets may negatively affect the liquidity and market prices of the units and the ADSs.
The BM&FBOVESPA is significantly less liquid than the NYSE or other major exchanges in the world. As of December 31, 2013, the aggregate market capitalization of the BM&FBOVESPA was equivalent to approximately R$2.4 trillion (U.S.$1.0 trillion) and the top ten stocks in terms of trading volume accounted for approximately 51.2% of all shares traded on BM&FBOVESPA in the year ended December 31, 2013. In contrast, as of December 31, 2013, the aggregate market capitalization of the NYSE was approximately U.S.$25.0 trillion. Although any of the outstanding shares of a listed company may trade on the BM&FBOVESPA, in most cases fewer than half of the listed shares are actually available for trading by the public, the remainder being held by small groups of controlling persons, government entities or a principal shareholder. The relative volatility and limited liquidity of the Brazilian securities markets may substantially limit your ability to sell the units or ADSs at the time and price you desire and, as a result, could negatively impact the market price of these securities.
The economic value of your investment may be diluted.
We may, from time to time, need additional funds and, in the event that public or private financing is unavailable or if our shareholders decide, we may issue additional units or shares. Any additional funds obtained by such a capital increase may dilute your interest in our company.
Actual or anticipated sales of a substantial number of units or our common shares or preferred shares in the future could decrease the market prices of the ADSs.
Sales of a substantial number of our units or our common shares or preferred shares in the future, or the anticipation of such sales, could negatively affect the market prices of our units and ADSs. If, in the future, substantial sales of units or common shares or preferred shares are made by existing or future holders, the market prices of the ADSs may decrease significantly. As a result, holders of ADSs may not be able to sell their ADSs at or above the price they paid for them.
Delisting of our shares from Level 2 of BM&FBOVESPA may negatively affect the price of our ADSs and units.
Companies listed on Level 2 of BM&FBOVESPA are required to have a public float of at least 25
.0%
of their total capital. In connection with our listing on the BM&FBOVESPA, prior to October 7, 2012 (extendable under certain circumstances to October 7, 2014) we were required to have a public float representing at least 25
.0%
of our total capital. On October 8, 2013, the BM&FBOVESPA granted the last extension period for our compliance with this requirement to October 7, 2014. As of December 31, 2013, our outstanding public float was 24.6% of our total capital. If we do not meet the minimum public float requirement, we may be subject to fines and eventually be delisted from Level 2 of BM&FBOVESPA and be traded at the regular level of BM&FBOVESPA. Level 2 regulations are also subject to change, and we may not be able to comply with such changes. Although such delisting could result in the obligation of the controlling shareholder to carry out a mandatory tender offer for the shares of the minority shareholders, such delisting may result in a decrease of the price of our shares, units and ADSs.
Holders of our units and our ADSs may not receive any dividends or interest on stockholders’ equity.
According to our by-laws, we must generally pay our shareholders at least 25
.0%
of our annual net income as dividends or interest on stockholders’ equity, as calculated and adjusted under Brazilian Corporate Law (“adjusted net income”), which may differ significantly from our net income as determined under IFRS. This adjusted net income may be used to increase capital, used to absorb losses or otherwise retained as allowed under Brazilian Corporate Law and may not be available to be paid as dividends or interest on stockholders’ equity. Additionally, Brazilian Corporate Law allows a publicly traded company like ours, to suspend the mandatory distribution of dividends and interest on stockholders’ equity in any particular year if our board of directors informs our shareholders that such distributions would be inadvisable in view of our financial condition or cash availability. We paid R$3.2 billion, R$2.7 billion and R$2.4 billion (R$0.84, R$0.71 and R$0.63 per unit) as dividends and interest on stockholders’ equity (considering gross value) in 2011, 2012 and 2013, respectively, in accordance with our dividend policy. See “Item 8. Financial Information—A. Consolidated Statements and Other Financial Information—Payment of Dividends and Interest Attributable to Stockholders’ Equity—Dividends.”
Holders of ADSs may find it difficult to exercise voting rights at our stockholders’ meetings.
Holders of ADSs will not be our direct shareholders and will be unable to enforce directly the rights of shareholders under our by-laws and Brazilian Corporate Law. Holders of ADSs may exercise voting rights with respect to the units represented by ADSs only in accordance with the deposit agreement governing the ADSs. Holders of ADSs will face practical limitations in exercising their voting rights because of the additional steps involved in our communications with ADS holders. For example, we are required to publish a notice of our stockholders’ meetings in specified newspapers in Brazil. Holders of our units will be able to exercise their voting rights by attending a stockholders’ meeting in person or voting by proxy. By contrast, holders of ADSs will receive notice of a stockholders’ meeting by mail from the American Depositary Receipts (“ADRs”) depositary following our notice to the depositary requesting the depository to do so. To exercise their voting rights, holders of ADSs must instruct the ADR depositary on a timely basis on how they wish to vote. This voting process necessarily will take longer for holders of ADSs than for holders of our units or shares. If the ADR depositary fails to receive timely voting instructions for all or part of the ADSs, the depositary will assume that the holders of those ADSs are
instructing it to give a discretionary proxy to a person designated by us to vote their ADSs, except in limited circumstances.
Holders of ADSs also may not receive the voting materials in time to instruct the depositary to vote the units underlying their ADSs. In addition, the depositary and its agents are not responsible for failing to carry out voting instructions of the holders of ADSs or for the manner of carrying out those voting instructions. Accordingly, holders of ADSs may not be able to exercise voting rights, and they will have little, if any, recourse if the units underlying their ADSs are not voted as requested.
Holders of ADSs could be subject to Brazilian income tax on capital gains from sales of ADSs.
Law 10,833 of December 29, 2003 provides that the disposal of assets located in Brazil by a non-resident to either a Brazilian resident or a non-resident is subject to taxation in Brazil, regardless of whether the disposal occurs outside or within Brazil. This provision results in the imposition of income tax on the gains arising from a disposal of our units by a non-resident of Brazil to another non-resident of Brazil. It is unclear whether ADSs representing our units, which are issued by the ADR depositary outside Brazil, will be deemed to be “property located in Brazil” for purposes of this law. We believe ADSs do not qualify as property located in Brazil and, thus, should not be subject to Brazilian income tax. Nevertheless, there is no judicial guidance as to the application of Law 10,833 of December 29, 2003 and, accordingly, we are unable to predict whether Brazilian courts may decide that it applies to dispositions of our ADSs between non-residents of Brazil. However, in the event that the disposition of assets is interpreted to include a disposition of our ADSs, this tax law would accordingly impose withholding taxes on the disposition of our ADSs by a non-resident of Brazil to another non-resident of Brazil. See “Item 10. Additional Information—E. Taxation—Brazilian Tax Considerations.”
Any gain or loss recognized by a U.S. taxpayer will generally be treated as U.S. source gain or loss. A U.S. taxpayer would not be able to credit any Brazilian tax imposed on the disposition of our units or ADSs against such person’s U.S. federal income tax liability, unless such credit can be applied (subject to applicable limitations) against tax due on other income of such person from foreign sources.
Judgments of Brazilian courts with respect to our units or ADSs will be payable only in reais.
Our by-laws provide that we, our shareholders, our directors and officers and the members of our fiscal council shall submit to arbitration any and all disputes or controversies that may arise amongst ourselves relating to, or originating from, the application, validity, effectiveness, interpretation, violations and effects of violations of the provisions of Brazilian Corporate Law, our by-laws, the rules and regulations of the CMN, the Brazilian Central Bank and the CVM, as well as other rules and regulations applicable to the Brazilian capital markets in addition to the listing regulations of the Level 2 segment of the BM&FBOVESPA, our listing agreement for adhesion to the Level 2 segment of the BM&FBOVESPA, and the rules and regulations of the Arbitration Regulation of the Market Arbitration Chamber. However, in specific situations, including whenever precautionary motions are needed for protection of rights, the dispute or controversy may have to be brought to a Brazilian court. If proceedings are brought in the courts of Brazil seeking to enforce our obligations in respect of the units or ADSs, we will not be required to discharge our obligations in a currency other than
reais
. Under Brazilian exchange control limitations and according to Brazilian laws, an obligation in Brazil to pay amounts denominated in a currency other than
reais
may be satisfied in Brazilian currency only at the exchange rate, as determined by the Brazilian Central Bank or competent court, in effect on the date the judgment is obtained, and such amounts are then adjusted to reflect exchange rate variations through the effective payment date. The then prevailing exchange rate may not afford non-Brazilian investors with full compensation for any claim arising out of or related to our obligations under the units or ADSs.
Holders of ADSs may be unable to exercise preemptive rights with respect to our units underlying the ADSs.
Holders of ADSs will be unable to exercise the preemptive rights relating to our units underlying ADSs unless a registration statement under the Securities Act is effective with respect to those rights or an exemption from the registration requirements of the Securities Act is available. We are not obligated to file a registration statement with respect to the shares relating to these preemptive rights or to take any other action to make preemptive rights available to holders of units or ADSs. We may decide, at our discretion, not to file any such registration statement. If we do not file a registration statement or if we and the ADR depository decide not to make preemptive rights
available to holders of units or ADSs, those holders may receive only the net proceeds from the sale of their preemptive rights by the depositary, or if they are not sold, their preemptive rights will be allowed to lapse.
As a holder of ADSs you will have different stockholders’ rights than in the United States and certain other jurisdictions.
Our corporate affairs are governed by our by-laws and Brazilian Corporate Law, which may differ from the legal principles that would apply if we were incorporated in a jurisdiction in the United States or in certain other jurisdictions outside Brazil.
Holders of our common shares are allowed to vote in our stockholders’ meetings, and each common share shall entitle its owner to one vote. Our preferred shares only allow voting rights in respect of a few matters. See “Item 10. Additional Information—B. Bylaws.”
Holders of ADSs are not our direct shareholders and will be unable to enforce directly the rights of shareholders under our bylaws and Brazilian Corporate Law. Holders of ADSs may exercise voting rights with respect to the units represented by ADSs only in accordance with the deposit agreement governing the ADSs. See “Holders of ADSs may find it difficult to exercise voting rights at our stockholders’ meetings.”
Thus, under Brazilian Corporate Law, holders of the ADSs and the holders of just the preferred shares may have fewer and less well-defined rights to protect their interests relative to actions taken by our board of directors or the holders of our common shares than under the laws of other jurisdictions outside Brazil.
Although Brazilian Corporate Law imposes restrictions on insider trading and price manipulation, the form of these regulations and the manner of their enforcement may differ from that in the U.S. securities markets or markets in certain other jurisdictions. In addition, in Brazil, self-dealing and the preservation of shareholder interests may be regulated differently, which could potentially disadvantage you as a holder of the preferred shares underlying ADSs.
|
History and Development of the Company
|
General
We are a publicly held company of indefinite term, incorporated under Brazilian law on August 9, 1985. Our corporate name is Banco Santander (Brasil) S.A. and our commercial name is Banco Santander. Our headquarters are located in Brazil, in the city of São Paulo, state of São Paulo, at Avenida Presidente Juscelino Kubitschek, 2,041 and 2,235, Bloco A, Vila Olímpia, 04543-011. Our telephone number is 55-11-3553-3300. Documentation of our incorporation is duly registered with the Junta Comercial do Estado de São Paulo (Commercial Registry of the State of São Paulo), or JUCESP, under NIRE (Registry Number) 35300332067.
Our agent for service is James H. Bathon, Managing Director - Legal and Compliance, Banco Santander, S.A., New York Branch, 45 E. 53rd Street New York, New York 10022.
History
The Santander Group has expanded globally through a number of acquisitions and the integration of the acquired businesses to achieve synergies.
In 1957, the Santander Group first entered the Brazilian market through an operating agreement with Banco Intercontinental do Brasil S.A. Since the 1990s, the Santander Group has sought to establish its presence in Latin America, particularly in Brazil. The Santander Group pursued this strategy through organic growth as well as acquisitions. In 1997, the Santander Group acquired Banco Geral do Comércio S.A., which subsequently changed its name to Banco Santander Brasil S.A. In the following year, the Santander Group acquired Banco Noroeste S.A. In 1999, Banco Noroeste was merged into Banco Santander Brasil. In January 2000, the Santander Group acquired Banco Meridional S.A. (including its subsidiary Banco Bozano, Simonsen S.A.).
In November 2000, the Santander Group acquired Banespa, a bank owned by the State of São Paulo, and became one of Brazil’s largest financial groups. In 2006, Santander Brasil consolidated its investments into one
entity, Banco Santander Banespa S.A., which was later renamed Banco Santander (Brasil) S.A. In 2007, the Santander Group implemented a brand unification program to consolidate our operations in Brazil at such time under the Santander brand.
On November 1, 2007, RFS Holdings B.V., a consortium comprising Santander Spain, The Royal Bank of Scotland Group PLC, Fortis SA/NV and Fortis N.V. (“Fortis”), acquired 96.95% of the shares of ABN AMRO Holding N.V. (and together with ABN AMRO Bank N.V. “ABN AMRO”), the controlling shareholder of Banco Real. In the first quarter of 2008, Fortis and Santander Spain reached an agreement whereby Santander Spain acquired the right to the Brazilian asset management activities of ABN AMRO, which Fortis had acquired as part of the consortium’s purchase of ABN AMRO. On July 24, 2008, Santander Spain took indirect share control of Banco Real, which it then absorbed into the Santander Group to consolidate its investments in Brazil. On August 29, 2008, the acquisition by Santander Brasil of Banco Real’s share capital was approved through a share exchange transaction (
incorporação de ações
), and Banco Real became a wholly-owned subsidiary of Santander Brasil. On April 30, 2009, Banco Real was merged into Santander Brasil and Banco Real ceased to exist as a separate legal entity.
Important Events
Offer by Santander Spain to Acquire Our Shares not held by the Santander Group
On April 29, 2014, Santander Spain, our indirect controlling shareholder, announced its intention to launch a voluntary offer in Brazil and the United States for acquisition of up to the totality of our shares that are not held by the Santander Group, which represent approximately 25% of our share capital, with payment in shares of Santander Spain.
Our shareholders that accept the offer will receive in payment Brazilian or American Depositary Receipts (BDRs or ADRs) representing shares issued by Santander Spain, thus becoming shareholders of Santander Spain, at the rate of 0.70 newly-issued shares of Santander Spain for each of our units or ADRs. As a result of this transaction, we will continue to be a listed company, although we will move from the Level 2 (
Nível 2
) of Corporate Governance of the BM&FBOVESPA to the traditional segment of the BM&FBOVESPA.
This offer is subject to customary conditions for this type of transaction, including the granting of the relevant regulatory authorizations and approval at our general shareholders’ meeting.
Sale of the Investment Fund Management and Managed Portfolio Operations
On December 17, 2013, we concluded the sale of our asset management business, by way of disposal of all shares of Santander Brasil Asset Management Distribuidora de Títulos e Valores Mobiliários S.A. (“DTVM”), a company controlled by us. The asset management activities then performed by DTVM were segregated into a new asset manager created for that purpose. The sales price was R$2,243 million, generating a post-tax capital gain of R$1,205 million.
We will remain as the administrator of the funds and in charge of distribution activities, receiving remuneration in line with market practices. As the administrator of the funds, we will continue to take care of the administration of the fund, performing the services related directly or indirectly to the functioning and maintenance of the fund. Additionally, we will also continue to engage in sales and distribution activities. We will not manage the funds invested or make investment decisions with respect thereto, which will be performed by the new asset manager.
The transaction is part of a worldwide partnership between Santander Spain and two of the world’s leading private equity companies, Warburg Pincus and General Atlantic.
Net profit derived from our asset management business amounted to R$74 million in 2011, R$55 million in 2012, and approximately R$55 million in 2013 through the date of sale.
Agreement for sale of 30% of the capital stock of Webmotors S.A. to Carsales
On June 21, 2013, we entered into an agreement to issue shares representing 30% of the capital stock of our indirect subsidiary, Webmotors S.A. (an online car trading portal), to Carsales.com Limited (“Carsales”) for R$180 million.
Carsales is a leading Australian company in the online vehicle classifieds market, with more than 60% of the market share in Australia, and with operations throughout Asia and Oceania, including in China, New Zealand, Thailand, Malaysia, Singapore, Indonesia and Dubai. The partnership with Carsales is intended to accelerate the growth of Webmotors and consolidate its leadership position in Brazil’s online vehicle classifieds market, through transfers of technology and know-how, together with greater independence and operational focus.
Agreement for the Acquisition of GetNet Tecnologia em Captura e Processamento de Transações Eletrônicas Hua S.A. (GetNet) Operations by Santander Brasil
On April 7, 2014, we announced to the market, by means of a material fact, that we and our controlled company Santander Getnet Serviços para Meios de Pagamento Sociedade Anônima (“SGS”) have executed, on April 4, 2014, a Share Purchase Agreement, which purpose was the acquisition, by SGS, of 100% of the voting and total corporate capital of GetNet Tecnologia em Captura e Processamento de Transações Eletrônicas H.U.A.H. S.A. (“GetNet”).
The purchase price of 100% of the shares issued by Getnet is R$1,104,000,000.00, of which: (i) R$1,020,000,000.00 will be paid to the sellers on the closing date, adjusted by the SELIC rate from 01/31/2014 until the date of the payment and (ii) R$84,000,000.00 will be paid in 5 equal annual installments as of the closing date.
The closing date and the implementation of the acquisition is subject to verification of certain precedent conditions usual for similar transactions, including the prior approval of the Brazilian Central Bank and the Administrative Economic Defense Council, and will be completed at the date of the closing date of the transaction, through the corporate rearrangement referred to in the material fact of April 7, 2014. Upon closing of the transaction, Santander Brasil will hold 88.5% of the total corporate capital of SGS and our partners will be entitled to 11.5% of such company.
The transaction will reinforce the strategy and the potential growth of our acquiring business, enabling (a) greater flexibility in managing the business, especially in terms of the necessary investments and the definitions regarding the commercial strategy to be adopted, (b) gains related to scale´s improvement, reduction of costs per transaction and additional synergies expected from the integration of operational and commercial structures.
Additionally, with the consolidation of the vertical business derived from GetNet, it will be possible for us to have a new, more complete commercial approach towards the business and enhance the differentiation of our services, assisting our customer loyalty and customer retention.
Plan to Optimize Our Capital Structure
To achieve a more efficient capital structure consistent with the new Basel III capital rules and our business strategy and asset growth plan, we developed in 2013 an equity optimization plan. In accordance with this plan, our shareholders approved on November 1, 2013, a capital decrease of Santander Brasil of R$6.0 billion, from R$62,828 million to R$56,828 million, without diluting the percentage of ownership held by our shareholders. Our shareholders also approved the amendment of our bylaws to confer upon our Board of Directors the authority to issue securities within the limits of the authorized capital. On January 7, 2014, all conditions for the equity distribution were concluded, including the expiration of the 60-day period for objections of any unsecured creditors, which expired on January 3, 2014. Payment of the distribution occurred on January 29, 2014. On January 29, 2014, we issued U.S. dollar denominated notes in an amount equivalent to R$6 billion. Santander Spain agreed to use its entire cash distribution to subscribe to the notes and agreed to subscribe to any notes from the total issuance that were not subscribed by our other shareholders.
The notes will be part of our Tier 1 and Tier 2 regulatory capital as approved by the Brazilian Central Bank on April 15, 2014. The Tier 1 notes were issued for an amount equivalent to R$3,000 million, bearing interest at 7.375% per annum and are perpetual. The Tier 2 notes were issued for an amount equivalent to R$3,000 million, bearing interest at 6.0% per annum and will mature on January 29, 2024. The notes shall be converted into our common shares and preferred shares upon the occurrence of certain conversion events. The notes constitute an unsecured and subordinated obligation. In accordance with applicable law, the rights and claims of holders of the (a) Tier 1 notes will rank prior to all holders of common equity Tier 1 capital and (b) Tier 2 notes will rank prior to all holders of common equity Tier 1 capital and additional Tier 1 capital.
Also in the context of the equity optimization plan, and with the purposes of eliminating the trades in
centavos
of our common and preferred shares, increasing liquidity and reducing costs of transaction thereof, on March 18, 2014, our shareholders approved (i) a stock dividend of 19,002,100,957 preferred shares to our shareholders, at the ratio of 0.047619048 preferred shares for each common share or preferred share, which results in five preferred shares for each Unit, through the capitalization of reserves in the amount of R$171,798,385.79; and (ii) a reverse share split of the totality of our common shares and preferred shares in a ratio of 1:55, so that each fifty-five (55) common shares and fifty-five preferred shares will correspond to one common share and one preferred share, and as a result, each Unit will be comprised of one common share and one preferred share. After such stock dividend and reverse share split, our corporate capital, in the total amount of R$57 million, will be divided into 7,600,840,325 shares, of which 3,869,849,668 will be common shares and 3,730,990,657 will be preferred shares, all of them with no par value. The stock dividend and reverse share split was approved by the Brazilian Central Bank on April 22, 2014 and its effective implementation will occur on June 2, 2014.
Extension of Period for Us to Reach the Minimum Percentage of Outstanding Shares (Free Float) of 25%
On October 8, 2013, BM&FBOVESPA granted our and our majority stockholders’ request to (i) extend the period for reaching the minimum free float until October 7, 2014; and (ii) reduce the current free float of 24.6% to 22.5%, exclusively in the context of: (a) the Buyback Program of depositary share certificates ( our units) or ADRs; and (b) the acquisition abroad, by Santander Spain, or any other member of Santander Group, of our ADRs. This authorization does not affect our obligation to achieve a free float of 25% by October 7, 2014, as set forth in the Agreement for the Adoption of Corporate Governance Level 2 Practices.
Implementation of the Program for Reinvestment of Dividends (“PRD”)
On November 1, 2013 we informed our shareholders about the implementation of the PRD. The PRD is intended to offer our shareholders an alternative for systematic and organized reinvestment of their dividends and/or interest on capital in our shares. The PRD focuses on individuals that are shareholders holding book entry-shares and our account holders.
Exercise of the Exchange Rights by Qatar Holding Luxembourg II S.À R.L.
On October 29, 2013, our shareholder Qatar Holding Luxembourg II S.À R.L. (“QHL”), exercised its exchange rights related to mandatorily exchangeable bonds in the total amount of U.S.$2,719 million, acquired pursuant to a purchase agreement, dated October 28, 2010, entered into between Santander Spain, as issuer, and QHL, as purchaser.
On November 7, 2013, Qatar Holding received from Santander Spain 190,030,195 ADSs issued by us, therefore increasing its interest in us to 196,461,770 of our ADS, which represents 5.08% of our common shares and 5.28% of our preferred shares at that time. For further information, see note 24 of our audited consolidated financial statements.
Capital Expenditures and Divestitures
Our principal capital expenditures are comprised of investments in information technology. Our information technology (“IT”) platform focuses on our customers and supports our business model. In 2013, 2012 and 2011, total investments in information technology were R$1.014 million, R$958 million and R$848 million, respectively.
In 2012 and 2013, we continually improved our technology platform by means of investments in systems and hardware renewal. During these years, our main project was the construction of a new data center with the most advanced requirements in terms of data centers.
Technology management by specialized companies within the Santander Group enables us to achieve a global scale and other benefits similar to outsourcing, without the loss-of-control that is often seen when outsourcing core activities. For further discussion regarding our technology infrastructure see “—B. Business Overview—Technology and Infrastructure” below.
Our major divestitures in the past three fiscal years and until the date of this information were the sale, in December 2013, of our asset management business to a holding company owned by
Santander Spain and the private equity funds Warburg Pincus and
General
Atlantic for
R$2,243 million See “—4A. Important Events - Sale of the Investment Fund Management and Managed Portfolio Operations” and the sale, in 2012 and 2013, of real estate assets, mainly branches, to Santander Real Estate Mutual Fund (Santander Agências Fundo de Investimento Imobiliário), that generated gains of R$335 million and R$88 million, respectively.
|
4B
.
|
Business Overview
|
Our Competitive Strengths
We believe that our main competitive advantages are: (i) being part of the Santander Group; (ii) maintaining a conservative risk profile; (iii) maintaining a strong capital base (iv) maintaining a modern technology platform; and (v) focusing on sustainable growth with a strong presence in attractive demographic and geographic areas.
Relationship with the Santander Group
We believe that being part of the Santander Group offers us a significant competitive advantage over our competitors. Under the Santander Group business model, each unit has to be self-sufficient in terms of capital and liquidity. However, our relationship allows us to:
|
|
·
|
access the Santander Group’s global information systems platform, which reduces our technology development costs, provides operational synergies with the Santander Group and enhances our ability to provide international products and services to our customers;
|
|
|
·
|
access the Santander Group’s multinational client base;
|
|
|
·
|
take advantage of the Santander Group’s global presence, in particular in other countries in Latin America, to offer international solutions for our Brazilian corporate customers’ financial needs as they expand their operations globally;
|
|
|
·
|
selectively replicate or adapt the Santander Group’s successful product offerings from other countries in Brazil;
|
|
|
·
|
benefit from the Santander Group’s operational expertise in areas such as internal controls and risk management, which has been developed in response to a wide range of market conditions across the world and which we believe will enhance our ability to expand our business within desired risk limits;
|
|
|
·
|
leverage the Santander Group’s experience with integrations to maximize and accelerate the generation of synergies from any future acquisitions; and
|
|
|
·
|
benefit from the Santander Group’s management training and development which is composed of a combination of in-house training and development with access to managerial expertise in other Santander Group units outside Brazil.
|
Conservative Risk Profile
High quality risk management is one of the Santander Group hallmarks and thus one of our priorities. Throughout its 150 years, the Santander Group has combined prudence in risk management with use of advanced techniques, always aiming to generate recurrent and balanced earnings and to create shareholder value. Our risk management model is a key factor for achieving our strategic objectives.
Our risk management principles are: (i) independence and risk assessment; (ii) business support to maintain risk quality; (iii) decision-making based on committee involvement; and (iv) use of modern tools and systems to analyze risk. Our risk management policy seeks to maintain a medium-low and predictable profile for all our risks.
To manage our risks, we have incorporated the Santander Group’s global program of risk management in various levels of our organization. The whole Bank is involved in risk management, from our branch employees to our Risk Management Committee members.
Strong Capital Base
Due to our strong capital base, among other factors, we were considered in May 2013 to be the most solid bank both in Latin America and Brazil by Bloomberg Markets Magazine. As of December 31, 2013, our Basel capital adequacy ratio was 19.2%. To achieve a more efficient capital structure consistent with the new Basel III capital rules and our business strategy and asset growth plan, we developed an equity optimization plan in 2013. In accordance with this plan, our shareholders approved, on November 1, 2013, a capital decrease of Santander Brasil of R$6 billion, without diluting the percentage of ownership held by our shareholders of record on January 14, 2014. Payment of the distribution occurred on January 29, 2014.
On January 29, 2014, we issued U.S. dollar denominated notes in an amount equivalent to R$6 billion. Santander Spain agreed to use its entire cash distribution to subscribe to the notes and agreed to subscribe to any notes from the total issuance that were not subscribed by our other shareholders.
The notes will be part of our Tier 1 and Tier 2 regulatory capital, as approved by the Brazilian Central Bank on April 15, 2014. The Tier 1 notes were issued for an amount equivalent to R$3 billion, bearing interest at 7.375% per annum and are perpetual. The Tier 2 notes were issued for an amount equivalent to R$3 billion, bearing interest at 6.0% per annum and will mature on January 29, 2024. For further information on our equity optimization plan, see “Item 4.—Information on the Company—A. History and Development of the Company—Important Events—Plan to Optimize Our Capital Structure.”
For further information on our capital adequacy requirements, see “Item 4.—Information on the Company—Regulation and Supervision—Capital Adequacy and Leverage—Basel.”
Modern Technology Platform
We operate a modern global technology platform that is interconnected with the platform of the Santander Group, which allows us to serve our customers on a global scale, under a platform that is uniquely customer-centered. Our technological platform is structured to allow us to provide core banking services and our standardized systems allow us to serve our customers quickly and efficiently.
Also, in 2013, we concluded the construction of our new data center, located in Campinas, which we believe to be the largest technology center in Latin America (with 800,000 square-meters). This data center has the maximum classification level in capacity and availability (Tier IV, with 99.99% availability) according to the UpTime Institute, a consortium of companies that engage in consulting for the enterprise data center industry. Our objectives in terms of technology are to: (i) maintain our systems with a high security level, (ii) optimize our systems technology activities and (iii) operate efficiently through improved use of energy and natural resources.
In 2013, we also initiated a partnership with iZettle, a Swedish mobile payments company, to offer credit and debit card readers that allow individuals and small businesses to accept card payments on their smartphones or tablets.
Sustainable growth with strong presence in attractive demographic and geographic areas
We continuously focus on sustainable growth, both organically and through select acquisitions and partnerships. We believe we are well positioned to benefit from the growth in our customer base and the relatively low penetration of financial products and services in Brazil. We have a strong presence in attractive demographic and geographic areas and we have strengthened our competitive position in all Brazilian regions, mainly in the South and Southeast, which are areas that account for approximately 72% of Brazil’s GDP.
Our strong presence in the South and Southeast regions also allows us to reach mid- and high-income customers that provide access to a stable and low-cost funding base through a wide variety of funding instruments. Furthermore, our focus on these customers has increased our profitability, as they have traditionally produced higher volumes and margins. Our presence in these attractive geographic areas allows us to effectively cover a significant portion of Brazil’s economic base.
We believe there is further potential for growth through the use of our existing, redesigned information technology platform, by increasing the penetration of financial products and services within our client base, which, as of December 31, 2013, comprised 29.5 million customers and 21.8 million checking accounts, according to the Brazilian Central Bank.
We rank third among private banks in Brazil in terms of assets, with a market share of 7.5%, as of December 31, 2013, according to the Brazilian Central Bank. Among these banks, we believe we hold a top three market position in most of our key product lines as evidenced by our market share in the following selected products and regions.
|
At December 31, 2013 Market share (%)
|
||||
|
Payroll/individual loans
|
7.7 | |||
|
Individual loans
|
11.7 | |||
|
Payroll loans
|
5.9 | |||
|
Auto leasing/CDC (Auto loans)
|
16.8 | |||
|
Credit cards
|
11.9 | |||
|
Branches(1)
|
11.3 | |||
|
Southeast(1)
|
15.2 | |||
|
South(1)
|
8.4 | |||
|
Source: Brazilian Central Bank.
|
We believe that our size and market leadership position provide us with exceptional competitive opportunities including (i) the ability to gather market intelligence to support decision-making in determining business opportunities and (ii) the ability to meet our customers’ needs by operating as a full-service bank. In addition, we are
a leading wholesale bank in Brazil. Through our unique access to the Santander Group’s global network, we are able to support our large Brazilian corporate customers in the globalization of their businesses.
Our Strategy
Our mission is to be our customer’s bank of choice as a simple, secure, efficient and profitable bank which constantly seeks to improve its service quality, with a team that enjoys working together to gain the recognition and trust of our clients. As a result, our strategy is focused on the following objectives:
|
|
·
|
To be the bank of choice for our customers, intensifying our relationship with them and providing the best value to all customer classes with a modern, simple and efficient commercial model;
|
|
|
·
|
To expand our main businesses, increasing revenues in a sustainable way and taking into account the balance between loans, funding and services;
|
|
|
·
|
To maintain sustainable and efficient risk and cost management;
|
|
|
·
|
To promote an intense agenda of productive transformation following the transformation of the financial industry focused on simplicity, productivity and efficiency; and
|
|
|
·
|
To maintain discipline in capital management and financial soundness in each of our business segments.
|
Our Business
Overview
Until the sale of our Asset Management business, we operated along three segments: Commercial Banking, Global Wholesale Banking and Asset Management and Insurance. As a result of the sale, we simplified our segmentation and merged our Asset Management and Insurance segment into our Commercial Banking Segment. For further information regarding the sale of our Asset Management business, see “—4A. Important Events - Sale of the Investment Fund Management and Managed Portfolio Operations”.
The following chart sets forth our operating segments and their main focus.
|
Commercial Banking
|
Global Wholesale Banking
|
|
|
·
Retail banking
|
·
Global Banking & Markets, or GB&M
|
|
|
·
Individuals
|
·
Proprietary Trading
|
|
|
·
Small and Medium enterprises (“SMEs”) (annual gross revenues up to R$80 million)
|
||
|
·
Corporate (annual gross revenues in excess of R$80 million, other than global corporate clients)
|
||
|
·
Consumer finance
|
||
|
·
Asset Management
|
||
|
·
Insurance
|
||
|
·
Capitalization Products
|
34
The following table presents the breakdown of our net interest income and profit before tax by operating segment.
|
For the year ended December 31,
|
||||||||||||||||||||||||
|
2013
|
2012
|
2011
|
2013
|
2012
|
2011
|
|||||||||||||||||||
|
Net interest income
|
Profit before tax
|
|||||||||||||||||||||||
|
(in millions of R$)
|
||||||||||||||||||||||||
|
Commercial Banking
|
26,328 | 29,470 | 25,207 | 1,510 | 3,103 | 5,827 | ||||||||||||||||||
|
Global Wholesale Banking
|
2,151 | 2,117 | 2,589 | 2,508 | 2,372 | 2,947 | ||||||||||||||||||
|
Total
|
28,479 | 31,587 | 27,796 | 4,018 | 5,475 | 8,774 | ||||||||||||||||||
In our Commercial Banking business segment, we focus on long-term relationships with our individual and corporate customers (other than global enterprise customers that are serviced by our Global Wholesale Banking segment), seeking to support all of their financial needs through our credit, banking services, financial products, asset management and insurance products. We also offer special financing and credit opportunities for corporate customers pursuing social and environmental improvement programs. Our business model and segmentation allows us to provide a tailored approach to each client in order to address their specific needs.
Through our Global Wholesale Banking segment we offer financial services and sophisticated and structured solutions to our customers, in parallel with our proprietary trading activities. Our wholesale banking business focuses on servicing local and multinational conglomerates, which we refer to as Global Banking & Markets, or “GB&M” customers. Our wholesale business provides our customers with a wide range of domestic and international services that are specifically tailored to the needs of each client. Our customers benefit from the global services provided by the Santander Group’s integrated wholesale banking network and local market expertise. Our proprietary trading desk is under strict risk control oversight and has consistently shown positive results, even under volatile scenarios.
Our business is strongly committed to sustainability. Our sustainable strategy is based on three pillars: (i) social and financial inclusion, (ii) education and (iii) socio environmental business. In 2013, both the Financial Times, and the International Finance Corporation or IFC, recognized Santander Brasil as the most sustainable bank of the year in the Americas category.
As of December 31, 2013 our credit portfolio grew 7.3% and reached R$226,206 million compared to R$210,741 million in December 31, 2012.
The following table shows a managerial breakdown of our credit portfolio by client category at the dates indicated.
|
For the year ended December 31,
|
Change, at December 31, 2013 vs. December 31, 2012
|
|||||||||||||||||||
|
2013
|
2012
|
2011
|
R$ million
|
%
|
||||||||||||||||
|
(in millions of R$)
|
||||||||||||||||||||
|
Individuals
|
74,441 | 70,277 | 63,413 | 4,164 | 5.9 | |||||||||||||||
|
Consumer finance
|
28,692 | 29,566 | 30,459 | (874 | ) | (3.0 | ) | |||||||||||||
|
Small and Medium Enterprises(1)
|
38,930 | 40,118 | 33,538 | (1,188 | ) | (3.0 | ) | |||||||||||||
|
Large Corporations(2)
|
84,143 | 70,780 | 66,774 | 13,363 | 18.9 | |||||||||||||||
|
Total
|
226,206 | 210,741 | 194,184 | 15,465 | 7.3 | |||||||||||||||
|
(1)
|
Companies with annual gross revenues of up to R$80 million.
|
|
(2)
|
Companies with annual gross revenues exceeding R$80 million, including our global corporate clients.
|
Commercial Banking
Our Commercial Banking business includes products and services for retail customers, enterprises and corporations (other than global corporate clients who are served by our Global Wholesale Banking segment), our consumer finance business and our asset management and insurance services.
We serve clients throughout Brazil, primarily through our branch network, which as of December 31, 2013, consisted of 2,313 branches, 1,253 mini branches (
postos de atendimento bancário
or “PABs” located at our corporate customers’ premises), and 16,958 ATMs.
In 2013, we revised both our Individuals and corporate client classification models to better reflect the macroeconomic changes of the Brazilian market and changes in customer preferences. We created a new high-income service sector, Santander Select, and we adjusted our corporate sector to better fulfill our corporate clients’ financial needs.
Retail Banking
Individuals
In 2013, we revised our Individuals classification model and created a new high-income service sector, Santander Select, designed to provide our high-income customers with a new category of specialized financial services that allows them to better manage their assets. We had opened 61 exclusive Santander Select branches with 400 relationship managers.
After our revision, our current Individuals classification model is as follows:
|
|
·
|
Private Banking Business:
serves a select group of clients with a minimum of R$3.0 million in assets available for investment. Our objective is to offer our clients a comprehensive range of financial products, banking services, tax planning and advisory services that provide recommendations on investments and asset allocation.
|
|
|
·
|
Santander Select:
customers who earn more than R$10,000 per month or have investments above R$200,000. Our objective is to offer wealth management advisory services to these customers.
|
|
|
·
|
Santander Van Gogh:
customers who earn over R$4,000 per month or have investments above R$40,000. Our objective is to offer differentiated financial services to these customers.
|
|
|
·
|
Santander Individual:
customers who earn less than R$4,000 per month. Our model offers simple and efficient solutions with options to improve cost-benefit of our banking services for these customers, primarily through electronic channels.
|
In order to better meet customer needs, in 2013 we launched the
Santander Conta Combinada
, which allows our clients to choose among four types of accounts, according to their profile. An example is the
Santander Conta Combinada Universitária Fit
(for university students), which has no monthly charge for the service package as long as basic account requirements are met. The
Santander Conta Combinada
is offered only to customers in our Individuals classification.
We offer our retail lending products to customers through our extensive branch network and on-site service units. See “—Distribution Network.” The following table sets forth our individual customer loan portfolio at the dates indicated, as per our management records:
|
For the year ended December 31,
|
Change, at December 31, 2013 vs. December 31, 2012
|
|||||||||||||||||||
|
2013
|
2012
|
2011
|
R$ million
|
%
|
||||||||||||||||
|
(in millions of R$)
|
||||||||||||||||||||
|
Leasing/Auto Loans(1)
|
3,185 | 2,740 | 2,277 | 445 | 16.3 | |||||||||||||||
|
Credit cards
|
17,070 | 16,138 | 14,144 | 932 | 5.8 | |||||||||||||||
|
Payroll loans(2)
|
12,994 | 13,529 | 12,248 | (535 | ) | (4.0 | ) | |||||||||||||
|
Mortgages
|
16,058 | 12,321 | 10,018 | 3,737 | 30.3 | |||||||||||||||
|
Agricultural Loans
|
2,725 | 2,147 | 2,492 | 578 | 26.9 | |||||||||||||||
|
Personal loans/Other
|
22,409 | 23,402 | 22,234 | (993 | ) | (4.2 | ) | |||||||||||||
|
Total
|
74,441 | 70,277 | 63,413 | 4,164 | 5.93 | |||||||||||||||
|
(1)
|
Including the loans to individuals in the consumer finance segment, the auto loan portfolio totaled R$27.6 billion in the fourth quarter of 2013, R$27.9 billion in the fourth quarter of 2012, and R$27.5 billion in the fourth quarter of 2011.
|
|
(2)
|
Including the payroll loan acquired portfolio, payroll loans totaled R$13.7 billion at December 31, 2013, R$14.8 billion at December 31, 2012 and R$15.1 billion at December 31, 2011.
|
Payroll Loans
Payroll loans are typical retail products with differentiated methods of payment. Monthly installments are deducted directly from the customer’s payroll by their employer and then credited to us, significantly reducing our credit risk. Our customers are typically employees from the public sector, private sector and state pension holders. We had 5.9% of market share in payroll loans at December 31, 2013, according to the Brazilian Central Bank.
Credit Cards
We participate in the credit card market, issuing cards from the Visa and MasterCard brands to our customers (including both account and non-account holders). Our revenues from credit cards include administration fees, interest on unpaid balances, annuities and rates charged on cash advances.
The total credit card portfolio in 2013 presented an increase of 5.6% compared to the same period in 2012, reaching R$17.4 billion. In 2013, our credit card customer base increased 7.6% from 2012, reaching 15.7 million credit cards, and our debit card customer base increased 11.1% from 2012, reaching 37.5 million debit cards.
In 2013, we maintained our partnerships with Vivo, a leading mobile phone operator in Brazil and the Raízen group (a Brazilian energy company operating more than 4,700 service stations under the Shell brand). These partnerships were designed to increase our customer base by combining our products with Raizen’s points of sales and Vivo’s customer base.
Merchant Acquiring Market
On April 4, 2014, we and our controlled company, Santander Getnet Serviços para Meios de Pagamento Sociedade Anônima, or SGS, executed a share purchase agreement for the acquisition, by SGS, of Getnet Tecnologia em Captura e Processamento de Transações H.U.A.H. S.A., our current partner in developing acquiring services and card processing activities. For further information on this transaction, see “Item 4.—Information on the Company—A. History and Development of the Company—Important Events—Agreement for the Acquisition of GetNet Tecnologia em Captura e Processamento de Transações Eletrônicas Hua S.A. (GetNet) Operations by Santander Brasil”. Our goal is to consolidate and strengthen a partnership initiated in 2010 by the two companies and to seek greater synergy.
During the third quarter of 2013 we initiated a partnership with iZettle, a Swedish mobile payments company, to offer credit and debit card-readers that allow individuals and small businesses to accept card payments on their smartphones or tablets.
In 2013 we had a 5.8% market share in Brazil in terms of revenues in the merchant acquiring market, covering more than 75% of the Brazilian territory, according to the Brazilian Central Bank.
Mortgages
We offer long-term loans to our customers for the purchase of real estate, secured by deeds of trust, which we consider a strategic product due to its lower risk and ability to increase customer loyalty. Mortgages were the credit product with the highest growth in our portfolio in 2013. In addition to financing for individuals, we also offer credit lines to corporate customers in the real estate construction industry for the financing of up to 80% of the project cost.
As of December 31, 2013, we had a 6.4% market share in Brazil in terms of amounts outstanding under mortgage products, according to the Brazilian Central Bank. As of December 31, 2013, our mortgage loans portfolio, including construction loans, was R$25.6 billion. Within the individual sector, mortgage loans increased 30.3%, reaching R$16.1 billion.
On average, the loan-to-value ratio of our housing loans is 58.0%. We do not offer mortgage loans that do not meet prime lending standards. That is (i) we do not make any loans for more than 80% of the value of the property to be purchased, (ii) and borrowers must meet certain minimum monthly income levels evidenced by recent payroll information and tax returns to confirm their employment or other types of revenue which allows us to evaluate their credit risk profile and (iii) payments may not exceed 35% of borrowers’ monthly income.
Small and Medium Enterprises
Our current SMEs classification model is as follows:
|
|
·
|
Enterprise 3:
companies with annual revenue over R$10 million and up to R$80 million. Our focus is to strengthen relationships through dedicated and differentiated account managers.
|
|
|
·
|
Enterprise 2:
companies with annual revenue over R$1 million and up to R$10 million. Our focus is to strengthen relationships through the centralization of cash flow management and adequate credit offering.
|
|
|
·
|
Enterprise 1:
companies with annual revenue up to R$1 million. Our focus is to increase penetration in this segment, primarily through merchant acquiring services, and by offering differentiated services, such as the integration of financial solutions for both the enterprise and its partners, bringing simplicity and economy to the enterprise’s day-to-day operations.
|
During 2013, we focused on offering our integrated service to our Enterprises 1 and 2 customers. The integrated service streamlines all stages of an enterprise, integrating services provided to both accounts, individual and business, bringing simplicity to our customers’ day-to-day operations. With respect to our Enterprise 2 customers, we also focused on improving our internet banking services and with respect to our Enterprise 3 customers, we focused on remodeling our product offering to better meet their needs.
The table below sets forth our SME loan portfolio at the dates indicated, as per our management records.
|
For the year ended December 31,
|
Change, December 31, 2013 vs. December 31, 2012
|
|||||||||||||||||||
|
2013
|
2012
|
2011
|
R$ million
|
%
|
||||||||||||||||
|
(in millions of R$)
|
||||||||||||||||||||
|
Agricultural lending
|
167 | 155 | 110 | 12 | 7.3 | |||||||||||||||
|
Working capital loans
|
18,502 | 19,811 | 16,486 | (1,309 | ) | (6.6 | ) | |||||||||||||
|
Buyer financing
|
19 | 30 | 16 | (11 | ) | (36.5 | ) | |||||||||||||
|
Vendor financing
|
6 | 5 | 7 | 1 | 15.2 | |||||||||||||||
|
Discounted receivables
|
772 | 1,174 | 736 | (402 | ) | (34.2 | ) | |||||||||||||
|
Comex
|
471 | 322 | 354 | 149 | 46.2 | |||||||||||||||
|
Overdraft facility
|
3,168 | 3,922 | 3,961 | (754 | ) | (19.2 | ) | |||||||||||||
|
Refinancing
|
2,803 | 3,598 | 3,195 | (795 | ) | (22.1 | ) | |||||||||||||
|
Resolution 2,770
|
13 | 10 | 38 | 3 | 31.4 | |||||||||||||||
|
Account overdraft loans
|
2,640 | 2,737 | 2,627 | (97 | ) | (3.5 | ) | |||||||||||||
|
CDC/leasing(1)
|
1,988 | 2,276 | 2,257 | (288 | ) | (12.6 | ) | |||||||||||||
|
Other(2)
|
8,381 | 6,078 | 3,751 | 2,303 | 38.0 | |||||||||||||||
|
Total(3)
|
38,930 | 40,118 | 33,538 | (1,188 | ) | 3.0 | ||||||||||||||
|
(1)
|
Does not include consumer finance products.
|
|
(2)
|
Includes credit cards, mortgage finance products and other products.
|
|
(3)
|
Includes small and medium companies with annual gross revenues up to R$80 million.
|
Corporate
Our corporate segment is comprised of large companies that have annual gross revenues greater than R$80 million (other than global corporate clients). We focus on fostering a close relationship with our corporate customers by providing them with customer-tailored services. To that end, we offer a wide range of specialized products and
services that are compatible with the products and services we offer to our GB&M customers. In 2013, we had more than 200 bankers and 110 product specialists dedicated exclusively to our corporate sector.
Consumer Finance
Aymoré Crédito, Financiamento e Investimento S.A. (“Santander Financiamentos”) is our main channel for consumer finance with expertise in providing consumer credit directly to borrowers or through intermediate agencies. Our consumer finance operations are based on four pillars: (1) vehicle financing, (2) commercial partnerships (particularly with automakers such as Nissan, Renault and Hyundai); (3) Webmotors (our online vehicle trading platform); and (4) consumer credit, which includes opportunities in sectors such as furniture, tourism, nautical, health and technology, accessibility equipment, renewable energies and cleaner processes, among others.
In December 2013, we had over 14,500 business partners, a sales team composed of 1,644 employees (operators and businesses managers) and 141 branches of Santander Financiamentos throughout Brazil dedicated to consumer finance. As of December 31, 2013, our core business, vehicle financing, represents approximately 89% of our consumer credit portfolio.
Asset Management
On December 17, 2013, we concluded the sale of our asset management business by way of a disposal of all shares of DTVM. For further information on the sale of our asset management business, see “Item 4.—Information on the Company—A. History and Development of the Company—Important Events—Sale of the Investment Fund Management and Managed Portfolio Operations”.
Following the sale of our asset management business, we continue to act as administrator, meaning we will continue to represent the fund, carry out certain activities before the client and engage in sales and distribution activities. We will not manage the funds invested or make investment decisions with respect thereto, which will be performed by the new asset manager.
Our main strategy in this segment continues to be offering innovative products to our customers. In 2013, we focused on launching products that provide Brazilian investors with access to external markets. Drawing on our global expertise, we began to offer our Brazilian customers a group of funds that invest in global equity. We believe that the sale of our asset management business will allow us to better cater to our customers’ growing need for global diversification.
Insurance Brokerage Services
We aim to provide our customers with streamlined and customized products focused on the retail segment. As a result of the sale of Santander Seguros in 2011, we operate exclusively with insurance products offered by the joint venture that was formed in connection with the sale of Santander Seguros, particularly in our insurance and private pension plan portfolio. We also sell automobile insurance policies from the major providers in Brazil.
For further information on the sale of Santander Seguros, see “Item 5—Operating and Financial Review and Prospects—A. Operating Results—Factors Affecting the Comparability of Our Results of Operations—- Sale of Zurich Santander Brasil Seguros e Previdência S.A. (the new corporate name of Santander Seguros S.A.).”
Capitalization Products
Capitalization Products are savings account products that generally require customers to deposit a fixed amount with us to be returned at the end of an agreed upon term, with accrued interest. In addition, the customer is automatically entered into periodic drawings for the opportunity to win significant cash prizes. Thus, capitalization products are similar to certificates of deposits, except that, along with purchasing a product that receives a return on principal, the customer has a chance of receiving cash prizes during the term of the product based on random drawings.
Our Capitalization Products transactions are carried out through our subsidiary Santander Capitalização S.A. and are focused on bank assurance products.
Global Wholesale Banking
Global Banking & Markets
GB&M is a global business unit that covers those clients that, due to their size, complexity or sophistication, require tailored services or high value added wholesale products. In this segment, we provide a wide range of domestic and international financial services to large Brazilian and multinational conglomerates in parallel to our proprietary trading activities. Our customers in the GB&M segment benefit from the global structure of services provided by the Santander Group with its worldwide integrated wholesale banking network and global services solutions, combined with its local market expertise. This structure allows services to be provided in an integrated fashion.
In 2013, we focused on developing our customer relationships by implementing a new client coverage model and strengthening partnerships with other sectors of the Bank through product cross-selling. The Global Wholesale Banking segment’s products and services are available not only to our GB&M clients, but also to Corporate, SME customers, private banking and retail clients.
We offer a range of services from core products to highly complex customized solutions in the following key areas:
|
|
·
|
Global transaction banking, which includes cash management, local loans and bank guarantees, trade finance, global custody, securities services, guarantees (both trade and non-trade) and trade services;
|
|
|
·
|
Credit markets, which is responsible for project financing and advising, debt capital markets, acquisition financing and loan syndication, credit sales, trading and asset and capital structuring;
|
|
|
·
|
Corporate finance, which includes mergers and acquisitions and equity capital markets operations;
|
|
|
·
|
Equities, which includes cash equities services for individuals and institutional clients, exchange traded derivatives and equity research;
|
|
|
·
|
Rates, which is responsible for offering treasury products such as foreign exchange transactions, derivatives (including equity derivatives), deposits and other financial and structured products;
|
|
|
·
|
Market making, which is responsible for the pricing of client deals originated by the sales force from our corporate, institutional, private banking and retail operations;
|
Our GB&M team is dedicated to client coverage comprising a range of industries, including telecommunications, retail, aviation, real estate and logistics, power, construction and infrastructure, natural resources, food, agribusiness and financial institutions.
We are one of the leading banks in capital markets and financial advisory services in the Brazilian and international markets, as evidenced by the leading league tables for the industry.
Our mergers and acquisitions team in Latin America ranked third in 2013 compared to ninth in 2012. We ranked fifth in Brazil in terms of announced transactions in 2013, compared to seventh in 2012, according to Bloomberg, with a total of twelve transactions, which amounted to U.S.$20 billion.
Our Brazilian equity capital markets division participated as bookrunner in numerous offerings in recent years. In 2013, we ranked fifth in equity issuances according to Bloomberg, with a total of fourteen transactions, which amounted to U.S.$2 billion.
In 2013, we also played an important role in both local and international debt capital markets for Brazilian issuers. In the local debt capital markets, we participated in 23 transactions, compared to fifteen transactions in 2012, arranging R$2.6 billion in funding for companies. We expanded our market share to 7.6% in 2013, rising two positions in the ANBIMA rankings to fifth place. In the international debt market, we increased our revenue by 38% by using a diversification strategy. In 2013, we participated in the coordination of fifteen transactions of financial and corporate bonds, which totaled U.S.$1.7 billion, according to the Bond Radar ranking.
Our project finance team has advised and structured the most important projects in recent years in several sectors of the economy. The Santander Group is one of the main project lenders in the world and is one of the leaders in the Brazilian market, as evidenced by ANBIMA’s ranking in recent years.
In 2013, we participated in almost all the infrastructure auctions held by the government, acting as advisors to the majority of the auction winners, including in the urban mobility, airports, toll roads, power generation, transmission lines, and water and waste sectors, among others. We expect project finance to continue being a key element of our business as infrastructure improvements remain one of the Brazilian government’s main priorities.
Our main activities in asset and capital structuring include proprietary investments in infrastructure projects and renewable energy. In 2013, we became a major shareholder in an important wind farm complex in the northeast of Brazil, consolidating our leadership in the wind farm industry.
Through our equities department, we provide advisory and trading execution for individuals and institutional investors, and manage hedge funds throughout Latin America, the United States, Europe and Asia. Our equity sales team and traders follow the equity strategy recommendations and the reports developed by our equity research team. Currently, our equity research team is regarded as one of the best in Latin America according to a poll by Institutional Investor magazine.
Our brokerage operations, which are focused on individuals offer premium advisory services to our clients, based on our proprietary equity research. During 2013, our equity brokerage operations delivered outstanding performance. While the Bovespa Index dropped 15.50% in 2013, our recommended portfolio (called “Carteira Dinâmica”) obtained returns of 11.5%. Our recommended portfolio is more flexible than traditional portfolios as it allows investors to allocate their positions according to market conditions, through more aggressive strategies. In 2013, short-term recommended strategies demonstrated an even greater performance of 47.0% returns.
We also offer, through our treasury sales team, foreign exchange products, derivatives and deposits to all of our clients, including corporate clients in large, middle and small enterprises, institutional investors and individuals. We have an effective coverage, based on teams which are specialized in each of these segments as well as structuring and products teams that work to create and maintain a portfolio that allows us to offer our customers the most innovative solutions available in the market.
We have a structure dedicated to international correspondent banking operations, which include trade financing and funding from correspondent banks. Our trade financing activities consist of import and export financing. Both import and export financings are extended in U.S. dollars or the relevant foreign currency of the commercial transaction.
We offer a comprehensive range of cash management solutions, both locally and globally. We offer clients the opportunity to significantly improve the management of domestic flows so as to gain access to local clearing services and process transactions quickly and effectively. This enhances our customer loyalty through integrated and personalized solutions, together with our global service model.
Our GB&M operations helped us achieve the following awards in 2013:
|
|
·
|
“Deal of the Year” awards were granted to two of our transactions: (I) CNO Bond: “Bond of the Year” by Latin Finance; and (II) Project Bond OOG: “LatAm Oil & Gas Deal of the Year” by Project Finance International and “TBC Award” by Euromoney.
|
|
|
·
|
“Deal of the Quarter Century” awards were granted to two of our transactions: (i) Odebrecht Drilling Norbe VIII / IX in 2010: “Best Project / Infrastructure Finance Deal” by Latin Finance; (ii) Purchase by Vale Inco Ltd. in 2006: “Best M&A Deal” by Latin Finance.
|
Proprietary Trading
Our Proprietary Trading is responsible for the management of our proprietary books and the establishment of a relevant presence as a leading liquidity provider across local and foreign markets.
Distribution Network
Our distribution network provides integrated financial services and products to our customers through a variety of channels, including branches and mini-branches (or PABs), as well as complementary distribution channels such as ATMs, call centers and Internet banking. These distribution channels are concentrated in the Southeast and South, Brazil’s wealthiest regions measured in terms of GDP per capita (representing approximately 72% of Brazil’s GDP in 2011).
The following table presents our principal distribution outlets at December 31, 2013:
|
At December 31, 2013
|
||||
|
Branches
|
2,313 | |||
|
PABs
|
1,253 | |||
|
ATMs
|
16,958 | |||
Branch Network
Our branch network offers all of our products and services to our customers. As of December 31, 2013, we had a network of 2,313 full service branches throughout Brazil, 85% of which were concentrated in the Southeast and South regions.
The table below shows the geographic distribution of our distribution network throughout Brazil, as of December 31, 2013.
|
Branches
|
PABs
|
ATMs
|
||||||||||
|
Central West
|
99 | 84 | 727 | |||||||||
|
Northeast
|
198 | 117 | 1,602 | |||||||||
|
North
|
38 | 47 | 387 | |||||||||
|
Southeast
|
1,669 | 865 | 12,198 | |||||||||
|
South
|
309 | 140 | 2,044 | |||||||||
|
Total(1)
|
2,313 | 1,253 | 16,958 | |||||||||
|
(1)
|
Physical location.
|
The following map shows the geographic distribution of our branch network, each region’s share of 2011 GDP and our market share as of December 31, 2013, according to the Brazilian Central Bank. Market share is calculated by dividing the number of our branches in the region by the number of branches for all principal banks in such region:
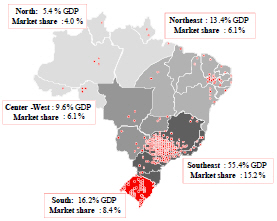
|
Source for GDP: IBGE 2011
|
PABs
We offer daily banking services to our SME and other corporate customers and their employees through our PABs located on their premises as well as in hospitals and universities. Our PABs are generally the exclusive point of sale at the premises. We believe that our PABs strengthen our relationships with our clients and builds customer loyalty with those individuals who benefit from the convenience of conducting their banking transactions at their workplace.
ATMs
We operate an extensive network of 16,958 ATMs, including those located in our branches and on-site service units. In addition, our customers have access to the “
Banco 24 Horas
” network which has more than 14,000 ATMs and the “
Rede Compartilhada Banco 24 Horas
” network which operates approximately 15,000 ATMs for over 40 participating banks located throughout Brazil. Through these networks our customers may access their accounts and conduct banking transactions (typically paying a per-transaction fee).
Complementary Distribution Channels
We also distribute our products and services through complementary distribution channels, which we believe contribute significantly to increased product sales and banking transactions. These channels consist of internet banking, mobile banking services and call centers. These distribution channels provide a significant amount of information to our customers and also improve direct sales. Because of their lower cost and large attendance capacity, we believe that complementary distribution channels are an important way to have more effective relationships with our customer base.
Call Centers
Our call centers provide our customers with the opportunity to make inquiries, execute payment transactions and apply for products and services, such as personal loans. Our call centers also serve as a distribution channel to offer our clients additional products and services.
The following table presents summarized operating statistics for our call centers.
|
At December 31,
|
Change, December 31, 2013 vs. December 31, 2012
|
|||||||||||||||||||
|
2013
|
2012
|
2011
|
Change
|
%
|
||||||||||||||||
|
Number of individual customers (in thousands)
|
2,333 | 2,452 | 2,525 | (119 | ) | (4.9 | ) | |||||||||||||
|
PAS(1)
|
3,567 | 3,563 | 3,631 | 4 | 0.1 | |||||||||||||||
|
Headcount
|
5,831 | 5,705 | 6,588 | 126 | 2.2 | |||||||||||||||
|
Percentage of using customers per month
|
25 | % | 28 | % | 27 | % | — | — | ||||||||||||
|
(1)
|
Work stations set up for call center activities.
|
Internet Banking
We view Internet banking as a key instrument for offering additional products to our customers. Individuals and SMEs can also access their accounts through the Internet to conduct banking transactions at their convenience, such as obtaining account information, financial transfers, contracting loans and making payments. The following table presents summarized operating statistics for our Internet banking.
|
At December 31,
|
Change, December 31, 2013 vs. December 31, 2012
|
|||||||||||||||||||
|
2013
|
2012
|
2011
|
Change
|
%
|
||||||||||||||||
|
Number of individual customers (in thousands)
|
2,743 | 2,588 | 2,448 | 155 | 6.0 | |||||||||||||||
|
Percentage of using customers
|
33 | % | 29 | % | 28 | % | — | — | ||||||||||||
Customer Funding
Since we are primarily a commercial bank, customer deposits are our main source of funding. These deposits, combined with capital and other instruments, enable us to cover our liquidity needs and legal reserve requirements. As of December 31, 2013, customer deposits amounted to R$200.2 billion, representing 64.9% of total funding, which amounted to R$308.4 billion.
The following table presents a managerial break-down of our customer funding for each period presented:
|
At December 31, 2013
|
||||||||||||
|
2013
|
2012
|
2011
|
||||||||||
|
(in millions of R$)
|
||||||||||||
|
Customer deposits
|
200,156 | 188,595 | 174,474 | |||||||||
|
Current accounts
|
15,585 | 13,585 | 13,561 | |||||||||
|
Savings accounts
|
33,589 | 26,857 | 23,293 | |||||||||
|
Time deposits
|
81,351 | 84,586 | 83,942 | |||||||||
|
Repurchase agreements
|
69,631 | 63,566 | 53,678 | |||||||||
|
Backed operations with Private Securities(1)
|
41,852 | 35,737 | 30,247 | |||||||||
|
Backed operations with Public Securities(1)
|
27,779 | 27,831 | 23,431 | |||||||||
|
Deposits from the Brazilian Central Bank and credit institutions
|
34,032 | 35,074 | 51,527 | |||||||||
|
Time deposits
|
30,510 | 26,077 | 27,023 | |||||||||
|
Demand deposits
|
251 | 48 | 134 | |||||||||
|
Repurchase agreements
|
3,271 | 8,949 | 24,371 | |||||||||
|
Backed operations with Private Securities(1)
|
373 | 559 | 223 | |||||||||
|
Backed operations with Public Securities(1)
|
2,898 | 8,389 | 24,147 | |||||||||
|
Total deposits
|
234,188 | 223,669 | 226,001 | |||||||||
|
Marketable debt securities
|
65,301 | 54,013 | 38,590 | |||||||||
|
Agribusiness Credit Notes
|
1,682 | 2,009 | 1,341 | |||||||||
|
Treasury Bills
|
28,222 | 25,320 | 19,926 | |||||||||
|
Real Estate Credit Notes
|
17,077 | 11,237 | 8,550 | |||||||||
|
Securities issued abroad
|
18,319 | 15,447 | 8,773 | |||||||||
|
Subordinated debt
|
8,906 | 11,919 | 10,908 | |||||||||
|
Total Funding
|
308,395 | 289,601 | 275,499 | |||||||||
|
(1)
|
Refers primarily to repurchase agreements backed by debentures of own issue.
|
For further discussion of our funding, see “Item 5. Operating and Financial Review and Prospects—B. Liquidity and Capital Resources—Liquidity and Funding.”
Technology and Infrastructure
In order to serve our customers effectively, improve our profitability and grow our business, we continuously invest in new technology and renewal of equipment and infrastructure. We believe that proper management of technology is key to the efficient management of our business. Our technology platform focuses on our customers and supports our business model. We operate a modern global technology platform that is interconnected with the platform of the Santander Group, which allows us to serve our customers on a global scale, under a platform that is uniquely customer-centered. See “Item 7. Major Shareholders and Related Party Transactions—B. Related Party Transactions—Information Technology Platform.”
In 2013, we concluded the construction of our new data center located in Campinas, which we believe to be the largest technology center in Latin America, with 800,000 square-meters. Our objectives are: (i) maintain our
systems with a high security level, (ii) optimize our technology activities and (iii) operate efficiently through the best use of energy and natural resources. The data center was planned in order to be an example of sustainable construction and consumes 20% less water and 30% less energy than our other data centers. Our new data center is the only data center in Latin America to have received the maximum classification level in capacity and availability (Tier IV, with 99.99% availability), within the design and implementation phases, according to the UpTime Institute.
In 2013, we also initiated a partnership with iZettle, a Swedish mobile payments company, to offer credit and debit card readers that allow individuals and small businesses to accept card payments on their smartphones or tablets.
Communications and Marketing
Our strategy, which is focused on close and transparent customer relations, requires that communication and marketing play a vital role in our business. Tools such as advertising, social networks, sponsorships, events and institutional publications provide us with opportunities to promote different forms of interaction with our audiences, each of which involves a different function. These objectives include the presentation of our activities, products and services, in addition to our strategy in relation to the promotion of sustainable business.
Marketing
In addition to supporting our business strategy, marketing expresses our corporate position. Our marketing activities throughout 2013 were based on the slogan “Your turn. Your voice. Your bank.” This slogan, linked to the global catch phrase “A bank for your ideas,” reflects the idea of acknowledging the empowerment and leading role of our customers with regard to brand relations. As a means of optimizing investments, our strategy is to concentrate efforts on the areas which set the Santander brand apart from others. This, for example, led to the launch of the high-income sector service Santander Select, the aim of which is to help high-income customers manage their assets. Through our communication platforms, we targeted customers in need of specialist financial guidance to enable them to actively participate in investment decisions, instead of relying on the manager to deal with such decisions.
Sponsorships and Culture
We maintained our considerable presence in sports marketing in 2013, by sponsoring three major Latin American football tournaments (Copa Libertadores, Copa Sulamericana and Recopa), in addition to the Ferrari Formula 1 team. In relation to cultural investment, we ought to benefit projects which promote creativity and innovation, the transfer of knowledge, conscientious consumption and entrepreneurship. Highlights for cultural programs in 2013 include the expositions “Poetic Narratives – Santander Collection” (an itinerant exposition from the Bank´s collection), the “9th MERCOSUL Biennial” and the “Santander Art Circuit,” a project which involved artists decorating the facades of ten bank branches in Porto Alegre, in the state of Rio Grande do Sul.
Communication and Events
The topics and forms of communication vary in accordance with the tools used and the audiences addressed. We relate with stakeholders including customers, journalists, shareholders and university students via the different platforms available. We believe social networks provide an excellent opportunity for stakeholder interaction because they provide the widest range of audiences and because everyone is able to participate in any given conversation. We utilize social networks to constantly establish dialog in connection with issues of common interest, as a means of increasing the engagement and involvement of the followers of our brand. As a result, we have over 2.1 million Facebook fans and 113,000 followers on Twitter. We also interact with interested parties through events, which bring us closer to our customers and potential customers. Our Annual Report is also an important means of communication with our various stakeholders and for 2012 was prepared in line with the standards of the Global Reporting Initiative (GRI).
Sustainability
Our strategy regarding sustainability is based on three pillars, which are essential for the development of Brazil: (i) social and financial inclusion; (ii) education; and (iii) socio-environmental businesses.
In 2013, the Financial Times, along with the IFC recognized Santander as the most sustainable bank of the year in the Americas category. The award was granted based on the evaluation of our commitment to sustainability and related practices. Other recognitions in 2013 included: (i)
Época Negócios 360°
, where we were ranked first in the social and environmental responsibility category; (ii)
Prêmio Eco
, one of Brazil’s main sustainability awards, promoted by the American Chamber of Commerce; (iii)
Guia Exame de Sustentabilidade
, which covers the best practices of corporate responsibility in the country; and (iv) the
Fundo Ethical
rating as “excellent” by the Investidor Institucional magazine ranking.
For the fourth consecutive year, our shares were included in the portfolio of the Business Sustainability Index (
Índice de Sustentabilidade Empresarial
) or “ISE”) from BM&FBOVESPA. We also maintained our presence at the Efficient Carbon Index (
Índice Carbono Eficiente
) or “ICO2,” composed by the shares of companies that take part in the IBrX-50 index, and which adopt transparency practices regarding their greenhouse gases emission (GEE –
gases de efeito estufa
). In addition to that, we have been elected to be part of the “Global Compact 100,” a stock index comprised by shares of companies committed to the ten principles of the United Nations Global Compact.
We strive to be the bank in Brazil which provides the best financial mechanisms to enable our clients and society to be more sustainable. For example, in 2013, our climate governance model focused on structuring new low carbon business models. A result from this strategy, we created the Reduce and Compensate CO2 Program (
Programa Reduza e Compense CO2
).
Social and Financial Inclusion
We are the largest microcredit private-owned bank in Brazil, based on market participation and portfolio value, with a total of R$2.0 billion microcredit provided and more than 285,000 entrepreneurs served since 2002.
We also promote social and financial inclusion by opening branches in low income communities and offering job opportunities for members of these communities. In 2013, we opened a new service station inside Paraisópolis, a low-income community in São Paulo. Another example of initiative is the
Programa Amigo de Valor
, which allows Santander’s employees and customers to transfer part of their income tax to the Child and Adolescent’s Rights Funds. In 2013, this program achieved a new record: R$8.4 million collected (71.4% more than 2012), which has been directed to 56 cities.
Education
Santander Universidades
is a global program that supports and encourages higher education. We are the most active private institution in the country to partner with the higher education value chain (students, young professionals, teachers and administrative employees). As of December 31, 2013, we had partnerships with 450 universities and had nearly 2 million clients in this program.
Since its creation, in 1996,
Santander Universidades
has already granted over 100 thousand scholarships. Between 2011 and 2015, the estimated investments at a global level will reach R$1.4 billion, from which R$259 million will be directed to higher education support in Brazil. In 2013, one of the highlights of our
Santander Universidades
program was the
Prêmios Santander Universidades
, which received 16,838 projects, and granted more than R$2.0 million in awards, international scholarships and on-line entrepreneurship courses to all projects submitted. We also offer the
Programa Escola Brasil
, a corporate volunteer program that contributes to the improvement of public schools education. The
Programa Escola Brasil
is present in 56 cities and 297 partner schools, and with the participation of 4,248 employees, relatives, customers and suppliers.
Socio-environmental Businesses
We finance projects for our corporate customers that improve their social and environmental impacts by (i) reducing water and/or energy consumption; (ii) optimizing waste management and operational efficiency; (iii) using sustainable constructions and/or renovations techniques and (iv) improving accessibility and corporate governance. In 2013, our socio-environmental business financing provided to our corporate and retail clients amounted to more than R$2.0 billion.
For our consumer finance customers, we offer products related to accessibility, renewable energies and cleaner processes.
The Mantiq, created in 2012 to manage Santander Brasil’s private equity business, ended 2013 with R$2,376 million in funds under. The Mantiq is one of the country’s largest private equity managers. It focuses on the infrastructure and oil and gas sectors, and its investment strategy takes into account socio-environmental criteria besides economics.
In 2013, we also reinforced our shareholder participation in companies which develop sustainable businesses, such as Ambievo, a company whose businesses include the development of sustainable solutions for soil cleaning and industrial degreasing.
Insurance Coverage
We maintain insurance policies that we renew annually in order to protect our assets. All of our branches and administrative buildings are insured against loss caused by fire, lightning, explosions and other “all risks” policy coverage. Such coverage establishes reimbursement for the asset replacement value.
We also maintain an insurance policy against third party damages to our properties.
Additionally, we maintain a directors and officers, or “D&O” insurance policy for our management against third parties complaints regarding management acts. There are insurance policies against crimes, employee dishonesty and damages arising out of public offerings.
Dependency on Patents, Licenses, Contracts and Processes
In Brazil, ownership of trademarks can be acquired only through a validly approved registration with the National Institute of Intellectual Property (
Instituto Nacional de Propriedade Industrial
, or “INPI”), the agency responsible for registering trademarks, patents and designs in Brazil. After registration, the owner has exclusive use of the trademark throughout Brazil for a ten-year period that can be successively renewed for equal periods.
The major trademarks we use, including, among others, the “Santander” and “Banco Santander” brands, are owned by the Santander Group. One of the Santander Group’s affiliates granted us a license to use such brands. All material trademarks for our business are registered or have been submitted to INPI by us or by the Santander Group. We own the principal domain names used in our business which include:
(1) www.santanderbrasil.com.br;
(2) www.bancosantander.com.br;
(3) www.bsantander.com.br;
(4) www.bancosantanderlight.com.br;
(5) www.corretorasantander.com.br;
(6) www.realsantander.com.br;
(7) www.santander.com.br.
Competition
In the last few decades, the Brazilian financial system has experienced significant structural changes, following the evolution on the country’s economic environment and developing a solid framework, for both legal and financial supervision.
In recent years, the consolidation of the Brazilian financial sector, with the merger of large banks and the privatization of state-owned banks, has increased competition in the Brazilian market for banking and financial services. According to the Brazilian Central Bank, in November 2013 there were 133 universal banks, 22 commercial banks and 14 investment banks, along with several brokers, leasing companies and other financial institutions operating in Brazil. In 2012 and 2013, the Brazilian economy grew less than in prior years, while delinquency rates, inflation and currency depreciation increased. The Brazilian government, in an attempt to foster economic growth, stimulated the availability of credit through large state-owned banks, sustaining the pace of the
previous years’ credit growth. Such state-owned banks started to offer credit at significantly lower interest rates. The privately-owned banks followed their lead by reducing the interest rates for their customers, while tightening customer credit approval policies in an effort to control potential increases in delinquency rates. Due to these measures, margins and spread were reduced, and credit risk increased.
Currently, there are six financial institutions at the forefront of the Brazilian financial industry in terms of assets: Santander Brasil, Bradesco, Itaú Unibanco, Banco do Brasil, Caixa Econômica Federal and BNDES. Together, these financial institutions accounted for 79% of the credit and 81% of the funding available in the country in December 2013.
Industry Transformation
Recently, the Brazilian banking industry has tried to adapt itself to the economic environment of the post-global crisis world, in a transformation process that has brought important changes to the country’s banking model.
One of these changes is the shift to a more conservative product mix. Due to the increase in default rates and the regulatory changes that increased banks’ capital requirements, the leading banks started to move their credit portfolio from products with larger spreads (and therefore, increased credit risk) to products with lower risks (and therefore, lower spreads). The leading banks also attempted to change the composition of their revenue, reducing revenue derived from financial margins (which are subject to default risks) and increasing revenue derived from fees (which are not subject to default risks).
Another relevant change is the decrease in banking spreads. The Brazilian government, through the state-owned banks, induced a reduction in interest rates available on certain products to foster credit demand, which led the private-owned banks to compress their spreads to remain competitive.
As a result of the above mentioned changes, there was a significant increase of interest of the banks in efficiency improvement, aiming to offset, at least partially, losses resulting from the change in product mix and the decrease in credit spreads.
Public Sector
Despite the privatizations and consolidations in the banking industry, the Brazilian government still controls commercial banks at state and federal levels. In addition to its significant role as a credit supplier (with a 51% market share) and a deposit taker (with a 48% market share), the state-owned banks also act as regional development agencies, with a strong position in markets like housing and rural credit.
The three main financial institutions controlled by the federal government are:
|
|
·
|
Banco do Brasil, a full service bank that offers a wide range of products to the public and private sectors. It is the main financial agent of the Brazilian government;
|
|
|
·
|
Caixa Econômica Federal, a full service bank, mainly involved in deposit taking, housing credit and urban infrastructure development; and
|
|
|
·
|
Banco Nacional do Desenvolvimento (BNDES), an investment bank that offers credit lines of medium and long-term financing at competitive interest rates to the private sector, especially the industrial sector. It operates with direct or indirect financing, through the transfer of resources to other state or private-owned financial institutions.
|
Private Sector
Following the movements involving the country’s largest private banks, we consider two financial institutions to be our main competitors: Bradesco and Itaú Unibanco. Both have established brands and distribution capacity throughout the country, competing in every category of banking activity. Furthermore, we also face competition from local and regional banks that operate with commercial banking products in specific niches. In the GB&M segment, our competitors are global financial institutions focused on investment bank services, which fill this role as a result of their experience in complex and structured operations, as well as their distribution network throughout Europe, North America and Asia.
Market Share
The following table shows the market share of the four leading financial institutions in Brazil in 2013.
|
Santander Brasil
|
Bradesco
|
Itaú Unibanco
|
Banco do Brasil
|
|||||||||||||
|
(In percentage)
|
||||||||||||||||
|
Total Assets(1)
|
8.2 | 11.2 | 16.1 | 17.8 | ||||||||||||
|
Total Lending(2)
|
8.4 | 11.9 | 15.2 | 23.0 | ||||||||||||
|
Total Deposits(2)
|
8.0 | 13.3 | 16.3 | 28.4 | ||||||||||||
|
Demand Deposits(2)
|
7.1 | 18.5 | 19.6 | 34.6 | ||||||||||||
|
Savings Accounts(2)
|
5.9 | 14.2 | 17.7 | 24.8 | ||||||||||||
|
Time Deposits(2)
|
9.6 | 11.3 | 13.8 | 29.2 | ||||||||||||
|
Mutual Funds(3)
|
6.1 | 18.1 | 16.6 | 20.9 | ||||||||||||
|
Retail(3)
|
11.7 | 10.0 | 20.4 | 23.7 | ||||||||||||
|
(1)
|
According to the Brazilian Central Bank’s report of the 50 largest banks in Brazil in accordance with Brazilian GAAP (December 2013).
|
|
(2)
|
According to the Brazilian Central Bank, reported and presented in accordance with Brazilian GAAP (December 2013).
|
|
(3)
|
According to ANBIMA (December 2013).
|
Credit Market in Brazil
There has been a steady increase in credit penetration in Brazil since 2002, but it is still at a level below that of other developed and emerging markets. However, after a decade where the credit penetration more than doubled compared to the GDP, the pace of growth slowed in 2013.
Total Credit as a percentage of GDP*
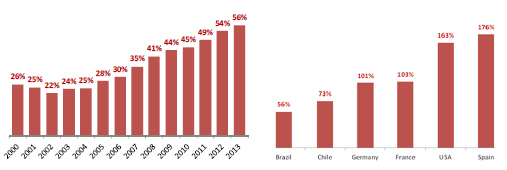
|
* Data from 2010 for all countries, except Brazil (2013).
|
|
Source: Brazilian Central Bank and IBGE
|
The Brazilian credit market is based on two types of loans:
|
|
·
|
mandatory or earmarked credit, which is subject to government controlled interest rates and follows rules for funding and destination defined by law.
|
|
|
·
|
market-based credit, which is not subject to any constraints regarding interest rates, funding or resource allocation.
|
By the end of December 2013, 55.5% of the R$2,715 billion of total credit outstanding in Brazil was market-based credit, of which 49.4% was loans to individuals and 50.6%, corporate loans.
|
2013
|
2012
|
2011
|
||||||||||
|
(in billions of Reais)
|
||||||||||||
|
Total Credit Outstanding
|
2,715 | 2,368 | 2,034 | |||||||||
|
Earmarked Credit
|
1,207 | 969 | 802 | |||||||||
|
Market-Based Credit
|
1,508 | 1,399 | 1,232 | |||||||||
|
Corporate
|
763 | 707 | 604 | |||||||||
|
Individuals
|
745 | 692 | 628 | |||||||||
|
Source: Brazilian Central Bank
|
Retail Credit
According to the Brazilian Central Bank, the total outstanding market-based credit for individuals increased at an average annual compounded rate (CAGR) of 12.4% between April 2011 and December 2013, reaching R$1,508.1 billion or 55.5% of all the loans in Brazil.
The following table shows the evolution of the main retail credit products offered to individuals:
|
2013
|
2012
|
2011
|
Change between December 31, 2013 vs. December 31, 2012
|
|||||||||||||
|
(in billions of R$, except percentages)
|
||||||||||||||||
|
Overdraft Accounts
|
20.2 | 18.3 | 17.6 | 10.2 | % | |||||||||||
|
Payroll Loans
|
221.8 | 188.9 | 159.3 | 17.5 | % | |||||||||||
|
Personal Credit
|
97.6 | 90.2 | 79.5 | 8.2 | % | |||||||||||
|
Credit Card
|
36.1 | 34.2 | 33.0 | 5.6 | % | |||||||||||
|
Consumer Goods (except Auto)
|
11.6 | 10.5 | 9.4 | 9.1 | % | |||||||||||
|
Autos
|
192.8 | 193.2 | 177.7 | (0.2 | %) | |||||||||||
|
Leasing
|
7.9 | 17.9 | 35.0 | (55.9 | %) | |||||||||||
|
Mortgage Financing (only individuals)
|
341.5 | 255.4 | 189.4 | 33.7 | % | |||||||||||
|
Others
|
322.0 | 267.2 | 220.2 | 20.5 | % | |||||||||||
|
Total
|
1,251.3 | 1,075.8 | 921.1 | 16.3 | % | |||||||||||
|
Source: Brazilian Central Bank
|
Historically, the costs of market-based loans in Brazil have always been high, due to the lack of competition and high default rates. A safer and more attractive market-based loan for individuals is the payroll loan. As its payments are deducted directly from the borrower’s paycheck, it is considerably less risky and, therefore, has lower interest rates than unsecured consumer credit, and grew 18.1% in 2013. As of December 31, 2013, payroll loans represent approximately 30% of the retail credit market in Brazil. Except with respect to the Brazilian Social Security Institute, which holds 11.5% of the payroll loans business, no single entity holds more than 10% of the revenues from this product. As of December 31, 2013, we had 5.9% of the market share in payroll loans, according to the Brazilian Central Bank.
The auto financing market has very competitive interest rates and the access to a low-cost source of funding is an important advantage. Thus, this market has been dominated by the large retail banks, which gradually assumed the business from the automakers’ lending arms. As this product is secured by the asset being financed, it tends to have lower default rates than other market-based products. However, in 2012, the default rate of auto financing increased considerably because of an easing of credit standards—basically long term loans and low down payments—leading the main competitors into tighten the conditions for granting new credit, such that this market shrank (4.9%) in 2013. As of December 31, 2013, we had 17% of the market share in vehicle financings, according to the Brazilian Central Bank.
The credit card market has relatively high default rates and, as a result, higher interest rates than other market-based products. This market is dominated by the large retail banks, operating their own labels associated with international labels (such as Visa and MasterCard). In May, 2013, the Brazilian Central Bank began to regulate electronic payment services. It is expected that this supervision will help decrease the risk of electronic transactions and reduce related costs. As of December 31, 2013, we had 12% of the market share in credit cards, according to the Brazilian Central Bank.
The housing and real estate financing market is still developing in Brazil, after a few decades of stagnation. According to the Brazilian Central Bank, the ratio of mortgage loans and GDP went from 5.3% in December 2011 to 8.2% in December 2013. The country’s housing deficit (8.53% in 2012, according to IPEA) is gradually decreasing due to the structural changes in the economy and the government incentives, including:
|
|
·
|
incentives and tax exemptions for civil construction;
|
|
|
·
|
reduction of default risks for contractors through real estate collateralization;
|
|
|
·
|
improved safety for home buyers through a special tax regime, which separates the contractors assets from the construction project’s assets; and
|
|
|
·
|
simplification and increased enforcement of the foreclosure laws.
|
Housing and real estate financing represent approximately 15% of the retail credit market in Brazil according to the Brazilian Central Bank. As of December 31, 2013, our market share was 6%.
Corporate Credit
According to the Brazilian Central Bank, the amount of loans granted to companies has increased at a CAGR of 15.6% between April 2011 and December 2013, reaching R$1,395.1 billion, or 53.5% of the country’s total lending. The main corporate products are the BNDES loans, which represents 17.5% of the country’s total lending, and working capital loans, that represents 14.4%.
In the period of high inflation, the supply of long-term credit lines to Brazilian companies were limited, leading to a low level of corporate leverage in the country. However, according to the Brazilian Central Bank, the amount of corporate credit increased significantly, from R$186.7 million in December 2000 to R$1.4 billion in December 2013, a CAGR of 16.8%.
Asset Management
According to ANBIMA, the asset management industry in Brazil increased at a CAGR of 12.2% between January 2008 and September 2013, reaching R$2,344.6 billion of total assets. Retail funds represent 14.5% of this total, or R$340.1 billion. The largest players of the market are the large financial conglomerates and their main clients are institutional investors, including pension funds, insurance companies and private banking clients.
The constant evolution of the investment fund industry has encouraged market participants to adopt better corporate governance practices and increase transparency in the management of investment funds. Besides, the industry also benefited from macro-economic factors such as:
|
|
·
|
economic stability in Brazil and increased disposable income and savings;
|
|
|
·
|
expansion of the insurance and private pension markets influenced, in part, by the growth of products such as private pension plans, whose assets increased the volume of assets under management of the Brazilian mutual fund industry;
|
|
|
·
|
improved credit ratings of Brazilian issuers; and
|
|
|
·
|
increased access to financial products offered over the internet.
|
REGULATION AND SUPERVISION
The basic institutional framework of the Brazilian financial system was established by Law 4,595, of December 31, 1964, as amended (the “Banking Reform Law”). The Banking Reform Law created the CMN, responsible for establishing the general guidelines of the monetary, foreign currency and credit policies as well as regulating the institutions of the financial system.
Principal Regulatory Agencies
CMN
The CMN oversees the Brazilian monetary, credit, budgetary, fiscal and public debt policies. The CMN is formed by the president of the Brazilian Central Bank, the Minister of Planning and the Minister of Finance and is chaired by the Minister of Finance. Pursuant to the Banking Reform Law, the CMN is authorized to regulate the credit operations of the Brazilian financial institutions, to regulate the Brazilian currency, to supervise Brazil’s reserves of gold and foreign exchange, to determine Brazilian savings and investment policies and to regulate the Brazilian capital markets with the purpose of promoting the economic and social development of Brazil. In this regard, the CMN also oversees the activities of the Brazilian Central Bank and the CVM.
Brazilian Central Bank
The Brazilian Central Bank is responsible for implementation of the CMN policies related to foreign currency and credit control, regulation of the Brazilian financial institutions, including as regards the minimum capital and compulsory deposit requirements, disclosure of the transactions carried out by financial institutions, as well as their financial information and monitoring and regulation of foreign investments in Brazil. The Brazilian Central Bank has committees to address specific issues, among which one highlights the Monetary Policy Committee (Copom) having the purpose of adopting measures to fulfill the inflation targets defined by the CMN and establish the monetary policy guidelines. The activity of the Copom in the control of inflation targets includes the definition of the target for the Selic Rate (the average rate for daily financing, backed by federal instruments, as assessed under the Special Settlement and Custody System) and publication of reports on the Brazilian economic and financial environment and projections for the inflation rate.
CVM
The CVM is responsible for implementation of the policies established by the CMN related to securities, with the purpose of regulating, developing, controlling and inspecting the securities market and its participants (companies with securities traded in the market, investment funds, investors, financial agents, such as custodians of instruments and securities, asset managers, independent auditors, consultants and instruments and securities analysts).
Self-regulating entities
The Brazilian financial and capital markets are also subject to the regulation of self-regulating entities that are divided by field of activity. The self-regulating entities include, among others, the National Association of Investment Banks – ANBIMA, the Brazilian Association of Credit Card and Services Companies – ABECS, the Brazilian Banks Federation – Febraban, the Brazilian Association of Publicly-Held Companies – ABRASCA and the BM&FBOVESPA.
Principal Limitations and Obligations of the Financial Institutions
In line with leading international standards of regulation, Brazilian financial institutions are subject to a series of limitations and obligations. In general such limitations and obligations concern the offering of credit, the concentration of risk, investments, operating procedures, loans and other transactions in foreign currency, the administration of third party funds and micro-credit. The restrictions and requirements for the banking activities established by applicable legislation and regulations include the following:
|
|
·
|
No financial institution may operate in Brazil without the prior approval of the Brazilian Central Bank. In addition, foreign banks must be expressly authorized by a presidential decree to operate in Brazil.
|
|
|
·
|
A financial institution may not hold direct or indirect equity interest in any company located in Brazil or abroad without prior approval of the Brazilian Central Bank. In addition, the corporate purpose of the company in which the financial institutions invest shall be complementary or subsidiary to the activities carried out by the financial institution. The following do not depend on such prior approval: (i) equity interests typically held in the investment portfolios of investment banks, development banks, development agencies (
agências de fomento
) and full-service banks with investment or development portfolios and (ii) temporary equity interests not registered as permanent assets of the financial institution.
|
|
|
·
|
Financial institutions must submit for prior approval by the Brazilian Central Bank the corporate documents that govern their organization and operation, including but not limited to those relative to capital increases, transfer of headquarters, opening, transfer or closing of branches (whether in Brazil or abroad), election of the members of the statutory bodies, as well as any corporate restructuring or alteration in the composition of their equity control.
|
|
|
·
|
Financial institutions must fulfill minimum capital and compulsory deposit requirements, as well as observe certain operational limits.
|
|
|
·
|
A financial institution may not own real estate, except for properties it occupies and subject to certain limitations imposed by the CMN. If a financial institution receives real estate, for example, in satisfaction of a debt, such property must be sold within one year, unless if otherwise authorized by the Brazilian Central Bank.
|
|
|
·
|
Financial institutions must comply with the principles of selectivity, guarantee, liquidity and risk diversification.
|
|
|
·
|
A financial institution cannot lend more than 25% of its shareholder’s equity to a single person or group.
|
|
|
·
|
A financial institution cannot grant loans or advances to companies in which it participates with more than 10% of latter’s capital, to companies that it controls directly or indirectly, that are subject to common control of the financial institution in question or to individuals or companies which participate with more than 10% of the financial institution’s capital. Also, loans or advances may not be granted to the executive officers, members of the board of directors and of the fiscal council and to certain members of the families of such individuals, as well as to companies in which said individuals hold an interest of more than 10%.
|
|
|
·
|
The activities of management of third party assets must be segregated from other activities and must observe the regulations issued by the CVM.
|
|
|
·
|
The total amount of the funds applied in permanent assets of the financial institutions cannot exceed 50% of their adjusted stockholders’ equity.
|
|
|
·
|
Financial institutions must comply with anti-money laundering and anti-corruption regulation.
|
|
|
·
|
Financial institutions must implement policies and internal procedures to control their systems of financial, operating and management information, as well as their conformity to all of the applicable regulations.
|
|
|
·
|
Financial institutions must implement a policy for remuneration of board members and executive officers that is compatible with their risk management policies. At least 50% of the variable remuneration must be paid in stock or instruments based on stock, and at least 40% of the variable remuneration must be deferred for payment at least 3 years in the future.
|
|
|
·
|
The Law of Banking Reform and specific regulations enacted by the CMN provides on imposition of penalties to financial institutions in certain situations where there has not been observance of the applicable requirements, controls and requisites. In addition, the Brazilian Central Bank may cancel the financial institution’s authorization to operate if the Brazilian Central Bank identifies at any time, in relation to a given financial institution: (1) habitual non-performance of the transactions considered to be essential for financial institutions, (2) operational inactivity, (3) non-establishment at the address informed to the Brazilian Central Bank, (4) non-remittance to the Brazilian Central Bank for a period of more than four months, without acceptable justification, of the consolidated financial statements required by the applicable
|
|
|
|
regulations, and (5) non-accomplishment of the business plan. The cancellation of an authorization for operation of a financial institution may only occur upon the establishment and processing of the appropriate administrative proceeding by the Brazilian Central Bank.
|
Additionally, being part of Santander Group and due to the global nature of our organization, we are subject to related international rules.
Capital Adequacy and Leverage – Basel
Current Requirements
The Brazilian Central Bank supervises the Brazilian banking system in accordance with the Basel Committee on Banking Supervision (“Basel Committee”) guidelines and other applicable regulations, including the Basel II Accord (“Basel II”), which was implemented in Brazil in the last years, and the Basel III Accord (“Basel III”), which supplements and amends Basel II and is in the process of being implemented. For this purpose, banks provide the Brazilian Central Bank with the information necessary for it to perform its supervisory functions, which include supervising the movements in the solvency and the capital adequacy of banks.
The main principle that guides the directives set forth in the Basel II and Basel III is that a bank’s own resources must cover its principal risks, including credit risk, market risk and operational risk.
Brazilian financial institutions are subject to capital measurement and standards based on a weighted risk-asset ratio. The parameters of this methodology resemble the international framework for minimum capital measurements adopted by Basel II, except for certain differences (for instance, Basel II requires banks to have a capital to risk-weighted assets ratio of at least 8.0%, while Brazilian current rules require minimum capital of 11.0% of risk weighted assets). Brazilian financial institutions’ regulatory capital is composed of two tiers. Tier I capital is represented by stockholders’ equity plus certain reserves, earned income and hybrid debt and capital instruments authorized by the Brazilian Central Bank. Tier II capital is represented by revaluation reserves, contingency reserves, special profit reserves related to mandatory dividends not yet distributed, preferred cumulative stock, certain subordinated debt and hybrid instruments and non-realized earnings related to available-for-sale securities market value adjustments.
Basel III
On December 16, 2010, the Basel Committee issued the Basel III framework which supplements and amends Basel II. Basel III includes higher minimum capital requirements and new conservation and countercyclical buffers capital requirements, revised risk-based capital measures, and the introduction of a new leverage ratio and two liquidity standards. As it occurred with other Basel directives, the Basel III will not be self-effectuating, but will be implemented gradually by each country through legislation or regulation to be imposed upon that country’s home banks. Basel III is currently being implemented in Brazil and its implementation is expected to conclude on January 1, 2022, according to the agreed international timeframe.
The Tier I capital will have to reach a minimum index of 6.0% floor, (according to the schedule established by the Brazilian Central Bank), divided into two portions: (1) Principal Capital consisting mainly of corporate capital and profit reserves (shares, units of ownership, reserves and earned income) of at least 4.5%, and (2) Supplementary Capital (certain reserves, revenue earned and hybrid securities and instruments capital authorized by the Brazilian Central Bank). To improve the quality of the capital of financial institutions, Basel III restricts the acceptance of financial instruments that fail to demonstrate effective capability of absorbing losses and requires the reduction of assets that in certain situations could jeopardize the financial institution’s capital value due to their low liquidity, dependence on future profits for realization or difficulty of value measurement.
Current hybrid instruments and subordinated debt approved by the Brazilian Central Bank as additional capital or Tier II are expected to be maintained if they also comply with requirements introduced by the Basel III, including the mandatory conversion clauses into equity or write-off upon the occurrence of triggering events provided for in the regulations. The instruments that do not comply with Basel III rules shall be gradually reduced until January 2022.
In accordance with the Basel III standards, the Brazilian Central Bank created the Premium Principal Capital, which corresponds to the following additional capitals (buffers): (1) conservative (fixed) capital to assist in the
absorption of losses; and (2) countercyclical (variable) capital, to deal with the risks of the macro-economic environment. The conservative and countercyclical capital creates additional capital reserves to be used in periods of stress. After a period of transition, the Brazilian Central Bank will determine the exact percentage of the Premium Principal Capital required, which may vary from 2.5% to 5% of the weighted risk-asset ratio. The Basel minimum capital index will increase from the current 11% to a maximum of 13%. The total index will be calculated by the sum of two parts: the Regulatory Capital and the Premium Principal Capital (consisting of the conservative capital and the countercyclical capital).
The Basel III rules also provide for the implementation of a leverage ratio calculated by the division of the Tier I capital by a bank’s total exposure. In addition, the new rules establish liquidity ratios of short and long term which shall control the cash position of banks (for example, obligation to maintain liquid assets for stress scenarios of the financial system for 30 days and funding with solid and stable capital).The following table presents an estimate of the implementation schedule of the main changes related to capital adequacy and leverage expected as a result of Basel III, as established by the Brazilian Central Bank:
|
Parameters
|
2013
|
2014
|
2015
|
2016
|
2017
|
2018
|
As from 2019
|
|||||||||||||||||||||
|
Common Equity
|
4.5 | % | 4.5 | % | 4.5 | % | 4.5 | % | 4.5 | % | 4.5 | % | 4.5 | % | ||||||||||||||
|
Tier I
|
5.5 | % | 5.5 | % | 6.0 | % | 6.0 | % | 6.0 | % | 6.0 | % | 6.0 | % | ||||||||||||||
|
Regulatory Capital
|
11.0 | % | 11.0 | % | 11.0 | % | 9.9 | % | 9.3 | % | 8.6 | % | 8.0 | % | ||||||||||||||
|
Conservative Capital
|
— | — | — | 0.6 | % | 1.3 | % | 1.9 | % | 2.5 | % | |||||||||||||||||
|
Countercyclical Capital
|
— |
up to 0.6
|
% |
up to 1.3
|
% |
up to 1.9
|
% |
up to 2.5
|
% |
up to 2.5
|
% |
up to 2.5
|
% | |||||||||||||||
In addition, in order to enable the implementation of the Basel III framework in Brazil certain legislative changes were made. Among others, Law No 12,838 enacted on July 9, 2013 granted powers to the Brazilian Central Bank to limit the payment of dividends by financial institutions in case of non-compliance with the prudential capital requirements defined by the National Monetary Council.
Consolidated Enterprise Level (conglomerado prudencial)
As from January 2014, financial institutions must submit to the Brazilian Central Bank, with monthly and semi-annual periodicity, consolidated financial statements based on the “consolidated enterprise level” (
conglomerado prudencial
) of which the financial institution is a member, which serve as the base for calculation of the requisites of regulating capital of the Brazilian institutions. The concept of “consolidated enterprise level” (
conglomerado prudencial
) includes the data relative to the financial institutions and other institutions authorized to operate by the Brazilian Central Bank, administrators of consortia, payment institutions and credit factoring companies, including real estate credit, or of credit rights, as for example mercantile foment companies, securitization companies and specific purpose companies, located in Brazil or abroad, as well as other legal entities headquartered in Brazil that have as their exclusive business purpose the equity participation in the mentioned entities.
Compulsory Reserve Requirements
Currently, the Brazilian Central Bank imposes a series of compulsory reserves requirements. Financial institutions must deposit these reserves with the Brazilian Central Bank. BACEN uses such reserve requirements as a mechanism to control the liquidity of the Brazilian financial system. Reserves imposed on time deposits, demand deposits and saving accounts represent almost the entirety of the amount that must be deposited at the Brazilian Central Bank.
Time Deposits (CDBs).
The Brazilian Central Bank imposes a reserve requirement of 20.0% in relation to time deposits. Financial institutions must deposit an amount equivalent to the surplus of (1) R$3 billion for financial institutions with consolidated Tier 1 capital under R$2 billion; (2) R$2 billion for financial institutions with consolidated Tier 1 capital between R$2 billion and R$5 billion; (3) R$1 billion for financial institutions with consolidated Tier 1 capital between R$5 billion and R$15 billion; and (4) zero for financial institutions with Regulatory Capital higher than R$15 billion.
Demand Deposits.
As a general rule the Brazilian Central Bank imposes a reserve requirement of 45% in relation to demand deposits.
Savings Deposits.
The Brazilian Central Bank imposes reserve requirement of 15% in relation to savings deposits. In addition, a minimum of 65.0% of the total amount of deposits in savings accounts must be used to finance the housing sector.
Additional Deposit Requirements.
The Brazilian Central Bank also stipulates an additional reserve requirement on deposits raised by full service banks, investment banks, commercial banks, development banks, finance, credit and investment companies, real estate credit companies and savings and loan associations. These institutions are required to deposit on a weekly basis the total sum of the following amounts: (1) 11% of the mathematical average of funds from time deposits and other specific amount subject to the reserve requirement; and (2) 10% of the mathematical average of funds from savings accounts subject to the reserve requirement. These amounts must be discounted by: (1) R$3 billion for financial institutions with consolidated Tier 1 capital under R$2 billion; (2) R$2 billion for financial institutions with consolidated Tier 1 capital between R$2 billion and R$5 billion; (3) R$1 billion for financial institutions with consolidated Tier 1 capital between R$5 billion and R$15 billion, and (4) zero for financial institutions with Regulatory Capital higher than R$15 billion. At the close of each day, the balance of such account should be equivalent to 100% of the additional reserve requirement.
Asset Composition Requirements
Permanent assets (defined as property and equipment other than commercial leasing operations, unconsolidated investments and deferred charges) of Brazilian financial institutions may not exceed 50% of their adjusted net equity, calculated in accordance with the criteria established by the Brazilian Central Bank.
The Brazilian financial institutions may not have more than 25.0% of their Regulatory Capital allocated to credit and leasing transactions and guarantees extended to the same customer or group of customers acting jointly or representing the same economic interest. In addition, the Brazilian financial institutions must comply with an exposure limit of 25.0% of their Regulatory Capital in connection with underwriting for or investments in securities of the same entity, its affiliates, controlled or controlling companies. Repurchase transactions executed in Brazil are subject to operational capital limits based on the financial institution’s Regulatory Capital, as adjusted in accordance with Brazilian Central Bank regulations. A financial institution may carry out repurchase transactions in an amount of up to thirty times its Regulatory Capital. Within that limit, repurchase transactions involving private securities may not exceed five times the Regulatory Capital. Limits on repurchase transactions involving securities backed by Brazilian governmental authorities vary in accordance with the type of security involved in the transaction and the perceived risk of the issuer as established by the Brazilian Central Bank.
The regulation issued by the Brazilian Central Bank as regards the classification and valuation of securities and derivative financial instruments—including government securities—owned by financial institutions, based on the investment strategy of the financial institution, determined that securities and derivatives are to be classified into three categories: (1) trading; (2) available for sale; and (3) held to maturity.
“Trading” and “available for sale” securities are to be marked-to-market with effects in income and stockholders’ equity, respectively. Securities classified as “held to maturity” are recorded at amortized cost. Derivatives are marked-to-market and recorded as assets and liabilities in the balance sheet. Changes in the market value of the derivatives are generally recognized in income with certain modifications, if these are designated as hedges and qualify for hedge accounting under the regulations issued by the Brazilian Central Bank. Securities and derivatives in the “held to maturity” portfolio may be hedged for accounting purposes, but their increase or decrease in value derived from the marked-to-market accounting method should not be taken into account.
Brazilian Payment and Settlement System
The rules for the settlement of payments in Brazil are based on the guidelines adopted by the Bank of International Settlements, or “BIS,” and the current Brazilian Payment and Settlement System (
Sistema Brasileiro de Pagamentos e Compensação
, the “SPB”) that began operating in April 2002. The Brazilian Central Bank and CVM (in respect of transactions with securities) have the power to regulate and supervise this system. Pursuant to these rules, all clearinghouses are required to adopt procedures designed to reduce the possibility of systemic crises and to reduce the risks previously borne by the Brazilian Central Bank. The most important principles of SPB are:
|
|
·
|
the existence of two main payment and settlement systems: real time gross settlements, using the reserves deposited with the Brazilian Central Bank; and deferred net settlements, through the clearinghouses;
|
|
|
·
|
the clearinghouses, with some exceptions, will be liable for the payment orders they accept; and
|
|
|
·
|
bankruptcy laws do not affect the payment orders made through the credits of clearinghouses nor the collateral granted to secure those orders. However, clearinghouses have ordinary credits against any participant under bankruptcy laws.
|
Treatment of Overdue Debts
The Brazilian Central Bank requires financial institutions to classify credit transactions in accordance with their level of credit risk and make provisions according to the level attributed to each transaction. Such credit classifications shall be determined in accordance with criteria set forth from time to time by the Brazilian Central Bank, relating to the condition of the debtor and the guarantor and the transaction terms. Where there are several credit transactions involving the same customer, economic group or group of companies, the credit risk must be determined by analyzing the particular credit transaction of such customer or group which represents the greatest credit risk to the financial institution.
Credit transactions of up to R$50 thousand may be classified either by the financial institution’s own evaluation method or according to the number of days such transaction is past due, whichever is the more stringent. Credit classifications are required to be reviewed (i) monthly, in the event of a delay in the payment of any installment of principal or interest, in accordance with the maximum risk classifications; (ii) every six months, in the case of transactions involving the same customer, economic group or group of companies, the amount of which exceeds 5% of the adjusted net worth of the financial institution in question; and (iii) once every twelve months, in all circumstances, except in the case of credit transactions with a customer whose total liability is lower than R$50 thousand, the classification of which may be reviewed as provided above. Such R$50 thousand limit may be amended by the Brazilian Central Bank from time to time.
The provisions set forth above are not applicable to our IFRS consolidated financial statements, which are based on the criteria described under “Item 5. Operating and Financial Review and Prospects—A. Operating Results—Critical Accounting Policies—Impairment Losses on Financial Assets.”
Credit Performance Information – Positive Registration
Brazilian law regulates databases containing credit performance information of individuals and legal entities. Dissemination of information from these databases is subject to the express request or authorization of the institution’s clients.
Stockholders’ Rules about the Collection of Bank Fees
The collection of bank fees and commissions is extensively regulated by the rules that seek standardization of the collection of bank fees and the cost of credit transactions for individuals. According to these rules, bank services to individuals are divided into the following four groups: (1) essential services; (2) priority services; (3) special services; and (4) specific or differentiated services. Banks are not able to collect fees in exchange for supplying essential services to individuals with regard to checking accounts, such as (1) supplying a debit card; (2) supplying ten checks per month to accountholders who meet the requirements to use checks, as per the applicable rules; (3) supplying a second debit card (except in cases of loss, theft, damage and other reasons not caused by the bank); (4) up to four withdrawals per month, which can be made at a branch of the bank, using checks or in ATM terminals; (5) supplying up to two statements describing the transactions during the month, to be obtained through ATM terminals; (6) inquiries over the internet; (7) up to two transfers of funds between accounts held by the same bank, per month, at a branch, through ATM terminals or over the internet; (8) clearing checks and (9) supplying a consolidated statement describing, on a month-by-month basis, the fees charged over the preceding year with regard to checking accounts and savings accounts.
Certain services rendered to individuals with regard to savings accounts also fall under the category of essential services and, therefore, are exempt from the payment of fees. CMN prohibits banks from charging fees for supplying essential services in connection with deposit and savings accounts where clients agree to access and use their accounts by electronic means only. In the case of these exclusively electronic deposit and savings accounts, banks are only authorized to charge fees for supplying essential services when the client voluntarily elects to obtain personal service at the banks’ branches or client service locations.
Priority services are the ones rendered to individuals with regard to checking accounts, transfers of funds, credit transactions, leasing, standard credit cards, over-the-counter exchange transactions for the purchase or sale of foreign currency in respect of international travel and records and are subject to the collection of fees by the financial institutions only if the service and its nomenclature are listed in its regulations. Commercial banks must also offer to their individual clients a “standardized package” of priority services, whose content is defined, as well as the clients’ option to acquire individual services, instead of adhering to the package.
The collection of fees in exchange for the supply of special services (including, among others, services relating to rural credit, currency exchange market and on-lending of funds from the real estate financial system, for example) are still governed by the specific provisions found in the laws and regulations relating to such services. The regulation authorizes financial institutions to charge fees for the performance of specific services, provided that the account holder or user is informed of the conditions for use and payment or the fee and charging method are defined in the contract. Some of the specific services are (1) approval of signatures; (2) management of investment funds; (3) rental of safe deposit boxes; (4) courier services; (5) custody and brokerage services, (6) endorsement of clients debts (
aval
, or guarantee); and (7) foreign currency exchange, among others.
It is worth pointing out: (1) prohibition of charging fees for amending adhesion contracts, except in the cases of asset replacement in leasing transactions and early liquidation or amortization, cancelation or termination; (2) prohibition of including services related to credit cards and other services not subject to fees in service packages that include priority, special and/or differentiated services; (3) subscription to service packages must be through a separate contract; (4) information given to the customer with respect to a service package must include the value of each service included in the package, the number of times that each service may be utilized per month, and the total price of the package; (5) a customer’s annual banking statement must separately identify default interest, penalties and other costs charged on loans and leasing transactions; (6) registration fees cannot be cumulatively charged; (7) overdraft fees can be charged, at most, once over the course of 30 days.
In addition, CMN regulations establish that all debits related to the collection of fees must be charged to a bank account only if there are sufficient funds to cover such debits in such account thus forbidding overdrafts caused by the collection of banking fees. Furthermore, a minimum of 30 days’ notice must precede any increase or creation of fees (except if related to credit card services, when a minimum of 45 days’ notice is required), while fees related to priority services and the “standardized package” can be increased only after 180 days from the date of the last increase (except if related to credit card services, when a minimum of 365 days’ notice is required) (whereas reductions can take place at any time).
Credit Cards
The banking regulations also have specific rules relative to the charges of credit card fees, as well as publication of information in the card invoices and the obligation of a package of basic services upon offering credit cards to clients. The credit card holders must pay monthly at least 15% of the outstanding credit card balances. This minimum payment does not apply to credit cards with payment by means of direct payroll deductions.
Payment Agents and Payment Arrangements
In 2013 it was established in Brazil a legal and regulatory framework for the payment industry, pursuant to which the CMN and the Brazilian Central Bank now have powers to regulate payment mechanisms, players and transactions.
The regulation issued by the Brazilian Central Bank, which will become effective in May 2014, determines, among other aspects: (1) consumer protection and anti-money laundering compliance and risk prevention systems that should be observed by all supervised entities when dealing with payment agents and payment arrangers; (2) the procedures for incorporation, organization, authorization and operation of payment agents, as well transfer of shareholding control, subject to the Brazilian Central Bank’s prior approval; (3) capital requirements; (4) definition of arrangements excluded from the SPB; and (5) payment accounts, which are divided into prepaid and post-paid accounts and require the allocation of the totality of their balance to a special account at the Brazilian Central Bank or investment in government bonds.
Portability of Credit Transactions
In 2013, the Brazilian Central Bank regulated the possibility of financial institutions’ customers transferring their credit transactions from an institution to another. The regulation that becomes effective in May 2014 establishes specific rules for such transfer, including, among others, the prohibition of the amount and term of the transaction in the financial institution receiving the transaction being higher than the amount due and term of the original transaction. It is authorized, however, the amendment of the interest fee on the transaction.
Anti-Money Laundering Regulations
Brazilian Anti-Money Laundering Law establishes that it is a crime to conceal or dissimulate the nature, origin, location, disposal, movement or ownership of assets, rights or valuables deriving directly or indirectly from a criminal violation, as well as their use in economic or financial activity and the participation in a group, association or office while being aware that its principal or secondary activities is directed towards the practice of such acts.
Brazilian Anti-Money Laundering Law also created the
Conselho de Controle de Atividades Financeiras
(the Council of Control of Financial Activities, or “COAF”), which operates under the Ministry of Finance. The purpose of the COAF is to investigate, examine, identify and impose administrative penalties in respect of, any suspicious or unlawful activities related to money laundering in Brazil. The COAF is composed of a president nominated by the Ministry of Finance and appointed by the President and eight members of the council, one of whom is appointed by each of the following entities: (1) the Brazilian Central Bank; (2) the CVM; (3) the Ministry of Foreign Affairs; (4) the SUSEP; (5) the Brazilian Federal Revenue Service; (6) the Office of the Attorney-General of the National Treasury; (7) the Federal Police Department; and (8) the Federal Intelligence Agency. The term of office of each of the president and the other members of the council is three years.
Brazilian anti-money laundering legislation establishes that financial institutions must, among others:
|
|
·
|
keep up-to-date records regarding their permanent customers (including registration data, statements of purpose and nature of transactions, their financial capacity, as well as the verification of characterization of customers as politically-exposed individuals).
|
|
|
·
|
adopt preventive and internal policies, processes and controls;
|
|
|
·
|
record transactions involving Brazilian and foreign currency, securities, metals or any other asset which may be converted into money, including specific registries of issuances or recharging of prepaid cards;
|
|
|
·
|
keep records of transactions or groups of turnover of funds carried out by individuals or entities belonging to the same group or financial conglomerate in a total amount that exceeds R$10 thousand in a calendar month or which reveal a pattern of activity that suggests a scheme to avoid identification, control and registration;
|
|
|
·
|
review transactions or proposals the features of which may indicate criminal intentions;
|
|
|
·
|
keep records of every transfer of funds related to, among others (a) deposits, wire transfers and checks, and (b) the issuance of checks and payment orders, in amounts that exceed R$1 thousand; and
|
|
|
·
|
notify the pertinent authority within time frames ranging for one business day from a proposed transaction to five business days from the end of the calendar month of any transaction that is considered suspect by the financial institution.
|
The financial institutions must inform COAF in the manner established by the Brazilian Central Bank, by the day following the date on which any of the following transactions, proposed or carried out, were verified:
|
|
·
|
transactions carried out or services provided, which amount equals or is greater than R$10 thousand and that, considering the parties involved, the amounts, the forms of execution, the instrument used or the lack of economic or legal bases, could characterize the existence of evidence of the crimes provided for in the Brazilian Anti-Money Laundering Law;
|
|
|
·
|
the transactions carried out or the services rendered that, based on their frequency, amount or form, could be aimed at deceiving the identification, control and record mechanisms;
|
|
|
·
|
the transactions carried out by or the services rendered to, regardless of their amount, the persons that recognizably have perpetrated or attempted to perpetrate terrorist acts or participated in them or facilitated their practice, as well as the existence of funds that belong to or are directly or indirectly controlled by them or by entities that belong or are directly or indirectly controlled by such persons, as well as by persons and entities acting on their behalf or under their orders; and
|
|
|
·
|
any acts that are believed to be financing terrorism.
|
These communications must be made without providing knowledge thereof to the parties involved.
The records referred to above must be kept for five to ten years, depending on the nature of the information, from the end of the relationship with the customer.
Failure to comply with any of the obligations indicated above may subject the financial institution and its officers and directors to penalties that range from fines (not above 200% of the transaction amount or the real profit obtained or that would be obtained by carrying out the transaction or the amount of R$20 million) to the declaration of its officers and directors as ineligible to exercise any position at a financial institution and/or the cancellation of the financial institution’s operating license.
Government and auditors from the Brazilian Federal Revenue Service may also inspect an institution’s documents, books and financial registry in certain circumstances.
The financial institutions must also maintain specific records of the transactions in cash (deposit, withdrawal, withdrawal by means of a prepaid card or request of provision for withdrawal) so as to enable the identification of a deposit in cash, withdrawal in cash, withdrawal in cash by means of a prepaid card, or request of provision for withdrawal, of an amount equal to or greater than R$100 thousand or that presents evidence of concealment or dissimulation of the nature, of the origin, of the location, of the disposal, of the movement or of the ownership of assets, rights and valuables, as well as issuance of banker’s checks, TED (Readily Available Electronic Transfer) or of any other instrument of transfer of funds upon payment in cash, for an amount equal to or greater than R$100 thousand.
Politically Exposed Individuals
Financial institutions and other institutions authorized to operate by the Brazilian Central Bank must take certain actions and have certain controls to establish business relationships with and to follow up financial transaction of customers who are deemed to be politically exposed individuals. The internal procedures developed and implemented by such financial institutions must be structured in such a way as to enable the identification of politically exposed individuals, as well as the origin of the funds involved in the transactions of such customers. One option is to verify the compatibility between the customer’s transactions and the net worth stated in such customer’s file.
Politically exposed individuals are public agents and their immediate family members, spouses, life partners and stepchildren who occupy or have occupied a relevant public office or position over the past five years in Brazil or other countries, territories and foreign jurisdictions.
Bank Secrecy
Brazilian financial institutions shall also maintain the secrecy of their banking operations and services provided to their customers. The only circumstances in which information about customers, services or transactions of Brazilian financial institutions or credit card companies may be disclosed to third parties are the following:
|
|
·
|
the disclosure of information with the express consent of the interested parties;
|
|
|
·
|
the exchange of information between financial institutions for record purposes;
|
|
|
·
|
the supply to credit reference agencies of information based on data from the records of issuers of bank checks drawn on accounts without sufficient funds and defaulting debtors; and
|
|
|
·
|
as to the occurrence or suspicion that criminal or administrative illegal acts have been performed, in which case the financial institutions and the credit card companies may provide the pertinent authorities with information relating to such criminal acts when necessary for the investigation of such acts.
|
Complementary Law 105/01 also allows the Brazilian Central Bank or the CVM to exchange information with foreign governmental authorities, provided that a specific treaty has previously been executed.
Auditing Requirements
The legislation and regulations issued by the CMN, CVM and BM&FBOVESPA determine that the periodic financial statements of financial institutions be audited by independent auditors (individuals or legal entities) registered with CVM and who meet the minimum requirements set forth by the Brazilian Central Bank, as well as that they must be presented together with an independent auditor’s report.
As result of the auditing work, the independent auditor must prepare the following reports: (1) audit report, issuing an opinion regarding the accounting statements and the respective explanatory notes, including regarding the compliance with financial regulations issued by the CMN and the Brazilian Central Bank; (2) internal control system quality and adequacy evaluation report, including regarding electronic data processing and risk management systems, evidencing any identified deficiencies; (3) legal and regulatory provisions noncompliance report, regarding those which have, or may have, material impacts on the financial statements or on the audited financial institution’s operations; (4) limited assurance report, analyzing Santander Brasil’s Annual and Sustainability Report pursuant to the guidelines and requirements of
Global Reporting Initiative
(GRI); and (5) any other reports required by the Brazilian Central Bank, CVM and BM&FBovespa. The reports issued by independent auditors must be available for consultation upon request by the overseeing authorities.
Independent auditors and the fiscal council when established, individually or jointly, must formally notify the Brazilian Central Bank of the existence or evidence of error or fraud, within three business days of the identification of the respective occurrence, including:
|
|
·
|
non-compliance with legal rules and regulations that place the continuity of the audited entity at risk;
|
|
|
·
|
frauds of any amount perpetrated by the management of the institution;
|
|
|
·
|
material frauds perpetrated by the institution’s employees or third parties; and
|
|
|
·
|
errors that result in major incorrectness in the financial statements of the audited entity.
|
The executive office of the financial institution must inform the independent auditor and the fiscal council, when established, if any of the above situations occur.
CMN Regulation also requires financial institutions and certain other entities holding regulatory capital equal to or greater than R$1 billion to create a corporate body designated as “audit committee.”
To obtain more information concerning the audit committee, see “Item 6. Directors, Senior Management Board Members, Executive Board and Employees—C. Board Practices—of the Board Advisory of Directors—Committees—Audit for Advisory to the Board of Directors of the Company—Audit Committee.”
Consumer Protection
Relationships between consumers and financial institutions are governed by Law 8078, dated September 11, 1990 (the “Brazilian Consumer Protection Code”), which grants consumers certain rights and sets forth measures to be observed by suppliers, which must by complied with by financial institutions. The Consumer Protection Code sets forth as consumer rights, among others, the assistance/facilitation in the defense of consumer’s rights, including through reverse burden of proof in their favor, and possibility of judicial review of contractual provisions deemed abusive.
Furthermore, banking regulation establishes procedures that financial institutions must observe when contracting any transactions, as well as when rendering services. We may highlight the following as examples of said procedures:
|
|
·
|
to timely provide the necessary information to allow client’s and user’s free choice and decision making process, including rights, duties, responsibilities, costs or advantages, penalties and possible risks when carrying out a transaction or rendering a service;
|
|
|
·
|
to timely provide, to the client or user, agreements, receipts, statements, advices and other documents related to the transactions and services, as well as the possibility of timely cancellation of the agreements;
|
|
|
·
|
formalization of an adequate instrument setting forth the rights and obligations for opening, using and maintaining a post-paid payment account;
|
|
|
·
|
to forward a payment instrument to the client’s or user’s residence or to enable the respective instrument only upon express request or authorization; and
|
|
|
·
|
identification of final users beneficiaries of payments or transfer in statements and bills of the payer, including in situations in which the payment service involves institutions participating in different payment arrangements.
|
Ombudsman
Financial institutions and other entities which are authorized to operate by the Brazilian Central Bank must have an ombudsman office to facilitate communication between the institutions and their customers, and in order to observe consumer defense legislation as well as the improvement of products and customer service. Institutions that are part of a financial group are allowed to establish one ombudsman department to service the whole group. The officer in charge of the ombudsman office must prepare a report every six months and whenever a material event is identified pursuant to the instructions of the Brazilian Central Bank.
Investment Funds Industry Regulation
Investment funds are subject to the regulation and supervision of the CMN and the CVM and, in certain specific matters, the Brazilian Central Bank. Investment funds may be managed by full-service banks, commercial banks, savings banks, investment banks, credit, financing and investment companies and brokerage and dealer companies within certain operational limits.
Investment funds may invest in any type of financial instrument available in the financial and capital markets, including for example, fixed income instruments, stocks, debentures and derivative products, provided that, in addition to the denomination of the fund, a reference to the relevant type of fund is included.
Investment funds may not:
|
|
·
|
have more than 10% of their net worth invested in securities of a single publicly-held issuer that is not a financial institution, its controlling shareholders, subsidiaries and affiliates or of another investment fund; and
|
|
|
·
|
have more than 20% of their net worth invested in securities issued by a financial institution (including the fund manager), its controlling shareholders, subsidiaries and affiliates.
|
Broker-Dealer Regulation
Broker and dealer firms are part of the national financial system and are subject to CMN, Brazilian Central Bank and CVM regulation and supervision. Brokerage firms must be chartered by the Brazilian Central Bank and are the only institutions in Brazil authorized to trade on stock exchanges. Both brokers and dealers may act as underwriters in the public placement of securities and engage in the brokerage of foreign currency in any exchange market.
Broker and dealer firms may not execute operations that may be qualified as the granting of loans to their customers, including the assignment of rights with limited exceptions; collect commissions from their customers related to transactions of securities during the primary distribution; acquire real estate which is not for their own use; or obtain loans from financial institutions, except for (1) loans for the acquisition of goods for use in connection with the firm’s corporate purpose or (2) loans the amount of which does not exceed two times the relevant firm’s net worth.
Foreign Exchange Market
Transactions involving the sale and purchase of foreign currency in Brazil may be conducted only by institutions duly authorized by the Brazilian Central Bank to operate in the foreign exchange market. There is no current limit to long or short positions in foreign currency for banks authorized to carry out transactions on the foreign exchange market. Other institutions within the national financial system are not allowed to have short positions in foreign currency, although there are no limits with respect to foreign exchange long positions.
The Brazilian Central Bank imposes a limit on the net exposure of Brazilian financial institutions and their affiliates for assets and debt subject to foreign currency and gold fluctuation. The limit is currently equivalent to 30.0% of the institution’s adjusted stockholders’ equity.
Penalties for non-compliance with foreign currency position limits range from compulsory sale of foreign currency to revocation of authorization to operate in the foreign exchange market.
On December 16, 2013, the Brazilian Central Bank issued a series of rules that will replace the Regulation of Foreign Exchange and International Capital Market (
Regulamento do Mercado de Câmbio e Capitais Internacionais
, or the “RMCCI”) of the Brazilian Central Bank as of February 3, 2014. These rules are intended to optimize and simplify regulation involving the foreign exchange market, Brazilian capital abroad and foreign capital in Brazil previously contemplated by the RMCCI. The new foreign exchange rules also aim to cover situations that were not contemplated in the prior regulations.
Foreign Investment in Brazilian Financial Institutions
The Brazilian constitution permits foreign individuals or companies to invest in the voting shares of Brazilian financial institutions only if they have specific authorization by the President of Brazil based on national interest or reciprocity. A decree on November 13, 1997, issued in respect of Banco Meridional do Brasil S.A. (our legal predecessor) allows 100% foreign participation in our capital stock. Foreign investors may acquire the shares issued by the Bank as a result of this decree. In addition, foreign investors may acquire publicly traded non-voting shares of Brazilian financial institutions traded on a stock exchange or securities depositary receipts offered abroad representing shares without specific authorization.
In addition, the Brazilian constitution prohibits foreign financial institutions from establishing new branches or subsidiaries in Brazil except when duly authorized by the President of Brazil and by the Brazilian Central Bank. A foreign financial institution duly authorized to operate in Brazil through a branch or a subsidiary is subject to the same rules, regulations and requirements that are applicable to any Brazilian financial institution.
Banking Correspondents
Financial institutions are allowed to provide specific services to clients, including customer services, through other entities. These entities are called “bank correspondents” and the relationship between the financial institution and the bank correspondent is ruled by a specific regulation published by CMN and is subject to the supervision of the Brazilian Central Bank.
Regulation of Branches
Authorization by the Brazilian Central Bank is required for operations of branches or subsidiaries of Brazilian financial institutions, upon the compliance with certain term, capital and equity requirements as well as the submission of an economic and financial feasibility analysis.
The Brazilian Central Bank’s prior authorization is also required in order to: (1) allocate new funds to branches or subsidiaries abroad; (2) subscribe capital increases, directly or indirectly, in subsidiaries abroad; (3) increase
equity participation, directly or indirectly, in subsidiaries abroad; and/or (4) merge or spin off, directly or indirectly, subsidiaries abroad.
The Brazilian Central Bank determines that the financial institutions can install the following establishment in Brazil: (1) branches, (2) teller booths, (3) automatic teller machines, and (4) segregated administrative units, provided that, for items (1) to (3) conformity with requirements of minimum capital and operating limits are necessary.
Cayman Islands Banking Regulation
Banks and trust companies wishing to conduct business from within the Cayman Islands must be licensed by the Cayman Islands Monetary Authority under the Banks and Trust Companies Law (2009 Revision) (the “Banks and Trust Companies Law”), independent if the business is to be actually conducted in the Cayman Islands.
Under the Banks and Trust Companies Law, there are two main categories of banking license: a category “A” license, which permits unrestricted domestic and off-shore banking business, and a category “B” license, which permits principally off-shore banking business. As of December 31, 2011, there were 15 banks holding category “A” licenses and 219 banks holding category “B” licenses. The holder of a category “B” license may have an office in the Cayman Islands and conduct business with other licensees and offshore companies but, except in limited circumstances, may not do banking business locally with the public or residents in the Cayman Islands. We have an unrestricted category “B” license.
There are no specific ratio or liquidity requirements under the Banks and Trust Companies Law, but the Cayman Islands Monetary Authority will expect observance of prudent banking practices, and the Banks and Trust Companies Law imposes a minimum net worth requirement of an amount equal to CI$400 thousand (or, in the case of licensees holding a restricted category “B” or a restricted trust license, CI$20 thousand).
U.S. Banking Regulation - Volcker Rule
On July 21, 2010, the United States enacted the Dodd-Frank Wall Street Reform and Consumer Protection Act (the “Dodd-Frank Act”), which provides a broad framework for significant regulatory changes that extend to almost every area of U.S. financial regulation. Within the Dodd-Frank Act, the Volcker Rule prohibits “banking entities” from engaging in certain forms of proprietary trading or from sponsoring or investing in certain covered funds, in each case subject to certain limited exceptions. The Volcker Rule became effective on July 21, 2012 and on December 10, 2013, U.S. regulators issued final rules implementing the Volcker Rule. The final rules also limit the ability of banking entities and their affiliates to enter into certain transactions with such funds with which they or their affiliates have certain relationships. The final rules contain exclusions and certain exemptions for market-making, hedging, underwriting, trading in U.S. government and agency obligations as well as certain foreign government obligations, trading solely outside the United States, and also permits certain ownership interests in certain types of funds to be retained. The final rules implementing the Volcker Rule extended the period for all banking entities to conform with the Volcker Rule and implement a compliance program until July 21, 2015, and additional extensions are possible. Banking entities such as Banco Santander must bring their activities and investments worldwide into compliance with the requirements of the Volcker Rule by the end of the conformance period. Banco Santander is assessing how the final rules implementing the Volcker Rule will affect its businesses, including Santander Brasil, and is developing and implementing plans to bring affected businesses into compliance.
Antitrust Regulation
According to the Brazilian antitrust law, actions which concentrate market share must be previously submitted to CADE for approval if the following criteria are met: (1) at least one of the groups involved in the deal has posted annual gross revenues or volume of business equal to or over R$750 million, in Brazil, in the year prior to the transaction; and (2) at least another group has posted annual gross revenues or volume of business equal to or over R$75 million, in Brazil, in the year prior to the transaction. Closing of a transaction without CADE’s approval will subject the parties to fines ranging from R$60 thousand to R$60 million.
The Brazilian Central Bank will also examine certain corporate reorganizations and other acts involving two or more financial institutions not only considering their potential effects on the financial system and its stability but also any potential impacts regarding market concentration and competition. Upon approval of the transaction, the Brazilian Central Bank may establish certain restrictions and require that the financial institutions execute an
agreement of market concentration control, pursuant to which the terms and conditions of the sharing of the efficiency gain resulting from the act shall be set forth.
Insolvency Laws Concerning Financial Institutions
Financial institutions are subject to the proceedings established by Law 6,024 of March 13, 1974 (“Law 6024”), which establishes the applicable provisions in the event of intervention or extra-judicial liquidation by the Brazilian Central Bank as well as to bankruptcy proceedings.
Intervention and extra-judicial liquidation occur when the Brazilian Central Bank has determined that the financial institution is in bad financial condition or upon the occurrence of events that may impact the creditors’ situation. Such measures are imposed by the Brazilian Central Bank in order to avoid the bankruptcy of the entity.
Intervention
An intervention can be carried out at the discretion of the Brazilian Central Bank in the following cases:
|
|
·
|
risk to the creditors due to mismanagement;
|
|
|
·
|
consistent violation of Brazilian banking laws or regulations; or
|
|
|
·
|
if the intervention is a feasible alternative to the liquidation of the financial institution.
|
As of the date on which it is ordered, the intervention will automatically suspend the enforceability of the payable obligations; prevent early termination or maturity of any previously contracted obligations; and freeze deposits existing on the date on which the intervention is decreed.
The intervention will cease if interested parties undertake to continue the economic activities of the financial institution, by presenting the necessary guarantees, as determined by the Brazilian Central Bank, when the situation of the entity is regularized as determined by the Brazilian Central Bank; or when extra-judicial liquidation or bankruptcy of the entity is ordered.
Intervention may also be ordered upon the request of a financial institution’s management.
Extra-judicial Liquidation
Extra-judicial liquidation is an administrative proceeding decreed by the Brazilian Central Bank (except that it is not applicable to financial institutions controlled by the Brazilian federal government) and conducted by a liquidator appointed by the Brazilian Central Bank. This extraordinary measure aims at terminating the activities of the affected financial institution, liquidating its assets and paying its liabilities, as in a judicially decreed bankruptcy. The Brazilian Central Bank will extra-judicially liquidate a financial institution if:
|
|
·
|
the institution’s economic or financial situation is at risk, particularly when the institution ceases to meet its obligations as they become due, or upon the occurrence of an event that could indicate a state of insolvency under the rules of the Bankruptcy Law;
|
|
|
·
|
management seriously violates Brazilian banking laws, regulations or rulings;
|
|
|
·
|
the institution suffers a loss which subjects its unprivileged and unsecured creditors to severe risk; and/or
|
|
|
·
|
upon revocation of the authorization to operate, the institution does not initiate ordinary liquidation proceedings within ninety days or, if initiated, the Brazilian Central Bank determines that the pace of the liquidation may harm the institution’s creditors.
|
A request for liquidation procedures can also be filed on reasonable grounds by the officers of the respective financial institution or by the receiver appointed by the Brazilian Central Bank in the receivership procedure.
The decree of extra-judicial liquidation will: (1) suspend the actions or foreclose on rights and interests relating to the estate of the entity being liquidated, while no other actions or executions may be brought during the
liquidation; (2) accelerate the obligations of the entity; and (3) interrupt the statute of limitations with regard to the obligations assumed by the institution.
Extra-judicial liquidation procedures may be terminated:
|
|
·
|
by discretionary decision of the Brazilian Central Bank if the parties involved undertake the administration of the financial institution after having provided the necessary guarantees; or
|
|
|
·
|
when the final accounts of the receiver are delivered and approved and subsequently registered in the relevant public records; or
|
|
|
·
|
when converted into ordinary liquidation; or
|
|
|
·
|
when a financial institution is declared bankrupt.
|
Temporary Special Administration Regime (Regime de Administração Especial Temporária or “RAET”)
In addition to the intervention procedures described above, the Brazilian Central Bank may also establish RAET, under Law 9447, dated March 14, 1997 combined with Law 6024/74, which is a less severe form of the Brazilian Central Bank intervention in private and non-federal public financial institutions that allows institutions to continue to operate normally. The RAET may be ordered in the case of an institution which:
|
|
·
|
continually enters into recurrent operations which are against economic or financial policies set forth in federal law;
|
|
|
·
|
faces a shortage of assets;
|
|
|
·
|
fails to comply with the compulsory reserves rules;
|
|
|
·
|
reveals the existence of hidden liabilities;
|
|
|
·
|
experiences the occurrence of situations that cause receivership pursuant to current legislation;
|
|
|
·
|
has reckless or fraudulent management; or
|
|
|
·
|
carries out activities which call for an intervention.
|
The main objective of a RAET is to assist the recovery of the financial condition of the institution under special administration and thereby avoid intervention and/or liquidation. Therefore, a RAET does not affect the day-to-day business, operations, liabilities or rights of the financial institution, which continues to operate in the ordinary course of business.
There is no minimum term for a RAET, which ceases upon the occurrence of any of the following events: (1) acquisition by the Brazilian federal government of control of the financial institution, (2) corporate restructuring, merger, spin-off, amalgamation or transfer of the controlling interest of the financial institution, (3) decision by the Brazilian Central Bank, or (4) declaration of extra-judicial liquidation of the financial institution.
Bankruptcy Law
The Law No. 11,101 (“Bankruptcy Law”) regulates judicial reorganizations, out-of-court reorganizations and bankruptcy of individuals and corporations since 2005 and applies to financial institutions only with respect to the matters not specifically regulated by the intervention and extra-judicial liquidation regimes described above.
Repayment of Creditors in a Liquidation or Bankruptcy
In the event of extra-judicial liquidation or bankruptcy of a financial institution, creditors are paid pursuant to their priorities and privileges. Pre-petition claims are paid on a ratable basis in the following order: labor credits; secured credits; tax credits; credits with special privileges; credits with general privileges; unsecured credits;
contractual fines and pecuniary penalties for breach of administrative or criminal laws, including those of a tax nature; and subordinated credits.
The current law confers immunity from attachment of compulsory deposits maintained by financial institutions with the Brazilian Central Bank. Such deposits may not be attached in actions by a bank’s general creditors for the repayment of debts as well as requires that the assets of any insolvent bank funded by loans made by foreign banks under trade finance lines be used to repay amounts owing under such lines in preference to those amounts owing to the general creditors of such insolvent bank.
Deposit Insurance - FGC
The purpose of the FGC is to guarantee the payment of funds deposited with financial institutions in case of intervention, liquidation, bankruptcy or insolvency. The FGC is funded by ordinary contributions made by the financial institutions in the amount of up to 0.0125% of the total amount of outstanding balances of the accounts corresponding to guaranteed obligations, and certain special contributions as determined. Delay in performing such contributions is subject to a penalty of 2% over the amount of the contribution.
The total amount of credit in the form of demand deposits, savings deposits, time deposits, deposits maintained in accounts blocked for transactions with checks (for the registration and control of funds relating to the rendering of services of payment of salaries, earnings, pensions), bills of exchange, real estate bills, mortgage bills, real estate credit bills and repurchase and resale agreements which object are instruments issued after March 8, 2012 by a company of the same group due to each customer by a financial institution (or by financial institutions of the same financial group) will be guaranteed by the FGC for up to a maximum of R$70 thousand per customer. When the assets of the FGC reach 2% of the total amounts they guarantee, the CMN may temporarily suspend or reduce the contribution of financial institutions to the FGC. The volume of deposits that financial institutions can accept with the guarantee granted by FGC will be reduced by 20% every year from January 2012 to January 2016, thereby ending such insurance by 2016.
Taxation
Corporate Income Tax (IRPJ) and Social Contribution Tax (CSLL)
The IRPJ is calculated at a rate of 15.0%, plus a surtax of 10.0% and the CSLL is calculated at a rate of 15.0% for financial institutions and 9.0% for companies, after adjustments determined by the tax legislation.
Deferred tax assets and liabilities are computed based on temporary differences between the book basis and tax basis of assets and liabilities, tax losses, and adjustments to fair value of securities and derivatives.
According to the requirements in the current regulations, the expected realization of deferred tax assets is based on projections of future results and a technical study approved by the Directors of Banco Santander.
The changes introduced by Law 11,638/2007 and by Law 11,941/2009 (articles 37 and 38), which modified the criterion for recognizing revenues, costs and expenses computed in the determination of net income, have no effect for purposes of determining the taxable profit for a legal entity which opted for the Transitional Tax Regime (RTT), being used for tax purposes the regulations in effect on December 31, 2007. The tax effects on the adoption of such rules are recorded, for accounting purposes, in the corresponding deferred assets and liabilities.
There is a Provisory Measure enacted in November 2013, pending on approval, which establishes that the Transitional Tax Regime (RTT) is going to finish in 2014 or 2015, depending on the option on each tax payer.
Tax on Services (ISS)
Each of the Municipalities and the Federal District are responsible to define the applicable ISS current rate, which is charged on the service value where the Group has branches or administrative centers. The rates vary from 2.0% to 5.0% and depend on the nature of the service.
PIS and COFINS Tax Rates
PIS and COFINS payable by financial institutions and similar entities, as defined by law, are due at the rate of 0.65% and 4% respectively. They are levied cumulatively on gross revenue billed, understood as the total revenues earned by the legal entity, net of certain expenses, such as funding costs.
The non-financial entities are taxed at the rates of 1.65% and 7.6% of PIS and COFINS respectively, and are subject to non-cumulative incidence, that consists of deduction of certain expenses from the tax base as allowed by law.
Tax on Financial Transactions (IOF)
IOF is a tax levied on credit, currency exchange, insurance and securities transactions and it is imposed on the following transactions and at the following rates:
|
Transaction(1)
|
Maximum Legal Rate
|
Present Rate
|
||
|
Credit extended by financial institutions and non-financial entities
|
1.5%
|
Up to 0.0041% per day for loans contracted by legal entities and 0.0041% per day for individuals. An additional 0.38% rate is applicable.
|
||
|
Transactions relating to securities(2)
|
1.5% per day
|
0.5% per day for certain investment funds
|
||
|
0% on transactions with equity securities and certain debt securities, such as debentures and real estate receivables notes (CRIs)
|
||||
|
1% per day on transactions with fixed income derived from federal, state, or municipal bonds, and fixed income investment funds limited to certain percentages of the income raised from investment
|
||||
|
0% on the assignment of securities to permit the issuance of Depositary Receipts abroad
|
||||
|
Transactions relating to derivatives
|
25.0%
|
0% on the notional value of the adjusted purchase sale or maturity of financial derivative contract in the country that individually result in an increased foreign exchange exposure on a short position
|
||
|
0% on derivative contracts to hedge risks inherent to the price fluctuation of foreign exchange resulting from export contracts signed by an individual or legal entity resident or domiciled in the country
|
||||
|
0% other transactions with derivative contracts not expressly mentioned by the tax law
|
|
Transaction(1)
|
Maximum Legal Rate
|
Present Rate
|
||
|
Insurance transactions entered into by insurance companies
|
25%
|
2.38% for health insurance
|
||
|
0.38% for life insurance
|
||||
|
7.38% for other types of insurance
|
||||
|
Foreign exchange transactions(2)
|
25%
|
0.38% (general rule)
|
||
|
6.38% on credit card transactions as from April 27, 2011
|
||||
|
6.38% on withdrawals abroad using credit or debit cards as from December 28, 2013
|
||||
|
6.38% on purchase of travelers cheque or loading of international prepaid card as from December 28, 2013
|
||||
|
0% for outflow of funds related to loans obtained from abroad (irrespective of the term) and for inflow of funds related to loans obtained from abroad for a period greater than 360 days.
|
||||
|
6% for remittances from abroad related to loans that will remain in Brazil for a period lower than or equal to 360 days.
|
||||
|
0% for interbank transactions
|
||||
|
0% for exchange transactions in connection with the outflow of proceeds from Brazil for the remittance of interest on net equity and dividends to be received by foreign investors
|
||||
|
0% for exchange transactions, including by means of simultaneous foreign exchange transactions, for the inflow of funds by foreign investors in the Brazilian financial and capital markets, except that variable income investments in stock exchanges and share acquisitions as part of an initial public offering, as well as investments in certain private equity funds, are not subject to an IOF rate
|
||||
|
0% for exchange transactions, including by means of simultaneous foreign exchange transactions, for the inflow of funds by foreign investors for purposes of initial or additional margin requirements in connection with transactions in stock exchanges
|
||||
|
0% for exchange transactions for the
|
|
Transaction(1)
|
Maximum Legal Rate
|
Present Rate
|
||
|
outflow of funds invested by foreign investors in the Brazilian financial and capital markets
|
||||
|
0% for exchange transactions for the inflow and outflow of funds invested by foreign investors, including by means of simultaneous foreign exchange transactions, in certificates of deposit of securities, known as Brazilian Depositary Receipts, or “BDRs.”
|
||||
|
0% for simultaneous exchange transactions effected on or after December 1, 2011, for the inflow of funds by foreign investors derived from the conversion of direct investments in Brazil made pursuant to Law 4,131/62 into investments in stock tradable in stock exchanges
|
||||
|
0% for revenues related to the export of goods and services transactions
|
|
(1)
|
The transactions mentioned in the table are for illustration purposes and do not reflect an exhaustive list of transactions subject to the IOF.
|
|
(2)
|
There are some exemptions or specific cases in which the applicable rate is zero.
|
Disclosure pursuant to Section 219 of the Iran threat reduction and Syria human rights act
Pursuant to Section 219 of the Iran Threat Reduction and Syria Human Rights Act of 2012, which added Section 13(r) to the Securities Exchange Act of 1934, as amended (the “Exchange Act”), an issuer is required to disclose in its annual or quarterly reports, as applicable, whether it or any of its affiliates knowingly engaged in certain activities, transactions or dealings relating to Iran or with individuals or entities designated pursuant to certain Executive Orders. Disclosure is generally required even where the activities, transactions or dealings were conducted in compliance with applicable law.
During the period covered by this annual report, neither Santander Brasil nor any of its subsidiaries engaged in any activities or transactions requiring disclosure pursuant to Section 13(r).
The following activities are disclosed in response to Section 13(r) with respect to affiliates of Santander Brasil within the Santander Group. During the period covered by this annual report:
(a) A Santander UK plc (“Santander UK”) customer, an Iranian national resident in the United Kingdom, was designated in September 2013 as acting for or on behalf of the Government of Iran. This accountholder’s current account and credit card with Santander UK were closed in December 2013. No revenue was generated by Santander UK on these products.
(b) In early October 2013, Santander UK opened an account for a Tunisian national, resident in the United Kingdom, who is currently designated by the United States for terrorism. After becoming aware of this customer’s designation, Santander UK exited the relationship later in October 2013. No revenue was generated by Santander UK on these accounts.
(c) Santander UK holds frozen savings and current accounts for three customers resident in the United Kingdom who are currently designated by the United States for terrorism. The accounts held by each customer were
blocked after the customer’s designation and have remained blocked and dormant throughout 2013. No revenue was generated by Santander UK on these accounts.
(d) A UK company maintained two commercial accounts at Santander UK that were used to provide payroll processing services for a United Kingdom entity that is currently designated by the United States under the Iran sanctions regime. The accounts may have been used to provide payroll services to other Iranian clients. Santander UK became aware of this account activity in September 2013 and exited the relationship in January 2014. No revenue was generated by Santander UK on these accounts.
(e) An Iranian national, resident in the United Kingdom, who is currently designated by the United States and the United Kingdom under the Iran sanctions regime held a mortgage with Santander UK that was issued prior to any such designation. No further drawdown has been made (or would be allowed) under this mortgage although we continue to receive repayment installments. In 2013, total revenue in connection with the mortgage was £10,421 while net profits were negligible relative to the overall profits of Santander UK. Santander UK does not intend to enter into any new relationships with this customer, and any disbursements will only be made in accordance with applicable sanctions. The same Iranian national also holds two investment accounts with Santander Asset Management UK Limited, part of the Santander Group. The accounts have remained frozen throughout 2013. The investment returns are being automatically reinvested, and no disbursements have been made to the customer. Total revenue for the Santander Group in connection with the investment accounts was £247 while net profits in 2013 were negligible relative to the overall profits of Santander Spain on a consolidated basis.
In addition, the Santander Group has certain legacy export credits and performance guarantees with Bank Mellat, which are included in the U.S. Department of the Treasury’s Office of Foreign Assets Control’s Specially Designated Nationals and Blocked Persons List. Santander Spain entered into two bilateral credit facilities in February 2000 in an aggregate principal amount of €25.9 million. Both credit facilities matured in 2012. In addition, in 2005 Santander Spain participated in a syndicated credit facility for Bank Mellat of €15.5 million, which matures on July 6, 2015. As of December 31, 2013, the Santander Group was owed €4.3 million under this credit facility.
Bank Mellat has been in default under all of these agreements in recent years and Santander Spain has been and expects to continue to be repaid any amounts due by official export credit agencies, which insure between 95% and 99% of the outstanding amounts under these credit facilities. No additional funds have been extended by Santander Spain under these facilities since they were initially granted.
The Santander Group also has certain legacy performance guarantees for the benefit of Bank Sepah and Bank Mellat (stand-by letters of credit to guarantee the obligations—either under tender documents or under contracting agreements—of contractors who participated in public bids in Iran) that were in place prior to April 27, 2007. However, should any of the contractors default in their obligations under the public bids, the Santander Group would not be able to pay any amounts due to Bank Sepah or Bank Mellat because any such payments would be frozen pursuant to Council Regulation (EU) No. 961/2010.
In the aggregate, all of the transactions described above resulted in approximately €72,000 gross revenues and approximately €123,000 net loss to the Santander Group in 2013, all of which resulted from the performance of export credit agencies rather than any Iranian entity. The Santander Group has undertaken significant steps to withdraw from the Iranian market such as closing its representative office in Iran and ceasing all banking activities therein, including correspondent relationships, deposit taking from Iranian entities and issuing export letters of credit, except for the legacy transactions described above. The Santander Group is not contractually permitted to cancel these arrangements without either (i) paying the guaranteed amount—which payment would be frozen as explained above (in the case of the performance guarantees), or (ii) forfeiting the outstanding amounts due to it (in the case of the export credits). As such, the Santander Group intends to continue to provide the guarantees and hold these assets in accordance with company policy and applicable laws.
SELECTED STATISTICAL INFORMATION
The following information for Santander Brasil is included for analytical purposes and is derived from and should be read in conjunction with the consolidated financial statements contained elsewhere herein as well as “Item 5. Operating and Financial Review and Prospects.”
Average annual balance sheet data has been calculated based upon the average of the monthly balances at 13 dates: at December 31 of the prior year and each of the month-end balances of the 12 subsequent months. Average
income statement and balance sheet data and other related statistical information have been prepared on a consolidated annual basis. We believe that the average data set forth herein accurately reflect in all material respects our financial condition and results of operations at the dates and for the periods specified.
The selected statistical information set forth below includes information at and for the years ended December 31, 2013, 2012, 2011, 2010 and 2009 extracted from the audited financial statements prepared in conformity with IFRS as issued by the IASB. See “Presentation of Financial and Other Information” and “Item 3. Key Information—3A. Selected Financial Data—Average Balance Sheet and Interest Rates.”
The following tables show our average balances and interest rates for each of the periods presented. With respect to the tables below and the tables under “—Changes in Net Interest Income—Volume and Rate Analysis” and “—Assets—Earning Assets—Yield Spread,” (1) we have stated average balances on a gross basis, before netting impairment losses, except for the total average asset figures, which include such netting, and (2) all average data have been calculated using month-end balances, which is not significantly different from having used daily averages. We stop accruing interest on loans once they are more than 60 days past due. All our non-accrual loans are included in the table below under “Other assets.”
|
For the year ended December 31,
|
||||||||||||||||||||||||||||||||||||
|
2013
|
2012
|
2011
|
||||||||||||||||||||||||||||||||||
|
Average Balance
|
Interest
|
Average Rate
|
Average Balance
|
Interest
|
Average Rate
|
Average Balance
|
Interest
|
Average Rate
|
||||||||||||||||||||||||||||
|
(in millions of R$, except percentages)
|
||||||||||||||||||||||||||||||||||||
|
Assets and Interest Income
|
||||||||||||||||||||||||||||||||||||
|
Cash and balances with the Brazilian Central Bank
|
54,966 | 6,797 | 12.4 | % | 57,249 | 5,731 | 10.0 | % | 55,100 | 6,297 | 11.4 | % | ||||||||||||||||||||||||
|
Loans and amounts due from credit institutions
|
34,605 | 751 | 2.2 | % | 25,177 | 1,042 | 4.1 | % | 19,017 | 1,219 | 6.4 | % | ||||||||||||||||||||||||
|
Loans and advances to customers
|
200,060 | 35,737 | 17.9 | % | 187,060 | 38,735 | 20.7 | % | 163,046 | 35,398 | 21.7 | % | ||||||||||||||||||||||||
|
Debt instruments
|
65,699 | 6,529 | 9.9 | % | 61,012 | 6,082 | 10.0 | % | 68,770 | 8,084 | 11.8 | % | ||||||||||||||||||||||||
|
Other interest – earning assets
|
— | 1,403 | 0.0 | — | 1,070 | — | — | 738 | — | |||||||||||||||||||||||||||
|
Total interest – earning assets
|
355,329 | 51,217 | 14.4 | % | 330,498 | 52,661 | 15.9 | % | 305,934 | 51,736 | 16.9 | % | ||||||||||||||||||||||||
|
Equity instruments
|
2,753 | 81 | 3.0 | % | 2,224 | 94 | 4.2 | % | 17,324 | 94 | 0.5 | % | ||||||||||||||||||||||||
|
Investments in associates
|
799 | — | — | 444 | — | — | 402 | — | — | |||||||||||||||||||||||||||
|
Total earning assets
|
358,881 | 51,298 | 14.3 | % | 333,166 | 52,754 | 15.8 | % | 323,660 | 51,830 | 16.0 | % | ||||||||||||||||||||||||
|
Cash and balances with the Brazilian Central Bank
|
3,326 | — | — | 4,793 | — | — | 6,830 | — | — | |||||||||||||||||||||||||||
|
Loans and amounts due from credit institutions
|
2,777 | — | — | 2,792 | — | — | 3,082 | — | — | |||||||||||||||||||||||||||
|
Impairment losses
|
(14,198 | ) | — | — | (12,647 | ) | — | — | (10,359 | ) | — | — | ||||||||||||||||||||||||
|
Other assets
|
48,316 | — | — | 43,383 | — | — | 35,478 | — | — | |||||||||||||||||||||||||||
|
Tangible assets
|
6,227 | — | — | 5,316 | — | — | 4,647 | — | — | |||||||||||||||||||||||||||
|
Intangible assets
|
29,955 | — | — | 31,340 | — | — | 31,450 | — | — | |||||||||||||||||||||||||||
|
Total average assets
|
435,286 | 51,298 | 11.8 | % | 408,143 | 52,754 | 12.9 | % | 394,788 | 51,830 | 13.1 | % | ||||||||||||||||||||||||
|
Liabilities and Interest Expense
|
||||||||||||||||||||||||||||||||||||
|
Deposits from the Brazilian Central Bank and Deposits from credit institutions
|
34,673 | 1,774 | 5.1 | % | 38,421 | 1,585 | 4.1 | % | 41,670 | 2,006 | 4.8 | % | ||||||||||||||||||||||||
|
Customer deposits
|
183,234 | 13,517 | 7.4 | % | 167,863 | 13,494 | 8.0 | % | 161,159 | 16,494 | 10.2 | % | ||||||||||||||||||||||||
|
Marketable debt securities
|
59,711 | 4,355 | 7.3 | % | 47,604 | 3,662 | 7.7 | % | 31,336 | 3,227 | 10.3 | % | ||||||||||||||||||||||||
|
Subordinated debts
|
9,764 | 810 | 8.3 | % | 11,440 | 1,011 | 8.8 | % | 10,288 | 1,213 | 11.8 | % | ||||||||||||||||||||||||
|
Other interest-bearing liabilities
|
— | 2,281 | — | — | 1,217 | — | — | 893 | — | |||||||||||||||||||||||||||
|
Total interest-bearing liabilities
|
287,382 | 22,738 | 7.9 | % | 265,322 | 20,970 | 7.9 | % | 244,446 | 23,834 | 9.8 | % | ||||||||||||||||||||||||
|
Deposits from credit institutions
|
176 | — | — | 197 | — | — | 321 | — | — | |||||||||||||||||||||||||||
|
Customer deposits – demand deposits
|
12,907 | — | — | 11,797 | — | — | 13,648 | — | — | |||||||||||||||||||||||||||
|
Other liabilities
|
53,906 | — | — | 52,906 | — | — | 60,749 | — | — | |||||||||||||||||||||||||||
|
Non-controlling interests
|
266 | — | — | 29 | — | — | 11 | — | — | |||||||||||||||||||||||||||
|
Stockholders’ Equity
|
80,650 | — | — | 77,886 | — | — | 75,606 | — | — | |||||||||||||||||||||||||||
|
Total average liabilities and equity
|
435,286 | 22,738 | 5.2 | % | 408,143 | 20,969 | 5.1 | % | 394,788 | 23,834 | 6.0 | % | ||||||||||||||||||||||||
Changes in Net Interest Income—Volume and Rate Analysis
The following tables present the changes in our net interest income allocated between changes in average volume and changes in average rate for the year ended December 31, 2013, compared to the year ended December 31, 2012, and for the year ended December 31, 2012 compared to the year ended December 31, 2011. We have calculated volume variances based on movements in average balances over the period and rate variance based on changes in interest rates on average interest-earning assets and average interest-bearing liabilities. We have allocated variances caused by changes in both volume and rate to volume. You should read the following tables and the footnotes thereto in light of our observations noted in “—Average Balance Sheet and Interest Rates.”
|
For the years ended 2013/2012
|
For the years ended 2012/2011
|
|||||||||||||||||||||||
|
Increase (decrease) due to changes in
|
||||||||||||||||||||||||
|
Volume
|
Rate
|
Net change
|
Volume
|
Rate
|
Net change
|
|||||||||||||||||||
|
(in millions of R$)
|
||||||||||||||||||||||||
|
Interest and Similar Income
|
||||||||||||||||||||||||
|
Interest-earning assets
|
||||||||||||||||||||||||
|
Cash and balances with the Brazilian Central Bank
|
(236 | ) | 1,302 | 1,065 | 238 | (804 | ) | (566 | ) | |||||||||||||||
|
Loans and amounts due from credit institutions
|
308 | (599 | ) | (291 | ) | 328 | (505 | ) | (177 | ) | ||||||||||||||
|
Loans and advances to customers
|
2,568 | (5,566 | ) | (2,998 | ) | 5,030 | (1,692 | ) | 3,338 | |||||||||||||||
|
Debt instruments
|
(466 | ) | (18 | ) | 447 | (853 | ) | (1,149 | ) | (2,002 | ) | |||||||||||||
|
Other interest-earning assets
|
333 | — | 333 | 332 | — | 332 | ||||||||||||||||||
|
Total interest-earning assets
|
3,438 | (4,882 | ) | (1,443 | ) | 5,076 | (4,151 | ) | 925 | |||||||||||||||
|
Equity Instruments
|
19 | (32 | ) | (12 | ) | (145 | ) | 145 | — | |||||||||||||||
|
Total earning assets
|
3,458 | (4,913 | ) | (1,456 | ) | (4,93 | ) | (4,006 | ) | 925 | ||||||||||||||
|
Interest Expense and Similar Charges
|
||||||||||||||||||||||||
|
Interest-bearing liabilities
|
||||||||||||||||||||||||
|
Deposits from the Brazilian Central Bank and Deposits from credit institutions
|
(165 | ) | 354 | 189 | (149 | ) | (272 | ) | (421 | ) | ||||||||||||||
|
Customer deposits
|
1,182 | (1,159 | ) | 23 | 662 | (3,663 | ) | (3,000 | ) | |||||||||||||||
|
Marketable debt securities
|
892 | (199 | ) | 693 | 1,391 | (955 | ) | 435 | ||||||||||||||||
|
Subordinated liabilities
|
(142 | ) | (59 | ) | (200 | ) | 125 | (328 | ) | (202 | ) | |||||||||||||
|
Other interest-bearing liabilities
|
1,064 | — | 1,064 | 323 | — | 324 | ||||||||||||||||||
|
Total interest-bearing liabilities
|
2,831 | (1,062 | ) | 1,768 | 2,353 | (5,218 | ) | (2,864 | ) | |||||||||||||||
Assets
Earning Assets – Yield Spread
The following table analyzes our average earning assets, interest income and dividends on equity securities and net interest income and shows gross yields, net yields and yield spread for each of the periods indicated. You should read this table and the footnotes thereto in light of our observations noted in “—Average Balance Sheet and Interest Rates.”
|
For the year ended December 31,
|
||||||||||||
|
2013
|
2012
|
2011
|
||||||||||
|
(in millions of R$, except percentages)
|
||||||||||||
|
Average earning assets
|
358,881 | 333,166 | 323,660 | |||||||||
|
Interest and dividends on equity securities(1)
|
51,298 | 52,754 | 51,830 | |||||||||
|
Net interest income
|
28,479 | 31,691 | 27,902 | |||||||||
|
Gross yield(2)
|
14.3 | % | 15.8 | % | 16.0 | % | ||||||
|
Net yield(3)
|
8.0 | % | 9.5 | % | 8.6 | % | ||||||
|
Yield spread(4)
|
6.4 | % | 7.9 | % | 6.3 | % | ||||||
|
(1)
|
Dividends on equity securities include dividends from companies accounted for by the equity method.
|
|
(2)
|
Gross yield is the quotient of interest and dividends on equity securities divided by average earning assets.
|
|
(3)
|
Net yield is the quotient of net interest income divided by average earning assets.
|
|
(4)
|
Yield spread is the difference between gross yield on earning assets and the average cost of interest-bearing liabilities.
|
Return on Equity and Assets
The following table presents our selected financial ratios for the periods indicated.
|
For the year ended December 31,
|
||||||||||||
|
2013
|
2012
|
2011
|
||||||||||
|
ROA: Return on average total assets
|
1.3 | % | 1.3 | % | 2.0 | % | ||||||
|
ROE: Return on average stockholders’ equity
|
7.3 | % | 7.1 | % | 10.3 | % | ||||||
|
ROE (adjusted): Average stockholders’ equity excluding goodwill as a percentage of average total assets excluding goodwill(1)
|
13.1 | % | 13.3 | % | 13.0 | % | ||||||
|
Average stockholders’ equity as a percentage of average total assets
|
18.5 | % | 19.1 | % | 19.2 | % | ||||||
|
Payout(2)
|
44.1 | % | 49.0 | % | 41.0 | % | ||||||
|
(1)
|
“Average stockholders’ equity excluding goodwill as a percentage of average total assets excluding goodwill” is a non-GAAP financial measure which adjusts “Return on average stockholders’ equity” to exclude the goodwill arising from the acquisition of Banco Real in 2008. See “Item 3. Key Information—3A. Selected Financial Data—Selected Consolidated Ratios” for a reconciliation of “Average stockholders’ equity excluding goodwill as a percentage of average total assets excluding goodwill” to “Return on average stockholders’ equity.”
|
|
(2)
|
Divided payout ratio (dividends declared per share divided by net income per share).
|
Interest-Earning Assets
The following table shows the percentage mix of our average interest-earning assets for the years indicated. You should read this table in light of our observations noted in “—Average Balance Sheet and Interest Rates.”
|
For the year ended December 31,
|
||||||||||||
|
2013
|
2012
|
2011
|
||||||||||
|
Cash and balances with the Brazilian Central Bank
|
15.5 | % | 17.3 | % | 18.0 | % | ||||||
|
Loans and amounts due from credit institutions
|
9.7 | % | 7.6 | % | 6.2 | % | ||||||
|
Loans and advances to customers
|
56.3 | % | 56.6 | % | 53.3 | % | ||||||
|
Debt instruments
|
18.5 | % | 18.5 | % | 22.5 | % | ||||||
|
Total interest-earning assets
|
100.0 | % | 100.0 | % | 100.0 | % | ||||||
Loans and amounts due from credit institutions
The following table shows our short-term funds deposited with other banks at each of the dates indicated.
|
For the year ended December 31,
|
||||||||||||
|
2013
|
2012
|
2011
|
||||||||||
|
(in millions of R$)
|
||||||||||||
|
Time deposits
|
4,443 | 8,720 | 7,136 | |||||||||
|
Reverse repurchase agreements
|
19,602 | 3,616 | 1,040 | |||||||||
|
Escrow deposits
|
7,422 | 7,574 | 6,869 | |||||||||
|
Cash and Foreign currency investments
|
14,609 | 9,921 | 4,247 | |||||||||
|
Other accounts
|
135 | 163 | 459 | |||||||||
|
Total
|
46,212 | 29,993 | 19,751 | |||||||||
Investment Securities
At December 31, 2013, the book value of investment securities was R$71 billion (representing 15.0% of our total assets in the period). Brazilian government securities totaled R$51.6 billion, or 72.8%, of our investment securities at December 31, 2013. For a discussion of how our investment securities are valuated, see notes 6 and 7 to the consolidated financial statements.
The following table shows the carrying amounts of our investment securities by type and residence of the counterparty at each of the indicated dates:
|
At December 31,
|
||||||||||||
|
2013
|
2012
|
2011
|
||||||||||
|
(in millions of R$)
|
||||||||||||
|
Debt securities
|
||||||||||||
|
Government securities—Brazil
|
51,619 | 57,189 | 56,833 | |||||||||
|
Government securities—other countries
|
— | — | — | |||||||||
|
Other debt securities
|
16,285 | 12,896 | 12,058 | |||||||||
|
Total domestic/debt securities
|
67,904 | 70,085 | 68,891 | |||||||||
|
Equity securities
Shares of Brazilian companies
|
1,124 | 914 | 1,002 | |||||||||
|
Shares of foreign companies
|
149 | 0 | 1 | |||||||||
|
Investment fund units and shares
|
1,726 | 1,718 | 1,128 | |||||||||
|
Total equity securities
|
2,999 | 2,632 | 2,131 | |||||||||
|
Total investment securities
|
70,903 | 72,717 | 71,022 | |||||||||
As of December 31, 2013, we held no securities of single issuers or related groups of companies whose aggregate book or market value exceed 10.0% of our stockholders’ equity, other than the Brazilian government securities, which represented 63.2% of our stockholders’ equity. The total value of our debt securities was approximately 83.2% of stockholders’ equity.
The following table analyzes the maturities and weighted average yields of our debt investment securities (before impairment allowance) at December 31, 2013. Yields on tax-exempt obligations have not been calculated on a tax equivalent basis because the effect on such calculation is not significant.
|
Maturing within 1 year
|
Maturing between 1 and 5 years
|
Maturing between 5 and 10 years
|
Maturing after 10 years
|
Total
|
||||||||||||||||
|
Debt securities
|
||||||||||||||||||||
|
Government securities—Brazil
|
5,495 | 36,492 | 4,861 | 4,770 | 51,619 | |||||||||||||||
|
Other debt securities
|
3,568 | 7,667 | 3,411 | 1,638 | 16,285 | |||||||||||||||
|
Total debt investment securities
|
9,064 | 44,160 | 8,272 | 6,408 | 67,904 | |||||||||||||||
|
(1)
|
The average rate for debt investment securities is 9%.
|
Loan Portfolio
At December 31, 2013, our total loans and advances to customers were R$226.2 billion (49.9% of our total assets). Net of allowances for impairment losses, loans and advances to customers were R$212.7 billion at December 31, 2013 (46.9% of our total assets). In addition to loans, we had outstanding at December 31, 2013, 2012, 2011, 2010 and 2009, R$102.7 billion, R$106.8 billion, R$98.6 billion, R$93.5 billion and R$77.8 billion respectively, of loan commitments drawable by third parties.
Types of Loans by Type of Customer
Substantially all of our loans are to borrowers domiciled in Brazil and are denominated in
reais
. The following tables analyze our loans and advances to customers (including securities purchased under agreements to resell), by type of customer loan, at each of the dates indicated. For each category of loan, we maintain specific risk management policies in line with the standards of the Santander Group and as managed and monitored by our board of directors through the credit committee. Our credit approval processes for each category of loan are structured primarily around our business segments. See “Item 11. Quantitative and Qualitative Disclosures about Risk—Credit Risk” for details on our credit approval policies for retail and wholesale lending.
We have a diversified loan portfolio with no specific concentration exceeding 9.4% of total loans.
|
At December 31,
|
||||||||||||||||||||
|
2013
|
2012
|
2011
|
2010
|
2009
|
||||||||||||||||
|
(in millions of R$)
|
||||||||||||||||||||
|
Commercial, financial and industrial(1)
|
113,571 | 103,209 | 94,921 | 78,101 | 66,601 | |||||||||||||||
|
Real estate (2)
|
25,555 | 20,107 | 16,298 | 12,090 | 9,054 | |||||||||||||||
|
Installment loans to individuals(3)
|
84,312 | 83,243 | 76,459 | 60,251 | 49,103 | |||||||||||||||
|
Lease financing(4)
|
2,768 | 4,182 | 6,506 | 10,116 | 13,636 | |||||||||||||||
|
Loans and advances to customers, gross(5)
|
226,206 | 210,741 | 194,184 | 160,558 | 138,394 | |||||||||||||||
|
Impairment losses
|
(13,473 | ) | (13,967 | ) | (11,118 | ) | (9,192 | ) | (10,070 | ) | ||||||||||
|
Loans and advances to customers, net
|
212,733 | 196,775 | 183,066 | 151,366 | 128,324 | |||||||||||||||
(1) Includes primarily loans to small and medium-size businesses, or SMEs in our Commercial Banking segment, and to GB&M, corporate and business enterprise customers in our Wholesale Global Banking segment. The principal products offered to SMEs in this category include revolving loans, overdraft facilities, installment loans, working capital and equipment finance loans. Credit approval for SMEs is based on customer income, business activity, collateral coverage and internal and external credit scoring tools. Collateral on commercial, financial and industrial lending to SMEs generally includes receivables, liens, pledges, guarantees and mortgages, with coverage generally ranging from 100.0% to 150.0% of the loan value depending on the risk profile of the loan. Our Wholesale Global Banking customers are offered a range of loan products ranging from typical corporate banking products (installment loans, working capital and equipment finance loans) to more sophisticated products (derivative and capital markets transactions). As Wholesale Global Banking customers tend to be larger businesses, credit approval is based on customer credit quality as evaluated by a specialized teams of risk analysts taking
account of, among other things, business revenues and credit history of each customer. Underwriting policies for this category of loans to our Wholesale Global Banking customers are focused on the type of guarantee or collateral provided. Certain loans (BNDES products) are generally secured by liens on financed machinery and equipment, though guarantees may be provided as additional security.
(2) Includes loans on residential real estate to individuals. Credit approval policies in this category are determined by reference to the type of lending product being offered, the type and location of the real estate, the revenue or income of the business or customer, respectively, requesting the loan and internal and external credit scoring information. All loans granted under this category are secured by the financed real estate. Loan-to-value ratios for loans in this category are generally limited to 80.0% and the average loan to value ratio for new loans is approximately between 54.0% and 60.0%. Moreover, real estate also includes construction loans made principally to real estate developers that are SMEs and corporate customers in our Wholesale Global Banking Segment. Loans in this category are generally secured by mortgages and receivables, though guarantees may be provided as additional security.
(3) Consists primarily of unsecured personal installment loans (including loans the payments for which are automatically deducted from a customer’s payroll), revolving loans, overdraft facilities, consumer finance facilities and credit cards. Credit approval in this category is based on individual income, debt-to-income ratio and internal and external credit scoring models. Credit approval for many of these types of loans is based on automatic scoring models, with pre-set lending limits based on credit scores. For example, the maximum lending amount on revolving loans and overdraft facilities may vary from between 60.0% to 240.0% of an individual’s monthly income, depending on the specific product and credit score of the individual.
(4) Includes primarily automobile leases and loans to individuals. Credit approval is based both on an automatic scoring model using external credit scores and on evaluation by our branch personnel following our risk management policies. The vehicle financed acts as collateral for the particular loan granted.
(5) Includes the debit balances (financial assets) of all the credit and loans granted by us, including money market operations through central counterparties, except for credit of any nature in the name of credit institutions or those represented by securities.
Maturity
The following table sets forth an analysis by maturity of our loans and advances to customers by type of loans at December 31, 2013.
|
Maturity
|
||||||||||||||||||||||||||||||||
|
Less than one year
|
One to five years
|
Over five years
|
Total
|
|||||||||||||||||||||||||||||
|
Balance
|
% of Total Loans
|
Balance
|
% of Total Loans
|
Balance
|
% of Total Loans
|
Balance
|
% of Total Loans
|
|||||||||||||||||||||||||
|
(in millions of R$, except percentages)
|
||||||||||||||||||||||||||||||||
|
Commercial, financial and industrial
|
78,548 | 58.1 | 31,675 | 41.4 | 3,348 | 23.1 | 113,571 | 50.2 | ||||||||||||||||||||||||
|
Real estate
|
5,787 | 4.3 | 9,632 | 12.6 | 10,136 | 70.0 | 25,555 | 11.3 | ||||||||||||||||||||||||
|
Installment loans to individuals
|
49,356 | 36.5 | 33,958 | 44.4 | 998 | 6.9 | 84,312 | 37.3 | ||||||||||||||||||||||||
|
Lease financing
|
1,569 | 1.2 | 1,192 | 1.6 | 7 | 0.0 | 2,768 | 1.2 | ||||||||||||||||||||||||
|
Loans and advances to customers, gross
|
135,260 | 100.0 | 76,457 | 100.0 | 14,489 | 100.0 | 226,206 | 100.0 | ||||||||||||||||||||||||
Fixed and Variable Rate Loans
The following table sets forth a breakdown of our fixed and variable rate loans by maturity at December 31, 2013.
|
Fixed and variable rate loans with maturity
|
||||||||||||||||||||||||||||||||
|
Less than one year
|
One to five years
|
Over five years
|
Total
|
|||||||||||||||||||||||||||||
|
Balance
|
% of Total
|
Balance
|
% of Total
|
Balance
|
% of Total
|
Balance
|
% of Total
|
|||||||||||||||||||||||||
|
(in millions of R$, except percentages)
|
||||||||||||||||||||||||||||||||
|
Fixed rate
|
103,976 | 76.9 | 60,522 | 79.2 | 3,806 | 26.3 | 168,304 | 74.4 | ||||||||||||||||||||||||
|
Variable rate
|
31,284 | 23.1 | 15,935 | 20.8 | 10,683 | 73.7 | 57,902 | 25.6 | ||||||||||||||||||||||||
|
Total
|
135,260 | 100.0 | 76,457 | 100.0 | 14,489 | 100.0 | 226,206 | 100.0 | ||||||||||||||||||||||||
Cross-Border Outstandings
The following table presents, at each balance sheet date indicated, the aggregate amount of our cross-border outstandings (which consist of loans, interest-bearing deposits with other banks, acceptances and other monetary assets denominated in a currency other than the home-country currency of the office where the item is booked). Cross-border outstandings do not include local currency loans made by subsidiary banks in other countries to the extent that such loans are funded in the local currency or hedged. As a result, they do not include the majority of the loans made by our Cayman Islands branch, which are fully hedged.
|
At December 31,
|
||||||||||||||||||||||||
|
2013
|
2012
|
2011
|
||||||||||||||||||||||
|
Balance
|
% of Total Assets
|
Balance
|
% of Total Assets
|
Balance
|
% of Total Assets
|
|||||||||||||||||||
|
(in millions of R$, except percentages)
|
||||||||||||||||||||||||
|
OECD countries(1)
|
||||||||||||||||||||||||
|
Austria
|
481 | 0.1 | 664 | 0.2 | 366 | 0.1 | ||||||||||||||||||
|
Spain
|
629 | 0.1 | — | 0.0 | 256 | 0.1 | ||||||||||||||||||
|
United States
|
3,383 | 0.7 | 3,606 | 0.9 | 8,305 | 2.1 | ||||||||||||||||||
|
Netherlands
|
8,990 | 2.0 | 6,439 | 1.5 | 5,675 | 1.4 | ||||||||||||||||||
|
Other OECD countries(2)
|
1,940 | 0.4 | 229 | 0.1 | 583 | 0.1 | ||||||||||||||||||
|
Total OECD
|
15,423 | 3.4 | 10,938 | 2.6 | 15,186 | 3.8 | ||||||||||||||||||
|
Non-OECD countries
|
||||||||||||||||||||||||
|
Latin American countries(2)
|
667 | 0.1 | 29 | 0.0 | 60 | 0.0 | ||||||||||||||||||
|
Cayman Islands
|
1,093 | 0.2 | 3,320 | 0.8 | 4,081 | 1.0 | ||||||||||||||||||
|
Other(2)
|
730 | 0.2 | 298 | 0.1 | 354 | 0.1 | ||||||||||||||||||
|
Total non-OECD
|
2,490 | 0.5 | 3,647 | 0.9 | 4,495 | 1.1 | ||||||||||||||||||
|
Total
|
17,913 | 4.0 | 14,585 | 3.5 | 19,681 | 4.9 | ||||||||||||||||||
(1) The Organization for Economic Cooperation and Development.
(2) Aggregate outstandings in any single country in this category do not exceed 0.75% of our total assets.
The following table presents the amounts of our cross-border outstandings at December 31, 2013, 2012 and 2011 by type of borrower where outstandings in the borrower’s country exceeded 0.75% of total assets.
|
Government
|
Banks and Other Financial Institutions
|
Commercial and Industrial
|
Other Loans
|
Total
|
||||||||||||||||
|
(in millions of R$)
|
||||||||||||||||||||
|
2011
|
||||||||||||||||||||
|
United States
|
185 | 7,863 | 257 | — | 8,305 | |||||||||||||||
|
Netherlands
|
— | — | 5,675 | — | 5,675 | |||||||||||||||
|
Cayman Islands
|
— | — | 4,081 | — | 4,081 | |||||||||||||||
|
Total
|
185 | 7,863 | 10,013 | — | 18,061 | |||||||||||||||
|
2012
|
||||||||||||||||||||
|
United States
|
203 | 3,336 | 67 | — | 3,606 | |||||||||||||||
|
Netherlands
|
— | 10 | 6,429 | — | 6,439 | |||||||||||||||
|
Cayman Islands
|
— | — | 3,100 | 220 | 3,320 | |||||||||||||||
|
Total
|
203 | 3,346 | 9,596 | 220 | 13,365 | |||||||||||||||
|
2013
|
||||||||||||||||||||
|
United States
|
— | 2,350 | 647 | — | 2,997 | |||||||||||||||
|
Netherlands
|
— | 33 | 8,956 | — | 8,989 | |||||||||||||||
|
Cayman Islands
|
— | — | 304 | 503 | 807 | |||||||||||||||
|
Total
|
— | 2,383 | 9,907 | 503 | 12,793 | |||||||||||||||
Movements in Allowances for Impairment Losses
The following tables analyze movements in our allowances for impairment losses for the periods indicated. For further discussion of movements in the allowances for impairment losses, see “Item 5.A. Operating Results—Results of Operations for the Year Ended December 31, 2013 Compared to the Year Ended December 31, 2012—Impairment Losses on Financial Assets” and “—Year Ended December 31, 2012 Compared to the Year Ended December 31, 2011—Impairment Losses on Financial Assets.”
|
At December 31,
|
||||||||||||||||||||
|
2013
|
2012
|
2011
|
2010
|
2009
|
||||||||||||||||
|
(in millions of R$)
|
||||||||||||||||||||
|
Balance at beginning of year
|
14,042 | 11,180 | 9,192 | 10,070 | 8,181 | |||||||||||||||
|
Impairment losses charged to income for the year
|
14,356 | 18,004 | 11,191 | 9,051 | 10,520 | |||||||||||||||
|
Write-off of impaired balances against recorded impairment allowance
|
(14,757 | ) | (15,142 | ) | (9,203 | ) | (9,929 | ) | (8,631 | ) | ||||||||||
|
Balance at end of year
|
13,641 | 14,042 | 11,180 | 9,192 | 10,070 | |||||||||||||||
|
Of which:
|
||||||||||||||||||||
|
Loans and advances to customers
|
13,473 | 13,967 | 11,118 | 9,192 | 10,070 | |||||||||||||||
|
Loans and amounts due from credit institutions
|
168 | 75 | 62 | — | — | |||||||||||||||
|
Recoveries of loans previously written off(1)
|
456 | 1,528 | 1,809 | 818 | 537 | |||||||||||||||
|
(1)
|
Impairment losses on financial assets, net, as reported in our consolidated financial statements, reflect net provisions for credit losses less recoveries of loans previously written off.
|
The table below shows a breakdown of recoveries, net provisions and write-offs against credit loss allowance by type and domicile of the borrower for the periods indicated.
|
At December 31,
|
||||||||||||||||||||
|
2013
|
2012
|
2011
|
2010
|
2009
|
||||||||||||||||
|
(in millions of R$)
|
||||||||||||||||||||
|
Recoveries of loans previously written off(1)
|
456 | 1,528 | 1,809 | 818 | 537 | |||||||||||||||
|
Commercial, financial and industrial
|
122 | 456 | 353 | 88 | 42 | |||||||||||||||
|
Real estate
|
78 | 64 | 65 | 69 | 58 | |||||||||||||||
|
Installment loans to individuals
|
215 | 960 | 1,331 | 635 | 420 | |||||||||||||||
|
Lease finance
|
41 | 48 | 60 | 26 | 17 | |||||||||||||||
|
I
mpairment losses charged to income for the year(1)
|
14,356 | 18,004 | 11,191 | 9,051 | 10,520 | |||||||||||||||
|
Commercial, financial and industrial
|
5,186 | 5,776 | 2,943 | 3,098 | 3,071 | |||||||||||||||
|
Real estate – mortgage
|
126 | 149 | 98 | 71 | 28 | |||||||||||||||
|
Installment loans to individuals
|
8,803 | 11,795 | 7,972 | 5,780 | 7,198 | |||||||||||||||
|
Lease finance
|
241 | 284 | 178 | 102 | 223 | |||||||||||||||
|
Write-off of impaired balances against recorded impairment allowance
|
(14,757 | ) | (15,142 | ) | (9,203 | ) | (9,929 | ) | (8,631 | ) | ||||||||||
|
Commercial, financial and industrial
|
(3,195 | ) | (4,992 | ) | (2,470 | ) | (3,209 | ) | (3,073 | ) | ||||||||||
|
Real estate
|
(177 | ) | (48 | ) | (37 | ) | (42 | ) | (31 | ) | ||||||||||
|
Installment loans to individuals
|
(11,093 | ) | (9,855 | ) | (6,484 | ) | (6,509 | ) | (5,377 | ) | ||||||||||
|
Lease finance
|
(292 | ) | (247 | ) | (212 | ) | (169 | ) | (150 | ) | ||||||||||
|
(1)
|
Impairment losses on financial assets, net, as reported in our consolidated financial statements, reflect net provisions for credit losses less recoveries of loans previously written off.
|
The table below shows a breakdown of allowances for credit losses by type of borrowers and the percentage of loans in each category as a share of total loans at the date indicated.
|
At December 31,
|
||||||||||||||||||||||||
|
2013
|
% of Total Loans
|
2012
|
% of Total Loans
|
2011
|
% of Total Loans
|
|||||||||||||||||||
|
(in millions of R$, except percentages)
|
||||||||||||||||||||||||
|
Borrowers
|
||||||||||||||||||||||||
|
Commercial, financial and industrial
|
6,524 | 50.2 | 4,532 | 49.0 | 3,747 | 48.9 | ||||||||||||||||||
|
Real estate
|
229 | 11.3 | 281 | 9.5 | 180 | 8.4 | ||||||||||||||||||
|
Installment loans to individuals
|
6,745 | 37.3 | 9,035 | 39.5 | 7,096 | 39.4 | ||||||||||||||||||
|
Lease financing
|
143 | 1.2 | 194 | 1.9 | 157 | 3.4 | ||||||||||||||||||
|
Total
|
13,641 | 100.0 | 14,042 | 100.0 | 11,180 | 100.0 | ||||||||||||||||||
Renegotiation Portfolio
The renegotiation portfolio for the year ended December 31, 2013 amounted to R$14.0 billion compared to R$10.9 billion for the same period in 2012, an increase of R$3.1 billion or 27.5%, mainly due to one of the measures adopted by the Bank in late 2012 focused on recovery campaigns to offer to delinquent customers loan terms adjustments to help them meet their payment obligations. This portfolio includes credit contracts that were extended and/or modified to facilitate repayment under conditions agreed upon with customers, including renegotiated operations previously classified as write-offs.
The renegotiation portfolio was covered by allowances for impairment losses of 50.3% in December 2013 and 51.2% in December 2012. These levels are considered appropriate for the characteristics of these operations.
The following table presents a breakdown of our managerial renegotiation portfolio by type of customer, allowances for impairment losses and our coverage ratio at the dates indicated:
|
2013
|
2012
|
|||||||
|
(in millions of R$, except percentages)
|
||||||||
|
Renegotiation Portfolio by type of customer
|
||||||||
|
Commercial, financial and industrial
|
6,497 | 5,190 | ||||||
|
Real Estate
|
1 | 1 | ||||||
|
Installment loans to individuals
|
7,042 | 5,391 | ||||||
|
Financial Leasing
|
470 | 408 | ||||||
|
Total
|
14,010 | 10,990 | ||||||
|
Allowances for impairment losses
|
7,049 | 5,632 | ||||||
|
Coverage ratio
|
50.3 | % | 51.2 | % | ||||
Balances are deemed to be impaired when there are reasonable doubts as to their full recovery and/or the collection of the related interest for the amounts on the dates indicated in the loan agreement, after taking into account the collateral guarantees received to secure (fully or partially) collection of the related balances.
Impaired Assets
The following table shows our impaired assets, excluding country risk.
|
At December 31,
|
||||||||||||||||||||
|
2013
|
2012
|
2011
|
2010
|
2009
|
||||||||||||||||
|
(in millions of R$, except percentages)
|
||||||||||||||||||||
|
Non-performing assets
|
||||||||||||||||||||
|
Past-due and other non-performing assets(1)
|
14,022 | 16,057 | 13,073 | 9,348 | 9,899 | |||||||||||||||
|
Non-performing assets as a percentage of total loans
|
6.2 | % | 7.6 | % | 6.7 | % | 5.8 | % | 7.2 | % | ||||||||||
|
Net loan charge-offs as a percentage of total loans
|
6.5 | % | 7.2 | % | 4.7 | % | 6.2 | % | 6.2 | % | ||||||||||
|
Net loan charge-offs as a percentage of average total loans
|
6.8 | % | 7.5 | % | 5.2 | % | 6.7 | % | 6.3 | % | ||||||||||
|
(1)
|
Includes at December 31, 2013, R$1,744 million of doubtful loans (2012 – R$1,087 million, 2011 – R$689 million and 2010 – R$927 million) that were not past-due and therefore were accounted for on an accrual basis. In the period ended December 31, 2013, the amount of interest owed on non-accruing assets that would have been recorded had such assets accrued interest from January 1, 2013 would have been R$2,790 million, in the period from January 1, 2012 to December 31, 2012, would have been R$3,306 million, in the period from January 1, 2011 to December 31, 2011, would have been R$2,769 million, in the period from January 1, 2010 to December 31, 2010, would have been R$2,049 million and in the period from January 1, 2009 to December 31, 2009, would have been R$2,005 million. No loan that was more than 60 days past due was accounted for on an accrual basis.
|
Evolution of Impaired Assets
Our impaired assets decreased 12.67%, or R$2 billion, to R$14 billion at December 31, 2013 compared to R$16.1 billion at December 31, 2012. Provisions for impairment losses, including total revenue recovery, decreased 2.85%, or R$401 million, to R$13.6 billion at December 31, 2013 compared to R$14 billion at December 31, 2012. Offsetting these effects were recoveries of R$456 million on loans previously written off at December 31, 2013 and R$1.5 billion at December 31, 2012.
The following table shows the changes in our impaired assets at the dates indicated:
|
At December 31,
|
||||||||||||||||||||
|
2013
|
2012
|
2011
|
2010
|
2009
|
||||||||||||||||
|
(in millions of R$)
|
||||||||||||||||||||
|
Balance at beginning of year
|
16,057 | 13,073 | 9,348 | 9,899 | 7,730 | |||||||||||||||
|
Net additions
|
12,722 | 18,126 | 12,928 | 9,378 | 10,800 | |||||||||||||||
|
Write-offs
|
(14,757 | ) | (15,142 | ) | (9,203 | ) | (9,929 | ) | (8,631 | ) | ||||||||||
|
Balance at end of year
|
14,022 | 16,057 | 13,073 | 9,348 | 9,899 | |||||||||||||||
Impaired Assets by Type of Customer
The following table shows the changes in our impaired assets by type of customers at the dates indicated:
|
At December 31,
|
||||||||
|
2013
|
2012
|
|||||||
|
(in millions of R$)
|
||||||||
|
Commercial, financial and industrial
|
6,410 | 6,157 | ||||||
|
Real estate
|
316 | 283 | ||||||
|
Installment loans to individuals
|
7,167 | 9,368 | ||||||
|
Lease financing
|
129 | 249 | ||||||
|
Total
|
14,022 | 16,057 | ||||||
Commercial, Financial and Industrial
Non-performing assets in the portfolio of commercial, financial and industrial loans amounted to R$6,410 million at December 31, 2013, an increase of R$253 million, or 4.1%, compared to 2012.
The increase in non-performing assets in this portfolio was mainly caused by the slowdown in the Brazilian economy, for which the GDP of 2.3% in 2013 was below initial expectations.
In 2013, the Brazilian economy was negatively impacted by the measures adopted by the Brazilian government. In 2013, the Brazilian Central Bank increased the SELIC rate from 7.25% at December 31, 2012 to 10.0% at December 31, 2013 in response to inflation in the first half of the year and also to mitigate the devaluation of the Brazilian currency as a consequence of the uncertainties in international financial markets caused by policy measures in the European and North American economy.
Trends observed in 2013 were consistent with the trend observed in 2012 and 2011, when government measures aimed to control inflation also led to increases in production costs and adversely affected the ability of our industrial customers to honor their debts.
Despite the increase in non-performing assets, there has been a reduction in default rates since the second quarter of 2013. This behavior was mainly due to the measures adopted by the Bank in late 2012, primarily related to the reassessment of limits for loans with higher level of collateral requirements and to the review of collection practices with respect to our borrowers whereby we offered certain customers the chance to negotiate a restructuring of their debts. These and other actions in 2013 helped improve the quality of this credit portfolio.
Real Estate
Non-performing assets in the real estate lending portfolio totaled R$316 million at December 31, 2013, an increase of R$33 million, or 11.6%, compared to 2012.
The increase in non-performing assets was primarily due to the growth of this credit portfolio, which grew by 27.1% in 2013. Notwithstanding the increase in non-performing assets, the default rate in the real estate lending portfolio reached 1.24% at December 31, 2013, a decrease of 17 basis points compared to December 31, 2012.
In general, the decrease in the default rate was mainly due to the improvement in the quality of this loan portfolio, as a consequence of the change in our portfolio mix in late 2012, with an increased share of secured mortgage loans, which we consider a strategic product due to the lower risk of default.
Installment loans to individuals
Non-performing assets in the installment loans to individuals lending portfolio totaled R$7,167 at December 31, 2013, with a reduction of 23.5%, or R$2,201 million compared to 2012.
The decrease in non-performing assets reflects the measures adopted by the Bank in late 2012 to manage default rates in this portfolio, which included the adaptation of credit limits for new customers, the development of new loan models with “predictive scoring” enhancements and recovery campaigns to offer to delinquent customers loan terms adjustments to help them meet their payment obligations.
Although the Brazilian economy continues presenting an unfavorable outlook for growth, low unemployment levels and a continued rise in real income have contributed positively to the reduction in default rates in this portfolio.
Financial Leasing
Non-performing assets in the financial leasing lending portfolio totaled R$129 million at December 31, 2013, with a reduction of 48.2%, or R$120 million compared to the same period last year, primarily due to the reduction in lending in this portfolio, in line with the market trend of decreased automobile financing to individuals. This trend was also observed in 2012, when non-performing assets in the financial leasing lending portfolio decreased 38.7%, or R$157 million compared to the same period in 2011.
Methodology for Impairment Losses
Our methodology for impairment losses efficiently captured the acceleration in delinquencies due to internal rating models based on client behavior data and available external credit bureau rating information, which updates the probability of default, or “PD” (the probability of a borrower failing to meet its principal and/or interest payment obligations), used by us to estimate our provisions for loan losses.
PD is measured using a time horizon of one year; that is, it quantifies the probability of a borrower defaulting in the coming year. A loan is in default if either the principal or interest is past due by ninety days or more or the loan is current but there are doubts as to the solvency of the borrower (which is recorded as subjective doubtful assets).
In addition to PD, we manage our loan portfolio by granting loans to borrowers who have higher volumes of guarantees relating to the loans and also maximizes the bank’s loan recovery. These and other actions combined are responsible for ensuring the adequacy of the LGD parameters (loss resulting from the event of default by the borrower to honor the principal and/or interest payments).
LGD calculation is based on the net charge offs on defaulted loans, taking into account the guarantees/collateral associated with the loans, the income and expenses associated with the recovery process and the timing of delinquency.
The methodology for impairment losses also considers the loss identification period, that is, the time period between the occurrence of a loss event and the identification of an objective evidence of this loss by the Bank. In other words, it represents the time horizon from the credit loss occurrence until the effective confirmation of this loss.
Prior to writing off past due loans (which is only done after we have completed all recovery efforts), we record provisions for the remaining balance of the loan so our allowance for impairment losses fully cover, our losses. Thus, we understand that our allowance for impairment loss methodology has been developed to fit its risk metrics and capture loans that could potentially become impaired.
Finally, loans originated in 2013 and 2012 have a higher proportion of loans with higher level of collateral or other credit enhancements as required pursuant to our updated underwriting standards, which therefore requires a lower level of provisioning.
Loans past due for less than 90 days but not classified as impaired
The following table shows the loans past due for less than 90 days but not classified as impaired at the dates indicated:
|
At December 31,
|
||||||||||||||||
|
2013
|
% of total
|
2012
|
% of total
|
|||||||||||||
|
(in millions of R$, except percentages)
|
||||||||||||||||
|
Commercial, financial and industrial
|
5,208 | 23.7 | 7,071 | 36.4 | ||||||||||||
|
Mortgage loans
|
6,841 | 31.2 | 1,305 | 6.7 | ||||||||||||
|
Installment loans to individuals
|
9,652 | 44.0 | 10,346 | 53.3 | ||||||||||||
|
Lease financing
|
231 | 1.1 | 703 | 3.6 | ||||||||||||
|
Total (*)
|
21,932 | 100.0 | 19,425 | 100.0 | ||||||||||||
|
(*)
|
Refers only to loans past due between 1 and 90 days.
|
Impaired Asset Ratios
The following table shows the ratio of our impaired assets to total computable credit risk and our coverage ratio at the dates indicated.
|
At December 31,
|
||||||||||||||||||||
|
2013
|
2012
|
2011
|
2010
|
2009
|
||||||||||||||||
|
(in millions of R$ except percentages)
|
||||||||||||||||||||
|
Computable credit risk(1)
|
257,420 | 238,807 | 216,756 | 183,121 | 159,362 | |||||||||||||||
|
Non-performing assets
|
14,022 | 16,057 | 13,073 | 9,348 | 9,899 | |||||||||||||||
|
Allowances for impairment losses
|
13,641 | 14,042 | 11,180 | 9,192 | 10,070 | |||||||||||||||
|
Ratios
|
||||||||||||||||||||
|
Non-performing assets to computable credit risk
|
5.4 | % | 6.7 | % | 6.0 | % | 5.1 | % | 6.2 | % | ||||||||||
|
Coverage ratio(2)
|
97.3 | % | 87.3 | % | 85.5 | % | 98.3 | % | 101.7 | % | ||||||||||
|
Net Expenses
|
(13,900 | ) | (16,476 | ) | (9,382 | ) | (8,233 | ) | (9,983 | ) | ||||||||||
|
Other financial instruments not measured at fair value
|
(218 | ) | — | — | (0.9 | ) | 17 | |||||||||||||
|
Total net expenses
|
(14,118 | ) | (16,476 | ) | (9,382 | ) | (8,234 | ) | (9,966 | ) | ||||||||||
|
(1)
|
Computable credit risk is the sum of the face amounts of loans and leases (including non-performing assets but excluding country risk loans), guarantees and documentary credits.
|
|
(2)
|
Allowances for impairment losses as a percentage of non-performing assets.
|
Non-current assets held for sale
The following table shows the movement in non-current assets held for sale at the dates indicated.
|
At December 31,
|
||||||||||||
|
2013
|
2012
|
2011
|
||||||||||
|
(in millions of R$, except percentages)
|
||||||||||||
|
Balance at beginning of year
|
315 | 223 | 168 | |||||||||
|
Foreclosures loans and other assets transferred(1)
|
51 | 113 | 24,875 | |||||||||
|
Disposals(1)
|
(42 | ) | (30 | ) | (24,820 | ) | ||||||
|
Others
|
— | 9 | — | |||||||||
|
Final balance, gross
|
324 | 315 | 223 | |||||||||
|
Impairment losses
|
(50 | ) | (149 | ) | (91 | ) | ||||||
|
Impairment as a percentage of foreclosed assets
|
15.3 | % | 47.5 | % | 40.8 | % | ||||||
|
Balance at end of year
|
275 | 166 | 132 | |||||||||
|
(1)
|
In 2011, includes R$24.7 billion of assets of Santander Seguros. Additionally, in 2011 we sold R$22.3 billion of liabilities that were associated with non-current assets held for sale of Santander Seguros. For further details see Note 3.b to our audited consolidated financial statements.
|
Liabilities
Deposits
The principal components of our deposits are customer demand, time and notice deposits, and international and domestic interbank deposits. Our retail customers are the principal source of our demand, time and notice deposits.
The following tables analyze our deposits at the dates indicated.
|
At December 31,
|
||||||||||||
|
2013
|
2012
|
2011
|
||||||||||
|
(in millions of R$)
|
||||||||||||
|
Deposits from central banks and credit institutions
|
||||||||||||
|
Time deposits
|
30,510 | 26,077 | 27,023 | |||||||||
|
Demand deposits
|
251 | 48 | 133 | |||||||||
|
Repurchase agreements
|
3,271 | 8,949 | 24,371 | |||||||||
|
of which:
|
||||||||||||
|
Backed operations with Private Securities (1)
|
373 | 559 | 223 | |||||||||
|
Backed operations with Public Securities
|
2,898 | 8,390 | 24,148 | |||||||||
|
Total deposits of the Brazilian Central Bank
and Credit Institutions
|
34,032 | 35,074 | 51,527 | |||||||||
|
Customer deposits
|
||||||||||||
|
Current accounts
|
15,585 | 13,585 | 13,561 | |||||||||
|
Savings accounts
|
33,589 | 26,857 | 23,293 | |||||||||
|
Time deposits
|
81,350 | 84,586 | 83,942 | |||||||||
|
Repurchase agreements
|
69,632 | 63,567 | 53,678 | |||||||||
|
of which:
|
||||||||||||
|
Backed operations with Private Securities (1)
|
41,853 | 35,736 | 30,247 | |||||||||
|
Backed operations with Public Securities (1)
|
27,779 | 27,831 | 23,431 | |||||||||
|
Total Customer deposits
|
200,156 | 188,595 | 174,474 | |||||||||
|
Total deposits
|
234,188 | 223,669 | 226,001 | |||||||||
|
(1)
|
Refers primarily to repurchase agreements backed by debentures of own issue.
|
The following table shows the maturity of time deposits (excluding inter-bank deposits) in denominations of U$100,000 or more at the dates indicated. Large denomination customer deposits may be a less stable source of funds than demand and savings deposits.
|
At December 31, 2013
|
||||||||
|
Domestic
|
International
|
|||||||
|
(in millions of R$)
|
||||||||
|
Under 3 months
|
5,705 | 1,002 | ||||||
|
3 to 6 months
|
24,847 | 4 | ||||||
|
6 to 12 months
|
3,531 | — | ||||||
|
Over 12 months
|
5,203 | 511 | ||||||
|
Total
|
39,286 | 1,517 | ||||||
Short-Term Borrowings
The following table shows our short-term borrowings consisting of government securities that we sold under agreements to repurchase for purpose of funding our operations.
|
For the year ended December 31,
|
||||||||||||||||||||||||
|
2013
|
2012
|
2011
|
||||||||||||||||||||||
|
Amount
|
Average Rate
|
Amount
|
Average Rate
|
Amount
|
Average Rate
|
|||||||||||||||||||
|
(in millions of R$, except percentages)
|
||||||||||||||||||||||||
|
Securities sold under agreements to repurchase
|
||||||||||||||||||||||||
|
At December 31
|
72,879 | 10.8 | % | 72,516 | 10.6 | % | 78,048 | 10.9 | % | |||||||||||||||
|
Average during the period
|
77,241 | 10.7 | % | 70,723 | 11.1 | % | 64,510 | 11.9 | % | |||||||||||||||
|
Maximum month-end balance
|
84,004 | 75,759 | 76,693 | |||||||||||||||||||||
|
Total short-term borrowings at year end
|
72,879 | 72,516 | 78,048 | |||||||||||||||||||||
4C
. Organizational Structure
Santander Group controls Santander Brasil directly and indirectly through Sterrebeeck B.V. (“Sterrebeeck”), Grupo Empresarial Santander, S.L. (“GES”) and Santander Insurance Holding, S.L., which are controlled subsidiaries. As of December 31, 2013, Santander Spain held, directly and indirectly, 75.68% of our voting stock.
Santander Spain ended December 2013 as the largest bank in the euro zone, with market capitalization, of €73,732 million. As of December 31, 2013, Santander Spain’s attributable profit totaled €4,370 million, 90.5% higher than the previous year, and shareholder dividends were €0.60 per share. The Santander Group operates principally in Spain, the United Kingdom, other European countries, Brazil and other Latin American countries and the United States, offering a wide range of financial products. In Latin America, the Santander Group has majority shareholdings in financial institutions in Argentina, Brazil, Chile, Mexico, Peru, Puerto Rico and Uruguay. As of December 31, 2013, Santander Brasil contributed 23.0% of the profit attributable to the Santander Group.
The following table presents the name, country of incorporation or residence and proportion of ownership interest of our main subsidiaries in accordance with the criteria for consolidation pursuant to IFRS:
|
Country of Incorporation
|
Ownership Interest
|
||||||||||
|
Activity
|
Direct
|
Indirect
|
|||||||||
|
Direct and Indirect subsidiaries of Banco Santander (Brasil) S.A.
|
|||||||||||
|
Banco Bandepe S.A.
|
Bank
|
Brazil
|
100.00 | % | 100.00 | % | |||||
|
Santander Leasing S.A. Arrendamento Mercantil
|
Leasing
|
Brazil
|
78.57 | % | 99.99 | % | |||||
|
Aymoré Crédito, Financiamento e Investimento S.A.
|
Financial
|
Brazil
|
100.00 | % | 100.00 | % | |||||
|
Santander Brasil Administradora de Consórcio Ltda.(2)
|
Buying club
|
Brazil
|
100.00 | % | 100.00 | % | |||||
|
Santander Microcrédito Assessoria Financeira S.A.
|
Microcredit
|
Brazil
|
100.00 | % | 100.00 | % | |||||
|
Santander Brasil Advisory Services S.A.
|
Other Activities
|
Brazil
|
96.52 | % | 96.52 | % | |||||
|
CRV Distribuidora de Títulos e Valores Mobiliários S.A.
|
Dealer
|
Brazil
|
100.00 | % | 100.00 | % | |||||
|
Santander Corretora de Câmbio e Valores Mobiliários S.A
|
Broker
|
Brazil
|
99.99 | % | 100.00 | % | |||||
|
Santander Participações S.A
|
Holding
|
Brazil
|
100.00 | % | 100.00 | % | |||||
|
Santander Getnet Serviços para Meios de Pagamento S.A.(1)
|
Other Activities
|
Brazil
|
50.00 | % | 50.00 | % | |||||
|
Sancap Investimentos e Participações S.A
|
Holding
|
Brazil
|
100.00 | % | 100.00 | % | |||||
|
Mantiq Investimentos Ltda.
|
Other Activities
|
Brazil
|
100.00 | % | 100.00 | % | |||||
|
Santos Energia Participações S.A.
|
Holding
|
Brazil
|
100.00 | % | 100.00 | % | |||||
|
Santander Brasil, EFC
|
Financial
|
Spain
|
100.00 | % | 100.00 | % | |||||
|
Santander S.A. Serviços Técnicos, Administrativos e de Corretagem de Seguros
|
Insurance Broker
|
Brazil
|
60.65 | % | 60.65 | % | |||||
|
Controlled by Sancap
|
|||||||||||
|
Santander Capitalização S.A.
|
Savings and annuities
|
Brazil
|
— | 100.00 | % | ||||||
|
Ablasa Participações S.A.
|
Holding
|
Brazil
|
— | 100.00 | % | ||||||
|
Controlled by Santander Serviços S.A.
|
|||||||||||
|
Webcasas S.A.
|
Other Activities
|
Brazil
|
— | 100.00 | % | ||||||
|
Controlled by Santos Energia Participações S.A.
|
|||||||||||
|
Central Eólica Santo Antônio de Pádua S.A.
|
Wind Energy
|
Brazil
|
— | 100.00 | % | ||||||
|
Central Eólica São Cristovão S.A.
|
Wind Energy
|
Brazil
|
— | 100.00 | % | ||||||
|
Central Eólica São Jorge S.A.
|
Wind Energy
|
Brazil
|
— | 100.00 | % | ||||||
|
Brazil Foreign Diversified Payment Rights Finance Company(a)
|
Securitization
|
Cayman Islands
|
— |
(a)
|
|||||||
|
Santander FIC FI Contract I Referenciado DI(a)
|
Investment Fund
|
Brazil
|
— |
|
(a)
|
||||||
|
Santander Fundo de Investimento Unix Multimercado Crédito Privado(a)
|
Investment Fund
|
Brazil
|
— |
|
(a)
|
||||||
|
Santander Fundo de Investimento Diamantina Multimercado Crédito Privado de Investimento no Exterior(a)
|
Investment Fund
|
Brazil
|
— |
|
(a)
|
||||||
|
Santander Fundo de Investimento Amazonas Multimercado Crédito Privado de Investimento no Exterior(a)
|
Investment Fund
|
Brazil
|
— |
|
(a)
|
||||||
|
Santander Fundo de Investimento SBAC Referenciado DI Crédito Privado(a)
|
Investment Fund
|
Brazil
|
— |
|
(a)
|
||||||
|
Santander Fundo de Investimento Guarujá Multimercado Crédito Privado de Investimento no Exterior(a)
|
Investment Fund
|
Brazil
|
— |
|
(a)
|
||||||
|
Santander Fundo de Investimento Financial Curto Prazo(a)
|
Investment Fund
|
Brazil
|
— |
|
(a)
|
||||||
|
Santander Fundo de Investimento Capitalization Renda Fixa(a)
|
Investment Fund
|
Brazil
|
— |
|
(a)
|
||||||
|
Santander Paraty QIF PLC(a)
|
Investment Fund
|
Brazil
|
— |
|
(a)
|
||||||
|
(a)
|
Company over which effective control is exercised, according to IFRS 10 - Consolidated Financial Statements, and there is no ownership interest.
|
|
(1)
|
We have authority to make decisions related to business strategy. Additionally, we allow Santander GetNet the use of our branch network and brand for the sale of products, which among other factors determines our control of Santander GetNet.
|
|
(2)
|
At meetings held on July 25, 2012, the Board of Directors of Santander Consórcios and Santander Brasil Consórcios agreed and decided to submit for approval from their respective partners, the proposed incorporation of Santander Consórcios (Incorporated) by Santander Brasil Consórcio (Incorporator) (Incorporation) which was approved at meeting of the Partners Incorporated and Incorporator on July 31, 2012. The merger will give through the transfer of the net book value of incorporated for the stockholders’ equity of the incorporator, based on the audited balance sheet at June 30, 2012. The equity variations occurred between the base date of that balance sheet and the effectiveness of the incorporation (the date of the Contract Amendment) were recognized and recorded directly on the incorporator. On November 30, 2012 this process of incorporation was approved by the BACEN.
|
|
4D
.
|
Property, Plant and Equipment
|
We operate five major administrative operational centers, of which four were owned properties and one was rented. Additionally, we own 458 properties for the activities of our banking network and rent 1,852 properties for the same purpose. Furthermore, in 2013, we have concluded the construction of our new data center in Campinas, which also is an owned property. For further information about the location of our branches, see—”Item 4. Information on the Company — B. Business Overview — Distribution Network.” Our headquarters are located at Av. Presidente Juscelino Kubitschek, 2,041 and 2,235 (Torre São Paulo)–Bloco A, Vila Olímpia, São Paulo, State of São Paulo, Brazil.
Not applicable.
|
Operating Results
|
The following discussion of our financial condition and results of operations should be read in conjunction with our consolidated financial statements for the years ended December 31, 2013, 2012 and 2011 and the related notes thereto, and with the financial information presented under the section entitled “Item 3. Key Information—A. Selected Financial Data” included elsewhere in this annual report. The preparation of the consolidated financial statements referred to in this section required the adoption of assumptions and estimates that affect the amounts recorded as assets, liabilities, revenue and expenses in the years and periods presented and are subject to certain risks and uncertainties. Our future results may vary substantially from those indicated as a result of various factors that affect our business, including, among others, those mentioned in the sections “Forward-Looking Statements” and “Item 3. Key Information—D. Risk Factors,” and other factors discussed elsewhere in this annual report. Our consolidated financial statements for the years ended December 31, 2013, 2012 and 2011, prepared in accordance
with IFRS and the report of our independent registered public accounting firm are included in “Item 18. Financial Statements.”
Effects of the Global Financial Markets Crisis on our Financial Condition and Results of Operations
The global financial markets crisis has significantly affected the world economy since the second half of 2008. It has led to recessions and increasing unemployment in the world’s leading economies, a reduction in investments on a global scale, a decrease in raw material prices and a sharp decline in credit availability and liquidity, as well as a general closure of the capital markets worldwide.
In Brazil, however, the effects of the global financial markets crisis were initially relatively moderate compared to those in the United States and Europe, and the Brazilian economy experienced a rapid and strong recovery shortly following the global crisis. After contracting 0.3% in 2009, GDP increased 7.5% in 2010 as compared to the previous year. In 2011, the economy slowed down to a growth of an estimated 2.7%, reflecting the lagged effects of a more restrictive monetary policy of the Brazilian Central Bank and the spillover of the international financial crisis (primarily in Europe). In 2012 and 2013, the latent effects of the international crisis persisted in Brazil and the domestic economy continued to slow down despite monetary and fiscal easing. Relatively strong domestic demand has sustained economic growth in Brazil, particularly due to high consumer confidence, strong labor markets and readjustments to the minimum wage. Also, the Brazilian Central Bank lowered reserve requirements and, in response, public banks increased their supply of credit. As a result, the global liquidity crisis had relatively little impact in Brazil.
The global financial crisis did not have a material impact on our liquidity and capital resources due to the relatively stable economic environment in Brazil, our relatively low dependence on funding from the international markets, a proactive approach from the Brazilian Central Bank and the liquidity cushion we built up in response to the global financial markets crisis. We gauge liquidity needs on a recurring basis based on our business plans and we pursue funding actions based on anticipated funding needs.
Brazilian Macroeconomic Environment
In the first half of 2011, the Brazilian Central Bank began focusing on measures to control economic growth and inflation in Brazil. By mid-year, when the global economy began showing signs of uncertainty, the government and the Brazilian Central Bank reversed this course and started implementing measures to stimulate the economy, including reducing interest rates. In December 2011, in further efforts to increase liquidity in the banking system, the Brazilian Central Bank announced changes to decrease the return on a portion of required reserves when these resources are not used by banks to either buy loan portfolios from smaller banks, or Financial Bills (
Letras Financeiras
), or used as interbank loans.
In 2012, in a challenging market environment, the economy slowed down substantially (with GDP growth of 1.0%), which resulted in a direct impact on credit quality in Brazil. As a consequence, the financial system suffered an increase in overall delinquency ratios, driven mainly by lending to individuals. The efforts of the government and the Brazilian Central Bank to increase liquidity and boost the economy continued in 2012, with additional measures such as reducing reserve requirements on time deposits and demand deposits and channeling liquidity to smaller banks.
In 2013, the pace of economic growth has remained slow (with GDP growth of 2.3%), while the credit quality in Brazil had improved, especially in lending to individuals. The delinquency ratio decreased in a reversal from the trend of an increasing delinquency ratio in 2012 as compared to 2011, reaching 3.0% as of December 31, 2013 as compared to 3.7% in 2012 and unemployment reached historically low rates.
Other Factors Affecting Our Financial Condition and Results of Operations
As a Brazilian bank, we are significantly affected by the general economic environment in Brazil. The following table presents key data of the Brazilian economy for the periods indicated:
|
For the year ended December 31,
|
||||||||||||
|
2013
|
2012
|
2011
|
||||||||||
|
GDP growth(1)
|
2.3 | % | 1.0 | % | 2.7 | % | ||||||
|
CDI rate(2)
|
8.0 | % | 8.4 | % | 11.6 | % | ||||||
|
TJLP(3)
|
5.0 | % | 5.7 | % | 6.0 | % | ||||||
|
SELIC rate(4)
|
10.0 | % | 7.25 | % | 11.0 | % | ||||||
|
Increase (decrease) in Real value against the U.S. dollar
|
14.5 | % | 8.9 | % | 12.6 | % | ||||||
|
Selling exchange rate (at period end) R$ per U.S.$1.00
|
2.34 | 2.04 | 1.88 | |||||||||
|
Average exchange rate R$ per U.S.$1.00(5)
|
2.17 | 1.95 | 1.67 | |||||||||
|
Inflation (IGP-M)(6)
|
5.5 | % | 7.8 | % | 5.1 | % | ||||||
|
Inflation (IPCA)(7)
|
5.9 | % | 5.8 | % | 6.5 | % | ||||||
|
Sources: BNDES, Brazilian Central Bank, FGV and IBGE.
|
|
(1)
|
Revised series. Source: IBGE.
|
|
(2)
|
The overnight interbank deposit rate (
Certificado de Depósito Interbancário
), or “CDI” is the average daily interbank deposit rate in Brazil (at the end of each month and annually).
|
|
(3)
|
Represents the interest rate applied by the BNDES for long-term financing (at the end of the period).
|
|
(4)
|
The benchmark interest rate payable to holders of some securities, such as treasury financial letters, issued by the Brazilian government and traded on the SELIC.
|
|
(5)
|
Average of the selling exchange rate for the last day of each month during the period.
|
|
(6)
|
The inflation rate is the general index of market prices (
Índice Geral de Preços-Mercado, or
“IGP-M”), as calculated by FGV.
|
|
(7)
|
The inflation rate is the consumer price index (
Índice de Preços ao Consumidor – Amplo
, or “IPCA”), as calculated by the IBGE.
|
Interest Rates
Since the implementation of an inflation target framework in 1999, local interest rates have been on a downward trend. The SELIC was lowered from 45.00% per annum in 1999 to 13.75% in 2008, shortly before the 2008/2009 global financial crisis began. The global financial crisis led to further reductions of the SELIC, which reached 8.75% in 2009 (its lowest historical level until then). The reduction in the SELIC contributed significantly to the economic recovery in Brazil. The normalization of local liquidity conditions and inflationary pressure in 2010 led the Brazilian Central Bank to raise rates by 375 basis points between April 2010 and July 2011, when the SELIC reached 12.50%. Nevertheless, the persistence of uncertainty in international markets and the first signs of slowdown in domestic activity led the Brazilian Central Bank to resume monetary easing in August 2011. Thus, the SELIC rate was cut by 525 basis points between August 2011 and December 2012. On October 10, 2012 the SELIC reached an annual rate of 7.25%, the lowest level in history. In 2013, the Brazilian Central Bank began a monetary tightening cycle due to rising inflation in the 6% range, the depreciation of the
real
, and a perception of the recovery of certain economic activity. The SELIC rate was increased by 275 basis points, reaching 10% on November 27, 2013 at the last monetary policy committee meeting of the year.
As of April 29, 2014, the SELIC rate was 11.00%.
The following table presents the low, high, average and period-end SELIC rate since 2009, as reported by the Brazilian Central Bank:
|
Low
|
High(1)
|
Average(2)
|
Period-End
|
|||||||||||||
|
Year
|
||||||||||||||||
|
2009
|
8.75 | 12.75 | 9.92 | 8.75 | ||||||||||||
|
2010
|
8.75 | 10.75 | 10.00 | 10.75 | ||||||||||||
|
2011
|
11.00 | 12.50 | 11.71 | 11.00 | ||||||||||||
|
2012
|
7.25 | 10.50 | 8.46 | 7.25 | ||||||||||||
|
2013
|
7.25 | 10.00 | 8.44 | 10.00 | ||||||||||||
|
(1)
|
Highest month-end rate.
|
|
(2)
|
Average of month-end rates during the period
|
Our assets are predominantly fixed rate and our liabilities predominantly floating. The resulting exposure to increases in market rates of interest is modified by our use of cash flow hedges to convert floating rates to fixed, but we maintain an exposure to interest rate movements. As of December 31, 2013, a 100 basis points increase in the yield curve would have resulted in R$383 million decline in the net interest income over a one-year period.
Credit Volume
Credit volume in Brazil has increased significantly since 2004, mainly driven by lower inflation, decreasing interest rates and consistent economic growth. The worldwide financial crisis temporarily affected the credit growth rates in late 2008 and early 2009. The monetary stimulus implemented by the Brazilian Central Bank as well as the intensive expansion of state-owned banks on credit supply have led to a recovery already in 2009, and intensified in 2010. Between 2010 and 2011, the outstanding credit increased 20% on average, the household debt burden (defined as the percentage of monthly available family income owed to service debt) was 20.2% in this same period, and in the end of 2011 the non-performing loans of individuals was 7.7%. In 2012, with the economic activity slowdown, the household debt burden climbed to 22.5%, and the non-performance loans of individuals rose to 8.0%, which resulted in deceleration of outstanding credit annual growth to 16.4%. The slowdown of credit growth continued through 2013, even with a remarkable expansion of credit supply by state-owned banks. The total outstanding credit increased 14.7% in 2013. Non-performance loans of individuals decreased to 6.7%, and the household debt burden decreased to 21.6% at the end of the year.
The total outstanding credit to GDP ratio has increased from 34.2% in December 2007 to 56.1% in December 2013. Although this is one of the highest levels ever achieved by Brazil, it is still low compared to other economies.
|
2013
|
2012
|
2011
|
||||||||||
|
(in billions of R$)
|
||||||||||||
|
Total Credit Outstanding (*)
|
2,715 | 2, 368 | 2,034 | |||||||||
|
Earmarked credit
|
1,207 | 969 | 802 | |||||||||
|
Non-earmarked based credit
|
1,508 | 1,399 | 1,232 | |||||||||
|
of which:
|
||||||||||||
|
Corporate
|
763 | 706 | 604 | |||||||||
|
Individuals (retail)
|
745 | 693 | 628 | |||||||||
|
(*) Some figures may be subject to revision by the Brazilian Central Bank
|
|
Source: Brazilian Central Bank
|
Foreign Exchange Rates
Our policy is to maintain limited foreign exchange rate exposure by seeking to match foreign currency denominated assets and liabilities as closely as possible, including through the use of derivative instruments. In 2013, we recorded foreign exchange gains of R$551 million. In 2012, we recorded foreign exchange gains of R$378 million, and in 2011, we recorded foreign exchange losses of R$121 million. These results are due to the variation of the U.S. dollar against the
real
on our assets and liabilities positions in U.S. dollar denominated instruments during these years. These foreign exchange gains and losses were offset in large part in each year by a corresponding loss or gain on derivatives entered into to hedge this exposure. Such losses and gains are recorded under “Exchange differences (net).”
The Brazilian currency has during the last decades experienced frequent and substantial variations in relation to the U.S. dollar and other foreign currencies. Most recently, the
real
was R$1.566 per U.S.$1.00 in August 2008. Primarily as a result of the crisis in the global financial markets, the
real
depreciated 31.9% against the U.S. dollar, and reached R$2.337 per U.S.$1.00 at year end 2008. In 2009 and 2010, the
real
appreciated against the U.S. dollar and reached R$1.666 per U.S.$1.00 at year end 2010. During 2011 the
real
depreciated and on December 31
st
, 2011 the exchange rate was R$1.876 per U.S.$1.00. During 2012 and 2013, the
real
continued to depreciate and on December 31, 2013, the exchange rate was R$2.343 per U.S.$1.00.
Inflation
The adoption of inflation targeting in 1999 resulted in a significant reduction in inflation rates in Brazil (measured by the IPCA, Consumer Price Index, the official inflation rate provided by the IBGE). In recent years, inflation has been oscillating around the target, which is set by the National Monetary Council. The target has been set at 4.5% since 2005 with a tolerance interval of 2 percentage points above and below this target.
The 2008 global financial crisis contributed to containing inflation in 2009, however domestic demand recovery and commodity price increases contributed to an inflation increase to 5.9% in 2010. In 2011, consumer price inflation climbed to 6.5%, driven by a 9% increase in service prices, and through 2012, consumer price inflation showed a mild reduction to 5.8%, mainly due to the impact of tax reduction on durable goods prices. The inflation rate was 5.91% in 2013, well above the inflation target of 4.5%, due to inflation for services around 9%, and food inflation, which was partially offset by the very low inflation of regulated prices, such as urban transport fares and electricity and telecommunication tariffs.
Reserve and Lending Requirements
The requirements set by the Brazilian Central Bank for reserves and credit has a significant impact on the operational results of the financial institutions in Brazil. Increases or decreases in such requirements may have an impact on our operational results by limiting or expanding the amounts available for commercial credit transactions.
During 2013, there were no changes in the percentage reserve requirements. However the Brazilian Central Bank introduced a timetable of the remuneration on time deposits reserve requirements, introduced by Circular 3,660, dated July 1, 2013. The initial rule stipulated that 36% of the time deposits reserve requirements would not receive remuneration from February 2014, changing this percentage to 27% in April 2014, 18% in June 2014 and 0% in August 2014. According to Circular 3,660, the deadline was brought forward to 36% in July 2013, 27% in November 2013, 18% in January 2014 and 0% in March 2014.
The Brazilian Central Bank issued the original rule to give incentive to the transfer of liquidity from large institutions to smaller ones. After verifying that it produced the intended goal, the Brazilian Central Bank decided to anticipate the timetable for completion of the implementation of the provisions of such regulation.
The table below shows the requirements for reserves and credit to which we are subject for each financing category:
|
Product
|
At December 31, 2012
|
At December 31, 2013
|
Form of Required Reserve
|
Yield
|
||||||||
|
Demand deposits
|
||||||||||||
|
Rural credit loans(1)
|
34.0 | % | 34.0 | % |
Loans
|
Cap rate: 5.5% p.a.
|
||||||
|
Microcredit loans(2)
|
2.0 | % | 2.0 | % |
Loans
|
Cap rate: 2.0% p.m.
|
||||||
|
Reserve requirements
|
44.0 | % | 44.0 | % |
Cash
|
Zero
|
||||||
|
Additional reserve requirements
|
0.0 | % | 0.0 | % |
Cash
|
SELIC
|
||||||
|
Free funding(3)
|
20.0 | % | 20.0 | % | ||||||||
|
Savings accounts
|
||||||||||||
|
Mortgage loans
|
65.0 | % | 65.0 | % |
Loans
|
Cap of TR + 12.0% p.a.
|
||||||
|
TR + 6.17% p.a., or
|
||||||||||||
|
Reserve requirements(4)
|
20.0 | % | 20.0 | % |
Cash
|
TR + 70.0% of the target SELIC
|
||||||
|
Additional reserve requirements
|
10.0 | % | 10.0 | % |
Cash
|
SELIC
|
||||||
|
Free funding(3)
|
5.0 | % | 5.0 | % | ||||||||
|
Time deposits
|
||||||||||||
|
Reserve requirements
|
20.0 | % | 20.0 | % | ||||||||
|
In cash or other instruments(5)
|
10.0 | % | 5.4 | % |
Cash or other instruments
|
Zero for Cash
|
||||||
|
In cash
|
10.0 | % | 14.6 | % |
Cash
|
SELIC
|
||||||
|
Additional reserve requirements
|
11.0 | % | 11.0 | % |
Cash
|
SELIC
|
||||||
|
Free funding(3)
|
69.0 | % | 69.0 | % | ||||||||
|
(1)
|
Rural credits are credits granted to farmers in the amount of R$4.4 billion and R$5.0 billion on December 31, 2012 and December 31, 2013, respectively.
|
|
(2)
|
Micro-credits are credits granted to very small businesses with open position of R$261.6 million and R$268.0 million on December 31, 2012 and December 31, 2013, respectively.
|
|
(3)
|
Interest-free financing is the amount to be used on a free of interest basis for other purposes in each financing category.
|
|
(4)
|
Upon publication of Circular No. 3,596/2012, the rule for calculation of the interest received on deposit reserves in savings accounts requirements was changed. As of May 31, 2012, whenever SELIC rate target was lower than or equal to 8.5% per year, Cap TR + 70.0% of SELIC target was used, otherwise the former rule was used, i.e. Cap TR + 6.17% per year.
|
|
(5)
|
Other instruments include motorcycle financing and certain assets (mainly loan portfolios and Treasury Bills) from eligible financial institutions in accordance with Circular 3,569 of December 2011.
|
Taxes
See “Item 4. Information on the Company—B. Business Overview— Regulation and Supervision—”Taxation.”
Hedging in Foreign Investments
We operate a branch in the Cayman Islands and a subsidiary named Santander Brasil Establecimiento Financiero de Credito, EFC, or “Santander EFC” (an independent wholly-owned subsidiary in Spain) which are used primarily for sourcing funds in the international banking and capital markets to provide credit lines for us that are extended to our customers for working capital and trade-related financings. Under Brazilian income tax rules, the gains or losses resulting from the impact of appreciation or devaluation of the
real
on foreign investments is non-taxable. This tax treatment results in volatility in the income tax line on our income statement. This asymmetry is offset through a derivative position in U.S. dollar futures, which generates gains or losses depending of any devaluation or appreciation of the
real
, which is our strategy to protect our after-tax results. The reconciliation of our effective tax rate to the statutory tax rate is set forth in note 23b to our consolidated financial statements.
Goodwill of Banco Real
We generated goodwill of R$27 billion as a result of our acquisition of Banco Real in 2008. Under IFRS, we are required to analyze goodwill for impairment at least annually or whenever there are indications of impairment. In 2013, 2012 and 2011, we assessed goodwill impairment based on net present value techniques. “Value in use” is used as the base to evaluate goodwill with the impairment test. For this purpose, we estimate cash flows for a period of 5 years considering several factors, including: (i) macro-economic projections, such as interest rates, inflation and
exchange rates, among others, (ii) the performance and growth estimates of the Brazilian financial system, (iii) increased costs, returns, synergies and investment plans, (iv) the behavior of customers; and (v) the growth rate and long-term adjustments to cash flows. These estimates rely on assumptions regarding the likelihood of future events, and changing certain factors could result in different outcomes. The estimate of cash flows is based on valuations prepared by an independent research company, which is reviewed and approved by the board of executive officers. The goodwill realization in at our level is also considered remote because the possibility of loss from impairment or disposal only applies to the entity as a whole and, according to the characteristics of the business combination performed it is not possible to segregate and identify the business originally acquired. Therefore, amortization of goodwill related to tax generates a permanent difference and no record of the deferred tax liability.
|
2013
|
2012
|
2011
|
||||||||||
|
(Value in use: cash flows)
|
||||||||||||
|
Main Assumptions
|
||||||||||||
|
Basis of valuation
|
||||||||||||
|
Period of the projections of cash flows(1)
|
5 years
|
10 years
|
10 years
|
|||||||||
|
Growth rate(2)
|
7.0 | % | 6.0 | % | 5.0 | % | ||||||
|
Discount rate(3)
|
14.8 | % | 15.0 | % | 15.2 | % | ||||||
|
(1)
|
The projections of cash flow are prepared using internal budget and growth plans of management based on historical data, market expectations and conditions such as industry growth, interest rates and inflation.
|
|
(2)
|
The growth rate is calculated based on a real growth rate of 2% p.a. adding to this an annual long term inflation.
|
|
(3)
|
The discount rate is calculated based on the capital asset pricing model.
|
|
|
We performed a sensitivity test in the goodwill impairment analysis considering the main assumptions that could reasonably be expected to possibly change, as required by the IFRS. Accordingly, we applied such a test considering the discount rate as the main assumption subject to reasonably possible change and we did not identify any impairment to goodwill.
|
Factors Affecting the Comparability of Our Results of Operations
Sale of the Investment Fund Management and Managed Portfolio Operations
On December 17, 2013, we concluded the sale of our asset management business, by way of disposal of all shares of Santander Brasil Asset Management Distribuidora de Títulos e Valores Mobiliários S.A. (“DTVM”), a company controlled by us. Net income derived from our asset management business amounted to R$74 million in 2011, R$55 million in 2012, and approximately R$55 million in 2013 through the date of sale. For further information on the sale of our asset management business, see “Item 4.—Information on the Company—A. History and Development of the Company—Important Events—Sale of the Investment Fund Management and Managed Portfolio Operations.”
Sale of Zurich Santander Brasil Seguros e Previdência S.A. (the new corporate name of Santander Seguros S.A.)
On October 5, 2011, we concluded the sale of all shares issued by Zurich Santander Brasil Seguros e Previdência S.A. and indirectly by Zurich Santander Brasil Seguros S.A. (the new corporate name of Santander Brasil Seguros S.A.) to the following companies: (i) Zurich Santander Insurance America S.L. (Zurich Santander), a holding company based in Spain that was 51% held (fifty one percent) by Zurich Financial Services Ltd. and its affiliates (Zurich) and 49% held (forty nine percent) by Santander Spain, and (ii) Inversiones ZS America SPA, a company established in Chile and held by Zurich Santander (Inversiones ZS). On June 8, 2012 SUSEP approved the transfer of the direct control of Zurich Santander Brasil Seguros e Previdência S.A. to Zurich Santander Holding (Spain), S.L., a holding company based in Spain that is 100% held by Zurich Santander and currently the owner of the shares initially transferred to Zurich Santander.
This closing effected the transfer (i) by us to Zurich Santander of 11,251,174,948 common shares of Zurich Santander Brasil Seguros e Previdência S.A., and to Inversiones ZS of 3 common shares of Zurich Santander Brasil Seguros e Previdência S.A. and (ii) payment of the preliminary purchase sale price to us, amounting to a net of R$2,741,102 thousand (received on October 5, 2011). On May 10, 2013 the final purchase price was defined by the
parties in the amount of R$2,744,990 thousand. On September 3, 2013, we concluded the offering of preemptive rights to shareholders, in accordance with Article 253 of Brazilian Corporate Law.
The assets of Zurich Santander Brasil Seguros e Previdência S.A. R$24,731,463 thousand, are primarily composed of R$21,551,422 thousand in debt instruments and equity (public securities, private securities and fund units specially constituted – guarantors of benefit plans – PGBL/VGBL). The liabilities of Zurich Santander Brasil Seguros e Previdência S.A. amount to R$22,349,428 thousand, main, represented by R$21,278,718 thousand in liabilities for securities agreements relating to technical provision for insurance operations and pension plans. The gain recognized in this operation was R$424,292 thousand, recorded as a result of our disposal of non-current assets held for sale that were not classified as discontinued operations.
This transaction fits into the strategic partnership between Santander Spain and Zurich, involving the acquisition by Zurich Santander of all property and casualty insurers and life and welfare of Santander Spain in Argentina, Brazil, Chile, Mexico and Uruguay.
As part of the arrangement of the transaction, we exclusively distribute these insurance products over the next 25 years through our branch network, with the exception of automobile insurance that is not included in the scope of the transaction. As a result of these contracts, we receive a relative payment equivalent to that received before the transaction. The operation aims to promote and strengthen our activities in the insurance market, providing a greater range of products, reaching classes of customers not currently being reached and leveraging our distribution capabilities.
Critical Accounting Policies
Our consolidated financial statements have been prepared in accordance with IFRS.
General
Our principal accounting policies are described in note 2 to our audited consolidated financial statements. The following discussion describes those areas that require the most judgment or involve a higher degree of complexity in the application of the accounting policies, and estimates that currently affect our financial condition and operational results. The accounting estimates made in these contexts require management to make assumptions about matters that are highly uncertain. In this regard, if management decides to change these estimates, or even if changes in these estimates occur from period to period, these accounting estimates could have a material impact on our financial condition and operational results.
Management bases its estimates and judgments on historical experience and on various other factors and circumstances, which are believed to be reasonable. Actual results may differ from these estimates if assumptions and conditions change. Judgments or changes in assumptions are submitted to the audit and compliance committee and to our regulatory authorities and are disclosed in the notes to our consolidated financial statements.
Fair Value of Financial Instruments
We record financial assets and liabilities as financial instruments that are classified at fair value through profit or loss, available for sale securities, and all derivatives at fair value on the balance sheet. The fair value of a financial instrument is the price that would be received to sell an asset or paid to transfer a liability in an orderly transaction between market participants at the measurement date, regardless of whether that price is directly observable or estimated using another valuation technique.
In estimating the fair value of an asset or a liability, we take into account the characteristics of the asset or liability if market participants would take those characteristics into account when pricing the asset and liability at the measurement date. That assumed transaction establishes the price to sell the asset or to transfer the liability. In the absence thereof, the price is established on the basis of valuation techniques commonly used by the financial markets.
We use derivative financial instruments for both trading and non-trading activities. The principal types of derivatives used are interest rate swaps, future rate agreements, interest rate options and futures, foreign exchange forwards, foreign exchange futures, foreign exchange options, foreign exchange swaps, cross currency swaps, equity index futures, equity options and equity swaps. The fair value of standard derivatives is calculated based on
published price quotations. The fair value of over-the-counter derivatives is calculated as the sum of the expected future cash flows arising from the instrument, discounted to present value at the date of measurement (“present value” or “theoretical close”) using valuation techniques commonly used by the financial markets as follows:
|
|
·
|
The present value method for valuing financial instruments permitting static hedging (principally, forwards and swaps) and loans and advances. Expected future cash flows are discounted using the interest rate curves of the applicable currencies. The interest rate curves are generally observable market data.
|
|
|
·
|
The Black-Scholes model for valuing financial instruments requiring dynamic hedging (principally structured options and other structured instruments). Certain observable market inputs are used in the Black-Scholes model to generate variables such as the bid-offer spread, exchange rates, volatility, correlation between indexes and market liquidity, as appropriate.
|
|
|
·
|
Each of the present value methods and the Black-Scholes models are used for valuing financial instruments exposed to interest rate risk, such as interest rate futures, caps and floors. The main inputs used in these models are principally observable market data, including appropriate interest rate curves, volatilities, correlations and exchange rates.
|
|
|
·
|
We use dynamic models similar to those used in the measurement of interest rate risk for measuring credit risk of linear instruments (such as bonds and fixed-income derivatives). In the case of non-linear instruments, if the portfolio is exposed to credit risk (such as credit derivatives), the joint probability of default is determined using the Standard Gaussian Copula model. The main inputs used to determine the underlying cost of credit for credit derivatives are quoted credit risk spreads, and the correlation between quoted credit derivatives of various issuers.
|
|
|
·
|
The determination of fair value requires us to make certain estimates and assumptions. If quoted market prices are not available, fair value is calculated using widely accepted pricing models that consider contractual prices of the underlying financial instruments, yield curves, contract terms, observable market data and other relevant factors. The use of different estimates or assumptions in these pricing models could lead to a different valuation being recorded in our consolidated financial statements.
|
See note 2d (iii) to our consolidated financial statements for additional information on valuation techniques used by us and details of the principal assumptions and estimates used in these models and the sensitivity of the valuation of financial instruments to changes in the principal assumptions used.
Impairment Losses on Financial Assets
Regarding the provision for impairment losses from credit risk, we evaluate all loans. Significant loans are individually evaluated for impairment and the loans that are not individually significant are collectively evaluated by grouping similar credit risk characteristics.
To measure the impairment loss on loans individually evaluated for impairment, we consider the conditions of the borrowers, such as their economic and financial situation, level of indebtedness, ability to generate income, cash flow, management, corporate governance and quality of internal controls, payment history, industry expertise, contingencies and credit limits, as well as characteristics of assets, such as their nature and purpose, type, sufficiency and liquidity level guarantees and total amount of credit, as well as based on historical experience of impairment and other circumstances known at the time of evaluation.
To measure the impairment loss on loans collectively evaluated for impairment, we segregate financial assets into groups considering the characteristics and similarity of credit risk, in other words, according to segment, the type of assets, guarantees and other factors associated such as the historical experience of impairment and other circumstances known at the time of assessment.
The impairment loss is calculated by the incurred loss method using statistical models that consider the following factors:
|
|
·
|
Exposure at default or “EAD” is the amount of risk exposure at the date of default by the borrower. In accordance with IFRS, the exposure at default used for this calculation is the current exposure, as reported in the balance sheet.
|
|
|
·
|
PD is the probability of the borrower failing to meet its principal and/or interest payment obligations. PD is measured using a time horizon of one year; that is, it quantifies the probability of the borrower defaulting in the coming year. A loan is in default if either the principal or interest is past due by ninety days or more or the loan is current but there are doubts as to the solvency of the counterparty (subjective doubtful assets).
|
|
|
·
|
Loss given default, or “LGD,” is the loss arising in the event of default. In addition to the Probability of Default (PD), we manage our portfolio looking for loans where borrowers will provide higher volumes of guarantees relating to the operations and also acts constantly strengthening the area of loan recovery. These and other actions combined are responsible for ensuring the adequacy of the LGD parameters (loss resulting from the event of default by the borrower to honor the principal and / or interest payments).
|
LGD calculation is based on the net charge offs on defaulted loans, taking into account the guarantees/collateral associated with the loans, the income and expenses associated with the recovery process and the timing of delinquency.
|
|
·
|
Loss identification period, or “LIP,” is the time period between the occurrence of a loss event and the identification of an objective evidence of this loss by the Bank. In other words, it represents the time horizon from the credit loss occurrence until the effective confirmation of this loss.
|
Moreover, prior to charging off past due loans (which is only done after we have completed all recovery efforts), we record provisions to the remaining balance of the loan so our allowance for impairment losses fully covers our losses. Thus, we understand that our allowance for impairment losses methodology has been developed to fit its risk metrics and capture loans that could potentially become impaired.
Impairment
Certain assets, such as intangible assets, including goodwill, equity method investments, financial assets not carried at fair value through profit or loss and other assets are subject to impairment review. We record impairment charges when we believe there is objective evidence of impairment, or that the cost of the assets may not be recoverable.
The assessment of what constitutes impairment is defined based on the following models:
We test goodwill for impairment on an annual basis, or more frequently if events or changes in economics circumstances, such as an adverse change in the Bank’s business condition or observable market data, indicate that these assets may be impaired. The recoverable amount determination used in the impairment assessment requires prices of comparable businesses, present value or other valuation techniques, or a combination thereof, requiring management to make subjective judgments and assumptions. Events and factors that may significantly affect the estimates include, among other things, competitive forces, customer behaviors and attrition, changes in revenue growth trends, cost structures and technology, and changes in discount rates and specific industry or market sector conditions. If an impairment loss is recognized for goodwill, it may not be reversed in a subsequent period (as a result of the impairment test of goodwill for 2013 and 2012 the recoverable amount of the cash generating unit did not present deterioration). The recognition of impairment is applicable when significant changes occur in the main estimates used to evaluate the recoverable amounts of the cash-generating unit (recoverable amount below the carrying amount.
Given the level of uncertainty related to these assumptions, our directors carry out sensitivity analysis using reasonably possible changes in the key assumptions on which the recoverable amount of the cash-generating units are based in order to confirm that the recoverable amounts still exceed the carrying amounts.
All debt and equity securities (other than those carried at fair value through profit or loss) are subject to impairment testing every reporting period. The carrying value is reviewed in order to determine whether an impairment loss has been incurred.
Evaluation for impairment includes both quantitative and qualitative information. For debt securities, such information include actual and estimated incurred credit losses indicated by payment default, market data on (estimated) incurred losses and other current evidence that the issuer may not pay amounts when due. Equity securities are impaired when management believes that, based on a significant or prolonged decline of fair value
below the acquisition price, there is sufficient reason to believe that the acquisition cost may not be recovered. “Significant” and “prolonged” are interpreted on a case-by-case basis for specific equity securities.
Upon impairment of either debt or equity instruments, the amount considered as effective loss is recognized in profit or loss. In addition, we did not identify any impairment of tangible assets in 2013 and 2012 (see notes 14, 13 and 12, respectively, to our audited consolidated financial statements).
Post-employment Benefit Plan
The Post-employment benefits plans include the following obligations undertaken by us: (i) to supplement the public social security system benefits, and (ii) medical assistance in the event of retirement, permanent disability or death for eligible employees and their direct beneficiaries.
Defined contribution plan
A defined contribution plan is the post-employment benefits plan for which we and our controlled entities as employer entities pay pre-determined contributions to a separate entity and will have no legal or constructive obligation to pay further contributions if the separate entity does not hold sufficient assets to honor all benefits relating to the service rendered in the current and prior periods.
These contributions are recognized as personnel expenses in the consolidated income statement.
Defined benefit plans
A defined benefit plan is the post-employment benefit plan which is not a defined contribution plan and is shown in note 21 to our audited consolidated financial statements. For this type of plan, the sponsoring entity’s obligation is to provide the agreed benefits to employees, assuming the potential actuarial risk that benefits will cost more than expected.
A defined benefit plan, the amendment of IAS 19 established fundamental changes in the accounting for and disclosure of employee post-employment benefits such as removing the mechanism of the corridor approach for recording of the obligation of the plans, as well as changes in the criteria for recognition of conventional interest of plan assets (valuation based on the discount rate actuarial liability).
The adoption of this new accounting policy involves, fundamentally, full recognition of liabilities on account of actuarial losses (actuarial deficit) not recognized previously, against to the stockholders’ equity (Statements of Comprehensive Income).
Main Definitions:
|
|
·
|
The present value of the defined benefit obligation is the present value of expected future payments required to settle the obligation resulting from employee service in the current and past periods, without deducting any plan assets.
|
|
|
·
|
Deficit or surplus is: (a) the present value of the defined benefit obligation, less (b) the fair value of plan assets.
|
|
|
·
|
The sponsoring entity may recognize the plan’s assets in the balance sheet when they meet the following characteristics: (i) the assets of the fund are sufficient to meet all employee benefit plan or a sponsor obligations; or (ii) the assets are returned to the sponsoring entity in order to reimburse it for employee benefits already paid.
|
|
|
·
|
Actuarial gains and losses are changes in present value of defined benefit obligation resulting from: (a) adjustments due to experience (the effects of differences between the actuarial assumptions adopted and what has actually occurred); and (b) effects of changes in actuarial assumptions.
|
|
|
·
|
Current service cost is the increase in the present value of the defined benefit obligation resulting from employee service in the current period.
|
|
|
·
|
The past service cost is the change in present value of defined benefit obligation for employee service in prior periods resulting from a change in the plan or reductions in the number of employees covered.
|
Post-employment benefits are recognized in the income statement in the lines of “Interest expense and similar charges” and “Provisions (net).”
The defined benefit plans are recorded based on an actuarial study, conducted annually by an external consultant, at the end of each year to be effective for the subsequent period.
Results of Operations for the year ended December 31, 2013 Compared to the year ended December 31, 2012
On December 17, 2013, we gave notice to the market of the sale of our asset management business by way of disposal of all shares of DTVM, a company controlled by us. The asset management activities then performed by DTVM were segregated into a new asset manager created for that purpose. The sales price was R$2,243 million, generating a post-tax capital gain of R$1,205 million (after deducting costs).
We will remain as the administrator of the funds and in charge of distribution activities, receiving remuneration in line with market practices. The transaction is part of a worldwide partnership between Santander Spain and two of the world’s leading private equity companies, Warburg Pincus and General Atlantic.
Due to the sale of the Asset Management business, we reviewed our business segmentation and concluded that it would be more appropriate to merge both of our insurance and asset management segments with the Commercial Banking segment. This change was reflected retrospectively on the periods reported on this form.
Highlights
For the year ended December 31, 2013, we reported a consolidated net income of R$5.8 billion, a 6.5% increase as compared to 2012. Impairment losses on financial assets decreased 14.3%, or R$2.4 billion, to R$14.1 billion for the year ended December 31, 2013 as compared to R$16.5 billion for the year ended December 31 2012, as a consequence of decreases in delinquency rates during 2013.
Changes in our default rates were in line with the general trend of decreasing default rates in the financial system, particularly as observed among private banks, which started in 2012 and lasted throughout 2013, as observed by a decrease in our delinquency rate of loans past due over 90 days from 7.6% in December 2012 to 6.2% in December 2013 (a decrease of 1.4 percentage points).
The coverage ratio was 97.3% in December 2013, a 9.9 percentage point increase as compared to 87.4% in December 2012.
Our total loan portfolio increased by 7.3% from R$210.7 billion on December 31, 2012 to R$226.2 billion on December 31, 2013. Loans to individuals and corporate customers presented the strongest growth, with increases of R$4,163 million and R$13,363 million, respectively, during the year ended December 31, 2013 compared to 2012. Growth in lending to individuals was driven by an increase of 30.3% in mortgage loans and 5.8% in credit cards. The growth in lending to corporate customers of 18.9% was positively impacted by the exchange rate variation.
Deposits from Brazilian Central Bank and deposits from credit institutions plus customer deposits increased by 4.7% to R$234.2 billion on December 31, 2013 from R$223.7 billion on December 31, 2012.
Our efficiency ratio was 38.8% in December 2013, a 3.1 percentage point increase from 35.7% in December 2012.
Our Basel capital adequacy ratio, in accordance with the Brazilian Central Bank was 19.2% as of December 31, 2013. According to the new rules on regulatory capital in Brazil, the value of goodwill for the calculation of capital base will be deducted from the capital base according to the “phase-in” for implementation of Basel III in Brazil which will be completed by 2019. For further information, see “Item 4. B. Business Overview—Regulation and supervision—
Capital Adequancy and Leverage—Basel
.”
Results of Operations
The following table shows the main components of our net income for 2013 and 2012.
|
For the year ended December 31
|
||||||||||||||||
|
2013
|
2012
|
% Change
|
Change
|
|||||||||||||
|
(in millions of R$, except percentages)
|
||||||||||||||||
|
Net interest income
|
28,479 | 31,587 | (9.8 | )% | (3,108 | ) | ||||||||||
|
Income from equity instruments
|
81 | 94 | (13.3 | )% | (12 | ) | ||||||||||
|
Income from companies accounted for by the equity method
|
91 | 73 | 24.6 | % | 18 | |||||||||||
|
Net fees and commissions
|
8,100 | 7,610 | 6.4 | % | 491 | |||||||||||
|
Gains/losses on financial assets and liabilities (net) and exchange differences (net)
|
(595 | ) | (170 | ) |
n.d.
|
(425 | ) | |||||||||
|
Other operating income (expenses)
|
(445 | ) | (623 | ) | (28.6 | )% | 179 | |||||||||
|
Total income
|
35,713 | 38,570 | (7.4 | )% | (2,858 | ) | ||||||||||
|
Administrative expenses
|
(13,850 | ) | (13,773 | ) | 0.6 | % | (78 | ) | ||||||||
|
Depreciation and amortization
|
(1,252 | ) | (1,201 | ) | 4.3 | % | (51 | ) | ||||||||
|
Provisions (net)
|
(2,693 | ) | (2,057 | ) | 30.9 | % | (636 | ) | ||||||||
|
Impairment losses on financial assets (net)
|
(14,118 | ) | (16,476 | ) | (14.3 | )% | 2,358 | |||||||||
|
Impairment losses on other assets (net)
|
(345 | ) | (38 | ) |
n.d.
|
(306 | ) | |||||||||
|
Other non-financial gains/losses
|
563 | 449 | 25.5 | % | 115 | |||||||||||
|
Operating profit before tax
|
4,018 | 5,475 | (26.6 | )% | (1,457 | ) | ||||||||||
|
Income taxes
|
(234 | ) | (37 | ) |
n.d.
|
(197 | ) | |||||||||
|
Net profit from continuing operations
|
3,785 | 5,438 | (30.4 | )% | (1,653 | ) | ||||||||||
|
Discontinued operations
|
2,063 | 55 |
n.d.
|
2,008 | ||||||||||||
|
Consolidated Profit for the Year
|
5,848 | 5,493 | 6.5 | % | 355 | |||||||||||
Our consolidated profit for the year ended December 31, 2013 was R$5.8 billion, a 6.5%, increase as compared to 2012.
This variation in our consolidated profit for the year was mainly due to:
|
|
·
|
A decrease of 14.3%, or R$2,358 million, in impairment losses on financial assets (net) for the year ended December 31, 2013 compared to the year ended December 31, 2012, mainly as a consequence of the improvement in the quality of our loan portfolio.
|
|
|
·
|
An increase of R$2,008 million, in discontinued operations for the year ended December 31, 2013 compared to the year ended December 31, 2012, principally due to gains of the sale of Santander Brasil Asset Management Distribuidora de Títulos e Valores Mobiliários. For further information, see “Item 4. Information on the Company—A History and Development of the Company—Important Events—Sale of the Investment Fund Management and Managed Portfolio Operations.”
|
These increases were offset by:
|
|
·
|
A 9.8% or R$3,108 million, decrease in net interest income for the year ended December 31, 2013 as compared to the year ended December 31, 2012 mainly due to lower average spreads, which are mainly explained by a greater share of products within our credit portfolio with lower spreads and lower risk.
|
|
|
·
|
A 30.9% or R$636 million, increase in net provisions for the year ended December 31, 2013 compared to the year ended December 31, 2012. This increase was mainly due to R$988 million in expenses to establish a fund to cover the impact of projects aimed at improving operational productivity and efficiency, partially offset by gains of R$568 million related to the installment program and cash payment of tax and social security debts.
|
Net Interest Income
Net interest income for the year ended December 31, 2013 was R$28,479 million, a 9.8%, or R$3,108 million, decrease from R$31,587 million for the year ended December 31, 2012. Revenues from lending activities decreased R$2,212 million or 9.2% during the year mainly explained by the increased share of products in the credit portfolio with lower spreads and lower credit risk.
Average total earning assets in 2013 were R$358.9 billion, a 7.7% or R$26 million increase from R$333.2 billion in 2012. The principal drivers of this increase were an increase of R$22.0 billion in average of loans and amounts due from credit institutions and loans and advances to customers. Net yield (the net interest income divided by average earning assets) was 8.0% in 2013, a decrease of 1.5 percentage point compared to 9.5% in 2012.
Average total interest bearing liabilities in 2013 were R$287.4 billion, an 8.3% or R$22 billion increase from R$265.3 billion in 2012. The main driver of this growth was an increase of R$12 billion in marketable debt securities and R$15 billion in customer deposits, partially offset by a R$4 billion in deposits from credit institutions.
Finally, the yield spread (the difference between gross yield on earning assets and the average cost of interest-bearing liabilities) in 2013 was 6.4%, 1.5 percentage point lower than in 2012, which was 7.9%.
Income from Equity Instruments
Income from Equity Instruments for the year ended December 31, 2013 totaled R$81 million, a 13.3%, decrease from R$94 million for the year ended December 31, 2012.
Income from Companies Accounted for by the Equity Method
Income from companies accounted for by the equity method for the year ended December 31, 2013 was R$91 million, a R$18 million increase from R$73 million for the year ended December 31, 2012. This increase principally reflects an increase in the results of Tecnologia Bancária S.A., our subsidiary that is specialized in self-service banking network management and Webmotors S.A., our subsidiary that operates an online automobile trading platform.
Net Fee and Commission Income
Net fee and commission income for the year ended December 31, 2013 reached R$8,100 million, a 6.4%, or R$491 million, increase from R$7,610 million for the year ended December 31, 2012. This increase was mainly due to an increase in commissions from credit and debit cards and an increase in commissions for insurance and capitalization products.
Revenues from credit and debit cards totaled R$1,940 million for the year ended December 31, 2013, an increase of 18.3% compared to the year ended December 31, 2012, mainly due to the increase in the volume of credit card of transactions and higher revenues from merchant acquiring services. Our credit card base increased 7.6% and our debit card base increased 11.1% for the year ended December, 31, 2013, both reaching a total of 53,2 million issued cards.
Revenues from insurance and capitalization products totaled R$1,978 million for the year ended December 31, 2013, a 21.2% increase compared to the year ended December 31, 2012. This increase was primarily due to life and personal accident insurance products business growth.
The following table reflects the breakdown of net fee and commission income for the year ended December 31, 2013 and 2012:
|
For the year ended December 31
|
||||||||||||||||
|
2013
|
2012
|
% Change
|
Change
|
|||||||||||||
|
(in millions of R$, except percentages)
|
||||||||||||||||
|
Banking fees
|
2,423 | 2,545 | (4.8 | )% | (123 | ) | ||||||||||
|
Receiving Services
|
652 | 581 | 12.2 | % | 71 | |||||||||||
|
Insurance and Capitalization
|
1,978 | 1,631 | 21.2 | % | 347 | |||||||||||
|
Asset Management and Pension Funds
|
999 | 1,089 | (8.3 | )% | (90 | ) | ||||||||||
|
Credit and debit cards
|
1,940 | 1,640 | 18.3 | % | 300 | |||||||||||
|
Capital markets
|
416 | 398 | 4.4 | % | 18 | |||||||||||
|
Trade finance
|
393 | 336 | 16.9 | % | 57 | |||||||||||
|
Tax on services
|
(374 | ) | (353 | ) | 6.0 | % | (21 | ) | ||||||||
|
Others
|
(326 | ) | (258 | ) | 26.1 | % | (68 | ) | ||||||||
|
Total
|
8,100 | 7,610 | 6.4 | % | 491 | |||||||||||
Gains/losses on Financial Assets and Liabilities (net) and Exchange Differences (net)
Gains/losses on financial assets and liabilities (net) and exchange differences for the year ended December 31, 2013 were losses of R$595 million, a R$425 million increase from losses of R$170 million for the year ended December 31, 2012. This variation is due to higher expenses related to derivative instruments used to hedge the impact of exchange rate variation on our foreign branches (for further information see “Item 5. Operating and Financial Review and Prospects—A. Operating Results—Other Factors Affecting Our Financial Condition and Results of Operations”), partially offset by income of R$208 million from market activities.
Other Operating Income/Expenses
Other operating income/expenses for the year ended December 31, 2013 was an expense of R$445 million, a decrease of R$179 million compared to an expense of R$623 million for the year ended December 31, 2012.
Administrative Expenses
Administrative Expenses for the year ended December 31, 2013 were R$13,850 million, a R$78 million increase compared to expenses of R$13,773 million for the year ended December 31, 2012.
Personnel expenses decreased R$41 million for the year ended December 31, 2013, due principally to lower labor indemnities expenses partially offset by the impact of our collective bargaining agreement.
|
For the year ended December 31
|
||||||||||||||||
| 2013 |
2012
|
% Change
|
Change
|
|||||||||||||
|
(in millions of R$, except percentages)
|
||||||||||||||||
|
Salaries
|
4,315 | 4,304 | 0.3 | % | 11 | |||||||||||
|
Social security
|
1,169 | 1,177 | (0.6 | )% | (8 | ) | ||||||||||
|
Benefits
|
1,051 | 983 | 6.9 | % | 68 | |||||||||||
|
Training
|
135 | 141 | (3.9 | )% | (6 | ) | ||||||||||
|
Others
|
376 | 482 | (22.1 | )% | (107 | ) | ||||||||||
|
Total
|
7,046 | 7,086 | (0.6 | )% | (41 | ) | ||||||||||
Other administrative expenses increased R$118 million from R$6,686 million for the year ended December 31, 2012 to R$6,805 million for the year ended December 31, 2013. The increase was primarily due to higher expenses from specialized and technical services, property, fixtures and supplies partially offset by other administrative expenses.
The efficiency ratio, which we calculate as total administrative expenses divided by total income, reached 38.8% in the year ended December 31, 2013, as compared to 35.7% for the year ended December 31, 2012.
The following table sets forth other administrative expenses for each of the periods indicated:
|
For the year ended December 31
|
||||||||||||||||
|
2013
|
2012
|
% Change
|
Change
|
|||||||||||||
|
(in millions of R$, except percentages)
|
||||||||||||||||
|
Specialized and technical services
|
1,991 | 1,719 | 15.8 | % | 272 | |||||||||||
|
Property, fixtures and supplies
|
1,248 | 1,171 | 6.6 | % | 77 | |||||||||||
|
Technology and systems
|
1,110 | 1,075 | 3.3 | % | 35 | |||||||||||
|
Advertising
|
461 | 499 | (7.5 | )% | (37 | ) | ||||||||||
|
Communications
|
573 | 573 | (0.1 | )% | (0 | ) | ||||||||||
|
Per diems and travel expenses
|
171 | 174 | (1.9 | )% | (3 | ) | ||||||||||
|
Surveillance and cash courier services
|
570 | 564 | 1.1 | % | 6 | |||||||||||
|
Other administrative expenses
|
681 | 912 | (25.3 | )% | (231 | ) | ||||||||||
|
Total
|
6,805 | 6,686 | 1.8 | % | 118 | |||||||||||
Depreciation and Amortization
Depreciation and amortization for the year ended December 31, 2013 was R$1,252 million, a R$51 million increase from R$1,201 million for the year ended December 31, 2012, principally due to the amortization of our technological systems.
Provisions (Net)
Provisions principally include provisions for tax, civil, and especially labor claims. Provisions (net) totaled R$2,693 million for the year ended December 31, 2013, an increase of R$636 million compared to R$2,057 million for the year ended December 31, 2012. This increase was mainly due to R$988 million in expenses to establish a fund to cover the impact of projects aimed at improving operational productivity and efficiency, partially offset by gains of R$568 million related to the installment program and cash payment of tax and social security debts.
Impairment Losses on Financial Assets (Net)
Our computable credit risk portfolio increased by R$18.6 billion at December 31, 2013, or 7.8% compared to the year-end 2012, while non-performing assets decreased 12.7%, or R$2 billion. The default rate had a decrease of 130 basis points in 2013, compared to the same period of the prior year. The net expenses from the allowances for credit losses in 2013 decreased 15.6% compared to 2012 (R$16.4 billion), accounting for R$13.9 billion at December 31, 2013.
The following table shows the ratio of our impaired assets to total computable credit risk and our coverage ratio at December 31, 2013 and December 31, 2012.
|
At December 31,
|
||||||||
|
2013
|
2012
|
|||||||
|
(in millions of R$, except percentages)
|
||||||||
|
Computable credit risk(1)
|
257,420 | 238,807 | ||||||
|
Non-performing assets
|
14,022 | 16,057 | ||||||
|
Allowances for impairment losses
|
13,641 | 14,042 | ||||||
|
Ratios
|
||||||||
|
Non-performing assets to computable credit risk
|
5.4 | % | 6.7 | % | ||||
|
Coverage ratio(2)
|
97.3 | % | 87.3 | % | ||||
|
Net Expenses
|
(13,900 | ) | (16,476 | ) | ||||
|
Other financial instruments not measured at fair value(3)
|
(218 | ) | — | |||||
|
Total net expenses
|
(14,118 | ) | (16,476 | ) | ||||
|
(1)
|
Computable credit risk is the sum of the face amounts of loans and leases (including non-performing assets but excluding country risk loans), guarantees and documentary credits.
|
|
(2)
|
Allowances for impairment losses as a percentage of non-performing assets.
|
|
(3)
|
Corresponds to registration of losses of permanent character in the realization value of bonds and securities classified as “Securities available for sale” recognized currently in “Earnings on financials assets (net).”
|
The following chart shows our non-performing assets to credit risk ratio from the fourth quarter of 2012 through the fourth quarter of 2013:
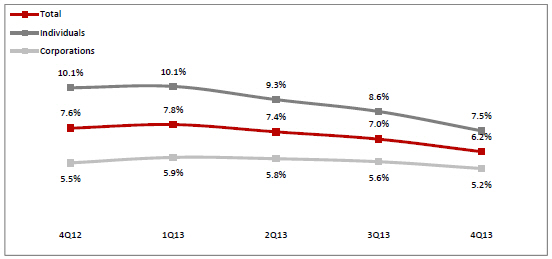
Impaired Assets by Type of Customer
The following table shows our non-performing assets by type of loan at December 31, 2013 and December 31, 2012.
|
At December 31,
|
||||||||
|
2013
|
2012
|
|||||||
|
(in millions of R$)
|
||||||||
|
Commercial, financial and industrial
|
6,410 | 6,157 | ||||||
|
Real estate – mortgage
|
316 | 283 | ||||||
|
Installment loans to individuals
|
7,167 | 9,368 | ||||||
|
Financial Leasing
|
129 | 249 | ||||||
|
Total
|
14,022 | 16,057 | ||||||
For a discussion of the evolution in impairment in our lending portfolios and our methodology for loan loss allowances with respect to the following lending portfolios, see “Item 4. Information on the Company—B. Business Overview—Selected Statistical Information—Evolution of Impaired Assets—Impaired Assets—Methodology for loan loss allowances.”
Commercial, financial and industrial
Non-performing assets in the portfolio of commercial, financial and industrial loans amounted to R$6,410 million at December 31, 2013, an increase of R$253 million or 4.1% compared to the same period last year.
The increase in non-performing assets in this portfolio was mainly caused by the slowdown in the Brazilian economy, whose GDP of 2.3% in 2013 was below initial expectations.
In 2013 the Brazilian economy was negatively impacted by the measures adopted by the Brazilian government. In 2013, the Brazilian Central Bank increased the SELIC rate from 7.25% at December 31, 2012 to 10.0% at December 31, 2013 in response to inflation in the first half of the year and also to mitigate the devaluation of the Brazilian currency as a consequence of the uncertainties in international financial markets caused by policy measures in the European and North American economy.
Trends observed in 2013 were consistent with the trend observed in 2012 and 2011, when the government measures aimed to control inflation also led to increases in production costs and adversely affected the ability of our industrial customers to honor their debts.
Despite the increase in non-performing assets, there has been a reduction in default rates since the second quarter of 2013. This behavior was mainly due to the measures adopted by the Bank in late 2012, primarily related to the reassessment of limits for loans with higher level of collateral requirements and to the review of collection practices with respect to our borrowers whereby we offered certain customers the chance to negotiate a restructuring of their debts. These and other actions in 2013 helped improve the quality of this credit portfolio.
Real estate
Non-performing assets in the real estate lending portfolio totaled R$316 million at December 31, 2013, an increase of R$33 million or 11.6% compared to 2012.
The increase in non-performing assets was primarily due to the growth of this credit portfolio, which grew by 27.1% in 2013. Notwithstanding the increase in non-performing assets, the default rate in the real estate lending portfolio reached 1.24% at December 31, 2013 a decrease of 17 basis points compared to December 31, 2012.
In general, the decrease in default rate was mainly due to the improvement in the quality of this loan portfolio, as a consequence of the change in our portfolio mix in late 2012, with an increased share of secured mortgage loans, which we consider a strategic product due to the lower risk of default.
Installment loans to individuals
Non-performing assets in the installment loans to individuals lending portfolio totaled R$7,167 million at December 31,2013, with a reduction of 23.5%, or R$2,201 million compared to 2012, with an increased share of secured mortgage loans, which we consider a strategic product due to the lower risk of default.
The decrease in non-performing assets reflects the measures adopted by the Bank in late 2012 to manage default rates in this portfolio, which included the adaptation of credit limits for new customers, the development of new loan models with “predictive scoring” enhancements and recovery campaigns to offer to delinquent customers loan terms adjustments to help them meet their payment obligations.
Although the Brazilian economy continues presenting an unfavorable outlook for growth, low unemployment levels and a continued rise in the disposable income have contributed positively to the reduction in default rates in this portfolio.
Financial Leasing
Non-performing assets in the financial leasing lending portfolio totaled R$129 million at December 31, 2013, with a reduction of 48.2%, or R$120 million compared to the same period last year, primarily due to the reduction in lending in this portfolio, in line with the market trend of decreased automobile financing to individuals. This trend was also observed in 2012, when non-performing assets in the financial leasing lending portfolio decreased 38.7%, or R$157 million compared to the same period of 2011.
Impairment Losses on Other Assets (Net)
Impairment losses on other assets (net) for the year ended December 31, 2013 were losses of R$345 million, mainly due to losses of R$254 million related to impairment of software, due to obsolescence and discontinuity of such systems.
Other Non-Financial Gains/Losses
Other non-financial gains/losses were gains of R$563 million during the year ended December 31, 2013, a R$115 million increase from gains of R$449 million during the year ended December 31, 2012, mainly due to R$290 million related to an increase in Webmotor’s capital and a R$154 million increase in gains related to foreclosed assets, partially offset by lower gains on sale of properties to the Real Estate Fund (R$335 million for the year ended December 31, 2013 as compared to R$88 million for the year ended December, 31, 2012).
Income Taxes
Income taxes expense includes income tax, social contribution, PIS and COFINS (which are social contributions due on some revenues net of some expenses). Tax expenses reached R$234 million for the year of
2013, a R$197 million increase from R$37 million for the year 2012. There are some significant permanent differences that impact the tax rate, including: interest on capital, goodwill amortization and the foreign exchange valuation on investments abroad. The effective tax rate is set forth on note 22b in the consolidated financial statements.
Discontinued Operations
Discontinued Operations include the results and the sale of the Asset Management. Discontinued operations reached R$2,063 million for the year ended December, 31, 2013, a R$2,008 million increase from R$55 million for the year ended December 31, 2012, principally due to gains on the sale of Santander Brasil Asset Management Distribuidora de Títulos e Valores Mobiliários.
Results of Operations by Segment for the Year ended December 31, 2013 Compared to the Year ended December 31, 2012
The following tables show our results of operations for the years ended December 31, 2013 and 2012, for each of our operating segments.
Commercial Banking
|
For the year ended December 31
|
||||||||||||||||
|
2013
|
2012
|
% Change
|
Change
|
|||||||||||||
|
(in millions of R$, except percentages)
|
||||||||||||||||
|
Net interest income
|
26,328 | 29,470 | (10.7 | )% | (3,142 | ) | ||||||||||
|
Income from equity instruments
|
81 | 94 | (13.3 | )% | (12 | ) | ||||||||||
|
Income from companies accounted for by the equity method
|
91 | 73 | 24.6 | % | 18 | |||||||||||
|
Net fee and commission income
|
7,241 | 6,870 | 5.4 | % | 371 | |||||||||||
|
Gains/losses on financial assets and liabilities (net) and exchange
|
||||||||||||||||
|
differences (net)
|
(1,316 | ) | (650 | ) | 102.6 | % | (667 | ) | ||||||||
|
Other operating income (expenses)
|
(422 | ) | (600 | ) | (29.7 | )% | 178 | |||||||||
|
Total income
|
32,003 | 35,257 | (9.2 | )% | (3,254 | ) | ||||||||||
|
Personnel expenses
|
(6,456 | ) | (6,546 | ) | (1.4 | )% | 90 | |||||||||
|
Other administrative expenses
|
(6,547 | ) | (6,461 | ) | 1.3 | % | (86 | ) | ||||||||
|
Depreciation and amortization
|
(1,134 | ) | (1,091 | ) | 3.9 | % | (42 | ) | ||||||||
|
Provisions (net)
|
(2,740 | ) | (2,062 | ) | 32.9 | % | (678 | ) | ||||||||
|
Impairment losses on financial assets (net)
|
(13,837 | ) | (16,404 | ) | (15.6 | )% | 2,567 | |||||||||
|
Impairment losses on other assets (net)
|
(344 | ) | (38 | ) |
n.d.
|
(305 | ) | |||||||||
|
Other nonfinancial gain (losses)
|
563 | 449 | 25.5 | % | 115 | |||||||||||
|
Operating profit before tax
|
1,510 | 3,103 | (51.3 | )% | (1,593 | ) | ||||||||||
|
Discontinued Operations
|
2,063 | 55 |
n.d.
|
2,008 | ||||||||||||
Profit before tax attributed to the Commercial Banking segment for the year ended December 31, 2013 was R$1,510 million, a R$1,593 million decrease from R$3,103 million for the year ended December 31, 2012.
This variation was mainly due to:
A decrease of 10.7%, or R$3.142 million, in net interest income for the year ended December 31, 2013 compared to the year ended December 31, 2012. Revenues from lending activities decreased R$2,212 million or 9.2% during the year, primarily due to the increasing share of the products in the loan portfolio with lower spreads and lower risk.
An increase of 102.6%, or R$667 million, in gains/losses on financial assets and liabilities (net) and exchange differences (net) for the year ended December 31, 2013 compared to the year ended December 31, 2012. This variation is primarily due to higher expenses related to derivative instruments used to hedge the impact of exchange rate variation on our foreign branches.
An increase of 32.9%, or R$678 million, in provisions (net) for the year ended December 31, 2013 compared to the year ended December 31, 2012. This increase was mainly due to R$988 million in expenses to establish a fund to cover the impact of projects aimed at improving operational productivity and efficiency, partially offset by gains of R$568 million related to the installment program and cash payment of tax and social security debts.
These decreases were partially offset by:
A 15.6%, or R$2,567 million, decrease in impairment losses on financial assets (net), for the year ended December 31, 2013 as compared to the year ended December 31, 2012, mainly as a consequence of the improvement in the quality of our credit portfolio.
An increase of 5.4%, or R$371 million, in net fee and commission income for the year ended December 31, 2013 compared to the year ended December 31, 2012, mainly due to the increase in credit card volume transactions and higher revenues from merchant acquiring services.
Global Wholesale Banking
|
For the year ended December 31
|
||||||||||||||||
|
2013
|
2012
|
% Change
|
Change
|
|||||||||||||
|
(in millions of R$, except percentages)
|
||||||||||||||||
|
Net interest income
|
2,151 | 2,117 | 1.6 | % | 34 | |||||||||||
|
Net fee and commission income
|
859 | 740 | 16.1 | % | 119 | |||||||||||
|
Gains/losses on financial assets and liabilities (net) and exchange differences (net)
|
722 | 480 | 50.4 | % | 242 | |||||||||||
|
Other operating income (expenses)
|
(23 | ) | (24 | ) | (2.2 | )% | 1 | |||||||||
|
Total income
|
3,709 | 3,313 | 11.9 | % | 396 | |||||||||||
|
Personnel expenses
|
(590 | ) | (541 | ) | 9.1 | % | (49 | ) | ||||||||
|
Other administrative expenses
|
(258 | ) | (225 | ) | 14.4 | % | (33 | ) | ||||||||
|
Depreciation and amortization
|
(118 | ) | (109 | ) | 8.0 | % | (9 | ) | ||||||||
|
Provisions (net)
|
47 | 6 |
n.d.
|
42 | ||||||||||||
|
Impairment losses on financial assets (net)
|
(281 | ) | (72 | ) |
n.d.
|
(209 | ) | |||||||||
|
Impairment losses on other assets (net)
|
(1 | ) | 0 |
n.d.
|
(1 | ) | ||||||||||
|
Profit before tax
|
2,508 | 2,372 | 5.8 | % | 137 | |||||||||||
|
Discontinued operations
|
— | — | — | — | ||||||||||||
Profit before tax attributed to the Global Wholesale Banking segment for the year ended December 31, 2013 was R$2.5 billion, a 5.8%, or R$137 million, increase from R$2.4 billion for the year ended December 31, 2012.
This variation was mainly due to:
An increase of 16.1%, or R$119 million, in net fee and commission income for the year ended December 31, 2013 compared to the year ended December 31, 2012, mainly due to an increase in commissions for products for cash management and guarantees.
An increase of 50.4%, or R$242 million, in gains/losses on financial assets and liabilities (net) and exchange differences for the year ended December 31, 2013 compared to the year ended December 31, 2012, primarily due to income of R$208 million from treasury operations for our customers.
These increases were offset by an increase of R$209 million in impairment losses or financial assets (net), reflecting deterioration in our Global Wholesale Banking segment credit portfolio.
Results of Operations for the year ended December 31, 2012 Compared to the year ended December 31, 2011
Highlights
For the year ended December 31, 2012, we reported a consolidated net income of R$5.5 billion, a 29.1% decrease as compared to 2011. Total revenues in 2012 were R$34.8 billion, a 6.8% increase from R$32.6 billion in
2011, mainly driven by an increase in net interest income. Administrative expenses increased by 7.7% year over year.
Our total loan portfolio increased by 8.5% from R$194.2 billion on December 31, 2011 to R$210.7 billion on December 31, 2012. The individual and corporate lending portfolios presented the strongest growth, with increases of R$6,864 million and R$10,586 million, respectively, during the year ended December 31, 2012 compared to 2011. Individual lending growth was driven mainly due to an increase of 29.9% in renegotiation and 23.0% in mortgage loans. Corporate lending increased by 10.6% due to the positive effects of the exchange rate variation.
Our delinquency ratio in December 2012 was 6.7%, as compared to 6.0% in December 2011.
The coverage ratio was 87.4% in December 31, 2012, a 1.9 percentage point increase from 85.5% in December 31, 2011.
Deposits from Brazilian Central Bank and deposits from credit institutions plus customer deposits decreased by 1.0% to R$223.7 billion on December 31, 2012 from R$226.0 billion on December 31, 2011.
Our efficiency ratio was 35.7% in December 2012, a 1.3 percentage point decrease from 37.0% in December 2011. This improvement was principally due to the increase in revenue from interest and fees.
Our Basel capital adequacy ratio at December 31, 2012 was 24.8% in accordance with Brazilian Central Bank rules (disregarding the effect of goodwill, the Basel capital adequacy ratio was 20.2%).
Results of Operations
The following table shows the main components of our net income for 2012 and 2011.
|
For the year ended December 31
|
||||||||||||||||
|
2012
|
2011
|
% Change
|
Change
|
|||||||||||||
|
(in millions of R$, except percentages)
|
||||||||||||||||
|
Net interest income
|
31,587 | 27,796 | 13.6 | % | 3,791 | |||||||||||
|
Income from equity instruments
|
94 | 94 | 0.1 | % | 0 | |||||||||||
|
Income from companies accounted for by the equity method
|
73 | 54 | 35.2 | % | 19 | |||||||||||
|
Net fees and commissions
|
7,610 | 7,199 | 5.7 | % | 410 | |||||||||||
|
Gains/losses on financial assets and liabilities (net) and exchange differences (net)
|
(170 | ) | (255 | ) | (33.3 | )% | 85 | |||||||||
|
Other operating income (expenses)
|
(623 | ) | (378 | ) | 65.1 | % | (246 | ) | ||||||||
|
Total income
|
38,570 | 34,510 | 11.8 | % | 4,060 | |||||||||||
|
Administrative expenses
|
(13,773 | ) | (12,783 | ) | 7.7 | % | (990 | ) | ||||||||
|
Depreciation and amortization
|
(1,201 | ) | (1,000 | ) | 20.0 | % | (200 | ) | ||||||||
|
Provisions (net)
|
(2,057 | ) | (2,985 | ) | (31.1 | )% | 929 | |||||||||
|
Impairment losses on financial assets (net):
|
(16,476 | ) | (9,382 | ) | 75.6 | % | (7,094 | ) | ||||||||
|
Impairment losses on other assets (net)
|
(38 | ) | (39 | ) | (0.7 | )% | 0 | |||||||||
|
Other non-financial gains/losses
|
449 | 452 | (0.7 | )% | (3 | ) | ||||||||||
|
Operating profit before tax
|
5,475 | 8,774 | (37.6 | )% | (3,299 | ) | ||||||||||
|
Income taxes
|
(37 | ) | (1,101 | ) | (96.6 | )% | 1,064 | |||||||||
|
Net profit from continuing operations
|
5,438 | 7,673 | (29.1 | )% | (2,235 | ) | ||||||||||
|
Discontinued operations
|
55 | 74 | (25.5 | )% | (19 | ) | ||||||||||
|
Consolidated Profit for the Year
|
5,493 | 7,747 | (29.1 | )% | (2,254 | ) | ||||||||||
Consolidated Profit for the year ended December 31, 2012 was R$5.5 billion, a 29.1%, or R$2.2 billion, decrease from R$7.7 billion for the year ended December 31, 2011.
This variation was mainly due to:
|
|
·
|
A 13.6%, or R$3,791 million, increase in net interest income for the year ended December 31, 2012 compared to the year ended December 31, 2011, mainly due to an increase of R$3.1 billion in revenues from lending activities, driven by loans to individuals and SME customers.
|
|
|
·
|
An increase of 5.7%, or R$410 million, in net fee and commission income for the year ended December 31, 2012 compared to the year ended December 31, 2011, principally due to: (1) an increase in revenues from credit and debit cards, which mainly reflects the increase in fees from our merchant acquiring services, and the adoption of a strategy based on innovation and a focus on customer needs, resulting in an increase in both the credit card base and product penetration and; (2) an increase in revenues from banking fees due to growth of our customer base. These increases were partially offset by a decrease in commissions from trade finance operations.
|
|
|
·
|
Income taxes declined by R$1,064 million in the year ended December 31, 2012, compared to the year ended December 31, 2011. Income tax expense includes: Income tax, social contribution, PIS and COFINS (which are social contributions due on some revenues net of some expenses). There are some significant permanent differences that impact the tax rate: interest on capital, goodwill amortization and the foreign exchange valuation on investments abroad.
|
|
|
·
|
A decrease of R$929 million in provisions for the year ended December 31, 2012. Provisions principally include provisions for tax, civil, and labor contingencies. The decrease was primarily due to our efforts and initiatives to normalize contingency levels, especially contingencies for labor claims.
|
These increases were offset by:
|
|
·
|
An increase of 7.7% or R$990 million in administrative expenses for the year ended December 31, 2012 as compared to the year ended December 31, 2011 mainly due to labor cost increases tied to inflation, and the continuous expansion of our branch network, with the addition of 52 new branches in 2012.
|
|
|
·
|
An increase of 75.6%, or R$7,094 million, in impairment losses on financial assets for the year ended December 31, 2012 as compared to the year ended December 31 2011. Following the evolution of default rate on the financial system, especially private banks, which began in 2011 and lasted throughout 2012, we were also affected by this trend, and our default rate changed from 6.0% in December 2011 to 6.7% in December 2012 (an increase of 170 basis points). For individuals, this increase in the default rate was primarily due to the rising level of indebtedness of households (an average increase of 22.0% in the period from January 2012 to October 2012, according to surveys by the Brazilian Central Bank). For corporations, the rise in the level of default rate reflects the lower pace of economic growth and changes in the portfolio mix, principally, a higher share of SMEs in the portfolio.
|
Net Interest Income
Net interest income for the year ended December 31, 2012 was R$31,587 million, a 13.6%, or R$3,791 million, increase from R$27,796 million for the year ended December 31, 2011. Revenues from lending activities increased R$3,137 million or 14.9% during the year due to a 14.5% or R$24,894 million, increase in the average loan portfolio volume, driven by increased lending to individuals and SMEs. For further information on the loan portfolio, see Item 3. Key Information—Selected Statistical Information—Loan Portfolio.
Average total earning assets in 2012 were R$333.2 billion, a 2.9% or R$9.5 billion increase from R$323.7 billion in 2011. The principal drivers of this increase were an increase of R$24.0 billion in average of loans and advances to customers, partially offset by a decrease of R$15.1 billion in equity instruments. Net yield (net interest income divided by average earning assets) was 9.5% in 2012, an increase of 0.9 percentage points compared to 8.6% in 2011.
Average total interest bearing liabilities in 2012 were R$265.3 billion, an 8.5% or R$20.9 billion increase from R$244.4 billion in 2011. The main driver of this growth was an increase of R$16.3 billion in marketable debt securities and R$7 billion in customer deposits, partially offset by R$3.2 billion in deposits from credit institutions.
Finally, the yield spread (the difference between gross yield on earning assets and the average cost of interest-bearing liabilities) in 2012 was 7.9%, 1.6 percentage point higher than in 2011, which was 6.3%.
Income from Equity Instruments
Income from Equity Instruments for the year ended December 31, 2012 totaled R$94.0 million, which was stable in comparison to 2011.
Income from Companies Accounted for by the Equity Method
Income from companies accounted for by the equity method for the year ended December 31, 2012 was R$73 million, a R$19 million increase from R$54 million for the year ended December 31, 2011. This increase principally reflects an increase in the results of Companhia de Crédito, Financiamento e Investimento RCI Brasil, partially offset by lower results from Companhia de Arrendamento Mercantil RCI Brasil.
Net Fee and Commission Income
Net fee and commission income for the year ended December 31, 2012 reached R$7,610 million, a 5.7%, or R$410 million, increase from R$7,199 million for the year ended December 31, 2011. This increase was mainly due to an increase in commissions from credit and debit cards and from banking fees.
Revenues from credit and debit cards totaled R$1,640 million for the year ended December 31, 2012, an increase of 26.3% compared to the year ended December 31, 2011. This increase was primarily due to the increase in fees as a result of the growth of our merchant acquiring services and the adoption of a strategy based on innovation and a focus on customer needs, resulting in an increase in our credit card base and in product penetration. In 2012, total financial transaction volume increased 22.3% compared to 2011. Our credit card base increased 17.5% and our debit card base increased 15.4% in 2012, reaching a total of 33.8 million issued cards.
Commissions from banking fees were R$2,545 million for the year ended December 31, 2012, a 3.2% increase compared to the year ended December 31, 2011, representing 33.4% of total commissions during the period. This variation is mainly due to an increase in our customer base.
The following table reflects the breakdown of net fee and commission income for the year ended December 31, 2012 and 2011:
|
For the year ended December 31
|
|||||||||||||||||
|
2012
|
2011
|
% Change
|
Change
|
||||||||||||||
|
(in millions of R$, except percentages)
|
|||||||||||||||||
|
Banking fees
|
2,545 | 2,466 | 3.2 | % | 80 | ||||||||||||
|
Receiving Services
|
581 | 517 | 12.5 | % | 64 | ||||||||||||
|
Insurance and Capitalization
|
1,631 | 1,536 | 6.2 | % | 96 | ||||||||||||
|
Asset Management and Pension Funds
|
1,089 | 1,057 | 3.0 | % | 32 | ||||||||||||
|
Credit and debit cards
|
1,640 | 1,298 | 26.3 | % | 342 | ||||||||||||
|
Capital markets
|
398 | 419 | (4.9 | )% | (20 | ) | |||||||||||
|
Trade finance
|
336 | 401 | (16.2 | )% | (65 | ) | |||||||||||
|
Tax on services
|
(353 | ) | (357 | ) | (1.3 | )% | 5 | ||||||||||
|
Others
|
(258 | ) | (136 | ) | 90.3 | % | (123 | ) | |||||||||
|
Total
|
7,610 | 7,199 | 5.7 | % | 410 | ||||||||||||
Gains/losses on Financial Assets and Liabilities (net) Plus Exchange Differences (net)
Gains/losses on financial assets and liabilities (net) plus exchange differences (net) for the year ended December 31, 2012 were losses of R$170 million, a R$85 million decrease from losses of R$255 million for the year ended December 31, 2011. This variation is mainly due to lower expenses of R$132 million from derivatives transactions including our results of hedging on investments abroad (see “Item 5. Operating and Financial Review and Prospects—A. Operating Results—Other Factors Affecting Our Financial Condition and Results of Operations) and higher gains of R$141 million in trading activities, partially offset by lower results of R$164 million from market making activities.
Other Operating Income/Expenses
Other operating income/expenses for the year ended December 31, 2012 was an expense of R$623 million, an increase of R$246 million compared to an expense of R$378 million for the year ended December 31, 2011, mainly due to the sale of Zurich Santander Brasil Seguros e Previdência S.A. and Zurich Santander Brasil Seguros to Zurich in 2011.
Administrative Expenses
Administrative Expenses for the year ended December 31, 2012 were R$13,773 million, an R$990 million increase compared to expenses of R$12,783 million in the year ended December 31, 2011, mainly due to labor cost increases tied to inflation, and the continuous expansion of our branch network, with the addition of 52 new branches in 2012.
Salaries, benefits and social security expenses increased R$479 million in 2012, due principally to the impact of salary increases tied to inflation under our collective bargaining agreement. This agreement requires certain adjustments in fixed and variable income, linked to the official consumer price inflation index (IPCA). For a discussion on how inflation can affect our costs, see “Item 3. Key Information—D. Risk Factors—Risks Relating to Brazil—Government efforts to control inflation may hinder the growth of the Brazilian economy and could harm our business.”
The following table sets forth personnel expenses for each of the periods indicated:
|
For the year ended December 31
|
||||||||||||||||
|
2012
|
2011
|
% Change
|
Change
|
|||||||||||||
|
(in millions of R$, except percentages)
|
||||||||||||||||
|
Salaries
|
4,304 | 4,179 | 3.0 | % | 124 | |||||||||||
|
Social security
|
1,177 | 1,077 | 9.3 | % | 100 | |||||||||||
|
Benefits
|
983 | 864 | 13.7 | % | 119 | |||||||||||
|
Training
|
141 | 116 | 21.6 | % | 25 | |||||||||||
|
Others
|
482 | 372 | 29.7 | % | 111 | |||||||||||
|
Total
|
7,086 | 6,607 | 7.2 | % | 479 | |||||||||||
Other administrative expenses increased R$511 million from R$6,175 million for the year ended December 31, 2011 to R$6,686 million for the year ended December 31, 2012. The increase was primarily due to specialized and technical services, data processing, new points of sale and growth in our customer base, which generally leads to increased spending on infrastructure and services.
The efficiency ratio, which we calculate as total administrative expenses divided by total income, reached 35.7% in the year ended December 31, 2012, as compared to 37.0% for the year ended December 31, 2011.
The following table sets forth other administrative expenses for each of the periods indicated:
|
For the year ended December 31
|
||||||||||||||||
|
2012
|
2011
|
% Change
|
Change
|
|||||||||||||
|
(in millions of R$, except percentages)
|
||||||||||||||||
|
Specialized and technical services
|
1,719 | 1,562 | 10.0 | % | 156 | |||||||||||
|
Property, fixtures and supplies
|
1,171 | 1,087 | 7.7 | % | 84 | |||||||||||
|
Technology and systems
|
1,075 | 1,006 | 6.8 | % | 69 | |||||||||||
|
Advertising
|
499 | 493 | 1.2 | % | 6 | |||||||||||
|
Communications
|
573 | 566 | 1.3 | % | 8 | |||||||||||
|
Per diems and travel expenses
|
174 | 174 | 0.3 | % | 1 | |||||||||||
|
Surveillance and cash courier services
|
564 | 521 | 8.1 | % | 42 | |||||||||||
|
Other administrative expenses
|
912 | 766 | 19.0 | % | 146 | |||||||||||
|
Total
|
6,686 | 6,175 | 8.3 | % | 511 | |||||||||||
Depreciation and Amortization
Depreciation and amortization for the year ended December 31, 2012 was R$1,201 million, a R$200 million increase from R$1,000 million for the year ended December 31, 2011, principally due to the amortization of our technological systems and branch network expansion.
Provisions (Net)
Provisions principally include provisions for tax, civil, and especially labor claims. Provisions (net) totaled R$2,057 million for the year ended December 31, 2012, a decrease of R$929 million compared to R$2,985 million for the year ended December 31, 2011. This decrease was mainly due to lower provisions for contingencies, primarily due to our efforts and initiatives to normalize our contingency levels, especially contingencies for labor claims.
Impairment Losses on Financial Assets (Net)
Our computable credit risk portfolio increased by R$22,048 million at December 31, 2012, or 10.2% compared to the year ended December 31, 2011, while non-performing assets increased 22.8%, or R$2,984 million. The default rate had an increase of 70 basis points in 2012 compared to the same period of the prior year. Net expenses from the allowances for credit losses in 2012 increased 75.6% compared to 2011 (R$7,094 million), and were R$16,476 million at December 31, 2012.
The following table shows the ratio of our impaired assets to total computable credit risk and our coverage ratio at December 31, 2012 and December 31, 2011.
|
At December 31,
|
||||||||
|
2012
|
2011
|
|||||||
|
(in millions of R$, except percentages)
|
||||||||
|
Computable credit risk(1)
|
238,804 | 216,756 | ||||||
|
Non-performing assets
|
16,057 | 13,073 | ||||||
|
Allowances for impairment losses
|
14,042 | 11,180 | ||||||
|
Ratios
|
||||||||
|
Non-performing assets to computable credit risk
|
6.7 | % | 6.0 | % | ||||
|
Coverage ratio(2)
|
87.4 | % | 85.5 | % | ||||
|
Net Expenses
|
(16,476 | ) | (9,382 | ) | ||||
|
Other financial instruments not measured at fair value
|
— | — | ||||||
|
Total net expenses
|
(16,476 | ) | (9,382 | ) | ||||
|
(1)
|
Computable credit risk is the sum of the face amounts of loans and leases (including nonperforming assets but excluding country risk loans), guarantees and documentary credits.
|
|
(2)
|
Allowances for impairment losses as a percentage of non-performing assets.
|
The following chart shows our nonperforming assets to credit risk ratio (not including guarantees and documentary credits) from the fourth quarter of 2011 through the fourth quarter of 2012:
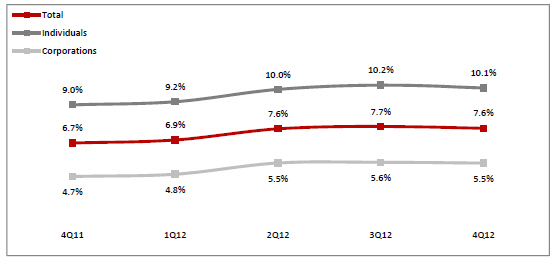
Impaired Assets by Type of Customer
The following table shows our non-performing assets by type of loan at December 31, 2012 and December 31, 2011.
|
At December 31,
|
||||||||
|
2012
|
2011
|
|||||||
|
(in millions of R$)
|
||||||||
|
Commercial, financial and industrial
|
6,157 | 4,775 | ||||||
|
Real estate – mortgage
|
283 | 172 | ||||||
|
Installment loans to individuals
|
9,368 | 7,720 | ||||||
|
Financial Leasing
|
249 | 406 | ||||||
|
Total
|
16,057 | 13,073 | ||||||
For a discussion of the evolution in impairment in our lending portfolios and our methodology for loan loss allowances with respect to the following lending portfolios, see Item 4. Information on the Company—B. Business Overview—Selected Statistical Information—Evolution of Impaired Assets—Impaired Assets—Methodology for loan loss allowances.
Commercial, financial and industrial
Non-performing assets in the commercial, financial and industrial loan portfolio on December 31, 2012, increased 28.9% compared to December 31, 2011, mainly due to unfavorable economic conditions as a result of the slowdown of the Brazilian economy. According to data from the Brazilian Central Bank, Brazilian GDP grew by just 0.9% in 2012, compared to 1.0% in 2011.
During the year, the Brazilian government adopted a series of measures to boost the economy, such as roads and railways concessions, increased hiring credits, tax incentives in important sectors of the economy, including the automobile industry and construction industry, among others. In addition, the Brazilian Central Bank reduced the SELIC throughout the year until October, 2012, when it reached the lowest level ever recorded. In November, the Brazilian Central Bank decided to maintain the SELIC rate at 7.25%.
Despite measures taken by the Brazilian government to stimulate the economy, our industrial clients continued to be negatively affected by unfavorable international markets, as a result of ongoing fiscal crises in Europe and the United States. These factors contributed to weak export performance and increased production costs for these clients, which were not fully reflected in their product pricing, and reduced their profitability and capacity to service their debt obligations. This was a continuation of the trend we observed in 2011.
Real estate–mortgage
Non-performing assets in the real estate – mortgage lending portfolio increased 64.5%, or R$111 million to R$283 million at December 31, 2012, compared to R$172 million at December 31, 2011, mainly due to growth in lending in this portfolio as more Brazilian consumers have begun funding home purchases through financing. Compared to the previous year, in 2012 the average default rate of the product remains stable at the same level observed in 2011.
Installment loans to individuals
Non-performing assets in the installment loans to individuals lending portfolio increased 21.3%, or R$1,648 million to R$9,368 million at December 31, 2012 compared to R$7,720 million at December 31, 2011, driven primarily by a high level of household debt of Brazilian families combined with inflation which reached 5.8% in the year (as measured by the IPCA, the consumer price index), and which directly affected the individuals segment of the banking system, mainly the consumer lending portfolio.
However, despite the scenario mentioned above, the Bank understands that its methodology for loan losses efficiently captured the acceleration in delinquencies due to internal rating models based on client behavior data and available external credit bureau rating information, which updates the Probability of default, or PD (the probability of the borrower failing to meet its principal and/or interest payment obligations.), used by the Bank to estimate the provision for loan losses.
PD is measured using a time horizon of one year; that is, it quantifies the probability of the borrower defaulting in the coming year. A loan is in default if either the principal or interest is past due by ninety days or more or the loan is current but there are doubts as to the solvency of the borrower (subjective doubtful assets).
In addition, prior to charging off past due loans (which is only done after we have completed all recovery efforts), we fully provision the remaining balance of the loan so our allowance for impairment losses fully covers our losses. Thus, the Bank understands that its loan loss allowance methodology has been developed to fit its risk metrics and capture loans that could potentially become impaired.
Finally, the loans originated in 2012 have a higher proportion of loans with higher level of collateral as required in the Bank’s revised underwriting standards as described, which therefore requires a lower level of provisioning.
Financial Leasing
Non-performing assets in the financial leasing lending portfolio decreased 38.7%, or R$157 million to R$249 million at December 31, 2012, compared to R$406 million in 2011, primarily due to the reduction in this lending portfolio, in line with the trend in the market of decreased automobile financing to individuals. According to the Brazilian Central Bank, at December 31, 2012, the lease financing portfolio for the financial system decreased 48.9% compared with 2011.
Impairment Losses on Other Assets (Net)
Impairment losses on other assets (net) for the year ended December 31, 2012 were losses of R$38 million, practically the same level of losses of R$39 million for year ended December 31, 2011.
Other Non-Financial Gains/Losses
Other non-financial gains/losses were gains of R$449 million during the year ended December 31, 2012, a R$3 million decrease from gains of R$452 million during the year ended December 31, 2011.
Income Taxes
Income taxes expense includes: income tax, social contribution, PIS and COFINS (which are social contributions due on some revenues net of some expenses). Income tax expenses reached R$37 million for 2012, a R$1,064 million decrease from R$1,101 million for 2011. There are some relevant permanent differences that impact the tax rate: interest on capital, goodwill amortization and the foreign exchange valuation on investments abroad. The effective tax rate is set forth on note 22b in the consolidated financial statements.
Discontinued Operations
Discontinued Operations include the results of the Asset Management business that was sold on December 17, 2013. Discontinued operations reached R$55 million for the year ended December, 31, 2012, a R$19 million decrease from R$74 million for the year ended December 31, 2012.
Results of Operations by Segment for the Year ended December 31, 2012 Compared to the Year ended December 31, 2011
The following tables show our results of operations for the years ended December 31, 2012 and 2011, for each of our operating segments.
Commercial Banking
|
For the year ended December 31
|
|||||||||||||||||
|
2012
|
2011
|
% Change
|
Change
|
||||||||||||||
|
(in millions of R$, except percentages)
|
|||||||||||||||||
|
Net interest income
|
29,470 | 25,207 | 16.9 | % | 4,263 | ||||||||||||
|
Income from equity instruments
|
94 | 94 | 0.1 | % | 0 | ||||||||||||
|
Income from companies accounted for by the
equity method
|
73 | 54 | 35.2 | % | 19 | ||||||||||||
|
Net fee and commission income
|
6,870 | 6,403 | 7.3 | % | 466 | ||||||||||||
|
Gains/losses on financial assets and liabilities
(net) and exchange differences (net)
|
(650 | ) | (768 | ) | (15.4 | )% | 118 | ||||||||||
|
Other operating income (expenses)
|
(600 | ) | (348 | ) | 72.1 | % | (251 | ) | |||||||||
|
Total income
|
35,257 | 30,641 | 15.1 | % | 4,616 | ||||||||||||
|
Personnel expenses
|
(6,546 | ) | (6,082 | ) | 7.6 | % | (464 | ) | |||||||||
|
Other administrative expenses
|
(6,461 | ) | (5,933 | ) | 8.9 | % | (528 | ) | |||||||||
|
Depreciation and amortization
|
(1,091 | ) | (895 | ) | 22.0 | % | (197 | ) | |||||||||
|
Provisions (net)
|
(2,062 | ) | (2,988 | ) | (31.0 | )% | 926 | ||||||||||
|
Impairment losses on financial assets (net)
|
(16,404 | ) | (9,334 | ) | 75.7 | % | (7,069 | ) | |||||||||
|
Impairment losses on other assets (net)
|
(38 | ) | (34 | ) | 13.1 | % | (4 | ) | |||||||||
|
Other nonfinancial gain (losses)
|
449 | 452 | (0.7 | )% | (3 | ) | |||||||||||
|
Profit before tax
|
3,103 | 5,827 | (46.7 | )% | (2,724 | ) | |||||||||||
|
Discontinued operations
|
55 | 74 | (25.5 | )% | (19 | ) | |||||||||||
Profit before tax attributed to the Commercial Banking segment for the year ended December 31, 2012 was R$3,103 million, a R$2,724 million decrease from R$5,827 million for the year ended December 31, 2011.
This variation was mainly due to:
An increase of 16.9%, or R$4,263 million, in net interest income for the year ended December 31, 2012 compared to the year ended December 31, 2011, mainly due to growth of R$3.1 billion in revenues from lending activities, driven by lending to individuals and SMEs.
An increase of 7.3%, or R$466 million, in net fee and commission income for the year ended December 31, 2012 compared to the year ended December 31, 2011, principally due to: (1) an increase in revenues from credit and debit cards which mainly reflects the increase in fees from our merchant acquiring services, and also the adoption of a strategy based on innovation and a focus on customer needs, resulting in an increase in the card base and in product penetration, and; (2) an increase in revenues from banking fees as a consequence of our growth in customer base.
A decrease of 31.0%, or R$926 million, in provisions (net) for the year ended December 31, 2012 compared to the year ended December 31, 2011, principally due to lower provisions for contingencies, primarily due to our efforts and initiatives to normalize the contingency levels, especially contingencies for labor claims.
These increases were offset by:
A 75.7%, or R$7,069 million, increase in impairment losses on financial assets (net), for the year ended December 31, 2012 as compared to the year ended December 31, 2011. The evolution of default rate in the financial system, especially in private banks, which began in 2011 and lasted throughout 2012, was also experienced by our operations, where the default rate increased from 6.7% in December 2011 to 7.6% in December 2012 (an increase of 89 bp). For individuals, this increase in the default rate was generated primarily due to the rising level of indebtedness of household (an average increase of 22.0% in the period from January to October 2012, according to surveys by the Brazilian Central Bank). For corporations, the rise in the level of default rate reflects lower pace of economic growth and change in the portfolio mix (higher participation of SMEs segment).
An 7.6%, or R$464 million, increase in personnel expenses in the year ended December 31, 2012 as compared to the year ended December 31, 2011, mainly due to the impact of our collective bargaining agreement. This agreement requires certain adjustments in fixed and variable income, linked to the official consumer price inflation index (IPCA).
Global Wholesale Banking
|
For the year ended December 31
|
||||||||||||||||
|
2012
|
2011
|
% Change
|
Change
|
|||||||||||||
|
(in millions of R$, except percentages)
|
||||||||||||||||
|
Net interest income
|
2,117 | 2,589 | (18.2 | )% | (472 | ) | ||||||||||
|
Net fee and commission income
|
740 | 796 | (7.0 | )% | (56 | ) | ||||||||||
|
Gains/losses on financial assets and liabilities
(net) and exchange differences (net)
|
480 | 513 | (6.5 | )% | (33 | ) | ||||||||||
|
Other operating income (expenses)
|
(24 | ) | (29 | ) | (19.0 | )% | 6 | |||||||||
|
Total income
|
3,313 | 3,869 | (14.4 | )% | (556 | ) | ||||||||||
|
Personnel expenses
|
(541 | ) | (526 | ) | 2.9 | % | (15 | ) | ||||||||
|
Other administrative expenses
|
(225 | ) | (242 | ) | (6.9 | )% | 17 | |||||||||
|
Depreciation and amortization
|
(109 | ) | (106 | ) | 3.5 | % | (4 | ) | ||||||||
|
Provisions (net)
|
6 | 3 | 93.4 | % | 3 | |||||||||||
|
Impairment losses on financial assets (net)
|
(72 | ) | (47 | ) | 52.8 | % | (25 | ) | ||||||||
|
Impairment losses on other assets (net)
|
0 | (5 | ) |
n.d.
|
5 | |||||||||||
|
Profit before tax
|
2,372 | 2,947 | (19.5 | )% | (575 | ) | ||||||||||
|
Discontinued Operations
|
— | — | — | — | ||||||||||||
Profit before tax attributed to the Global Wholesale Banking segment for the year ended December 31, 2012 was R$2,372 million, a 19.5%, or R$575 million, decrease from R$2.947 million for the year ended December 31, 2011.
This variation was mainly due to an 18.2%, or R$472 million, decrease in net interest income for the year ended December 31, 2012, as compared to the year ended December 31, 2011, mainly as a result of the effects of a lower basic interest rate (the SELIC rate) on business during 2012 and lower gains on trading activities.
New Accounting Pronouncements
The following standards came into force and were adopted by the Bank in 2013:
|
|
·
|
Amendments to IAS 1, Presentation of Items of Other Comprehensive Income – the amendments require items to be classified into items that will be reclassified (recycled) to profit or loss in subsequent periods and items that will not be reclassified.
|
|
|
·
|
Amendments to IAS 19, Employee Benefits – these amendments eliminate the corridor under which until January 1, 2013 entities were permitted to opt not to recognize at the end of the reporting period a certain portion of the actuarial gains and losses disclosed on measurement of the pension obligations and to defer said recognition (see Note 2.v to the consolidated financial statements for the year ended December 31, 2012). When these amendments came into effect, all actuarial gains and losses were recognized immediately. The amendments also include significant changes in the presentation of cost items, as a result of which the service cost relating to post-employment benefit obligations (past service cost and plan
|
|
|
|
curtailments and settlements) and net interest cost will be recognized in profit or loss and the measurement component (comprising basically actuarial gains and losses) will be recognized in Equity-Valuation adjustments and may not be reclassified to profit or loss.
|
|
|
·
|
IFRS 13, Fair Value Measurement – this IFRS replaced the previous rules concerning fair value contained in various standards with a single standard. It does not modify the criteria set out in other standards for measuring assets and liabilities at fair value, but rather contains more extensive guidance about how fair value should be determined. IFRS 13 is applicable to the measurement of both financial and non-financial items and it introduces new disclosure requirements.
|
|
|
·
|
Amendments to IFRS 7, Offsetting Financial Assets and Financial Liabilities – these amendments introduce new disclosures to be included in the annual financial information for financial assets and financial liabilities that are presented net in the balance sheet and for other instruments subject to an enforceable netting arrangement.
|
|
|
·
|
IFRS 10, Consolidated Financial Statements – this standard supersedes the previous IAS 27 and SIC 12, and introduces a single control-based consolidation model, irrespective of the nature of the investee. IFRS 10 modifies the previous definition of control. The new definition of control sets out the following elements of control: power over the investee; exposure, or rights, to variable returns from involvement in the investee; and the ability to use power over the investee to affect the amount of the investor’s returns.
|
|
|
·
|
IFRS 11, Joint Arrangements – this standard supersedes the previous IAS 31. The fundamental change introduced by IFRS 11 is the elimination of the option of proportionate consolidation for jointly controlled entities, which begin to be accounted for using the equity method.
|
|
|
·
|
IFRS 12, Disclosure of Interests in Other Entities – this standard represents a single standard presenting the disclosure requirements for interests in other entities (whether they are subsidiaries, associates, joint arrangements or other interests) and includes new disclosure requirements. The objective of this standard is to require an entity to disclose information that enables users of its financial statements to evaluate the nature of its interests in other entities (control), the possible restrictions on its ability to access or use assets and settle liabilities, the risks associated with its interests in unconsolidated structured entities, etc.
|
|
|
·
|
Amendments to IAS 27 and IAS 28 (revised) – these amendments reflect the changes arising from the new IFRS 10 and IFRS 11 described above.
|
The application of the aforementioned accounting standards and interpretations did not have any material effects on our financial statements, except for the application of the amendments to IAS 19, the impact of which is detailed in Note 1.e and summarized above.
Also, the following standards which will come into effect after December 31, 2013 were issued at the date of preparation of our consolidated financial statements:
Amendments to IAS 32, Financial Instruments:
|
|
·
|
Presentation – Offsetting Financial Assets and Financial Liabilities (obligatory for reporting periods beginning on or after January 1, 2014, early application permitted) — these amendments introduce a series of additional clarifications on the requirements established by the standard for an entity to be able to offset a financial asset and a financial liability, indicating that they can only be offset when an entity currently has a legally enforceable right to set off the recognized amounts and this does not depend on the occurrence of future events.
|
|
|
·
|
Amendments to IAS 36, Impairment of Assets – Recoverable Amount Disclosures for Non-Financial Assets (obligatory for reporting periods beginning on or after January 1, 2014, early application permitted) — these amendments eliminate the requirement to present certain disclosures on the recoverable amount of each cash generating unit and introduce the obligation to disclose information on the recoverable amount of assets in relation to which an impairment loss was recognized or reversed in the year.
|
Amendments to IAS 39 Financial Instruments:
|
|
·
|
Recognition and Measurement – Novation of Derivatives and Continuation of Hedge Accounting (obligatory for reporting periods beginning on or after January 1, 2014, early application permitted) — these amendments introduce an exception to the application of the discontinuation of hedge accounting for novations in which, as a consequence of laws or regulations, the original counterparty of the hedging instrument is replaced by one or more central counterparties, such as clearing agencies, provided that other changes to the hedging instrument are limited to those that are necessary to effect such a replacement of the counterparty.
|
|
|
·
|
IFRS 9, Financial Instruments – Classification and Measurement and Hedge Accounting (without a defined mandatory effective date), which will in the future replace the part of the current IAS 39 relating to the classification and measurement of financial assets and hedge accounting. IFRS 9 presents significant differences regarding financial assets with respect to the current standard, including the approval of a new classification model based on only two categories, namely instruments measured at amortized cost and those measured at fair value, the disappearance of the current Held-to-maturity investments and Available-for-sale financial assets categories, impairment analyses only for assets measured at amortized cost and the non-separation of embedded derivatives in financial contracts. The main change introduced with regard to financial liabilities affects liabilities that an entity elects to measure at fair value. The portion of the change in the fair value of these liabilities attributable to changes in the entity’s own credit risk must be presented in Valuation adjustments instead of in the income statement. In relation to hedge accounting, the new model attempts to align the accounting rules with risk management. The three types of hedge accounting under the current standard are maintained (cash flow hedges, fair value hedges and hedges of net investments in foreign operations). However, there are very significant changes with respect to IAS 39 in several areas such as hedged items, hedging instruments, accounting for the time value of options and effectiveness assessment.
|
|
|
·
|
Amendments to IAS 19, Employee Benefits – Defined Benefit Plans – Employee Contributions (mandatory for reporting periods beginning on or after July 1, 2014, early application permitted) — these amendments allow employee contributions to be deducted from the service cost in the same period in which they are paid, provided certain requirements are met, without the need to make calculations to attribute the reduction to each year of service.
|
|
|
·
|
IFRIC 21, Levies mandatory for reporting periods beginning on or after January 1, 2014, early application permitted) – provides clarifying guidance on when to recognize a liability to pay a fee, levy or tax that is accounted for in accordance with IAS 37 and the timing and amount of which are certain. In these cases, the levy is recognized when the activity that triggers its payment occurs.
|
|
|
·
|
Improvements to IFRSs, 2010–2012 cycle (mandatory for reporting periods beginning on or after July 1, 2014) – these improvements introduced minor amendments to IFRS 2, IFRS 3, IFRS 8, IFRS 13, IAS 16, IAS 24 and IAS 38.
|
|
|
·
|
Improvements to IFRSs, 2011–2013 cycle (mandatory for reporting periods beginning on or after July 1 2014) – these improvements introduced minor amendments to IFRS 3, IFRS 13 and IAS 40.
|
We are currently analyzing the possible effects of these new standards and interpretations.
5B
. Liquidity and Capital Resources
Our asset and liability management strategy is set by the Executive Financial Committee, which operates under strict guidelines and procedures established by the Santander Group. The Executive Financial Committee establishes our funding strategy, structural balance sheet, interest rate position and capital management. Our Executive Financial Committee also establishes and coordinates transfer pricing policies, management of risk-weighted assets, economic capital exposure, management of local regulatory capital, decision making on capital instrument issuances, and risk appetite.
Pursuant to the Santander Group’s model, all subsidiaries have to be self-funded in terms of liquidity and capital. In addition, our general asset and liability management policy is to maintain a close match of maturity, interest rate and currency exposures. Subject to our internal risk management policies we aim to maintain adequate
liquidity to meet our present and future financial obligations and to capitalize on business and market opportunities as they arise.
Most of our liquidity is raised in the local market and we maintain a portfolio of high quality public bonds for liquidity management. Legal reserve requirements consumes a significant amount of funding in Brazil, see “Regulatory Overview—Principal Regulatory Agencies—Compulsory Reserve Requirements.”
Due to our stable and diversified sources of funding, which include a large client deposit base in the local market and a large number of correspondent banks with long-standing relationships, historically we have not experienced liquidity problems.
Liquidity and Funding
Market conditions and prospects as well as the Brazilian Central Bank requirements for compulsory deposits and stress tests determine our minimum liquidity levels. We control, manage and review our liquidity analyzing current and expected levels of liquidity, structuring the sources of financing to achieve an optimal diversification in terms of maturities, instruments, currencies, markets as well as setting forth contingency plans. The objective is to ensure that we have sufficient liquidity to honor our commitments in light of market conditions, our institutional needs and market opportunities.
The following tables present the composition of our consolidated funding at the dates indicated.
|
At December 31,
|
||||||||||||
|
2013
|
2012
|
2011
|
||||||||||
|
(in millions of R$)
|
||||||||||||
|
Customer deposits
|
200,156 | 188,595 | 174,474 | |||||||||
|
Current accounts
|
15,585 | 13,585 | 13,561 | |||||||||
|
Savings accounts
|
33,589 | 26,857 | 23,293 | |||||||||
|
Time deposits
|
81,351 | 84,586 | 83,942 | |||||||||
|
Repurchase agreements
|
69,631 | 63,566 | 53,678 | |||||||||
|
Backed operations with Private Securities(1)
|
41,852 | 35,736 | 30,247 | |||||||||
|
Backed operations with Public Securities(1)
|
27,779 | 27,831 | 23,431 | |||||||||
|
Deposits from the Brazilian Central Bank and credit institutions
|
34,032 | 35,074 | 51,527 | |||||||||
|
Time deposits
|
30,510 | 26,077 | 27,023 | |||||||||
|
Demand deposits
|
251 | 48 | 134 | |||||||||
|
Repurchase agreements
|
3,271 | 8,949 | 24,371 | |||||||||
|
Backed operations with Private Securities(1)
|
373 | 559 | 223 | |||||||||
|
Backed operations with Public Securities(1)
|
2,898 | 8,389 | 24,147 | |||||||||
|
Total deposits
|
234,188 | 223,669 | 226,001 | |||||||||
|
Marketable debt securities
|
65,301 | 54,013 | 38,590 | |||||||||
|
Agribusiness Credit Notes
|
1,682 | 2,009 | 1,341 | |||||||||
|
Treasury Bills
|
28,222 | 25,320 | 19,926 | |||||||||
|
Real Estate Credit Notes
|
17,077 | 11,237 | 8,550 | |||||||||
|
Securities issued abroad
|
18,319 | 15,447 | 8,773 | |||||||||
|
Subordinated debt
|
8,906 | 11,919 | 10,908 | |||||||||
|
Total Funding
|
308,395 | 289,601 | 275,499 | |||||||||
|
(1)
|
Refers basically to repurchase agreements backed by debentures of own issue.
|
Deposits
Customer Deposits
Our balance of customer deposits was R$200.2 billion on December 31, 2013, R$188.6 billion on December 31, 2012, and R$174.5 billion on December 31, 2011, representing 64.9%, 65.1% and 63.3% of our total funding,
respectively. The increase of 6.1% in 2013 was driven by the increase of 14.7% in current accounts and 25.1% in savings accounts.
Current Accounts
Our balance of current accounts was R$15.6 billion on December 31, 2013, R$13.6 billion on December 31, 2012 and R$13.6 billion on December 31, 2011, representing 6.7%, 6.1%, and 6.0% of total deposits, respectively.
Customer Savings Deposits
Our balance of customer savings deposits was R$33.6 billion on December 31, 2013, R$26.9 billion on December 31, 2012 and R$23.3 billion on December 31, 2011, representing 14.3%, 12.0% and 10.3% of total deposits, respectively.
Customer Time Deposits
Our balance of customer time deposits was R$81.4 billion on December 31, 2013, R$84.6 billion on December 31, 2012 and R$83.9 billion on December 31, 2011, representing 34.7%, 37.8% and 37.1% of total deposits, respectively.
Customer Deposits – Repurchase Agreements
We maintain a portfolio of Brazilian public and private sector liquid debt instruments used to obtain overnight funds from other financial institutions or investment funds by selling such securities and simultaneously agreeing to repurchase them. Due to the short-term (overnight) nature of this funding source, such transactions are volatile and are composed, generally, of Brazilian public securities and of repurchase agreements linked to debentures. Securities sold under repurchase agreements increased to R$69.6 billion on December 31, 2013 from R$63.6 billion on December 31, 2012 and R$53.7 billion on December 31, 2011, representing 29.7%, 28.4% and 23.8% of total deposits, respectively.
Deposits from the Brazilian Central Bank and Credit Institutions
Our balance of deposits from the Brazilian Central Bank and credit institutions was R$34.0 billion on December 31, 2013, R$35.1 billion on December 31, 2012 and R$51.5 billion on December 31, 2011, representing 14.5%, 15.7% and 22.8% of total deposits, respectively. The main change in 2013 was observed in the repurchase agreements’ balance, which decreased 63.4% from December 31, 2012.
It also includes mainly Borrowings and Domestic Onlendings:
|
|
·
|
Borrowings
. We have relationships with banks all over the world, providing credit lines as foreign currency-linked (either to the U.S. dollar or to a basket of foreign currencies). We apply the proceeds from these transactions mainly to U.S. dollar-linked lending operations and in particular to trade finance operations.
|
|
|
·
|
Domestic Onlendings
. We onlend from public institutions, mainly BNDES and FINAME, for which we act as a financial agent. Funding from these sources in Brazil represents a method of providing long-term loans with attractive average interest rates to certain sectors of the economy. Loans from these funds are allocated by BNDES through banks to specific sectors targeted for economic development. This type of lending is known as “repassing” or “onlending.” Under this arrangement, we borrow funds from BNDES or FINAME, the equipment financing subsidiary of BNDES, and pass the funds to the targeted sector of the economy. These loans are generally granted at rates below the average market rates and have an average maturity of up to five years. Because the repassed funds are generally matched and/or funded by loans from a federal government agency, we take no interest rate or maturity mismatch risk nor charge interest at a fixed margin over the cost of funds. We, however, retain the commercial credit risk of the borrower and therefore have discretion in the lending decision and application of the credit criteria. This type of funding is not affected by compulsory deposit requirements. The onlending is generally secured or guaranteed, although this is not required by the terms of the onlending.
|
Other Funding
Marketable Debt Securities
Our balance of marketable debt securities was R$65.3 billion on December 31, 2013, R$54.0 billion on December 31, 2012 and R$38.6 billion on December 31, 2011, representing 21.2%, 18.7% and 14.6% of our total funding, respectively. The increase of 20.9% in 2013 is mainly due to the growth of the real estate credit notes, the securities issued abroad and treasury bills, which grew 52.0%, 18.6% and 11.5%, respectively.
The treasury bills instrument is a funding alternative available to banks that can be characterized as senior or subordinated debt for purposes of capital adequacy rules. Pursuant to CMN Resolution 4,123 of August 23, 2012, its minimum term must be 24 months and it must be issued for a minimum amount of R$300,000 for subordinated transactions and R$150,000 for senior transactions.
Our balance of securities issued abroad was R$18.3 billion on December 31, 2013, and was comprised by R$16.1 billion of bonds (under our Medium Term Notes Program – MTN) and other securities and R$2.2 billion (under our Diversified Payment Rights Program – DPR) of securitization notes. Although this kind of funding source is growing at a fast pace, our external foreign currency bond issuances comprise a small portion of our total funding.
Subordinated Debt
As of December 31, 2013, our subordinated debt included R$8.9 billion of certificates of deposit issued by us in the local market in various issuances at average interest rates indexed to CDI or IPCA, a decrease of R$3.0 billion from the amount of subordinated debt at December 31, 2012, due to the repayment of certain subordinated debt at maturity.
Capital Management
Our capital management is based on conservative principles and continuous monitoring of the items that affect our solvency level. We are required to comply with Brazilian capital adequacy regulations under Brazilian Central Bank rules. In October 2013, the new regulations implementing the capital and the regulatory capital requirements of the Basel Committee on Banking Supervision (Basel III) came into effect in Brazil. The minimum regulatory capital requirements currently remain at 11%. The Tier I requirement is 5.5%, divided into core capital of at least 4.5%, consisting mainly of corporate capital and profit reserves, including shares, units of ownership, reserves and earned income, and additional capital consisting mainly of certain reserves, revenue earned and hybrid securities and instruments as capital authorized by the Brazilian Central Bank.
According to the new rules on regulatory capital in Brazil, the value of goodwill for the calculation of capital base will be deducted from the capital base according to the “phase-in” for implementation of Basel III in Brazil which will be completed by 2019. In addition, if Basel III requirements were fully implemented as of the date hereof, we would continue to maintain an adequate regulatory capital ratio under Basil III and Brazilian Central Bank rules.
Our Basel capital adequacy ratio, in accordance with the Brazilian Central Bank was 19.2% as of December 31, 2013.
For more information, see ““Item 4. Information on the Company—B. Business Overview—Regulatory Overview—Capital Adequacy and Leverage—Basel.”
|
At December 31,
|
||||||||||||||||||||||||
|
2013
|
2012
|
2011
|
||||||||||||||||||||||
|
Amount
|
Ratio
|
Amount
|
Ratio
|
Amount
|
Ratio
|
|||||||||||||||||||
|
(in millions of R$, except percentages)
|
||||||||||||||||||||||||
|
Tier 1 capital
|
63,595 | 18.4 | % | 65,213 | 19.3 | % | 64,760 | 22.5 | % | |||||||||||||||
|
Tier 2 capital
|
2,701 | 0.8 | % | 5,070 | 1.5 | % | 6,642 | 2.3 | % | |||||||||||||||
|
Tier 1 and 2 capital
|
66,296 | 19.2 | % | 70,283 | 20.8 | % | 71,402 | 24.8 | % | |||||||||||||||
|
Required Regulatory Capital
(1)
|
37,936 |
n.a.
|
37,131 |
n.a.
|
31,702 |
n.a.
|
||||||||||||||||||
|
5C
.
|
Research and Development, Patents and Licenses, etc.
|
We do not have any significant policies or projects relating to research and development, and we own no relevant patents or licenses.
|
Trend Information
|
The following list sets forth, in our view, the most important trends, uncertainties and events that are reasonably likely to have a material effect on our net sales or revenues, income from continuing operations, profitability, liquidity and capital resources, or that would cause reported financial information to be not necessarily indicative of future operating results or financial condition:
|
|
·
|
Financial problems in certain countries in Europe could lead to another international financial crisis. If this occurs, Brazilian GDP growth in future periods may be depressed and, as a result, our credit portfolio may not grow or could decrease and our provisions for loan losses would increase;
|
|
|
·
|
Further inflation increases that could cause an increase in interest rates and lower growth in lending activities;
|
|
|
·
|
Continued market volatility and instability that could affect our revenues;
|
|
|
·
|
Restrictive regulations or government intervention in the banking business, which could affect our margins and/or growth in lending activities;
|
|
|
·
|
Regulatory capital changes towards more restrictive rules as a response to any potential financial crisis or general macroeconomic conditions;
|
|
|
·
|
Decreased liquidity in domestic capital markets;
|
|
|
·
|
Tax policies that could decrease our profitability; and
|
|
|
·
|
Currency fluctuation and exchange rate controls that could have an adverse impact on international investors.
|
For more information, see “Item 3. Key Information—D. Risk Factors,” where we present the risks we face in our business that may affect our commercial activities, operating results or liquidity.
|
5E
.
|
Off-Balance Sheet Arrangements
|
We have entered, in the normal course of business, into several types of off-balance sheet arrangements, including lines and letters of credit and financial guarantees.
Lending-Related Financial Instruments and Guarantees
We utilize lines and letters of credit and financial guarantee instruments to meet the financing needs of our customers. The contractual amount of these financial instruments represents the maximum possible credit risk should the counterparty draw down the commitment or we fulfill our obligation under the guarantee, and the counterparty subsequently fails to perform according to the terms of the contract. Most of these commitments and guarantees expire without the counterparty drawing on the credit line or a default occurring. As a result, the total contractual amount of these instruments does not represent our future credit exposure or funding requirements. Further, certain commitments, primarily related to consumer financing are cancelable, upon notice, at our option.
The “maximum potential amount of future payments” represents the notional amount that could be lost if there were a total default by the guaranteed parties, without consideration of possible recoveries from collateral held or pledged, or recoveries under recourse provisions. There is no relationship between these amounts and probable
losses on these guarantees. In fact, the maximum potential amount of future payments significantly exceeds inherent losses.
The following table sets forth the maximum potential amount of future payments under credit and financial guarantees.
|
At December 31,
|
||||||||||||
|
2013
|
2012
|
2011
|
||||||||||
|
(millions of R$)
|
||||||||||||
|
Contingent liabilities
|
||||||||||||
|
Financial guarantees and other securities
|
30,428 | 27,117 | 21,872 | |||||||||
|
Documentary credits
|
785 | 946 | 700 | |||||||||
|
Total contingent liabilities
|
31,214 | 28,063 | 22,572 | |||||||||
|
Commitments
|
||||||||||||
|
Loan commitments drawable by third parties(1)
|
100,550 | 106,754 | 98,553 | |||||||||
|
Total commitments
|
100,550 | 106,754 | 98,553 | |||||||||
|
Total
|
131,764 | 134,817 | 121,125 | |||||||||
|
(1)
|
Includes the approved limits and unused overdraft, credit card and others.
|
We also manage certain funds that are not recorded on our balance sheet as detailed below for the periods indicated:
|
At December 31,
|
||||||||||||
|
2013
|
2012
|
2011
|
||||||||||
|
(millions of R$)
|
||||||||||||
|
Investment funds
|
4,404 | 104,461 | 104,877 | |||||||||
|
Assets under management(1)
|
— | 9,393 | 8,144 | |||||||||
|
Total
|
4,404 | 113,854 | 113,022 | |||||||||
|
(1)
|
In 2013, we sold our asset management business through the disposal of all of our shares in DTVM. See “Item 4.—Information on the Company—A. History and Development of the Company—Important Events—Sale of the Investment Fund Management and Managed Portfolio Operations”
|
Finally, we hold certain third-party securities in custody which are not recorded on our balance sheet. As of December 31, 2013, 2012 and 2011, we held in custody debt securities and equity instruments entrusted to the Bank by third parties totaling R$66.7 million, R$79.7 million and R$122.2 million, respectively.
5F
. Contractual Obligations
Our contractual obligations at December 31, 2013 are summarized as follows:
|
At December 31, 2013
|
||||||||||||||||||||
|
Total
|
Less than 1 year
|
1-3 years
|
3-5 years
|
More than 5 years
|
||||||||||||||||
|
(in millions of R$)
|
||||||||||||||||||||
|
Contractual Obligations
|
||||||||||||||||||||
|
Deposits from the Brazilian Central
Bank and credit institutions(1)
|
34,032 | 24,154 | 7,027 | 1,566 | 1,285 | |||||||||||||||
|
Customer deposits
|
200,156 | 125,119 | 59,896 | 14,907 | 234 | |||||||||||||||
|
Marketable debt securities
|
65,301 | 34,371 | 25,335 | 5,393 | 202 | |||||||||||||||
|
Subordinated liabilities
|
8,906 | 2,370 | 6,233 | 303 | — | |||||||||||||||
|
Total
|
308,395 | 186,014 | 98,491 | 22,169 | 1,721 | |||||||||||||||
|
(1)
|
Includes R$2,955 million of repurchase agreements with maturity on January 2, 2014.
|
The above table does not reflect amounts that we may have to pay on derivative contracts. The amounts ultimately payable will depend upon movements in the financial markets. The aggregate fair value of all our derivative contracts at December 31, 2013 was R$1,177 million, compared to R$674 million at December 31, 2012.
In addition, we lease many properties under standard real estate lease contracts, which can be canceled at our option and include renewal options and escalation clauses. Total future minimum payments of non-cancelable operating leases as of December 31, 2013 was R$2,638.9 million, of which R$687.7 million matures in up to one year, R$1,627.8 million from one year to up to five years and R$323.4 million after five years. Additionally, we have contracts with unspecified maturities totaling R$2.2 million per month.
According to our by-laws, we are managed by a board of directors (
conselho de administração
) and a board of executive officers (
diretoria executiva
). The board of directors is our supervisory board as set out in our by-laws and in applicable legislation. Our board of executive officers is responsible for our day-to-day management.
Our board of directors is comprised of a minimum of five members and a maximum of twelve members. A minimum of 20.0% of the members of the board of directors must be independent directors, as defined by Regulation Level 2 of the BM&FBOVESPA. The board of directors has a Chairman and a Vice Chairman each elected at the general shareholders’ meeting by majority vote.
Our board of executive officers is comprised of a minimum of two members and a maximum of seventy-five members, one of them being appointed as the chief executive officer, and the others may be appointed as senior vice president executive officers, vice president executive officers, investor relations officer, executive officers and officers without specific designation. Certain of our executive officers are also members of the boards of executive officers and/or boards of directors of our subsidiaries.
Pursuant to Brazilian law, the election of each member of the board of directors and board of executive officers must be approved by the Brazilian Central Bank.
As a result of our agreement with BM&FBOVESPA to join the Level 2 segment of BM&FBOVESPA and of our adherence to Regulation Level 2 of the BM&FBOVESPA, our directors and officers have, prior to taking office, executed an instrument of adherence to this regulation and our agreement with BM&FBOVESPA.
The following table presents the names, positions and dates of birth of the current members of our board of directors and board of executive officers:
Members of the Board of Directors:
|
Name
|
Position
|
Date of Birth
|
|
Celso Clemente Giacometti
|
Chairman, Independent Member
|
October 13, 1943 |
|
Jesús Maria Zabalza Lotina
|
Vice-Chairman
|
April 16, 1958
|
|
Conrado Engel
|
Member
|
May 30, 1957
|
|
José Antonio Alvarez Alvarez
|
Member
|
January 6, 1960
|
|
José Manuel Tejón Borrajo
|
Member
|
July 11, 1951
|
|
José de Paiva Ferreira
|
Member
|
March 1, 1959
|
|
Alvaro Antonio Cardoso de Souza(1)
|
Independent Member
|
September 5, 1948
|
|
Marília Artimonte Rocca
|
Independent Member
|
January 31, 1973
|
|
Viviane Senna Lalli
|
Independent Member
|
June 14, 1957
|
Members of the Board of Executive Officers:
|
Name
|
Position
|
Date of Birth
|
|
Jesús Maria Zabalza Lotina
|
Chief Executive Officer
|
April 16, 1958
|
|
Conrado Engel
|
Senior Vice President Executive Officer
|
May 30, 1957
|
|
José de Paiva Ferreira
|
Senior Vice President Executive Officer
|
March 1, 1959
|
|
Angel Santodomingo Martell(1)(2)
|
Vice President Executive Officer
|
November 16, 1965
|
|
Carlos Alberto López Galán
|
Vice President Executive Officer
|
November 6, 1962
|
|
Carlos Rey de Vicente
|
Vice president Executive Officer
|
February 20, 1974
|
|
Ignacio Dominguez-Adame Bozzano
|
Vice President Executive Officer
|
August 20, 1968
|
|
João Guilherme de Andrade
So Consiglio
|
Vice President Executive Officer
|
December 7, 1968
|
|
Juan Sebastián Moreno Blanco (1)
|
Vice President Executive Officer
|
December 17, 1964
|
|
Manoel Marcos Madureira
|
Vice president Executive Officer
|
December 30, 1951
|
|
Marco Antonio Martins de Araújo Filho
|
Vice President Executive Officer
|
June 19, 1965
|
|
Oscar Rodriguez Herrero
|
Vice President Executive Officer
|
October 4, 1971
|
|
Pedro Carlos Araújo Coutinho
|
Vice President Executive Officer
|
April 2, 1966
|
|
Fernando Diaz Roldán
|
Executive Officer
|
October 7,1965
|
|
Jose Alberto Zamorano Hernandez
|
Executive Officer
|
May 9, 1962
|
|
José Roberto Machado Filho
|
Executive Officer
|
August 25, 1968
|
|
Maria Eugênia Andrade Lopez Santos
|
Executive Officer
|
January 23, 1966
|
|
Amancio Acúrcio Gouveia
|
Officer
|
March 31, 1963
|
|
Ana Paula Nader Alfaya
|
Officer
|
August 7, 1971
|
|
Antonio Pardo de Santayana Montes
|
Officer
|
November 5, 1971
|
|
Carlos Alberto Seiji Nomoto
|
Officer
|
November 28, 1969
|
|
Cassio Schmitt
|
Officer
|
April 23, 1971
|
|
Cassius Schymura
|
Officer
|
February 19, 1965
|
|
Ede Ilson Viani
|
Officer
|
September 5, 1967
|
|
Eduardo Müller Borges
|
Officer
|
September 12, 1967
|
|
Flávio Tavares Valadão
|
Officer
|
July 1, 1963
|
|
Gilberto Duarte de Abreu Filho
|
Officer
|
August 7, 1973
|
|
Javier Rodríguez de Colmenares Álvarez
|
Officer
|
April 1,1977
|
|
Jamil Habibe Hannouche
|
Officer
|
June 23, 1960
|
|
Jean Pierre Dupui
|
Officer
|
September 23, 1968
|
|
Luiz Felipe Taunay Ferreira
|
Officer
|
March 18, 1967
|
|
Mara Regina Lima Alves Garcia
|
Officer
|
December 28, 1966
|
|
Marcelo Zerbinatti
|
Officer
|
February 5, 1974
|
|
Marcio Aurelio de Nobrega
|
Officer
|
August 23, 1967
|
|
Mauro Adolfo Libert Westphalen
|
Officer
|
July 9, 1968
|
|
Mauro Siequeroli
|
Officer
|
March 24, 1957
|
|
Miguel Angel Albero Ocerin
|
Officer
|
February 23, 1960
|
|
Nilo Sérgio Silveira Carvalho
|
Officer
|
February 26, 1961
|
|
Nilton Sergio S. Carvalho
|
Officer
|
January 1, 1957
|
|
Ramón Sanchez Díez
|
Officer
|
October 29, 1968
|
|
Reginaldo Antonio Ribeiro
|
Officer
|
May 19, 1969
|
|
Roberto de Oliveira Campos Neto
|
Officer
|
June 28, 1969
|
|
Ronaldo Yassuyuki Morimoto
|
Officer
|
May 5, 1977
|
|
Sergio Antonio Borriello
|
Officer
|
April 15, 1964
|
|
Sergio Gonçalves
|
Officer
|
August 7, 1956
|
|
Thomas Gregor Ilg
|
Officer
|
September 12, 1968
|
|
Vanessa de Souza Lobato Barbosa
|
Officer
|
December 24, 1968
|
|
Wilson Luiz Matar
|
Officer
|
November 28, 1958
|
|
(1)
|
Member whose appointment is subject to Brazilian Central Bank approval.
|
|
(2)
|
Member whose appointment is subject to the issuance of Brazilian visa.
|
Below are the biographies of the members of our board of directors and board of officers.
Members of the Board of Directors:
Celso Clemente Giacometti
. Mr. Giacometti is Brazilian and was born on October 13, 1943. He holds a degree in business administration from the Faculdade de Economia São Luís and graduated with an accounting sciences degree from the Faculdade de Ciências Econômicas de Ribeirão Preto. He started his career in 1960 as a trainee and reviewer at Citibank. From 1963 to 2001 he worked at Arthur Andersen, becoming a partner in 1974 and acting as CEO of Brazilian operations from 1985 to 2000. He served on the board of directors and audit committees of Lojas Marisa S.A., Tarpon Investments, TIM Participações and LLX Logística, and also served as member of the Fiscal Council of CTEEP/ISA – Transmissão Paulista. He was also the CEO of Souto Vidigal, a holding company and family office from 2004 to 2006. On February 3, 2010 he was elected as an independent member of the board of directors of Santander Brasil and in October 2011, he was appointed as our Chairman. In 2013, he was elected to the position of Chairman of the Company’s Board of Directors, where he worked until June, 2013, when he became Vice president of this body and, on August 28, 2013 he was reconducted to the position of Chairman of the Company’s Board of Directors. Moreover, Mr. Giacometti is a member of the Audit Committee, Chairman of the Compensation and Nomination Committee and Coordinator of the Corporate Governance and Sustainability Committee, as well as the Risk Committee. He is President of the Fiscal Council of Ambev S. A. which also performs the roles of the Audit Committee. He is the managing partner of Giacometti Serviços Profissionais Ltda. Mr. Giacometti is also one of the co-founders and former board member of Brazilian Institute Corporate Governance “IBGC”.
Conrado Engel
.
Mr. Engel is Brazilian and was born on May 30, 1957. He holds a degree in aeronautical engineering from the Instituto Tecnológico de Aeronáutica – ITA. He started his career in 1981 as management trainee of Citibank S.A., where he worked for seven years. From 1992 to 1997 he was the responsible officer for the business related to credit cards for Banco Nacional-Unibanco. In 1998 he was elected CEO of Financeira Losango. In October 2003 he became responsible for the retail business of HSBC in Brazil and was a member of its Executive Committee until the end of 2006. From January 2007 to May 2009 he was responsible for the retail business of HSBC in the Asian-Pacific region, in Hong Kong. In May 2008 he was appointed group general manager and took office as CEO of HSBC Brasil in June 2009, where he remained until March 2012. At Santander Brasil he is a senior vice president executive officer, responsible for our retail business.
Jesús Maria Zabalza Lotina
.
Mr. Zabalza is Spanish and was born on April 16, 1958. He graduated with a degree in Industrial Engineering and always has worked in the financial markets. In 1982, he started his career at Banco Vizcaya, where he occupied the position of Officer at various locations in Cádiz, Granada, Sevilla and Zaragoza. Six years later, he served as an Officer in the Burgos Region, with BBV. He followed his career always occupying the highest positions at BBV and right after that at Banco Hipotecário and Caixa Postal, where he occupied the position of General Officer in both entities, which were already part of Argentaria. Starting in 1996, he worked for six years at La Caixa, in Madrid, as Assistant Officer, where he was responsible for the expansion process starting from Cataluña, and where he was also member of the Directive Board. In 2002, he was General Officer of Banco Santander and of the Latin America Division. He also occupied the position of First Vice president of the Board of Directors of Banco Santander Chile and was a member of the Board of Directors of Santander Mexico. From 2002 to 2010, he occupied the positions of President of the Board of Directors of Santander Colombia and of Bancorp, in Porto Rico. He is also Vice president of the Spanish Association of Executives of Finance (AEEF). Today, he occupies the post of our Chief Executive Officer and he is also the Vice-Chairman of our board of directors.
José Antonio Alvarez Alvarez
.
Mr. Alvarez is Spanish and was born on January 6, 1960. He holds a bachelor’s degree in business economics science from Universidad Santiago de Compostela in Spain and a MBA from the University of Chicago’s Graduate School of Business. He started at Santander Spain in 2002 as the head of finance management and in November 2004 he was elected as chief financial officer. He served as financial officer of Banco Bilbao Vizcaya Argentaria, S.A. in Spain from 1999 to 2002 and as financial officer of Corporación Bancaria de España, S.A. (Argentaria) from 1995 to 1999. He was also chief financial officer for Banco Hipotecario, S.A. in Spain from 1993 to 1995 and vice president of Finanpostal Gestión Fondos de Inversión y Pensiones from 1990 to 1993. He was a member of the board of directors of Banco de Crédito Local S.A. from 2000 to 2002. Today he is a member of the board of directors of Banco Santander (Brasil) S.A., Santander Consumer Finance, S.A., the chairman of Santander de Titulización, SGFT, S.A., a member of the board of directors of Bolsa de Mercados Españoles, S.A. (BME) and a member of the board of directors of Santander Global Property, S.L.
José Manuel Tejón Borrajo
.
Mr. Tejón is Spanish and was born on July 11, 1951. He holds a bachelor’s degree in economics from the Universidad Complutense de Madrid in Spain. He started at Santander Spain in 1989 as head of general audit and since 2004 he has been responsible for the general audit division and administration control. Within the Santander Group, he also serves as the chairman of the board of directors of Banco de Albacete, S.A., the chairman of the board of directors of Cantabro Catalana de Inversiones, S.A., a member of the board of directors of Santander Investments, S.A., he is also the vice chairman of the board of directors of Santander Investments I, S.A., a director of Santander Holding Internacional, S.A., an officer of Santusa Holding, S.L., vice chairman of the board of directors of Santander Gestión, S.L., chairman of the board of directors of Administración de Bancos Latinoamericanos Santander, S.L., chairman of the board of directors of Grupo Empresarial Santander, S.L. and serves as member of our board of directors.
José de Paiva Ferreira
.
Mr. Paiva is Portuguese and was born on March 1, 1959. He has a specialization degree in Business Administration from the Fundação Getúlio Vargas, and an MBA from the Wharton School of Business at the University of Pennsylvania. He has worked in the financial markets for 40 years. He started to work at Banco Bradesco in 1973 and occupied many different positions. Afterwards, he joined Banco Geral do Comércio, Noroeste and Santander Brasil, where he was Vice president Executive Officer, responsible for the Business, Human Resources, Operations, Technology, Property, Products, Marketing, Credit Cards, Insurance, Leasing and Branch Network. From 2000 to 2001 he occupied the position of e-Business Officer for Latin America, for the American Division of Santander Central Hispano. At the end of 2001, he came back to Brazil in order to work at Banco Banespa as Vice president Executive Officer, responsible for the Operational Resources department. From 2003, he became Vice president Executive Officer responsible for Marketing, Products, and Retail Business for Santander Brasil. In 2008 he became the CEO of Santander Brasil, a position that he occupied until the merger with Banco Real, when he became Senior Vice president Executive Officer, responsible for the Retail Business. In March 2011 he became Director of the Santander’s Board of Directors, and joined the Board business group based in Los Angeles, California, USA, where his main activities involved technological innovations, and he also acted as Senior Executive Vice President Officer, being responsible for different businesses of the Group. Currently, he is a member of our board of directors, and since July 2013 he also acted as Senior Vice president Executive Officer, being responsible for the Human Resources, Organization, Property, Proceedings, Operations, Technology and Costs.
Alvaro Antonio Cardoso de Souza
.
Mr. Souza is Portuguese and was born on September 5, 1948. He holds a degree in Economics and Business Administration from the Universidade Católica de São Paulo, and attended several specialization courses from a number of American universities, such as University of Pittsburgh and Wharton Business School of the University of Pennsylvania. Currently, he is Officer of AdS – Gestão, Consultoria e Investimentos Ltda.; chairman of the board of directors of Fundo Brasileiro para a Biodiversidade (FUNBIO) and member of the board of directors of the following companies and organizations: WWF International Board of Trustees, WWF-Brasil, Duratex S/A, AMBEV, Grupo Libra and Santos Futebol Clube. Mr. Souza is Certified Officer, accreditation granted to him by Instituto Brasileiro de Governança Corporativa. He was General Officer of Banco de Investimentos Crefisul and Chief Executive Officer of Citibank / Brazil. In the United States, he was globally responsible for Citibank’s Private Banking. Mr. Souza was also Chief Executive Officer of Citibank in Switzerland, Chairman of the Board of Directors of Banco Crefisul and Credicard in Brazil, besides participating in the Board of Directors of Citibank Equity Investments (Argentina). Mr. Souza also worked as Senior Advisor for Latin America at Citibank until his retirement in September 2003. He was President of Banco ABC-Roma, an affiliate to Grupo Globo and was on the Board of directors of several Brazilian companies, such as Celbrás, Ultraquímica, SPCI Computadores, Signature Lazard, Banco Triângulo, CSU Cardsystems and Gol Linhas Aéreas. He was also member of the Board of Directors of MasterCard International and President of the American Chamber of Commerce in São Paulo.
Marília Artimonte Rocca
.
Mrs. Marília Rocca is Brazilian and was born on January 31, 1973. She holds a degree in business administration from Fundação Getúlio Vargas of São Paulo and an MBA in management from Columbia Business School, New York. She attended the Executive Program – Family in Business at Harvard Business School, in Boston. Mrs. Rocca began her career in the operations department at Wal Mart Brasil, serving the company since it commenced operations in Brazil and remained there until 1998. She managed third-sector organizations for six years and was also the co-founder and general director of Endeavor Brasil, a NGO leader of high-impact entrepreneurship and Fundação Brava, an organization focused on the promotion of public management. She started and developed part of the Family Office of the Lemann, Sicupira and Telles families. She is currently a Vice president at TOTVS and a partner at Mãe Terra and Fibraxx, companies in the natural and organic products segment, where she worked from 2007 until 2012. She was a member of the board of directors of TOTVS from 2001 until 2012, Endeavor Brasil from 2005 until 2012, and has been a member of our board of
directors since 2012, and, since 2013 she is also a member of our corporate governance and sustainability committee. She was also a member of the board of directors of Grupo IBMEC from 2004 to 2008, having been appointed as a member of Insper’s External Assessment Committee. She was selected for the program Henry Crown Fellowship of Aspen Institute, in which she participated from 2006. In 2011 she was granted the business category Cláudia Award.
Viviane Senna Lalli
.
Ms. Senna is Brazilian and was born on June 14, 1957. She holds a degree in Psychology from the Pontifícia Universidade Católica in São Paulo and she is specialist in Depth Psychology. From 1981 to 1996, she worked as a psychotherapist for adults and children, and as a trainer of therapists in Depth Psychology. In 1994 she founded the Institute Ayrton Senna, the mission of which is the production and application on a wide range of knowledge and innovation for the complete education of children and youth. Ms. Senna is also a member of the following boards and committees: Council for Economic and Social Development (CDES); Advisory Councils of FEBRABAN and Citibank Brazil; Board of Education of CNI and FIESP; Energias do Brazil (EDP), ADVB, World Trade Center (WTC) and “Todos pela Educação;” guidance and social investment committees of Bank Itaú-Unibanco.
Members of the Board of Executive Officers:
Jesús Maria Zabalza Lotina
.
See “—Members of the Board of Directors.”
Conrado Engel
.
See “—Members of the Board of Directors.”
José de Paiva Ferreira
.
See “—Members of the Board of Directors.”
Angel Santodomingo Martell
.
Mr. Martell is Spanish and was born on November 16, 1965. He holds a degree in Economics and Business Sciences with specialization in Finance from Universidad I.C.A.D.E. de Madrid. As one of our vice president executive officers, he will hold the position of our investor relations officer. He started at the Santander Group at 2005 and since then has become globally responsible for the investor relations area, as well as accountable for the international development and asset management areas. Mr. Martell also occupies a position as the Vice President of the Board of Directors of Spanish Association of Investor Relations – A.E.R.I. Previously, Mr. Martell has worked as officer of Grupo Fortis and Banesto Bolsa. He has also worked at Usera y Morenés S.V.B (
Sociedade de Valores y Bolsa
) and Arthur Andersen (Deloitte). From 1996 to 2008, Mr. Martell occupied the position of chief executive officer of CFA – Chartered Financial Analyst – Spain, where he acted as funding member of a nonprofit organization focused on serving the holders of financial analyst accreditation (CFA) in Spain.
Carlos Alberto López Galán
.
Mr. Galán is Spanish and was born on November 6, 1962. He holds a bachelor’s degree in business economics science from Universidad Autónoma de Madrid in Spain and a master’s degree in financial markets from Universidad Pontifícia Comillas in Spain. As one of our vice president executive officers, he has been responsible for the financial area. He is also the investor relations officer and chief financial officer. He started at the Santander Group as an analyst in 1986, and in 1995 he became responsible for the controller department for Santander Financial Products. From 1997 to 1999 he served as vice president of Santander Investment Mexico. Mr. Galán also served from July 1999 to August 2006 as chief financial officer and officer of operations and a board member for the following companies: Santander Brasil, Afore S.S., Gestora S.S., Aseguradora S.A., Casa de Bolsa and Universia. He served as a board member for the Grupo Financeiro Santander Serfin and for the following companies: Altec (currently Isban), Universia, Proaquanima, Banco Santander Serfin, Casa de Bolsa, Afore S.S., Gestora S.S. and Aseguradora S.A. He is also vice president officer of Banco Bandepe S.A., executive officer of Atual Companhia Securitizadora de Créditos Financeiros, executive officer of Aymoré Crédito e Financiamento S.A. and administrative officer of Norchem Participações e Consultoria S.A. As well as a member of the board of directors of Santander Leasing S.A. Arrendamento Mercantil, Companhia de Arrendamento Mercantil RCI Brasil and Companhia de Crédito, Financiamento e Investimento RCI Brasil. He is also Vice president of the Board of Trustees of the Fundação Santander and Director of Santander Brasil Establecimiento Financeiro de Crédito S.A.
Carlos Rey de Vicente
.
Mr. Rey de Vicente is Spanish and was born on February 20, 1974. He graduated in Law from the Universidad Complutense de Madrid, and he became a member of the Colégio de Abogados de Madrid since 1997. In 2010 he started to work at Banco Santander Spain, where he was responsible for the strategy and planning of the banks Santander México, Chile, Argentina, Puerto Rico, Uruguay, Peru and Colombia. His main activities were related to the retail business, where he was responsible for approximately 35,000 employees, located
in 2,000 different offices. Besides that, he served as member of the Directive Committee in America Division. From 2001 to May, 2010, Mr. Rey de Vicente was a partner of McKinsey & Co., where he was responsible for heading several projects on strategic consulting. His activities were always concentrated on banking matters and insurance, besides acting on team management. Before, he worked as a lawyer in two different offices, where at one of them he was partner and founder, dealing mainly with insurance and civil responsibility. Today, Mr. Rey de Vicente is Vice president Executive Officer at Banco Santander (Brasil) S.A., responsible for the Strategy and Quality department.
Ignacio Domínguez-Adame Bozzano
.
Mr. Bozzano is Spanish and was born on August 20, 1968. He holds a degree in Economics and Business Sciences with specialization in Finance from Universidad Complutense de Madrid. He also holds an MBA from the University of Houston. He joined the Santander Group in 1994, initially developing activities in the area of Global Banking & Markets and with a focus on M&A, Project Finance and Leveraged Finance teams. From August 2006 to February 2007 he served as a Managing Officer at Banco Santander Central Hispano, SCH Investment (Spain), where he was responsible for the area of structured transactions. From February 2007 to April 2009 he served as a Managing Officer at Banco Santander Central Hispano. From 1991 to 1992, he worked in the department of investment analysis of Dragados y Construcciones S.A. (Spain). As one of our executive vice president officer, he is responsible for our global wholesale banking operations, including Global Banking & Markets. He is also an executive officer of REB Empreendimentos e Administradora de Bens S.A., and executive officer of CRV Distribuidora de Títulos e Valores Mobiliários S.A. and Officer of Santander Participações S.A.
João Guilherme de Andrade So Consiglio
.
Mr. Consiglio has dual citizenship, Brazilian and Italian, and was born on December 7, 1968. He holds a degree in economics from Universidade de São Paulo and a Post Laurea from Universitá Degli Studi di Genova, Italy, Facoltá di Economia e Commercio. As one of our executive vice president officer, he is responsible for our corporate clients. He was an economist at Bunge (Serfina S.A. Adm. e Participações) from 1990 to 1994, a manager of the economics department of Santista Corretora S.A. CVM from 1994 to 1995 and has been with Santander Brasil (ABN AMRO/Banco Real) since 1995. He started as a corporate banking manager, then assumed corporate development and private equity functions until 2005, when he became responsible for product management and development in Brazil. He became head of global transaction products in Brazil in 2008, and in 2010 assumed his current responsibilities. He served as a member of the board of directors at CBSS (Visa Vale) until 2008, and as a member of the board of directors of Câmara Interbancária de Pagamentos - CIP and member of the Conselho Superior of FUNCEX until 2010. He is also a member of the board of directors of Companhia de Arrendamento Mercantil RCI Brasil and Companhia de Crédito, Financiamento e Investimento RCI Brasil and representative of Banco Santander on the Board of Directors and consultative council of Associação BRAIN – Brasil Investimentos & Negócios.
Juan Sebastian Moreno Blanco
.
Mr. Blanco was born on December 17, 1964, in Spain, and he has dual citizenship, Spanish and Mexican. He graduated in Business Administration from the University of Houston in Houston, Texas. From 1987 to 1994 he worked at the company Bakinter as Commercial Officer, responsible for the commercial area as well as for the Enterprises segment in Santander. From 1994 to 1997 he worked as Project Officer in the financial system of Mexico and Brazil, for Booz, Allen & Hamilton in Mexico. He joined the Santander Group in 1997, where he served as Executive Officer of Companies and Institutions, after which he became Executive Officer of Business Development at Banco Santander Mexico, with responsibility for activities in the area of products of the bank. In 2006, he became responsible for the segments of Large Enterprises, Corporate, Institutional and High Income in Latin America, in addition to leading the product areas for the countries of Latin America (Comex, Cash Management, Payroll etc.). From 2008 to 2010, he performed the role of Chief Executive Officer (CEO) of Banco Santander – Puerto Rico. As of 2010, he occupied the position of Vice president of the Commercial area of Banco Santander Mexico, with responsibility for the business areas. At that time, he was also: a member of the Management Committee; Steering Committee, ALCO, Finance Committee and Risk Committee. As one of our vice president executive officers, he will be responsible for the commercial area.
Manoel Marcos Madureira
.
Mr. Madureira is Brazilian and was born on December 30, 1951. He holds a Bachelor’s Degree in Mechanical Engineering from the Taubaté University in São Paulo and a Degree in Administration from the Tokyo International Center in Japan. From 1976 to 2005 he worked in the automobile sector, as Institutional Relations and Communication Officer at Fiat Automóveis and Mercedes Benz do Brasil. From 1998 to 2005 he was also Vice President of the Associação de Fabricantes de Veículos Automotores and President of the Associação de Engenharia Automotora. In 2006 he was elected as Vice president of Corporate Affairs of Santander Brasil and in 2007 he was put in charge of the Vice Presidency of the Federação Brasileira de Bancos. In 2008 he was transferred to Santander Spain, as Communication Officer for Latin America, where he
remained until September 2012. In October 2012 he returned to Brazil as Executive Director to be in charge of the Corporate Communication and Institutional Relations Departments of Santander Brasil, and he is currently the Executive Vice president of Communication, Marketing, Institutional Relations and Sustainability. Mr. Madureira is also the Chief Executive Officer and also member of the Board of Trustees of Santander Cultural and Executive Director of Universia Brasil S.A.
Marco Antonio Martins de Araújo Filho
.
Mr. Araújo is Brazilian and was born on June 19, 1965. He holds a law degree from Universidade de Brasília and a Master’s Degree (LLM – Master of Laws) in International Business and Trade Law from Fordham University in New York. He is admitted to practice law in Brazil (since 1988) and in the State of New York (since 1993). Mr. Araújo has more than 20 years of legal experience. He was a parliamentary advisor from 1989 to 1991 and a senior lawyer for Banco Itaú BBA S.A. from 1994 to 2003. He joined ABN AMRO in 2003, and was ABN AMRO’s Latin America General Counsel and an executive officer of Banco Real, covering eight countries in Latin America, including Brazil. Since 2008, he has been a member of the Santander Brasil Group. Today, as one of the executive vice presidents of Banco Santander (Brasil) S.A., he is in charge of our corporate affairs department, which includes the Legal, Compliance, Money Laundering Prevention and institutional Public Policy. At the Santander Group, he is also an executive officer at Aymoré Crédito, Financiamento e Investimento S.A., at Banco Bandepe S.A. and at Ablasa Participações S.A; a member of the board of directors of Mantiq Investimentos Ltda.; and a member of Trustee Council of Fundação Santander. Between 2007 and 2011, he was the counselor of the National Financial System, representing ANBIMA, where he was Vice president. Since 2012, he has represented Banco Santander at FEBRABAN, as executive officer, and he is also a member of the Self-Regulation Council of FEBRABAN.
Oscar Rodriguez Herrero
.
Mr. Rodriguez is Spanish and was born on October 4, 1971. He holds a bachelor’s degree in business administration from the Colégio Universitário de Estúdios Financieros in Madrid, Spain and an MBA from Northwestern University’s Kellogg School of Management in Chicago, Illinois. As one of our executive vice presidents, he is the head of our risk management department. He served as an analyst of credit risk for the Santander Investment business in Brazil, Chile and Argentina based in Spain from 1994 to 1998. He was a consultant at McKinsey & Co in the United States and Spain from 2000 to 2004. Mr. Rodriguez also served as credit risk officer of the wholesale banking and corporate areas of Santander Brasil from 2004 to 2006. Currently, he is the chief executive officer of Atual Companhia Securitizadora de Créditos Financeiros, an executive officer of Banco Bandepe S.A., Aymoré Crédito, Financiamento e Investimento S.A. and officer of Santander Participações S.A., Santander Leasing S.A. Arrendamento Mercantil and Santander Brasil Advisory Services S.A. He is also a member of the board of directors of Companhia de Arrendamento Mercantil RCI Brasil, Companhia de Crédito, Financiamento e Investimento RCI Brasil, and Mantiq Investimentos Ltda. and a member of the Boards of Trustees of Santander Cultural and Fundação Santander. As one of our Vice-President Executive Officers, he is currently responsible for the Retail Risks and Corporate Risks in Banco Santander Brasil.
Pedro Carlos Araújo Coutinho
.
Mr. Coutinho is Brazilian and was born on April 2, 1966. He holds a degree in business administration from the Instituto Superior de Ciências, Letras e Artes of Três Corações - INCOR - MG, a specialization degree in Financial Administration from Fundação Dom Cabral and an MBA in Marketing from Instituto de Ensino e Pesquisa – INSPER. He has 30 years professional experience in the Financial Market, with solid background in retail business, on the management results for different scenarios, and on the development and deployment of Business Models. He was the Officer responsible for the Small and Medium Companies Segment of Banco Nacional S.A., from 1983 to 1995, and he was also the Officer responsible for the Individual High Income of Unibanco S.A., from 1995 to 1997. As one of our Executive Vice presidents, he is responsible for distribution strategy, expansion plans for branch offices, market study of all regions of Brazil, and responsible for the commercial management in Brazil, by evaluating microregions and specific niches, in order to identify potential markets, under the title of Commercial Executive Vice president. Moreover, he is a Vice president Officer of Santander Cultural and Fundação Santander.
Fernando Diaz Roldan
.
Mr. Roldan is Spanish and was born on October 7, 1965. He holds a bachelor’s degree in physics and a specialization degree in applied physics from Universidad Autónoma de Madrid. He also holds a postgraduate degree in business management from IESE Business School, Universidad de Navarra. Mr. Roldan started his career working in the commercial department. In 1994 he moved to the IT management division. From 1996 to 2001 he worked for IT companies such as: Vida Britânica SAE, Rhône-Poulenc Rorer and Ibéria SA SITEL Teleservices. In 2001 he joined Grupo Endesa, where he worked as general officer/operations officer of Mundívia and corporate infrastructure officer, of the telecommunication and systems division. In 2006 he was invited to join the Santander Group, as Corporate Services Officer of Produban Serviços de Informática S.A., where he managed
production services for business global units of the Group (Global Banking & Markets, Asset Management, Insurance and Credit Cards), as well as corporate projects and competency centers. In 2008, he led Produban’s operations, in Brazil, as Executive Officer for the Santander Group. He actively participated in the integration of Santander Bank and ABN
Real
and he was also responsible for the technological infrastructure operation of Santander Group in Brazil, Chile and Argentina. Since the end of 2012, he has been responsible for the Technology department in Santander Brasil Group, acting as CIO – Chief Information Officer.
José Alberto Zamorano Hernandez
.
Mr. Zamorano is Spanish and was born on May 9, 1962. He holds a degree in business administration from the Universidad Complutense de Madrid. In 1991, Mr. Zamorano began his career in Santander Group as manager of the internal audit area from 1995 to 2002, where he was responsible for the credit risk audit in regional units of Galícia, Alicante and Castilla La Mancha. From 2002 to 2005 Mr. Zamorano was superintendent of internal audit of Santander Brasil and from 2005 to 2010, he was an executive officer of internal audit in Grupo Financeiro Santander México. As one of our executive officers, Mr. Zamorano has been responsible for our internal audit area since 2011.
José Roberto Machado Filho
.
Mr. Machado is Brazilian and was born on August 25, 1968. He holds a degree in electrical engineering from Faculdade de Engenharia Industrial (FEI) in São Paulo and has a master’s degree in business, economics and finance from the Universidade de São Paulo. As one of our executive officers, he is responsible for real estate business. He was an engineer for Keumkang Limited from 1990 through 1991, a foreign exchange manager from 1992 through 1995 and a manager of emerging markets trading desk from 1992 through 1996 of Banco CCF Brasil S.A. He was also an executive officer of Banco Rabobank Internacional Brasil S.A. from 1998 through 2003 and was an executive officer of Banco Real from 2003 to 2009. Currently he is responsible for the Corporate and Integrated Offer Department, which involves the following segments: Corporate, retail products, customer’s intelligence, incentives, Real Estate Business and payroll credit, besides being responsible for the Rio de Janeiro Local, which unifies the capital of Rio as well as Espírito Santo. He is also an executive officer of Banco Bandepe S.A., Webmotors S.A. and CRV – Distribuidora de Títulos e Valores Mobiliários and Officer of Ideia Produções e Design Ltda. – ME. He is also a director of CETIP.
Maria Eugênia Andrade Lopez Santos
. Ms. Santos has dual citizenship, Brazilian and Spanish, and was born on January 23, 1966. She holds a degree in economics from the Universidade da Bahia and a specialization degree from Fundação Getúlio Vargas. As one of our officers, she is responsible for Private Segments (Private Banking, Select, Van Gogh and Individual), Investments and Insurance (Equity Management). She is also a Chief Executive Officer of Santander Brasil Advisory Services S.A.
Amancio Acúrcio Gouveia
.
Mr. Gouveia is Brazilian and was born on March 31, 1963. He holds a degree in accounting from the Universidade Santa Úrsula. As one of our officers, he is responsible for financial transactions. He was an audit manager for KPMG until 1991, accounting manager of Unibanco – União de Bancos Brasileiros S.A. from 1991 to 1999, supervisory manager of BankBoston Banco Múltiplo S.A. from 1999 to 2001 and has been an accounting and controlling manager of Santander Group since 2001. He is also an officer of Santander Leasing S.A. Arrendamento Mercantil, an executive officer of Atual Companhia Securitizadora de Créditos Financeiros, Santander Capitalização S.A., Aymoré Crédito, Financiamento e Investimento S.A., Banco Bandepe S.A. and administrator of Santander Brasil Administradora de Consórcio Ltda and of SANCAP Investimentos e Participações S.A. and a member of the Fiscal Council of Companhia Energética de São Paulo.
Ana Paula Nader Alfaya
.
Ms. Nader is Brazilian and was born on August 7, 1971. She holds a degree in publicity and advertising from the Universidade Paulista in São Paulo and a specialization degree in communications from the Escola Superior de Propaganda e Marketing. From 1996 to 1997, she served as Marketing and Internal Communication Manager, at Unibanco. She served as Credit Card’s Communication Manager from 1997 to 1998 at BankBoston and after that, as Strategy and Planning Marketing Manager, from 1998 to 2000, still at BankBoston. She served as Planning Marketing and Research Manager, from 2000 to 2003 at ABN AMRO, and as Retail Marketing Manager, from 2003 to 2004, and in the same year she became a superintendent of Strategy Marketing Department for retail. From 2005 to 2010 she served as executive superintendent of the Brand, Research and Marketing Department and, since 2011 as senior executive superintendent of Brand and Marketing department and since 2012 as Director of Brand and Marketing department.
Antonio Pardo de Santayana Montes
.
Mr. Pardo is Spanish and was born on November 5, 1971. He holds a degree in economics and a law degree from the Universidade Pontifícia Comillas in Icade. As one of our officers, he is responsible for risk approval in Credit Recovery, and before that he was Wholesale Risks Officer. He was a
consultant at PricewaterhouseCoopers from 1995 to 1998, senior risk analyst for Santander Central Hispano/Santander Investment from 1998 to 2000, senior manager of Monitor Company from 2000 to 2005 and returned to the Santander Group in 2005. Since then and until joining Santander Brasil in 2009, he worked in the Wholesale Risk Area as Deputy Head and was seconded to ABN AMRO in the post-merger process after its acquisition. He is also an executive officer of Atual Companhia Securitizadora de Créditos Financeiros.
Carlos Alberto Seiji Nomoto
.
Mr. Nomoto is Brazilian and was born on November 28, 1969. He holds a degree in business administration from the Escola Superior de Administração de Negócios and an MBA degree in Marketing from Insper. He acts as one of our officers, with responsibility for the Sustainability Department and for managing the projects and programs related to the area. From 1994 to 1997 he worked in the Private Banking and Asset Management areas at Banco Real. In 1999 he was the manager of the Finance Advising Area at Lloyds Bank. In 2000 he was Strategic Planning Manager of Grupo EDP – Eletricidade de Portugal.
Cassio Schmitt
.
Mr. Schmitt is Brazilian and was born on April 23, 1971. He holds a degree in economics from the Universidade Federal do Rio Grande do Sul, a master’s degree in corporate economics from the Fundação Getúlio Vargas in São Paulo and a master’s degree in business administration (MBA) from the Sloan School of Business, Massachusetts Institute of Technology (MIT). He was treasury economist of Banco de Crédito Nacional S.A. from 1995 to 1996, and senior economist for UNIBANCO – União de Bancos Brasileiros S.A. from 1996 to 1999. He was an associate of the leveraged finance team of UBS Warburg in 2000, project finance superintendent of UNIBANCO from 2001 to 2003 and corporate banking superintendent of UNIBANCO Representative Office in New York from 2003 to 2004. He was a superintendent in the M&A/Project Finance team of Santander Brasil in 2004, and became responsible for project finance in Brazil in 2005 and also for the areas of acquisition finance and syndicated lending in 2010. From 2011 to 2012, he became responsible for the GBM clients Risk Department. Today he is responsible for the Global Transaction Banking (GTB).
Cassius Schymura
.
Mr. Schymura is Brazilian and was born on February 19, 1965. He holds a degree in electrical engineering from the Pontifícia Universidade Católica in Rio de Janeiro and an MBA from the Fundação Dom Cabral. As one of our officers, he is responsible for the Acquiring and Cards area. He was the investment products manager for Banco Nacional S.A. from 1989 to 1991, products and marketing manager of Cardway Processamento from 1991 to 1994, products manager of Cartão Nacional from 1994 to 1996, marketing and products supervisory manager of Unicard Banco Múltiplo S.A. from 1996 to 1999, a senior associate at Booz Allen & Hamilton in 1999, a board member and the president of Idéiasnet S.A. from 2000 to 2001, the general manager of SOFTCORP from 2001 to 2004 and has been part of Santander Group since 2004. He is also Chairman of Santander Getnet Serviços, and he is also an Officer representing ABECS.
Ede Ilson Viani
.
Mr. Viani has dual Brazilian and Italian citizenship and he was born on September 5, 1967. He holds a degree in accounting and an MBA from the Instituto de Ensino e Pesquisa – INSPER. He was an auditor at Banco Itaú S.A. from 1986 to 1990, and a senior auditor at BankBoston S.A, as well. He worked for 17 years at BankBoston acting subsequently as Credit Risk Officer for medium, corporate and large corporate companies, Managing Director for Lending Products and Managing Director for SME Business Banking. He joined Santander Brasil in 2007 as Director for Small Business Banking and has been responsible for Retail Banking Risk Management from July 2010 to 2014. As one of our Officers, he is currently responsible for the Corporate Business, being responsible for all segments: segmentation, products, offer value and commercial activity.
Eduardo Müller Borges
.
Mr. Borges is Brazilian and was born on September 12, 1967. He holds a degree in business administration from the Pontifícia Universidade Católica of São Paulo. He joined the Santander Group in 2005, and is responsible for the Credit Markets Group, which includes Financing of Projects, Acquisitions, Syndicated Lending, debt capital markets and investment of our equity in renewable energy projects, within the GB&M. He was an international trade manager and then an international capital markets senior manager of the First National Bank of Boston, São Paulo from 1993 to 1996, vice president in emerging markets syndicated loans of BancBoston Robertson Stephens Inc. in Boston, Massachusetts from 1996 to 1999, a Director of BankBoston Banco Múltiplo S.A. from 1999 to 2000, capital markets vice president of Banco JP Morgan S.A. from 2000 to 2002, capital markets vice president of Santander Brasil from 2002 to 2004, a Director of ING Bank N.V. São Paulo from 2004 to 2005 and has been working at Santander Brasil again since 2005. Currently he is a member of the Executive Committee of the Global Banking & Markets Division in Brasil, an executive officer of REB Empreendimentos e Administradora de Bens S.A. and Officer of Santander Participações S.A., EOL Vento Energias Renováveis S.A., EOL Wind Energias Renováveis S.A., EOL Brisa Energias Renováveis S.A., member of the Board of Directors of
Santos Energia Participações S.A. and MS Participações Societárias S.A., and Chief Executive Officer of BW Guirapá.
Flávio Tavares Valadão
.
Mr. Valadão is Brazilian and was born on July 1, 1963. He holds a degree in electrical engineering from the Escola de Engenharia Mauá, an accounting and finance degree from the Instituto Brasileiro de Mercado de Capitais and a master’s degree in electrical engineering from the University of Lille in France. As one of our officers, he is responsible for the Corporate Finance area at Santander. He was a corporate finance officer for Banco Paribas from 1990 to 1998 and joined Banco ABN AMRO Real in 1998.
Gilberto Duarte de Abreu Filho
.
Mr. Abreu is Brazilian and was born on August 7, 1973. He holds a degree in industrial engineering from the Universidade de São Paulo and an MBA from the Massachusetts Institute of Technology, in Massachusetts. As one of our officers, he is responsible for the Mortgage Financing and he is also Chief Executive Officer of SANCAP Investimentos e Participações S.A. Before joining Santander Brasil, Mr. Abreu was a senior manager at McKinsey & Company, leading projects in both the financial and retail areas.
Jamil Habibe Hannouche
.
Mr. Hannouche is Brazilian and was born on June 23, 1960. He holds a degree in Mechanical Engineering from the Universidade Mogi das Cruzes – UMC. He holds a specialization degree in finance from Faculdade Dom Cabral, and a master’s degree in Business Management from IBMEC, as well as a master’s degree in Pedagogy from Dom Domenico. As one of our officers, he is responsible for the Universities area, including Universia Brasil S.A.’s management. He was an officer of Banco Nacional S.A. from 1983 to 1995, and an officer of Unibanco - União de Bancos Brasileiros S.A. from 1995 to 2000. He is currently an Officer of the Universities department in Banco Santander and he is also responsible for the Universia Brasil.
Javier Rodriguez de Colmenares y Alvarez
.
Mr. Rodriguez de Colmenares is a Spanish citizen, born on April 1st, 1977. He graduated in Law and Economics & Business Administration at Universidad Pontificia Comillas (ICADE) in Madrid and obtained a Master´s Degree in Investment Banking & Financial Markets from the School of Finance of Banco Bilbao Vizcaya Argentaria (BBVA). He joined the Project Finance Department at BBVA in 2001 and left as a Vice President to join the Santander Group to Global Head (Europe and the Americas) of TMTs and Logistics within the Structured Finance Unit at the Investment Bank (Santander Investment and later Global Banking & Markets). He was later named to lead the Global Infrastructure Group at the same business unit and then promoted as Global Head of Project & Acquisition Finance for the whole Santander Group, based in Madrid. In November 2009 he was named Chief Credit Officer for Specialized Finance & Structured Products (Derivatives) at the Risk Management Division, acting as a permanent member of the Global Wholesale Risk Committee and the Underwritings & Structured Products Risk Committee as well as the Global Sustainability Committee chaired by the Group CEO. As one of our Officers, he acts as the Chief Credit Officer of the Wholesale Bank in Brazil (Santander Global Banking & Markets).
Jean Pierre Dupui
.
Mr. Dupui is Brazilian and was born on September 23, 1968. He holds a bachelor’s degree in Economics and a specialization degree from the University of Boston, USA. Today he is responsible for the Corporate & Investment Bank (CIB) of Santander Brasil. From 1992 to 1998 he worked at the structured finance and trade finance department of Lloyds TSB Group in São Paulo and London. From 1998 to 2001 he worked at the structured finance department of Citigroup Brasil. From 2001 to 2004 he worked for BBVA Brasil in the debt capital markets department. From 2004 to 2006 he was corporate finance officer at Citigroup New York and São Paulo. He started his career in Santander Group in 2006, where he took charge of the credit markets department of Santander Brasil. From 2009 to 2012 he was responsible for global transaction banking of Santander in Madrid.
Luiz Felipe Taunay Ferreira
.
Mr. Taunay is Brazilian and was born on March 18, 1967. He holds a degree in business administration from the Fundação Getúlio Vargas, a degree in economics from the Universidade de São Paulo and a master’s degree in economics from the Universidade de São Paulo. Mr. Taunay is also a CFA charter holder. As one of our officers, he works in the investors’ relations department. He was a trader for Banco ING Brasil from 1994 to 1996 and head of equity derivatives market risk management at ING Barings, London from 1996 to 1998. He joined Banco Real in 1998 and has been with the Santander Group ever since. Currently he is an executive officer of Aymoré Crédito, Financiamento e Investimento S.A. and Banco Bandepe S.A.; and an officer of Santander Leasing S.A. Arrendamento Mercantil.
Mara Regina Lima Alves Garcia
.
Ms. Garcia is Brazilian and was born on December 28, 1966. She holds a bachelor’s degree in Law from the Faculdades Metropolitanas – FMU, a specialization degree in Financial Law from the IBMEC - Instituto Brasileiro de Mercado de Capitais, and a master’s degree in International Economic
Law from the Pontifícia Universidade Católica de São Paulo – PUC. She was legal manager of Banco Inter-Atlântico S.A. from 1996 to 2000 and a senior lawyer of Banco Itaú BBA S.A. from 2000 to 2006. She joined Santander Brasil in 2006 as executive superintendent of the legal wholesale area. As one of our officers, she is responsible for the legal consulting area and serves the wholesale and retail areas; and she is also member of the legal committee of FEBRABAN and ABBI.
Marcelo Zerbinatti
.
Mr. Zerbinatti is Brazilian and was born on February 5, 1974. He holds a degree in Business Administration from Faculdades Metropolitanas – FMU – SP, a specialization degree in Negotiation from Fundação Getúlio Vargas and holds a master’s degree in Planning from PUC – SP. He worked at Banco Bradesco S.A. from 1988 to 1992 as Head of Service, at Bank Boston from 1992 to 1994 as Coordinator of Foreign Exchange, and at Banco Real from 1994 to 2006 as Project Superintendent. From 2006 to 2008 he served as our Senior Organization Executive Superintendent responsible for Process and Management of Changes. From 2008 he became responsible for the coordination of the Integration Office, and from 2011, he became an Officer, responsible for the Organization, Technology and Processes Department, called Organization and Efficiency Department, from 2012. From October 2013, he became responsible for the Strategic Planning department.
Marcio Aurelio de Nobrega
.
Mr. Nobrega is Brazilian and was born on August 23, 1967. He holds a degree in business administration and economics from the Faculdade Santana and business extension at IESE Business School. As one of our officers, he is responsible for the technology and operations for Global Businesses and Asset Management Back Office. He joined Banco Real in 1982 and has been working for Santander Brasil ever since.
Mario Adolfo Libert Westphalen
.
Mr. Westphalen is Brazilian and was born on July 9, 1968. He holds a degree in Electrical Engineering from the Universidade de Brasilia. From 1992 to 1993 he was an engineer for Associate Telesis / Telemikro Telecommunications, where he worked in systems development. From 1994 to 1995 he was Head of Support and Installation of Autotrac Telecomunicações, where, from 1995 to 1997 he served as Officer of Product Development, Aftermarket and Import. In 1999 was Special Advisor to the Ministry of Development, Industry and Trade. From 1999 to 2001, he served as Senior Consultant at K2 Achievements Consultoria. From 2001 to 2003 he worked as Executive Officer and Partner of the firm Concrete Solutions. From 2004 he joined Santander Brasil, where he served as Superintendent of Patrimony and Facilities until 2007, when he became Executive Superintendent of Corporate Resources, until 2010. From 2010 to 2013 was Officer of Operations at Santander Global Facilities - SGF in the United States, with responsibility for the structuring and operation of the Santander Group’s subsidiary in the United States, whose mission is to provide and standardize Wealth Management and Payroll and Benefits services to 13 different Santander Group entities in that country. As one of our officers he is responsible for the Costs, Organization and Efficiency department.
Mauro Siequeroli
.
Mr. Siequeroli is Brazilian and was born on March 24, 1957. He holds a degree in business administration from Fundação Getúlio Vargas and a specialization degree in industrial resources and general administration also from Fundação Getúlio Vargas. As one of our officers, he is responsible for the corporate resources area. He was an operations officer for Banco Crefisul S.A. from 1985 through 1994, a products officer for Banco BMC from 1995 to 1998, an operations officer for Banco Bandeirantes S.A. from 1999 to 2000 and joined Santander Brasil in 2001. He is also an executive officer of Santander S.A. - Serviços Técnicos, Administrativos e de Corretagem de Seguros.
Miguel Angel Albero Ocerin
.
Mr. Albero is Spanish and was born on February 23, 1960. He graduated in Economics Sciences and Business Administration and holds a master’s degree in Financial Markets from Centro Internacional Carlos V (UAM). During his career he has developed management activities in the management of financial resources and human capital in sectors of financial intermediation, asset management, product structuring, business development, development of financial markets and customer relationships. Most of his professional activity has been developed at Grupo CM Capital Markets (ABN AMRO Group), where he held different executive positions in the companies of the group. He joined the Santander Group in 2007, responsible for the area of Capital Structuring (GB&M), which includes the promotion of renewable energy projects, energy efficiency and carbon financing. As one of our officers he is currently responsible for Trade Export & Commodity Finance and Correspondent Banking. Mr. Albero is also Officer of CRV Distribuidora De Títulos E Valores Mobiliários S.A.
Nilo Sérgio Silveira Carvalho
.
Mr. Carvalho is Brazilian and was born on February 26, 1961. He holds a degree in business administration from UniSantos – Universidade Católica de Santos and an MBA from Fundação Getúlio Vargas. As one of our officers, since 2008, he is responsible for the Customer Experience Department, and he is also responsible for the Retail Products and Segments department. He was a products officer for Unibanco –
União de Bancos Brasileiros S.A. from 1994 to 1998, retail and technology officer for Santander Brasil from 1998 to 2004, executive officer of Medial Saúde S.A. from 2004 to 2008. Currently he is also an executive officer of Sancap Investimentos e Participações S.A., and officer of Santander Brasil Administradora de Consórcio S.A.
Nilton Sergio S. Carvalho
.
Mr. Nilton Carvalho is Brazilian and was born on January 1, 1957. He holds a bachelor’s degree in electric production engineering from the Faculdade de Engenharia Industrial. Mr. Carvalho has been engaged in the banking business since 1981. From 1981 to 2005 he worked at Unibanco in several different departments. From 2005 to 2008, he served as operations officer at Olé Financiamentos. From 2008 to September, 2009, he was responsible for the Organization department at Santander Brasil. From October 2009 to October, 2012 he was responsible for the operation structure at Aymoré Financiamentos. Today he is responsible for the Operations department of Banco Santander, and he is also Deputy Director of RCI Leasing and for RCI CFI, and he is a Director on the board of directors of Webmotors.
Ramón Sanchez Díez.
Mr. Díez is Spanish and was born on October 29, 1968. He holds a degree in economics from the Universidad Autónoma de Madrid and has completed an Advanced Management Program at The University of Pennsylvania Wharton School. As one of our officers, he is responsible for our Payroll Customers business. He served as a financial analyst and portfolio manager for Santander Brasil’s New York branch from 1992 to 1997 and as an officer for strategy and analysis for Latin American banks at Santander in Madrid from 1997 to 2003. He was an officer for strategy and investor relations for Santander Brasil from 2004 to 2006, head of Customer Acquisition from 2007 to 2009, was in charge of our retail banking channels (call center, internet, mobile and ATM channels) from 2009 until 2011 and before his current position was the head of retail commercial planning and communication.
Reginaldo Antonio Ribeiro
.
Mr. Ribeiro is Brazilian and was born on May 19, 1969. He holds a degree in economics from the Universidade Estadual de Campinas, an accounting degree from the Universidade Paulista and an MBA from the FIPECAFI (Fundação Instituto de Pesquisas Contábeis, Atuariais e Financeiras), Universidade de São Paulo. As one of our officers, he is responsible for tax issues, tax planning strategies and corporate restructuring processes. He served as a manager for Arthur Andersen Consultoria Fiscal Financeira S/C Ltda. from 1990 to 2001. He was also a member of the Fiscal Council of Companhia Energética de São Paulo and AES TIETÊ from 2002 to 2006. He is an executive superintendent of Santander S.A. – Serviços Técnicos, Administrativos e de Corretagem de Seguros, chief executive officer of REB Empreendimentos e Administradora de Bens S.A., executive officer of Aquanima Brasil Ltda. and Atual Companhia Securitizadora de Créditos Financeiros; and officer of Santander Participações S.A., Santander Brasil Advisory Services S.A., and Norchem Participações e Consultoria S.A, Ablasa Participações S.A., Eol Brisa Energias Renováveis S.A., Eol Vento Energias Renováveis S.A. and Eol Wind Energias Renováveis S.A. and he is a member of the board of directors of Santos Energia Participações S.A.
Roberto de Oliveira Campos Neto
.
Mr. Neto is Brazilian and was born on June 28, 1969. He holds a bachelor’s degree in Economics and a specialization degree in Economics with a focus on in Finance from the University of California, Los Angeles (UCLA). He worked at Banco Bozano Simonsen from 1996 to 1999, where he served as Operator of Derivatives of Interest and Foreign Exchange (1996), Operator of External Debt (1997), Operator of the Area of Stock Exchanges (1998) and Head of the Area of International Fixed Income (1999). From 2000 to 2003 he worked as Head of the International Area and Fixed Income at Santander Brasil. In 2004 he served as Portfolio Manager of Claritas. He joined us in 2005 as Operator and in 2006 he was head of the trading desk. In 2010 he became responsible for the Proprietary Trading and Market Making Local & International. He is currently also responsible for Treasury.
Ronaldo Yassuyuki Morimoto
.
Mr. Morimoto is Brazilian and was born on May 5, 1977. He holds a bachelor’s degree in Economics from the School of Economics of the Universidade de São Paulo. He has been responsible for the area of ALM (Assets and Liabilities Management) / Financial Management. Mr. Morimoto is also Vice president of Banco Bandepe and Executive Officer of Aymoré Crédito, Financiamento e Investimento S.A. He joined Santander Brasil in 2001, working in different areas such as Governments & Institutions, Products, Finance & Accounting, Basel II Project and Wholesale Financial Control. He began his career at Banco América do Sul in the area of credit risk in 1998, then worked at Citibank S.A. from 1998 to 2000 and AT&T Latin America from 2000 to 2001.
Sergio Antonio Borriello
.
Mr. Borriello is Brazilian and was born on April 15, 1964. He holds a bachelor’s degree in Accounting Sciences, from the Pontifícia Universidade Católica – PUC – SP. He started his career in 1982, at KPMG Peat Marwick, where he worked for 5 years, until reaching the position of Senior Auditor. From
1987 to 1998 he worked at Citibank N.A., where he served in many financial areas, such as Fiscal, Accounting Policies and Management Information (MIS). From 1993 to 1996 he served in Treasury Risk, and from 1996 to 1998 in the Financial area, as Controller. From 1998 to 2002 he worked at Citibank – Colombia, as CFO, where he had additional responsibilities related to Internal Audit, Compliance and Market/Liquidity Risks. From 2002 to 2004 he worked at ABN AMRO, where he served as Business CFO, being responsible for all the businesses unities. Besides that, he was responsible for the Accounting Policies, and for the implementation of the IFRS Project and US GAAP. After, from 2005 to 2008, he worked at Banco IBI, where he acted as CFO, in addition, he occupied a statutory position, approved by SUSEP. From 2012 to 2013, he served as Officer appointed pursuant to the bylaws, at Tecnisa S.A., where he was responsible for the implantation of the Shared Services Center. Currently, Mr. Borriello works as Officer appointed pursuant to the bylaws of Santander Brasil, with responsibility for the Technology and Operational Means for the Financial Area and Risks, in addition to performing the functions of Chief Data Officer – CDO.
Sérgio Gonçalves
.
Mr. Gonçalves is Brazilian and was born on August 7, 1956. He holds a degree in economics from Fundação Armando Álvares Penteado, São Paulo, with an international Executive MBA degree from the Universidade de São Paulo – USP. Since November 2000, he has been one of our Officers, and he is currently responsible for the Companies, Government & Institutions departments. He worked as Corporate Banking Officer for 16 years (from 1979 to 1994) at Banco Crefisul, associate of Citibank. From 1995 to 2000, he was Products Officer at Banco Nossa Caixa (today, Banco do Brasil S.A.).
Thomas Gregor Ilg
.
Mr. Thomas Gregor Ilg is Brazilian, and was born on September 12, 1968. He holds a bachelor’s degree in agricultural engineering from the Universidade Estadual de Campinas – UNICAMP, and a postgraduate diploma in Business Administration at the Fundação Getúlio Vargas (CEAG). He has been engaged in the financial markets for over 21 years, including 12 years with Santander Brasil and 10 years with The First National Bank of Boston, where he first joined as trainee in the Risks and Business areas. At Santander Brasil he was responsible for the Corporate Banking Business until the beginning of 2007 when he joined our Treasury Division to develop an area designed to distribute derivatives to the Middle Market, Private Banking and Retail Business in general. At the end of 2008 he moved to the Credit Division to manage the Corporate Banking Risk Area, and now, as one of our Officers, he is responsible for the Retail Admission and Corporate Risks.
Vanessa de Souza Lobato Barbosa
.
Ms. Barbosa is Brazilian, and was born on December 24, 1968. She holds a bachelor’s degree in Business Administration from Pontifícia Universidade Católica in Minas Gerais - Brazil, and a specialization degree in Marketing at Universidade Federal de Minas Gerais – UFMG. From 1992 to 1995 she served as Marketing Local Manager at Banco Nacional. She also worked at Unibanco, in Recife – Brazil, from 1995 to 1999. In 1999 she started to work for Banco Santander, where she worked as General Manager of the Recife branch office. From 2001 to 2006 she served as Local Superintendent, where she was responsible for one of the Retail’s Locals, with head office in Belo Horizonte, covering the states of Minas Gerais, and Goiás, as well as Brasília, and the states of the Northeast. From 2006 to 2013, Ms. Barbosa became Executive Superintendent of branch network, including important cities such as: Campinas, Jundiaí, Sorocaba, Piracicaba, Limeira and Americana. As one of our officers, she is currently responsible for the Human Resources department.
Wilson Luiz Matar
.
Mr. Matar is Brazilian and was born on November 28, 1958. He holds a degree in civil engineering from the Polytechnic School of USP and has Business Administrator and specialization degrees from the FEA – Faculdade de Economia e Administração – USP. He has 33 years of experience in banking, including eighteen years in the Controllership departments of different banks. He worked at Santander Group for seven years in the controller ship area, responsible for management information and budget. Since 2006 he has been responsible for risk solvency as Vice president of Credit and Market Risks, in charge of controlling and monitoring credit portfolios as an Officer.
We have no knowledge of any arrangement or understanding with major shareholders, customers, suppliers or any other person pursuant to which any person was selected as a director or executive officer.
6B
. Compensation
Compensation of Directors, Executive Officers and Members of Audit Committee
Our shareholders establish the maximum annual aggregate compensation of our directors and officers at the annual shareholders’ meeting. Compensation of the members of our audit committee is established by our board of
directors. Under Brazilian law, companies are required to disclose the highest, lowest and average compensation of our directors, members of the audit committee and officers without indicating any individual name. However, as members of the Brazilian Institute of Finance Executives (
Instituto Brasileiro de Executivos de Finanças
– IBEF) we were granted an injunction on March 2, 2010, allowing us not to disclose this information.
Shareholders at the general shareholders meeting held on April 29, 2013 set compensation for our directors and executive officers at a total of up to R$300 million. The meeting of the board of directors held on February 27, 2013 approved compensation for the audit committee in the amount of R$3.0 million for a twelve-month period beginning on March 24, 2013. The compensation includes the value of stock and option compensation as well as pension reserves and pension plans. For the above mentioned twelve-month periods, members of our board of directors and executive officers received a total of approximately R$183.2 million and members of our audit committee received a total of approximately R$2.1 million. The total amount of contributions for pension plans of our board of executive officers in 2013 was R$2.6 million.
The criteria for granting and paying variable compensation vary according to the activities performed by the different areas and, therefore, payment of the variable compensation may differ depending on the department and activities performed by each member. Pursuant to Brazilian law, variable compensation is required to be compatible with the financial institution’s own risk management policies. At least 50.0% of variable compensation must be paid in stock or stock-based instruments and at least 40% of variable compensation must be deferred for future payment by at least 3 years. These rules are effective as from January 1, 2012.
As approved by our board of directors at the meeting held on December 23, 2009, we indemnify our directors and executive officers and members of the audit committee from claims arising during the time they occupy their respective offices, exclusively related to court or administrative costs and attorneys’ fees, except in cases of bad faith, gross negligence, willful misconduct or mismanagement by our directors or executive officers. This indemnity was also granted to the members of the audit committee and the compensation and nomination committee.
Compensation Plan Overview
We have three programs for long-term compensation: the Deferral Program, the Local Long-Term Incentive Program (the Stock Option Plan, or “SOP” and the Performance Share Plan, or “PSP”) and the Global Long-Term Incentive Program (PI09, PI10/PI11/PI12/PI13 and PI14).
Executive officers and executives in key positions are eligible to participate in these plans. The plans last three years promoting our executive officers and executives’ commitment to our long-term results. Members of the board of directors can participate in these plans only if they are executive officers, otherwise, the board members are not eligible to participate in any of these plans.
Deferral Program
Our Deferral Program is available to our statutory officers, officers in positions of management and certain other eligible employees. As part of the Deferral Program, we defer a part of these employees’ variable compensation over a period of three years.
Our Deferral Program aims to: (i) align the program with the principles of the Financial Stability Board, or “FSB,” agreed upon at the G20; (ii) align our interests with those of the plan’s participants (to achieve sustainable and recurring growth and profitability of our businesses and to recognize the participants’ contributions); (iii) allow the retention of participants; and (iv) improve our performance and protect the interests of shareholders via a long-term commitment.
Pursuant to Brazilian Law, payments made under the Deferral Program are subject to total or partial cancellation, or claw back, in cases of: (i) our unsatisfactory financial performance (financial results audited lower than defined in our business plan or loss in the period); (ii) failure to comply with internal policies, especially policies for risk management (with the need for reclassification of operations or revision of provisions), (iii) substantial change in our financial condition, unless arising from changes in accounting standards (damages, financial loss); or (iv) significant changes in our capital base.
We renew and update our Deferral Program every year. As of 2013, we had three plans outstanding: one for each fiscal year: 2011, 2012 and 2013. As of December 31, 2013, we recorded total expenses of R$81,215 million in connection with our Deferral Program compared to total expenses of R$65,359 million in 2012.
Deferral Program – 2012 and 2013
|
|
·
|
Our 2012 and 2013 plans are divided among two programs:
|
|
|
·
|
Statutory Officers and Executives
. Statutory Officers and Executives who take significant risks in the Bank and are in charge of the control areas. Deferred compensation will be paid 50% in cash, indexed to 100.0% of the CDI, and 50% in Units.
|
|
|
·
|
Collective Unsupervised – Employees
. Individuals eligible for this program include manager employees and certain of our employees. Deferred compensation will be paid 100.0% in cash, indexed to 110.0% of the CDI.
|
Deferral Program – 2011
Our 2011 plan is divided among three programs:
|
|
·
|
Supervised Collective
. The program is for members of our executive committee and other executives who manage significant risks for us and are responsible for internal control. Deferred compensation will be paid 50.0% in cash, indexed to 100.0% of the CDI, and 50.0% in shares.
|
|
|
·
|
Collective Unsupervised – Statutory Directors
. Eligible officers for this program include statutory officers that are not participants in the Supervised Collective program. Deferred compensation will be paid 100.0% in our Units.
|
|
|
·
|
Collective Unsupervised – Employees
. Individuals eligible for this program include manager employees and certain other of our employees. Deferred compensation will be paid 100.0% in cash, indexed to 120.0% of the CDI.
|
Local Long-Term Incentive Program
In the Local Long-Term Incentive Program, we have two plans for different beneficiaries, SOP, and PSP. The SOP is an option plan to purchase our Units for our top management, and the PSP is an incentive plan to compensate executives from all our areas. The objective of these plans is to retain our employees’ commitment to long-term results.
The average share price of our Units at December 31, 2013 and 2012 was R$14.07 and R$14.93, respectively.
As of December 31, 2013, we incurred pro rata daily expenses of R$43.4 million, with respect to the SOP plan and R$5.4 million with respect to the PSP plan. During the period, we recorded a gain under personnel expenses due to fluctuations in the market value of the PSP share plan in the amount of R$363 thousand on a consolidated basis.
Stock Option Plan — SOP
Our Stock Option Plan consists of three-year stock option plans to purchase our Units. The period for exercising the options is within two years of the vesting period. The volume equivalent to one third of the Units resulting from the exercise of options cannot be sold by the participant during a period of one year from the exercise date. Plan participants must remain with us during the term of the plan in order to be eligible to exercise their options on their corresponding Units.
Incentive Plan Long Term – SOP 2012
On February 3, 2010, our shareholders approved the grant of the SOP 2012 plan, with an exercise period between June 30, 2012 and June 30, 2014. The number of Units exercisable by the participants under this plan were determined (i) 50% based on total shareholder return, or “TSR,” and (ii) 50% based on the comparison between realized and budgeted net income. The options issued under the plan have an option price of R$23.50 per Unit. On December 31, 2013, there were outstanding options under the plan corresponding to a maximum of 4,903,767 Units.
Incentive Plan Long Term – SOP 2014
On October 25, 2011, our shareholders approved the grant of the SOP 2014 plan, with an exercise period between June 30, 2014 and June 30, 2016. The number of Units exercisable by the participants will be determined according to the TSR. The amount of Units that can be exercised may be reduced if our goals of return on risk-adjusted capital, or “RORAC,” are not achieved based on a yearly comparison between realized and budgeted performance. The options issued under the plan have an option price of R$14.31 per Unit. On December 31, 2013, there were outstanding options under the plan corresponding to a maximum of 15,559,406 Units.
Incentive Plan Long Term – SOP 2016
On April 29, 2013, our shareholders approved the grant of the SOP 2013 plan, with an exercise period between June 30, 2016 and June 30, 2018. The number of Units exercisable by the participants will be determined according to the TSR. The amount of Units that can be exercised may be reduced if our goals of return on risk-weighted assets, or “RoRWA,” are not achieved based on a yearly comparison between realized and budgeted performance. The options issued under the plan have an option price of R$14.42 per Unit. On December 31, 2013, there were outstanding options under the plan corresponding to a maximum of 11,042,745 Units.
Performance Share Plan – PSP
Our PSP consists of share-based compensation, launched in a three-year cycle.
PSP – Pl14
On February 3, 2010, our shareholders approved the PSP Pl14 plan. Under this compensation plans, participants receive 50% of the plan’s compensation based on shares but settled in cash and 50% in Units. On December 31, 2013, there were outstanding 1,717,309 Units under P114.
PSP – 2013
On April 29, 2013, our shareholders approved the PSP 2013 plan. Under this compensation plan, participants receive 100% of the plan’s compensation in Units. The amount of Units received may be reduced if our goals of return on RoRWA are not achieved based on a comparison between realized and budgeted performance in each year, as determined by the board of directors. On December 31, 2013, there were 2,431,003 outstanding Units under this plan.
Fair Value and Performance Parameters of SOP and PSP Plans
For the accounting of the local program’s plans, simulations were performed by an independent consultant, based on the Monte Carlo methodology, using the performance parameters used to calculate the shares to be granted. These parameters are associated with their respective probabilities of occurrence, which are updated at the closing of each period.
TSR Ranking–SOP
|
TSR Ranking
|
SOP(1)
|
SOP delivery 2014(2)
|
SOP 2013(3)
|
||||||||||
|
(% of Shares exercisable)
|
|||||||||||||
| 1 | 50 | % | 100 | % | 100 | % | |||||||
| 2 | 35 | % | 75 | % | 75 | % | |||||||
| 3 | 25 | % | 50 | % | 50 | % | |||||||
| 4 | 0 | % | 25 | % | 0 | % | |||||||
|
(1)
|
Associated with the TSR, the remaining 50% of shares exercisable refer to the realization of net income versus budgeted profit.
|
|
(2)
|
The percentage of shares determined at the position of TSR is subject to reduction in accordance with the implementation of the RORAC.
|
|
(3)
|
The percentage of shares determined at the position of TSR is subject to reduction in accordance with the implementation of the reduction of Return on Risk-weighted Assets (RoRWA).
|
TSR Ranking – PSP
|
TSR Ranking
|
PSP (PI12, PI13 and PI14)(1)
|
PSP 2013(2)
|
|||||||
|
% Shares
|
|||||||||
| 1 | 50 | % | 100 | % | |||||
| 2 | 35 | % | 75 | % | |||||
| 3 | 25 | % | 50 | % | |||||
| 4 | 0 | % | 0 | % | |||||
|
(1)
|
Associated with the TSR, the remaining 50% of shares exercisable refer to realization of net income versus budgeted profit.
|
|
(2)
|
The percentage of shares determined at the position of TSR is subject to reduction in accordance with the implementation of the reduction of Return on Risk-weighted Assets (RoRWA).
|
Method of Assessment - SOP
|
SOP
|
SOP delivery 2014
|
SOP 2013
|
||||||||||
|
Method of Assessment
|
Black-Scholes
|
Black-Scholes
|
Binomial
|
|||||||||
|
Volatility
|
40.00 | % | 40.00 | % | 57.37 | % | ||||||
|
Dividend Rate
|
3.00 | % | 3.00 | % | 5.43 | % | ||||||
|
Period of Vesting
|
2 years
|
2 years
|
2.72 years
|
|||||||||
|
Average Exercise Period
|
5 years
|
5 years
|
3.72 years
|
|||||||||
|
Risk-Free Rate
|
11.80 | % | 10.50 | % | 11.18 | % | ||||||
|
Likelihood of Occurrence
|
60.27 | % | 71.26 | % | 43.11 | % | ||||||
|
Fair Value for Stock
|
R$5.96 | R$6.45 | R$7.19 | |||||||||
Method of Assessment – PSP
|
PSP 2013
|
PI14 – PSP
|
PI13 – PSP
|
PI12 – PSP
|
|||||||||||||
|
Method of Assessment
|
Binomial
|
|||||||||||||||
|
Volatility
|
40.00 | % | 57.37 | % | 57.37 | % | 57.37 | % | ||||||||
|
Likelihood of Occurrence
|
60.27 | % | 37.59 | % | 26.97 | % | 43.11 | % | ||||||||
|
Risk-Free Rate
|
11.80 | % | 10.50 | % | 10.50 | % | 11.18 | % | ||||||||
Global Long-Term Incentive Program
In the Global Program, we have six plans, four of which have already been executed. For each cycle, a maximum number of Santander Spain shares are determined according to the achievement of performance indicators set out in the plan regulation.
Long-term incentive policy
The board of directors of Santander Spain, at a meeting held on March 26, 2008, approved the long-term incentive policy intended for the executives of Santander Spain and the Santander Group (except Banesto). This policy provides for compensation tied to the performance of the stock of Santander Spain, as established at the annual shareholders’ meeting.
This multiannual incentive plan is payable in shares of Santander Spain. The beneficiaries of the plan are the executive officers and other members of senior management, together with any other of our executives determined by the board of directors or, when delegated to it, the executive committee.
The plan involves three-year cycles for the delivery of shares to the beneficiaries. The goal is to establish a proper sequence between the end of the incentive program, linked to the previous I-06, and successive cycles of the plan. Thus, the first two cycles began in July 2007 with duration of two years for the first cycle (PI09) and the other cycles having an average duration of three years (PI10, PI11, PI12, Pl13 and PI14).
For each cycle, a maximum number of shares is established for each beneficiary who remains as our employee for the duration of the plan. The targets, which, if met, will determine the number of shares to be delivered, are defined by comparing Santander Spain’s performance with that of a benchmark group of financial institutions and are linked to two parameters, namely TSR and growth in earnings per share (“EPS”).
The ultimate number of shares to be delivered will be determined in each of the cycles by the degree of achievement of the targets on the third anniversary of commencement of each cycle (with the exception of the first cycle, for which the second anniversary will be considered), and the shares will be delivered within a maximum period of seven months from the end of the cycle.
At the end of each cycle, the TSR and the EPS growth will be calculated for Santander Spain and each of the benchmark entities and the results will be ranked from first to last. Each of the two criteria (TSR and EPS growth) will be weighted at 50.0% in the calculation of the percentage of shares to be delivered, based on the following scale and in accordance with Santander Spain’s relative position among the benchmark entities.
|
Santander Spain’s Place in the TSR Ranking
|
Percentage of Maximum Shares to Be Delivered
|
Santander Spain’s Place in the EPS Growth Ranking
|
Percentage of Maximum Shares to Be Delivered
|
|||||||
|
1st to 5th
|
100.0 | % |
1st to 5th
|
100.0 | % | |||||
|
6th
|
82.0 | % |
6th
|
82.0 | % | |||||
|
7th
|
65.0 | % |
7th
|
65.0 | % | |||||
|
8th
|
47.5 | % |
8th
|
47.5 | % | |||||
|
9th
|
30.0 | % |
9th
|
30.0 | % | |||||
|
10th and below
|
0.0 | % |
10th and below
|
0.0 | % | |||||
Any benchmark group entity that is acquired by another company, whose shares cease trading or that ceases to exist, will be excluded from the benchmark group and certain adjustments to the ranking criteria and award criteria are made. In an event of this of any similar nature, the comparison with the benchmark group will be performed in such a way that, for each of the measures considered (TSR and EPS growth) the maximum percentage of shares will be delivered if Santander Spain ranks within the first quartile (including the 25th percentile) of the benchmark group; no shares will be delivered if Santander Spain ranks below the average (50th percentile); 30.0% of the maximum amount of shares will be delivered if Santander Spain is placed at the median (50th percentile). The linear interpolation method will be used for calculating the corresponding percentage for positions between the median and the first quartile (25th percentile) (neither included).
Beginning with plan Pl12, the number of shares to be awarded is related to only one performance parameter, TSR, which is fully weighted in the percentage of shares to be distributed.
Fair Value
The fair value of the Performance Share Plans was calculated as follows:
|
|
·
|
It was assumed that the beneficiaries will not terminate the employment with us during the term of each plan.
|
|
|
·
|
The fair value of the 50.0% linked to Santander Spain’s relative TSR position was calculated, on the grant date, on the basis of the report provided by external valuers whose assessment was carried out using a Monte Carlo valuation model, performing 10,000 simulations to determine the TSR of each of the companies in the benchmark group, taking into account the variables set forth below. The results (each of which represents the delivery of a number of shares) are classified in decreasing order by calculating the weighted average and discounting the amount at the risk-free interest rate.
|
|
PI10
|
PI11
|
PI12
|
PI13
|
PI14
|
||||||||||||||||
|
Expected volatility(1)
|
15.7 | % | 19.3 | % | 42.4 | % | 49.6 | % | 51.3 | % | ||||||||||
|
Annual dividend yield based on last few years
|
3.2 | % | 3.5 | % | 4.9 | % | 6.3 | % | 6.1 | % | ||||||||||
|
Risk-free interest rate (Treasury Bond yield – zero coupon) over the period of the plan
|
4.5 | % | 4.84 | % | 2.04 | % | 3.33 | % | 4.07 | % | ||||||||||
|
(1)
|
Calculated on the basis of historical volatility over the corresponding period (two or three years).
|
The application of the simulation model results in percentage values of 42.7% for PI09, 42.3% for PI10, 44.9% for PI11 and 52.4% for PI12, which are applied to 50.0% of the value of the options granted, in order to determine the book cost of the TSR-based portion of the incentive. Since this valuation refers to a market condition, it cannot be adjusted after the grant date.
In 2013, there were pro rata daily expenses of R$3.2 million for costs on the respective dates of the cycles of the global program. Expenses related to the plans are recognized against other liabilities – provision for share-based payments.
Contract termination
Employment contracts have an undefined period. The termination of the employment relationship for non-fulfillment of obligations or voluntarily does not entitle executives to any financial compensation.
6C
. Board Practices
Our shareholders elect members of our board of directors at the annual general shareholders’ meeting for two-year terms (members may be reelected). The board of directors appoints our executive officers for two-year terms, who can also be reelected.
The current members of the board of directors were appointed during the ordinary and extraordinary shareholders’ meeting held on April 29, 2013, and the extraordinary shareholders’ meetings held on June 03, 2013, November 01, 2013 and April 30, 2014 until the ordinary shareholders’ meeting to be held in 2015.
The current executive officers were elected at the board of directors meetings held on May 28, 2013, June 25, 2013, July 29, 2013, September 26, 2013, December 30, 2013, January 29, 2014 and March 26,2014, with terms of office until the first board of directors meeting occurring after the ordinary shareholders’ meeting to be held in 2015.
The board of directors meets regularly four times a year and extraordinarily as often as required. The executive officers meet as often as required by the CEO or by the officer designated by him.
On December 23, 2009, our board of directors approved its code of regulations. Shareholders may access such code on the websites www.santander.com.br/ri and www.santander.com.br/acionistas, section “Corporate Governance—Regulations of the Board of Directors.”
Fiscal Council
According to Brazilian Corporate Law, the adoption of a permanent fiscal council by us as a publicly held company is voluntary. Our by-laws provide for a nonpermanent fiscal council, which can be installed at the request of shareholders representing at least one-tenth of the voting shares or five per cent of the nonvoting shares. Currently our fiscal council is not installed. The fiscal council is an independent body elected by shareholders to supervise the activities of managers and independent auditors. The responsibilities of the fiscal council are established by Brazilian Corporate Law and include oversight of management’s compliance with laws and by-laws, the issuance of a report on the company’s annual and quarterly reports, certain matters submitted for shareholders’ approval, calling of shareholders’ meetings in some cases and reporting on specific adverse matters arising at those meetings.
Board Advisory Committees
Audit Committee
According to Brazilian Central Bank regulations (Resolution 3,198/2004 of the CMN, as amended), an audit committee is a statutory board, separate from the board of directors, created by a shareholders’ resolution. The members of the audit committee may be members of the board of directors, provided that they meet certain independence requirements. All members of our audit committee meet such independence requirements. In addition, under Brazilian law, the function of hiring independent auditors is reserved for the board of directors. As a result, as specified in Section 3(a)(58) of the Exchange Act, our board of directors functions as our audit committee for the purpose of approving any engagement of our independent auditors for audit and non-audit services provided to our subsidiaries or to us. Except in these respects, our audit committee performs the functions of audit committees of U.S. companies. For more information see “Item 16D. Exemptions from the Listing Standards for Audit Committees.”
Our audit committee is composed of three to six members, elected by our board of directors, among persons, members of the board of directors and others, who meet all statutory and regulatory requirements for the exercise of their office, including any requirements to ensure their independent judgment, one of them with a demonstrable knowledge of the accounting and audit practice, which shall serve for a one-year term and may be reelected pursuant to applicable legislation for up to four consecutive times to a maximum five-year term of office. One of the members shall be designated as the audit committee’s coordinator, and at least one member must have proven knowledge in the areas of accounting and auditing (financial expert).
Our audit committee has as main functions:
|
|
·
|
advises the board of directors on the engagement or replacement of the external auditor;
|
|
|
·
|
assesses the quality of the financial statements, of the senior management reports, of the explanatory notes and of the independent auditor’s report, as well as of other material financial information disclosed and sent to the regulatory bodies;
|
|
|
·
|
evaluates the effectiveness of the normative provisions applicable to us, in addition to internal regulation and codes;
|
|
|
·
|
evaluates the fulfillment by our management of the recommendations made by the external or internal auditors;
|
|
|
·
|
prepares, at the end of the six-month period ended on June 30 and December 31 every year, the report of the audit committee, meeting the applicable legal and regulatory provisions; and
|
|
|
·
|
receives and reviews the reports required by the regulatory bodies concerning the activities of the ombudsman, on the base dates of June 30 and December 31 or when a material event is identified.
|
The current members of the audit committee are Celso Clemente Giacometti, Elidie Palma Bifano, who acts as financial expert, Graham Charles Nye (pending Brazilian Central Bank approval) and René Luiz Grande, who acts as a coordinator, all of them with term of office of one year as of March 18, 2014.
Set forth below are biographies of the members of our audit committee.
Celso Clemente Giacometti
.
See “—Members of the Board of Directors.”
René Luiz Grande
.
Mr. Grande is a Brazilian citizen and was born on April 19, 1953. He holds a degree in Economics from Pontificia Universidade Católica de São Paulo, and a specialization degree in National Financial System from Fundação Instituto de Administração as (FIA). He was an employee of the Brazilian Central Bank, qualified by the public examination since June, 1975, and worked in the Supervision and Inspection Department of the National Financial System. During his career in the Brazilian Central Bank he served in various functions, including officer responsible for standards and organization matters of the financial system from 1975 to 1978; technical assistant from 1978 to 1989; supervisor from 1989 to 1995; inspection supervisor from 1995 to 1999; head of the Banking Supervisory and Technical Department from 1999 to 2003, and deputy head of the Banking
Supervisory and Financial Conglomerates department from 2003 to 2011. Before working with the Brazilian Central Bank, he occupied the position of head of Human Resources with the Companhia Brasileira de Embalagens Metálicas BRASILATA from 1973 to 1975.
Elidie Palma Bifano
.
Mrs. Bifano is Brazilian, born on May 16, 1947. She holds a bachelor’s degree in Law and Social Sciences from the Faculdade de Direito da Universidade de São Paulo – USP, in 1969. She holds a specialization degree in Tax Law from USP and, a master’s degree and a doctorate in Tax Law from Pontifícia Universidade Católica de São Paulo – PUC-SP. From 1974 to 2012 she worked at PricewaterhouseCoopers – PwC, where she served as a partner in the tax advisory department for more than 20 years. In June 2012, she became a partner at Mariz Oliveira e Siqueira Campos Advogados. Mrs. Bifano is also a professor of postgraduate studies at USP, PUC, FGV, Instituto Brasileiro de Estudos Tributários and Instituto Brasileiro de Direito Tributário, or “IBDT.” For 18 years she has been serving as Financial Vice president (CFO) at the Brazil-Canada Chamber of Commerce. She is also a member of the IBDT’s Council and the International Tax Law Magazine’s Editorial Council, at Quartier Latin Publishing. Since August, 2012, she has been a member of Santander Brasil’s S.A.’s audit committee.
Graham Charles Nye
.
Mr. Nye is Brazilian, born on April 30, 1960. He holds a bachelor´s degree in Business Studies and Accounting from the University of Edinburgh, Scotland. He is a Chartered Accountant, member of The Institute of Chartered Accountants of Scotland. From 1982 to 2013 he worked at PricewaterhouseCoopers – PwC, where he served as a partner in the financial services assurance and transaction support practices for 17 years, of which 15 years were in São Paulo, Brazil. During his career at PwC, he also worked and was resident in Budapest (Hungary), Lisbon (Portugal), London (England) and Aberdeen (Scotland).
Compensation and Nomination Committee
In order to comply with the Brazilian Central Bank regulations (CMN Resolution 3,921/2010 of November 25, 2010) on February 7, 2012, our shareholders established the compensation and nomination committee in our by-laws, which also acts as the compensation and nomination committee for all our affiliates and subsidiaries.
Our compensation and nomination committee is composed of three to five members, appointed by the board of directors from among persons who meet all statutory and regulatory requirements for the exercise of their office. At least one of the members cannot be an executive officer and the others may or may not be members of our board of directors, and at least two members shall be independent, pursuant to paragraph 3 of article 14, of our by-laws. The compensation and nomination committee shall have in its composition qualified members with the experience required for the judgment exercise of including any requirements to ensure their independent judgment about our internal compensation policy and the repercussion of this internal compensation policy on the risk management. Such persons shall serve for a term of two years and may be reelected for up to four consecutive times, pursuant to applicable legislation.
Our compensation and nomination committee has as main functions:
|
·
|
develops internal compensation policies applicable to our executive officers and makes proposals to our board of directors regarding policies for variable and fixed compensation, benefits, and special programs for recruiting and terminations;
|
|
·
|
proposes and recommends the nomination of the Audit Committee’s members, as well as the members of other committees of the Bank;
|
|
·
|
proposes to the board of directors the aggregate compensation of the executive officers and member of the Audit Committee to be submitted to the general meeting, pursuant to article 152 of Law 6,404 of 1976;
|
|
·
|
proposes to the Board of Directors the aggregate and individual variable compensation to the CEO and Executive Vice Presidents;
|
|
·
|
analyzes our internal officer and board compensation policies and procedures in comparison with market practice, and recommends changes to align our policies with market practice if significant differences from market practice are identified;
|
|
·
|
annually prepares, within ninety days as from December 31 of each year, the compensation and nomination committee report, in accordance with applicable statutory and regulatory provisions; and
|
|
·
|
ensure that the internal officer compensation policy is compatible with our risk management rules, with performance targets and with our current and expected financial condition, and pursuant to the applicable regulatory provisions and regulations published by the Brazilian Central Bank.
|
The current members of the compensation and nomination committee are Celso Clemente Giacometti, who acts as Coordinator, Eduardo Nunes Gianini and Viviane Senna Lalli, with term of office until the first board of directors meeting occurring after the ordinary shareholders meeting to be held on 2015.
Celso Clemente Giacometti
.
See “—Members of the Board of Directors.”
Viviane Senna Lalli
.
See “—Members of the Board of Directors.”
Eduardo Nunes Gianini
.
Mr. Gianini is Brazilian and holds a bachelor’s degree in sociology and politics from Fundação Escola de Sociologia e Política de São Paulo, or “FESPSP.” He has been engaged as executive and consultant in matters related to human resources management for 32 years. He started his career at Serprofit Ltda., a company which provided outsourcing services between 1970 and 1979. From 1979 to 1990 he was human resources manager and total quality manager at Union Carbide do Brasil S.A. He was a partner officer at Hays do Brasil Consultores Ltda., where he worked from 1991 to 2009. Currently he is a partner officer of Gobbet & Gianini Consultores Ltda., with expertise in executive compensation and organizational development.
Risk Committee
The risk committee is a consultative body which has the responsibility of advising the board of directors on subjects related to the policies, operational directions and methodologies of capital allocation, risk management and exposure edges, according to the applicable law.
The risk committee is composed of three to five members, and at least two of these members must be independent. The term of office is of two years, re-election permitted, and the members may be removed at any time. The risk committee meetings are held at least four times a year or when extraordinarily convened by its coordinator.
The current members of the risk committee are Celso Clemente Giacometti (who also act as coordinator), René Luiz Grande and Conrado Engel, with term of office until the first board of directors meeting occurring after the ordinary shareholders’ meeting to be held in 2015.
Celso Clemente Giacometti.
See “—Members of the Board of Directors.”
René Luiz Grande.
See “Audit Committee.”
Conrado Engel.
See “Member of the Board of Directors.”
Corporate Governance and Sustainability Committee
The corporate governance and sustainability committee is a consultative body which is responsible for advising the board of directors on subjects related to the corporate governance and sustainability practices, that enhance the management of Banco Santander, regarding the transparency and respect and the promotion of the sustainable development of the company.
The committee is composed of three to five members, and at least two of these members must be independent. The term of office is of two years, re-election permitted, and the members may be removed at any time. The corporate governance and sustainability committee meetings are held at least four times a year or when extraordinarily convened by its coordinator.
The current members of the corporate governance and sustainability committee are Celso Clemente Giacometti (who also act as coordinator), Gilberto Mifano, José Luciano Duarte Penido, Marília Artimonte Rocca and Maria Luíza Pinto e Paiva, with term of office until the first board of directors meeting occurring after the ordinary shareholders’ meeting to be held in 2015.
Celso Clemente Giacometti
.
See “—Members of the Board of Directors.”
Marília Artimonte Rocca
.
See “—Members of the Board of Directors.”
Gilberto Mifano
.
Mr. Mifano is Brazilian and was born on November 11, 1949. He has a degree in Business Administration, from the School of Business Administration of São Paulo of FGV. He is Independent Director of
Cielo S.A. and Accumulators Moura S/A, and he is independent member of TOTVS Audit Committee, as well as independent member of our Corporate Governance and Sustainability Committee. Mr. Mifano is also external consultant of the Audit Committee, Risk Management and Finance of Natura S/A and partner counselor of PRAGMA Patrimônio Ltda. From 2006 to 2012 he was a Director, Vice-Chairman and Chairman of the Board of Directors of IBGC – Brazilian Institute of Corporate Governance. From 1994 to 2008, he was General Officer of BOVESPA – Bolsa de Valores de São Paulo and CBLC – Brazilian Clearing and Depository Company. During this period he was responsible, among other things, for the creation of the New Market, the integration of the Brazilian stock exchanges, demutualization and IPO of BOVESPA. He then organized the merger of Bovespa and BM&F when he was elected the first Chairman of BM&F BOVESPA S/A – Securities, Commodities and Futures Exchange. At international level, for about 8 years, he was part of the executive committees of WFE – World Federation of Exchanges and FIAB – Ibero-American Federation of Exchanges. Previously, he was executive and officer in financial companies in Brazil in the areas of credit, engineering, products and marketing.
José Luciano Duarte Penido
.
Mr. Penido is Brazilian and was born on March 8, 1948. He holds a degree in Mining Engineering from the School of Engineering of the Federal University of Minas Gerais. He began his career in ICOMI – Indústria e Comércio de Minérios, at the manganese mine, in the Serra do Navio, Amapá, where he worked until August 1973. From September 1973 to 1988 he worked at SAMITRI, a mining company of the Belgo Mineira Group, responsible for several managerial functions of mineral research, mining and industrial projects. From 1989 to 2003 he worked at SAMARCO, where he served as Development Officer and as CEO for 12 years. From 2004 to 2009 he was CEO of VCP – Votorantim Celulose e Papel. Since 2009, Mr. Penido has chaired the Board of Directors of Fibria Celulose. Mr. Penido is also an independent member of the Board of Directors of COPERSUCAR, CHEMISTRY AMPARO YPÊ, and Orteng GROUP – Equipamentos e Sistemas, where he also coordinates the Personnel and Compensation Committees. Since 2012 Mr. Penido has been a member of our Corporate Governance and Sustainability Committee. Since January 2014 he has been a member of the Executive Committee of the WBCSD – World Business Council for Sustainable Development. In their socio-environmental activities, Mr. Penido is a member of the Council for Economic and Social Development of the Presidency of the Republic, the Council for Economic and Social Development of Bahia, Chairman of the Deliberative Council of the Ecological Corridor Association of Vale do Paraiba, and he is also a counselor founder of the NGO Citizen Network.
Maria Luiza de Oliveira Pinto e Paiva
.
Ms. Paiva is Brazilian, and was born on July 14, 1963. She has degrees in Psychology from the Pontifícia Universidade Católica de São Paulo (PUC – SP) and in Human Resources from the University of Michigan. She works as a consultant on Sustainable Development and Organizational Development. From 2002 to 2012 she served as our Executive Officer, responsible for the creation and development of the area of sustainability within the institution. Ms. Paiva has been involved in the sustainability issue for over 12 years. In addition, she is a member of the Advisory Board of the Institute Akatu and Brazilian Women’s Network for Sustainability and the Brazilian Association of Sustainability Professionals (ABRAPS). From 1988 to 1994 she served as Human Resources Manager at Banco Nacional SA. From 1995 to 2002 she worked at the Regional Office for Latin America and the Caribbean, in Amsterdam, where she served as head of Global Human Resources at ABN AMRO.
Executive Committee
The CEO, senior vice president executive officers and vice president executive officers comprise the executive committee which examines policies for business management, operational support, human resources and capital allocation. It also deliberates on the main technological, infrastructure and services projects.
Disclosure Committee
The Disclosure Committee is an executive body which advises the company on communications with external and internal audiences, including material facts, notices to the market, notices to shareholders, resolutions of the board of directors, internal communications, press enquires and press releases. The committee shall consists of four members: the investor relations officer, who acts at its chairman, the executive vice president responsible for corporate affairs, the executive vice president responsible for brand, marketing, communication and interactivity and the officer responsible for the investor relations.
|
6D
.
|
Employees
|
On December 31, 2013, we had 49,621 full-time, permanent employees. The following table presents the breakdown of our full-time, permanent employees at the date indicated.
|
At December 31,
|
||||||||||||
|
2013
|
2012
|
2011
|
||||||||||
|
Administrative employees
|
6,776 | 7,271 | 8,014 | |||||||||
|
Commercial areas employees
|
42,845 | 46,721 | 46,550 | |||||||||
|
Total
|
49,621 | 53,992 | 54,564 | |||||||||
We provide a competitive benefits package, which contributes to the engagement, attraction and retention of our employees. To ensure competitiveness, we compare our annual benefit package to the best practices and market trends. Policies are developed and offered contemplating the individual needs of our employees. We also have a policy of providing continuous training to our employees, allowing them to hone their skills and create a more effective team, committed to the values of the group.
We have a profit sharing plan with our employees based on predetermined goals for our annual operating and financial results. As a result, if we meet or exceed certain goals, our employees can share in our financial performance. See “—B. Compensation.”
We also offer our employees a defined contribution pension plan where employees can choose to contribute part of their wages and to which we can also make contributions on behalf of such employees. This plan provides retirement benefits, and disability and death benefits. SantanderPrevi is the only pension plan currently open for new membership. Most of our current employees are registered with the SantanderPrevi plan. At December 31, 2013, 43,715 participants were enrolled in that plan, making the total amount under management approximately R$1.9 billion. For additional information on our pension plans, see note 21 of our audited consolidated financial statements.
The Brazilian Banking Employees’ Union represents most of our employees. In the event of a potential conflict with our banking employees and/or the banking union, negotiations are conducted by the FENABAN. Each year, generally in September, all Brazilian banks have a collective negotiation period in which they revise salary structures. During this period, the Brazilian Banking Employees’ Union negotiates bank employees’ salaries within the scope of the Brazilian Banking Collective Agreement with the FENABAN. Since the acquisition of our predecessor banks by our indirect shareholder Santander Spain, we have not suffered significant losses through strikes and our management believes it has good relations with our employees.
|
6E
.
|
Share Ownership
|
The following table provides the names of our directors and executive officers who owned shares of Santander Brasil as of December 31, 2013.
|
Shareholder
|
Common Shares
|
Percentage of Outstanding Common Shares
|
Preferred Shares
|
Percentage of Outstanding Preferred Shares
|
Percentage of Total Share Capital
|
|||||||||||||||
|
Amancio Acurcio Gouveia
|
569,415 | (1 | ) | 517,650 | (1 | ) | (1 | ) | ||||||||||||
|
Ana Paula Nader Alfaya
|
140,690 | (1 | ) | 127,900 | (1 | ) | (1 | ) | ||||||||||||
|
Antonio Pardo de Santayana Montes
|
1,521,905 | (1 | ) | 1,383,550 | (1 | ) | (1 | ) | ||||||||||||
|
Carlos Alberto López Galán
|
2,286,515 | (1 | ) | 2,078,650 | (1 | ) | (1 | ) | ||||||||||||
|
Carlos Alberto Seiji Nomoto
|
67,540 | (1 | ) | 61,400 | (1 | ) | (1 | ) | ||||||||||||
|
Cassio Schmitt
|
1,010,845 | (1 | ) | 918,950 | (1 | ) | (1 | ) | ||||||||||||
|
Cassius Schymura
|
1,138,995 | (1 | ) | 1,035,450 | (1 | ) | (1 | ) | ||||||||||||
|
Celso Clemente Giacometti
|
1 | (1 | ) | 0 | (1 | ) | (1 | ) | ||||||||||||
|
Conrado Engel
|
5,523,595 | (1 | ) | 5,021,450 | (1 | ) | (1 | ) | ||||||||||||
|
Ede Ilson Viani
|
1,533,565 | (1 | ) | 1,394,150 | (1 | ) | (1 | ) | ||||||||||||
|
Eduardo Müller Borges
|
2,040,555 | (1 | ) | 1,855,050 | (1 | ) | (1 | ) | ||||||||||||
|
Flavio Tavares Valadão
|
6,177,930 | (1 | ) | 5,616,300 | (1 | ) | (1 | ) | ||||||||||||
|
Gilberto Duarte de Abreu Filho
|
1,029,930 | (1 | ) | 936,300 | (1 | ) | (1 | ) | ||||||||||||
|
Ignacio Dominguez Adame Bozzano
|
2,322,155 | (1 | ) | 2,111,050 | (1 | ) | (1 | ) | ||||||||||||
|
Jamil Habibe Hannouche
|
1,156,980 | (1 | ) | 1,051,800 | (1 | ) | (1 | ) | ||||||||||||
|
Jesus Maria Zabalza Lotina
|
825,000 | (1 | ) | 750,000 | (1 | ) | (1 | ) | ||||||||||||
|
João Guilherme de Andrade So Consiglio
|
4,369,145 | (1 | ) | 3,971,950 | (1 | ) | (1 | ) | ||||||||||||
|
Shareholder
|
Common Shares
|
Percentage of Outstanding Common Shares
|
Preferred Shares
|
Percentage of Outstanding Preferred Shares
|
Percentage of Total Share Capital
|
|||||||||||||||
|
Jose Alberto Zamorano Hernandez
|
558,195 | (1 | ) | 507,450 | (1 | ) | (1 | ) | ||||||||||||
|
José Antonio Alvarez Alvarez
|
1 | (1 | ) | 0 | (1 | ) | (1 | ) | ||||||||||||
|
José de Paiva Ferreira
|
468,051 | (1 | ) | 425,500 | (1 | ) | (1 | ) | ||||||||||||
|
José Manuel Tejon Borrajo
|
1 | (1 | ) | 0 | (1 | ) | (1 | ) | ||||||||||||
|
José Roberto Machado Filho
|
2,409,935 | (1 | ) | 2,190,850 | (1 | ) | (1 | ) | ||||||||||||
|
Luiz Felipe Taunay Ferreira
|
1,349,370 | (1 | ) | 1,226,700 | (1 | ) | (1 | ) | ||||||||||||
|
Manoel Marcos Madureira
|
702,075 | (1 | ) | 638,250 | (1 | ) | (1 | ) | ||||||||||||
|
Mara Regina Lima Alves Garcia
|
585,640 | (1 | ) | 532,400 | (1 | ) | (1 | ) | ||||||||||||
|
Marcelo Zerbinatti
|
710,325 | (1 | ) | 645,750 | (1 | ) | (1 | ) | ||||||||||||
|
Marcio Aurelio de Nobrega
|
1,072,225 | (1 | ) | 974,750 | (1 | ) | (1 | ) | ||||||||||||
|
Marco Antônio Martins de Araújo Filho
|
1,798,885 | (1 | ) | 1,635,350 | (1 | ) | (1 | ) | ||||||||||||
|
Maria Eugênia Andrade Lopez Santos
|
2,059,860 | (1 | ) | 1,872,600 | (1 | ) | (1 | ) | ||||||||||||
|
Mauro Siequeroli
|
710,215 | (1 | ) | 645,650 | (1 | ) | (1 | ) | ||||||||||||
|
Miguel Angel Albero Ocerin
|
1,097,250 | (1 | ) | 997,500 | (1 | ) | (1 | ) | ||||||||||||
|
Nilo Sérgio Silveira Carvalho
|
1,029,930 | (1 | ) | 936,300 | (1 | ) | (1 | ) | ||||||||||||
|
Nilton Sergio Silveira Carvalho
|
44,165 | (1 | ) | 40,150 | (1 | ) | (1 | ) | ||||||||||||
|
Oscar Rodriguez Herrero
|
1,527,735 | (1 | ) | 1,388,850 | (1 | ) | (1 | ) | ||||||||||||
|
Pedro Carlos Araújo Coutinho
|
2,811,600 | (1 | ) | 2,556,000 | (1 | ) | (1 | ) | ||||||||||||
|
Ramón Sanchez Díez
|
733,040 | (1 | ) | 666,400 | (1 | ) | (1 | ) | ||||||||||||
|
Reginaldo Antonio Ribeiro
|
716,210 | (1 | ) | 651,100 | (1 | ) | (1 | ) | ||||||||||||
|
Roberto de Oliveira Campos Neto
|
10,748,870 | (1 | ) | 9,771,700 | (1 | ) | (1 | ) | ||||||||||||
|
Ronaldo Yassuyuki Morimoto
|
4,640,845 | (1 | ) | 4,218,950 | (1 | ) | (1 | ) | ||||||||||||
|
Sergio Gonçalves
|
810,975 | (1 | ) | 737,250 | (1 | ) | (1 | ) | ||||||||||||
|
Thomas Gregor ILG
|
808,720 | (1 | ) | 735,200 | (1 | ) | (1 | ) | ||||||||||||
|
Vanessa de Souza Lobato Barbosa
|
44,165 | (1 | ) | 40,150 | (1 | ) | (1 | ) | ||||||||||||
|
Viviane Senna Lalli
|
1 | (1 | ) | 0 | (1 | ) | (1 | ) | ||||||||||||
|
Wilson Luiz Matar
|
227,535 | (1 | ) | 206,850 | (1 | ) | (1 | ) | ||||||||||||
|
Other Employees
|
154,108,367 | 0.07 | % | 141,275,784 | 0.08 | % | 0.08 | % | ||||||||||||
|
(1)
|
Owns less than 0.01%.
|
Shares held by members of our board of directors and our executive officers do not have special voting rights in relation to shares held by our other shareholders
7A
. Major Shareholders
As of December 31, 2013, Santander Spain directly and indirectly through its subsidiaries, Grupo Empresarial Santander, S.L., Sterrebeeck B.V. and Santander Insurance Holding, S.L., owned approximately 74.86% of our total capital stock.
The following table presents the beneficial ownership of our common and preferred shares as at December 31, 2013.
|
Principal Shareholders
|
Common Shares
|
Percentage of Outstanding Common Shares
|
Preferred Shares
|
Percentage of Outstanding Preferred Shares
|
Percentage of Total Share Capital
|
|||||||||||||||
|
(in thousands, except percentages)
|
||||||||||||||||||||
|
Grupo Empresarial Santander SL
|
61,350,950 | 28.82 | % | 51,153,553 | 27.47 | % | 28.19 | % | ||||||||||||
|
Sterrebeeck B.V.
|
99,527,083 | 46.76 | % | 86,492,330 | 46.45 | % | 46.62 | % | ||||||||||||
|
Santander Insurance Holding SL
|
206,664 | 0.10 | % | 0 | 0.00 | % | 0.05 | % | ||||||||||||
|
Qatar Holding, LLC
|
10,805,397 | 5.08 | % | 9,823,089 | 5.28 | % | 5.17 | % | ||||||||||||
|
Treasury Shares
|
1,021,459 | 0.48 | % | 928,599 | 0.50 | % | 0.49 | % | ||||||||||||
|
Employees(1)
|
231,638 | 0.11 | % | 211,757 | 0.11 | % | 0.11 | % | ||||||||||||
|
Other minority shareholders
|
39,698,541 | 18.65 | % | 37,593,057 | 20.19 | % | 19.37 | % | ||||||||||||
|
Total
|
212,841,732 | 100.00 | % | 186,202,385 | 100.00 | % | 100.00 | % | ||||||||||||
|
Note:
|
|
(1)
|
Includes members of senior management. See “Management—Share Ownership.”
|
The total number of ADSs held by U.S. investors at December 31, 2013, is 280,260,156, not including individuals and legal entities with portfolios of less than U.S.$100 million, information to which we do not have access.
Significant Changes in Percentage Ownership of Principal Shareholders
On November 14 and 15, 2011 we filed an amendment to our automatic shelf registration statement and a related prospectus supplement with the SEC with the purpose of having available for sale on a registered basis approximately 8.0% of our capital stock. At such time, the Santander Group expected to use this registration statement to allow for greater flexibility of the group in fulfilling its commitment to deliver approximately a 5.0% stake in our capital stock under the outstanding exchangeable bonds and fulfill our commitment to reach a 25.0% free float prior to October 2013 or October 2014, subject to agreement with BM&FBOVESPA, when market conditions are appropriate.
On January 9, 2012, Grupo Empresarial Santander, S.L. transferred to Santander Spain ADRs representing approximately 5.18% of our capital stock, as part of an internal reorganization in the Santander Group, to the transfer of approximately 4.41% of our capital stock to a third party, which should deliver such interest to the investors of the exchangeable bonds issued by Santander Spain in October 2010, in the total amount of USD 2,718,800,000, acquired by QHL. The issuance of such exchangeable bonds by Santander Spain was object of a Material Fact dated October 29, 2010. On October 29, 2013 QHL exercised its exchange rights related to such exchangeable bonds in the total amount of U.S.$2,719 million, and as a result, on November 7, 2013, Qatar Holding, LLC received from Santander Spain 190,030,195 ADS issued by us. Therefore, and considering the 6,431,575 ADS issued by us already held directly or indirectly by Qatar group, it held a total of 196,461,770 ADS as of that date, which represented 5.08% of the common shares and 5.28% of the preferred shares of our capital stock at that time. For further information, see note 24 of our audited consolidated financial statements.
During 2012 and 2013, Grupo Empresarial Santander, S.L. and Santander Spain performed a series of ADR sale transactions. As a result Santander Spain, directly or indirectly, held at December 31, 2013 approximately 75.68% of our voting capital stock and approximately 74.86% of our total capital stock and our free float was approximately 24.61% of the total stock.
Subscription of Tier 1 and Tier 2 Notes
At a shareholders’ meeting held on November 1, 2013, as part of the Plan for Optimization of our Capital, our shareholders approved: (i) the distribution of equity to our shareholders as a result of a capital reduction, in the total amount of R$6 billion, with no reduction in the number of shares; (ii) the issuance abroad of debt instruments to compose our Tier I and Tier II regulatory capital; and (iii) a bonus share program and an adjustment in the composition of the Units, followed by a reverse share split, with the purpose of eliminating trading in cents.
The distribution of Tier 1 and Tier 2 Notes was finalized on January 29, 2014. We issued U.S.$1,247,712,527 aggregate principal amount of 7.375% Tier 1 Subordinated Perpetual Notes, and U.S.$1,247,712,527 aggregate principal amount of 6.000% Tier 2 Subordinated Notes due January 29, 2024. The Tier 1 and Tier 2 Notes were offered directly to the holders of our ADRs as well as to the holders of our units, and our common and preferred shares.
Voting Rights of Principal Shareholders
Our principal shareholders do not have voting rights distinct from those of our other shareholders. See Item 10—Additional Information—B—Memorandum and Articles of Association—Issued Share Capital.
7B
. Related Party Transactions
We have a documented policy with respect to related-party transactions approved by the board of directors, which is intended to ensure that all transactions covered by the policy are conducted based on our interest and our shareholders. The policy defines the power to approve certain transactions by the board of directors. The rules are also applied to all our directors, senior management, employees and subsidiaries. Additionally, related party transactions are also included in the regular auditing program developed by our internal audit, as well as subject to the supervision of our independent auditors.
We currently engage in, and expect from time to time in the future to engage in, financial and commercial transactions with our subsidiaries and affiliates and those of the Santander Group. We have credit lines outstanding with the Santander Group and its affiliated financial institutions around the world. At December 31, 2013, borrowings and deposits from the Santander Group represented approximately 2.0% of our total funding. In addition, from time to time, we enter into certain transactions with the Santander Group and other related parties for the provision of advisory and advertising services. Such transactions are conducted at arm’s-length, based on terms that would have been applied for transactions with third parties.
The transactions and remuneration of services with related parties are made in the ordinary course of business on an arms’ length basis under similar conditions, including interest rates, terms and guarantees, and involve no greater risk than transactions with unrelated parties carried out in the ordinary course and have no other disadvantages. The follow discussion describes all of our material related party transactions.
On December 17, 2013, we concluded the sale of our asset management business to an affiliate of Santander Spain, by way of disposal of all shares of DTVM. The sales price was R$2,243 million, generating a post-tax capital gain of R$1,205 million (after deducting costs). See “Item 4.—Information on the Company—A. History and Development of the Company—Important Events—Sale of the Investment Fund Management and Managed Portfolio Operations.”
In the second quarter of 2012 we, through our subsidiary in Spain, acquired from Banco Santander S.A.’s New York and London Branches a portfolio of contracts, including financing and export credit and import-related operations contracted with Brazilian clients or their affiliates abroad, totaling U.S.$119 million equivalent to R$181 million (using the exchange rate of the days when there were operations). Such operations were concluded, according to our policy for related-party transactions, including obtaining the approval of our board of directors.
Information Technology Platform
We enter into certain agreements with some affiliates of the Santander Group (
Ingeniería de Software Bancário S.L.
(Spain), ISBAN S.A. (Chile), Produban Servicios Informáticos Generales S.L. (Spain), ISBAN S.A. (Brazil) and Produban Serviços de Informática S.A. (Brazil)) for the outsourcing of certain products and services relating to our information technology platform, including software development, hosting and information processing. We believe the provisions of these services are provided on an arm’s-length basis with terms substantially similar to those available from other providers in the market. In each of 2013 and 2012, affiliates of the Santander Group received R$673 million and R$718 million, respectively, for the provision of such products and services. Additionally, these affiliates are responsible for managing all third party technology contracts. See “Item 4. Information on the Company—B. Business Overview—Technology and Infrastructure.”
Procurement Services
We have entered into agreements with Aquanima Brasil Ltda., an affiliate of the Santander Group, which offers procurement services (sourcing, e-procurement, outsourcing and consultancy) to Santander Brasil. Volume aggregation between Santander Brasil and other client companies allow for joint purchases for groups of different clients. The agreements entered into with Aquanima Brasil Ltda. were on an arm’s-length basis. We paid Aquanima Brasil Ltda. approximately R$23 million in 2013 and R$21 million yearly in 2012 and 2011.
Other Related Party Transactions
From time to time, we engage in lending and borrowing transactions to fund our operations and other miscellaneous transactions with various companies of the Santander Group, in compliance with restrictions on loans or advances imposed by Brazilian law. The following table shows the balances owed to us by such companies (assets) at each of December 31, 2013 and December 31, 2012 and the amounts owed by us to such companies (liabilities) at the same dates. The table also sets forth amounts received (income) or paid (expenses) to such companies for the year ended December 31, 2013 and December 31, 2012. All such transactions with Santander Group companies were conducted on an arm’s-length basis with terms substantially similar to those available from other providers in the market.
|
At December 31, 2013
|
At December 31, 2012
|
|||||||||||||||||||||||
|
Parent(1)
|
Joint-controlled companies
|
Other Related-Party(2)
|
Parent(1)
|
Joint-controlled companies
|
Other Related-Party(2)
|
|||||||||||||||||||
|
(in thousands of R$)
|
||||||||||||||||||||||||
|
Assets
|
||||||||||||||||||||||||
|
Trading derivatives, net
|
(74,519 | ) | — | (271,527 | ) | (135,291 | ) | — | (742,972 | ) | ||||||||||||||
|
Banco Santander S.A. – Spain
|
(74,519 | ) | — | — | (135,291 | ) | — | — | ||||||||||||||||
|
Santander Benelux, S.A., N.V.
|
— | — | (91,959 | ) | — | — | (399,110 | ) | ||||||||||||||||
|
Abbey National Treasury Services Plc
|
— | — | (61,885 | ) | — | — | (68,552 | ) | ||||||||||||||||
|
Real Fundo de Investimento Multimercado Santillana Crédito Privado
|
— | — | (117,683 | ) | — | — | (275,310 | ) | ||||||||||||||||
|
Loans and amounts due from credit institutions
–
Cash and overnight operations in foreign currency
|
11,935,149 | — | 39,329 | 9,615,489 | — | 318,423 | ||||||||||||||||||
|
Banco Santander S.A. – Spain(3(5)(6)
|
11,935,149 | — | — | 9,615,489 | — | — | ||||||||||||||||||
|
Banco Santander Totta, S.A.
|
— | — | 1,167 | — | — | 1,139 | ||||||||||||||||||
|
Abbey National Treasury Services Plc
|
— | — | 18,998 | — | — | — | ||||||||||||||||||
|
Santander Benelux, S.A., N.V.
|
— | — | 19,162 | — | — | 317,233 | ||||||||||||||||||
|
Banco Santander, S.A. – México
|
— | — | 2 | — | — | 51 | ||||||||||||||||||
|
Loans and other values with customers
|
— | — | 446,590 | — | — | 227,398 | ||||||||||||||||||
|
Zurich Santander Brasil Seguros S.A.
|
— | — | 43,865 | — | — | 75,445 | ||||||||||||||||||
|
Zurich Santander Brasil Seguros e Previdência S.A.
|
— | — | 402,725 | — | — | 151,953 | ||||||||||||||||||
|
Loans and amounts due from credit institutions(1)
|
9,007 | 1,105,765 | 3,053 | 7,284 | 1,087,129 | 34,024 | ||||||||||||||||||
|
Banco Santander S.A. – Spain
|
9,007 | — | — | 7,284 | — | — | ||||||||||||||||||
|
Companhia de Crédito, Financiamento e Investimento RCI Brasil
|
— | 1,105,425 | — | — | 1,086,756 | — | ||||||||||||||||||
|
Companhia de Arrendamento Mercantil RCI Brasil
|
— | 340 | — | — | 373 | — | ||||||||||||||||||
|
Abbey National Treasury Services Plc
|
— | — | — | — | — | 34,024 | ||||||||||||||||||
|
Santander Brasil Asset Management Distribuidora de Títulos e Valores Mobiliários S.A.
|
— | — | 3,053 | — | — | — | ||||||||||||||||||
|
Other Assets
|
100 | 933 | — | 159 | 772 | 62 | ||||||||||||||||||
|
Banco Santander S.A. – Spain
|
100 | — | — | 159 | — | — | ||||||||||||||||||
|
Companhia de Crédito, Financiamento e Investimento RCI Brasil
|
— | 933 | — | — | 772 | — | ||||||||||||||||||
|
Others
|
— | — | — | — | — | 62 | ||||||||||||||||||
|
Liabilities
|
||||||||||||||||||||||||
|
Deposits from credit institutions
|
(130,451 | ) | (31,738 | ) | (444,141 | ) | (154,635 | ) | (16,280 | ) | (244,702 | ) | ||||||||||||
|
At December 31, 2013
|
At December 31, 2012
|
|||||||||||||||||||||||
|
Parent(1)
|
Joint-controlled companies
|
Other Related-Party(2)
|
Parent(1)
|
Joint-controlled companies
|
Other Related-Party(2)
|
|||||||||||||||||||
|
(in thousands of R$)
|
||||||||||||||||||||||||
|
Banco Santander S.A. – Spain(4)
|
(130,451 | ) | — | — | (154,635 | ) | — | — | ||||||||||||||||
|
Santander Brasil Asset Management Distribuidora de Títulos e Valores Mobiliários S.A.
|
— | — | (170,914 | ) | — | — | — | |||||||||||||||||
|
Companhia de Crédito, Financiamento e Investimento RCI Brasil
|
— | (21,473 | ) | — | — | (12,762 | ) | — | ||||||||||||||||
|
Real Fundo de Investimento Multimercado Santillana Credito Privado
|
— | — | (258,548 | ) | — | — | (239,067 | ) | ||||||||||||||||
|
Banco Santander, S.A. – Uruguay
|
— | — | (13,986 | ) | — | — | (5,239 | ) | ||||||||||||||||
|
Companhia de Arrendamento Mercantil RCI Brasil
|
— | (10,265 | ) | — | — | (3,518 | ) | — | ||||||||||||||||
|
Others
|
— | — | (693 | ) | — | — | (396 | ) | ||||||||||||||||
|
Marketable debt securities
|
(20,413 | ) | — | — | (16,210 | ) | — | — | ||||||||||||||||
|
Banco Santander, S.A. – Spain (7)
|
(20,413 | ) | — | — | (16,210 | ) | — | — | ||||||||||||||||
|
Customer Deposits
|
— | (133,267 | ) | (273,531 | ) | — | — | (176,821 | ) | |||||||||||||||
|
ISBAN Brasil S.A
|
— | — | (101,391 | ) | — | — | (98,324 | ) | ||||||||||||||||
|
Produban Serviços de Informática S.A.
|
— | — | (48,110 | ) | — | — | (43,528 | ) | ||||||||||||||||
|
Zurich Santander Brasil Seguros e Previdência S.A.
|
— | — | (84,117 | ) | — | — | (29,190 | ) | ||||||||||||||||
|
Santander Brasil Gestão de Recursos Ltda.
|
— | — | (27,062 | ) | — | — | — | |||||||||||||||||
|
Webmotors S.A.
|
— | (133,267 | ) | — | — | — | — | |||||||||||||||||
|
Others
|
— | — | (12,851 | ) | — | — | (5,779 | ) | ||||||||||||||||
|
Other liabilities – Dividends and Bonuses Payable
|
(1,089,328 | ) | — | (5,735 | ) | (765,524 | ) | — | (562 | ) | ||||||||||||||
|
Grupo Empresarial Santander S.L.(1)
|
(410,283 | ) | — | — | (236,246 | ) | — | — | ||||||||||||||||
|
Santander Insurance Holding S.L.
|
— | — | (721 | ) | — | — | (562 | ) | ||||||||||||||||
|
Sterrebeeck B.V.(1)
|
(679,045 | ) | — | — | (529,278 | ) | — | — | ||||||||||||||||
|
Banco Madesant – Sociedade Unipessoal S.A.
|
— | — | (365 | ) | — | — | — | |||||||||||||||||
|
Santusa Holding, S.L.
|
— | — | (4,649 | ) | — | — | ||||||||||||||||||
|
Other payables
|
(2,678 | ) | — | (341 | ) | (3,544 | ) | — | (25,006 | ) | ||||||||||||||
|
Banco Santander S.A. – Spain
|
(2,678 | ) | — | — | (3,544 | ) | — | — | ||||||||||||||||
|
Isban Brasil S.A.
|
— | — | (103 | ) | — | — | — | |||||||||||||||||
|
Produban Serviços de Informática S.A.
|
— | — | (70 | ) | — | — | (55 | ) | ||||||||||||||||
|
Zurich Santander Brasil Seguros e Previdência S.A.
|
— | — | (35 | ) | — | — | (24,079 | ) | ||||||||||||||||
|
Santander Brasil Asset
|
— | — | (117 | ) | — | — | ||||||||||||||||||
|
Others
|
— | — | (16 | ) | — | — | (872 | ) | ||||||||||||||||
|
(*)
|
All loans and amounts to related parties were made in our ordinary course of business and on sustainable basis, including interest rates and collateral and did not involve more than the normal risk of collectability or present other unfavorable features.
|
|
(1)
|
Banco Santander (Brasil) S.A. is indirectly controlled by Santander – Spain (note 1-a), through its subsidiaries Grupo Empresarial Santander, S.L. and Sterrebeeck B.V.
|
|
(2)
|
Refers to the Company’s subsidiaries (Santander- Spain).
|
|
(3)
|
In December 31, 2013, refers to cash amounting to R$188 million (2012 – R$83 million and 2011 – R$228 millions).
|
|
(4)
|
In December 31, 2013, refers to raising funds through operations transfers abroad amounting to R$130 million, with maturity until October 2018 and interest between 0.56% and 14.03% p.a. (2012 – R$155 million, with maturity until January 2015 and interest between 0.39% and 5.82% p.a. and 2011 – R$1,200 million and interest between 0.39% and 5.82% p.a.).
|
|
(5)
|
In December 31, 2013, refers to investments in foreign currency (applications overnight): applications of Santander (Brasil) and our Grand Cayman Branch in Banco Santander S.A. – Spain (New York subsidiary), with maturity on January 2, 2014 and interest of 0.17% p.a., amounting to R$10,438,660 million (2012 – R$9,446 million with maturity on January 2, 2013, and interest of 0.17%p.a. and 0.10% p.a.).
|
|
(6)
|
On December 31, 2013, refers to investments in foreign currency (applications overnight) of Santander Brasil EFC in Santander Spain, amounting to R$1,186,856 million with maturity on January 2, 2014 and interest of 0.08 % and 0.14% p.a.
|
|
(7)
|
Refers to our and our Grand Cayman Branch Eurobonds emissions with maturity between March 18, 2014 and February 13, 2017 and interest of between 2.34% p.a. and 8.00% p.a.
|
|
At December 31, 2013
|
At December 31, 2012
|
|||||||||||||||||||||||
|
Parent(1)
|
Joint-controlled companies
|
Other Related–Party(2)
|
Parent(1)
|
Joint–controlled companies
|
Other Related–Party(2)
|
|||||||||||||||||||
|
(in thousands of R$)
|
||||||||||||||||||||||||
|
Income
|
||||||||||||||||||||||||
|
Interest and similar income—Loans and amounts due from credit institutions
|
15,303 | 64,373 | 220 | 10,393 | 59,546 | 487 | ||||||||||||||||||
|
Banco Santander, S.A. – Spain
|
15,303 | — | — | 10,393 | — | — | ||||||||||||||||||
|
Abbey National Treasury Services Plc
|
— | — | 25 | — | — | 35 | ||||||||||||||||||
|
Companhia de Crédito, Financiamento e Investimento RCI Brasil
|
— | 64,373 | — | — | 59,546 | — | ||||||||||||||||||
|
Santander Benelux, S.A., N.V.
|
— | — | 195 | — | — | 452 | ||||||||||||||||||
|
Interest expenses and similar charges—Deposits from customers
|
— | (7,119 | ) | (8,837 | ) | — | — | (9,732 | ) | |||||||||||||||
|
ISBAN Brasil S.A
|
— | — | (4,419 | ) | — | — | (5,697 | ) | ||||||||||||||||
|
Produban Serviços de Informática S.A.
|
— | — | (2,944 | ) | — | — | (3,000 | ) | ||||||||||||||||
|
Webmotors S.A
|
— | (7,119 | ) | — | — | — | — | |||||||||||||||||
|
Others
|
— | — | (1,474 | ) | — | — | (1,035 | ) | ||||||||||||||||
|
Interest expenses and similar charges—Deposits from credit institutions
|
(25,897 | ) | (3,227 | ) | (19,669 | ) | (38,515 | ) | (297 | ) | — | |||||||||||||
|
Banco Santander S.A. – Spain
|
(25,897 | ) | — | — | (38,515 | ) | — | — | ||||||||||||||||
|
Companhia de Crédito, Financiamento e Investimento RCI Brasil
|
— | (3,227 | ) | — | — | (297 | ) | — | ||||||||||||||||
|
Real Fundo de Investimento Multimercado Santillana Credito Privado
|
— | — | (19,669 | ) | — | — | (6,927 | ) | ||||||||||||||||
|
Interest expenses and similar charges
—
Securities
|
(786 | ) | — | — | (1,773 | ) | — | — | ||||||||||||||||
|
Banco Santander S.A. – Spain
|
(786 | ) | — | — | (1,773 | ) | — | — | ||||||||||||||||
|
Fee and commission income (expense)
|
(49,335 | ) | 26,265 | 142,543 | (34,253 | ) | 15,602 | 127,215 | ||||||||||||||||
|
Banco Santander S.A. – Spain
|
(49,335 | ) | — | — | (34,253 | ) | — | — | ||||||||||||||||
|
Companhia de Crédito, Financiamento e Investimento RCI Brasil
|
— | 13,925 | — | — | 11,016 | — | ||||||||||||||||||
|
Companhia de Arrendamento Mercantil RCI Brasil
|
— | 4,045 | — | — | 4,586 | — | ||||||||||||||||||
|
Webmotors S.A.
|
— | 8,295 | — | — | — | — | ||||||||||||||||||
|
Zurich Santander Brasil Seguros S.A.
|
— | — | 31,158 | — | — | 26,647 | ||||||||||||||||||
|
Zurich Santander Brasil Seguros e Previdência S.A.
|
— | — | 111,385 | — | — | 99,665 | ||||||||||||||||||
|
Others
|
— | — | — | — | — | 903 | ||||||||||||||||||
|
At December 31, 2013
|
At December 31, 2012
|
|||||||||||||||||||||||
|
Parent(1)
|
Joint-controlled companies
|
Other Related–Party(2)
|
Parent(1)
|
Joint–controlled companies
|
Other Related–Party(2)
|
|||||||||||||||||||
|
(in thousands of R$)
|
||||||||||||||||||||||||
|
Gains (losses) on financial assets and liabilities (net) and Exchange differences (net)
|
(231,543 | ) | 24,061 | 313,661 | (26,099 | ) | — | (407,267 | ) | |||||||||||||||
|
Banco Santander S.A. – Spain
|
(231,543 | ) | — | — | (26,099 | ) | — | — | ||||||||||||||||
|
Santander Benelux, S.A., N.V.
|
— | — | 319,708 | — | — | 81,575 | ||||||||||||||||||
|
Real Fundo de Investimento Multimercado Santillana Crédito Privado
|
— | — | (16,120 | ) | — | — | (472,744 | ) | ||||||||||||||||
|
Abbey National Beta Investments Limited
|
— | — | 4,015 | — | — | (40,701 | ) | |||||||||||||||||
|
Companhia de Crédito, Financiamento e Investimento RCI Brasil
|
— | 19,546 | — | — | — | — | ||||||||||||||||||
|
Webmotors S.A.
|
— | 4,515 | — | — | — | |||||||||||||||||||
|
Others
|
— | — | 6,058 | — | — | 24,603 | ||||||||||||||||||
|
Administrative expenses and amortization
|
(114 | ) | (436,182 | ) | (99 | ) | — | (428,062 | ) | |||||||||||||||
|
Banco Santander S.A. – Spain
|
(114 | ) | — | — | (99 | ) | — | — | ||||||||||||||||
|
ISBAN Brasil S.A.
|
— | — | (94,959 | ) | — | — | (90,283 | ) | ||||||||||||||||
|
Produban Serviços de Informática S.A.
|
— | — | (150,598 | ) | — | — | (139,516 | ) | ||||||||||||||||
|
ISBAN Chile S.A.
|
— | — | — | — | — | (3,799 | ) | |||||||||||||||||
|
Aquanima Brasil Ltda
|
— | — | — | — | — | — | ||||||||||||||||||
|
Ingeniería de Software Bancario, S.L.
|
— | — | (32,353 | ) | — | — | (41,442 | ) | ||||||||||||||||
|
Produban Servicios Informáticos Generales, S.L
|
— | (24,429 | ) | — | — | (24,707 | ) | |||||||||||||||||
|
TECBAN—Tecnologia Bancária S.A.
|
— | — | (112,227 | ) | — | — | (99,739 | ) | ||||||||||||||||
|
Konecta Brazil Outsourcing Ltda.
|
— | — | (14,402 | ) | — | — | — | |||||||||||||||||
|
Zurich Santander Brasil Seguros S.A.
|
— | — | — | — | — | (915 | ) | |||||||||||||||||
|
Others
|
— | — | (7,214 | ) | — | — | — | |||||||||||||||||
|
Others Administrative expenses—Donation
|
— | — | (20,168 | ) | — | — | (18,027 | ) | ||||||||||||||||
|
Santander Cultural
|
— | — | (1,789 | ) | — | — | (3,800 | ) | ||||||||||||||||
|
Fundacao Santander
|
— | — | (4,103 | ) | — | — | (3,000 | ) | ||||||||||||||||
|
Instituto Escola Brasil
|
— | — | (2,276 | ) | — | — | (1,227 | ) | ||||||||||||||||
|
Fundação Sudameris
|
— | — | (12,000 | ) | — | — | (10,000 | ) | ||||||||||||||||
|
Gains (losses) on non-current assets held for sale not classified as discontinued operations
|
— | — | 2,059,858 | — | — | — | ||||||||||||||||||
|
Capital Riesgo Global, SCR (Espanha) (3)
|
— | — | 47,161 | — | — | — | ||||||||||||||||||
|
Santander Brasil Gestão de Recursos Ltda(4)
|
— | — | 2,007,838 | — | — | — | ||||||||||||||||||
|
Santander Brasil Asset Management Distribuidora de Títulos e Valores Mobiliários S.A.
|
— | — | 4,859 | — | — | — | ||||||||||||||||||
|
(1)
|
Banco Santander (Brasil) S.A. is indirectly controlled by Santander – Spain, through its subsidiaries Grupo Empresarial Santander, S.L. and Sterrebeeck B.V.
|
|
(2)
|
Refers to subsidiaries of Santander Spain.
|
|
(3)
|
Refers to the gain on the sale of MS Participações S.A.
|
|
(4)
|
Refers to the gain on the sale of Santander Brasil Asset Management business.
|
|
7C
.
|
Interests of Experts and Counsel
|
Not applicable.
|
8A
.
|
Consolidated Statements and Other Financial Information
|
Consolidated Financial Statements
See “Item 18. Financial Statements,” which contains our audited consolidated financial statements prepared in accordance with IFRS.
Legal Proceedings
We are a party to lawsuits and administrative proceedings incidental to the normal course of our business. The main categories of lawsuits and administrative proceedings to which we are subject include:
|
|
·
|
administrative and judicial actions relating to taxes;
|
|
|
·
|
administrative and indemnification suits for damage related to consumer rights, in particular with respect to credit cards, checking accounts, collection and loan disputes;
|
|
|
·
|
suits involving dispute of contractual clauses of existing agreements and actions for review of contracts, including those which discuss breach of contracts and foreign currency indexation;
|
|
|
·
|
civil suits, including from depositors relating to the alleged effects of our implementation of various government economic plans (seeking differences for monetary adjustments on remuneration of several deposits, such as savings accounts, certificates of deposits and judicial deposits);
|
|
|
·
|
lawsuits relating to the privatization of Banespa;
|
|
|
·
|
class actions involving agreements and settlement of debts with the public sector; and
|
|
|
·
|
suits brought by employees, former employees, associations and unions relating to alleged labor rights violations.
|
In accordance with IAS 37 – Provisions, Contingent Liabilities and Contingent Assets, we record provisions for administrative and judicial proceedings in which we assess the chances of loss to be probable and we do not record provisions when the chances of loss are possible or remote. In cases where we litigate a claim, we record a provision for our estimate of the probable loss based on historical data for similar claims. In addition, we record provisions (1) on a case-by-case basis based on the analysis and legal opinion of internal and external counsel or (2) by considering the historical average amount of loss of such category of lawsuits. Due to the established provisions and the legal opinions provided, we believe that any liabilities related to these lawsuits or proceedings will not have a material adverse effect on our financial condition or results of operations.
As of December 31, 2013, our judicial and administrative proceedings classified as probable loss risk (tax, labor and civil) amounted to approximately R$7.8 billion and have been provisioned. Our judicial and administrative proceedings classified as possible loss risk (tax, labor and civil) amounted to approximately R$11.0 billion.
Tax Litigation
In December, 2013, the Bank and its affiliates joined a government amnesty program established by Law 12,865/13 (Articles 17 and 39).
The main lawsuit included in the program was on behalf of Banco ABN AMRO Real, succeeded by us, claiming the removal of the application of Law 9,718/98. The referred lawsuit covered debts of PIS and COFINS generated from September 2006 to April 2009, and had an unfavorable decision in Federal Court. The Bank and affiliates continue disputing the application of Law 9,718/98. Other administrative and judicial cases were also included in this program.
The accounting effects of those cases included in the program were registered at the time of joining the program. As a consequence, contingent tax liabilities were settled in the amount of R$2,053 million, through payment (R$1,389 million) and judicial deposits were converted into payments to the Brazilian Government (R$155 million). The gain was R$505, before taxes.
We are a party to several tax-related lawsuits and judicial and administrative proceedings. As of December 31, 2013, our probable loss risk for tax litigation amounted to approximately R$1.8 billion fully provisioned and our possible loss risk for tax litigation amounted to approximately R$10.3 billion.
The main lawsuits related to tax legal obligations fully registered as obligation are:
|
|
·
|
PIS/COFINS
. We filed lawsuits seeking to invalidate the provisions of Law 9,718/98, pursuant to which PIS and COFINS taxes must be levied on all revenues of legal entities. Prior to the enactment of such provisions, which have been overruled by recent Supreme Court decisions for non-financial institutions, PIS and COFINS were levied only on revenues from services and sale of goods. As of December 31, 2013 these claims amounted to R$8,593 million, which are fully provisioned.
|
|
|
·
|
Tax rate increase
. We filed for an injunction to avoid the increase in the CSLL tax rate established by Executive Act 413/2008, subsequently codified into Law 11,727/2008. Financial institutions were formerly subject to a CSLL tax rate of 9.0%; however, Law 11,727/2008 established a 15.0% CSLL tax rate as from April 2008. Judicial proceedings are pending judgment. As of December 31, 2013, the amount related to this injunction totaled R$1,217 million, which are fully provisioned.
|
The main judicial and administrative proceedings to which probable loss risk assessment relates are:
|
|
·
|
Equal tax treatment
. We filed a lawsuit challenging the application of an increased Social Contribution on Net Income (
Contribuição Social sobre o Lucro Líquido
) or “CSLL” rate of 18.0% for financial institutions, applicable until 1998, compared to the CSLL rate of 8.0% for non-financial institutions on the basis of the constitutional principle of equal tax treatment. As of December 31, 2013, the amount related to this claim totaled R$52 million, which are fully provisioned.
|
|
|
·
|
Tax on services for financial institutions
. Certain municipalities levy Service Tax (
Imposto Sobre Serviços
–
ISS
) on certain revenues derived from transactions not usually classified as the rendering of services. In such cases, we have argued in administrative and judicial proceedings against the payment of ISS. As of December 31, 2013, amounts related to these proceedings totaled R$545 million, which are fully provisioned.
|
|
|
·
|
Social security contribution
. We are involved in administrative and judicial proceedings regarding the collection of income tax on social security and education allowance contributions as we believe that these benefits do not constitute salary. As of December 31, 2013, amounts related to these proceedings totaled R$332 million, which are fully provisioned.
|
Contingent liabilities classified as possible risk of loss refer to judicial and administrative proceedings involving tax matters assessed by legal counsels as possible losses, which were not accounted for. The main lawsuits include:
|
|
·
|
Taxes on banking transactions
. In May 2003, the Brazilian Federal Revenue Service issued a tax assessment against Santander Distribuidora de Títulos e Valores Mobiliários Ltda. (“Santander DTVM”) and another tax assessment against our predecessor, Banco Santander Brasil S.A. The tax assessments refer to the collection of a CPMF tax on transactions conducted by Santander DTVM in the management of its customers’ funds and clearance services provided by our predecessor to Santander DTVM in 2000, 2001 and the first two months of 2002. We believe that the tax treatment was adequate. Santander DTVM succeeded in the first instance in its proceeding before the tax appeals board, while Banco Santander Brasil
|
|
|
|
S.A. was found liable for the tax assessment. Both decisions were appealed by the respective losing parties and the proceedings are pending final judgment of the respective appeals in a non-appealable proceeding before the Board of Tax Appeals (
Conselho Administrativo de Recursos Fiscais
) or “CARF.” As of December 31, 2013 amounts related to these claims are approximately R$604 million each.
|
|
|
·
|
Taxes on reimbursements arising from contractual guarantees
. The Brazilian Federal Revenue Service issued infraction notices against Santander Brasil with respect to the collection of IRPJ and CSLL taxes for tax years 2002 to 2006 on amounts reimbursed by the previous controlling shareholder as reimbursement obligations for payments made by us and our controlled entities as a result of contingent liabilities arising from the activities of the previous controlling shareholder. The Brazilian Federal Revenue Service deemed the amounts to be “taxable income” rather than reimbursements. In November 2011, a public hearing was held before CARF and a unanimous decision was handed down to cancel the tax assessments corresponding to the 2002 tax year. In February 2012 this decision was declared non-appealable, so there is no potential tax liability related to this claim for the 2002 tax year. In relation to the base period 2004, we had a new decision favorable in the CARF. This resolution can be appealed by the Brazilian tax administration. Proceedings related to tax years 2003 to 2006 are ongoing. As of December 31, 2013 amounts related to this infraction are approximately R$142 million.
|
|
|
·
|
Losses on loans. We have challenged the tax assessments issued by the Brazilian Federal Revenue Service claiming that our deduction of losses on loans from Income Tax of Legal Entities (
Imposto de Renda das Pessoas Jurídicas
–
IRPJ
) and CSLL bases have not met the relevant requirements under applicable law. As of December 31, 2013 the amount related to this challenge is approximately R$595 million.
|
|
|
·
|
Social Security Contribution
–
Profit Sharing Payments
(
Participação nos Lucros e Resultados
or “PLR”). We are involved in administrative and judicial proceedings arising from infraction notices with respect to the collection of social security contributions on profit sharing payments. The tax authorities claim that payments by us were not made in accordance with law. We have appealed against these charges, since we consider the tax treatment to be appropriate based on applicable law and the nature of the payments. As of December 31, 2013 amounts related to these proceedings totaled approximately R$1,056 million.
|
|
|
·
|
IRPJ and CSLL
–
Capital Gain
. The Brazilian Federal Revenue Service issued a tax assessment against Santander Seguros (legal successor of ABN AMRO Brasil Dois Participações S.A. (AAB Dois Par)) charging income tax and social contribution related to the 2005 tax year. The Brazilian Federal Revenue Service claims that the capital gain on the sale of Real Seguros S.A. and Real Vida e Previdência S.A. by AAB Dois Par should be paid at a 34.0% tax rate instead of 15.0%. The assessment was appealed at the administrative level based on our understanding that the tax treatment adopted in the transaction was in compliance with the current tax law and the capital gain was properly taxed. The administrative process is set for trial. We are responsible for any adverse outcome in this process as a former controller of Zurich Santander Brasil Seguros e Previdência S.A. As of December 31, 2013 the amount related to this proceeding is approximately R$233 million.
|
Labor Litigation
Similar to many other Brazilian banks, we are party to lawsuits brought by labor unions, associations or individual employees seeking, in general, compensation for overtime work, lost wages and other labor rights, including lawsuits relating to retiree complaints about pension benefits. We believe we have either paid or adequately provisioned for all such potential liabilities. In addition, we are defendants in labor lawsuits filed by third-party employees that rendered or render services to us through service providers. Brazilian courts understand that if a third-party service provider fails to pay its employee, the employee has the right to demand payment directly from the company to which it rendered its services. As of December 31, 2013, our probable loss risk of labor-related litigation amounted to R$1.9 billion, which amount has been provisioned and our possible loss risk of labor-related litigation amounted to R$0.1 billion.
Civil Litigation
We are a party to civil lawsuits claiming damages and other civil remedies. These disputes normally fall within one of the following categories typical for Brazilian banks: (1) actions requesting the review of contractual terms and conditions or seeking monetary adjustments, including the alleged effects of implementation of certain
economic government plans (as described below); (2) actions arising from loan agreements; (3) execution actions; and (4) actions seeking damages. As of December 31, 2013, our probable loss risk in connection with civil litigation liabilities amounted to R$1.6 billion, which has been provisioned in full and our possible loss risk in connection with civil litigation liabilities amounted to R$0.5 billion. For civil lawsuits considered to be common and similar in nature, the provisions are recorded based on statistical average previous payments, and on the legal counsel’s evaluation of success. Provisions for other lawsuits are determined individually on a case-by-case basis.
Economic plans
Like the rest of the banking system, Santander Brazil has been the subject of claims from customers, mostly depositors, and of class actions brought for a common reason, arising from a series of legislative changes relating to the calculation of inflation (“
planos economicos
”). The claimants considered that their vested rights had been impaired due to the immediate application of these adjustments. In April 2010, the High Court of Justice (“STJ”) set the limitation period for these class actions at five years, as claimed by the banks, rather than twenty years, as sought by the claimants, which will probably significantly reduce the number of actions brought and the amounts claimed in this connection. As regards the substance of the matter, the decisions issued to date have been adverse for the banks, although some proceedings have been brought at the STJ and the Supreme Federal Court (“STF”) with which the matter is expected to be definitively settled. In August 2010, STJ handed down a decision finding for the plaintiffs in terms of substance, but excluding one of the “
planos
” from the claim, thereby reducing the amount thereof, and once again confirming the five-year statute of limitations period. Shortly thereafter, the STF issued an injunctive relief order whereby the proceedings in progress in this connection were stayed until this court issues a final decision on the matter. In spite of the fact STF initiated judgment in November 2013, a formal ruling has not been handed down as of the date hereof we cannot predict as to when a formal ruling will be handed down by either the STJ or the STF.
Other Litigation
In addition to the matters described above, we are from time to time subject to certain claims and parties to certain legal proceedings incidental to the normal course of our business, including in connection with our lending activities, relationships with our employees and other commercial or tax matters. In view of the inherent difficulty of predicting the outcome of legal matters, particularly where the claimants seek very large or indeterminate damages, or where the cases present novel legal theories, involve a large number of parties or are in the early stages of discovery, we cannot state with confidence what the eventual outcome of these pending matters will be, what the timing of the ultimate resolution of these matters will be or what the eventual loss, fines or penalties related to each pending matter may be. We believe that we have made adequate provisions related to the costs anticipated to be incurred in connection with these various claims and legal proceedings and believe that liabilities related to such claims and proceedings should not have, in the aggregate, a material adverse effect on our business, financial condition, or results of operations. However, in light of the uncertainties involved in such claims and proceedings, there is no assurance that the ultimate resolution of these matters will not significantly exceed the provisions currently accrued by us; as a result, the outcome of a particular matter may be material to our operating results for a particular period, depending upon, among other factors, the size of the loss or liability imposed and our level of income for that period.
Contingent liabilities classified as remote risk of loss refer to judicial and administrative proceedings involving other matters assessed by legal counsels as remote losses, which were not provided for. The main lawsuits include:
Former employees of Banco do Estado de São Paulo S.A., Santander Banespa, Cia. de Arrendamiento Mercantil:
a claim was filed in 1998 by the association of retired Banespa employees (AFABESP) on behalf of its members, requesting the payment of a half-yearly bonus initially envisaged in the entity’s Bylaws in the event that the entity obtained a profit and that the distribution of this profit were approved by the board of directors. The bonus was not paid in 1994 and 1995 since the bank did not make a profit and partial payments were made from 1996 to 2000, as agreed by the board of directors, and the relevant clause was eliminated in 2001. The Regional Employment Court ordered the bank to pay this half-yearly bonus in September 2005 and the bank filed an appeal against the decision at the High Employment Court (“TST”) and, subsequently, at the STF. The TST confirmed the judgment against the bank, whereas the STF rejected the extraordinary appeal filed by the bank in a decision adopted by only one of the Court members, thereby also upholding the order issued to the bank. This decision was appealed by the bank and the association. Only the appeal lodged by the bank has been given leave to proceed and will be decided upon by the STF in plenary session.
In December 2008, the Brazilian Federal Revenue Service issued an infraction notice against us in the total amount of R$3.9 billion with respect to IRPJ and CSLL related to 2002 to 2004. The tax authorities assert that Santander Brasil did not meet the legal requirements for deducting amortization of the goodwill arising from the acquisition of Banespa. On October 21, 2011 an unanimous decision of CARF was handed down to cancel the tax assessments corresponding to tax years 2002 to 2004. The Brazilian Federal Revenue Service appealed to the Câmara Superior de Recursos Fiscais with respect to the merits but not due to the fine, and the 2002 tax year which was already being prescribed. The assessment was reduced to R$1.8 billion. In June 2010, the Brazilian Federal Revenue Service issued other infraction notices in the total amount of R$1.4 billion, based on the same concepts as the previous notice, with respect to IRPJ and CSSL related to 2005 to 2007. In these cases, the Bank was not granted a favorable decision, and it has been appealed on its merits, though there was a reduction in the fine of R$367 million, and the assessment was reduced to R$984 million. As of December 2013, the Brazilian Federal Revenue Service issued another infraction notice, in the total amount of R$344 million with respect to income tax and social contribution related to 2008. The Bank has already appealed. In accordance with the advice of our external legal counsel, we believe that the Brazilian Federal Revenue Service’s position is incorrect, and that the risk of loss is remote. Therefore we did not record any provision since this issue should not have an impact on our consolidated financial statements.
In addition to the above-mentioned proceedings, in June 2013, the Brazilian tax authorities issued an infraction notice against us as the responsible party liable for the tax on the capital gain allegedly obtained in Brazil by an entity not resident in Brazil, Sterrebeeck B.V., as a result of the “
incorporação de ações
” (a merger of shares) transaction carried out in August 2008. As a result of the aforementioned transaction, we acquired all the shares of Banco Real and AAB Dois Par through the delivery to these entities’ shareholders of shares newly issued by using a capital increase carried out for that purpose. The Brazilian tax authorities take the view that in the aforementioned transaction Sterrebeeck B.V. obtained income subject to tax in Brazil consisting of the difference between the issuance value of our shares that were received and the acquisition cost of the shares delivered in the exchange. The Santander Group filed an appeal against the infraction notice at the Federal Tax Office and considers, based on the advice of its external legal counsel, that the position taken by the Brazilian tax authorities is not correct, so there are solid defense arguments to appeal against the infraction notice and that, therefore, the risk of loss is remote. Consequently, the Santander Group has not recognized any provisions in connection with these proceedings because this matter should not affect the consolidated financial statements.
Cayman Islands Branch
We have a branch in the Cayman Islands with its own staff and representative officers. Banco Santander S.A. –Cayman Islands branch is licensed under The Banks and Trust Companies Law (2013 Revision), or the “Banks and Trust Companies Law,” as a Category “B” Bank and it is duly registered as a Foreign Company with the Registrar of Companies in Grand Cayman, Cayman Islands. The branch, therefore, is duly authorized to carry on banking business in the Cayman Islands. The branch was authorized by the local authorities to act as its own registered office and it is located at the Waterfront Centre Building, 28, North Church Street – 2nd floor, Grand Cayman, Cayman Islands, P.O. Box 10444 – KYI-1004, Phone: 1-345-769-4401 and Fax: 1-345-769-4601.
Our Cayman Islands branch is currently engaged in the business of sourcing funds in the international banking and capital markets to provide credit lines for us, which are then extended to our customers for working capital and trade-related financings. It also takes deposits in foreign currency from corporate and individual clients and extends credit to Brazilian and non-Brazilian clients, mainly to support trade transactions with Brazil. The results of the operations of the Cayman Islands branch are consolidated in our consolidated financial statements.
Dividend Policy
General Rules
We are required by Brazilian Corporate Law and our by-laws to hold an annual general shareholders’ meeting by no later than the fourth month after each fiscal year, at which time, among other things, the allocation of the results of operations in any year and the distribution of an annual dividend are reviewed. The payment of annual dividends is based on our consolidated audited financial statements prepared for the immediately preceding fiscal year.
Our by-laws provide that an amount equal to at least 25.0% of our adjusted net income, after deducting allocations to the legal and contingency reserves, should be available for distribution as dividend or interest attributable to shareholders’ equity in any given year. This amount represents the mandatory dividend.
Our board of directors may declare interim dividends or interest attributable to shareholders’ equity based on income verified in semi-annual consolidated financial statements. The board of directors may also declare dividends based on consolidated financial statements prepared for shorter periods, provided that the total dividends paid in each six-month period do not exceed the capital reserves amount required by Brazilian Corporate Law. The board of directors may also pay interim dividends or interest attributable to shareholders’ equity out of retained earnings or income reserves recorded in the last annual or semi-annual balance sheet. Any payment of interim dividends or interest on shareholders’ equity may be set off against the amount of mandatory dividends relating to the net income earned in the year in which the interim dividends were paid.
The amount distributed to shareholders as interest attributable to shareholders’ equity, net of any withholding tax, may be included as part of the minimum mandatory dividend. In accordance with applicable law, we are required to pay to shareholders an amount sufficient to ensure that the net amount they receive in respect of interest attributable to shareholders’ equity, after payment of the applicable withholding tax, plus the amount of declared dividends, is at least equivalent to the amount of the minimum mandatory dividend.
Brazilian Corporate Law allows, however, our shareholders to suspend dividends distribution if our board of directors reports to our annual shareholders’ meeting that the distribution would not be advisable given our financial condition. Our fiscal council, if in operation, should review any suspension of the mandatory dividend. In addition, our management should submit a report to the CVM setting out the reasons for the suspension. Net income not distributed by virtue of a suspension is allocated to a separate reserve and, if not absorbed by subsequent losses, is required to be distributed as dividend as soon as our financial condition permits such payment.
Dividend Policy
We currently recommend to our shareholders to distribute 50.0% of our yearly adjusted net income (as defined below) as dividends and/or interest attributable to shareholders’ equity. Our future dividend policy and the amount of future dividends and/or interest attributable to shareholders’ equity we decide to recommend to our shareholders for approval will depend on a number of factors, including, but not limited to, our cash flow, financial condition (including capital position), investment plans, prospects, legal requirements, economic climate and such other factors as we may deem relevant at the time.
Payment of Dividends
Any holder of record of shares at the time a dividend is declared is entitled to receive dividends. Under Brazilian Corporate Law, dividends are generally required to be paid within 60 days following the date on which the dividend is declared, unless the shareholders’ resolution establishes another payment date, which, in any event, must occur prior to the end of the fiscal year in which such dividend was declared. Based on Brazilian Corporate Law, unclaimed dividends do not bear interest, are not monetarily adjusted and may revert to us three years after dividends were declared. In this regard, on April 29, 2013 our shareholders approved in an extraordinary shareholders meeting the amendment of the term of payment of dividends and interest attributable to shareholders’ equity related specifically for the year of 2013, to not more than 180 days as from its declaration by our board of directors and in any circumstances within the year of 2013.
The depositary is the registered owner of the units underlying the ADSs on the records of the registrar. Such units are held in Brazil by us, acting as the custodian and agent for the depositary for our units and also as the registrar.
Payments of cash dividends and distributions, if any, are made in
reais
to the custodian on behalf of the depositary, which then converts such proceeds into U.S. dollars and causes such U.S. dollars to be delivered to the depositary for distribution to holders of ADSs. In the event that the custodian is unable to convert immediately the Brazilian currency received as dividends into U.S. dollars, the amount of U.S. dollars payable to holders of ADSs may be adversely affected by depreciation of the Brazilian currency.
The following tables set forth the amounts available for distribution as dividends based on the Brazilian GAAP calculation of net income. The reconciliation of net income under Brazilian GAAP to net income under IFRS is
presented in note 46 to our audited consolidated financial statements for the years ended December 31, 2013, 2012 and 2011.
|
For the year ended December 31,
|
||||||||||||
|
2013
|
2012
|
2011
|
||||||||||
|
(in millions of R$)
|
||||||||||||
|
Dividends
|
1,650 | 1,625 | 1,780 | |||||||||
|
Interest attributable to shareholders’ equity
|
1,020 | 1,550 | 1,760 | |||||||||
|
Total
|
2,670 | 3,175 | 3,540 | |||||||||
|
Dividends and interest on capital per 1,000 shares (
reais
)
|
||||||||||||
|
Common shares
|
6.39 | 7.61 | 8.48 | |||||||||
|
Preferred shares
|
7.03 | 8.37 | 9.32 | |||||||||
History of Payment of Dividends and Interest Attributable to Shareholders’ Equity
In 2013, we declared dividends and interest on shareholders’ equity in the gross amount of R$2,400 million, R$950 million of which was paid on August 29, 2013 and R$1,450 million of which was paid on February 26, 2014.
The table below shows the amounts paid to our shareholders in the periods indicated.
|
For the year ended December 31,
|
||||||||||||||||||||
|
2013
|
2012
|
2011
|
2010
|
2009
|
||||||||||||||||
|
(in millions of R$)
|
||||||||||||||||||||
|
Dividends
|
2,100 | 1,650 | 1,625 | 1,780 | 750 | |||||||||||||||
|
Interest attributable to shareholders’ equity
|
300 | 1,020 | 1,550 | 1,760 | 825 | |||||||||||||||
|
Total
|
2,400 | 2,670 | 3,175 | 3,540 | 1,575 | |||||||||||||||
|
Dividends and interest on capital per 1,000 shares (
reais
)
|
||||||||||||||||||||
|
Common shares
|
5.75 | 6.39 | 7.61 | 8.48 | 4.11 | |||||||||||||||
|
Preferred shares
|
6.32 | 7.03 | 8.37 | 9.32 | 4.52 | |||||||||||||||
|
8B
.
|
Significant Changes
|
In 2013 we implemented significant changes in our accounting polices related to the Amendments to IAS 19, Employee Benefits, that is obligatory for reporting periods beginning on or after January 1, 2013. These amendments eliminated the “Corridor” method under which entities were able to opt for deferred recognition of a given portion of actuarial gains and losses, establishing that all actuarial gains and losses must be recognized immediately in stockholders’ equity. The amendments included significant changes in the presentation of cost components, as a result of which the service cost relating to post-employment benefit obligations (past service cost and plan curtailments and settlements) and net interest cost must be recognized in profit or loss and the re-measurement component (comprising basically actuarial gains and losses) must be recognized in Equity—Other Comprehensive Income and may not be reclassified to profit or loss. In accordance with IAS 8, these amendments entail a change of accounting policy and, accordingly, they must be applied retrospectively from January 1, 2013, by adjusting the beginning balances of Equity for the earliest period presented as though the new accounting policy had always been applied.
|
9A
.
|
Offering and Listing Details
|
Market Price and Volume Information
On September 18, 2009, our board of directors approved the implementation of the global public offering (the “Global Offering”), which included the issue of 525,000,000 units (each representing one of 55 common shares and 50 preferred shares), all registered, without par value, free and clear of any liens or encumbrances, consisting of the simultaneous initial public offering of (i) units in Brazil on the over-the-counter market, in accordance with CVM Instruction 400/2003, and (ii) units abroad, including in the form of ADRs representing ADSs registered with the SEC under the Securities Act.
On October 6, 2009, the Global Offering of shares were priced at R$23.50 per unit and U.S.$13.40 per ADS. The units have been traded on the BM&FBOVESPA and the NYSE since October 7, 2009.
The following table shows our outstanding publicly traded common shares and preferred shares:
|
Free Float
|
BM&FBOVESPA
|
NYSE
|
||||||
|
Common shares
|
16,450,396,710 | 32,300,468,200 | ||||||
|
Preferred shares
|
14,954,906,100 | 29,364,062,000 | ||||||
|
Total
|
31,405,302,810 | 61,664,530,200 | ||||||
Units, Common and Preferred Shares traded on BM&FBOVESPA
The table below sets forth the high, low and last daily sales prices in
reais
for our shares on the BM&FBOVESPA for the periods indicated.
|
Reais
per share – SANB3 (Common Shares)
|
||||||||||||
|
High
|
Low
|
Last
|
||||||||||
|
2009 Annual
|
0.25 | 0.11 | 0.24 | |||||||||
|
2010 Annual
|
0.30 | 0.17 | 0.28 | |||||||||
|
2011 Annual
|
0.25 | 0.12 | 0.16 | |||||||||
|
2012 Annual
|
0.20 | 0.13 | 0.15 | |||||||||
|
1
st
Quarter
|
0.20 | 0.14 | 0.17 | |||||||||
|
2
nd
Quarter
|
0.17 | 0.14 | 0.14 | |||||||||
|
3
rd
Quarter
|
0.19 | 0.13 | 0.16 | |||||||||
|
4
th
Quarter
|
0.16 | 0.13 | 0.15 | |||||||||
|
2013 Annual
|
0.16 | 0.11 | 0.14 | |||||||||
|
1
st
Quarter
|
0.16 | 0.13 | 0.15 | |||||||||
|
2
nd
Quarter
|
0.16 | 0.12 | 0.12 | |||||||||
|
3
rd
Quarter
|
0.15 | 0.11 | 0.15 | |||||||||
|
4
th
Quarter
|
0.15 | 0.13 | 0.14 | |||||||||
|
LAST 6 MONTHS
|
||||||||||||
|
November 2013
|
0.15 | 0.13 | 0.15 | |||||||||
|
December 2013
|
0.15 | 0.13 | 0.14 | |||||||||
|
January 2014
|
0.14 | 0.10 | 0.11 | |||||||||
|
February 2014
|
0.12 | 0.10 | 0.11 | |||||||||
|
March 2014
|
0.12 | 0.10 | 0.12 | |||||||||
|
April 2014
(through April 28)
|
0.13 | 0.11 | 0.11 | |||||||||
|
Reais
per share – SANB4 (Preferred Shares)
|
||||||||||||
|
High
|
Low
|
Last
|
||||||||||
|
2009 Annual
|
0.26 | 0.12 | 0.22 | |||||||||
|
2010 Annual
|
0.22 | 0.16 | 0.21 | |||||||||
|
2011 Annual
|
0.19 | 0.12 | 0.14 | |||||||||
|
2012 Annual
|
0.18 | 0.13 | 0.13 | |||||||||
|
1
st
Quarter
|
0.18 | 0.13 | 0.16 | |||||||||
|
2
nd
Quarter
|
0.17 | 0.14 | 0.15 | |||||||||
|
3
rd
Quarter
|
0.16 | 0.13 | 0.14 | |||||||||
|
4
th
Quarter
|
0.15 | 0.13 | 0.13 | |||||||||
|
2013 Annual
|
0.16 | 0.11 | 0.14 | |||||||||
|
1
st
Quarter
|
0.16 | 0.13 | 0.14 | |||||||||
|
2
nd
Quarter
|
0.15 | 0.12 | 0.12 | |||||||||
|
3
rd
Quarter
|
0.15 | 0.11 | 0.15 | |||||||||
|
4
th
Quarter
|
0.15 | 0.13 | 0.14 | |||||||||
|
LAST 6 MONTHS
|
||||||||||||
|
November 2013
|
0.15 | 0.14 | 0.15 | |||||||||
|
December 2013
|
0.15 | 0.13 | 0.14 | |||||||||
|
January 2014
|
0.14 | 0.10 | 0.11 | |||||||||
|
February 2014
|
0.12 | 0.10 | 0.12 | |||||||||
|
March 2014
|
0.12 | 0.10 | 0.11 | |||||||||
|
April 2014
(through April 28
)
|
0.13 | 0.11 | 0.13 | |||||||||
|
BMF&BOVESPA
Units – SANB11
|
||||||||||||
|
High
|
Low
|
Last
|
||||||||||
|
R$ per share
|
||||||||||||
|
2009 Annual
|
n.a.
|
n.a.
|
n.a.
|
|||||||||
|
2010 Annual
|
26.05 | 17.93 | 24.85 | |||||||||
|
2011 Annual
|
22.95 | 12.51 | 14.96 | |||||||||
|
2012 Annual
|
19.70 | 13.59 | 14.97 | |||||||||
|
1
st
Quarter
|
19.70 | 14.96 | 16.80 | |||||||||
|
2
nd
Quarter
|
17.16 | 15.04 | 15.40 | |||||||||
|
3
rd
Quarter
|
17.32 | 13.60 | 14.82 | |||||||||
|
4
th
Quarter
|
15.48 | 13.59 | 14.97 | |||||||||
|
2013 Annual
|
16.07 | 12.64 | 13.98 | |||||||||
|
1
st
Quarter
|
16.07 | 13.97 | 14.61 | |||||||||
|
2
nd
Quarter
|
15.71 | 13.17 | 13.55 | |||||||||
|
3
rd
Quarter
|
16.01 | 12.64 | 14.94 | |||||||||
|
4
th
Quarter
|
15.74 | 13.65 | 13.98 | |||||||||
|
LAST 6 MONTHS
|
||||||||||||
|
November 2013
|
15.68 | 14.19 | 14.90 | |||||||||
|
December 2013
|
15.00 | 13.65 | 13.98 | |||||||||
|
January 2014
|
14.45 | 11.21 | 11.26 | |||||||||
|
February 2014
|
11.92 | 10.84 | 11.45 | |||||||||
|
March 2014
|
12.58 | 10.89 | 12.57 | |||||||||
|
April 2014
(through April 28
)
|
13.49 | 12.15 | 12.74 | |||||||||
ADSs traded on NYSE
Our ADSs have been listed and traded on the NYSE since October 7, 2009. Our Units abroad, including in the form of ADRs representing ADSs are registered with the SEC under the Securities Act and the Exchange Act.
The deposit agreement, pursuant to which ADRs have been issued is between us and JPMorgan Chase Bank National Association, as depositary, and the holders from time to time of ADRs.
Since certain of our shares and our ADSs are held by nominees, the number of record holders may not be representative of the number of beneficial owners.
|
NYSE
ADS – BSBR
|
||||||||||||
|
High
|
Low
|
Last
|
||||||||||
|
U.S.$ per share
|
||||||||||||
|
2009 Annual
|
14.28 | 12.59 | 13.05 | |||||||||
|
2010 Annual
|
15.66 | 9.82 | 13.60 | |||||||||
|
2011 Annual
|
13.98 | 6.73 | 8.14 | |||||||||
|
2012 Annual
|
11.30 | 6.56 | 7.28 | |||||||||
|
1
st
Quarter
|
11.30 | 8.05 | 9.17 | |||||||||
|
2
nd
Quarter
|
9.33 | 7.18 | 7.75 | |||||||||
|
3
rd
Quarter
|
8.50 | 6.70 | 7.37 | |||||||||
|
4
th
Quarter
|
7.68 | 6.56 | 7.28 | |||||||||
|
2013 Annual
|
8.08 | 5.71 | 5.97 | |||||||||
|
1
st
Quarter
|
8.08 | 7.30 | 7.30 | |||||||||
|
2
nd
Quarter
|
7.49 | 6.11 | 6.12 | |||||||||
|
3
rd
Quarter
|
6.70 | 5.71 | 6.70 | |||||||||
|
4
th
Quarter
|
7.17 | 5.88 | 5.97 | |||||||||
|
LAST 6 MONTHS
|
||||||||||||
|
November 2013
|
6.93 | 5.20 | 6.41 | |||||||||
|
December 2013
|
6.23 | 5.91 | 5.97 | |||||||||
|
January 2014
|
6.05 | 4.64 | 4.64 | |||||||||
|
February 2014
|
5.01 | 4.58 | 4.93 | |||||||||
|
March 2014
|
5.55 | 4.64 | 5.55 | |||||||||
|
April 2014
(through April 28
)
|
5.81 | 5.53 | 5.71 | |||||||||
|
9B
.
|
Plan of Distribution
|
Not applicable.
|
9C
.
|
Markets
|
Regulation of Brazilian Securities Markets
The Brazilian securities market is regulated by the CVM, as provided for by Law 6,385 of December 7, 1976, or the “Brazilian Securities Market Law,” and Brazilian Corporate Law, as well as the CMN and the Brazilian Central Bank.
The Brazilian Central Bank and the CVM are responsible for the regulation and supervision of brokerage firms. The Brazilian Central Bank also regulates foreign investment and exchange transactions, pursuant to the guidelines set forth by the CMN, as provided for by the Brazilian Securities Market Law and Law 4,595 of December 31, 1964. These laws and regulations provide for, among other things, disclosure requirements, criminal sanctions for insider trading and price manipulation, protection of minority shareholders, the procedures for licensing and supervising brokerage firms and the governance of Brazilian stock exchanges.
Under Brazilian Corporate Law, a company is either publicly held, a
companhia aberta
, or privately held and unlisted, a
companhia fechada
. All publicly-held companies must be registered with the CVM and are subject to reporting and other regulatory requirements. A company registered with the CVM may list its securities either on the Brazilian stock exchange market or on Brazilian over-the-counter markets. The shares of a listed company may also be traded privately.
The over-the-counter market is divided into two categories: (1) organized over-the-counter market, in which the transactions are supervised by self-regulating entities authorized by the CVM; and (2) non-organized over-the-counter market, in which the transactions are not supervised by self-regulating entities authorized by the CVM. In either case, the over-the-counter market consists of direct trades, outside of the stock exchange market, through a financial institution registered with the CVM which serves as an intermediary. No special application, other than registration with the CVM (and, in case of organized over-the-counter markets, registration with the applicable one), is necessary for securities of a public company to be traded in this market.
To be listed on the BM&FBOVESPA, a company must apply for registration with the CVM and BM&FBOVESPA.
Trading on the BM&FBOVESPA
In late 2008,
Bolsa de Valores de São Paulo
–
BVSP and Companhia Brasileira de Liquidação e Custódia
were merged into BM&FBOVESPA, which currently concentrates all trading activities of shares and commodities in Brazil, including settlement, clearing and depositary services.
Trading on the Brazilian stock exchange is conducted by authorized members. Trading sessions in the shares market take place every business day, from 10:00 a.m. to 5:00 p.m., on an electronic trading system called Megabolsa. Trading is also conducted between 5:30 p.m. and 6:00 p.m. in an after-market system connected to both traditional brokerage firms and brokerage firms operating on the Internet. This after-market trading is subject to regulatory limits on price volatility of securities traded by investors operating on the Internet.
The trading of securities on the BM&FBOVESPA may be suspended at the request of a company in anticipation of a material announcement. Trading may also be suspended on the initiative of the BM&FBOVESPA or the CVM, among other reasons, based on or due to a belief that a company has provided inadequate information regarding a significant event or has provided inadequate responses to inquiries by the CVM or the BM&FBOVESPA.
In addition, in order to maintain control over the fluctuation of the BM&FBOVESPA index, the BM&FBOVESPA has adopted a “circuit breaker” system pursuant to which trading sessions may be suspended for a period of 30 minutes or one hour whenever the BM&FBOVESPA index falls below 10.0% or 15.0%, respectively, in relation to the closing index levels of the previous trading session.
When investors trade shares on the BM&FBOVESPA, the trade is settled in three business days after the trade date, without adjustments to the purchase price. The seller is ordinarily required to deliver the shares to the exchange on the third business day following the trade date. Delivery of and payment for shares are made through the facilities of an independent clearing house, the BM&FBOVESPA, which handles the multilateral settlement of both financial obligations and transactions involving securities. According to the regulations of the BM&FBOVESPA, financial settlement is carried out through the system of transfer of funds of the Brazilian Central Bank and the transactions involving the sale and purchase of shares are settled through the BM&FBOVESPA custody system. All deliveries against final payment are irrevocable.
Corporate Governance Practices
In 2000, the BM&FBOVESPA introduced three special listing segments, known as Levels 1 and 2 of Corporate Governance and
Novo Mercado
, aimed at fostering a secondary market for securities issued by Brazilian companies listed on the BM&FBOVESPA and prompted such companies to follow good corporate governance practices. The listing segments are designed for the trading of shares issued by companies voluntarily undertaking to abide by corporate governance practices and disclosure requirements in addition to those already imposed by Brazilian law. The listing requirements were updated on May 10, 2011.
To become a Level 1 company, in addition to the obligations imposed by applicable law, the issuer must agree to: (i) ensure that shares of the issuer representing at least 25.0% of its total capital are effectively available for trading, (ii) adopt offering procedures that favor widespread ownership of shares whenever making a public offering, (iii) comply with minimum quarterly disclosure standards, (iv) follow stricter disclosure policies with respect to transactions made by controlling shareholders, members of its board of directors and its executive officers involving securities issued by the company, (v) submit any existing shareholders’ agreement and stock option plans to the BM&FBOVESPA, and (vi) disclose to shareholders a schedule of corporate events.
To become a Level 2 company, in addition to the obligations imposed by applicable law, an issuer must agree to: (i) comply with all of the listing requirements for Level 1 companies, (ii) grant tag-along rights for all shareholders in connection with a transfer of control of the company by offering for each share (common or preferred) the same price paid per share of the controlling block, (iii) grant voting rights to holders of preferred shares in connection with certain corporate restructurings and related-party transactions, such as (a) any merger, consolidation or spin-off of the company, (b) approval of transactions between the company and its controlling shareholder or parties related to the controlling shareholder, (c) approval of any valuation of assets to be delivered to
the company in payment for shares issued in a capital increase, (d) appointment of an expert to ascertain the fair value of the company in connection with any deregistration and delisting tender offer from Level 2 and (e) any changes to these voting rights, which will prevail as long as the adhesion contract to the Level 2 regulation with the BM&FBOVESPA is in effect, (iv) have a board of directors consisting of at least five members out of which a minimum of 20% of the directors must be independent and limit the term of all members to two years, (v) prepare financial statements (
Demonstrações Financeiras Padronizadas
) in English, (vi) if it elects to delist from the Level 2 segment, conduct a tender offer by the company’s controlling shareholder (the minimum price of the shares to be offered will be the economic value determined by an independent specialized firm with the appropriate experience), and (vii) adhere exclusively to the Market Arbitration Chamber for resolution of disputes between the company and its investors.
To be listed in the
Novo Mercado
, an issuer must meet all of the requirements for Level 1 and Level 2 companies and, in addition, the issuer’s capital stock must be represented exclusively by common shares.
We are committed to high standards of corporate governance and adhere to the practices required by the Level 2 listing segment of the BM&FBOVESPA.
In addition to that, within the BM&FBOVESPA we are part of two sustainability indexes: ISE and ICO2. The ISE
(Índice de Sustentabilidade Empresarial
– Entrepreneurial Sustainability Index) is a reference for socially responsible investments in Brazil. To be part of the portfolio composed by 40 companies, the company participates in a careful process to evaluate its performance in regards to sustainability, including economic efficiency, environmental balance, social practices and corporate governance.
The ICO2 (
Índice Carbono Eficiente
– Efficient Carbon Index) is a result of a partnership between BM&FBOVESPA and the National Economic and Social Development Bank (BNDES), and was created to prepare Brazil for a low carbon economy. Composed of stocks of companies participating in the IBrX-50, it takes into account the Greenhouse Gases (GHG) emissions released by the companies.
Investment in Our Units by Non-Residents of Brazil
Investors residing outside Brazil, including institutional investors, may either register their investments in securities in Brazil, as a foreign direct investment under Law 4,131/62 or as a portfolio investment under Resolution 2,689 of the CMN (or CMN Resolution 2,689), and CVM Instruction 325. Foreign investors, regardless of whether their investments are made as direct investments or portfolio investments, must be enrolled with the Brazilian Internal Revenue. This registration process is undertaken by the investor’s legal representative in Brazil.
With certain limited exceptions, CMN Resolution 2,689 allows investors to carry out any type of transaction in the Brazilian capital markets involving a security traded on a Brazilian stock or futures exchange or organized over-the-counter market, but investors may not transfer the ownership of investments made under CMN Resolution 2,689 to other non-Brazilian holders through private transactions. Investments and remittances outside Brazil of gains, dividends, profits or other payments under our units are made through the foreign exchange market.
For further information on the requirements for the registration of foreign portfolio investments under CMN Resolution 2,689, see “Item 10. Additional Information—D. Exchange Controls—Capital Markets Investment.”
In their turn, foreign direct investors under Law 4,131/62 may sell their shares in both private and open market transactions, but these investors are currently subject to less favorable tax treatment on gains. For more information on foreign direct investors, see “Item 10. Additional Information—D. Exchange Controls—Foreign Direct Investment.”
Resolution 1,927 of the CMN, which restated and amended Annex V to Resolution 1,289 of the CMN, provides for the issuance of depositary receipts in foreign markets in respect of shares of Brazilian issuers. We filed an application to have the ADSs approved under CMN Resolution 1,927 by the Brazilian Central Bank and the CVM, and we received final approval on October 1, 2009.
If a holder of ADSs decides to exchange ADSs for the underlying units, the holder will be entitled to (1) sell the units on the BM&FBOVESPA and rely on the depositary’s electronic registration for five business days from the date of exchange to obtain and remit U.S. dollars abroad upon the holder’s sale of our units, (2) convert its investment into a foreign portfolio investment under CMN Resolution 2,689/00 or (3) convert its investment into a
foreign direct investment under Law 4,131/62. See “Item 10. Additional Information—E. Taxation—Brazilian Tax Considerations” for a description of the tax consequences to an investor residing outside Brazil of investing in our units in Brazil.
If a holder of ADSs wishes to convert its investment into either a foreign portfolio investment under CMN Resolution 2,689/00 or a foreign direct investment under Law 4,131/62, it should begin the process of obtaining its own foreign investor registration with the Brazilian Central Bank or with the CVM, as the case may be, in advance of exchanging the ADSs for common shares.
The custodian is authorized to update the depositary’s electronic registration to reflect conversions of ADSs into foreign portfolio investments under CMN Resolution 2,689/00. If a holder of ADSs elects to convert its ADSs into a foreign direct investment under Law 4,131/62, the conversion will be effected by the Brazilian Central Bank after receipt of an electronic request from the custodian with details of the transaction. This may also involve the need to change the units into shares.
If a foreign direct investor under Law 4,131/62 wishes to deposit its units into the ADR program in exchange for ADSs, such holder will be required to present to the custodian evidence of payment of capital gains taxes. The conversion will be effected by the Brazilian Central Bank after receipt of an electronic request from the custodian with details of the transaction. This may also involve the need to change the units into shares.
The Brazilian constitution permits foreign individuals or companies to invest in the voting shares of Brazilian financial institutions only if they have specific authorization by the President of Brazil based on national interest or reciprocity. A presidential decree issued on November 13, 1997, in respect of Banco Meridional do Brasil S.A. (a predecessor entity) allows up to one hundred percent foreign participation in our capital stock. Foreign investors may acquire our units or ADSs as a result of this decree. In addition, foreign investors may acquire publicly traded non-voting shares of Brazilian financial institutions traded on a stock exchange or depositary receipts offered abroad representing non-voting shares without specific authorization. See “Item 4. Information on the Company—B. Business Overview—Regulatory Overview—Foreign Investment in Brazil—Foreign Investment in Brazilian Financial Institutions.”
|
9D
.
|
Selling Shareholders
|
Not applicable.
|
9E
.
|
Dilution
|
Not applicable.
|
9F
.
|
Expenses of the Issue
|
Not applicable.
|
10A
.
|
Share Capital
|
Not applicable.
|
10B
.
|
Bylaws
|
We describe below a summary of the important provisions of our bylaws and of the corporate and Brazilian capital markets legislation and regulations. This description is not intended to be exhaustive. It is based on our Bylaws (an English translation of which has been filed with the SEC) as well as on the legislation and regulations applicable to companies and the Brazilian capital market currently in effect.
Registration and Business Purpose
We are a publicly-held company, incorporated under Brazilian law. Our documents of incorporation are duly registered with the Commercial Registry of the State of São Paulo, (JUCESP) under NIRE No. 35300332067.
Pursuant to article 4 of our Bylaws, our corporate purpose is to (1) participate in asset, liability and accessory transactions related to our respective authorized portfolios (commercial, investment, credit, financing and investment, real estate credit and leasing), as well as foreign exchange transactions; (2) manage investment portfolios and any other transaction that would be allowed by law and regulations in force; and (3) participate, as shareholder or quotaholder, in other companies.
Managers’ Role and Conflict of Interests
Brazilian Corporate Law imposes on the members of the board of directors and officers the duty of diligence during the performance of their functions, as well as the duty of loyalty to the company besides prohibiting the member of the board of directors and the officers from: (1) receiving any type of direct or indirect personal advantage from third parties, by virtue of the position occupied, without authorization in the bylaws or from a shareholders’ meeting; (2) taking part in any corporate transaction in which he or she has an interest that conflicts with our interest or in the decisions made by other directors on the matter; (3) use any commercial opportunity which may come to his or her knowledge, by virtue of his or her position, for his or her own benefit or that of a third party, whether or not harmful to the company; (4) fail to exercise or protect the company’s rights or to take advantage of a commercial opportunity of interest to the company, in seeking to obtain advantages for himself or herself or for a third party; (5) acquire for resale with profit property or rights which he or she knows the company needs or which the company intends to acquire.
Additionally, since we are a financial institution, we are subject to certain prohibitions set forth in Law 4,595, dated as of December 31, 1964, including the prohibition to grant loans and advance amounts to the members of our board of directors and officers, as well as to the members of our other consulting, administrative, fiscal or similar boards and the respective spouses.
In addition to these provisions, Article 10 of our Bylaws provides that board members and officers are forbidden to be involved in the analysis, approval or settlement of business deals or loans relating to a company where they hold more than five percent (5%) of the capital stock as partners or shareholders, or where they are members of the management, or had been members within a period of up to six (6) months before their appointment. Finally, our policy for transactions with related parties also sets forth procedures to be followed by managers involved in such transactions, and when other potential conflicts of interest may arise.
Rights of Common Shares and Preferred Shares
Each common share gives its holder the right to a vote at general meetings. In their turn, the preferred shares do not grant voting rights in our shareholders’ general meetings, except as related to the following matters:
|
|
·
|
Change of corporate status, merger, consolidation or a spin-off;
|
|
|
·
|
Approval of agreements entered into between us and our controlling shareholder, directly or indirectly, and agreements with other companies in which our controlling shareholder has an interest, whenever the law or the Bylaws provide that they must be approved at a shareholders’ general meeting;
|
|
|
·
|
The appraisal of assets to be contributed to increase our capital stock;
|
|
|
·
|
Appointment of a specialized appraisal company to appraise our economic value in case of cancellation of our registration as a publicly-held company or the cancellation of our Level 2 status (except in the case we adhere to the
Novo Mercado
listing segment rules of BM&FBOVESPA, which imply adoption of additional corporate governance practices);
|
|
|
·
|
Amendment or revocation of applicable provisions of our Bylaws that alter or modify any of the requirements of Section 4.1 of the Level 2 Regulation; provided that such right shall only be effective as long as the Level 2 Regulation remains applicable to us.
|
|
·
|
As regards the election of members of the board of directors, the Brazilian Corporate Law sets forth that, when members of the board of directors are elected, minority holders of shares in public companies holding a minimum of 15% of the total number of voting shares, or holders of preferred shares without voting rights, or with restricted voting rights, representing 10% of the capital stock, or holders of common and preferred shares who jointly represent at least 10% of the capital stock, have the right to elect one member of our board of
|
|
|
directors, in a separate vote. Nevertheless, these rights can only be exercised by the holders of shares that maintained their holding for at least three months before the date of the annual shareholders’ meeting. The Brazilian Corporate Law also permits a multiple vote procedure to be adopted, upon request by shareholders representing at least 10% of our voting capital. According to CVM Instruction 282 of June 26, 1998, the percentage needed to call for a multiple vote to elect members of the board of directors, in public companies with capital stock exceeding R$100 million, is 5%.
|
The holders of preferred shares are entitled to the following rights according to our Bylaws:
|
|
·
|
Dividends and interest on shareholders own equity in an amount 10% higher than those attributed to common shares, as well as priority in the distribution;
|
|
|
·
|
Participation on equal terms with the common shares conditions, in capital increases arising from the capitalization of reserves and income, as well as in the distribution of bonus shares created by the capitalization of accrued income, reserves or any other resources;
|
|
|
·
|
Priority in reimbursement of capital, without payment of premium, in the case of liquidation; and
|
|
|
·
|
Tag-along rights, in the event of a change in our control, under the same terms and conditions extended to our controlling shareholders.
|
|
|
·
|
Common shares not belonging to the controlling shareholders also gives their holders tag-along rights in the event that our control is transferred on the same terms and conditions as those granted to our controlling shareholders.
|
The shareholders’ general meeting may decide on conversion of the preferred shares into common shares.
The Brazilian Corporate Law sets forth that shares without voting rights or shares with restricted rights, including our preferred shares, shall be granted unrestricted voting rights if the company ceases to distribute, during three consecutive fiscal years, any fixed or minimum dividend granted to these shares, until the respective distributions are made.
According to our Bylaws, the dividends that are not claimed by shareholders within three years, from the beginning of their payment, shall prescribe to our benefit.
Under the Brazilian Corporate Law, any change in the preferences or that have an adverse financial effect on the rights of the holders of our preferred shares, or any change that results in the creation of a more favored class of preferred shares, must be approved by a resolution at a general shareholders’ meeting, and will only become valid and effective after approval by a majority of our preferred shareholders in a shareholders’ meeting.
Brazilian Corporate Law also sets forth that the following shareholders’ rights cannot be repealed by our Bylaws or decisions made at shareholders’ meetings:
|
|
·
|
the right to vote at general meetings, in the case of holders of common shares;
|
|
|
·
|
the right to share in the distribution of dividends and interest on shareholders’ equity, and to share in the surplus assets in the event of our liquidation;
|
|
|
·
|
preemptive rights in subscribing for shares or convertible securities in specific circumstances;
|
|
|
·
|
the right to monitor the management; and
|
|
|
·
|
the right of withdrawal in the circumstances established by law, including our consolidation, merger, and spin-off.
|
Description of Units
The Units are share deposit certificates representing 55 common shares and 50 preferred shares, all of them free and unencumbered. The shares represented by the Units shall be registered in a trust account as linked to the Units,
and ownership can only be transferred by means of a transfer of the corresponding Units, on the written instructions of the holder. Earnings from the Units and the amount received in the case of redemption or repayment shall only be paid to the holder of the Units registered in our books, in its role as custodian.
Neither the shares underlying the Units, the earnings thereon or the corresponding redemption or repayment amounts may be pledged, encumbered or in any other way given in guarantee by the holder of the Units, nor may they be subject to pledge, confiscation, sequestration, search or apprehension, or to any other onus or encumbrance.
The Units are held by us, as the custody institution, in book-entry form in an account opened in the holder’s name and the transfer of ownership is effected by debiting the seller’s Unit account and crediting the buyer’s Unit account, according to a written transfer order issued by the seller or a court authorization or transfer order delivered to us. We will retain all the written transfer orders sent by the holders of the Units as well as the court authorizations or transfer orders. Dividends, interest on shareholders’ equity and/or cash bonuses shall be paid to us, and we then transfer the amount to the custody agents for payment to the Unit holders. The pledge, usufruct, right of succession, fiduciary transfer in guarantee and any other conditions, onus or encumbrances on the Units must be registered in the custodian’s records as well as noted in the corresponding statement of account of Units.
We shall provide Unit holders with a statement of account at the end of each month in which there is movement and, even if there is no movement, at least once a year. The statement shall show the date and place of issue, the name, and details of the holder of the Unit account, an indication that it is a statement of Unit account, details of the shares deposited, a statement that the shares deposited, their earnings and any amounts received in the event of redemption or repayment shall only be paid to the holder of the Unit account or to the holder’s order in writing, our charge for the deposit, if any, and the addresses where Unit holders may obtain assistance.
Upon a written order issued by the holder of the Unit account to an authorized broker for the stock exchange where the Units are traded, the custodian shall block the corresponding Units and transfer them to the buyer, on receipt of confirmation of the sale from the exchange.
The Unit holder shall have the right, at any time, to instruct a broker to cancel Units and transfer the underlying shares. The broker must request to us, as agent, to transfer the Units to the share deposit accounts held by the custodian in the holder’s name. The Unit holder shall bear any transfer and cancellation costs involved. Similarly, the holder may instruct a broker to assemble Units by transferring the number of shares representing a Unit, which shall be registered by the custodian in a trust account linked to the Units.
The right to cancel Units may be suspended in the event of a public distribution offer for Units, either in the domestic or the international market, but the suspension may not last longer than 180 days. Units subject to any onus or encumbrance may not be cancelled.
The following rules apply to the exercise of the rights granted to the shares represented by Units:
|
·
|
Dividends and share redemption or repayment amounts delivered to us as depository of the shares shall be paid by us to the Unit holder;
|
|
·
|
Only the Unit holder shall have the right to attend our general meetings and to exercise all the prerogatives conferred on our shareholders by the shares represented by the Units;
|
|
·
|
In the event of a stock split, cancellation, reverse stock split or new issues of shares by us while the Units are in existence, the following rules will be observed:
|
|
|
(1)
|
In the event there is a change in the number of shares represented by Units as a result of a reverse stock split or cancellation of shares, we will debit from the Unit accounts the number of cancelled shares of each Unit holder, and proceed with the automatic cancelation of Units, observing the ratio of 55 common shares to 50 preferred shares issued by us to each Unit. We will deliver to the shareholders those shares that are insufficient to constitute a Unit in the form of shares, rather than Units; and
|
|
|
(2)
|
In the event there is a change in the number of shares represented by the Units as a result of a reverse stock split or cancellation of shares, the custodian will register the deposit of the new shares and issue new Units, registering them in the accounts of their respective holders, so as to reflect the new number of shares held by unit holders, maintaining a ratio of 55 common shares to 50 preferred shares issued
|
|
|
|
by us and represented by Units and will deliver to holders those shares that are insufficient to constitute a Unit in the form of shares, rather than Units;
|
|
·
|
In the event of a capital increase by means of the issue of shares that may be converted into new Units, Unit holders may exercise the preemption rights belonging to the shares represented by their Units. We shall create new Units in the register of book-entry Units and credit them to their holders so as to reflect the new number of common and preferred shares issued by us, subject to current proportion of ordinary and preferred shares to constitute the Units. Shares that are too few to constitute a Unit shall be delivered to the shareholders as shares, rather than Units. There shall be no automatic credit of Units in the event of the exercise of preemption rights in the issue of securities other than shares; and
|
Unit holders will be entitled to receive any shares issued as a result of our spin-off, consolidation or merger.
General Meetings
At our duly convened and installed general meetings, our shareholders are authorized to resolve on business related to our activities and to take the decisions they deem to be in our interests.
Our shareholders are exclusively responsible for approving the financial statements at the annual general meeting, and to decide on the destination of net earnings and the distribution of dividends for the year immediately preceding the meeting. The members of the board of directors and fiscal council are, as a general rule, elected at annual general meetings, unless for an exceptional reason they have to be elected at an extraordinary general meeting.
An extraordinary general meeting may be held at any time, including together with an annual general meeting. Our shareholders in general meeting are exclusively responsible for approving, among other matters: (1) amendments to our Bylaws; (2) election and dismissal of members of our board of directors; (3) creation of any reserves of profits, other than the legal reserve; (4) cancellation of our listing on Level 2 of the São Paulo Stock Exchange (BM&FBOVESPA); (5) suspension of the rights of a shareholder that has failed to comply with obligations under the law or our Bylaws; (6) approval of our incorporation, merger or spin-off; (7) approval of our dissolution or liquidation, and approval of reports prepared by the liquidators as well as the election of a liquidator and members of the fiscal council to operate during a liquidation; and (8) election of an appraiser to determine our value in the event of cancellation of our registration as a publicly held company, or of our listing on the Level 2 segment.
Quorum of General Meetings
As a general rule, the Brazilian Corporate Law sets forth that a general meeting can be held if shareholders holding at least 25% of the voting capital stock are present, at the first call, and at the second call if any number of holders of voting shares are present. If the shareholders have been convened to resolve on amendments to the Bylaws, the quorum at the first call must be at least 2/3 of the voting shares and, at the second call, any number of holders of voting shares.
The CVM may authorize the abovementioned quorum, set forth in the Brazilian Corporate Law, to be reduced in the case of a publicly held company with widely held shares, and where the last 3 general meetings have been attended by shareholders representing less than half the voting shares.
In general, the approval of any matter must occur through votes of shareholders attending a general meeting in person, or through a proxy, corresponding at least to a majority of the common shares represented at the meeting, and abstentions are not taken into account for this calculation. Nevertheless, the affirmative vote of shareholders representing at least one half of the voting shares is needed for the approval of the following matters, among others: (1) reduction of the mandatory dividend to be distributed to our shareholders; (2) changes in our business purpose; (3) our merger, spin-off or incorporation; (4) our participation in a corporate group (as defined by the Brazilian Corporate Law); (5) the termination of a state of liquidation and (6) our dissolution.
Call Notice of our Shareholders’ General Meetings
The Brazilian Corporate Law requires all general meetings to be called by a minimum of three entries in the Official Gazette of the State of São Paulo, and in another mass circulation newspaper in São Paulo, where the
BM&FBOVESPA is located. Our call notices of meetings are currently published in the Official Gazette of the State of São Paulo, the official journal of São Paulo state, and in the
Valor Econômico
newspaper. The first call must be published not more than 15 days before the date of the meeting, and the second call not more than eight days in advance. However, in certain circumstances, at the request of any shareholder, the CVM may (1) after consulting us, require the shareholders’ meeting to be postponed and held 30 days after the first call; and/or (2) suspend for up to 15 days the advance notice required for an extraordinary general meeting, to give the shareholder time to understand and analyze the proposals to be voted on at the meeting. The call notices must give full details of the agenda for the meeting (the term “general matters” being prohibited) and the adequate supporting documents must be available to the public on the CVM’s website from the date of publication of the first call.
Place of our Shareholders’ General Meetings
Our shareholders’ meetings are held at our headquarters at Avenida Presidente Juscelino Kubitschek, 2041/2235, Bloco A, Vila Olímpia, in the city of São Paulo, state of São Paulo, Brazil. Brazilian Corporate Law allows our shareholders to hold meetings outside our headquarters in an event of
force majeure
, provided that the meetings are held in the city of São Paulo and the relevant notice contains a clear indication of the place where the meeting will be held.
Responsibility for Calling General Meetings
It is usually the responsibility of our board of directors to call a general meeting, which may also be called by the following persons or bodies: (1) any shareholder, when our directors fail to call a meeting within 60 days of the date required by law or by our by-laws; (2) shareholders representing a minimum of 5% of our capital stock, if our managers fail to call a meeting, within 8 days, in response to a justified request submitting matters to be discussed; (3) shareholders representing a minimum of 5% of our capital stock, if our managers fail to call a meeting intended to install a fiscal council, if our board of directors fail to call a meeting intended to install a fiscal council, within eight days of the request being made; and (4) the fiscal council, if our board of directors fails to call the annual general meeting; and the fiscal council can also call an extraordinary general meeting whenever there are serious or urgent reasons.
Conditions for Admission to a General Shareholders’ Meetings
Shareholders attending general meetings must prove that they are the holders of shares with voting rights, as set forth in the Brazilian Corporate Law. Our shareholders may be represented by a proxy (including a public proxy in accordance with CVM Instruction 481, of December 17, 2009), appointed not more than one year before the date of the meeting, and this representative must be a shareholder, a manager, a lawyer or, in the case of a publicly-held company, as ours is, a financial institution. Investment funds may be represented by their respective administrators.
Trading Policy for Our Securities
The objective of our Securities Trading Policy is: (i) to control and punish those persons with access to privileged information and who use this information to trade in securities issued by us; and (ii) to establish rules for trading in our securities, in accordance with CVM Instruction 358 of January 3, 2002, as amended (“
CVM Instruction 358
”) and with our internal rules.
The purpose of this policy is to avoid insider trading (the furnishing of privileged information from which third parties may benefit) and to ensure transparency in the trading of our securities. Our trading policy establishes blackout periods for trading in our shares by ourselves, our controlling shareholders (direct or indirect), members of the board and of our fiscal council (when one has been installed) and other technical or consultative bodies or other persons who, by virtue of their job, position or commercial, professional or trust relationship with us, have access to any privileged information. This is intended to avoid improper use of information not disclosed to us.
Among other matters, our policy establishes that the persons subject to it shall refrain from buying or selling, by themselves or via their direct dependents or by using directly or indirectly controlled companies, any securities issued by us, or backed by them, as well as their respective derivatives:
|
|
(1)
|
From the time when such persons become aware of material information that may affect the value of our securities, until such information is disclosed to the public. Those subject to the policy may trade in Company securities received or acquired under our variable compensation plans only during a
|
|
|
|
period of thirty (30) days from the date when such securities are vested, and after the end of the corresponding lock-up period, for the purpose of disposing of them, subject to the undertakings described in the following items;
|
|
|
(2)
|
During the period between our decision to increase capital stock, issue securities, distribute dividends, pay bonuses, or execute a stock split or a reverse stock split, and the publication of the corresponding notices or announcements;
|
|
|
(3)
|
When it is intended to carry out a takeover, a total or partial spin-off, transformation or corporate reorganization;
|
|
|
(4)
|
During the 30-day period prior to the publication of annual or six-monthly financial statements, or quarterly financial information (“ITR”). However, exceptionally in the case of issues of fixed-rate securities by us by means of a public offer overseas, in order to raise funds for us in the ordinary course of our business, including medium term notes issued by us, this period shall be reduced to fifteen (15) days before the publication of such statements.
|
Our policy also establishes that our controlling shareholders, officers, and members of our board of directors, members of our fiscal council (when there is an active one) and members of any other bodies with technical or consulting functions created by a provision in the Bylaws, shall not be trade securities issued by us or their respective derivatives on the same day that we, our controlled or associated companies or any other company under their common control are selling shares held in treasury or purchasing shares to be held in treasury, or while holding open orders to deal in our shares. However, such prohibition shall not apply if the acquisition or sale of our shares by us has the specific purpose of making feasible the management of risk arising out of our activities as
market maker of certain funds indexes
.
Right to Withdrawal
The Brazilian Corporate Law gives our shareholders the right to withdraw from the Bank, upon reimbursement of the equity value of their shares, if the shareholder disagrees or abstained to vote certain resolutions approved in shareholders’ general meetings.
According to the Brazilian Corporate Law, the right of withdrawal may be exercised in the following circumstances, among others provided by law: (1) a change in the preferences, privileges or repayment or redemption conditions granted to our preferred shares, or the creation of a new, more favored class of shares (in which case, only a shareholder who is adversely affected by such change or creation shall have the right of withdrawal); (2) spin-off (subject to the conditions below); (3) a reduction in our mandatory dividend; (4) a change in our corporate purpose; (5) a merger or incorporation with another company in specific circumstances (as described below); (6) our joining a group of companies, as defined in the Brazilian Corporate Law; (7) a corporate transformation; (8) the takeover of all our shares by another Brazilian company, so as to make us its wholly-owned subsidiary; or (9) the acquisition of control of another company at a price exceeding the legal limits.
The Brazilian Corporate Law also provides that a spin-off of a company shall entitle its shareholders to withdraw only if it results in: (1) a change in the corporate purpose, unless the assets spun off are transferred to a company whose principal activity coincides with the business purpose of spun-off company; (2) a reduction in the mandatory dividend; or (3) becoming part of a group of companies, as defined in the Brazilian Corporate Law. Besides, our shareholders shall not have the right of withdrawal in the event of a consolidation or merger of us into another company, or when we become part of a group of companies (as defined in the Brazilian Corporate Law), our shareholders will not be entitled to withdraw from our company if their shares and the shares of such companies (a) are liquid, i.e. are listed on the BM&FBOVESPA general index or on any other Stock Exchange index, as defined by the CVM, and (b) are widely held, such that our controlling shareholders or other companies under common control hold less than half the shares of the type or class to which the right of withdrawal corresponds. The right of withdrawal must be exercised within 30 days of publication of the minutes of the general meeting resolving on the matter that gave rise to such right. Furthermore, we have the right to reconsider any resolution that has given rise to a right of withdrawal, during the 10 days following the end of the period for exercising the right, if we consider that the payment of the price for buying out dissident shareholders would put our financial stability at risk.
Shareholders who exercise the right to withdrawal shall receive the equity value of their shares, based on the latest balance sheet approved at a general meeting. If, however, the resolution giving rise to the right of withdrawal
was passed more than 60 days after the date of the latest approved balance sheet, a shareholder may call for a special balance sheet to be prepared as of a date not more than 60 days before the resolution, to assess the value of the shares. In this case, we must immediately pay 80% of the reimbursement value, calculated according to the latest balance sheet approved by our shareholders, and the balance within 120 days of the date of the resolution of the general meeting.
Redemption of Shares
According to the Brazilian Corporate Law, we may redeem our shares by means of a resolution passed at a general meeting by votes representing at least 50.0% of the shares affected by the redemption. Shares may redeemed out of retained profits, revenues reserves or capital reserves. If not all the shares are to be redeemed, lottery ballot shall be held. If custody shares are selected in the ballot and the custody agreement does not provide for the situation, the financial institution must specify the proportion of shares to be redeemed.
Preemption Rights
Our shareholders have preemptive rights to subscribe for shares in any capital increase, in proportion to their shareholding at the time of the increase. Our shareholders also have preemptive rights in any offer of our shares or subscription warrants. A period of not less than 30 days from the publication of the notice to shareholders of the capital increase is allowed for the exercise of preemptive rights, and these rights are transferable.
However, according to the Brazilian Corporate Law and our Bylaws, our shareholders do not have preemptive rights in cases of granting or exercise of any share call option. In addition, our board of directors may exclude the preemptive right of our shareholders or reduce the exercise period, in the issuance of shares and subscription warrants, whose placement is made through sale on stock exchange or public subscription, or share exchange, in a public offering of control acquisition.
Purchase of our own Shares
Our Bylaws authorize our Board of Directors to approve the purchase of our own shares. The decision to acquire our shares and to hold them in treasury, or to cancel them, is subject to the following restrictions, among others. It may not: (1) result in a reduction of our capital stock; (2) require the use of funds exceeding the balance of retained or available profits, other than the legal reserve (as defined in the applicable regulations), as shown in the latest balance sheet; (3) give rise, directly or indirectly, by action or omission, to an artificial situation of demand, supply or pricing of the shares, or involve any practice that is not equitable; (4) apply to shares that have not been paid up, or to those belonging to our controlling shareholders; or (5) take place simultaneously with a public offer for the purchase of our shares. We may not hold in treasury more than 10% of our shares outstanding, excluding the shares belonging to our controlling shareholders and including shares held by our subsidiaries.
On July 29, 2013, our board of directors approved the renewal of a Unit repurchase program to cover the acquisition of up to 76,008,403 Units, representing 4,180,462,165 common shares and 3,800,420,150 preferred shares or ADRs which, by us or our branch in Cayman and/or by certain entities which are part of our conglomerate in Brazil, corresponding, as of June 30, 2013, to approximately 2% of the totality of our corporate capital. The repurchase program ends on August 24, 2014.
We may purchase our shares on the stock exchange, but not by means of private transactions or for a price above the market value, unless approved in advance by the CVM (and except in the case of the exercise of options previously granted to our management). We may also buy our own shares in the event that we should cease to be a publicly-held company. We may also purchase or issue put or call options on our shares.
Cancellation of Registration as a Publicly-Held Company
We may cancel our registration as a publicly-held company, and, for this purpose our controlling shareholders must necessarily make a public offer to acquire all our shares in the market, according to the Brazilian Corporate Law and the regulations issued by the CVM. The minimum offer price must be at least equal to the economic value of our shares, as valued by a specialized company using any generally accepted and recognized valuation method, or any other criteria defined by the CVM.
The valuation report must be prepared by a specialized and experienced appraiser, who is independent of the Bank, our management team and our controlling shareholders. The appraiser shall be chosen by a vote of the majority of those attending a general meeting, with each common or preferred share having the right to one vote. The proposer shall bear the costs of preparing the valuation report. The general meeting held for this purpose must be attended by shareholders representing at least 20% of the total number of shares outstanding. If this quorum is not met, subsequent shareholder meetings may be called and held without the need for a specific minimum quorum.
Discontinuation of Differentiated Corporate Governance Level 2 Practices
We may at any time cease to exercise the differentiated corporate governance Level 2 practices, provided that a resolution to this effect is approved in general meeting by shareholders representing the majority of our shares, and provided that BM&FBOVESPA is informed in writing at least 30 days in advance. Discontinuation of the Level 2 practices will not imply the loss of our BM&FBOVESPA listing.
According to our Bylaws, if our shareholders in general meeting resolve: (1) to discontinue the differentiated corporate governance Level 2 practices, so that our shares are listed for trading outside Level 2, or (2) to undertake a corporate reorganization such that the resulting company is not admitted to Level 2, then our controlling shareholders must make a public offer to acquire the shares of our remaining shareholders, at a minimum price corresponding to the economic value according to a valuation report prepared as indicated in the part of this Section headed “Cancellation of Registration as a Publicly-Held Company” above. Notice of the issue of the public offer must be given to BM&FBOVESPA and disclosed to the market immediately after the general meeting of shareholders has approved the discontinuation of the listing or the corporate reorganization.
The controlling shareholders shall not be required to make this public offer if the discontinuation of differentiated corporate governance Level 2 practices is the result of the signing of any agreement for us to be listed on the special segment of BM&FBOVESPA called
Novo Mercado
, or if the company resulting from the corporate reorganization operation is listed on this segment.
Disposal of Control
Our Bylaws state that disposal of control of our company, either in a single transaction or in a series of transactions, must be subject to the condition, whether suspensive or resolutory, that the acquirer undertakes to make a public offer to acquire all the shares held by our other shareholders, both common and preferred, pursuant to the conditions and deadlines required by the current legislation and the Level 2 Regulations, so as to ensure that they receive equal treatment to the controlling shareholder in the disposal. A declaration must be submitted to BM&FBOVESPA with the price and other conditions of the transaction disposing of control.
This offer will still be required (1) in cases where there is assignment for consideration of rights to subscribe for shares that may result in the disposal of the company’s control; and (2) in case of disposal of control of a company that holds the control power over us, and, in that event, the selling controlling shareholder shall be required to declare to BM&FBOVESPA the amount attributed to us in such disposal and attach documentation that evidences such amount.
Pursuant to the terms of our Bylaws, the transfer of shares by the controlling shareholder disposing of control shall occur upon the subscription by the acquirer of the Controlling Shareholders’ Agreement, which must be submitted to BM&FBOVESPA immediately.
Requirement for Disclosure of Information
As a publicly-held company and a company listed on the Level 2 segment of BM&FBOVESPA, we must comply with the requirements for disclosure of information set forth by the Brazilian Corporate Law, the CVM and the BM&FBOVESPA Level 2 Regulation.
Periodic and Occasional Disclosure of Information
The regulation applicable to publicly-held companies issued by the CVM, including CVM Instruction 358, as well as the BM&FBOVESPA Level 2 Regulation provide that we must disclose a number of periodic and occasional information. Among such information are, for example, our financial statements accompanied by the management reports and the reports of our independent auditors, our standard financial information form (
formulário de
informações financeiras padronizadas
– DFP), our quarterly report (
formulário de informações trimestrais
– ITR) and our reference form (
formulário de referência
).
According to CVM Instruction 480 of December 7, 2009, the reference form (
formulário de referência
) must be filed with the CVM annually, within 5 months of the closing date of the reporting period, in the form established by the regulation. The reference form (
formulário de referência
) shall be updated prior to a public offer, as well as upon the occurrence of certain events determined by the regulation that alter the information described therein, within 7 business days of the date of the respective change. This document contains complete information regarding us including, in general, the matters addressed in this annual report.
CVM Instruction 457 of July 13, 2007, as amended (“CVM Instruction 457”) provides that we are also subject to the disclosure of our consolidated financial statements based on the International Financial Reporting Standards, or IFRS, within 4 months of the end of each reporting period. The financial statements mentioned by CVM Instruction 457 must be disclosed in their entirety, together with (1) the management report, (2) explanatory note expressly stating without reservation that the consolidated financial statements are in accordance with IFRS and Brazilian GAAP, and (3) the opinion of the independent auditors. Within up to 15 days following the term established by Brazilian law for disclosure of our quarterly information, we must: (1) disclose our full quarterly information translated into the English language; or (2) disclose our financial statements or consolidated financial statements in accordance with IFRS, accompanied by the independent auditors’ review report.
The BM&FBOVESPA Level 2 Regulation establishes that we must publish our financial statements and consolidated financial statements at the end of each quarter (except for the last quarter of each year) and at the end of each year, jointly with the quarterly report (
formulário de informações trimestrais
) and the reference form (
formulário de referência
) in English, together with the management report or remarks about our performance, and the opinion or special review report of the independent auditors, as provided for in the local legislation. According to the BM&FBOVESPA Level 2 Regulation, the notes to the quarterly financial statements must include information on transactions with related parties and contain the disclosures required by the accounting rules applicable to the annual financial statements.
Disclosure of Information about Trading by Our Managers and Related Persons
Our officers, members of our board of directors, fiscal council, if in operation, and of any technical or consulting body created by our Bylaws must disclose to us the securities issued by us, our controlling or controlled companies, when publicly-held, and the derivatives as well as other securities referenced by such securities that are held by them, as well as the trades with such securities. This obligation includes the securities held by the spouses, companions and any dependents of the abovementioned persons, as well as the companies directly or indirectly controlled by them. We are obliged to send such information to CVM and BM&FBOVESPA within ten days following the end of the month in which there is a change in the holding position or the month in which the relevant person is invested in the position (including name of person acquiring the shares, number and characteristics of the securities, form, price and date of acquisition).
Disclosure of Information about our Shareholders with Relevant Interest
CVM Instruction No. 358 sets forth that (a) any direct or indirect controlling shareholders, (b) any shareholders entitled to elect members of board of directors and fiscal council, as well as (c) any person or group of persons acting jointly or representing the same interest, when reaching a direct or indirect holding corresponding to 5% or more of the same type or class of shares of our corporate capital must disclose to us the following information: (1) name and qualification of the person acquiring the shares; (2) reason for the participation and aimed quantity of shares, containing, if it were the case, a declaration by the acquiring party that it does not intend to alter the composition of its control or the structure of the company’s administration; (3) number of shares, subscription warrants, rights of subscription of shares and call options, by class and type, then directly or indirectly held by the acquirer or any related person; (4) number of debentures convertible into shares then directly or indirectly held by the acquirer or any related person, specifying the number of shares subject to potential conversion, by class and type; and (5) indication of any agreement ruling the exercise of voting rights or the purchase and sale of our securities.
Also, the persons mentioned in the previous paragraph must always inform us when their respective interests increase 5%, are reduced reaching 5% or decrease 5%.
Our investor relations officer is responsible for sending this information to CVM and to BM&FBOVESPA as soon as received.
Disclosure of Material Facts
Law 6,385 of December 7, 1976, as amended, and CVM Instruction 358 set forth that we must disclose any decision of our controlling shareholder, of a general shareholders’ meeting or of any of our management bodies, or any other act or event in connection with our business that could influence: (1) the trading price of our securities or securities referenced to our securities; (2) the decision by investors to buy, sell or keep those securities; (3) the decision by investors to exercise any rights they have as holders of those securities.
Examples of material facts are: the signing of shareholders’ agreements, the transfer of control of the company, a consolidation, merger or spin-off involving the company or associated companies, the change in rights and advantages of the securities issued by the company, the split or reverse split of shares, among others.
Our investor relations officer is responsible for the disclosure of any material facts to the market.
The applicable regulation authorizes us, on an exceptional basis, to request confidential treatment of certain material developments from the CVM, when our management believes that disclosure of the respective fact to the public could result in adverse consequences to us.
|
10C
.
|
Material Contracts
|
For the two years immediately preceding the publication of this annual report, we were not a party to any material contract outside the ordinary course of business.
|
10D
.
|
Exchange Controls
|
Foreign Investment in Brazil
Foreign Direct Investment
Foreign Direct Investment in Brazil is regulated by Law 4,131 and Law 4,390 enacted on September 3, 1962 and August 29, 1964, respectively, as amended. A foreign direct investor under Law 4,131/62 must:
|
|
·
|
register as a foreign direct investor with the Brazilian Central Bank;
|
|
|
·
|
obtain a taxpayer identification number from the Brazilian tax authorities;
|
|
|
·
|
appoint a tax representative in Brazil; and
|
|
|
·
|
appoint a representative in Brazil for service of process in respect of suits based on the Brazilian Corporate Law.
|
Foreign capital must be registered with the Brazilian Central Bank through the Electronic Registration System – Foreign Direct Investment (the
Registro Declaratório Eletrônico – Investimento Externo Direto
) within 30 days of the flow of funds into Brazil in accordance with Law 4,131. The registration of foreign capital is required for the remittance of profits abroad, the repatriation of capital and the registration of reinvestments. Investments will always be registered in the foreign currency in which they are actually made, or in Brazilian currency, if the funds are derived from a non-resident account properly held in Brazil.
On December 28, 2006, Law 11,371 allowed the registration of the foreign capital invested in Brazilian companies not yet duly registered and not subject to other types of registration. For the purposes of such registration the amount of foreign capital in
reais
to be registered must be evidenced in the accounting records of the relevant Brazilian company and be registered prior to the last business day of the subsequent calendar year during which the company becomes obligated to register the capital.
Other than such registration, foreign investment is not subject to government approvals or authorizations, and there are no requirements regarding minimum investment or local participation in capital (except in very limited
cases such as in financial institutions, insurance companies and other entities subject to specific regulations). Foreign participation, however, is limited (that is, subject to approvals) or forbidden in several sectors.
Foreign investments in currency must be officially channeled through financial institutions duly authorized to deal in foreign exchange. Foreign currency must be converted into Brazilian currency and vice versa through the execution of an exchange contract. Foreign investments may also be made through the contribution of assets and equipment intended for the local production of goods and services.
Capital Markets Investment
Investors residing outside Brazil, including institutional investors, are authorized to purchase securities in Brazil on the Brazilian stock exchange, provided that they comply with the registration requirements set forth in Resolution CMN 2,689 and CVM Instruction 325.
With certain limited exceptions, under CMN Resolution 2,689 investors are permitted to carry out any type of transaction in the Brazilian capital markets involving a security traded on a stock or futures exchange or organized over-the-counter market, but may not transfer the ownership of investments made under CMN Resolution 2,689 to other non-Brazilian holders through private transactions. Investments and remittances outside Brazil of gains, dividends, profits or other payments under Santander Brasil’s shares are made through the commercial rate exchange market.
Under CMN Resolution 2,689, an investor residing outside Brazil must:
|
|
·
|
appoint at least one representative in Brazil that will be responsible for complying with registration and reporting requirements and reporting procedures with the Brazilian Central Bank and the CVM. If the representative is an individual or a non-financial company, the investor must also appoint an institution duly authorized by the Brazilian Central Bank that will be jointly and severally liable for the representative’s obligations;
|
|
|
·
|
complete the appropriate foreign investor registration form;
|
|
|
·
|
register as a foreign investor with the CVM;
|
|
|
·
|
register the foreign investment with the Brazilian Central Bank;
|
|
|
·
|
appoint a tax representative in Brazil; and
|
|
|
·
|
obtain a taxpayer identification number from the Brazilian federal tax authorities.
|
Securities and other financial assets held by foreign investors pursuant to CMN Resolution 2,689 must be registered or maintained in deposit accounts or under the custody of an entity duly licensed by the Brazilian Central Bank or the CVM. In addition, securities trading by foreign investors is generally restricted to transactions involving securities listed on the Brazilian stock exchanges or traded in organized over-the-counter markets licensed by the CVM.
10E
. Taxation
The following summary contains a description of certain Brazilian and U.S. federal income tax consequences of the ownership and disposition of units or ADSs, but it does not purport to be a comprehensive description of all the tax considerations that may be relevant to the ownership or disposition of units or ADSs. The summary is based on the tax laws of Brazil and regulations thereunder and on the tax laws of the United States and regulations thereunder as of the date hereof, which are subject to change.
Although there is at present no income tax treaty between Brazil and the United States, the tax authorities of the two countries have had discussions that may culminate in a treaty. No assurance can be given, however, as to whether or when a treaty will enter into force or how it will affect the U.S. Holders (as defined below) of units or ADSs. Prospective holders of units or ADSs should consult their tax advisors as to the tax consequences of the acquisition, ownership and disposition of units or ADSs in their particular circumstances.
Brazilian Tax Considerations
The following discussion is a summary of the Brazilian tax considerations relating to the acquisition, exchange, ownership and disposition of units or ADSs by a holder that is not domiciled in Brazil for purposes of Brazilian taxation (a “Non-Resident Holder”). The discussion is based on Brazilian law as currently in effect, which is subject to change, possibly with retroactive effect, and to differences of interpretation. Any change in such law may change the consequences described below.
The tax consequences described below do not take into account the effects of any tax treaties or reciprocity of tax treatment entered into by Brazil and other countries. The discussion also does not address any tax consequences under the tax laws of any state or locality of Brazil.
The description below is not intended to constitute a complete analysis of all tax consequences relating to the acquisition, exchange, ownership and disposition of our units or ADSs. Holders of units or ADSs and prospective purchasers thereof should consult their tax advisors with respect to the tax consequences of owning and disposing of our units or ADSs in light of their particular investment circumstances.
Income Tax
Dividends
Dividends paid by a Brazilian company, such as ourselves, including stock dividends and other dividends paid to a Non-Resident Holder are currently not subject to withholding income tax in Brazil, to the extent that such amounts are related to profits generated since January 1, 1996. Dividends relating to profits generated prior to January 1, 1996 may be subject to Brazilian withholding tax at varying rates, depending on the year the profits were generated.
Interest Attributable to Shareholders’ Equity
Law 9,249, dated December 1995, as amended, allows a Brazilian corporation, such as ourselves, to make distributions to shareholders of interest on net equity and treat those payments as a deductible expense for purposes of calculating Brazilian corporate income tax and social contribution on net profits; subject to the limits described below. These distributions may be paid in cash. For tax purposes, this interest is limited to the daily pro rata variation of the Long Term Interest Rate (
Taxa de Juros de Longo Prazo
– TJLP), as determined by the Brazilian Central Bank from time to time, and the amount of this deductible expense may not exceed the greater of:
|
|
·
|
50.0% of the net income (after the deduction of social contribution on net profit but before taking into account allowances for income tax and the interest attributable to shareholders’ equity) for the period in respect of which the payment is made; and
|
|
|
·
|
50.0% of our accumulated profits.
|
Payment of interest on shareholders’ equity to a Non-Resident Holder is subject to withholding income tax at the rate of 15.0%, or 25.0% for individuals or entities residing in a “Tax Haven” (that is, a country where there is no income tax or where income tax is below 20.0% or where local legislation imposes restrictions on disclosure regarding shareholder composition or investment ownership). These payments may be included, at their net value, as part of any mandatory dividend, as discussed above under “—Dividend Policy.”
Distributions of interest on shareholders’ equity to Non-Resident Holders may be converted into U.S. dollars and remitted outside Brazil, subject to applicable exchange controls, if the investment is registered with the Brazilian Central Bank.
Capital Gains
|
|
(i)
|
Taxation of Capital Gain Earned in the Country in a Transaction Not Carried Out on the Brazilian Stock Exchange (Or Similar Exchange).
|
According to Law 10,833/03, the gains recognized on a disposition of assets located in Brazil, such as our units, by a Non-Resident Holder, could be subject to withholding tax in Brazil. This rule is applicable regardless of
whether the disposition occurs in Brazil or abroad and regardless of whether the disposition is made to an individual or entity resident or domiciled in Brazil.
As a general rule, capital gains realized as a result of a disposition of units are the positive difference between the amount realized on the disposition of the units and the acquisition cost of such units.
The income tax on these gains must be deducted at source and the tax rate will vary depending on the domicile of the Non-Resident Holder:
|
|
·
|
If the Non-Resident Holder is not located in a Tax Haven, the tax rate will be 15.0%;
|
|
|
·
|
If the Non-Resident Holder is located in a Tax Haven, the tax rate will be 25.0%.
|
The tax must be withheld and paid by the payer or, in cases where the buyer and seller are domiciled abroad, a legal representative shall be elected for the payment of the tax.
|
|
(ii)
|
Taxation of the Net Gain Earned in the Country in a Transaction Carried Out on the Brazilian Stock Exchange (Or Similar Exchange).
|
There will also be the levy of income tax on net gains earned by a Non-Resident Holder on the disposition of units sold on the Brazilian stock exchange, commodities or futures exchange (or similar exchange). The tax rate will vary according to the type of investment registration made by the Non-Resident Holder at the Brazilian Central Bank:
|
|
·
|
Net gains earned by a Non-Resident Holder who (1) has registered its investment in Brazil with the Brazilian Central Bank under the rules of the Brazilian Monetary Counsel – Resolution 2,689 (“Registered Holder”) and (2) is not a Tax Haven resident are subject to income tax at a rate of zero percent; and
|
|
|
·
|
Net gains earned by a Non-Resident Holder who is not a Registered Holder or is a Tax Haven resident (Registered Holder or not) are subject to income tax at a rate of 15.0%. In this case, withholding income tax of 0.005% will be levied by the intermediary institution (that is, a broker) that receives the order directly from the Non-Resident Holder, which can be later offset against the 15.0% income tax due on the net gain, which will be paid by the Non-Resident Holder´s tax representative in Brazil.
|
Any other gains realized on a disposition of units that is not carried out on such an exchange or that is conducted in the “OTC market” are subject to the same rules set forth in item “(i) Taxation of Capital Gain Earned in the Country in a Transaction Not Carried Out on the Brazilian Stock Exchange (Or Similar Exchange):”
|
|
·
|
Gains realized by a Non-Resident Holder on the disposition of preemptive rights held in stock will be subject to Brazilian income tax, according to the same rules applicable to the sale of units or ADSs.
|
|
|
(iii)
|
Reduction of Capital
|
In the case of a capital reduction by a Brazilian corporation, such as ourselves, the positive difference between the amount received by the Non-Resident Holder and the acquisition cost of the securities is treated as capital gain derived from the sale or exchange of shares not carried out on a Brazilian exchange described above in (i) and is therefore subject to withholding tax at the rate of 15.0% for a Non-Resident Holder not located in a Tax Haven or up to 25.0% for a Non-Resident Holder located in a Tax Haven.
Sale of ADSs
Pursuant to Section 26 of Law 10,833, the sale of property located in Brazil by a Non-Resident Holder, whether to a Brazilian resident or to another Non-Resident Holder, is subject to Brazilian income tax. Our understanding is that ADSs do not qualify as property located in Brazil and, thus, should not be subject to the Brazilian income tax. Insofar as the regulatory norm referred to in Section 26 is recent and generic and has not been tested through the administrative or judicial courts, we are unable to assure you of the final outcome of such discussion.
Gains on the exchange of ADSs for units
Non-Resident Holders may exchange ADSs for the underlying units and sell the units on the Brazilian stock exchange, and the sale proceeds may be remitted abroad within five business days from the date of exchange or sale (in reliance on the depositary’s electronic registration). Because there is no calculation of capital gains earned in the country, such a transaction would not be subject to income tax.
Upon receipt of the underlying units in exchange for ADSs, Non-Resident Holders may also elect to register with the Brazilian Central Bank the U.S. dollar value of such units as a foreign portfolio investment under CMN Resolution 2,689/00, which will entitle them to the tax treatment applicable to Registered Holders described above.
Alternatively, the Non-Resident Holder is also entitled to register with the Brazilian Central Bank the U.S. dollar value of such units as a foreign direct investment under Law 4,131/62, in which case the respective sale would be subject to the tax treatment applicable to transactions carried out of by a Non-Resident Holder that is not a Registered Holder.
Gains on the exchange of units for ADSs
The deposit of units in exchange for the ADSs by a Non-Resident Holder may be subject to Brazilian income tax on capital gains if the acquisition cost of the units is lower than the market price for such unit.
The difference between the acquisition cost and the average price of the units is considered a capital gain subject to income tax at a rate of 15.0%, or 25.0% for Tax Haven residents. If a Non-Resident Holder that is a foreign direct investor under Law 4,131/62 wishes to deposit its units into the ADR program in exchange for ADSs, such Non-Resident Holder will be required to present to the custodian evidence, if applicable, of payment of the income tax assessed on capital gains at the rate of 15.0% or, in the case of a Tax Haven resident, 25.0%.
However, there are arguments that there should be no withholding tax on this transaction, because: (i) the sale of units does not occur; and (ii) the transaction is registered on the stock exchange. Given the uncertainty of these two positions, we recommend that you consult your tax advisors.
Tax on Foreign Exchange Transactions
The Tax on Foreign Exchange Transactions (I0F/Exchange Tax), is due on the conversion of Brazilian or foreign currency, or any document that represents it, into an available equivalent amount. Currently, for most exchange transactions, the IOF/Exchange Tax rate is 0.38%.
However, different rates apply to an inflow of resources into Brazil for investments carried out by Non-Resident Holders in the Brazilian financial and capital markets under regulations issued by the CMN 2,689 (
“
Resolução 2.689
”
). These rates are:
|
|
(i)
|
investment in financial and capital markets (Fixed Income), constitution of guaranteed margin, derivatives operations with predetermined yield, including simultaneous operations: zero (from June 4, 2013);
|
|
|
(ii)
|
investment in variable income securities negotiated on a stock exchange, commodities and futures, acquisition of shares in public offers or subscription of shares, as long as they belong to companies that are allowed to deal in the stock exchange: zero;
|
|
|
(iii)
|
application in investment funds in participations (FIP), investment funds in emerging companies (FIEE) and investment funds in shares from these funds (FIC-FIP and FIC-FIEE): zero;
|
|
|
(iv)
|
operations of cancellation of depositary receipts for shares acquisition: zero;
|
|
|
(v)
|
return on investments in the Brazilian capital and financial markets: zero;
|
|
|
(vi)
|
distribution of interest on shareholders’ equity and dividends: zero; and
|
|
|
(vii)
|
investment in Brazilian Depositary Receipts: zero.
|
Under the provisions of the Law, the Brazilian government may increase any of these rates at any time, up to 25.0%. However, any increase in rates may only apply to future transactions.
There is a 0.0% IOF tax on foreign exchange transactions for inflows that are designated to investments in debentures regulated by Law 12,431/2011, specifically the ones related to investment projects, and all the conditions of Law 12,431/2011 should apply.
Tax on Transactions Involving Bonds and Securities and Derivatives
Brazilian law imposes a Tax on Transactions Involving Bonds and Securities, known as “IOF/Bonds Tax.”
Currently, the IOF tax on fixed income bonds has a daily rate of 1.0% limited to 96.0% of the income generated by the bond, on the redemption amount, or the amount received from assignment or renegotiation. The rate is reduced to zero as from the thirtieth day.
The rate of IOF/Bonds Tax applicable to transactions of variable income securities, including those traded in stock, commodities or futures markets that involve shares, or units comprised of shares, is reduced to zero.
The conversion of shares into ADRs or units into ADSs was not taxable before November 17, 2009. Following the enactment of Decree 7,011 of November 18, 2009, these transactions are subject to the IOF/Bonds Tax at the rate of 1.5% on the transaction value (obtained by multiplying the number of shares/units converted by the closing price on the day before the conversion, or, in the case no trades were made on that day, by the last closing price available). However, under Decree 8,165 of December 24, 2013, the tax was reduced to zero.
The IOF Derivatives Tax was established by the Decree 7,563 of September 16, 2011, with the original levy of 1.0% per day on the notional value of the adjusted purchase sale or maturity of financial derivative contract in the country that individually results in an increased foreign exchange exposure on a short position. However, under Decree 8,027, of June 12, 2013, the tax rate was reduced to zero.
Other Brazilian Taxes
The inheritance and gift tax (ITCMD) is applicable to the transfer of any goods or rights by gift or bequest. The transfer or disposition of shares, or units comprised of shares, that are abroad to individuals that are domiciled in Brazil is subject to taxation. If the shares are in Brazil and are transferred to a non-resident, the ITCMD will apply if the donor is domiciled in Brazil and the donee is domiciled abroad.
Material U.S. Federal Income Tax Considerations for U.S. Holders
The following summary describes the material U.S. federal income tax consequences of the ownership and disposition of ADSs or units, but it does not purport to be a comprehensive description of all of the tax considerations that may be relevant to a particular person’s decision to acquire such securities. This summary does not address “Medicare contribution tax” consequences and applies only to U.S. Holders (as defined below) that hold ADSs or units as capital assets for U.S. federal income tax purposes and does not address special classes of holders, such as:
|
|
·
|
certain financial institutions;
|
|
|
·
|
insurance companies;
|
|
|
·
|
dealers and traders in securities that use a mark-to-market method of tax accounting;
|
|
|
·
|
persons holding ADSs or units as part of a hedge, “straddle,” conversion transaction or integrated transaction;
|
|
|
·
|
holders whose “functional currency” is not the U.S. dollar;
|
|
|
·
|
holders liable for the alternative minimum tax;
|
|
|
·
|
tax exempt entities, including “individual retirement accounts” and “Roth IRAs;”
|
|
|
·
|
partnerships or other entities classified as partnerships for U.S. federal income tax purposes;
|
|
|
·
|
holders that own or are deemed to own ten percent or more of our voting shares; and
|
|
|
·
|
persons holding ADSs or units in connection with a trade or business conducted outside the United States.
|
If an entity that is classified as a partnership for U.S. federal income tax purposes holds units or ADSs, the U.S. federal income tax treatment of a partner will generally depend on the status of the partner and upon the activities of the partnership. Partnerships holding units or ADSs and partners in such partnerships should consult their tax advisors as to the particular U.S. federal income tax consequences of holding and disposing of the units or ADSs.
The summary is based upon the Internal Revenue Code of 1986, as amended (the “Code”), administrative pronouncements, judicial decisions and final, temporary and proposed Treasury Regulations, all as of the date hereof, changes to any of which may affect the tax consequences described herein, possibly with retroactive effect. In addition, the summary is based in part on representations of the depositary and assumes that each obligation provided for in, or otherwise contemplated by, the deposit agreement or any other related document will be performed in accordance with its terms. U.S. Holders are urged to consult their tax advisors as to the U.S. federal income tax consequences of the acquisition, ownership and disposition of ADSs or units in their particular circumstances.
As used herein, a “U.S. Holder” is, for U.S. federal income tax purposes, a beneficial owner of ADSs or units that is:
(1) an individual that is a citizen or resident of the United States;
(2) a corporation, or other entity taxable as a corporation, created or organized in or under the laws of the United States, any state thereof or the District of Columbia;
(3) an estate the income of which is subject to U.S. federal income taxation regardless of its source; or
(4) a trust if (a) a court within the United States is able to exercise primary supervision for the administration of the trust, and one or more U.S. persons have the authority to control all substantial decisions of the trust or (b) the trust has validly elected under applicable Treasury Regulations to be treated as a U.S. person.
In general, for U.S. federal income tax purposes, U.S. Holders of ADSs will be treated as the owners of the underlying units represented by those ADSs. Accordingly, no gain or loss will be recognized if a U.S. Holder exchanges ADSs for the underlying units represented by those ADSs.
The U.S. Treasury has expressed concerns that parties to whom American depositary shares are released before delivery of shares to the depositary (a practice called “pre-release”) or intermediaries in the chain of ownership between U.S. Holders and the issuer of the security underlying the American depositary shares, may be taking actions that are inconsistent with the claiming of foreign tax credits by U.S. Holders of American depositary shares. These actions would also be inconsistent with the claiming of the preferential tax rates described below, applicable to dividends received by certain non-corporate holders. Accordingly, the creditability of Brazilian taxes and the availability of the preferential tax rates for dividends received by certain non-corporate holders, each described below, could be affected by actions taken by these parties or intermediaries.
Taxation of Distributions
Distributions paid on our units or ADSs (including distributions to shareholders that are treated as interest on net equity for Brazilian tax purposes and amounts withheld in respect of Brazilian tax), other than certain pro rata distributions of our common shares, will be treated as dividends to the extent paid out of our current or accumulated earnings and profits (as determined under U.S. federal income tax principles). Because we do not maintain calculations of our earnings and profits under U.S. federal income tax principles, it is expected that distributions generally will be reported to U.S. Holders as dividends. These dividends will be included in a U.S. Holder’s income on the date of the U.S. Holder’s (or in the case of ADSs, the depositary’s) receipt of the dividend, and will not be eligible for the “dividends received deduction” generally allowed to corporations receiving dividends from domestic corporations under the Code. The amount of the distribution will equal the U.S. dollar value of the
reais
received,
calculated by reference to the exchange rate in effect on the date that distribution is received (which, for U.S. Holders of ADSs, will be the date on which the distribution is received by the depositary), whether or not the depositary or U.S. Holder in fact converts any
reais
received into U.S. dollars at that time. If the dividend is converted into U.S. dollars on the date of receipt, a U.S. Holder generally will not be required to recognize foreign currency gain or loss in respect of the dividend income. A U.S. Holder may have foreign currency gain or loss if the dividend is converted into U.S. dollars after the date of receipt. Any gains or losses resulting from the conversion of
reais
into U.S. dollars will be treated as ordinary income or loss, as the case may be, of the U.S. Holder and will generally be U.S.-source.
Subject to applicable limitations, the discussion above regarding concerns expressed by the U.S. Treasury and the discussion of the passive foreign investment company rules below, under current law, dividends paid with respect to our ADSs to certain non-corporate U.S. Holders will be taxable at the preferential rates applicable to long-term capital gain. Non-corporate U.S. Holders should consult their tax advisors regarding the availability of these favorable rates in their particular circumstances.
Sale or Other Disposition of ADSs or Units
Subject to the discussion of the passive foreign investment company rules below, gain or loss realized by a U.S. Holder on the sale or exchange of ADSs or units will be subject to U.S. federal income tax as capital gain or loss in an amount equal to the difference between the U.S. Holder’s adjusted tax basis in the ADSs or units and the amount realized on the disposition, in each case as determined in U.S. dollars. Such gain or loss will be long-term capital gain or loss to the extent that the U.S. Holder’s holding period with respect to the ADSs or units exceeds one year. Gain or loss, if any, will generally be U.S.-source for foreign tax credit purposes. The deductibility of capital losses is subject to limitations. Long-term capital gain of a non-corporate U.S. Holder is generally taxed at preferential rates. If a Brazilian tax is withheld on the sale or other disposition of ADSs or units, a U.S. Holder’s amount realized will include the gross amount of proceeds of the sale or disposition before the deduction of the Brazilian tax. See “—Brazilian Tax Considerations” for a description of when a disposition may be subject to taxation by Brazil.
Foreign Tax Credits
Subject to certain generally applicable limitations, which may vary depending upon a U.S. Holder’s circumstances, and subject to the discussion above regarding concerns expressed by the U.S. Treasury, a U.S. Holder will be entitled to a credit against its U.S. federal income tax liability for Brazilian income taxes withheld from dividends on ADSs or units. A U.S. Holder will be entitled to use these foreign tax credits to offset only the portion of its U.S. tax liability that is attributable to foreign-source income. This limitation on foreign taxes eligible for credit is calculated separately with regard to specific classes of income. In addition, a U.S. Holder must satisfy minimum holding period requirements in order to be eligible to claim a foreign tax credit for foreign taxes withheld on dividends.
Because a U.S. Holder’s gains from the sale or exchange of ADSs or units will generally be treated as U.S.-source income, this limitation may preclude a U.S. Holder from claiming a credit for all or a portion of the foreign taxes imposed on any such gains. U.S. Holders should consult their tax advisors as to whether these Brazilian taxes may be creditable against the U.S. Holder’s U.S. federal income tax liability on foreign-source income from other sources. Instead of claiming a credit, a U.S. Holder may, at its election, deduct such otherwise creditable Brazilian income taxes in computing taxable income, subject to generally applicable limitations under U.S. law. An election to deduct foreign taxes instead of claiming foreign tax credits applies to all foreign taxes paid or accrued in the taxable year.
The Brazilian IOF/Exchange Tax imposed on the purchases of units and the IOF/Bonds Tax on the deposits of units in exchange for ADSs (as discussed above under “—Brazilian Tax Considerations”), will not be treated as creditable foreign tax for U.S. federal income tax purposes. U.S. Holders should consult their tax advisors as to whether those taxes would be deductible for U.S. federal income tax purposes.
The rules governing foreign tax credits are complex and, therefore, U.S. Holders are urged to consult their own tax advisors to determine whether they are subject to any special rules that limit their ability to make effective use of foreign tax credits.
Passive Foreign Investment Company Rules
Based on proposed Treasury Regulations, which are proposed to be effective for taxable years beginning after December 31, 1994, we believe we were not a passive foreign investment company (a “PFIC”) for our taxable year ended December 31, 2013. However, because the proposed Treasury regulations may not be finalized in their current form, because the application of the proposed regulations is not entirely clear and because the composition of our income and assets will vary over time, there can be no assurance that we will not be a PFIC for any taxable year. The determination of whether we are a PFIC is made annually and is based upon the composition of our income and assets (including, among others, entities in which we hold at least a 25.0% interest), and the nature of our activities.
If we were a PFIC for any taxable year during which a U.S. Holder held our ADSs or units, any gain recognized by a U.S. Holder on a sale or other disposition of ADSs or units would be allocated ratably over the U.S. Holder’s holding period for the ADSs or units. The amounts allocated to the taxable year of the sale or other exchange and to any year before we became a PFIC would be taxed as ordinary income. The amount allocated to all other taxable years would be subject to tax at the highest rate in effect for individuals or corporations, as appropriate, for that taxable year, and an interest charge would be imposed on the resulting tax liability for each of those taxable years. Further, the portion of any distribution in respect of ADSs or units that is in excess of 125.0% of the average of the annual distributions on ADSs or units received by the U.S. Holder during the preceding three years or the U.S. Holder’s holding period, whichever is shorter, would be subject to taxation as described above. Certain elections may be available that would result in alternative treatments (such as mark-to-market treatment) of the ADSs or units. U.S. Holders should consult their tax advisors to determine whether any of these elections would be available and, if so, what the consequences of the alternative treatments would be in their particular circumstances.
If we are a PFIC in any taxable year, a U.S. Holder may be required to file a report with the Internal Revenue Service (the “IRS”) containing such information as the Treasury Department may require.
In addition, if we are a PFIC in a taxable year in which we pay a dividend or the prior taxable year, the preferential dividend rates discussed above with respect to certain dividends paid to non-corporate holders would not apply.
Information Reporting and Backup Withholding
Payments of dividends and sales proceeds that are made within the United States or through certain U.S.-related financial intermediaries generally are subject to information reporting, and may be subject to backup withholding unless (1) the U.S. Holder is an exempt recipient or (2) in the case of backup withholding, the U.S. Holder provides a correct taxpayer identification number and certifies that it is not subject to backup withholding. The amount of any backup withholding from a payment to a U.S. Holder will be allowed as a credit against the U.S. Holder’s U.S. federal income tax liability and may entitle the U.S. Holder to a refund, provided that the required information is timely furnished to the IRS.
|
10F
.
|
Dividends and Paying Agents
|
Not applicable.
|
10G
.
|
Statement by Experts
|
Not applicable.
|
10H
.
|
Documents on Display
|
We are subject to the information requirements of the Exchange Act, except that as a foreign issuer, we are not subject to the proxy rules or the short-swing profit disclosure rules of the Exchange Act. In accordance with these statutory requirements, we file with or furnish reports and other information with the SEC. Reports and other information filed or furnished by us to the SEC may be inspected and copied at the public reference facilities maintained by the SEC at Room 1024, 100 F Street, N.E., Washington, D.C. 20549. Copies of such material may also be inspected at the offices of the NYSE, 11 Wall Street, New York, New York 10005, on which our ADSs are listed. In addition, the SEC maintains a website that contains information filed electronically with the SEC, which can be accessed over the internet at http://www.sec.gov.
We also file consolidated financial statements and other periodic reports with the CVM located at Rua Sete de Setembro, 111, Rio de Janeiro, Rio de Janeiro 20159-900, Brazil. The CVM maintains an Internet website that contains reports and other information about issuers, like us, that file electronically with the CVM. The address of that website is http://www.cvm.gov.br. We also file consolidated financial statements and other periodic information with BM&FBOVESPA. The address of the BM&FBOVESPA website is http://www.bovespa.com.br.
|
10I
.
|
Subsidiary Information
|
Not applicable.
Overview
To manage the risks of our operations, we have incorporated the Santander Group’s global risk management functions at various levels of our organization. Certain members of our risk management team are seconded from the Santander Group to ensure a consistent risk management approach worldwide by implementing our risk management policies for all areas, including financial, credit and market risk. In addition, committees headed by senior management oversee our risk reports in each of these areas. Risk limits and exposures in local jurisdictions are further subject to the approval of the Santander Group.
Risk management reports provided to our senior management are generated mainly by the control department and the risk consolidation department based on the databases corresponding to each department. Likewise, the reports for senior management of the Santander Group’s financial entities and foreign branches are generated mainly by the risk control departments of each of those entities and branches.
The presentation of risk management information to senior management is designed to enhance the understanding and management of risks for the Santander Group’s administrative bodies and branches. These reports are targeted to different audiences within senior management, whether the Santander Group, its financial entities, or its foreign branches, depending on the kind of information each type of report highlights. Information may be transmitted to senior management either through our intranet risk reporting tool, through e-mail or by live presentations.
Information, analyses and decisions are also disseminated through the channels described below, fostering communication among areas within the Bank and within the risk management process:
|
|
·
|
risk intranet, which is used to transmit information related to the various risk management areas;
|
|
|
·
|
internal department mailboxes, which allow for the exchange of information within groups and areas;
|
|
|
·
|
periodic meetings (departmental, monthly, quarterly, off-site, conventions), which allow for regular exchange of information on an in-person basis;
|
|
|
·
|
regulations portal, which is an internal portal within our intranet where we maintain our current risk management policies;
|
|
|
·
|
e-mail;
|
|
|
·
|
video and teleconferences with Santander Spain; and
|
|
|
·
|
risk committees, including the executive risk committee for Brazil, the risk management
committee, centralized risk committees (such as the retail superior risk committee and the territorial committee), decentralized committees (such as the network committee) and
decentralized instances for business management (including branch committees).
|
Information is prepared in an effort to improve risk management and is classified as standard information or non-standard information.
|
|
·
|
Standard information: includes information and reports generated on a regular basis and with fixed content, subject to revisions, which is available to senior management for different target areas, depending on the type of information included in each report. This information is used to facilitate knowledge about credit use, instrument valuation and the results generated, in addition to the analyses needed to manage these risks and optimize capital. Each report may have a distinct presentation based on the guidelines pursuant to which it is prepared.
|
|
|
·
|
Non-standard information: includes presentations and other information prepared for our senior management on an ad hoc basis or upon specific request and addresses specific topics that are not included in the standard reports. When the request for certain information becomes more regular, such report becomes standard and automatically generated. Standard information delivered to our senior management is intended to facilitate the understanding of all risks for which the risk management department is responsible. The content of each report fits within one of two fundamental bases: the nature of the information and its frequency. The nature of the information prepared is either quantitative or qualitative.
|
Quantitative Information
. Quantitative information includes risk metrics that permit our senior management to better analyze situations, trends and developments in each segment, activity or portfolio, relating to planned scenarios or defined limits, with emphasis on any scenarios falling outside such limits. Quantitative information is developed primarily to analyze liquidity and market risks, and solvency risks. Information related to liquidity and market risk includes, among other items, measurements of positions, mark-to-market valuations, sensitivity analyses, volume analyses, measures of liquidity gaps and country risk models, impacts of risks on results, economic risks, stress test simulations and back-testing. Information related to solvency risks includes, among other items, credit exposure measures, abnormal events, doubtful asset measurements, impacts of solvency risks on our results, measures of expected loss, stress test simulations, and other information related to economic and market risks.
Qualitative Information
. Qualitative information includes internal and external events relating to the economic, financial or competitive environment, and an evaluation and analysis of the causes and consequences or foreseeable consequences of such events. These also include measures used to prepare such models. The frequency with which quantitative and qualitative risk management information is prepared is determined by the kind of information provided, as follows:
Daily information
:
|
|
·
|
liquidity and market risk: includes data on treasury limits (VaR, positions, sensibility of linear and non-linear books) and the principal changes in the treasury portfolio; and
|
|
|
·
|
solvency risk: focuses on sharp changes or those that involve significant variations in the evolution of the business and its environment.
|
Weekly information
:
|
|
·
|
this information focuses on generating updated high-level information in different segments (focused on solvency risk) or portfolios (focused on market risk), as well as a summary of the relevant facts and expected short-term changes;
|
|
|
·
|
our senior management, including president and vice presidents of retail, risks and finance, and an independent member of our board of directors, receive a weekly report regarding market risks; and
|
|
|
·
|
this data is drawn from our risk management framework and policies globally and is validated by local market and solvency risk areas.
|
Monthly information
:
|
|
·
|
liquidity and market risk: facilitates the analysis of the current situation of different activities, including structural and interest rate risks; it also includes a detailed analysis of contrast measures and stress scenarios;
|
|
|
·
|
solvency risk: facilitates an assessment of the current situation in different segments, compared to the budgeted situations and an analysis of the causes of deviations. It introduces credit rating with a basis of analysis;
|
Monthly information is generally more detailed than weekly information.
Risk Management Committees
The following table describes our principal credit and market risk management committees in Brazil, the responsibilities and members of each such committee and the frequency with which such committees meets.
|
Committee
|
Responsibilities
|
Members
|
Meeting
Frequency
|
|||
|
Executive Risk Committee (focused on portfolios management)
|
·
Approves the risk tolerance that will be proposed to the board of directors of the Bank;
·
Monitors portfolios and ensures compliance with Santander Brasil’s risk tolerance and budget; and
|
Monthly
|
||||
|
·
Monitors the market to identify risks and opportunities that must be managed.
|
Chief Executive Officer
Vice Presidents that are members of the Executive Committee
|
|||||
|
Executive Risk Committee (focused on clients)
|
·
Analyzes and approves credit risks and market operations for Global Wholesale clients and Corporate as well as limits and treasury products and restructuring proposals and payment arrangements.
|
Vice President for Risk Management in Brazil and reporting officers
Invited members:
Heads of segments, products and networks
|
Three times a week
|
|||
|
·
Applies the Group’s risk policies locally in a manner compatible with the objectives of the business areas;
·
Handles general issues related to market risk, cross-border limits, country risk, global banking operations, enterprises and retail clients;
|
||||||
|
·
Receives monthly updates on changes in business and risk policies that impact net margins, gross margins, provisions for doubtful accounts and the plan for credit management, as well as any other matters related to risk management;
|
||||||
|
·
Approves credit management plans; and
|
||||||
|
·
Reviews the observations and recommendations made from time to time by regulators and internal and external auditors.
|
|
Committee
|
Responsibilities
|
Members
|
Meeting
Frequency
|
|||
|
Wholesale/Retail Monitoring Committee
|
·
Analyzes, discusses, proposes, and monitors policies, cash flows and credit processes of the Wholesale/Retail area;
·
Approves publicity campaigns, pre-qualification of clients and warning signals and monitors their performance;
·
Monitors the wholesale portfolio and the behavior of each of its segments as measured by:
|
Officers and risk management superintendents
Executive Vice President of the commercial network, global banking and corporate operations.
Executive Superintendent Commercial
Regional Superintendent-Commercial
Director of organization, technology and processes
CFO of Retail and Finance
|
Weekly/semi-monthly/ad-hoc
|
|||
|
·
Credit indicators, projections, and development;
|
||||||
|
·
Opportunities by product, economic sector and region;
|
||||||
|
·
Non-performance;
|
||||||
|
·
Client valuations; and
|
||||||
|
·
Behavior of clients subject to special monitoring.
|
||||||
|
·
Monitors the market to identify opportunities and risks to be managed.
|
Our executive credit committee makes decisions with regard to risk management in Brazil with representatives of our senior management, including our chief executive officer, our vice president of risk management and the other members of our executive committee. The main responsibilities of the executive credit committee include defining our level of risk tolerance, monitoring our loan portfolios and market conditions as well as any recommendations made by the Brazilian Central Bank. The executive credit committee also raises any matters to our board of directors that exceed the authority of the committee. Each of our risk management committees has certain powers and approval levels, in each case subject to Brazilian law and regulations. Decisions at the committee level are intended to be collegial in a manner to ensure that differing opinions are all considered.
Credit Risk
The Santander Group risk management model is based on prudent risk management and the definition of risk tolerance by our board of executive officers.
We operate within the risk management culture of the Santander Group following the guidelines of our board of executive officers, the Brazilian Central Bank regulations and international best practices, to protect capital and ensure profitability.
One of our credit risk management principles is independence from our business areas that provides sufficient autonomy to accomplish an appropriate risk management.
Another characteristic of our credit model is the direct involvement of our senior management in decision-making through credit committees.
Our credit approval process, particularly the approval of new loans and risk monitoring, is structured according to our classification of customers and products between our retail and wholesale lending operations.
Retail Lending
In retail banking, credit requests by individuals are analyzed by a credit approval system applying various types of processes depending on the credit history of the individual and the type of credit requested. For standard credit requests in amounts less than R$2.0 million with respect to mortgage loans, approval is generally made at our branches based on an automatic, standardized process. When the customer’s request is submitted for credit approval,
we collect relevant credit information from the customer, including the individual’s profession, level of income, internal and external financial restrictions, credit history, current indebtedness, and relationship with us. Based on this data and the type of credit requested, our credit rating system automatically assigns a credit rating based on a scoring model and our risk management policies. We use our scoring models in two different phases: during the “application” process and later in the “ongoing” phase. A credit scoring model is applied in the application phase when the customer begins a relationship with us and a behavioral scoring model is used when the customer has already had a relationship with us for a period established by our risk management policies. This policy allows us to evaluate our existing customers with a more complete analysis than if we applied a pure scoring model for all customers.
For financing products offered to SMEs, the credit risk approval process can involve an automated scoring system, based on credit policies, and/or be manually and individually analyzed and approved, based on the creditworthiness of the SME, in accordance with the respective credit risk approval authority levels as described in the table below. This preliminary analysis also generates a credit rating based on our internal models. Additional information, such as the characteristics of the financing product being offered, including related terms and conditions and collateral granted in connection therewith, is also taken into account as part of the approval process.
Pre-approved limits are granted lines of credit for a particular individual or a SME based on the creditworthiness and size as determined according to our scoring criteria. Credit approval by our branches is allowed by authorized personnel according to established parameters. Credit limits are managed based on the performance of the customers taking into account its risk profile.
Credit authorizations are established through policies that define the rules and responsibilities of the members of each committee. We have established procedures and authorized certain organizational bodies to approve credit requests in amounts greater than those delegated to individual branches (both for individuals and SMEs). Such approvals are made following application of the relevant scoring model and individualized analysis by the relevant authorized organization body. The following table presents the individuals or organization bodies authorized to make extensions of credit to retail borrowers for the amounts specified:
|
Authorization Required
|
Amount
|
|
|
Branch(1)
|
Up to R$2 million
|
|
|
Business Committees(2)
|
Up to R$2 million
|
|
|
Network Committees(3)
|
Up to R$4 million
|
|
|
Decision centers(4)
|
Up to R$8 million
|
|
|
Retail Risk Committee(5)
|
Up to R$15 million
|
|
|
Superior Risk Committee for Retail(6)
|
Up to R$60 million
|
|
|
Superior Risk Committee(7)
|
Up to U.S.$70 million
|
|
|
Brazil Executive Risk Committee(8)
|
Up to €100 million
|
|
(1)
|
For individuals, the maximum value is R$2.0 million for mortgages; for other credit lines, the maximum is R$150,000. For SMEs the maximum value for credit lines is R$500,000.
|
|
(2)
|
Members of Business Committees include a credit risk manager.
|
|
(3)
|
Members of Network Committees include a credit risk manager.
|
|
(4)
|
Members of the Decision Centers of Risk includes Superintendents and other representatives of the Risk area.
|
|
(5)
|
Members of the Retail Risk Committee include a Retail Risk Superintendent and other representatives of the Risk area.
|
|
(6)
|
Members of the Superior Risk Committee for Retail include the Retail Risk Director.
|
|
(7)
|
Members of the Superior Risk Committee include the Director of Wholesale, Retail Risk Director, Director of Market Risk, Director of Billing and representatives from each Risk department.
|
|
(8)
|
Santander Brasil Chief Executive Officer, Credit Risk Vice President/Brazil, Market Risk Director/Brazil, Risk Officers of Wholesale, Retail, Recovery and Solvency, and Vice Presidents of de Santander Business areas (wholesale and retail).
|
Wholesale Lending
With respect to our Global Wholesale Banking customers, the approval process is determined for each customer class and product separately. Credit requests by our GB&M customers, a group of approximately 600 entities, are approved by the Superior Risk Committee or by the Brazil Executive Risk Committee. Credit requests by our corporate customers/ in our Global Wholesale Banking segment (corporations with annual revenues in excess of R$80 million) must be approved by credit committees presented in the following table for the amounts indicated.
|
Authorization Required
|
Amount Corporate Customers (GB&M)
|
Amount Corporate Customers
|
||
|
Regional approval committee
|
N.A.
|
Up to R$6 million
|
||
|
Regional Wholesale Risk Committee
|
N.A.
|
Up to R$15 million
|
||
|
Territorial Risk Committee
|
N.A.
|
Up to R$40 million
|
||
|
Superior Risk Committee(1)
|
Up to U.S.$40 million
|
Up from U.S.$70 million
|
||
|
Brazil Executive Risk Committee(2)
|
Up to €100 million
|
Up to €100 million
|
|
(1)
|
Members of the superior risk committee include, among others, officers of wholesale, retail, market risk, recovery and representatives from the risk departments.
|
|
(2)
|
Held jointly with the Corporate risk committee, with members from Brazil and Spain, including: the general risk director for Santander Spain, the executive vice president for risk at Santander Brasil, the market risk director for Santander Brasil, and risk officers for wholesale, retail, recovery and solvency.
|
Credit Monitoring
Credit lines to retail banking SME customers are reviewed on a weekly basis. Credit lines to retail banking individual clients are reviewed, systemically, on a daily basis, based on a client’s credit rating. This process allows for improvements in the credit exposure of customers that have presented good credit quality. Specific early warnings are automatically generated in the case of the deterioration of a customer’s credit quality. In this case, with the identification of the client’s solvency problem, a process to reduce credit risk, designed to prevent default, is implemented.
Early warnings are automatically generated for SMEs, and their financial performance is monitored monthly. In addition, the financial situation of each enterprise is discussed by specific committees in the presence of the commercial area with the aim of continuously improving the quality of our loan portfolio.
Credit lines to Global Wholesale Banking customers and related credit quality are reviewed on an annual basis. There is a monitoring procedure and for any specific concern in regard of the credit quality of a certain customer, we use a system of customer monitoring known as FEVE (Firms for Special Vigilance), with possible actions to be taken under the following categories: “monitor,” “reduce exposure,” “seek collateral” or “cancel.” A customer subject to action under one of these categories will be reviewed on a quarterly or a semi-annual basis, depending on the situation.
Recovery
Our business recovery area is responsible for all of our non-performing portfolios. This area defines, implements and monitors strategies and performance related to non-performing portfolios, seeking to ensure maximum efficiency in recovery subject to applicable Brazilian law and regulation.
The business recovery area uses statistical tools to study the behavior of clients and strategize more effective recovery. Customers with greater probability of payment are classified as low risk customers and those with a low probability of payment are classified as high risk with collection more intensified.
The channels of operation are defined as “
Mapa de Responsabilidade
,” (Responsibility Map), using the time value of default versus risk value, in addition to other characteristics, to create strategies for recovery. Our credit recovery tools include daily contact through our call center, inclusion of defaulting clients to external sources of credit protection, sending collection letters, besides direct contacts through our branch network are tools used for credit recovery. Internal teams specialized in restructuring and debt recovery work directly with loans of higher values defaulting clients with overdue more than 60 days. We use outside agencies and lawyers to recover high-risk clients. These agencies receive a success fee for any amounts recovered.
We often sell non-performing loans in our portfolio. These sales of non-performing loans in our portfolios happen periodically through an auction process in order to look for better market opportunities.
Executive Financial Committee
Our asset and liability management strategy is defined by the Executive Financial Committee, which operates under the strict guidelines and procedures established by the Santander Group. Members of the Executive Financial Committee include our chief executive officer, chief financial officer, treasurer, executive vice president of risk management, senior vice president of Global Wholesale Banking operations, senior vice president of retail banking, the head of ALM and our chief economist, among others. The Executive Financial Committee establishes our funding strategy, structural balance sheet interest rate position and capital management. It uses several risk metrics to monitor the impact of market conditions, including interest rate margin sensitivities. Other financial committee activities include the establishment of transfer pricing policies, management of risk-weighted assets and economic capital exposure, management of local regulatory capital and decision making on capital instrument issuances, each of which is in line with the Santander Group’s guidelines and limits.
Market Risk
Activities subject to market risk and types of market risk
Our market risk area is responsible for measuring, controlling and monitoring risk in respect of those operations where risk to our business arises as a result of changes in market factors. Market risk arises due to changes and potential volatility in interest rates, exchange rates, share prices and commodities prices, as well as due to liquidity risk of the various products and markets in which we operate. The following list summarizes the principal market risks to which we are exposed.
Interest rate risk
Interest rate risk is the possibility that changes in interest rates could adversely affect the value of a financial instrument, a portfolio or our operations as a whole. We are exposed to interest rate risk whenever there is a mismatch between interest rate sensitive assets and liabilities, subject to any hedging we have engaged in using interest rate swaps or other off-balance sheet derivative instruments. Interest rate risk arises in connection with both our trading and non-trading activities.
Exchange rate risk
Exchange rate risk arises due to the sensitivity of the value of a foreign currency position in relation to a base currency (in our case,
reais
) due to a potential change in exchange rates. We are exposed to foreign exchange rate risk as a result of mismatches between assets and liabilities, and off-balance sheet items denominated in different currencies, either as a result of trading or in the normal course of business. We maintain non-trading open currency positions arising from our investments in overseas subsidiaries (such as our Cayman Islands branch), affiliates and their currency funding. Our principal non-trading currency exposure is the U.S. dollar, which, as mandated by our policies, is hedged to the
real
within established limits.
Equity price risk
Equity price risk arises due to the sensitivity of the value of an investment position in equity markets to adverse movements in the market prices or in response to expectations of future dividends. Among other instruments, equity price risk affects positions in shares, stock market indices and derivatives using shares as the underlying asset (puts, calls, and equity swaps). We are exposed to equity price risk in both our trading and non-trading investments in equity securities.
Commodities price risk
Commodities price risk is the risk derived from the effect of potential change in commodity prices. Our exposure to this risk is not significant and is concentrated in derivative operations involving commodities for clients.
Volatility risk
Volatility risk is the risk or sensitivity of the value of a portfolio to changes in the volatility of a number of risk factors, including volatility of interest rates, exchange rates, share prices and of commodity prices. This risk is applicable to financial instruments which have volatility as a variable in their valuation model.
There are other types of market risks that are more complex, such as:
Correlation risk
Correlation risk is the sensitivity of the value of a portfolio to changes in the relation between risk factors, whether of the same type (for example, between two exchange rates) or of a different nature (for example, between an interest rate and the price of a commodity).
Market liquidity risk
Market liquidity risk is that of a Bank entity or the Santander Brasil Group as a whole finding itself unable to exit or close a position in time without affecting the market price or the cost of the transaction. This risk can be caused by a decrease in the number of market makers or institutional investors, the execution of large volumes of operations, market instability and increases of the concentration existing in certain products and currencies. Market depth is the main liquidity driver in our trading portfolio, even though our policy is to trade the most liquid assets. Our liquidity risk also arises in non-trading activity due to the maturity gap between assets and liabilities mostly in the retail banking business.
Risk of prepayment or cancellation
In certain transactions the contract allows, explicitly or implicitly, cancellation before the maturity without negotiation, which creates a risk that the cash flows expected from that particular credit line have to be reinvested at a potentially lower interest rate. This mainly affects loans or mortgage securities.
Underwriting risk
Underwriting risk occurs as a result of an entity’s participation in underwriting a placement of securities or another type of debt, assuming the risk of partially owning the issue or the loan due to non-placement of all of it among potential buyers.
Derivatives used in Managing Market Risks
We use derivatives both in trading and non-trading activities to manage market risks. Trading derivatives are used to eliminate, reduce or modify risk in trading portfolios (interest rate, foreign exchange and equity price risk), and to provide financial services to customers. Our principal counterparties (in addition to customers) for this activity are financial institutions and the BM&FBOVESPA. Our principal derivative instruments include interest rate swaps, interest rate futures, foreign exchange forwards, foreign exchange futures, foreign exchange options, cross currency swaps, equity index futures and equity options and interest rate options. With respect to non-trading activity, derivatives are used in order to manage interest rate risks and foreign exchange risks arising from asset and liability management activity. We also use interest rate and foreign exchange linear derivatives in non-trading activity.
We have no credit derivatives in Brazil, as there is no market for credit derivatives in Brazil.
On the basis of the origin of the risk, activities are classified as follows:
Trading book
The trading book: includes financial services to customers and purchase-sale and positioning mainly in fixed income, equity and currency products. The trading book comprises our proprietary positions in financial instruments held for resale and/or bought to take advantage of current and/or expected differences between purchase and sale prices. This portfolio also includes positions in financial instruments deriving from market-making and sales activities. As a result of trading fixed income securities, equity securities and foreign exchange, we are exposed to
interest rate, equity price and foreign exchange rate risks. We are also exposed to volatility when non-linear derivatives are used.
Non-trading book (banking/structural)
The non-trading book is constituted of market risks inherent in the balance sheet, excluding the trading portfolio. These include:
|
|
i.
|
Structural interest rate risk. This arises from mismatches in the maturities and re-pricing of all assets and liabilities.
|
|
|
ii.
|
Structural exchange rate risk/hedging of results. Exchange rate risk occurs when the currency in which the investment is made is different from the
real
in companies or branches that are consolidated and those that are not (structural exchange rate). In addition, exchange rate hedging of future results generated in currencies other than the
real
(hedging of results).
|
|
|
iii.
|
Structural equity risk. This involves investments via stakes in financial or non-financial companies that are not consolidated, as well as portfolios available for sale formed by equity positions.
|
Market Risk Management Framework
Our board of directors is responsible for establishing our policies, procedures and limits with respect to market risk, including which businesses to enter into and maintain. The risk committee monitors our overall performance in light of the risks we assume. Together with the local and global assets and liabilities committees, each market risk unit measures and monitors our market and liquidity risk and provides figures to the assets and liabilities committees to use in managing such risks.
Market risk is regulated and controlled through certain policies, set forth in our market and liquidity risk management policies manual, and through structures setting forth specific limits to our exposure to market risk which is based on global limits established for the entire Santander Group. In addition, authorized products are listed and reviewed periodically.
These policies, procedures and limits on market risk are applicable to all units, businesses or portfolios susceptible to market risk, and rest on five basic pillars, that we believe are vital for correct management of market risks:
|
|
i.
|
Measurement, analysis and control of market and liquidity risks;
|
|
|
ii.
|
Calculation, analysis, explanation and reconciliation of results;
|
|
|
iii.
|
Defining, capturing, validating and distributing market data;
|
|
|
iv.
|
Approval of limits, products and underlying assets; and
|
|
|
v.
|
Consolidation of information.
|
In turn, our market risk management is guided by the following basic principles:
|
|
i.
|
Involvement of senior management;
|
|
|
ii.
|
Independence of the risk function from the business units;
|
|
|
iii.
|
Clear definition of powers;
|
|
|
iv.
|
Risk measurement;
|
|
|
v.
|
Limiting risks;
|
|
|
vi.
|
Analysis and control of risk positions;
|
|
|
vii.
|
Establishing risk policies and procedures; and
|
|
|
viii.
|
Assessing risk methodologies.
|
Structure of Limits Regarding Market Risk
The market risk limit structure represents the Bank’s risk appetite and is aligned with our global market risk management policies, which encompass all of our business units and serve to:
|
|
i.
|
identify and define the main types of risk incurred in a manner consistent with our business strategy.
|
|
|
ii.
|
quantify and report to our business segments with respect to appropriate risk levels and risk profile in line with senior management’s assessment of risks to help avoid any of our business segments taking undesired risks.
|
|
|
iii.
|
provide flexibility to our business segments to timely and efficiently establish risk positions responsive to market changes and our business strategies, and always within acceptable Santander Brasil risk levels.
|
|
|
iv.
|
allow the individuals and teams originating new business to take prudent risks that will help attain budgeted results.
|
|
|
v.
|
establish investment alternatives by limiting equity requirements.
|
|
|
vi.
|
define the range of products and underlying assets within which each unit of treasury can operate, taking into consideration our risk modeling and valuation systems and our liquidity tools. This will help to constrain all market risk within the business management and defined risk strategy.
|
Global market risk management policies define our risk limit structure while the risk committee reviews and approves such policies. Business managers administer their activities within these limits. The risk limit structure covers both our trading and non-trading portfolios and includes limits on fixed income instruments, equity securities, foreign exchange and derivative instruments.
Limits considered to be global limits refer to the business unit level. To date, system restrictions prevent intra-day limits. Our business units must comply with approved limits. Potential excesses require a range of actions carried out by the global market risk function unit including (1) providing risk-reducing suggestions and controls, which are the result of breaking “alarm” limits and (2) taking executive actions that require risk takers to close out positions to reduce risk levels.
The market risk limits used by us are established along different metrics intended to cover all activity subject to market risk from many perspectives, applying criteria we believe to be conservative. The principal limits include:
Trading limits
|
|
i.
|
VaR limits;
|
|
|
ii.
|
Limits of equivalent positions and/or nominal;
|
|
|
iii.
|
Sensitivity limits to interest rates;
|
|
|
iv.
|
Vega limits;
|
|
|
v.
|
Risk limits of delivery by short positions in securities (fixed income and equities); and
|
|
|
vi.
|
Limits aimed at reducing the volume of effective losses or protecting results already generated during the period:
|
|
|
·
|
Loss trigger; and
|
|
|
·
|
Stop loss.
|
Structural limits
|
|
i.
|
Structural interest rate risk of the balance sheet:
|
|
|
·
|
Sensitivity limit of net interest margin over a one year horizon; and
|
|
|
·
|
Sensitivity limit of market value of equity.
|
|
|
ii.
|
Structural exchange rate risk comprised of the net position in each currency.
|
|
|
iii.
|
Liquidity Risk: limits defined based on several stress scenarios
|
Market Risk Statistical Tools
Locally, we use a variety of mathematical and statistical models, including VaR models, historical simulations and stress testing to measure, monitor, report and manage market risk. Such numbers, produced locally, also serve as input for global activities such as evaluations of RORAC, and to allocate economic capital to various activities in order to evaluate the RORAC of such activities.
Trading Activity
|
|
·
|
VaR: as calculated by us, our internal VaR model is an estimate of the expected maximum loss in the market value of a given portfolio over a one-day time horizon at a 99% confidence level, subject to certain assumptions and limitations discussed below. Our standard methodology is based on historical simulation of 520 days and is calculated using the VaR methodology “full revaluation.” In order to capture recent market volatility in the model, the reported VaR is the higher between two different VaR figures, both of which use a historical window of 520 days. One VaR figure applies an exponential declining factor to give a higher weight for the most recent observations and the other VaR figure gives the same weight to all observed values. This methodology makes our VaR numbers react very quickly to changes in current volatility, significantly reducing the likelihood of back testing exceptions. We use VaR estimates to alert senior management whenever the statistically estimated losses in our portfolios exceed prudent levels.
|
Assumptions and limitations
: our VaR methodology should be interpreted in light of the limitations that (1) a one-day time horizon may not fully capture the market risk of positions that cannot be liquidated or hedged within one day and (2) at present, we compute VaR at the close of business and trading positions may change substantially during the course of the trading day.
Calibration measures
: in order to calibrate our VaR model, we use back testing, which is a comparative analysis between VaR estimates and the daily clean Profit and Loss (theoretical result generated assuming the mark-to-market daily variation of the portfolio considering only the movement of the market variables). The purpose of these tests is to verify and measure the precision of the models used to calculate VaR.
|
|
·
|
Stressed VaR: our stressed VaR model uses the same calculation methodology as VaR with the following two exceptions: (1) the stressed VaR uses a window of 250 days, instead of 520 days for the VaR; (2) unlike when calculating the VaR the higher between the percentile uniformly weighted and the one exponentially weighted is not applied. Instead, only the uniformly weighted percentile is used. All the other aspects regarding the methodology and the inputs for calculating the stressed VaR are the same as those for the VaR. To determine the period of observation the methodology area has analyzed the history of the main market risk factors, which were chosen on the basis of expert criteria, and taking into account the most significant positions of our portfolio.
|
|
|
·
|
Stress Test: this is a simulation technique, which consists of estimating the potential impact on results by applying different stress scenarios to all the trading portfolios and considering the same assumptions according to the relevant risk factor. These scenarios can replicate events that happened in the past (such as crisis events) or hypothetical scenarios that do not correspond to past events. These results are analyzed at least monthly and, along with the VaR provide a fuller spectrum of the risk profile.
|
|
|
·
|
Sensitivities: our market risk sensitivity measures are those that gauge the change (or sensitivity) of the market value of an instrument or portfolio to changes in each of the risk factors. The sensitivity of the value
|
|
|
|
of an instrument to changes in market factors can be obtained through analytical approximations by partial derivatives or through a full revaluation of the portfolio.
|
Non-trading Activities
|
|
·
|
Interest rate gap of assets and liabilities: interest rate gap analysis focuses on lags or mismatches between changes in the value of asset, liability and off-balance sheet items. Gap analysis provides a basic representation of the balance sheet structure and allows for the detection of interest rate risk by concentration of maturities. It is also a useful tool for estimating the impact of eventual interest rate movements on net interest margin or equity. All on- and off-balance sheet items must be broken down by their flows and analyzed in terms of re-pricing and maturity. In the case of those items that do not have a contractual maturity, an internal model of analysis is used and estimates are made of their duration and sensitivity.
|
|
|
·
|
Net interest margin (“NIM”) sensitivity: The sensitivity of net interest margin measures the change in the short- and medium-term in the accruals expected over a 12-month horizon, in response to a shift in the yield curve. The yield curve is calculated by simulating the net interest margin, both for a scenario of a shift in the yield curve as well as for the current scenario. The sensitivity is the difference between the two margins calculated.
|
|
|
·
|
Market value of equity (“MVE”) sensitivity: Net worth sensitivity measures the interest risk implicit in net worth (equity) over the entire life of the operation on the basis of the effect that a change in interest rates has on the current values of financial assets and liabilities. This is an additional measure to the sensitivity of the net interest margin.
|
|
|
·
|
Value at risk: The VaR for balance sheet activity and investment portfolios is calculated with the same standard as for trading and historical simulation, with a confidence level of 99.0% and a time frame of one day.
|
|
|
·
|
Analysis of scenarios of stress test: We apply three scenarios for the performance of interest rates: six standard deviations up and six standard deviations down of risk factors and one abrupt scenario in which risk factors are increased by 50.0% up and down from current levels. These scenarios are applied to the balance sheet, obtaining the impact on net worth as well as the projections of net interest revenue for the year.
|
|
|
·
|
Liquidity risk: Liquidity risk is associated with our capacity to finance our commitments at reasonable market prices, as well as to carry out our business plans with stable sources of funding. We permanently monitor maximum gap profiles. The measures used to control liquidity risk are the liquidity gap, stress scenarios and contingency plans.
|
|
|
·
|
Liquidity gap: The liquidity gap provides information on contractual and expected cash inflows and outflows for a certain period of time, for each of the currencies in which we operate. The gap measures the net need or excess of funds at a particular date and reflects the level of liquidity maintained under normal market conditions.
|
|
|
·
|
Analysis of scenarios/contingency plan: The contingency plan includes the local and external activities and consists of a formal set of preventive and corrective actions taken in times of liquidity crises. Using analysis of historical scenarios and simulations of impacts on bank liquidity we define action plans and contingencies to establish roles and responsibilities and levels to trigger the contingency plan. Each unit should prepare its contingency plan. Additionally, Santander Spain must be periodically informed about the contingency plan of each subsidiary. The document can be updated more or less frequently depending on the market liquidity conditions.
|
Quantitative Analysis
Trading Activity
Quantitative analysis of daily VaR in 2013
Our risk performance with regard to trading activity in financial markets during 2013, measured by daily VaR (measured at a 99% of confidence level, over a one day time frame), is shown in the following graph.
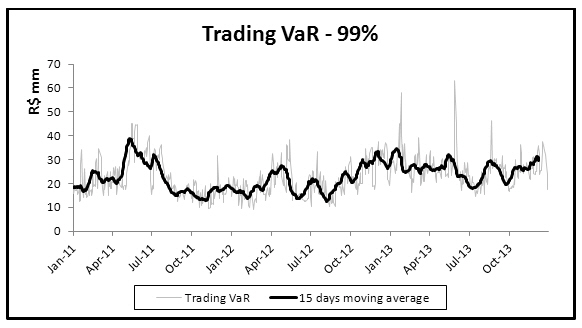
During 2013, VaR fluctuated between R$14.7 million and R$63.1 million, its highest rate in recent years. In comparison, in 2012, VaR fluctuated between R$9.0 million and R$38.0 million. VaR remained relatively stable over most of 2013, with peaks at the end of January and May, due to occasional large moves in market risk factors together with higher levels of exposure to foreign exchange rate and interest rate risks. As of December 31, 2013, fluctuations in VaR were mainly driven by interest rate and foreign currency positions, with low level of equity exposure.
The histogram below shows the distribution of average risk in terms of VaR between 2011 and 2013 where the accumulation of days with VaR levels between R$16 million and R$36 million can be observed in 92% of the distribution.
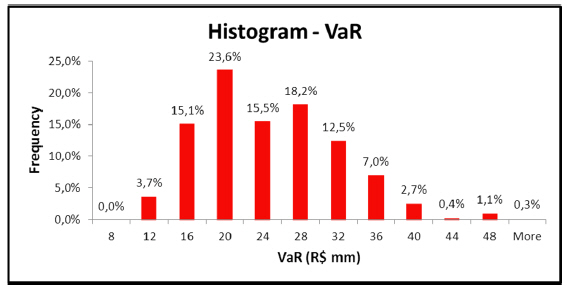
VaR by Risk Factor
The minimum, maximum, average and year-end 2013 VaR values by risk factor were as follows:
|
in Millions of R$
|
2013
|
|||||||||||||||||||
|
Dec-12
|
Low
|
Average
|
High
|
Dec-13
|
||||||||||||||||
|
Trading VaR
|
18.90 | 14.67 | 26.07 | 63.13 | 17.41 | |||||||||||||||
|
Diversification Effect
|
(8.50 | ) | (1.68 | ) | (13.03 | ) | (52.37 | ) | (23.36 | ) | ||||||||||
|
Interest Rate VaR
|
20.38 | 12.89 | 22.23 | 63.12 | 17.09 | |||||||||||||||
|
Equity VaR
|
3.29 | 1.50 | 7.05 | 14.57 | 8.05 | |||||||||||||||
|
Foreign Exchange VaR
|
3.72 | 1.96 | 9.83 | 37.80 | 15.63 | |||||||||||||||
In 2013, the average VaR for 2013 was R$26.1 million, with most of the risk due to interest rates, and with a high diversification effect, which amounted to around 50% of total average trading VaR. We were relatively conservative in equity trading activity, but very active in our foreign exchange trading desk, mainly trading in U.S. dollars versus
reais
, with directional strategies and in fixed income strategies.
The average VaR of the three main risk factors, interest rates, equity prices and exchange rates, were R$22.2 million, R$7.1 million and R$9.8 million, respectively, with a negative average diversification effect of R$13.0 million. The chart below shows the evolution of the risk groups VaR interest rates (IR), VaR exchange rates (FX) and VaR equity prices (EQ) (at a 99% confidence level, over a one day time frame and a 15 day moving average).
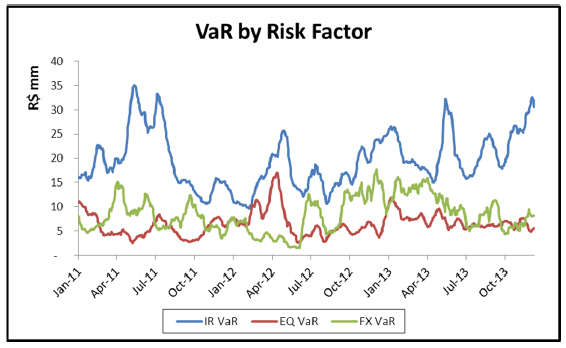
Risk management of structured derivatives
Our structured derivatives activity is mainly focused on designing investment products and managing hedging risks for clients. Our risk management is focused on ensuring that the net risk exposure is the lowest possible. These transactions include options on equities, currencies, fixed-income instruments and mostly market making books.
The chart below shows the VaR Vega performance of our structured derivatives business in 2011, 2012 and 2013, which fluctuated around an average of R$2.9 million. The periods with higher VaR levels related to episodes of significant increases in market volatility.
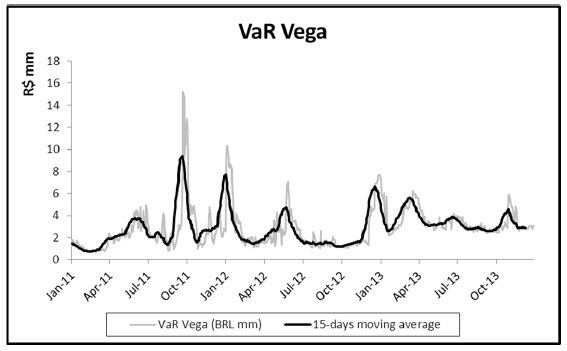
Scenario analysis
Different stress test scenarios were analyzed during 2013. A correlation break scenario generated the results presented below.
Worst Case Scenario
The table below shows the maximum daily losses for each risk factor (fixed-income, equities and currencies) as of December 31, 2013, in a scenario that uses historical volatilities and simulates variations of the risk factors for +/-3 and +/-6 standard deviations on a daily basis. From this group of scenarios, we generate a table of stress test results, which identifies the largest loss per risk factor. The sum of the largest losses of each risk factor is the result of the Worst Case Scenario, which considers the break of correlation between risk factors.
|
Worst Case Stress Test
|
Exchange Rate
|
Fixed Income
|
Equity
|
Total
|
||||||||||||
|
(in millions of R$)
|
||||||||||||||||
|
Total trading
|
(33.8 | ) | (53.6 | ) | (17.1 | ) | (104.5 | ) | ||||||||
The stress test shows that the economic loss suffered by the group in the marked-to-market result would be, if this scenario materialized in the market, R$104.5 million.
Non-trading Activity
Quantitative Analysis of Interest Rate Risk in 2013
Convertible Currencies
At the end of 2013, the sensitivity of net interest margin at one year, to a parallel rise of 100 basis points in the local yield curve was R$383 million.
In addition, at the end of 2013, the sensitivity of net worth to parallel rises of 100 basis points in the yield curves was R$1,402 million in the local currency yield curve.
Structural Gap
The following table shows the managerial gaps between the re-pricing dates of our assets and liabilities at December 31, 2013 in millions of
reais
.
|
Total
|
0-1
month
|
1-3
months
|
3-6
months
|
6-12 months
|
1-3
years
|
3-5
years
|
> 5 years
|
Not Sensitive
|
||||||||||||||||||||||||||||
|
Structural Gap
|
(in millions of R$)
|
|||||||||||||||||||||||||||||||||||
|
Money Market
|
171,652 | 82,184 | 5,598 | 2,193 | 13,468 | 30,770 | 21,938 | 14,180 | 1,320 | |||||||||||||||||||||||||||
|
Loans
|
210,808 | 47,521 | 20,058 | 26,813 | 33,761 | 45,295 | 10,795 | 12,200 | 14,366 | |||||||||||||||||||||||||||
|
Permanent
|
22,118 | — | — | — | — | — | — | — | 22,118 | |||||||||||||||||||||||||||
|
Other
|
107,159 | 54,378 | 30 | 5 | 4 | — | — | — | 52,741 | |||||||||||||||||||||||||||
|
Total Assets
|
511,737 | 184,083 | 25,687 | 29,011 | 47,233 | 76,065 | 32,733 | 26,380 | 90,546 | |||||||||||||||||||||||||||
|
Money Market
|
(156,532 | ) | (110,164 | ) | (1,830 | ) | (1,857 | ) | (4,816 | ) | (16,826 | ) | (10,414 | ) | (10,625 | ) | — | |||||||||||||||||||
|
Deposits
|
(174,152 | ) | (111,820 | ) | (311 | ) | (154 | ) | (43,692 | ) | (16,971 | ) | (807 | ) | (265 | ) | (132 | ) | ||||||||||||||||||
|
Equity and Other
|
(181,054 | ) | (53,797 | ) | (7,852 | ) | (3,199 | ) | (3,332 | ) | (109 | ) | — | — | (112,764 | ) | ||||||||||||||||||||
|
Total Liabilities
|
(511,737 | ) | (275,781 | ) | (9,993 | ) | (5,210 | ) | (51,840 | ) | (33,906 | ) | (11,221 | ) | (10,889 | ) | (112,897 | ) | ||||||||||||||||||
|
Balance Gap
|
— | (91,698 | ) | 15,694 | 23,802 | (4,608 | ) | 42,159 | 21,512 | 15,490 | (22,351 | ) | ||||||||||||||||||||||||
|
Off-Balance Gap
|
— | 35,570 | (18,472 | ) | (5,441 | ) | 8,999 | (22,143 | ) | 974 | 513 | — | ||||||||||||||||||||||||
|
Total Structural Gap
|
— | (56,128 | ) | (2,778 | ) | 18,360 | 4,391 | 20,015 | 22,487 | 16,003 | (22,351 | ) | ||||||||||||||||||||||||
|
Accumulated Gap
|
— | (56,128 | ) | (58,906 | ) | (40,545 | ) | (36,154 | ) | (16,139 | ) | 6,348 | 22,351 | — | ||||||||||||||||||||||
The interest rate risk of our balance sheet management portfolios, measured by the sensitivity of the net margin to a parallel movement of 100 basis points, increased R$111 million during 2013, reaching a maximum of R$472 million in March. The sensitivity of the market value decreased R$131 million during 2013, reaching a maximum of R$1,802 million in April. The main factors in 2013 that influenced sensitivity were the purchases and sales of government bonds in the non-trading book.
The following chart shows our NIM and MVE sensitivity during each month in 2013.
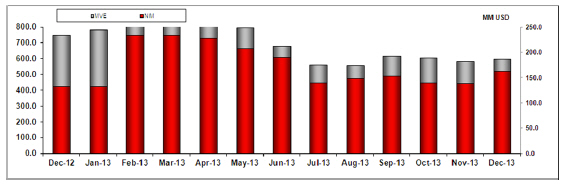
Interest Rate Risk Profile at December 31, 2013
The currency gap tables below show the managerial distribution of risk by maturity and currency in Brazil as of December 31, 2013 in millions of
reais
.
|
Total
|
0-1
month
|
1-3
months
|
3-6
months
|
6-12 months
|
1-3
years
|
3-5
years
|
> 5 years
|
Not Sensitive
|
||||||||||||||||||||||||||||
|
Gaps in local currency
|
||||||||||||||||||||||||||||||||||||
|
Money Market
|
137,156 | 66,854 | 5,365 | 2,131 | 11,382 | 26,284 | 18,316 | 5,929 | 895 | |||||||||||||||||||||||||||
|
Loans
|
184,736 | 44,370 | 16,723 | 18,297 | 24,767 | 44,016 | 9,989 | 12,004 | 14,571 | |||||||||||||||||||||||||||
|
Permanent
|
21,935 | — | — | — | — | — | — | — | 21,935 | |||||||||||||||||||||||||||
|
Others
|
63,095 | 11,418 | — | — | — | — | — | — | 51,677 | |||||||||||||||||||||||||||
|
Total Assets
|
406,922 | 122,641 | 22,088 | 20,428 | 36,149 | 70,300 | 28,305 | 17,933 | 89,078 | |||||||||||||||||||||||||||
|
Money Market
|
(122,433 | ) | (106,592 | ) | (659 | ) | (1,228 | ) | (1,750 | ) | (6,052 | ) | (3,283 | ) | (2,868 | ) | — | |||||||||||||||||||
|
Deposits
|
(172,418 | ) | (110,640 | ) | (309 | ) | (150 | ) | (43,690 | ) | (16,502 | ) | (761 | ) | (236 | ) | (132 | ) | ||||||||||||||||||
|
Equity and Other
|
(114,649 | ) | (4,685 | ) | — | — | — | — | — | — | (109,964 | ) | ||||||||||||||||||||||||
|
Total Liabilities
|
(409,500 | ) | (221,917 | ) | (968 | ) | (1,378 | ) | (45,440 | ) | (22,554 | ) | (4,044 | ) | (3,104 | ) | (110,097 | ) | ||||||||||||||||||
|
Off-Balance Gap
|
1,675 | 39,078 | (1,464 | ) | (10,114 | ) | (13,264 | ) | (13,924 | ) | 672 | 691 | — | |||||||||||||||||||||||
|
Gap
|
(903 | ) | (60,198 | ) | 19,656 | 8,937 | (22,555 | ) | 33,822 | 24,933 | 15,521 | (21,018 | ) | |||||||||||||||||||||||
|
Total
|
0-1
month
|
1-3
months
|
3-6
months
|
6-12 months
|
1-3
years
|
3-5
years
|
> 5 years
|
Not Sensitive
|
||||||||||||||||||||||||||||
|
Gaps in foreign currency
|
||||||||||||||||||||||||||||||||||||
|
Money Market
|
34,496 | 15,331 | 233 | 62 | 2,086 | 4,486 | 3,622 | 8,251 | 425 | |||||||||||||||||||||||||||
|
Loans
|
26,073 | 3,151 | 3,336 | 8,516 | 8,993 | 1,279 | 806 | 196 | (205 | ) | ||||||||||||||||||||||||||
|
Permanent
|
183 | — | — | — | — | — | — | — | 183 | |||||||||||||||||||||||||||
|
Others
|
44,064 | 42,960 | 30 | 5 | 4 | — | — | — | 1,064 | |||||||||||||||||||||||||||
|
Total Assets
|
104,815 | 61,442 | 3,599 | 8,583 | 11,084 | 5,765 | 4,428 | 8,447 | 1,467 | |||||||||||||||||||||||||||
|
Money Market
|
(34,099 | ) | (3,572 | ) | (1,171 | ) | (629 | ) | (3,066 | ) | (10,774 | ) | (7,131 | ) | (7,756 | ) | — | |||||||||||||||||||
|
Deposits
|
(1,734 | ) | (1,180 | ) | (2 | ) | (4 | ) | (3 | ) | (469 | ) | (46 | ) | (29 | ) | — | |||||||||||||||||||
|
Equity and Other
|
(66,405 | ) | (49,112 | ) | (7,852 | ) | (3,199 | ) | (3,332 | ) | (109 | ) | — | — | (2,800 | ) | ||||||||||||||||||||
|
Total Liabilities
|
(102,237 | ) | (53,864 | ) | (9,026 | ) | (3,832 | ) | (6,400 | ) | (11,352 | ) | (7,177 | ) | (7,786 | ) | (2,800 | ) | ||||||||||||||||||
|
Off-Balance Gap
|
(1,675 | ) | (3,508 | ) | (17,008 | ) | 4,673 | 22,263 | (8,219 | ) | 303 | (178 | ) | — | ||||||||||||||||||||||
|
Gap
|
903 | 4,070 | (22,434 | ) | 9,424 | 26,946 | (13,806 | ) | (2,446 | ) | 483 | (1,333 | ) | |||||||||||||||||||||||
Market Risk: VaR Consolidated Analysis
Our total daily VaR as of December 31, 2013 and December 31, 2012, broken down by trading and structural (non-trading) portfolios, is set forth below. Our VaR data for trading and non-trading portfolios were summed and thus does not reflect the diversification effect.
|
2013
|
2012
|
|||||||||||||||||||
|
Low
|
Average
|
High
|
Period End
|
Period End
|
||||||||||||||||
|
(in millions of R$)
|
||||||||||||||||||||
|
Trading
|
14.7 | 26.1 | 63.1 | 17.4 | 18.9 | |||||||||||||||
|
Non-trading
|
300.8 | 421.7 | 539.4 | 539.4 | 295.5 | |||||||||||||||
|
Diversification effect
|
— | — | — | — | — | |||||||||||||||
|
Total
|
315.5 | 447.8 | 602.5 | 556.8 | 314.4 | |||||||||||||||
|
Note:
|
VaR figures for trading and non-trading portfolios were added, thus disregarding the diversification effect.
|
Our daily VaR estimates of interest rate risk, foreign exchange rate risk and equity price risk were as set forth below:
Interest Rate Risk
|
2013
|
2012
|
|||||||||||||||||||
|
Low
|
Average
|
High
|
Period End
|
Period End
|
||||||||||||||||
|
(in millions of R$)
|
||||||||||||||||||||
|
Interest rate risk
|
|
|
|
|
||||||||||||||||
|
Trading
|
12.9 | 22.2 | 63.1 | 17.1 | 20.4 | |||||||||||||||
|
Non-trading
|
300.8 | 421.7 | 539.4 | 539.4 | 295.5 | |||||||||||||||
|
Diversification effect
|
— | — | — | — | — | |||||||||||||||
|
Total
|
313.7 | 443.9 | 602.5 | 556.5 | 315.9 | |||||||||||||||
|
Note:
|
VaR figures for trading and non-trading portfolios were added, thus disregarding the diversification effect.
|
Foreign Exchange Rate Risk
|
2013
|
2012
|
|||||||||||||||||||
|
Low
|
Average
|
High
|
Period End
|
Period End
|
||||||||||||||||
|
(in millions of R$)
|
||||||||||||||||||||
|
Exchange rate risk
|
||||||||||||||||||||
|
Trading
|
2.0 | 9.8 | 37.8 | 15.6 | 3.7 | |||||||||||||||
|
Non–trading
|
N.A.
|
N.A.
|
N.A.
|
N.A.
|
N.A.
|
|||||||||||||||
|
Diversification effect
|
— | — | — | — | — | |||||||||||||||
|
Total
|
2.0 | 9.8 | 37.8 | 15.6 | 3.7 | |||||||||||||||
|
Note:
|
VaR figures for trading and non-trading portfolios were added, thus disregarding the diversification effect.
|
Equity Price Risk
|
2013
|
2012
|
|||||||||||||||||||
|
Low
|
Average
|
High
|
Period End
|
Period End
|
||||||||||||||||
|
(in millions of R$)
|
||||||||||||||||||||
|
Equity price risk
|
||||||||||||||||||||
|
Trading
|
1.5 | 7.0 | 14.6 | 8.0 | 3.3 | |||||||||||||||
|
Non–trading
|
N.A.
|
N.A.
|
N.A.
|
N.A.
|
N.A.
|
|||||||||||||||
|
Diversification effect
|
— | — | — | — | — | |||||||||||||||
|
Total
|
1.5 | 7.0 | 14.6 | 8.0 | 3.3 | |||||||||||||||
|
Note:
|
VaR figures for trading and non-trading portfolios were added, thus disregarding the diversification effect.
|
Our daily VaR estimates by activity were as set forth below:
|
2013
|
2012
|
|||||||||||||||||||
|
Low
|
Average
|
High
|
Period End
|
Period End
|
||||||||||||||||
|
(in millions of R$)
|
||||||||||||||||||||
|
Trading
|
||||||||||||||||||||
|
Interest rate risk
|
12.9 | 22.2 | 63.1 | 17.1 | 20.4 | |||||||||||||||
|
Exchange rate risk
|
2.0 | 9.8 | 37.8 | 15.6 | 3.7 | |||||||||||||||
|
Equity
|
1.5 | 7.0 | 14.6 | 8.0 | 3.3 | |||||||||||||||
|
Total
|
14.7 | 26.1 | 63.1 | 17.4 | 18.9 | |||||||||||||||
|
Non-trading interest rate
|
||||||||||||||||||||
|
Interest rate
|
300.8 | 421.7 | 539.4 | 539.4 | 295.5 | |||||||||||||||
|
Non-trading foreign exchange
|
||||||||||||||||||||
|
Exchange rate
|
N.A.
|
N.A.
|
N.A.
|
N.A.
|
N.A.
|
|||||||||||||||
|
Non-trading equity
|
||||||||||||||||||||
|
Equity
|
N.A.
|
N.A.
|
N.A.
|
N.A.
|
N.A.
|
|||||||||||||||
|
Total
|
300.8 | 421.7 | 539.4 | 539.4 | 295.5 | |||||||||||||||
|
Total (Trading + Non-Trading)
|
313.7 | 443.9 | 602.5 | 556.5 | 315.9 | |||||||||||||||
|
Interest rate
|
300.8 | 421.7 | 539.4 | 539.4 | 295.5 | |||||||||||||||
|
Exchange rate
|
2.0 | 9.8 | 37.8 | 15.6 | 3.7 | |||||||||||||||
|
Equity
|
1.5 | 7.0 | 14.6 | 8.0 | 3.3 | |||||||||||||||
|
Note:
|
VaR figures for trading and non-trading portfolios were added, thus disregarding the diversification effect.
|
Operational Risk
Operational risk losses can occur due to inadequate processes, people and systems failures or even from external events like natural disasters, terrorism, robbery and vandalism.
To accomplish our operational risk objectives, we have adopted the following organizational structure, which is part of our corporate governance framework:
|
|
·
|
Executive Operation Committee: a senior committee, independent and with decision-making autonomy, responsible for defining our strategies and guidelines for the management and control of operational, technological and business continuity risks;
|
|
|
·
|
Operational Risk Unit: responsible for implementing and disseminating the culture, defining methodologies, standards, policies, tools, training and procedures applicable to and required for the effective and efficient management and control of the operational risk; and
|
|
|
·
|
Operational and Technological Risks Department: responsible for implementing the soundness of operational and technological risk management practices throughout the organization in addition to ensuring business continuity management for contingencies. The area assists managerial staff in meeting their strategic objectives by strengthening the decision-making process and optimizing execution of daily activities. The Department contributes to preventing and reducing operational risk losses, providing the best practices for operational risk management as well as ensuring that we are in compliance with regulatory requirements.
|
In 2013, we continued striving to upgrade the safety of our electronic transaction channels (ATM, Internet Banking and Customer Service). We strengthened the authenticity validation devices for transactions performed, resulting in a reduction of effective losses and customer complaints.
Another important step of operational risk objectives was the improvement of our business continuity management within our disaster recovery plan for scenarios of technological disruption, which has allowed us to continue improving our response to technological disruption events.
Objectives
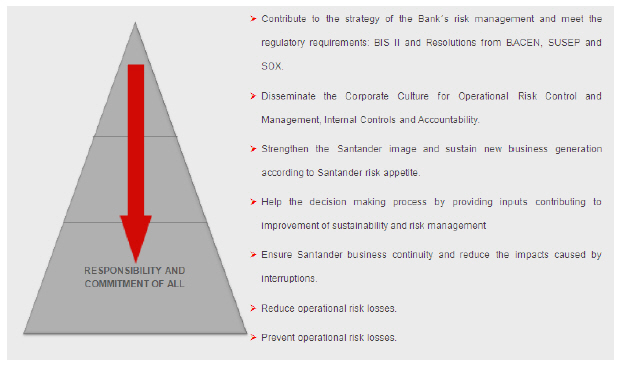
Environmental and Social Risk
We have an environmental and social risk management system for analyzing clients in the Global Wholesale Banking segment. Under this system, clients with credit limits and/or risk greater than R$1.0 million are screened for environmental and social concerns, such as contaminated land, illegal deforestation, labor violations and other major environmental and social issues for which there are potential legal penalties. In 2013, we screened approximately 2,066 wholesale corporate customers, including about 25 major new projects, for these types of risks. A specialized team with backgrounds in biology, health and safety engineering, chemistry engineering and geology monitors our customers’ environmental practices, and our financial analysts assess the damage that unfavorable environmental conditions may cause to our customers’ financial condition and collateral, among other effects. Furthermore, Global Wholesale Banking segment clients, when starting their commercial relationship with the Bank, are screened for environmental and social concerns by the new clients’ acceptance area. The social and environmental risk unit uses a software which optimizes, organizes and standardizes the analysis process, leading to more precise monitoring of clients. Our monitoring activity focuses on preserving our capital and our reputation in the market. We constantly train our credit and commercial areas about how to apply environmental and social risk standards in credit approval process for companies. The areas responsible for hiring any supplier must identify potential environmental risks and opportunities. Suppliers must comply with standards required by applicable environmental and labor legislation.
|
12A
.
|
Debt Securities
|
Not applicable.
|
12B
.
|
Warrants and Rights
|
Not applicable.
|
12C
.
|
Other Securities
|
Not applicable.
|
12D
.
|
American Depositary Shares
|
Fees and Expenses
The depositary may charge each person to whom ADSs are issued, including, without limitation, issuances against deposits of units, issuances in respect of unit distributions, rights and other distributions, issuances pursuant to a stock dividend or stock split declared by us or issuances pursuant to a merger, exchange of securities or any other transaction or event affecting the ADSs or deposited securities, and each person surrendering ADSs for withdrawal of deposited securities in any manner permitted by the deposit agreement or whose ADRs are cancelled or reduced for any other reason, U.S.$13.94 for each 100 ADSs (or any portion thereof) issued, delivered, reduced, cancelled or surrendered, as the case may be. The depositary may sell (by public or private sale) sufficient securities and property received in respect of a unit distribution, rights and/or other distribution prior to such deposit to pay such charge.
The following additional charges shall be incurred by the ADR holders, by any party depositing or withdrawing units or by any party surrendering ADSs or to whom ADSs are issued (including, without limitation, issuance pursuant to a stock dividend or stock split declared by us or an exchange of stock regarding the ADRs or the deposited securities or a distribution of ADSs), whichever is applicable:
|
|
·
|
a fee of U.S.$1.50 per ADR for transfers of certificated or direct registration ADRs;
|
|
|
·
|
a fee of up to U.S.$0.05 per ADS for any cash distribution made pursuant to the deposit agreement;
|
|
|
·
|
a fee of U.S.$0.05 per ADS per calendar year (or portion thereof) for services performed by the depositary in administering our ADR program (which fee may be charged on a periodic basis during each calendar year and shall be assessed against holders of ADRs as of the record date or record dates set by the depositary during each calendar year and shall be payable in the manner described in the next succeeding provision);
|
|
|
·
|
any other charge payable by any of the depositary, any of the depositary’s agents, including, without limitation, the custodian, or the agents of the depositary’s agents in connection with the servicing of our units or other deposited securities (which charge shall be assessed against registered holders of our ADRs as of the record date or dates set by the depositary and shall be payable at the sole discretion of the depositary by billing such registered holders or by deducting such charge from one or more cash dividends or other cash distributions);
|
|
|
·
|
a fee for the distribution of securities (or the sale of securities in connection with a distribution), such fee being in an amount equal to the fee for the execution and delivery of ADSs that would have been charged as a result of the deposit of such securities (treating all such securities as if they were units) but which securities or the net cash proceeds from the sale thereof are instead distributed by the depositary to those holders entitled thereto;
|
|
|
·
|
stock transfer or other taxes and other governmental charges;
|
|
|
·
|
cable, telex and facsimile transmission and delivery charges incurred at the holder’s request;
|
|
|
·
|
transfer or registration fees for the registration of transfer of deposited securities on any applicable register in connection with the deposit or withdrawal of deposited securities;
|
|
|
·
|
expenses of the depositary in connection with the conversion of foreign currency into U.S. dollars; and
|
|
|
·
|
such fees and expenses as are incurred by the depositary (including, without limitation, expenses incurred in connection with compliance with foreign exchange control regulations or any law or regulation relating to foreign investment) in delivery of deposited securities or otherwise in connection with the depositary’s or its custodian’s compliance with applicable laws, rules or regulations.
|
We will pay all other charges and expenses of the depositary and any agent of the depositary (except the custodian) pursuant to agreements from time to time between us and the depositary. The fees described above may be amended from time to time.
Direct and Indirect Payments
JP Morgan Chase Bank, N.A., or JP Morgan, as depositary, has agreed to reimburse certain of our reasonable expenses related to our ADR program and incurred by us in connection with the program. Under certain circumstances, including termination of the program, we are required to repay to J.P. Morgan amounts reimbursed in prior periods.
The reimbursements include direct payments (legal and accounting fees incurred in connection with preparation of Form 20-F and ongoing SEC compliance and listing requirements, listing fees, investor relations expenses, advertising and public relations expenses and fees payable to Broadridge and other service providers for the distribution of hard copy materials to beneficial ADR holders in the Depositary Trust Company, such as information related to shareholders’ meetings and related voting instruction cards) and indirect payments (third-party expenses paid directly and fees waived).
For the year ended December 31, 2013, we received approximately U.S.$4.3 million as reimbursement from J.P. Morgan.
No matters to report.
No matters to report.
|
15A
.
|
Disclosure Controls and Procedures
|
As of December 31, 2013, under the supervision and with the participation of our management, including our chief executive officer, chief financial officer and chief accounting officer, performed an evaluation of the effectiveness of the design and operation of our disclosure controls and procedures (as defined in Rule 13a-15(e) under the Exchange Act). There are, as described below, inherent limitations to the effectiveness of any control system, including disclosure controls and procedures. Accordingly, even effective disclosure controls and procedures can provide only reasonable assurance of achieving their control objectives.
Based on such evaluation, our chief executive officer, chief financial officer and chief accounting officer concluded that our disclosure controls and procedures are effective in ensuring that information we are required to disclose in the reports we file or submit under the Exchange Act is (1) recorded, processed, summarized and reported within the time periods specified in the SEC’s rules and forms and (2) accumulated and communicated our management, including our chief executive officer, chief financial officer and the chief accounting officer, as appropriate to allow timely decisions regarding required disclosures.
In addition to this and in accordance with the legal requirements (Resolutions 2,554/98 and 3,380/06 and circular 3,467/09), we produced and issued an internal report on March 15, 2014, according to the Brazilian Central Bank’s requirements regarding the effectiveness of the internal control environment.
|
15B
.
|
Management’s Annual Report on Internal Control over Financial Reporting
|
Our management is responsible for establishing and maintaining an adequate internal control over financial reporting as defined in Rule 13a-15(f) under the Exchange Act.
Our internal control over financial reporting is a process designed by, or under the supervision of, our principal executive and principal financial officers and effected by our board of directors, management and other personnel, to provide reasonable assurance regarding the reliability of financial reporting and the preparation of consolidated financial statements for external purposes, in accordance with generally accepted accounting principles. For us, generally accepted accounting principles refer to IFRS.
Our internal control over financial reporting includes those policies and procedures that:
|
|
·
|
pertain to the maintenance of records that in reasonable detail accurately and fairly reflect the transactions and dispositions of our assets;
|
|
|
·
|
provide reasonable assurance that transactions are recorded as necessary to permit preparation of consolidated financial statements in accordance with generally accepted accounting principles, and that our receipts and expenditures are being made only in accordance with authorizations of our management and officers; and
|
|
|
·
|
provide reasonable assurance of prevention or timely detection of unauthorized acquisition, use or disposition of our assets that could have a material effect on the consolidated financial statements.
|
Because of its inherent limitations, internal control over financial reporting may not prevent or detect misstatements. Also, projections of any evaluation of effectiveness to future periods are subject to the risk that controls may become inadequate because of changes in conditions, or that the degree of compliance with the policies or procedures may deteriorate.
We have adapted our internal control over financial reporting to the most rigorous international standards and comply with the guidelines set by the Committee of Sponsoring Organizations of the Treadway Commission (“COSO”) in its Enterprise Risk Management Integrated Framework. These guidelines have been extended and installed in our Group companies, applying a common methodology and standardizing the procedures for identifying processes, risks and controls, based on the Enterprise Risk Management Integrated Framework.
Risk Management Integrated Framework
The documentation process in our companies has been constantly directed and monitored by a global coordination team, which set the guidelines for its development and supervised its execution at the unit level.
The general framework is consistent, as it assigns to management specific responsibilities regarding the structure and effectiveness of the processes related directly and indirectly with the production of consolidated financial statements, as well as the controls needed to mitigate the risks inherent in these processes.
Under the supervision and with the participation of our management, including our chief executive officer, our chief financial officer and our chief accounting officer, we conducted an evaluation of the effectiveness of our internal control over financial reporting as of December 31, 2013, based on the framework set by COSO.
Based on this assessment, management believes that, as of December 31, 2013, its internal control over financial reporting was effective based on those criteria.
The Registered Public Accounting firm, Deloitte Touche Tohmatsu Auditores Independentes, has issued an audit report on the effectiveness of our internal control over financial reporting as of December 31, 2013. This report follows below.
|
15C
.
|
Audit Report of the Registered Public Accounting Firm
|
For the report of Deloitte Touche Tohmatsu Auditores Independentes, our Registered Public Accounting firm, dated April 28, 2014, on the effectiveness of our Internal Control over financial reporting as of December 31, 2013, see “Item 18. Financial Statements.”
|
15D
.
|
Changes in Internal Control over Financial Reporting
|
There was no change in our internal control over financial reporting that occurred during the period covered by this annual report that has materially affected, or is reasonably likely to materially affect, our internal control over financial reporting.
The board of directors has determined that one of the members of our audit committee, Mrs. Elidie Palma Bifano is an “Audit Committee Financial Expert” and meets the requirements set forth by the SEC and NYSE. She is, as are all other current members of the audit committee, deemed independent under applicable Brazilian law.
For more details about the audit committee see “Item 6. Directors, Senior Management and Employees—C. Board Practices—Board Advisory Committees—Audit Committee.”
The Code of Ethics (the “Code of Ethics”), the central element of the Governance Compliance, is applicable to the members of the board of directors and to all employees and trainees (“Persons Subject to the Code of Ethics”) of Santander Brasil and its subsidiaries. It defines the principles that should guide both the personal and professional behavior of the Persons Subject to the Code of Ethics. They must know the Code of Ethics and seek to broaden it, by
championing and striving for its enforcement. To that effect, Persons Subject to the Code of Ethics have the obligation to attend and participate in all training activities to which they are summoned in order to become appropriately acquainted with the Code of Ethics. The Persons Subject to the behavior of the Code of Ethics should be guided by ethical principles and rules of conduct that are consistent with the companies’ values.
The Code of Ethics helps us to establish respectful and transparent relationships and aims for the accomplishment of Santander Brasil’s obligations with its customers, employees, shareholders, partners, regulators and society as a whole. The Code of Ethics should also be a reference for the compliance with legal duties and for the maintenance of commercial relationships founded on trust with partners and clients.
The full version of the Code of Ethics is available on our website at www.santander.com.br/ri.
The balance of “Other general administrative expenses—Technical reports” includes the fees paid by the consolidated companies (detailed in the accompanying Appendix I of the consolidated financial statements included elsewhere in this annual report) to their respective auditors, Deloitte Touche Tohmatsu, as follows:
|
For the year ended
December 31,
|
||||||||
|
2013
|
2012
|
|||||||
|
(in millions of R$)
|
||||||||
|
Audit of the annual financial statements of the companies
audited by Deloitte (constant scope of consolidation)
|
15.3 | 11.1 | ||||||
The services commissioned from our auditors meet the independence requirements stipulated by the Brazilian Central Bank and CVM regulation and by the Sarbanes-Oxley Act of 2002, and they did not involve the performance of any work that is incompatible with the audit function.
If we are required to engage an auditing firm for audit and audit-related services, those services have to be pre-approved by the audit committee.
The audit committee is regularly informed of all fees paid to the auditing firms by us.
Under NYSE and SEC rules for listed companies, we must comply with Rule 10A-3 under the Securities Exchange Act (Listing Standards Relating to Audit Committees). Rule 10A-3 provides that we should establish an audit committee composed of members of the board of directors, meet the requirements specified in the listing standards, or appoint and establish a board of auditors or similar body to perform the role of the audit committee, in reliance on the general exemption of audit committees of foreign private issuers set forth in Rule 10A-3(c) (3) of the Securities Exchange Act.
In accordance with the rules of the Brazilian Central Bank, we constituted a body similar to the audit committee of the board of directors of an American company, which we refer to as our “audit committee.”
Our audit committee observes Brazilian legislation and performs all the functions of an audit committee under Rule 10A-3. As provided in Brazilian law, our board of directors and the audit committee are distinct statutory entities. Moreover, according to Brazilian law, the function of hiring independent auditors is a power reserved exclusively to the board of directors of the company. Our audit committee recommends as the case may be, engagement or replacement of independent auditors to the board of directors, and our board of directors acts as our audit committee for the purposes of nominating such independent auditors. Celso Clemente Giacometti is the only member of the board of directors who is also a member of the audit committee.
Except in these respects, the audit committee of Santander Brasil is comparable to an audit committee of the board and performs the same functions of an American company. Our audit committee is able to act independently in carrying out the responsibilities of an audit committee under the Sarbanes-Oxley Act, meets the exemption requirements of Rule 10A-3(c)(3) and therefore is in compliance with Rule 10A-3 of the Securities Exchange Act.
The following table reflects purchases of our equity securities, including in the form of ADSs, by us or our affiliates in 2013.
Banco Santander (Brasil) S.A. – Buyback Program Units
|
2013
|
Total Number of Units Purchased
|
Average Price Paid per Unit in U.S.$
|
Total Number of Units Purchased as Part of Publicly Announced Plans or Programs (1)
|
Maximum Number (or Approximate Dollar Value) of Units that May Yet Be Purchased Under the Plans or Programs
|
||||||||||||
|
January 1 to January 31
|
— | — | — | — | ||||||||||||
|
February 1 to February 28
|
827,400 | 14.278467 | 827,400 | — | ||||||||||||
|
March 1 to March 31
|
57,800 | 14.739654 | 57,800 | — | ||||||||||||
|
April 1 to April 30
|
10,000 | 14.050000 | 10,000 | — | ||||||||||||
|
May 1 to May 31
|
316,300 | 14.277954 | 316,300 | — | ||||||||||||
|
June 1 to June 30
|
300,500 | 13.692582 | 300,500 | — | ||||||||||||
|
July 1 to July 31
|
960,000 | 13.886327 | 960,000 | — | ||||||||||||
|
August 1 to August 31
|
1,909,400 | 13.775191 | 1,909,400 | — | ||||||||||||
|
September 1 to September 30
|
— | — | — | — | ||||||||||||
|
October 1 to October 31
|
— | — | — | — | ||||||||||||
|
November 1 to November 30
|
886,600 | 15.220045 | 886,600 | — | ||||||||||||
|
December 1 to December 31
|
— | — | — | — | ||||||||||||
|
Total
|
5,268,000 | — | 5,268,000 | — | ||||||||||||
|
(1)
|
The Buyback Program of Units or ADRs, as approved by our board of directors and publicly announced on July 29, 2013.
|
No changes.
In December 2012, primarily in response to the requirements of the European Banking Authority, Santander Spain, adopted a corporate governance framework (
Marco de Gobierno Interno del Grupo Santander
). The purpose of the framework is to organize and standardize the corporate governance practices of Santander Spain and its most significant subsidiaries, including us, in order to enhance the ability of Santander Spain to manage the risks arising from Santander group operations around the world.
The three pillars of the framework are (i) an organizational model based on functions subject to internal governance, (ii) terms of reference according to which Santander Spain exercises control and oversight over its subsidiaries and participates in specific decisions as their controlling shareholder, and (iii) corporate models establishing common guidelines for the management and control of Santander Spain’s subsidiaries, subject to local autonomy considerations. In general, the framework purports to implement organizational and procedural changes rather than mandating particular substantive outcomes.
By its own terms, the framework as a whole is premised on the legal and financial autonomy of the subsidiaries and does not empower Santander Spain to supplant its subsidiaries’ decision-making processes. Moreover, each of the three pillars of the framework is explicitly made subject to local legal requirements. We approved the adoption of this corporate governance framework in May 2013, subject to the precedence of applicable Brazilian laws and regulations and the limitations imposed thereby such as banking secrecy laws, as well as our corporate governance practices, including our policies for related party transactions and for disclosure of material acts and facts.
As a result of the precedence given to local legal requirements in the framework itself and in our adopting resolutions, we do not expect that the adoption of the corporate governance framework will affect our ability to comply with applicable corporate governance regulations, including SEC and NYSE rules applicable to foreign private issuers.
Pursuant to Section 303A.11 of the Listed Company Manual of the NYSE we are required to provide a summary of the significant ways in which our corporate governance practices differ from those required for United States resident companies under the NYSE listing standards. Section 303A of the NYSE Listed Company Manual sets forth certain corporate governance requirements that a company must satisfy to be listed on the NYSE. However, exemptions from many of the requirements are available to foreign private issuers such as us. As a foreign private issuer, we are permitted to, and we will, follow home country practice in lieu of the NYSE corporate governance standards from which we are exempt.
A discussion of the significant differences between Brazilian corporate governance standards that govern our practices and the NYSE standards applicable to U.S. companies follows below. It includes only a brief summary description of our corporate governance practices.
Principal Differences between Brazilian and U.S. Corporate Governance Practices
We are also subject to the NYSE corporate governance listing standards. As a foreign private issuer, the standards applicable to us are considerably different than the standards applied to U.S. listed companies. Under the NYSE rules, we are required only to: (1) have an audit committee or audit board, pursuant to an applicable exemption available to foreign private issuers, that meets certain requirements, as discussed below, (2) provide prompt certification by our chief executive officer of any material non-compliance with any applicable NYSE corporate governance rules (3) submit an executed written affirmation annually to the NYSE and submit an interim written affirmation each time a change occurs to the board or any of the committees subject to Section 303A of the NYSE rules, and (4) provide a brief description of the significant differences between our corporate governance practices and the NYSE corporate governance practice required to be followed by U.S. listed companies. The discussion of the significant differences between our corporate governance practices and those required of U.S. listed companies follows below, as required for foreign private issuers by NYSE Rule 303A.11
Majority of Independent Directors
The NYSE rules require that a majority of the board must consist of independent directors. As a company with a majority of our voting shares being beneficially owned by another entity (Santander Spain), we are not required to comply with this rule. Independence is defined by various criteria, including the absence of a material relationship between the director and the listed company. Under the listing standards of Level 2 of BM&FBOVESPA, our board of directors must have at least five members, at least 20.0% of which must be independent, as determined pursuant to Article 14 of our by-laws. Currently, four members of our board of directors are deemed independent, pursuant to the criterias of the listing standards of Level 2 of BM&FBOVESPA. Also, Brazilian Corporate Law, the Brazilian Central Bank and the CVM have established rules that require directors to meet certain qualification requirements and that address the compensation and duties and responsibilities of, as well as the restrictions applicable to, a company’s executive officers and directors. While we believe that these rules provide adequate assurances that our directors are independent and meet the requisite qualification requirements under Brazilian law, we believe such rules would permit us to have directors that would not otherwise pass the test for director independence established by the NYSE. Brazilian Corporate Law requires that our directors be elected by our shareholders at an annual shareholders’ meeting. Currently, all of our directors are elected by our shareholders after recommendation of the Compensation and Nomination Committee.
Executive Sessions
NYSE rules require that the non-management directors must meet at regularly scheduled executive sessions without management present. Brazilian Corporate Law does not have a similar provision. According to Brazilian Corporate Law, up to one-third of the members of the board of directors can be elected from management. Our president, Mr. Jesus Maria Zabalza Lotina, and the Senior Vice president Executive Officers, Mr. José de Paiva Ferreira and Conrado Engel are members of our board of directors. There is no requirement that our non-management directors meet regularly without management. As a result, the non-management directors on our board do not typically meet in executive session.
Committees
NYSE rules require that listed companies have a nominating/corporate governance committee and a remuneration committee composed entirely of independent directors and governed by a written charter addressing the committee’s required purpose and detailing its required responsibilities. As a company whose majority of voting shares is held by another group, we are not required to comply with this rule. The responsibilities of the nominating/corporate governance committee include, among other things, identifying and selecting qualified board member nominees and developing a set of corporate governance principles applicable to the company. The responsibilities of the remuneration committee, in turn, include, among other things, reviewing corporate goals relevant to the chief executive officer’s compensation, evaluating the chief executive officer’s performance, approving the chief executive officer’s compensation levels and recommending to the board non-chief executive officer compensation, incentive-compensation and equity-based plans.
CMN rules require us to have a compensation committee of at least three members. We have created the compensation and nomination committee, whose function is to advise our board of directors on matters in connection with (i) election of members for our board of directors, audit committee, and executive office, (ii) the succession plan, (iii) fixed and variable remuneration policies and benefits and (iv) the long-term incentive plan.
See “Item 6. Directors, Senior Management and Employees—C. Board Practices.”
Pursuant to Brazilian Corporate Law the aggregate compensation for our directors and executive officers is established by our shareholders.
Audit Committee and Audit Committee Additional Requirements
NYSE rules require that listed companies have an audit committee that (1) is composed of a minimum of three independent directors who are all financially literate, (2) meets the SEC rules regarding audit committees for listed companies, (3) has at least one member who has accounting or financial management expertise and (4) is governed by a written charter addressing the committee’s required purpose and detailing its required responsibilities.
CMN rules require us to have an audit committee of at least three independent members. The audit committee is elected by the board of directors. SEC Rule 10A-3 provides that the listing of securities of foreign private issuers will be exempt from the audit committee requirements if the issuer meets certain requirements. Our audit committee allows us to meet the requirements set forth by this rule. See “Item 16D. Exemptions from the Listing Standards for Audit Committees.”
Shareholder Approval of Equity Compensation Plans
NYSE rules require that shareholders be given the opportunity to vote on all equity compensation plans and material revisions thereto, with limited exceptions. Under Brazilian Corporate Law, shareholders must approve all stock option plans. In addition, any issuance of new shares that exceeds our authorized share capital is subject to shareholder approval. Our shareholders do not have the opportunity to vote on all equity compensation plans.
Corporate Governance Guidelines
NYSE rules require that listed companies adopt and disclose corporate governance guidelines. We comply with the corporate governance guidelines under applicable Brazilian law. The corporate governance guidelines applicable to us under Brazilian law are consistent with the guidelines established by the NYSE.
Pursuant to best practices of corporate governance guidelines, on September 22, 2010, our board of directors approved a policy that regulates related-party transactions, which was revised on September 26, 2012. This policy provides rules which aim to ensure that all decisions, in particular those involving related parties and other situations with potential conflict of interests will be aligned with our interests and those of our shareholders. The policy applies to all employees and directors and executive officers of Santander Brasil.
Code of Business Conduct and Ethics
NYSE rules require that listed companies adopt and disclose a code of business conduct and ethics for directors, officers and employees, and promptly disclose any waivers of the code for directors or executive officers.
Applicable Brazilian law does not have a similar requirement. We adopted a Code of Ethics on February 27, 2009, last revised on May 28, 2013, which regulates the conduct of our managers, officers and directors in connection with the disclosure and control of financial and accounting information and their access to privileged and non-public information. Our Code of Ethics complies with the requirements of the Sarbanes-Oxley Act and the NYSE rules.
Internal Audit Function
NYSE rules require that listed companies maintain an internal audit function to provide management and the audit committee with ongoing assessments of the company’s risk management processes and system of internal control.
Our internal audit department works independently to conduct methodologically structured examinations, analysis, surveys and fact finding to evaluate the integrity, adequacy, effectiveness, efficiency and economy of the information systems processes and internal controls related to our risk management. The internal audit department reports on an on-going basis to the audit committee. In carrying out its duties, the internal audit department has access to all documents, records, systems, locations and professionals involved with the activities under review.
Website
Our corporate governance codes are available to the public on our website in Portuguese and English, which do not form part of this annual report, at www.santander.com.br under the heading “Investor Relations—Corporate Governance.”
Not applicable.
We have responded to Item 18 in lieu of this item.
Consolidated Financial Statements are filed as part of this annual report, see pages F-1 to F-129.
(a) Index to Consolidated Financial Statements
(b) List of Exhibits.
|
Exhibit
Number
|
Description
|
||
|
1.1
|
English translation of By-laws of Santander Brasil, amended and restated on November 1, 2013.
|
||
|
2.1
|
Form of Deposit Agreement among Santander Brasil, JPMorgan Chase Bank, N.A., as depositary, and the holders from time to time of American depositary shares issued thereunder, including the form of American depositary receipts (incorporated by reference to our Registration Statement on Form F-6 (file no. 333-162027) filed with the SEC on September 21, 2009).
|
||
|
2.2
|
Amendment No. 1 to Deposit Agreement dated as of February 10, 2011 among Santander Brasil, JPMorgan Chase Bank, N.A., as depositary, and holders from time to time of American depositary receipts issued thereunder (incorporated by reference to Exhibit (a)(2) to our Registration Statement on Form F-6 (file no. 333-172167) filed with the SEC on February 11, 2011).
|
||
|
2.3
|
Subordinated Indenture dated as of January 29, 2014, among Santander Brasil and The Bank of New York Mellon, as trustee.
|
||
|
2.4
|
First Supplemental Indenture dated as of January 29, 2014, among Santander Brasil and The Bank of New York Mellon, as trustee, paying agent, transfer agent and registrar.
|
||
|
2.5
|
Second Supplemental Indenture dated as of January 29, 2014, among Santander Brasil and The Bank of New York Mellon, as trustee, paying agent, transfer agent and registrar.
|
||
|
4.1
|
Option Plan to Purchase Share deposit Certificate of Santander Brasil (incorporated by reference to Attachment I to our Form 6-K/A filed with the SEC on January 6, 2010).
|
||
|
4.2
|
Long Term Incentive Plan – Investment in Deposit Share Certificate (“Units”) of Santander Brasil (incorporated by reference to Exhibit III to our Form 6-K (file no. 001-34476) filed with the SEC on September 27, 2011).
|
||
|
4.3
|
Deferred Bonus Plans related to 2011 (incorporated by reference to Exhibit I to our Form 6-K (file no. 001-34476) filed with the SEC on January 9, 2012).
|
||
|
4.4
|
Deferred Bonus Plans related to 2012 (incorporated by reference to Exhibit I to our Form 6-K (file no. 001-34476) filed with the SEC on January 15, 2013).
|
||
|
4.5
|
Long Term Incentive Plan – Investment in Deposit Share Certificates (“Units”) of Santander Brasil (incorporated by reference to Exhibit V to our Form 6-K (file no. 001-34476) filed with the SEC on April 4, 2013).
|
||
|
8.1
|
List of Subsidiaries (incorporated by reference as Appendix I of our Consolidated Financial Statements filed with this Form 20-F).
|
||
|
11.1
|
English translation of the Code of Ethics of Santander Brasil.
|
||
|
12.1
|
Section 302 Certification by the principal executive officer.
|
||
|
12.2
|
Section 302 Certification by the principal financial officer.
|
||
|
13.1
|
Section 906 Certification by the chief executive officer.
|
||
|
13.2
|
Section 906 Certification by the chief financial officer.
|
||
|
15.1
|
Consent of Deloitte Touche Tohmatsu Auditores Independentes.
|
||
SIGNATURES
The registrant hereby certifies that it meets all of the requirements for filing on Form 20-F and that it has duly caused and authorized the undersigned to sign this annual report on its behalf.
|
BANCO SANTANDER (Brasil) S.A.
|
|||
| By: |
/s/ Jesús Maria Zabalza Lotina
|
||
| Name: |
Jesús Maria Zabalza Lotina
|
||
| Title: |
Chief Executive Officer
|
||
Date: April 30, 2014

To the Board of Directors and Shareholders of
Banco Santander (Brasil) S.A.
Sao Paulo - SP - Brazil
We have audited the accompanying consolidated
balance sheets
of
Banco Santander (Brasil) S.A.
and subsidiaries (“Bank”) as of December 31, 2013, 2012 and 2011,
and the related consolidated statements of income
, comprehensive income, changes in equity, and cash flows for each of the three years ended December 31, 2013, all expressed in Brazilian reais. These financial statements are the responsibility of the Bank's management. Our responsibility is to express an opinion on these financial statements based on
our audits.
We conducted our audits in accordance with the standards of the Public Company Accounting Oversight Board (United States) - PCAOB. Those standards require that we plan and perform the audit to obtain reasonable assurance about whether the consolidated financial statements are free of material misstatement. An audit includes examining, on a test basis, evidence supporting the amounts and disclosures in the consolidated financial statements. An audit also includes assessing the accounting principles used and significant estimates made by management, as well as evaluating the overall financial statement presentation. We believe that our audits provide a reasonable basis for our opinion.
In our opinion, such consolidated financial statements present fairly, in all material respects, the
financial position of
Banco Santander (Brasil) S.A.
and subsidiaries
at December 31, 2013, 2012 and 2011, and the results of their operations
and their cash flows for
each of the three years ended December 31, 2013
, in conformity with International Financial Reporting Standards – IFRS as issued by the International Accounting Standards Board - IASB
.
As discussed in note 1.b to the consolidated financial statements, the accompanying balance sheet as of December 31, 2012 and 2011, and the related statements of income, comprehensive income, changes in equity and cash flows for the two years ended December 31, 2012, have been retrospectively adjusted as a result of changes in accounting policies related to the adoption of International Accounting Standard - IAS 19 (R) - Employee Benefits.
Our audits were conducted for the purpose of forming an opinion on the basic financial statements taken as a whole. The supplementary information included in note 41.j) under the caption Statemhents of Value Added is presented for the purpose of additional analysis, whose presentation by publicly-held companies is required by Brazilian Corporate Law, and is not a required part of the basic financial statements
in conformity with International Financial Reporting Standards as issued by the International Accounting Standards Board.
This supplementary information is the responsibility of the Bank's management. Such information has been subjected to the auditing procedures applied in our audit of the basic financial statements and, in our opinion, is fairly stated in all material respects when considered in relation to the basic financial statements taken as a whole.

F-1
Deloitte Touche Tohmatsu
We have also audited, in accordance with the standards of the Public Company Accounting Oversight Board (United States) - PCAOB, the Bank’s internal control over financial reporting as of December 31, 2013, based on the criteria established in Internal Control - Integrated Framework (1992) issued by the Committee of Sponsoring Organizations of the Treadway Commission - COSO, and our report dated March 27, 2014 expressed an unqualified opinion on the Bank’s internal control over financial reporting.
/s/ Deloitte Touche Tohmatsu
Auditores Independentes
São Paulo, Brazil
March 27, 2014
REPORT OF INDEPENDENT REGISTERED PUBLIC ACCOUNTING FIRM
To the Board of Directors and Shareholders of
Banco Santander (Brasil) S.A.
Sao Paulo - SP - Brazil
We have audited the internal control over financial reporting of Banco Santander (Brasil) S.A. and subsidiaries (“Bank”) as of December 31, 2013, based on criteria established in Internal Control - Integrated Framework (1992) issued by the Committee of Sponsoring Organizations of the Treadway Commission - COSO. The Bank’s Management is responsible for maintaining effective internal control over financial reporting and for its assessment of the effectiveness of internal control over financial reporting included in the accompanying Management’s Report on Internal Controls over Financial Reporting. Our responsibility is to express an opinion on the Banks’s internal control over financial reporting based on our audit.
We conducted our audit in accordance with the standards of the Public Company Accounting Oversight Board (United States) - PCAOB. Those standards require that we plan and perform the audit to obtain reasonable assurance about whether effective internal control over financial reporting was maintained in all material respects. Our audit included: obtaining an understanding of internal control over financial reporting, assessing the risk that a material weakness exists, testing and evaluating the design and operating effectiveness of internal control based on the assessed risk, and performing such other procedures as we considered necessary in the circumstances. We believe that our audit provides a reasonable basis for our opinion.
A company’s internal control over financial reporting is a process designed by, or under the supervision of, the company’s principal executive and principal financial officers, or persons performing similar functions, and effected by the company’s board of directors, management, and other personnel to provide reasonable assurance regarding the reliability of financial reporting and the preparation of financial statements for external purposes in accordance with International Financial Reporting Standards - IFRS. A company’s internal control over financial reporting includes those policies and procedures that: (1) pertain to the maintenance of records that, in reasonable detail, accurately and fairly reflect the transactions and dispositions of the assets of the company; (2) provide reasonable assurance that transactions are recorded as necessary to permit preparation of financial statements in accordance with International Financial Reporting Standards - IFRS, and that receipts and expenditures of the company are being made only in accordance with authorizations of management and directors of the company; and (3) provide reasonable assurance regarding prevention or timely detection of unauthorized acquisition, use or disposition of the company’s assets that could have a material effect on the financial statements.
Deloitte Touche Tohmatsu
Because of the inherent limitations of internal control over financial reporting, including the possibility of collusion or improper management override of controls, material misstatements due to error or fraud may not be prevented or detected on a timely basis. Also, projections of any evaluation of the effectiveness of the internal control over financial reporting to future periods are subject to the risk that the controls may become inadequate because of changes in conditions, or that the degree of compliance with the policies or procedures may deteriorate.
In our opinion, the Bank maintained, in all material respects, effective internal control over financial reporting as of December 31, 2013, based on the criteria established in Internal Control - Integrated Framework (1992) issued by the Committee of Sponsoring Organizations of the Treadway Commission - COSO.
We have also audited, in accordance with the standards of the Public Company Accounting Oversight Board (United States) - PCAOB, the consolidated balance sheets as of December 31, 2013, 2012 and 2011, and related consolidated statements of income, comprehensive income, changes in total equity and cash flows for each of the three years in the period ended December 31, 2013 of
Banco Santander (Brasil) S.A.
and subsidiaries (“Bank”)
. Our
report dated March 27, 2014 expressed an unqualified opinion on those consolidated financial statements and included explanatory paragraphs related to the accompanying financial statements that have been retrospectively adjusted as a result of changes in accounting policies related to employee benefits.
/s/ Deloitte Touche Tohmatsu
Auditores Independentes
São Paulo, Brazil
March 27, 2014
|
BANCO SANTANDER (BRASIL) S.A.
|
||||||||
|
|
||||||||
|
(Thousands of Brazilian Reais - R$)
|
|
Assets
|
Note
|
2013
|
2012 - adjusted
|
2011 - adjusted
|
||||||||||||
|
Cash and Balances With The Brazilian Central Bank
|
4 | 51,714,210 | 55,535,240 | 65,938,003 | ||||||||||||
|
Financial Assets Held For Trading
|
30,218,787 | 31,638,269 | 29,901,495 | |||||||||||||
|
Debt instruments
|
6 | 22,840,499 | 26,646,708 | 25,298,804 | ||||||||||||
|
Equity instruments
|
7 | 477,577 | 428,589 | 448,209 | ||||||||||||
|
Trading derivatives
|
8 | 6,900,711 | 4,562,972 | 4,154,482 | ||||||||||||
|
|
||||||||||||||||
|
Other Financial Assets At Fair Value Through Profit Or Loss
|
1,298,296 | 1,228,318 | 665,369 | |||||||||||||
|
Loans and amounts due from credit institutions
|
5 | 112 | 5,065 | 60,813 | ||||||||||||
|
Debt instruments
|
6 | 105,850 | 124,187 | 230,037 | ||||||||||||
|
Equity instruments
|
7 | 1,192,334 | 1,099,066 | 374,519 | ||||||||||||
|
Available-For-Sale Financial Assets
|
46,287,082 | 44,148,620 | 44,608,201 | |||||||||||||
|
Debt instruments
|
6 | 44,957,272 | 43,044,570 | 43,300,354 | ||||||||||||
|
Equity instruments
|
7 | 1,329,810 | 1,104,050 | 1,307,847 | ||||||||||||
|
|
||||||||||||||||
|
Loans and Receivables
|
258,777,511 | 226,957,041 | 202,757,191 | |||||||||||||
|
Loans and amounts due from credit institutions
|
5 | 46,043,184 | 29,913,132 | 19,628,861 | ||||||||||||
|
Loans and advances to customers
|
9 | 212,734,327 | 196,774,297 | 183,066,268 | ||||||||||||
|
Debt instruments
|
6 | - | 269,612 | 62,062 | ||||||||||||
|
|
||||||||||||||||
|
Hedging Derivatives
|
8 | 322,817 | 156,163 | 80,708 | ||||||||||||
|
|
||||||||||||||||
|
Non-Current Assets Held For Sale
|
10 | 274,730 | 165,710 | 132,388 | ||||||||||||
|
|
||||||||||||||||
|
Investments in Associates and Joint Ventures
|
11 | 1,063,803 | 472,093 | 422,225 | ||||||||||||
|
Tax Assets
|
22 | 22,060,488 | 21,496,743 | 17,016,841 | ||||||||||||
|
Current
|
2,862,789 | 3,538,238 | 2,077,224 | |||||||||||||
|
Deferred
|
19,197,699 | 17,958,505 | 14,939,617 | |||||||||||||
|
|
||||||||||||||||
|
Other Assets
|
15 | 5,084,668 | 5,600,727 | 4,802,873 | ||||||||||||
|
|
||||||||||||||||
|
Tangible Assets
|
12 | 6,885,927 | 5,938,228 | 5,008,306 | ||||||||||||
|
|
||||||||||||||||
|
Intangible Assets
|
29,064,376 | 29,270,711 | 29,245,332 | |||||||||||||
|
Goodwill
|
13 | 27,217,565 | 27,217,565 | 27,217,565 | ||||||||||||
|
Other intangible assets
|
14 | 1,846,811 | 2,053,146 | 2,027,767 | ||||||||||||
|
|
||||||||||||||||
|
TOTAL ASSETS
|
453,052,695 | 422,607,863 | 400,578,932 | |||||||||||||
|
The accompanying Notes and Appendix I are an integral part of these consolidated financial statements.
|
||||||||||||||||
Consolidated Financial Statements - December 31, 2013
F-5
|
BANCO SANTANDER (BRASIL) S.A.
|
||||||||
|
CONSOLIDATED BALANCE SHEETS
|
||||||||
|
(Thousands of Brazilian Reais - R$)
|
|
Liabilities and Stockholders' Equity
|
Note
|
2013
|
2012 - adjusted
|
2011 - adjusted
|
||||||||||||
|
Financial Liabilities Held For Trading
|
13,554,306 | 5,351,736 | 5,047,288 | |||||||||||||
|
Trading derivatives
|
8 | 5,417,795 | 5,111,553 | 4,709,660 | ||||||||||||
|
Short positions
|
8,136,511 | 240,183 | 337,628 | |||||||||||||
|
|
||||||||||||||||
|
Financial Liabilities at Amortized Cost
|
329,700,620 | 306,976,206 | 291,451,686 | |||||||||||||
|
Deposits from Brazilian Central Bank and deposits from credit institutions
|
16 | 34,032,289 | 35,073,626 | 51,527,021 | ||||||||||||
|
Customer deposits
|
17 | 200,155,677 | 188,594,930 | 174,473,891 | ||||||||||||
|
Marketable debt securities
|
18 | 65,300,548 | 54,012,018 | 38,590,423 | ||||||||||||
|
Subordinated debts
|
19 | 8,906,144 | 11,919,151 | 10,908,344 | ||||||||||||
|
Other financial liabilities
|
20 | 21,305,962 | 17,376,481 | 15,952,007 | ||||||||||||
|
|
||||||||||||||||
|
Hedging Derivatives
|
8 | 628,983 | 281,545 | 36,071 | ||||||||||||
|
|
||||||||||||||||
|
Provisions
|
21 | 10,892,388 | 12,774,966 | 11,357,848 | ||||||||||||
|
Provisions for pensions funds and similar obligations
|
3,043,311 | 5,260,700 | 3,088,593 | |||||||||||||
|
Provisions for judicial and administrative proceedings, commitments and other provisions
|
7,849,077 | 7,514,266 | 8,269,255 | |||||||||||||
|
|
||||||||||||||||
|
Tax Liabilities
|
11,693,338 | 13,784,464 | 11,875,899 | |||||||||||||
|
Current
|
10,069,745 | 10,219,083 | 8,127,795 | |||||||||||||
|
Deferred
|
22 | 1,623,593 | 3,565,381 | 3,748,104 | ||||||||||||
|
|
||||||||||||||||
|
Other Liabilities
|
23 | 4,927,758 | 4,302,820 | 3,927,851 | ||||||||||||
|
|
||||||||||||||||
|
Total Liabilities
|
371,397,393 | 343,471,737 | 323,696,643 | |||||||||||||
|
|
||||||||||||||||
|
Stockholders' Equity
|
26 | 83,339,506 | 79,921,205 | 77,117,409 | ||||||||||||
|
Share capital
|
62,634,585 | 62,634,585 | 62,634,585 | |||||||||||||
|
Reserves
|
17,673,134 | 14,644,576 | 10,031,388 | |||||||||||||
|
Treasury shares
|
(291,707 | ) | (170,562 | ) | (112,768 | ) | ||||||||||
|
Profit for the year attributable to the Parent
|
5,723,494 | 5,482,606 | 7,739,204 | |||||||||||||
|
Less: dividends and remuneration
|
(2,400,000 | ) | (2,670,000 | ) | (3,175,000 | ) | ||||||||||
|
|
||||||||||||||||
|
Other Comprehensive Income
|
(1,973,305 | ) | (1,022,209 | ) | (254,080 | ) | ||||||||||
|
|
||||||||||||||||
|
Stockholders' Equity Attributable to the Parent
|
81,366,201 | 78,898,996 | 76,863,329 | |||||||||||||
|
Non - Controlling Interests
|
25 | 289,101 | 237,130 | 18,960 | ||||||||||||
|
|
||||||||||||||||
|
Total Stockholders' Equity
|
81,655,302 | 79,136,126 | 76,882,289 | |||||||||||||
|
Total Liabilities and Stockholders' Equity
|
453,052,695 | 422,607,863 | 400,578,932 | |||||||||||||
|
The accompanying Notes and Appendix I are an integral part of these consolidated financial statements.
|
||||||||||||||||
|
BANCO SANTANDER (BRASIL) S.A.
|
||||||||||||||||
|
CONSOLIDATED INCOME STATEMENTS
|
||||||||||||||||
|
(Thousands of Brazilian Reais - R$, except for per share data)
|
||||||||||||||||
|
Note
|
2013
|
2012 - adjusted
|
2011 - adjusted
|
|||||||||||||
|
Interest and similar income
|
29 | 51,217,046 | 52,643,537 | 51,716,177 | ||||||||||||
|
Interest expense and similar charges
|
30 | (22,737,825 | ) | (21,056,577 | ) | (23,920,100 | ) | |||||||||
|
Interest Net Income
|
28,479,221 | 31,586,960 | 27,796,077 | |||||||||||||
|
Income from equity instruments
|
31 | 81,286 | 93,734 | 93,611 | ||||||||||||
|
Income from companies accounted for by the equity method
|
11 | 91,342 | 73,322 | 54,216 | ||||||||||||
|
Fee and commission income
|
32 | 10,741,623 | 9,610,855 | 8,628,720 | ||||||||||||
|
Fee and commission expense
|
33 | (2,641,167 | ) | (2,000,929 | ) | (1,429,279 | ) | |||||||||
|
Gains (losses) on financial assets and liabilities (net)
|
34 | (1,145,887 | ) | (548,200 | ) | (133,907 | ) | |||||||||
|
Financial assets held for trading
|
(2,599,638 | ) | (1,456,070 | ) | (902,167 | ) | ||||||||||
|
Other financial instruments at fair value through profit or loss
|
44,000 | 238,208 | 57,039 | |||||||||||||
|
Financial instruments not measured at fair value through profit or loss
|
1,406,375 | 655,838 | 685,355 | |||||||||||||
|
Other
|
3,376 | 13,824 | 25,866 | |||||||||||||
|
Exchange differences (net)
|
35 | 551,059 | 378,033 | (121,364 | ) | |||||||||||
|
Other operating income (expense)
|
36 | (444,888 | ) | (623,493 | ) | (377,701 | ) | |||||||||
|
Total Income
|
35,712,589 | 38,570,282 | 34,510,373 | |||||||||||||
|
Administrative expenses
|
(13,850,360 | ) | (13,772,733 | ) | (12,782,784 | ) | ||||||||||
|
Personnel expenses
|
37 | (7,045,610 | ) | (7,086,356 | ) | (6,607,391 | ) | |||||||||
|
Other administrative expenses
|
38 | (6,804,750 | ) | (6,686,377 | ) | (6,175,393 | ) | |||||||||
|
Depreciation and amortization
|
(1,251,916 | ) | (1,200,875 | ) | (1,000,388 | ) | ||||||||||
|
Tangible assets
|
12 | (726,989 | ) | (724,990 | ) | (570,132 | ) | |||||||||
|
Intangible assets
|
14 | (524,927 | ) | (475,885 | ) | (430,256 | ) | |||||||||
|
Provisions (net)
|
21.b | (2,692,818 | ) | (2,056,606 | ) | (2,985,326 | ) | |||||||||
|
Impairment losses on financial assets (net)
|
(14,118,071 | ) | (16,475,596 | ) | (9,381,549 | ) | ||||||||||
|
Loans and receivables
|
9.c | (13,899,789 | ) | (16,475,596 | ) | (9,381,549 | ) | |||||||||
|
Other financial instruments not measured at fair value through profit or loss
|
7 | (218,282 | ) | - | - | |||||||||||
|
Impairment losses on other assets (net)
|
(344,580 | ) | (38,352 | ) | (38,605 | ) | ||||||||||
|
Other intangible assets
|
14 | (285,862 | ) | - | (9,043 | ) | ||||||||||
|
Other assets
|
(58,718 | ) | (38,352 | ) | (29,562 | ) | ||||||||||
|
Gains (losses) on disposal of assets not classified as non-current assets held for sale
|
39 | 459,890 | 501,006 | 5,320 | ||||||||||||
|
Gains (losses) on non-current assets held for sale not classified as discontinued operations
|
40 | 103,523 | (52,201 | ) | 446,776 | |||||||||||
|
Operating Profit Before Tax
|
4,018,257 | 5,474,925 | 8,773,817 | |||||||||||||
|
Income taxes
|
22 | (233,596 | ) | (37,014 | ) | (1,100,923 | ) | |||||||||
|
Net Profit from Continuing Operations
|
3,784,661 | 5,437,911 | 7,672,894 | |||||||||||||
|
Discontinued Operations
|
42 | 2,063,463 | 55,313 | 74,238 | ||||||||||||
|
Consolidated Profit for the Year
|
5,848,124 | 5,493,224 | 7,747,132 | |||||||||||||
|
Profit attributable to the Parent
|
5,723,494 | 5,482,606 | 7,739,204 | |||||||||||||
|
Profit attributable to non-controlling interests
|
25 | 124,630 | 10,618 | 7,928 | ||||||||||||
|
|
||||||||||||||||
|
Earnings Per Share (Brazilian Reais)
|
27 | |||||||||||||||
|
From continuing and discontinued operations
|
||||||||||||||||
|
Basic earnings per share
|
14.39 | 13.77 | 19.39 | |||||||||||||
|
Diluted earning per share
|
14.38 | 13.77 | 19.39 | |||||||||||||
|
From continuing operations
|
||||||||||||||||
|
Basic earnings per share
|
9.20 | 13.63 | 19.21 | |||||||||||||
|
Diluted earning per share
|
9.20 | 13.63 | 19.21 | |||||||||||||
|
The accompanying Notes and Appendix I are an integral part of these consolidated financial statements.
|
||||||||||||||||
|
BANCO SANTANDER (BRASIL) S.A.
|
||||||||||||
|
|
||||||||||||
|
(Thousands of Brazilian Reais - R$)
|
||||||||||||
|
2013
|
2012
|
2011
|
||||||||||
|
Consolidated Profit for the Year
|
5,848,124 | 5,493,224 | 7,747,132 | |||||||||
|
|
||||||||||||
|
Other Comprehensive Income Which May be Reclassified to net Income:
|
(2,143,157 | ) | 533,969 | 184,391 | ||||||||
|
Available-for-sale financial assets
|
(2,232,616 | ) | 800,471 | 10,602 | ||||||||
|
Valuation adjustments
|
(2,456,005 | ) | 1,976,989 | 807,371 | ||||||||
|
Amounts transferred to income statement
|
(1,406,375 | ) | (655,983 | ) | (705,279 | ) | ||||||
|
Income taxes
|
1,629,764 | (520,535 | ) | (91,490 | ) | |||||||
|
Cash flow hedges
|
89,459 | (266,502 | ) | 173,789 | ||||||||
|
Valuation adjustments
|
(53,682 | ) | (467,880 | ) | 15,149 | |||||||
|
Amounts transferred to income statement
|
289,318 | (163 | ) | 261,603 | ||||||||
|
Income taxes
|
(146,177 | ) | 201,541 | (102,963 | ) | |||||||
|
Net investment hedge
|
239,255 | (424,774 | ) | - | ||||||||
|
Net investment hedge
|
398,758 | (303,410 | ) | - | ||||||||
|
Income taxes
|
(159,503 | ) | (121,364 | ) | - | |||||||
|
Exchange on investments Abroad
|
(239,255 | ) | 424,774 | - | ||||||||
|
Exchange on investments Abroad
|
(398,758 | ) | 303,410 | - | ||||||||
|
Income taxes
|
159,503 | 121,364 | - | |||||||||
|
Other Comprehensive Income Which May not be Reclassified to net Income:
|
1,187,695 | (1,314,228 | ) | (728,858 | ) | |||||||
|
Defined benefits plan
|
1,187,695 | (1,314,228 | ) | (728,858 | ) | |||||||
|
Defined benefits plan
|
1,984,545 | (2,185,708 | ) | (1,214,763 | ) | |||||||
|
Income taxes
|
(796,850 | ) | 871,480 | 485,905 | ||||||||
|
Total Comprehensive Income
|
4,892,662 | 4,712,965 | 7,202,665 | |||||||||
|
|
||||||||||||
|
Attributable to the parent
|
4,772,398 | 4,714,477 | 7,194,737 | |||||||||
|
Attributable to non-controlling interests
|
120,264 | (1,512 | ) | 7,928 | ||||||||
|
Total
|
4,892,662 | 4,712,965 | 7,202,665 | |||||||||
|
The accompanying Notes and Appendix I are an integral part of these consolidated financial statements.
|
||||||||||||
|
BANCO SANTANDER (BRASIL) S.A.
|
||||||||||||||||||||||||||
|
CONSOLIDATED STATEMENT OF CHANGES IN TOTAL EQUITY
|
||||||||||||||||||||||||||
|
(Thousands of Brazilian Reais - R$)
|
|
Stockholders´ Equity Attributable to the Parent
|
||||||||||||||||||||||||||||||||||||||||||||||||||||||||
|
Other Comprehensive Income
|
||||||||||||||||||||||||||||||||||||||||||||||||||||||||
|
Note
|
Share
Capital
|
Reserves
|
Treasury
Shares
|
Profit
Attributed
to the Parent
|
Dividends and
Remuneration
|
Total
|
Available-for-sale Financial Assets
|
Defined Benefit Plans
|
Translation adjustments investment abroad
|
Gains and losses - Cash flow hedge and Investment
|
Total
|
Non-controlling
Interests
|
Total
Stockholders'
Equity
|
|||||||||||||||||||||||||||||||||||||||||||
|
Balances at December 31, 2010
|
62,634,585 | 6,094,885 | - | 7,382,093 | (3,540,000 | ) | 72,571,563 | 949,597 | - | - | (165,842 | ) | 73,355,318 | 8,076 | 73,363,394 | |||||||||||||||||||||||||||||||||||||||||
|
Employee Benefit Plans (Effects - Amendments to the IAS 19)
|
- | 56,238 | - | 25,006 | - | 81,244 | - | (493,368 | ) | - | - | (412,124 | ) | - | (412,124 | ) | ||||||||||||||||||||||||||||||||||||||||
|
Balances at January 1, 2011
|
62,634,585 | 6,151,123 | - | 7,407,099 | (3,540,000 | ) | 72,652,807 | 949,597 | (493,368 | ) | - | (165,842 | ) | 72,943,194 | 8,076 | 72,951,270 | ||||||||||||||||||||||||||||||||||||||||
|
Total comprehensive income
|
- | - | - | 7,739,204 | - | 7,739,204 | 10,602 | (728,858 | ) | - | 173,789 | 7,194,737 | 7,928 | 7,202,665 | ||||||||||||||||||||||||||||||||||||||||||
|
Appropriation of net profit for the year
|
- | 7,407,099 | - | (7,407,099 | ) | - | - | - | - | - | - | - | - | - | ||||||||||||||||||||||||||||||||||||||||||
|
Dividends and interest on capital
|
26. | b | - | (3,540,000 | ) | - | - | 365,000 | (3,175,000 | ) | - | - | - | - | (3,175,000 | ) | - | (3,175,000 | ) | |||||||||||||||||||||||||||||||||||||
|
Share based payment
|
26. | a | - | 13,153 | - | - | - | 13,153 | - | - | - | - | 13,153 | - | 13,153 | |||||||||||||||||||||||||||||||||||||||||
|
Treasury shares
|
37. | b | - | - | (112,768 | ) | - | - | (112,768 | ) | - | - | - | - | (112,768 | ) | - | (112,768 | ) | |||||||||||||||||||||||||||||||||||||
|
Results of treasury shares
|
- | 13 | - | - | - | 13 | - | - | - | - | 13 | - | 13 | |||||||||||||||||||||||||||||||||||||||||||
|
Other
|
- | - | - | - | - | - | - | - | - | - | - | 2,956 | 2,956 | |||||||||||||||||||||||||||||||||||||||||||
|
Balances at December 31, 2011 - adjusted
|
62,634,585 | 10,031,388 | (112,768 | ) | 7,739,204 | (3,175,000 | ) | 77,117,409 | 960,199 | (1,222,226 | ) | - | 7,947 | 76,863,329 | 18,960 | 76,882,289 | ||||||||||||||||||||||||||||||||||||||||
|
Total comprehensive income
|
- | - | - | 5,482,606 | - | 5,482,606 | 800,472 | (1,302,099 | ) | 182,046 | (448,548 | ) | 4,714,477 | (1,512 | ) | 4,712,965 | ||||||||||||||||||||||||||||||||||||||||
|
Appropriation of net profit for the year
|
- | 7,739,204 | - | (7,739,204 | ) | - | - | - | - | - | - | - | - | - | ||||||||||||||||||||||||||||||||||||||||||
|
Dividends and interest on capital
|
26. | b | - | (3,175,000 | ) | - | - | 505,000 | (2,670,000 | ) | - | - | - | - | (2,670,000 | ) | - | (2,670,000 | ) | |||||||||||||||||||||||||||||||||||||
|
Share based payments
|
37. | b | - | 49,611 | - | - | - | 49,611 | - | - | - | - | 49,611 | - | 49,611 | |||||||||||||||||||||||||||||||||||||||||
|
Treasury shares
|
26. | d | - | - | (57,794 | ) | - | - | (57,794 | ) | - | - | - | - | (57,794 | ) | - | (57,794 | ) | |||||||||||||||||||||||||||||||||||||
|
Results of treasury shares
|
26. | d | - | (41 | ) | - | - | - | (41 | ) | - | - | - | - | (41 | ) | - | (41 | ) | |||||||||||||||||||||||||||||||||||||
|
Other
|
- | (586 | ) | - | - | - | (586 | ) | - | - | - | - | (586 | ) | 219,682 | 219,096 | ||||||||||||||||||||||||||||||||||||||||
|
Balances at December 31, 2012 - adjusted
|
62,634,585 | 14,644,576 | (170,562 | ) | 5,482,606 | (2,670,000 | ) | 79,921,205 | 1,760,671 | (2,524,325 | ) | 182,046 | (440,601 | ) | 78,898,996 | 237,130 | 79,136,126 | |||||||||||||||||||||||||||||||||||||||
|
Total comprehensive income
|
- | - | - | 5,723,494 | - | 5,723,494 | (2,232,616 | ) | 1,367,351 | (239,255 | ) | 328,714 | 4,947,688 | 120,264 | 5,067,952 | |||||||||||||||||||||||||||||||||||||||||
|
Appropriation of net profit for the year
|
- | 5,482,606 | - | (5,482,606 | ) | - | - | - | - | - | - | - | - | - | ||||||||||||||||||||||||||||||||||||||||||
|
Dividends and interest on capital
|
26. | b | - | (2,670,000 | ) | - | - | 270,000 | (2,400,000 | ) | - | - | - | - | (2,400,000 | ) | - | (2,400,000 | ) | |||||||||||||||||||||||||||||||||||||
|
Share based payments
|
37. | b | - | 41,378 | - | - | - | 41,378 | - | - | - | - | 41,378 | - | 41,378 | |||||||||||||||||||||||||||||||||||||||||
|
Treasury shares
|
26. | d | - | - | (121,145 | ) | - | - | (121,145 | ) | - | - | - | - | (121,145 | ) | - | (121,145 | ) | |||||||||||||||||||||||||||||||||||||
|
Treasury shares income
|
26. | d | - | (716 | ) | - | - | - | (716 | ) | - | - | - | - | (716 | ) | - | (716 | ) | |||||||||||||||||||||||||||||||||||||
|
Other
|
- | 175,290 | - | - | - | 175,290 | - | (175,290 | ) | - | - | - | (68,293 | ) | (68,293 | ) | ||||||||||||||||||||||||||||||||||||||||
|
Balances at December 31, 2013
|
62,634,585 | 17,673,134 | (291,707 | ) | 5,723,494 | (2,400,000 | ) | 83,339,506 | (471,945 | ) | (1,332,264 | ) | (57,209 | ) | (111,887 | ) | 81,366,201 | 289,101 | 81,655,302 | |||||||||||||||||||||||||||||||||||||
The accompanying Notes and Appendix I are an integral part of these consolidated financial statements.
|
BANCO SANTANDER (BRASIL) S.A.
|
||||||||
|
CONSOLIDATED CASH FLOWS STATEMENTS
|
||||||||
|
(Thousands of Brazilian Reais - R$)
|
|
Note
|
2013
|
2012
|
2011
|
|||||||||||||
|
1. Cash Flows From Operating Activities
|
||||||||||||||||
|
Consolidated profit for the year
|
5,848,124 | 5,493,224 | 7,747,132 | |||||||||||||
|
Adjustments to profit
|
15,256,698 | 16,506,772 | 11,328,292 | |||||||||||||
|
Depreciation of tangible assets
|
12 | 726,989 | 724,990 | 570,132 | ||||||||||||
|
Amortization of intangible assets
|
14 | 524,927 | 475,885 | 430,256 | ||||||||||||
|
Impairment losses on other assets (net)
|
344,580 | 38,352 | 38,605 | |||||||||||||
|
Provisions and Impairment losses on financial assets (net)
|
16,810,889 | 18,532,202 | 12,366,875 | |||||||||||||
|
Net Gains (losses) on disposal of tangible assets, investments
and non-current assets held for sale
|
(563,413 | ) | (448,805 | ) | (452,096 | ) | ||||||||||
|
Share of results of entities accounted for using the equity method
|
11 | (91,342 | ) | (73,322 | ) | (54,216 | ) | |||||||||
|
Changes in deferred tax assets and liabilities
|
22.d | (2,537,771 | ) | (2,785,070 | ) | (1,588,367 | ) | |||||||||
|
Discontinued operations
|
1,174 | 2,773 | 3,950 | |||||||||||||
|
Others
|
40,665 | 39,767 | 13,153 | |||||||||||||
|
Net (increase) decrease in operating assets
|
(27,387,896 | ) | (23,480,323 | ) | (57,775,985 | ) | ||||||||||
|
Balance with the Brazilian Central Bank
|
3,239,600 | 11,046,168 | (8,824,495 | ) | ||||||||||||
|
Financial assets held for trading
|
1,449,177 | (1,736,773 | ) | (5,080,130 | ) | |||||||||||
|
Other financial assets at fair value through profit or loss
|
(96,489 | ) | (562,949 | ) | (4,277,011 | ) | ||||||||||
|
Available-for-sale financial assets
|
(5,645,404 | ) | 1,879,461 | 2,696,868 | ||||||||||||
|
Loans and receivables
|
(27,121,769 | ) | (30,821,128 | ) | (39,864,486 | ) | ||||||||||
|
Other assets
|
1,129,892 | (3,019,907 | ) | (2,152,964 | ) | |||||||||||
|
Discontinued operations
|
(342,903 | ) | (265,195 | ) | (273,767 | ) | ||||||||||
|
Net increase (decrease) in operating liabilities
|
29,205,900 | 7,021,290 | 28,884,891 | |||||||||||||
|
Financial liabilities held for trading
|
8,202,570 | 304,448 | 262,635 | |||||||||||||
|
Financial liabilities at amortized cost
|
21,359,301 | 4,411,101 | 24,290,139 | |||||||||||||
|
Other liabilities
|
(697,700 | ) | 2,040,546 | 4,058,350 | ||||||||||||
|
Discontinued operations
|
341,729 | 265,195 | 273,767 | |||||||||||||
|
Paid tax
|
22.a | (1,198,409 | ) | (2,137,965 | ) | (1,932,317 | ) | |||||||||
|
Total net cash flows from operating activities (1)
|
21,724,417 | 3,402,998 | (11,747,987 | ) | ||||||||||||
|
2. Cash Flows From Investing Activities
|
||||||||||||||||
|
Investments
|
(2,572,009 | ) | (1,989,428 | ) | (1,921,753 | ) | ||||||||||
|
Increase / Acquisition of Investments in associates
|
(206,101 | ) | - | (6,356 | ) | |||||||||||
|
Tangible assets
|
(1,773,009 | ) | (1,447,401 | ) | (1,074,509 | ) | ||||||||||
|
Intangible assets
|
(592,899 | ) | (542,027 | ) | (840,888 | ) | ||||||||||
|
Disposal
|
255,885 | 432,906 | 2,770,270 | |||||||||||||
|
Subsidiaries, jointly controlled entities and associates
|
3.a | 43,455 | - | 2,741,102 | ||||||||||||
|
Tangible assets
|
12 | 139,113 | 420,134 | 17,193 | ||||||||||||
|
Dividends and interest on capital received
|
73,317 | 12,772 | 11,975 | |||||||||||||
|
Total net cash flows from investing activities (2)
|
(2,316,124 | ) | (1,556,522 | ) | 848,517 | |||||||||||
|
3. Cash Flows From Financing Activities
|
||||||||||||||||
|
Issuance of shares of subsidiaries
|
- | 370,999 | - | |||||||||||||
|
Acquisition of own shares
|
26 | (121,145 | ) | (57,794 | ) | (112,755 | ) | |||||||||
|
Issuance of other long-term financial liabilities
|
18 | 45,575,270 | 36,376,139 | 29,501,246 | ||||||||||||
|
Dividends paid and interest on capital
|
(2,046,360 | ) | (2,495,328 | ) | (3,926,417 | ) | ||||||||||
|
Payments of subordinated liabilities
|
19 | (3,823,280 | ) | - | - | |||||||||||
|
Payments of other long-term financial liabilities
|
18 | (40,549,791 | ) | (25,440,219 | ) | (14,895,052 | ) | |||||||||
|
Decrease in non-controlling interests
|
(72,659 | ) | - | 2,956 | ||||||||||||
|
Total net cash flows from financing activities (3)
|
(1,037,965 | ) | 8,753,797 | 10,569,978 | ||||||||||||
|
Net Increase in Cash (1+2+3)
|
18,370,328 | 10,600,273 | (329,492 | ) | ||||||||||||
|
Cash and cash equivalents at beginning of year
|
19,617,680 | 9,017,407 | 9,346,899 | |||||||||||||
|
Cash and cash equivalents at end of year
|
37,988,008 | 19,617,680 | 9,017,407 | |||||||||||||
|
Cash and cash equivalents components
|
||||||||||||||||
|
Cash
|
4 | 3,533,344 | 4,114,775 | 3,542,707 | ||||||||||||
|
Loans and other
|
5 | 34,454,664 | 15,502,905 | 5,474,700 | ||||||||||||
|
Total of cash and cash equivalents
|
37,988,008 | 19,617,680 | 9,017,407 | |||||||||||||
|
Non-cash transactions
|
||||||||||||||||
|
Foreclosures loans and other assets transferred
to non-current assets held for sale
|
163,261 | 112,697 | 143,511 | |||||||||||||
|
Dividends and interest on capital declared but not paid
|
1,450,000 | 1,202,825 | 1,175,000 | |||||||||||||
|
Supplemental information
|
||||||||||||||||
|
Interest received
|
50,467,302 | 54,198,128 | 50,042,248 | |||||||||||||
|
Interest paid
|
21,738,114 | 22,232,253 | 22,901,817 | |||||||||||||
|
The accompanying Notes and Appendix I are an integral part of these consolidated financial statements.
|
||||||||||||||||
F-10
BANCO SANTANDER (BRASIL) S.A.
NOTES TO THE CONSOLIDATED FINANCIAL STATEMENTS
(Amounts in thousands of Brazilian Reais - R$, unless otherwise stated)
a) Introduction
Banco Santander (Brasil) S.A. (Banco Santander or Bank), indirectly controlled by Banco Santander, S.A., with headquarters in Spain (Banco Santander Spain), is the lead institution of the financial and non-financial group (Conglomerate Santander) with the Central Bank of Brazil (Bacen), established as a corporation, with main office at Avenida Presidente Juscelino Kubitschek, 2041 e 2235 - Bloco A - Vila Olímpia - São Paulo - SP. Banco Santander operates as a multiple bank and through its subsidiaries carries out its operations through two segments (note 42): Commercial Bank and Global Wholesale Bank, which operates with commercial, investment, credit and financing and exchange, mortgage lending, leasing, credit cards and securities brokerage. Its operations are conducted as part of a set of institutions that operate on integrated financial markets and capital.
The consolidated balance sheet as of December 31, 2013, 2012 and 2011 and the related consolidated statement of income, comprehensive income, changes in total equity, and cash flows for the three years in the period ended December 31, 2013 were approved by the Board of Directors at the meeting held on March 27, 2014.
b) Basis of presentation of the consolidated financial statements
These consolidated financial statements were prepared in accordance with International Financial Reporting Standards (IFRS) issued by the International Accounting Standards Board (IASB), and the interpretations issued by the IFRS Interpretations Committee (Current name of IFRIC) (IFRS).
In addition, to the adoption of new standards, amendments and interpretations effective in the current year, the Bank also changed the presentation of the balance corresponding to Customer Relationship, classified up to December 31, 2012 under Other intangible assets, and reclassified to Other Assets, with retrospective effect on the presentation in the Consolidated Balance Sheets and Consolidated Income Statements.
Adoption of new standards, amendments and interpretations
In the current year, the bank has applied a number of new and revised IFRSs issued by the International Accounting Standards Board (IASB) that are mandatory effective for the accounting period that begins on or after 1 January 2013:
The Bank has applied the amendments to IAS 1 titled Presentation of Items of Other Comprehensive Income. The amendment increases the required level of disclosure within the statement of comprehensive income. The impact of this amendment has been to analyse items within the statement of comprehensive income between items that will not be reclassified subsequently to profit or loss and items that will be reclassified subsequently to profit or loss in accordance with the respective IFRS standard to which the item relates. The financial statements have also been amended to analyse income tax on the same basis. The amendments have been applied retrospectively, and hence the presentation of items of comprehensive income have been restated to reflect the change. Other than the above mentioned presentation changes, the application of the amendments to IAS 1 do not result in any impact on profit or loss, comprehensive income and total comprehensive income.
• IFRS 10 - Consolidated Financial Statements replaces the consolidation guidance in IAS 27 Consolidated and Separate Financial Statements (2008) and SIC-12 Consolidation — Special Purpose Entities by introducing a single consolidation model for all entities based on control, irrespective of the nature of the investee (so whether an entity is controlled through voting rights of investors or through other contractual arrangements as is common in special purpose entities). Under IFRS 10, control is based on whether an investor has: i) power over the investee; ii) exposure, or rights, to variable returns from its involvement with the investee; and iii) the ability to use its power over the investee to affect the amount of the returns.
• IFRS 11 - Joint Arrangements - introduces new accounting requirements for joint arrangements, which replaces IAS 31 - Interests in Joint Ventures. According to IFRS 11, it will be mandatory to use the equity method and it will not be permitted to choose the method of accounting for a jointly controlled entity. The basic principle of IFRS 11 is that parts of a joint venture agreement must determine the type of the joint venture in question, based on the assessment of rights and obligations and, according to the accounting for the type of joint venture. There are two types of joint ventures:
- Joint Operations: Rights and obligations on the assets and liabilities related to the agreement. The parties account for their assets, liabilities and related income and expenses.
- Joint Venture: Rights to the net assets of the Agreement. The parties account for their investments under the equity method.
F-11
BANCO SANTANDER (BRASIL) S.A.
NOTES TO THE CONSOLIDATED FINANCIAL STATEMENTS
(Amounts in thousands of Brazilian Reais - R$, unless otherwise stated)
• IFRS 12 - Disclosures of Interests in Other Entities requires enhanced disclosures about both consolidated and unconsolidated entities in which an entity has interest. The objective of IFRS 12 is to allow users of financial statements to evaluate the basis of control, any restrictions on consolidated assets and liabilities, risk exposures arising from interests in unconsolidated structured entities and non-controlling interest in the activities of consolidated entities.
• IAS 27 - Consolidated and Separate Financial Statements (2011) - keeps the requirements relating to separate financial statements. The other portions of IAS 27 (2008) are replaced by IFRS 10.
• IAS 28 - Investments in Associates (2011) - amended IAS 28 Investments in Associates (2008) to conform changes based on the issuance of IFRS 10, IFRS 11 and IFRS 12.
• IFRS 13 - Fair Value Measurement - Replaces the guidance on fair value measurement in existing IFRS principles for a single standard. IFRS 13 defines fair value, provides guidance on how to determine fair value and requires disclosures about fair value measurements. However, IFRS 13 does not change the requirements about which items should be measured or disclosed at fair value.
The aforementioned standards did not have any impact on the Consolidated Financial Statements.
• Amendments to IAS 19, Employee Benefits (mandatory for reporting periods beginning on or after January 1, 2013) - These amendments eliminated the "Corridor" approach under which entities were able to opt for deferred recognition
of a given
portion of actuarial gains and losses, by establishing that all actuarial gains and losses must be recognized immediately in Equity. The amendments included significant changes in the presentation of cost components, as a result of which the service cost relating to post-employments benefit obligations (past service cost and plan curtailments and settlements) and net interest cost must be recognized in profit or loss and remeasurement component (comprising basically actuarial gains and losses) must be recognized in Equity - Other Comprehensive Income and may not be reclassified to profit or loss. In accordance with IAS 8, these amendments entail a change of accounting policy and, accordingly, they must be applied retrospectively as from January 1, 2013, by adjusting the opening balances of Equity for the earliest period presented as if the new accounting policy had always been applied. The impact of this accounting policy as at December 31, 2012 and 2011 is as follows:
|
2012
|
||||||||||||||||||||||||
|
Provisions for pension funds and similar obligations
|
Stockholders' Equity
(1)
|
Non-controlling Interest
|
Other Assets
|
Tax Assets - Deferred
|
Income Statements for the year ended 12/31/2012
(2)
|
|||||||||||||||||||
|
Balances originally registered as at December 31, 2012
|
1,307,815 | - | - | - | - | (192,677 | ) | |||||||||||||||||
|
Effects of adopting amendments to the IAS 19
|
3,952,885 | (2,417,855 | ) | (12,130 | ) | (92,418 | ) | 1,615,318 | 33,946 | |||||||||||||||
|
Balances as at December 31, 2012
|
5,260,700 | (2,417,855 | ) | (12,130 | ) | (92,418 | ) | 1,615,318 | (158,732 | ) | ||||||||||||||
|
2011
|
||||||||||||||||||||||||
|
Provisions for pension funds and similar obligations
|
Stockholders' Equity
(1)
|
Non-controlling Interest
|
Other Assets
|
Tax Assets - Deferred
|
Income Statements for the year ended 12/31/2011
(2)
|
|||||||||||||||||||
|
Balances originally registered as at December 31, 2011
|
1,246,040 | - | - | - | - | (118,105 | ) | |||||||||||||||||
|
Effects of adopting amendments to the IAS 19
|
1,842,553 | (1,149,703 | ) | - | (73,618 | ) | 766,468 | (8,721 | ) | |||||||||||||||
|
Balances as at December 31, 2011
|
3,088,593 | (1,149,703 | ) | - | (73,618 | ) | 766,468 | (126,826 | ) | |||||||||||||||
(1) Recorded under the “ Statements of Comprehensive Income” and “Reserves”.
(2) Recorded under “Interest expense and similar charges” and "Provisions (net)", net of taxes.
For more details, see notes 21, 22, 25, 27, 28, 30, 41.j, 42 and 45 which reflect the financial information as restated for the impact described above.
F-12
BANCO SANTANDER (BRASIL) S.A.
NOTES TO THE CONSOLIDATED FINANCIAL STATEMENTS
(Amounts in thousands of Brazilian Reais - R$, unless otherwise stated)
Standards and Interpretations that became effective after December 31, 2013
Lastly, at the date of preparation of these consolidated financial statements, the following standards and interpretations which effectively come into force after December 31, 2013 had not yet been adopted by the Bank:
• IFRS 9 – Financial Instruments: Recognition and Measurement – The main changes of IFRS 9 compared to IAS 39 are: (i) All recognized financial assets that are currently in the scope of IAS 39 will be measured at either amortized cost or fair value; (ii) IFRS 9 does not retain IAS 39’s concept of embedded derivatives for hybrid contracts if the host contract is a financial asset within the scope of IFRS 9; (iii) the guidance included in IFRS 9 retains the classification criteria for financial liabilities currently contained in IAS 39. However, there are two key differences, relating to presentation and measurement, compared to IAS 39: (a) the presentation of the effects of changes in fair value attributable to a liability’s credit risk; and (b) the elimination of the cost exemption for derivative liabilities to be settled by delivery of unquoted equity instruments.
• The Bank has applied the amendments to IFRS 7 titled Disclosures – Offsetting Financial Assets and Financial Liabilities. The amendments to IFRS 7 require entities to disclose information about rights of offset and related arrangements (such as collateral posting requirements) for financial instruments under an enforceable master netting agreement or similar arrangement. The amendment has been applied retrospectively.
• Amendments to IAS 32 - Financial Instruments - Presentation - adds guidance on offsetting financial assets and financial liabilities, whose amendment is effective beginning on or after January 1, 2014, and the bank does not anticipate significant effect as a result of their adoption.
• IAS 36 - Impairment of assets - adds guidance on the disclosure of recoverable amounts of non-financial assets, whose amendment is effective beginning on or after January 1, 2014, and the bank is assessing the impact of disclosure upon its adoption .
• IAS 39 - Impairment of assets - adds guidance clarifying that there is not necessary to discontinue "hedge accounting" whether the derivative instrument is renewed, provided that certain criteria are reached. This amendment is effective for annual periods beginning on or after January 1, 2014, and the bank does not anticipate significant effect as a result of its adoption.
On November 19, 2013, the IASB announced the completion of a package of changes to the accounting requirements for financial instruments. These amendments relate to the requirements for classification and measurement as well as the expected credit loss impairment model to be included in IFRS 9. Once those deliberations are complete, the IASB expects to publish a final version of IFRS 9, informing new mandatory effective date.
The Bank expects the adoption of the above-mentioned standard to have a material effect on the consolidated financial statements taken as a whole, and those impacts are under analyses as we follow the IASB deliberations.
• Investment entities: Amendments to IFRS 10, IFRS 12 and IAS 27 (effective for reporting periods beginning on or after January 1, 2014 with early adoption permitted) - these amendments provide for an exception from the consolidation rules under IFRS 10 for parent companies that meet the definition of investment entities. In view of their nature, these amendments do not affect the Consolidated at Bank.
c) Estimates
The consolidated results and the determination of consolidated equity are influenced by the accounting policies, assumptions, estimates and measurement bases used by the Bank's management in preparing the consolidated financial statements. The Bank makes estimates and assumptions that affect the reported amounts of assets and liabilities for future periods. All estimates and assumptions required, in conformity with IFRS, are best estimates made in accordance with the applicable standard.
In the consolidated financial statements estimates were made by the management of the Bank and consolidated entities in order to quantify certain assets, liabilities, income, expenses and explanatory notes. These estimates, which were made on the basis of the best information available, relate mainly to the following:
• Fair value measurement of certain financial instruments are further discussed in note 2-d.
• Allowance for loan losses are further discussed in note 2-h.
• Impairment losses on certain assets other than loans (including goodwill and other tangible and intangible assets) are further discussed in note 2-m and 2-n.
• Measurement of goodwill in a business combination are further discussed in note 2-n.
• The useful life of tangible and intangible assets are further discussed in note 2-m, 2-n and 14.
• Other assets are further discussed in note 2-k and 2-o.
• Provisions, contingent assets and liabilities are further discussed in note 2-q.
• Post-employment benefits are further discussed in note 2-w.
• Recognition and evaluation of deferred taxes are further discussed in note 2-z.
F-13
BANCO SANTANDER (BRASIL) S.A.
NOTES TO THE CONSOLIDATED FINANCIAL STATEMENTS
(Amounts in thousands of Brazilian Reais - R$, unless otherwise stated)
These estimates are based on current expectations and estimates on projections of future events and trends, which may affect the consolidated financial statements. The main assumptions that may affect these estimates, in addition to those previously mentioned above, relate to the following factors:
• Changes in deposit amounts, customer basis and defaults by borrowers;
• Changes in interest rates;
• Changes in inflation rates;
• Government regulation and tax matters;
• Adverse legal or regulatory disputes or proceedings;
• Credit, market and other risks of lending and investment activities;
• Changes in market values of Brazilian securities, particularly Brazilian government securities; and
• Changes in regional, national and international business and economic conditions.
d) Capital management
Capital management considers the regulatory and economic levels. The objective is to achieve an efficient capital structure in terms of cost and compliance, meeting the requirements of the regulatory body and contributing to achieving the goals of the classification of rating agencies and investors' expectations. The capital management includes securitization, sale of assets, raising capital through issue of shares, subordinated liabilities and hybrid instruments.
From an economic standpoint, capital management seeks to optimize value creation at the Bank and at its different business segment. To this end, the economic capital, RORAC (return on risk-adjusted capital) and value creation data for each business segment are generated, analyzed and reported to the management committee on a quarterly basis. Within the framework of the internal capital adequacy assessment process (Pillar 2 of the Basel Capital Accord), the Group uses an economic capital measurement model with the objective of ensuring that there is sufficient capital available to support all the risks of its activity in different economic scenarios, with the solvency levels agreed upon by the Group.
In order to adequately manage the Bank’s capital, it is essential to estimate and analyze future needs, in anticipation of the various phases of the business cycle. Projections of regulatory and economic capital are made based in financial projections (balance sheet, income statement, etc.) and on macroeconomic scenarios estimated by the Economic Research Service. These estimates are used by the Bank as a reference to plan the management actions (issues, securitizations, etc.) required to achieve its capital targets.
The accounting policies and measurement bases applied in preparing the consolidated financial statements were as follows:
a) Foreign currency transactions
The consolidated financial statements of Banco Santander are presented in Brazilian Reais, the functional and reporting currency of these financial statements.
For each subsidiary, entity under joint control and investment in an unconsolidated company, Banco Santander has defined the functional currency. The assets and liabilities of these entities with functional currency other than the Brazilian Real are translated as follows:
- Assets and liabilities are translated at the exchange rate at the balance sheet date.
- Revenues and expenses are translated at the monthly average exchange rates.
- Gain and losses on translation of net investment are recorded in the statement of comprehensive income, in “exchange rate of investees located abroad”.
b) Basis of consolidation
i. Subsidiaries
“Subsidiaries” are defined as entities over which the Bank has control. Control is based on whether the bank has: i) power over the investee; ii) exposure, or rights, to variable returns from its involvement with the investee; and iii) the ability to use its power over the investee to affect the amount of the returns, as set forth in the law, the Bylaws or agreement.
Consolidation of a subsidiary begins when the bank obtains control over the subsidiary and ceases when the bank loses control of the subsidiary. Specifically, income and expense of a subsidiary acquired or disposed during the year are included in the consolidated statement of profit or loss and other comprehensive income from the date the bank gains controls until the date when the bank ceases to control the subsidiary.
F-14
BANCO SANTANDER (BRASIL) S.A.
NOTES TO THE CONSOLIDATED FINANCIAL STATEMENTS
(Amounts in thousands of Brazilian Reais - R$, unless otherwise stated)
Profit or loss and each component of other comprehensive income are attributed to the owners of the Bank and to the non-controlling interests. Total comprehensive income of subsidiaries is attributed to the owners of the bank and to the non-controlling interest. Total comprehensive income of subsidiaries is attributed to the owners of the bank and to the non-controlling interest even if this results in the non-controlling interest having a deficit balance. All intragroup assets and liabilities, equity, income, expenses, and cash flows relating to the transactions between members of the group are eliminated in full on consolidation.
Changes in the Bank’s interest in a subsidiary that do not result in loss of control are accounted for as equity transactions. The carrying amounts of the Bank’s interests and noncontrolling interests are adjusted to reflect the changes in their relative interests in the subsidiary. Any difference between the amount by which the non-controlling interests are adjusted and the fair value of the consideration paid or received is recognised directly in equity and attributed to owners of the Company.
When the Bank loses control of a subsidiary, the profit or loss on disposal is calculated as the difference between (i) the aggregate of the fair value of the consideration received and the fair value of any retained interest and (ii) the previous carrying amount of the assets (including goodwill), less liabilities of the subsidiary and any non-controlling interests. Amounts previously recognised in other comprehensive income in relation to the subsidiary are accounted for (i.e. reclassified to profit or loss or transferred directly to retained earnings) in the same manner as would be required if the relevant assets or liabilities are disposed of. The fair value of any investment retained in the former subsidiary at the date when control is lost is regarded as the fair value on initial recognition for subsequent accounting under IAS 39 Financial Instruments: Recognition and Measurement or, when applicable, the costs on initial recognition of an investment in an associate or jointly controlled entity.
ii. Interests in joint ventures (jointly controlled entities) and associates
“Joint ventures” mean interests in entities that are not subsidiaries but which are jointly controlled by two or more unrelated entities. This is evidenced by contractual arrangements whereby two or more entities (“ventures”) acquire interests in entities (jointly controlled entities) or carry out transactions or hold assets so that strategic financial and operating decisions affecting the joint venture require the unanimous consent of the venturers.
Associates are entities over which the Bank is in a position to exercise significant influence, but it does not control or has joint control.
In the consolidated financial statements, interest in joint ventures and investments in associates are accounted for using the equity method, i.e. at the Bank’s share of net assets of the investee, after taking into account the dividends received from capital reductions and other related transactions. In the case of transactions with an associate, the related profits or losses are eliminated to the extent of the Bank’s investment in the associate. Relevant information regarding companies accounted for under the equity method by the Bank is provided in note 11.
iii. Special purpose entities
When the Bank incorporates special purpose entities, or holds ownership interests therein, to enable its customers to access certain investments, or for the transfer of risks or other purposes,
Bank assesses
, using internal criteria and procedures, and taking into consideration the applicable legislation, whether control (as defined above) exists and, therefore, whether these entities should be consolidated. These criteria and procedures take into account, among other things, the risks and rewards retained by the Bank and, accordingly, all relevant matters are taken into consideration, including any guarantees granted or any losses associated with the collection of the related assets retained by the Bank. These entities include the securitization special purpose vehicles, which are fully consolidated in the case of the SPVs over which, based on the aforementioned analysis, it is considered that the Bank continues to exercise control.
iv. Business combinations, acquisitions and disposals
A business combination is the combination of two or more separate entities or economic units into one single entity or group of entities and is accounted for in accordance with IFRS 3, “Business Combinations”.
Business combinations are carried out so that the Bank obtains control over an entity and are recognized for accounting purposes as follows:
• The Bank measures the cost of the business combination, defined as the fair value of the assets offered, the liabilities incurred and the equity instruments issued, if any.
• The fair values of the assets, liabilities and contingent liabilities of the acquired entity or business, including any intangible assets which might not have been recognized by the acquiree, are estimated at the acquisition date and recognized in the consolidated balance sheet.
• The excess of the acquisition cost over the fair values of the identifiable net assets acquired are recognized as goodwill (note 13). The excess of fair values of the identifiable net assets over the acquisition cost is bargain purchase gain and is recorded as income on the date of acquisition.
Also, note 3 below includes a description of the most significant transaction carried out in 2013.
F-15
BANCO SANTANDER (BRASIL) S.A.
NOTES TO THE CONSOLIDATED FINANCIAL STATEMENTS
(Amounts in thousands of Brazilian Reais - R$, unless otherwise stated)
c) Definitions and classification of financial instruments
i. Definitions
A “financial instrument” is any contract that gives rise to a financial asset of one entity and, simultaneously, to a financial liability or equity instrument of another entity.
An “equity instrument” is any agreement that evidences a residual interest in the assets of the issuing entity after deducting all of its liabilities.
A “financial derivative” is a financial instrument whose value changes in response to the change in an observable market variable (such as an interest rate, foreign exchange rate, financial instrument price, market index or credit rating), whose initial investment is very small compared with other financial instruments with a similar response to changes in market factors, and which is generally settled at a future date.
“Hybrid financial instruments” are contracts that simultaneously include a non-derivative host contract together with a derivative, known as an embedded derivative, that is not separately transferable and has the effect that some of the cash flows of the hybrid contract vary in a way similar to a stand-alone derivative.
The following transactions are not treated for accounting purposes as financial instruments:
• Investments in subsidiaries, jointly controlled entities and associates (note 11).
• Rights and obligations under employee benefit plans (note 21).
ii. Classification of financial assets for measurement purposes
Financial assets are initially classified into the various categories used for management and measurement purposes, unless they have to be presented as “Non-current assets held for sale” or they relate to “Cash and balances with the Brazilian Central Bank”, “Hedging derivatives” and “Investment in associates”, which are reported separately.
Financial assets are included for measurement purposes in one of the following categories:
• Financial assets held for trading (at fair value through profit or loss): this category includes the financial assets acquired for the purpose of generating a profit in the near term from fluctuations in their prices and financial derivatives that are not designated as hedging instruments.
• Other financial assets at fair value through profit or loss: this category includes hybrid financial assets not held for trading that are measured entirely at fair value and financial assets not held for trading that are included in this category in order to obtain more relevant information, either because this eliminates or significantly reduces recognition or measurement inconsistencies (“accounting mismatches”) that would arise from measuring assets or liabilities or recognizing the gains or losses on them on different bases, or because a group of financial assets or financial liabilities or both is managed and its performance is evaluated on a fair value basis, in accordance with a documented risk management or investment strategy, and information about the group is provided on that basis to the Bank’s key management personnel.
Financial instruments included in this category (and “Other financial liabilities at fair value through profit or loss”) are permanently subject to a consistent system of measuring, managing and controlling risks and returns that enables all the financial instruments involved to be monitored and identified and allows the effective reduction of risk to be checked. Financial assets may only be included in this category on the date they are acquired or originated.
Available-for-sale financial assets are stated at fair value. This category includes debt instruments not classified as “Held-to-maturity investments”, “Loans and receivables” or “Financial assets at fair value through profit or loss”, and equity instruments issued by entities other than subsidiaries, associates and jointly controlled entities, provided that such instruments have not been classified as “Financial assets held for trading” or as “Other financial assets at fair value through profit or loss”. Gains and losses arising from changes in fair value are recognized in "Equity" in the line item "Valuation Adjustment" with the exception of impairment losses, which are recognized in profit or loss. When the investment is disposed of or is determined to be impaired, the cumulative gain or loss previously accumulated in "Equity - Valuation Adjustments" is reclassified to profit or loss.
• Loans and receivables: this category includes financing granted to third parties, based on their nature, irrespective of the type of borrower and the form of financing, including finance lease transactions in which the consolidated entities act as lessors. The consolidated entities generally intend to hold the loans and credits granted by them until their final maturity and, therefore, they are presented in the consolidated balance sheet at their amortized cost (which includes the required adjustments to reflect estimated impairment losses).
F-16
BANCO SANTANDER (BRASIL) S.A.
NOTES TO THE CONSOLIDATED FINANCIAL STATEMENTS
(Amounts in thousands of Brazilian Reais - R$, unless otherwise stated)
• Held-to-maturity investments: this category includes debt instruments traded in an active market, with fixed maturity and with fixed or determinable payments, for which the Bank has both the intention and proven ability to hold to maturity. These investments are measured at amortized cost less any impairment, with revenue recognized on an effective yield basis.
iii. Classification of financial assets for presentation purposes
Financial assets are classified by nature into the following items in the consolidated balance sheet:
• Cash and balances with the Brazilian Central Bank: cash balances and balances receivable on demand relating to deposits with the Brazilian Central Bank.
• Loans and receivables: includes the balance of loans granted by the Bank, other than those represented by securities, as well as finance lease receivables and other debit balances of a financial nature in favor of the Bank, such as checks drawn on credit institutions, balances receivable from clearing houses and settlement agencies for transactions on the stock exchange and organized markets, bonds given in cash, capital calls, fees and commissions receivable for financial guarantees and debit balances arising from transactions not originated in banking transactions and services, such as the collection of rentals and similar items.
• Loans and amounts due from credit institutions: credit of any nature in the name of credit institutions.
• Loans and advances to customers: includes the debit balances of all the remaining credit and loans granted by the Bank, other than those represented by securities, including money market operations through central counterparties.
• Debt instruments: bonds and other securities that represent a debt for their issuer, that generate an interest return, and that are in the form of certificates or book entries.
• Equity instruments: financial instruments issued by other entities, such as shares, which have the nature of equity instruments for the issuer, unless they are investments in subsidiaries, jointly controlled entities or associates. Investment fund units are included in this item.
• Trading derivatives: includes the fair value in favor of the Bank of derivatives which do not form part of hedge accounting.
• Hedging derivatives: includes the fair value in favor of the Bank of derivatives designated as hedging instruments in hedge accounting.
• Investments in associates: includes the investments in the share capital of associates.
iv. Classification of financial liabilities for measurement purposes
Financial liabilities are classified for measurement purposes into one of the following categories:
• Financial liabilities held for trading (at fair value through profit or loss): this category includes the financial liabilities issued for the purpose of generating a profit in the short term from fluctuations in their prices, financial derivatives not considered to qualify for hedge accounting and financial liabilities arising from the direct sale of financial assets purchased under resale agreements or borrowed (“Short positions”).
• Other financial liabilities at fair value through profit or loss: financial liabilities are included in this category when more relevant information is obtained, either because this eliminates or significantly reduces recognition or measurement inconsistencies (“accounting mismatches”) that would arise from measuring assets or liabilities or recognizing the gains or losses on them on different bases, or because a group of financial liabilities or financial assets and liabilities is managed and its performance is evaluated on a fair value basis, in accordance with a documented risk management or investment strategy, and information about the Bank is provided on that basis to the Bank’s key management personnel.
• Financial liabilities at amortized cost: financial liabilities, irrespective of their instrumentation and maturity, not included in any of the abovementioned categories which arise from the funding-taking activities carried on by financial institutions.
v. Classification of financial liabilities for presentation purposes
Financial liabilities are classified by nature into the following items in the consolidated balance sheet:
• Deposits from the Brazilian Central Bank: deposits of any nature received from the Brazilian Central Bank.
• Deposits from credit institutions: deposits of any nature, including Borrowings and Onlendings and money market funding received from credit institutions.
• Customer deposits: includes deposits of any nature such as demand deposits, saving deposits and time deposits including money market operation received from
customer
.
• Marketable debt securities: includes the amount of bonds and other debt represented by marketable securities, other than subordinated liabilities.
• Trading derivatives: includes the fair value, with a negative balance for the Bank, of derivatives which do not form part of hedge accounting.
F-17
BANCO SANTANDER (BRASIL) S.A.
NOTES TO THE CONSOLIDATED FINANCIAL STATEMENTS
(Amounts in thousands of Brazilian Reais - R$, unless otherwise stated)
• Short positions: includes the amount of financial liabilities arising from the outright sale of financial assets purchased under reverse repurchase agreements or borrowed.
• Subordinated liabilities: amount of financing received which, for the purposes of payment priority, ranks behind ordinary debt. This category also includes the financial instruments issued by the Bank which, although equity for legal purposes, do not meet the requirements for classification as equity.
• Other financial liabilities: includes the amount of payment obligations having the nature of financial liabilities not included in other items, and liabilities under financial guarantee contracts, unless they have been classified as doubtful.
• Hedging derivatives: includes the fair value of the Bank’s liability in respect of derivatives designated as hedging instruments in hedge accounting.
d) Measurement of financial assets and liabilities and recognition of fair value changes
In general, financial assets and liabilities are initially recognized at fair value which, in the absence of evidence to the contrary, is deemed to be the transaction price. Financial instruments not measured at fair value through profit or loss, are adjusted by the transaction costs. Financial assets and liabilities are subsequently measured at each period-end as follows:
i. Measurement of financial assets
Financial assets are measured at fair value, without deduction of estimated costs of transaction that may be incurred on their disposal, except for loans and receivables, held-to-maturity investments, equity instruments whose fair value cannot be determined in a sufficiently objective manner and financial derivatives that have as equity instruments subject and are settled by delivery of those instruments.
"Fair value" is the price that would be received to sell an asset or paid to transfer a liability in an orderly transaction between market participants at the measurement date, regardless of whether that price is directly observable or estimated using another valuation technique. In estimated the fair value of an asset or an liability, the bank takes into account the charactheristics of the asset or liability if market participants would take those characheristics into account when pricing the asset and liability at measurement date.
If there is no market price for a given financial instrument, its fair value is estimated on the basis of valuation techniques commonly used by the international financial community, according to the specific features of the instrument to be measured and, particularly, the various types of risk associated with it.
All derivatives are recognized in the balance sheet at fair value from the trade date. If the fair value is positive, they are recognized as assets and if the fair value is negative, they are recognized as liabilities. The changes in the fair value of derivatives from the trade date are recognized in “Gains/losses on financial assets and liabilities” in the consolidated income statement. Specifically, the fair value of standard financial derivatives included in the portfolios of financial assets or liabilities held for trading is deemed to be their daily quoted price and if, for exceptional reasons, the quoted price cannot be determined on a given date, these financial derivatives are measured using methods similar to those used to measure over the counter “OTC” derivatives.
The fair value of OTC derivatives is taken to be the sum of the future cash flows arising from the instrument, discounted to present value at the date of measurement (“present value” or “theoretical close”) using valuation techniques commonly used by the financial markets: “net present value” (NPV), option pricing models and other methods.
“Loans and receivables” and “Held-to-maturity investments” are measured at amortized cost using the effective interest method. “Amortized cost” is the acquisition cost of a financial asset or liability plus or minus, as appropriate, the principal repayments and the cumulative amortization (taken to the income statement) between the difference of the initial cost and the maturity amount. In the case of financial assets, amortized cost furthermore includes any reductions for impairment or uncollectibility. In the case of loans and receivables hedged in fair value hedges, the changes in the fair value of these assets related to the risk or risks being hedged are recognized.
The “effective interest rate” is the discount rate that exactly matches the initial amount of a financial instrument to all its estimated cash flows of all kinds over its remaining life. For fixed rate financial instruments, the effective interest rate coincides with the contractual interest rate established on the acquisition date plus, where applicable, the fees and transaction costs that, because of their nature, form part of their financial return. In the case of floating rate financial instruments, the effective interest rate coincides with the rate of return prevailing in all connections until the next benchmark interest reset date.
Equity instruments whose fair value cannot be determined in a sufficiently objective manner are measured at acquisition cost adjusted, where appropriate, by any related impairment loss.
The amounts at which the financial assets are recognized represent, in all material respects, the Bank’s maximum exposure to credit risk at each reporting date. Also, the Bank has received collateral and other credit enhancements to mitigate its exposure to credit risk, which consist mainly of mortgage guarantees, cash collateral, equity instruments and personal security, assets leased out under leasing and renting agreements, assets acquired under repurchase agreements and securities loans and derivatives.
F-18
BANCO SANTANDER (BRASIL) S.A.
NOTES TO THE CONSOLIDATED FINANCIAL STATEMENTS
(Amounts in thousands of Brazilian Reais - R$, unless otherwise stated)
ii. Measurement of financial liabilities
In general, financial liabilities are measured at amortized cost, as defined above, except for those included under “Financial liabilities held for trading” and “Other financial liabilities at fair value through profit or loss” and financial liabilities designated as hedge items (or hedging instruments) in fair value hedges, which are measured at fair value.
iii. Valuation techniques
Fair value measurements using a fair value hierarchy that reflects the model used in the measurement process.
Level 1:
Financial instruments at fair value, determined on the basis of public price quotations in active markets, include government debt securities, private-sector debt securities, securitized assets, shares, short positions and fixed-income securities issued.
Level 2:
Fair value measurements are those derived from inputs other than quoted prices included within Level 1 that are observable for the asset or liability, either directly (i.e. as prices) or indirectly (i.e. derived from prices). Level 2 generally includes internal models to estimate the price, in this case are used observable inputs in active markets.; and
Level 3:
Fair value measurements are those derived from valuation techniques that include inputs for the asset or liability that are not based on observable market data (unobservable inputs).
Trading Financial Assets, Others financial assets at fair value on through profit or loss, Available-for-sale financial assets and Financial liabilities held for trading.
Level 1:
The securities with high liquidity and observable prices in an active market are classified as level 1. At this level were classified most of the Brazilian Government Securities (mainly LTN, LFT, NTN-B, NTN-C and NTN-F), shares in stocks and other securities traded in an active market.
Level 2:
When price quotations cannot be observed, the Management, using their own internal models, make their best estimate of the price that would be set by the market. These models use data based on observable market parameters as an important reference. Various techniques are used to make these estimates, including the extrapolation of observable market data and extrapolation techniques. The best evidence of fair value of a financial instrument on initial recognition is the transaction price, unless the fair value of the instrument can be obtained from other market transactions carried out with the same instrument or similar instruments or can be measured using a valuation technique in which the variables used include only data from observable market, especially interest rates. These securities are classified within Level 2 of the fair value hierarchy and are composed mainly by Agricultural Debt Securities (TDA and Debentures) in a market with less liquidity than those classified at level 1.
Level 3:
When there is information that is not based on observable market data, Banco Santander uses internally developed models, from curves generated according to the internal model. Level 3 comprises mainly unlisted shares that are not generally traded in an active market.
Derivatives
Level 1:
Derivatives traded on exchanges are classified in Level 1 of the hierarchy.
Level 2:
For derivatives traded over the counter, to the valuation of financial instruments (basically swaps and options), are usually used as observable market data: exchange rates, interest rates, volatility, correlation between indexes and market liquidity.
In the pricing of the financial instruments mentioned, uses the method of the Black-Scholes model (exchange rate options, interest rate options; caps and floors) and the method of present value (discount of future values by market curves).
Level 3:
Derivatives not traded in stock and do not have an observable data in a active market were classified as Level 3, and are composed mainly of exotic derivatives.
F-19
BANCO SANTANDER (BRASIL) S.A.
NOTES TO THE CONSOLIDATED FINANCIAL STATEMENTS
(Amounts in thousands of Brazilian Reais - R$, unless otherwise stated)
The following table shows a summary of the fair values of financial assets and liabilities for the years ended December 31, 2013, 2012 and 2011, classified based on several measurement methods adopted by the Bank to determine fair value:
|
Thousands of Reais
|
2013
|
|||||||||||||||
|
|
Level 1
|
Level 2
|
Level 3
|
Total
|
||||||||||||
|
|
|
|
||||||||||||||
|
Financial assets held for trading
|
28,193,318 | 2,022,142 | 3,327 | 30,218,787 | ||||||||||||
|
Debt instruments
|
22,394,344 | 446,155 | - | 22,840,499 | ||||||||||||
|
Equity instruments
|
473,202 | 1,048 | 3,327 | 477,577 | ||||||||||||
|
Trading derivatives
|
5,325,772 | 1,574,939 | - | 6,900,711 | ||||||||||||
|
Other financial assets at fair value through profit or loss
|
753,893 | 210,242 | 334,161 | 1,298,296 | ||||||||||||
|
Loans and amounts due from credit institutions
|
- | 112 | - | 112 | ||||||||||||
|
Debt instruments
|
- | 105,850 | - | 105,850 | ||||||||||||
|
Equity instruments
|
753,893 | 104,280 | 334,161 | 1,192,334 | ||||||||||||
|
Available-for-sale financial assets
|
33,962,431 | 11,811,180 | 513,471 | 46,287,082 | ||||||||||||
|
Debt instruments
|
33,146,090 | 11,811,180 | - | 44,957,270 | ||||||||||||
|
Equity instruments
|
816,341 | - | 513,471 | 1,329,812 | ||||||||||||
|
Hedging derivatives (assets)
|
293,546 | 29,271 | - | 322,817 | ||||||||||||
|
Financial liabilities held for trading
|
11,934,099 | 1,620,207 | - | 13,554,306 | ||||||||||||
|
Trading derivatives
|
3,797,588 | 1,620,207 | - | 5,417,795 | ||||||||||||
|
Short positions
|
8,136,511 | - | - | 8,136,511 | ||||||||||||
|
Hedging derivatives (liabilities)
|
608,478 | 20,505 | - | 628,983 | ||||||||||||
|
Thousands of Reais
|
2012
|
|||||||||||||||
|
|
Level 1
|
Level 2
|
Level 3
|
Total
|
||||||||||||
|
|
|
|
||||||||||||||
|
Financial assets held for trading
|
29,693,009 | 1,939,296 | 5,964 | 31,638,269 | ||||||||||||
|
Debt instruments
|
26,439,345 | 207,364 | - | 26,646,709 | ||||||||||||
|
Equity instruments
|
428,589 | - | - | 428,589 | ||||||||||||
|
Trading derivatives
|
2,825,075 | 1,731,932 | 5,964 | 4,562,971 | ||||||||||||
|
Other financial assets at fair value through profit or loss
|
724,551 | 124,187 | 379,580 | 1,228,318 | ||||||||||||
|
Loans and amounts due from credit institutions
|
5,065 | - | - | 5,065 | ||||||||||||
|
Debt instruments
|
- | 124,187 | - | 124,187 | ||||||||||||
|
Equity instruments
|
719,486 | - | 379,580 | 1,099,066 | ||||||||||||
|
Available-for-sale financial assets
|
33,148,388 | 10,874,055 | 126,177 | 44,148,620 | ||||||||||||
|
Debt instruments
|
32,225,141 | 10,819,430 | - | 43,044,571 | ||||||||||||
|
Equity instruments
|
923,247 | 54,625 | 126,177 | 1,104,049 | ||||||||||||
|
Hedging derivatives (assets)
|
80,256 | 75,907 | - | 156,163 | ||||||||||||
|
Financial liabilities held for trading
|
3,178,163 | 2,169,437 | 4,136 | 5,351,736 | ||||||||||||
|
Trading derivatives
|
2,937,980 | 2,169,437 | 4,136 | 5,111,553 | ||||||||||||
|
Short positions
|
240,183 | - | - | 240,183 | ||||||||||||
|
Hedging derivatives (liabilities)
|
158,899 | 122,646 | - | 281,545 | ||||||||||||
|
Thousands of Reais
|
2011
|
|||||||||||
|
|
Level 1
|
Level 2
|
Total
|
|||||||||
|
|
|
|
||||||||||
|
Financial assets held for trading
|
448,210 | 29,453,285 | 29,901,495 | |||||||||
|
Debt instruments
|
- | 25,298,804 | 25,298,804 | |||||||||
|
Equity instruments
|
448,210 | - | 448,210 | |||||||||
|
Trading derivatives
|
- | 4,154,481 | 4,154,481 | |||||||||
|
Other financial assets at fair value through profit or loss
|
374,519 | 290,850 | 665,369 | |||||||||
|
Loans and amounts due from credit institutions
|
- | 60,813 | 60,813 | |||||||||
|
Debt instruments
|
- | 230,037 | 230,037 | |||||||||
|
Equity instruments
|
374,519 | - | 374,519 | |||||||||
|
Available-for-sale financial assets
|
608,901 | 43,999,300 | 44,608,201 | |||||||||
|
Debt instruments
|
- | 42,077,252 | 42,077,252 | |||||||||
|
Equity instruments
|
608,901 | 1,922,048 | 2,530,949 | |||||||||
|
Hedging derivatives (assets)
|
- | 80,708 | 80,708 | |||||||||
|
Financial liabilities held for trading
|
337,628 | 4,709,660 | 5,047,288 | |||||||||
|
Trading derivatives
|
- | 4,709,660 | 4,709,660 | |||||||||
|
Short positions
|
337,628 | - | 337,628 | |||||||||
|
Hedging derivatives (liabilities)
|
- | 36,071 | 36,071 | |||||||||
F-20
BANCO SANTANDER (BRASIL) S.A.
NOTES TO THE CONSOLIDATED FINANCIAL STATEMENTS
(Amounts in thousands of Brazilian Reais - R$, unless otherwise stated)
The following tables shows the changes that occurred during the year 2013 and 2012 for level 3
|
In thousand of reais
|
Fair Value
2012
|
Gains/ losses (Realized-Not Realized)
|
Transfers in and/ or out of Level 3
|
Additions
|
Charge-offs
|
Fair value
2013
|
||||||||||||||||||
|
Financial assets held for trading
|
5,963 | - | 3,327 | - | (5,963 | ) | 3,327 | |||||||||||||||||
|
Other financial assets at fair value through profit or loss
|
379,580 | 23,737 | (69,965 | ) | 809 | - | 334,161 | |||||||||||||||||
|
Available-for-sale financial assets
|
126,178 | (35,818 | ) | 54,516 | 380,567 | (11,972 | ) | 513,471 | ||||||||||||||||
|
Financial liabilities held for trading
|
4,136 | - | - | - | (4,136 | ) | - | |||||||||||||||||
|
In thousand of reais
|
Fair Value
2011
|
Transfers for Level 3
|
Additions/ Charge-offs
|
Fair value
2012
|
||||||||||||
|
Financial assets held for trading
|
- | - | 5,963 | 5,963 | ||||||||||||
|
Other financial assets at fair value through profit or loss
|
- | 339,164 | 40,416 | 379,580 | ||||||||||||
|
Available-for-sale financial assets
|
- | 230,036 | (103,858 | ) | 126,178 | |||||||||||
|
Financial liabilities held for trading
|
- | - | 4,136 | 4,136 | ||||||||||||
In 2012, Banco Santander conducted a study where the methods were reevaluated by products, which resulted in the reclassification of some financial instruments, mainly, Brazilian Government Securities which had its classification changed from level 2 to level 1.
iv. Recognition of fair value changes
As a general rule, changes in the carrying amount of financial assets and liabilities are recognized in the consolidated income statement, distinguishing between those arising from the accrual of interest and similar items -which are recognized under “Interest and similar income” or “Interest expense and similar charges”, as appropriate- and those arising for other reasons, which are recognized at their net amount under “Gains (losses) on financial assets and liabilities (net)”.
Adjustments due to changes in fair value arising from Available-for-sale financial assets are recognized temporarily in equity under “Other Comprehensive Income”. Items charged or credited to this account remain in the Bank’s consolidated equity until the related assets are derecognized, whereupon they are charged to the consolidated income statement.
v. Hedging transactions
The consolidated entities use financial derivatives for the following purposes: i) to facilitate these instruments to customers who request them in the management of their market and credit risks; ii) to use these derivatives in the management of the risks of the Bank entities' own positions and assets and liabilities (“hedging derivatives”); and iii) to obtain gains from changes in the prices of these derivatives (“financial derivatives”).
Financial derivatives that do not qualify for hedge accounting are treated for accounting purposes as trading derivatives.
A derivative qualifies for hedge accounting if all the following conditions are met:
1. The derivative hedges one of the following three types of exposure:
a. Changes in the fair value of assets and liabilities due to fluctuations, among others, in the interest rate and/or exchange rate to which the position or balance to be hedged is subject (“fair value hedge”);
b. Changes in the estimated cash flows arising from financial assets and liabilities, commitments and highly probable forecast transactions (“cash flow hedge”);
c. The net investment in a foreign operation (“hedge of a net investment in a foreign operation”).
2. It is effective in offsetting exposure inherent in the hedged item or position throughout the expected term of the hedge, which means that:
a. At the date of arrangement the hedge is expected, under normal conditions, to be highly effective (“prospective effectiveness”).
b. There is sufficient evidence that the hedge was actually effective during the whole life of the hedged item or position (“retrospective effectiveness”).
3. There must be adequate documentation evidencing the specific designation of the financial derivative to hedge certain balances or transactions and how this effective hedge was expected to be achieved and measured, provided that this is consistent with the Bank’s management of own risks.
F-21
BANCO SANTANDER (BRASIL) S.A.
NOTES TO THE CONSOLIDATED FINANCIAL STATEMENTS
(Amounts in thousands of Brazilian Reais - R$, unless otherwise stated)
The changes in value of financial instruments qualifying for hedge accounting are recognized as follows:
a. In fair value hedges, the gains or losses arising on both the hedging instruments and the hedged items (attributable to the type of risk being hedged) are recognized directly in the consolidated income statement.
b. In cash flow hedges, the effective portion of the change in value of the hedging instrument is recognized temporarily in equity under “Other comprehensive Income - Cash flow hedges” until the forecast transactions occur, when it is recognized in the consolidated income statement, unless, if the forecast transactions result in the recognition of non-financial assets or liabilities, it is included in the cost of the non-financial asset or liability. The ineffective portion of the change in value of hedging derivatives is recognized directly in the consolidated income statement.
c. The ineffective portion of the gains and losses on the hedging instruments of cash flow hedges and hedges of a net investment in a foreign operation are recognized directly under “Gains (losses) on financial assets and liabilities (net)” in the consolidated income statement.
If a derivative designated as a hedge instrument no longer meets the requirements described above due to expiration, ineffectiveness or for any other reason, the derivative is classified as a trading derivative.
When fair value hedge accounting is discontinued, the adjustments previously recognized on the hedged item are transferred to profit or loss at the effective interest rate re-calculated at the date of hedge discontinuation. The adjustments must be fully amortized at maturity.
When cash flow hedges are discontinued, any cumulative gain or loss on the hedging instrument recognized in equity under "Other comprehensive Income” (from the period when the hedge was effective) remains recognized in equity until the forecast transaction occurs at which time it is recognized in profit or loss, unless the transaction is no longer expected to occur, in which case any cumulative gain or loss is recognized immediately in profit or loss.
e) Derecognition of financial assets and liabilities
The accounting treatment of transfers of financial assets depends on the extent to which the risks and rewards associated with the transferred assets are transferred to third parties:
1. If the Bank transfers substantially all the risks and rewards to third parties -unconditional sale of financial assets, sale of financial assets under an agreement to repurchase them at their fair value at the date of repurchase, sale of financial assets with a purchased call option or written put option that is deeply out of the money, securitization of assets in which the transferor does not retain a subordinated debt or grant any credit enhancement to the new holders, and other similar cases-, the transferred financial asset is derecognized and any rights or obligations retained or created in the transfer are recognized simultaneously.
2. If the Bank retains substantially all the risks and rewards associated with the transferred financial asset -sale of financial assets under an agreement to repurchase them at a fixed price or at the sale price plus interest, a securities lending agreement in which the borrower undertakes to return the same or similar assets, and other similar cases-, the transferred financial asset is not derecognized and continues to be measured by the same criteria as those used before the transfer. However, the following items are recognized:
a. An associated financial liability, for an amount equal to the consideration received; this liability is subsequently measured at amortized cost.
b. The income from the transferred financial asset not derecognized and any expense incurred on the new financial liability.
3. If the Bank neither transfers nor retains substantially all the risks and rewards associated with the transferred financial asset -sale of financial assets with a purchased call option or written put option that is not deeply in or out of the money, securitization of assets in which the transferor retains a subordinated debt or other type of credit enhancement for a portion of the transferred asset, and other similar cases, the following distinction is made:
a. If the transferor does not retain control of the transferred financial asset, the asset is derecognized and any rights or obligations retained or created in the transfer are recognized.
b. If the transferor retains control, it continues to recognize the transferred financial asset for an amount equal to its exposure to changes in value and recognizes a financial liability associated with the transferred financial asset. The net carrying amount of the transferred asset and the associated liability is the amortized cost of the rights and obligations retained, if the transferred asset is measured at amortized cost, or the fair value of the rights and obligations retained, if the transferred asset is measured at fair value.
Accordingly, financial assets are only derecognized when the rights on the cash flows they generate have been extinguished or when substantially all the inherent risks and rewards have been transferred to third parties. Similarly, financial liabilities are only derecognized when the obligations they generate have been extinguished or when they are acquired, with the intention of either to cancel them or to resell them.
F-22
BANCO SANTANDER (BRASIL) S.A.
NOTES TO THE CONSOLIDATED FINANCIAL STATEMENTS
(Amounts in thousands of Brazilian Reais - R$, unless otherwise stated)
f) Offsetting of financial instruments
Financial asset and liability balances are offset (i.e. reported in the consolidated balance sheet at their net amount) only if the Bank and their subsidiaries currently have a legally enforceable right to set off the recognized amounts and intend either to settle on a net basis, or to realize the asset and settle the liability simultaneously.
g) Regular way purchases of financial assets
Regular way purchases of financial assets are recognized on trade date. The assets are derecognized when the rights to receive cash flows have expired or the Bank has transferred substantially all the risks and rewards of ownership.
h) Impairment of financial assets
i. Definition
A financial asset is considered to be impaired and therefore its carrying amount is adjusted to reflect the effect of impairment when there is objective evidence that events have occurred which:
• Give rise to an adverse impact on the future cash flows that were estimated at the transaction date, in the case of debt instruments (loans and debt securities);
• Mean that their carrying amount cannot be fully recovered, in the case of equity instruments;
• Arising from the violation of terms of loans, and
• During the bankruptcy process.
As a general rule, when the events above are observed, the carrying amount of impaired financial assets is adjusted by recording a provision for losses on debts expense as "Losses on financial assets (net)" in the consolidated income statement. The reversal of previously recorded losses is recognized in the consolidated income statement in the period in which the impairment and decrease can be related objectively to an event of recovery.
Financial Assets are deemed to be impaired, and the interest accrual suspended, when there are reasonable doubts as to their full recovery and/or the collection of the related interest for the amounts and on the dates indicated in the loan agreement, after taking into account the collateral guarantees received to secure (fully or partially) collection of the related balances. For all non-performing past due assets, any collections relating to impaired loans and advances are used to recognize the accrued interest and the remainder, if any, is applied to reduce the principal amount outstanding.
ii. Debt instruments carried at amortized cost
The amount of an impairment loss incurred for determination of the recoverable amount on a debt instrument measured at amortized cost is equal to the difference between its carrying amount and the present value of its estimated future cash flows (excluding future credit losses that have not been incurred) discounted the original effective interest rate of the financial asset (or the effective interest rate computed at initial recognition), and is presented as a reduction of the asset balance and recorded in income statements.
In estimating the future cash flows of debt instruments the following factors are taken into account:
• All the amounts that are expected to be obtained over the remaining life of the instrument, in this case, the provided guarantees. The impairment loss takes into account the likelihood of collecting accrued interest receivable.
• The various types of risk to which each instrument is subject; and
• The circumstances in which collections will foreseeably be made.
These cash flows are subsequently discounted using the instrument's effective interest rate.
Specifically in regards to recoverable amount losses resulting from materialization of the insolvency risk of the obligors (credit risk), a debt instrument is impaired due to insolvency when there is evidence of a deterioration of the obligor's ability to pay, either because it is in arrears or for other reasons.
The Bank has certain policies, methods and procedures for covering its credit risk arising both from insolvency allocable to counterparties.
These policies, methods and procedures are applied in the granting, examination and documentation of debt instruments, and contingent liabilities and commitments, the identification of their recoverable amount and the calculation of the amounts necessary to cover the related credit risk.
The procedures applied in the identification, measurement, control and reduce the exposure to credit risk, are based on an individual basis or grouped by similarity.
F-23
BANCO SANTANDER (BRASIL) S.A.
NOTES TO THE CONSOLIDATED FINANCIAL STATEMENTS
(Amounts in thousands of Brazilian Reais - R$, unless otherwise stated)
• Customers with individual management: Wholesale segment customers, financial institutions and certain companies. Risk management is performed through an analysis complemented by tools to support decision-making model-based risk assessment internal procedure.
• Customers with standardized management: individuals and companies not classified as individual clients. Risk management models based on automated decision-making and risk assessment procedure, complemented, when the model is not comprehensive or accurate enough, by teams of analysts specializing in this type of risk. The credits related to customers standardized, are usually considered not recoverable when they have historical loss experience and delay greater than 90 days.
Regarding the provision for impairment losses from credit risk, the Bank evaluates all loans. Loans are either individually evaluated for impairment or collectively evaluated for impairment. Loans accounted as amortized cost, which are not individually evaluated for impairment, are collectively evaluated for impairment, grouping them considering the similarity of risk. Loans individually evaluated for impairment are not included in balances that are collectively evaluated for impairment.
To measure the impairment loss on loans individually evaluated for impairment, the Bank considers the conditions of the borrower, such as their economic and financial situation, level of indebtedness, ability to generate income, cash flow, management, corporate governance and quality of internal controls, payment history, industry expertise, contingencies and credit limits, as well as characteristics of assets, such as its nature and purpose, type, sufficiency and liquidity level guarantees and total amount of credit, as well as based on historical experience of impairment and other circumstances known at the moment of evaluation.
To measure the impairment loss on loans collectively evaluated for impairment, the Bank segregates financial assets into groups considering the characteristics and similarity of credit risk, in other words, according to segment, the type of assets, guarantees and other factors associated as the historical experience of impairment and other circumstances known at the time of assessment.
The impairment loss is calculated by using statistical models that consider the following factors:
• Exposure at default or “EAD” is the amount of risk exposure at the date of default by the borrower.
In accordance with IFRS, the exposure at default used for this calculation is the current exposure, as reported in the balance sheet.
• Probability of default, or “PD”, is the probability of the borrower failing to meet its principal and/or interest payment obligations.
PD is measured using a time horizon of one year; that is, it quantifies the probability of the borrower defaulting in the coming year. A loan is in default if either the principal or interest is past due by ninety days or more or the loan is current but there are doubts as to the solvency of the counterparty (subjective doubtful assets).
• Loss given default, or “LGD”, is the loss arising in the event of default.
LGD calculation is based on the net charge offs on defaulted loans, taking into account the guarantees/collateral associated with the loans, the income and expenses associated with the recovery process and the timing of delinquency.
• In addition, prior to charging off past due loans (which is only done after the Bank have completed all recovery efforts), is composed fully provision the remaining balance of the loan so our allowance for loan losses fully cover the losses. Thus, the Bank understands that its loan loss allowance methodology has been developed to fit its risk metrics and capture loans that could potentially become impaired.
iii. Debt or equity instruments classified as available for sale
The difference between the amortized cost and fair value of debt or equity instruments classified as available for sale are recorded in equity under "Other Comprehensive Income."
When there is objective evidence that the aforementioned differences are due to a permanent loss, they are no longer recognized in equity and are reclassified, at the cumulative amount at that date, to the consolidated income statement. Losses considered as permanent relating to an investment in equity instruments are not reversed in subsequent periods.
iv. Equity instruments measured at cost
The amount of impairment losses on equity instruments measured at cost is the difference between the carrying amount and the present value of the expected future cash flows discounted at the market rate of return for similar securities.
Impairment losses of recoverable amounts are recognized in the consolidated income statement for the period in which they arise as a direct reduction of the cost of the instrument. These losses can only be reversed subsequently if the related assets are sold.
i) Repurchase agreements
Purchases (disposal) of financial assets under a non-optional resale (repurchase) agreement at a fixed price are recognized in the consolidated balance sheet as Investment (funding), in repurchase agreements based on the nature of the debtor (creditor), under “Cash and balances with the Brazilian Central Bank”, “Loans and amounts due from credit institutions” or “Loans and advances to customers” (“Deposits from the Brazilian Central Bank”, “Deposits from credit institutions” or “Customer deposits”).
Differences between the purchase and sale prices are recognized as interest over the contract term.
F-24
BANCO SANTANDER (BRASIL) S.A.
NOTES TO THE CONSOLIDATED FINANCIAL STATEMENTS
(Amounts in thousands of Brazilian Reais - R$, unless otherwise stated)
j) Accounting for leases
i. Financial leases
Financial leases are leases that transfer substantially all the risks and rewards incidental to ownership of the leased asset to the lessee.
When the consolidated entities act as the lessors of an asset, all types of finances leases have guaranteed residual values, and the sum of the present value of the lease payments receivable from the lessee plus the guaranteed residual value which is the exercise price of the purchase option of the lessee at the end of the lease term is recognized as loans to third parties and is therefore included under “Loans and receivables” in the consolidated balance sheet.
The finance income arising from these contracts is credited to “Interest and similar income” in the consolidated income statement so as to achieve a constant rate of return over the lease term.
ii. Operating Leases
In operating leases, the ownership of the leased asset and substantially all the risks and rewards incidental thereto remain with the lessor.
When the consolidated entities act as the lessors, they present the acquisition cost of the leased assets under “Tangible assets” (note 12). The depreciation policy for these assets is consistent with that for similar items of property, plant and equipment for own use and income from operational leases is recognized on a straight-line basis under “Other operating income (expense)” in the consolidated income statement.
When the consolidated entities act as the lessees, the lease expenses, including any incentives granted by the lessor, are charged on a straight-line basis to “Other administrative expenses” in their consolidated income statements.
k) Non-current assets held for sale
“Non-current assets held for sale” includes the carrying amount of individual items or disposal groups or items forming part of a business unit earmarked for disposal (“Discontinued operations”), whose sale in their present condition is highly probable and is expected to occur within one year, the property or other non-current assets received by the consolidated entities as total or partial settlement of their debtors' payment obligations to them are deemed to be non-current assets held for sale through the completion of actions which normally occurs up to one year.
Non-current assets held for sale are measured at the lower of fair value less costs to sell and their carrying amount at the date of classification in this category. Non-current assets held for sale are not depreciated.
Impairment losses on an asset or disposal group arising from a reduction in its carrying amount to its fair value (less costs to sell) are recognized under “Gains (losses) on disposal and expenses of non-current assets held for sale not classified as discontinued operations” in the consolidated income statement. The gains on a non-current asset held for sale resulting from subsequent increases in fair value (less costs to sell) increase its carrying amount and are recognized in the consolidated income statement up to an amount equal to the impairment losses previously recognized.
l) Residual maturity periods and average interest rates
The analysis of the maturities of the balances of certain items in the consolidated balance sheets and the average interest rates at 2013, 2012 and 2011 year-end is provided in note 41-d.
m) Tangible assets
“Tangible assets” includes the amount of buildings, land, furniture, vehicles, computer hardware and other fixtures owned by the Bank, including tangible assets received by the Bank in full or partial satisfaction of financial assets representing receivables from third parties which are intended to be held for continuing use and tangible assets acquired under finance leases are presented at acquisition cost, less the related accumulated depreciation and any impairment losses (net carrying amount higher than recoverable amount).
F-25
BANCO SANTANDER (BRASIL) S.A.
NOTES TO THE CONSOLIDATED FINANCIAL STATEMENTS
(Amounts in thousands of Brazilian Reais - R$, unless otherwise stated)
Depreciation is calculated, using the straight-line method, on the basis of the acquisition cost of the assets less their residual value. The land on which the buildings and other structures are located has an indefinite life and, therefore, it is not depreciated.
The tangible asset depreciation charge is recognized in the consolidated income statement and is calculated basically using the following depreciation rates (based on the average years of estimated useful life of the various assets):
|
Annual
Rate
|
||||
|
Buildings for own use
|
4 | % | ||
|
Furniture
|
10 | % | ||
|
Fixtures
|
10 | % | ||
|
Office and IT equipment
|
20 | % | ||
|
Leasehold improvements
|
10% or up to contractual maturity
|
|||
The Bank assesses at end of each period, if there is no indication that the items of tangible assets may be impaired (carrying amount exceeds its recoverable amount either for use or sale). The assessment of property is done through reports prepared by independent companies.
Once a reduction in the impairment loss of tangible assets is identified, it is adjusted to reach its recoverable amount by recognizing an impairment loss recorded in "Impairment loss on other assets (Net)". Additionally the value of depreciation of that asset is recalculated in order to adjust the value of the life of the asset.
In case of evidence or indication of an impairment loss of a tangible asset, the Bank recognizes the reversal of impairment loss recorded in prior years and should adjust the future depreciation expenses according to the lifetime value of the property. Under no circumstance, a reversal of impairment loss of an asset will increase its carrying amount higher than the amount that it would have had no impairment loss been recognized in prior years.
Upkeep and maintenance expenses relating to property, plant and equipment for own use are recognized as an expense in the period in which they are incurred.
n) Intangible assets
Intangible assets are identifiable non-monetary assets (separable from other assets) without physical substance which arise as a result of a legal transaction or software are developed internally. Only assets whose cost can be estimated reliably and from which the consolidated entities consider it probable that future economic benefits will be generated are recognized.
Intangible assets are recognized initially at acquisition or production cost and are subsequently measured deducting any accumulated amortization and any accumulated impairment losses.
i. Goodwill
In the acquisition of investment in subsidiary, any difference between the investment cost and the investor's share in net fair value of assets, liabilities and contingent liabilities of the investee (subsidiary or affiliate) is accounted for in accordance with IFRS 3 "Business Combination ".
Goodwill is recognized only when the amount of the consideration of the investee acquired exceeds the fair value at the acquisition date, and therefore represents a payment made by the acquirer in anticipation of future economic benefits of assets of the acquired entity that can not be individually identified and recognized separately.
At the end of each reporting period or whenever there is any indication of impairment, goodwill is reviewed for impairment (impairment test) and, if there is any impairment, the goodwill is written down against Impairment losses on Goodwill and other intangible assets in the consolidated income statement.
The net fair value adjustments of assets, liabilities and contingent liabilities of the investee in relation to its carrying amount are allocated to individual identifiable assets acquired and liabilities assumed that comprise it based on their respective fair values
at the date of purchase.
In the case of a business combination achieved in stages, prior interest in the acquiree is measured again at fair value at acquisition date when control of the acquiree is obtained.
F-26
BANCO SANTANDER (BRASIL) S.A.
NOTES TO THE CONSOLIDATED FINANCIAL STATEMENTS
(Amounts in thousands of Brazilian Reais - R$, unless otherwise stated)
ii. Other intangible assets
Other intangible assets are non-monetary asset without physical substance. Generally arising from software development and acquisition of rights that can generate benefits for the Bank. They can have characteristics of definite or indefinite period.
Other intangible assets are considered to have indefinite useful life when, based on an analysis of all relevant factors, it is concluded that there is no foreseeable limit to the period over which the asset is expected to generate cash inflows for the Bank, or a finite useful life, in all other cases.
Intangible assets with indefinite useful lives are not amortized, but rather, at the end of each period, the entity reviews the remaining useful life of assets to determine if they are still undefined and, if this is not the case, the change should be accounted for as a change in accounting estimate.
Intangible assets with definite useful life are amortized over its useful life by using methods similar to those used to depreciate tangible assets. The amortization expense is recognized under "Depreciation and amortization" in the consolidated income statement.
The Bank assesses at the end of each period, if there is no indication that the items of intangible assets may present an impairment loss, i.e. an asset that presents the carrying amount higher than the net realizable value. After identifying any reduction in impairment loss, it is adjusted to reach its fair value.
Measurement of the recoverable amount of other intangible assets - software is made based on the value in use, as well as the analysis of the discontinuity of the asset in relation to the activities of the Bank.
Expenditures for acquisition and development of software are amortized over a maximum period od 5 years.
o) Other assets
Other assets include the balance of all prepayments and accrued income (excluding accrued interest), customer relationship, the net amount of the difference between pension plan obligations and the value of the plan assets with a balance on the entity’s behalf, when this net amount is to be reported in the consolidated balance sheet, and the amount of any other assets not included in other items.
The Bank uses the value in use of customer relationship as a basis for measuring the impairment since it is not reasonably possible to determine the net value of sales, because there is no basis for making a reliable estimate of the value to be obtained by selling the asset in a transaction at cumulative basis, between knowledgeable, willing parties. The value in use of customer lists acquired related to the purchase of the "payroll" will be determined individually. A analyses that aims to demonstrate the expectation of generating future economic benefit and the present value of expected cash flows is prepared by the business areas. Quarterly, these analyses are reviewed based on the actual cash flows of each business (value in use), which are compared with the carrying amount, checking whether there is a need to record a loss on non-recoverability.
p) Liabilities for insurance contracts
The liabilities for insurance contracts are comprised substantially by mathematical reserves for current and future benefits (PMBaC and PMBC). Insurance contracts are contracts under which the Bank accepts a significant risk – other than a financial risk – from a policyholder by agreeing to compensate the beneficiary on the occurrence of an uncertain future event by which the policyholder will be adversely affected.
Insurance liabilities are recognized when the contract is entered into and the premiums are charged. Contracts that have been classified as insurance are not reclassified subsequently. The liability is derecognized when the contract expires or is cancelled.
Mathematical reserves for current and future benefits are recognized based on contributions made under the capitalization financial system. The mathematical reserves for current benefits represent commitments under continued income plans which are recognized through actuarial calculation for the traditional, pension plan (PGBL) and cash value life insurance (VGBL) plans.
All valuation methods used by the subsidiaries are based on the general principle that the carrying amount of the net liability must be sufficient to meet any reasonably foreseeable obligation resulting from the insurance contracts. Investment assumptions are either determined by the local regulator or based on management’s future expectations. In the latter case, the anticipated future investment returns are set by management, considering the available market information and economic indicators. A significant assumption related to estimated gross profits on variable annuities, is the annual long-term growth rate of the underlying assets.
At each balance sheet date an assessment is made of whether the provisions for Mathematical reserves are adequate.
F-27
BANCO SANTANDER (BRASIL) S.A.
NOTES TO THE CONSOLIDATED FINANCIAL STATEMENTS
(Amounts in thousands of Brazilian Reais - R$, unless otherwise stated)
q) Provision for contingent assets and liabilities
Banco Santander and its subsidiaries are involved in judicial and administrative proceedings related to tax, labor and civil, in the normal course of their activities.
The judicial and administrative proceedings are recognized in the accounts based on the nature, complexity and history of actions and beliefs of the internal and external legal advisors.
Provisions are made when the risk of loss of judicial or administrative action is assessed as probable and the amounts involved can be measured with sufficient accuracy, based on best available information. The provisions include legal obligations, judicial and administrative proceedings related to tax and social security obligations, whose object is to challenge their legality or constitutionality, regardless of the assessment that the probability of success, the amounts are fully recognized in the financial statements. They are fully or partially reversed when the obligations cease to exist or are reduced.
Contingent liabilities are possible obligations that arise from past events and whose existence will be confirmed only by the occurrence or nonoccurrence of one or more future events that are not totally under the control of the consolidated entities. Under accounting rules, contingent liabilities classified as possible losses are not recognized, but disclosed in the notes to the financial statements.
Contingent assets are not accounted for, except when there are guarantees or favorable court decisions, with respect to which no appeal is possible, characterizing the gain as virtually certain. Assets with probable success, if any, are only disclosed in the financial statements.
Management believes that the provisions recognized are sufficient to cover losses from judicial and administrative proceedings, and it also believes that, in the aggregate, they will not have significant impacts on results, cash flow or financial condition of the Bank.
Given the uncertainties arising from the proceedings, it is not practicable to determine the timing of any outflow (cash disbursement).
r) Other liabilities
“Other liabilities” includes the balance of all accrued expenses and deferred income, excluding accrued interest, and the amount of any other liabilities not included in other categories.
s) Share-based compensation
The Bank has long-term compensation plans with vesting conditions. The main vesting conditions are: (1) service conditions, since it is necessary that the participant continues to be employed by the Bank during the term of the Plan for their rights to vest; (2) performance conditions, since the number of Units that ultimately vest will be determined according to the result of certain performance parameter of the Bank, such as: total Shareholder Return (TSR) and may be reduced in case of failure to achieve the goals of reducing the Return on Risk Adjusted Capital (RORAC), comparison between actual and budget in each year, as determined by the Board of Directors and (3) market conditions, since some parameters are linked to the market price of the Bank´s shares. These compensation plans are measured and recorded in accordance with IFRS 2 - "Share-based payment". The Bank measures the fair value of the services rendered by reference to the fair value of the equity instruments granted at the grant date, taking into account the market conditions for each plan when estimating the fair value.
Settlement in shares
The Bank measures the fair value of the services received by reference to the fair value of the equity instruments granted at the grant date, taking into account the market conditions for each grant when estimating the fair value. In order to recognize the personnel expenses against equity reserves throughout the vesting period, as the services are received, the Bank considers the treatment of service conditions and recognize the amount for the services received during the vesting period based on the best available estimate of the number of equity instruments expected to vest. Semi-annually, the Bank reviews the estimate of the number of equity instruments expected to vest.
Settlement in cash
For cash-settled share-based compensation (in the form of share appreciation rights), the Bank measures the services rendered and the corresponding liability incurred at the fair value of the share appreciation rights at the grant date and until the liability is settled, the Banks remeasures the fair value of the liability at the end of each reporting period and at the date of settlement, with any changes in fair value recognized in profit or loss for the period. In order to recognize the personnel expenses against a provision in “other liabilities” throughout the vesting period, reflecting the period as the services are received, the Bank bases the total liability on the best estimate of the number of share appreciation rights that will vest at the end of the vesting period and recognizes the amount for the services received during the vesting period based on such best available estimate. Periodically, the Bank reviews such estimate of the number of share appreciation rights that will vest at the end of vesting period.”
F-28
BANCO SANTANDER (BRASIL) S.A.
NOTES TO THE CONSOLIDATED FINANCIAL STATEMENTS
(Amounts in thousands of Brazilian Reais - R$, unless otherwise stated)
t) Recognition of income and expenses
The most significant criteria used by the Bank to recognize its income and expenses are summarized as follows:
i. Interest income, interest expenses and similar items
Interest income, interest expenses and similar items are generally recognized on an accrual basis using the effective interest method. Dividends received from other companies are recognized as income when the consolidated entities' right to receive them arises.
ii. Commissions, fees and similar items
Fees and commission income and expenses are recognized in the consolidated income statement using criteria that vary according to their nature. The main criteria are as follows:
• Fee and commission income and expenses relating to financial assets and financial liabilities measured at fair value through profit or loss are recognized when paid;
• Those arising from transactions or services that are performed over a period of time are recognized over the life of these transactions or services; and
• Those relating to services provided in a single act are recognized when the single act has been performed.
iii. Non-financial income and expenses
These are recognized for accounting purposes on an accrual basis.
iv. Deferred collections and payments
These are recognized for accounting purposes at the amount resulting from discounting the expected cash flows at market rates.
v. Loan arrangement fees
Loan arrangement fees, mainly loan origination and application fees, are accrued and recognized in income over the term of the loan. In the case of loan origination fees, the portion relating to the associated direct costs incurred in the loan arrangement is recognized immediately in the consolidated income statement.
u) Financial guarantees
“Financial guarantees” are defined as contracts whereby an entity undertakes to make specific payments for a third party if the latter does not do so, irrespective of the various legal forms they may have, such as guarantees, irrevocable documentary credits issued or confirmed by the entity, among others.
The Bank initially recognizes the financial guarantees as liability in the consolidated balance sheet at fair value, which is generally the present value of the fees, commissions and similar interest receivable from these contracts over the term thereof, and simultaneously the Bank recognizes, as asset in the consolidated balance sheet, the amount of the fees, commissions and interest received at the start of the transactions and the amounts receivable at the present value of the fees, commissions and interest receivable.
Financial guarantees, regardless of the guarantor, type of instrument or other circumstances, are reviewed periodically so as to determine the credit risk to which they are exposed and, if appropriate, to consider whether a provision is required. The credit risk is determined by application of criteria similar to those established for quantifying impairment losses on debt instruments measured at amortized cost.
The provisions made for these transactions are recognized under “Provisions - Provisions for contingent liabilities, commitments and other provisions” in the consolidated balance sheet (note 21).
If a specific provision is required for financial guarantees, the related unearned commissions recognized under “Financial liabilities at amortized cost – Other financial liabilities” in the consolidated balance sheet are reclassified to the appropriate provision.
v) Assets under management and investment and pension funds managed by the Bank
Assets owned by third parties and managed by the consolidated entities are not presented in the consolidated balance sheet. Management fees are included in “Fee and commission income” in the consolidated income statement. Note 42-b contains information on the third-party assets managed by the Bank.
The investment funds and pension funds managed by the consolidated entities are not recorded in the consolidated balance sheet since the related assets are owned by third parties. The fees and commissions earned in the year for the services rendered by the Bank entities to these funds (asset management and custody services) are recognized under “Fee and commission income” in the consolidated income statement.
F-29
BANCO SANTANDER (BRASIL) S.A.
NOTES TO THE CONSOLIDATED FINANCIAL STATEMENTS
(Amounts in thousands of Brazilian Reais - R$, unless otherwise stated)
w) Post-employment benefits
Post-employment benefit plans include the commitments of the Bank: (i) addition to the benefits of public pension plan; and (ii) healthcare in case of retirement, permanent disability or death for those employees, and their direct beneficiaries.
Defined contribution plans
Defined benefit plans is the post-employment benefit plan which the Bank, and its subsidiaries, as the sponsoring entity pays fixed contributions into a pension fund, not having a legal or constructive obligation to pay further contributions if the fund does not hold sufficient assets to pay all benefits relating to services provided in the current and in previous periods.
The contributions made in this connection are recognized under "Interest Expense and Similar Charges" in the income statement.
Defined benefit plans
Defined benefit plan is the post-employment benefit plan which is not a defined contribution plan and is shown in Note 21.c. For this type of plan, the sponsoring entity's obligation is to provide the benefits agreed with employees, assuming the potential actuarial risk that benefits will cost more than expected.
For defined benefit plan, the amendment of IAS 19 established fundamental changes in the accounting for and disclosure of employee post-employment benefits such as removing the corridor approach in the accounting for the obligation of the plans, as well as changes in the criteria for recognition of conventional interest of plan assets (valuation based on the discount rate actuarial liability).
The adoption of this new accounting policy involves, fundamentally, full recognition of liabilities on account of actuarial losses (actuarial deficit) not recognized previously, in contrast to the stockholders’ equity (Statements of Comprehensive Income).
Main Definitions
- The present value of the defined benefit obligation is the present value of expected future payments required to settle the obligation resulting from employee service in the current and past periods, without deducting any plan assets.
- Deficit or surplus is: (a) the present value of the defined benefit obligation, less (b) the fair value of plan assets.
- The sponsoring entity may recognize the plan's assets in the balance sheet when they meet the following characteristics: (i) the assets of the fund are sufficient to meet all employee benefit plan or a sponsor obligations; or (ii) the assets are returned to the sponsoring entity in order to reimburse it for employee benefits already paid.
- Actuarial gains and losses correspond to changes in the present value of defined benefit obligation resulting from: (a) adjustments by experience (the effects of differences between the actuarial assumptions adopted and what has actually occurred); and (b) effects of changes in actuarial assumptions.
- Current service cost is the increase in the present value of the defined benefit obligation resulting from employee service in the current period.
- The past service cost is the change in present value of defined benefit obligation for employee service in prior periods resulting from a change in the plan or reductions in the number of employees covered.
Post-employment benefits are recognized in income in "Interest expense and similar Charges" and "Provisions (net)".
The defined benefit plans are recorded based on an actuarial study, conducted annually by an external consulting firm, at the end of each year to be effective for the subsequent period.
x) Other long-term employee benefits
“Other long-term employee benefits”, defined as obligations to early retirees considered as those who have ceased to render services at the entity but who, without being legally retired, continue to have economic rights relating to the entity until they acquire the legal status of retiree, long-service bonuses, obligations for death of spouse or disability before retirement that depend on the employee's length of service at the entity and other similar items, are treated for accounting purposes, where applicable, as established above for defined benefit post-employment plans, except that all past service costs and actuarial gains and losses are recognized immediately" (note 21).
y) Termination benefits
Termination benefits are recognized when there is a detailed formal plan identifying the basic changes to be made, provided that implementation of the plan has begun, its main features have been publicly announced or objective facts concerning its implementation have been disclosed.
F-30
BANCO SANTANDER (BRASIL) S.A.
NOTES TO THE CONSOLIDATED FINANCIAL STATEMENTS
(Amounts in thousands of Brazilian Reais - R$, unless otherwise stated)
z) Income taxes
Income tax is calculated at the rate of 15% plus a 10% surtax; social contribution tax is calculated at the rate of 15% for financial institutions, and for non-financial companies the social contribution tax rate is 9%, after adjustments determined by tax legislation.
The expense for corporate income tax is recognized in the consolidated income statement, except when it results from a transaction recognized directly in equity, in which case the tax effect is also recognized in equity.
The current income tax expense is calculated as the sum of the current tax resulting from application of the appropriate tax rate to the taxable profit for the year (net of any deductions allowable for tax purposes), and of the changes in deferred tax assets and liabilities recognized in the consolidated income statement.
“Tax assets” includes the amount of all tax assets, which are broken down into “current” amounts of tax to be recovered within the next twelve months and “deferred” amounts of tax to be recovered in future years, including those arising from unused tax losses or tax credits.
“Tax liabilities” includes the amount of all tax liabilities (except provisions for taxes), which are broken down into “current” amount payable in respect of the income tax on the taxable profit for the year and other taxes in the next twelve months and “deferred” the amount of income tax payable in future years.
Deferred tax assets and liabilities include temporary differences, which are identified as the amounts expected to be payable or recoverable on differences between the carrying amounts of assets and liabilities and their related tax bases, and tax loss and tax credit carryforwards. These amounts are measured at the tax rates that are expected to apply in the period when the asset is realized or the liability is settled.
Deferred tax assets are only recognized for temporary differences to the extent that it is considered probable that the consolidated entities will have sufficient future taxable profits against which the deferred tax assets can be utilized, and the deferred tax assets do not arise from the initial recognition (except in a business combination) of other assets and liabilities in a transaction that affects neither taxable profit or accounting profit. Other deferred tax assets (tax loss and tax credit carryforwards) are only recognized if it is considered probable that the consolidated entities will have sufficient future taxable profits against which they can be utilized.
Income and expenses recognized directly in stockholders equity are accounted for as temporary differences.
The deferred tax assets and liabilities recognized are reassessed at each balance sheet date in order to ascertain whether they still exist, and the appropriate adjustments are made on the basis of the findings of the analyses performed.
Under the current regulation, the expected realization of tax credits based on the Bank's projections of future results and based on technical study, as shown in Note 22.
PIS (Social Integration Program) and COFINS (Tax for Social Security Financing) taxes have been computed at a combined rate of 4.65% on certain gross revenues and expenses. Financial institutions may deduct financial expenses in determining the PIS/COFINS tax basis. PIS and COFINS are considered a profit-base component (net basis of certain revenues and expenses), therefore and accordingly to IAS 12 it is recorded as income taxes.
aa) Consolidated cash flow statements
The following terms are used in the consolidated cash flow statements with the following meanings:
• Cash flows: inflows and outflows of cash and cash equivalents, which are short-term, highly liquid investments that are subject to an insignificant risk of changes in value and original maturity of three months or less.
• Operating activities: the primary revenue-generating activities of credit institutions and other activities that are not investing or financing activities.
• Investing activities: the acquisition and disposal of long-term assets and other investments not included in cash and cash equivalents.
• Financing activities: activities that result in changes in the size and breakdown of the equity and liabilities that are not operating activities.
In preparing the consolidated cash flows statement, the high liquidity investments with insignificant risk of changes in their values were classified as "Cash and cash equivalents". The Bank classifies as cash and cash equivalents balances recorded under "Cash and balance with the Brazilian Central Bank" and "Loans and amounts due from credit institutions" in the consolidated balance sheet, except restricted resources and long-term transactions.
The interest paid and received correspond basically to operating activities of Banco Santander.
F-31
BANCO SANTANDER (BRASIL) S.A.
NOTES TO THE CONSOLIDATED FINANCIAL STATEMENTS
(Amounts in thousands of Brazilian Reais - R$, unless otherwise stated)
a) Sale of the Investment Fund Management and Managed Portfolio Operations, Currently Developed by Santander Brasil Asset
On December 17, 2013, was concluded the operation involving the sale of its asset management business, by Banco Santander current developed by Santander Brasil Asset ("Transaction"), as informed in the Material Fact dated May 30, 2013, the Transaction falls within the context of a partnership abroad between Banco Santander Spain and the world’s leading private equity companies, Warburg Pincus and General Atlantic., which aims to promote the global growth of its unit management of third party funds, as relevant Fact as of May 30, 2013. This operation generated a gain to Banco Santander of R$ 2,008 million before taxes (Tax effect R$803 million).
Within the scope of the Transaction, Banco Santander disposal all Santander Brasil Asset shares, of which, during Transaction, the asset management activity then performed by Santander Brasil Asset, was segregated from third-party fund allocation activity into a new asset manager created for that purposes (“Asset Manager”).
As part of the Transaction, was entered into between the Asset Manager and Banco Santander a trade agreement establishing the general rules for the management and distribution of products and services to Banco Santander's customers. Banco Santander will remain as manager and dispenser of funds, receiving remuneration consistent with market practices.
b) Establishment of foreign subsidiary
Banco Santander established an independent subsidiary in Spain, Santander Brasil Establecimiento Financieiro de Credito, S.A. (Santander EFC), in order to complement the foreign trade strategy for corporate clients - large Brazilian companies and their operations abroad - and offer financial products and services through an offshore entity that is not established in a jurisdiction with favorable tax treatment.
The approval process of the establishment of foreign subsidiary before the regulatory bodies (Bacen, Spanish Ministerio de Economia y Hacienda and by Banco de España) was completed on March, 28, 2012. The paid-up share capital of Santander EFC was €748 million.
c) Sale of Zurich Santander Brasil Seguros e Previdência S.A. (formerly Santander Seguros S.A.)
On October 5, 2011, Banco Santander concluded the sale of all shares issued by Zurich Santander Brasil Seguros e Previdência S.A. and indirectly by Zurich Santander Brasil Seguros S.A. (the new corporate name of Santander Brasil Seguros S.A.) to the following companies: (i) Zurich Santander Insurance America S.L. (Zurich Santander), a holding company based in Spain that was 51% held (fifty one percent) by Zurich Financial Services Ltd. and its affiliates (Zurich) and 49% held (forty nine percent) by Santander Spain, and (ii) Inversiones ZS America SPA, a company established in Chile and held by Zurich Santander (Inversiones ZS). On June 8, 2012 SUSEP approved the transfer of the direct control of Zurich Santander Brasil Seguros e Previdência S.A. to Zurich Santander Holding (Spain), S.L., a holding company based in Spain that is 100% held by Zurich Santander and currently the owner of the shares initially transferred to Zurich Santander.
This closing effected the transfer (i) by Banco Santander to Zurich Santander of 11,251,174,948 common shares of Zurich Santander Brasil Seguros e Previdência S.A., and to Inversiones ZS of 3 common shares of Zurich Santander Brasil Seguros e Previdência S.A. and (ii) payment of the preliminary purchase sale price to Banco Santander, amounting to a net of R$2,741,102 thousands (received on October 5,2011). On May 10, 2013 the final purchase price was defined by the parties in the amount of R$ 2,744,990 thousands, resulting in a price reduction in the aggregate amount of R$ 6,567,142 thousands. On September 3, 2013, Banco Santander concluded the offering of preemptive rights to shareholders, in accordance with Article 253 of Brazilian Corporate Law.
The assets of Zurich Santander Brasil Seguros e Previdência S.A. R$24,731,463 thousands, are primarily composed of R$21,551,422 thousands in debts instruments and equity (public securities, private and fund units specially constituted - guarantors of benefit plans - PGBL/VGBL). The liabilities of Zurich Santander Brasil Seguros e Previdência S.A. amount to R$22,349,428 thousands, main, represented by R$21,278,718 thousands in liabilities for securities agreements relating to technical provision for insurance operations and pension plans. The gain recognized in this operation was R$424,292 thousands, recorded as a result of our disposal of non-current assets held for sale that were not classified as discontinued operations.
This transaction fits into the strategic partnership between Santander Spain and Zurich, involving the acquisition by Zurich Santander of all property and casualty insurers and life and welfare of Santander Spain in Argentina, Brazil, Chile, Mexico and Uruguay.
F-32
BANCO SANTANDER (BRASIL) S.A.
NOTES TO THE CONSOLIDATED FINANCIAL STATEMENTS
(Amounts in thousands of Brazilian Reais - R$, unless otherwise stated)
As part of the arrangement of the transaction, Banco Santander exclusively distributes these insurance products over the next 25 years through its branch network, with the exception of automobile insurance that is not included in the scope of the transaction. As a result of these contracts, Banco Santander receives a relative payment equivalent to that received before the transaction. The operation aims to promote and strengthen Banco Santander activities in the insurance market, providing a greater range of products, reaching classes of customers not currently being reached and leveraging the distribution capabilities of Banco Santander.
d) Partial spin-off of Zurich Santander Brasil Seguros e Previdência S.A. with the transfer of the split portion to Sancap Investimentos e Participações S.A.
In the context of sale transaction of Zurich Santander Brasil Seguros e Previdência S.A., at the extraordinary stockholders' meeting held on April 29, 2011, was approved the partial spin-off of Zurich Santander Brasil Seguros e Previdência S.A. with the transfer of its equity to a new company, constituted in the act of the partial spin-off, under the company name of Sancap Investimentos e Participações S.A. (“Sancap”). The spun-off assets to Sancap is total amounting of R$511,774 and refers only and exclusively to the totality of the participation held by Zurich Santander Brasil Seguros e Previdência capital. The partial spin-off was approved by Susep on August 9, 2011.
|
Thousands of Reais
|
2013
|
2012
|
2011
|
|||||||||
|
|
|
|
|
|||||||||
|
Cash and cash equivalents
|
3,533,344 | 4,114,775 | 3,542,707 | |||||||||
|
of which:
|
||||||||||||
|
Cash
|
3,533,344 | 4,114,775 | 3,542,707 | |||||||||
|
Money market investments
(1)
|
12,793,443 | 17,337,140 | 17,607,917 | |||||||||
|
Central bank compulsory deposits
(2)
|
35,387,423 | 34,083,325 | 44,787,379 | |||||||||
|
Total
|
51,714,210 | 55,535,240 | 65,938,003 | |||||||||
(1) Includes securities purchased under agreements to resell, long term and not considered cash equivalents.
(2) Central bank compulsory deposits relate to a minimum balance that financial institutions are required to maintain with the Central Bank of Brazil based on a percentage of deposits received from third parties, considered as restricted use of resources.
The breakdown, by classification, type and currency, of the balances of “Loans and amounts due from credit institutions” in the consolidated balance sheets is as follows:
|
Thousands of Reais
|
2013
|
2012
|
2011
|
|||||||||
|
|
|
|
|
|||||||||
|
Classification:
|
|
|
|
|||||||||
|
Other financial assets at fair value through profit or loss
|
112 | 5,065 | 60,813 | |||||||||
|
Loans and receivables
|
46,043,184 | 29,913,132 | 19,628,861 | |||||||||
|
Of which:
|
||||||||||||
|
Loans and amounts due from credit institutions, gross
|
46,211,607 | 29,988,338 | 19,690,528 | |||||||||
|
Impairment losses (note 9.c)
|
(168,423 | ) | (75,206 | ) | (61,667 | ) | ||||||
|
Loans and amounts due from credit institutions, net
|
46,043,296 | 29,918,197 | 19,689,674 | |||||||||
|
Loans and amounts due from credit institutions, gross
|
46,211,719 | 29,993,403 | 19,751,341 | |||||||||
|
Type:
|
||||||||||||
|
Applications in time deposits
(2)
|
4,442,671 | 8,719,825 | 7,136,037 | |||||||||
|
Reverse repurchase agreements
(1) (2)
|
19,602,697 | 3,616,002 | 1,039,551 | |||||||||
|
Escrow deposits
|
7,422,359 | 7,573,599 | 6,868,943 | |||||||||
|
Cash and Foreign currency investments
(2)
|
14,608,963 | 9,921,309 | 4,247,179 | |||||||||
|
Other accounts
|
135,029 | 162,668 | 459,631 | |||||||||
|
Total
|
46,211,719 | 29,993,403 | 19,751,341 | |||||||||
|
Currency:
|
||||||||||||
|
Brazilian Real
|
35,828,923 | 21,803,005 | 15,067,109 | |||||||||
|
US dollar
|
9,131,549 | 7,782,694 | 4,300,075 | |||||||||
|
Euro
|
1,248,077 | 406,064 | 354,078 | |||||||||
|
Pound sterling
|
2,070 | 446 | 4,519 | |||||||||
|
Other currencies
|
1,100 | 1,194 | 25,560 | |||||||||
|
Total
|
46,211,719 | 29,993,403 | 19,751,341 | |||||||||
(1) Collateralized by debt instruments.
(2) Includes R$34,454,664 (2012 - R$15,502,905 and 2011 - R$ 5,474,700), of short-term transactions and low risk of change in its value, considered cash equivalents.
F-33
BANCO SANTANDER (BRASIL) S.A.
NOTES TO THE CONSOLIDATED FINANCIAL STATEMENTS
(Amounts in thousands of Brazilian Reais - R$, unless otherwise stated)
Note 41-d contains a detail of the residual maturity periods of loans and receivables and of the related average interest rates.
The breakdown, by classification, type and currency, of the balances of “Debt instruments” is as follows:
|
Thousands of Reais
|
2013
|
2012
|
2011
|
|||||||||
|
|
|
|
|
|||||||||
|
Classification:
|
|
|
|
|||||||||
|
Financial assets held for trading
|
22,840,499 | 26,646,708 | 25,298,804 | |||||||||
|
Other financial assets at fair value through profit or loss
|
105,850 | 124,187 | 230,037 | |||||||||
|
Available-for-sale financial assets
|
44,957,272 | 43,044,570 | 43,300,354 | |||||||||
|
Loans and receivables
|
- | 269,612 | 62,062 | |||||||||
|
Total
|
67,903,621 | 70,085,077 | 68,891,257 | |||||||||
|
Type:
|
||||||||||||
|
Government securities - Brazil
(1)
|
51,618,879 | 57,188,916 | 56,833,361 | |||||||||
|
Debentures and Promissory notes
|
12,134,183 | 8,866,474 | 8,281,136 | |||||||||
|
Other debt securities
|
4,150,559 | 4,029,687 | 3,776,760 | |||||||||
|
Total
|
67,903,621 | 70,085,077 | 68,891,257 | |||||||||
|
Currency:
|
||||||||||||
|
Brazilian Real
|
65,664,839 | 69,214,546 | 68,187,066 | |||||||||
|
US dollar
|
2,238,782 | 870,531 | 704,191 | |||||||||
|
Total
|
67,903,621 | 70,085,077 | 68,891,257 | |||||||||
(1) Includes, substantially, National Treasury Bills (LTN), Treasury Bills (LFT) e National Treasury Notes (NTN-A, NTN-B, NTN-C e NTN-F).
As at December 31, 2013, includes R$29,134,247 (2012 - R$25,650,177 and 2011 - R$34,521,029) of debt securities relating to repurchase agreements, R$4,722,191 (2012 - R$1,487,183 and 2011 - R$2,221,258) to compulsory deposits in Central Bank, R$6,188,885 (2012 - R$8,146,345 and 2011 - R$8,851,981) to guarantee of BM&FBovespa transactions and R$2,726,887 (2012 - R$3,228,030 and 2011 - R$3,066,458) to escrow deposits and other guarantee.
Note 41-d contains a detail of the residual maturity periods of available-for-sale financial assets and of loans and receivables and of the related average interest rates.
a) Breakdown
The breakdown, by classification and type, of the balances of “Equity instruments” is as follows:
|
Thousands of Reais
|
2013
|
2012
|
2011
|
|||||||||
|
|
|
|
|
|||||||||
|
Classification:
|
|
|
|
|||||||||
|
Financial assets held for trading
|
477,577 | 428,589 | 448,209 | |||||||||
|
Other financial assets at fair value through profit or loss
|
1,192,334 | 1,099,066 | 374,519 | |||||||||
|
Available-for-sale financial assets
|
1,329,810 | 1,104,050 | 1,307,847 | |||||||||
|
Total
|
2,999,721 | 2,631,705 | 2,130,575 | |||||||||
|
Type:
|
||||||||||||
|
Shares of Brazilian companies
|
1,124,152 | 913,719 | 1,001,644 | |||||||||
|
Shares of foreign companies
|
149,109 | 349 | 1,229 | |||||||||
|
Investment fund units and shares
(1)
|
1,726,460 | 1,717,637 | 1,127,702 | |||||||||
|
Total
|
2,999,721 | 2,631,705 | 2,130,575 | |||||||||
(1) Composite, principally, by stock investment.
b) Changes
The changes in the balance of “Equity instruments – Financial assets held for trading” were as follows:
|
Thousands of Reais
|
2013
|
2012
|
2011
|
|||||||||
|
Balance at beginning of year
|
428,589 | 448,209 | 3,283,931 | |||||||||
|
Changes in the scope of consolidation (note 3.c)
|
- | - | (1,643,066 | ) | ||||||||
|
Net additions /disposals
|
49,491 | (20,026 | ) | (1,193,006 | ) | |||||||
|
Valuation adjustments
|
(503 | ) | 406 | 350 | ||||||||
|
Balance at end of year
|
477,577 | 428,589 | 448,209 | |||||||||
F-34
BANCO SANTANDER (BRASIL) S.A.
NOTES TO THE CONSOLIDATED FINANCIAL STATEMENTS
(Amounts in thousands of Brazilian Reais - R$, unless otherwise stated)
The changes in the balance of “Equity instruments – Other financial assets at fair value through profit or loss” were as follows:
|
Thousands of Reais
|
2013
|
2012
|
2011
|
|||||||||
|
Balance at beginning of year
|
1,099,066 | 374,519 | 17,423,359 | |||||||||
|
Changes in the scope of consolidation (note 3.c)
|
- | - | (19,819,585 | ) | ||||||||
|
Net additions /disposals
|
93,268 | 724,547 | 374,518 | |||||||||
|
Valuation adjustments
(1)
|
- | - | 2,396,227 | |||||||||
|
Balance at end of year
|
1,192,334 | 1,099,066 | 374,519 | |||||||||
(1) Refers to variation of the Investment fund units Guarantors of Benefit Plans - PGBL/VGBL are accounted as income in "Other operating income (expense) - Expense from insurance contracts" net of the variations of their technical provisions.
|
Thousands of Reais
|
2013
|
2012
|
2011
|
|||||||||
|
|
|
|
|
|||||||||
|
Balance at beginning of year
|
1,104,050 | 1,307,847 | 1,728,037 | |||||||||
|
Net changes in the scope of consolidation (note 3.c)
|
- | - | (18,539 | ) | ||||||||
|
Net additions /disposals
|
428,274 | (201,249 | ) | (319,221 | ) | |||||||
|
Valuation adjustments
|
15,849 | (2,548 | ) | (82,430 | ) | |||||||
|
Impairment
(1)
|
(218,363 | ) | - | - | ||||||||
|
Balance at end of year
|
1,329,810 | 1,104,050 | 1,307,847 | |||||||||
(1)
Corresponds to registration of losses of permanent character in the realization value of bonds and securities classified in categories securities available for sale recognized currently in earnings on “Other financial instruments not measured at fair value through profit or loss”.
a) Notional amounts and market values of trading and hedging derivatives
a.1) Derivatives Recorded in Memorandum and Balance Sheets
Portfolio Summary of Trading Derivative and Used as Hedge
|
2013
|
2012
|
2011
|
||||||||||
|
Assets
|
||||||||||||
|
Swap Differentials Receivable
|
5,567,911 | 4,092,378 | 3,334,672 | |||||||||
|
Option Premiums to Exercise
|
500,886 | 297,124 | 208,117 | |||||||||
|
Forward Contracts and Others
|
1,154,731 | 329,633 | 692,401 | |||||||||
|
Total
|
7,223,528 | 4,719,135 | 4,235,190 | |||||||||
|
Liabilities
|
||||||||||||
|
Swap Differentials Payable
|
4,217,405 | 4,327,209 | 3,485,915 | |||||||||
|
Option Premiums Launched
|
690,743 | 456,172 | 537,474 | |||||||||
|
Forward Contracts and Others
|
1,138,630 | 609,717 | 722,342 | |||||||||
|
Total
|
6,046,778 | 5,393,098 | 4,745,731 | |||||||||
|
Summary by Category
|
||||||||||||
|
Trading
|
December 31, 2013
|
|||||||||||
|
Notional
|
Cost
|
Fair Value
|
||||||||||
|
"Swap"
|
724,783 | 1,656,672 | ||||||||||
|
Asset
|
178,606,316 | 17,535,192 | 18,755,675 | |||||||||
|
CDI (Interbank Deposit Rates)
|
48,684,752 | 16,464,230 | 17,210,663 | |||||||||
|
Fixed Interest Rate - Real
(1)
|
36,600,526 | - | - | |||||||||
|
Indexed to Price and Interest Rates
|
16,519,189 | - | - | |||||||||
|
Indexed to Foreign Currency
|
76,750,555 | 1,043,589 | 1,497,546 | |||||||||
|
Others
|
51,294 | 27,373 | 47,466 | |||||||||
|
Liabilities
|
177,881,533 | (16,810,409 | ) | (17,099,003 | ) | |||||||
|
CDI (Interbank Deposit Rates)
|
32,220,522 | - | - | |||||||||
|
Fixed Interest Rate - Real
|
52,396,615 | (15,796,089 | ) | (15,930,641 | ) | |||||||
|
Indexed to Price and Interest Rates
|
17,533,509 | (1,014,320 | ) | (1,168,362 | ) | |||||||
|
Indexed to Foreign Currency
(1)
|
75,706,966 | - | - | |||||||||
|
Others
|
23,921 | - | - | |||||||||
F-35
BANCO SANTANDER (BRASIL) S.A.
NOTES TO THE CONSOLIDATED FINANCIAL STATEMENTS
(Amounts in thousands of Brazilian Reais - R$, unless otherwise stated)
|
Trading
|
December 31, 2013
|
|||||||||||
|
Notional
|
Cost
|
Fair Value
|
||||||||||
|
Options
|
234,782,478 | (84,844 | ) | (189,857 | ) | |||||||
|
Purchased Position
|
111,750,290 | 431,770 | 500,886 | |||||||||
|
Call Option - US Dollar
|
3,815,905 | 108,122 | 178,192 | |||||||||
|
Put Option - US Dollar
|
1,407,427 | 36,455 | 39,582 | |||||||||
|
Call Option - Other
|
45,136,315 | 202,542 | 211,330 | |||||||||
|
Interbank Market
|
43,304,479 | 88,525 | 149,768 | |||||||||
|
Others
(2)
|
1,831,836 | 114,017 | 61,562 | |||||||||
|
Put Option - Other
|
61,390,643 | 84,651 | 71,782 | |||||||||
|
Interbank Market
|
57,052,006 | 43,746 | 9,022 | |||||||||
|
Others
(2)
|
4,338,637 | 40,905 | 62,760 | |||||||||
|
Sold Position
|
123,032,188 | (516,614 | ) | (690,743 | ) | |||||||
|
Call Option - US Dollar
|
3,507,854 | (204,056 | ) | (314,271 | ) | |||||||
|
Put Option - US Dollar
|
772,847 | (16,514 | ) | (20,075 | ) | |||||||
|
Call Option - Other
|
63,515,372 | (180,324 | ) | (267,640 | ) | |||||||
|
Interbank Market
|
61,871,607 | (106,328 | ) | (214,387 | ) | |||||||
|
Others
(2)
|
1,643,765 | (73,996 | ) | (53,253 | ) | |||||||
|
Put Option - Other
|
55,236,115 | (115,720 | ) | (88,757 | ) | |||||||
|
Interbank Market
|
51,288,888 | (44,524 | ) | (12,019 | ) | |||||||
|
Others
(2)
|
3,947,227 | (71,196 | ) | (76,738 | ) | |||||||
|
Futures Contracts
|
123,646,819 | - | - | |||||||||
|
Purchased Position
|
41,654,829 | - | - | |||||||||
|
Exchange Coupon (DDI)
|
3,772,361 | - | - | |||||||||
|
Interest Rates (DI1 and DIA)
|
29,099,344 | - | - | |||||||||
|
Foreign Currency
|
8,167,914 | - | - | |||||||||
|
Indexes
(3)
|
598,874 | - | - | |||||||||
|
Others
|
16,336 | - | - | |||||||||
|
Sold Position
|
81,991,990 | - | - | |||||||||
|
Exchange Coupon (DDI)
|
30,021,614 | - | - | |||||||||
|
Interest Rates (DI1 and DIA)
|
10,266,576 | - | - | |||||||||
|
Foreign Currency
|
18,179,682 | - | - | |||||||||
|
Indexes
(3)
|
64,008 | - | - | |||||||||
|
Average rate of Repo Operations (OC1)
|
23,460,110 | - | - | |||||||||
|
Forward Contracts and Others
|
26,308,836 | 418,810 | 16,101 | |||||||||
|
Purchased Commitment
|
14,198,260 | (244,539 | ) | (92,565 | ) | |||||||
|
Currencies
|
13,147,558 | (244,539 | ) | (92,565 | ) | |||||||
|
Others
|
1,050,702 | - | - | |||||||||
|
Sell Commitment
|
12,110,576 | 663,349 | 108,666 | |||||||||
|
Currencies
|
11,711,716 | 660,462 | 105,756 | |||||||||
|
Others
|
398,860 | 2,887 | 2,910 | |||||||||
F-36
BANCO SANTANDER (BRASIL) S.A.
NOTES TO THE CONSOLIDATED FINANCIAL STATEMENTS
(Amounts in thousands of Brazilian Reais - R$, unless otherwise stated)
|
Summary by Category
|
||||||||||||
|
Trading
|
December 31, 2012
|
|||||||||||
|
Notional
|
Cost
|
Fair Value
|
||||||||||
|
"Swap"
|
(116,636 | ) | (109,449 | ) | ||||||||
|
Asset
|
112,138,690 | 15,982,326 | 16,792,479 | |||||||||
|
CDI (Interbank Deposit Rates)
|
34,842,507 | 4,335,903 | 4,981,610 | |||||||||
|
Fixed Interest Rate - Real
(1)
|
16,341,376 | 11,646,423 | 11,810,869 | |||||||||
|
Indexed to Price and Interest Rates
|
14,386,596 | - | - | |||||||||
|
Indexed to Foreign Currency
|
46,477,772 | - | - | |||||||||
|
Others
|
90,439 | - | - | |||||||||
|
Liabilities
|
112,255,326 | (16,098,962 | ) | (16,901,928 | ) | |||||||
|
CDI (Interbank Deposit Rates)
|
30,506,604 | - | - | |||||||||
|
Fixed Interest Rate - Real
|
4,694,953 | - | - | |||||||||
|
Indexed to Price and Interest Rates
|
19,509,496 | (5,122,900 | ) | (5,512,171 | ) | |||||||
|
Indexed to Foreign Currency
(1)
|
57,406,818 | (10,929,046 | ) | (11,355,697 | ) | |||||||
|
Others
|
137,455 | (47,016 | ) | (34,060 | ) | |||||||
|
Options
|
266,060,940 | (94,067 | ) | (159,048 | ) | |||||||
|
Purchased Position
|
107,224,381 | 228,378 | 297,124 | |||||||||
|
Call Option - US Dollar
|
1,792,837 | 44,838 | 31,993 | |||||||||
|
Put Option - US Dollar
|
1,748,915 | 24,039 | 24,087 | |||||||||
|
Call Option - Other
|
46,244,224 | 86,370 | 45,920 | |||||||||
|
Interbank Market
|
45,411,468 | 51,667 | 2,289 | |||||||||
|
Others
(2)
|
832,756 | 34,703 | 43,631 | |||||||||
|
Put Option - Other
|
57,438,405 | 73,131 | 195,124 | |||||||||
|
Interbank Market
|
56,963,540 | 57,121 | 185,813 | |||||||||
|
Others
(2)
|
474,865 | 16,010 | 9,311 | |||||||||
|
Sold Position
|
158,836,559 | (322,445 | ) | (456,172 | ) | |||||||
|
Call Option - US Dollar
|
1,453,215 | (36,653 | ) | (28,003 | ) | |||||||
|
Put Option - US Dollar
|
1,385,098 | (14,684 | ) | (6,036 | ) | |||||||
|
Call Option - Other
|
83,389,536 | (152,818 | ) | (103,294 | ) | |||||||
|
Interbank Market
|
81,602,615 | (68,927 | ) | (4,241 | ) | |||||||
|
Others
(2)
|
1,786,921 | (83,891 | ) | (99,053 | ) | |||||||
|
Put Option - Other
|
72,608,710 | (118,290 | ) | (318,839 | ) | |||||||
|
Interbank Market
|
71,156,608 | (64,771 | ) | (272,536 | ) | |||||||
|
Others
(2)
|
1,452,102 | (53,519 | ) | (46,303 | ) | |||||||
|
Futures Contracts
|
61,247,088 | - | - | |||||||||
|
Purchased Position
|
40,376,893 | - | - | |||||||||
|
Exchange Coupon (DDI)
|
2,916,996 | - | - | |||||||||
|
Interest Rates (DI1 and DIA)
|
30,144,684 | - | - | |||||||||
|
Foreign Currency
|
6,576,093 | - | - | |||||||||
|
Indexes
(3)
|
133,917 | - | - | |||||||||
|
Treasury Bonds/Notes
|
605,203 | - | - | |||||||||
|
Sold Position
|
20,870,195 | - | - | |||||||||
|
Exchange Coupon (DDI)
|
14,091,511 | - | - | |||||||||
|
Interest Rates (DI1 and DIA)
|
6,556,673 | - | - | |||||||||
|
Foreign Currency
|
12,414 | - | - | |||||||||
|
Indexes
(3)
|
17,926 | - | - | |||||||||
|
Treasury Bonds/Notes
|
191,671 | - | - | |||||||||
|
Forward Contracts and Others
|
21,766,014 | 166,807 | (280,084 | ) | ||||||||
|
Purchased Commitment
|
11,046,667 | (593,458 | ) | 197,859 | ||||||||
|
Currencies
|
11,046,667 | (593,458 | ) | 197,859 | ||||||||
|
Sell Commitment
|
10,719,347 | 760,265 | (477,943 | ) | ||||||||
|
Currencies
|
10,797,139 | 745,350 | (185,614 | ) | ||||||||
|
Others
|
(77,792 | ) | 14,915 | (292,329 | ) | |||||||
F-37
BANCO SANTANDER (BRASIL) S.A.
NOTES TO THE CONSOLIDATED FINANCIAL STATEMENTS
(Amounts in thousands of Brazilian Reais - R$, unless otherwise stated)
|
Trading
|
December 31, 2011
|
|||||||||||
|
Notional
|
Cost
|
Fair Value
|
||||||||||
|
"Swap"
|
(232,234 | ) | (195,880 | ) | ||||||||
|
Asset
|
99,094,099 | 9,085,753 | 9,228,909 | |||||||||
|
CDI (Interbank Deposit Rates)
|
32,413,067 | 8,712,638 | 8,223,265 | |||||||||
|
Fixed Interest Rate - Real
(1)
|
5,684,619 | 373,115 | 1,005,644 | |||||||||
|
Indexed to Price and Interest Rates
|
13,259,314 | - | - | |||||||||
|
Indexed to Foreign Currency
|
47,621,292 | - | - | |||||||||
|
Others
|
115,807 | - | - | |||||||||
|
Liabilities
|
99,326,333 | (9,317,987 | ) | (9,424,789 | ) | |||||||
|
CDI (Interbank Deposit Rates)
|
23,700,429 | - | - | |||||||||
|
Fixed Interest Rate - Real
|
5,311,504 | - | - | |||||||||
|
Indexed to Price and Interest Rates
|
19,781,674 | (6,522,360 | ) | (6,352,475 | ) | |||||||
|
Indexed to Foreign Currency
(1)
|
50,340,717 | (2,719,425 | ) | (3,004,037 | ) | |||||||
|
Others
|
192,009 | (76,202 | ) | (68,277 | ) | |||||||
|
Options
|
266,612,580 | (217,101 | ) | (329,357 | ) | |||||||
|
Purchased Position
|
110,672,248 | 239,107 | 208,117 | |||||||||
|
Call Option - US Dollar
|
1,299,890 | 22,549 | 39,528 | |||||||||
|
Put Option - US Dollar
|
794,230 | 2,656 | 65 | |||||||||
|
Call Option - Other
|
74,456,856 | 111,458 | 48,267 | |||||||||
|
Interbank Market
|
73,455,970 | 62,801 | 14,994 | |||||||||
|
Others
(2)
|
1,000,886 | 48,657 | 33,273 | |||||||||
|
Put Option - Other
|
34,121,272 | 102,444 | 120,257 | |||||||||
|
Interbank Market
|
31,754,691 | 16,250 | 41,309 | |||||||||
|
Others
(2)
|
2,366,581 | 86,194 | 78,948 | |||||||||
|
Sold Position
|
155,940,332 | (456,208 | ) | (537,474 | ) | |||||||
|
Call Option - US Dollar
|
2,842,096 | (21,179 | ) | (17,896 | ) | |||||||
|
Put Option - US Dollar
|
2,848,995 | (19,867 | ) | (7,683 | ) | |||||||
|
Call Option - Other
|
69,094,441 | (187,362 | ) | (100,105 | ) | |||||||
|
Interbank Market
|
67,744,926 | (87,838 | ) | (20,471 | ) | |||||||
|
Others
(2)
|
1,349,515 | (99,524 | ) | (79,634 | ) | |||||||
|
Put Option - Other
|
81,154,800 | (227,800 | ) | (411,790 | ) | |||||||
|
Interbank Market
|
78,492,974 | (101,163 | ) | (293,479 | ) | |||||||
|
Others
(2)
|
2,661,826 | (126,637 | ) | (118,311 | ) | |||||||
|
Futures Contracts
|
100,361,012 | - | - | |||||||||
|
Purchased Position
|
46,879,640 | - | - | |||||||||
|
Exchange Coupon (DDI)
|
1,727,725 | - | - | |||||||||
|
Interest Rates (DI1 and DIA)
|
42,328,562 | - | - | |||||||||
|
Foreign Currency
|
2,563,038 | - | - | |||||||||
|
Indexes
(3)
|
78,332 | - | - | |||||||||
|
Treasury Bonds/Notes
|
178,570 | - | - | |||||||||
|
Others
|
3,413 | - | - | |||||||||
|
Sold Position
|
53,481,372 | - | - | |||||||||
|
Exchange Coupon (DDI)
|
17,359,882 | - | - | |||||||||
|
Interest Rates (DI1 and DIA)
|
21,981,554 | - | - | |||||||||
|
Foreign Currency
|
13,923,253 | - | - | |||||||||
|
Indexes
(3)
|
38,496 | - | - | |||||||||
|
Treasury Bonds/Notes
|
178,187 | - | - | |||||||||
|
Forward Contracts and Others
|
22,726,891 | (13,508 | ) | (29,941 | ) | |||||||
|
Purchased Commitment
|
11,564,473 | 412,217 | 298,083 | |||||||||
|
Currencies
|
11,556,048 | 412,217 | 298,083 | |||||||||
|
Others
|
8,425 | - | - | |||||||||
|
Sell Commitment
|
11,162,418 | (425,725 | ) | (328,024 | ) | |||||||
|
Currencies
|
11,138,022 | (442,856 | ) | (272,312 | ) | |||||||
|
Others
|
24,396 | 17,131 | (55,712 | ) | ||||||||
(1) In 2012 and 2011, Includes credit derivatives.
(2) Includes stock options, indices and commodities.
(3) Includes Bovespa index and S&P.
F-38
BANCO SANTANDER (BRASIL) S.A.
NOTES TO THE CONSOLIDATED FINANCIAL STATEMENTS
(Amounts in thousands of Brazilian Reais - R$, unless otherwise stated)
a.2) Derivatives Financial Instruments by Counterparty
|
Notional
|
2013
|
2012
|
2011
|
|||||||||||||||||||||
|
Related
|
Financial
|
|||||||||||||||||||||||
|
Customers
|
Parties
|
Institutions
(1)
|
Total
|
Total
|
Total
|
|||||||||||||||||||
|
"Swap"
|
36,552,414 | 86,954,433 | 55,099,469 | 178,606,316 | 112,138,690 | 99,094,099 | ||||||||||||||||||
|
Options
|
3,263,388 | 730,059 | 230,789,031 | 234,782,478 | 266,060,940 | 266,612,580 | ||||||||||||||||||
|
Futures Contracts
|
- | - | 123,646,819 | 123,646,819 | 61,247,088 | 100,361,012 | ||||||||||||||||||
|
Forward Contracts and Others
|
13,628,060 | 9,257,517 | 3,423,259 | 26,308,836 | 21,766,014 | 22,726,891 | ||||||||||||||||||
(1) Includes trades with the BM&FBovespa and other securities and commodities exchanges.
a.3) Derivatives Financial Instruments by Maturity
|
Notional
|
2013
|
2012
|
2011
|
|||||||||||||||||||||
|
Up to
|
From 3 to
|
Over
|
||||||||||||||||||||||
|
3 Months
|
12 Months
|
12 Months
|
Total
|
Total
|
Total
|
|||||||||||||||||||
|
"Swap"
|
40,200,385 | 50,392,769 | 88,013,162 | 178,606,316 | 112,138,690 | 99,094,099 | ||||||||||||||||||
|
Options
|
165,992,171 | 40,560,563 | 28,229,744 | 234,782,478 | 266,060,940 | 266,612,580 | ||||||||||||||||||
|
Futures Contracts
|
54,465,502 | 33,816,696 | 35,364,621 | 123,646,819 | 61,247,088 | 100,361,012 | ||||||||||||||||||
|
Forward Contracts and Others
|
11,148,113 | 6,402,559 | 8,758,164 | 26,308,836 | 21,766,014 | 22,726,891 | ||||||||||||||||||
a.4) Derivatives by Market Trading
| Notional |
Stock
|
Over the
|
2013
|
2012
|
2011
|
|||||||||||||||||||
| Exchange (1) |
Cetip
(2)
|
Counter | Total | Total |
Total
|
|||||||||||||||||||
|
"Swap"
|
48,944,989 | 51,377,800 | 78,283,527 | 178,606,316 | 112,138,690 | 99,094,099 | ||||||||||||||||||
|
Options
|
224,282,471 | 2,796,722 | 7,703,285 | 234,782,478 | 266,060,940 | 266,612,580 | ||||||||||||||||||
|
Futures Contracts
|
123,646,819 | - | - | 123,646,819 | 61,247,088 | 100,361,012 | ||||||||||||||||||
|
Forward Contracts and Others
|
- | 16,164,648 | 10,144,188 | 26,308,836 | 21,766,014 | 22,726,891 | ||||||||||||||||||
(1) Includes trades with the BM&FBovespa and other securities and commodities exchanges.
(2) Includes amount traded on other clearinghouses.
a.5) Credit Derivatives
Transactions involving credit derivatives are carried out in order to reduce or eliminate exposure to specific risks arising from the purchase or sale of assets within the concept of credit portfolio management.
In December 31, 2012, the volume of credit derivatives with total return rate - credit risk received corresponds to R$607,119 (2011- R$557,327) of cost and R$669,507 (2011 - R$500,425) of market value and required stockholders' equity used amounted to R$3,585 (2011 - R$3,291).
F-39
BANCO SANTANDER (BRASIL) S.A.
NOTES TO THE CONSOLIDATED FINANCIAL STATEMENTS
(Amounts in thousands of Brazilian Reais - R$, unless otherwise stated)
a.6) Derivatives Used as Hedge Instruments
Derivatives used as hedge by index are as follows:
Market Risk Hedge
|
2013
|
||||||||||||
|
Adjustment
|
||||||||||||
|
Cost
|
to Market
|
Fair Value
|
||||||||||
|
Hedge Instruments
|
||||||||||||
|
Swap Contracts
|
38,532 | (68,228 | ) | (29,696 | ) | |||||||
|
Asset
|
2,514,466 | (562,968 | ) | 1,951,498 | ||||||||
|
CDI (Interbank Deposit Rates)
(1) (2)
|
1,206,647 | (685,468 | ) | 521,179 | ||||||||
|
Indexed to Foreign Currency - Libor - US Dollar
(2) (3) (4) (6)
|
498,575 | 28,638 | 527,213 | |||||||||
|
Indexed to Foreign Currency - Fixed Interest - Swiss Franc
(5)
|
330,511 | 4,603 | 335,114 | |||||||||
|
Indexed to Foreign Currency - Euro
(1)
|
478,733 | 89,259 | 567,992 | |||||||||
|
Liabilities
|
(2,475,934 | ) | 494,740 | (1,981,194 | ) | |||||||
|
Indexed to Foreign Currency - US Dollar
(1)
|
(1,221,704 | ) | (157,150 | ) | (1,378,854 | ) | ||||||
|
Indexed to Foreign Currency - Fixed Interest
(2)
|
(538,292 | ) | 668,433 | 130,141 | ||||||||
|
Indexed to Foreign Currency - Fixed Interest - US Dollar
(3)
|
(26,824 | ) | (1,651 | ) | (28,475 | ) | ||||||
|
CDI (Interbank Deposit Rates)
(4)
|
(136,522 | ) | (6,783 | ) | (143,305 | ) | ||||||
|
Indexed to Foreign Currency - Libor - US Dollar
(5)
|
(304,621 | ) | (5,805 | ) | (310,426 | ) | ||||||
|
Fixed Interest Rate - Real
(6)
|
(247,971 | ) | (2,304 | ) | (250,275 | ) | ||||||
|
Assets
|
2,148,723 | 129,432 | 2,278,155 | |||||||||
|
Lending Operation
|
1,614,157 | 90,801 | 1,704,958 | |||||||||
|
Indexed to Foreign Currency - US Dollar
|
1,098,267 | 106,548 | 1,204,815 | |||||||||
|
Indexed to Foreign Currency - Fixed Interest - US Dollar
|
26,840 | 373 | 27,213 | |||||||||
|
Indexed Indices of Prices and Interest
|
104,851 | 2,104 | 106,955 | |||||||||
|
CDI (Interbank Deposit Rates)
|
155,127 | (6,948 | ) | 148,179 | ||||||||
|
Fixed Interest Rate - Real
|
229,072 | (11,276 | ) | 217,796 | ||||||||
|
Securities
|
534,566 | 38,631 | 573,197 | |||||||||
|
Available-for-Sale Securities - Debentures
|
534,566 | 38,631 | 573,197 | |||||||||
|
Liabilities
|
(332,147 | ) | (2,963 | ) | (335,110 | ) | ||||||
|
Securities Issued Abroad
|
(332,147 | ) | (2,963 | ) | (335,110 | ) | ||||||
|
Eurobonds
|
(332,147 | ) | (2,963 | ) | (335,110 | ) |
Market Risk Hedge
|
2012
|
||||||||||||
|
Adjustment
|
||||||||||||
|
Cost
|
to Market
|
Fair Value
|
||||||||||
|
Hedge Instruments
|
||||||||||||
|
Swap Contracts
|
59,148 | (147,817 | ) | (88,669 | ) | |||||||
|
Asset
|
1,581,458 | 105,351 | 1,686,809 | |||||||||
|
CDI (Interbank Deposit Rates)
(1) (2)
|
1,039,229 | 5,241 | 1,044,470 | |||||||||
|
Indexed to Foreign Currency - Libor - US Dollar
(2) (3)(4) (6)
|
255,056 | 24,302 | 279,358 | |||||||||
|
Indexed to Foreign Currency - EURO
(1)
|
287,173 | 75,808 | 362,981 | |||||||||
|
Liabilities
|
(1,522,310 | ) | (253,168 | ) | (1,775,478 | ) | ||||||
|
Indexed to Foreign Currency - US Dollar
(1)
|
(1,070,666 | ) | (185,072 | ) | (1,255,738 | ) | ||||||
|
Indexed to Price Indexes and Interest
(2)
|
(245,530 | ) | (50,678 | ) | (296,208 | ) | ||||||
|
Indexed to Foreign Currency - Fixed Interest US Dollar
(3)
|
(35,076 | ) | (3,062 | ) | (38,138 | ) | ||||||
|
CDI (Interbank Deposit Rates)
(4)
|
(171,038 | ) | (14,356 | ) | (185,394 | ) | ||||||
|
Hedge Item
|
||||||||||||
|
Assets
|
1,593,371 | 119,818 | 1,713,189 | |||||||||
|
Lending Operation
|
1,229,701 | 83,785 | 1,313,486 | |||||||||
|
Indexed to Foreign Currency - US Dollar
|
1,021,123 | 93,162 | 1,114,285 | |||||||||
|
Indexed to Foreign Currency - Fixed Interest US Dollar
|
35,094 | 676 | 35,770 | |||||||||
|
CDI (Interbank Deposit Rates)
|
173,484 | (10,053 | ) | 163,431 | ||||||||
|
Securities
|
363,670 | 36,033 | 399,703 | |||||||||
|
Securities Available for Sale - Debentures
|
363,670 | 36,033 | 399,703 |
F-40
BANCO SANTANDER (BRASIL) S.A.
NOTES TO THE CONSOLIDATED FINANCIAL STATEMENTS
(Amounts in thousands of Brazilian Reais - R$, unless otherwise stated)
|
2011
|
||||||||||||
|
Adjustment
|
||||||||||||
|
Cost
|
to Market
|
Fair Value
|
||||||||||
|
Hedge Instruments
|
||||||||||||
|
Swap Contracts
|
74,928 | 1,247 | 76,175 | |||||||||
|
Asset
|
417,731 | 35,864 | 453,595 | |||||||||
|
CDI (Interbank Deposit Rates)
(1)
|
145,940 | 771 | 146,711 | |||||||||
|
Indexed to Foreign Currency - Libor - US Dollar
(3) (4)
|
271,791 | 35,093 | 306,884 | |||||||||
|
Liabilities
|
(342,803 | ) | (34,617 | ) | (377,420 | ) | ||||||
|
Indexed to Foreign Currency - US Dollar
(1)
|
(101,410 | ) | (908 | ) | (102,318 | ) | ||||||
|
Indexed to Foreign Currency - Fixed Interest US Dollar
(3)
|
(55,498 | ) | (5,067 | ) | (60,565 | ) | ||||||
|
CDI (Interbank Deposit Rates)
(4)
|
(185,895 | ) | (28,642 | ) | (214,537 | ) | ||||||
|
Hedge Item
|
||||||||||||
|
Assets
|
342,473 | 3,787 | 346,260 | |||||||||
|
Lending Operation
|
342,473 | 3,787 | 346,260 | |||||||||
|
Indexed to Foreign Currency - US Dollar
|
100,871 | 1,450 | 102,321 | |||||||||
|
Indexed to Foreign Currency - Fixed Interest US Dollar
|
55,663 | 4,902 | 60,565 | |||||||||
|
CDI (Interbank Deposit Rates)
|
185,939 | (2,565 | ) | 183,374 |
(1) Instruments whose the hedge item are loan operations indexed in foreign currency - dollar with fair value R$1,204,815 ( 2012 - R$1,114,285 and 2011 - R$102,321), indexed Indices of Prices and Interest R$106,955 and securities shown by debentures with fair value R$114,891 (2012 - R$133,273).
(2) Instruments whose hedge object are securities shown by debentures with fair value R$458,306 (2012 - R$266,430).
(3) Instruments whose the hedge item are loan operations indexed in foreign currency fixed interest - US dollar with fair value R$27,213 (2012 - R$35,770 and 2011 - R$60,565).
(4) Instruments whose the hedge item are loan operations indexed in CDI with fair value R$148,179 (2012 - R$163,431 and 2011 - R$183,374).
(5) Instruments whose hedge objects are obligations for securities abroad - eurobonds with fair value R$335,110.
(6) Instruments whose hedge objects are lending operations indexed pre fixed interest - Reais with a market value of R$217,796.
|
Cash Flow Hedge
|
||||||||||||||||
|
2013
|
||||||||||||||||
|
Reference
|
Adjustment
|
|||||||||||||||
|
Value
|
Cost
|
to Fair Value
|
Fair Value
|
|||||||||||||
|
Hedge Instruments
|
||||||||||||||||
|
Swap Contracts
|
(166,190 | ) | (110,280 | ) | (276,470 | ) | ||||||||||
|
Asset
|
2,863,318 | 2,863,318 | 50,346 | 2,913,664 | ||||||||||||
|
Indexed to Foreign Currency - Swiss Franc
(1)
|
983,011 | 983,011 | 40,109 | 1,023,120 | ||||||||||||
|
Indexed to Foreign Currency - Chile
(2)
|
97,135 | 97,135 | 6,867 | 104,002 | ||||||||||||
|
Indexed to Foreign Currency - Iuan
(3)
|
58,043 | 58,043 | 1,131 | 59,174 | ||||||||||||
|
Indexed in Reais
(4)
|
1,278,611 | 1,278,611 | (41,887 | ) | 1,236,724 | |||||||||||
|
Indexed to Foreign Currency - Pre Dollar
(5)
|
236,560 | 236,560 | 28,717 | 265,277 | ||||||||||||
|
Indexed to Foreign Currency - Euro
(6)
|
209,958 | 209,958 | 15,409 | 225,367 | ||||||||||||
|
Liabilities
|
(3,029,508 | ) | (3,029,508 | ) | (160,626 | ) | (3,190,134 | ) | ||||||||
|
Indexed to Foreign Currency - Pre Dollar
(1) (2) (3) (4)
|
(2,627,525 | ) | (2,627,525 | ) | (112,112 | ) | (2,739,637 | ) | ||||||||
|
CDI (Interbank Deposit Rates)
(5)
|
(204,096 | ) | (204,096 | ) | (32,980 | ) | (237,076 | ) | ||||||||
|
Indexed to Foreign Currency - Dollar
(6)
|
(161,618 | ) | (161,618 | ) | (12,206 | ) | (173,824 | ) | ||||||||
|
Indexed to Foreign Currency - Reais
(6)
|
(36,269 | ) | (36,269 | ) | (3,328 | ) | (39,597 | ) | ||||||||
|
Future Contracts
|
13,115,676 | - | - | - | ||||||||||||
|
Foreign Currency - Dollar
(7)
|
13,115,676 | - | - | - | ||||||||||||
F-41
BANCO SANTANDER (BRASIL) S.A.
NOTES TO THE CONSOLIDATED FINANCIAL STATEMENTS
(Amounts in thousands of Brazilian Reais - R$, unless otherwise stated)
|
2012
|
||||||||||||||||
|
Reference
|
Adjustment
|
|||||||||||||||
|
Value
|
Cost
|
to Fair Value
|
Fair Value
|
|||||||||||||
|
Hedge Instruments
|
||||||||||||||||
|
Swap Contracts
|
(18,867 | ) | (17,846 | ) | (36,713 | ) | ||||||||||
|
Asset
|
818,997 | 818,997 | 60,173 | 879,170 | ||||||||||||
|
Indexed to Foreign Currency - Swiss Franc
(1)
|
678,335 | 678,335 | 53,619 | 731,954 | ||||||||||||
|
Indexed to Foreign Currency - Chile
(2)
|
91,379 | 91,379 | 6,584 | 97,963 | ||||||||||||
|
Indexed to Foreign Currency - Iuan
(3)
|
49,283 | 49,283 | (30 | ) | 49,253 | |||||||||||
|
Liabilities
|
(837,864 | ) | (837,864 | ) | (78,019 | ) | (915,883 | ) | ||||||||
|
Indexed to Foreign Currency - Pre Dollar
(1) (2) (3)
|
(837,864 | ) | (837,864 | ) | (78,019 | ) | (915,883 | ) | ||||||||
|
Future Contracts
|
34,567,439 | - | - | - | ||||||||||||
|
DI1 Rate
(9)
|
18,962,863 | - | - | - | ||||||||||||
|
Foreign Currency - Dollar
(7)
|
15,604,576 | - | - | - | ||||||||||||
|
2011
|
||||||||||||||||
|
Reference
|
Adjustment
|
|||||||||||||||
|
Value
|
Cost
|
to Fair Value
|
Fair Value
|
|||||||||||||
|
Hedge Instruments
|
||||||||||||||||
|
Swap Contracts
|
(30,354 | ) | (1,184 | ) | (31,538 | ) | ||||||||||
|
Asset
|
651,490 | 651,490 | 26,989 | 678,479 | ||||||||||||
|
Indexed to Foreign Currency - Swiss Franc
(1)
|
300,488 | 300,488 | 25,792 | 326,280 | ||||||||||||
|
Indexed to Pre Interest Rate - Real
(8)
|
351,002 | 351,002 | 1,197 | 352,199 | ||||||||||||
|
Liabilities
|
(681,844 | ) | (681,844 | ) | (28,173 | ) | (710,017 | ) | ||||||||
|
Indexed to Foreign Currency - Pre Dollar
|
(681,844 | ) | (681,844 | ) | (28,173 | ) | (710,017 | ) | ||||||||
|
Future Contracts
|
(1,794,034 | ) | - | - | - | |||||||||||
|
DI1 Rate
(9)
|
(1,794,034 | ) | - | - | - | |||||||||||
|
2013
|
2012
|
2011
|
||||||||||
|
Hedge Item - Cost
|
||||||||||||
|
Assets
|
13,308,608 | 15,538,109 | - | |||||||||
|
Lending Operations - Financing and Export Credit and Imports
|
12,906,917 | 15,538,109 | - | |||||||||
|
Promissory Notes - PN
|
204,096 | - | - | |||||||||
|
Lending Operations
|
197,595 | - | - | |||||||||
|
Liabilities
|
2,423,571 | 19,607,312 | 2,518,986 | |||||||||
|
Eurobonds
|
2,423,571 | 820,077 | 300,803 | |||||||||
|
Deposits from credit institutions - Foreign Loans
|
- | - | 351,002 | |||||||||
|
Times deposits
|
- | 18,787,235 | 1,867,181 | |||||||||
(1) Operations due December 1, 2014, March 4, 2015 and April 12, 2016 (12/31/2012 - operations due December 1, 2014 and April 12, 2016 and 12/31/2012 - operations due December 1, 2014), whose object of "hedging" transactions are eurobonds.
(2) Operation due April 13, 2016 (12/31/2012 - operation due April 13, 2016), whose object of "hedge" is an operation of eurobonds.
(3) Operation with maturing on December 24, 2014 (12/31/2012 - operation due December 24, 2014), and hedge object of eurobonds transactions.
(4) Operation due March 18, 2016, whose object of "hedge" is an operation of eurobonds.
(5) Operation maturing on April 10, 2018, which hedge objects its securities operation represented by promissory notes classified in "available-for-sale securities" category.
(6) Operations due April 3, 2018 and July 15, 2015, whose objects "hedge" contracts are loans from credit institutions.
(7) Operations due January 31, 2014 (31/12/2012 - operation due January 31, 2013) and the updated value of the instruments of R$12,904,246 (12/31/2012 - R$ 15,531,390), whose object of "hedge" are the loans - loan agreements and credit export and import.
(8) On December 31, 2011, operation due June 15, 2012, whose object of "hedging" are operations with borrowings abroad.
(9) In the first quarter of 2013, due to the business strategy, the structures of "hedge" cash flow which had the object of "hedge" bank deposit certificates (CDB) were discontinued. The effect of marking to market of these futures contracts net of tax effects highlighted in equity corresponds to a debt of R$1,046 and will be amortized by January 2014, the remaining term of the hedging instruments.
The effect of marking to market the swaps and future contracts corresponds to a debit in the amount of R$168,050 (2012 to a debit in the amount of - R$258,555 and 2011 to a credit in the amount of R$15,149) accounted on stockholders equity, net of tax effects.
F-42
BANCO SANTANDER (BRASIL) S.A.
NOTES TO THE CONSOLIDATED FINANCIAL STATEMENTS
(Amounts in thousands of Brazilian Reais - R$, unless otherwise stated)
Investment Hedge
On December 31, 2013, the Bank has recorded a transaction of investment hedge on its stake in Santander EFC, with notional value of R$2,3 billion, maturing between January to March and the effect of R$117,891, of exchange rate changes recorded in equity, net of taxes. No ineffective portion be recorded in the consolidated income statement was identified.
a.7) Derivatives Pledged as Guarantee
The guarantee margin transactions traded on the BM&FBovespa using own and third-party derivatives is composed of government securities.
|
2013
|
2012
|
2011
|
||||||||||
|
Financial Treasury Bill - LFT
|
763,911 | 1,421,634 | 1,181,181 | |||||||||
|
National Treasury Bill - LTN
|
2,521,736 | 3,699,901 | 4,363,944 | |||||||||
|
National Treasury Notes - NTN
|
3,017,363 | 3,024,811 | 3,306,856 | |||||||||
|
Total
|
6,303,010 | 8,146,346 | 8,851,981 | |||||||||
a) Breakdown
The breakdown, by classification, of the balances of “Loans and advances to customers” in the consolidated balance sheets is as follows:
|
Thousands of Reais
|
2013
|
2012
|
2011
|
|||||||||
|
|
|
|
|
|||||||||
|
Loans and receivables
(1)
|
212,734,327 | 196,774,297 | 183,066,268 | |||||||||
|
Of which:
|
||||||||||||
|
Loans and receivables at amortized cost
|
226,206,449 | 210,740,669 | 194,184,437 | |||||||||
|
Impairment losses
|
(13,472,122 | ) | (13,966,372 | ) | (11,118,169 | ) | ||||||
|
Loans and advances to customers, net
|
212,734,327 | 196,774,297 | 183,066,268 | |||||||||
|
Loans and advances to customers, gross
|
226,206,449 | 210,740,669 | 194,184,437 | |||||||||
(1) During the year of 2012 the Banco Santander, through its wholly subsidiary in Spain, acquired by Banco Santander SA - New York Branch and London Branch, under commutative conditions, portfolio of financing contracts to export and import, related to operations contracted with Brazilian clients or their affiliates abroad, totaling US$29 million and US$90 million equivalent to R$60 million and R$121 million respectively, the exchange rate of the days when there were operations. These transactions were concluded, noting the Policy for Transactions with Related Parties of the Bank, including approval by the Board of Directors.
|
Thousands of Reais
|
2013
|
2012
|
2011
|
|||||||||
|
Type:
|
|
|
|
|||||||||
|
Loans operations
(1)
|
223,329,356 | 208,636,512 | 192,681,804 | |||||||||
|
Repurchase agreements
|
55,339 | 407,694 | 337,986 | |||||||||
|
Other receivables
|
2,821,754 | 1,696,463 | 1,164,647 | |||||||||
|
Total
|
226,206,449 | 210,740,669 | 194,184,437 | |||||||||
(1) Includes loans, leasing and other loans with credit characteristics.
There are no loans and advances to customers for material amounts without fixed maturity dates.
b) Detail
Following is a detail, by loan type and status, borrower sector and interest rate formula, of the loans and advances to customers, which reflect the Bank’s exposure to credit risk in its core business, gross of impairment losses:
|
Thousands of Reais
|
2013
|
2012
|
2011
|
|||||||||
|
Loan borrower sector:
|
||||||||||||
|
Commercial, financial and industrial
|
113,571,171 | 103,208,796 | 94,921,748 | |||||||||
|
Real estate-construction
|
25,554,929 | 20,106,962 | 16,297,940 | |||||||||
|
Installment loans to individuals
|
84,312,245 | 83,243,281 | 76,458,873 | |||||||||
|
Lease financing
|
2,768,104 | 4,181,630 | 6,505,876 | |||||||||
|
Total
(1)
|
226,206,449 | 210,740,669 | 194,184,437 | |||||||||
(1) It includes commercial credit, secured loans, reverse repurchase agreements, finance leases, other term loans and impaired assets.
F-43
BANCO SANTANDER (BRASIL) S.A.
NOTES TO THE CONSOLIDATED FINANCIAL STATEMENTS
(Amounts in thousands of Brazilian Reais - R$, unless otherwise stated)
|
Interest rate formula:
|
||||||||||||
|
Fixed interest rate
|
168,304,100 | 153,505,996 | 133,503,436 | |||||||||
|
Floating rate
|
57,902,349 | 57,234,673 | 60,681,001 | |||||||||
|
Total
|
226,206,449 | 210,740,669 | 194,184,437 | |||||||||
c) Impairment losses
The changes in the allowances for the impairment losses on the balances of “Loans and receivables” were as follows:
|
Thousands of Reais
|
2013
|
2012
|
2011
|
|||||||||
|
Balance at beginning of year
|
14,041,578 | 11,179,836 | 9,191,762 | |||||||||
|
Impairment losses charged to income for the year
|
14,356,099 | 18,003,906 | 11,190,886 | |||||||||
|
Of which:
|
||||||||||||
|
Commercial, financial and industrial
|
5,186,845 | 5,776,813 | 2,943,221 | |||||||||
|
Real estate-mortgage
|
125,720 | 148,847 | 97,472 | |||||||||
|
Installment loans to individuals
|
8,802,651 | 11,794,298 | 7,972,084 | |||||||||
|
Lease finance
|
240,883 | 283,948 | 178,109 | |||||||||
|
Write-off of impaired balances against recorded impairment allowance
|
(14,757,132 | ) | (15,142,164 | ) | (9,202,812 | ) | ||||||
|
Of which:
|
||||||||||||
|
Commercial, financial and industrial
|
(3,194,381 | ) | (4,991,510 | ) | (2,469,617 | ) | ||||||
|
Real estate-mortgage
|
(177,394 | ) | (48,071 | ) | (36,447 | ) | ||||||
|
Installment loans to individuals
|
(11,093,001 | ) | (9,855,295 | ) | (6,484,338 | ) | ||||||
|
Lease finance
|
(292,356 | ) | (247,288 | ) | (212,410 | ) | ||||||
|
Balance at end of year
|
13,640,545 | 14,041,578 | 11,179,836 | |||||||||
|
Of which:
|
||||||||||||
|
Loans and advances to customers
|
13,472,122 | 13,966,372 | 11,118,169 | |||||||||
|
Loans and amounts due from credit institutions (Note 5)
|
168,423 | 75,206 | 61,667 | |||||||||
|
Thousands of Reais
|
2013 | 2012 | 2011 | |||||||||
|
Recoveries of loans previously charged off
|
456,310 | 1,528,310 | 1,809,337 | |||||||||
|
Of which:
|
||||||||||||
|
Commercial, financial and industrial
|
123,280 | 456,160 | 352,638 | |||||||||
|
Real estate-mortgage
|
77,672 | 64,341 | 65,323 | |||||||||
|
Installment loans to individuals
|
214,764 | 959,900 | 1,331,104 | |||||||||
|
Lease finance
|
40,594 | 47,909 | 60,272 | |||||||||
Taking into account these amounts recognized in “Impairment losses charged to income for the year” and the "Recoveries of loans previously charged off", the "Impairment losses on financial assets - Loans and receivables” amounted to R$13,899,788 in 2013, R$16,475,925 in 2012 and R$9,381,549 in 2011.
d) Impaired assets
The detail of the changes in the balance of the financial assets classified as “Loans and receivables – loans and advances to customers” and considered to be impaired due to credit risk is as follows:
|
Thousands of Reais
|
2013
|
2012
|
2011
|
|||||||||
|
Balance at beginning of year
|
16,057,134 | 13,072,693 | 9,348,648 | |||||||||
|
Net additions
|
12,721,775 | 18,126,605 | 12,926,857 | |||||||||
|
Derecognized assets
|
(14,757,132 | ) | (15,142,164 | ) | (9,202,812 | ) | ||||||
|
Balance at end of year
|
14,021,777 | 16,057,134 | 13,072,693 | |||||||||
BANCO SANTANDER (BRASIL) S.A.
NOTES TO THE CONSOLIDATED FINANCIAL STATEMENTS
(Amounts in thousands of Brazilian Reais - R$, unless otherwise stated)
Following is a detail of the financial assets considered to be impaired classified by age of the oldest past-due amount:
|
Thousands of Reais
|
2013
|
2012
|
2011
|
|||||||||
|
With no Past-Due Balances or Less than 3 Months Past Due
|
5,785,220 | 4,567,148 | 5,480,930 | |||||||||
|
With Balances Past Due by
|
||||||||||||
|
3 to 6 Months
|
3,377,653 | 5,282,229 | 2,473,485 | |||||||||
|
6 to 12 Months
|
4,230,751 | 5,609,819 | 4,342,172 | |||||||||
|
12 to 18 Months
|
563,207 | 484,835 | 445,032 | |||||||||
|
18 to 24 Months
|
33,988 | 66,111 | 311,679 | |||||||||
|
More than 24 Months
|
30,958 | 46,992 | 19,395 | |||||||||
|
Total
|
14,021,777 | 16,057,134 | 13,072,693 | |||||||||
e) Loan past due for less than 90 days but not classified as impaired
|
Thousands of Reais
|
2013
|
% of total loans past due for less than 90 days
|
2012
|
% of total loans past due for less than 90 days
|
|||||||||
|
Commercial and industrial
|
5,208,063
|
23.75%
|
7,070,941
|
36.40%
|
|||||||||
|
Mortgage loans
|
6,841,305
|
31.19%
|
1,304,674
|
6.70%
|
|||||||||
|
Installment loans to individuals
|
9,651,987
|
44.01%
|
10,346,596
|
53.30%
|
|||||||||
|
Financial Leasing
|
231,157
|
1.05%
|
702,640
|
3.60%
|
|||||||||
|
Total
(1)
|
21,932,512
|
100.00%
|
19,424,851
|
100.00%
|
(1) Refers only to loans past due between 1 and 90 days.
f) Lease portfolio at present value
|
Thousands of Reais
|
2013
|
2012
|
2011
|
|||||||||
|
Gross investment in lease transactions
|
3,143,227 | 4,882,797 | 7,991,849 | |||||||||
|
Lease receivables
|
2,439,551 | 3,714,457 | 5,720,996 | |||||||||
|
Unrealized residual values
(1)
|
703,676 | 1,168,340 | 2,270,853 | |||||||||
|
Unearned income on lease
|
(2,394,584 | ) | (3,622,469 | ) | (5,570,537 | ) | ||||||
|
Offsetting residual values
|
(703,676 | ) | (1,168,340 | ) | (2,270,853 | ) | ||||||
|
Leased property and equipment
|
7,996,409 | 11,738,066 | 16,485,919 | |||||||||
|
Accumulated depreciation
|
(5,387,661 | ) | (8,242,886 | ) | (11,346,459 | ) | ||||||
|
Present value adjustment
|
2,156,908 | 4,768,240 | 8,049,256 | |||||||||
|
Losses on unamortized lease
|
186,661 | 171,659 | 198,119 | |||||||||
|
Advances for guaranteed residual value
|
(2,233,693 | ) | (4,355,504 | ) | (7,050,545 | ) | ||||||
|
Other assets
|
4,513 | 10,067 | 19,127 | |||||||||
|
Total
|
2,768,104 | 4,181,630 | 6,505,876 | |||||||||
(1) Guaranteed residual value of lease agreements.
Unrealized lease income (lease income to appropriate related to minimum payments receivable) is R$375,127 ( 2012 - R$701,167 and 2011 - R$1,485,973).
As at December 31, 2013, 2012 and 2011 there were no material agreements for lease contracts.
Breakdown by maturity
Gross investment in lease transactions
|
Thousands of Reais
|
2013
|
2012
|
2011
|
|||||||||
|
Overdue
|
75,723 | 144,586 | 214,378 | |||||||||
|
Due to:
|
||||||||||||
|
Up to 1 year
|
1,617,452 | 2,504,585 | 3,728,746 | |||||||||
|
From 1 to 5 years
|
1,439,700 | 2,225,247 | 4,042,054 | |||||||||
|
Over 5 years
|
10,352 | 8,379 | 6,671 | |||||||||
|
Total
|
3,143,227 | 4,882,797 | 7,991,849 | |||||||||
BANCO SANTANDER (BRASIL) S.A.
NOTES TO THE CONSOLIDATED FINANCIAL STATEMENTS
(Amounts in thousands of Brazilian Reais - R$, unless otherwise stated)
Report per lease portfolio maturity at present value
|
Thousands of Reais
|
2013
|
2012
|
2011
|
|||||||||
|
Overdue
|
55,037 | 96,689 | 143,337 | |||||||||
|
Due to:
|
||||||||||||
|
Up to 1 year
|
1,537,026 | 2,353,900 | 3,427,190 | |||||||||
|
From 1 to 5 years
|
1,169,336 | 1,727,902 | 2,932,795 | |||||||||
|
Over 5 years
|
6,705 | 3,139 | 2,554 | |||||||||
|
Total
|
2,768,104 | 4,181,630 | 6,505,876 | |||||||||
g) Transfer of financial assets with retention of risks and benefits
In March 2013, the Bank disposal the loan portfolio amounting R$47,485, with retention of risks and benefits that were not classified to write-off. Contracts and installments of contracts assignment object refer to mortgages, which fall due until October 2041.
In December 2011, the Bank disposal the loan portfolio amounting R$688,821, with retention of risks and benefits that were not classified to write-off. Contracts and installments of contracts assignment object refer to mortgages, which fall due until October 2041.
In December 31, 2013, the amount recorded on “Loans and advances to customers” related to loan portfolio assigned is R$380,736 (2012 - R$508,714), and R$336,040 (2012 - R$495,467) of “Other financial liabilities - Financial Liabilities Associated with Assets Transfer”.
The foregoing transfer was conducted with a recourse clause and the mandatory repurchase is provided for in the following events:
- agreements in default for longer than 90 consecutive days;
- agreements under renegotiation;
- agreements subject to portability, pursuant to Resolution 3,401 of the Brazilian Monetary Council (CMN);
- agreements subject to intervenience.
The amount of mandatory repurchase will be calculated based on the outstanding balance of credit duly updated on the date of said repurchase.
As of the date of assignment, the cash flows of assigned operations will be paid directly to the assigning entity.
At December 31, 2013, 2012 and 2011, the total amount of non-current assets held for sale includes foreclosed assets and other tangible assets. The change in the "Non-current assets held for sale" is as follows:
|
Thousands of Reais
|
2013
|
2012
|
2011
|
|||||||||
|
Balance at beginning of year
|
315,315 | 223,374 | 167,526 | |||||||||
|
Foreclosures loans and other assets transferred
(1)
|
51,010 | 112,697 | 24,874,974 | |||||||||
|
Sales
(1) (2)
|
(41,937 | ) | (29,987 | ) | (24,819,126 | ) | ||||||
|
Others
|
24 | 9,231 | - | |||||||||
|
Final balance, gross
(3)
|
324,412 | 315,315 | 223,374 | |||||||||
|
Impairment losses
|
(49,682 | ) | (149,605 | ) | (90,986 | ) | ||||||
|
Impairment as a percentage of foreclosed assets
|
15.31 | % | 47.45 | % | 40.73 | % | ||||||
|
Balance at end of year
|
274,730 | 165,710 | 132,388 | |||||||||
(1) In 2011, includes R$24,731,463 of assets of Zurich Santander Brasil Seguros e Previdência S.A. Additionally, R$22,349,428 of liabilities directly associated with non-current assets held for sale of Zurich Santander Brasil Seguros e Previdência S.A. were sold. The assets and liabilities related to the sale of Zurich Santander Brasil Seguros e Previdência S.A. (note 3.c) are presented at net amount in the cash flow statement.
(2) Includes sale of administrative buildings.
(3) Refers mainly to buildings and vehicles arising from executions of loans.
BANCO SANTANDER (BRASIL) S.A.
NOTES TO THE CONSOLIDATED FINANCIAL STATEMENTS
(Amounts in thousands of Brazilian Reais - R$, unless otherwise stated)
Jointly controlled
Banco Santander considers investments classified as jointly controlled: when they possess a shareholders' agreement, which sets the strategic financial and operating decisions require the unanimous consent of all investors.
Significant Influence
Banco Santander considers investments classified as significant influence over the associates who have indication of board members.
a) Breakdown
|
Participation %
|
|||||||||||||||
|
Jointly Controlled by the Banco Santander
|
Activity
|
Country
|
12/31/2013
|
12/31/2012
|
12/31/2011
|
||||||||||
|
Companhia de Crédito, Financiamento e Investimento RCI Brasil
(1)
|
Financial
|
Brazil
|
39.89 | % | 39.89 | % | 39.64 | % | |||||||
|
Companhia de Arrendamento Mercantil RCI Brasil
(1)
|
Leasing
|
Brazil
|
- | - | 39.88 | % | |||||||||
|
Norchem Participações e Consultoria S.A.
(2)
|
Other Activities
|
Brazil
|
50.00 | % | 50.00 | % | 50.00 | % | |||||||
|
Cibrasec - Companhia Brasileira de Securitização
(2)
|
Securitization
|
Brazil
|
13.64 | % | 13.64 | % | 13.64 | % | |||||||
|
Estruturadora Brasileira de Projetos S.A. - EBP
(2)
|
Other Activities
|
Brazil
|
11.11 | % | 11.11 | % | 11.11 | % | |||||||
|
Jointly Controlled by Santander S.A. Serviços Técnicos, Administrativos e de Corretagem
|
|||||||||||||||
|
Webmotors S.A.
(4)
|
Other Activities
|
Brazil
|
70.00 | % | - | - | |||||||||
|
Tecnologia Bancária S.A. - TECBAN
(3)
|
Other Activities
|
Brazil
|
20.82 | % | - | - | |||||||||
|
Significant Influence of Banco Santander
|
|||||||||||||||
|
Norchem Holding e Negócios S.A.
(2)
|
Other Activities
|
Brazil
|
21.75 | % | 21.75 | % | 21.75 | % | |||||||
|
BW Guirapá I S.A.
(5)
|
Holding
|
Brazil
|
40.57 | % | - | - | |||||||||
|
Investments
|
||||||||||||
|
Jointly Controlled by the Banco Santander
|
12/31/2013
|
12/31/2012
|
12/31/2011
|
|||||||||
|
Companhia de Crédito, Financiamento e Investimento RCI Brasil
(1)
|
467,362 | 413,047 | 132,514 | |||||||||
|
Companhia de Arrendamento Mercantil RCI Brasil
(1)
|
- | - | 232,017 | |||||||||
|
Norchem Participações e Consultoria S.A.
(2)
|
24,254 | 23,369 | 22,528 | |||||||||
|
Cibrasec - Companhia Brasileira de Securitização
(2)
|
10,298 | 10,285 | 10,287 | |||||||||
|
Estruturadora Brasileira de Projetos S.A. - EBP
(2)
|
11,085 | 2,726 | 679 | |||||||||
|
Jointly Controlled by Santander S.A. Serviços Técnicos, Administrativos e de Corretagem de Seguros (Santander Serviços)
|
||||||||||||
|
Webmotors S.A.
(4)
|
316,784 | - | - | |||||||||
|
Tecnologia Bancária S.A. - TECBAN
(3)
|
118,209 | - | - | |||||||||
|
Significant Influence of Banco Santander
|
||||||||||||
|
Norchem Holding e Negócios S.A.
(2)
|
27,096 | 22,666 | 24,200 | |||||||||
|
BW Guirapá I S.A.
(5)
|
88,715 | - | - | |||||||||
|
Total
|
1,063,803 | 472,093 | 422,225 | |||||||||
BANCO SANTANDER (BRASIL) S.A.
NOTES TO THE CONSOLIDATED FINANCIAL STATEMENTS
(Amounts in thousands of Brazilian Reais - R$, unless otherwise stated)
|
Results of Investments
|
||||||||||||
|
Jointly Controlled by the Banco Santander
|
1/01 at 12/31/2013
|
1/01 at 12/31/2012
|
1/01 at 12/31/2011
|
|||||||||
|
Companhia de Crédito, Financiamento e Investimento RCI Brasil
(1)
|
68,162 | 68,534 | 25,424 | |||||||||
|
Companhia de Arrendamento Mercantil RCI Brasil
(1)
|
- | - | 29,102 | |||||||||
|
Norchem Participações e Consultoria S.A.
(2)
|
1,225 | 841 | (2,973 | ) | ||||||||
|
Cibrasec - Companhia Brasileira de Securitização
(2)
|
522 | 825 | 909 | |||||||||
|
Estruturadora Brasileira de Projetos S.A. - EBP
(2)
|
5,530 | 2,046 | (2,320 | ) | ||||||||
|
Jointly Controlled by Santander Serviços
|
||||||||||||
|
Webmotors S.A.
(4)
|
6,479 | - | - | |||||||||
|
Tecnologia Bancária S.A. - TECBAN
(3)
|
9,938 | - | - | |||||||||
|
Significant Influence of Banco Santander
|
||||||||||||
|
Norchem Holding e Negócios S.A.
(2)
|
5,952 | 1,076 | 4,074 | |||||||||
|
BW Guirapá I S.A.
(5)
|
(6,466 | ) | - | - | ||||||||
|
Total
|
91,342 | 73,322 | 54,216 | |||||||||
|
2013
|
||||||||||||
|
Jointly Controlled by the Banco Santander
|
Total assets
|
Total liabilities
|
Total profit
|
|||||||||
|
Companhia de Crédito, Financiamento e Investimento RCI Brasil
(1)
|
9,284,500 | 8,182,191 | 154,008 | |||||||||
|
Companhia de Arrendamento Mercantil RCI Brasil
(1)
|
1,705,709 | 1,022,876 | 69,485 | |||||||||
|
Norchem Participações e Consultoria S.A.
(2)
|
102,665 | 54,158 | 2,450 | |||||||||
|
Cibrasec - Companhia Brasileira de Securitização
(2)
|
106,427 | 31,235 | 8,605 | |||||||||
|
Estruturadora Brasileira de Projetos S.A. - EBP
(2)
|
94,493 | 18,129 | (2,003 | ) | ||||||||
|
Jointly Controlled by Santander S.A. Santander Serviços
|
||||||||||||
|
Webmotors S.A.
(4)
|
221,400 | 11,388 | 14,410 | |||||||||
|
Tecnologia Bancária S.A. - TECBAN
(3)
|
753,463 | 500,896 | 60,859 | |||||||||
|
Significant Influence of Banco Santander
|
||||||||||||
|
Norchem Holding e Negócios S.A.
(2)
|
202,264 | 77,684 | 27,367 | |||||||||
|
BW Guirapá I S.A.
(5)
|
119,215 | 398,155 | 14,410 | |||||||||
|
Total
|
12,590,136 | 10,296,712 | 349,591 | |||||||||
|
2012
|
||||||||||||
|
Jointly Controlled by the Banco Santander
|
Total assets
|
Total liabilities
|
Total profit
|
|||||||||
|
Companhia de Crédito, Financiamento e Investimento RCI Brasil
(1)
|
7,196,107 | 6,181,629 | 190,090 | |||||||||
|
Companhia de Arrendamento Mercantil RCI Brasil
(1)
|
1,809,185 | 1,167,533 | 95,595 | |||||||||
|
Norchem Participações e Consultoria S.A.
(2)
|
98,151 | 51,414 | 1,681 | |||||||||
|
Cibrasec - Companhia Brasileira de Securitização
(2)
|
117,905 | 42,480 | 9,580 | |||||||||
|
Estruturadora Brasileira de Projetos S.A. - EBP
(2)
|
30,325 | 5,790 | 18,419 | |||||||||
|
Significant Influence of Banco Santander
|
||||||||||||
|
Norchem Holding e Negócios S.A.
(2)
|
563,279 | 220,522 | 6,401 | |||||||||
|
Total
|
9,814,952 | 7,669,368 | 321,766 | |||||||||
BANCO SANTANDER (BRASIL) S.A.
NOTES TO THE CONSOLIDATED FINANCIAL STATEMENTS
(Amounts in thousands of Brazilian Reais - R$, unless otherwise stated)
|
2011
|
||||||||||||
|
Jointly Controlled by the Banco Santander
|
Total assets
|
Total liabilities
|
Total profit
|
|||||||||
|
Companhia de Crédito, Financiamento e Investimento RCI Brasil
(1)
|
4,533,347 | 4,199,058 | 80,205 | |||||||||
|
Companhia de Arrendamento Mercantil RCI Brasil
(1)
|
1,402,148 | 820,376 | 72,973 | |||||||||
|
Norchem Participações e Consultoria S.A.
(2)
|
94,918 | 49,861 | (5,946 | ) | ||||||||
|
Cibrasec - Companhia Brasileira de Securitização
(2)
|
134,766 | 59,322 | 11,462 | |||||||||
|
Estruturadora Brasileira de Projetos S.A. - EBP
(2)
|
6,958 | 842 | (20,879 | ) | ||||||||
|
Significant Influence of Banco Santander
|
||||||||||||
|
Norchem Holding e Negócios S.A.
(2)
|
172,267 | 61,001 | 18,733 | |||||||||
|
Total
|
6,344,404 | 5,190,460 | 156,548 | |||||||||
b) Changes
The changes in the balance of this item were as follows:
|
12/31/2013
|
12/31/2012
|
12/31/2011
|
||||||||||
|
Jointly Controlled by the Banco Santander
|
||||||||||||
|
Balance at beginning of year
|
449,427 | 398,025 | 348,262 | |||||||||
|
Capital increases
|
2,830 | - | 6,107 | |||||||||
|
Additions
|
418,547 | - | 2,174 | |||||||||
|
Income from companies accounted for by the equity method
|
91,674 | 72,246 | 50,142 | |||||||||
|
Dividends proposed/received
|
(14,689 | ) | (20,827 | ) | (8,951 | ) | ||||||
|
Others
|
203 | (17 | ) | 291 | ||||||||
|
Balance at end of year
|
947,992 | 449,427 | 398,025 | |||||||||
|
Significant Influence of Banco Santander
|
||||||||||||
|
Balance at beginning of year
|
22,666 | 24,200 | 22,325 | |||||||||
|
Additions
(5)
|
95,000 | - | 825 | |||||||||
|
Income from companies accounted for by the equity method
|
(332 | ) | 1,076 | 4,074 | ||||||||
|
Dividends proposed/received
|
(1,523 | ) | (2,610 | ) | (3,024 | ) | ||||||
|
Balance at end of year
|
115,811 | 22,666 | 24,200 | |||||||||
(1) At the Extraordinary General Meeting held on May 31, 2012 of Companhia de Arrendamento Mercantil RCI Brasil (Leasing RCI Brasil) and Companhia de Crédito, Financiamento e Investimento RCI Brasil (Financeira RCI Brasil), their respective stockholders approved the proposed merger of shares of Leasing RCI Brasil into the equity of Financeira RCI Brasil as at March 31, 2012, Leasing RCI Brasil becoming an indirect interest of the Bank.
(2) Companies delayed by one month for the calculation of equity.
(3) Acquisition by Santander Serviços of shares issued by Tecban held by Santusa under a sale and purchase agreement entered into between the parties on January 21, 2013. The acquisition, corresponding to 20.82% of the share capital of Tecban, is subject to authorization by Bacen pursuant to Resolution 4.062/2012, and effective on March 27, 2013.
(4) Was celebrated on June 21, 2013 an agreement with the objective of Carsales.com Limited (Carsales) participation in Webmotors’ capital (Transaction), a company indirectly controlled by Banco Santander, for R$180 million. The Transaction will be implemented through the acquisition by the Carsales of new shares of Webmotors’ capital, representing 30% of all capital. Although the participation exceeds 50%, in accordance with the stockholders' agreement, Banco Santander and Carsales now joint control. This transaction generated a gain in Santander Serviços amounting R$119,961 related to the change in the percentage shareholding in Webmotors S.A. due to the entry of Carsales in its capital and R$169,775, related to the recognition of the fair value of the indirect remaining in Banco Santander of Webmotors’ capital of 42.5% (60.65% for the Bank's investment in the Santander Serviços’ capital under 70.00% of investment to Santander Serviços for Webmotors S.A.), under IFRS 10 - Consolidated Financial Statements, these amounts were recorded in “Gains (losses) disposal of assets not classified as non-current assets held for sale.
(5) In June, Bank endorsed R$95,000 and paid R$50,000 on BW Guirapá S.A. Capital's, and in October 2013 there was payment of share capital in the amount of R$45,000 without issuing new shares.
(*) The Bank does not have collateral with associates and joint ventures.
(**) The Bank does not have contingent liabilities with significant risk of possible losses related to investments in affiliates.
BANCO SANTANDER (BRASIL) S.A.
NOTES TO THE CONSOLIDATED FINANCIAL STATEMENTS
(Amounts in thousands of Brazilian Reais - R$, unless otherwise stated)
c) Impairment losses
No impairment losses was recognized on investments in associates and joint ventures in 2013, 2012 and 2011.
Tangible assets of the Bank relate to property, plant and equipment for the Bank's own use. The Bank does not have tangible assets held as investment property nor leased out under operating leases. The Bank is also not a part of any financial lease contracts as of and during fiscal years ended December 31, 2013, 2012 and 2011.
a) Breakdown
The detail, by class of asset, of the tangible assets in the consolidated balance sheets is as follows:
|
In thousand of reais
|
||||||||||||||||||||
|
Cost
|
Land and buildings
|
IT equipment and fixtures
|
Furniture and vehicles
|
Works in progress and others
|
Total
|
|||||||||||||||
|
Balance at beginning of the year
|
2,226,175 | 1,317,006 | 3,000,988 | 1,263 | 6,545,432 | |||||||||||||||
|
Changes in the scope of consolidation (note 3.c)
|
(2,093 | ) | (626 | ) | (272 | ) | - | (2,991 | ) | |||||||||||
|
Additions
|
204,222 | 25,302 | 843,643 | 1,569 | 1,074,736 | |||||||||||||||
|
Write-off
|
(5,482 | ) | (16,827 | ) | (52,000 | ) | - | (74,309 | ) | |||||||||||
|
Transfers
|
24,832 | 204,956 | (206,278 | ) | - | 23,510 | ||||||||||||||
|
Balance at December 31, 2011
|
2,447,654 | 1,529,811 | 3,586,081 | 2,832 | 7,566,378 | |||||||||||||||
|
Additions
|
272,599 | 4,586 | 1,169,292 | 927 | 1,447,404 | |||||||||||||||
|
Write-off
|
(72,188 | ) | (71,962 | ) | (41,473 | ) | - | (185,623 | ) | |||||||||||
|
Transfers
|
567 | 498,412 | (188,798 | ) | - | 310,181 | ||||||||||||||
|
Balance at December 31, 2012
|
2,648,632 | 1,960,847 | 4,525,102 | 3,759 | 9,138,340 | |||||||||||||||
|
Additions
|
335,943 | 75,239 | 1,329,411 | 706 | 1,741,299 | |||||||||||||||
|
Write-off
|
(32,857 | ) | (48,032 | ) | (29,178 | ) | - | (110,067 | ) | |||||||||||
|
Transfers
|
68,766 | 154,883 | (242,158 | ) | - | (18,509 | ) | |||||||||||||
|
Balance at December 31, 2013
|
3,020,484 | 2,142,937 | 5,583,177 | 4,465 | 10,751,063 | |||||||||||||||
|
Accumulated depreciation
|
||||||||||||||||||||
|
Balance at beginning of the year
|
(269,553 | ) | (852,129 | ) | (844,337 | ) | - | (1,966,019 | ) | |||||||||||
|
Changes in the scope of consolidation (note 3.c)
|
524 | 556 | 184 | - | 1,264 | |||||||||||||||
|
Additions
|
(59,259 | ) | (163,854 | ) | (347,019 | ) | - | (570,132 | ) | |||||||||||
|
Write-off
|
2,255 | 15,548 | 33,867 | - | 51,670 | |||||||||||||||
|
Transfers
|
(23,662 | ) | (32 | ) | 187 | - | (23,507 | ) | ||||||||||||
|
Balance at December 31, 2011
|
(349,695 | ) | (999,911 | ) | (1,157,118 | ) | - | (2,506,724 | ) | |||||||||||
|
Additions
|
(59,673 | ) | (242,026 | ) | (423,291 | ) | - | (724,990 | ) | |||||||||||
|
Write-off
|
42,123 | 59,006 | 18,304 | - | 119,433 | |||||||||||||||
|
Transfers
|
- | (50,911 | ) | 3 | - | (50,908 | ) | |||||||||||||
|
Balance at December 31, 2012
|
(367,245 | ) | (1,233,842 | ) | (1,562,102 | ) | - | (3,163,189 | ) | |||||||||||
|
Additions
|
(58,480 | ) | (236,731 | ) | (431,778 | ) | - | (726,989 | ) | |||||||||||
|
Write-off
|
18,657 | 58,338 | 14,957 | - | 91,952 | |||||||||||||||
|
Transfers
|
- | (29 | ) | (26,397 | ) | - | (26,426 | ) | ||||||||||||
|
Balance at December 31, 2013
|
(407,068 | ) | (1,412,264 | ) | (2,005,320 | ) | - | (3,824,652 | ) | |||||||||||
BANCO SANTANDER (BRASIL) S.A.
NOTES TO THE CONSOLIDATED FINANCIAL STATEMENTS
(Amounts in thousands of Brazilian Reais - R$, unless otherwise stated)
|
Impairment
|
Land and buildings
|
IT equipment and fixtures
|
Furniture and vehicles
|
Works in progress and others
|
Total
|
|||||||||||||||
|
Balance at beginning of the year
|
(61,304 | ) | - | - | - | (61,304 | ) | |||||||||||||
|
Impacts on results
|
9,956 | - | - | - | 9,956 | |||||||||||||||
|
Balance at December 31, 2011
|
(51,348 | ) | - | - | - | (51,348 | ) | |||||||||||||
|
Impacts on results
|
14,425 | - | - | - | 14,425 | |||||||||||||||
|
Balance at December 31, 2012
|
(36,923 | ) | - | - | - | (36,923 | ) | |||||||||||||
|
Impacts on results
|
(3,561 | ) | - | - | - | (3,561 | ) | |||||||||||||
|
Balance at December 31, 2013
|
(40,484 | ) | - | - | - | (40,484 | ) | |||||||||||||
|
Carrying amount
|
||||||||||||||||||||
|
Balance at December 31, 2011
|
2,046,611 | 529,900 | 2,428,963 | 2,832 | 5,008,306 | |||||||||||||||
|
Balance at December 31, 2012
|
2,244,464 | 727,005 | 2,963,000 | 3,759 | 5,938,228 | |||||||||||||||
|
Balance at December 31, 2013
|
2,572,932 | 730,673 | 3,577,857 | 4,465 | 6,885,927 | |||||||||||||||
The depreciation expenses has been included in the line item “Depreciation and amortization” in the income statement.
b) Tangible asset purchase commitments
On December 31, 2013, the Bank has no contractual commitments for the acquisition of tangible fixed assets (2012 - R$18,872).
The goodwill recorded is subject to impairment test at least annually or in a short period, whenever there are indications of impairment and was allocated according to the operating segments (note 42).
The recoverable goodwill amounts are determined from value in use calculations. For this purpose, we estimate cash flow for a period of 5 years. We prepare cash flows considering several factors, including: (i) macro-economic projections, such as interest rates, inflation and exchange rates, among others, (ii) the performance and growth estimates of the Brazilian financial system, (iii) increased costs, returns, synergies and investment plans, (iv) the behavior of customers, and (v) the growth rate and long-term adjustments to cash flows. These estimates rely on assumptions regarding the likelihood of future events, and changing certain factors could result in differing outcomes. The estimate of cash flows is based on valuations prepared by independent research company, which is reviewed and approved by the Executive Board.
The impairment test of goodwill was conducted in 2013, 2012 and 2011 and for the current period was not identified any evidence of impairment.
|
Thousands of Reais
|
2013
|
2012
|
2011
|
|||||||||
|
Breakdown/Operating segments:
|
||||||||||||
|
Banco ABN Amro Real S.A. (Banco Real)/ Commercial Banking
|
27,217,565 | 27,217,565 | 27,217,565 | |||||||||
|
Total
|
27,217,565 | 27,217,565 | 27,217,565 | |||||||||
|
Commercial Banking
|
||||||||||||
|
2013
|
2012
|
2011
|
||||||||||
|
Main assumptions:
|
||||||||||||
|
Basis of determining recoverable amounts
|
Value in use: cash flows
|
|||||||||||
|
Period of the projections of cash flows
(1)
|
5 years
|
10 years
|
10 years
|
|||||||||
|
Growth rate perpetual
|
7.0 | % | 6.0 | % | 5.0 | % | ||||||
|
Discount rate
(2)
|
14.8 | % | 15.0 | % | 15.2 | % | ||||||
(1) The projections of cash flow are prepared using internal budget and growth plans of the administration, based on historical data, market expectations and conditions such as industry growth, interest hate and inflation.
(2) The discount rate is calculated based on the capital asset pricing model (CAPM).
BANCO SANTANDER (BRASIL) S.A.
NOTES TO THE CONSOLIDATED FINANCIAL STATEMENTS
(Amounts in thousands of Brazilian Reais - R$, unless otherwise stated)
The changes of goodwill in December, 31 2013, 2012 and 2011 were as follows:
|
Thousands of Reais
|
2013
|
2012
|
2011
|
|||||||||
|
Balance at beginning of the year
|
27,217,565 | 27,217,565 | 28,312,236 | |||||||||
|
Disposals:
|
||||||||||||
|
Real Seguros Vida e Previdência
(1)
|
- | - | (1,094,671 | ) | ||||||||
|
Balance at end of the year
|
27,217,565 | 27,217,565 | 27,217,565 | |||||||||
(1) In 2011, includes the write-off of the goodwill related to Real Seguros Vida e Previdência, due the sale of the all shares of Zurich Santander Brasil Seguros e Previdência S.A. (note 3.c).
a) Breakdown
The details by asset category of the "other intangible assets" of the consolidated balance sheets are as follow:
|
Cost
|
IT developments
|
Other assets
|
Total
|
|||||||||
|
Balance at beginning of the year
|
2,405,493 | 249,397 | 2,654,890 | |||||||||
|
Changes in the scope of consolidation (note 3.c)
|
(21,727 | ) | - | (21,727 | ) | |||||||
|
Additions
|
862,645 | 14,846 | 877,491 | |||||||||
|
Write-off
|
(264,502 | ) | (58,750 | ) | (323,252 | ) | ||||||
|
Transfers
|
- | 4 | 4 | |||||||||
|
Balance at December 31, 2011
|
2,981,909 | 205,497 | 3,187,406 | |||||||||
|
Additions
|
755,249 | 9,250 | 764,499 | |||||||||
|
Write-off
|
(3,962 | ) | - | (3,962 | ) | |||||||
|
Transfers
|
(310,160 | ) | - | (310,160 | ) | |||||||
|
Balance at December 31, 2012
|
3,423,036 | 214,747 | 3,637,783 | |||||||||
|
Additions
|
523,495 | 132,697 | 656,192 | |||||||||
|
Write-off
|
(78,749 | ) | (2,101 | ) | (80,850 | ) | ||||||
|
Transfers
|
24,739 | - | 24,739 | |||||||||
|
Balance at December 31, 2013
|
3,892,521 | 345,343 | 4,237,864 | |||||||||
|
Accumulated amortization
|
||||||||||||
|
Balance at beginning of the year
|
(782,054 | ) | (160,291 | ) | (942,345 | ) | ||||||
|
Additions
|
(416,878 | ) | (13,378 | ) | (430,256 | ) | ||||||
|
Write-off
|
213,304 | - | 213,304 | |||||||||
|
Transfers
|
(7 | ) | - | (7 | ) | |||||||
|
Balance at December 31, 2011
|
(985,635 | ) | (173,669 | ) | (1,159,304 | ) | ||||||
|
Additions
|
(463,637 | ) | (12,248 | ) | (475,885 | ) | ||||||
|
Write-off
|
- | - | - | |||||||||
|
Transfers
|
50,887 | - | 50,887 | |||||||||
|
Balance at December 31, 2012
|
(1,398,385 | ) | (185,917 | ) | (1,584,302 | ) | ||||||
|
Additions
|
(504,285 | ) | (20,642 | ) | (524,927 | ) | ||||||
|
Write-off
|
9,128 | 418 | 9,546 | |||||||||
|
Transfers
|
1,615 | (6,788 | ) | (5,173 | ) | |||||||
|
Balance at December 31, 2013
|
(1,891,927 | ) | (212,929 | ) | (2,104,856 | ) | ||||||
|
Impairment - IT
|
||||||||||||
|
Balance at beginning of the year
|
(64,695 | ) | - | (64,695 | ) | |||||||
|
Additions
|
(9,043 | ) | - | (9,043 | ) | |||||||
|
Write-off
|
73,403 | - | 73,403 | |||||||||
|
Balance at December 31, 2011
|
(335 | ) | - | (335 | ) | |||||||
|
Additions
|
- | - | - | |||||||||
|
Write-off
|
- | - | - | |||||||||
|
Balance at December 31, 2012
|
(335 | ) | - | (335 | ) | |||||||
|
Write-off
|
(285,862 | ) | - | (285,862 | ) | |||||||
|
Impairment losses on other assets
|
- | - | - | |||||||||
|
Balance at December 31, 2013
|
(286,197 | ) | - | (286,197 | ) | |||||||
|
Carrying amount
|
||||||||||||
|
Balance at December 31, 2011
|
1,995,939 | 31,828 | 2,027,767 | |||||||||
|
Balance at December 31, 2012
|
2,024,316 | 28,830 | 2,053,146 | |||||||||
|
Balance at December 31, 2013
|
1,714,397 | 132,414 | 1,846,811 | |||||||||
BANCO SANTANDER (BRASIL) S.A.
NOTES TO THE CONSOLIDATED FINANCIAL STATEMENTS
(Amounts in thousands of Brazilian Reais - R$, unless otherwise stated)
The amortization expenses has been included in the line item “Depreciation and amortization” in the income statement.
The breakdown of the balance of “Other assets” is as follows:
|
Thousands of Reais
|
2013
|
2012
|
2011
|
|||||||||
|
|
||||||||||||
|
Customer relationship
(1)
|
1,377,072 | 2,749,612 | 2,189,748 | |||||||||
|
Prepayments and accrued income
|
1,255,046 | 614,062 | 641,098 | |||||||||
|
Contractual guarantees of former controlling stockholders (Note 21.d.5)
|
954,325 | 991,394 | 992,687 | |||||||||
|
Actuarial asset (Note 21.c)
|
898 | 12,865 | 13,133 | |||||||||
|
Amounts receivable of covenants
|
399,045 | 134,007 | 326,637 | |||||||||
|
Other receivables
|
1,098,282 | 1,098,787 | 639,570 | |||||||||
|
Total
|
5,084,668 | 5,600,727 | 4,802,873 | |||||||||
(1) In 2013, includes loss not recoverable asset recorded by buying rights to the provision of payroll in the amount of R$64,170.The loss related to the acquisition of rights in payrolls was recorded due to the reduction in the value of the expected return on the management of payroll and history of broken contracts.
The breakdown, by classification, type and currency, of the balances of these items is as follows:
|
Thousands of Reais
|
2013
|
2012
|
2011
|
|||||||||
|
Classification:
|
||||||||||||
|
Financial liabilities at amortized cost
|
34,032,289 | 35,073,626 | 51,527,021 | |||||||||
|
Total
|
34,032,289 | 35,073,626 | 51,527,021 | |||||||||
|
Type:
|
||||||||||||
|
Demand deposits
(1)
|
251,134 | 47,763 | 133,567 | |||||||||
|
Time deposits
(2)
|
30,510,143 | 26,077,164 | 27,022,696 | |||||||||
|
Repurchase agreements
|
3,271,012 | 8,948,699 | 24,370,758 | |||||||||
|
Of which:
|
||||||||||||
|
Backed operations with Private Securities
(3)
|
373,256 | 559,494 | 223,285 | |||||||||
|
Backed operations with Government Securities
|
2,897,756 | 8,389,205 | 24,147,473 | |||||||||
|
Total
|
34,032,289 | 35,073,626 | 51,527,021 | |||||||||
|
Currency:
|
||||||||||||
|
Reais
|
16,242,319 | 19,385,341 | 33,811,322 | |||||||||
|
Euro
|
497,300 | 370,544 | 437,811 | |||||||||
|
US dollar
|
17,292,342 | 15,106,130 | 15,141,705 | |||||||||
|
Other currencies
|
328 | 211,611 | 2,136,183 | |||||||||
|
Total
|
34,032,289 | 35,073,626 | 51,527,021 | |||||||||
(1) Non-interest bearing accounts.
(2) It includes the operation with credit institution arising from export and import financing lines, BNDES and Finame on-lending and abroad and other credit lines abroad.
(3) Refers basically to repurchase agreements backed by debentures own issue.
Note 41-d contains a detail of the remaining maturity of financial liabilities at amortized cost and of the related average interest rates.
F-53
BANCO SANTANDER (BRASIL) S.A.
NOTES TO THE CONSOLIDATED FINANCIAL STATEMENTS
(Amounts in thousands of Brazilian Reais - R$, unless otherwise stated)
The breakdown, by classification and type, of the balance of “Customer deposits” is as follows:
|
Thousands of Reais
|
2013
|
2012
|
2011
|
|||||||||
|
|
|
|||||||||||
|
Classification:
|
||||||||||||
|
Financial liabilities at amortized cost
|
200,155,677 | 188,594,930 | 174,473,891 | |||||||||
|
Total
|
200,155,677 | 188,594,930 | 174,473,891 | |||||||||
|
Type:
|
||||||||||||
|
Demand deposits
|
||||||||||||
|
Current accounts
(1)
|
15,584,719 | 13,585,488 | 13,561,003 | |||||||||
|
Savings accounts
|
33,589,050 | 26,856,910 | 23,293,434 | |||||||||
|
Time deposits
|
81,350,739 | 84,586,047 | 83,941,820 | |||||||||
|
Repurchase agreements
|
69,631,169 | 63,566,485 | 53,677,634 | |||||||||
|
Of which:
|
||||||||||||
|
Backed operations with Private Securities
(2)
|
41,851,923 | 35,735,634 | 30,246,944 | |||||||||
|
Backed operations with Government Securities
|
27,779,246 | 27,830,851 | 23,430,690 | |||||||||
|
Total
|
200,155,677 | 188,594,930 | 174,473,891 | |||||||||
(1) Non-interest bearing accounts.
(2) Refers basically to repurchase agreements backed by debentures own issue.
Note 41-d contains a detail of the residual maturity periods of financial liabilities at amortized cost and of the related average interest rates.
The breakdown, by classification and type, of the balance of “Marketable debt securities” is as follows:
|
Thousands of Reais
|
2013
|
2012
|
2011
|
|||||||||
|
|
|
|
|
|||||||||
|
Classification:
|
||||||||||||
|
Financial liabilities at amortized cost
|
65,300,548 | 54,012,018 | 38,590,423 | |||||||||
|
Total
|
65,300,548 | 54,012,018 | 38,590,423 | |||||||||
|
Type:
|
||||||||||||
|
Real estate credit notes - LCI
(1)
|
17,077,414 | 11,236,843 | 8,550,108 | |||||||||
|
Bonds and other securities
|
15,903,376 | 13,049,920 | 6,539,765 | |||||||||
|
Treasury Bills
(3)
|
28,222,426 | 25,320,186 | 19,926,031 | |||||||||
|
Securitization notes (MT100)
(4)
|
2,247,237 | 2,236,089 | 2,152,543 | |||||||||
|
Agribusiness credit notes - LCA
(2)
|
1,681,646 | 2,008,472 | 1,341,232 | |||||||||
|
Debenture
(5)
|
168,449 | 160,508 | 80,744 | |||||||||
|
Total
|
65,300,548 | 54,012,018 | 38,590,423 | |||||||||
(1) Real Estate Credit Notes are fixed income securities pegged by mortgages and mortgage-backed securities or liens on property. On December 31, 2013, have maturities between 2014 to 2020.
(2) Agribusiness credit notes are fixed income securities in which resources are allocated to the promotion of agribusiness, indexed between 85.0% to 100.0% of CDI. On December 31, 2013, have maturities between 2014 to 2020.
(3) The main features of the Treasury Bills are the minimum period of two years, minimum notional of R$300 and permission for early redemption of only 5% of the issued amount. On December 31, 2013, have a maturity between 2014 to 2025.
(4) Issuance of securities linked to the right to receive of future flow of payment orders receivable from foreign correspondent banks.
(5) Debentures issued by the Santos Energia Participações S.A. in April 2013, with remuneration indexed to CDI + 1.60% p.a. maturing on April 12, 2014.
The breakdown, by currency, of the balance of this account is as follows:
|
Thousands of Reais
|
||||||||||||
|
Currency:
|
2013
|
2012
|
2011
|
|||||||||
|
Reais
|
50,737,739 | 39,267,849 | 32,681,252 | |||||||||
|
US dollar
|
13,090,912 | 13,920,498 | 5,608,368 | |||||||||
|
Swiss Francs
|
1,315,966 | 679,024 | 300,803 | |||||||||
|
Iuan Renminbi/chi
|
58,044 | - | - | |||||||||
|
Peso/Chile
|
97,887 | - | - | |||||||||
|
Euro
|
- | 144,647 | - | |||||||||
|
Total
|
65,300,548 | 54,012,018 | 38,590,423 | |||||||||
F-54
BANCO SANTANDER (BRASIL) S.A.
NOTES TO THE CONSOLIDATED FINANCIAL STATEMENTS
(Amounts in thousands of Brazilian Reais - R$, unless otherwise stated)
|
Average interest (%)
|
||||||||||||
|
Currency:
|
2013
|
2012
|
2011
|
|||||||||
|
Reais
|
7.2 | % | 8.6 | % | 10.2 | % | ||||||
|
US dollar
|
3.9 | % | 3.9 | % | 3.8 | % | ||||||
|
Swiss Francs
|
1.0 | % | 3.2 | % | 3.0 | % | ||||||
|
Iuan Renminbi/chi
|
10.0 | % | - | - | ||||||||
|
Peso/Chile
|
10.0 | % | - | - | ||||||||
|
Euro
|
- | 0.6 | % | - | ||||||||
|
Total
|
7.2 | % | 7.3 | % | 8.8 | % | ||||||
|
The changes in the balance of Marketable debt instruments were as follows:
|
|
Thousands of Reais
|
2013 | 2012 | 2011 | |||||||||
|
Balance at beginning of the period
|
54,012,018 | 38,590,423 | 20,086,645 | |||||||||
|
Issuances
|
45,575,270 | 36,376,139 | 29,501,246 | |||||||||
|
Payments
|
(40,549,791 | ) | (25,440,219 | ) | (14,895,052 | ) | ||||||
|
Interest (Note 30)
|
4,355,190 | 3,662,370 | 3,226,644 | |||||||||
|
Exchange differences and Others
|
2,071,089 | 823,305 | 670,940 | |||||||||
|
Others
|
(163,228 | ) | - | - | ||||||||
|
Balance at end of the period
|
65,300,548 | 54,012,018 | 38,590,423 |
At December 31, 2013, 2012 and 2011, none of these instruments was convertible into Bank shares or granted privileges or rights which, in certain circumstances, make them convertible into shares.
A note 41-d contains a detail of the residual maturity periods of financial liabilities at amortized cost and of the related average interest rates in each year.
The breakdown of "Bonds and other securities" is as follows:
|
Interest rate (p.a.)
|
||||||||||||||||||||||
|
Issuance
|
Maturity
|
Currency
|
2013
|
2012
|
2011
|
|||||||||||||||||
|
Eurobonds
|
mar-11
|
mar-14
|
US$
|
Libor + 2.1
|
% | 2,813,498 | 2,452,473 | 2,252,536 | ||||||||||||||
|
Eurobonds
|
apr and nov-10
|
apr-15
|
US$
|
4.5 | % | 1,971,183 | 1,740,005 | 1,617,341 | ||||||||||||||
|
Eurobonds
|
jan and jun-11
|
jan-16
|
US$
|
4.3 | % | 2,005,381 | 1,741,878 | 1,608,424 | ||||||||||||||
|
Eurobonds
|
nov-05
|
nov-13
|
R$ | 17.1 | % | - | 333,182 | 333,182 | ||||||||||||||
|
Eurobonds
|
jun-11
|
dec-14
|
CHF
|
3.1 | % | 395,378 | 335,749 | 300,803 | ||||||||||||||
|
Eurobonds
|
feb and sep-12
|
feb-17
|
US$
|
4.6 | % | 3,210,407 | 2,806,547 | - | ||||||||||||||
|
Eurobonds
(2)
|
apr-12
|
apr-16
|
CHF
|
3.3 | % | 404,185 | 343,275 | - | ||||||||||||||
|
Eurobonds
(2)
|
mar-13
|
apr-18
|
US$
|
4,5% a 8,4 | % (1) | 786,587 | - | - | ||||||||||||||
|
Eurobonds
(2)
|
mar and may-13
|
mar-16
|
US$
|
8.0 | % | 1,283,821 | - | - | ||||||||||||||
|
Eurobonds
(2)
|
jun-13
|
jun-15
|
CHF
|
1.1 | % | 332,147 | - | - | ||||||||||||||
|
Others
|
2,700,789 | 3,296,811 | 427,479 | |||||||||||||||||||
|
Total
|
15,903,376 | 13,049,920 | 6,539,765 | |||||||||||||||||||
(1) The operation has compound interest flow: to April,17, 2013 equal 4.5% p.a., in period April, 18, 2013 to the October, 17, 2017 equal 8.4% p.a. and October, 18, 2017 the April 17, 2018 equal 7.0% p.a.
(2) Includes R$2,423,572 (12/31/2012 - R$820,077) in cash flow hedge operations, being R$1,283,821 indexed in Reais, R$983,819 indexed on foreign currency - Swiss Franc (12/31/2012 - R$679,025), R$97,887 in Chilean Peso (12/31/2012 - R$91,767) and R$58,044 in Iuan (12/31/2012 - R$49,285), and R$332,147 for market risk hedge operations indexed to foreign currency - Swiss Franc.
F-55
BANCO SANTANDER (BRASIL) S.A.
NOTES TO THE CONSOLIDATED FINANCIAL STATEMENTS
(Amounts in thousands of Brazilian Reais - R$, unless otherwise stated)
The composition of "securitization notes - MT100" is as follows:
|
Issuance
|
Maturity
|
Currency
|
Interest rate (p.a.)
|
2013
|
||||||
|
Series 2008-1
(1)
|
may-08
|
mar-15
|
US$
|
6.2%
|
150,645
|
|||||
|
Series 2008-2
(1) (2)
|
aug-08
|
sep-17
|
US$
|
Libor (6 months) + 0.8%
|
940,146
|
|||||
|
Series 2009-1
(1)
|
aug-09
|
sep-14
|
US$
|
Libor (6 months) + 2.1%
|
40,593
|
|||||
|
Series 2009-2
(1)
|
aug-09
|
sep-19
|
US$
|
6.3%
|
105,135
|
|||||
|
Series 2010-1
(1)
|
dec-10
|
mar-16
|
US$
|
Libor (6 months) + 1.5%
|
420,537
|
|||||
|
Series 2011-1
(1) (3)
|
may-11
|
mar-18
|
US$
|
4.2%
|
237,020
|
|||||
|
Series 2011-2
(1) (4)
|
may-11
|
mar-16
|
US$
|
Libor (6 months) + 1.4%
|
353,161
|
|||||
|
Total
|
2,247,237
|
|
Issuance
|
Maturity
|
Currency
|
Interest rate (p.a.)
|
2012
|
2011
|
|||||||
|
Series 2008-1
(1)
|
may-08
|
mar-15
|
US$
|
6.2%
|
212,565
|
265,203
|
||||||
|
Series 2008-2
(1) (2)
|
aug-08
|
sep-17
|
US$
|
Libor (6 months) + 0.8%
|
820,758
|
753,126
|
||||||
|
Series 2009-1
(1)
|
aug-09
|
sep-14
|
US$
|
Libor (6 months) + 2.1%
|
69,730
|
94,494
|
||||||
|
Series 2009-2
(1)
|
aug-09
|
sep-19
|
US$
|
6.3%
|
103,967
|
95,435
|
||||||
|
Series 2010-1
(1)
|
dec-10
|
mar-16
|
US$
|
Libor (6 months) + 1.5%
|
513,993
|
471,594
|
||||||
|
Series 2011-1
(1) (3)
|
may-11
|
mar-18
|
US$
|
4.2%
|
206,758
|
189,790
|
||||||
|
Series 2011-2
(1) (4)
|
may-11
|
mar-16
|
US$
|
Libor (6 months) + 1.4%
|
308,318
|
282,901
|
||||||
|
Total
|
2,236,089
|
2,152,543
|
(1) With charges payable semiannually.
(2) Principal is payable in 6 semiannual installments from March, 2015 (the period of this series was extended by three years in August, 2011).
(3) The principal will be paid semiannually in 9 installments from March 2014.
(4) The principal will be paid semiannually in 5 installments from March 2014.
The detail of the balance of “Subordinated liabilities” is as follows:
|
Thousands of Reais
|
||||||||||
|
|
Issuance
|
Maturity
(1)
|
Amount (millions)
|
Interest rate
|
2013
|
|||||
|
Subordinated Certificates
|
jun-06
|
jul-16
|
R$1500
|
105.0% CDI
|
3,306,909
|
|||||
|
Subordinated Certificates
|
oct-06
|
sep-16
|
R$850
|
104.5% CDI
|
1,788,358
|
|||||
|
Subordinated Certificates
|
jul-07
|
jul-14
|
R$885
|
104.5% CDI
|
1,684,508
|
|||||
|
Subordinated Certificates
|
jul-06 to oct-06
|
jul-16 to jul-18
|
R$447
|
104.5% CDI
|
970,794
|
|||||
|
Subordinated Certificates
|
jan-07
|
jan-14
|
R$250
|
104.5% CDI
|
508,655
|
|||||
|
Subordinated Certificates
|
may-08 to jun-08
|
may-13 to may-18
|
R$283
|
CDI
(2)
|
101,659
|
|||||
|
Subordinated Certificates
|
may-08 to jun-08
|
may-13 to jun-18
|
R$268
|
IPCA
(3)
|
368,401
|
|||||
|
Subordinated Certificates
|
nov-08
|
nov-14
|
R$100
|
120.5% CDI
|
176,860
|
|||||
|
Total
|
|
|
|
8,906,144
|
F-56
BANCO SANTANDER (BRASIL) S.A.
NOTES TO THE CONSOLIDATED FINANCIAL STATEMENTS
(Amounts in thousands of Brazilian Reais - R$, unless otherwise stated)
|
Thousands of Reais
|
||||||||||
|
|
Issuance
|
Maturity
(1)
|
Amount (millions)
|
Interest rate
|
2012
|
|||||
|
Subordinated Certificates
|
jun-06
|
jul-16
|
R$1500
|
105.0% CDI
|
3,048,617
|
|||||
|
Subordinated Certificates
|
oct-06
|
sep-16
|
R$850
|
104.5% CDI
|
1,649,313
|
|||||
|
Subordinated Certificates
|
jul-07
|
jul-14
|
R$885
|
104.5% CDI
|
1,553,537
|
|||||
|
Subordinated Certificates
|
apr-08
|
apr-13
|
R$600
|
100.0% CDI + 1.3%
|
1,010,620
|
|||||
|
Subordinated Certificates
|
apr-08
|
apr-13
|
R$555
|
100.0% CDI + 1.0%
|
929,321
|
|||||
|
Subordinated Certificates
|
jul-06 to oct-06
|
jul-16 to jul-18
|
R$447
|
104.5% CDI
|
895,314
|
|||||
|
Subordinated Certificates
|
jan-07
|
jan-13
|
R$300
|
104.0% CDI
|
561,379
|
|||||
|
Subordinated Certificates
|
aug-07
|
aug-13
|
R$300
|
100.0% CDI + 0.4%
|
524,743
|
|||||
|
Subordinated Certificates
|
jan-07
|
jan-14
|
R$250
|
104.5% CDI
|
469,107
|
|||||
|
Subordinated Certificates
|
may-08 to jun-08
|
may-13 to may-18
|
R$283
|
CDI
(2)
|
461,792
|
|||||
|
Subordinated Certificates
|
may-08 to jun-08
|
may-13 to jun-18
|
R$268
|
IPCA
(3)
|
494,490
|
|||||
|
Subordinated Certificates
|
nov-08
|
nov-14
|
R$100
|
120.5% CDI
|
161,101
|
|||||
|
Subordinated Certificates
|
feb-08
|
feb-13
|
R$85
|
IPCA +7.9%
|
159,817
|
|||||
|
Total
|
|
|
|
11,919,151
|
||||||
|
Thousands of Reais
|
||||||||||
|
|
Issuance
|
Maturity
(1)
|
Amount (millions)
|
Interest rate
|
2011
|
|||||
|
Subordinated Certificates
|
jun-06
|
jul-16
|
R$1,500
|
105.0% CDI
|
2,801,102
|
|||||
|
Subordinated Certificates
|
oct-06
|
sep-16
|
R$850
|
104.5% CDI
|
1,516,018
|
|||||
|
Subordinated Certificates
|
jul-07
|
jul-14
|
R$885
|
104.5% CDI
|
1,427,982
|
|||||
|
Subordinated Certificates
|
apr-08
|
apr-13
|
R$600
|
100.0% CDI + 1.3%
|
920,870
|
|||||
|
Subordinated Certificates
|
apr-08
|
apr-13
|
R$555
|
100.0% CDI + 1.0%
|
848,876
|
|||||
|
Subordinated Certificates
|
jul-06 to oct-06
|
jul-16 to jul-18
|
R$447
|
104.5% CDI
|
822,956
|
|||||
|
Subordinated Certificates
|
jan-07
|
jan-13
|
R$300
|
104.0% CDI
|
516,217
|
|||||
|
Subordinated Certificates
|
aug-07
|
aug-13
|
R$300
|
100.0% CDI + 0.4%
|
482,026
|
|||||
|
Subordinated Certificates
|
jan-07
|
jan-14
|
R$250
|
104.5% CDI
|
431,194
|
|||||
|
Subordinated Certificates
|
may-08 to jun-08
|
may-13 to may-18
|
R$283
|
CDI
(2)
|
422,628
|
|||||
|
Subordinated Certificates
|
may-08 to jun-08
|
may-13 to jun-18
|
R$268
|
IPCA
(3)
|
431,919
|
|||||
|
Subordinated Certificates
|
nov-08
|
nov-14
|
R$100
|
120.5% CDI
|
146,183
|
|||||
|
Subordinated Certificates
|
feb-08
|
feb-13
|
R$85
|
IPCA +7.9%
|
140,373
|
|||||
|
Total
|
|
|
|
10,908,344
|
(1) Subordinated certificates of deposit issued by Banco Santander S.A. with yield paid at the end of the term together with the principal.
(2) Indexed to 100% and 112% of the CDI.
(3) Indexed to the IPCA (extended consumer price index) plus interest of 8.3% p.a. to 8.4% p.a.
The detail by currency, of the balance of “Subordinated liabilities” is as follows:
|
|
Thousands of Reais
|
Average Interest Rate (%)
|
||||||||||||||||||||||
|
Currency:
|
2013
|
2012
|
2011
|
2013
|
2012
|
2011
|
||||||||||||||||||
|
Reais
|
8,906,144 | 11,919,151 | 10,908,344 | 8.5 | % | 8.7 | % | 11.2 | % | |||||||||||||||
|
Total
|
8,906,144 | 11,919,151 | 10,908,344 | 8.5 | % | 8.7 | % | 11.2 | % | |||||||||||||||
The changes in “Subordinated liabilities” were as follows:
| 2013 | 2012 | 2011 | ||||||||||||||||||||||
|
Balance at beginning of year
|
11,919,151 | 10,908,344 | 9,695,105 | |||||||||||||||||||||
|
Payments
|
(3,823,280 | ) | - | - | ||||||||||||||||||||
|
Interest (Note 30)
|
810,273 | 1,010,807 | 1,213,239 | |||||||||||||||||||||
|
Balance at end of year
|
8,906,144 | 11,919,151 | 10,908,344 |
Note 41-d contains a detail of the residual maturity periods of subordinated liabilities at each year-end and of the related average interest rates in each year.
F-57
BANCO SANTANDER (BRASIL) S.A.
NOTES TO THE CONSOLIDATED FINANCIAL STATEMENTS
(Amounts in thousands of Brazilian Reais - R$, unless otherwise stated)
The breakdown of the balances of these items is as follows:
|
Thousands of Reais
|
2013
|
2012
|
2011
|
|||||||||
|
Credit card obligations
|
14,870,988 | 12,689,689 | 11,000,043 | |||||||||
|
Unsettled financial transactions
|
2,916,301 | 1,791,274 | 1,914,897 | |||||||||
|
Dividends payable
|
1,684,277 | 1,055,309 | 1,182,284 | |||||||||
|
Tax collection accounts - Tax payables
|
379,174 | 422,271 | 579,413 | |||||||||
|
Liability associated with the transfer of assets (Note 9.g)
|
336,040 | 495,467 | 686,015 | |||||||||
|
Other financial liabilities
|
1,119,182 | 922,471 | 589,355 | |||||||||
|
Total
|
21,305,962 | 17,376,481 | 15,952,007 | |||||||||
a) Breakdown
The breakdown of the balance of “Provisions” is as follows:
|
Thousands of Reais
|
2013
|
2012
|
2011
|
|||||||||
|
|
||||||||||||
|
Provisions for pension funds and similar obligations
|
3,043,311 | 5,260,700 | 3,088,593 | |||||||||
|
Provisions for judicial and administrative proceedings, commitments and other provisions
|
7,849,077 | 7,514,266 | 8,269,255 | |||||||||
|
Judicial and administrative proceedings under the responsibility of former controlling stockholders
|
954,325 | 991,394 | 992,687 | |||||||||
|
Judicial and administrative proceedings
|
5,382,320 | 5,795,027 | 6,398,333 | |||||||||
|
Of which:
|
||||||||||||
|
Civil
|
1,641,199 | 1,480,320 | 1,333,671 | |||||||||
|
Labor
|
1,938,355 | 2,611,852 | 3,337,579 | |||||||||
|
Tax and Social Security
|
1,802,766 | 1,705,610 | 1,727,083 | |||||||||
|
Others provisions
(1)
|
1,512,432 | 727,845 | 878,235 | |||||||||
|
Total
|
10,892,388 | 12,774,966 | 11,357,848 | |||||||||
(1) In 2013, includes R$987,600 relating the formation of a fund to cover the impacts of projects aimed at improving operational productivity and efficiency recorded under “Provisions (net)”, provision for compensation fund for salary variation (FCVS) and others provisions.
b) Changes
The changes in “Provisions” were as follows:
|
Thousands of Reais
|
2013
|
|||||||||||
|
|
Pensions
|
Other
Provisions
(1)
|
Total
|
|||||||||
|
Balance at beginning of year
|
5,260,700 | 7,514,266 | 12,774,966 | |||||||||
|
Additions charged to income:
|
||||||||||||
|
Interest expense and similar charges (Note 30)
|
378,904 | - | 378,904 | |||||||||
|
Personnel Expenses (Note 37.a & 21.c)
|
46,341 | - | 46,341 | |||||||||
|
Additions to provisions
|
(4,769 | ) | 2,697,587 | 2,692,818 | ||||||||
|
Payments to pensioners and early retirees with a charge to internal provisions
|
(44,515 | ) | - | (44,515 | ) | |||||||
|
Payments to external funds
|
(315,853 | ) | - | (315,853 | ) | |||||||
|
Amount used
|
- | (3,063,833 | ) | (3,063,833 | ) | |||||||
|
Transition Adjustments to the amendments to the IAS 19
|
(2,265,530 | ) | - | (2,265,530 | ) | |||||||
|
Transfer to other assets - actuarial assets (Note 15)
|
(11,967 | ) | - | (11,967 | ) | |||||||
|
Transfers, exchange differences and other changes
|
- | 701,057 | 701,057 | |||||||||
|
Balance at end of year
|
3,043,311 | 7,849,077 | 10,892,388 | |||||||||
F-58
BANCO SANTANDER (BRASIL) S.A.
NOTES TO THE CONSOLIDATED FINANCIAL STATEMENTS
(Amounts in thousands of Brazilian Reais - R$, unless otherwise stated)
|
Thousands of Reais
|
2012
|
|||||||||||
|
|
Pensions
|
Other Provisions
(1)
|
Total
|
|||||||||
|
Balance at beginning of year
|
3,088,593 | 8,269,255 | 11,357,848 | |||||||||
|
Additions charged to income:
|
||||||||||||
|
Interest expense and similar charges (Note 30)
|
278,619 | - | 278,619 | |||||||||
|
Personnel Expenses (Note 37.a & 21.c)
|
42,798 | - | 42,798 | |||||||||
|
Additions to provisions
|
(53,124 | ) | 2,109,730 | 2,056,606 | ||||||||
|
Payments to pensioners and early retirees with a charge to internal provisions
|
(42,584 | ) | - | (42,584 | ) | |||||||
|
Payments to external funds
|
(239,042 | ) | - | (239,042 | ) | |||||||
|
Amount used
|
- | (2,908,432 | ) | (2,908,432 | ) | |||||||
|
Transition Adjustments to the amendments to the IAS 19
|
2,185,708 | - | 2,185,708 | |||||||||
|
Transfer to other assets - actuarial assets (Note 15)
|
(268 | ) | - | (268 | ) | |||||||
|
Transfers, exchange differences and other changes
|
- | 43,713 | 43,713 | |||||||||
|
Balance at end of year
|
5,260,700 | 7,514,266 | 12,774,966 | |||||||||
|
Thousands of Reais
|
2011
|
|||||||||||
|
Pensions
|
Other Provisions
(1)
|
Total
|
||||||||||
|
Balance at beginning of year
|
1,876,981 | 8,205,053 | 10,082,034 | |||||||||
|
Net change in the scope of consolidation (Note 3.c)
|
- | (127,419 | ) | (127,419 | ) | |||||||
|
Additions charged to income:
|
||||||||||||
|
Interest income and similar charges (Note 29)
|
(55,103 | ) | - | (55,103 | ) | |||||||
|
Interest expense and similar charges (Note 30)
|
231,944 | - | 231,944 | |||||||||
|
Personnel Expenses (Note 37.a & 21.c)
|
19,460 | - | 19,460 | |||||||||
|
Additions to provisions
(2)
|
46,274 | 2,939,052 | 2,985,326 | |||||||||
|
Payments to pensioners and early retirees with a charge to internal provisions
|
(39,596 | ) | - | (39,596 | ) | |||||||
|
Payments to external funds
|
(219,263 | ) | - | (219,263 | ) | |||||||
|
Amount used
|
- | (2,672,142 | ) | (2,672,142 | ) | |||||||
|
Transition Adjustments to the amendments to the IAS 19
|
1,214,763 | - | 1,214,763 | |||||||||
|
Transfer to other assets - actuarial assets (Note 15)
|
13,133 | - | 13,133 | |||||||||
|
Transfers, exchange differences and other changes
|
- | (75,289 | ) | (75,289 | ) | |||||||
|
Balance at end of year
|
3,088,593 | 8,269,255 | 11,357,848 | |||||||||
(1) Includes, primarily, provisions for tax risks and legal obligations, and judicial and administrative proceedings of labor and civil lawsuits.
(2) In the fourth quarter of 2011 were made up an additional R$648.7 million provision for labor proceedings concerning the Bank's initiative to accelerate the agreements in order to reduce the volume of open cases. Alongside this, the Bank has been working strongly in the prevention of labor disputes, with improvements in controls journey governance in outsourcing, among other measures.
c) Provisions for pensions and similar obligations
i. Supplemental Pension Plan
The Banco Santander and its subsidiaries sponsor private pension entities and plans exclusive to employees and former employees, pension funds and cash assistance with the purpose of providing retirement and pension benefits that supplement those provided by the government, as defined in the basic regulations of each plan.
• Banesprev - Fundo Banespa de Seguridade Social (Banesprev)
- Plan I: defined benefit plan fully defrayed by Banco Santander, covers employees hired after May 22, 1975 called Participants Recipients, and those hired until May 22, 1975 called Participants Aggregates, who are also entitled to death benefits. Plan is closed to new entrants since March 28, 2005.
- Plan II: defined benefit plan, constituted from July 27, 1994, effective of the new text of the Statute and Regulations of the Basic Plan II, Plan I participants who chose the new plan began to contribute to the rate of 44.9% stipulated by the actuary for funding each year, introduced in April 2012 extraordinary cost to the sponsor and participants, as agreed with the PREVIC due Deficit in plan. Plan is closed to new entrants since June 3, 2005.
- Plan V: defined benefit plan fully defrayed by Banco Santander, covers employees hired until after May 22, 1975.
F-59
BANCO SANTANDER (BRASIL) S.A.
NOTES TO THE CONSOLIDATED FINANCIAL STATEMENTS
(Amounts in thousands of Brazilian Reais - R$, unless otherwise stated)
- Supplemental Pension Plan: defined benefit plan was created in view of the privatization of Banespa and is managed by Banesprev and offered only to employees hired before May 22, 1975, this Plan effective January 1, 2000. Plan is closed to new entrants since April 28, 2000.
- Plan III: variable contribution plan, for employees hired after May 22,1975, previously served by the Plans I and II. Under this plan contributions are made by the sponsor and the participants. The benefits are in the form of defined contribution during the period of contribution and defined benefit during the receipt of benefit, if paid as monthly income for life. Plan is closed to new entrants since September 1, 2005.
- Plan IV: variable contribution plan, designed for employees hired as of November 27, 2000, in which the sponsor only contributes to the risk benefits and administrative expenses. In this plan the benefit is set in the form of defined contribution during the period of contribution and defined benefit during the receipt of benefits in the form of monthly income for life, in whole or in part of the benefit. The risk benefits of the plan are in the form of defined benefit. Plan is closed to new entrants since July 23, 2010.
• Sanprev - Santander Associação de Previdência (Sanprev)
-
Plan I: defined benefit plan, established on September 27, 1979, covering employees enrolled in the plan sponsor and is in process of extinction since June 30, 1996.
- Plan II: plan that provides insurance risk, pension supplement temporary, disability retirement annuity and the supplemental death and sickness allowance and birth, including employees enrolled in the plan sponsor and is funded solely by sponsors through monthly contributions, as indicated by the actuary. Plan is closed to new entrants since March 10, 2010.
- Plan III: variable contribution plan covering employees of the sponsors who made the choice to contribute, by contributing freely chosen by participants from 2% of salary contribution. That the benefit plan is a defined contribution during the contribution and defined benefit during the receipt of the benefit, being in the form of monthly income for life, in whole or in part of the benefit. Plan is closed to new entrants since March 10, 2010.
• Bandeprev - Bandepe Previdência Social (Bandeprev)
Defined benefit plan, sponsored by Banco Bandepe and Banco Santander, managed by Bandeprev. The plans are divided into basic plan and special retirement supplement plan, with different eligibility requirements, contributions and benefits by subgroups of participants. Both plans are closed to new entrants.
• Other plans
SantanderPrevi - Sociedade de Previdência Privada (SantanderPrevi):
is a closed pension entity, which aims at setting up and implementation of benefit plans of pension character, complementary to the general welfare, in the form of legislation. Have a plan designed in the form of defined contribution, with contributions made by sponsors and participants. It also has 10 cases of lifetime income with benefits arising from the previous plan.
Fundação América do Sul de Assistência e Seguridade Social (Fasass):
Closed Pension entity that administered social security benefits in three plans, two on a Defined Benefit and a variable contribution, whose process of withdrawal of sponsorship, approved by Supplementary Pension Plan Secretariat (SPC), actual PREVIC - Superintendence of Pension Funds, were implemented in July 2009.
Banco Santander and subsidiary companies are the sponsor of the welfare plans, supplemental retirement plan and of pension plans for associated employees, structured as defined benefit plans.
ii. Actuarial Techniques
The amount of the defined benefit obligations was determined by independent actuaries using the following actuarial techniques:
• Valuation method:
Projected unit credit method, which sees each year of service as giving rise to an additional unit of benefit entitlement and measures each unit separately.
• Nominal discount rate for actuarial obligation and calculation of interest on assets:
- Banesprev, Sanprev, SantanderPrevi, Bandeprev and Other Plans - 11.2% (2012 - 8.7% and 2011 - 10.4%).
- Cabesp, Law 9.656 and others obligations - 11.3% (2012 - 9.0% and 2011 - 10.4%).
F-60
BANCO SANTANDER (BRASIL) S.A.
NOTES TO THE CONSOLIDATED FINANCIAL STATEMENTS
(Amounts in thousands of Brazilian Reais - R$, unless otherwise stated)
• Estimated long-term inflation rate:
- Banesprev, Sanprev, SantanderPrevi, Bandeprev and Other Plans - 4.5% (2012 - 4.5% and 2011 - 4.4%).
• Estimate salary increase rate:
- Banesprev, Sanprev, SantanderPrevi, Bandeprev Básico and Other Plans - 5.0% ( 2012 - 5.0% and 2011 - 4.9%).
iii. Health and Dental Care Plan
• Cabesp - Caixa Beneficente dos Funcionários do Banco do Estado de São Paulo S.A.
Entity that covers health and dental care expenses of employees hired until Banespa privatization in 2000.
• SantanderPrevi’s Retirees
SantanderPrevi’s retirees’ health care plan "Retirement SantanderPrevi" has lifelong nature and it is a closed group. In shutdown the employee should have completed 10 years of employment with Banco Real and 55 years of age. In this case it was offered continuity of health care plan where the employee bears 70% of the monthly and Bank subsidizes 30%. This rule lasted until Dec/2002 and after this period that the employee was off like status Retired Holandaprevi, bears 100% of the monthly health plan.
• Former employees of Banco Real S.A. (retiree by Circulares)
It granting entitlement to healthcare former employee of Banco Real, with lifetime benefit was granted in the same condition the active employee, in this case, with the same coverage and plan design. Eligible only to plans Basic and standard first apartment, opting for apartment he takes the difference between the plans more co-participation in the Basic plan. Not allowed new additions of dependents. It has subsidizes of 90% of the plan.
• Bandeprev’s retirees
The health care plan retirees of Bandeprev’s pension plan beneficiaries is a lifetime benefit, for which Banco Santander is responsible for defraying 50% of the benefits of employees retired before the date the sponsor Banco Bandepe was privatized and 30% of the benefits of employees retired after privatization.
• Officer with Lifetime Benefits (Lifetime Officers)
Lifetime health care benefit granted to former officers of Banco Sudameris Brasil S.A. In this case, no conclusion, being 100% funded by the bank.
• Life insurance for Banco Real’s retirees
For Retirees Circulars: indemnity in case of Natural Death, Disease Disability, Accidental Death. The subsidy is 45.28% of the value. This benefit is also granted to retirees Foundation Sudameris where cost is 100% of the retired. It closed group.
• Free clinic
The health care plan "free clinic" is a lifetime plan offered to the retirees who have contributed to Fundação Sudameris for at least 25 years and is funded by the users. The plan is offered only for hospitalization in wards, where the cost is 100% of Sudameris Foundation.
• Plasas
Voluntary health plan, created on July 1, 1989, supplementary to the health care plan and only for cases of hospitalization. It includes a reserve made up by participants’ and Fasass’ contributions, which are suspended since August 1999. The Plan is closed to new entrants since July 1999.
Additionally, it is assured to retired employees, since they meet to certain legal requirements and full pays their respective contributions, the right to be maintaining as a beneficiary of the Bank health plan, in the same conditions for healthcare coverage, taken place during their employment contract. The Bank’s provisions related to this retired employees are accrued using actuarial calculations based in the present value of the current cost.
F-61
BANCO SANTANDER (BRASIL) S.A.
NOTES TO THE CONSOLIDATED FINANCIAL STATEMENTS
(Amounts in thousands of Brazilian Reais - R$, unless otherwise stated)
The funding status of the defined benefit obligations in 2013 and in the last 4 years are as follows:
|
Thousands of Reais
|
2013
|
2012
|
2011
|
2010
|
2009
|
|||||||||||||||
|
|
||||||||||||||||||||
|
Present value of the obligations - Post-employment plans:
|
|
|
|
|
||||||||||||||||
|
To current employees
|
585,214 | 1,639,679 | 1,312,325 | 1,212,603 | 1,078,765 | |||||||||||||||
|
Vested obligations to retired employees
|
15,912,616 | 19,028,670 | 15,268,283 | 14,009,689 | 12,644,915 | |||||||||||||||
|
|
16,497,830 | 20,668,349 | 16,580,608 | 15,222,292 | 13,723,680 | |||||||||||||||
|
Less:
|
||||||||||||||||||||
|
Fair value of plan assets
|
15,271,532 | 17,883,138 | 15,051,746 | 14,522,452 | 13,324,387 | |||||||||||||||
|
Unrecognized assets
(1)
|
(786,377 | ) | (780,922 | ) | (802,969 | ) | (835,897 | ) | (870,468 | ) | ||||||||||
|
Provisions – Post-employment plans, net
|
2,012,675 | 3,566,133 | 2,331,831 | 1,535,737 | 1,269,761 | |||||||||||||||
|
|
||||||||||||||||||||
|
Present value of the obligations - Other similar obligations:
|
||||||||||||||||||||
|
To current employees
|
315,542 | 747,175 | 601,549 | 530,858 | 23,053 | |||||||||||||||
|
Vested obligations to retired employees
|
5,208,636 | 6,286,495 | 4,569,371 | 3,759,378 | 3,842,505 | |||||||||||||||
|
|
5,524,178 | 7,033,670 | 5,170,920 | 4,290,236 | 3,865,558 | |||||||||||||||
|
Less:
|
||||||||||||||||||||
|
Fair value of plan assets
|
4,629,910 | 5,473,031 | 4,535,896 | 4,142,589 | 3,683,450 | |||||||||||||||
|
Unrecognized assets
(1)
|
(135,470 | ) | (121,064 | ) | (108,605 | ) | (193,597 | ) | (97,711 | ) | ||||||||||
|
Provisions – Other similar obligations, net
|
1,029,738 | 1,681,703 | 743,629 | 341,244 | 279,819 | |||||||||||||||
|
Total provisions for pension plans, net
|
3,042,413 | 5,247,836 | 3,075,460 | 1,876,981 | 1,549,580 | |||||||||||||||
|
Of which:
|
||||||||||||||||||||
|
Actuarial provisions
|
3,043,311 | 5,260,700 | 3,088,593 | 1,876,981 | 1,549,580 | |||||||||||||||
|
Actuarial assets (note 15)
|
898 | 12,865 | 13,133 | - | - | |||||||||||||||
(1) Refers to fully funded plans Banesprev I and III, Sanprev I, II and III, Bandeprev and Plasas.
The amounts recognized in the consolidated income statement in relation to the aforementioned defined benefit obligations are as follows:
|
Thousands of Reais
|
Post-Employment Plans
|
|||||||||||||||||||
|
|
2013
|
2012
|
2011
|
2010
|
2009
|
|||||||||||||||
|
|
|
|
|
|
|
|||||||||||||||
|
Current service cost (note 37.a & 21.b)
|
25,584 | 22,708 | 19,460 | 16,212 | 22,051 | |||||||||||||||
|
Interest cost
|
1,803,190 | 1,756,104 | 1,561,367 | 1,460,199 | 1,362,265 | |||||||||||||||
|
Expected return on plan assets
|
(1,563,926 | ) | (1,551,712 | ) | (1,492,661 | ) | (1,327,254 | ) | (1,283,582 | ) | ||||||||||
|
Extraordinary charges:
|
||||||||||||||||||||
|
Other movements
|
(4,244 | ) | (25,648 | ) | 62,837 | 5,754 | 14,549 | |||||||||||||
|
Early retirement cost
|
93 | 8,258 | 89 | 32 | - | |||||||||||||||
|
Total
|
260,697 | 209,711 | 151,092 | 154,943 | 115,283 | |||||||||||||||
|
Thousands of Reais
|
Other Similar Obligations
|
|||||||||||||||||||
|
|
2013 | 2012 | 2011 | 2010 | 2009 | |||||||||||||||
|
|
||||||||||||||||||||
|
Current service cost (note 37.a & 21.b)
|
20,757 | 20,090 | - | - | 14,483 | |||||||||||||||
|
Interest cost
|
602,131 | 537,954 | 445,405 | 424,157 | 307,459 | |||||||||||||||
|
Expected return on plan assets
|
(462,491 | ) | (463,727 | ) | (433,252 | ) | (391,636 | ) | (279,880 | ) | ||||||||||
|
Extraordinary charges:
|
||||||||||||||||||||
|
Other movements
|
(618 | ) | (35,734 | ) | 2,873 | 64,180 | 8,550 | |||||||||||||
|
Early retirement cost
|
- | - | 38,335 | 58,576 | - | |||||||||||||||
|
Total
|
159,779 | 58,583 | 53,361 | 155,277 | 50,612 | |||||||||||||||
F-62
BANCO SANTANDER (BRASIL) S.A.
NOTES TO THE CONSOLIDATED FINANCIAL STATEMENTS
(Amounts in thousands of Brazilian Reais - R$, unless otherwise stated)
The changes in the present value of the accrued defined benefit obligations were as follows:
|
Thousands of Reais
|
Post-Employment Plans
|
|||||||||||||||||||
|
|
2013
|
2012
|
2011
|
2010
|
2009
|
|||||||||||||||
|
|
|
|
|
|
||||||||||||||||
|
Present value of the obligations at beginning of year
|
20,668,349 | 16,580,608 | 15,222,292 | 13,723,680 | 12,630,889 | |||||||||||||||
|
Current service cost
|
25,584 | 22,708 | 19,460 | 16,212 | 22,051 | |||||||||||||||
|
Interest cost
|
1,721,109 | 1,659,518 | 1,561,367 | 1,460,199 | 1,362,265 | |||||||||||||||
|
Early retirement cost
|
- | - | 89 | 32 | - | |||||||||||||||
|
Benefits paid
|
(1,336,124 | ) | (1,308,099 | ) | (1,171,279 | ) | (1,064,412 | ) | (1,394,064 | ) | ||||||||||
|
Actuarial (gains)/losses
|
(4,632,667 | ) | 3,693,482 | 924,447 | 1,085,254 | 1,102,539 | ||||||||||||||
|
Others
|
51,579 | 20,132 | 24,232 | 1,327 | - | |||||||||||||||
|
Present value of the obligations at end of year
|
16,497,830 | 20,668,349 | 16,580,608 | 15,222,292 | 13,723,680 | |||||||||||||||
|
Thousands of Reais
|
Other Similar Obligations
|
|||||||||||||||||||
|
|
2013
|
2012
|
2011
|
2010
|
2009
|
|||||||||||||||
|
|
|
|
|
|
|
|||||||||||||||
|
Present value of the obligations at beginning of year
|
7,033,670 | 5,170,920 | 4,290,236 | 3,865,558 | 2,711,520 | |||||||||||||||
|
Current service cost
|
20,757 | 20,090 | - | - | 14,483 | |||||||||||||||
|
Interest cost
|
615,014 | 526,079 | 445,405 | 424,157 | 307,459 | |||||||||||||||
|
Early retirement cost
|
- | - | (4,411 | ) | 1,026 | - | ||||||||||||||
|
Benefits paid
|
(291,221 | ) | (292,145 | ) | (220,030 | ) | (177,674 | ) | (178,875 | ) | ||||||||||
|
Actuarial (gains)/losses
|
(1,859,513 | ) | 1,710,072 | 633,116 | 132,301 | 1,010,971 | ||||||||||||||
|
Other
|
5,471 | (101,346 | ) | 26,604 | 44,868 | - | ||||||||||||||
|
Present value of the obligations at end of year
|
5,524,178 | 7,033,670 | 5,170,920 | 4,290,236 | 3,865,558 | |||||||||||||||
The changes in the fair value of the plan assets were as follows:
|
Thousands of Reais
|
Post-Employment Plans
|
|||||||||||||||||||
|
|
2013
|
2012
|
2011
|
2010
|
2009
|
|||||||||||||||
|
|
|
|
|
|
|
|||||||||||||||
|
Fair value of plan assets at beginning of year
|
17,883,138 | 15,051,746 | 14,522,452 | 13,324,387 | 12,390,745 | |||||||||||||||
|
Expected return on plan assets
|
1,563,926 | 1,551,712 | 1,492,661 | 1,327,254 | 1,283,582 | |||||||||||||||
|
Actuarial gains/(losses)
|
(3,178,551 | ) | 2,342,632 | 34,074 | 788,178 | 692,559 | ||||||||||||||
|
Contributions
|
294,688 | 223,260 | 173,838 | 129,051 | 106,837 | |||||||||||||||
|
Of which:
|
||||||||||||||||||||
|
By the Bank
|
243,109 | 203,520 | 153,744 | 108,501 | 84,495 | |||||||||||||||
|
By plan participants
|
51,579 | 19,740 | 20,094 | 20,550 | 22,341 | |||||||||||||||
|
Benefits paid
|
(1,291,645 | ) | (1,308,099 | ) | (1,171,279 | ) | (1,051,854 | ) | (1,149,336 | ) | ||||||||||
|
Exchange differences and other items
|
(25 | ) | 21,887 | - | 5,436 | - | ||||||||||||||
|
Fair value of plan assets at end of year
|
15,271,531 | 17,883,138 | 15,051,746 | 14,522,452 | 13,324,387 | |||||||||||||||
|
Thousands of Reais
|
Other Similar Obligations
|
|||||||||||||||||||
|
|
2013
|
2012
|
2011
|
2010
|
2009
|
|||||||||||||||
|
|
|
|
|
|
|
|||||||||||||||
|
Fair value of plan assets at beginning of year
|
5,473,031 | 4,535,896 | 4,142,589 | 3,683,450 | 2,897,569 | |||||||||||||||
|
Expected return on plan assets
|
462,491 | 463,727 | 433,252 | 391,636 | 279,880 | |||||||||||||||
|
Actuarial gains/(losses)
|
(1,088,686 | ) | 694,955 | 130,734 | 187,714 | 635,821 | ||||||||||||||
|
Contributions
|
52,870 | 70,598 | 64,878 | 58,833 | 42,751 | |||||||||||||||
|
Of which:
|
||||||||||||||||||||
|
By the Bank
|
47,399 | 65,551 | 59,576 | 53,944 | 37,635 | |||||||||||||||
|
By plan participants
|
5,471 | 5,048 | 5,301 | 4,889 | 5,116 | |||||||||||||||
|
Benefits paid
|
(269,796 | ) | (292,145 | ) | (218,173 | ) | (192,371 | ) | (172,571 | ) | ||||||||||
|
Exchange differences and other items
|
- | - | (17,384 | ) | 13,327 | - | ||||||||||||||
|
Fair value of plan assets at end of year
|
4,629,910 | 5,473,031 | 4,535,896 | 4,142,589 | 3,683,450 | |||||||||||||||
Opening of gains (losses) Actuarial from experience, financial assumptions and demographic hypotheses:
|
Thousands of Reais
|
Post-Employment Plans
|
||
|
2013
|
|||
|
Experience Plan
|
7,545
|
||
|
Changes in Financial Assumptions
|
4,616,063
|
||
|
Changes in Demographic Assumptions
|
9,059
|
||
|
Gain (Loss) Actuarial - Obligation
|
4,632,667
|
||
|
Return on Investment, Return Unlike Implied Discount Rate
|
(3,178,551)
|
||
|
Gain (Loss) Actuarial - Asset
|
(3,178,551)
|
F-63
BANCO SANTANDER (BRASIL) S.A.
NOTES TO THE CONSOLIDATED FINANCIAL STATEMENTS
(Amounts in thousands of Brazilian Reais - R$, unless otherwise stated)
| Thousands of Reais |
Other Similar Obligations
|
|||
|
2013
|
||||
|
Experience Plan
|
(162,621 | ) | ||
|
Changes in Financial Assumptions
|
1,977,207 | |||
|
Changes in Demographic Assumptions
|
44,927 | |||
|
Gain (Loss) Actuarial - Obligation
|
1,859,513 | |||
|
Return on Investment, Return Unlike Implied Discount Rate
|
(1,088,686 | ) | ||
|
Gain (Loss) Actuarial - Asset
|
(1,088,686 | ) | ||
The experience adjustments arising from plan assets and liabilities are shown bellow:
|
Post - Employment Plans
|
||||||||||||||||||||
|
In thousand of reais
|
2013
|
2012
|
2011
|
2010
|
2009
|
|||||||||||||||
|
Experience Adjustments in Net Assets
|
(3,178,551 | ) | 2,342,632 | 34,074 | 788,178 | 692,559 | ||||||||||||||
|
Other Similar Obligations
|
||||||||||||||||||||
|
In thousand of reais
|
2013 | 2012 | 2011 | 2010 | 2009 | |||||||||||||||
|
Experience Adjustments in Net Assets
|
(1,088,686 | ) | 694,955 | 130,734 | 187,714 | 635,821 | ||||||||||||||
The amounts of actuarial obligation of defined benefit plans uninsured and defined benefit plans partially or totally covered are shown below:
|
In thousand of reais
|
2013
|
2012
|
2011
|
2010
|
||||||||||||
|
|
|
|||||||||||||||
|
Defined benefit plans uninsured
|
836,129 | 890,234 | 769,150 | 628,138 | ||||||||||||
|
Defined benefit plans partially or totally covered
|
21,061,473 | 26,811,786 | 20,982,378 | 18,884,390 | ||||||||||||
In 2014 the Bank expects to make contributions to fund these obligations for amounts similar to those made in 2013.
The main categories of plan assets as a percentage of total plan assets are as follows:
|
|
2013
|
2012
|
2011
|
2010
|
2009
|
|||||||||||||||
|
|
|
|
|
|||||||||||||||||
|
Equity instruments
|
2.10 | % | 2.80 | % | 2.77 | % | 5.05 | % | 2.55 | % | ||||||||||
|
Debt instruments
|
96.30 | % | 93.40 | % | 93.38 | % | 92.91 | % | 96.58 | % | ||||||||||
|
Properties
|
0.20 | % | 0.50 | % | 0.50 | % | 0.47 | % | 0.12 | % | ||||||||||
|
Other
|
1.40 | % | 3.30 | % | 3.36 | % | 1.57 | % | 0.75 | % | ||||||||||
The expected return on plan assets was determined on the basis of the market expectations for returns over the duration of the related obligations.
The actual return on plan assets was R$2,991 (2012 - R$5,057 and 2011 - R$2,090).
The following table shows the estimated benefits payable at December 31, 2013 for the next ten years:
|
Thousands of Reais
|
|
|
|
|
|
2014
|
1,734,926
|
|
2015
|
1,818,829
|
|
2016
|
1,906,063
|
|
2017
|
1,995,072
|
|
2018 to 2023
|
13,949,933
|
|
Total
|
21,404,823
|
Presumptions about the rates related to medical care costs have a significant impact on the amounts recognized in income. A change of one percentage point in the medical care cost rates would have the effects as follows:
|
Thousands of Reais
|
||||
|
Sensitivity
|
||||
|
(+) 1,0%
|
(-) 1,0%
|
|||
|
Effect on current service cost and interest on actuarial liabilities
|
-
|
-
|
||
|
Effects on present value of obligation
|
724,088
|
(612,260)
|
||
F-64
BANCO SANTANDER (BRASIL) S.A.
NOTES TO THE CONSOLIDATED FINANCIAL STATEMENTS
(Amounts in thousands of Brazilian Reais - R$, unless otherwise stated)
The following table shows the duration of the actuarial liabilities of the plans sponsored by Banco Santander:
|
Plans
|
Post - Employment Plans
|
||
|
Duration (in years)
|
|||
|
Banesprev Plans I
|
12.66 | ||
|
Banesprev Plans II
|
11.86 | ||
|
Banesprev Plans III
|
8.66 | ||
|
Banesprev Plans IV
|
16.70 | ||
|
Banesprev Plans V
|
9.42 | ||
|
Banesprev Pre-75
|
10.17 | ||
|
Sanprev I
|
7.15 | ||
|
Sanprev II
|
17.87 | ||
|
Bandeprev Basic
|
10.07 | ||
|
Bandeprev Special I
|
7.54 | ||
|
Bandeprev Special II
|
7.47 | ||
|
SantanderPrevi
|
7.63 | ||
|
Meridional
|
7.27 | ||
|
Plans
|
Other Similar Obligations
|
||
|
Cabesp
|
14.03 | ||
|
Law 9656
|
41.25 | ||
|
Bandepe
|
15.08 | ||
|
Plasas
|
13.67 | ||
|
Free Clinic
|
11.92 | ||
|
Lifetime officers
|
9.93 | ||
|
Circulars
(1)
|
13,76 & 10,89 | ||
|
Life Insurance
|
9.02 |
(1)The duration 13.76 refers to the plan of Former Employees of Banco ABN Amro and 10.89 to the plane of Former Employees of Banco Real.
d) Provisions for civil, labor, tax and social security contingencies
Banco Santander and its subsidiaries are parties to judicial and administrative proceedings involving civil, labor, tax and social security matters arising in the normal course of their business.
Provisions were recognized based on the nature, complexity and history of the lawsuits, and on the opinion of the in-house and outside legal counsel. Banco Santander's policy is to accrue the full amount of the potential risk of loss whose valuation is classified as probable. The statutory tax and social security were fully recognized in the financial statements.
Management understands that the recognized provisions are sufficient to cover probable losses with respect to judicial and administrative proceedings as follows:
d.1) Tax and Social Security Proceedings
The Bank and its subsidiaries entered into a amnesty e program for taxes and social security debts established by Law 12.865/13 (Articles 17 and 39).
The main case included in the program is the lawsuit claiming the application of Law 9.718/98 for Banco ABN Amro Real, succeeded by Banco Santander. This lawsuit comprehend PIS and COFINS social contributions from September 2006 to April 2009, this case had unfavorable decision in federal court. The Bank and its subsidiaries follow discussing the application of the Law 9.718/98. Other administrative and judicial proceedings were also included this program.
The accounting effects in all the cases included in the program, were registered in the moment at the of adhesion the program. As a result, contingent tax liabilities were paid in the amount of R$2,053,822, through payment of R$1,389,501 and the conversion judicial deposits of R$155,020. The gain recorded on the income statements is R$504,859 before taxes.
The main lawsuits related to tax legal obligations, recorded in the line "Tax Liabilities - Current", fully registered as obligation, are described below:
• PIS and Cofins -
R$8,593,676 (2012 - R$8,735,925 and 2011 - R$6,833,010): The Bank and its subsidiaries filed lawsuits seeking to invalidate the provisions of Law 9,718/98, pursuant to which PIS and COFINS taxes must be levied on all revenues of legal entities. Prior to the enactment of such provisions, which have been overruled by recent Supreme Court decisions for nonfinancial institutions, PIS and COFINS were levied only on revenues from services and sale of goods.
F-65
BANCO SANTANDER (BRASIL) S.A.
NOTES TO THE CONSOLIDATED FINANCIAL STATEMENTS
(Amounts in thousands of Brazilian Reais - R$, unless otherwise stated)
• Increase in CSLL tax rate -
R$1,217,935 (2012 - R$1,103,018 and 2011 - R$979,938) – The Bank and its subsidiaries filed lawsuits for an injunction to avoid the increase in the CSLL tax rate established by Executive Act 413/2008, subsequently codified into Law 11.727/2008. Financial institutions were formerly subject to a CSLL tax rate of 9%; however, new law established a 15% CSLL tax rate as from April 2008. Judicial proceedings are pending judgment.
Banco Santander and its subsidiaries are parties to judicial and administrative proceedings related to tax and social security matters, which are classified based on the opinion of legal counsel as probable loss risk.
The main topics discussed in these lawsuits are:
• CSLL - equal tax treatment -
R$52,489 (2012 - R$51,271 and 2011 - R$49,314) - The Bank and its subsidiaries filed a lawsuit challenging the application of an increased CSLL rate of 18% for financial companies, applicable until 1998, compared to the CSLL rate of 8% for non-financial companies on the basis of the constitutional principle of equal tax treatment.
• Tax on Services for Financial Institutions (ISS) -
R$545,337 (2012 - R$445,497 and 2011 - R$542,443): The Bank and its subsidiaries filed lawsuits, in administrative and judicial proceedings, some municipalities collection of ISS on certain revenues derived from transactions not usually classified as the rendering of services.
• Social Security Contribution (INSS) -
R$332,259 (2012 - R$349,855 and 2011 - R$288,137): The Bank and its subsidiaries are involved in administrative and judicial proceedings regarding the collection of income tax on social security and education allowance contributions over several funds that, according to the evaluation of legal advisors, have no nature of salary.
d.2) Labor judicial and administrative proceedings
These are lawsuits brought by labor Unions, Associations, Public Prosecutors and former employees claiming labor rights they understand are due, especially payment for overtime and other labor rights, including retirement benefit lawsuits.
For claims considered to be similar and usual for the business, provisions are recognized based on the history of payments made. Claims that do not fit into the previous criterion are assessed individually, based on the status of each lawsuit, law and previous court decisions according to the assessment of the likelihood of a favorable outcome, and the risk assessment made by the legal counsel, and the provisions are recognized based on such assessment of losses by the legal counsel.
d.3) Civil judicial and administrative proceedings
These contingencies are generally caused by: (1) lawsuits with a request for revision of contractual terms and conditions or requests for monetary adjustments, including alleged effects of implementing various economic plans of the government, (2) actions arising from loan agreements, (3) enforcement actions, and (4) actions for compensation for damages. For civil lawsuits considered common and similar in nature, the provisions are recorded based on previous payments statistical average, and evaluating successful second legal evaluation. Lawsuits for other processes are determined individually according to the analysis applicable to the circumstances of each case.
The main lawsuits classified as probable loss are described below:
Lawsuits for indemnity -
seek indemnity for property damage and/or moral, relating to the consumer relationship on matters related to credit cards, consumer credit, bank accounts, collection and loans and other operations. In the civil lawsuits considered to be similar and usual, provisions are recognized based on the history of payments made. Civil lawsuits that do not fit into the previous criterion are accrued according to the individual assessment made, and provisions are recognized based on the status of each lawsuit, law and previous court decisions according to the likely risk of payment, and the risk assessment made by the legal counsel.
Economic Plans
- efforts to recover actions with collective the deficient inflation adjustments in savings accounts arising from the Economic Plans (Bresser, Verão, Collor I and II). These refer to the lawsuits filed by savings accountholders disputing the interest credited by the Banco Santander under such plans as they considered that such legal amendments infringed on the rights acquired with regard to the application of the inflation indexes. Provisions are set aside for such lawsuits based on the average payments made historically.
Civil lawsuits that do not fit into the previous criterion are accrued according to the individual assessment made, and provisions are recognized based on the status of each lawsuit, law and previous court decisions according to likely risk of payment, and classification of the legal counsel. The Banco Santander is also a party in public class action suits on the same issue filed by consumer rights organizations, Public Prosecutor’s Offices and Public Defender’s Offices. In these cases, the provision is made only after the final unappealable sentence is handed down on the lawsuits, based on the individual execution orders. The Superior Court of Justice (STJ) decided against the bank’s. The STF is still analyzing the subject and has already ordered the suspension of all the procedures except those that were not already decided in trial courts and those who have a final decision. There are decisions favorable to banks at the STF with regard to the economic phenomenon similar to that of savings accounts, as in the case of monetary restatement of time deposits - CDB and agreements (present value table).
F-66
BANCO SANTANDER (BRASIL) S.A.
NOTES TO THE CONSOLIDATED FINANCIAL STATEMENTS
(Amounts in thousands of Brazilian Reais - R$, unless otherwise stated)
Moreover, there are precedents at the Supreme Court regarding the constitutionality of the norms that changed Brazil’s monetary standard. In April 14, 2010, in the STJ was recently decided that the deadline for the filing of civil lawsuits that argue the government's purge of five years, but this decision not handed down on the lawsuits yet. Thus, with this decision, a majority stake, as was proposed after the period of 5 years is likely to be rejected, reducing the values involved. The Supreme Court decided that the deadline for individual savers to qualify in the public civil litigations, also is five years, counted from the final judgment of their sentence, that not handed down on the lawsuits yet. Banco Santander believes in the success of the arguments defended in these courts based on their content and the sound legal basis.
d.4) Civil, labor, tax and social security contingencies classified as possible loss risk
Refer to judicial and administrative proceedings involving civil, labor, tax and social security matters assessed by the legal counsels as possible loss risk, which were not accrued as a provision.
Tax lawsuits classified as possible loss risk, totaled R$10,3 billion, including the following main lawsuits:
• Provisional Contribution on Financial Transactions (CPMF) on Customer Operations -
In May 2003, the Federal Revenue Service of Brazil issued a tax assessment against Santander Distribuidora de Títulos e Valores Mobiliários Ltda. (“Santander DTVM”) and another tax assessment against the former Banco Santander. The tax assessments refer to the collection of “CPMF” tax on transactions conducted by Santander DTVM in the management of its customers’ funds and clearance services provided by Banco Santander to Santander DTVM in 2000, 2001 and the first two months of 2002. Based on the evaluation of legal counsel, the tax treatment was adequate. Santander DTVM succeeded in the second instance in its proceeding before the Board of Tax Appeals (Conselho Administrativo de Recursos Fiscais – CARF). However this decision was reversed and a new appeal was introduced, which is subject to assessment. The Banco Santander was found liable for the tax assessment. Both decisions were appealed by the respective losing parties and the proceedings are pending final judgment of the respective appeals in a non-appealable proceeding before CARF. As of December 31, 2013 amounts related to these claims are approximately R$604 million each.
• IRPJ and CSLL on Reimbursement Arising from Contractual Guarantees -
The Federal Revenue Service of Brazil issued infraction notices against Banco Santander with respect to the collection of IRPJ and CSLL taxes for tax years 2002 to 2006 on amounts reimbursed by the previous controlling shareholder of successful banking institutions by Banco Santander as reimbursement obligations for payments made by the Bank and its controlled entities with liabilities arising from the activities carried out by these institutions when the previous controlling shareholder still maintained control of such group. The Federal Revenue Service deemed the amounts to be “taxable income” rather than reimbursements. In November 2011, the CARF dismissed the administrative proceeding in respect to the base period of 2002, fully canceling the record of infraction and was terminated in February 2012 during the term of the appeal. Proceedings related to tax years 2003 to 2006 are ongoing and as of December 31, 2013 amounts related to this period are approximately R$142 million.
• Credit Losses -
The Bank and its subsidiaries challenged the tax assessments issued by the Federal Revenue Services of Brazil claiming improper deduction of losses on loans on Income Tax of Legal Entities (IRPJ) and CSLL bases for allegedly failing to meet the relevant requirements under applicable law. As of December 31, 2013 the amount related to this challenge is approximately R$595 million.
• CSLL - Tax rate increase -
Lawsuit regarding the difference from social contribution tax rate applied to financial institutions and equivalent entities in the first half of 1996, as such tax rate was higher than the rates applied to other legal entities, which is contrary to the precedence and non-retroactivity constitutional principle. On July 2012 the lawsuit was a final favorable decision.
• INSS on Profit Sharing Payments (“PLR”)
– The Bank and the subsidiaries are involved in several administrative and legal proceedings against the tax authorities in connection with the taxation for social security purposes of certain PLR items. As of December 31, 2013 amounts related to these proceedings totaled approximately R$1.056 million.
•
IRPJ and CSLL - Capital Gain -
The Brazilian Federal Revenue Service issued a tax assessment against Zurich Santander Brasil Seguros e Previdência S.A. (legal successor of ABN AMRO Brasil Dois Participações S.A. (AAB Dois Par)) charging income tax and social contribution related to the 2005 tax year, claiming that the capital gain on the sale of Real Seguros S.A. and Real Vida e Previdência S.A. by AAB Dois Par should be paid at a 34% tax rate instead of 15%. The assessment was appealed at the administrative level based on understanding that the tax treatment adopted in the transaction was in compliance with the current tax law and the capital gain was properly taxed. We partially favor the decision by CARF for give voluntary part appeal to delete the fine craft and interest on this fine. This decision may be appealed. The Banco Santander is responsible for any adverse outcome in this process as former controlling of Zurich Santander Brasil Seguros e Previdência S.A. As of December 31, 2013 the amount related to this proceeding is approximately R$233 million.
F-67
BANCO SANTANDER (BRASIL) S.A.
NOTES TO THE CONSOLIDATED FINANCIAL STATEMENTS
(Amounts in thousands of Brazilian Reais - R$, unless otherwise stated)
The labor lawsuits classified as possible loss risk totaled R$0,1 billion, excluding the lawsuit below:
• Semiannual Bonus or Profit Sharing -
a labor lawsuit relating to the payment of a semiannual bonus or, alternatively, profit sharing, to retired employees from the former Banco do Estado de São Paulo S.A. - Banespa, that had been hired until May 22, 1975, filed as Banespa’s Retirees Association. The Superior Labor Court ruled against the Bank. The STF rejected the extraordinary appeal of the Bank by a monocratic decision maintaining the earlier condemnation. Santander brought Regimental Appeal which awaits decision by the STF. The Regimental Appeal is an internal appeal filed in the STF itself, in order to refer the monocratic decision to a group of five ministers. The 1st Chamber of the STF upheld the appeal by the Bank and denied the Afabesp. The materials of the extraordinary appeal of the Bank now proceed to the Plenum of the STF for decision on overall impact and judgment. The amount related to this claim is not disclosed due to the current stage of the lawsuit and the possible impact such disclosure may have on the progress of the claim.
The liabilities related to civil lawsuits with possible loss risk totaled R$0,6 billion.
d.5) Judicial and administrative proceedings under the responsibility of former controlling stockholders
Refer to tax, labor and civil lawsuits in the amounts of R$948,074, R$3,299 and R$2,952 (2012 - R$978,083, R$10,078 and R$3,233 and 2011 - R$969,485, R$14,150 and R$9,052), with responsibility of the former controlling stockholders of the banks and acquired entities. Based on the agreements signed these lawsuits have guarantees of full reimbursement by the former controlling stockholders, and amounts reimbursable were recorded under other assets.
a) Income and Social Contribution Taxes
The total charge for the year can be reconciled to accounting profit as follows:
|
Thousands of Reais
|
2013
|
2012
|
2011
|
|||||||||
|
Operating profit before tax, net of profit sharing
|
4,018,257 | 5,474,925 | 8,773,817 | |||||||||
|
Interest on capital
(1)
|
(300,000 | ) | (1,020,000 | ) | (1,550,000 | ) | ||||||
|
Discontinued operations
|
2,063,463 | 55,313 | 74,238 | |||||||||
|
Unrealized profits
|
(1,319 | ) | (24,403 | ) | (914 | ) | ||||||
|
Income before taxes
|
5,780,401 | 4,485,835 | 7,297,141 | |||||||||
|
Rates (25% income and contribution tax and 15% social contribution tax)
|
(2,312,160 | ) | (1,794,334 | ) | (2,918,856 | ) | ||||||
|
PIS and COFINS (net of income and social contribution taxes)
(2)
|
(1,065,515 | ) | (1,143,825 | ) | (1,037,570 | ) | ||||||
|
Permanent differences:
|
||||||||||||
|
Equity in subsidiaries
|
36,537 | 29,329 | 21,686 | |||||||||
|
Goodwill
(3)
|
1,454,794 | 1,454,778 | 1,241,381 | |||||||||
|
Exchange variation - foreign branches
(4)
|
1,296,777 | 804,414 | 767,921 | |||||||||
|
Adjustments:
|
||||||||||||
|
Constitution of income and social contribution taxes on temporary differences
|
614,293 | 404,809 | 602,394 | |||||||||
|
Effects of change in rate of social contribution taxes
(5)
|
11,420 | 19,308 | 9,439 | |||||||||
|
Other adjustments
|
(269,742 | ) | 188,507 | 212,682 | ||||||||
|
Income and social contribution taxes
|
(233,596 | ) | (37,014 | ) | (1,100,923 | ) | ||||||
|
Of which:
|
||||||||||||
|
Current tax
|
(2,771,367 | ) | (2,822,084 | ) | (2,732,999 | ) | ||||||
|
Deferred taxes
|
2,537,771 | 2,785,070 | 1,632,076 | |||||||||
|
Taxes paid in the year
|
(1,198,409 | ) | (2,137,965 | ) | (1,932,317 | ) | ||||||
(1) Amount distributed to shareholders as interest attributable to shareholders’ equity. For accounting purposes, although the interest should be reflected in the statement of income for tax deduction, the charge is reversed before the calculation of the net income in the statutory financial statements and deducted from the shareholders’ equity since is considered as dividend.
(2) PIS and COFINS are considered a profit-base component (net basis of certain revenues and expenses), therefore and accordingly to IAS 12 it is recorded as income taxes.
(3) The difference between the tax basis and accounting basis of goodwill on acquisition of Banco ABN Amro Real S.A. is a difference of a permanent nature and definitive, since the possibility of future use of resources to settle a tax liability is considered remote by the Administration in this case the possibility of loss on impairment or disposal only applies to the entity as a whole and according to the characteristics of the business combination performed, it is not possible to segregate and identify the business originally acquired. Therefore, amortization of goodwill tax creates a permanent differences and there is not record of the deferred tax liability (note 46).
(4) Permanent difference related of foreign currency exchange variation on investments abroad nontaxable/ deductible.
(5) Effect of rate differences for the other non-financial corporations, which the social contribution tax rate is 9%.
F-68
BANCO SANTANDER (BRASIL) S.A.
NOTES TO THE CONSOLIDATED FINANCIAL STATEMENTS
(Amounts in thousands of Brazilian Reais - R$, unless otherwise stated)
b) Effective tax rate calculation
The effective tax rate is as follows:
|
Thousands of Reais
|
2013
|
2012
|
2011
|
|||||||||
|
Operating profit before tax
|
4,018,257 | 5,474,925 | 8,773,817 | |||||||||
|
Income tax
|
233,596 | 37,014 | 1,100,923 | |||||||||
|
Effective tax rate
(1)
|
5.81 | % | 0.68 | % | 12.55 | % | ||||||
(1) In 2013, 2012 and 2011, considering the tax effect of the exchange variation over foreign branches and the economic hedge, accounted in the Gains (losses) on financial assets and liabilities (net) (note 35) the effective tax rate would have been 40.7%, 21.4% and 26.5%, respectively.
c) Tax recognized in equity
In addition to the income tax recognized in the consolidated income statement, the Bank recognized the following amounts in consolidated equity:
|
Thousands of Reais
|
2013
|
2012
|
2011
|
|||||||||
|
Tax credited to equity
|
555,044 | 535,264 | 97,498 | |||||||||
|
Measurement of available-for-sale securities
|
507,045 | 341,088 | 97,498 | |||||||||
|
Measurement of cash flow hedges
|
47,999 | 194,176 | - | |||||||||
|
Tax charged to equity
|
(1,029,078 | ) | (3,291,984 | ) | (1,667,291 | ) | ||||||
|
Measurement of available-for-sale securities
|
(148,128 | ) | (1,611,935 | ) | (845,109 | ) | ||||||
|
Measurement of cash flow hedges
|
- | - | (7,365 | ) | ||||||||
|
Effects of Adopting amendments to the IAS 19
|
(880,950 | ) | (1,680,049 | ) | (814,817 | ) | ||||||
|
Total
|
(474,034 | ) | (2,756,720 | ) | (1,569,793 | ) | ||||||
d) Deferred taxes
The detail of the balances of “Tax assets – Deferred” and “Tax liabilities – Deferred” is as follows:
|
Thousands of Reais
|
2013
|
2012
|
2011
|
|||||||||
|
Deferred Tax assets
|
19,195,626 | 17,956,432 | 14,937,544 | |||||||||
|
Of which:
|
||||||||||||
|
Temporary differences
(1)
|
17,131,721 | 15,002,202 | 12,887,544 | |||||||||
|
Tax loss carryforwards
|
1,366,178 | 2,256,503 | 1,352,273 | |||||||||
|
Social contribution taxes 18%
|
697,727 | 697,727 | 697,727 | |||||||||
|
Tax offset
|
2,073 | 2,073 | 2,073 | |||||||||
|
Total deferred tax assets
|
19,197,699 | 17,958,505 | 14,939,617 | |||||||||
|
Deferred tax liabilities
|
1,623,593 | 3,565,381 | 3,748,104 | |||||||||
|
Of which:
|
||||||||||||
|
Excess depreciation of leased assets
|
539,223 | 1,192,056 | 2,012,314 | |||||||||
|
Adjustment to fair value of trading securities and derivatives
|
1,084,370 | 2,373,325 | 1,735,790 | |||||||||
|
Total deferred tax liabilities
|
1,623,593 | 3,565,381 | 3,748,104 | |||||||||
(1) Temporary differences relate mainly to impairment losses on loans and receivables and provisions for judicial and administrative proceedings.
In 2013, were not recorded tax assets amounting R$160.392.
The changes in the balances of “Tax Assets – Deferred” and “Tax Liabilities – Deferred” in the last three years were as follows:
|
Thousands of Reais
|
Balances at December 31, 2012
|
Adjustment to
Income
|
Valuation adjustments
(1)
|
Adjustment to
Income - Discontinued Operations
(2)
|
Balances at December 31, 2013
|
|||||||||||||||
|
|
|
|
|
|
||||||||||||||||
|
Deferred tax assets
|
17,956,432 | 1,895,688 | (655,143 | ) | (1,351 | ) | 19,195,626 | |||||||||||||
|
Temporary differences
|
15,002,202 | 2,786,013 | (655,143 | ) | (1,351 | ) | 17,131,721 | |||||||||||||
|
Tax loss carryforwards
|
2,256,503 | (890,325 | ) | - | - | 1,366,178 | ||||||||||||||
|
Social contribution taxes 18%
|
697,727 | - | - | - | 697,727 | |||||||||||||||
|
Deferred tax liabilities
|
3,565,381 | (642,083 | ) | (1,299,705 | ) | - | 1,623,593 | |||||||||||||
|
Temporary differences
|
3,565,381 | (642,083 | ) | (1,299,705 | ) | - | 1,623,593 | |||||||||||||
|
Total
|
14,391,051 | 2,537,771 | 644,562 | (1,351 | ) | 17,572,033 | ||||||||||||||
F-69
BANCO SANTANDER (BRASIL) S.A.
NOTES TO THE CONSOLIDATED FINANCIAL STATEMENTS
(Amounts in thousands of Brazilian Reais - R$, unless otherwise stated)
|
Thousands of Reais
|
Balances at December 31, 2011
|
Adjustment to
Income
|
Valuation adjustments
(1)
|
Adjustment to
Income - Discontinued Operations
(2)
|
Balances at December 31, 2012
|
||||||||||||
|
|
|
|
|
|
|||||||||||||
|
Deferred tax assets
|
14,937,544
|
1,969,761
|
1,086,216
|
(37,089)
|
17,956,432
|
||||||||||||
|
Temporary differences
|
12,887,544
|
1,065,531
|
1,086,216
|
(37,089)
|
15,002,202
|
||||||||||||
|
Tax loss carryforwards
|
1,352,273
|
904,230
|
-
|
-
|
2,256,503
|
||||||||||||
|
Social contribution taxes 18%
|
697,727
|
-
|
-
|
-
|
697,727
|
||||||||||||
|
Deferred tax liabilities
|
3,748,104
|
(815,309)
|
632,586
|
-
|
3,565,381
|
||||||||||||
|
Temporary differences
|
3,748,104
|
(815,309)
|
632,586
|
-
|
3,565,381
|
||||||||||||
|
Total
|
11,189,440
|
2,785,070
|
453,630
|
(37,089)
|
14,391,051
|
||||||||||||
|
Thousands of Reais
|
Balances at December 31, 2010
|
Adjustment to
Income
|
Valuation adjustments
(1)
|
Acquisitions
for the
Year (Net of disposals)
|
Adjustment to
Income - Discontinued Operations
(2)
|
Balances at December 31, 2011
|
|||||||||||
|
|
|
|
|
|
|||||||||||||
|
Deferred tax assets
|
13,690,047
|
881,361
|
483,032
|
(68,950)
|
(47,946)
|
14,937,544
|
|||||||||||
|
Deferred tax liabilities
|
4,280,159
|
(707,006)
|
276,494
|
(101,543)
|
-
|
3,748,104
|
|||||||||||
|
Total
|
9,409,888
|
1,588,367
|
206,538
|
32,593
|
(47,946)
|
11,189,440
|
|||||||||||
(1) It relates to tax recognized in equity.
(2) Tax effect on income in Santander Asset.
e) Expected realization of tax loss carryforwards
|
Year
|
Temporary differences
|
Tax loss carryforwards
|
Social contribution taxes 18%
|
||||||||||
|
2014
|
4,967,476 | 373,117 | 28,121 | ||||||||||
|
2015
|
3,335,125 | 531,413 | 115,759 | ||||||||||
|
2016
|
6,431,449 | - | - | ||||||||||
|
2017
|
502,287 | 370,344 | 176,797 | ||||||||||
|
2018
|
382,734 | 82,972 | 210,808 | ||||||||||
| 2019 to 2021 | 883,300 | 8,332 | 166,242 | ||||||||||
|
After 2021
|
629,350 | - | - | ||||||||||
|
Total
|
17,131,721 | 1,366,178 | 697,727 | ||||||||||
f) Current Taxes
The current tax assets refers, basically, to the balance of Income and Social Contribution Taxes Offset.
The breakdown of the balance of “Other Liabilities” is as follows:
|
Thousands of Reais
|
2013
|
2012
|
2011
|
|||||||||
|
|
|
|
|
|||||||||
|
Accrued expenses and deferred income
(1)
|
2,127,999 | 1,966,435 | 1,930,290 | |||||||||
|
Transactions in transit
|
571,901 | 912,034 | 695,880 | |||||||||
|
Provision for share-based payment
|
224,559 | 210,822 | 158,543 | |||||||||
|
Other
(2)
|
2,003,299 | 1,213,529 | 1,143,138 | |||||||||
|
Total
|
4,927,758 | 4,302,820 | 3,927,851 | |||||||||
(1) Corresponds, mainly, the payments to be made - personnel expenses.
(2) Includes credits for unreleased funds.
F-70
BANCO SANTANDER (BRASIL) S.A.
NOTES TO THE CONSOLIDATED FINANCIAL STATEMENTS
(Amounts in thousands of Brazilian Reais - R$, unless otherwise stated)
The balances of Other Comprehensive Income include the amounts, net of the related tax effect, of the adjustments to assets and liabilities recognized temporarily in equity stated in the Consolidated Statement of Changes in Equity and Consolidated Statements of Comprehensive Income until they are extinguished or realized, when they are recognized in the consolidated income statement. The amounts attributable to subsidiaries, investments in associates and joint ventures are presented, on a line by line basis, in the appropriate items based on their nature.
It should be noted that the consolidated Statements of Comprehensive Income includes the changes to Other Comprehensive Income as follows:
- Revaluation gains (losses): This includes the amount of the gains, net of losses incurred in the year, recognized directly in equity. The amounts recognized in equity in the year remain under this item, even if in the same year they are transferred to the income statement or to the initial carrying amount of the assets or liabilities or are reclassified to another line item.
- Amounts transferred to income statement: This includes the amount of the revaluation gains (losses) previously recognized in equity, even in the same year, which are subsequently recognized in the income statement.
- Amounts transferred to the initial carrying amount of hedged items: This includes the amount of the revaluation gains (losses) previously recognized in Equity, even in the same year, which are recognized in the initial carrying amount of assets or liabilities as a result of cash flow hedges.
- Other transfers: This includes the amount of the transfers made in the year between the various Other Comprehensive Income items.
In the Consolidated Statements of Comprehensive Income the amounts in "Other Comprehensive Income" are recognized gross, including the amount relating to non-controlling interests, and the corresponding tax effect is presented under a separate item, except in the case of entities accounted for using the equity method, the amounts for which are presented net of the tax effect.
a) Available-for-sale financial assets
Other Comprehensive Income—Available-for-sale financial assets includes the net amount of unrealized changes in the fair value of assets classified as available-for-sale financial assets (see Notes 6 and 7).
The breakdown, by type of instrument and geographical origin of the issuer, of Other Comprehensive Income Available-for-sale financial assets at December 31, 2013, 2012 and 2011 is as follows:
|
In thousand of reais
|
2013
|
|||||||||||||||
|
Revaluation gains
|
Revaluation losses
|
Net revaluation gains/(losses)
|
Fair value
|
|||||||||||||
|
Debt Instruments
|
||||||||||||||||
|
Government debt securities
|
11,686 | (392,463 | ) | (380,777 | ) | 29,615,457 | ||||||||||
|
Private-sector debt securities
|
109,673 | (141,782 | ) | (32,109 | ) | 15,341,815 | ||||||||||
|
Equity instruments
|
||||||||||||||||
|
Domestic
|
367,509 | (426,568 | ) | (59,059 | ) | 1,329,810 | ||||||||||
|
Of which:
|
||||||||||||||||
|
Listed
|
330,760 | (390,800 | ) | (60,040 | ) | 403,295 | ||||||||||
|
Unlisted
|
36,749 | (35,768 | ) | 981 | 926,515 | |||||||||||
|
Total
|
488,868 | (960,813 | ) | (471,945 | ) | 46,287,082 | ||||||||||
|
In thousand of reais
|
2012
|
|||||||||||||||
|
Revaluation gains
|
Revaluation losses
|
Net revaluation gains/(losses)
|
Fair value
|
|||||||||||||
|
Debt Instruments
|
||||||||||||||||
|
Government debt securities
|
2,283,906 | (1,030,507 | ) | 1,253,399 | 30,400,250 | |||||||||||
|
Private-sector debt securities
|
1,135,406 | (514,195 | ) | 621,211 | 12,644,320 | |||||||||||
|
Equity instruments
|
||||||||||||||||
|
Domestic
|
200,278 | (314,217 | ) | (113,939 | ) | 1,104,050 | ||||||||||
|
Of which:
|
||||||||||||||||
|
Listed
|
180,861 | (281,419 | ) | (100,558 | ) | 340,494 | ||||||||||
|
Unlisted
|
19,417 | (32,798 | ) | (13,381 | ) | 763,556 | ||||||||||
|
Total
|
3,619,590 | (1,858,919 | ) | 1,760,671 | 44,148,620 | |||||||||||
F-71
BANCO SANTANDER (BRASIL) S.A.
NOTES TO THE CONSOLIDATED FINANCIAL STATEMENTS
(Amounts in thousands of Brazilian Reais - R$, unless otherwise stated)
|
In thousand of reais
|
|
2011
|
||||||||||||||
|
Revaluation gains
|
Revaluation losses
|
Net revaluation gains/(losses)
|
Fair value
|
|||||||||||||
|
Debt Instruments
|
||||||||||||||||
|
Government debt securities
|
1,993,581 | (930,000 | ) | 1,063,581 | 31,858,187 | |||||||||||
|
Private-sector debt securities
|
126,508 | (173,363 | ) | (46,855 | ) | 11,442,167 | ||||||||||
|
Equity instruments
|
||||||||||||||||
|
Domestic
|
169,948 | (226,475 | ) | (56,527 | ) | 1,307,847 | ||||||||||
|
Of which:
|
||||||||||||||||
|
Listed
|
154,958 | (194,040 | ) | (39,082 | ) | 462,062 | ||||||||||
|
Unlisted
|
14,990 | (32,435 | ) | (17,445 | ) | 845,785 | ||||||||||
|
Total
|
2,290,037 | (1,329,838 | ) | 960,199 | 44,608,201 | |||||||||||
At each reporting date, the Bank assesses whether there is any objective evidence indicating that the available-for-sale financial assets (debt securities and equity instruments) are impaired.
This assessment includes but is not limited to an analysis of the following information: i) the issuer’s economic and financial position, any default or late payments, issuer’s solvency, the evolution of its business, short-term projections, trends observed with respect to its earnings and, if applicable, its dividend distribution policy; ii) market-related information such as changes in the general economic situation, changes in the issuer’s industry which might affect its ability to pay; iii) changes in the fair value of the security analyzed, and analysis of the reasons of such changes—whether they are specific to the security or the result of the general uncertainty concerning the economy or the country—and iv) independent analysts’ reports and forecasts and other independent market information.
In the case of equity instruments, when the changes in the fair value of the equity instrument being evaluated are assessed, the duration and significance of the decline in its market price below cost is taken into account. Nevertheless, it should be noted that the Bank assesses, on a case-by-case basis each of the equity instruments that have incurred losses, and monitors the performance of their market prices, recognizing an impairment loss as soon as it is determined that the recoverable amount could be decreased.
If, after completing the above assessment, the Bank considers that the presence of one or more of these factors affect recovery of the cost of the financial asset, an impairment loss is recognized in the consolidated income statement for the amount of the loss in equity under Other Comprehensive Income. Also, where the Bank does not intend and/or is not able to hold the investment for a sufficient amount of time to recover the cost, the financial asset is written down to its fair value.
b) Cash flow hedges
Other Comprehensive Income—Cash flow hedges includes the gains or losses attributable to hedging instruments that qualify as effective hedges. These amounts will remain under this heading until they are recognized in the consolidated income statement in the periods in which the hedged items affect it (see Note 8).
Accordingly, amounts representing valuation losses will be offset in the future by gains generated by the hedged items.
c) Hedges of net investments in foreign operations and Translation adjustments foreign investment
Other Comprehensive Incomes—Hedges of net investments in foreign operations includes the net amount of changes in the value of hedging instruments in hedges of net investments in foreign operations, for the portion of these changes considered as effective hedges (Note 8).
Other Comprehensive Income—Exchange differences includes the net amount of the differences arising on the translation to Reais of the balances of the consolidated entities whose functional currency is not the Reais (Note 2.a).
The Bank has recorded a transaction of investment hedge on its investment in Santander EFC, an independent subsidiary in Spain. Accordingly, amounts representing valuation losses will be offset in the future by gains generated by the hedged instruments.
F-72
BANCO SANTANDER (BRASIL) S.A.
NOTES TO THE CONSOLIDATED FINANCIAL STATEMENTS
(Amounts in thousands of Brazilian Reais - R$, unless otherwise stated)
“Non-controlling interests” include the net amount of the equity of subsidiaries attributable to equity instruments that do not belong, directly or indirectly, to the Bank, including the portion attributed to them of profit for the year.
a) Breakdown
The detail, by company, of the balance of “Equity - Non-controlling interests” is as follows:
|
Thousands of Reais
|
2013
|
2012
|
2011
|
|||||||||
|
Santander Leasing S.A. Arrendamento Mercantil
|
395 | 796 | 784 | |||||||||
|
Santander Brasil Advisory Services S.A.
(3)
|
451 | 442 | 1,712 | |||||||||
|
Brasil Foreign Diversified Payment Rights Finance Company
|
- | 2 | 2 | |||||||||
|
Santander Getnet Serviços para Meios de Pagamentos S.A.
|
56,932 | 26,633 | 13,061 | |||||||||
|
MS Participações Societárias S.A.
(1)
|
- | - | 3,401 | |||||||||
|
Santander Serviços Técnicos, Administrativos e de Corretagem de Seguros
(2)
|
231,323 | 209,257 | - | |||||||||
|
Total
|
289,101 | 237,130 | 18,960 | |||||||||
|
Profit attributable to non-controlling interests
|
124,630 | 10,618 | 7,928 | |||||||||
|
Of which:
|
||||||||||||
|
Santander Leasing S.A. Arrendamento Mercantil
|
17 | 82 | 83 | |||||||||
|
Santander Brasil Advisory Services S.A.
(3)
|
28 | 70 | 1,302 | |||||||||
|
Santander Getnet Serviços para Meios de Pagamentos S.A.
|
49,427 | 13,573 | 6,450 | |||||||||
|
MS Participações Societárias S.A.
(1)
|
- | (2,792 | ) | 93 | ||||||||
|
Santander Serviços Técnicos, Administrativos e de Corretagem de Seguros
(2)
|
74,468 | (315 | ) | - | ||||||||
|
Other companies
|
690 | - | - | |||||||||
b) Changes
The changes in the balance of “Non-controlling interests” are summarized as follows:
|
Thousands of Reais
|
2013
|
2012
|
2011
|
|||||||||
|
Balance at beginning of year
|
237,130 | 18,960 | 8,076 | |||||||||
|
Inclusion of companies
(2) (3)
|
- | 222,507 | 3,308 | |||||||||
|
Dividends paid
|
(104,280 | ) | (2,825 | ) | (352 | ) | ||||||
|
Profit attributable to non-controlling interests
|
124,630 | 10,618 | 7,928 | |||||||||
|
Transition Adjustments to the amendments to the IAS 19
|
(6,029 | ) | (12,130 | ) | - | |||||||
|
Others
|
37,650 | - | - | |||||||||
|
Balance at end of year
|
289,101 | 237,130 | 18,960 | |||||||||
(1) Disposal on November 22, 2013 of all shares of MS Participações Societárias S.A., by Banco Santander, for Capital Riesgo Global, S.C.R. de R
é
gimen Simplificado, S.A., followed by disposal on December 28, 2013 by Capital Riesgo Global, S.C.R. de R
é
gimen Simplificado, S.A., of investment for Elincasiol, S.L.
(2) Refers to minority interests in Santander Serviços Técnicos, Administrativos e de Corretagem de Seguros.
(3) On AGE held on August 26, 2011, was approved: (i) the change of name of Santander CHP S.A. to Santander Brasil Advisory Services S.A.; and (ii) changes of corporate purpose.
a) Capital
The capital, fully subscribed and paid, is divided into registered shares in dematerialized form, no par value:
|
|
Thousands of shares
|
|||||||||||
|
|
|
2013
|
||||||||||
|
Common
|
Preferred
|
Total
|
||||||||||
|
Brazilian residents
|
19,030,307 | 18,705,661 | 37,735,968 | |||||||||
|
Foreign residents
|
193,811,425 | 167,496,724 | 361,308,149 | |||||||||
|
Total shares
|
212,841,732 | 186,202,385 | 399,044,117 | |||||||||
|
(-) Treasury shares
|
(1,021,459 | ) | (928,599 | ) | (1,950,058 | ) | ||||||
|
Total outstanding
|
211,820,273 | 185,273,786 | 397,094,059 | |||||||||
F-73
BANCO SANTANDER (BRASIL) S.A.
NOTES TO THE CONSOLIDATED FINANCIAL STATEMENTS
(Amounts in thousands of Brazilian Reais - R$, unless otherwise stated)
|
|
Thousands of shares | |||||||||||
|
|
2012
|
|||||||||||
|
Common
|
Preferred
|
Total
|
||||||||||
|
Brazilian residents
|
18,079,891 | 17,841,646 | 35,921,537 | |||||||||
|
Foreign residents
|
194,761,841 | 168,360,739 | 363,122,580 | |||||||||
|
Total shares
|
212,841,732 | 186,202,385 | 399,044,117 | |||||||||
|
(-) Treasury shares
|
(568,882 | ) | (517,166 | ) | (1,086,048 | ) | ||||||
|
Total outstanding
|
212,272,850 | 185,685,219 | 397,958,069 | |||||||||
|
|
Thousands of shares | |||||||||||
|
|
2011 | |||||||||||
|
Common
|
Preferred
|
Total
|
||||||||||
|
Brazilian residents
|
16,000,704 | 16,052,894 | 32,053,598 | |||||||||
|
Foreign residents
|
196,841,028 | 170,149,491 | 366,990,519 | |||||||||
|
Total shares
|
212,841,732 | 186,202,385 | 399,044,117 | |||||||||
|
(-) Treasury shares
|
(391,254 | ) | (355,685 | ) | (746,939 | ) | ||||||
|
Total outstanding
|
212,450,478 | 185,846,700 | 398,297,178 | |||||||||
b) Dividends and Interest on Capital
In accordance with the Bank’s bylaws, stockholders are entitled to a minimum dividend equivalent to 25% of net income for the year, adjusted according to legislation. Preferred shares are nonvoting and nonconvertible, but have the same rights and advantages granted to common shares, in addition to priority in the payment of dividends at a rate that is 10% higher than those paid on common shares, and in the capital reimbursement, without premium, in the event of liquidation of the Banco.
Dividend payments have been prepared and will continue to be prepared in accordance with Brazilian Corporate Law.
Before the annual shareholders meeting, the Board of Directors may establish the amount of dividends out of earnings based on (i) balance sheets or earning reserves from the last balance sheet; or (ii) balance sheets issued in the period shorter than 6 months, in which case the payment of dividends shall not exceed the amount of capital reserves. These payments are fully input into the mandatory dividend.
|
|
|
2013
|
||||||||||||||
|
|
Reais per Thousand Shares / Units | |||||||||||||||
|
|
Common
|
Preferred
|
Units
|
|||||||||||||
|
Interest on capital
(1) (5)
|
300,000 | 0.7200 | 0.7921 | 79.2055 | ||||||||||||
|
Interim Dividends
(2) (6)
|
650,000 | 1.5603 | 1.7163 | 171.6337 | ||||||||||||
|
Interim Dividends
(3) (7)
|
450,000 | 1.0821 | 1.1904 | 119.0365 | ||||||||||||
|
Interim Dividends
(4) (8)
|
285,196 | 0.6862 | 0.7548 | 75.4818 | ||||||||||||
|
Intercalary Dividends
(4) (8)
|
714,804 | 1.7199 | 1.8918 | 189.1847 | ||||||||||||
|
Total in December 31, 2013
|
2,400,000 | |||||||||||||||
(1) Established by the Board of Directors in March 2013, common shares - R$0,6120, preferred shares - R$0,6732 and Units R$67,3247 net of taxes.
(2) Established by the Board of Directors in June 2013.
(3) Established by the Board of Directors in September 2013.
(4) Established by the Board of Directors in December 2013.
(5) The amount of interest on capital will be allocated to the mandatory dividend for the year 2013 and both were paid on August 29, 2013, without monetary compensation.
(6) The amount of interim dividends were allocated to the additional dividends, for the year 2013 and were paid on August 29, 2013, without any compensation to monetary.
(7) The amount of interim dividends, R$144,473 were fully attributed to the mandatory dividends for the year 2013 and the amount of the R$305,527 were attributed to complementary dividends for the year 2013 and both will be paid from February 26, 2014, without any compensation to monetary.
(8) The amount of interim dividends will be fully attributed to mandatory dividends for the year 2013 and will be paid on February 26, 2014 without any monetary compensation.
F-74
BANCO SANTANDER (BRASIL) S.A.
NOTES TO THE CONSOLIDATED FINANCIAL STATEMENTS
(Amounts in thousands of Brazilian Reais - R$, unless otherwise stated)
|
|
2012
|
|||||||||||||||
|
|
Reais per Thousand Shares / Units
|
|||||||||||||||
|
|
Common
|
Preferred
|
Units
|
|||||||||||||
|
Interest on capital
(1) (7)
|
400,000 | 0.9600 | 1.0560 | 105.6001 | ||||||||||||
|
Interim Dividends
(2) (8)
|
490,000 | 1.1763 | 1.2939 | 129.3968 | ||||||||||||
|
Intercalary Dividends
(2) (7)
|
410,000 | 0.9842 | 1.0827 | 108.2708 | ||||||||||||
|
Interest on capital
(3) (7)
|
170,000 | 0.4081 | 0.4489 | 44.8927 | ||||||||||||
|
Interim Dividends
(4) (10)
|
350,000 | 0.8402 | 0.9243 | 92.4273 | ||||||||||||
|
Intercalary Dividends
(4) (9)
|
150,000 | 0.3601 | 0.3961 | 39.6117 | ||||||||||||
|
Interest on capital
(5) (9)
|
450,000 | 1.0804 | 1.1884 | 118.8399 | ||||||||||||
|
Intercalary Dividends
(6) (9)
|
250,000 | 0.6002 | 0.6602 | 66.0221 | ||||||||||||
|
Total in December 31, 2012
|
2,670,000 | |||||||||||||||
(1) Established by the Board of Directors in March, 2012, Common Shares - R$0.8160, Preferred Shares - R$0.8976 and Units - R$89.7600, net of taxes.
(2) Established by the Board of Directors in June, 2012.
(3) Established by the Board of Directors in June, 2012, Common Shares - R$0.3469, Preferred Shares - R$0.3816 and Units - R$38.1589, net of taxes.
(4) Established by the Board of Directors in September, 2012.
(5) Established by the Board of Directors in December, 2012.
(6) Established by the Board of Directors in December, 2012, Common Shares - R$0.9183, Preferred Shares - R$1.0101 and Units - R$101.0139, net of taxes.
(7) The amount of intercalary dividends and interest on capital were allocated entirely to the mandatory dividends for the year 2012 and were paid on August 29, 2012, without any monetary compensation.
(8) The amount of interim dividends will be allocated entirely to the supplementary dividends for the year 2012 and was paid in August 29, 2012, without any monetary compensation.
(9) The amount of the intercalary dividend and interest on capital will be fully imputed to the mandatory dividend for the year of 2012 and were paid from February 26, 2013, without any monetary compensation.
(10) The amount of interim dividends, R$348,950 will be imputed to the mandatory dividend for the year of 2012 and R$1,050 will be allocated to the supplementary dividend for the year 2012 and both will be paid as of February 26, 2013, without any monetary compensation.
|
|
2011
|
|||||||||||||||
|
|
Thousands of Reais (9) |
Reais per Thousand Shares / Units
|
||||||||||||||
|
|
Common
|
Preferred
|
Units
|
|||||||||||||
|
Interest on capital
(1) (5) (9)
|
600,000 | 1.4366 | 1.5802 | 158.0216 | ||||||||||||
|
Intercalary Dividends
(2) (5)
|
273,840 | 0.6556 | 0.7212 | 72.1211 | ||||||||||||
|
Intercalary Dividends
(2) (5) (9)
|
476,160 | 1.1401 | 1.2541 | 125.4059 | ||||||||||||
|
Interest on capital
(3) (5) (9)
|
550,000 | 1.3168 | 1.4485 | 144.8532 | ||||||||||||
|
Intercalary Dividends
(4) (5) (9)
|
100,000 | 0.2394 | 0.2634 | 26.3369 | ||||||||||||
|
Interest on capital
(6) (8) (9)
|
400,000 | 0.9592 | 1.0551 | 105.5127 | ||||||||||||
|
Intercalary Dividends
(7) (8) (9)
|
775,000 | 1.8590 | 2.0449 | 204.4944 | ||||||||||||
|
Total in December 31, 2011
|
3,175,000 | |||||||||||||||
(1) Established by the Board of Directors in March, 2011, Common Shares - R$1.2211, and Preferred Shares - R$1.3432 and Units - R$134.3184, net of taxes.
(2) Established by the Board of Directors in May, 2011.
(3) Established by the Board of Directors in June, 2011, Common Shares - R$1.1193, and Preferred Shares - R$1.2313 and Units - R$123.1252, net of taxes.
(4) Established by Board of Directors in June, 2011.
(5) The amount of interest on capital and dividends intermediate / Intercalary was paid on August 29, 2011.
(6) Established by the Board of Directors in September, 2011, Common Shares - R$0.8153, and Preferred Shares - R$0.8969 and Units - R$89.6858, net of taxes.
(7) Established by Board of Directors in December 2011.
(8) The amount of interest on capital was paid on February 28, 2012.
(9) The amount of intercalary dividends and interest on capital was allocated entirely to the mandatory distribution of income for the year 2011.
c) Reserves
The reserves are allocated as follows after the deductions and statutory provisions, from the net income:
Legal reserve
In accordance with Brazilian Corporate Law, 5% in transferred to the legal reserve, until it reaches 20% of the share capital. This reserve is designed to ensure the integrity of the capital and can only be used to offset losses or increase capital.
F-75
BANCO SANTANDER (BRASIL) S.A.
NOTES TO THE CONSOLIDATED FINANCIAL STATEMENTS
(Amounts in thousands of Brazilian Reais - R$, unless otherwise stated)
Capital reserve
The Bank´s capital reserve consists of: reserve of goodwill for the subscription of shares and other capital reserves, and can only be used to absorb losses that exceed retained earnings and profit reserves, redemption, repayment or purchase of shares of our treasury; incorporation of the capital, or payment of dividends to preferred shares in certain circumstances.
Reserve for equalization dividend
After the destination of dividends, the remaining balance if any, may, upon proposal of the Executive Board and approved by the Board of Directors, be destined to constitute a reserve for equalization of dividends, which is limited to 50% of the Capital. This reserve aims to ensure funds for the payment of dividends, including the form of Interest on Capital, or any interim payment to maintain the flow of shareholders remuneration.
d) Treasury shares
At the meeting held on July 29, 2013 the Board of Directors approved the extension, for one more year, the buyback program certificate of deposit of shares ("Units") which will begin on August 24, 2013, ending on August 24, 2014.
The current Buyback Program aims to: (1) maximize value creations for shareholders through efficient management of capital structure; (2) facilitate the payment of management, managerial employees and other employees of the Bank and companies under its control, in line with the Resolution of the CMN 3921, of November 25, 2010, pursuant to the Plan of Long-Term Incentive and (3) facilitate the management of risk arising the services rendered, by the Bank, of market maker in Brazil of certain index funds, where the Units are included in the theoretical portfolio of reference such funds in accordance with applicable rules. Part of the Units repurchased will be used by the Bank to hedge against price fluctuation of securities that make up the benchmark, and should be bought and sold in accordance with the risk management policy of the Bank.
The Buyback Program will cover the procurement of over to 76,008,403 Units, representing 4,180,462,165 common shares and 3,800,420,150 preferred shares, or ADRs (American Depositary Receipts) by the Bank, or by its Cayman branch; Aymore by CFI and / or the Sancap, corresponding on June, 30 2013 approximately 2% of the total share capital of the Bank.
In 2013, 5,268,000 Units were acquired, 2,049,180 Units paid as Bonus and Long-Term Incentive Plan – Local and 5,600 treasury shares were sold. The balance accumulated of treasury shares on December 31, 2013, amounting to 11,823,638 Units (12/31/2012 – 8,610,418) equivalent to R$177,122 (12/31/2012 – R$134,371). The minimum, weighted average and maximum cost per Unit of the total number of treasury shares is, respectively, R$13.36, R$15.06 and R$18.52. In 2013 was acquired 5,015,447 ADRs. The balance accumulated of ADRs acquired and held in treasury amounting 6,748,347 ADRs, in the current amount of R$114,586 (12/31/2012 - R$36,191). The minimum, weighted average and maximum cost per ADR of the total number of treasury shares is, respectively, US$5.86, US$7.24 e US$10.21. The market value of these shares on December 31, 2013 was R$13,98 per Unit and US$5.40 per ADR.
Additionally, year ended December 31, 2013, treasury shares were traded, refer to the services of a market maker that resulted in a loss of R$716 (12/31/2012 - loss of R$41) recorded directly in equity in capital reserves.
a) Basic earnings per share
Basic earnings per share is calculated by dividing the net profit attributable to the Parent by the weighted average outstanding shares during the year average number, excluding the average number of own shares held during the year and held in treasury.
|
2013
|
2012
|
2011
|
||||||||||
|
Profit attributable to the Parent
|
||||||||||||
|
From Continuing and Discontinued Operations
|
5,723,494 | 5,482,606 | 7,739,204 | |||||||||
|
From Continuing Operations
|
3,660,031 | 5,427,293 | 7,664,966 | |||||||||
|
Weighted average shares outstanding
|
397,875,180 | 398,046,964 | 399,044,117 | |||||||||
|
Basic earning per 1,000 share (Brazilian Reais - R$)
|
||||||||||||
|
From Continuing and Discontinued Operations
|
14.39 | 13.77 | 19.39 | |||||||||
|
From Continuing Operations
|
9.20 | 13.63 | 19.21 | |||||||||
F-76
BANCO SANTANDER (BRASIL) S.A.
NOTES TO THE CONSOLIDATED FINANCIAL STATEMENTS
(Amounts in thousands of Brazilian Reais - R$, unless otherwise stated)
b) Diluted earning per share
The diluted earnings per share is calculated by dividing the net profit attributable to the Parent by the weighted average outstanding shares during the year average number, excluding the average number of own shares held during the year and held in treasury, including the effect of dilutive potential programs long-term compensation.
|
2013
|
2012
|
2011
|
||||||||||
|
Profit attributable to the Parent
|
||||||||||||
|
From Continuing and Discontinued Operations
|
5,723,494 | 5,482,606 | 7,739,204 | |||||||||
|
From Continuing Operations
|
3,660,031 | 5,427,293 | 7,664,966 | |||||||||
|
Weighted average shares outstanding
|
397,875,180 | 398,046,964 | 399,044,117 | |||||||||
|
Incremental shares from stock options granted under Stock Option Plan
|
159,866 | 244,088 | - | |||||||||
|
Adjusted weighted average shares
|
398,035,046 | 398,291,052 | 399,044,117 | |||||||||
|
Diluted earnings 1,000 share (Brazilian Reais - R$)
|
||||||||||||
|
From Continuing and Discontinued Operations
|
14.38 | 13.77 | 19.39 | |||||||||
|
From Continuing Operations
|
9.20 | 13.63 | 19.21 | |||||||||
Financial institutions are required to maintain Regulatory Capital (PR), Tier I and Principal Capital consistent with their risk activities, higher to the minimum requirement of the Regulatory Capital Requirement, represented by the sum of the partial credit risk, market risk and operational risk.
The minimum Regulatory Capital requirement (PR) is 11% until December 31, 2015. And the minimum Regulatory Capital requirement of Tier I is 5.5% from October 1, 2013 to December 31, 2014. The minimum Principal Capital requirement of 4.5% from October 1, 2013.
In July 2008 came into force the rules on regulatory capital measurement by the Standardized Approach of Basel II. These rules were repealed by Resolution 4.192/2013 and 4.278/2013 which took effect since1st October 2013. And the Resolution 4,193 and 4,281 of 2013, establishing the model for calculating the minimum Regulatory Capital requirements (PR), Tier I and Principal Capital. These resolution states that the composition of the Regulatory Capital is done through equity, subordinated debt, hybrid capital instruments. Index is calculated on a consolidated basis, as shown below:
|
Financial Consolidated
(1)
|
||||||||||||
| Thousands of Reais | 2013 | 2012 | 2011 | |||||||||
|
Tier I Regulatory Capital
|
63,594,727 | 65,213,301 | 64,759,590 | |||||||||
|
Principal Capital
|
63,594,727 | - | - | |||||||||
|
Tier II Regulatory Capital
|
2,701,014 | 5,069,813 | 6,642,092 | |||||||||
|
Regulatory Capital (Tier I and II)
|
66,295,741 | 70,283,114 | 71,401,682 | |||||||||
|
Required Regulatory Capital
|
37,936,111 | 37,131,442 | 31,701,580 | |||||||||
|
Portion of Credit Risk
(2)
|
34,199,529 | 32,409,974 | 28,761,446 | |||||||||
|
Market Risk Portions
(3)
|
2,047,595 | 2,951,238 | 1,219,396 | |||||||||
|
Operational Risk Portion
|
1,688,987 | 1,770,230 | 1,720,738 | |||||||||
|
Basel I Ratio
|
18.4 | - | - | |||||||||
|
Basel Principal Capital
|
18.4 | - | - | |||||||||
|
Basel
(4)
|
19.2 | % | 20.8 | % | 24.8 | % | ||||||
(1) Amounts calculated based on the consolidated information provided by the financial institutions (Financial Conglomerate).
(2) To calculate the capital allocation for credit risk were considered modifications and inclusions of Bacen Circular 3.644 of March 4, 2013, which revoked Bacen Circular 3.563/2011. The main changes were in line of real estate loans, with the change in weight depending of the amount financed (LTV), payroll loans with change in aggregate weight of 300% to 150% and the segregated weight of 75% for large companies and other wallets with change of billing.
(3) Includes portions for market risk exposures subject to variations in rates of foreign currency coupons (PJUR2), price indexes (PJUR3) and interest rate (PJUR1/PJUR4), the price of commodities (PCOM), the price of shares classified as trading portfolios (PACS), and portions for gold exposure and foreign currency transactions subject to foreign exchange (PCAM).
(4) Not consider the possible impacts of the Optimization of Capital Structure Plan mentioned (Note 47) Subsequent Event.
Banco Santander, quarterly disclose information relating to risk management and Required Regulatory Capital (PRE). A report with further details of the structure and methodology will be disclosed at the website www.santander.com.br/ri.
Financial institutions are required to maintain investments in permanent assets compatible with adjusted regulatory capital. Funds invested in permanent assets, calculated on a consolidated basis, are limited to 50% of adjusted regulatory capital, as per prevailing regulation. On December 31, 2013 and 2012 Banco Santander classifies for said index.
BANCO SANTANDER (BRASIL) S.A.
NOTES TO THE CONSOLIDATED FINANCIAL STATEMENTS
(Amounts in thousands of Brazilian Reais - R$, unless otherwise stated)
“Interest and similar income” in the consolidated income statement comprises the interest accruing in the year on all financial assets with an implicit or explicit return, calculated by applying the effective interest method, irrespective of measurement at fair value; and the rectifications of income as a result of hedge accounting. Interest is recognized gross, without deducting any tax withheld at source.
The breakdown of the main items of interest and similar charges accrued in 2013, 2012 and 2011 is as follows:
|
Thousands of Reais
|
2013
|
2012
|
2011
|
|||||||||
|
Cash and balances with the Brazilian Central Bank
|
6,796,728 | 5,731,269 | 6,297,438 | |||||||||
|
Loans and amounts due from credit institutions
|
751,248 | 1,027,615 | 1,202,902 | |||||||||
|
Loans and advances to customers
|
35,737,244 | 38,735,467 | 35,397,614 | |||||||||
|
Debt instruments
|
6,529,253 | 6,081,759 | 8,084,155 | |||||||||
|
Pension plans (Note 21.b)
|
- | - | 55,103 | |||||||||
|
Other interest
|
1,402,573 | 1,067,427 | 678,965 | |||||||||
|
Total
|
51,217,046 | 52,643,537 | 51,716,177 | |||||||||
“Interest expense and similar charges” in the consolidated income statement includes the interest accruing in the year on all financial liabilities with an implicit or explicit return, including remuneration in kind, calculated by applying the effective interest method, irrespective of measurement at fair value; the rectifications of cost as a result of hedge accounting; and the interest cost attributable to pension funds.
The breakdown of the main items of interest expense and similar charges accrued in 2013, 2012 and 2011 is as follows:
|
Thousands of Reais
|
2013
|
2012
|
2011
|
|||||||||
|
Deposits from credit institutions
|
1,774,488 | 1,585,375 | 2,006,136 | |||||||||
|
Customer deposits
|
13,516,868 | 13,494,019 | 16,494,482 | |||||||||
|
Marketable debt securities and subordinated liabilities:
|
||||||||||||
|
Marketable debt securities (note 18)
|
4,355,190 | 3,662,370 | 3,226,644 | |||||||||
|
Subordinated liabilities (note 19)
|
810,273 | 1,010,807 | 1,213,239 | |||||||||
|
Pensions (note 21.b)
|
378,904 | 278,619 | 231,944 | |||||||||
|
Other interest
|
1,902,102 | 1,025,387 | 747,655 | |||||||||
|
Total
|
22,737,825 | 21,056,577 | 23,920,100 | |||||||||
“Income from equity instruments” includes the dividends and payments on equity instruments out of profits generated by investees after the acquisition of the equity interest.
The breakdown of the balance of this item is as follows:
|
Thousands of Reais
|
2013
|
2012
|
2011
|
|||||||||
|
Equity instruments classified as:
|
|
|
||||||||||
|
Financial assets held for trading
|
16,608 | 16,064 | 5,187 | |||||||||
|
Available-for-sale financial assets
|
22,004 | 16,651 | 88,424 | |||||||||
|
Other financial instruments at fair value through profit or loss
|
42,674 | 61,019 | - | |||||||||
|
Total
|
81,286 | 93,734 | 93,611 | |||||||||
BANCO SANTANDER (BRASIL) S.A.
NOTES TO THE CONSOLIDATED FINANCIAL STATEMENTS
(Amounts in thousands of Brazilian Reais - R$, unless otherwise stated)
“Fee and commission income” comprises the amount of all fees and commissions accruing in favor of the Bank in the year, except those that form an integral part of the effective interest rate on financial instruments.
The breakdown of the balance of this item is as follows:
|
Thousands of Reais
|
2013
|
2012
|
2011
|
|||||||||
|
|
|
|
||||||||||
|
Collection and payment services:
|
|
|
||||||||||
|
Bills
|
509,850 | 417,793 | 374,103 | |||||||||
|
Demand accounts
|
1,380,304 | 1,683,885 | 1,624,466 | |||||||||
|
Cards
|
3,583,818 | 2,794,822 | 1,940,239 | |||||||||
|
Checks and other
|
181,898 | 594,172 | 606,142 | |||||||||
|
Orders
|
258,421 | 265,221 | 223,354 | |||||||||
|
Total
|
5,914,291 | 5,755,893 | 4,768,304 | |||||||||
|
Marketing of non-banking financial products:
|
||||||||||||
|
Investment funds
|
970,503 | 1,051,070 | 1,058,910 | |||||||||
|
Insurance
|
1,683,391 | 1,379,626 | 1,273,137 | |||||||||
|
Capitalization
|
298,654 | 280,101 | 266,620 | |||||||||
|
Total
|
2,952,548 | 2,710,797 | 2,598,667 | |||||||||
|
Securities services:
|
||||||||||||
|
Securities underwriting and placement
|
207,439 | 207,318 | 271,361 | |||||||||
|
Securities trading
|
133,266 | 120,457 | 101,104 | |||||||||
|
Administration and custody
|
95,592 | 97,395 | 102,603 | |||||||||
|
Asset management
|
2,108 | 2,182 | 2,963 | |||||||||
|
Total
|
438,405 | 427,352 | 478,031 | |||||||||
|
Other:
|
||||||||||||
|
Foreign exchange
|
384,727 | 314,009 | 343,288 | |||||||||
|
Financial guarantees
|
321,651 | 255,544 | 232,688 | |||||||||
|
Other fees and commissions
|
730,001 | 147,260 | 207,742 | |||||||||
|
Total
|
1,436,379 | 716,813 | 783,718 | |||||||||
|
Total
|
10,741,623 | 9,610,855 | 8,628,720 | |||||||||
“Fee and commission expense” shows the amount of all fees and commissions paid or payable by the Bank in the year, except those that form an integral part of the effective interest rate on financial instruments.
The breakdown of the balance of this item is as follows:
|
Thousands of Reais
|
2013
|
2012
|
2011
|
|||||||||
|
|
|
|
||||||||||
|
Fees and commissions assigned to third parties
|
1,836,202 | 1,376,275 | 1,015,426 | |||||||||
|
Of which: Credit cards
|
1,650,717 | 1,187,134 | 834,412 | |||||||||
|
Other fees and commissions
|
804,965 | 624,654 | 413,853 | |||||||||
|
Total
|
2,641,167 | 2,000,929 | 1,429,279 | |||||||||
BANCO SANTANDER (BRASIL) S.A.
NOTES TO THE CONSOLIDATED FINANCIAL STATEMENTS
(Amounts in thousands of Brazilian Reais - R$, unless otherwise stated)
Gains (losses) on financial assets and liabilities (net)” includes the amount of the valuation adjustments of financial instruments, except those attributable to interest accrued as a result of application of the effective interest method and to allowances, and the gains or losses derived from the sale and purchase thereof.
The breakdown of the balance of this item, by type of instrument, is as follows:
|
Thousands of Reais
|
2013
|
2012
|
2011
|
|||||||||
|
|
|
|
||||||||||
|
Held for trading
(1)
|
(2,599,638 | ) | (1,456,070 | ) | (902,167 | ) | ||||||
|
Other financial instruments at fair value through profit or loss
(2)
|
44,000 | 238,208 | 57,039 | |||||||||
|
Financial instruments not measured at fair value through profit or loss
|
1,406,375 | 655,838 | 685,355 | |||||||||
|
Of which: Available-for-sale financial assets
|
||||||||||||
|
Debt instruments
|
1,418,546 | 592,955 | 452,972 | |||||||||
|
Equity instruments
|
(12,171 | ) | 63,028 | 256,694 | ||||||||
|
Hedging derivatives and other
|
3,376 | 13,824 | 25,866 | |||||||||
|
Total
|
(1,145,887 | ) | (548,200 | ) | (133,907 | ) | ||||||
(1) Includes the economic hedge of the Bank’s position in Cayman, which is a non-autonomous subsidiary (note 22).
(2) Includes the net gain arising from transactions involving debt securities, equity instruments and derivatives included in this portfolio, since the Bank manages its risk in these instruments on a global basis.
“Exchange differences (net)” shows the gains or losses on foreign currency transactions, the differences that arise on translations of monetary items in foreign currencies to the functional currency, and those disclosed on non-monetary assets in foreign currency at the time of their disposal.
The breakdown of "Other operating income (expense)" is as follows:
|
Thousands of Reais
|
2013
|
2012
|
2011
|
|||||||||
|
|
|
|
||||||||||
|
Profit from insurance contracts
|
- | - | 432,134 | |||||||||
|
Of which:
|
||||||||||||
|
Income from insurance contracts
|
- | - | 4,132,663 | |||||||||
|
Expense from insurance contracts
|
- | - | (3,700,529 | ) | ||||||||
|
Other operating income
|
415,852 | 395,668 | 539,737 | |||||||||
|
Other operating expense
|
(657,080 | ) | (831,370 | ) | (1,165,854 | ) | ||||||
|
Contributions to fund guarantee of credit - FGC
|
(203,660 | ) | (187,791 | ) | (183,718 | ) | ||||||
|
Total
|
(444,888 | ) | (623,493 | ) | (377,701 | ) | ||||||
a) Breakdown
The breakdown of “Personnel expenses” is as follows:
|
Thousands of Reais
|
2013
|
2012
|
2011
|
|||||||||
|
|
|
|
||||||||||
|
Wages and salaries
|
4,314,508 | 4,303,627 | 4,179,150 | |||||||||
|
Social security costs
|
1,169,289 | 1,176,807 | 1,076,598 | |||||||||
|
Benefits
|
1,050,829 | 982,886 | 864,085 | |||||||||
|
Defined benefit pension plans (note 21.b)
|
46,341 | 42,798 | 19,460 | |||||||||
|
Contributions to defined contribution pension plans
|
65,422 | 65,062 | 55,425 | |||||||||
|
Share-based compensation
|
133,224 | 126,967 | 94,217 | |||||||||
|
Training
|
135,043 | 140,591 | 115,613 | |||||||||
|
Other personnel expenses
|
130,954 | 247,618 | 202,843 | |||||||||
|
Total
|
7,045,610 | 7,086,356 | 6,607,391 | |||||||||
BANCO SANTANDER (BRASIL) S.A.
NOTES TO THE CONSOLIDATED FINANCIAL STATEMENTS
(Amounts in thousands of Brazilian Reais - R$, unless otherwise stated)
b) Share-Based Compensation
Banco Santander has long-term compensation plans linked to the market price of the shares . The members of the Executive Board of Banco Santander are eligible for these plans, besides the members selected by the Board of Directors and informed to the Human Resources, which selection may fall according to the seniority of the group. For the Board of Directors members in order to be eligible, it is necessary to exercise Executive Board functions.
b.1) Local Program
The Extraordinary stockholders’ Meeting of Banco Santander held on February 3, 2010 approved the Share-Based Compensation Program - Units of Banco Santander (Local Plan), consisting of two independent plans: Stock Option Plan for Share Deposit Certificates - Units (SOP) and Long-Term Incentive Plan - Investment in Share Deposit Certificates - Units (PSP).
On 25 October 2011, Banco Santander held an Extraordinary General Meeting, which approved the grant of the Incentive Plan Long Term (SOP 2014) - Investment in Certificates of Deposit Shares ("Units") to certain directors and Managerial level employees of the Bank and companies under its control.
On 29 April, 2013, Banco Santander held an Extraordinary General Meeting, which approved the grant of the Banco Santander’s share-based compensation program - Stock Option Plan for Share Deposit Certificates – Units (SOP 2013) and the Long-Term Incentive Plan - Investment in Share Deposit Certificates (PSP 2013).
The characteristic of each plan are:
SOP Plan:
It is a 3 year Stock Option Plan by which new shares of the Banco Santander are issued, as a manner of retaining the officers’ commitment to long-term results. The period for exercising the options starts on June 30, 2012 and is two years longer than the vesting period. The volume equivalent to 1/3 of the Units resulting from the exercise of options cannot be sold by the participant during a period of one year from the exercise date of each unit.
Long-Term Incentive Plan - SOP 2014:
It is a 3 year Stock Option Plan. The period for exercise comprises between June 30, 2014 and June 30, 2016. The number of Units exercisable by the participants will be determined according to the result of the determination of a performance parameter of the Bank: total Shareholder Return (TSR) and may be reduced if failure to achieve the goals of reducing the Return on Risk Adjusted Capital (RORAC), comparison made between realized and budgeted in each year, as determined by the Board of Directors. Additionally, it is necessary that the participant remains in the Bank during the term of the Plan to acquire a position to exercise the corresponding Units.
Long-Term Incentive Plan – SOP 2013:
It is a stock option plan with 3 years of vesting. The period for the exercise comprises between June 30, 2016 and June 30, 2018. The number of Units exercisable by the participants will be determined according to the result of measurement of a performance parameter of the Bank: Total Shareholder Return (TSR) and can be reduced, if not achieved the goals of reducing weighted Return on Assets by Risk (RoRWA), comparison between realized and budgeted in each year, as determined by the Board of Directors. Additionally, it is necessary that the participant remains in the Bank during the term of the Plan to acquire a position to exercise the corresponding Units.
PSP Plan:
Compensation Plan based on shares settled in cash, with vesting period of 3 years, promoting a commitment of executives with the long-term results. The Plan has as its object the payment of bonus by the Company to Participants under the Variable Compensation and (i) 50% (fifty percent) consist of the delivery "Units", where which can not be sold during the term of 01 (one) year from the date of exercise and (ii) 50% (fifty percent) will be paid in cash, which may be used freely by the Participants ("fifty percent"), after deductions of all taxes, charges and withholdings.
Long-Term Incentive Plan – PSP 2013
: Compensation Plan based on shares with cycles of 3 years, promoting a commitment of executives with the long-term results. The Plan has as its object the payment of bonus by the Company to Participants under the Variable Compensation 100% (one hundred percent) consist of the delivery Units.
b.1.1) Fair Value and Plans Performance Parameters
For accounting of the Local Program plans, an independent consultant promoted simulations based on Monte Carlo methodology's, as presented the performance parameters used to calculate the shares to be granted. Such parameters are associated with their respective probabilities of occurrence, which are updated at the close of each period.
|
PSP 2013/ SOP 2013
|
SOP, PI12 - PSP, PI13 - PSP and PI14 - PSP
(1)
|
SOP 2014
(2)
|
||||||||||
|
Total Shareholder Return (TSR) rank
|
% of Exercisable Shares
|
|||||||||||
|
1st
|
100 | % | 50 | % | 100 | % | ||||||
|
2nd
|
75 | % | 35 | % | 75 | % | ||||||
|
3th
|
50 | % | 25 | % | 50 | % | ||||||
|
4th
|
- | - | 25 | % | ||||||||
(1) Associated with the TSR, the remaining 50% of the shares subject to exercise refer to the realization of net income vs. budgeted profit.
(2) The percentage of shares determined at the position of TSR is subject to a penalty according to the implementation of the Return on Risk Adjusted Capital (RORAC).
BANCO SANTANDER (BRASIL) S.A.
NOTES TO THE CONSOLIDATED FINANCIAL STATEMENTS
(Amounts in thousands of Brazilian Reais - R$, unless otherwise stated)
For measurement of the fair value the following premises was used:
|
PSP 2013
|
PI14 - PSP
|
PI13 - PSP
|
PI12 - PSP
|
|||||||||||||
|
Method of Assessment
|
Binomial
|
Binomial
|
Binomial
|
Binomial
|
||||||||||||
|
Volatility
|
40.00 | % | 57.37 | % | 57.37 | % | 57.37 | % | ||||||||
|
Probability of Occurrence
|
60.27 | % | 37.59 | % | 26.97 | % | 43.11 | % | ||||||||
|
Risk-Free Rate
|
11.80 | % | 10.50 | % | 10.50 | % | 11.18 | % | ||||||||
|
PSP 2013
|
SOP 2014
|
SOP plan
|
||||||||||||||
|
Method of Assessment
|
Black&Scholes
|
Black&Scholes
|
Binomial
|
|||||||||||||
|
Volatility
|
40.00 | % | 40.00 | % | 57.37 | % | ||||||||||
|
Rate of Dividends
|
3.00 | % | 3.00 | % | 5.43 | % | ||||||||||
|
Vesting Period
|
2 years
|
2 years
|
2,72 years
|
|||||||||||||
|
Average Exercise Time
|
5 years
|
5 years
|
3,72 years
|
|||||||||||||
|
Risk-Free Rate
|
11.80 | % | 10.50 | % | 11.18 | % | ||||||||||
|
Probability of Occurrence
|
60.27 | % | 71.26 | % | 43.11 | % | ||||||||||
|
Fair Value of the Option Shares
|
R$ | 5,96 | R$ | 6,45 | R$ | 7,19 | ||||||||||
The average value of shares SANB11 in of the year is R$14,07 (2012 - R$14,93 and 2011 - R$14.96).
On 2013, daily pro-rata expenses amounting R$43,404 (2012 - R$44,917 and 2011 - R$12,893), relating to the SOP plan and R$5,390 (2012 - R$6,479 and 2011 - R$15,632) relating to the PSP plan. Also recorded in the period a gain with the movement of the market value of the share of the PSP Plan in the amount of R$363 as "Gains (losses) on financial assets and liabilities (net) - Others".
|
Date of
|
|||||||||||||||||
|
Commencement
|
Expiration
|
||||||||||||||||
|
Number of
|
Exercise
|
of Exercise
|
Date of Exercise
|
||||||||||||||
|
Shares
|
Price in Reais
|
Year Granted
|
Employees
|
Period
|
Period
|
||||||||||||
|
Final Balance on December 31, 2010
|
13,914,532 | ||||||||||||||||
|
Cancelled PI12 - PSP options
|
(106,718 | ) | 2010 |
Managers
|
02/03/10
|
06/30/12
|
|||||||||||
|
Cancelled PI12 - SOP options
|
40,479 | 23.50 | 2010 |
Managers
|
02/03/10
|
06/30/14
|
|||||||||||
|
Granted PI13 - PSP options
|
1,498,700 | 2011 |
Managers
|
02/03/10
|
06/30/13
|
||||||||||||
|
Cancelled PI13 - PSP options
|
(130,493 | ) | 2011 |
Managers
|
02/03/10
|
06/30/13
|
|||||||||||
|
Granted SOP 2014 options
|
14,450,000 | 14.31 | 2011 |
Managers
|
10/26/11
|
12/31/13
|
|||||||||||
|
Final Balance on December 31, 2011
|
29,666,500 | ||||||||||||||||
|
Cancelled PI12 - PSP options
|
(698,103 | ) | 2010 |
Managers
|
02/03/10
|
06/30/12
|
|||||||||||
|
Exercised (PI12 - PSP)
|
(486,852 | ) | 2010 |
Managers
|
02/03/10
|
06/30/12
|
|||||||||||
|
Cancelled PI12 - PSP options
|
(7,759,571 | ) | 23.50 | 2010 |
Managers
|
02/03/10
|
06/30/14
|
||||||||||
|
Cancelled PI13 - PSP options
|
(72,209 | ) | 2011 |
Managers
|
02/03/10
|
06/30/13
|
|||||||||||
|
Granted PI14 - PSP options
|
1,910,000 | 2012 |
Managers
|
05/29/12
|
06/30/14
|
||||||||||||
|
Cancelled PI14 - PSP options
|
(106,226 | ) | 2012 |
Managers
|
05/29/12
|
06/30/14
|
|||||||||||
|
Cancelled SOP 2014
|
(2,393,163 | ) | 14.31 | 2011 |
Managers
|
10/26/11
|
12/31/13
|
||||||||||
|
Granted SOP 2014
|
5,855,000 | 14.31 | 2012 |
Managers
|
10/26/11
|
12/31/13
|
|||||||||||
|
Final Balance on December 31, 2012
|
25,915,376 | ||||||||||||||||
|
Cancelled (PI 13 - PSP) options
|
(971,238 | ) | 2011 |
Managers
|
02/03/10
|
06/30/13
|
|||||||||||
|
Exercised (PI 13 - PSP) options
|
(324,760 | ) | 2011 |
Managers
|
02/03/10
|
06/30/13
|
|||||||||||
|
Cancelled (PI 14 - PSP) options
|
(86,465 | ) | 2012 |
Managers
|
05/29/12
|
06/30/14
|
|||||||||||
|
Cancelled (SOP - 2014) options
|
(2,352,431 | ) | 14.31 | 2011 |
Managers
|
10/26/11
|
12/31/13
|
||||||||||
|
Granted (SOP - 2013) options
|
12,240,000 | 14.43 | 2013 |
Managers
|
05/02/13
|
12/31/15
|
|||||||||||
|
Granted (PSP - 2013) options
|
2,456,000 | 2013 |
Managers
|
08/13/13
|
06/30/16
|
||||||||||||
|
Cancelled (SOP - 2013) options
|
(1,197,255 | ) | 14.43 | 2013 |
Managers
|
05/02/13
|
06/30/18
|
||||||||||
|
Cancelled (PSP - 2013) options
|
(24,997 | ) | 2013 |
Managers
|
08/13/13
|
06/30/16
|
|||||||||||
|
Final Balance on December 31, 2013
|
35,654,230 | ||||||||||||||||
|
SOP
|
4,903,767 | 23.50 | 2010 |
Managers
|
02/03/10
|
06/30/14
|
|||||||||||
|
PI14 - PSP
|
1,717,309 | 2012 |
Managers
|
05/29/12
|
06/30/14
|
||||||||||||
|
SOP - 2014
|
15,559,406 | 14.31 | 2011 |
Managers
|
10/26/11
|
06/30/16
|
|||||||||||
|
SOP - 2013
|
11,042,745 | 14.43 | 2013 |
Managers
|
05/02/13
|
06/30/18
|
|||||||||||
|
PSP - 2013
|
2,431,003 | 2013 |
Managers
|
08/13/13
|
06/30/16
|
||||||||||||
|
Total
|
35,654,230 | ||||||||||||||||
BANCO SANTANDER (BRASIL) S.A.
NOTES TO THE CONSOLIDATED FINANCIAL STATEMENTS
(Amounts in thousands of Brazilian Reais - R$, unless otherwise stated)
b.2) Global Program
Long-Term Incentive Policy
The Board of Directors’ of Banco Santander Spain approved in a meeting held on March 26, 2008, the long-term incentive policy intended for the executives of Banco Santander Spain and the Santander Group companies (except Banco Español de Crédito, S.A. - Banesto). This policy provides for compensation tied to the performance of the stock of Banco Santander Spain, as established in the Annual Stockholders’ Meeting.
Among the plans of Banco Santander Spain, Conglomerate Santander's executives in Brazil already participate in the Stock Plan Tied to Goals: multiyear plan paid in shares of Banco Santander Spain. This plan’s beneficiaries are the Executive Officers and other members of Top Management, as well as any other group of executives identified by the Executive Board or the Executive Committee.
This plan involves three-years cycles for the delivery of shares to the grantees. The first two cycles started in July 2007, with the first cycle lasting two years (Plan I09) and the other cycles lasting three years, on average (Plan I10/Plan I11/Plan I12/Plan I13 and Plan l14). Therefore since 2009 a new cycle beginnings and the closure of a previous cycle. The purpose is to establish an appropriate sequence between the end of the incentive program, tied to the previous plan, I-06, and the successive cycles of this plan.
For each cycle is set a maximum number of shares for each grantee who continued working at Grupo Santander Spain during the plan. The objectives whose fulfillment determine the number of shares distributed are defined by comparing the performance of Grupo Santander Spain in relation to a Reference Group (financial institutions) and are related to two parameters: RTA and growth in Earnings / Benefit for Action (BPA).
Each of these parameters has a weight of 50% in the determination of the percentage of shares to be granted. The number of shares to be granted is determined in each cycle by the goal attainment level on the third anniversary of the start of each cycle (except the first cycle, for which the second anniversary will be considered).
From the plan Pl12 the purpose determines the number of actions that relate to just one performance condition, which has 100% weight in the percentage of shares to be distributed: the TSR Group.
Global Plan Fair Value
It was assumed that the grantee will not leave the Bank’s employment during the term of each plan. The fair value of the 50% linked to the Bank’s relative TSR position was calculated, on the grant date, on the basis of the report provided by external valuators whose assessment was carried out using a Monte Carlo valuation model, performing 10 thousand simulations to determine the TSR of each of the companies in the Benchmark Group, taking into account the variables set forth below. The results (each of which represents the delivery of a number of shares) are classified in decreasing order by calculating the weighted average and discounting the amount at the risk-free interest rate.
|
PI10
|
PI11
|
PI12
|
PI13
|
PI14
|
||||||||||||||||
|
Expected volatility (*)
|
0.1567 | 0.1931 | 0.4236 | 0.4964 | 0.5135 | |||||||||||||||
|
Annual dividend yield based on last five years
|
3.24 | % | 3.47 | % | 4.88 | % | 6.33 | % | 6.06 | % | ||||||||||
|
Risk-free interest rate (Treasury Bond yield –zero coupon) over the period of the plan
|
4.50 | % | 4.84 | % | 2.04 | % | 3.33 | % | 4.07 | % | ||||||||||
(*) calculated on the basis of historical volatility over the corresponding period (two or three years).
In view of the high correlation between TSR and EPS, it was considered feasible to extrapolate that (in a high percentage of cases) the TSR value is also valid for EPS. Therefore, it was initially determined that the fair value of the portion of the plans linked to the Bank’s relative EPS position, i.e. of the remaining 50% of the options granted, was the same as that of the 50% corresponding to the TSR. Since this valuation refers to a non-market condition, it is reviewed and adjusted on a yearly basis.
BANCO SANTANDER (BRASIL) S.A.
NOTES TO THE CONSOLIDATED FINANCIAL STATEMENTS
(Amounts in thousands of Brazilian Reais - R$, unless otherwise stated)
|
Number of Shares
|
Granted Year
|
Employees
|
Data of Commencement of Exercise Period
|
Data of Expiry of Exercise Period
|
|||||||||
|
|
|
|
|
|
|
||||||||
|
Final Balance on December 31, 2010
|
3,450,248 | ||||||||||||
|
Exercised Options (PI11)
|
(1,783,945 | ) | 2008 |
Managers
|
06/21/08
|
07/31/11
|
|||||||
|
Cancelled Options (PI11)
|
(527,286 | ) | 2008 |
Managers
|
06/21/08
|
07/31/11
|
|||||||
|
Granted Options (PI14)
|
531,684 | 2011 |
Managers
|
07/01/11
|
07/31/14
|
||||||||
|
Final Balance on December 31, 2011
|
1,670,701 | ||||||||||||
|
Exercised Options (PI12)
|
(137,299 | ) | 2009 |
Managers
|
06/19/09
|
07/31/12
|
|||||||
|
Cancelled Options (PI12)
|
(403,907 | ) | 2009 |
Managers
|
06/19/09
|
07/31/12
|
|||||||
|
Cancelled Options (PI14)
|
(59,373 | ) | 2011 |
Managers
|
07/01/11
|
07/31/14
|
|||||||
|
Final Balance on December 31, 2012
|
1,070,122 | ||||||||||||
|
Cancelled Options (PI13)
|
(14,209 | ) | 2010 |
Managers
|
07/01/10
|
07/31/13
|
|||||||
|
Cancelled Options (PI14)
|
(676,228 | ) | 2011 |
Managers
|
07/01/11
|
07/31/14
|
|||||||
|
Final Balance on December 31, 2013
|
379,685 | ||||||||||||
|
Plan I14
|
379,685 | 2011 |
Managers
|
07/01/11
|
07/31/14
|
||||||||
|
Total
|
379,685 | ||||||||||||
On 2013, pro rata expenses were recognized in the amount of R$3,215 (2012 - R$5,215 and 2011 - R$9,954), related to the costs of the cycles mentioned above, regarding the total amount of the Global Program Plans.
Plans do not result in dilution of the share capital of the Bank, because they are paid in shares of Banco Santander Spain.
b.3) Share-Based Bonus
The Annual stockholders’ Meeting of Banco Santander Spain, held on June 11, 2010, approved the new policy for executive compensation through a share-based bonus plan effective for all the companies of the Group, including Banco Santander. This new policy, subject to adjustments applicable to Banco Santander, were approved by Appointment and Compensation Committee and Board of Directors at the meeting held on February 2, 2011.
The plan's objectives are: (i) to align the compensation program with the principles of the “Financial Stability Board” (FSB) agreed upon at the G20; (ii) to align Banco Santander’s interests with those of the plan’s participants (to achieve the sustainable and recurring growth and profitability of Banco Santander’s businesses and to recognize the participants’ contributions); (iii) to allow the retention of participants; and (iv) to improve Banco Santander’s performance and defend the interests of stockholders' via a long-term commitment.
The purpose of the plan is the cash or shares payment of part of the variable compensation owed by Banco Santander to the plan’s participants pursuant to the Bank’s compensation policy, based on the future performance of the bank’s shares.
The payment of share-based bonus is within the limits of the overall management compensation approved by Banco Santander's Annual Stockholders' Meeting.
The total number of shares on which the compensation plan is based will be settled in three installments and equally allocated to each of the three fiscal years following the reference year.
On December 21, 2011, the Board of Directors approved the proposed new incentive plan (deferred) for payment of the variable remuneration of directors and certain employees, which was the subject to resolution of the ordinary general meeting February 7, 2012.
On December 19, 2012, the Board of Directors approved the proposed new incentive plan (deferred) for payment of the variable remuneration of directors and certain employees, which will be subject to resolution of the ordinary general meeting on February 15, 2013.
On April 24, 2013, the Board of Directors approved the proposed new incentive plan (deferred) for payment of the variable remuneration of directors and certain employees, which was approved in AGE (Extraordinary General Meeting) of June 3, 2013. resolution of the ordinary general meeting on June 3, 2013.
This proposal includes certain requirements for deferred payment of part of the future variable compensation due to its managers and other employees, given the financial basis for sustainable long-term adjustments in future payments due to the risks assumed and fluctuations in cost of capital.
The plan is divided into 3 programs:
a) Supervised Collective - Participants of the Executive Committee and other executives who take significant risks in the Bank and are responsible for the control areas. The deferral will be half in cash, indexed to 100% of CDI and half in shares. On the year ended on December 31, 2013, was recorded expense amounting R$11,317 (2012 - R$16,972 and 2011- R$26,613).
b) Collective unsupervised - Statutory Directors - not part of the Statutory Directors' Collective Supervised ", the amount deferred will be paid 100% in Units" SANB11". On the year ended on December 31, 2013, we recorded expenses "pro rata" in the amount of R$68,705 (2012 - R$47,492 and 2011 - R$29,167), regarding the provision of the plan and recorded gain with the oscillation of the share market value of the plan in the amount of R$1,781 as personal expenses.
BANCO SANTANDER (BRASIL) S.A.
NOTES TO THE CONSOLIDATED FINANCIAL STATEMENTS
(Amounts in thousands of Brazilian Reais - R$, unless otherwise stated)
c) Unsupervised Collective - Employees - managerial employees and other employees of the organization that will be benefited from the deferral plan. The deferred amount will be paid 100% cash, indexed to 110% to 120% of CDI. On the year ended on December 31, 2013, there were expense of R$1,193 (2012 - expense of R$895 and 2011, no expenses was recorded).
a) Breakdown
The breakdown of the balance of this item is as follows:
|
Thousands of Reais
|
2013
|
2012
|
2011
|
|||||||||
|
|
||||||||||||
|
Property, fixtures and supplies
|
1,247,901 | 1,171,071 | 1,087,222 | |||||||||
|
Technology and systems
|
1,109,716 | 1,074,337 | 1,005,812 | |||||||||
|
Advertising
|
461,465 | 498,708 | 492,829 | |||||||||
|
Communications
|
572,965 | 573,325 | 565,799 | |||||||||
|
Per diems and travel expenses
|
170,782 | 174,667 | 174,166 | |||||||||
|
Taxes other than income tax
|
88,696 | 65,374 | 58,633 | |||||||||
|
Surveillance and cash courier services
|
570,368 | 563,337 | 520,912 | |||||||||
|
Insurance premiums
|
14,522 | 12,003 | 10,234 | |||||||||
|
Specialized and technical services
|
1,990,547 | 1,718,899 | 1,562,465 | |||||||||
|
Technical reports
|
401,467 | 377,435 | 363,525 | |||||||||
|
Others specialized and technical services
|
1,589,080 | 1,341,464 | 1,198,940 | |||||||||
|
Other administrative expenses
|
577,788 | 834,656 | 697,321 | |||||||||
|
Total
|
6,804,750 | 6,686,377 | 6,175,393 | |||||||||
b) Other information
The balance of “Technical reports” includes the fees paid by the consolidated companies (detailed in the accompanying Appendix I) to their respective auditors, the detail being as follows:
|
Thousands of Reais
|
2013
|
2012
|
2011
|
|||||||||
|
Audit of the annual financial statements and audit related services of the companies audited by Deloitte (constant scope of consolidation)
|
15,266 | 11,135 | 8,828 | |||||||||
Services provided by others audit firms totaled R$3.5 million (2012 - R$3.7 million and 2011 - R$5.4 million).
The breakdown of the balance of this item is as follows:
|
Thousands of Reais
|
2013
|
2012
|
2011
|
|||||||||
|
|
|
|
||||||||||
|
Gains
|
460,203 | 501,274 | 6,759 | |||||||||
|
On disposal of tangible assets
(1)
|
123,305 | 352,782 | 6,759 | |||||||||
|
On disposal of investments
(2) (3)
|
336,898 | 148,492 | - | |||||||||
|
Losses
|
(313 | ) | (268 | ) | (1,439 | ) | ||||||
|
On disposal of tangible assets
|
(313 | ) | (268 | ) | (1,439 | ) | ||||||
|
Total
|
459,890 | 501,006 | 5,320 | |||||||||
(1) Includes R$121,391 (2012 - R$334,593) related to the gain on sale of property for Fundo Imobiliário. This fund has administration and management by third parties.
(2) In 2012, includes R$148,492 related to the capital variation in the percentage of participation of the bank by the segregation of the equity investments of temporary nature (private equity), investments in related business services complementary to banking services (Appendix 1).
(3) In 2013 includes a gain of R$289,736, related to the operation with Webmotors (Note 11.b) and R$47,161, related disposal of MS Participações held in November 2013 and loss on disposal of Santander Brasil Asset.
It refers basically to the result on disposal of property received in the processes of recovery of loans to customers and the provision of the recoverable value of these assets. In 2011, includes R$424,292 gain on sale of Zurich Santander Brasil Seguros e Previdência S.A (note 3.c).
BANCO SANTANDER (BRASIL) S.A.
NOTES TO THE CONSOLIDATED FINANCIAL STATEMENTS
(Amounts in thousands of Brazilian Reais - R$, unless otherwise stated)
a) Guarantees and commitments
The Bank provides a variety of guarantees to its customers to improve their credit standing and allow them to compete. The following table summarizes at December 31, 2013, 2012 and 2011 all of the guarantees.
As required, the “maximum potential amount of future payments” represents the notional amounts that could be lost if there were a total default by the guaranteed parties, without consideration of possible recoveries from collateral held or pledged, or recoveries under recourse provisions. There is no relationship between these amounts and probable losses on these guarantees. In fact, "maximum potential amount of future payments" significantly exceeds inherent losses.
|
Thousands of Reais
|
2013
|
2012
|
2011
|
|||||||||
|
Maximum potential amount of future payments
|
||||||||||||
|
|
|
|
||||||||||
|
Contingent liabilities
|
|
|
|
|||||||||
|
Guarantees and other sureties
|
30,428,391 | 27,117,592 | 21,871,792 | |||||||||
|
Financial guarantees
|
29,073,448 | 25,481,319 | 17,818,624 | |||||||||
|
Performance guarantees
|
511,028 | 280,755 | 910,655 | |||||||||
|
Financial letters of credit
|
580,847 | 1,019,623 | 2,213,135 | |||||||||
|
Other
|
263,068 | 335,895 | 929,378 | |||||||||
|
Other contingent exposures
|
785,111 | 945,555 | 700,160 | |||||||||
|
Documentary Credits
|
785,111 | 945,555 | 700,160 | |||||||||
|
Total Contingent Liabilities
|
31,213,502 | 28,063,147 | 22,571,952 | |||||||||
|
Commitments
|
||||||||||||
|
Loan commitments drawable by third parties
(1)
|
100,549,513 | 106,754,302 | 98,552,891 | |||||||||
|
Total Commitments
|
100,549,513 | 106,754,302 | 98,552,891 | |||||||||
|
Total
|
131,763,015 | 134,817,449 | 121,124,843 | |||||||||
|
(1) Includes the approved limits and unused overdraft, credit card and others.
|
||||||||||||
Financial guarantees are provided to our clients in respect of their obligations to third parties. We have the right to seek reimbursement from our clients for any amount we shall have to pay under such guarantee. Additionally, we may hold cash or other highly liquid collateral for these guarantees. These guarantees are subject to the same credit evaluation performed on the origination of loans.
We expect many of these guarantees to expire without the need to disburse any cash. Therefore, in the ordinary course of business, we expect that these guarantees will have virtually no impact on our liquidity.
Performance guarantees are issued to guaranteed customers obligations such as to make contractually specified investments, to supply specified products, commodities, or maintenance or warranty services to a third party, completion of projects in accordance with contract terms, etc. Financial standby letters of credit include guarantees of payment of loans, credit facilities, promissory notes and trade acceptances. The Bank always requires collateral to grant this kind of financial guarantees. In Documentary Credits, the Bank acts as a payment intermediary between trading companies located in different countries (import-export transactions). Under a documentary credit transaction, the parties involved deal with the documents rather than the commodities to which the documents may relate. Usually the traded commodities are used as collateral to the transaction and the Bank may provide some credit facilities. Loan commitments drawable by third parties include mostly credit card lines and commercial commitments. Credit card lines are unconditionally cancelable by the issuer. Commercial commitments are mostly 1 year facilities subject to information requirements to be provided by our customers.
The risk criteria followed to issue all kinds of guarantees, financial standby letters of credit, documentary credits and any risks of signature are in general the same as those used for other products of credit risk, and therefore subject to the same admission and monitoring standards. The guarantees granted on behalf of our customers are subject to the same credit quality review process as any other risk product. On a regular basis, at least once a year, the solvency of the mentioned customers is checked as well as the probability of those guarantees to be executed. In case that any doubt on the customer’s solvency may arise we create allowances with charge to net income, by the amount of the inherent losses even if there is no claim to us.
The provision for losses on the non-recovery guarantees and other securities (Note 9.c) is recorded as "Impairment losses on financial assets (net)” on consolidated income statement and its calculation is described in note 2.h.
Additionally, the liability recognized as deferred revenue for the premium received for providing the above guarantees, which is being amortized into income over the life of the related guarantees is R$234,766 (2012 - R$131,955 and 2011 - R$76,324).
BANCO SANTANDER (BRASIL) S.A.
NOTES TO THE CONSOLIDATED FINANCIAL STATEMENTS
(Amounts in thousands of Brazilian Reais - R$, unless otherwise stated)
b) Off-balance-sheet funds under management
The detail of off-balance-sheet funds managed by the Bank is as follows:
|
Thousands of Reais
|
2013
|
2012
|
2011
|
|||||||||
|
|
|
|||||||||||
|
Investment funds
|
4,404,165 | 104,461,015 | 104,877,454 | |||||||||
|
Assets under management
(1)
|
- | 9,393,269 | 8,144,334 | |||||||||
|
Total
|
4,404,165 | 113,854,284 | 113,021,788 | |||||||||
|
(1) In 2013, was held the sale of Asset Management segment and disposal of all shares of Santander Brasil Asset.
|
||||||||||||
c) Third-party securities held in custody
At December 31, 2013, the Bank held in custody debt securities and equity instruments totaling R$66,691,116 (2012 - R$79,719,901 and 2011 - R$122,198,361) entrusted to it by third parties.
d) Residual maturity periods and Average interest rates
The breakdown, by maturity, of the balances of certain items in the consolidated balance sheets is as follows:
|
|
2013
|
|||||||||||||||||||||||||||||||
|
|
Thousands of Reais
|
|||||||||||||||||||||||||||||||
|
|
On
Demand
|
Up to
3 Months
|
3 to
12 Months
|
1 to
3 Years
|
3 to
5 Years
|
After 5
Years
|
Total
|
Average
Interest
Rate
|
||||||||||||||||||||||||
|
Assets:
|
||||||||||||||||||||||||||||||||
|
Cash and balances with the Brazilian Central Bank
|
38,920,767 | 11,778,318 | 1,015,125 | - | - | - | 51,714,210 | 9.8 | % | |||||||||||||||||||||||
|
Debt instruments
|
- | 2,754,014 | 6,309,666 | 21,339,947 | 22,819,908 | 14,680,086 | 67,903,621 | 9.0 | % | |||||||||||||||||||||||
|
Equity instruments
|
2,999,721 | - | - | - | - | - | 2,999,721 | - | ||||||||||||||||||||||||
|
Loans and amounts due from credit institutions
|
7,490,700 | 28,071,361 | 478,145 | 1,073,002 | 1,491,784 | 7,438,304 | 46,043,296 | 11.0 | % | |||||||||||||||||||||||
|
Loans and advances to customer, gross
|
9,038,989 | 62,080,061 | 58,199,577 | 54,892,176 | 13,727,561 | 14,795,963 | 212,734,327 | 18.1 | % | |||||||||||||||||||||||
|
Total
|
58,450,177 | 104,683,754 | 66,002,513 | 77,305,125 | 38,039,253 | 36,914,353 | 381,395,175 | 15.6 | % | |||||||||||||||||||||||
|
|
||||||||||||||||||||||||||||||||
|
Liabilities:
|
||||||||||||||||||||||||||||||||
|
Deposits from credit institutions
(1)
|
323,975 | 9,668,294 | 14,162,039 | 7,026,789 | 1,565,974 | 1,285,218 | 34,032,289 | 9.7 | % | |||||||||||||||||||||||
|
Customer deposits
(1)
|
49,261,396 | 49,287,931 | 26,569,482 | 59,895,690 | 14,906,679 | 234,499 | 200,155,677 | 8.1 | % | |||||||||||||||||||||||
|
Marketable debt securities
(1)
|
- | 13,057,198 | 21,314,224 | 25,334,738 | 5,392,554 | 201,834 | 65,300,548 | 7.9 | % | |||||||||||||||||||||||
|
Subordinated liabilities
|
- | 508,655 | 1,861,368 | 6,232,972 | 303,149 | - | 8,906,144 | 8.5 | % | |||||||||||||||||||||||
|
Other financial liabilities
|
128,479 | 20,241,811 | 448,067 | 27,792 | 144,733 | 315,080 | 21,305,962 | - | ||||||||||||||||||||||||
|
Total
|
49,713,850 | 92,763,889 | 64,355,180 | 98,517,981 | 22,313,089 | 2,036,631 | 329,700,620 | 8.3 | % | |||||||||||||||||||||||
|
Difference (assets less liabilities)
|
8,736,327 | 11,919,865 | 1,647,333 | (21,212,856 | ) | 15,726,164 | 34,877,722 | 51,694,555 | ||||||||||||||||||||||||
BANCO SANTANDER (BRASIL) S.A.
NOTES TO THE CONSOLIDATED FINANCIAL STATEMENTS
(Amounts in thousands of Brazilian Reais - R$, unless otherwise stated)
|
|
2012
|
|||||||||||||||||||||||||||||||
|
|
Thousands of Reais
|
|||||||||||||||||||||||||||||||
|
|
On
Demand
|
Up to
3 Months
|
3 to
12 Months
|
1 to
3 Years
|
3 to
5 Years
|
After 5
Years
|
Total
|
Average
Interest
Rate
|
||||||||||||||||||||||||
|
Assets:
|
||||||||||||||||||||||||||||||||
|
Cash and balances with the Brazilian Central Bank
|
38,198,101 | 10,205,643 | 7,131,496 | - | - | - | 55,535,240 | 7.3 | % | |||||||||||||||||||||||
|
Debt instruments
|
- | 5,607,527 | 6,430,543 | 19,424,651 | 36,226,923 | 2,395,433 | 70,085,077 | 9.6 | % | |||||||||||||||||||||||
|
Equity instruments
|
2,631,705 | - | - | - | - | - | 2,631,705 | 7.3 | % | |||||||||||||||||||||||
|
Loans and amounts due from credit institutions
|
10,578,691 | 7,475,012 | 3,585,485 | 1,260,606 | - | 7,018,403 | 29,918,197 | 7.3 | % | |||||||||||||||||||||||
|
Loans and advances to customer, gross
|
9,532,378 | 57,727,291 | 55,012,123 | 51,713,899 | 12,465,248 | 24,289,730 | 210,740,669 | 20.9 | % | |||||||||||||||||||||||
|
Total
|
60,940,875 | 81,015,473 | 72,159,647 | 72,399,156 | 48,692,171 | 33,703,566 | 368,910,888 | 15.5 | % | |||||||||||||||||||||||
|
|
||||||||||||||||||||||||||||||||
|
Liabilities:
|
||||||||||||||||||||||||||||||||
|
Deposits from credit institutions
(1)
|
434,853 | 14,418,896 | 13,719,558 | 4,663,551 | 777,383 | 1,059,385 | 35,073,626 | 8.4 | % | |||||||||||||||||||||||
|
Customer deposits
(1)
|
41,094,568 | 39,996,790 | 20,421,839 | 63,229,707 | 17,608,936 | 6,243,090 | 188,594,930 | 7.3 | % | |||||||||||||||||||||||
|
Marketable debt securities
(1)
|
- | 10,833,946 | 20,715,152 | 16,817,641 | 5,621,656 | 23,623 | 54,012,018 | 7.3 | % | |||||||||||||||||||||||
|
Subordinated liabilities
|
- | 721,196 | 3,006,549 | 2,336,613 | 5,587,196 | 267,597 | 11,919,151 | 8.7 | % | |||||||||||||||||||||||
|
Other financial liabilities
|
254,666 | 16,795,033 | 61,924 | 264,858 | - | - | 17,376,481 | - | ||||||||||||||||||||||||
|
Total
|
41,784,087 | 82,765,861 | 57,925,022 | 87,312,370 | 29,595,171 | 7,593,695 | 306,976,206 | 6.5 | % | |||||||||||||||||||||||
|
Difference (assets less liabilities)
|
19,156,788 | (1,750,388 | ) | 14,234,625 | (14,913,214 | ) | 19,097,000 | 26,109,871 | 61,934,682 | |||||||||||||||||||||||
|
|
2011 | |||||||||||||||||||||||||||||||
|
|
Thousands of Reais
|
|||||||||||||||||||||||||||||||
|
|
On
Demand
|
Up to
3 Months
|
3 to
12 Months
|
1 to
3 Years
|
3 to
5 Years
|
After 5
Years
|
Total
|
Average
Interest
Rate
|
||||||||||||||||||||||||
|
Assets:
|
||||||||||||||||||||||||||||||||
|
Cash and balances with the Brazilian Central Bank
|
48,330,086 | 10,073,723 | 7,534,194 | - | - | - | 65,938,003 | 11.3 | % | |||||||||||||||||||||||
|
Debt instruments
|
- | 6,498,289 | 5,795,261 | 25,972,025 | 12,507,634 | 18,118,048 | 68,891,257 | 11.0 | % | |||||||||||||||||||||||
|
Equity instruments
|
2,130,575 | - | - | - | - | - | 2,130,575 | - | ||||||||||||||||||||||||
|
Loans and amounts due from credit institutions
|
5,731,172 | 2,309,372 | 2,199,399 | 1,189,022 | 1,919,282 | 6,341,427 | 19,689,674 | 9.7 | % | |||||||||||||||||||||||
|
Loans and advances to customer, gross
|
10,113,580 | 44,546,345 | 59,788,958 | 52,036,749 | 19,390,744 | 8,308,061 | 194,184,437 | 23.7 | % | |||||||||||||||||||||||
|
Total
|
66,305,413 | 63,427,729 | 75,317,812 | 79,197,796 | 33,817,660 | 32,767,536 | 350,833,946 | 17.9 | % | |||||||||||||||||||||||
|
|
||||||||||||||||||||||||||||||||
|
Liabilities:
|
||||||||||||||||||||||||||||||||
|
Deposits from credit institutions
(1)
|
618,585 | 29,430,719 | 12,555,672 | 6,923,632 | 1,043,065 | 955,348 | 51,527,021 | 9.2 | % | |||||||||||||||||||||||
|
Customer deposits
(1)
|
37,035,145 | 40,490,745 | 19,044,846 | 56,390,445 | 15,123,854 | 6,388,856 | 174,473,891 | 9.6 | % | |||||||||||||||||||||||
|
Marketable debt securities
(1)
|
- | 3,389,679 | 16,130,779 | 15,781,068 | 3,204,393 | 84,504 | 38,590,423 | 8.8 | % | |||||||||||||||||||||||
|
Subordinated liabilities
|
- | - | - | 5,402,364 | 5,269,434 | 236,546 | 10,908,344 | 11.2 | % | |||||||||||||||||||||||
|
Other financial liabilities
|
176,974 | 15,461,434 | 45,819 | 267,780 | - | - | 15,952,007 | - | ||||||||||||||||||||||||
|
Total
|
37,830,704 | 88,772,577 | 47,777,116 | 84,765,289 | 24,640,746 | 7,665,254 | 291,451,686 | 9.5 | % | |||||||||||||||||||||||
|
Difference (assets less liabilities)
|
28,474,709 | (25,344,848 | ) | 27,540,696 | (5,567,493 | ) | 9,176,914 | 25,102,282 | 59,382,260 | |||||||||||||||||||||||
|
(1) Include obligations which may have advance exigibility, being: sight and time deposits, repurchase agreements with customers, LCI and LCA.
|
||||||||||||||||||||||||||||||||
BANCO SANTANDER (BRASIL) S.A.
NOTES TO THE CONSOLIDATED FINANCIAL STATEMENTS
(Amounts in thousands of Brazilian Reais - R$, unless otherwise stated)
e) Equivalent Reais value of assets and liabilities
The detail of the main foreign currency balances in the consolidated balance sheet, based on the nature of the related items, is as follows:
|
Equivalent Value in Thousands of Reais
|
2013
|
|||||||
|
Assets
|
Liabilities
|
|||||||
|
Cash and balances with the Brazilian Central Bank
|
95,974 | - | ||||||
|
Financial assets/liabilities held for trading
|
691,203 | 530,290 | ||||||
|
Available-for-sale financial assets
|
2,210,754 | - | ||||||
|
Loans and receivables
|
24,309,163 | - | ||||||
|
Financial liabilities at amortized cost
|
- | 32,352,778 | ||||||
|
Total
|
27,307,094 | 32,883,068 | ||||||
|
Equivalent Value in Thousands of Reais
|
2012 | |||||||
|
Assets
|
Liabilities
|
|||||||
|
Cash and balances with the Brazilian Central Bank
|
109,310 | - | ||||||
|
Financial assets/liabilities held for trading
|
1,025,541 | 1,609,662 | ||||||
|
Available-for-sale financial assets
|
406,900 | - | ||||||
|
Loans and receivables
|
12,902,249 | - | ||||||
|
Financial liabilities at amortized cost
|
- | 30,434,449 | ||||||
|
Total
|
14,444,000 | 32,044,111 | ||||||
|
Equivalent Value in Thousands of Reais
|
2011 | |||||||
|
Assets
|
Liabilities
|
|||||||
|
Cash and balances with the Brazilian Central Bank
|
71,341 | - | ||||||
|
Financial assets/liabilities held for trading
|
1,441,332 | 1,370,402 | ||||||
|
Available-for-sale financial assets
|
701,636 | - | ||||||
|
Loans and receivables
|
22,060,787 | - | ||||||
|
Financial liabilities at amortized cost
|
- | 27,087,602 | ||||||
|
Total
|
24,275,096 | 28,458,004 | ||||||
f) Fair value of financial assets and liabilities not measured at fair value
The financial assets owned by the Bank are measured at fair value in the accompanying consolidated balance sheet, except for loans and receivables.
Similarly, the Bank’s financial liabilities except for financial liabilities held for trading and those measured at fair value - are measured at amortized cost in the consolidated balance sheet.
i) Financial assets measured at other than fair value
Following is a comparison of the carrying amounts of the Bank’s financial assets measured at other than fair value and their respective fair values at year-end:
|
Thousands of Reais
|
2013
|
||||
|
Carrying Amount
|
Fair Value
|
||||
|
Assets
|
|||||
|
Loans and receivables:
|
|
|
|||
|
Loans and amounts due from credit institutions (note 5)
|
46,043,184
|
46,005,357
|
|||
|
Loans and advances to customers (note 9)
|
212,734,327
|
212,734,327
|
|||
|
Total
|
258,777,511
|
258,739,684
|
|||
BANCO SANTANDER (BRASIL) S.A.
NOTES TO THE CONSOLIDATED FINANCIAL STATEMENTS
(Amounts in thousands of Brazilian Reais - R$, unless otherwise stated)
|
Thousands of Reais
|
2012
|
||||
|
Carrying Amount
|
Fair Value
|
||||
|
Assets
|
|||||
|
Loans and receivables:
|
|
||||
|
Loans and amounts due from credit institutions (note 5)
|
29,913,132
|
29,906,104
|
|||
|
Loans and advances to customers (note 9)
|
196,774,297
|
196,774,301
|
|||
|
Debt instruments (note 6)
|
269,612
|
269,612
|
|||
|
Total
|
226,957,041
|
226,950,017
|
|||
|
Thousands of Reais
|
2011
|
||||
|
Carrying Amount
|
Fair Value
|
||||
|
Assets
|
|||||
|
Loans and receivables:
|
|
|
|||
|
Loans and amounts due from credit institutions (note 5)
|
19,628,861
|
19,535,160
|
|||
|
Loans and advances to customers (note 9)
|
183,066,268
|
183,202,428
|
|||
|
Debt instruments (note 6)
|
62,062
|
58,043
|
|||
|
Total
|
202,757,191
|
202,795,631
|
|||
ii) Financial liabilities measured at other than fair value
Following is a comparison of the carrying amounts of the Bank’s financial liabilities measured at other than fair value and their respective fair values at year-end:
|
Thousands of Reais
|
2013
|
||||
|
Carrying Amount
|
Fair Value
|
||||
|
Liabilities
|
|||||
|
Financial liabilities at amortized cost:
|
|
|
|||
|
Deposits from Bacen and credit institutions (note 16)
|
34,032,289
|
34,033,116
|
|||
|
Customer deposits (note 17)
(*)
|
200,155,677
|
200,224,854
|
|||
|
Marketable debt securities (note 18)
|
65,300,548
|
65,768,037
|
|||
|
Subordinated liabilities (note 19)
|
8,906,144
|
9,034,361
|
|||
|
Other financial liabilities (note 20)
|
21,305,962
|
21,313,528
|
|||
|
Total
|
329,700,620
|
330,373,896
|
|||
(*) For these purposes, the fair value of customer demand deposits, which are included within customer deposits, are taken to be the same as their carrying amount.
|
Thousands of Reais
|
2012
|
||||
|
Carrying Amount
|
Fair Value
|
||||
|
Liabilities
|
|||||
|
Financial liabilities at amortized cost:
|
|
|
|||
|
Deposits from Bacen and credit institutions (note 16)
|
35,073,626
|
35,073,722
|
|||
|
Customer deposits (note 17)
(*)
|
188,594,930
|
188,626,476
|
|||
|
Marketable debt securities (note 18)
|
54,012,018
|
54,857,848
|
|||
|
Subordinated liabilities (note 19)
|
11,919,151
|
12,115,792
|
|||
|
Other financial liabilities (note 20)
|
17,376,481
|
17,376,481
|
|||
|
Total
|
306,976,206
|
308,050,319
|
|||
(*) For these purposes, the fair value of customer demand deposits, which are included within customer deposits, are taken to be the same as their carrying amount.
BANCO SANTANDER (BRASIL) S.A.
NOTES TO THE CONSOLIDATED FINANCIAL STATEMENTS
(Amounts in thousands of Brazilian Reais - R$, unless otherwise stated)
|
Thousands of Reais
|
2011
|
||||
|
Carrying Amount
|
Fair Value
|
||||
|
Liabilities
|
|||||
|
Financial liabilities at amortized cost:
|
|
|
|||
|
Deposits from Bacen and credit institutions (note 16)
|
51,527,021
|
51,524,429
|
|||
|
Customer deposits (note 17)
(*)
|
174,473,891
|
174,496,664
|
|||
|
Marketable debt securities (note 18)
|
38,590,423
|
38,564,263
|
|||
|
Subordinated liabilities (note 19)
|
10,908,344
|
10,908,344
|
|||
|
Other financial liabilities (note 20)
|
15,952,007
|
15,952,007
|
|||
|
Total
|
291,451,686
|
291,445,707
|
|||
(*) For these purposes, the fair value of customer demand deposits, which are included within customer deposits, are taken to be the same as their carrying amount.
The methods and assumptions to estimate the fair value are defined below:
- Short-term investments - The short-term investments includes the interbank deposits and the repurchase agreements. The carrying amount is approximated to the fair value.
- Loans operations – Fair value are estimated for groups of loans with similar characteristics. The fair value was measured by discounting estimated cash flow using the interest rate of new contracts.
- Deposits – The fair value of deposits was calculated by discounting the difference between the cash flows on a contractual basis and current market rates for instruments with similar maturities. For variable-rate deposits, the carrying amount was considered to approximates fair value.
- Long-term loans – The fair value of long-term loans were estimated by cash flow discounted at the interest rate offered on the market with similar terms and maturities.
g) Other Obligations
The Banco Santander rents properties, mainly used for branches, based on a standard contract which may be cancelled at its own criterion and includes the right to opt for renewals and adjustment clauses. The leases are classified as operating leases. Total future minimum payments of non-cancelable operating leases as of December 31, 2013 is R$2,638,941, of which R$687,726 up to 1 year, R$1,627,811 from 1 year to up to 5 years and R$323,404 after 5 years. Additionally, Banco Santander has contracts for a matures indeterminate, totaling R$2,239 monthly rent corresponding to the contracts with this feature. Payment of operating leases recognized as expenses were R$714,195.
Monthly rental contracts will be adjusted on an annual basis, as per prevailing legislation, at Índice Geral de Preços do Mercado (IGPM) variation. The lessee is entitled to unilaterally rescind the agreement, at any time, as contractual clauses and legislation.
h) Obligation offset and settlement agreements
Obligation offset and settlement agreements - Resolution CMN 3.263/2005 – The Bank has an obligation offset and settlement agreement within the ambit of national financial institutions (SFN), entered into with individuals and legal entities which may or may not be members of SFN, resulting in improved assurance of financial settlement, with the parties with which it has this type of agreement. These agreements establish that payment obligations with the Bank, arising from loans and derivative transactions, in case of default of the counterparty, will be offset against payment obligations of the Bank with the counterparty.
i) Contingent assets
On December 31, 2013, 2012 and 2011 no contingent assets were accounted.
BANCO SANTANDER (BRASIL) S.A.
NOTES TO THE CONSOLIDATED FINANCIAL STATEMENTS
(Amounts in thousands of Brazilian Reais - R$, unless otherwise stated)
j) Statements of value added
The following Statements of value added is not required under IFRS but being presented as supplementary information as required by Brazilian Corporate Law for publicly-held companies, and has been derived from the Bank´s consolidated financial statements prepared in accordance with IFRS.
| 2013 | ||||||||
|
Thousands of Reais
|
||||||||
|
Interest and similar income
|
51,217,046 | |||||||
|
Net fee and commission income
|
8,100,456 | |||||||
|
Impairment losses on financial assets (net)
|
(14,118,071 | ) | ||||||
|
Other income and expense
|
(3,087,835 | ) | ||||||
|
Interest expense and similar charges
|
(22,737,825 | ) | ||||||
|
Third-party input
|
(6,336,244 | ) | ||||||
|
Materials, energy and others
|
(523,510 | ) | ||||||
|
Third-party services
|
(4,705,062 | ) | ||||||
|
Impairment of assets
|
(344,580 | ) | ||||||
|
Other
|
(763,092 | ) | ||||||
|
Gross added value
|
13,037,527 | |||||||
|
Retention
|
||||||||
|
Depreciation and amortization
|
(1,251,916 | ) | ||||||
|
Added value produced
|
11,785,611 | |||||||
|
Investments in affiliates and subsidiaries
|
91,342 | |||||||
|
Added value to distribute
|
11,876,953 | |||||||
|
Added value distribution
|
||||||||
|
Employee
|
6,168,058 | 51.9 | % | |||||
|
Compensation
|
4,444,516 | |||||||
|
Benefits
|
1,165,825 | |||||||
|
Government severance indemnity funds for employees - FGTS
|
277,496 | |||||||
|
Other
|
280,221 | |||||||
|
Taxes
|
1,199,844 | 10.1 | % | |||||
|
Federal
|
1,143,472 | |||||||
|
State
|
682 | |||||||
|
Municipal
|
55,690 | |||||||
|
Compensation of third-party capital - rental
|
724,391 | 6.1 | % | |||||
|
Remuneration of interest on capital
|
3,784,660 | 31.9 | % | |||||
|
Dividends and interest on capital
|
1,444,473 | |||||||
|
Profit Reinvestment
|
2,215,557 | |||||||
|
Profit (loss) attributable to non-controlling interests
|
124,630 | |||||||
|
Total
|
11,876,953 | 100.0 | % | |||||
BANCO SANTANDER (BRASIL) S.A.
NOTES TO THE CONSOLIDATED FINANCIAL STATEMENTS
(Amounts in thousands of Brazilian Reais - R$, unless otherwise stated)
|
2012
|
2011
|
|||||||||||||||
|
Thousands of Reais
|
||||||||||||||||
|
Interest and similar income
|
52,643,537 | 51,716,177 | ||||||||||||||
|
Net fee and commission income
|
7,609,926 | 7,199,441 | ||||||||||||||
|
Impairment losses on financial assets (net)
|
(16,475,596 | ) | (9,381,549 | ) | ||||||||||||
|
Other income and expense
|
(2,307,727 | ) | (3,072,591 | ) | ||||||||||||
|
Interest expense and similar charges
|
(21,056,577 | ) | (23,920,100 | ) | ||||||||||||
|
Third-party input
|
(6,106,901 | ) | (5,673,440 | ) | ||||||||||||
|
Materials, energy and others
|
(553,022 | ) | (546,460 | ) | ||||||||||||
|
Third-party services
|
(4,429,375 | ) | (4,148,569 | ) | ||||||||||||
|
Impairment of assets
|
(38,352 | ) | (38,605 | ) | ||||||||||||
|
Other
|
(1,086,152 | ) | (939,806 | ) | ||||||||||||
|
Gross added value
|
14,306,662 | 16,867,938 | ||||||||||||||
|
Retention
|
||||||||||||||||
|
Depreciation and amortization
|
(1,200,874 | ) | (1,000,387 | ) | ||||||||||||
|
Added value produced
|
13,105,788 | 15,867,551 | ||||||||||||||
|
Added value received from transfer
|
||||||||||||||||
|
Investments in affiliates and subsidiaries
|
73,322 | 54,216 | ||||||||||||||
|
Added value to distribute
|
13,179,110 | 15,921,767 | ||||||||||||||
|
Added value distribution
|
||||||||||||||||
|
Employee
|
6,203,194 | 47.1 | % | 5,800,901 | 36.4 | % | ||||||||||
|
Compensation
|
4,425,379 | 4,263,493 | ||||||||||||||
|
Benefits
|
1,095,961 | 948,845 | ||||||||||||||
|
Government severance indemnity funds for employees - FGTS
|
330,532 | 318,505 | ||||||||||||||
|
Other
|
351,322 | 270,058 | ||||||||||||||
|
Taxes
|
920,176 | 7.0 | % | 1,907,413 | 12.0 | % | ||||||||||
|
Federal
|
865,847 | 1,221,375 | ||||||||||||||
|
State
|
1,005 | 50,529 | ||||||||||||||
|
Municipal
|
53,324 | 635,509 | ||||||||||||||
|
Compensation of third-party capital - rental
|
617,829 | 4.7 | % | 540,559 | 3.4 | % | ||||||||||
|
Remuneration of interest on capital
|
5,437,911 | 41.3 | % | 7,672,894 | 48.2 | % | ||||||||||
|
Dividends and interest on capital
|
2,178,950 | 2,901,160 | ||||||||||||||
|
Profit Reinvestment
|
3,248,343 | 4,763,806 | ||||||||||||||
|
Profit (loss) attributable to non-controlling interests
|
10,618 | 7,928 | ||||||||||||||
|
Total
|
13,179,110 | 100.0 | % | 15,921,767 | 100.0 | % | ||||||||||
In accordance with IFRS 8, an operating segment is a component of an entity:
(a) that engages in business activities from which it may earn revenues and incur expenses (including revenues and expenses relating to transactions with other components of the same entity),
(b) whose operating results are regularly reviewed by the entity’s chief operating decision maker to make decisions about resources to be allocated to the segment and assess its performance, and
(c) For which discrete financial information are available.
Based on these guidelines the Bank has identified, the following reportable operating segments:
• Commercial Banking,
• Global Wholesale Banking,
The Bank operates in Brazil and abroad, through the Cayman branch and its subsidiary in Spain, with Brazilian clients and therefore has no geographical segments.
The Commercial Banking segment encompasses the entire commercial banking business (except for the Corporate Banking business managed globally using the Global Relationship Model). The Global Wholesale Banking segment reflects the returns on the Global Corporate Banking business, those on Investment Banking and Markets worldwide, including all treasury departments and the equities business.
BANCO SANTANDER (BRASIL) S.A.
NOTES TO THE CONSOLIDATED FINANCIAL STATEMENTS
(Amounts in thousands of Brazilian Reais - R$, unless otherwise stated)
On December 17, 2013, was held the sale of Asset Management operations and disposal of all Santander Brasil Asset's shares, that up to September 2013 was allocated on Asset Management and Insurance segment. The gains/losses with the sale of Asset Management , thus the gains/losses of Santander Brasil Asset are recorded in "Discontinued Operations" on Commercial Banking segment, according to IFRS 5. With the sale of the Asset Management segment, would be more appropriate to its merger with the Commercial Banking segment. This retrospective amendment takes effect on the presentation of this note.
The income statements and other significant data are as follows:
|
Thousands of Reais
|
2013
|
|||||||||||
|
(Condensed) Income Statement
|
Commercial Banking
|
Global Wholesale Banking
|
Total
|
|||||||||
|
|
|
|
||||||||||
|
NET INTEREST INCOME
|
26,327,797 | 2,151,424 | 28,479,221 | |||||||||
|
Income from equity instruments
|
81,286 | - | 81,286 | |||||||||
|
Income from companies accounted for by the equity method
|
91,342 | - | 91,342 | |||||||||
|
Net fee and commission income
|
7,241,003 | 859,453 | 8,100,456 | |||||||||
|
Gains (losses) on financial assets and liabilities (net) and Exchange differences (net)
(1)
|
(1,316,450 | ) | 721,622 | (594,828 | ) | |||||||
|
Other operating income (expense)
|
(421,691 | ) | (23,197 | ) | (444,888 | ) | ||||||
|
TOTAL INCOME
|
32,003,287 | 3,709,302 | 35,712,589 | |||||||||
|
Personnel expenses
|
(6,455,616 | ) | (589,994 | ) | (7,045,610 | ) | ||||||
|
Other administrative expenses
|
(6,546,946 | ) | (257,804 | ) | (6,804,750 | ) | ||||||
|
Depreciation and amortization
|
(1,133,710 | ) | (118,206 | ) | (1,251,916 | ) | ||||||
|
Provisions (net)
|
(2,740,200 | ) | 47,382 | (2,692,818 | ) | |||||||
|
Impairment losses on financial assets (net)
|
(13,836,802 | ) | (281,269 | ) | (14,118,071 | ) | ||||||
|
Impairment losses on non-financial assets (net)
|
(343,560 | ) | (1,020 | ) | (344,580 | ) | ||||||
|
Other non-financial gains (losses)
|
563,413 | - | 563,413 | |||||||||
|
OPERATING PROFIT BEFORE TAX
(1)
|
1,509,866 | 2,508,391 | 4,018,257 | |||||||||
|
PROFIT FROM DISCONTINUED OPERATIONS
|
2,063,463 | - | 2,063,463 | |||||||||
|
|
||||||||||||
|
Other:
|
||||||||||||
|
Total assets
|
394,381,593 | 58,671,102 | 453,052,695 | |||||||||
|
Loans and advances to customers
|
168,475,404 | 44,258,923 | 212,734,327 | |||||||||
|
Customer deposits
|
182,451,259 | 17,704,418 | 200,155,677 | |||||||||
(1) Includes in the Commercial Bank, the fiscal hedge of investment in dollar (a strategy to mitigate the effects of fiscal and exchange rate variation of offshore investments on net income), the result of which is recorded in "Gains (losses) on financial assets and liabilities" fully offset in taxes line. Adjusted for losses amounting to R$2,367,430 due to the effects of the devaluation of the Real against the Dollar in 2013, the Profit before Tax for the Commercial Bank segment was R$3,877,296.
BANCO SANTANDER (BRASIL) S.A.
NOTES TO THE CONSOLIDATED FINANCIAL STATEMENTS
(Amounts in thousands of Brazilian Reais - R$, unless otherwise stated)
|
Thousands of Reais
|
2012
|
|||||||||||
|
(Condensed) Income Statement
|
Commercial Banking
|
Global Wholesale Banking
|
Total
|
|||||||||
|
|
|
|||||||||||
|
NET INTEREST INCOME
|
29,469,903 | 2,117,057 | 31,586,960 | |||||||||
|
Income from equity instruments
|
93,734 | - | 93,734 | |||||||||
|
Income from companies accounted for by the equity method
|
73,322 | - | 73,322 | |||||||||
|
Net fee and commission income
|
6,869,566 | 740,360 | 7,609,926 | |||||||||
|
Gains (losses) on financial assets and liabilities (net) and Exchange differences (net)
(1)
|
(649,842 | ) | 479,675 | (170,167 | ) | |||||||
|
Other operating income (expense)
|
(599,763 | ) | (23,730 | ) | (623,493 | ) | ||||||
|
TOTAL INCOME
|
35,256,920 | 3,313,362 | 38,570,282 | |||||||||
|
Personnel expenses
|
(6,545,799 | ) | (540,557 | ) | (7,086,356 | ) | ||||||
|
Other administrative expenses
|
(6,461,101 | ) | (225,276 | ) | (6,686,377 | ) | ||||||
|
Depreciation and amortization
|
(1,091,407 | ) | (109,468 | ) | (1,200,875 | ) | ||||||
|
Provisions (net)
|
(2,062,148 | ) | 5,542 | (2,056,606 | ) | |||||||
|
Impairment losses on financial assets (net)
|
(16,403,680 | ) | (71,916 | ) | (16,475,596 | ) | ||||||
|
Impairment losses on non-financial assets (net)
|
(38,352 | ) | - | (38,352 | ) | |||||||
|
Other non-financial gains (losses)
|
448,805 | - | 448,805 | |||||||||
|
OPERATING PROFIT BEFORE TAX
(1)
|
3,103,238 | 2,371,687 | 5,474,925 | |||||||||
|
PROFIT FROM DISCONTINUED OPERATIONS
|
55,313 | - | 55,313 | |||||||||
|
|
||||||||||||
|
Other:
|
||||||||||||
|
Total assets
|
369,824,459 | 52,783,404 | 422,607,863 | |||||||||
|
Loans and advances to customers
|
161,048,108 | 35,726,189 | 196,774,297 | |||||||||
|
Customer deposits
|
169,912,114 | 18,682,816 | 188,594,930 | |||||||||
(1) Includes in the Commercial Bank, the fiscal hedge of investment in dollar (a strategy to mitigate the effects of fiscal and exchange rate variation of offshore investments on net income), the result of which is recorded in "Gains (losses) on financial assets and liabilities" fully offset in taxes line. Adjusted for losses amounting to R$ 1,437,250 due to the effects of the devaluation of the Real against the Dollar in 2012, the Profit before Tax for the Commercial Bank segment was R$4,540,488.
|
Thousands of Reais
|
2011
|
|||||||||||
|
(Condensed) Income Statement
|
Commercial Banking
|
Global Wholesale Banking
|
Total
|
|||||||||
|
|
|
|||||||||||
|
NET INTEREST INCOME
|
25,207,007 | 2,589,070 | 27,796,077 | |||||||||
|
Income from equity instruments
|
93,611 | - | 93,611 | |||||||||
|
Income from companies accounted for by the equity method
|
54,216 | - | 54,216 | |||||||||
|
Net fee and commission income
|
6,403,091 | 796,350 | 7,199,441 | |||||||||
|
Gains (losses) on financial assets and liabilities (net) and Exchange differences (net)
|
(768,312 | ) | 513,041 | (255,271 | ) | |||||||
|
Other operating income (expense)
|
(348,397 | ) | (29,304 | ) | (377,701 | ) | ||||||
|
TOTAL INCOME
|
30,641,216 | 3,869,157 | 34,510,373 | |||||||||
|
Personnel expenses
|
(6,081,866 | ) | (525,525 | ) | (6,607,391 | ) | ||||||
|
Other administrative expenses
|
(5,933,361 | ) | (242,032 | ) | (6,175,393 | ) | ||||||
|
Depreciation and amortization
|
(894,608 | ) | (105,780 | ) | (1,000,388 | ) | ||||||
|
Provisions (net)
|
(2,988,192 | ) | 2,866 | (2,985,326 | ) | |||||||
|
Impairment losses on financial assets (net)
|
(9,334,483 | ) | (47,066 | ) | (9,381,549 | ) | ||||||
|
Impairment losses on non-financial assets (net)
|
(33,898 | ) | (4,707 | ) | (38,605 | ) | ||||||
|
Other non-financial gains (losses)
|
452,096 | - | 452,096 | |||||||||
|
OPERATING PROFIT BEFORE TAX
(1)
|
5,826,904 | 2,946,913 | 8,773,817 | |||||||||
|
PROFIT FROM DISCONTINUED OPERATIONS
|
74,238 | - | 74,238 | |||||||||
|
|
||||||||||||
|
Other:
|
||||||||||||
|
Total assets
|
349,533,565 | 51,045,367 | 400,578,932 | |||||||||
|
Loans and advances to customers
|
179,600,909 | 3,465,359 | 183,066,268 | |||||||||
|
Customer deposits
|
152,002,313 | 22,471,578 | 174,473,891 | |||||||||
(1) Includes in the Commercial Bank, the economic hedge of investment in dollar (a strategy to mitigate the effects of fiscal and exchange rate changes on investments offshore over the net income), which result is recorded in “Gains/losses on financial assets and liabilities (net)” fully offset the tax line. The effects of the devaluation of the Real against the Dollar in 2011 generated losses of R$1,646,212. The Profit before Tax for the Commercial Bank segment was R$7,473,116.
BANCO SANTANDER (BRASIL) S.A.
NOTES TO THE CONSOLIDATED FINANCIAL STATEMENTS
(Amounts in thousands of Brazilian Reais - R$, unless otherwise stated)
The parties related to the Bank are deemed to include, in addition to its subsidiaries, associates and jointly controlled entities, the Bank’s key management personnel and the entities over which the key management personnel may exercise significant influence or control.
Following is a detail of the business transactions performed by the Bank with its related parties on December 31, 2013, 2012 and 2011:
a) Key-person management compensation
The Board of Directors' meeting held on February 27, 2013, was approved in accordance with the Compensation and Appointment Committee the global compensation proposal of directors (Board of Directors and Executive Officers) for the year 2013, amounting to R$300,000, covering fixed remuneration, variable and equity-based and other benefits. The proposal was approved by the extraordinary stockholders' meeting held on April 29, 2013.
i) Long-term benefits
The Santander Brazil as well as Banco Santander Spain, as other subsidiaries of Santander Group, have long-term compensation programs tied to their share's performance, based on the achievement of goals.
ii) Short-term benefits
The following table shows the Board of Directors’ and Executive Board’s:
|
Thousands of Reais
|
2013
|
2012
|
2011
|
|||||||||
|
Fixed compensation
|
47,536 | 46,827 | 46,501 | |||||||||
|
Variable compensation
(1)
|
91,306 | 114,866 | 162,154 | |||||||||
|
Other
|
13,555 | 12,469 | 11,709 | |||||||||
|
Total Short-term benefits
|
152,397 | 174,162 | 220,364 | |||||||||
|
Share-based payment
(2) (3)
|
30,841 | 34,431 | 18,067 | |||||||||
|
Total Long-term benefits
|
30,841 | 34,431 | 18,067 | |||||||||
|
Total
(4)
|
183,238 | 208,593 | 238,431 | |||||||||
(1) In 2011, includes the share incurred with the changes in administrative structure and governance in the completion of the Bank's integration process.
(2) In October 25, 2011, the Bank launched a new plan based compensation for executives (note 13 c) in accordance with the Resolution of the CMN 3.921 of November 25, 2010.
(3) On May 02, 2013, was the granting of a new Share-based Compensation Plan for the executives (SOP 2013).
(4) Refers to the amount paid by Banco Santander to its executives officers for the positions which they hold in the Bank and other companies of the conglomerate. On the period of twelve months ended on December 31, 2013, was paid for managers of Santander Asset the amount of R$3,214 and in 2012 and 2011, were paid to managers of Zurich Santander Brasil Seguros e Previdência S.A. and Santander Asset R$6,292 and R$8,312, respectively.
Additionally, on 2013, charges were collected on key-person management compensation in the amount of R$28,109 (2012 - R$46,001 and 2011 - R$22,205).
iii) Contract termination
The termination of the employment relationship for non-fulfillment of obligations or voluntarily does not entitle executives to any financial compensation.
b) Lending operations
Under current law, it is not granted loans or advances involving:
I - officers, members of board of directors and audit committee as well as their spouses and relatives up to the second degree;
II - individuals or legal entities of Banco Santander, which hold more than 10% of the share capital;
III -Legal entities which hold more than 10% of the share capital, Banco Santander and its subsidiaries;
IV - legal entities which hold more than 10% of the share capital, any of the directors or members of the Board of Directors and Audit Committee or management's own financial institution, as well as their spouses or relatives up to the second degree.
BANCO SANTANDER (BRASIL) S.A.
NOTES TO THE CONSOLIDATED FINANCIAL STATEMENTS
(Amounts in thousands of Brazilian Reais - R$, unless otherwise stated)
c) Ownership Interest
The table below shows the direct interest (common shares and preferred shares) as of December 31, 2013, 2012 and 2011:
|
|
2013
|
|||||||||||||||||||||||
|
|
Common
|
Preferred
|
Total
|
|||||||||||||||||||||
|
Shares
|
Common
|
Shares
|
Preferred
|
Shares
|
Total
|
|||||||||||||||||||
|
Stockholders'
|
(thousands)
|
Shares (%)
|
(thousands)
|
Shares (%)
|
(thousands)
|
Shares (%)
|
||||||||||||||||||
|
Grupo Empresarial Santander, S.L.
(1)
|
61,350,950 | 28.8 | % | 51,153,553 | 27.5 | % | 112,504,503 | 28.2 | % | |||||||||||||||
|
Sterrebeeck B.V.
(1)
|
99,527,083 | 46.8 | % | 86,492,330 | 46.5 | % | 186,019,413 | 46.6 | % | |||||||||||||||
|
Santander Insurance Holding
(1)
|
206,664 | 0.1 | % | - | 0.0 | % | 206,664 | 0.1 | % | |||||||||||||||
|
Qatar Holding, LLC
|
10,805,397 | 5.1 | % | 9,823,089 | 5.3 | % | 20,628,486 | 5.1 | % | |||||||||||||||
|
Employees
|
154,108 | 0.1 | % | 141,276 | 0.1 | % | 295,384 | 0.1 | % | |||||||||||||||
|
Members of the Board of Directors
|
( | *) | ( | *) | ( | *) | ( | *) | ( | *) | ( | *) | ||||||||||||
|
Members of the Executive Board
|
( | *) | ( | *) | ( | *) | ( | *) | ( | *) | ( | *) | ||||||||||||
|
Other
|
39,776,071 | 18.7 | % | 37,663,538 | 20.2 | % | 77,439,609 | 19.5 | % | |||||||||||||||
|
Total
|
211,820,273 | 185,273,786 | 397,094,059 | |||||||||||||||||||||
|
Treasury shares
|
1,021,459 | 0.4 | % | 928,599 | 0.4 | % | 1,950,058 | 0.4 | % | |||||||||||||||
|
Total
|
212,841,732 | 100.0 | % | 186,202,385 | 100.0 | % | 399,044,117 | 100.0 | % | |||||||||||||||
| 2012 | ||||||||||||||||||||||||
|
|
Common
|
Preferred
|
Total
|
|||||||||||||||||||||
|
Shares
|
Common
|
Shares
|
Preferred
|
Shares
|
Total
|
|||||||||||||||||||
|
Stockholders'
|
(thousands)
|
Shares (%)
|
(thousands)
|
Shares (%)
|
(thousands)
|
Shares (%)
|
||||||||||||||||||
|
Grupo Empresarial Santander, S.L.
(1)
|
61,606,700 | 28.9 | % | 51,386,053 | 27.6 | % | 112,992,753 | 28.3 | % | |||||||||||||||
|
Sterrebeeck B.V.
(1)
|
99,527,083 | 46.8 | % | 86,492,330 | 46.5 | % | 186,019,413 | 46.6 | % | |||||||||||||||
|
Santander Insurance Holding
(1)
|
206,664 | 0.1 | % | - | 0.0 | % | 206,664 | 0.1 | % | |||||||||||||||
|
Employees
|
173,703 | 0.1 | % | 159,213 | 0.1 | % | 332,916 | 0.1 | % | |||||||||||||||
|
Members of the Board of Directors
|
( | *) | ( | *) | ( | *) | ( | *) | ( | *) | ( | *) | ||||||||||||
|
Members of the Executive Board
|
( | *) | ( | *) | ( | *) | ( | *) | ( | *) | ( | *) | ||||||||||||
|
Other
|
50,758,700 | 23.8 | % | 47,647,623 | 25.6 | % | 98,406,323 | 24.7 | % | |||||||||||||||
|
Total
|
212,272,850 | 185,685,219 | 397,958,069 | |||||||||||||||||||||
|
Treasury shares
|
568,882 | 0.3 | % | 517,166 | 0.3 | % | 1,086,048 | 0.3 | % | |||||||||||||||
|
Total
|
212,841,732 | 100.0 | % | 186,202,385 | 100.0 | % | 399,044,117 | 100.0 | % | |||||||||||||||
| 2011 | ||||||||||||||||||||||||
|
|
Common
|
Preferred
|
Total
|
|||||||||||||||||||||
|
Shares
|
Common
|
Shares
|
Preferred
|
Shares
|
Total
|
|||||||||||||||||||
|
Stockholders'
|
(thousands)
|
Shares (%)
|
(thousands)
|
Shares (%)
|
(thousands)
|
Shares (%)
|
||||||||||||||||||
|
Grupo Empresarial Santander, S.L.
(1)
|
72,876,994 | 34.3 | % | 61,631,776 | 33.2 | % | 134,508,770 | 33.8 | % | |||||||||||||||
|
Sterrebeeck B.V.
(1)
|
99,527,083 | 46.8 | % | 86,492,330 | 46.5 | % | 186,019,413 | 46.6 | % | |||||||||||||||
|
Banco Santander, S.A.
(1)
|
2,090,231 | 1.0 | % | 1,900,210 | 1.0 | % | 3,990,441 | 1.0 | % | |||||||||||||||
|
Santander Insurance Holding
(1)
|
206,664 | 0.1 | % | - | 0.0 | % | 206,664 | 0.1 | % | |||||||||||||||
|
Employees
|
211,427 | 0.1 | % | 193,458 | 0.1 | % | 404,885 | 0.1 | % | |||||||||||||||
|
Members of the Board of Directors
|
( | *) | ( | *) | ( | *) | ( | *) | ( | *) | ( | *) | ||||||||||||
|
Members of the Executive Board
|
( | *) | ( | *) | ( | *) | ( | *) | ( | *) | ( | *) | ||||||||||||
|
Other
|
37,538,079 | 17.5 | % | 35,628,926 | 19.0 | % | 73,167,005 | 18.2 | % | |||||||||||||||
|
Total
|
212,450,478 | 185,846,700 | 398,297,178 | |||||||||||||||||||||
|
Treasury shares
|
391,254 | 0.2 | % | 355,685 | 0.2 | % | 746,939 | 0.2 | % | |||||||||||||||
|
Total
|
212,841,732 | 100.0 | % | 186,202,385 | 100.0 | % | 399,044,117 | 100.0 | % | |||||||||||||||
(1) Companies of the Santander Spain Group.
(*) None of the members of the Board of Directors and the Executive Board holds 1.0% or more of any class of shares.
BANCO SANTANDER (BRASIL) S.A.
NOTES TO THE CONSOLIDATED FINANCIAL STATEMENTS
(Amounts in thousands of Brazilian Reais - R$, unless otherwise stated)
c.1 Excercise of the exchange rights by the Qatar Holding Luxembourg II S.A.R.L.
On October 29, 2013, Qatar Holding Luxembourg II S.À R.L. (“QHL”) exercised its exchange rights related to the mandatorily exchangeable bonds in the total amount of US$2,718,800, acquired pursuant to the purchase agreement, dated October 28, 2010, entered into between Banco Santander Spain, as issuer, and QHL, as purchaser.
As a result of QHL’s exercise of its exchange rights, on November 7, 2013, Qatar Holding received from Banco Santander Spain 190,030,195 ADR issued by Banco Santander. Therefore, and considering the 6,431,575 ADR issued by Banco Santander currently held directly or indirectly by Qatar Holding up to November 7, 2013, QHL (together with its controlling shareholders, controlled and commonly controlled entities) holds a total of 196,461,770 ADR of Banco Santander as of the date thereof, which represents 5.08% of the common shares and 5.28% of the preferred shares of the Bank.
The exercise exchange rights by QHL, not imply an increase in the Banco Santander's free float.
c.2 Bank Santander Spain's ADRs Sales and Free Float Increase
On March 22, 2012 Banco Santander Spain informed to Banco Santander that, in fulfillment of Exchange Commission (CVM) Instruction No. 358/2002, and in accordance to the commitment of reaching the free-float of 25% of the capital stock of Banco Santander, it reduced its interest in the capital stock of Banco Santander by 5.76%, which resulted in the increase of the free-float of the Banco Santander to 24.12% at the moment. Such reduction of 5.76% (5.66% of common shares and 5.88% of preferred shares) was a result of the following transactions: (i) the transfer of 4.41% of Banco Santander’s capital stock carried out in January 2012, (ii) the sale of 0.58% of the capital stock of Banco Santander carried out until March 22, 2012, and (iii) the transfer of 0.77% of Banco Santander´s capital stock carried out on March 22, 2012 to a third party, which shall deliver such interest to the investors of the exchangeable bonds issued by Santander Spain in October, 2010, on maturity and as provided in such bonds.
c.3 Extension of time to reach the minimum percentage of outstanding shares (free float)
On October 10 and 11, 2013 were published Notices to the Market in order to inform to the shareholders that on October 8, 2013 the BM&FBovespa granted the claim by Banco Santander and its majority shareholders to (i) prorogate the period for reaching the minimum free float, until October 7, 2014; and (ii) to reduce the actual free float, of 24.6%, down to 22.5%, exclusively in the context of: (a)the Buyback Program of depositary share certificates (“Units”) or American Depositary Receipts (“ADRs”); and (b) acquisitions abroad, by Banco Santander, S.A., or an affiliated entity of the economic group, of ADRs issued by the Company. Such authorization does not interfere in the obligation undertook by Banco Santander to reach a free float of 25% until October 7, 2014, as set forth in the Agreement for Adoption of Corporate Governance Level 2 Practices.
d) Related-Party Transactions
The transactions and compensation for services among Banco Santander companies are carried out under usual market value, rates and terms, and under commutativity condition.
Santander has the Policy on Related Party Transactions approved by the Board of Directors, which aim to ensure that all transactions are made on the policy typified in view the interests of Banco Santander and its stockholders'. The policy defines powers to approve certain transactions by the Board of Directors. The rules laid down are also applied to all employees and directors of Banco Santander and its subsidiaries.
BANCO SANTANDER (BRASIL) S.A.
NOTES TO THE CONSOLIDATED FINANCIAL STATEMENTS
(Amounts in thousands of Brazilian Reais - R$, unless otherwise stated)
The principal transactions and balances are as follows:
|
Thousands of Reais
|
|
2013
|
||||||||||
|
Parent
(1)
|
Joint-controlled
companies
|
Other Related-Party
(2)
|
||||||||||
|
Assets
|
11,869,737 | 1,106,698 | 217,445 | |||||||||
|
Trading derivatives, net
|
(74,519 | ) | - | (271,527 | ) | |||||||
|
Banco Santander, S.A. – Spain
|
(74,519 | ) | - | - | ||||||||
|
Santander Benelux, S.A., N.V.
|
- | - | (91,959 | ) | ||||||||
|
Abbey National Treasury Services Plc
|
- | - | (61,885 | ) | ||||||||
|
Real Fundo de Investimento
|
- | - | (117,683 | ) | ||||||||
|
Loans and other values with credit institutions - Cash and overnight operations in foreign currency
|
11,935,149 | - | 39,329 | |||||||||
|
Banco Santander, S.A. – Spain
(3) (5) (6)
|
11,935,149 | - | - | |||||||||
|
Banco Santander Totta, S.A.
|
- | - | 1,167 | |||||||||
|
Abbey National Treasury Services Plc
|
- | - | 18,998 | |||||||||
|
Santander Benelux, S.A., N.V.
|
- | - | 19,162 | |||||||||
|
Banco Santander, S.A. – México
|
- | - | 2 | |||||||||
|
Loans and other values with customers
|
- | - | 47,545 | |||||||||
|
Zurich Santander Brasil Seguros S.A.
|
- | - | 43,865 | |||||||||
|
Zurich Santander Brasil Seguros e Previdência S.A.
|
- | - | 3,680 | |||||||||
|
Loans and other values with credit institutions
(1)
|
9,007 | 1,105,765 | 3,053 | |||||||||
|
Banco Santander – Spain
|
9,007 | - | - | |||||||||
|
Companhia de Crédito, Financiamento e Investimento RCI Brasil
|
- | 1,105,425 | - | |||||||||
|
Companhia de Arrendamento Mercantil RCI Brasil
|
- | 340 | - | |||||||||
|
Santander Brasil Asset
|
- | - | 3,053 | |||||||||
|
Other Assets
|
100 | 933 | 399,045 | |||||||||
|
Banco Santander – Spain
|
100 | - | - | |||||||||
|
Companhia de Crédito, Financiamento e Investimento RCI Brasil
|
- | 933 | - | |||||||||
|
Zurich Santander Brasil Seguros e Previdência S.A.
|
- | - | 399,045 | |||||||||
|
Liabilities
|
(1,242,870 | ) | (165,005 | ) | (723,748 | ) | ||||||
|
Deposits from credit institutions
|
(130,451 | ) | (31,738 | ) | (444,141 | ) | ||||||
|
Banco Santander, S.A. – Spain
(4)
|
(130,451 | ) | - | - | ||||||||
|
Companhia de Crédito, Financiamento e Investimento RCI Brasil
|
- | (21,473 | ) | - | ||||||||
|
Santander Brasil Asset
|
- | - | (170,914 | ) | ||||||||
|
Real Fundo de Investimento Multimercado Santillana Credito Privado
|
- | - | (258,548 | ) | ||||||||
|
Banco Santander, S.A. – Uruguay
|
- | - | (13,986 | ) | ||||||||
|
Companhia de Arrendamento Mercantil RCI Brasil
|
- | (10,265 | ) | - | ||||||||
|
Others
|
- | - | (693 | ) | ||||||||
|
Marketable debt securities
|
(20,413 | ) | - | - | ||||||||
|
Banco Santander, S.A. – Spain
(7)
|
(20,413 | ) | - | - | ||||||||
|
Customer deposits
|
- | (133,267 | ) | (273,531 | ) | |||||||
|
ISBAN Brasil S.A.
|
- | - | (101,391 | ) | ||||||||
|
Produban Serviços de Informática S.A.
|
- | - | (48,110 | ) | ||||||||
|
Zurich Santander Brasil Seguros e Previdência S.A.
|
- | - | (84,117 | ) | ||||||||
|
Santander Brasil Gestão de Recursos Ltda
|
- | - | (27,062 | ) | ||||||||
|
Webmotors S.A.
|
- | (133,267 | ) | - | ||||||||
|
Others
|
- | - | (12,851 | ) | ||||||||
|
Other Liabilities - Dividends and interest on capital Payable
|
(1,089,328 | ) | - | (5,735 | ) | |||||||
|
Grupo Empresarial Santander, S.L.
(1)
|
(410,283 | ) | - | - | ||||||||
|
Santander Insurance Holding, S.L.
|
- | - | (721 | ) | ||||||||
|
Sterrebeeck B.V.
(1)
|
(679,045 | ) | - | - | ||||||||
|
Banco Madesant - Sociedade Unipessoal, S.A.
|
- | - | (365 | ) | ||||||||
|
Santusa Holding, S.L.
|
- | - | (4,649 | ) | ||||||||
|
Other Payables
|
(2,678 | ) | - | (341 | ) | |||||||
|
Banco Santander – Spain
|
(2,678 | ) | - | - | ||||||||
|
ISBAN Brasil S.A.
|
- | - | (103 | ) | ||||||||
|
Produban Serviços de Informática S.A.
|
- | - | (70 | ) | ||||||||
|
Zurich Santander Brasil Seguros e Previdência S.A.
|
- | - | (35 | ) | ||||||||
|
Santander Brasil Asset
|
- | - | (117 | ) | ||||||||
|
Others
|
- | - | (16 | ) | ||||||||
BANCO SANTANDER (BRASIL) S.A.
NOTES TO THE CONSOLIDATED FINANCIAL STATEMENTS
(Amounts in thousands of Brazilian Reais - R$, unless otherwise stated)
|
Thousands of Reais
|
2012
|
|||||||||||
|
Parent
(1)
|
Joint-controlled
companies
|
Other Related-Party
(2)
|
||||||||||
|
Assets
|
9,487,641 | 1,087,901 | (163,065 | ) | ||||||||
|
Trading derivatives, net
|
(135,291 | ) | - | (742,972 | ) | |||||||
|
Banco Santander, S.A. – Spain
|
(135,291 | ) | - | - | ||||||||
|
Santander Benelux, S.A., N.V.
|
- | - | (399,110 | ) | ||||||||
|
Abbey National Treasury Services Plc
|
- | - | (68,552 | ) | ||||||||
|
Real Fundo de Investimento Multimercado Santillana Credito Privado
|
- | - | (275,310 | ) | ||||||||
|
Loans and other values with credit institutions - Cash and overnight operations in foreign currency
|
9,615,489 | - | 318,423 | |||||||||
|
Banco Santander, S.A. – Spain
(3)
|
9,615,489 | - | - | |||||||||
|
Banco Santander Totta, S.A.
|
- | - | 1,139 | |||||||||
|
Santander Benelux, S.A., N.V.
|
- | - | 317,233 | |||||||||
|
Banco Santander, S.A. – México
|
- | - | 51 | |||||||||
|
Loans and other values with customers
|
- | - | 93,391 | |||||||||
|
Zurich Santander Brasil Seguros S.A.
|
- | - | 75,445 | |||||||||
|
Zurich Santander Brasil Seguros e Previdência S.A.
|
- | - | 17,946 | |||||||||
|
Loans and other values with credit institutions
(1)
|
7,284 | 1,087,129 | 34,024 | |||||||||
|
Banco Santander – Spain
|
7,284 | - | - | |||||||||
|
Abbey National Treasury Services Plc
|
- | - | 34,024 | |||||||||
|
Companhia de Crédito, Financiamento e Investimento RCI Brasil
|
- | 1,086,756 | - | |||||||||
|
Companhia de Arrendamento Mercantil RCI Brasil
|
- | 373 | - | |||||||||
|
Other Assets
|
159 | 772 | 134,069 | |||||||||
|
Banco Santander – Spain
|
159 | - | - | |||||||||
|
Companhia de Crédito, Financiamento e Investimento RCI Brasil
|
- | 772 | - | |||||||||
|
Zurich Santander Brasil Seguros e Previdência S.A.
|
- | - | 134,007 | |||||||||
|
Others
|
- | - | 62 | |||||||||
|
Liabilities
|
(939,913 | ) | (16,280 | ) | (447,091 | ) | ||||||
|
Deposits from credit institutions
|
(154,635 | ) | (16,280 | ) | (244,702 | ) | ||||||
|
Banco Santander, S.A. – Spain
(4)
|
(154,635 | ) | - | - | ||||||||
|
Companhia de Crédito, Financiamento e Investimento RCI Brasil
|
- | (12,762 | ) | - | ||||||||
|
Companhia de Arrendamento Mercantil RCI Brasil
|
- | (3,518 | ) | - | ||||||||
|
Real Fundo de Investimento Multimercado Santillana Credito Privado
|
- | - | (239,067 | ) | ||||||||
|
Banco Santander, S.A. – Uruguay
|
- | - | (5,239 | ) | ||||||||
|
Others
|
- | - | (396 | ) | ||||||||
|
Marketable debt securities
|
(16,210 | ) | - | - | ||||||||
|
Banco Santander, S.A. – Spain
(7)
|
(16,210 | ) | - | - | ||||||||
|
Customer deposits
|
- | - | (176,821 | ) | ||||||||
|
ISBAN Brasil S.A.
|
- | - | (98,324 | ) | ||||||||
|
Produban Serviços de Informática S.A.
|
- | - | (43,528 | ) | ||||||||
|
Zurich Santander Brasil Seguros e Previdência S.A.
|
- | - | (29,190 | ) | ||||||||
|
Others
|
- | - | (5,779 | ) | ||||||||
|
Other Liabilities - Dividends and interest on capital Payable
|
(765,524 | ) | - | (562 | ) | |||||||
|
Grupo Empresarial Santander, S.L.
(1)
|
(236,246 | ) | - | - | ||||||||
|
Santander Insurance Holding, S.L.
|
- | - | (562 | ) | ||||||||
|
Sterrebeeck B.V.
(1)
|
(529,278 | ) | - | - | ||||||||
|
Other Payables
|
(3,544 | ) | - | (25,006 | ) | |||||||
|
Banco Santander – Spain
|
(3,544 | ) | - | - | ||||||||
|
Produban Serviços de Informática S.A.
|
- | - | (55 | ) | ||||||||
|
Zurich Santander Brasil Seguros e Previdência S.A.
|
- | - | (24,079 | ) | ||||||||
|
Others
|
- | - | (872 | ) | ||||||||
BANCO SANTANDER (BRASIL) S.A.
NOTES TO THE CONSOLIDATED FINANCIAL STATEMENTS
(Amounts in thousands of Brazilian Reais - R$, unless otherwise stated)
|
Thousands of Reais
|
|
2011
|
||||||||||
|
|
Parent
(1)
|
Joint-controlled
companies
|
Other Related-Party
(2)
|
|||||||||
|
Assets
|
303,062 | 823,543 | 209,040 | |||||||||
|
Trading derivatives, net
|
(25,639 | ) | - | (442,496 | ) | |||||||
|
Banco Santander, S.A. – Spain
|
(25,639 | ) | - | - | ||||||||
|
Santander Benelux, S.A., N.V.
|
- | - | (308,821 | ) | ||||||||
|
Abbey National Treasury Services Plc
|
- | - | (39,102 | ) | ||||||||
|
Real Fundo de Investimento Multimercado Santillana Credito Privado
|
- | - | (94,573 | ) | ||||||||
|
Loans and amounts due from credit institutions - Cash and overnight operations in foreign currency
|
227,724 | - | 263,915 | |||||||||
|
Banco Santander, S.A. – Spain
(3) (6)
|
227,724 | - | - | |||||||||
|
Banco Santander Totta, S.A.
|
- | - | 1,097 | |||||||||
|
Santander Benelux, S.A., N.V.
|
- | - | 262,818 | |||||||||
|
Loans and other values with customers
|
- | - | 56,561 | |||||||||
|
Zurich Santander Brasil Seguros S.A.
|
- | - | 56,561 | |||||||||
|
Loans and amounts due from credit institutions
(1)
|
95,539 | 822,928 | 3,750 | |||||||||
|
Banco Santander, S.A. – Spain
|
95,539 | - | - | |||||||||
|
Companhia de Crédito, Financiamento e Investimento RCI Brasil
|
- | 822,606 | - | |||||||||
|
Companhia de Arrendamento Mercantil RCI Brasil
|
- | 322 | - | |||||||||
|
Abbey National Treasury Services Plc
|
- | - | 1,369 | |||||||||
|
Santander Overseas Bank, Inc – Puerto Rico
|
- | - | 2,381 | |||||||||
|
Other Assets
|
5,438 | 615 | 327,310 | |||||||||
|
Banco Santander, S.A. – Spain
|
5,438 | - | - | |||||||||
|
Companhia de Crédito, Financiamento e Investimento RCI Brasil
|
- | 615 | - | |||||||||
|
Zurich Santander Brasil Seguros e Previdência S.A.
|
- | - | 326,637 | |||||||||
|
Others
|
- | - | 673 | |||||||||
|
Liabilities
|
(2,112,183 | ) | (15,213 | ) | (689,715 | ) | ||||||
|
Deposits from credit institutions
|
(1,200,207 | ) | (15,213 | ) | (394,738 | ) | ||||||
|
Banco Santander, S.A. – Spain
(4)
|
(1,200,207 | ) | - | - | ||||||||
|
Grupo Banesto: Sociedades consolidables
|
- | - | (167,081 | ) | ||||||||
|
Companhia de Crédito, Financiamento e Investimento RCI Brasil
|
- | (10,348 | ) | - | ||||||||
|
Real Fundo de Investimento Multimercado Santillana Credito Privado
|
- | - | (223,367 | ) | ||||||||
|
Companhia de Arrendamento Mercantil RCI Brasil
|
- | (4,865 | ) | - | ||||||||
|
Banco Santander, S.A. – Uruguay
|
- | - | (4,057 | ) | ||||||||
|
Others
|
- | - | (233 | ) | ||||||||
|
Customer deposits
|
- | - | (205,383 | ) | ||||||||
|
ISBAN Brasil S.A.
|
- | - | (110,341 | ) | ||||||||
|
Produban Serviços de Informática S.A.
|
- | - | (47,970 | ) | ||||||||
|
Zurich Santander Brasil Seguros e Previdência S.A.
|
- | - | (31,062 | ) | ||||||||
|
Others
|
- | - | (16,010 | ) | ||||||||
|
Other Liabilities - Dividends and Bonuses Payable
|
(908,004 | ) | - | (3,615 | ) | |||||||
|
Banco Santander, S.A. – Spain
|
(7,772 | ) | - | - | ||||||||
|
Grupo Empresarial Santander, S.L.
(1)
|
(379,617 | ) | - | - | ||||||||
|
Santander Insurance Holding, S.L.
|
- | - | (553 | ) | ||||||||
|
Sterrebeeck B.V.
(1)
|
(520,615 | ) | - | - | ||||||||
|
Banco Madesant - Sociedade Unipessoal, S.A.
|
- | - | (3,062 | ) | ||||||||
|
Other Payables
|
(3,972 | ) | - | (85,979 | ) | |||||||
|
Banco Santander, S.A. – Spain
|
(3,972 | ) | - | - | ||||||||
|
Santander Insurance Holding, S.L.
|
- | - | (9,257 | ) | ||||||||
|
Zurich Santander Brasil Seguros e Previdência S.A.
|
- | - | (74,772 | ) | ||||||||
|
Others
|
- | - | (1,950 | ) | ||||||||
BANCO SANTANDER (BRASIL) S.A.
NOTES TO THE CONSOLIDATED FINANCIAL STATEMENTS
(Amounts in thousands of Brazilian Reais - R$, unless otherwise stated)
(*) All loans and amounts to related parties were made in our ordinary course of business and on sustainable basis, including interest rates and collateral and did not involve more than the normal risk of collectability or present other unfavorable features.
(1) Banco Santander (Brasil) S.A. is indirectly controlled by Banco Santander Spain (note 1-a), through its subsidiary Grupo Empresarial Santander, S.L. and Sterrebeeck B.V.
(2) Refers to the Company's subsidiaries (Banco Santander Spain).
(3) In December 31, 2012, refers to the cash of R$188,449 (2012 - R$ 83,027 e 2011 - R$227,724).
(4) As at December 31, 2013, refers to raising funds through operations transfers abroad amounting R$130,451, with maturity until October, 2018 and interest between 0.56% and 14.03%p.a. (2012 - R$154,635 with maturity until January, 2015 and interest between 0.39% and 5.82%p.a. e 2011 - R$1,200,207, with interest between 0.39% and 5.82% p.a.).
(5) On December 30, 2013, refers to investments in foreign currency (applications overnight): applications of Bank's Grand Cayman Branch, near the branch of Banco Santander Spain (New York) maturing on January 2, 2014 and interest 0.17% p.a., amounting R$10,438,660 (2012 - R$9,445,842 maturing on January 2, 2013 and interest between 0.17% and 0.10% p.a.).
(6) On December 31, 2013, refers to investments in foreign currency (applications overnight): applications of subsidiary Santander Brasil EFC with Banco Santander Spain, amounting R$1,186,856, maturing on January 2, 2014 and interest between 0.08% and 0.14% p.a.
(7) Refers the emissions of Eurobonds of Banco Santander (Brasil) and Grand Cayman Branch, maturing between March 18, 2014 and February 13, 2017 and interest between 2.34% p.a. and 8.00% p.a.
|
Thousands of Reais
|
|
2013
|
||||||||||
|
|
Parent
(1)
|
Joint-controlled
companies
|
Other Related-Party
(2)
|
|||||||||
|
Income
|
(292,372 | ) | 104,353 | 2,031,426 | ||||||||
|
Interest and similar income - Loans and amounts due from credit institutions
|
15,303 | 64,373 | 220 | |||||||||
|
Banco Santander, S.A. – Spain
|
15,303 | - | - | |||||||||
|
Abbey National Treasury Services Plc
|
- | - | 25 | |||||||||
|
Companhia de Crédito, Financiamento e Investimento RCI Brasil
|
- | 64,373 | - | |||||||||
|
Santander Benelux, S.A., N.V.
|
- | - | 195 | |||||||||
|
Interest expense and similar charges - Customer deposits
|
- | (7,119 | ) | (8,837 | ) | |||||||
|
ISBAN Brasil S.A.
|
- | - | (4,419 | ) | ||||||||
|
Produban Serviços de Informática S.A.
|
- | - | (2,944 | ) | ||||||||
|
Webmotors S.A.
|
- | (7,119 | ) | - | ||||||||
|
Others
|
- | - | (1,474 | ) | ||||||||
|
Interest expense and similar charges - Deposits from credit institutions
|
(25,897 | ) | (3,227 | ) | (19,669 | ) | ||||||
|
Banco Santander, S.A. – Spain
|
(25,897 | ) | - | - | ||||||||
|
Companhia de Crédito, Financiamento e Investimento RCI Brasil
|
- | (3,227 | ) | - | ||||||||
|
Real Fundo de Investimento Multimercado Santillana Credito Privado
|
- | - | (19,669 | ) | ||||||||
|
Others
|
- | - | - | |||||||||
|
Expense and similar charges - Marketable debt securities
|
(786 | ) | - | - | ||||||||
|
Banco Santander, S.A. – Spain
|
(786 | ) | - | - | ||||||||
|
Fee and commission income (expense)
|
(49,335 | ) | 26,265 | 142,543 | ||||||||
|
Companhia de Crédito, Financiamento e Investimento RCI Brasil
|
- | 13,925 | - | |||||||||
|
Companhia de Arrendamento Mercantil RCI Brasil
|
- | 4,045 | - | |||||||||
|
Banco Santander, S.A. – Spain
|
(49,335 | ) | - | - | ||||||||
|
Webmotors S.A.
|
- | 8,295 | - | |||||||||
|
Zurich Santander Brasil Seguros S.A.
|
- | - | 31,158 | |||||||||
|
Zurich Santander Brasil Seguros e Previdência S.A.
|
- | - | 111,385 | |||||||||
|
Gains (losses) on financial assets and liabilities (net) and exchange differences (net)
|
(231,543 | ) | 24,061 | 313,661 | ||||||||
|
Banco Santander, S.A. – Spain
|
(231,543 | ) | - | - | ||||||||
|
Santander Benelux, S.A., N.V.
|
- | - | 319,708 | |||||||||
|
Real Fundo de Investimento Multimercado Santillana Credito Privado
|
- | - | (16,120 | ) | ||||||||
|
Abbey National Treasury Services Plc
|
- | - | 4,015 | |||||||||
|
Companhia de Crédito, Financiamento e Investimento RCI Brasil
|
- | 19,546 | - | |||||||||
|
Webmotors S.A.
|
- | 4,515 | - | |||||||||
|
Others
|
- | - | 6,058 | |||||||||
BANCO SANTANDER (BRASIL) S.A.
NOTES TO THE CONSOLIDATED FINANCIAL STATEMENTS
(Amounts in thousands of Brazilian Reais - R$, unless otherwise stated)
|
Thousands of Reais
|
|
2013
|
||||||||||
|
|
Parent
(1)
|
Joint-controlled
companies
|
Other Related-Party
(2)
|
|||||||||
|
Administrative expenses and Amortization
|
(114 | ) | - | (436,182 | ) | |||||||
|
Banco Santander, S.A. – Spain
|
(114 | ) | - | - | ||||||||
|
ISBAN Brasil S.A.
|
- | - | (94,959 | ) | ||||||||
|
Produban Serviços de Informática S.A.
|
- | - | (150,598 | ) | ||||||||
|
Ingeniería de Software Bancario, S.L.
|
- | - | (32,353 | ) | ||||||||
|
Produban Servicios Informaticos Generales, S.L.
|
- | - | (24,429 | ) | ||||||||
|
TECBAN - Tecnologia Bancaria Brasil
|
- | - | (112,227 | ) | ||||||||
|
Konecta Brazil Outsourcing Ltda
|
- | - | (14,402 | ) | ||||||||
|
Others
|
- | - | (7,214 | ) | ||||||||
|
Others Administrative expenses - Donation
|
- | - | (20,168 | ) | ||||||||
|
Santander Cultural
|
- | - | (1,789 | ) | ||||||||
|
Fundacao Santander
|
- | - | (4,103 | ) | ||||||||
|
Instituto Escola Brasil
|
- | - | (2,276 | ) | ||||||||
|
Fundação Sudameris
|
- | - | (12,000 | ) | ||||||||
|
Gains (losses) on non-current assets held for sale not classified as discontinued operations
|
- | - | 2,059,858 | |||||||||
|
Capital Riesgo Global
(3)
|
- | - | 47,161 | |||||||||
|
Santander Brasil Gestão de Recursos Ltda
(4)
|
- | - | 2,007,838 | |||||||||
|
Santander Brasil Asset
|
- | - | 4,859 | |||||||||
|
Thousands of Reais
|
|
2012
|
||||||||||
|
|
Parent
(1)
|
Joint-controlled
companies
|
Other Related-Party
(2)
|
|||||||||
|
Income
|
(90,346 | ) | 74,851 | (742,313 | ) | |||||||
|
Interest and similar income - Loans and amounts due from credit institutions
|
10,393 | 59,546 | 487 | |||||||||
|
Banco Santander, S.A. – Spain
|
10,393 | - | - | |||||||||
|
Companhia de Crédito, Financiamento e Investimento RCI Brasil
|
- | 59,546 | - | |||||||||
|
Abbey National Treasury Services Plc
|
- | - | 35 | |||||||||
|
Santander Benelux, S.A., N.V.
|
- | - | 452 | |||||||||
|
Interest expense and similar charges - Customer deposits
|
- | - | (9,732 | ) | ||||||||
|
ISBAN Brasil S.A.
|
- | - | (5,697 | ) | ||||||||
|
Produban Serviços de Informática S.A.
|
- | - | (3,000 | ) | ||||||||
|
Others
|
- | - | (1,035 | ) | ||||||||
|
Interest expense and similar charges - Deposits from credit institutions
|
(38,515 | ) | (297 | ) | (6,927 | ) | ||||||
|
Banco Santander, S.A. – Spain
|
(38,515 | ) | - | - | ||||||||
|
Companhia de Crédito, Financiamento e Investimento RCI Brasil
|
- | (297 | ) | - | ||||||||
|
Real Fundo de Investimento Multimercado Santillana Credito Privado
|
- | - | (6,927 | ) | ||||||||
|
Others
|
- | - | - | |||||||||
|
Expense and similar charges - Marketable debt securities
|
(1,773 | ) | - | - | ||||||||
|
Banco Santander, S.A. – Spain
|
(1,773 | ) | - | - | ||||||||
|
Fee and commission income (expense)
|
(34,253 | ) | 15,602 | 127,215 | ||||||||
|
Companhia de Arrendamento Mercantil RCI Brasil
|
- | 4,586 | - | |||||||||
|
Companhia de Crédito, Financiamento e Investimento RCI Brasil
|
- | 11,016 | - | |||||||||
|
Banco Santander, S.A. – Spain
|
(34,253 | ) | - | - | ||||||||
|
Zurich Santander Brasil Seguros S.A.
|
- | - | 26,647 | |||||||||
|
Zurich Santander Brasil Seguros e Previdência S.A.
|
- | - | 99,665 | |||||||||
|
Others
|
- | - | 903 | |||||||||
|
Gains (losses) on financial assets and liabilities (net) and exchange differences (net)
|
(26,099 | ) | - | (407,267 | ) | |||||||
|
Banco Santander, S.A. – Spain
|
(26,099 | ) | - | - | ||||||||
|
Santander Benelux, S.A., N.V.
|
- | - | 81,575 | |||||||||
|
Real Fundo de Investimento Multimercado Santillana Credito Privado
|
- | - | (472,744 | ) | ||||||||
|
Abbey National Treasury Services Plc
|
- | - | (40,701 | ) | ||||||||
|
Others
|
- | - | 24,603 | |||||||||
BANCO SANTANDER (BRASIL) S.A.
NOTES TO THE CONSOLIDATED FINANCIAL STATEMENTS
(Amounts in thousands of Brazilian Reais - R$, unless otherwise stated)
|
Thousands of Reais
|
|
2012
|
||||||||||
|
|
Parent
(1)
|
Joint-controlled
companies
|
Other Related-Party
(2)
|
|||||||||
|
Administrative expenses and Amortization
|
(99 | ) | - | (428,062 | ) | |||||||
|
ISBAN Brasil S.A.
|
- | - | (90,283 | ) | ||||||||
|
Produban Serviços de Informática S.A.
|
- | - | (139,516 | ) | ||||||||
|
ISBAN Chile S.A.
|
- | - | (3,799 | ) | ||||||||
|
Banco Santander, S.A. – Spain
|
(99 | ) | - | - | ||||||||
|
Ingeniería de Software Bancario, S.L.
|
- | - | (41,442 | ) | ||||||||
|
Produban Servicios Informaticos Generales, S.L.
|
- | - | (24,707 | ) | ||||||||
|
TECBAN - Tecnologia Bancaria Brasil
|
- | - | (99,739 | ) | ||||||||
|
Zurich Santander Brasil Seguros S.A.
|
- | - | (915 | ) | ||||||||
|
Others
|
- | - | (27,661 | ) | ||||||||
|
Others Administrative expenses - Donation
|
- | - | (18,027 | ) | ||||||||
|
Santander Cultural
|
- | - | (3,800 | ) | ||||||||
|
Fundacao Santander
|
- | - | (3,000 | ) | ||||||||
|
Instituto Escola Brasil
|
- | - | (1,227 | ) | ||||||||
|
Fundação Sudameris
|
- | - | (10,000 | ) | ||||||||
|
Thousands of Reais
|
|
2011
|
||||||||||
|
|
Parent
(1)
|
Joint-controlled
companies
|
Other Related-Party
(2)
|
|||||||||
|
Income
|
(272,122 | ) | 69,935 | (369,496 | ) | |||||||
|
Interest and similar income - Loans and amounts due from credit institutions
|
5,046 | 50,771 | 267 | |||||||||
|
Banco Santander, S.A. – Spain
|
5,046 | - | - | |||||||||
|
Abbey National Treasury Services Plc
|
- | - | 14 | |||||||||
|
Companhia de Crédito, Financiamento e Investimento RCI Brasil
|
- | 50,771 | - | |||||||||
|
Santander Benelux, S.A., N.V.
|
- | - | 253 | |||||||||
|
Interest expense and similar charges - Customer deposits
|
- | - | (16,890 | ) | ||||||||
|
ISBAN Brasil S.A.
|
- | - | (10,551 | ) | ||||||||
|
Produban Serviços de Informática S.A.
|
- | - | (3,841 | ) | ||||||||
|
Others
|
- | - | (2,498 | ) | ||||||||
|
Interest expense and similar charges - Deposits from credit institutions
|
(15,311 | ) | (620 | ) | (26,821 | ) | ||||||
|
Banco Santander, S.A. – Spain
|
(15,311 | ) | - | - | ||||||||
|
Companhia de Crédito, Financiamento e Investimento RCI Brasil
|
- | (620 | ) | - | ||||||||
|
Real Fundo de Investimento Multimercado Santillana Credito Privado
|
- | - | (21,777 | ) | ||||||||
|
Banco Madesant - Sociedade Unipessoal, S.A.
|
- | - | (5,013 | ) | ||||||||
|
Others
|
- | - | (31 | ) | ||||||||
|
Expense and similar charges - Marketable debt securities
|
(1,789 | ) | - | - | ||||||||
|
Banco Santander, S.A. – Spain
|
(1,789 | ) | - | - | ||||||||
|
Fee and commission income (expense)
|
(14,820 | ) | 13,262 | 56,224 | ||||||||
|
Companhia de Crédito, Financiamento e Investimento RCI Brasil
|
- | 10,118 | - | |||||||||
|
Banco Santander, S.A. – Spain
|
(14,820 | ) | - | - | ||||||||
|
Aviación Centaurus, A.I.E.
|
- | - | 11,928 | |||||||||
|
Zurich Santander Brasil Seguros e Previdência S.A.
|
- | - | 35,785 | |||||||||
|
Others
|
- | 3,144 | 8,511 | |||||||||
|
Gains (losses) on financial assets and liabilities (net)
|
(245,096 | ) | 6,522 | (505,726 | ) | |||||||
|
Banco Santander, S.A. – Spain
|
(245,096 | ) | - | - | ||||||||
|
Santander Benelux, S.A., N.V.
|
- | - | (38,238 | ) | ||||||||
|
Santander Overseas Bank, Inc – Puerto Rico
|
- | - | 160 | |||||||||
|
Real Fundo de Investimento Multimercado Santillana Credito Privado
|
- | - | (342,975 | ) | ||||||||
|
Abbey National Treasury Services Plc
|
- | - | (91,726 | ) | ||||||||
|
Santander Insurance Holding, S.L.
|
- | - | (11,714 | ) | ||||||||
|
Companhia de Crédito, Financiamento e Investimento RCI Brasil
|
- | 6,522 | - | |||||||||
|
Others
|
- | - | (21,233 | ) | ||||||||
BANCO SANTANDER (BRASIL) S.A.
NOTES TO THE CONSOLIDATED FINANCIAL STATEMENTS
(Amounts in thousands of Brazilian Reais - R$, unless otherwise stated)
|
Thousands of Reais
|
|
2011
|
||||||||||
|
|
Parent
(1)
|
Joint-controlled
companies
|
Other Related-Party
(2)
|
|||||||||
|
Administrative expenses and Amortization
|
(152 | ) | - | (278,679 | ) | |||||||
|
ISBAN Brasil S.A.
|
- | - | (54,104 | ) | ||||||||
|
Produban Serviços de Informática S.A.
|
- | - | (103,991 | ) | ||||||||
|
ISBAN Chile S.A.
|
- | - | (4,814 | ) | ||||||||
|
Aquanima Brasil Ltda.
|
- | - | (21,500 | ) | ||||||||
|
Ingeniería de Software Bancario, S.L.
|
- | - | (32,209 | ) | ||||||||
|
Produban Servicios Informaticos Generales, S.L.
|
- | - | (23,629 | ) | ||||||||
|
Zurich Santander Brasil Seguros e Previdência S.A.
|
- | - | (89 | ) | ||||||||
|
Zurich Santander Insurance America, S.L.
|
- | - | (12,151 | ) | ||||||||
|
Others
|
(152 | ) | - | (26,192 | ) | |||||||
|
Others Administrative expenses - Donation
|
- | - | (22,163 | ) | ||||||||
|
Santander Cultural
|
- | - | (4,569 | ) | ||||||||
|
Fundacao Santander
|
- | - | (8,117 | ) | ||||||||
|
Instituto Escola Brasil
|
- | - | (1,477 | ) | ||||||||
|
Fundação Sudameris
|
- | - | (8,000 | ) | ||||||||
|
Gains (losses) on non-current assets held for sale not classified as discontinued operations
|
- | - | 424,292 | |||||||||
|
Zurich Santander Insurance America, S.L.
|
- | - | 424,292 | |||||||||
(
1) Banco Santander (Brasil) S.A. is indirectly controlled by Banco Santander Spain, through its subsidiary Grupo Empresarial Santander, S.L. and Sterrebeeck B.V.
(2) Refers to the Company's subsidiaries (Banco Santander, S.A .- Spain).
(3) Refers the profit on disposal of the company MS Participações.
(4) Refers the profit on disposal of the Santander Brasil Asset Management and of Investment Fund Management and Managed Portfolio Operations (note 3).
Risk management at Banco Santander follows the same principles that are defined for the Group worldwide, with:
• Independence of the risk function with respect to the business. The head of the Bank’s Risk Division, reports directly to the executive committee and the board. The local risk unit keeps its independence with a direct report to the Corporate Risk Unit.
• Commitment to support the business, contributing, without ignoring the previous principle, to the achievement of business objectives while maintaining quality of risk. For this, the organizational structure of risk seeking cooperation between business managers and risk.
• Collective decisions (even at branches level), which ensures that different, avoiding individual decisions.
• Well-established tradition of using statistical tools to predict losses due to default, as internal rating, credit scoring and scoring behavior, return on risk-adjusted capital (RORAC), value-at-risk (VaR), economic capital, extreme scenario analyses, etc.
• Global focus, through the integrated treatment of all risk factors in all business units and by using the concept of economic capital as a homogeneous measure of the risk assumed and the basis for assessing the management performed.
• Maintenance of a medium-low risk profile, and low volatility by:
- seeking to a high degree of risk diversification, thus limiting risk concentration on customers,
- maintaining a low level of complexity in market operations;
- ongoing attention to monitoring risks to prevent possible impairment of portfolios.
At Bank, the risk management and control process has been structured using as reference the framework defined at corporate level and described according to the following phases:
• Adaptation of corporate management frameworks and policies that reflect Group Santander’s risk management principles.
Within this regulatory framework, the Corporate Risk Management Framework, approved by Senior Management (Risks), regulates the principles and standards governing the Santander Brazil´s risk activities, based on the corporate organizational and a management models.
The organizational model comprises the management map, the risk function and governance, and the regulatory framework itself. The management model contains the basic pillars for risk management, the channels for the planning and setting of targets, the budgeting and risk limit setting process, the control of operations, the framework for risk reporting to senior management and the technological reference model for risk management.
BANCO SANTANDER (BRASIL) S.A.
NOTES TO THE CONSOLIDATED FINANCIAL STATEMENTS
(Amounts in thousands of Brazilian Reais - R$, unless otherwise stated)
• Identification of risks, through the constant review and monitoring of exposures, the assessment of new products and businesses and the specific analysis of singular transactions;
• Measurement of risks using periodically tested methods and models;
• Preparation and distribution of a complete set of reports that are reviewed daily by the heads at all levels of Banco Santander management.
Implementation of a risk control system which checks, on a daily basis, the degree to which Bank´s risk profile matches the risk policies approved and the risk limits set. The most noteworthy corporate tools and techniques (abovementioned) already in use in Banco Santander are in different stages of maturity regarding the level of implementation and use in Bank. For wholesale segment, these techniques are quite in line with the corporate level development. For local segments, internal ratings and scorings based models, VaR and market risk scenario analysis and stress testing have been already embedded in risk management routine while Expected loss, Economic Capital and RORAC have been integrated in risk management.
• Internal ratings- and scorings-based models which, by assessing the various qualitative and quantitative risk components by customer and transaction, make it possible to estimate, firstly, the probability of default and, subsequently, the expected loss, based on Loss Given Default (LGD) estimates.
• Economic capital, as a homogeneous measure of the risk assumed and a basis for the measurement of the management performance.
• RORAC, which is used both as a transaction pricing tool in the whole sale segment, more precisely in global ranking and markets(bottom-up approach) and in the analysis of portfolios and units (top-down approach).
• VaR, which is used for controlling and setting the market risk limits for the various treasury portfolios.
• Scenario analysis and stress testing to supplement the analysis market and credit risk in order assessing the impact of alternative scenarios, even on provisions and capital.
The Bank intends to use the internal models for the calculation of regulatory capital (regulatory) and for this has agreed a timetable with the local supervisor. The Bank has defined a Basel 2 governance structure and has assigned for this purpose, the necessary human and technology resources to meet the stringent requirements established by the regulators.
a) Corporate Governance of the Risk Function
The structure of the Banco Santander Risk Committee is defined in accordance with the highest standards of prudent management and vision client." Each committee has certain powers and approval levels, while respecting local legal and regulatory environment. Decisions are collegial and defined through credit committees, which ensures that different opinions.
Its main responsibilities are:
- Integrate and adapt the Bank's risk to local level, as well as risk management strategy and the willingness and level of risk tolerance, all matched with corporate standards Banco Santander Spain;
- Approve the proposals and operations and limitations of clients and portfolio (wholesale and retail);
- Decide on general topics related to Market Risk;
- Ensure Banco Santander activities are consistent with the risk tolerance level previously approved by Committee Executive and in line with the policies of Banco Santander Spain; and
- Authorize the use of management tools and local risk models and know the result of their internal validation.
The risk function at Banco Santander is executed by the Executive Vice-Presidency of Risk, which is independent from the business areas and reports directly to the CEO of Banco Santander.
Further details of the structure, methodologies and control system related to risk management is described in the report available on the website www.santander.com.br.
b) Credit Risk
b.1) Introduction to the treatment of credit risk
The Bank develops Credit Risk Management policies and strategies with the support of several business departments, which are responsible for guaranteeing the appropriate validation of the systems and internal procedures applied in the credit risk management. These systems and procedures are applied to the identification, measurement, control, and mitigation of exposure to credit risk, by individual transaction or by aggregate of similar transactions.
BANCO SANTANDER (BRASIL) S.A.
NOTES TO THE CONSOLIDATED FINANCIAL STATEMENTS
(Amounts in thousands of Brazilian Reais - R$, unless otherwise stated)
Credit risk is the exposure to loss in the event of default of total or partial of customers or counterparties on meeting their financial obligations to the Bank. Credit risk management seeks to provide subsidies in defining strategies, beyond the set limits, encompassing analysis of exposures and trends, as well as the effectiveness of credit policy. The goal is to maintain a risk profile and adequate minimum profitability to offset the risk of default, both client and portfolio, as defined by the Executive Committee. Also responsible for the control and monitoring used in managing credit risk system, both individually and grouped by similarity (standardized management) framework:
• Customers with individualized management: the wholesale segment customers, financial institutions and certain companies. Risk management is implemented through a risk analyst defined. The client is linked to a risk analyst who prepares, forwards, directs and monitors the progress of the client the analysis to Committee. The management is complemented by support tools for decision-making based on models for internal risk assessment.
• Customers with standardized management: individuals and companies not classified as individual clients. The management of this risk models based on automated decision-making and risk assessment of local risks, complemented by commercial competencies and teams of analysts to handle exceptions.
Collection of documentation and information necessary for a comprehensive analysis of the risk involved in credit operations (the identification of the decision-maker, the counterparty, the risk involved in the transactions, the classification of the risk level into different categories, credit granting, periodic assessments of risk levels) these procedures are applied by the Bank to determine the volumes of guarantees and allowances necessary so that lending transactions are conducted according to existing standards and with the necessary security. The Policies, systems and procedures used are reassessed annually to ensure they are consistent with the best risk management requirements and current market scenarios.
Aspects Macroeconomic and market conditions, sectored and geographical concentration, as well as customer profiling and economic prospects are also evaluated and considered in the appropriate measuring of credit risk.
b.2) Measures and measurement tools
Rating tools
The Bank has used proprietary internal rating models to measure the credit quality of a given customer or transaction. Each rating relates to a certain probability of default or non-payment, determined on the basis of the Entity’s historical experience, with the exception of certain portfolios classified as “low default portfolios”. Rating/Scores models are used in the Bank’s loan approval and risk monitoring process.
Global rating tools are applied to the sovereign risk, financial institutions and global wholesale clients (GBM) with centralized management in Banco Santander. These tools assign a rating to each customer, which is obtained from a quantitative or automatic module, based on balance sheet ratios or macroeconomic variables, supplemented by the analyst’s judgment.
For the corporate and individualized institutions segments, it was defined a single methodology for the construction of a rating system in each country, based on the same modules as the above-mentioned ratings: a quantitative or automatic module (analyzing the credit performance of a sample of customers and the correlation with their financial statements), a qualitative or analyst judgment module, and final reviews.
Ratings assigned to customers are reviewed periodically to include any new financial information available and the experience in the banking relationship. The frequency of the reviews is increased in the case of customers that reach certain levels in the automatic warning systems and of customers classified as requiring special monitoring. The own rating tools are reviewed to qualifications by them awarded are progressively cleared.
For standardized customers, both legal entities and individuals, scoring tools that automatically assign a score to proposed transactions.
Credit risk parameters
The estimates of the risk parameters Probability of default (PD and LGD) are based on internal experience, i.e. on default observations and on the experience in defaulted loan recoveries during a defined credit cycle.
For low risk portfolios, such as banks, sovereign risk or global wholesale clients, the parameters are based on CDS market data and with global broadness, using Santander´s world presence.
For the other portfolios, parameter estimates are based on the Bank’s internal experience.
LGD calculation is based on the observation of the recoveries of defaulted loans, taking into account the guarantees/collateral associated with the loan, the income and expenses associated with the recovery process.
The estimated parameters are then assigned to performing, i.e. non-defaulted, loans. For low-default portfolios, which are managed globally, the assignment process follows the same patterns in all Banco Santander units.
BANCO SANTANDER (BRASIL) S.A.
NOTES TO THE CONSOLIDATED FINANCIAL STATEMENTS
(Amounts in thousands of Brazilian Reais - R$, unless otherwise stated)
b.3) Observed loss: measures of cost of credit
To supplement the use of the advanced models described above (see related data in the “Economic Capital” section), other habitual measures are used to facilitate prudent and effective management of credit risk based on observed loss.
The cost of credit is measured by the sum of credit losses of year and to the average loans portfolio of the year.
b.4) Credit risk cycle
The risk management process consists of identifying, measuring, analyzing, controlling, negotiating and deciding on, as appropriate, the risks incurred in the Bank’s operations.
The risk cycle comprises three different phases: pre-sale, sale and post-sale:
• Pre-sale: this phase includes the risk planning and target setting processes, determination of the Bank’s risk appetite, approval of new products, risk analysis and credit rating process, and limit setting.
• Sale: this is the decision-making phase for both pre-classified and specific transactions.
• Post-sale: this phase comprises the risk monitoring, measurement and control processes and the recovery process.
Planning and setting risk limits
Risk limit setting is a dynamic process that identifies the Banco Santander’s risk appetite by assessing business proposals and the attitude to risk. This process is defined in the global risk limit plan, an agreed-upon comprehensive document for the integrated management of the balance sheet and the inherent risks.
The risk limits are founded on two basic structures: customers/segments and products.
For individualized risks, customers represent the most basic level, for which individual limits are established (pre-classification).
For large corporate groups a pre-classification model, based on an economic capital measurement and monitoring system, is used. As regards the corporate segment, a simplified pre-classification model is applied for customers meeting certain requirements (thorough knowledge, rating, and others).
In the case of standardized risks, the risk limits are planned and set using the credit management programs (PGC), a document agreed upon by the business areas and the risk units and approved by the Risk Executive Committee, which contains the expected results of transactions in terms of risk and return, as well as the limits applicable to the activity and the related risk management.
Risk analysis and rating process
Risk analysis is a pre-requisite for the approval of loans to customers by the Bank. This analysis consists of examining the counterparty’s ability on meeting its contractual obligations to the Banco Santander, which involves analyzing the customer’s credit quality, its risk transactions, solvency, and sustainability of business and the return to be obtained in view of the risk assumed.
The risk analysis is conducted yearly, at least, and can be held shortly when client profile indicates (through systems with centralized alerts, managers visits to clients or specific credit analysis), or when operations are not covered by pre-classification.
Decision-Making on Operations
The process of decision making on operations aims to analyze them and adopt resolutions, taking into account interest risks (risk appetite) and any important elements of operation to offset the risk and return.
The Banco Santander uses, among others, the RORAC methodology (return on risk-adjusted capital), for the risk analysis and pricing in the decision-making process on transactions and deals.
Risk monitoring and control
In addition to the tasks performed by the Internal Audit Division, the Vice Presidency of Risks has a specific area of risk monitoring function for adequate credit quality control, formed by local and global teams with specific resources and persons in charge.
This monitoring function is based on process of permanent observation to enable early detection of any incidents that might arise in the evolution of the risk, the transactions, the customers and their environment, and the adoption of preventive actions. The risk monitoring function is specialized by customer segment.
BANCO SANTANDER (BRASIL) S.A.
NOTES TO THE CONSOLIDATED FINANCIAL STATEMENTS
(Amounts in thousands of Brazilian Reais - R$, unless otherwise stated)
For this purpose a system called “firms under special surveillance” (FEVE, using the Spanish acronym) has been designed that distinguishes four categories based on the degree of concern raised by the circumstances observed (extinguish, secure, reduce and monitor. The inclusion of a company in the FEVE system does not mean that there has been a losses due to default, but rather that has deemed advisable to adopt a specific policy for this company, to place a person in charge and to set the policy implementation period. Customers classified as FEVE are revised at least every six months, or every three months for those classified in the most severe categories. A company is classified as FEVE as a result of the monitoring process itself, a review performed by Internal Audit, a decision made by the sales manager responsible for that company or the triggering of the automatic warning system.
Assigned ratings are reviewed at least annually, but if any weakness is detected, or depending on the rating itself, more frequent reviews are performed.
For exposures to standardized customers, the key indicators are monitored in order to detect any variance in the performance of the loan portfolio with respect to the forecasts contained in the credit management programs.
b.5) Risk control function
Supplementing the management process, the risk control function obtains a global view of the Bank’s loan portfolio, through the various phases of the risk cycle, with a level of detail sufficient to permit the assessment of the current situation of the risk process, its qualities and any eventual changes.
Any changes in the Bank’s risk exposure are controlled on an ongoing and systematic basis against budgets, limits and benchmarks, and the impacts of these changes in certain future situations, both of an exogenous nature and those arising from strategic decisions, are assessed in order to establish measures that place the profile and amount of the loss portfolio within the parameters set by Executive Commission.
The risk control function is performed by assessing risks from various complementary perspectives, the main pillars being control by geographical location, business area, management model, product and process, thus facilitating the detection of specific areas warranting action and for which decisions have to be taken.
b.5.1) Credit recovery
The Credit Recovery department works in the credit collection and recovery of Banco Santander clients. The strategies and channels of collection operation are defined according analysis which showed the greatest efficiency in the recovery. In the early days of delinquency, is adopted a more enhanced recovery model, with specific strategies, with a closer internal monitoring. Call centers, negativation in the organs of credit protection (credit bureaus), letters of collection and collection through the branches network are used during this phase, in order to recover the loan and maintain customer relationship. In cases with arrears exceeding 60 days past due and higher values, come into play internal teams specialized in restructuring and credit recovery with direct management of delinquent customers. Lower values or more severe delays have the recovery carried out through third party collection administrative (friendly) or judicial, according to internal criteria, receiving a commission for any amounts recovered.
Tools are used, such as behavioral score, to study the performance of collecting certain groups, in an attempt to reduce costs and increase recoveries. The customers probability of payment are classified as low risk, and greater attention is paid to maintaining a healthy relationship with them. Customers with little chance of making the payment, in turn, are classified as high risk, and are being monitored more closely . All customers, with overdue amounts or restructured credits, have internal restrictions.
Sales of portfolios of defaulted loans, with a focus on operations in write-off status, are also held periodically through an auction process, in which are assessed conditions and characteristics of operations for its evaluation, without retention of risk.
b.6) Credit risk from other outlook
Certain areas and specific views of credit risk deserve attention of specialist, complementary to global risk management.
Concentration risk
Concentration risk is an essential factor in the area of credit risk management. The Bank constantly monitors the degree of concentration of its credit risk portfolios, by geographical area/country, economic sector, product and customer group.
The risk committee establishes the risk policies and reviews the exposure limits required to ensure adequate management of credit risk portfolio concentration.
From the sectorial standpoint, the distribution of the corporate portfolio is adequately diversified.
The Bank’s Risk Area works closely with the Finance Area in the active management of credit portfolios, which includes reducing the concentration of exposures through several techniques, such as the arrangement of credit derivatives for hedging purposes or the performance of securitization transactions, in order to optimize the risk/return ratio of the total portfolio.
BANCO SANTANDER (BRASIL) S.A.
NOTES TO THE CONSOLIDATED FINANCIAL STATEMENTS
(Amounts in thousands of Brazilian Reais - R$, unless otherwise stated)
Credit risk from financial market operations
This heading includes the credit risk arising in treasury operations with customers, mainly credit institutions. These operations are performed both via money market financing products with different financial institutions and via derivative instruments arranged for the purpose of serving our customers.
Risk control is performed using an integrated, real-time system that enables the Bank to know at any time the unused exposure limit with respect to any counterparty, any product and maturity and at any Bank unit.
Credit risk is measured at its current market value and its potential value (exposure value considering the future variation in the underlying market factors). Therefore, the credit risk equivalent (CRE) is defined as the sum of net replacement value plus the maximum potential value of the contracts in the future.
Environmental risk
Our social and environmental risk policy is applied to wholesale clients and goes beyond credit by analyzing social and environmental issues when new clients are brought to the bank. The Social and Environmental Risk team analyzes the way our clients manage their social and environmental matters, as well as their value chain. This is achieved by checking for contaminated land, deforestation, serious work-related violations and other matters that may incur penalties.
The team, composed of specialists with degrees in Biology, Geology, Chemical Engineering and Health and Safety Engineering, monitors our clients’ social and environmental practices, financial analysts assess the probability that substandard practices in these areas may affect collateral and clients’ financial performance. Our experience shows that companies that care more about employees and the environment usually have more efficient management systems and are therefore a better credit risk.
b.7) Variations in main aggregates in 2013
The year 2013 was marked by economic growth falls short of expectation that had at its beginning. Important factors such as higher inflation and hence the need to raise the basic interest rate declined the credit market in the year grew less than previous periods.
In this scenario the management of credit risk has been a major focus of management in the year, to the extent that required revisions admission policies of credit monitoring procedures and methods for recovery of loans. The results were significant reductions in delinquency and the need for provision of credit.
Strengthened our risk framework assigning a view to better management and closer to customers, supporting the business strategy of Banco Santander. Thus, we could shut down in 2013 with good results and significant improvement in portfolio quality.
Improving rates of credit recovery in 2013 came from the Tactical Deployment Plan Recoveries, which had intensified focus on the channels of contact charging, the new model the recovery (areas of strategy, business network and collection channels) , renegotiation and revision of management discipline policy.
The involvement of senior management in decision making, and these held collectively at our Committees besides independence Risks relating to the business, allow more assertive decisions and reducing credit risk.
The analysis of credit for projects and companies in the Wholesale segment, continue integrating opinions of our area of Environmental Risk.
Below the table of the evolution of the main indicators of credit.
|
2013
|
2012
|
2011
|
||||||||||
|
Credit risk exposure - customers (Thousand of Reais)
|
257,419,951 | 238,803,816 | 216,756,389 | |||||||||
|
Loans and advances to customers, gross
|
226,206,449 | 210,740,669 | 194,184,437 | |||||||||
|
Contingent Liabilities - Guarantees and other sureties
|
31,213,502 | 28,063,147 | 22,571,952 | |||||||||
|
Non-performing loans ratio (%)
|
6.20 | % | 7.58 | % | 6.73 | % | ||||||
|
Impairment coverage ratio (%)
|
97.28 | % | 87.45 | % | 85.52 | % | ||||||
|
Specific credit loss provisions, net of RAWO (*) (Thousand of Reais)
|
13,640,545 | 14,041,987 | 11,179,835 | |||||||||
|
Cost of credit (% of risk)
|
5.65 | % | 7.25 | % | 4.76 | % | ||||||
Data prepared on the basis of management criteria and the accounting criteria of the controller unit.
(*) RAWO = Recoveries of Assets Derecognized.
F-110
BANCO SANTANDER (BRASIL) S.A.
NOTES TO THE CONSOLIDATED FINANCIAL STATEMENTS
(Amounts in thousands of Brazilian Reais - R$, unless otherwise stated)
c) Market Risk
Market risk is the exposure to risks such as interest rates, exchange rates, prices of goods, prices in the stock market and others values, according to the type of product, volume of operations, term and conditions of the agreement and underlying volatility.
The Bank operates according to global policies, within the Group’s risk tolerance level, aligned with the objectives in Brazil and in the world.
With this purpose, it has developed its own Risk Management model, according to the following principles:
- Functional independence;
- Executive capacity sustained by knowledge and proximity with the client;
- Global reach of the function (different types of risk);
- Collective decision-making, which evaluate a variety of possible scenarios and do not compromise the results with individual decision, including Brazil Executive Risk Committee (Comitê Executivo de Riscos Brasil), which delimits and approves the operations and the Asset and Liabilities Committee, which responds for the capital management and structural risks, including country-risk, liquidity and interest rates.
- Management and improvement of the equation risk/return; and
- Advanced methodologies for risk management, such as Value at Risk – VaR (historical simulation of 521 days with a confidence level of 99% and time horizon of one day), scenarios, financial margin sensibility, equity value and contingency plan.
The Market Risks structure is part of the Vice Presidency of Credit and Market Risks, an independent area that aligns risk policies taking into consideration the guidelines of the Board of Directors and the Risks Division of Santander in Spain.
c.1) Activities subject to market risk
The measurement, control and monitoring of the market risk area comprises all operations in which net worth risk is assumed. This risk arises from changes in the risk factors –interest rate, exchange rate, equities, commodity prices and the volatility thereof– and from the solvency and liquidity risk of the various products and markets in which the Bank operates.
The activities are segmented by risk type as follows:
- Trading: this item includes financial services for customers, trading operations and positioning mainly in fixed-income, equity , foreign currency products and shares.
- Balance sheet management: A risk management assessment aims to give stability to interest income from the commercial and economic value of the Bank, maintaining adequate levels of liquidity and solvency. The risk is measured by the balance sheet exposure to movements in interest rates and level of liquidity.
- Structural risks:
i. Structural foreign currency risk/hedges of results: foreign currency risk arising from the currency in which investments in consolidable and non-consolidable companies are made (structural exchange rate). This item also includes the positions taken to hedge the foreign currency risk on future results generated in currencies other than the Real (hedges of results).
ii. Structural equities risk: this item includes equity investments in non-consolidated financial and non-financial companies that give rise to equities risk.
The Treasury area is responsible for managing the positions taken in the trading activity.
The Financial Management area is responsible for managing the balance sheet management risk and structural risks centrally through the application of uniform methodologies adapted to the situation of each market in which the Bank operates. Thus, in the convertible currencies area, Financial Management directly manages the Parent's risks and coordinates the management of the other units operating in these currencies. Decisions affecting the management of these risks are taken through the ALCO (Asset Liability Control committees) in the respective countries.
The aim pursued by Financial Management is to ensure the stability and recurring nature of both the net interest margin of the commercial activity and the Bank’s economic value, whilst maintaining adequate liquidity and solvency levels.
Each of these activities is measured and analyzed using different tools in order to reflect their risk profiles as accurately as possible.
BANCO SANTANDER (BRASIL) S.A.
NOTES TO THE CONSOLIDATED FINANCIAL STATEMENTS
(Amounts in thousands of Brazilian Reais - R$, unless otherwise stated)
c.2) Methodologies
Trading
The Bank calculates its market risk capital requirement using a standard model provided by Central Bank of Brazil.
The standard methodology applied to trading activities by the Banco Santander and the value at risk (VaR), which measures the maximum expected loss with a given confidence level and time horizon. This methodology was based on a standard historical simulation with a 99% confidence level and a one-day time horizon. Statistical adjustments were made to enable the swift and efficient incorporation of the most recent events that condition the level of risk assumed.
Specifically, the Bank uses a time window of two years or 521 daily data obtained retrospectively from the reference date of the VaR calculation. Two figures are calculated each day, one by applying an exponential decline factor which gives a lesser weighting to more distant observations in time, and another with uniform weightings for all observations. The VaR reported is the higher of these two figures.
VaR is not the only measure. It is used because it is easy to calculate and because it provides a good reference of the level of risk incurred by the Bank. However, other measures are simultaneously being implemented to enable the Bank to exercise greater risk control in all the markets in which it operates.
One of these measures is scenario analysis, which consists of defining behavior scenarios for various financial variables and determining the impact on results of applying them to the Bank’s activities. These scenarios can replicate past events (such as crises) or, conversely, determine plausible scenarios that are unrelated to past events. A minimum of three types of scenarios are defined (plausible, severe and extreme) which, together with VaR, make it possible to obtain a much more complete spectrum of the risk profile.
The positions are monitored daily through an exhaustive control of changes in the portfolios, the aim being to detect possible incidents and correct them immediately. The daily preparation of an income statement is an excellent risk indicator, insofar as it allows us to observe and detect the impact of changes in financial variables on the portfolios.
Lastly, due to their atypical nature, derivatives and credit trading management (actively traded credit – Trading Book) activities are controlled by assessing specific measures on a daily basis. In the case of derivatives, these measures are sensitivities to fluctuations in the price of the underlying (delta and gamma), in volatility (vega) and in time (theta). For credit trading management activities, the measures controlled include sensitivity to spread, jump-to-default and position concentrations by rating level.
With respect to the credit risk inherent in the trading portfolios (Credit Trading portfolios), and in keeping with the recommendations made by the Basel Committee of Banking Supervision, an additional measure has been introduced, the Incremental Risk Charge (IRC), in order to cover the default risk which is not properly captured in the VaR, through the variation of the related market prices of credit spreads. The instruments affected are basically fixed-income bonds, , derivatives on bonds (forwards, options, etc.) and credit derivatives (credit default swaps, asset-backed securities, etc.). The method used to calculate the IRC, is defined globally at Group level.
c.3) Balance-sheet management
Interest rate risk
The Bank analyses the sensitivity of the net interest margin and market value of equity to changes in interest rates. This sensitivity arises from maturity and interest rate repricing gaps in the various balance sheet items.
On the basis of the balance-sheet interest rate position, and considering the market situation and outlook, the necessary financial measures are adopted to align this position with that desired by the Bank. These measures can range from the taking of positions on markets to the definition of the interest rate features of commercial products.
The measures used by the Bank to control interest rate risk in these activities are the interest rate gap, the sensitivity of net interest margin (NIM) and market value of equity (MVE) to changes in interest rates, the duration of capital, value at risk (VaR) and scenario analysis.
Interest rate gap of assets and liabilities
The interest rate gap analysis focuses on the mismatches between the interest reset periods of on-balance-sheet assets and liabilities and of off-balance-sheet items. This analysis facilitates a basic snapshot of the balance sheet structure and enables concentrations of interest rate risk in the various maturities to be detected. Additionally, it is a useful tool for estimating the possible impact of potential changes in interest rates on the entity's net interest margin and market value of equity.
The flows of all the on- and off-balance-sheet aggregates must be broken down and placed at the point of repricing or maturity. The duration and sensitivity of aggregates that do not have a contractual maturity date are analyzed and estimated using an internal model.
BANCO SANTANDER (BRASIL) S.A.
NOTES TO THE CONSOLIDATED FINANCIAL STATEMENTS
(Amounts in thousands of Brazilian Reais - R$, unless otherwise stated)
Net interest margin (NIM) sensitivity
The sensitivity of the net interest margin measures the change in the expected accruals for a specific period (12 months) given a shift in the interest rate curve.
The sensitivity of the net interest margin is calculated by simulating the margin both for a scenario of changes in the interest rate curve and for the current scenario, the sensitivity being the difference between the two margins so calculated.
Market value of equity (MVE) sensitivity
The sensitivity of the market value of equity is a complementary measure to the sensitivity of the net interest margin.
This sensitivity measures the interest rate risk implicit in the market value of equity based on the effect of changes in interest rates on the present values of financial assets and liabilities.
Value at risk (VaR)
The value at risk for balance sheet aggregates and investment portfolios is calculated by applying the same standard as that used for trading: historical simulation with a confidence interval of 99% . Statistical adjustments were made to enable the swift and efficient incorporation of the most recent events that condition the level of risk assumed.
c.4) Liquidity risk
Liquidity risk is associated with the Bank’s ability to finance its commitments at reasonable market prices and to carry out its business plans with stable sources of funding. The Bank permanently monitors maximum gap profiles.
The measures used to control liquidity risk in balance sheet management are the liquidity gap, liquidity ratios, stress scenarios and contingency plans.
Liquidity gap
The liquidity gap determines the inflow and outflow of funds for assets, liabilities (note 41.d) and off-balance sheet accounts at a given time horizon, making it possible to analyze mismatches between the Bank's expected inflow and outflow of funds.
A liquidity gap may be prepared and analyzed as divided into local currency liquidity gap and foreign currency liquidity gap, under which cash and cash equivalents, inflows and outflows and strategies are segregated into local and foreign currency, respectively.
The Bank prepares three types of Liquidity Gap analyses:
1 - Contractual liquidity gap
The Contractual Liquidity Gap determines the contractual maturity flows of the Bank’s major products on a consolidated basis, and any existing mismatches. It also informs the available liquidity in one day and the consumption of or increase in liquidity in the period.
2 - Operational liquidity gap
Daily cash monitoring and management considering the market situation, maturities and renewal of assets and liabilities, liquidity requirement and specific events.
3 - Projected liquidity gap
Based on the Contractual Liquidity Gap, new maturity flows are projected considering the Bank’s budget plan.
Liquidity ratios
In addition to the Liquidity Gap analysis, a Structure Liquidity model is also prepared to assess the structure profile of the sources and uses of the Bank’s funds, which includes Liquidity Ratio studies.
The key Liquidity Ratios analyzed are as follows:
• Deposits / Lending operations – measures the Institution’s ability to finance lending operations with more stable and lower-cost funding.
• Stable Liabilities / Permanent Assets – measures the ration between Capital + Other Stable Liabilities and Investments + Other Permanent Assets.
• Market Funding / Total Assets – measures the percentage of the Group’s assets financed with less stable and higher-cost funding.
• Short-term market funding / Market Funding – measures the percentage of probable liquidity loss (less than 90 days) on total less stable funding.
• Net Assets / Short-term Market Funding – measures the commitment ratio of highly-liquid assets and probable liquidity loss(less than 90 days).
BANCO SANTANDER (BRASIL) S.A.
NOTES TO THE CONSOLIDATED FINANCIAL STATEMENTS
(Amounts in thousands of Brazilian Reais - R$, unless otherwise stated)
Scenario analysis / Contingency plan
Liquidity management requires an analysis of financial scenarios where possible liquidity issues are evaluated. For this, crisis scenarios are built and then studied. The model used for this analysis is the Liquidity Stress Test.
The Liquidity Stress Test assesses the institution’s financial structure and ability to resist and respond to the most extreme situations.
The purpose of the Liquidity Stress Test is to simulate adverse market conditions, making it possible assess impacts on the institution’s liquidity and payment ability, so as to take preventive actions or avoid positions that may adversely affect liquidity in worst-case scenarios.
Scenarios are determined based on an analysis of the market commitment during prior crises and future estimates. Four scenarios with different intensity levels are prepared.
Based on an analysis of the stress models, the Minimum Liquidity concept was determined, which is the minimum liquidity required to support the liquidity losses of up to 90% for 90 days in all crisis scenarios simulated.
Based on the results obtained through the Liquidity Stress Test, the Bank prepares its Liquidity Contingency Plan, which is a formal combination of preventive and corrective actions to be taken in liquidity crisis scenarios.
The Liquidity Contingency Plan is primarily intended to the following:
• Crisis identification – the preparation of a Liquidity Contingency Plan requires the determination in advance of a measurable parameter determining the institution’s liquidity condition and structure. This parameter is the Liquidity Minimum Limit determined by the Liquidity Stress Test. When this limit is exceeded, there is a liquidity crisis environment, and thus, the Contingency Plan is used.
• Internal Communication – after the crisis is identified, it is necessary to establish clear communication channels to mitigate the problems raised. People held accountable for taking these contingency actions should be notified of the extent of the contingency and measures to be taken.
• Corrective actions – Actions intended to actually generate the funds required to solve or mitigate the effects of crisis, as follows:
- Assess the type and severity of the crisis;
- Identify the most impacted segment;
- Put in practice the measures planned to generate funds, considering the required amount and cost of the additional resource, either financial or image cost.
ALCO reviews and approves stress models, Minimum Liquidity and Contingency Plan on a semi-annual basis.
If adverse market conditions occur, ALCO may review and approve new models, Minimum Liquidity and Contingency Plan on a need basis.
c.5) Structural foreign currency risk / Hedges of results / Structural equities risk
These activities are monitored by measuring positions, VaR and results.
c.5.1) Complementary measures
Calibration and test measures
Back-testing consists of performing a comparative analysis between VaR estimates and daily “clean” results (profit or loss on the portfolios at the end of the preceding day valued at following-day prices) and “dirty” (managerial income taking into account also the costs, intraday results and loading). The aim of these tests is to verify and provide a measure of the accuracy of the models used to calculate VaR.
Back-testing analyses performed at the Banco Santander comply, at the very least, with the BIS recommendations regarding the verification of the internal systems used to measure and manage financial risks. Additionally, the Santander Bank also conducts hypothesis tests: excess tests, normality tests, Spearman’s rank correlation, average excess measures, etc.
The assessment models are regularly calibrated and tested by a specialized unit.
BANCO SANTANDER (BRASIL) S.A.
NOTES TO THE CONSOLIDATED FINANCIAL STATEMENTS
(Amounts in thousands of Brazilian Reais - R$, unless otherwise stated)
c.6) Control system
Limit setting
The limit setting process is performed together with the budgeting activity and is the tool used to establish the assets and liabilities available to each business activity. Limit setting is a dynamic process that responds to the level of risk considered acceptable by management.
The limits structure requires a process to be performed that pursues, inter alia, the following objectives:
1. To identify and delimit, in an efficient and comprehensive manner, the main types of financial risk incurred, so that they are consistent with business management and the defined strategy.
2. To quantify and communicate to the business areas the risk levels and profile deemed acceptable by senior management so as to avoid undesired risks.
3. To give flexibility to the business areas for the efficient and timely assumption of financial risks, depending on market changes, and for the implementation of the business strategies, provided that the acceptable levels of risk are not exceeded.
4. To allow business makers to assume risks which, although prudent, are sufficient to obtain the budgeted results.
5. To delimit the range of products and underlyings with which each Treasury unit can operate, taking into account features such as assessment model and systems, liquidity of the instruments involved, etc.
c.7) Risks and results in 2013
Trading
The average VaR of the Bank’s trading portfolio in 2013 was R$26.1 million (2012 - R$20.8 million and 2011 – R$21.7 million). The dynamic management of this profile enables the Bank to change its strategy in order to capitalize on the opportunities offered by an environment of uncertainty.
c.7.1) Balance sheet management
(1)
Interest rate risk
Convertible currencies
At 2013 year-end, the sensitivity of the net interest margin at one year to parallel increases of 100 basis points applied to Banco Santander portfolios was concentrated on the BRL interest rate curve was negative by R$383.03 million.
Also at 2013 year-end, the sensitivity market value of equity to parallel increases of 100 basis points applied to the Banco Santander in the BRL interest rate curve was negative by R$1,402.22 million.
Quantitative risk analysis
The interest rate risk in balance sheet management portfolios, measured in terms of sensitivity of the net interest margin (NIM) at one year to a parallel increase of 100 b.p. in the interest rate curve, decreased R$81 million over 2013, reaching a maximum of R$383 million in the month in December. The sensitivity value increased R$130 million during 2013. The main factors that occurred in 2013 and influenced the growth of this sensitivity were:
- Sale of roles for recognition of A5666 income, resulting in a decrease in sensitivity for a total of R$291 million.
- Purchase of roles for mounting position, resulting in an increase in net interest income totaling R$125 million.
|
Thousands of Reais
|
||||||||||||
|
2013
|
2012
|
2011
|
||||||||||
|
Sensibilities
|
||||||||||||
|
Net Interest Margin
|
383 | 272 | 263 | |||||||||
|
Market Value of Equity
|
1,402 | 1,533 | 1,492 | |||||||||
|
Value at Risk - Balance
|
||||||||||||
|
VaR
|
540 | 296 | 252 | |||||||||
(1) Includes the balance sheet total, except for the financial assets and liabilities held for trading.
BANCO SANTANDER (BRASIL) S.A.
NOTES TO THE CONSOLIDATED FINANCIAL STATEMENTS
(Amounts in thousands of Brazilian Reais - R$, unless otherwise stated)
Structural liquidity management
Structural liquidity management seeks to finance the Bank’s recurring business with optimal maturity and cost conditions, avoiding the need to assume undesired liquidity risks.
The main features of the structural liquidity management in 2013 were as follows:
• Ample structural liquidity position. Since Banco Santander is basically a commercial bank, customer deposits constitute the main source of liquidity in its financing structure. These deposits, combined with capital and other similar instruments, enable the Bank to cover most of its liquidity requirements and, as a result, the financing raised in wholesale markets is moderate with respect to the size of its balance sheet.
• In Brazil, the legal reserve requirement takes a considerable part of the funding.
• Obtainment of liquidity through diversification in instruments. Additionally, subordinated and senior debts have an overall long maturity.
• The local balance sheet should be self-funded.
• Based on stress test results, a minimum liquidity buffer is maintained.
• Banco Santander reliance in international funding is not considerable.
• The aim is that hard currency related activities be funded with third parties hard currency funding.
• Though, given that potential disruptions in this market, Banco Santander has mechanisms to use the local liquidity in order to support hard currency activities.
• High capacity to obtain on-balance-sheet liquidity. Government bond positions are held for liquidity management purposes.
• The Bank performs control and management functions, which involves planning its funding requirements, structuring the sources of financing to achieve optimum diversification in terms of maturities and instruments, and defining contingency plans.
In practice, the liquidity management performed by the Bank consists of the following:
• Each year, a liquidity plan is prepared on the basis of the financing needs arising from the budgets of each business. Based on these liquidity requirements and taking into account certain prudential limits on the obtainment of short-term market financing, the Bank establishes an issue and securitization plan for the year.
• Throughout the year the Bank periodically monitors the actual changes in financing requirements and updates this plan accordingly.
• Control and analysis of liquidity risk. The primary objective is to guarantee that the Bank has sufficient liquidity to meet its short- and long-term financing requirements in normal market situations. To this end, the Bank employs certain balance-sheet control measures, such as the liquidity gap and liquidity ratios.
Simultaneously, various scenario (or stress-scenario) analyses are conducted which consider the additional requirements that could arise if certain extreme but plausible events occur. The aim pursued is to cover a broad spectrum of situations that are more or less likely to affect the Bank, thus enabling it to prepare the related contingency plans.
c.8) Sensitivity analysis
The risk management is focused on portfolios and risk factors pursuant to the requirements of regulators and good international practices.
Financial instruments are segregated into trading and banking portfolios, as in the management of market risk exposure, according to the best market practices and the transaction classification and capital management criteria of the New Standardized Approach of regulators. The trading portfolio consists of all transactions with financial instruments and products, including derivatives, held for trading, and the banking portfolio consists of core business transactions arising from the different Banco Santander business lines and their possible hedges. Accordingly, based on the nature of Banco Santander’s activities, the sensitivity analysis was presented for trading and banking portfolios.
Banco Santander performs the sensitivity analysis of the financial instruments in accordance with requirements of regulatory bodies and international best practices, considering the market information and scenarios that would adversely affect the positions of the Bank.
The table below summarizes the stress amounts generated by Banco Santander’s corporate systems, related to the banking and trading portfolio, for each one of the portfolio scenarios as at December 31, 2013.
BANCO SANTANDER (BRASIL) S.A.
NOTES TO THE CONSOLIDATED FINANCIAL STATEMENTS
(Amounts in thousands of Brazilian Reais - R$, unless otherwise stated)
Trading portfolio
|
Risk Factor
|
Description
|
Scenario 1
|
Scenario 2
|
Scenario 3
|
|||||||||
|
Interest Rate - Reais
|
Exposures subject to changes in interest fixed rate
|
(1,108 | ) | (19,853 | ) | (39,707 | ) | ||||||
|
Coupon Interest Rate
|
Exposures subject to changes in coupon rate of interest rate
|
(9,767 | ) | (135,858 | ) | (271,716 | ) | ||||||
|
Coupon - US Dollar
|
Exposures subject to changes in coupon US Dollar rate
|
(5,610 | ) | (9,970 | ) | (19,940 | ) | ||||||
|
Coupon - Other Currencies
|
Exposures subject to changes in coupon foreign currency rate
|
(160 | ) | (489 | ) | (978 | ) | ||||||
|
Foreign currency
|
Exposures subject to foreign exchange
|
(8,465 | ) | (211,615 | ) | (423,230 | ) | ||||||
|
Eurobond/Treasury/Global
|
Exposures subject to changes in interest rate negotiated roles in international market
|
(1,383 | ) | (11,823 | ) | (23,646 | ) | ||||||
|
Inflation
|
Exposures subject to change in coupon rates of price indexes
|
(1,235 | ) | (14,555 | ) | (29,110 | ) | ||||||
|
Shares and Indexes
|
Exposures subject to change in shares price
|
(3,486 | ) | (87,142 | ) | (174,284 | ) | ||||||
|
Other
|
Exposures not meeting the previous settings
|
(994 | ) | (50 | ) | (99 | ) | ||||||
|
Total
(1)
|
(32,208 | ) | (491,355 | ) | (982,710 | ) | |||||||
(1) Amounts net of taxes.
Scenario 1:
a shock of 10 base points on the interest curves and 1% to price changes (currency and stocks);
Scenario 2:
a shock of +25% and -25% in all risk factors, are considered the greatest losses per risk factor;
Scenario 3:
a shock of +50% and -50% in all risk factors, are considered the greatest losses per risk factor.
Portfolio Banking
|
2012
|
|||||||||||||
|
Risk Factor
|
Description
|
Scenario 1
|
Scenario 2
|
Scenario 3
|
|||||||||
|
Interest Rate - Reais
|
Exposures subject to changes in interest fixed rate
|
(30,514 | ) | (854,985 | ) | (1,619,450 | ) | ||||||
|
TR and Long-Term Interest Rate - (TJLP)
|
Exposures subject to changes in Exchange of TR and TJLP
|
(8,411 | ) | (253,579 | ) | (434,305 | ) | ||||||
|
Inflation
|
Exposures subject to change in coupon rates of price indexes
|
(1,703 | ) | (25,295 | ) | (48,941 | ) | ||||||
|
Coupon - US Dollar
|
Exposures subject to changes in coupon US Dollar rate
|
(47,114 | ) | (253,798 | ) | (530,827 | ) | ||||||
|
Coupon - Other Currencies
|
Exposures subject to changes in coupon foreign currency rate
|
(10,316 | ) | (55,043 | ) | (119,343 | ) | ||||||
|
Interest Rate Markets International
|
Exposures subject to changes in interest rate negotiated roles in international market
|
(44,938 | ) | (283,314 | ) | (537,036 | ) | ||||||
|
Foreign Currency
|
Exposures subject to foreign exchange
|
(2,791 | ) | (69,780 | ) | (139,559 | ) | ||||||
|
Total
(1)
|
(145,787 | ) | (1,795,794 | ) | (3,429,461 | ) | |||||||
(1) Amounts net of taxes.
Scenario 1:
a shock of 10 base points in interest rate curves and 1% price variance (currency);
Scenario 2:
a shock of +25% and -25% in all risk factors, are considered the greatest losses per risk factor;
Scenario 3:
a shock of +50% and -50% in all risk factors, are considered the greatest losses per risk factor.
d) Operational and Technological Risks and Internal Controls - SOX
Banco Santander’s corporative areas, responsible for technological and operational risk management and Internal controls are under the supervision of various vice-presidents, with structures, procedures, methodologies, tools and specific internal models guaranteed through an appropriate managerial model permitting the identification, capture, assessment, control, monitoring, mitigation and reduction of operational risk events and losses. In addition, the management and prevention of operational and technological risks, the continuity of the business and the continuous strengthening of the internal control system, meets the requirements of the regulators, the New Basel Accord (BIS II) and the Sarbanes-Oxley Act (SOX). It is also aligned with the guidelines set forth by Banco Santander Spain, which are based on the COSO - Committee of Sponsoring Organizations of the Treadway Commission – Enterprise Risk Management – Integrated Framework.
The procedures developed and adopted are intended to ensure Banco Santander’s continuing presence among the select group of financial institutions recognized as having the best operational risk management practices, thereby helping to continuously improve its reputation, solidity and reliability in the local and international markets.
Management plays an active part, aligned with the mission of the areas, recognizing, participating and sharing responsibility for the continuous improvement of the operational and technological risk management culture and structure, as well as of the internal control system, in order to ensure compliance with the established objectives and goals, as well as the security and quality of the products and services provided.
BANCO SANTANDER (BRASIL) S.A.
NOTES TO THE CONSOLIDATED FINANCIAL STATEMENTS
(Amounts in thousands of Brazilian Reais - R$, unless otherwise stated)
Banco Santander’s Board of Directors opted to adopt the Alternative Standardized Approach (ASA) to calculate the installment of Required Notional Equity (PRE) related to operational risk.
The 2013 review of the effectiveness of internal controls in the Banco Santander companies, in accordance with section 404 of the Sarbanes-Oxley Act, was concluded in March, 2014 and found no evidence of any material issues.
d.1) Operational and Technological Risks Area (ROT)
This area is responsible for implementing best practices in regard to operational and technological risk management and controls, as well as business continuity management Such practices are designed to help managers meet strategic goals, contribute to Banco Santander’s decision-making process and the daily course of its activities and ensure compliance with all legal and regulatory requirements, thus maintaining the Bank’s reputation, reliability and solidity.
The foundations of the model adopted for the management and control of operational and technological risks combine both a centralized and decentralized approach.
Centralized approach: determines that the Operational Risk area is responsible for the control of operational and technological risks, corresponding to the following activities: the identification, assessment, capture, monitoring, control, analysis, consolidation, mitigation and modeling of significant operational risks and the events and losses resulting from such risks, encompassing all of Banco Santander’s areas, processes and institutions.
Decentralized approach: determines that the management of operational and technological risks is the responsibility of the organization’s area, process and product managers, aided by operational risk and internal control representatives, and supported by the policies, methodologies and tools defined by the ROT. Managers identify and communicate operational risk events to the ROT for registration in the historical event and loss database and in order to develop and implement corrective and preventive measures.
Banco Santander does everything possible to ensure the convergence and consistent integration of best operational risk control and management practices. With this in mind it also adopts qualitative and quantitative focuses, and the management and control of technological risks and business continuity.
d.2) Qualitative and Quantitative Focuses
The qualitative focus aims to identify and prevent operational risks, as well as define the risk profile of the areas, processes and products, seeking to strengthen the internal control environment and monitor key qualitative operational risk indicators (KRIs).
The quantitative focus is correlated with the qualitative one, helping to detect, correct and prevent operational risks, as well as providing a mechanism for analyzing and making strategic and operational decisions.
Both focuses are responsible for providing methodologies and tools to assist managers in identifying and assessing risks and controls, as well as defining the operational risk profiles of the areas, processes and products. They also help in the implementation of policies, rules, procedures and tools to maintain the flow of capturing risk events, losses and key operational risk indicators, consolidating them into a single database, allowing analysis of the respective risks, identification of their main causes, and, together with the responsible managers, the coordination and effective implementation of action plans to mitigate and reduce operational risks and losses.
d.3) Management and Control of Technological Risks
Helps managers to identify and evaluate technological risks and their respective internal controls in specific relation to technology-related processes and activities. It also defines methodologies and tools, working closely with corporate management and coordination with those responsible for preventing and reducing the impacts caused by technological risk events.
d.4) Management and Control of Business Continuity
Responsible for coordinating and controlling the implementation, maintenance and updating of the Business Continuity Management (GCN) methodology of Banco Santander’s various areas.
Its main goal is to preserve the integrity of the organization’s people, values and commitments, in addition to evaluating the need to develop and implement the Business Continuity Plan and the consequent formalization of procedures and alternative infrastructure to ensure the continuity of Banco Santander’s core businesses with its stakeholders. These plans are developed through the evaluation of impacts caused by a possible interruption of activities as a result of extreme events that may affect the Bank.
BANCO SANTANDER (BRASIL) S.A.
NOTES TO THE CONSOLIDATED FINANCIAL STATEMENTS
(Amounts in thousands of Brazilian Reais - R$, unless otherwise stated)
The main results are:
• Analysis of Business Impact – BIA;
• Business Continuity Plan – PCN;
• Contingency structure activation tests; and
• Group Crisis Response – GRC.
d.5) Scope and Sustainability
The scope of Banco Santander’s operational and technological risk management, as well as its business continuity management, exceeds the allocation of regulatory capital. Acting in an ethical and professional manner, the control of operational and technological risks generates important advantages for the Bank, ensuring its sustainable development, including:
• Improved operational efficiency and productivity in activities and processes and optimization of the allocation of economic and regulatory capital.
•
Compliance with existing regulations (Bacen, CVM, Susep and BIS-II), as well as with new requirements, and monitoring timely responses to requests from regulatory bodies.
• Strengthening of the Bank’s reputation and improving the risk/return ratio for its stakeholders.
• Maintaining and preserving the quality and reliability of the Bank’s products and services, as well as those of its related parties.
• Identifying and addressing in a timely manner the need to correct vulnerabilities in processes and conduct business continuity and damage control tests.
• Development and application of training programs through online and on-site courses aiming to disseminate the operational and technological risk and GCN culture.
• Propagation of the operational risk management and control culture through internal communications (intranet, printed material and other means), thereby reinforcing accountability.
This solid and efficient structure permits the continuous enhancement of existing methodologies and the further dissemination of the culture of responsibility in regard to the management and control of operational risk events.
d.6) Differential factor
The Operational Risk area invests in the development, training and updating of its professionals so they can keep up with changes in the business environment, in addition to offering training programs for other professionals through the intranet and on-site courses.
This has made a significant contribution to Banco Santander consistently achieving its strategic and operational goals, by providing knowledge of the exposure to assumed operational risks and the controlled environment, maintaining the Bank’s low-risk profile and ensuring the sustainable development of its operations.
Stand out:
• Annual Operational and Technological Risk Prevention and Control Week.
• Maintenance of the New Employee Interaction Program, “A single voice,” with lectures on responsibility and operational risk management.
• Training on the necessary procedures for evaluating the internal control environment.
• Mandatory training for all Banco Santander employees through Netcursos, addressing the issue of operational risks and business continuity.
• The creation, dissemination and maintenance of Instruction Manuals, promoting corporate values and commitment.
• Coordination of the annual process for projecting losses caused by operational risks, defining action plans to reduce these losses and for accountability.
• Development of key risk indicators, aiming to ensure absolute and relative analyses based on volumetry and market analysis.
• Integration with the other areas of the Bank, electing representatives for the most important ones, including the technology area.
BANCO SANTANDER (BRASIL) S.A.
NOTES TO THE CONSOLIDATED FINANCIAL STATEMENTS
(Amounts in thousands of Brazilian Reais - R$, unless otherwise stated)
d.7) Outlook
As a result of the structure, methodology and management model it has developed and adopted and which has proved its effectiveness through the implementation of improved internal controls and the identification of risk exposure, Banco Santander is expected to further strengthen its position in the local and international markets, while consolidating this strategy, in order to maintain its recognition as an innovative institution in regard to managing and controlling operational and technological risks and managing business continuity.
d.8) Communication Policy
The Operational Risk area is part of Banco Santander’s governance structure and produces a series of specific monthly reports for management detailing events that occurred, the main activities undertaken, and the corrective and precautionary action plans identified and monitored, ensuring transparency and providing knowledge for governance forums.
Semiannually, it produces a Report on the Management and Control of Operational and Technological Risks, the Management of Business Continuity and the Evaluation of Internal Controls, which is presented to the Bank’s Board of Directors for its awareness and to enable it to take resolutions on the results and activities developed in the period.
Additional information can be obtained from the Bank’s Social and Annual Reports on its website.
Internal Controls and the Sarbanes-Oxley Act Area (SOX)
The Bank instituted the SOX Internal Controls area in order to strengthen the monitoring and continuous enhancement of the Internal Controls Model (MCI) through the implementation and coordination of this Model, which aims to reduce risks in the preparation and disclosure of financial statements.
The area is responsible for implementing and maintaining the SOX Internal Controls Model (MCI), which is consolidated by information documented in a single database (the SOX System), with access to the responsible managers and other authorized users, including auditors, through the local intranet or email.
The system helps Management administer the MCI, in addition to documenting sub-processes and associated risks, indicators and controls. It is also used by the managers responsible to certify controls, sub-processes, processes, activities and subgroups, in order to ensure that there are no problems with the financial statements to be certified by the Chief Executive Officer and Executive Vice-President.
The methodology adopted by the Bank establishes the periodic evaluation of the internal control systems aiming to:
- Based on established and performed tests, obtain a reasonable degree of security in relation to the design and operation of the control activities documented in the Internal Controls Model;
- Ensure the proper operation of control activities for all transactions and during the entire year;
- Obtain information to support corrective measures to resolve any deficiencies in internal controls; and
- Develop a sustainable test program to enable periodic evaluations by Banco Santander’s management.
Responsibilities of the Sox Internal Controls area
To help strengthen the SOX Internal Control Model to ensure compliance with the requirements of the Sarbanes-Oxley Act of 2002.
In order to comply with the requirements of this law, Banco Santander adjusted its Internal Controls Model (MCI) to stricter international standards, which are in line with the guidelines established by the Committee of Sponsoring Organizations of the Treadway Commission (COSO), encompassing strategic, operational, financial disclosure and compliance elements.
The methodology includes the following periods for internal certification:
- semiannual certification – beginning of the second half: resulting from the evaluation of the design and operation of the control activities in relation to the first half.
- annual certification – beginning of the following year: resulting from the evaluation of the design and operation of controls in the second half or during the year ended – annual controls are not included in the semiannual certification.
In addition, it prepares a semiannual report to evaluate the quality and compliance of the internal control systems and to identify material distortion risks that may impact the financial statements, as well as evaluate the quality of the internal control environment that permits the correct preparation and disclosure of the financial statements, thus meeting the requirements of the regulatory bodies. The internal controls report considers the entire Internal Controls Model methodology developed, applied and monitored under the SOX System.
BANCO SANTANDER (BRASIL) S.A.
NOTES TO THE CONSOLIDATED FINANCIAL STATEMENTS
(Amounts in thousands of Brazilian Reais - R$, unless otherwise stated)
The main goals of the area are:
• To disseminate the risk management and internal control culture throughout the various levels of the Organization;
• To implement and provide formal maintenance of the Risk and Control Model based on a consistent methodology (COSO and COBIT) accepted by the inspection bodies and including all the relevant areas;
• To document the operational flow, allowing the process to be viewed as a whole, identifying material risks and controls involving the business and the improvement of processes;
• To provide support for the conclusion that the Internal Control Model is appropriate for the nature and complexity of the respective businesses;
• To validate the identified and documented controls in order to mitigate potential material risks of the activities through effectiveness tests in regard to design and operation.
e) Reputational Risk
e.1) Reputational Risk
Reputational risk is the exposure arising from negative public opinion, irrespective of whether this opinion is based on facts or merely on public perception. The reputational risk management is accomplished through responsible involvement in the right business with the right client.
Accordingly Banco Santander aims to offer the most suitable product according to the each customer profile.
e.2) Compliance
The Compliance Risk is the legal risk or regulatory sanctions, financial loss, or damages to the Bank reputation that may suffer as a result of failure to comply with laws, regulations, codes of conduct and good banking practices in the exercise of their activity. The Compliance at Banco Santander has a proactive approach, working in educational processes, monitoring and corporate communications.
The Compliance area operates independently, reporting to Management, Regulatory Compliance Panel, contributing to maintain the reputation and integrity of Banco Santander.
e.3) Directives
a. Compliance principles – Ethics and Conduct in the Securities Markets
The Bank’s ethical principles and conduct parameters are established in internal policies which are made available to all employees. Conduct Code in the Securities Markets and its formal acknowledgement is mandatory to all staff working close to securities markets. Proper communication channels are in place to clarify doubts and complaints from employees, monitoring and controls are conducted in a way that adherence to the rules established is secured.
b. Money Laundering Prevention
The Bank’s money Laundering Prevention policies and terrorism financing prevention are based on the knowledge and rigorousness of the acceptance of new clients, complemented by the continuous scrutiny of all transactions where the Bank are involved in. The importance given to the theme is reflected on the direct involvement of senior management, namely the Operational Money Laundering Prevention and Compliance Committee, which meets each trimester to deliberate on issues regarding the theme and to be directly involved with new clients acceptance and suspicious transactions reporting.
c. New products and services and suitability
All new products and services are debated/analyzed in internal committees on several levels until their risks are completely minimized, the Corporate Commercialization Committee (Comité Corporativo de Comercialización - CCC), integrated by executives of Banco Santander (Spain), being the ultimate approval instance. After the approval these products and services are monitored, in order to identify events in a timely manner that may pose reputational risk, reported to the Commercialization Committee.
BANCO SANTANDER (BRASIL) S.A.
NOTES TO THE CONSOLIDATED FINANCIAL STATEMENTS
(Amounts in thousands of Brazilian Reais - R$, unless otherwise stated)
f) Compliance with the new regulatory framework
The Banco Santander has assumed from the outset a firm commitment to the principles underlying the “Revised Framework of International Convergence of Capital Measurement and Capital Standards” (Basel II). This framework allows entities to make internal estimates of the capital they are required to hold in order to safeguard their solvency against events caused by various types of risk. As a result of this commitment, the Santander Bank has devoted all the human and material resources required to ensure the success of the Basel II implementation plan. For this purpose, a Basel II team was created in the past, consisting of qualified professionals from the Bank’s different areas: mainly Finance, Risks, Technology and Operations, Internal Audit −to verify the whole process, as the last layer of control at the entity−, and Business −particularly as regards the integration of the internal models into management. Additionally, specific work teams have been set up to guarantee the proper management of the most complex aspects of the implementation.
Supplementing the efforts of the Basel II operating team, Santander Bank management has displayed total involvement from the very beginning. Thus, the progress of the project and the implications of the implementation of the New Capital Accord for the Banco Santander have been reported to the management committee and to the board of directors on a regular basis.
In the specific case of credit risk, the implementation of Basel II entails the recognition, for regulatory capital purposes, of the internal models that have been used for management purposes.
The Bank intends to apply, over the next five years, the advanced internal ratings-based (AIRB) approach under Basel II for substantially all its banks, until the percentage of net exposure of the loan portfolio covered by this approach is close to 100%.
Given the medium-low risk profile characterizing Banco Santander’s business activities, since it focuses primarily on commercial banking (SMEs and individuals), and the significant diversification of the Bank’s risk. The Pillar 2 which takes into account the impact of risks not addressed under Pillar 1 (regulatory capital) and the benefits arising from the diversification among risks, businesses and geographical locations.
The Banco Santander continued in 2013 with the project for the progressive implementation of the technology platforms and methodological developments required for the roll-out of the AIRB approaches for regulatory capital calculation purposes. Therefore, the Bank expects to apply advanced approaches for the calculation of regulatory capital requirements at its business units in Brazil in 2016, after the required approval from the supervisory authorities has been obtained.
Regarding the other risks addressed under Pillar I of Basel II, the Banco Santander is developing internal models for market risk and will remain using the standardized method for operational risk, since it considers the premature use of advanced models (AMA) for this purpose . Regarding the Market Risk, Banco Santander presented his candidacy in the second half of 2011, pending approval with the regulators for the use of internal models for calculating regulatory capital.
Pillar 2 is another significant line of action under the Basel II Corporate Framework. In addition to reviewing and strengthening the methodology supporting the economic capital model, the technology was brought into line with the platform supporting Pillar 1, so that all the information on credit risk will come from this source.
Besides the Basel II implementations, Banco Santander is involved with the studies for the implementation of Basel III, as preliminaries guidelines and the schedule released by Bacen. The studies involve methodology for ascertainment of the Regulatory Capital, minimum Requirements of RC’s maintenance, level I from RC and Total Capital and Creation of Additional of Countercyclical Buffers and Conservation.
f.1) Internal validation of risk models
Internal validation is a pre-requisite for the supervisory validation process by Basel II implementation. A specialized unit of the Entity, with sufficient independence, obtains a technical opinion on the adequacy of the internal models for the intended internal or regulatory purposes, and concludes on their usefulness and effectiveness. This unit must also assess whether the risk management and control procedures are adequate for the Entity’s risk strategy and profile.
In addition to complying with the regulatory requirement, the internal validation function provides an essential support to the risk committee and the local risk committees in the performance of their duties to authorize the use of the models (for management and regulatory purposes) and in their regular reviews.
BANCO SANTANDER (BRASIL) S.A.
NOTES TO THE CONSOLIDATED FINANCIAL STATEMENTS
(Amounts in thousands of Brazilian Reais - R$, unless otherwise stated)
Internal model validation at the Banco Santander encompasses credit risk models, market risk models, option pricing models and the economic capital model. The scope of the validation includes not only the more theoretical or methodological aspects, but also the technology systems and the quality of the data they provide, on which their effective operation relies, and, in general, all the relevant aspects of advanced risk management (controls, reporting, uses, involvement of senior management, etc.). Therefore, the aim of internal validation is to review quantitative, qualitative, technological and corporate governance related to Basel aspects.
The internal validation function is located, at corporate level, within the Integrated Risk Control and Internal Risk Validation area (CIVIR) and reports directly to head office (the third deputy chairman of the Bank and to the chairman of the risk committee) in Madrid. This function is performed at a global and corporate level in order to ensure uniformity of application. The need to validate models implemented at different units subject to create four corporate validation centers located in Madrid, London, New York and Sao Paulo. This facilitates the application of a corporate methodology that is supported by a set of tools developed internally by the Banco Santander which provide a robust corporate framework for application at all the Bank’s units and which automate certain verifications to ensure efficient reviews.
It should be noted that the Banco Santander corporate internal validation framework is fully consistent with the internal validation criteria for advanced approaches issued by regulators. Accordingly, the Bank maintains the segregation of functions between internal validation and internal audit, which, in its role as the last layer of control at the Bank, is responsible for reviewing the methodology, tools and work performed by internal validation and for giving its opinion on the degree of effective independence.
f.2) Capital Management
Capital management considers the regulatory and economic aspects and its objective is to achieve an efficient capital structure in terms of cost and compliance, meeting the requirements of the regulatory authorities and supporting to accomplish the goals of the classification of rating agencies and investors' expectations. The capital management includes securitization, sale of assets and raise capital through issuing shares, subordinated liabilities and hybrid instruments.
From an economic standpoint, capital management seeks to optimize value creation at the Bank and at its different business segment. To this end, the economic capital, RORAC (return on risk-adjusted capital) and data about the value creation of each business segment are generated. Within the framework of the internal capital adequacy assessment process (Pillar 2 of the Basel Capital Accord) the Group uses an economic capital measurement model with the objective of ensuring that there is sufficient capital available to support all the risks of its activity in different economic scenarios, with the solvency levels agreed upon by the Group.
In order to adequately manage the Bank’s capital, it is essential to estimate and analyze future needs, in anticipation of the various phases of the business cycle. Projections of regulatory and economic capital are made based on financial projections (balance sheet, income statement, etc.) and on macroeconomic scenarios estimated by the Economic Research Service. These estimates are used by the Bank as a reference to plan the management actions (issues, securitizations, etc.) required to achieve its capital targets and ensure adequate solvency levels.
g) Economic capital
g.1) Main objectives
The development of economic capital models in finance aims to solve a fundamental problem of regulatory capital, Sensitivity Risk.
In this context, the economic capital models are essentially designed to generate risk-sensitive estimates, allowing greater precision in risk management, as well as better allocation of economic capital by business units of Banco Santander.
The Banco Santander has directed efforts to build a model of robust and integrated economic capital to the business management.
The main objectives of the structure of economic capital of the Banco Santander are:
1 - Consolidate Pillar I and other risks which affect business in a single quantitative model, and determine estimates of capital by establishing correlations between different risks;
2 - Quantify and monitor different types of variations in risk;
3 - Distribute capital consumption between the different portfolios and manage the efficiency of return on capital (RORAC);
4 - Estimating the Economic Value Added for each business unit. Economic profit must exceed the cost of the Bank's capital;
5 - Accordance with the regulation in areas where the Bank operates in the review process of Pillar II by supervisors.
BANCO SANTANDER (BRASIL) S.A.
NOTES TO THE CONSOLIDATED FINANCIAL STATEMENTS
(Amounts in thousands of Brazilian Reais - R$, unless otherwise stated)
g.2) The
economic capital
model
In calculating the economic capital, is the Bank's definition of losses to be covered. Thus, is used a confidence interval necessary to ensure business continuity. The confidence interval for the Banco Santander is 99.90% higher than required by Basel II.
The risk profile in Brazil is distributed by Credit risk, Market, ALM, Business, Operations and fixed assets. However, to successfully anticipate the changes proposed in Basel III, new risks have been incorporated to model: Intangibles, pension funds (defined benefit) and tax credits, which allow the Bank to adopt a position even more conservative and prudent.
|
% Capital
|
2013
|
2012
|
2011
|
|||||||||||||
|
Risk Type
|
New Methodology
|
New Methodology
|
Comparison
|
|||||||||||||
|
Credit
|
60 | % | 57 | % | 65 | % | 63 | % | ||||||||
|
Market
|
3 | % | 4 | % | 4 | % | 4 | % | ||||||||
|
ALM
|
8 | % | 5 | % | 6 | % | 7 | % | ||||||||
|
Business
|
8 | % | 8 | % | 9 | % | 9 | % | ||||||||
|
Operational
|
8 | % | 13 | % | 14 | % | 16 | % | ||||||||
|
Fixed Assets
|
1 | % | 1 | % | 1 | % | 1 | % | ||||||||
|
Intangible Assets
|
3 | % | 4 | % | - | - | ||||||||||
|
Pension Funds
|
2 | % | 3 | % | - | - | ||||||||||
|
Deferred Tax Assets
|
7 | % | 5 | % | - | - | ||||||||||
|
TOTAL
|
100 | % | 100 | % | 100 | % | 100 | % | ||||||||
Still, for being a commercial bank, credit is the main source of risk in Banco Santander and evolution of your wallet a leading factor for oscillation
Banco Santander periodically evaluates the level and evolution of RORAC (risk-adjusted return) of the main business units. The RORAC is the quotient of the profit generated on allocated capital, using the following formula:
RoRAC=Profit/Economic Capital
Banco Santander also makes the planning of capital in order to obtain future projections of economic and regulatory capital. The estimates obtained for the Bank are incorporated to different scenarios consistently, including its strategic objectives (organic growth, M & A, payout ratio, credits, etc.). Possible management strategies leading to optimize capital and solvency return of the Bank are identified.
RoRAC
Banco Santander has used the RORAC, with the following objectives:
1 – Analyze and set a minimum price for operations (admission) and clients (monitoring).
2 – Estimate capital consumption of each customer, economic groups, portfolio or business segment, in order to optimize the allocation of economic capital, maximizing the efficiency of the Bank.
3 – Measure and monitor business performance.
To evaluate the operations of global customers, the calculation of economic capital takes into account some variables used in the calculation of expected losses and unexpected.
Among these variables are:
1 – Counterparty rating;
2 – Maturity;
3 – Guarantees;

4 – Type of financing;
The return on capital is determined by the cost of capital. To create value for shareholders, the minimum return operation must exceed the cost of capital of Banco Santander.
BANCO SANTANDER (BRASIL) S.A.
NOTES TO THE CONSOLIDATED FINANCIAL STATEMENTS
(Amounts in thousands of Brazilian Reais - R$, unless otherwise stated)
The table below present a conciliation of shareholders’ equity and net income attributed to the parent between standards adopted in Brazil (BRGAAP) and IFRS, with the conceptual description of the main adjustments:
|
Thousands of Reais
|
Note
|
2013
|
2012
|
2011
|
||||||||||||
|
Shareholders' equity attributed under to the Parent Brazilian GAAP
|
|
62,819,207 | 63,451,508 | 64,428,862 | ||||||||||||
|
IFRS adjustments, net of taxes, when applicable:
|
|
|||||||||||||||
|
Classification of financial instruments at fair value through profit or loss
|
a | 3,367 | 7,032 | 13,840 | ||||||||||||
|
Redesignation of financial instruments to available-for-sale
|
b | 28,912 | 460,340 | 303,686 | ||||||||||||
|
Impairment on loans and receivables
|
c | 155,527 | 80,413 | 1,128,106 | ||||||||||||
|
Deferral of financial fees, commissions and inherent costs under effective
|
||||||||||||||||
|
interest rate method
|
d | 319,533 | 394,823 | 545,763 | ||||||||||||
|
Reversal of goodwill amortization
|
e | 17,060,156 | 13,423,171 | 9,786,227 | ||||||||||||
|
Realization on purchase price adjustments
|
f | 999,510 | 1,068,715 | 708,533 | ||||||||||||
|
Share based payments
|
g | - | - | 34,132 | ||||||||||||
|
Recognition of fair value in the partial sale in subsidiaries
|
h | 112,052 | - | - | ||||||||||||
|
Others
|
(132,063 | ) | 12,994 | (85,820 | ) | |||||||||||
|
Shareholders' equity attributed to the parent under IFRS
|
81,366,201 | 78,898,996 | 76,863,329 | |||||||||||||
|
Non-controlling interest under IFRS
|
289,101 | 237,130 | 18,960 | |||||||||||||
|
Shareholders' equity (including non-controlling interest) under IFRS
|
81,655,302 | 79,136,126 | 76,882,289 | |||||||||||||
|
Thousands of Reais
|
Note
|
2013 | 2012 | 2011 | ||||||||||||
|
Net income attributed to the Parent under Brazilian GAAP
|
2,107,327 | 2,725,748 | 3,548,482 | |||||||||||||
|
IFRS adjustments, net of taxes, when applicable:
|
||||||||||||||||
|
Classification of financial instruments at fair value through profit or loss
|
a | (17,587 | ) | (20,797 | ) | 18,918 | ||||||||||
|
Redesignation of financial instruments to available-for-sale
|
b | 96,213 | (118,847 | ) | 18,402 | |||||||||||
|
Impairment on loans and receivables
|
c | 75,114 | (628,474 | ) | 907,516 | |||||||||||
|
Deferral of financial fees, commissions and inherent costs under effective
|
||||||||||||||||
| interest rate method | d | (75,290 | ) | (150,940 | ) | 245,763 | ||||||||||
|
Reversal of goodwill amortization
|
e | 3,636,985 | 3,636,944 | 3,103,452 | ||||||||||||
|
Realization on purchase price adjustments
|
f | (69,205 | ) | (59,037 | ) | 69,013 | ||||||||||
|
Recognition of fair value in the partial sale in subsidiaries
|
h | 112,052 | - | - | ||||||||||||
|
Others
|
(142,115 | ) | 98,009 | (172,342 | ) | |||||||||||
|
Net income attributed to the parent under IFRS
|
5,723,494 | 5,482,606 | 7,739,204 | |||||||||||||
|
Non-controlling interest under IFRS
|
124,630 | 10,618 | 7,928 | |||||||||||||
|
Net income (including non-controlling interest) under IFRS
|
5,848,124 | 5,493,224 | 7,747,132 | |||||||||||||
a) Classification of financial instruments at fair value through profit or loss:
Under BRGAAP, all loans and receivables and deposits are accounted for at amortized cost. Under IFRS, in accordance with IAS 39 “Financial Instruments: Recognition and Measurement” the financial assets can be measured at fair value and included in the category as “other financial assets at fair value through profit or loss” to eliminate or significantly reduce the accounting mismatch the recognition or measurement derived from measuring assets or liabilities or recognizing gains or losses on them on different bases, which are managed and their performance evaluated on the basis of fair value. Thus, the Bank classified loans, financing and deposits that meet these parameters, as the "other financial assets at fair value through profit or loss", as well as certain debt instruments classified as “available for sale” under BRGAAP. The Bank has selected such classification basis as it eliminates an accounting mismatch in the recognition of income and expenses.
b) Redesignation of financial instruments to available-for-sale:
Under BRGAAP, the Bank accounts some investments, for example, in debt securities at amortized cost and equity securities at cost. At the time of preparing this balance sheet, management revised its strategy for managing their investments and in accordance with the premises of the Central Bank Circular 3.068, were reclassified debt securities category for "negotiation" with record in fair value through profit or loss. Under IFRS, the Bank has classified these investments as available for sale, measuring them at fair value with changes recognized in the "Consolidated statements of comprehensive income", within the scope of IAS 39 "Financial Instruments: Recognition and Measurement", which does not allow reclassification of any financial instrument for the fair value through profit or loss category after initial recognition.
BANCO SANTANDER (BRASIL) S.A.
NOTES TO THE CONSOLIDATED FINANCIAL STATEMENTS
(Amounts in thousands of Brazilian Reais - R$, unless otherwise stated)
c) Impairment on loans and receivables:
On the income refers to the adjust based on estimated losses on loans and receivables portfolio, which was established with based on historical loss of impairment and other circumstances known at the time of evaluation, according to the guidance provided by IAS 39 "Financial Instruments: Recognition and Measurement. These criteria differ in certain aspects of the criteria adopted under BRGAAP, which uses certain regulatory limits set by the Central Bank. Additionally, the equity accumulated adjustments of the allocation of purchase price when the acquisition of Banco Real, according to the requirements of IFRS 3 "Business Combinations".
d) Deferral of financial fees, commissions and other costs under effective interest rate method:
Under IFRS, in accordance with IAS 39 “Financial Instruments: Recognition and Measurement”, financial fees, commissions and other costs that are integral part of effective interest rate of financial instruments measured at amortized cost are recognized in profit or loss over the term of the corresponding contracts. Under BRGAAP these fees and expenses are recognized directly as income when received or paid.
e) Reversal of goodwill amortization:
Under BRGAAP, goodwill is amortized systematically over a period up to 10 years and additionally, the goodwill recorded is measured annually or whenever there is any indication that the asset may be impaired. Under IFRS, in accordance with IAS 38 “Intangible Assets”, goodwill is not amortized, but instead, is tested for impairment, at least annually, and whenever there is an indication that the goodwill may be impaired; comparing its recoverable amount with its carrying value. The tax amortization of goodwill of Banco ABN Amro Real SA represents a difference between book and tax basis of a permanent nature and definitive as the possibility of future use of resources to settle a tax liability is considered remote by management, supported by the opinion of expert external advisors. The tax amortization of goodwill is permanent and definitive, and therefore does not apply to the recognition of a deferred tax liability in accordance with IAS 12, on temporary differences.
f) Realization on purchase price adjustments:
As part of the allocation of the purchase price related to the acquisition of Banco Real, following the requirements of IFRS 3, the Bank has recognized the assets and liabilities of the acquiree to fair value, including identifiable intangible assets with finite lives. Under BRGAAP, in a business combination, the assets and liabilities are kept at their book value. This purchase price adjustment relates substantially to the following items:
• The appropriation related to the value of assets in the loan portfolio. The initial recognition of value of the loans at fair value, adjustment to the yield curve of the loan portfolio in comparison to its nominal value, which is appropriated by its average realization period.
• The amortization of the identified intangible assets with finite lives over their estimated useful lives.
g) Share based payments:
Banco Santander has a local long-term compensation plans linked to payments based in shares. According to IFRS 2 "share based payments", the amount of shares to be paid should be measured at the fair value and accounted in equity, while in BRGAAP it is accounted in "Other Payables - Other". ". In January 2012, the BRGAAP began to adopt CMN Resolution 3,989/11, which eliminated this difference with IFRS.
h) Recognition of fair value in the partial disposal of investments in subsidiaries
Under IFRS, in accordance with IFRS 10 "Consolidated Financial Statements" on partial disposal of a permanent investment, fair value is recognized over the remaining portion. Under BRGAAP, this type of operation, ongoing participation is maintained by its book value.
BANCO SANTANDER (BRASIL) S.A.
NOTES TO THE CONSOLIDATED FINANCIAL STATEMENTS
(Amounts in thousands of Brazilian Reais - R$, unless otherwise stated)
Plan to Optimize the Capital Structure
On September 26, 2013, the Company disclosed a Material Fact announcing that, in order to optimize its capital structure, the Board of Directors submitted a proposal to optimize the composition of Banco Santander’s regulatory capital to the shareholders for their approval ("PR Optimization Plan"). The aim is to establish a more efficient capital structure, consistent with the new prudent capital rules and aligned with Banco Santander’s business plan and asset growth. The PR Optimization Plan has the following items: (i) the redistribution of equity to the shareholders of Banco Santander in the total amount of R$6,000,000, with no reduction in the number of shares; (ii) the issuance abroad of capital instruments to compose Tier I and Tier II of Banco Santander’s regulatory capital and; (iii) a bonus share program and an adjustment in the composition of the Units, followed by a reverse share split (inplit), with the purpose of eliminating trading in cents.
Equity Distributions
On November 1st, 2013, the proposals for return of funds to shareholders was approved on Shareholders’ Meeting. In January 2014, conditions for effective recovery of resources (during the period of opposition from unsecured creditors, approval by the Bacen and filing the minutes of the meeting at the Junta Comercial do Estado de São Paulo - JUCESP). According to the Notices to the Market published on January 7, 2014
1
were entitled the Equity Distributions all holders of Units or shares of the Bank on January 14, 2014, include, and the Bank's shares and Units will be traded ex-rights to the Equity Distributions as from January 15, 2014. Payment to shareholders occurred on January 29, 2014.
Issuance of Notes
On January 14, 2014 the Board of Directors approved the issuance of notes outside Brazil, in dollars, amounting to R$6,000,000. The issuance of Notes held on January 29, 2014 having been fully paid by the shareholders of the Bank.
The specific characteristics of the Notes issued to compose the Tier I are: (a) Notional
2
: US$1,247,713, equivalent to R$3,000,000, (b) Interest Rate: 7.375% p.a. (c) Maturity: The Tier I Notes shall be perpetual; (d) Frequency of interest payment: interest will be paid quarterly from April 29, 2014. The specific characteristics of the Notes issued to form the Tier II are: (a) Notional
2
: US$1,247,713, equivalent to R$3,000,000 (b) Interest Rate: 6.0% p.a. (c) Maturity: the Tier II Notes will mature on January 29, 2024, and (d) Frequency of interest payment: interest payable semi-annually from July 29, 2014.
The Notes have the following main characteristics in common: ( a) unitary value of, at least, US$150 and integral multiples of US$1.00 at that exceeds this minimum value , ( b ) The Notes may be redeemed or repurchased by Banco Santander ( 1 ) after the 5th anniversary from the date of issue of the Notes , the Bank at its own initiative or due to change in tax laws applicable to the Notes , or ( 2 ) at any time , because of the occurrence of certain regulatory events ; ( c ) the credits from the Notes may be granted as paid in capital increase of the Bank with the subsequent issuance of ordinary and preferred shares issued by the Bank , to the extent necessary to compose Units, if certain regulatory events defined in CMN Resolution 4.192/13 are verified , in which case the Bank will promote an increase in share capital , subject to the preemptive rights to all shareholders to subscribe for new ordinary and preferred shares .
Banco Santander will request for Bacen's approval for the Notes compose the Tier I and Tier II regulatory capital.
Bonus and Grouping of Shares
It is estimated that the last step of the PR Optimization Plan - the bonus shares and adjust the composition of the Units and reverse shares split - should be brought to the ordinary general meeting in the first quarter of 2014.
(1) Related to U.S. Record Date, the date of payment or any other further information may be obtained through the website:www.adr.com.
(2) Translated for rate as reported by Bacen at January 27, 2014 for reais into dollars of R$2.4044 to U.S. $ 1.00.
BANCO SANTANDER (BRASIL) S.A.
NOTES TO THE CONSOLIDATED FINANCIAL STATEMENTS
(Amounts in thousands of Brazilian Reais - R$, unless otherwise stated)
|
Adjusted
|
||||||||||||||||||
|
Directly and Indirectly controlled by Banco Santander (Brasil) S.A.
|
Participation %
|
Stockholders'
|
||||||||||||||||
|
Activity
|
Direct
|
Indirect
|
Equity
|
Net Income
|
||||||||||||||
|
Banco Bandepe S.A.
|
Bank
|
100.00 | % | 100.00 | % | 2,944,279 | 105,150 | |||||||||||
|
Santander Leasing S.A. Arrendamento Mercantil
|
Leasing
|
78.57 | % | 99.99 | % | 5,034,417 | 218,424 | |||||||||||
|
Aymoré Crédito, Financiamento e Investimento S.A.
|
Financial
|
100.00 | % | 100.00 | % | 1,054,375 | 58,816 | |||||||||||
|
Santander Brasil Administradora de Consórcio Ltda.
(2)
|
Buying club
|
100.00 | % | 100.00 | % | 127,038 | 24,292 | |||||||||||
|
Santander Microcrédito Assessoria Financeira S.A.
|
Microcredit
|
100.00 | % | 100.00 | % | 21,392 | 3,277 | |||||||||||
|
Santander Brasil Advisory Services S.A.
|
Other Activities
|
96.52 | % | 96.52 | % | 12,914 | 806 | |||||||||||
|
CRV Distribuidora de Títulos e Valores Mobiliários S.A.
|
Dealer
|
100.00 | % | 100.00 | % | 29,108 | 4,986 | |||||||||||
|
Santander Corretora de Câmbio e Valores Mobiliários S.A.
|
Broker
|
99.99 | % | 100.00 | % | 261,947 | 60,509 | |||||||||||
|
Santander Participações S.A.
|
Holding
|
100.00 | % | 100.00 | % | 1,252,642 | 84,081 | |||||||||||
|
Santander Getnet
(1)
|
Other Activities
|
50.00 | % | 50.00 | % | 113,866 | 98,847 | |||||||||||
|
Sancap Investimentos e Participações S.A.
|
Holding
|
100.00 | % | 100.00 | % | 370,459 | 92,179 | |||||||||||
|
Mantiq Investimentos Ltda.
|
Other Activities
|
100.00 | % | 100.00 | % | 6,937 | 754 | |||||||||||
|
Santos Energia Participações S.A.
|
Holding
|
100.00 | % | 100.00 | % | 82,448 | (3,051 | ) | ||||||||||
|
Santander Brasil EFC
|
Financial
|
100.00 | % | 100.00 | % | 2,444,438 | 23,113 | |||||||||||
|
Santander S.A. Serviços Técnicos, Administrativos e de Corretagem de Seguros
|
Insurance Broker
|
60.65 | % | 60.65 | % | 587,926 | 189,261 | |||||||||||
|
Controlled by Santander Serviços
|
||||||||||||||||||
|
Webcasas S.A.
|
Other Activities
|
- | 100.00 | % | 23,972 | (528 | ) | |||||||||||
|
Controlled by Sancap
|
||||||||||||||||||
|
Santander Capitalização S.A.
|
Savings and annuities
|
- | 100.00 | % | 213,035 | 85,289 | ||||||||||||
|
Ablasa Participações S.A.
|
Holding
|
- | 100.00 | % | 22,675 | 225 | ||||||||||||
|
Controlled by Santos Energia Participações S.A.
|
||||||||||||||||||
|
Central Eólica Santo Antônio de Pádua S.A.
|
Wind Power
|
- | 100.00 | % | 22,215 | (173 | ) | |||||||||||
|
Central Eólica São Cristovão S.A.
|
Wind Power
|
- | 100.00 | % | 40,029 | (243 | ) | |||||||||||
|
Central Eólica São Jorge S.A.
|
Wind Power
|
- | 100.00 | % | 42,432 | (193 | ) | |||||||||||
|
Brazil Foreign Diversified Payment Rights Finance Company
(a)
|
Securitization
|
- |
(a)
|
- | - | |||||||||||||
|
Santander FIC FI Contract I Referenciado DI
(a)
|
Investment Fund
|
- |
(a)
|
- | - | |||||||||||||
|
Santander Fundo de Investimento Unix Multimercado Crédito Privado
(a)
|
Investment Fund
|
- |
(a)
|
- | - | |||||||||||||
|
Santander Fundo de Investimento Diamantina Multimercado Crédito Privado de Investimento no Exterior
(a)
|
Investment Fund
|
- |
(a)
|
- | - | |||||||||||||
|
Santander Fundo de Investimento Amazonas Multimercado Crédito Privado de Investimento no Exterior
(a)
|
Investment Fund
|
- |
(a)
|
- | - | |||||||||||||
|
Santander Fundo de Investimento SBAC Referenciado DI Crédito Privado
(a)
|
Investment Fund
|
- |
(a)
|
- | - | |||||||||||||
|
Santander Fundo de Investimento Guarujá Multimercado Crédito Privado de Investimento no Exterior
(a)
|
Investment Fund
|
- |
(a)
|
- | - | |||||||||||||
|
Santander Fundo de Investimento Financial Curto Prazo
(a)
|
Investment Fund
|
- |
(a)
|
- | - | |||||||||||||
|
Santander Fundo de Investimento Capitalization Renda Fixa
(a)
|
Investment Fund
|
- |
(a)
|
- | - | |||||||||||||
|
Santander Paraty QIF PLC
(a)
|
Investment Fund
|
- |
(a)
|
- | - | |||||||||||||
BANCO SANTANDER (BRASIL) S.A.
NOTES TO THE CONSOLIDATED FINANCIAL STATEMENTS
(Amounts in thousands of Brazilian Reais - R$, unless otherwise stated)
(a) Company over which effective control is exercised, according with IFRS 10 - Consolidated Financial Statements, and there is no ownership interest.
(1) Banco Santander has authority to make decisions related to business strategy. Additionally, Banco Santander allows Getnet the use of its branch network and brand for the sale of products, which among other factors determines the Bank's control of Getnet.
(2) At meetings held on July 25, 2012, the Board of Directors of Santander Consórcios and Santander Brasil Consórcios agreed and decided to submit for approval from their respective partners, the incorporation propose of Santander Consórcios (Incorporated) by Santander Brasil Consórcio (Incorporator) (Incorporation) which was approved at meeting of the Partners Incorporated and Incorporator on July 31, 2012. The merger will give through the transfer of the net book value of incorporated for the stockholders’ equity of the incorporator, based on the audited balance sheet at June 30, 2012. The equity variations occurred between the base date of that balance sheet and the effectiveness of the incorporation (the date of the Contract Amendment) were recognized and recorded directly on the incorporator. On November 30, 2012 this process of incorporation was approved by the Bacen.
***
F-129
TABLE OF CONTENTS
Part IItem 1. Identity Of Directors, Senior Management and AdvisersItem 2. Offer Statistics and Expected TimetableItem 3. Key InformationItem 4 . Information on The CompanyItem 4A. Unresolved Staff CommentsItem 5. Operating and Financial Review and ProspectsItem 6 . Directors, Senior Management and EmployeesItem 7 . Major Shareholders and Related Party TransactionsItem 8. Financial InformationItem 9. The Offer and ListingItem 10. Additional InformationItem 11. Quantitative and Qualitative Disclosures About RiskItem 12. Description Of Securities Other Than Equity SecuritiesPart IIItem 13. Defaults, Dividend Arrearages and DelinquenciesItem 14. Material Modifications To The Rights Of Security Holders and Use Of ProceedsItem 15. Controls and ProceduresItem 16. [reserved]Item 16A. Audit Committee Financial ExpertItem 16B. Code Of EthicsItem 16C . Principal Accountant Fees and ServicesItem 16D . Exemptions From The Listing Standards For Audit CommitteesItem 16E . Purchases Of Equity Securities By The Issuer and Affiliated PurchasersItem 16F . Change in Registrant S Certifying AccountantItem 16G. Corporate GovernanceItem 16H . Mine Safety DisclosurePart IIIItem 17. Financial StatementsItem 18. Financial StatementsItem 19. ExhibitsNote 41-d Contains A Detail Of The Residual Maturity Periods Of Loans and Receivables and Of The Related Average Interest RatesNote 41-d Contains A Detail Of The Residual Maturity Periods Of Other Financial Assets and Liabilities At Each Year-end