UNITED STATES
SECURITIES AND EXCHANGE COMMISSION
Washington, D.C. 20549
FORM 10-K
(Mark One)
|
☒
|
ANNUAL REPORT PURSUANT TO SECTION 13 OR 15(d) OF THE SECURITIES EXCHANGE ACT OF 1934
|
For the fiscal year ended December 31, 2020.
or
|
☐
|
TRANSITION REPORT PURSUANT TO SECTION 13 OR 15(d) OF THE SECURITIES EXCHANGE ACT OF 1934
|
For the transition period from to
Commission file number:
001-38656
BANK7 CORP.
(Exact name of registrant as specified in its charter)
|
Oklahoma
|
|
20-0764349
|
|
(State or other jurisdiction of incorporation or organization)
|
|
(I.R.S. Employer Identification Number)
|
|
1039 N.W. 63
rd
Street, Oklahoma City, Oklahoma
|
|
73116
|
|
(Address of principal executive offices)
|
|
(Zip Code)
|
Registrant’s telephone number, including area code:
(405) 810-8600
Securities registered pursuant to Section 12(b) of the Act:
|
Title of each class
|
Trading
Symbol(s)
|
Name of each exchange on which registered
|
|
Common Stock, $0.01 par value
|
BSVN
|
The NASDAQ Global Select Market
|
Securities registered pursuant to Section 12(g) of the Act: None
Indicate by check mark if the registrant is a well-known seasoned issuer, as defined in Rule 405 of the Securities Act. YES ☐ NO ☒
Indicate by check mark if the registrant is not required to file reports pursuant to Section 13 or Section 15(d) of the Act. YES ☐ NO ☒
Indicate by check mark whether the Registrant (1) has filed all reports required to be filed by Section 13 or 15(d) of the Securities Exchange Act of 1934 during the preceding 12 months (or for such shorter period that the
registrant was required to file such reports), and (2) has been subject to such filing requirements for the past 90 days. YES ☒ NO ☐
Indicate by check mark whether the registrant has submitted electronically and posted on its corporate website, if any, every Interactive Data File required to be submitted and posted pursuant to Rule 405 of Regulation S-T
during the preceding 12 months (or for such shorter period that the Registrant was required to submit and post such files). YES ☒ NO ☐
Indicate by check mark whether the registrant is a large accelerated filer, an accelerated filer, a non-accelerated filer, a smaller reporting company, or an “emerging growth company”. See definitions of “large accelerated
filer,” “accelerated filer,” “smaller reporting company” and “emerging growth company” in Rule 12b-2 of the Exchange Act. (Check one):
|
Large accelerated filer ☐
|
Accelerated filer ☐
|
|
Non-accelerated filer ☒
|
Smaller reporting company ☐
|
|
Emerging growth company ☒
|
If an emerging growth company, indicate by check mark if the registrant has elected not to use the extended transition period for complying with any new or revised financial accounting standards
provided pursuant to Section 13(a) of the Exchange Act. ☐
Indicate by checkmark whether the registrant has filed a report on and attestation to its management's assessment of the effectiveness of its internal control over financial reporting under Section
404(b) of the Sarbanes-Oxley Act (15 U.S.C. 7262(b)) by the registered public accounting firm that prepared or issued its audit report. ☐
Indicate by check mark whether the registrant is a shell company (as defined in Rule 12b-2 of the Act). YES ☐ NO ☒
As of June 30, 2020, the aggregate market value of the registrant's common stock held by non-affiliates of the registrant was $31,303,776 based on the closing sale price as reported on the NASDAQ Global Market Select System.
As of March 22, 2021, the registrant had 9,049,422 shares of common stock, par value $0.01, outstanding.
DOCUMENTS INCOPORATED BY REFERENCE
Portions of the Proxy Statement for the Registrant’s Annual Meeting of Shareholders to be held on May 20, 2021 are incorporated into Part III of this Annual Report on Form 10-K.
|
PART I
|
|
|
1
|
|
|
11
|
|
|
22
|
|
|
22
|
|
|
23
|
|
|
23
|
|
|
PART II
|
|
|
23
|
|
|
24
|
|
|
30
|
|
|
53
|
|
|
55
|
|
| 98 | |
| 98 | |
| 99 | |
|
PART III
|
|
| 99 | |
| 99 | |
| 99 | |
| 99 | |
| 99 | |
|
PART IV
|
|
| 99 | |
|
101
|
|
|
102
|
|
| 99 |
Item 1. Business
Company Overview
We are Bank7 Corp., a bank holding company headquartered in Oklahoma City, Oklahoma. Through our wholly-owned subsidiary, Bank7, we operate nine full-service branches in Oklahoma, the
Dallas/Fort Worth metropolitan area and Kansas. We were formed in 2004 in connection with our acquisition of First National Bank of Medford, which was renamed Bank7 (the “Bank”). We are focused on serving business owners and entrepreneurs by
delivering fast, consistent and well-designed banking solutions. As of December 31, 2020, we had total assets of $1.0 billion, total loans of $836.6 million, total deposits of $905.5 million and total shareholders’ equity of $107.3 million.
Our website is: www.bank7.com. We make available free of charge through our website, our annual report on Form 10-K, our quarterly reports on Form 10-Q, current reports on Form 8-K,
and amendments to those reports as soon as reasonably practicable after they have been electronically filed or furnished with the Securities and Exchange Commission. Information included on our website is not incorporated into this filing.
Products and Services
We are a full-service commercial bank. We focus on the development of deep business relationships with our commercial customers and their principals. We also focus on providing
customers with exceptional service and meeting their banking needs through a wide variety of commercial and retail financial services.
We have a particular focus in the following loan categories (i) commercial real estate lending, (ii) hospitality lending, (iii) energy lending, and (iv) commercial and industrial
lending. We also provide consumer lending services to individuals for personal and household purposes, including secured and unsecured term loans and home improvement loans. Consumer lending services include (i) residential real estate loans and
mortgage banking services, (ii) personal lines of credit, (iii) loans for the purchase of automobiles, and (iv) other installment loans.
We also offer deposit banking products, including (i) commercial deposit services, commercial checking, money market, and other deposit accounts, and (ii) retail deposit services such
as certificates of deposit, money market accounts, checking accounts, negotiable order of withdrawal accounts, savings accounts, and automated teller machine access.
Strategic Focus
Our success is driven by:
|
•
|
the development of deep business relationships with our commercial customers and their principals;
|
|
•
|
disciplined growth without compromising our asset quality or credit culture;
|
|
•
|
drawing upon years of executive level experience at multi-billion dollar banks;
|
|
•
|
efficiencies gained by adherence to automated and repeatable processes; and
|
|
•
|
investing in our people and technology.
|
We will continue to focus on daily execution, making sound credit decisions and maintaining cost discipline, which have been the hallmark of our success. Our customers will remain our
top priority as we focus on efficiently providing tailored banking products and services to business owners and entrepreneurs, with a goal of generating robust growth and delivering exceptional returns to our shareholders. Additionally, our bank
will continue to position itself for future growth both organically and through strategic acquisitions.
Cost Discipline and Efficiency
We constantly monitor expenditures, and, when appropriate, we use automation, technology and repeatable processes to drive profitability through industry leading efficiencies. We
operate as few branches as practical, and the branches we do operate are smaller and more cost efficient than many of our peers’ branches. As we continue to grow, we expect our utilization of automation, technology, and repeatable processes will
continue to drive efficiencies throughout the Bank. Combining talented people with process automation will enable us to scale even further, and will also enable us to deliver consistently superior customer service.
Organic Growth
Much of our historic asset growth has been driven organically and within our current markets. In particular the Dallas/Fort Worth metropolitan area, Oklahoma City, and Tulsa, where we
recently opened a full-service branch, contain ample opportunities for us to grow our customer base and increase our loans and deposits. Although our expansion with brick and mortar branches will be limited, we believe operating strategically placed
branches will be important, and therefore we will continue to selectively build our presence in key markets. We also intend to continually enhance our internet and mobile banking products to remain competitive in the marketplace.
Markets
We are headquartered in Oklahoma City, Oklahoma, and we operate four additional branches in Oklahoma. We also operate two branches in the Dallas/Fort Worth metropolitan area and two
branches in Kansas.
Competition
The banking and financial services industry is highly competitive, and we compete with a wide range of financial institutions within our markets, including local, regional and
national commercial banks and credit unions. We also compete with mortgage companies, trust companies, brokerage firms, consumer finance companies, mutual funds, securities firms, insurance companies, third-party payment processors, financial
technology, or Fintech, companies and other financial intermediaries for certain of our products and services. Some of our competitors are not subject to the regulatory restrictions and level of regulatory supervision applicable to us.
Interest rates on loans and deposits, as well as prices on fee-based services, are typically significant competitive factors within the banking and financial services industry. Many
of our competitors are much larger financial institutions that have greater financial resources than we do and compete aggressively for market share. These competitors attempt to gain market share through their financial product mix, pricing
strategies and banking center locations. Other important competitive factors in our industry and markets include office locations and hours, quality of customer service, community reputation, continuity of personnel and services, capacity and
willingness to extend credit, and ability to offer excellent banking products and services. While we seek to remain competitive with respect to fees charged, interest rates and pricing, we believe that our broad suite of financial solutions, our
high-quality customer service culture, our positive reputation and our long-standing community relationships enable us to compete successfully within our markets and enhance our ability to attract and retain customers.
Human Capital
Our corporate culture is defined by core values which include integrity, accountability, professionalism, community-focused and efficiency. We value our employees by investing in
competitive compensation and benefit packages and fostering a team environment centered on professional service and open communication. Attracting, retaining and developing qualified, engaged employees who embody these values are crucial our success.
We offer all of our employees a comprehensive benefits package that includes medical, dental and vision insurance, a flexible spending plan, group life insurance, short-term and long-term disability insurance, a traditional 401(k) Plan, competitive
paid time off/paid holidays, and competitive incentives.
We are committed and focused on the health and safety of our employees, customers, and communities and are committed to providing a safe and secure work environment in accordance with
applicable labor, safety, health, anti-discrimination and other workplace laws. We strive for all of our employees to feel safe at work. To that end, we maintain a whistleblower hotline that allows associates and others to anonymously voice concerns.
We prohibit retaliation against an individual who reported a concern or assisted with an inquiry or investigation.
The COVID-19 pandemic presented challenges to maintain employee and customer safety while continuing to be open for business. Accordingly, we launched a proactive response to the
escalating COVID-19 outbreak that included securing and distributing the necessary PPE to all locations, enacting all applicable government-mandated/CDC-recommended guidelines for safe social distancing (including the installation of plexiglass
barriers, floor spacing markers and hand-sanitizer stations), and increasing emphasis on facility cleaning.
Supervision and Regulation
General
We are extensively regulated under U.S. federal and state law. As a result, our growth and earnings performance may be affected not only by management decisions and general economic
conditions, but also by federal and state statutes and by the regulations and policies of various bank regulatory agencies, including the Oklahoma Banking Department (“OBD”), the Federal Reserve, the Federal Deposit Insurance Corporation (“FDIC”) and
the Consumer Financial Protection Bureau (“CFPB”). Furthermore, tax laws administered by the Internal Revenue Service (“IRS”) and state taxing authorities, accounting rules developed by the Financial Accounting Standards Board (“FASB”), securities
laws administered by the Securities and Exchange Commission (“SEC”) and state securities authorities and Anti-Money Laundering (“AML”) laws enforced by the U.S. Department of the Treasury, or Treasury, also impact our business.
Federal and state banking laws impose a comprehensive system of supervision, regulation and enforcement on the operations of banks, their holding companies and their affiliates. These
laws are intended primarily for the protection of depositors, customers and the Depositor Insurance Fund of the FDIC (“DIF”) rather than for shareholders. Federal and state laws, and the related regulations of the bank regulatory agencies, affect,
among other things, the scope of business, the kinds and amounts of investments banks may make, reserve requirements, capital levels relative to operations, the nature and amount of collateral for loans, the establishment of branches, the ability to
merge, consolidate and acquire, dealings with insiders and affiliates and the payment of dividends.
This supervisory and regulatory framework subjects banks and bank holding companies to regular examination by their respective regulatory agencies, which results in examination
reports and ratings that, while not publicly available, can affect the conduct and growth of their businesses. These examinations consider not only compliance with applicable laws and regulations, but also capital levels, asset quality and risk,
management’s ability and performance, earnings, liquidity and various other factors. These regulatory agencies have broad discretion to impose restrictions and limitations on the operations of a regulated entity and exercise enforcement powers over a
regulated entity (including terminating deposit insurance, imposing orders, fines and other civil and criminal penalties, removing officers and directors and appointing supervisors and conservators) where the agencies determine, among other things,
that such operations are unsafe or unsound, fail to comply with applicable law or are otherwise inconsistent with laws and regulations or with the supervisory policies of these agencies.
Regulatory Capital Requirements
The federal banking agencies require that banking organizations meet several risk-based capital adequacy requirements. The current risk-based capital standards applicable to the
Company and the Bank are based on the Basel III Capital Rules established by the Basel Committee on Banking Supervision (the “Basel Committee”). The Basel Committee is a committee of central banks and bank supervisors/regulators from the major
industrialized countries that develops broad policy guidelines for use by each country’s supervisors in determining the supervisory policies they apply. The requirements are intended to ensure that banking organizations have adequate capital given
the risk levels of assets and off-balance sheet financial instruments.
The Basel III Capital Rules require the Bank and the Company to comply with four minimum capital standards: a Tier 1 leverage ratio of at least 4.0%; a CET1 to risk-weighted assets of
4.5%; a Tier 1 capital to risk-weighted assets of at least 6.0%; and a total capital to risk-weighted assets of at least 8.0%. The calculation of all types of regulatory capital is subject to definitions, deductions and adjustments specified in the
regulations.
The Basel III Capital Rules also require a “capital conservation buffer” of 2.5% above the regulatory minimum risk-based capital requirements. The capital conservation buffer is
designed to absorb losses during periods of economic stress and effectively increases the minimum required risk-weighted capital ratios. Banking institutions with a ratio of CET1 to risk-weighted assets below the effective minimum (4.5% plus the
capital conservation buffer) are subject to limitations on certain activities, including payment of dividends, share repurchases and discretionary bonuses to executive officers based on the amount of the shortfall.
As of December 31, 2020, the Company’s and the Bank’s capital ratios exceeded the minimum capital adequacy guideline percentage requirements under the Basel III Capital Rules on a
fully phased-in basis.
Prompt Corrective Action
The Federal Deposit Insurance Act requires federal banking agencies to take “prompt corrective action” with respect to depository institutions that do not meet minimum capital
requirements. For purposes of prompt corrective action, the law establishes five capital tiers: “well-capitalized,” “adequately capitalized,” “undercapitalized,” “significantly undercapitalized,” and “critically undercapitalized.” A depository
institution’s capital tier depends on its capital levels and certain other factors established by regulation. Under the applicable FDIC regulations, an institution is deemed to be “well-capitalized” if it has a total risk-based capital ratio of 10.0%
or greater, a Tier 1 risk-based capital ratio of 8.0% or greater, a CET1 ratio of 6.5% or greater and a leverage ratio of 5.0% or greater.
At each lower capital category, a bank is subject to increased restrictions on its operations. For example, a bank is generally prohibited from making capital distributions and paying
management fees to its holding company if doing so would make the bank “undercapitalized.” Asset growth and branching restrictions apply to undercapitalized banks, which are required to submit written capital restoration plans meeting specified
requirements (including a guarantee by the parent holding company, if any). “Significantly undercapitalized” banks are subject to broad regulatory restrictions, including among other things, capital directives, forced mergers, restrictions on the
rates of interest they may pay on deposits, restrictions on asset growth and activities, and prohibitions on paying bonuses or increasing compensation to senior executive officers without FDIC approval. “Critically undercapitalized” are subject to
even more severe restrictions, including, subject to a narrow exception, the appointment of a conservator or receiver within 90 days after becoming critically undercapitalized.
The appropriate federal banking agency may determine (after notice and opportunity for a hearing) that the institution is in an unsafe or unsound condition or deems the institution to
be engaging in an unsafe or unsound practice. The appropriate agency is also permitted to require an adequately capitalized or undercapitalized institution to comply with the supervisory provisions as if the institution were in the next lower
category (but not treat a significantly undercapitalized institution as critically undercapitalized) based on supervisory information other than the capital levels of the institution.
The capital classification of a bank affects the frequency of regulatory examinations, the bank’s ability to engage in certain activities and the deposit insurance premium paid by the
bank. A bank’s capital category is determined solely for the purpose of applying prompt correct action regulations and the capital category may not accurately reflect the bank’s overall financial condition or prospects.
As of December 31, 2020, the Bank met the requirements for being deemed “well-capitalized” for purposes of the prompt corrective action regulations.
The Company
General
. As a bank holding company, the Company is subject to regulation and supervision by the Federal Reserve under the Bank Holding Company Act of 1956, as amended, or the
BHCA. Under the BHCA, the Company is subject to periodic examination by the Federal Reserve. The Company is required to file with the Federal Reserve periodic reports of its operations and such additional information as the Federal Reserve may
require.
Acquisitions, Activities and Change in Control
. The BHCA generally requires the prior approval by the Federal Reserve for any merger involving a bank holding company or a bank
holding company’s acquisition of more than 5% of a class of voting securities of any additional bank or bank holding company or to acquire all or substantially all of the assets of any additional bank or bank holding company.
Subject to certain conditions (including deposit concentration limits established by the BHCA and the Dodd-Frank Act), the Federal Reserve may allow a bank holding company to acquire
banks located in any state of the United States. Federal law also prohibits any person or company from acquiring “control” of an FDIC-insured depository institution or its holding company without prior notice to the appropriate federal bank
regulator.
Permitted Activities
.
The BHCA generally prohibits the Company from controlling or engaging in any business other
than that of banking, managing and controlling banks or furnishing services to banks and their subsidiaries. This general prohibition is subject to a number of exceptions. The principal exception allows bank holding companies to engage in, and to own
shares of companies engaged in, certain businesses found by the Federal Reserve prior to November 11, 1999 to be “so closely related to banking as to be a proper incident thereto.” This authority would permit the Company to engage in a variety of
banking-related businesses, including the ownership and operation of a savings association, or any entity engaged in consumer finance, equipment leasing, the operation of a computer service bureau (including software development) and mortgage banking
and brokerage. The BHCA generally does not place territorial restrictions on the domestic activities of nonbank subsidiaries of bank holding companies. The Federal Reserve has the power to order any bank holding company or its subsidiaries to
terminate any activity or to terminate its ownership or control of any subsidiary when the Federal Reserve has reasonable grounds to believe that continuing such activity, ownership or control constitutes a serious risk to the financial soundness,
safety or stability of any bank subsidiary of the bank holding company.
Source of Strength
. Federal Reserve policy historically required bank holding companies to act as a source of financial and managerial strength to their subsidiary banks. The
Dodd-Frank Act codified this policy as a statutory requirement. Under this requirement the Company is expected to commit resources to support the Bank, including at times when the Company may not be in a financial position to provide it. The Company
must stand ready to use its available resources to provide adequate capital to the Bank during periods of financial stress or adversity. The Company must also maintain the financial flexibility and capital raising capacity to obtain additional
resources for assisting the Bank. The Company’s failure to meet its source of strength obligations may constitute an unsafe and unsound practice or a violation of the Federal Reserve’s regulations or both. The source of strength obligation most
directly affects bank holding companies where a bank holding company’s subsidiary bank fails to maintain adequate capital levels. Any capital loans by a bank holding company to the subsidiary bank are subordinate in right of payment to deposits and
to certain other indebtedness of the subsidiary bank. The BHCA provides that in the event of a bank holding company’s bankruptcy any commitment by a bank holding company to a federal bank regulatory agency to maintain the capital of its subsidiary
bank will be assumed by the bankruptcy trustee and entitled to priority of payment.
Safe and Sound Banking Practices
. Bank holding companies and their non-banking subsidiaries are prohibited from engaging in activities that represent unsafe and unsound banking
practices or that constitute a violation of law or regulations. Under certain conditions the Federal Reserve may conclude that certain actions of a bank holding company, such as a payment of a cash dividend, would constitute an unsafe and unsound
banking practice. The Federal Reserve also has the authority to regulate the debt of bank holding companies, including the authority to impose interest rate ceilings and reserve requirements on such debt. Under certain circumstances the Federal
Reserve may require a bank holding company to file written notice and obtain its approval prior to purchasing or redeeming its equity securities, unless certain conditions are met.
Dividend Payments, Stock Redemptions and Repurchases
. The Company’s ability to pay dividends to its shareholders is affected by both general corporate law considerations and
the regulations and policies of the Federal Reserve applicable to bank holding companies, including the Basel III Capital Rules. Generally, an Oklahoma corporation may not make distributions to its shareholders if (i) after giving effect to the
dividend, the corporation would be insolvent, or (ii) the amount of the dividend exceeds the surplus of the corporation. Dividends may be declared and paid in a corporation’s own treasury shares that have been reacquired by the corporation out of
surplus. Dividends may be declared and paid in a corporation’s own authorized but unissued shares out of the surplus of the corporation upon the satisfaction of certain conditions.
It is the Federal Reserve’s policy that bank holding companies should generally pay dividends on common stock only out of income available over the past year, and only if prospective
earnings retention is consistent with the organization’s expected future needs and financial condition. It is also the Federal Reserve’s policy that bank holding companies should not maintain dividend levels that undermine their ability to be a
source of strength to its banking subsidiaries. Additionally, the Federal Reserve has indicated that bank holding companies should carefully review their dividend policy and has discouraged payment ratios that are at maximum allowable levels unless
both asset quality and capital are very strong.
Bank holding companies must consult with the Federal Reserve before redeeming any equity or other capital instrument included in Tier 1 or Tier 2 capital (or, for small bank holding
companies like the Company, before redeeming any instruments included in equity as defined under GAAP) prior to stated maturity, if such redemption could have a material effect on the level or composition of the organization’s capital base. In
addition, bank holding companies are unable to repurchase shares equal to 10% or more of its net worth if it would not be well-capitalized (as defined by the Federal Reserve) after giving effect to such repurchase. Bank holding companies experiencing
financial weaknesses, or that are at significant risk of developing financial weaknesses, must consult with the Federal Reserve before redeeming or repurchasing common stock or other regulatory capital instruments.
The Bank
General
. The Bank is an Oklahoma-chartered member bank and is subject to examination, supervision and regulation by the OBD and the Federal Reserve. The Bank is also subject to
certain regulations of the FDIC and the CFPB.
The OBD supervises and regulates all areas of the Bank’s operations including, without limitation, the making of loans, the issuance of securities, the conduct of the Bank’s corporate
affairs, the satisfaction of capital adequacy requirements, the payment of dividends, and the establishment or closing of banking offices. The Federal Reserve is the Bank’s primary federal regulatory agency, and periodically examines the Bank’s
operations and financial condition and compliance with federal law. In addition, the Bank’s deposit accounts are insured by the DIF to the maximum extent provided under federal law and FDIC regulations, and the FDIC has certain enforcement powers
over the Bank.
Depositor Preference
. In the event of the “liquidation or other resolution” of an insured depository institution, the claims of depositors of the institution, including the
claims of the FDIC as subrogee of insured depositors, and certain claims for administrative expenses of the FDIC as a receiver, will have priority over other general unsecured claims against the institution. If an insured depository institution
fails, insured and uninsured depositors, along with the FDIC, will have priority in payment ahead of unsecured, non-deposit creditors including the parent bank holding company with respect to any extensions of credit they have made to that insured
depository institution.
Deposit Insurance
. As an FDIC-insured institution, the Bank is required to pay deposit insurance premiums to the FDIC. The amount of such premiums is determined by multiplying
the institution’s assessment rate by its assessment base. The assessment base is based on the institution’s risk classification which is assigned based on the institution’s capital levels and the level of supervisory concern the institution poses to
the regulators. The assessment rate is calculated as the institution’s average consolidated total assets minus average tangible equity.
Additionally, the Dodd-Frank Act altered the minimum designated reserve ratio of the DIF, increasing the minimum from 1.15% to 1.35% of the estimated amount of total insured deposits,
and eliminating the requirement that the FDIC pay dividends to depository institutions when the reserve ratio exceeds certain thresholds. At least semi-annually, the FDIC updates its loss and income projections for the DIF and, if needed, may
increase or decrease the assessment rates, following notice and comment on proposed rulemaking. As a result, the Bank’s FDIC deposit insurance premiums could increase.
Examination Assessments
. Oklahoma-chartered banks are required to pay an annual fee of $1,000 to the OBD to fund its operations. In addition, Oklahoma-chartered banks are
charged an examination assessment calculated based on the amount of the Bank’s assets at rates established by the Oklahoma Banking Board. During the year ended December 31, 2020, the Bank paid examination assessments to the OBD totaling $126,000.
Capital Requirements
. Banks are generally required to maintain minimum capital ratios. For a discussion of the capital requirements applicable to the Bank, see “—Regulatory
Capital Requirements” above.
Bank Reserves
. The Federal Reserve requires all depository institutions to maintain reserves against some transaction accounts (primarily NOW and Super NOW checking accounts).
The balances maintained to meet the reserve requirements imposed by the Federal Reserve may be used to satisfy liquidity requirements. An institution may borrow from the Federal Reserve “discount window” as a secondary source of funds if the
institution meets the Federal Reserve’s credit standards.
Dividend Payments
. The primary source of funds for the Company is dividends from the Bank. Unless the approval of the Federal Reserve is obtained, the Bank may not declare or
pay a dividend if the total of all dividends declared during the calendar year, including the proposed dividend, exceeds the sum of the Bank’s net income during the current calendar year and the retained net income of the prior two calendar years.
Oklahoma law also places restrictions on the declaration of dividends by Oklahoma state-chartered banks, including the Bank, to their shareholders. Before any dividend may be declared by the Bank, not less than 10% of the net profits of the Bank must
be transferred to a surplus fund until the surplus equals 100% of the Bank’s capital stock. This may decrease any amount available for the payment of dividends in a particular period if the surplus funds for the Bank fail to comply with this
limitation. Furthermore, the approval of the Commissioner of the OBD is required if the total of all dividends declared by the Bank in any calendar year exceed the total of its net profits of that year combined with its retained net profits of the
preceding two years, less any required transfers to surplus or a fund for the retirement of any preferred stock. The Federal Reserve and the OBD also may, under certain circumstances, prohibit the payment of dividends to us from the Bank. Oklahoma
corporate law also requires that dividends can only be paid out of funds legally available therefor.
The payment of dividends by any financial institution is affected by the requirement to maintain adequate capital pursuant to applicable capital adequacy guidelines and regulations,
and a financial institution generally is prohibited from paying any dividends if, following payment thereof, the institution would be undercapitalized. As described above, the Bank exceeded its minimum capital requirements under applicable regulatory
guidelines as of December 31, 2020.
Transactions with Affiliates
. The Bank is subject to sections 23A and 23B of the Federal Reserve Act, or the Affiliates Act, and the Federal Reserve’s implementing Regulation
W. An affiliate of a bank is any company or entity that controls, is controlled by or is under common control with the bank. Accordingly, transactions between the Company, the Bank and any non-bank subsidiaries will be subject to a number of
restrictions. The Affiliates Act imposes restrictions and limitations on the Bank from making extensions of credit to, or the issuance of a guarantee or letter of credit on behalf of, the Company or other affiliates, the purchase of, or investment
in, stock or other securities thereof, the taking of such securities as collateral for loans, and the purchase of assets of the Company or other affiliates. Such restrictions and limitations prevent the Company or other affiliates from borrowing from
the Bank unless the loans are secured by marketable obligations of designated amounts. Furthermore, such secured loans and investments by the Bank to or in the Company or to or in any other non-banking affiliate are limited, individually, to 10% of
the Bank’s capital and surplus, and such transactions are limited in the aggregate to 20% of the Bank’s capital and surplus. All such transactions, as well as contracts entered into between the Bank and affiliates, must be on terms that are no less
favorable to the Bank than those that would be available from non-affiliated third parties. Federal Reserve policies also forbid the payment by bank subsidiaries of management fees which are unreasonable in amount or exceed the fair market value of
the services rendered or, if no market exists, actual costs plus a reasonable profit.
Loans to Directors, Executive Officers and Principal Shareholders
. The authority of the Bank to extend credit to its directors, executive officers and principal shareholders,
including their immediate family members and corporations and other entities that they control, is subject to substantial restrictions and requirements under the Federal Reserve’s Regulation O, as well as the Sarbanes-Oxley Act. These statutes and
regulations impose limits the amount of loans the Bank may make to directors and other insiders and require that the loans must be made on substantially the same terms, including interest rates and collateral, as prevailing at the time for comparable
transactions with persons not affiliated with the Company or the Bank, that the Bank must follow credit underwriting procedures at least as stringent as those applicable to comparable transactions with persons who are not affiliated with the Company
or the Bank; and that the loans must not involve a greater than normal risk of non-payment or include other features not favorable to the Bank. Furthermore, the Bank must periodically report all loans made to directors and other insiders to the bank
regulators. As of December 31, 2020, the Bank had no lines of credit for loans to insiders and no loans outstanding to insiders.
Limits on Loans to One Borrower
. As an Oklahoma state-chartered bank, the Bank is subject to limits on the amount of loans it can make to one borrower. With certain limited
exceptions, loans and extensions of credit from Oklahoma state-chartered banks outstanding to any borrower (including certain related entities of the borrower) at any one time may not exceed 30% of the capital, less intangible assets, of the bank. An
Oklahoma state-chartered bank may lend an additional amount if the loan is fully secured by certain types of collateral, like bonds or notes of the United States. Certain types of loans are exempted from the lending limits, including loans secured by
segregated deposits held by the bank. The Bank’s legal lending limit to any one borrower was $34.6 million as of December 31, 2020.
Safety and Soundness Standards/Risk Management
. The federal banking agencies have adopted guidelines establishing operational and managerial standards to promote the safety and
soundness of federally insured depository institutions. The guidelines set forth standards for internal controls, information systems, internal audit systems, loan documentation, credit underwriting, interest rate exposure, asset growth,
compensation, fees and benefits, asset quality and earnings.
If an institution fails to comply with any of the standards set forth in the guidelines, the financial institution’s primary federal regulator may require the institution to submit a
plan for achieving and maintaining compliance. If a financial institution fails to submit an acceptable compliance plan, or fails in any material respect to implement a compliance plan that has been accepted by its primary federal regulator, the
regulator is required to issue an order directing the institution to cure the deficiency. Until the deficiency cited in the regulator’s order is cured, the regulator may restrict the financial institution’s rate of growth, require the financial
institution to increase its capital, restrict the rates the institution pays on deposits or require the institution to take any action the regulator deems appropriate under the circumstances. Noncompliance with the standards established by the safety
and soundness guidelines may also constitute grounds for other enforcement action by the federal bank regulatory agencies, including cease and desist orders and civil money penalty assessments.
Branching Authority
. New branches must be approved by the Federal Reserve and the OBD, which consider a number of factors, including financial history, capital adequacy,
earnings prospects, character of management, needs of the community and consistency with corporate power. The Dodd-Frank Act permits insured state banks to engage in interstate branching if the laws of the state where the new banking office is to be
established would permit the establishment of the banking office if it were chartered by a bank in such state. Finally, we may also establish banking offices in other states by merging with banks or by purchasing banking offices of other banks in
other states, subject to certain restrictions.
Interstate Deposit Restrictions
. The Interstate Act, together with the Dodd-Frank Act, relaxed prior branching restrictions under federal law by permitting, subject to
regulatory approval, banks to establish branches in states where the laws permit banks chartered in such states to establish branches.
Section 109 of the Interstate Act prohibits a bank from establishing or acquiring a branch or branches outside of its home state primarily for the purpose of deposit production.
Community Reinvestment Act
. The CRA directs the federal bank regulatory agencies, in examining insured depository institutions, to assess their record of helping to meet the
credit needs of their entire community, including low- and moderate- income neighborhoods, consistent with safe and sound banking practices. The CRA further requires the agencies to take a financial institution’s record of meeting its community
credit needs into account when evaluating applications for, among other things, domestic branches, consummating mergers or acquisitions or holding company formations.
The federal banking agencies have adopted regulations which measure a bank’s compliance with its CRA obligations on a performance-based evaluation system. This system bases CRA
ratings on an institution’s actual lending service and investment performance rather than the extent to which the institution conducts needs assessments, documents community outreach or complies with other procedural requirements. The ratings range
from a high of “outstanding” to a low of “substantial noncompliance.” The Bank had a CRA rating of “satisfactory” as of its most recent CRA assessment.
Anti-Money Laundering and the Office of Foreign Assets Control Regulation
. The USA PATRIOT Act is designed to deny terrorists and criminals the ability to obtain access to the
U.S. financial system and has significant implications for depository institutions, brokers, dealers and other businesses involved in the transfer of money. The USA PATRIOT Act substantially broadened the scope of United States AML laws and
regulations by imposing significant compliance and due diligence obligations, created new crimes and penalties and expanded the extra territorial jurisdiction of the United States. Financial institutions are also prohibited from entering into
specified financial transactions and account relationships, must use enhanced due diligence procedures in their dealings with certain types of high-risk customers and must implement a written customer identification program. Financial institutions
must take certain steps to assist government agencies in detecting and preventing money laundering and report certain types of suspicious transactions. Regulatory authorities routinely examine financial institutions for compliance with these
obligations and have imposed cease and desist orders and civil money penalties against institutions found to be in violation of these obligations.
Likewise, OFAC administers and enforces economic and trade sanctions against targeted foreign countries and regimes under authority of various laws, including designated foreign
countries, nationals and others. OFAC publishes lists of specially designated targets and countries. Financial institutions are responsible for, among other things, blocking accounts of and transactions with such targets and countries, prohibiting
unlicensed trade and financial transactions with them and reporting blocked transactions after their occurrence.
Failure of a financial institution to maintain and implement adequate AML and OFAC programs, or to comply with all of the relevant laws or regulations, could have serious legal and
reputational consequences for the institution, including causing applicable bank regulatory authorities not to approve merger or acquisition transactions when regulatory approval is required or to prohibit such transactions even if approval is not
required.
Consumer Financial Services
We are subject to a number of federal and state consumer protection laws that extensively govern our relationship with our customers. These laws include the ECOA, the Fair Credit
Reporting Act, the Truth in Lending Act, the Truth in Savings Act, the Electronic Fund Transfer Act, the Expedited Funds Availability Act, the Home Mortgage Disclosure Act, the Fair Housing Act, the Real Estate Settlement Procedures Act, the Fair
Debt Collection Practices Act, the Service Members Civil Relief Act, the Military Lending Act, and these laws’ respective state law counterparts, as well as state usury laws and laws regarding unfair and deceptive acts and practices. These and other
federal laws, among other things, require disclosures of the cost of credit and terms of deposit accounts, provide substantive consumer rights, prohibit discrimination in credit transactions, regulate the use of credit report information, provide
financial privacy protections, prohibit unfair, deceptive and abusive practices and subject us to substantial regulatory oversight. Violations of applicable consumer protection laws can result in significant potential liability from litigation
brought by customers, including actual damages, restitution and attorneys’ fees. Federal bank regulators, state attorneys general and state and local consumer protection agencies may also seek to enforce consumer protection requirements and obtain
these and other remedies, including regulatory sanctions, customer rescission rights, action by the state and local attorneys general in each jurisdiction in which we operate and civil money penalties. Failure to comply with consumer protection
requirements may also result in failure to obtain any required bank regulatory approval for mergers or acquisitions or prohibition from engaging in such transactions even if approval is not required.
Rulemaking authority for most federal consumer protection laws was transferred from the prudential regulators to the CFPB on July 21, 2011. In some cases, regulators such as the
Federal Trade Commission and the DOJ also retain certain rulemaking or enforcement authority. The CFPB also has broad authority to prohibit unfair, deceptive and abusive acts and practices, or UDAAP, and to investigate and penalize financial
institutions that violate this prohibition. While the statutory language of the Dodd-Frank Act sets forth the standards for acts and practices that violate the prohibition on UDAAP, certain aspects of these standards are untested, and thus it is
currently not possible to predict how the CFPB will exercise this authority.
The consumer protection provisions of the Dodd-Frank Act and the examination, supervision and enforcement of those laws and implementing regulations by the CFPB have created a more
intense and complex environment for consumer finance regulation. The CFPB has significant authority to implement and enforce federal consumer protection laws and new requirements for financial services products provided for in the Dodd-Frank Act, as
well as the authority to identify and prohibit UDAAP. The review of products and practices to prevent such acts and practices is a continuing focus of the CFPB, and of banking regulators more broadly. The ultimate impact of this heightened scrutiny
is uncertain but could result in changes to pricing, practices, products and procedures. It could also result in increased costs related to regulatory oversight, supervision and examination, additional remediation efforts and possible penalties. In
addition, the Dodd-Frank Act provides the CFPB with broad supervisory, examination and enforcement authority over various consumer financial products and services, including the ability to require reimbursements and other payments to customers for
alleged legal violations and to impose significant penalties, as well as injunctive relief that prohibits lenders from engaging in allegedly unlawful practices. The CFPB also has the authority to obtain cease and desist orders providing for
affirmative relief or monetary penalties. The Dodd-Frank Act does not prevent states from adopting stricter consumer protection standards. State regulation of financial products and potential enforcement actions could also adversely affect our
business, financial condition or results of operations.
The CFPB has examination and enforcement authority over providers with more than $10 billion in assets. Banks and savings institutions with $10 billion or less in assets, like the
Bank, will continue to be examined by their applicable bank regulators.
Federal Banking Agency Incentive Compensation Guidance
The federal bank regulatory agencies have issued comprehensive guidance intended to ensure that the incentive compensation policies of banking organizations do not undermine the
safety and soundness of those organizations by encouraging excessive risk-taking. The incentive compensation guidance sets expectations for banking organizations concerning their incentive compensation arrangements and related risk-management,
control and governance processes. The incentive compensation guidance, which covers all employees that have the ability to materially affect the risk profile of an organization, either individually or as part of a group, is based upon three primary
principles: (1) balanced risk-taking incentives; (2) compatibility with effective controls and risk management; and (3) strong corporate governance. Any deficiencies in compensation practices that are identified may be incorporated into the
organization’s supervisory ratings, which can affect its ability to make acquisitions or take other actions. In addition, under the incentive compensation guidance, a banking organization’s federal supervisor may initiate enforcement action if the
organization’s incentive compensation arrangements pose a risk to the safety and soundness of the organization. Further, the Basel III capital rules limit discretionary bonus payments to bank executives if the institution’s regulatory capital ratios
fail to exceed certain thresholds. Although the federal bank regulatory agencies proposed additional rules in 2016 related to incentive compensation for all banks with more than $1.0 billion in assets, which would include the Company and the Bank,
those rules have not been finalized and the scope and content of the U.S. banking regulators’ policies on executive compensation are continuing to develop and are likely to continue evolving in the near future.
Financial Privacy
The federal bank regulatory agencies have adopted rules that limit the ability of banks and other financial institutions to disclose non-public information about consumers to
non-affiliated third parties. These limitations require disclosure of privacy policies to consumers and, in some circumstances, allow consumers to prevent disclosure of certain personal information to a non-affiliated third party. These regulations
affect how consumer information is transmitted through financial services companies and conveyed to outside vendors. In addition, consumers may also prevent disclosure of certain information among affiliated companies that is assembled or used to
determine eligibility for a product or service, such as that shown on consumer credit reports and asset and income information from applications. Consumers also have the option to direct banks and other financial institutions not to share information
about transactions and experiences with affiliated companies for the purpose of marketing products or services.
Impact of Monetary Policy
The monetary policy of the Federal Reserve has a significant effect on the operating results of financial or bank holding companies and their subsidiaries. Among the tools available
to the Federal Reserve to affect the money supply are open market transactions in U.S. government securities, changes in the discount rate on member bank borrowings and changes in reserve requirements against member bank deposits. These tools are
used in varying combinations to influence overall growth and distribution of bank loans, investments and deposits, and their use may affect interest rates charged on loans or paid on deposits.
Changes in Laws, Regulations or Policies
Other legislative and regulatory initiatives which could affect the Company, the Bank and the banking industry in general may be pending, proposed or introduced before the U.S.
Congress, the Oklahoma Legislature and other governmental bodies from time to time. Such proposals, if enacted, may further alter the structure, regulation and competitive relationship among financial institutions, and may subject the Company or the
Bank to increased regulation, disclosure and reporting requirements. In addition, the various banking regulatory agencies often adopt new rules and regulations to implement and enforce existing legislation. It cannot be predicted whether, or in what
form, any such legislation or regulations may be enacted or the extent to which the business of the Company or the Bank would be affected thereby.
Item 1A. Risk Factors
We believe the risks described below are the risks that are material to us. Any of the following risks, as well as risks that we do not know or currently deem
immaterial, could have a material adverse effect on our business, financial condition, results of operations and growth prospects.
Risks Relating to Our Business and Market
Our business is concentrated in, and largely dependent upon, the continued growth and welfare of our markets, and adverse economic conditions in these markets
could negatively impact our operations and customers.
Our business is affected by the economy of Oklahoma, the Dallas/Fort Worth metropolitan area and Kansas, our primary markets. Our success depends to a significant extent upon the business activity,
population, income levels, employment trends, deposits and real estate activity in these markets. The Oklahoma economy has been generally steady, if not increasing, in the past few years. The housing market remains strong with prices having increased
through 2020. Vacancy rates for commercial properties remain low and small business owners are increasingly considering bank borrowings in order to grow. However, in early March 2020, the economic outlook changed dramatically due to multiple events,
including: the COVID-19 virus, possible supply chain disruption, an increasing risk of recession, and in some cases, fear of the unknown.
In addition, market developments may affect consumer confidence levels and may cause adverse changes in payment patterns, causing increases in delinquencies and default rates, which
could impact our charge-offs and provision for credit losses. Adverse changes in economic conditions in these markets could reduce our growth in loans and deposits, impair our ability to collect our loans, increase our problem loans and charge-offs
and otherwise negatively affect our performance and financial condition.
We have credit exposure to the energy industry.
The energy industry is a significant sector in our Oklahoma market, and to a lesser extent, Kansas and the Dallas/Fort Worth metropolitan area. A downturn or lack of growth in the
energy industry and energy-related business, including sustained low oil or gas prices or the failure of oil or gas prices to rise in the future, could adversely affect our business, financial condition and results of operations. As of December 31,
2020, our energy loans, which include loans to exploration and production companies, midstream companies, purchasers of mineral and royalty interests and service providers totaled $101.9 million, or 12.1% of total loans, as compared to $102.1
million, or 14.4% of total loans as of December 31, 2019. In addition to our direct exposure to energy loans, we also have indirect exposure to energy prices, as some of our non-energy customers' businesses are directly affected by volatility with
the oil and gas industry and energy prices and otherwise are dependent on energy-related businesses. As of December 31, 2020, we had $10.7 million in unfunded commitments to borrowers in the oil and gas industry. We expect prolonged depressed pricing
pressure on oil and gas to lead to increased credit stress in our energy portfolio, increased losses associated with our energy portfolio, increased utilization of our contractual obligations to extend credit and weaker demand for energy lending.
General uncertainty resulting from continued volatility could have other adverse impacts, such as job losses in industries tied to energy, decreased spending habits, lower borrowing needs, higher transaction deposit balances or a number of other
effects that are difficult to isolate or quantify, particularly in markets with significant dependence on the energy industry like Oklahoma, and to a lesser extent Kansas and the Dallas/Fort Worth metropolitan area, all of which could have an adverse
effect on our business, financial condition and results of operations.
We have credit exposure to the hospitality industry.
The Company has loan exposure to the hospitality industry, primarily through loans made to construct or finance the operation of hotels. At December 31, 2020, this exposure was
approximately $194.3 million, or 23.2%, of the total loan portfolio, along with an additional $65 million in unfunded debt, as compared to $167 million, or 23.6%, of the total loan portfolio, along with an additional $39.4 million in unfunded debt as
of December 31, 2019. The hospitality industry is subject to changes in the travel patterns of business and leisure travelers, both of which are affected by the strength of the economy, as well as other factors. The performance of the hospitality
industry has traditionally been closely linked with the performance of the general economy and, specifically, growth in gross domestic product. Changes in travel patterns of both business and leisure travelers, particularly during periods of economic
contraction or low levels of economic growth, may create difficulties for the industry over the long-term. Although we have made a large portion of our hospitality loans to long-term, well-established hotel operators in strategic locations, a general
downturn in the supply growth of such markets or hotel occupancy or room rates could negatively impact the borrowers’ ability to repay. A significant loss in this portfolio could materially and adversely affect the Company’s financial condition and
results of operations. Our customers in the hospitality industry may be particularly susceptible to a material decline in revenues resulting from decreased travel and leisure activities following the outbreak of COVID-19.
The continued economic impacts of the coronavirus ("COVID-19") could adversely affect our business activities, financial condition and results of operations.
Our business is dependent upon the willingness and ability of our customers to conduct banking and other financial transactions. Beginning in early 2020, COVID-19 spread across the
world, including the U.S. The spread of COVID-19 caused severe disruptions in the U.S. economy, regional quarantines, business shutdowns, high unemployment, disruptions to supply chains, and overall economic instability. The pandemic’s ultimate
impact on our business will depend on highly uncertain and unpredictable future developments, including the magnitude and duration of the pandemic and actions taken by governmental authorities in response to the pandemic, particularly within our
geographic footprint. The pandemic and resultant governmental action have severely restricted economic activity and resulted in a general deterioration in economic conditions. Many businesses saw a steep decline in revenue and have endured temporary
closures or are operating at reduced capacities, some of which are our borrowers. The pandemic’s impact on our customer’s businesses has resulted in the recognition of credit losses in our loan portfolios and increases in our allowance for credit
losses and such effects may continue if the economy continues to worsen or more clients draw on their lines of credit or seek additional loans to help finance their businesses.
Additionally, the COVID-19 pandemic has significantly affected the financial markets and has resulted in a number of Federal Reserve actions. Market interest rates declined
significantly in March 2020 and have remained at lower rates throughout 2020 into 2021. On March 3, 2020, the 10-year Treasury yield fell below 1.00% for the first time, and the Federal Reserve reduced the target federal funds rate by 50 basis points
to 1.00% to 1.25%. On March 15, 2020, the Federal Reserve further reduced the target federal funds rate by 100 basis points to 0.00% to 0.25% and announced a $700 billion quantitative easing program in response to the expected economic downturn
caused by the COVID-19 pandemic. The Federal Reserve reduced the interest that it pays on excess reserves from 1.60% to 1.10% on March 3, 2020, and then to 0.10% on March 15, 2020. These prolonged reductions in interest rates, have adversely affected
our net interest income and margins and our profitability.
These negative economic conditions have negatively impacted our financial results and are expected to have a continued adverse effect on our business, including adversely impacting the demand for our
products and services, our net interest income and our liquidity and regulatory capital requirements.
We have a concentration in commercial real estate lending that could cause our regulators to restrict our ability to grow.
As a part of their regulatory oversight, the federal regulators have issued guidance on Concentrations in Commercial Real Estate Lending, Sound Risk Management Practices, or the CRE
Concentration Guidance, with respect to a financial institution’s concentrations in CRE lending activities. The CRE Concentration Guidance identifies certain concentration levels that, if exceeded, will expose the institution to additional
supervisory analysis with regard to the institution’s CRE concentration risk. The CRE Concentration Guidance is designed to promote appropriate levels of capital and sound loan and risk management practices for institutions with a concentration of
CRE loans. In general, the CRE Concentration Guidance establishes the following supervisory criteria as preliminary indications of possible CRE concentration risk: (1) the institution’s total construction, land development and other land loans
represent 100% or more of total capital; or (2) total CRE loans as defined in this guidance, or Regulatory CRE, represent 300% or more of total capital, and the institution’s Regulatory CRE has increased by 50% or more during the prior 36-month
period. Pursuant to the CRE Concentration Guidance, loans secured by owner occupied CRE are not included for purposes of the CRE concentration calculation. As of December 31, 2020, our Regulatory CRE represented 343.8% of our total Bank capital and
our construction, land development and other land loans represented 93.5% of our total Bank capital, as compared to 322.6% and 66.3% as of December 31, 2019, respectively. During the prior 36-month period, our Regulatory CRE has increased 87.3%. We
are actively working to manage our Regulatory CRE concentration, and we believe that our underwriting policies, management information systems, independent credit administration process, and monitoring of real estate loan concentrations are currently
sufficient to address the CRE Concentration Guidance. We have implemented enhanced CRE monitoring techniques as expected by banking regulators as our concentrations have approached or exceeded the regulatory guidance. Nevertheless, the Federal
Reserve could become concerned about our CRE loan concentrations, and it could limit our ability to grow by restricting its approvals for the establishment or acquisition of branches, or approvals of mergers or other acquisition opportunities, or by
requiring us to raise additional capital, reduce our loan concentrations or undertake other remedial actions.
Because a portion of our loan portfolio is comprised of real estate loans, negative changes in the economy affecting real estate values and liquidity could impair
the value of collateral securing our real estate loans and result in loan and other losses.
Adverse developments affecting real estate values, particularly in Oklahoma City and the Dallas/Fort Worth metropolitan area, could increase the credit risk associated with our real
estate loan portfolio. Real estate values may experience periods of fluctuation, and the market value of real estate can fluctuate significantly in a short period of time. Adverse changes affecting real estate values and the liquidity of real estate
in one or more of our markets could increase the credit risk associated with our loan portfolio, and could result in losses that adversely affect credit quality, financial condition and results of operation. Negative changes in the economy affecting
real estate values and liquidity in our market areas could significantly impair the value of property pledged as collateral on loans and affect our ability to sell the collateral upon foreclosure without a loss or additional losses. Collateral may
have to be sold for less than the outstanding balance of the loan, which could result in losses on such loans. Such declines and losses could have a material adverse impact on our business, results of operations and growth prospects. If real estate
values decline, it is also more likely that we would be required to increase our allowance, which could adversely affect our business, financial condition and results of operations.
Many of our loans are to commercial borrowers, which have a higher degree of risk than other types of loans.
As of December 31, 2020, we had approximately $829 million of commercial purpose loans, which include general commercial, energy, agricultural, and CRE loans, representing
approximately 98.8% of our gross loan portfolio. Commercial purpose loans are often larger and involve greater risks than other types of lending. Because payments on these loans are often dependent on the successful operation or development of the
property or business involved, their repayment is more sensitive than other types of loans to adverse conditions in the real estate market or the general economy.
Accordingly, a downturn in the real estate market or the general economy could heighten our risk related to commercial purpose loans, particularly energy and CRE loans. Unlike
residential mortgage loans, which generally are made on the basis of the borrowers’ ability to make repayment from their employment and other income and which are secured by real property whose value tends to be more easily ascertainable, commercial
purpose loans typically are made on the basis of the borrowers’ ability to make repayment from the cash flow of the commercial venture. If the cash flow from business operations is reduced, the borrowers’ ability to repay the loan may be impaired. As
a result of the larger average size of each commercial purpose loan as compared with other loans such as residential loans, as well as the collateral which is generally less readily marketable, losses incurred on a small number of commercial purpose
loans could have a material adverse impact on our financial condition and results of operations.
Our largest loan relationships make up a material percentage of our total loan portfolio
.
As of December 31, 2020, our 20 largest borrowing relationships ranged from approximately $13 million to $31.6 million (including unfunded commitments) and totaled approximately
$363.4 million in total commitments (representing, in the aggregate, 34.7% of our total outstanding commitments as of December 31, 2020). Of these 20 relationships, $235.6 million were originated from the Oklahoma market, with the remaining $127.7
million extended to borrowers located in the Dallas/Fort Worth metropolitan area. Each of the loans associated with these relationships has been underwritten in accordance with our underwriting policies and limits. Along with other risks inherent in
these loans, such as the deterioration of the underlying businesses or property securing these loans, this concentration of borrowers presents a risk that, if one or more of these relationships were to become delinquent or suffer default, we could be
exposed to material losses. The allowance for loan losses may not be adequate to cover losses associated with any of these relationships, and any loss or increase in the allowance would negatively affect our earnings and capital. Even if these loans
are adequately collateralized, an increase in classified assets could harm our reputation with our regulators and inhibit our ability to execute our business plan.
Our largest deposit relationships currently make up a material percentage of our deposits and the withdrawal of deposits by our largest depositors could force us
to fund our business through more expensive and less stable sources.
At December 31, 2020, our 20 largest deposit relationships accounted for 33.6% of our total deposits. Withdrawals of deposits by any one of our largest depositors or by one of our
related customer groups could force us to rely more heavily on borrowings and other sources of funding for our business and withdrawal demands, adversely affecting our net interest margin and results of operations. We may also be forced, as a result
of withdrawals of deposits, to rely more heavily on other, potentially more expensive and less stable funding sources. Additionally, such circumstances could require us to raise deposit rates in an attempt to attract new deposits, which would
adversely affect our results of operations. Under applicable regulations, if the Bank were no longer “well capitalized,” the Bank would not be able to accept brokered deposits without the approval of the FDIC.
A substantial portion of our loan portfolio consists of loans maturing within one year, and there is no guarantee that these loans will be replaced upon maturity
or renewed on the same terms or at all.
As of December 31, 2020, approximately 43.2% of our gross loans were maturing within one year, compared to approximately 41.7% of our gross loans that were maturing within one year as
of December 31, 2019. As a result, we will either need to renew or replace these loans during the course of the year. There is no guarantee that these loans will be originated or renewed by borrowers on the same terms or at all, as demand for such
loans may decrease. Furthermore, there is no guarantee that borrowers will qualify for new loans or that existing loans will be renewed by us on the same terms or at all, as collateral values may be insufficient or the borrowers’ cash flow may be
materially less than when the loan was initially originated. This could result in a significant decline in the size of our loan portfolio.
Our allowance for loan losses may not be adequate to cover our actual loan losses, which could adversely affect our earnings.
We maintain an allowance for loan losses in an amount that we believe is appropriate to provide for losses inherent in the portfolio. While we strive to carefully monitor credit
quality and to identify loans that may become nonperforming, at any time there are loans included in the portfolio that will result in losses but that have not been identified as nonperforming or potential problem loans. We cannot be sure that we
will be able to identify deteriorating loans before they become nonperforming assets or that we will be able to limit losses on those loans that are identified. As a result, future additions to the allowance may be necessary. Additionally, future
additions may be required based on changes in the loans comprising the portfolio and changes in the financial condition of borrowers, such as may result from changes in economic conditions or as a result of incorrect assumptions by management in
determining the allowance. Federal banking regulators, as an integral part of their supervisory function, periodically review our allowance for loan losses. These regulatory agencies may require us to increase our provision for loan losses or to
recognize further loan charge-offs based upon their judgments, which may be different from ours. Any increase in the allowance for loan losses could have a negative effect on our financial condition and results of operations. Commercial and
commercial real estate loans comprise a significant portion of our total loan portfolio. These types of loans typically are larger than residential real estate loans and other consumer loans. Because our loan portfolio contains a significant
number of commercial and commercial real estate loans with relatively large balances, the deterioration of one or a few of these loans may cause a significant increase in nonperforming assets. An increase in nonperforming loans could result in a
loss of earnings from these loans, an increase in the allowance for loan losses, or an increase in loan charge-offs, which could have an adverse impact on our results of operations and financial condition.
One of our senior loan officers is responsible for a material portion of our loan originations and the loss of such officer could adversely affect our business,
financial condition and results of operation.
Since joining the Bank in August 2015, one senior loan officer in the Dallas/Fort Worth metropolitan area, has originated 24.1% of our total loan portfolio as of December 31, 2020.
This senior loan officer is subject to a noncompetition agreement but the loss of his expertise and ability, could have an adverse impact on our business, financial condition and results of operations.
Our profitability depends on interest rates generally, and we may be adversely affected by changes in market interest rates.
Our profitability depends in substantial part on our net interest income. Net interest income is the difference between the amounts received by us on our interest-earning assets and
the interest paid by us on our interest-bearing liabilities. Our net interest income depends on many factors that are partly or completely outside of our control, including competition, federal economic, monetary and fiscal policies and economic
conditions generally. Our net interest income will be adversely affected if market interest rates change so that the interest we pay on deposits and borrowings increases faster than the interest we earn on loans and investments.
Changes in interest rates could affect our ability to originate loans and deposits. Historically, there has been an inverse correlation between the demand for loans and interest
rates. Loan origination volume usually declines during periods of rising or high interest rates and increases during periods of declining or low interest rates. Changes in interest rates also have a significant impact on the carrying value of certain
of our assets, including loans and other assets, on our balance sheet.
Interest rate increases often result in larger payment requirements for our borrowers, which increase the potential for default. At the same time, the marketability of any underlying
property that serves as collateral for such loans may be adversely affected by any reduced demand resulting from higher interest rates. An increase in interest rates that adversely affects the ability of borrowers to pay the principal or interest on
loans may lead to an increase in nonperforming assets and a reduction of income recognized, which could have a material adverse effect on our results of operations and cash flows. Further, when we place a loan on nonaccrual status, we reverse any
accrued but unpaid interest receivable, which decreases interest income. Subsequently, we continue to have a cost to fund the loan, which is reflected as interest expense, without any interest income to offset the associated funding expense. Thus, an
increase in the amount of nonaccrual loans would have an adverse impact on net interest income.
As short-term interest rates have remained at low levels, and as longer term interest rates have fallen, we expect to experience net interest margin compression as our
interest-earning assets will continue to reprice downward while our interest-bearing liability rates could fail to decline in tandem. This could have a material adverse effect on our net interest income and our results of operations.
The ratio of variable- to fixed-rate loans in our loan portfolio, the ratio of short-term (maturing at a given time within 12 months) to long-term loans, and the ratio of our demand,
money market and savings deposits to certificates of deposit (and their time periods), are the primary factors affecting the sensitivity of our net interest income to changes in market interest rates. The composition of our rate-sensitive assets or
liabilities is subject to change and could result in a more unbalanced position that would cause market rate changes to have a greater impact on our earnings. Fluctuations in market rates and other market disruptions are neither predictable nor
controllable and may adversely affect our financial condition and earnings.
We rely on short-term funding, which can be adversely affected by local and general economic conditions.
As of December 31, 2020, approximately $693.4 million, or 76.6%, of our deposits consisted of demand, savings, money market and negotiable order of withdrawal, or NOW, accounts.
Approximately $212.2 million of the remaining balance of deposits consists of certificates of deposit, of which approximately $164.8 million, or 18.2% of our total deposits, was due to mature within one year. Based on our experience, we believe that
our savings, money market and non-interest-bearing accounts are relatively stable sources of funds. Historically, a majority of non-brokered certificates of deposit are renewed upon maturity as long as we pay competitive interest rates. Many of these
customers are, however, interest-rate conscious and may be willing to move funds into higher-yielding investment alternatives. Our ability to attract and maintain deposits, as well as our cost of funds, has been, and will continue to be significantly
affected by general economic conditions. In addition, as market interest rates rise, we will have competitive pressure to increase the rates we pay on deposits. If we increase interest rates paid to retain deposits, our earnings may be adversely
affected.
Liquidity risk could impair our ability to fund operations and meet our obligations as they become due and could jeopardize our financial condition.
Liquidity is essential to our business. Liquidity risk is the potential that we will be unable to meet our obligations as they come due because of an inability to liquidate assets or
obtain adequate funding. The Bank’s primary funding source is customer deposits. In addition, the Bank has historically had access to advances from the Federal Home Loan Bank of Topeka, or the FHLB, the Federal Reserve Bank of Kansas City, or the
FRB, discount window and other wholesale sources, such as internet-sourced deposits to fund operations. We participate in the Certificate of Deposit Account Registry Service, or CDARS, where customer funds are placed into multiple certificates of
deposit, each in an amount under the standard FDIC insurance maximum of $250,000, and placed at a network of banks across the United States. Although the Bank has historically been able to replace maturing deposits and advances as necessary, it might
not be able to replace such funds in the future. An inability to raise funds through deposits, borrowings, the sale of loans and other sources could have a substantial negative effect on liquidity.
Our access to funding sources in amounts adequate to finance our activities or on acceptable terms could be impaired by factors that affect our organization specifically or the
financial services industry or economy in general. Factors that could detrimentally impact access to liquidity sources include a decrease in the level of our business activity as a result of a downturn in the markets in which our loans are
concentrated or adverse regulatory actions against us. The Bank’s ability to borrow or attract and retain deposits in the future could be adversely affected by the Bank’s financial condition or regulatory restrictions, or impaired by factors that are
not specific to it, such as FDIC insurance changes, disruption in the financial markets or negative views and expectations about the prospects for the banking industry. Borrowing capacity from the FHLB or FRB may fluctuate based upon the condition of
the Bank or the acceptability and risk rating of loan collateral and counterparties could adjust discount rates applied to such collateral at the lender’s discretion.
The FRB or FHLB could restrict or limit the Bank’s access to secured borrowings. Correspondent banks can withdraw unsecured lines of credit or require collateralization for the
purchase of fed funds. Liquidity also may be affected by the Bank’s routine commitments to extend credit. Market conditions or other events could also negatively affect the level or cost of funding, affecting our ongoing ability to accommodate
liability maturities and deposit withdrawals, meet contractual obligations and fund asset growth and new business transactions at a reasonable cost, in a timely manner and without adverse consequences.
Any substantial, unexpected or prolonged change in the level or cost of liquidity could have a material adverse effect on our financial condition and results of operations, and could
impair our ability to fund operations and meet our obligations as they become due and could jeopardize our financial condition.
We are exposed to cybersecurity risks associated with our internet-based systems and online commerce security, including “hacking” and “identify theft.”
We conduct a portion of our business over the internet. We rely heavily upon data processing, including loan servicing and deposit processing, software, communications and information
systems from a number of third parties to conduct our business. As a bank, we are more likely to be targeted by cyber-attacks in an effort to unlawfully access customer funds or customer personally identifiable information.
Third-party or internal systems and networks may fail to operate properly or become disabled due to deliberate attacks or unintentional events. Our operations are vulnerable to
disruptions from human error, natural disasters, power loss, computer viruses, spam attacks, denial of service attacks, unauthorized access and other unforeseen events. Undiscovered data corruption could render our customer information inaccurate.
These events may obstruct our ability to provide services and process transactions. While we believe we are in compliance with all applicable privacy and data security laws, an incident could put our customer confidential information at risk.
Although we have not experienced a cyber-incident which has been successful in compromising our data or systems, we can never be certain that all of our systems are entirely free from
vulnerability to breaches of security or other technological difficulties or failures. We monitor and modify, as necessary, our protective measures in response to the perpetual evolution of known cyber-threats.
A breach in the security of any of our information systems, or other cyber-incident, could have an adverse impact on, among other things, our revenue, ability to attract and maintain
customers and our reputation. In addition, as a result of any breach, we could incur higher costs to conduct our business, to increase protection, or related to remediation. Furthermore, our customers could incorrectly blame us and terminate their
account with us for a cyber-incident which occurred on their own system or with that of an unrelated third party. In addition, a security breach could also subject us to additional regulatory scrutiny and expose us to civil litigation and possible
financial liability.
Our operations could be interrupted if our third-party service providers experience difficulty, terminate their services or fail to comply with banking
regulations.
We depend to a significant extent on a number of relationships with third-party service providers. Specifically, we receive core systems processing, essential web hosting and other
internet systems, loan and deposit processing and other processing services from third-party service providers. If these third-party service providers experience financial, operational or technological difficulties or terminate their services and we
are unable to replace them with other service providers, our operations could be interrupted. If an interruption were to continue for a significant period of time, our business, financial condition and results of operations could be materially
adversely affected. Even if we are able to replace our service providers, it may be at a higher cost to us, which could adversely affect our business, financial condition and results of operations.
We may be exposed to risk of environmental liabilities with respect to properties to which we take title.
In the course of our business, we may foreclose and take title to real estate, and we could be subject to environmental liabilities with respect to these properties. We may be held
liable to a governmental entity or to third parties for property damage, personal injury, investigation and clean-up costs incurred by these parties in connection with environmental contamination, or we may be required to investigate or clean up
hazardous or toxic substances, or chemical releases at a property. The costs associated with investigation or remediation activities could be substantial. In addition, if we are the owner or former owner of a contaminated site, we may be subject to
claims by third parties based on damages and costs resulting from environmental contamination emanating from the property. If we ever become subject to significant environmental liabilities, our business, financial condition, liquidity and results of
operations could be materially and adversely affected.
Risks Relating to Our Regulatory Environment
We are subject to extensive regulation, which increases the cost and expense of compliance and could limit or restrict our activities, which in turn may adversely
impact our earnings and ability to grow.
We operate in a highly regulated environment and are subject to regulation, supervision and examination by a number of governmental regulatory agencies, including the Federal Reserve,
the OBD, and the FDIC. Regulations adopted by these agencies, which are generally intended to provide protection for depositors, customers and the DIF, rather than for the benefit of shareholders, govern a comprehensive range of matters relating to
ownership and control of our shares, our acquisition of other companies and businesses, permissible activities for us to engage in, maintenance of adequate capital levels, dividend payments and other aspects of our operations. These bank regulators
possess broad authority to prevent or remedy unsafe or unsound practices or violations of law. Following examinations, we may be required, among other things, to change our asset valuations or the amounts of required loan loss allowances or to
restrict our operations, as well as increase our capital levels, which could adversely affect our results of operations. The laws and regulations applicable to the banking industry could change at any time and we cannot predict the effects of these
changes on our business, profitability or growth strategy. Increased regulation could increase our cost of compliance and adversely affect profitability. Moreover, certain of these regulations contain significant punitive sanctions for violations,
including monetary penalties and limitations on a bank’s ability to implement components of its business plan, such as expansion through mergers and acquisitions or the opening of new branch offices. In addition, changes in regulatory requirements
may add costs associated with compliance efforts. Furthermore, government policy and regulation, particularly as implemented through the Federal Reserve, significantly affect credit conditions. Negative developments in the financial industry and the
impact of new legislation and regulation in response to those developments could negatively impact our business operations and adversely impact our financial performance.
Monetary policy and other economic factors could affect our profitability adversely.
In addition to being affected by general economic conditions, our earnings and growth are affected by the policies of the Federal Reserve. An important function of the Federal Reserve
is to regulate the money supply and credit conditions. Among the instruments used by the Federal Reserve to implement these objectives are open market purchases and sales of U.S. government securities, adjustments of the discount rate and changes in
banks’ reserve requirements against bank deposits. These instruments are used in varying combinations to influence overall economic growth and the distribution of credit, bank loans, investments and deposits. Their use also affects interest rates
charged on loans or paid on deposits.
The monetary policies and regulations of the Federal Reserve have had a significant effect on the operating results of commercial banks in the past and are expected to continue to do
so in the future. The effects of such policies upon our business, financial condition and results of operations cannot be predicted.
Regulations relating to privacy, information security and data protection could increase our costs, affect or limit how we collect and use personal information and
adversely affect our business opportunities.
We are subject to various privacy, information security and data protection laws, including requirements concerning security breach notification, and we could be negatively impacted
by these laws. For example, our business is subject to the Gramm-Leach-Bliley Act which, among other things: (i) imposes certain limitations on our ability to share non-public personal information about our customers with non-affiliated third
parties; (ii) requires that we provide certain disclosures to customers about our information collection, sharing and security practices and afford customers the right to “opt out” of any information sharing by us with non-affiliated third parties
(with certain exceptions) and (iii) requires we develop, implement and maintain a written comprehensive information security program containing safeguards appropriate based on our size and complexity, the nature and scope of our activities and the
sensitivity of customer information we process, as well as plans for responding to data security breaches. Various state and federal banking regulators and states have also enacted data security breach notification requirements with varying levels of
individual, consumer, regulatory or law enforcement notification in certain circumstances in the event of a security breach. Moreover, legislators and regulators in the United States are increasingly adopting or revising privacy, information security
and data protection laws that potentially could have a significant impact on our current and planned privacy, data protection and information security-related practices, our collection, use, sharing, retention and safeguarding of consumer or employee
information, and some of our current or planned business activities. This could also increase our costs of compliance and business operations and could reduce income from certain business initiatives. This includes increased privacy-related
enforcement activity at the federal level by the Federal Trade Commission, as well as at the state level.
We rely on third parties, and in some cases subcontractors, to provide information technology and data services. Although we provide for appropriate protections through our contracts
and perform information security risk assessments of its third-party service providers and business associates, we still have limited control over their actions and practices. In addition, despite the security measures that we have in place to ensure
compliance with applicable laws and rules, our facilities and systems, and those of our third-party providers may be vulnerable to security breaches, acts of vandalism or theft, computer viruses, misplaced or lost data, programming and/or human
errors or other similar events. In such cases, notification to affected individuals, state and federal regulators, state attorneys general and media may be required, depending upon the number of affected individuals and whether personal information
including financial data was subject to unauthorized access.
Compliance with current or future privacy, data protection and information security laws (including those regarding security breach notification) affecting customer or employee data
to which we are subject could result in higher compliance and technology costs and could restrict our ability to provide certain products and services, which could have a material adverse effect on our business, financial conditions or results of
operations. Our failure to comply with privacy, data protection and information security laws could result in potentially significant regulatory or governmental investigations or actions, litigation, fines, sanctions and damage to our reputation,
which could have a material adverse effect on our business, financial condition or results of operations.
Risks Related to Our Common Stock
Shares of certain shareholders may be sold into the public market. This could cause the market price of our common stock to drop significantly.
Our principal shareholders (collectively, the “Haines Family Trusts”) have the benefit of certain registration rights covering all of their shares of our common stock pursuant to the
registration rights agreement that we entered into with the Haines Family Trusts in connection with our initial public offering. Sales of a substantial number of these shares in the public market, or the perception that these sales could occur, could
cause the market price of our common stock to decline or to be lower than it might otherwise be. In addition, as of December 31, 2020 approximately 70.3% of our outstanding common stock is beneficially owned by our principal shareholders, executive
officers and directors. The substantial amount of common stock that is owned by and issuable to our principal shareholders, executive officers and directors may adversely affect our share price, our share price volatility and the development and
persistence of an active and liquid trading market. The sale of these shares could impair our ability to raise capital through the sale of additional equity securities.
Oklahoma law and the provisions of our amended and restated certificate of incorporation and amended and restated bylaws may have an anti-takeover effect, and
there are substantial regulatory limitations on changes of control of bank holding companies.
Oklahoma corporate law and provisions of our amended and restated certificate of incorporation, or certificate of incorporation, and our amended and restated bylaws, or bylaws, could
make it more difficult for a third party to acquire us, even if doing so would be perceived to be beneficial by our shareholders. Furthermore, with certain limited exceptions, federal regulations prohibit a person or company or a group of persons
deemed to be “acting in concert” from, directly or indirectly, acquiring more than 10% (5% if the acquirer is a bank holding company) of any class of our voting stock or obtaining the ability to control in any manner the election of a majority of our
directors or otherwise direct the management or policies of our Company without prior notice or application to and the approval of the Federal Reserve. Accordingly, prospective investors need to be aware of and comply with these requirements, if
applicable, in connection with any purchase of shares of our common stock. Collectively, provisions of our certificate of incorporation and bylaws and other statutory and regulatory provisions may delay, prevent or deter a merger, acquisition, tender
offer, proxy contest or other transaction that might otherwise result in our shareholders receiving a premium over the market price for their common stock. Moreover, the combination of these provisions effectively inhibits certain business
combinations, which, in turn, could adversely affect the market price of our common stock.
We are controlled by trusts established for the benefit of members of the Haines family, whose interests may not coincide with our other shareholders.
As of December 31, 2020, the Haines Family Trusts control approximately 63.7% of our common stock. So long as the Haines Family Trusts continue to control more than 50% of our
outstanding shares of common stock, they will have the ability, if they vote in the same manner, to determine the outcome of all matters requiring shareholder approval, including the election of directors, the approval of mergers, material
acquisitions and dispositions and other extraordinary transactions, and amendments to our certificate of incorporation, bylaws and other corporate governance documents. In addition, this concentration of ownership may delay or prevent a change in
control of our Company and make some transactions more difficult or impossible without the support of the Haines Family Trusts. The Haines Family Trusts also have certain rights, such as registration rights, that our other shareholders do not have.
In any of these matters, the interests of the Haines Family Trusts may differ from or conflict with our interests as a company or the interests of other shareholders. Accordingly, the Haines Family Trusts could influence us to enter into transactions
or agreements that other shareholders would not approve or make decisions with which other shareholders may disagree.
We are a “controlled company” within the meaning of the rules of NASDAQ, and qualify for exemptions from certain corporate governance requirements. As a result,
our shareholders do not have the same protections afforded to shareholders of companies that are subject to such requirements.
We are a “controlled company” under NASDAQ’s corporate governance listing standards, meaning that more than 50% of the voting power for the election of our board of directors will be
held by a single person, entity or group. As a controlled company, we are exempt from the obligation to comply with certain corporate governance requirements, including the requirements:
•
that a majority of our board of directors consists of “independent directors,” as defined under NASDAQ rules;
•
that director nominations are selected, or recommended for the board of directors’ selection, by either (i) the
independent directors constituting a majority of the board of directors’ independent directors in a vote in which only independent directors participate, or (ii) a nominating and corporate governance committee that is composed entirely of
independent directors; and
•
that we have a compensation committee that is composed entirely of independent directors.
Even though we are a “controlled company,” we currently intend to comply with each of these requirements. However, we may avail ourselves of certain of these other exemptions for as
long as we remain a “controlled company.” Accordingly, our shareholders may not have the same protections afforded to shareholders of companies that are subject to all of NASDAQ’s corporate governance requirements, which could make our stock less
attractive to investors or otherwise harm our stock price.
Our bylaws have an exclusive forum provision, which could limit a shareholder's ability to obtain a favorable judicial forum for disputes with us or our directors,
officers or other employees.
Our bylaws have an exclusive forum provision providing that, unless we consent in writing to an alternative forum, the state or federal courts for the Western District of Oklahoma are
the sole and exclusive forum for (i) any derivative action or proceeding brought on behalf of the Company, (ii) any action asserting a claim for breach of a fiduciary duty owed by any director, officer, employee or agent of the Company to the Company
or the Company’s shareholders, (iii) any action asserting a claim arising pursuant to any provision of the Oklahoma General Corporation Act, or OGCA, the certificate of incorporation or the bylaws or (iv) any action asserting a claim governed by the
internal affairs doctrine, in each case subject to said courts having personal jurisdiction over the indispensable parties named as defendants therein. Any person purchasing or otherwise acquiring any interest in any shares of our capital stock will
be deemed to have notice of and to have consented to this provision of our certificate of incorporation. The exclusive forum provision may limit a shareholder’s ability to bring a claim in a judicial forum that it finds favorable for disputes with us
or our directors, officers or other employees, which may discourage such lawsuits. Alternatively, if a court were to find the exclusive forum provision to be inapplicable or unenforceable in an action, we may incur additional costs associated with
resolving such action in other jurisdictions, which could have a material adverse effect on our business, financial condition, results of operations and growth prospects.
We are a bank holding company and our only source of cash, other than further issuances of securities, is distributions from the Bank.
We are a bank holding company with no material activities other than activities incidental to holding the common stock of the Bank. Our principal source of funds to pay distributions
on our common stock and service any of our obligations, other than further issuances of securities, would be dividends received from the Bank. Furthermore, the Bank is not obligated to pay dividends to us, and any dividends paid to us would depend on
the earnings or financial condition of the Bank and various business considerations. As is the case with all financial institutions, the profitability of the Bank is subject to the fluctuating cost and availability of money, changes in interest rates
and in economic conditions in general. In addition, various federal and state statutes limit the amount of dividends that the Bank may pay to the Company without regulatory approval.
Prior to our initial public offering, we were treated as an S Corporation, and claims of taxing authorities related to our prior status as an S Corporation could
harm us.
Upon consummation of our initial public offering, our status as an S Corporation terminated and we became taxed as a C Corporation under the provisions of Sections 301 to 385 of the
Code, which treat the corporation as an entity that is subject to an entity level U.S. federal income tax. If the unaudited, open tax years in which we were an S Corporation are audited by the IRS, and we are determined not to have qualified for, or
to have violated, our S Corporation status, we likely would be obligated to pay corporate level tax, plus interest and possible penalties. This could result in tax with respect to all of the income we reported for periods when we believed we properly
were treated as an S Corporation not subject to entity level taxation. Under the terms of a tax sharing agreement entered into by the Company and the Haines Family Trusts, the Haines Family Trusts will indemnify us with respect to our unpaid tax
liabilities (including interest and penalties) to the extent that such unpaid tax liabilities are attributable to a decrease in the shareholders’ taxable income for any tax period and a corresponding increase in the Company’s taxable income for any
period. This indemnity includes any additional taxes resulting from the Company not being a valid S Corporation. Any such claims, however, could result in additional costs to us and could have a material adverse effect on our results of operations
and financial condition.
We have entered into a tax sharing agreement with the Haines Family Trusts, and we could become obligated to make payments to the Haines Family Trusts for any
additional federal, state or local income taxes assessed against them for tax periods prior to the completion of our initial public offering.
Prior to our initial public offering, we were treated as an S Corporation for U.S. federal income tax purposes. As a result, the Haines Family Trusts, as our shareholders, were taxed
on our income. Therefore, the Haines Family Trusts have received certain distributions from us that were generally intended to equal the amount of tax such trusts were required to pay with respect to our income. In connection with our initial public
offering, our S Corporation status terminated. As a result of such termination, we are subject to federal and state income taxes. In the event an adjustment to our taxable income for any taxable period (or portion thereof) beginning after the date
of the termination of our S Corporation status results in any increase in taxable income of the Haines Family Trusts for any taxable period (or portion thereof) ending prior to termination of our S Corporation status, it is possible that the Haines
Family Trusts would be liable for additional income taxes for such prior periods. Therefore, we have entered into an agreement with the Haines Family Trusts. Pursuant to this agreement, in the event of any restatement of our taxable income for any
taxable period (or portion thereof) beginning after the date of termination of our S Corporation status pursuant to a determination by, or a settlement with, a taxing authority, then, depending on the nature of the adjustment, we may be required to
make a payment to the Haines Family Trusts in an amount equal to their incremental tax liability, which amount may be material. In addition, we will indemnify the Haines Family Trusts with respect to unpaid income tax liabilities to the extent that
such unpaid income tax liabilities are attributable to our taxable income for any period after our S Corporation status terminates. In both cases, the amount of the payment will be based on the assumption that the Haines Family Trusts are taxed at
the highest rate applicable to individuals for the relevant periods. We will also indemnify the Haines Family Trusts for any interest, penalties, losses, costs or expenses arising out of any claim under the agreement. However, the Haines Family
Trusts will indemnify us with respect to our unpaid tax liabilities (including interest and penalties) to the extent that such unpaid tax liabilities are attributable to a decrease in the shareholders’ taxable income for any for tax period and a
corresponding increase in the Company’s taxable income for any period. The Haines Family Trusts will also indemnify the Company with respect to any additional taxes attributable to our final S Corporation tax year that ends with the termination of
our S Corporation status.
Item 1B. Unresolved Staff Comments
Not applicable.
Item 2. Properties
The Company’s corporate offices are located at 1039 N.W. 63
rd
Street, Oklahoma City, Oklahoma 73116. The Company’s corporate office space is owned by the Bank’s
wholly-owned subsidiary, 1039 NW 63
rd
, LLC, and consists of approximately 6,600 square feet, an annex of approximately 4,400 square feet, and a 10,000 square foot operations building. The Bank operates from our corporate office, five
full-service branch offices located in Oklahoma, two full-service branch offices located in southwest Kansas and two full-service branch offices located in the Dallas/Fort Worth metropolitan area. Of these nine locations, four are leased and five are
owned by the Bank. All branches are equipped with ATMs and all Oklahoma branches provide for drive-up access. Additionally, we maintain an administrative office located in the Dallas/Fort Worth metropolitan area, which is leased by the Bank.
From time to time, the Company or the Bank is a party to claims and legal proceedings arising in the ordinary course of business. Management does not believe any present litigation or
the resolution thereof will have a material adverse effect on the business, consolidated financial condition or results of operations of the Company.
Item 4. Mine Safety Disclosures
Not applicable.
PART II
Item 5. Market for Registrant’s Common Equity, Related Stockholder Matters and Issuer Purchases of Equity Securities
The Company’s shares of common stock are traded on The NASDAQ Global Select Market under the symbol “BSVN”. The approximate number of holders of record of the Company’s common stock
as of March 11, 2020 was 4. The Company’s common stock began trading on The NASDAQ Global Select Market on September 20, 2018.
The Company paid quarterly dividends of $0.10 per share with respect to each of the first three quarters of 2020, increasing to $0.11 per share in the fourth quarter. The Company
currently expects to continue quarterly dividends of $0.11 per share in the future. Any future determination to pay dividends and the amount of such dividends on the Company’s common stock will be made by its Board of Directors and will depend on a
number of factors, including
|
|
• |
historical and projected financial condition, liquidity and results of operations;
|
|
|
• |
the Company’s capital levels and requirements;
|
|
|
• |
statutory and regulatory prohibitions and other limitations;
|
|
|
• |
any contractual restriction on the Company’s ability to pay cash dividends, including pursuant to the terms of any of its credit agreements or other borrowing arrangements;
|
|
|
• |
business strategy;
|
|
|
• |
tax considerations;
|
|
|
• |
any acquisitions or potential acquisitions;
|
|
|
• |
general economic conditions; and
|
|
|
• |
other factors deemed relevant by the Board of Directors.
|
The table below sets forth our market repurchases of Bank7 Corp. common stock during the three months ended December 31, 2020.
|
Number of
Shares
Purchased
|
Average Price
Paid Per Share
|
Number of Shares That
May Yet be Purchased
Under the Program
|
||||||||||
|
(Dollars in thousands, except per share data)
|
||||||||||||
|
October 1, 2020 to October 31, 2020
|
150,400
|
$
|
9.45
|
764,346
|
||||||||
|
November 1, 2020 to November 30, 2020
|
46,524
|
$
|
9.25
|
717,822
|
||||||||
|
December 1, 2020 to December 31, 2020
|
—
|
—
|
717,822
|
|||||||||
|
For the Three Months Ended December 31, 2020
|
196,924
|
$
|
9.43
|
717,822
|
||||||||
Set forth below is information as of December 31, 2020 regarding equity compensation plans. The plan that has been approved by the shareholders is the 2018 Equity Incentive Plan.
|
Plan
|
Number of securities to
be issued upon exercise of outstanding options and rights
|
Weighted average
exercise price
|
Number of securities remaining available for issuance under plan
|
|||||||||
|
Equity compensation plans approved by shareholders
|
303,250
|
$
|
18.48
|
694,750
|
||||||||
|
Equity compensation plans not approved by shareholders
|
––
|
––
|
––
|
|||||||||
COMPANY PERFORMANCE
Presented below is a line graph which compares the percentage in the cumulative total return on the Company’s Common Stock to the cumulative total return of the NASDAQ Stock
Market (U.S. Companies) Index and the NASDAQ Bank Stock Index. The period presented is from September 24, 2018 through December 31, 2020. The graph assumes an investment on September 24, 2018 of $100 in the Company’s Common Stock and in each index,
and that any dividends were reinvested. The values presented for each year during the period represent the cumulative market values of the respective investment. The performance graph represents past performance and should not be considered to be
an indication of future performance.
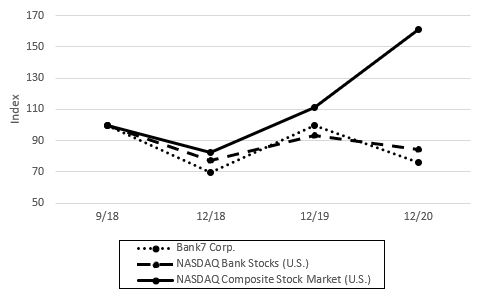
Item 6. Selected Financial Data
The following table sets forth selected historical consolidated financial and operating data as of and for the years ended December 31, 2020, 2019, and 2018. Selected financial
data as of and for the years ended December 31, 2020, 2019 and 2018 has been derived from our audited consolidated financial statements included elsewhere in this report.
You should read the following financial data in conjunction with the other information contained in this report, including under “Management’s Discussion and Analysis of
Financial Condition and Results of Operations” and in the financial statements and related notes included elsewhere in this report.
|
As of or for the Year Ended
December 31,
|
||||||||||||
|
2020
|
2019
|
2018
|
||||||||||
|
(Dollars in thousands, except per share data)
|
||||||||||||
|
Income Statement Data:
|
||||||||||||
|
Total interest income
|
$
|
53,314
|
$
|
51,709
|
$
|
46,800
|
||||||
|
Total interest expense
|
6,153
|
9,516
|
7,169
|
|||||||||
|
Net interest income
|
47,161
|
42,193
|
39,631
|
|||||||||
|
Provision for loan losses
|
5,350
|
-
|
200
|
|||||||||
|
Total noninterest income
|
1,665
|
1,308
|
1,331
|
|||||||||
|
Total noninterest expense
|
17,592
|
28,432
|
14,965
|
|||||||||
|
Provision for income taxes
|
6,618
|
6,844
|
797
|
|||||||||
|
Net income
|
19,266
|
8,225
|
25,000
|
|||||||||
|
Balance Sheet Data:
|
||||||||||||
|
Cash and due from banks
|
$
|
153,901
|
$
|
117,128
|
$
|
128,090
|
||||||
|
Total loans
|
836,613
|
707,304
|
599,910
|
|||||||||
|
Allowance for loan losses
|
9,639
|
7,846
|
7,832
|
|||||||||
|
Total assets
|
1,016,669
|
866,392
|
770,511
|
|||||||||
|
Interest-bearing deposits
|
658,945
|
538,262
|
474,744
|
|||||||||
|
Noninterest-bearing deposits
|
246,569
|
219,221
|
201,159
|
|||||||||
|
Total deposits
|
905,514
|
757,483
|
675,903
|
|||||||||
|
Total shareholders’ equity
|
107,319
|
100,126
|
88,466
|
|||||||||
The following table sets forth selected ratios as of and for the years ended December 31, 2020, 2019 and 2018. The performance, asset quality and capital ratios are unaudited and
derived from our audited financial statements as of and for the periods presented. Average balances are unaudited and have been calculated using daily averages.
|
As of or for the Year Ended
December 31,
|
||||||||||||
|
2020
|
2019
|
2018
|
||||||||||
|
(Dollars in thousands, except per share data)
|
||||||||||||
|
Share and Per Share Data:
|
||||||||||||
|
Earnings per share (basic)
|
$
|
2.05
|
$
|
0.81
|
$
|
3.08
|
||||||
|
Earnings per share (diluted)
|
2.05
|
0.81
|
3.03
|
|||||||||
|
Dividends per share
|
0.41
|
0.60
|
7.71
|
|||||||||
|
Book value per share
|
11.87
|
9.96
|
8.68
|
|||||||||
|
Tangible book value per share
(1)
|
11.69
|
9.78
|
8.49
|
|||||||||
|
Weighted average common shares outstanding–basic
|
9,378,769
|
10,145,032
|
8,105,856
|
|||||||||
|
Weighted average common shares outstanding–diluted
|
9,379,154
|
10,147,311
|
8,237,638
|
|||||||||
|
Shares outstanding at end of period
|
9,044,765
|
10,057,506
|
10,187,500
|
|||||||||
|
Selected Ratios:
|
||||||||||||
|
Return on average:
|
||||||||||||
|
Assets
|
2.03
|
%
|
1.03
|
%
|
3.53
|
%
|
||||||
|
Shareholders’ equity
|
18.82
|
8.42
|
33.01
|
|||||||||
|
Yield on earning assets
|
5.67
|
6.55
|
6.48
|
|||||||||
|
Yield on loans
|
6.37
|
7.58
|
7.58
|
|||||||||
|
Yield on loans (excluding loan fee income)
(1)
|
5.76
|
6.88
|
6.71
|
|||||||||
|
Cost of funds
|
0.73
|
1.37
|
1.11
|
|||||||||
|
Cost of interest-bearing deposits
|
1.05
|
1.89
|
1.52
|
|||||||||
|
Cost of total deposits
|
0.73
|
1.37
|
1.08
|
|||||||||
|
Net interest margin
|
5.01
|
5.35
|
5.49
|
|||||||||
|
Net interest margin (excluding loan fee income)
(1)
|
4.48
|
4.78
|
4.78
|
|||||||||
|
Noninterest expense to average assets
|
1.85
|
3.56
|
2.05
|
|||||||||
|
Efficiency ratio
|
36.03
|
65.39
|
37.04
|
|||||||||
|
Loans to deposits
|
92.39
|
93.38
|
88.76
|
|||||||||
|
Credit Quality Ratios:
|
||||||||||||
|
Nonperforming assets to total assets
|
1.63
|
%
|
0.38
|
%
|
0.35
|
% | ||||||
|
Nonperforming assets to total loans and OREO
|
1.98
|
0.47
|
0.45
|
|||||||||
|
Nonperforming loans to total loans
|
1.98
|
0.47
|
0.44
|
|||||||||
|
Allowance for loan losses to nonperforming loans
|
58.29
|
235.40
|
299.50
|
|||||||||
|
Allowance for loan losses to total loans
|
1.15
|
1.11
|
1.31
|
|||||||||
|
Net charge-offs to average loans
|
0.432
|
-0.002
|
0.004
|
|||||||||
|
Capital Ratios (Bank)
(2)
:
|
||||||||||||
|
Tangible equity to tangible assets
|
10.42
|
11.37
|
11.25
|
|||||||||
|
Common equity tier 1 capital ratio
|
13.51
|
14.28
|
14.78
|
|||||||||
|
Tier 1 leverage ratio
|
10.78
|
11.65
|
11.26
|
|||||||||
|
Tier 1 risk-based capital ratio
|
13.51
|
14.28
|
14.78
|
|||||||||
|
Total risk-based capital ratio
|
14.75
|
15.42
|
16.03
|
|||||||||
|
Capital Ratios (Company):
|
||||||||||||
|
Total shareholders’ equity to total assets
|
10.56
|
%
|
11.56
|
%
|
11.48
|
% | ||||||
|
Common equity tier 1 capital ratio
|
13.50
|
14.11
|
14.61
|
|||||||||
|
Tier 1 leverage ratio
|
10.78
|
11.53
|
11.13
|
|||||||||
|
Tier 1 risk-based capital ratio
|
13.50
|
14.11
|
14.61
|
|||||||||
|
Total risk-based capital ratio
|
14.73
|
15.25
|
15.86
|
|||||||||
|
As of or for the Year Ended
December 31,
|
||||||||||||
|
2020
|
2019
|
2018
|
||||||||||
|
(Dollars in thousands, except per share data)
|
||||||||||||
|
Share and Per Share Data:
|
||||||||||||
|
Earnings per share (basic) – S Corp
(1)
|
$
|
2.76
|
$
|
1.48
|
$
|
3.18
|
||||||
|
Earnings per share (basic) – C Corp
(1)
|
2.05
|
0.81
|
2.48
|
|||||||||
|
Earnings per share (diluted) – S Corp
(1)
|
2.76
|
1.48
|
3.13
|
|||||||||
|
Earnings per share (diluted) – C Corp
(1)
|
2.05
|
0.81
|
2.44
|
|||||||||
|
Dividends per share
|
0.41
|
0.60
|
7.71
|
|||||||||
|
Book value per share
|
11.87
|
9.96
|
8.68
|
|||||||||
|
Tangible book value per share
(2)
|
11.69
|
9.78
|
8.49
|
|||||||||
|
Weighted average common shares outstanding–basic
|
9,378,769
|
10,145,032
|
8,105,856
|
|||||||||
|
Weighted average common shares outstanding–diluted
|
9,379,154
|
10,147,311
|
8,238,753
|
|||||||||
|
Shares outstanding at end of period
|
9,044,765
|
10,057,506
|
10,187,500
|
|||||||||
|
Selected Ratios:
|
||||||||||||
|
Return on average:
|
||||||||||||
|
Assets – S Corp
(1)
|
2.73
|
%
|
1.88
|
%
|
3.53
|
%
|
||||||
|
Assets – C Corp
(1)
|
2.03
|
1.03
|
2.75
|
|||||||||
|
Shareholders’ equity – S Corp
(1)
|
25.29
|
15.44
|
33.01
|
|||||||||
|
Shareholders’ equity – C Corp
(1)
|
18.82
|
8.42
|
25.69
|
|||||||||
|
Yield on earnings assets
|
5.67
|
6.55
|
6.48
|
|||||||||
|
Yield on loans
|
6.37
|
7.58
|
7.58
|
|||||||||
|
Yield on loans (excluding loan fee income)
(2)
|
5.76
|
6.88
|
6.71
|
|||||||||
|
Cost of funds
|
0.73
|
1.37
|
1.11
|
|||||||||
|
Cost of interest-bearing deposits
|
1.05
|
1.89
|
1.52
|
|||||||||
|
Cost of total deposits
|
0.73
|
1.37
|
1.08
|
|||||||||
|
Net interest margin
|
5.01
|
5.35
|
5.49
|
|||||||||
|
Net interest margin (excluding loan fee income)
(2)
|
4.48
|
4.78
|
4.78
|
|||||||||
|
Noninterest expense to average assets
|
1.85
|
3.56
|
2.05
|
|||||||||
|
Efficiency ratio
|
36.03
|
65.39
|
37.04
|
|||||||||
|
Loans to deposits
|
92.39
|
93.38
|
88.76
|
|||||||||
|
Credit Quality Ratios:
|
||||||||||||
|
Nonperforming assets to total assets
|
1.63
|
% |
0.38
|
% |
0.35
|
% | ||||||
|
Nonperforming assets to total loans and OREO
|
1.98
|
0.47
|
0.45
|
|||||||||
|
Nonperforming loans to total loans
|
1.98
|
0.47
|
0.43
|
|||||||||
|
Allowance for loan losses to nonperforming loans
|
58.29
|
235.40
|
299.50
|
|||||||||
|
Allowance for loan losses to total loans
|
1.15
|
1.11
|
1.31
|
|||||||||
|
Net charge-offs to average loans
|
0.432
|
-0.002
|
-0.004
|
|||||||||
|
Capital Ratios:
|
||||||||||||
|
Total shareholders’ equity to total assets
|
10.56
|
% |
11.56
|
% |
11.48
|
% | ||||||
|
Tangible equity to tangible assets
(2)
|
10.42
|
11.37
|
11.25
|
|||||||||
|
Common equity tier 1 capital ratio
(3)
|
13.51
|
14.28
|
14.78
|
|||||||||
|
Tier 1 leverage ratio
(3)
|
10.78
|
11.65
|
11.26
|
|||||||||
|
Tier 1 risk-based capital ratio
(3)
|
13.51
|
14.28
|
14.78
|
|||||||||
|
Total risk-based capital ratio
(3)
|
14.75
|
15.42
|
16.03
|
|||||||||
|
(1)
|
Represents a non-GAAP financial measure. For 2018, C Corp amounts were calculated based on a combined effective tax rate of 22.19% as if we had been a C Corp for the full year. For 2019
and 2020, S Corp amounts were calculated using an effective tax rate of 0% as if we had been an S Corp for the full year.
|
|
(2)
|
Represents a non-GAAP financial measure. See “GAAP reconciliation and management explanation of non-GAAP financial measures” for a reconciliation of these measures to their most comparable
GAAP measures.
|
|
(3)
|
Ratios are based on Bank level financial information rather than consolidated information.
|
GAAP Reconciliation and Management Explanation of Non-GAAP Financial Measures
Our accounting and reporting policies conform to GAAP and the prevailing practices in the banking industry. However, we also evaluate our performance based on certain additional
financial measures discussed in this report as being non-GAAP financial measures. We classify a financial measure as being a non-GAAP financial measure if that financial measure excludes or includes amounts, or is subject to adjustments that have the
effect of excluding or including amounts, that are included or excluded, as the case may be, in the most directly comparable measure calculated and presented in accordance with GAAP as in effect from time to time in the United States in our
statements of income, balance sheets or statements of cash flows. Non-GAAP financial measures do not include operating and other statistical measures or ratios or statistical measures calculated using exclusively either financial measures calculated
in accordance with GAAP, operating measures or other measures that are not non-GAAP financial measures or both.
The non-GAAP financial measures that we discuss in this report should not be considered in isolation or as a substitute for the most directly comparable or other financial measures
calculated in accordance with GAAP. Moreover, the manner in which we calculate the non-GAAP financial measures that we discuss in this report may differ from that of other companies reporting measures with similar names. It is important to understand
how other banking organizations calculate their financial measures with names similar to the non-GAAP financial measures we have discussed in this report when comparing such non-GAAP financial measures.
Tangible Book Value Per Share
. We calculate (1) tangible equity as total shareholders’ equity less goodwill and other intangibles; and (2)
tangible book value per share as tangible equity divided by our shares outstanding at the end of the relevant period. The most directly comparable GAAP financial measure for tangible book value per share is book value per share.
Tangible Shareholders’ Equity to Tangible Assets.
We calculate (1) tangible assets as total assets less goodwill and other intangibles; and
(2) tangible shareholders’ equity to tangible assets as tangible equity (as defined in the preceding paragraph) divided by tangible assets at the end of the relevant period. The most directly comparable GAAP financial measure for tangible
shareholders’ equity to tangible assets is total shareholders’ equity to total assets.
We believe that tangible book value per share and tangible shareholders’ equity to tangible assets are measures that are important to many investors in the marketplace who are
interested in changes from period to period in our shareholders’ equity exclusive of changes in intangible assets. Intangible assets have the effect of increasing total shareholders’ equity while not increasing our tangible book value per share or
tangible shareholders’ equity to tangible assets. The following table reconciles, as of the dates set forth below, total shareholders’ equity to tangible shareholders’ equity, total assets to tangible assets and presents tangible book value per share
compared to book value per share and tangible shareholders’ equity to tangible assets to total shareholders’ equity to total assets:
|
As of December 31,
|
||||||||||||
|
2020
|
2019
|
2018
|
||||||||||
|
(Dollars in thousands, except per share data)
|
||||||||||||
|
Tangible Shareholders’ Equity:
|
||||||||||||
|
Total shareholders’ equity
|
$
|
107,319
|
$
|
100,126
|
$
|
88,466
|
||||||
|
Adjustments:
|
||||||||||||
|
Goodwill and other intangibles
|
(1,583
|
)
|
(1,789
|
)
|
(1,995
|
)
|
||||||
|
Tangible shareholders’ equity
|
$
|
105,736
|
$
|
98,337
|
$
|
86,471
|
||||||
|
Tangible Assets:
|
||||||||||||
|
Total assets
|
$
|
1,016,669
|
$
|
866,392
|
$
|
770,511
|
||||||
|
Adjustments:
|
||||||||||||
|
Goodwill and other intangibles
|
$
|
(1,583
|
)
|
$
|
(1,789
|
)
|
$
|
(1,995
|
)
|
|||
|
Tangible assets
|
$
|
1,015,086
|
$
|
864,603
|
$
|
768,516
|
||||||
|
End of period common shares outstanding
|
9,044,765
|
10,057,506
|
10,187,500
|
|||||||||
|
Book value per share
|
$
|
11.87
|
$
|
9.96
|
$
|
8.68
|
||||||
|
Tangible book value per share
|
$
|
11.69
|
$
|
9.78
|
$
|
8.49
|
||||||
|
Total shareholders’ equity to total assets
|
10.56
|
%
|
11.56
|
%
|
11.48
|
%
|
||||||
|
Tangible shareholders’ equity to tangible assets
|
10.42
|
%
|
11.37
|
%
|
11.25
|
%
|
||||||
Exclusion of loan fee income
. We calculate (1) yield on loans (excluding loan fee income) as interest income on loans less loan fee income
divided by average total loans and (2) net interest margin (excluding loan fee income) as net interest income less loan fee income divided by average interest-earning assets. The most directly comparable GAAP financial measure for yield on loans
(excluding loan fee income) is yield on loans and for net interest margin (excluding loan fee income) is net interest margin. The following table reconciles, as of the dates set forth below, yield on loans (excluding loan fee income) to yield on
loans and net interest margin (excluding loan fee income) to net interest margin:
|
As of or for the Year Ended December 31,
|
||||||||||||
|
2020
|
2019
|
2018
|
||||||||||
|
(Dollars in thousands)
|
||||||||||||
|
Loan interest income (excluding loan fee income):
|
||||||||||||
|
Interest income on loans, including loan fee income
|
$
|
52,450
|
$
|
48,200
|
$
|
44,279
|
||||||
|
Adjustments:
|
||||||||||||
|
Loan fee income
|
(5,035
|
)
|
(4,443
|
)
|
(5,121
|
)
|
||||||
|
Interest income on loans (excluding loan fee income)
|
$
|
47,415
|
$
|
43,757
|
$
|
39,158
|
||||||
|
Average total loans
|
$
|
823,228
|
$
|
636,274
|
$
|
584,003
|
||||||
|
Yield on loans
|
6.37
|
%
|
7.58
|
%
|
7.58
|
%
|
||||||
|
Yield on loans (excluding loan fee income)
|
5.76
|
%
|
6.88
|
%
|
6.71
|
%
|
||||||
|
Net interest margin (excluding loan fee income):
|
||||||||||||
|
Net interest income
|
$
|
47,161
|
$
|
42,193
|
$
|
39,631
|
||||||
|
Adjustments:
|
||||||||||||
|
Loan fee income
|
(5,035
|
)
|
(4,443
|
)
|
(5,121
|
)
|
||||||
|
Net interest income (excluding loan fee income)
|
$
|
42,126
|
$
|
37,750
|
$
|
34,510
|
||||||
|
Average interest-earning assets
|
$
|
940,890
|
$
|
789,009
|
$
|
721,935
|
||||||
|
Net interest margin
|
5.01
|
%
|
5.35
|
%
|
5.49
|
%
|
||||||
|
Net interest margin (excluding loan fee income)
|
4.48
|
%
|
4.78
|
%
|
4.78
|
%
|
||||||
One-time executive stock transfer.
We had net income of $8.2 million for the year ended December 31, 2019. On September 5, 2019, our largest
shareholders, the Haines Family Trusts, contributed 656,925 of their shares to the Company, approximately 6.5% of shares outstanding. Subsequently, the Company immediately issued those shares to certain executive officers, which was charged as
compensation expense through the income statement of the Company. As part of this transaction, the Company retired 149,425 shares, or $2.6 million, for income and payroll taxes. This previously announced transaction was a one-time, non-cash expense;
however, because the shares were simultaneously contributed into the Company by the Haines Family Trusts, the transaction had a virtual net-zero impact to shareholders’ equity.
Excluding the one-time, non-cash expense related to the stock transfer outlined above, net income would have been $20.0 million for the year ending December 31, 2019. Illustrated below is a
reconciliation of pro forma net income through the year ended December 31, 2019.
|
For the Year Ended
December 31,
|
||||||||||||||||
|
2020
|
2019
|
$ Change
|
% Change
|
|||||||||||||
|
(Dollars in thousands)
|
||||||||||||||||
|
Pro Forma Net Income
|
||||||||||||||||
|
Total Interest Income
|
$
|
53,314
|
$
|
51,709
|
$
|
1,605
|
3.10
|
%
|
||||||||
|
Total Interest Expense
|
6,153
|
9,516
|
(3,363
|
)
|
(35.34
|
%)
|
||||||||||
|
Net Interest Margin
|
47,161
|
42,193
|
4,968
|
11.77
|
%
|
|||||||||||
|
Provision for Loan Losses
|
$
|
5,350
|
$
|
-
|
$
|
5,350
|
||||||||||
|
Total Noninterest Income
|
$
|
1,665
|
$
|
1,308
|
$
|
357
|
27.26
|
%
|
||||||||
|
Total Noninterest Expense
|
$
|
17,592
|
$
|
28,432
|
$
|
(10,840
|
)
|
(38.13
|
%)
|
|||||||
|
Stock Transfer Compensation Expense
(1)
|
--
|
(11,796
|
)
|
11,796
|
--
|
|||||||||||
|
Pro Forma Noninterest Expense
|
$
|
17,592
|
$
|
16,636
|
$
|
956
|
5.75
|
%
|
||||||||
|
Pro Forma Pre-Tax Income
|
$
|
25,884
|
$
|
26,866
|
$
|
(982
|
)
|
(3.65
|
%)
|
|||||||
|
Pro Forma Income Tax Expense
|
$
|
6,618
|
$
|
6,836
|
$
|
(218
|
)
|
(3.19
|
%)
|
|||||||
|
Pro Forma Net After-Tax Income
|
$
|
19,266
|
$
|
20,030
|
$
|
(764
|
)
|
(3.81
|
%)
|
|||||||
|
(1)
|
Compensation expense includes $168,000 in payroll taxes.
|
CAUTIONARY NOTE ABOUT FORWARD LOOKING STATEMENTS
This Annual Report on Form 10-K contains forward-looking statements. These forward-looking statements reflect our current views with respect to, among other things, future events and
our financial performance. These statements are often, but not always, made through the use of words or phrases such as “may,” “might,” “should,” “could,” “predict,” “potential,” “believe,” “expect,” “continue,” “will,” “anticipate,” “seek,”
“estimate,” “intend,” “plan,” “strive,” “projection,” “goal,” “target,” “outlook,” “aim,” “would,” “annualized” and “outlook,” or the negative version of those words or other comparable words or phrases of a future or forward-looking nature. These
forward-looking statements are not historical facts, and are based on current expectations, estimates and projections about our industry, management’s beliefs and certain assumptions made by management, many of which, by their nature, are inherently
uncertain and beyond our control. Accordingly, we caution that any such forward-looking statements are not guarantees of future performance and are subject to risks, assumptions, estimates and uncertainties that are difficult to predict. Although we
believe that the expectations reflected in these forward-looking statements are reasonable as of the date made, actual results may prove to be materially different from the results expressed or implied by the forward-looking statements.
There are or will be important factors that could cause our actual results to differ materially from those indicated in these forward-looking statements, including, but not limited
to, the following:
•
our ability to effectively execute our expansion strategy and manage our growth, including identifying and consummating
suitable acquisitions;
•
business and economic conditions, particularly those affecting our market areas of Oklahoma, the Dallas/Fort Worth
metropolitan area and Kansas, including a decrease in or the volatility of oil and gas prices or agricultural commodity prices within the region;
•
the geographic concentration of our markets in Oklahoma, the Dallas/Fort Worth metropolitan area and Kansas;
•
high concentrations of loans secured by real estate and energy located in our market areas;
•
risks associated with our commercial loan portfolio, including the risk for deterioration in value of the general business
assets that secure such loans;
•
risks related to the significant amount of credit that we have extended to a limited number of borrowers;
•
our ability to maintain our reputation;
•
our ability to successfully manage our credit risk and the sufficiency of our allowance;
•
reinvestment risks associated with a significant portion of our loan portfolio maturing in one year or less;
•
our ability to attract, hire and retain qualified management personnel;
•
our dependence on our management team, including our ability to retain executive officers and key employees and their
customer and community relationships;
•
interest rate fluctuations, which could have an adverse effect on our profitability;
•
competition from banks, credit unions and other financial services providers;
•
system failures, service denials, cyber-attacks and security breaches;
•
our ability to maintain effective internal control over financial reporting;
•
employee error, fraudulent activity by employees or customers and inaccurate or incomplete information about our customers
and counterparties;
•
increased capital requirements imposed by banking regulators, which may require us to raise capital at a time when capital
is not available on favorable terms or at all;
•
costs and effects of litigation, investigations or similar matters to which we may be subject, including any effect on our
reputation;
•
severe weather, acts of god, acts of war, pandemics or terrorism;
•
impact of COVID-19, the coronavirus, on the United States economy, particularly the hospitality industry;
•
compliance with governmental and regulatory requirements, including the Dodd-Frank and Wall Street Consumer Protection Act,
or Dodd-Frank Act, and other regulations relating to banking, consumer protection, securities and tax matters;
•
changes in the laws, rules, regulations, interpretations or policies relating to financial institutions, accounting, tax,
trade, monetary and fiscal matters, including the policies of the Federal Reserve and as a result of initiatives of the Trump administration; and
•
other factors that are discussed in the section entitled “Risk Factors,” beginning on page 11.
The foregoing factors should not be construed as exhaustive and should be read together with the other cautionary statements included in this report. Because of these risks and other
uncertainties, our actual future results, performance or achievements, or industry results, may be materially different from the results indicated by the forward-looking statements in this report. In addition, our past results of operations are not
necessarily indicative of our future results. Accordingly, no forward-looking statements should be relied upon, which represent our beliefs, assumptions and estimates only as of the dates on which such forward-looking statements were made. Any
forward-looking statement speaks only as of the date on which it is made, and we do not undertake any obligation to update or review any forward-looking statement, whether as a result of new information, future developments or otherwise, except as
required by law.
The following discussion and analysis of our financial condition and results of operations should be read in conjunction with our consolidated financial statements
and related notes included elsewhere in this report.
Unless the context indicates otherwise, references in this management’s discussion and analysis to “we”, “our”, and “us,” refer to Bank7 Corp. and its consolidated
subsidiaries. All references to “the Bank” refer to Bank7, our wholly owned subsidiary.
General
We are Bank7 Corp., a bank holding company headquartered in Oklahoma City, Oklahoma. Through our wholly-owned subsidiary, Bank7, we operate nine full-service branches in Oklahoma, the
Dallas/Fort Worth, Texas metropolitan area and Kansas. We are focused on serving business owners and entrepreneurs by delivering fast, consistent and well-designed loan and deposit products to meet their financing needs. We intend to grow organically
by selectively opening additional branches in our target markets and we will also pursue strategic acquisitions.
As a bank holding company, we generate most of our revenue from interest income on loans and from short-term investments. The primary source of funding for our loans and short-term
investments are deposits held by our subsidiary, Bank7. We measure our performance by our return on average assets, return on average equity, earnings per share, capital ratios, and our efficiency ratio, which is calculated by dividing noninterest
expense by the sum of net interest income on a tax equivalent basis and noninterest income.
As of December 31, 2020, we had total assets of $1.0 billion, total loans of $836.6 million, total deposits of $905.5 million and total shareholders’ equity of $107.3 million. In
September 2018, in conjunction with our initial public offering, the Company terminated its status as an S Corporation and elected to be treated as a C Corporation. As this termination occurred at the end of the third quarter, we have presented
information as pre-tax and pro forma numbers in the non-GAAP reconciliation below.
The U.S. economy experienced widespread volatility throughout 2020 as a result of the COVID-19 pandemic and government responses to the pandemic. Economic condition declined rapidly
and significantly following the initial widespread U.S. outbreak in March and April of 2020. Federal stimulus was quickly passed in the form of the CARES Act and the economy rebounded significantly in the second half of 2020. In an emergency measure
aimed at dampening the economic impact of COVID-19, the Federal Reserve lowered the target for the federal funds rate to a range of between zero to 0.25% effective on March 16, 2020 where it remained through the end of 2020. This action by the
Federal Reserve followed a prior reduction of the targeted federal funds rates to a range of 1.0% to 1.25% effective March 4, 2020. This decline in interest rates led to new all-time low yields across the U.S. Treasury maturity curve. In September
2020, the Federal Reserve (FED) indicated that it expects to maintain the targeted federal funds rate at current levels and expects that to last through 2023. Although rates are at or near historical lows, it is possible the FED could force rates
even lower, which could further negatively impact the net interest margins for the banking industry.
Net interest income is a key driver for our earnings, and is defined as the difference between interest income earned on interest-earning assets such as loans and securities and
interest expense paid on interest-bearing liabilities such as deposits. Our bank has an asset sensitive Balance Sheet, therefore, our earnings are susceptible to lower rates because the interest income received on loans and other investments falls
more quickly and to a larger degree than the interest rates paid on deposits. Although we have implemented various strategies to mitigate the effects of lower interest rates, we have experienced a decrease in net interest income, and could possibly
experience further degradation to our net interest margin.
Factors Affecting Comparability of Financial Results
S Corporation Status
Since our formation in 2004, until our initial public offering, we have elected to be taxed for U.S. federal income tax purposes as an S Corporation. As a result, our net income has
not been subject to, and we have not paid, U.S. federal or state income taxes, and we have not been required to make any provision or recognize any liability for U.S. federal income tax in our financial statements. The consummation of our initial
public offering resulted in the termination of our status as an S Corporation and in our taxation as a C Corporation for U.S. federal and state income tax purposes. Upon the termination of our status as an S Corporation, we commenced paying U.S.
federal income tax on our pre-tax net income for each year (including the short year beginning on the date our status as an S Corporation terminated), and our financial statements reflect a provision for U.S. federal income tax. As a result of this
change, the net income and earnings per share data presented prior to our conversion to a C Corporation in 2018, which do not include any provision for U.S. federal income tax, will not be comparable with our current net income and earnings per
share, which is calculated by including a provision for U.S. federal and state income tax.
Furthermore, we have recognized deferred tax assets and liabilities for the future tax consequences attributable to differences between the financial statement carrying amounts of our
existing assets and liabilities and their respective tax bases. Deferred tax assets and liabilities are measured using tax rates expected to apply to taxable income in the years in which those temporary differences are expected to be recovered or
settled. The effect on deferred tax assets and liabilities of the change in tax rates resulting from becoming a C Corporation were recognized in income in the quarter the change took place. This difference between the financial statement carrying
amounts of assets and liabilities and their respective tax bases was recorded as a net deferred tax asset of $2 million (net of $13,000 uncertain tax liability) on our consolidated balance sheet as of December 31, 2020.
Pro Forma Income Tax Expense and Net Income
As a result of our status as an S Corporation, we had no U.S. federal income tax expense for the full year ended December 31, 2018, but rather only for the short year after conversion
to C corporation status (as discussed earlier). The pro forma impact of being taxed as a C Corporation is illustrated in the following table:
|
As of or for the
year ended
December 31,
|
||||||||||||
|
2020
|
2019
|
2018
|
||||||||||
|
(Dollars in thousands)
|
||||||||||||
|
Before Taxes
|
||||||||||||
|
Net income
(1)
|
$
|
25,884
|
$
|
15,069
|
$
|
25,797
|
||||||
|
Pro forma C Corporation
|
||||||||||||
|
Combined effective income tax rate
(2)
|
25.57
|
%
|
45.42
|
%
|
22.19
|
%
|
||||||
|
Income tax provision
|
$
|
6,618
|
$
|
6,844
|
$
|
5,720
|
||||||
|
Net income
|
19,266
|
8,225
|
20,077
|
|||||||||
|
Total shareholders’ equity
|
107,319
|
100,126
|
88,466
|
|||||||||
|
Earnings per share (basic)
|
2.05
|
0.81
|
2.48
|
|||||||||
|
Earnings per share (diluted)
|
2.05
|
0.81
|
2.44
|
|||||||||
|
Return on average:
|
||||||||||||
|
Assets
|
2.03
|
1.03
|
2.75
|
|||||||||
|
Shareholders’ equity
|
18.82
|
8.42
|
25.69
|
|||||||||
| (1) |
A portion of our net income in each of these periods was derived from nontaxable investment income and other nondeductible expenses.
|
| (2) |
Based on a statutory federal income tax rate of 21%, 21% and 21%, for the years ended December 31, 2020, 2019 and 2018, respectively, plus the applicable statutory state income tax rate for each of the respective
periods. State income tax was $1.6 million and $1.2 million, with an effective state tax rate of 4.9% and 4.4% for the years ended December 31, 2020 and 2019, respectively. State income tax expense would have been approximately $1.3 million
for the year ended December 31, 2018 with an effective state tax rate of 4.9%
|
2020 Highlights
For the year ended December 31, 2020, we reported pre-tax net income of $25.9 million compared to pre-tax net income of $15.0 million for the year ended December 31, 2019. The
increase was primarily related to compensation expense from the one-time, non-cash executive stock transaction in 2019. For the year ended December 31, 2020, average loans totaled $823.2 million, an increase of $187.0 million or 29.4%, from December
31, 2019. For the year ended December 31, 2020, loan yields, excluding loan fee income, were 5.76%, a decrease of 112 basis points from the same period in 2019 due to decreasing interest rates. Loan yield excluding loan fee income is a non-GAAP
measure. See “GAAP Reconciliation and Management Explanation of Non-GAAP Financial Measures” elsewhere in this report.
Pre-tax return on average assets and return on average equity was 2.73% and 25.29%, respectively for the year ended December 31, 2020, as compared to 1.88% and 15.44%, respectively,
for the same period in 2019. Our efficiency ratio for the year ended December 31, 2020 was 36.03% as compared to 65.39% for the year ended December 31, 2019. The decrease was due to compensation expense from the the one-time, non-cash executive
stock transaction in 2019.
As of December 31, 2020, total loans were $836.6 million, an increase of $129.3 million, or 18.3%, from December 31, 2019. Total deposits were $905.5 million as of December 31, 2020,
an increase of $148.0 million, or 19.5%, from December 31, 2019. Tangible book value per share was $11.69 as of December 31, 2020, an increase of $1.91, or 19.6%, from December 31, 2019. Tangible book value per share is a non-GAAP financial measure.
See “GAAP Reconciliation and Management Explanation of Non-GAAP Financial Measures” elsewhere in this report.
Results of Operations
Years Ended December 31, 2020, December 31, 2019, and December 31, 2018
Net Interest Income and Net Interest Margin
The following table presents, for the periods indicated, information about: (i) weighted average balances, the total dollar amount of interest income from interest-earning assets, and
the resultant average yields; (ii) average balances, the total dollar amount of interest expense on interest-bearing liabilities, and the resultant average rates; (iii) net interest income; and (iv) the net interest margin.
|
|
For the Years Ended December 31,
|
|||||||||||||||||||||||||||||||||||
|
2020
|
2019
|
2018
|
||||||||||||||||||||||||||||||||||
|
Average
Balance
|
Interest
Income/
Expense
|
Average
Yield/
Rate
|
Average
Balance
|
Interest
Income/
Expense
|
Average
Yield/
Rate
|
Average
Balance
|
Interest
Income/
Expense
|
Average
Yield/
Rate
|
||||||||||||||||||||||||||||
|
(Dollars in thousands)
|
||||||||||||||||||||||||||||||||||||
|
Interest-earning assets:
|
||||||||||||||||||||||||||||||||||||
|
Short-term investments
(1)
|
$
|
116,295
|
$
|
828
|
0.71
|
%
|
$
|
151,434
|
$
|
3,459
|
2.28
|
%
|
$
|
136,880
|
$
|
2,521
|
1.84
|
%
|
||||||||||||||||||
|
Investment securities
(2)
|
$
|
1,123
|
36
|
3.21
|
%
|
$
|
1,065
|
50
|
4.69
|
%
|
$
|
1,052
|
—
|
0.00
|
%
|
|||||||||||||||||||||
|
Loans held for sale
|
$
|
244
|
—
|
0.00
|
%
|
$
|
236
|
—
|
0.00
|
%
|
$
|
182
|
—
|
0.00
|
%
|
|||||||||||||||||||||
|
Total loans
(3)
|
$
|
823,228
|
$
|
52,450
|
6.37
|
%
|
$
|
636,274
|
$
|
48,200
|
7.58
|
%
|
$
|
583,821
|
$
|
44,279
|
7.58
|
%
|
||||||||||||||||||
|
Total interest-earning assets
|
$
|
940,890
|
$
|
53,314
|
5.67
|
%
|
$
|
789,009
|
$
|
51,709
|
6.55
|
%
|
$
|
721,935
|
$
|
46,800
|
6.48
|
%
|
||||||||||||||||||
|
Noninterest-earning assets
|
$
|
8,067
|
$
|
9,519
|
$
|
8,629
|
||||||||||||||||||||||||||||||
|
Total assets
|
$
|
948,957
|
$
|
798,528
|
$
|
730,564
|
||||||||||||||||||||||||||||||
|
Funding sources:
|
||||||||||||||||||||||||||||||||||||
|
Interest-bearing liabilities:
|
||||||||||||||||||||||||||||||||||||
|
Deposits:
|
||||||||||||||||||||||||||||||||||||
|
Transaction accounts
|
$
|
377,519
|
$
|
2,729
|
0.72
|
%
|
$
|
295,576
|
$
|
5,057
|
1.71
|
%
|
$
|
240,881
|
$
|
3,584
|
1.49
|
%
|
||||||||||||||||||
|
Time deposits
|
$
|
207,442
|
$
|
3,424
|
1.65
|
%
|
$
|
208,375
|
$
|
4,459
|
2.14
|
%
|
$
|
220,023
|
$
|
3,410
|
1.55
|
%
|
||||||||||||||||||
|
Total interest-bearing deposits
|
$
|
584,961
|
$
|
6,153
|
1.05
|
%
|
$
|
503,951
|
$
|
9,516
|
1.89
|
%
|
$
|
460,904
|
$
|
6,994
|
1.52
|
%
|
||||||||||||||||||
|
Other borrowings
|
$
|
—
|
$
|
—
|
0.00
|
%
|
$
|
—
|
$
|
—
|
0.00
|
%
|
$
|
3,652
|
$
|
175
|
4.79
|
%
|
||||||||||||||||||
|
Total interest-bearing liabilities
|
$
|
584,961
|
$
|
6,153
|
1.05
|
%
|
$
|
503,951
|
$
|
9,516
|
1.89
|
%
|
$
|
464,556
|
$
|
7,169
|
1.54
|
%
|
||||||||||||||||||
|
Noninterest-bearing liabilities:
|
||||||||||||||||||||||||||||||||||||
|
Noninterest-bearing deposits
|
$
|
256,431
|
$
|
192,562
|
$
|
183,750
|
||||||||||||||||||||||||||||||
|
Other noninterest-bearing liabilities
|
$
|
5,206
|
$
|
4,585
|
$
|
4,110
|
||||||||||||||||||||||||||||||
|
Total noninterest-bearing liabilities
|
$
|
261,637
|
$
|
197,147
|
$
|
187,860
|
||||||||||||||||||||||||||||||
|
Shareholders’ equity
|
$
|
102,359
|
$
|
97,430
|
$
|
78,148
|
||||||||||||||||||||||||||||||
|
Total liabilities and shareholders’ equity
|
$
|
948,957
|
$
|
798,528
|
$
|
730,564
|
||||||||||||||||||||||||||||||
|
Net interest income
|
$
|
47,161
|
$
|
42,193
|
$
|
39,631
|
||||||||||||||||||||||||||||||
|
Net interest spread
(4)
|
4.61
|
%
|
4.67
|
%
|
4.94
|
%
|
||||||||||||||||||||||||||||||
|
Net interest margin
|
5.01
|
%
|
5.35
|
%
|
5.49
|
%
|
||||||||||||||||||||||||||||||
|
(1)
|
Includes income and weighted average balances for fed funds sold, interest-earning deposits in banks and other miscellaneous interest-earning assets.
|
|
(2)
|
Includes income and weighted average balances for FHLB and FRB stock.
|
|
(3)
|
Average loan balances include monthly average nonaccrual loans of $11.3 million, $2.1 million and $991,000 for the years ended December 31, 2020, 2019 and 2018, respectively.
|
|
(4)
|
Net interest spread is the average yield on interest-earning assets minus the average rate on interest-bearing liabilities.
|
We continued to experience strong asset growth for the year ended December 31, 2020 compared to the year ended December 31, 2019:
|
|
- |
Total interest income on loans increased $4.3 million, or 8.8%, to $52.5 million which was attributable to a $187.0 million increase in the average balance of loans to $823.2 million during the year ended 2020 as
compared with the average balance of $636.3 million for the year ended 2019;
|
|
|
- |
Loan fees totaled $5.0 million, an increase of $592,000 or 13.3%;
|
|
|
- |
Yields on our interest-earning assets totaled 5.67%, a decrease of 88 basis points which was attributable to lower loan rates and a decrease in yield on short term investments of 157 basis points, both were
primarily impacted by the aforementioned changes in market interest rates related to the pandemic; and
|
|
|
- |
Net interest margin for the year ended 2020 and 2019 was 5.01% and 5.35%, respectively.
|
For the year ended December 31, 2019 compared to the year ended December 31, 2018:
|
|
- |
Total interest income on loans increased $3.9 million, or 8.9%, to $48.2 million which was attributable to a $52.5 million increase in the average balance of loans to $636.3 million during the year ended 2019 as
compared with the average balance of $583.8 million for the year ended 2018;
|
|
|
- |
Loan fees totaled $4.4 million, a decrease of $678,000 or 13.2% which was attributable to nonrecurring loan fee income earned during the year ended 2018 as compared to 2019;
|
|
|
- |
Yields on our interest-earning assets totaled 6.55%, an increase of 7 basis points; and
|
|
|
- |
Net interest margin for the year ended 2019 and 2018 was 5.35% and 5.49%, respectively.
|
The FED influences the general market rates of interest, including the deposit and loan rates offered by many financial institutions. Our loan portfolio is significantly affected by
changes in the prime interest rate. For the two year period between January 1, 2018 and December 31, 2020, the prime rate fluctuated between a high of 5.5%, and a low of 3.25%. Although the FED has signaled continued low rates through 2023, changing
interest rates will always be present and managing through those changes requires constant oversight.
Interest income on short-term investments decreased $2.6 million, or 76.1%, to $828,000 for year ended December 31, 2020 compared to 2019, due to a decrease in the average balances of
$35.1 million, or 23.2% and a yield decrease of 157 basis points which was related to the aforementioned changes in market interest rates related to the pandemic. Interest income on short-term investments increased $938,000, or 37.2%, to $3.5
million for year ended December 31, 2019 compared to 2018, due to an increase in the average balances of $14.5 million, or 10.63% and a yield increase of 44 basis points.
Interest expense on interest-bearing deposits totaled $6.2 million for the year ended December 31, 2020, compared to $9.5 million for 2019, a decrease of $3.4 million, or 35.3%. The
decrease was related to the cost of interest-bearing deposits decreasing to 1.05% for the year ended December 31, 2020 from 1.89% for the year ended December 31, 2019, which was related to the aforementioned changes in market interest rates related
to the pandemic. Interest expense on interest-bearing deposits totaled $9.5 million for the year ended December 31, 2019, compared to $7.0 million for 2018, an increase of $2.5 million, or 36.1%. The increase was related to average daily interest
bearing deposit balances increasing by $43.0 million or 9.3% while the cost of interest-bearing deposits grew to 1.89% for the year ended December 31, 2019 from 1.52% for the year ended December 31, 2018.
Net interest margin, including loan fee income, for the years ended December 31, 2020, 2019 and 2018 was 5.01%, 5.35% and 5.49%, respectively. Excluding our loan fee income, net
interest margin for the years ended December 31, 2020, 2019 and 2018 was 4.48%, 4.78% and 4.78%, respectively. Net interest margin excluding loan fee income is a non-GAAP measure. See “GAAP Reconciliation and Management Explanation of Non-GAAP
Financial Measures” elsewhere in this report.
The following table sets forth the effects of changing rates and volumes on our net interest income during the period shown. Information is provided with respect to (i) effects on
interest income attributable to changes in volume (change in volume multiplied by prior rate) and (ii) effects on interest income attributable to changes in rate (changes in rate multiplied by prior volume).
|
For the Year Ended
December 31, 2020 vs. 2019
|
For the Year Ended
December 31, 2019 vs. 2018
|
|||||||||||||||||||||||
|
Change due to:
|
Change due to:
|
|||||||||||||||||||||||
|
Volume
(1)
|
Rate
(1)
|
Interest
Variance
|
Volume
(1)
|
Rate
(1)
|
Interest
Variance
|
|||||||||||||||||||
|
(Dollars in thousands)
|
||||||||||||||||||||||||
|
Increase (decrease) in interest income:
|
||||||||||||||||||||||||
|
Short-term investments
|
$
|
(803
|
)
|
$
|
(1,828
|
)
|
$
|
(2,631
|
)
|
$
|
268
|
$
|
670
|
$
|
938
|
|||||||||
|
Investment securities
|
$
|
3
|
$
|
(17
|
)
|
$
|
(14
|
)
|
$
|
---
|
$
|
50
|
$
|
50
|
||||||||||
|
Total loans
|
$
|
14.163
|
$
|
(9,913
|
)
|
$
|
4,250
|
$
|
3,978
|
$
|
(57
|
)
|
$
|
3,921
|
||||||||||
|
Total increase in interest income
|
$
|
13,363
|
$
|
(11,758
|
)
|
$
|
1,605
|
$
|
4,246
|
$
|
663
|
$
|
4,909
|
|||||||||||
|
Increase (decrease) in interest expense:
|
||||||||||||||||||||||||
|
Deposits:
|
||||||||||||||||||||||||
|
Transaction accounts
|
$
|
1,402
|
$
|
(3,730
|
)
|
$
|
(2,328
|
)
|
$
|
814
|
$
|
659
|
$
|
1,473
|
||||||||||
|
Time deposits
|
$
|
(20
|
)
|
$
|
(1,015
|
)
|
$
|
(1,035
|
)
|
$
|
(181
|
)
|
$
|
1,230
|
$
|
1,049
|
||||||||
|
Total interest-bearing deposits
|
$
|
1,382
|
$
|
(4,745
|
)
|
$
|
(3,363
|
)
|
$
|
633
|
$
|
1,889
|
$
|
2,522
|
||||||||||
|
Other borrowings
|
---
|
---
|
---
|
---
|
(175
|
)
|
(175
|
)
|
||||||||||||||||
|
Total interest-bearing liabilities
|
$
|
1,382
|
$
|
(4,745
|
)
|
$
|
(3,363
|
)
|
$
|
633
|
$
|
1,714
|
$
|
2,347
|
||||||||||
|
Increase in net interest income
|
$
|
11,981
|
$
|
(7,013
|
)
|
$
|
4,968
|
$
|
3,613
|
$
|
(1,051
|
)
|
$
|
2,562
|
||||||||||
|
(1)
|
Variances attributable to both volume and rate are allocated on a consistent basis between rate and volume based on the absolute value of the variances in each category.
|
Provision for Loan Losses
For the year ended December 31, 2020 compared to the year ended December 31, 2019:
|
|
- |
The provision for loan losses increased from zero to $5.4 million related to loan growth, uncertainty in the economy caused by the COVID-19 pandemic and $3.6 million in net charge offs; and
|
|
|
- |
The allowance as a percentage of loans increased by 4 basis points to 1.15%.
|
For the year ended December 31, 2019 compared to the year ended December 31, 2018:
|
|
- |
The provision for loan losses decreased by $200,000, or 100%, to $0; and
|
|
|
- |
The allowance as a percentage of loans decreased by 20 basis points to 1.11%.
|
Noninterest Income
Noninterest income for the year ended December 31, 2020 was $1.7 million compared to $1.3 million for the year ended December 31, 2019, an increase of $357,000, or 27.3%. Noninterest
income for the year ended December 31, 2019 was $1.3 million compared to $1.3 million for the year ended December 31, 2018, a decrease of $23,000, or 1.7%. The following table sets forth the major components of our noninterest income for the years
ended December 31, 2020, 2019 and 2018:
|
For the Years Ended
December 31,
|
For the Years Ended
December 31,
|
|||||||||||||||||||||||||||||||
|
2020
|
2019
|
$ Increase
(Decrease)
|
% Increase
(Decrease)
|
2019
|
2018
|
$ Increase
(Decrease)
|
% Increase
(Decrease)
|
|||||||||||||||||||||||||
|
(Dollars in thousands)
|
(Dollars in thousands)
|
|||||||||||||||||||||||||||||||
|
Noninterest income:
|
||||||||||||||||||||||||||||||||
|
Secondary Market Income
|
$
|
175
|
$
|
164
|
$
|
11
|
6.71
|
%
|
$
|
164
|
$
|
212
|
$
|
45
|
12.97
|
%
|
||||||||||||||||
|
Service Charges on Deposit Accounts
|
$
|
442
|
$
|
392
|
$
|
50
|
12.76
|
%
|
$
|
392
|
$
|
347
|
$
|
(48
|
)
|
(22.64
|
%)
|
|||||||||||||||
|
Other Income and Fees
|
$
|
1,048
|
$
|
752
|
$
|
296
|
39.36
|
%
|
$
|
752
|
$
|
772
|
$
|
(20
|
)
|
(2.59
|
%)
|
|||||||||||||||
|
Total noninterest income
|
$
|
1,665
|
$
|
1,308
|
$
|
357
|
27.29
|
%
|
$
|
1,308
|
$
|
1,331
|
$
|
(23
|
)
|
(1.73
|
%)
|
|||||||||||||||
Noninterest Expense
Noninterest expense for the year ended December 31, 2020 was $17.6 million compared to $28.4 million for the year ended December 31, 2019, a decrease of $10.8 million or 38.1%.
Noninterest expense for the year ended December 31, 2019 was $28.4 compared to $15.0 million for the year ended December 31, 2018, an increase of $13.5 million, or 90.0%. The following table sets forth the major components of our noninterest expense
for the years ended December 31, 2020, 2019 and 2018:
|
For the Years Ended
December 31,
|
For the Years Ended
December 31,
|
|||||||||||||||||||||||||||||||
|
2020
|
2019
|
$ Increase
(Decrease)
|
% Increase
(Decrease)
|
2019
|
2018
|
$ Increase
(Decrease)
|
% Increase
(Decrease)
|
|||||||||||||||||||||||||
|
(Dollars in thousands)
|
(Dollars in thousands)
|
|||||||||||||||||||||||||||||||
|
Noninterest expense:
|
||||||||||||||||||||||||||||||||
|
Salaries and employee benefits
|
$
|
10,130
|
$
|
21,265
|
$
|
(11,135
|
)
|
(52.36
|
%)
|
$
|
21,265
|
$
|
8,113
|
$
|
13,152
|
162.11
|
%
|
|||||||||||||||
|
Furniture and equipment
|
868
|
829
|
39
|
4.70
|
%
|
829
|
684
|
145
|
21.20
|
%
|
||||||||||||||||||||||
|
Occupancy
|
1,957
|
1,677
|
280
|
16.70
|
%
|
1,677
|
1,105
|
572
|
51.76
|
%
|
||||||||||||||||||||||
|
Data and item processing
|
1,091
|
1,078
|
13
|
1.21
|
%
|
1,078
|
966
|
112
|
11.59
|
%
|
||||||||||||||||||||||
|
Accounting, legal and professional fees
|
536
|
757
|
(221
|
)
|
(29.19
|
%)
|
757
|
305
|
452
|
148.20
|
%
|
|||||||||||||||||||||
|
Regulatory assessments
|
506
|
126
|
380
|
301.59
|
%
|
126
|
542
|
(416
|
)
|
(76.75
|
%)
|
|||||||||||||||||||||
|
Advertising and public relations
|
400
|
588
|
(188
|
)
|
(31.97
|
%)
|
588
|
553
|
35
|
6.33
|
%
|
|||||||||||||||||||||
|
Travel, lodging and entertainment
|
241
|
368
|
(127
|
)
|
(34.51
|
%)
|
368
|
699
|
(331
|
)
|
(47.35
|
%)
|
||||||||||||||||||||
|
Other expense
|
1,863
|
1,744
|
119
|
6.82
|
%
|
1,744
|
1,998
|
(254
|
)
|
(12.71
|
%)
|
|||||||||||||||||||||
|
Total noninterest expense
|
$
|
17,592
|
$
|
28,432
|
$
|
(10,840
|
)
|
(38.13
|
%)
|
$
|
28,432
|
$
|
14,965
|
$
|
13,467
|
89.99
|
%
|
|||||||||||||||
For the year ended December 31, 2020 compared to the year ended December 31, 2019:
|
|
- |
Salaries and employee benefits expense was $10.1 million compared to $21.3 million, a decrease of $11.1 million, or 52.4%. The decrease was attributable to our one-time non-cash executive stock transaction in 2019.
|
|
|
- |
Occupancy expense was $2.0 million compared to $1.7 million, an increase of $280,000, or 16.7%. The increase in 2020 was primarily due to 2020 being the first full year of depreciation for the renovation of our
main branch and headquarters and increased rent at our full-service Tulsa location.
|
For the year ended December 31, 2019 compared to the year ended December 31, 2018:
|
|
- |
Salaries and employee benefits expense was $21.3 million compared to $8.1 million, an increase of $13.2 million, or 162.1%. The increase in 2019 was attributable to our one-time non-cash executive stock
transaction.
|
|
|
- |
Occupancy expense was $1.7 million compared to $1.1 million, an increase of $572,000, or 51.8%. The increase in 2019 was primarily due to the renovation of our headquarters and the expansion into two new markets.
|
|
|
- |
Accounting, legal and professional fees were $757,000 compared to $305,000, an increase of $452,000, or 148.2%. The increase was primarily due to 2019 being our first full year as a public company.
|
Financial Condition
The following discussion of our financial condition compares December 31, 2020, 2019, and 2018.
Total Assets
Total assets increased $150.3 million, or 17.4%, to $1.0 billion as of December 31, 2020, as compared to $866.4 million as of December 31, 2019 and $770.5 million as of December 31,
2018. The increasing trend in total assets is primarily attributable to strong organic loan and retail deposit growth within the Oklahoma City market and expansion into the Dallas/Fort Worth metropolitan area, as well as the addition of loans related
to the Paycheck Protection Program (PPP) in 2020.
Loan Portfolio
Our loans represent the largest portion of our earning assets. The quality and diversification of the loan portfolio is an important consideration when reviewing our financial
condition. As of December 31, 2020, 2019 and 2018, our gross loans were $839.1 million, $708.7 million and $601.9 million, respectively.
The following table presents the balance and associated percentage of each major category in our loan portfolio as of December 31, 2020, December 31, 2019 and December 31, 2018:
|
As of December 31,
|
As of December 31,
|
As of December 31,
|
||||||||||||||||||||||
|
2020
|
2019
|
2018
|
||||||||||||||||||||||
|
Amount
|
% of
Total
|
Amount
|
% of Total
|
Amount
|
% of Total
|
|||||||||||||||||||
|
(Dollars in thousands)
|
||||||||||||||||||||||||
|
Construction & development
|
$
|
107,855
|
12.8
|
%
|
$
|
70,628
|
10.0
|
%
|
$
|
87,267
|
14.5
|
%
|
||||||||||||
|
1-4 family real estate
|
29,079
|
3.5
|
34,160
|
4.8
|
33,278
|
5.5
|
||||||||||||||||||
|
Commercial real estate - other
|
290,489
|
34.6
|
273,278
|
38.5
|
156,396
|
26.0
|
||||||||||||||||||
|
Total real estate
|
427,423
|
50.9
|
378,066
|
53.3
|
276,941
|
46.0
|
||||||||||||||||||
|
Commercial & industrial
|
351,248
|
41.9
|
260,762
|
36.8
|
248,394
|
41.3
|
||||||||||||||||||
|
Agricultural
|
50,519
|
6.0
|
57,945
|
8.2
|
62,844
|
10.4
|
||||||||||||||||||
|
Consumer
|
9,898
|
1.2
|
11,895
|
1.7
|
13,723
|
2.3
|
||||||||||||||||||
|
Gross loans
|
839,088
|
100.0
|
%
|
708,668
|
100.0
|
%
|
601,902
|
100.0
|
%
|
|||||||||||||||
|
Less deferred loan fees, net
|
(2,475
|
)
|
(1,364
|
)
|
(1,992
|
)
|
||||||||||||||||||
|
Total loans
|
836,613
|
707,304
|
599,910
|
|||||||||||||||||||||
|
Allowance for loan and lease losses
|
(9,639
|
)
|
(7,846
|
)
|
(7,832
|
)
|
||||||||||||||||||
|
Net loans
|
$
|
826,974
|
$
|
699,458
|
$
|
592,078
|
||||||||||||||||||
During the second quarter of 2020, we began originating loans to qualified small businesses under the PPP administered by the SBA under the provisions of the CARES Act. Included in our commercial & industrial balance at
December 31, 2020, are $44.9 million of PPP loans.
We have established internal concentration limits in the loan portfolio for CRE loans, hospitality loans, energy loans, and construction loans, among others. All loan types are within
our established limits. We use underwriting guidelines to assess each borrower’s historical cash flow to determine debt service, and we further stress test the debt service under higher interest rate scenarios. Financial and performance covenants are
used in commercial lending to allow us to react to a borrower’s deteriorating financial condition, should that occur.
The following tables show the contractual maturities of our gross loans as of the periods below:
|
As of December 31, 2020
|
||||||||||||||||||||||||||||
|
Due in One Year or Less
|
Due after One Year
Through Five Years
|
Due after Five Years
|
||||||||||||||||||||||||||
|
Fixed
Rate
|
Adjustable
Rate
|
Fixed
Rate
|
Adjustable
Rate
|
Fixed
Rate
|
Adjustable
Rate
|
Total
|
||||||||||||||||||||||
|
(Dollars in thousands)
|
||||||||||||||||||||||||||||
|
Construction & development
|
$
|
14
|
$
|
47,649
|
$
|
885
|
$
|
58,387
|
$
|
—
|
$
|
920
|
$
|
107,855
|
||||||||||||||
|
1-4 family real estate
|
273
|
13,394
|
4,712
|
9,959
|
39
|
702
|
29,079
|
|||||||||||||||||||||
|
Commercial real estate - other
|
2,377
|
55,307
|
45,880
|
180,721
|
294
|
5,910
|
290,489
|
|||||||||||||||||||||
|
Total real estate
|
2,664
|
116,350
|
51,477
|
249,067
|
333
|
7,532
|
427,423
|
|||||||||||||||||||||
|
Commercial & industrial
|
16,914
|
194,520
|
39,593
|
93,707
|
11
|
6,503
|
351,248
|
|||||||||||||||||||||
|
Agricultural
|
5,141
|
27,215
|
2,534
|
14,420
|
60
|
1,149
|
50,519
|
|||||||||||||||||||||
|
Consumer
|
1,544
|
150
|
6,570
|
65
|
1,144
|
425
|
9,898
|
|||||||||||||||||||||
|
Gross loans
|
$
|
26,263
|
$
|
338,235
|
$
|
100,174
|
$
|
357,259
|
$
|
1,548
|
$
|
15,609
|
$
|
839,088
|
||||||||||||||
|
As of December 31, 2019
|
||||||||||||||||||||||||||||
|
Due in One Year or Less
|
Due after One Year
Through Five Years
|
Due after Five Years
|
||||||||||||||||||||||||||
|
Fixed
Rate
|
Adjustable
Rate
|
Fixed
Rate
|
Adjustable
Rate
|
Fixed
Rate
|
Adjustable
Rate
|
Total
|
||||||||||||||||||||||
|
(Dollars in thousands)
|
||||||||||||||||||||||||||||
|
Construction & development
|
$
|
—
|
$
|
31,860
|
$
|
833
|
$
|
37,483
|
$
|
—
|
$
|
452
|
$
|
70,628
|
||||||||||||||
|
1-4 family real estate
|
282
|
9,598
|
3,843
|
19,676
|
43
|
718
|
34,160
|
|||||||||||||||||||||
|
Commercial real estate - other
|
1,849
|
23,533
|
23,194
|
219,390
|
335
|
4,977
|
273,278
|
|||||||||||||||||||||
|
Total real estate
|
2,131
|
64,991
|
27,870
|
276,549
|
378
|
6,147
|
378,066
|
|||||||||||||||||||||
|
Commercial & industrial
|
11,677
|
176,329
|
9,973
|
54,233
|
12
|
8,538
|
260,762
|
|||||||||||||||||||||
|
Agricultural
|
3,947
|
34,875
|
2,786
|
13,055
|
1,319
|
1,963
|
57,945
|
|||||||||||||||||||||
|
Consumer
|
2,042
|
—
|
4,824
|
159
|
4,047
|
823
|
11,895
|
|||||||||||||||||||||
|
Gross loans
|
$
|
19,797
|
$
|
276,195
|
$
|
45,453
|
$
|
343,996
|
$
|
5,756
|
$
|
17,471
|
$
|
708,668
|
||||||||||||||
|
As of December 31, 2018
|
||||||||||||||||||||||||||||
|
Due in One Year or Less
|
Due after One Year
Through Five Years
|
Due after Five Years
|
||||||||||||||||||||||||||
|
Fixed
Rate
|
Adjustable
Rate
|
Fixed
Rate
|
Adjustable
Rate
|
Fixed
Rate
|
Adjustable
Rate
|
Total
|
||||||||||||||||||||||
|
(Dollars in thousands)
|
||||||||||||||||||||||||||||
|
Construction & development
|
$
|
741
|
$
|
29,412
|
$
|
617
|
$
|
56,497
|
$
|
---
|
$
|
---
|
$
|
87,267
|
||||||||||||||
|
1-4 family real estate
|
682
|
19,866
|
1,643
|
$
|
10,934
|
---
|
153
|
33,278
|
||||||||||||||||||||
|
Commercial real estate - other
|
457
|
14,280
|
283
|
$
|
134,090
|
2,197
|
5,089
|
156,396
|
||||||||||||||||||||
|
Total real estate
|
1,880
|
63,558
|
2,543
|
201,521
|
2,197
|
5,242
|
276,941
|
|||||||||||||||||||||
|
Commercial & industrial
|
13,725
|
153,891
|
7,878
|
66,631
|
14
|
6,255
|
248,394
|
|||||||||||||||||||||
|
Agricultural
|
4,474
|
32,496
|
4,084
|
17,669
|
1,374
|
2,747
|
62,844
|
|||||||||||||||||||||
|
Consumer
|
2,688
|
---
|
5,443
|
50
|
4,453
|
1,089
|
13,723
|
|||||||||||||||||||||
|
Gross loans
|
$
|
22,767
|
$
|
249,945
|
$
|
19,948
|
$
|
285,871
|
$
|
8,038
|
$
|
15,333
|
$
|
601,902
|
||||||||||||||
Allowance for Loan and Lease Losses
The allowance is based on management’s estimate of probable losses inherent in the loan portfolio. In the opinion of management, the allowance is adequate to absorb estimated losses
in the portfolio as of each balance sheet date. While management uses available information to analyze losses on loans, future additions to the allowance may be necessary based on changes in economic conditions. In addition, various regulatory
agencies, as an integral part of their examination process, periodically review the Company’s allowance. In analyzing the adequacy of the allowance, a comprehensive loan grading system to determine risk potential in loans is utilized together with
the results of internal credit reviews.
To determine the adequacy of the allowance, the loan portfolio is broken into segments based on loan type. Historical loss experience factors by segment, adjusted for changes in
trends and conditions, are used to determine an indicated allowance for each portfolio segment. These factors are evaluated and updated based on the composition of the specific loan segment. Other considerations include volumes and trends of
delinquencies, nonaccrual loans, levels of bankruptcies, criticized and classified loan trends, expected losses on real estate secured loans, new credit products and policies, economic conditions, concentrations of credit risk and the experience and
abilities of our lending personnel. In addition to the segment evaluations, impaired loans with a balance of $250,000 or more are individually evaluated based on facts and circumstances of the loan to determine if a specific allowance amount may be
necessary. Specific allowances may also be established for loans whose outstanding balances are below the $250,000 threshold when it is determined that the risk associated with the loan differs significantly from the risk factor amounts established
for its loan segment.
The allowance was $9.6 million at December 31, 2020, $7.8 million at December 31, 2019 and $7.8 million at December 31, 2018. The increasing trend was related to, and in conjunction
with, loan growth and uncertainty in the economy caused by the COVID-19 pandemic.
The following table provides an analysis of the activity in our allowance for the periods indicated:
|
For the Year Ended
December 31,
|
||||||||||||
|
2020
|
2019
|
2018
|
||||||||||
|
(Dollars in thousands)
|
||||||||||||
|
Balance at beginning of the period
|
$
|
7,846
|
$
|
7,832
|
$
|
7,654
|
||||||
|
Provision for loan losses
|
5,350
|
—
|
200
|
|||||||||
|
Charge-offs:
|
||||||||||||
|
Construction & development
|
—
|
—
|
—
|
|||||||||
|
1-4 family real estate
|
—
|
(2
|
)
|
(25
|
)
|
|||||||
|
Commercial real estate - other
|
—
|
—
|
—
|
|||||||||
|
Commercial & industrial
|
(3,289
|
)
|
(4
|
)
|
(73
|
)
|
||||||
|
Agricultural
|
(300
|
)
|
(11
|
)
|
—
|
|||||||
|
Consumer
|
(1
|
)
|
(1
|
)
|
—
|
|||||||
|
Total charge-offs
|
(3,590
|
)
|
(18
|
)
|
(98
|
)
|
||||||
|
Recoveries:
|
||||||||||||
|
Construction & development
|
—
|
—
|
—
|
|||||||||
|
1-4 family real estate
|
2
|
5
|
3
|
|||||||||
|
Commercial real estate - other
|
—
|
—
|
—
|
|||||||||
|
Commercial & industrial
|
18
|
24
|
71
|
|||||||||
|
Agricultural
|
10
|
3
|
1
|
|||||||||
|
Consumer
|
3
|
—
|
1
|
|||||||||
|
Total recoveries
|
33
|
32
|
76
|
|||||||||
|
Net charge-offs
|
(3,557
|
)
|
14
|
(22
|
)
|
|||||||
|
Balance at end of the period
|
$
|
9,639
|
$
|
7,846
|
$
|
7,832
|
||||||
While the entire allowance is available to absorb losses from any and all loans, the following table represents management’s allocation of the allowance by loan category, and the
percentage of allowance in each category, for the periods indicated:
|
As of December 31,
|
||||||||||||||||||||||||
|
2020
|
2019
|
2018
|
||||||||||||||||||||||
|
Amount
|
Percent
|
Amount
|
Percent
|
Amount
|
Percent
|
|||||||||||||||||||
|
(Dollars in thousands)
|
||||||||||||||||||||||||
|
Construction & development
|
$
|
1,239
|
12.85
|
%
|
$
|
782
|
9.97
|
%
|
$
|
1,136
|
14.50
|
%
|
||||||||||||
|
1-4 family real estate
|
334
|
3.47
|
%
|
378
|
4.82
|
%
|
433
|
5.53
|
%
|
|||||||||||||||
|
Commercial real estate - other
|
3,337
|
34.62
|
%
|
3,025
|
38.55
|
%
|
2,035
|
25.98
|
%
|
|||||||||||||||
|
Commercial & industrial
|
4,035
|
41.86
|
%
|
2,887
|
36.80
|
%
|
3,231
|
41.26
|
%
|
|||||||||||||||
|
Agricultural
|
580
|
6.02
|
%
|
642
|
8.18
|
%
|
818
|
10.44
|
%
|
|||||||||||||||
|
Consumer
|
114
|
1.18
|
%
|
132
|
1.68
|
%
|
179
|
2.29
|
%
|
|||||||||||||||
|
Total
|
$
|
9,639
|
100.0
|
%
|
$
|
7,846
|
100.0
|
%
|
$
|
7,832
|
100.0
|
%
|
||||||||||||
Nonperforming Assets
Loans are considered delinquent when principal or interest payments are past due 30 days or more. Delinquent loans may remain on accrual status between 30 days and 90 days past due.
Loans on which the accrual of interest has been discontinued are designated as nonaccrual loans. Typically, the accrual of interest on loans is discontinued when principal or interest payments are past due 90 days or when, in the opinion of
management, there is a reasonable doubt as to collectability of the obligation. When loans are placed on nonaccrual status, all interest previously accrued but not collected is reversed against current period interest income. Income on a nonaccrual
loan is subsequently recognized only to the extent that cash is received and the loan’s principal balance is deemed collectible. Loans are restored to accrual status when loans become well-secured and management believes full collectability of
principal and interest is probable.
A loan is considered impaired when it is probable that we will be unable to collect all amounts due according to the contractual terms of the loan agreement. Impaired loans include
loans on nonaccrual status and loans modified in a troubled debt restructuring, or TDR. Income from a loan on nonaccrual status is recognized to the extent cash is received and when the loan’s principal balance is deemed collectible. Depending on a
particular loan’s circumstances, we measure impairment of a loan based upon either the present value of expected future cash flows discounted at the loan’s effective interest rate, the loan’s observable market price, or the fair value of the
collateral less estimated costs to sell if the loan is collateral dependent. A loan is considered collateral dependent when repayment of the loan is based solely on the liquidation of the collateral. Fair value, where possible, is determined by
independent appraisals, typically on an annual basis. Between appraisal periods, the fair value may be adjusted based on specific events, such as if deterioration of quality of the collateral comes to our attention as part of our problem loan
monitoring process, or if discussions with the borrower lead us to believe the last appraised value no longer reflects the actual market for the collateral. The impairment amount on a collateral dependent loan is charged off to the allowance if
deemed not collectible and the impairment amount on a loan that is not collateral dependent is set up as a specific reserve.
In cases where a borrower experiences financial difficulties and we make certain concessionary modifications to contractual terms, the loan is classified as a TDR. Included in certain
loan categories of impaired loans are TDRs on which we have granted certain material concessions to the borrower as a result of the borrower experiencing financial difficulties. The concessions granted by us may include, but are not limited to: (1) a
modification in which the maturity date, timing of payments or frequency of payments is modified, (2) an interest rate lower than the current market rate for new loans with similar risk, or (3) a combination of the first two concessions.
If a borrower on a restructured accruing loan has demonstrated performance under the previous terms, is not experiencing financial difficulty and shows the capacity to continue to
perform under the restructured terms, the loan will remain on accrual status. Otherwise, the loan will be placed on nonaccrual status until the borrower demonstrates a sustained period of performance, which generally requires six consecutive months
of payments. Loans identified as TDRs are evaluated for impairment using the present value of the expected cash flows or the estimated fair value of the collateral, if the loan is collateral dependent. The fair value is determined, when possible, by
an appraisal of the property less estimated costs related to liquidation of the collateral. The appraisal amount may also be adjusted for current market conditions. Adjustments to reflect the present value of the expected cash flows or the estimated
fair value of collateral dependent loans are a component in determining an appropriate allowance, and as such, may result in increases or decreases to the provision for loan losses in current and future earnings.
Real estate we acquire as a result of foreclosure or by deed-in-lieu of foreclosure is classified as other real estate owned, or OREO, until sold, and is initially recorded at fair
value less costs to sell when acquired, establishing a new cost basis.
Nonperforming loans include nonaccrual loans, loans past due 90 days or more and still accruing interest and loans modified under TDRs that are not performing in accordance with their
modified terms. Nonperforming assets consist of nonperforming loans plus OREO. Loans accounted for on a nonaccrual basis were $14.6 million as of December 31, 2020, $1.8 million as of December 31, 2019 and $2.6 million as of December 31, 2018. OREO
was $0 as of December 31, 2020, $0 as of December 31, 2019 and $110,000 as of December 31, 2018.
The following table presents information regarding nonperforming assets as of the dates indicated.
|
As of
December 31,
|
||||||||||||
|
2020
|
2019
|
2018
|
||||||||||
|
(Dollars in thousands)
|
||||||||||||
|
Nonaccrual loans
|
$
|
14,575
|
$
|
1,809
|
$
|
2,615
|
||||||
|
Troubled debt restructurings
|
-
|
912
|
-
|
|||||||||
|
Accruing loans 90 or more days past due
|
1,960
|
612
|
-
|
|||||||||
|
Total nonperforming loans
|
16,535
|
3,333
|
2,615
|
|||||||||
|
Other real estate owned
|
—
|
—
|
110
|
|||||||||
|
Total nonperforming assets
|
$
|
16,535
|
$
|
3,333
|
$
|
2,725
|
||||||
|
Ratio of nonperforming loans to total loans
|
1.98
|
%
|
0.47
|
%
|
0.44
|
%
|
||||||
|
Ratio of nonperforming assets to total assets
|
1.63
|
%
|
0.38
|
%
|
0.35
|
%
|
||||||
The following tables present an aging analysis of loans as of the dates indicated.
|
As of December 31, 2020
|
||||||||||||||||||||||||||||
|
Loans
30-59 days
past due
|
Loans
60-89 days
past due
|
Loans
90+ days
past due
|
Total
Loans
90+
days and
accruing
|
Total
past
due
Loans
|
Current
Loans
|
Gross
Loans
|
||||||||||||||||||||||
|
(Dollars in thousands)
|
||||||||||||||||||||||||||||
|
Construction & development
|
$
|
714
|
$
|
—
|
$
|
—
|
$
|
—
|
$
|
714
|
$
|
107,141
|
$
|
107,855
|
||||||||||||||
|
1-4 family real estate
|
—
|
—
|
—
|
—
|
—
|
29,079
|
29,079
|
|||||||||||||||||||||
|
Commercial real estate - other
|
1,444
|
—
|
1,960
|
1,960
|
3,404
|
287,085
|
290,489
|
|||||||||||||||||||||
|
Commercial & industrial
|
—
|
—
|
—
|
—
|
—
|
351,248
|
351,248
|
|||||||||||||||||||||
|
Agricultural
|
—
|
—
|
—
|
—
|
—
|
50,519
|
50,519
|
|||||||||||||||||||||
|
Consumer
|
193
|
—
|
—
|
—
|
193
|
9,705
|
9,898
|
|||||||||||||||||||||
|
Total
|
$
|
2,351
|
$
|
0
|
$
|
1,960
|
$
|
1,960
|
$
|
4,311
|
$
|
834,777
|
$
|
839,088
|
||||||||||||||
|
As of December 31, 2019
|
||||||||||||||||||||||||||||
|
Loans
30-59 days
past due
|
Loans
60-89 days
past due
|
Loans
90+ days
past due
|
Total
Loans
90+
days and
accruing
|
Total
past
due
Loans
|
Current
Loans
|
Gross
Loans
|
||||||||||||||||||||||
|
(Dollars in thousands)
|
||||||||||||||||||||||||||||
|
Construction & development
|
$
|
—
|
$
|
—
|
$
|
—
|
$
|
—
|
$
|
—
|
$
|
70,628
|
$
|
70,628
|
||||||||||||||
|
1-4 family real estate
|
—
|
—
|
—
|
—
|
—
|
34,160
|
34,160
|
|||||||||||||||||||||
|
Commercial real estate - other
|
—
|
—
|
—
|
—
|
—
|
273,278
|
273,278
|
|||||||||||||||||||||
|
Commercial & industrial
|
—
|
—
|
14
|
14
|
14
|
260,748
|
260,762
|
|||||||||||||||||||||
|
Agricultural
|
—
|
—
|
598
|
598
|
598
|
57,347
|
57,945
|
|||||||||||||||||||||
|
Consumer
|
90
|
—
|
—
|
—
|
90
|
11,805
|
11,895
|
|||||||||||||||||||||
|
Total
|
$
|
90
|
$
|
0
|
$
|
612
|
$
|
612
|
$
|
702
|
$
|
707,966
|
$
|
708,668
|
||||||||||||||
|
As of December 31, 2018
|
||||||||||||||||||||||||||||
|
Loans
30-59 days
past due
|
Loans
60-89 days
past due
|
Loans
90+ days
past due
|
Total Loans
90+ days and
accruing
|
Total past
due
Loans
|
Current
Loans
|
Gross
Loans
|
||||||||||||||||||||||
|
(Dollars in thousands)
|
||||||||||||||||||||||||||||
|
Construction & development
|
$
|
-
|
$
|
-
|
$
|
-
|
$
|
-
|
$
|
-
|
$
|
87,267
|
$
|
87,267
|
||||||||||||||
|
1-4 family real estate
|
8
|
-
|
-
|
-
|
8
|
33,270
|
33,278
|
|||||||||||||||||||||
|
Commercial real estate - other
|
-
|
-
|
-
|
-
|
-
|
156,396
|
156,396
|
|||||||||||||||||||||
|
Commercial & industrial
|
-
|
5
|
-
|
-
|
5
|
248,389
|
248,394
|
|||||||||||||||||||||
|
Agricultural
|
-
|
-
|
-
|
-
|
-
|
62,844
|
62,844
|
|||||||||||||||||||||
|
Consumer
|
41
|
-
|
-
|
-
|
41
|
13,682
|
13,723
|
|||||||||||||||||||||
|
Total
|
$
|
49
|
$
|
5
|
$
|
0
|
$
|
0
|
$
|
54
|
$
|
601,848
|
$
|
601,902
|
||||||||||||||
In addition to the past due and nonaccrual criteria, the Company also evaluates loans according to its internal risk grading system. Loans are segregated between pass, watch, special
mention, and substandard categories. The definitions of those categories are as follows:
In addition to the past due and nonaccrual criteria, the Company also evaluates loans according to its internal risk grading system. Loans are segregated between pass, watch, special
mention, and substandard categories. The definitions of those categories are as follows:
Pass
: These loans generally conform to Bank policies, are characterized by policy-conforming advance rates on collateral, and have
well-defined repayment sources. In addition, these credits are extended to borrowers and guarantors with a strong balance sheet and either substantial liquidity or a reliable income history.
Watch
: These loans are still considered “Pass” credits; however, various factors such as industry stress, material changes in cash flow or
financial conditions, or deficiencies in loan documentation, or other risk issues determined by the lending officer, Commercial Loan Committee or CQC warrant a heightened sense and frequency of monitoring.
Special mention
: These loans have observable weaknesses or evidence imprudent handling or structural issues. The weaknesses require close
attention, and the remediation of those weaknesses is necessary. No risk of probable loss exists. Credits in this category are expected to quickly migrate to “Watch” or “Substandard” as this is viewed as a transitory loan grade.
Substandard
: These loans are not adequately protected by the sound worth and debt service capacity of the borrower, but may be well-secured.
The loans have defined weaknesses relative to cash flow, collateral, financial condition or other factors that might jeopardize repayment of all of the principal and interest on a timely basis. There is the possibility that a future loss will occur
if weaknesses are not remediated.
Substandard loans totaled $23.1 million as of December 31, 2020, an increase of $12.0 million compared to December 31, 2019. The increase primarily related to two commercial and
industrial relationships comprised of one note each totaling $14.4 million with no specific reserves and two commercial real estate relationships comprised of one note each totaling $5.0 million with no specific reserves. Substandard loans totaled
$11.1 million as of December 31, 2019, an increase of $2.0 million compared to December 31, 2018. The increase primarily related to one agricultural relationship comprised of four notes totaling $1.8 million with no specific reserve, one agricultural
relationship comprised of three notes totaling $555,000 with no specific reserve, one mixed relationship comprised of eight notes totaling $4.2 million with no specific reserve, and one mixed relationship comprised of four notes totaling $2.8 million
with no specific reserve.
Outstanding loan balances categorized by internal risk grades as of the periods indicated are summarized as follows:
|
As of December 31, 2020
|
||||||||||||||||||||
|
Pass
|
Watch
|
Special
mention
|
Substandard
|
Total
|
||||||||||||||||
|
(Dollars in thousands)
|
||||||||||||||||||||
|
Construction & development
|
$
|
107,855
|
$
|
—
|
$
|
—
|
$
|
—
|
$
|
107,855
|
||||||||||
|
1-4 family real estate
|
28,711
|
368
|
—
|
—
|
29,079
|
|||||||||||||||
|
Commercial real estate - other
|
248,194
|
24,155
|
10,086
|
8,054
|
290,489
|
|||||||||||||||
|
Commercial & industrial
|
328,656
|
7,691
|
300
|
14,601
|
351,248
|
|||||||||||||||
|
Agricultural
|
50,051
|
—
|
—
|
468
|
50,519
|
|||||||||||||||
|
Consumer
|
9,898
|
—
|
—
|
—
|
9,898
|
|||||||||||||||
|
Total
|
$
|
773,365
|
$
|
32,214
|
$
|
10,386
|
$
|
23,123
|
$
|
839,088
|
||||||||||
|
As of December 31, 2019
|
||||||||||||||||||||
|
Pass
|
Watch
|
Special
mention
|
Substandard
|
Total
|
||||||||||||||||
|
(Dollars in thousands)
|
||||||||||||||||||||
|
Construction & development
|
$
|
70,628
|
$
|
—
|
$
|
—
|
$
|
—
|
$
|
70,628
|
||||||||||
|
1-4 family real estate
|
33,622
|
538
|
—
|
—
|
34,160
|
|||||||||||||||
|
Commercial real estate - other
|
267,437
|
—
|
—
|
5,841
|
273,278
|
|||||||||||||||
|
Commercial & industrial
|
241,176
|
5,312
|
11,524
|
2,750
|
260,762
|
|||||||||||||||
|
Agricultural
|
53,290
|
—
|
2,128
|
2,527
|
57,945
|
|||||||||||||||
|
Consumer
|
11,895
|
—
|
—
|
—
|
11,895
|
|||||||||||||||
|
Total
|
$
|
678,048
|
$
|
5,850
|
$
|
13,652
|
$
|
11,118
|
$
|
708,668
|
||||||||||
|
As of December 31, 2018
|
||||||||||||||||||||
|
Pass
|
Watch
|
Special mention
|
Substandard
|
Total
|
||||||||||||||||
|
(Dollars in thousands)
|
||||||||||||||||||||
|
Construction & development
|
$
|
84,485
|
$
|
2,782
|
$
|
—
|
$
|
—
|
$
|
87,267
|
||||||||||
|
1-4 family real estate
|
29,942
|
3,221
|
—
|
115
|
33,278
|
|||||||||||||||
|
Commercial real estate - other
|
154,353
|
1,559
|
—
|
484
|
156,396
|
|||||||||||||||
|
Commercial & industrial
|
204,671
|
36,342
|
—
|
7,381
|
248,394
|
|||||||||||||||
|
Agricultural
|
57,782
|
758
|
3,207
|
1,097
|
62,844
|
|||||||||||||||
|
Consumer
|
13,723
|
—
|
—
|
—
|
13,723
|
|||||||||||||||
|
Total
|
$
|
544,956
|
$
|
44,662
|
$
|
3,207
|
$
|
9,077
|
$
|
601,902
|
||||||||||
Troubled Debt Restructurings
TDRs are defined as those loans in which a bank, for economic or legal reasons related to a borrower’s financial difficulties, grants a concession to the borrower that it would not
otherwise consider. A loan is considered impaired when, based on current information and events, it is probable that the Company will be unable to collect all amounts due from the borrower in accordance with original contractual terms of the loan.
Loans with insignificant delays or insignificant short-falls in the amount of payments expected to be collected are not considered to be impaired. Loans defined as individually impaired, based on applicable accounting guidance, include larger balance
nonperforming loans and TDRs.
The CARES Act includes a provision that permits a financial institution to elect to suspend temporarily troubled debt restructuring accounting under ASC Subtopic 310-40 in certain
circumstances (“section 4013”). To be eligible under section 4013, a loan modification must be (1) related to COVID-19; (2) executed on a loan that was not more than 30 days past due as of December 31, 2019; and (3) executed between March 1, 2020,
and the earlier of (A) 60 days after the date of termination of the National Emergency or (B) January 1, 2022. In response to this section of the CARES Act, the federal banking agencies issued a revised interagency statement on April 7, 2020 that, in
consultation with the Financial Accounting Standards Board, confirmed that for loans not subject to section 4013, short-term modifications made on a good faith basis in response to COVID-19 to borrowers who were current prior to any relief are not
troubled debt restructurings under ASC Subtopic 310-40. This includes short-term (e.g., up to six months) modifications such as payment deferrals, fee waivers, extensions of repayment terms, or delays in payment that are insignificant. Borrowers
considered current are those that are less than 30 days past due on their contractual payments at the time a modification program is implemented. As of December 31, 2020, eight loans totaling $33.0 million were modified, related to COVID-19, which
were not considered troubled debt restructurings.
The following table presents loans restructured as TDRs as of December 31, 2020, December 31, 2019 and December 31, 2018.
|
As of December 31, 2020
|
||||||||||||||||
|
Number of
Contracts
|
Pre-Modification
Outstanding
Recorded Investment
|
Post-Modification
Outstanding
Recorded Investment
|
Specific Reserves
Allocated
|
|||||||||||||
|
(Dollars in thousands)
|
||||||||||||||||
|
Commercial and industrial
|
1
|
$
|
10,886
|
$
|
10,886
|
$
|
-
|
|||||||||
|
Agricultural
|
1
|
469
|
469
|
-
|
||||||||||||
|
Commercial real estate - other
|
1
|
1,622
|
1,622
|
-
|
||||||||||||
|
Total
|
3
|
$
|
12,977
|
$
|
12,977
|
$
|
-
|
|||||||||
|
As of December 31, 2019
|
||||||||||||||||
|
Number of
Contracts
|
Pre-Modification
Outstanding
Recorded Investment
|
Post-Modification
Outstanding
Recorded Investment
|
Specific Reserves
Allocated
|
|||||||||||||
|
(Dollars in thousands)
|
||||||||||||||||
|
Commercial real estate - other
|
1
|
$
|
1,809
|
$
|
1,809
|
$
|
26
|
|||||||||
|
Agricultural
|
2
|
912
|
912
|
-
|
||||||||||||
|
Total
|
3
|
$
|
2,721
|
$
|
2,721
|
$
|
26
|
|||||||||
|
As of December 31, 2018
|
||||||||||||||||
|
Number of
Contracts
|
Pre-Modification
Outstanding Recorded Investment
|
Post-Modification
Outstanding
Recorded Investment
|
Specific Reserves
Allocated
|
|||||||||||||
|
(Dollars in thousands)
|
||||||||||||||||
|
Commercial & industrial
|
1
|
$
|
501
|
$
|
501
|
$
|
-
|
|||||||||
|
Total
|
1
|
$
|
501
|
$
|
501
|
$
|
-
|
|||||||||
There were no payment defaults with respect to loans modified as TDRs as of December 31, 2020, 2019, and 2018.
Impairment analyses are prepared on TDRs in conjunction with the normal allowance process. TDRs restructured during the years ended December 31, 2020, 2019 and 2018 required $0,
$26,000 and $0 in specific reserves, respectively.
The following table presents total TDRs, both in accrual and nonaccrual status as of the periods indicated:
|
As of December 31, 2020
|
As of December 31, 2019
|
As of December 31, 2018
|
||||||||||||||||||||||
|
Number of
Contracts
|
Amount
|
Number of
Contracts
|
Amount
|
Number of
Contracts
|
Amount
|
|||||||||||||||||||
|
(Dollars in thousands)
|
||||||||||||||||||||||||
|
Accrual
|
-
|
$
|
-
|
2
|
$
|
912
|
-
|
$
|
-
|
|||||||||||||||
|
Nonaccrual
|
3
|
12,977
|
1
|
1,809
|
1
|
501
|
||||||||||||||||||
|
Total
|
3
|
$
|
12,977
|
3
|
$
|
2,721
|
1
|
$
|
501
|
|||||||||||||||
Deposits
We gather deposits primarily through our seven branch locations and online though our website. We offer a variety of deposit products including demand deposit accounts and
interest-bearing products, such as savings accounts and certificates of deposit. We put continued effort into gathering noninterest-bearing demand deposit accounts through loan production cross-selling, customer referrals, marketing efforts and
various involvement with community networks. Some of our interest-bearing deposits were obtained through brokered transactions. We participate in the CDARS program, where customer funds are placed into multiple certificates of deposit, each in an
amount under the standard FDIC insurance maximum of $250,000, and placed at a network of banks across the United States.
Total deposits as of December 31, 2020, 2019 and 2018 were $905.5 million, $757.5 million and $675.9 million, respectively. The increase was primarily due to organic deposit growth.
The following table sets forth deposit balances by certain categories as of the dates indicated and the percentage of each deposit category to total deposits.
|
As of December 31,
|
||||||||||||||||||||||||
|
2020
|
2019
|
2018
|
||||||||||||||||||||||
|
Amount
|
Percentage
of
Total
|
Amount
|
Percentage
of
Total
|
Amount |
Percentage
of
Total
|
|||||||||||||||||||
|
(Dollars in thousands)
|
||||||||||||||||||||||||
|
Noninterest-bearing demand
|
$
|
246,569
|
27.2
|
%
|
|
$
|
219,221
|
29.0
|
%
|
$
|
201,159
|
29.8
|
%
|
|||||||||||
|
Interest-bearing:
|
||||||||||||||||||||||||
|
NOW deposits
|
232,676
|
25.6
|
112,420
|
14.8
|
91,896
|
13.6
|
||||||||||||||||||
|
Money market
|
160,108
|
17.7
|
150,554
|
19.9
|
118,150
|
17.5
|
||||||||||||||||||
|
Savings deposits
|
54,008
|
6.0
|
72,750
|
9.6
|
69,548
|
10.3
|
||||||||||||||||||
|
Time deposits (more than $100,000)
|
187,964
|
20.8
|
176,998
|
23.3
|
167,304
|
24.8
|
||||||||||||||||||
|
Time deposits ($100,000 or less)
|
24,189
|
2.7
|
25,540
|
3.4
|
27,846
|
4.1
|
||||||||||||||||||
|
Total interest-bearing
|
658,945
|
72.8
|
538,262
|
71.0
|
474,744
|
70.2
|
||||||||||||||||||
|
Total deposits
|
$
|
905,514
|
100.0
|
%
|
|
$
|
757,483
|
100.0
|
%
|
675,903
|
100.0
|
%
|
||||||||||||
The following table summarizes our average deposit balances and weighted average rates for the years ended December 31, 2020, 2019 and 2018:
|
|
|
As of the Year Ended
December 31,
|
||||||||||||||||||||||
|
2020
|
2019
|
2018
|
||||||||||||||||||||||
|
Average
Balance
|
Weighted
Average
Rate
|
Average
Balance
|
Weighted
Average
Rate
|
Average
Balance
|
Weighted
Average
Rate
|
|||||||||||||||||||
|
(Dollars in thousands)
|
||||||||||||||||||||||||
|
Noninterest-bearing demand
|
$
|
256,431
|
0.00
|
%
|
$
|
192,562
|
0.00
|
%
|
$
|
183,750
|
0.00
|
%
|
||||||||||||
|
Interest-bearing:
|
||||||||||||||||||||||||
|
NOW
|
163,989
|
0.78
|
95,694
|
1.83
|
71,384
|
1.56
|
||||||||||||||||||
|
Money market
|
154,724
|
0.72
|
132,265
|
1.83
|
90,230
|
1.65
|
||||||||||||||||||
|
Savings
|
58,806
|
0.56
|
67,617
|
1.30
|
79,267
|
1.23
|
||||||||||||||||||
|
Time
|
207,442
|
1.65
|
208,375
|
2.14
|
220,023
|
1.55
|
||||||||||||||||||
|
Total interest-bearing
|
584,961
|
1.05
|
503,951
|
1.89
|
460,904
|
1.52
|
||||||||||||||||||
|
Total deposits
|
$
|
841,392
|
0.73
|
%
|
$
|
696,513
|
1.37
|
%
|
$
|
644,654
|
1.08
|
%
|
||||||||||||
The following tables set forth the maturity of time deposits as of the dates indicated below:
|
As of December 31, 2020 Maturity Within:
|
||||||||||||||||||||
|
(Dollars in thousands)
|
Three Months
|
Three to
Six Months
|
Six to
12 Months
|
After
12 Months
|
Total
|
|||||||||||||||
|
(Dollars in thousands)
|
||||||||||||||||||||
|
Time deposits ($100,000 or less)
|
$
|
6,537
|
$
|
4,923
|
$
|
8,234
|
$
|
7,295
|
$
|
26,989
|
||||||||||
|
Time deposits (more than $100,000)
|
34,312
|
28,817
|
81,945
|
40,090
|
185,164
|
|||||||||||||||
|
Total time deposits
|
$
|
40,849
|
$
|
33,740
|
$
|
90,179
|
$
|
47,385
|
$
|
212,153
|
||||||||||
|
As of December 31, 2019 Maturity Within:
|
||||||||||||||||||||
|
(Dollars in thousands)
|
Three Months
|
Three to
Six Months
|
Six to
12 Months
|
After
12 Months
|
Total
|
|||||||||||||||
|
(Dollars in thousands)
|
||||||||||||||||||||
|
Time deposits ($100,000 or less)
|
$
|
6,998
|
$
|
5,024
|
$
|
8,387
|
$
|
8,231
|
$
|
28,640
|
||||||||||
|
Time deposits (more than $100,000)
|
52,048
|
34,126
|
49,700
|
38,024
|
173,898
|
|||||||||||||||
|
Total time deposits
|
$
|
59,046
|
$
|
39,150
|
$
|
58,087
|
$
|
46,255
|
$
|
202,538
|
||||||||||
|
As of December 31, 2018 Maturity Within:
|
||||||||||||||||||||
|
Three Months
|
Three to
Six Months
|
Six to
12 Months
|
After
12 Months
|
Total
|
||||||||||||||||
|
(Dollars in thousands)
|
||||||||||||||||||||
|
Time deposits ($100,000 or less)
|
$
|
6,229
|
$
|
4,791
|
$
|
10,342
|
$
|
6,484
|
$
|
27,846
|
||||||||||
|
Time deposits (more than $100,000)
|
33,308
|
41,193
|
71,827
|
20,976
|
167,304
|
|||||||||||||||
|
Total time deposits
|
$
|
39,537
|
$
|
45,984
|
$
|
82,169
|
$
|
27,460
|
$
|
195,150
|
||||||||||
Liquidity
Liquidity refers to the measure of our ability to meet the cash flow requirements of depositors and borrowers, while at the same time meeting our operating, capital and strategic cash
flow needs, all at a reasonable cost. We continuously monitor our liquidity position to ensure that assets and liabilities are managed in a manner that will meet all short-term and long-term cash requirements. We manage our liquidity position to meet
the daily cash flow needs of customers, while maintaining an appropriate balance between assets and liabilities to meet the return on investment objectives of our shareholders.
Our liquidity position is supported by management of liquid assets and access to alternative sources of funds. Our liquid assets include cash, interest-bearing deposits in
correspondent banks and fed funds sold. Other available sources of liquidity include wholesale deposits and borrowings from correspondent banks and FHLB advances.
Our short-term and long-term liquidity requirements are primarily met through cash flow from operations, redeployment of prepaying and maturing balances in our loan portfolios, and
increases in customer deposits. Other alternative sources of funds will supplement these primary sources to the extent necessary to meet additional liquidity requirements on either a short-term or long-term basis.
As of December 31, 2020, we had no unsecured fed funds lines with correspondent depository institutions with no amounts advanced. In addition, based on the values of loans pledged as
collateral, we had borrowing availability with the FHLB of $64.8 million as of December 31, 2020 and $71.7 million as of December 31, 2019.
Capital Requirements
The Bank is subject to various regulatory capital requirements administered by the federal and state banking regulators. Failure to meet regulatory capital requirements may result in
certain mandatory and possible additional discretionary actions by regulators that, if undertaken, could have a direct material effect on our financial statements. Under capital adequacy guidelines and the regulatory framework for “prompt corrective
action” (described below), the Bank must meet specific capital guidelines that involve quantitative measures of our assets, liabilities and certain off-balance sheet items as calculated under regulatory accounting policies. The capital amounts and
classifications are subject to qualitative judgments by the federal banking regulators about components, risk weightings and other factors. Qualitative measures established by regulation to ensure capital adequacy required the Bank to maintain
minimum amounts and ratios of Common Equity Tier 1, or CET1, capital, Tier 1 capital and total capital to risk-weighted assets and of Tier 1 capital to average consolidated assets, referred to as the “leverage ratio.” For further information, see
“Supervision and Regulation – Regulatory Capital Requirements” and “Supervision and Regulation – Prompt Corrective Action Framework.”
In the wake of the global financial crisis of 2008 and 2009, the role of capital has become fundamentally more important, as banking regulators have concluded that the amount and
quality of capital held by banking organizations was insufficient to absorb losses during periods of severely distressed economic conditions. The Dodd-Frank Act and banking regulations promulgated by the U.S. federal banking regulators to implement
Basel III have established strengthened capital standards for banks and bank holding companies and require more capital to be held in the form of common stock. These provisions, which generally became applicable to the Bank on January 1, 2015, impose
meaningfully more stringent regulatory capital requirements than those applicable to the Bank prior to that date. In addition, the Basel III regulations implement a concept known as the “capital conservation buffer.” In general, banks, bank holding
companies with more than $3.0 billion in assets and bank holding companies with publicly-traded equity are required to hold a buffer of CET1 capital equal to 2.5% of risk-weighted assets over each minimum capital ratio by January 1, 2019 in order to
avoid being subject to limits on capital distributions (e.g., dividends, stock buybacks, etc.) and certain discretionary bonus payments to executive officers. For community banks, such as us, the capital conservation buffer requirement commenced on
January 1, 2016, with a gradual phase-in. Full compliance with the capital conservation buffer was required by January 1, 2019.
As of December 31, 2020, the FDIC categorized the Bank as “well-capitalized” under the prompt corrective action framework. There have been no conditions or events since December 31,
2020 that management believes would change this classification.
The table below also summarizes the capital requirements applicable to the Bank in order to be considered “well-capitalized” from a regulatory perspective, as well as the Bank’s
capital ratios as of December 31, 2020, 2019 and 2018. The Bank exceeded all regulatory capital requirements under Basel III and the Bank was considered to be “well-capitalized” as of the dates reflected in the tables below.
|
Actual
|
With
Capital Conservation
Buffer
|
Minimum
To be Considered
“Well-Capitalized”
|
||||||||||||||||||||||
|
Amount
|
Ratio
|
Amount
|
Ratio
|
Amount
|
Ratio
|
|||||||||||||||||||
|
(Dollars in thousands)
|
||||||||||||||||||||||||
|
As of December 31, 2020
:
|
||||||||||||||||||||||||
|
Total capital to risk-weighted assets
|
||||||||||||||||||||||||
|
Company
|
$
|
115,375
|
14.73
|
%
|
$
|
82,216
|
10.500
|
%
|
N/A
|
N/A
|
||||||||||||||
|
Bank
|
115,335
|
14.75
|
82,114
|
10.500
|
78,204
|
10.00
|
||||||||||||||||||
|
Tier 1 capital to risk-weighted assets
|
||||||||||||||||||||||||
|
Company
|
105,736
|
13.50
|
66,556
|
8.500
|
N/A
|
N/A
|
||||||||||||||||||
|
Bank
|
105,696
|
13.51
|
66,473
|
8.500
|
62,563
|
8.00
|
||||||||||||||||||
|
CET 1 capital to risk-weighted assets
|
||||||||||||||||||||||||
|
Company
|
105,736
|
13.50
|
54,811
|
7.000
|
N/A
|
N/A
|
||||||||||||||||||
|
Bank
|
105,696
|
13.51
|
54,743
|
7.000
|
50,832
|
6.50
|
||||||||||||||||||
|
Tier 1 leverage ratio
|
||||||||||||||||||||||||
|
Company
|
105,736
|
10.78
|
N/A
|
N/A
|
N/A
|
N/A
|
||||||||||||||||||
|
Bank
|
105,696
|
10.78
|
N/A
|
N/A
|
49,041
|
5.00
|
||||||||||||||||||
|
Actual
|
With
Capital Conservation
Buffer
|
Minimum
To be Considered
“Well-Capitalized”
|
||||||||||||||||||||||
|
Amount
|
Ratio
|
Amount
|
Ratio
|
Amount
|
Ratio
|
|||||||||||||||||||
|
(Dollars in thousands)
|
||||||||||||||||||||||||
|
As of December 31, 2019
:
|
||||||||||||||||||||||||
|
Total capital to risk-weighted assets
|
||||||||||||||||||||||||
|
Company
|
$
|
105,137
|
15.25
|
%
|
$
|
72,393
|
10.500
|
%
|
N/A
|
N/A
|
||||||||||||||
|
Bank
|
106,148
|
15.42
|
72,287
|
10.500
|
68,845
|
10.00
|
||||||||||||||||||
|
Tier 1 capital to risk-weighted assets
|
||||||||||||||||||||||||
|
Company
|
97,291
|
14.11
|
58,604
|
8.500
|
N/A
|
N/A
|
||||||||||||||||||
|
Bank
|
98,302
|
14.28
|
58,518
|
8.500
|
55,076
|
8.00
|
||||||||||||||||||
|
CET 1 capital to risk-weighted assets
|
||||||||||||||||||||||||
|
Company
|
97,291
|
14.11
|
48,262
|
7.000
|
N/A
|
N/A
|
||||||||||||||||||
|
Bank
|
98,302
|
14.28
|
48,192
|
7.000
|
44,749
|
6.50
|
||||||||||||||||||
|
Tier 1 leverage ratio
|
||||||||||||||||||||||||
|
Company
|
97,291
|
11.53
|
N/A
|
N/A
|
N/A
|
N/A
|
||||||||||||||||||
|
Bank
|
98,302
|
11.65
|
N/A
|
N/A
|
42,241
|
5.00
|
||||||||||||||||||
|
Actual
|
With
Capital Conservation
Buffer
|
Minimum
To be Considered
“Well-Capitalized”
|
||||||||||||||||||||||
|
Amount
|
Ratio
|
Amount
|
Ratio
|
Amount
|
Ratio
|
|||||||||||||||||||
|
(Dollars in thousands)
|
||||||||||||||||||||||||
|
As of December 31, 2018:
|
||||||||||||||||||||||||
|
Total capital to risk-weighted assets
|
||||||||||||||||||||||||
|
Company
|
$
|
92,693
|
15.86
|
%
|
$
|
57,709
|
9.875
|
%
|
N/A
|
N/A
|
||||||||||||||
|
Bank
|
93,704
|
16.03
|
57,709
|
9.875
|
58,439
|
10.00
|
||||||||||||||||||
|
Tier 1 capital to risk-weighted assets
|
||||||||||||||||||||||||
|
Company
|
85,382
|
14.61
|
46,021
|
7.875
|
N/A
|
N/A
|
||||||||||||||||||
|
Bank
|
86,393
|
14.78
|
46,021
|
7.875
|
46,751
|
8.00
|
||||||||||||||||||
|
CET 1 capital to risk-weighted assets
|
||||||||||||||||||||||||
|
Company
|
85,382
|
14.61
|
37,255
|
6.375
|
N/A
|
N/A
|
||||||||||||||||||
|
Bank
|
86,393
|
14.78
|
37,255
|
6.375
|
37,985
|
6.50
|
||||||||||||||||||
|
Tier 1 leverage ratio
|
||||||||||||||||||||||||
|
Company
|
85,382
|
11.13
|
N/A
|
N/A
|
N/A
|
N/A
|
||||||||||||||||||
|
Bank
|
86,393
|
11.26
|
N/A
|
N/A
|
38,355
|
5.00
|
||||||||||||||||||
Shareholders’ equity provides a source of permanent funding, allows for future growth and provides a cushion to withstand unforeseen adverse developments. Total shareholders’ equity
increased to $107.3 million as of December 31, 2020, compared to $100.1 million as of December 31, 2019 and $88.5 million as of December 31, 2018. The increases were driven by retained capital from net income during the periods.
Contractual Obligations
The following tables contain supplemental information regarding our total contractual obligations as of December 31, 2020:
|
Payments Due as of December 31, 2020
|
||||||||||||||||||||
|
Within
One Year
|
One to
Three Years
|
Three to
Five Years
|
After
Five Years
|
Total
|
||||||||||||||||
|
(Dollars in thousands)
|
||||||||||||||||||||
|
Deposits without a stated maturity
|
$
|
693,361
|
$
|
-
|
$
|
-
|
$
|
-
|
$
|
693,361
|
||||||||||
|
Time deposits
|
164,753
|
46,563
|
822
|
-
|
212,138
|
|||||||||||||||
|
Borrowings
|
-
|
-
|
-
|
-
|
-
|
|||||||||||||||
|
Operating lease commitments
|
470
|
390
|
49
|
-
|
909
|
|||||||||||||||
|
Total contractual obligations
|
$
|
858,599
|
$
|
46,953
|
$
|
871
|
$
|
-
|
$
|
906,423
|
||||||||||
We believe that we will be able to meet our contractual obligations as they come due through the maintenance of adequate cash levels. We expect to maintain adequate cash levels
through profitability, loan repayment and maturity activity and continued deposit gathering activities. We have in place various borrowing mechanisms for both short-term and long-term liquidity needs.
Off-Balance Sheet Arrangements
We are a party to financial instruments with off-balance sheet risk in the normal course of business to meet the financing needs of our customers. These financial instruments include
commitments to extend credit and standby letters of credit. Those instruments involve, to varying degrees, elements of credit and interest rate risk in excess of the amount recognized in the consolidated balance sheet. The contractual or notional
amounts of those instruments reflect the extent of involvement we have in particular classes of financial instruments. To control this credit risk, the Company uses the same underwriting standards as it uses for loans recorded on the balance sheet.
Loan commitments are agreements to lend to a customer, as long as there is no violation of any condition established in the contract. Standby letters of credit are conditional
commitments issued by the Company to guarantee the performance of the customer to a third party. They are intended to be disbursed, subject to certain conditions, upon request of the borrower.
The following table summarizes commitments as of the dates presented.
|
As of December 31,
|
||||||||||||
|
2020
|
2019
|
2018
|
||||||||||
|
(Dollars in thousands)
|
||||||||||||
|
Commitments to extend credit
|
$
|
206,520
|
$
|
191,459
|
$
|
135,015
|
||||||
|
Standby letters of credit
|
2,366
|
3,338
|
1,078
|
|||||||||
|
Total
|
$
|
208,886
|
$
|
194,797
|
$
|
136,093
|
||||||
Critical Accounting Policies and Estimates
Our accounting and reporting policies conform to GAAP and conform to general practices within the industry in which we operate. To prepare financial statements in conformity with
GAAP, management makes estimates, assumptions and judgments based on available information. These estimates, assumptions and judgments affect the amounts reported in the financial statements and accompanying notes. These estimates, assumptions and
judgments are based on information available as of the date of the financial statements and, as this information changes, actual results could differ from the estimates, assumptions and judgments reflected in the financial statement. In particular,
management has identified several accounting policies that, due to the estimates, assumptions and judgments inherent in those policies, are critical in understanding our financial statements.
The JOBS Act permits us an extended transition period for complying with new or revised accounting standards affecting public companies. We have elected to take advantage of this
extended transition period, which means that the financial statements included in this report, as well as any financial statements that we file in the future, will not be subject to all new or revised accounting standards generally applicable to
public companies for the transition period for so long as we remain an emerging growth company or until we affirmatively and irrevocably opt out of the extended transition period under the JOBS Act.
The following is a discussion of the critical accounting policies and significant estimates that we believe require us to make the most complex or subjective decisions or assessments.
Additional information about these policies can be found in Note 1 of the Company’s consolidated financial statements as of December 31, 2020.
Allowance for Loan and Lease Losses
The allowance is based on management’s estimate of probable losses inherent in the loan portfolio. In the opinion of management, the allowance is adequate to absorb estimated losses
in the portfolio as of each balance sheet date. While management uses available information to analyze losses on loans, future additions to the allowance may be necessary based on changes in economic conditions and changes in the composition of the
loan portfolio. In addition, various regulatory agencies, as an integral part of their examination process, periodically review the Bank’s allowance. In analyzing the adequacy of the allowance, a comprehensive loan grading system to determine risk
potential in loans is utilized together with the results of internal credit reviews.
To determine the adequacy of the allowance, the loan portfolio is broken into segments based on loan type. Historical loss experience factors by segment, adjusted for changes in
trends and conditions, are used to determine an indicated allowance for each portfolio segment. These factors are evaluated and updated based on the composition of the specific loan segment. Other considerations include volumes and trends of
delinquencies, nonaccrual loans, levels of bankruptcies, criticized and classified loan trends, expected losses on real estate secured loans, new credit products and policies, economic conditions, concentrations of credit risk and the experience and
abilities of our lending personnel. In addition to the segment evaluations, impaired loans with a balance of $250,000 or more are individually evaluated based on facts and circumstances of the loan to determine if a specific allowance amount may be
necessary. Specific allowances may also be established for loans whose outstanding balances are below the $250,000 threshold when it is determined that the risk associated with the loan differs significantly from the risk factor amounts established
for its loan segment.
Goodwill and Intangibles
Goodwill from an acquisition is the value attributable to unidentifiable intangible elements acquired. At a minimum, annual evaluation of the value of goodwill is required. Management
evaluated the carrying value of the Company’s goodwill as of December 31, 2020, 2019 and 2018, and determined that no impairment existed.
An entity may assess qualitative factors to determine whether it is more likely than not that the fair value of a reporting unit is less than its carrying amount. Factors assessed
include all relevant events and circumstances including macroeconomic conditions, industry and market conditions, cost factors that have a negative effect on earnings and cash flows, overall financial performance, other relevant entity or reporting
unit specific events and, if applicable, a sustained decrease in share price.
If after assessing the totality of events or circumstances, such as those described above, an entity determines that it is more likely than not that the fair value of a reporting unit
is less than its carrying amount, then the entity is to perform a two-step impairment test.
The first step of the impairment test compares the fair value of a reporting unit with its carrying amount, including goodwill. If the carrying amount of a reporting unit exceeds its
fair value, the second step of the impairment test is to be performed to measure the amount of impairment loss, if any, when it is more likely than not that goodwill impairment exists.
Other intangible assets consist of core deposit intangible assets and are amortized on a straight-line basis based on the estimated useful life of 10 years. Such assets are
periodically evaluated as to the recoverability of their carrying values.
Income Taxes
The Company files a consolidated income tax return. Deferred taxes are recognized under the balance sheet method based upon the future tax consequences of temporary differences
between the carrying amounts and tax basis of assets and liabilities, using the tax rates expected to apply to taxable income in the periods when the related temporary differences are expected to be realized.
The amount of accrued current and deferred income taxes is based on estimates of taxes due or receivable from taxing authorities either currently or in the future. Changes in these
accruals are reported as tax expense, and involve estimates of the various components included in determining taxable income, tax credits, other taxes and temporary differences. Changes periodically occur in the estimates due to changes in tax rates,
tax laws and regulations and implementation of new tax planning strategies. The process of determining the accruals for income taxes necessarily involves the exercise of considerable judgment and consideration of numerous subjective factors.
Management performs an analysis of the Company’s tax positions annually and believes it is more likely than not that all of its tax positions will be utilized in future years.
Fair Value of Financial Instruments
ASC Topic 820, Fair Value Measurement, defines fair value as the price that would be received to sell a financial asset or paid to transfer a financial liability in an orderly
transaction between market participants at the measurement date. The degree of management judgment involved in determining the fair value of assets and liabilities is dependent upon the availability of quoted market prices or observable market
parameters. For financial instruments that trade actively and have quoted market prices or observable market parameters, there is minimal subjectivity involved in measuring fair value. When observable market prices and parameters are not available,
management judgment is necessary to estimate fair value. In addition, changes in market conditions may reduce the availability of quoted prices or the observable date.
Interest Rate Sensitivity and Market Risk
As a financial institution, our primary component of market risk is interest rate volatility. Our financial management policy provides management with the guidelines for effective
funds management, and we have established a measurement system for monitoring our net interest rate sensitivity position. We have historically managed our sensitivity position within our established guidelines.
Fluctuations in interest rates will ultimately impact both the level of income and expense recorded on most of our assets and liabilities, and the market value of all interest-earning
assets and interest-bearing liabilities, other than those which have a short term to maturity. Interest rate risk is the potential of economic losses due to future interest rate changes. These economic losses can be reflected as a loss of future net
interest income and/or a loss of current fair market values. The objective is to measure the effect on net interest income and to adjust the balance sheet to minimize the inherent risk while at the same time maximizing income.
We manage our exposure to interest rates by structuring our balance sheet in the ordinary course of business. We do not enter into instruments such as leveraged derivatives, financial
options or financial future contracts to mitigate interest rate risk from specific transactions. Based upon the nature of our operations, we are not subject to foreign exchange or commodity price risk. We do not own any trading assets.
Our exposure to interest rate risk is managed by the Asset/Liability Committee, or the ALCO Committee, in accordance with policies approved by the Holding Company’s board of
directors. The ALCO Committee formulates strategies based on appropriate levels of interest rate risk. In determining the appropriate level of interest rate risk, the ALCO Committee considers the impact on earnings and capital on the current outlook
on interest rates, potential changes in interest rates, regional economies, liquidity, business strategies and other factors. The ALCO Committee meets regularly to review, among other things, the sensitivity of assets and liabilities to interest rate
changes, the book and market values of assets and liabilities, commitments to originate loans and the maturities of investments and borrowings. Additionally, the ALCO Committee reviews liquidity, cash flow flexibility, maturities of deposits and
consumer and commercial deposit activity. Management employs methodologies to manage interest rate risk, which include an analysis of relationships between interest-earning assets and interest-bearing liabilities and an interest rate shock simulation
model.
We use interest rate risk simulation models and shock analyses to test the interest rate sensitivity of net interest income and fair value of equity, and the impact of changes in
interest rates on other financial metrics. Contractual maturities and re-pricing opportunities of loans are incorporated in the model. The average lives of non-maturity deposit accounts are based on decay assumptions and are incorporated into the
model. We utilize third-party experts to periodically evaluate the performance of our non-maturity deposit accounts to develop the decay assumptions. All of the assumptions used in our analyses are inherently uncertain and, as a result, the model
cannot precisely measure future net interest income or precisely predict the impact of fluctuations in market interest rates on net interest income. Actual results will differ from the model’s simulated results due to timing, magnitude and frequency
of interest rate changes as well as changes in market conditions and the application and timing of various management strategies.
On a quarterly basis, we run various simulation models including a static balance sheet and dynamic growth balance sheet. These models test the impact on net interest income and fair
value of equity from changes in market interest rates under various scenarios. Under the static model and dynamic growth models, rates are shocked instantaneously and ramped rates change over a 12-month and 24-month horizon based upon parallel and
non-parallel yield curve shifts. Parallel shock scenarios assume instantaneous parallel movements in the yield curve compared to a flat yield curve scenario. Non-parallel simulation involves analysis of interest income and expense under various
changes in the shape of the yield curve. Our internal policy regarding internal rate risk simulations currently specifies that for gradual parallel shifts of the yield curve, estimated net interest income at risk for the subsequent one-year period
should not decline by more than 10% for a -100 basis point shift, 5% for a 100 basis point shift, 10% for a 200 basis point shift, 15% for a 300 basis point shift, and 20% for a 400 basis point shift.
The following table summarizes the simulated change in net interest income and fair value of equity over a 12-month horizon as of the dates indicated:
|
Change in Interest Rates (Basis Points)
|
|
|
As of December 31,
|
As of December 31,
|
|
||||||||||||
|
2020
|
2019
|
||||||||||||||||
|
Percent
Change in
Net Interest
Income
|
Percent
Change in
Fair Value of
Equity
|
Percent
Change in
Net Interest
Income
|
Percent
Change in
Fair Value of
Equity
|
||||||||||||||
|
+400
|
80.57
|
%
|
19.41
|
%
|
69.65
|
%
|
21.41
|
%
|
|||||||||
|
+300
|
60.55
|
17.53
|
51.57
|
19.84
|
|||||||||||||
|
+200
|
40.46
|
15.51
|
33.39
|
18.15
|
|||||||||||||
|
+100
|
20.16
|
13.36
|
14.91
|
16.34
|
|||||||||||||
|
Base
|
(0.29
|
)
|
11.06
|
(3.81
|
)
|
14.39
|
|||||||||||
|
-100
|
(6.32
|
)
|
10.35
|
(13.68
|
)
|
12.34
|
|||||||||||
The results are primarily due to behavior of demand, money market and savings deposits during such rate fluctuations. We have found that, historically, interest rates on these
deposits change more slowly than changes in the discount and fed funds rates. This assumption is incorporated into the simulation model and is generally not fully reflected in a gap analysis. The assumptions incorporated into the model are inherently
uncertain and, as a result, the model cannot precisely measure future net interest income or precisely predict the impact of fluctuations in market interest rates on net interest income. Actual results will differ from the model’s simulated results
due to timing, magnitude and frequency of interest rate changes as well as changes in market conditions and the application and timing of various strategies.
Impact of Inflation
Our consolidated financial statements and related notes included elsewhere in this Form 10-K have been prepared in accordance with GAAP. These require the measurement of financial
position and operating results in terms of historical dollars, without considering changes in the relative value of money over time due to inflation or recession.
Unlike many industrial companies, substantially all of our assets and liabilities are monetary in nature. As a result, interest rates have a more significant impact on our performance
than the effects of general levels of inflation. Interest rates may not necessarily move in the same direction or in the same magnitude as the prices of goods and services. However, other operating expenses do reflect general levels of inflation.
Consolidated Financial Statements
Index
|
Page
|
|
|
57
|
|
|
Consolidated Financial Statements:
|
|
| 59 | |
| 60 | |
| 61 | |
| 62 | |
| 63 |
Bank7 Corp.
Consolidated Financial Statements
Shareholders, Board of Directors, and Audit Committee
Bank7 Corp.
Oklahoma City, Oklahoma
Opinion on the Financial Statements
We have audited the accompanying consolidated balance sheets of Bank7 Corp. (the Company) as of December 31, 2020 and 2019, the related consolidated statements of income, shareholders’ equity, and cash flows for each of the years in the
three-year period ended December 31, 2020, and the related notes (collectively, the consolidated financial statements). In our opinion, the consolidated financial statements referred to above present fairly, in all material respects, the
financial position of the Company as of December 31, 2020 and 2019, and the results of its operations and its cash flows for each of the years in the three-year period ended December 31, 2020, in conformity with accounting principles generally
accepted in the United States of America.
Basis for Opinion
These financial statements are the responsibility of the Company’s management. Our responsibility is to express an opinion on the Company’s financial statements based on our audits.
We are a public accounting firm registered with the Public Company Accounting Oversight Board (United States) (PCAOB) and are required to be independent with respect to the Company in accordance with the U.S. federal securities laws and the
applicable rules and regulations of the Securities and Exchange Commission and the PCAOB.
We conducted our audits in accordance with the standards of the PCAOB. Those standards require that we plan and perform the audit to obtain reasonable assurance about whether the consolidated financial statements are free of material
misstatement, whether due to error or fraud. The Company is not required to have, nor were we engaged to perform, an audit of its internal control over financial reporting. As part of our audits, we are required to obtain an understanding of
internal control over financial reporting, but not for the purpose of expressing an opinion on the effectiveness of the Company’s internal control over financial reporting. Accordingly, we express no such opinion.
57
Stockholders, Board of Directors, and Audit Committee
Bank7 Corp.
Page 2
Our audits included performing procedures to assess the risks of material misstatement of the consolidated financial statements, whether due to error or fraud, and performing procedures that respond to those risks. Such procedures include
examining, on a test basis, evidence regarding the amounts and disclosures in the consolidated financial statements. Our audits also included evaluating the accounting principles used and significant estimates made by management, as well as
evaluating the overall presentation of the consolidated financial statements. We believe our audits provide a reasonable basis for our opinion.
We have served as the Company’s auditor since 2011.
/s/ BKD, LLP
Oklahoma City, Oklahoma
March 25, 2021
Consolidated Balance Sheets
(Dollar amounts in thousands)
|
Assets
|
December 31,
2020
|
December 31,
2019
|
||||||
|
Cash and due from banks
|
$
|
153,901
|
$
|
117,128
|
||||
|
Interest-bearing time deposits in other banks
|
16,412
|
30,147
|
||||||
|
Loans, net of allowance for loan losses of $9,639 and $7,846 at December 31, 2020 and 2019, respectively
|
826,974
|
699,458
|
||||||
|
Loans held for sale, at fair value
|
324
|
1,031
|
||||||
|
Premises and equipment, net
|
9,151
|
9,624
|
||||||
|
Nonmarketable equity securities
|
1,172
|
1,100
|
||||||
|
Goodwill and other intangibles, net
|
1,583
|
1,789
|
||||||
|
Interest receivable and other assets
|
7,152
|
6,115
|
||||||
|
Total assets
|
$
|
1,016,669
|
$
|
866,392
|
||||
|
Liabilities and Shareholders’ Equity
|
||||||||
|
Deposits
|
||||||||
|
Noninterest-bearing
|
$
|
246,569
|
$
|
219,221
|
||||
|
Interest-bearing
|
658,945
|
538,262
|
||||||
|
Total deposits
|
905,514
|
757,483
|
||||||
|
Income taxes payable
|
9
|
357
|
||||||
|
Interest payable and other liabilities
|
3,827
|
8,426
|
||||||
|
Total liabilities
|
909,350
|
766,266
|
||||||
|
Shareholders’ equity
|
||||||||
|
Preferred stock, par value $0.01 per share, 1,000,000 shares authorized; none issued or outstanding
|
-
|
-
|
||||||
|
Common stock, non-voting, par value $0.01 per share, 20,000,000 shares authorized; none issued or outstanding
|
-
|
-
|
||||||
|
Common stock, $0.01 par value; 50,000,000 shares authorized; shares issued and outstanding: 9,044,765 and 10,057,506, at December 31, 2020 and 2019 respectively
|
90
|
101
|
||||||
|
Additional paid-in capital
|
93,162
|
92,391
|
||||||
|
Retained earnings
|
14,067
|
7,634
|
||||||
|
Total shareholders’ equity
|
107,319
|
100,126
|
||||||
|
|
||||||||
|
Total liabilities and shareholders’ equity
|
$
|
1,016,669
|
$
|
866,392
|
||||
See Notes to Consolidated Financial Statements
Consolidated Statements of Income
(Dollar amounts in thousands, except per share data)
|
Twelve months ended
December 31, |
||||||||||||
|
2020
|
2019
|
2018
|
||||||||||
|
Interest Income
|
||||||||||||
|
Loans, including fees
|
$
|
52,450
|
$
|
48,200
|
$
|
44,279
|
||||||
|
Interest-bearing time deposits in other banks
|
525
|
1,709
|
588
|
|||||||||
|
Interest-bearing deposits in other banks
|
339
|
1,800
|
1,933
|
|||||||||
|
Total interest income
|
53,314
|
51,709
|
46,800
|
|||||||||
|
Interest Expense
|
||||||||||||
|
Deposits
|
6,153
|
9,516
|
6,994
|
|||||||||
|
Other borrowings
|
-
|
-
|
175
|
|||||||||
|
Total interest expense
|
6,153
|
9,516
|
7,169
|
|||||||||
|
Net Interest Income
|
47,161
|
42,193
|
39,631
|
|||||||||
|
Provision for Loan Losses
|
5,350
|
-
|
200
|
|||||||||
|
Net Interest Income After Provision for Loan Losses
|
41,811
|
42,193
|
39,431
|
|||||||||
|
Noninterest Income
|
||||||||||||
|
Secondary market income
|
175
|
164
|
212
|
|||||||||
|
Service charges on deposit accounts
|
442
|
392
|
347
|
|||||||||
|
Other
|
1,048
|
752
|
772
|
|||||||||
|
Total noninterest income
|
1,665
|
1,308
|
1,331
|
|||||||||
|
Noninterest Expense
|
||||||||||||
|
Salaries and employee benefits
|
10,130
|
21,265
|
8,113
|
|||||||||
|
Furniture and equipment
|
868
|
829
|
684
|
|||||||||
|
Occupancy
|
1,957
|
1,677
|
1,310
|
|||||||||
|
Data and item processing
|
1,091
|
1,078
|
966
|
|||||||||
|
Accounting, marketing and legal fees
|
536
|
757
|
305
|
|||||||||
|
Regulatory assessments
|
506
|
126
|
542
|
|||||||||
|
Advertising and public relations
|
400
|
588
|
553
|
|||||||||
|
Travel, lodging and entertainment
|
241
|
368
|
699
|
|||||||||
|
Other
|
1,863
|
1,744
|
1,793
|
|||||||||
|
Total noninterest expense
|
17,592
|
28,432
|
14,965
|
|||||||||
|
Income Before Taxes
|
25,884
|
15,069
|
25,797
|
|||||||||
|
Income tax expense
|
6,618
|
6,844
|
797
|
|||||||||
|
Net Income
|
$
|
19,266
|
$
|
8,225
|
$
|
25,000
|
||||||
|
Earnings per common share - basic
|
$
|
2.05
|
$
|
0.81
|
$
|
3.08
|
||||||
|
Earnings per common share - diluted
|
2.05
|
0.81
|
3.03
|
|||||||||
|
Weighted average common shares outstanding - basic
|
9,378,769
|
10,145,032
|
8,105,856
|
|||||||||
|
Weighted average common shares outstanding - diluted
|
9,379,154
|
10,147,311
|
8,237,638
|
|||||||||
See Notes to Consolidated Financial Statements
Consolidated Statements of Shareholders’ Equity
(Dollar Amounts in thousands, except share data)
|
Year Ended December 31,
|
||||||||||||
|
2020
|
2019
|
2018
|
||||||||||
|
Common Stock (Shares)
|
||||||||||||
|
Balance at beginning of period
|
10,057,506
|
10,187,500
|
7,287,500
|
|||||||||
|
Common stock issued
|
-
|
-
|
2,900,000
|
|||||||||
|
Shares issued for restricted stock units
|
19,437
|
19,431
|
-
|
|||||||||
|
Shares acquired and canceled
|
(1,032,178
|
)
|
(149,425
|
)
|
-
|
|||||||
|
Balance at end of period
|
9,044,765
|
10,057,506
|
10,187,500
|
|||||||||
|
Common Stock (Amount)
|
||||||||||||
|
Balance at beginning of period
|
$
|
101
|
$
|
102
|
$
|
73
|
||||||
|
Shares issued, net of offering costs
|
-
|
-
|
29
|
|||||||||
|
Shares acquired and canceled
|
(11
|
)
|
(1
|
)
|
-
|
|||||||
|
Balance at end of period
|
$
|
90
|
$
|
101
|
$
|
102
|
||||||
|
Additional Paid-in Capital
|
||||||||||||
|
Balance at beginning of period
|
$
|
92,391
|
$
|
80,275
|
$
|
6,987
|
||||||
|
Capital contribution
|
-
|
-
|
137
|
|||||||||
|
Shares issued, net of offering costs
|
-
|
-
|
50,125
|
|||||||||
|
Reclassification of undistributed S Corporation earnings
|
-
|
-
|
22,872
|
|||||||||
|
Stock-based compensation expense
|
771
|
12,116
|
154
|
|||||||||
|
Balance at end of period
|
$
|
93,162
|
$
|
92,391
|
$
|
80,275
|
||||||
|
Retained Earnings
|
||||||||||||
|
Balance at beginning of period
|
$
|
7,634
|
$
|
8,089
|
$
|
62,116
|
||||||
|
Net income
|
19,266
|
8,225
|
25,000
|
|||||||||
|
Reclassification of undistributed S Corporation earnings
|
-
|
-
|
(22,872
|
)
|
||||||||
|
Common stock acquired and canceled
|
(9,065
|
)
|
(2,645
|
)
|
-
|
|||||||
|
Cash dividends declared ($0.41, $0.60, $7.71 per share)
|
(3,768
|
)
|
(6,035
|
)
|
(56,155
|
)
|
||||||
|
Balance at end of period
|
$
|
14,067
|
$
|
7,634
|
$
|
8,089
|
||||||
|
Total shareholders' equity
|
$
|
107,319
|
$
|
100,126
|
$
|
88,466
|
||||||
See Notes to Consolidated Financial Statements
Consolidated Statements of Cash Flows
(Dollar Amounts in thousands)
|
For the Years Ended December 31,
|
||||||||||||
|
2020
|
2019
|
2018
|
||||||||||
|
Operating Activities
|
||||||||||||
|
Net income
|
$
|
19,266
|
$
|
8,225
|
$
|
25,000
|
||||||
|
Items not requiring (providing) cash
|
||||||||||||
|
Depreciation and amortization
|
1,093
|
849
|
1,097
|
|||||||||
|
Provision for loan losses
|
5,350
|
-
|
200
|
|||||||||
|
Net increase on other real estate owned
|
-
|
-
|
(10
|
)
|
||||||||
|
Gain on sales of loans
|
(175
|
)
|
(164
|
)
|
(212
|
)
|
||||||
|
Stock-based compensation expense
|
771
|
12,116
|
154
|
|||||||||
|
(Gain) loss on sale of premises and equipment
|
(3
|
)
|
183
|
-
|
||||||||
|
Cash receipts from the sale of loans originated for sale
|
8,924
|
7,697
|
8,185
|
|||||||||
|
Cash disbursements for loans originated for sale
|
(8,042
|
)
|
(8,052
|
)
|
(8,097
|
)
|
||||||
|
(Gain) loss on sale of other real estate owned
|
-
|
(330
|
)
|
3
|
||||||||
|
Deferred income tax benefit
|
(875
|
)
|
(20
|
)
|
(1,069
|
)
|
||||||
|
Changes in
|
||||||||||||
|
Interest receivable and other assets
|
(162
|
)
|
1,064
|
(1,405
|
)
|
|||||||
|
Interest payable and other liabilities
|
(912
|
)
|
(2,388
|
)
|
3,155
|
|||||||
|
Net cash provided by operating activities
|
25,235
|
19,180
|
27,001
|
|||||||||
|
Investing Activities
|
||||||||||||
|
Maturities of interest-bearing time deposits in other banks
|
28,162
|
18,583
|
3,884
|
|||||||||
|
Purchases of interest-bearing time deposits in other banks
|
(14,427
|
)
|
(16,971
|
)
|
(5,475
|
)
|
||||||
|
Net change in loans
|
(132,866
|
)
|
(107,458
|
)
|
(36,981
|
)
|
||||||
|
Purchases of premises and equipment
|
(438
|
)
|
(3,100
|
)
|
(378
|
)
|
||||||
|
Proceeds from sale of premises and equipment
|
27
|
403
|
1,336
|
|||||||||
|
Change in nonmarketable equity securities
|
(72
|
)
|
(45
|
)
|
(6
|
)
|
||||||
|
Proceeds from sale of foreclosed assets
|
-
|
518
|
47
|
|||||||||
|
Net cash used in investing activities
|
(119,614
|
)
|
(108,070
|
)
|
(37,573
|
)
|
||||||
|
Financing Activities
|
||||||||||||
|
Net change in deposits
|
148,031
|
81,580
|
50,072
|
|||||||||
|
Repayment of borrowed funds
|
-
|
-
|
(5,600
|
)
|
||||||||
|
Cash distributions
|
(7,803
|
)
|
(1,006
|
)
|
(56,155
|
)
|
||||||
|
Capital injection
|
-
|
-
|
137
|
|||||||||
|
Common stock acquired and canceled
|
(9,076
|
)
|
(2,646
|
)
|
-
|
|||||||
|
Net change in common stock
|
-
|
-
|
50,154
|
|||||||||
|
Net cash provided by financing activities
|
131,152
|
77,928
|
38,608
|
|||||||||
|
Increase (Decrease) in Cash and Due from Banks
|
36,773
|
(10,962
|
)
|
28,036
|
||||||||
|
Cash and Due from Banks, Beginning of Period
|
117,128
|
128,090
|
100,054
|
|||||||||
|
Cash and Due from Banks, End of Period
|
$
|
153,901
|
$
|
117,128
|
$
|
128,090
|
||||||
|
Supplemental Disclosure of Cash Flows Information
|
||||||||||||
|
Interest paid
|
$
|
6,502
|
$
|
9,342
|
$
|
7,304
|
||||||
|
Income taxes paid
|
$
|
7,731
|
$
|
6,779
|
$
|
-
|
||||||
|
Dividends declared and not paid
|
$
|
994
|
$
|
5,029
|
$
|
-
|
||||||
|
Non-cash stock contribution
|
$
|
-
|
$
|
11,627
|
$
|
-
|
||||||
|
Supplemental Disclosure of Non-Cash Investing Activities
|
||||||||||||
|
Foreclosed assets acquired in settlement of loans
|
$
|
-
|
$
|
78
|
$
|
50
|
||||||
See Notes to Consolidated Financial Statements
Notes to Consolidated Financial Statements
| Note 1: |
Nature of Operations and Summary of Significant Accounting Policies
|
Nature of Operations
Bank7 Corp. (the “Company”), formerly known as Haines Financial Corp, is a bank holding company whose principal activity is the ownership and management of its wholly owned subsidiary, Bank7
(the “Bank”). The Bank is primarily engaged in providing a full range of banking and financial services to individual and corporate customers located in Oklahoma, Kansas, and Texas. The Bank is subject to competition from other financial
institutions. The Company is subject to the regulation of certain federal agencies and undergoes periodic examinations by those regulatory authorities.
Principles of Consolidation
The accompanying consolidated financial statements include the accounts of the Company, the Bank and its subsidiary, 1039 NW 63
rd
, LLC, which holds real estate utilized by the Bank. All significant intercompany accounts and transactions have been eliminated in consolidation.
Use of Estimates
The preparation of financial statements in conformity with accounting principles generally accepted in the United States of America (“GAAP”) requires management to make estimates and
assumptions that affect the reported amounts of assets and liabilities and disclosure of contingent assets and liabilities at the date of the financial statements and the reported amounts of revenues and expenses during the reporting period.
Actual results could differ from those estimates.
Material estimates that are particularly susceptible to significant change relate to the determination of the allowance for loan losses, valuation of other real estate owned,
other-than-temporary impairments, income taxes, goodwill and intangibles and fair values of financial instruments.
Cash Equivalents
The Company considers all liquid investments with original maturities of three months or less to be cash equivalents.
Interest-Bearing Time Deposits in Other Banks
Interest-bearing time deposits in other banks totaled $16.4 million and $30.1 million at December 31, 2020 and December 31, 2019 respectively, and have original maturities generally ranging
from one to five years.
Bank7 Corp.
Notes to Consolidated Financial Statements
Debt securities that management has the positive intent and ability to hold to maturity are classified as “held-to-maturity” and recorded at amortized cost. Trading securities are recorded at
fair value with changes in fair value included in earnings. Securities not classified as held-to-maturity or trading, including equity securities with readily determinable fair values, are classified as “available-for-sale” and recorded at fair
value, with unrealized gains and losses excluded from earnings and reported in other comprehensive income. Purchase premiums and discounts are recognized in interest income using the interest method over the terms of the securities. Gains and
losses on the sale of securities are recorded on the trade date and are determined using the specific identification method. For debt securities with fair value below amortized cost when the Company does not intend to sell a debt security, and
it is more likely than not the Company will not have to sell the security before recovery of its cost basis, it recognizes the credit component of an other-than-temporary impairment of a debt security in earnings and the remaining portion in
other comprehensive income. The Company had no “available-for-sale” or “held to maturity” investments as of December 31, 2020 and 2019.
Loans
Loans that management has the intent and ability to hold for the foreseeable future or until maturity or payoffs are reported at their outstanding principal balances adjusted for unearned
income, charge-offs, the allowance for loan losses, any unamortized deferred fees or costs on originated loans and unamortized premiums or discounts on purchased loans.
For loans amortized at cost, interest income is accrued based on the unpaid principal balance. Loan origination fees, net of certain direct origination costs, as well as premiums and discounts,
are deferred and amortized over the respective term of the loan.
The accrual of interest on loans is discontinued at the time the loan is 90 days past due unless the credit is well-secured and in process of collection. Past-due status is based on contractual
terms of the loan. In all cases, loans are placed on nonaccrual or charged off at an earlier date if collection of principal or interest is considered doubtful.
All interest accrued but not collected for loans that are placed on nonaccrual or charged off are reversed against interest income. The interest on these loans is accounted for on the
cash-basis or cost-recovery method, until qualifying for return to accrual. Loans are returned to accrual status when all the principal and interest amounts contractually due are brought current and future payments are reasonably assured.
Mortgage Loans Held for Sale
Mortgage loans originated and intended for sale in the secondary market are carried at the lower of cost or fair value in the aggregate. Net unrealized losses, if any, are recognized through a
valuation allowance by charges to noninterest income. Gains and losses on loan sales are recorded in noninterest income and direct loan origination costs and fees are deferred at origination of the loan and are recognized in noninterest income
upon the sale of the loan.
Allowance for Loan Losses
The allowance for loan losses is established as losses are estimated to have occurred through a provision for loan losses charged to income. Loan losses are charged against the allowance when
management believes the uncollectability of a loan balance is confirmed. Subsequent recoveries, if any, are credited to the allowance.
Bank7 Corp.
Notes to Consolidated Financial Statements
The allowance consists of allocated and general components. The allocated component relates to loans that are classified as impaired. For those loans that are classified as impaired, an
allowance is established when the discounted cash flows or collateral value or observable market price of the impaired loan is lower than the carrying value of that loan. The general component covers nonimpaired loans and is based on historical
charge-off experience and expected loss given default derived from the Company’s internal risk rating process. Other adjustments may be made to the allowance for pools of loans after an assessment of internal or external influences on credit
quality that are not fully reflected in the historical loss or risk rating data.
A loan is considered impaired when, based on current information and events, it is probable that the Company will be unable to collect the scheduled payments of principal or interest when due
according to the contractual terms of the loan agreement. Factors considered by management in determining impairment include payment status, collateral value and the probability of collecting scheduled principal and interest payments when due.
Loans that experience insignificant payment delays and payment shortfalls generally are not classified as impaired. Management determines the significance of payment delays and payment shortfalls on a case-by-case basis, taking into consideration
all of the circumstances surrounding the loan and the borrower, including the length of the delay, the reasons for the delay, the borrower’s prior payment record and the amount of the shortfall in relation to the principal and interest owed.
Impairment is measured on a loan-by-loan basis for commercial and construction loans by either the present value of expected future cash flows discounted at the loan’s effective interest rate, the loan’s obtainable market price or the fair value
of the collateral if the loan is collateral-dependent.
Groups of loans with similar risk characteristics are collectively evaluated for impairment based on the group’s historical loss experience adjusted for changes in trends, conditions and other
relevant factors that affect repayment of the loans. Accordingly, the Company does not separately identify individual consumer loans for impairment measurements, unless such loans are the subject of a restructuring agreement due to financial
difficulties of the borrower.
Premises and Equipment
Premises and equipment are stated at cost, less accumulated depreciation. Depreciation is charged to operating expense and is computed using the straight-line method over the estimated useful
lives of the assets. Maintenance and repairs are charged to expense as incurred while improvements are capitalized. Premises and equipment is tested for impairment if events or changes in circumstances occur that indicate that the carrying amount
of any premises and equipment may not be recoverable. Premises that are identified to be sold are transferred to other real estate owned at the lower of their carrying amounts or their fair values less estimated costs to sell. Any losses on
premises identified to be sold are charged to operating expense. When premises and equipment are transferred to other real estate owned, sold, or otherwise retired, the cost and applicable accumulated depreciation are removed from the respective
accounts and any resulting gains or losses are reported in the statement of income.
Bank7 Corp.
Notes to Consolidated Financial Statements
Non-Marketable Equity Securities
Non-marketable equity securities consist primarily of Federal Home Loan Bank of Topeka (FHLB) stock and Federal Reserve Bank of Kansas City stock and are required investments for financial
institutions that are members of the FHLB and Federal Reserve systems. The required investment in common stock is based on a predetermined formula, carried at cost and evaluated for impairment.
Long-Lived Asset Impairment
The Company evaluates the recoverability of the carrying value of long-lived assets whenever events or circumstances indicate the carrying amount may not be recoverable. If a long-lived asset
is tested for recoverability and the undiscounted estimated future cash flows is expected to result from the use and eventual disposition of the asset is less than the carrying amount of the asset, the asset cost is adjusted to fair value and an
impairment loss is recognized as the amount by which the carrying amount of a long-lived asset exceeds its fair value.
No asset impairment was recognized during the years ended December 31, 2020, 2019, and 2018.
Foreclosed Assets Held for Sale
Foreclosed assets held for sale consist of assets acquired through, or in lieu of, loan foreclosure and are initially recorded at fair value, less cost to sell at the date of foreclosure,
establishing a new cost basis. Subsequent to foreclosure, valuations are periodically performed by management and the assets are carried at the lower of carrying amount of fair value less costs to sell. Revenue and expenses from operations and
changes in the valuation allowance are included in current operations.
Goodwill and Intangible Assets
Goodwill is tested annually for impairment or more frequently if other impairment indicators are present. If the implied fair value of goodwill is lower than its carrying amount, a goodwill
impairment is indicated and goodwill is written down to its implied fair value. Subsequent increases in goodwill value are not recognized in the accompanying consolidated financial statements.
Other intangible assets consist of core deposit intangible assets and are amortized on a straight-line basis based on an estimated useful life of 10 years. Such assets are periodically
evaluated as to the recoverability of their carrying values.
Segments
While the chief decision-makers monitor the revenue streams of the various products and services, operations are managed and financial performance is evaluated on a Company-wide basis.
Discrete financial information is not available other than on a Company-wide basis. Accordingly, all of the financial service operations are considered by management to be aggregated in one reportable operating segment.
Bank7 Corp.
Notes to Consolidated Financial Statements
Income Taxes
Prior to September 24, 2018, the Company had elected to be taxed as an S Corporation for federal and state income tax purposes. As such, stockholders were taxed on their pro rata share of
earnings and deductions of the Company, regardless of the amount of distributions received. Generally, the Company was not subject to federal income tax. Effective September 24, 2018, the Company converted from an S Corporation to a C Corporation
and is subject to federal and state taxes at that date.
The Company uses a comprehensive model for recognizing, measuring, presenting, and disclosing in the financial statements tax positions taken or expected to be taken on a tax return. A tax
position is recognized as a benefit only if it is ‘‘more likely than not’’ that the tax position would be sustained in a tax examination, with a tax examination being presumed to occur. The amount recognized is the largest amount of tax benefit
that is greater than 50% likely of being realized on examination. For tax positions not meeting the “more likely than not” test, no tax benefit is recorded.
The Company recognizes interest accrued and penalties related to unrecognized tax benefits in tax expense. During the years ended December 31, 2020, 2019 and 2018, the Company recognized no
interest and penalties.
We or one of our subsidiaries file income tax returns in the U.S. federal jurisdiction and various state jurisdictions. We are no longer subject to U.S. federal or state tax examinations for
years before 2017.
Revenue Recognition
In addition to lending and related activities, the Company offers various services to customers that generate revenue. Contract performance typically occurs in one year or less. Incremental
costs of obtaining a contract are expensed when incurred when the amortization period is one year or less.
Service and transaction fees on depository accounts
Customers often pay certain fees to the bank to access the cash on deposit including certain non-transactional fees such as account maintenance or dormancy fees, and certain transaction based
fees such as ATM, wire transfer, or foreign exchange fees. Revenue is recognized when the transactions occur or as services are performed over primarily monthly or quarterly periods. Payment is typically received in the period the transactions
occur, or in some cases, within 90 days of the service period.
Interchange Fees
Interchange fees, or “swipe” fees, are charges that merchants pay to the processors who, in turn, share that revenue with us and other card-issuing banks for processing electronic payment
transactions. Interchange fees represent the portion of the debit card transaction amount that the card issuer retains to compensate it for processing transactions and providing rewards. Interchange fees are settled and recognized on a daily or
monthly basis.
Bank7 Corp.
Notes to Consolidated Financial Statements
Recent Accounting Pronouncements
In February 2016, the FASB issued ASU 2016-02, Leases (Topic 842). The ASU requires lessees to recognize a lease liability and a right-of-use asset for all leases, excluding short-term leases,
at the commencement date. The guidance in the ASU is effective for reporting periods beginning after December 15, 2021. Additionally, a modified retrospective transition approach is required for leases existing at the earliest comparative
period presented. It is expected that adoption will not have a significant impact on the Company’s financial condition, results of operation, or capital position, but will impact the presentation on the balance sheet of the Company’s current
operating leases. The Company expects to adopt the standard in the fourth quarter of 2021.
In June 2016, the FASB issued ASU 2016-13, Financial Instruments – Credit Losses (Topic 326). The ASU requires the replacement of the current incurred loss model with an expected loss model,
referred to as the current expected credit loss (CECL) model. The guidance in the ASU is effective for reporting periods beginning after December 15, 2022 with a cumulative-effect adjustment to retained earnings required for the first reporting
period. Management is still assessing the impact of this ASU. The Company will adopt this ASU in the first quarter of 2023.
In January 2017, the FASB issued ASU 2017-04, Intangibles – Goodwill and Other (Topic 350): Simplifying the Test for Goodwill Impairment. The ASU amends existing guidance to simplify the
subsequent measurement of goodwill by eliminating Step 2 from the goodwill impairment test. Under the new guidance, if a reporting unit’s carrying amount exceeds its fair value an entity will record an impairment charge based on that difference.
The standard eliminates today’s requirement to calculate a goodwill impairment charge using Step 2, which requires an entity to calculate any impairment charge by comparing the implied fair value of goodwill with its carrying amount. Early
adoption is permitted. ASU 2017-04 was adopted as of January 1, 2020, with no significant impacts on the Company’s financial statements.
In August 2018, the FASB issued ASU No. 2018-13, Fair Value Measurement (Topic 820). ASU 2018-13 removes, modifies and adds disclosure requirements on fair value measurements. ASU 2018-13 was
adopted on January 1, 2020, and did not have a significant impact on the Company’s financial statements.
Legislative and Regulatory Developments
On March 27, 2020, the Coronavirus Aid, Relief, and Economic Security Act (CARES Act) was signed into law. It contains substantial tax and spending provisions intended to address the impact of
the COVID-19 pandemic. The goal of the CARES Act is to prevent a severe economic downturn through various measures, including direct financial aid to American families and economic stimulus to significantly impacted industry sectors. The CARES
Act also includes a range of other provisions designed to support the U.S. economy and mitigate the impact of COVID-19 on financial institutions and their customers, including through the authorization of various programs and measures that the
U.S. Department of the Treasury, the Small Business Administration, the Federal Reserve Board, and other federal banking agencies may or are required to implement. Further, in response to the COVID-19 outbreak, the Federal Reserve Board has
implemented or announced a number of facilities to provide emergency liquidity to various segments of the U.S. economy and financial market.
Bank7 Corp.
Notes to Consolidated Financial Statements
The extent to which the COVID-19 pandemic impacts the Company’s business, liquidity, asset valuations, results of operations, and financial condition, as well as its regulatory capital and
liquidity ratios, will depend on future developments, which are highly uncertain, including the scope and duration of the pandemic and actions taken by governmental authorities and other third parties in response to the pandemic. Moreover, the
effects of the COVID-19 pandemic may have a material adverse effect on all or a combination of valuation impairments on the Company's intangible assets, loans, or deferred tax assets.
| Note 2: |
Change in Capital Structure
|
On June 26, 2018, the Company amended and restated its Certificate of Incorporation. The original Certificate of Incorporation was amended to change the name of the Company from Haines
Financial Corp to Bank7 Corp. In addition, the amendment changed the capital structure to authorize the issuance of 50,000,000 shares of common stock, par value $0.01 per share (the “Common Stock”), 20,000,000 shares of non-voting common stock,
par value $0.01 per share (the “Non-voting Common Stock”), and 1,000,000 shares of preferred stock, par value $0.01 per share (the “Preferred Stock”).
The Company completed a 24-to-1 stock split of the Company’s outstanding shares of common stock for shareholders on record as of July 6, 2018. The stock was payable in the form of a dividend
on or about July 9, 2018. Shareholders received 24 additional shares for each share held. All share and per share amounts in the consolidated financial statements and related notes have been retroactively adjusted to reflect this stock split
for all periods presented.
Initial Public Offering
On September 20, 2018, the Company completed the initial public offering of its common stock. In connection with the Company’s initial public offering, the Company sold and issued 2,900,000
shares of common stock at $19 per share. After deducting the underwriting discounts and offering expenses, the Company received total net proceeds of $50.1 million from the initial public offering.
In connection with the initial public offering, the Company terminated its S Corporation status and became a taxable entity (“C Corporation”) on September 24, 2018. As such, any periods prior
to September 24, 2018 will only reflect an effective state income tax rate. As a result of the termination of S Corporation status, we increased our deferred tax asset and recorded an initial tax benefit of $863,000. The deferred tax asset is the
result of timing differences in the recognition of income/deductions for generally accepted accounting principles (“GAAP”) and tax purposes. Net deferred tax assets are included in other assets and no valuation allowance is considered necessary.
| Note 3: |
Restriction on Cash and Due from Banks
|
The Company is required to maintain reserve funds in cash and/or on deposit with the Federal Reserve Bank. The reserve required at December 31, 2020 was $0.
Bank7 Corp.
Notes to Consolidated Financial Statements
| Note 4: |
Earnings Per Share
|
Basic earnings per common share represents the amount of earnings for the period available to each share of common stock outstanding during the reporting period. Basic EPS is computed based
upon net income divided by the weighted average number of common shares outstanding during the year.
Diluted EPS represents the amount of earnings for the period available to each share of common stock outstanding including common stock that would have been outstanding assuming the issuance of
common shares for all dilutive potential common shares outstanding during each reporting period. Diluted EPS is computed based upon net income dividend by the weighted average number of commons shares outstanding during each period, adjusted for
the effect of dilutive potential common shares, such as restricted stock awards and nonqualified stock options, calculated using the treasury stock method.
The following table shows the computation of basic and diluted earnings per share:
|
As of and for the Years ended December 31,
|
||||||||||||
|
2020
|
2019
|
2018
|
||||||||||
|
(Dollars in thousands, except per share amounts)
|
||||||||||||
|
Numerator
|
||||||||||||
|
Net income
|
$
|
19,266
|
$
|
8,225
|
$
|
25,000
|
||||||
|
Denominator
|
||||||||||||
|
Weighted-average shares outstanding for basic earnings per share
|
9,378,769
|
10,145,032
|
8,105,856
|
|||||||||
|
Dilutive effect of stock compensation
(1)
|
385
|
2,279
|
131,782
|
|||||||||
|
Denominator for diluted earnings per share
|
9,379,154
|
10,147,311
|
8,237,638
|
|||||||||
|
Earnings per common share
|
||||||||||||
|
Basic
|
$
|
2.05
|
$
|
0.81
|
$
|
3.08
|
||||||
|
Diluted
|
$
|
2.05
|
$
|
0.81
|
$
|
3.03
|
||||||
(1) Nonqualified stock options outstanding of 185,250, 163,000 and 150,000 as of December 31, 2020, 2019 and 2018, respectively, have not been included in diluted earnings per share because to do so would have been
antidilutive for the periods presented.
Bank7 Corp.
Notes to Consolidated Financial Statements
| Note 5: |
Loans and Allowance for Loan Losses
|
A summary of loans at December 31, 2020 and December 31, 2019, are as follows (dollars in thousands):
|
December 31,
2020
|
December 31,
2019
|
|||||||
|
Construction & development
|
$
|
107,855
|
$
|
70,628
|
||||
|
1 - 4 family real estate
|
29,079
|
34,160
|
||||||
|
Commercial real estate - other
|
290,489
|
273,278
|
||||||
|
Total commercial real estate
|
427,423
|
378,066
|
||||||
|
Commercial & industrial
|
351,248
|
260,762
|
||||||
|
Agricultural
|
50,519
|
57,945
|
||||||
|
Consumer
|
9,898
|
11,895
|
||||||
|
Gross loans
|
839,088
|
708,668
|
||||||
|
Less allowance for loan losses
|
(9,639
|
)
|
(7,846
|
)
|
||||
|
Less deferred loan fees
|
(2,475
|
)
|
(1,364
|
)
|
||||
|
Net loans
|
$
|
826,974
|
$
|
699,458
|
||||
Included in the commercial & industrial loan balance at December 31, 2020, are $44.9 million of loans that were originated under the SBA PPP program.
Bank7 Corp.
Notes to Consolidated Financial Statements
The following table presents, by portfolio segment, the activity in the allowance for loan losses for the years ended December 31, 2020, 2019, and 2018 (dollars in thousands):
|
|
Construction &
Development
|
1 - 4 Family
Real Estate
|
Commercial
Real Estate -
Other
|
Commercial
& Industrial
|
Agricultural
|
Consumer
|
Total
|
|||||||||||||||||||||
|
December 31, 2020
|
||||||||||||||||||||||||||||
|
Balance, beginning of period
|
$
|
782
|
$
|
378
|
$
|
3,025
|
$
|
2,887
|
$
|
642
|
$
|
132
|
$
|
7,846
|
||||||||||||||
|
Charge-offs
|
-
|
-
|
-
|
(3,289
|
)
|
(300
|
)
|
(1
|
)
|
(3,590
|
)
|
|||||||||||||||||
|
Recoveries
|
-
|
2
|
-
|
18
|
10
|
3
|
33
|
|||||||||||||||||||||
|
Net charge-offs
|
-
|
2
|
-
|
(3,271
|
)
|
(290
|
)
|
2
|
(3,557
|
)
|
||||||||||||||||||
|
Provision (credit) for loan losses
|
457
|
(46
|
)
|
312
|
4,419
|
228
|
(20
|
)
|
5,350
|
|||||||||||||||||||
|
Balance, end of period
|
$
|
1,239
|
$
|
334
|
$
|
3,337
|
$
|
4,035
|
$
|
580
|
$
|
114
|
$
|
9,639
|
||||||||||||||
|
Construction &
Development
|
1 - 4 Family
Real Estate
|
Commercial
Real Estate -
Other
|
Commercial
& Industrial
|
Agricultural
|
Consumer
|
Total
|
||||||||||||||||||||||
|
December 31, 2019
|
||||||||||||||||||||||||||||
|
Balance, beginning of period
|
$
|
1,136
|
$
|
433
|
$
|
2,035
|
$
|
3,231
|
$
|
818
|
$
|
179
|
$
|
7,832
|
||||||||||||||
|
Charge-offs
|
-
|
(2
|
)
|
-
|
(4
|
)
|
(11
|
)
|
(1
|
)
|
(18
|
)
|
||||||||||||||||
|
Recoveries
|
-
|
5
|
-
|
24
|
3
|
-
|
32
|
|||||||||||||||||||||
|
Net recoveries
|
-
|
3
|
-
|
20
|
(8
|
)
|
(1
|
)
|
14
|
|||||||||||||||||||
|
Provision (credit) for loan losses
|
(354
|
)
|
(58
|
)
|
990
|
(364
|
)
|
(168
|
)
|
(46
|
)
|
-
|
||||||||||||||||
|
Balance, end of period
|
$
|
782
|
$
|
378
|
$
|
3,025
|
$
|
2,887
|
$
|
642
|
$
|
132
|
$
|
7,846
|
||||||||||||||
|
Construction &
Development
|
1 - 4 Family
Commercial
|
Commercial
Real Estate -
Other
|
Commercial
& Industrial
|
Agricultural
|
Consumer
|
Total
|
||||||||||||||||||||||
|
December 31, 2018
|
||||||||||||||||||||||||||||
|
Balance, beginning of period
|
$
|
1,407
|
$
|
431
|
$
|
1,865
|
$
|
2,779
|
$
|
1,015
|
$
|
157
|
$
|
7,654
|
||||||||||||||
|
Charge-offs
|
-
|
(25
|
)
|
-
|
(73
|
)
|
-
|
-
|
(98
|
)
|
||||||||||||||||||
|
Recoveries
|
-
|
3
|
-
|
71
|
1
|
1
|
76
|
|||||||||||||||||||||
|
Net charge-offs
|
-
|
(22
|
)
|
-
|
(2
|
)
|
1
|
1
|
(22
|
)
|
||||||||||||||||||
|
Provision (credit) for loan losses
|
(271
|
)
|
24
|
170
|
454
|
(198
|
)
|
21
|
200
|
|||||||||||||||||||
|
Balance, end of period
|
$
|
1,136
|
$
|
433
|
$
|
2,035
|
$
|
3,231
|
$
|
818
|
$
|
179
|
$
|
7,832
|
||||||||||||||
Bank7 Corp.
Notes to Consolidated Financial Statements
|
Construction &
Development
|
1 - 4 Family
Real Estate
|
Commercial
Real Estate -
Other
|
Commercial
& Industrial
|
Agricultural
|
Consumer
|
Total
|
||||||||||||||||||||||
|
December 31, 2020
|
||||||||||||||||||||||||||||
|
Allowance Balance
|
||||||||||||||||||||||||||||
|
Ending balance
|
||||||||||||||||||||||||||||
|
|
||||||||||||||||||||||||||||
|
Individually evaluated for impairment
|
$
|
-
|
$
|
-
|
$
|
-
|
$
|
177
|
$
|
-
|
$
|
-
|
$
|
177
|
||||||||||||||
|
Collectively evaluated for impairment
|
1,239
|
334
|
3,337
|
3,858
|
580
|
114
|
9,462
|
|||||||||||||||||||||
|
Total
|
$
|
1,239
|
$
|
334
|
$
|
3,337
|
$
|
4,035
|
$
|
580
|
$
|
114
|
$
|
9,639
|
||||||||||||||
|
Gross Loans
|
||||||||||||||||||||||||||||
|
Ending balance
|
||||||||||||||||||||||||||||
|
|
||||||||||||||||||||||||||||
|
Individually evaluated for impairment
|
$
|
-
|
$
|
-
|
$
|
8,054
|
$
|
14,601
|
$
|
468
|
$
|
-
|
$
|
23,123
|
||||||||||||||
|
Collectively evaluated for impairment
|
107,855
|
29,079
|
282,435
|
336,647
|
50,051
|
9,898
|
815,965
|
|||||||||||||||||||||
|
Total
|
$
|
107,855
|
$
|
29,079
|
$
|
290,489
|
$
|
351,248
|
$
|
50,519
|
$
|
9,898
|
$
|
839,088
|
||||||||||||||
|
December 31, 2019
|
||||||||||||||||||||||||||||
|
Allowance Balance
|
||||||||||||||||||||||||||||
|
Ending balance
|
||||||||||||||||||||||||||||
|
|
||||||||||||||||||||||||||||
|
Individually evaluated for impairment
|
$
|
-
|
$
|
-
|
$
|
26
|
$
|
-
|
$
|
-
|
$
|
-
|
$
|
26
|
||||||||||||||
|
Collectively evaluated for impairment
|
782
|
378
|
2,999
|
2,887
|
642
|
132
|
7,820
|
|||||||||||||||||||||
|
Total
|
$
|
782
|
$
|
378
|
$
|
3,025
|
$
|
2,887
|
$
|
642
|
$
|
132
|
$
|
7,846
|
|
Gross Loans
|
||||||||||||||||||||||||||||
|
Ending balance
|
||||||||||||||||||||||||||||
|
|
||||||||||||||||||||||||||||
|
Individually evaluated for impairment
|
$
|
-
|
$
|
-
|
$
|
5,841
|
$
|
2,750
|
$
|
2,527
|
$
|
-
|
$
|
11,118
|
||||||||||||||
|
Collectively evaluated for impairment
|
70,628
|
34,160
|
267,437
|
258,012
|
55,418
|
11,895
|
697,550
|
|||||||||||||||||||||
|
Total
|
$
|
70,628
|
$
|
34,160
|
$
|
273,278
|
$
|
260,762
|
$
|
57,945
|
$
|
11,895
|
$
|
708,668
|
Bank7 Corp.
Notes to Consolidated Financial Statements
Each loan segment is made up of loan categories possessing similar risk characteristics.
Risk characteristics applicable to each segment of the loan portfolio are described as follows:
Real Estate
–
The real estate portfolio consists of residential and commercial properties. Residential loans are generally secured by
owner occupied 1–4 family residences. Repayment of these loans is primarily dependent on the personal income and credit rating of the borrowers. Credit risk in these loans can be impacted by economic conditions within the Company’s market
areas that might impact either property values or a borrower’s personal income. Risk is mitigated by the fact that the loans are of smaller individual amounts and spread over a large number of borrowers. Commercial real estate loans in this
category typically involve larger principal amounts and are repaid primarily from the cash flow of a borrower’s principal business operation, the sale of the real estate or income independent of the loan purpose. Credit risk in these loans is
driven by the creditworthiness of a borrower, property values, the local economy and other economic conditions impacting a borrower’s business or personal income.
Commercial & Industrial
–
The commercial portfolio includes loans to commercial customers for use in financing working capital needs,
equipment purchases and expansions. The loans in this category are repaid primarily from the cash flow of a borrower’s principal business operation. Credit risk in these loans is driven by creditworthiness of a borrower and the economic
conditions that impact the cash flow stability from business operations.
Agricultural
–
Loans secured by agricultural assets are generally made for the purpose of acquiring land devoted to crop production,
cattle or poultry or the operation of a similar type of business on the secured property. Sources of repayment for these loans generally include income generated from operations of a business on the property, rental income or sales of the
property. Credit risk in these loans may be impacted by crop and commodity prices, the creditworthiness of a borrower, and changes in economic conditions which might affect underlying property values and the local economies in the Company’s
market areas.
Consumer
–
The consumer loan portfolio consists of various term and line of credit loans such as automobile loans and loans for other
personal purposes. Repayment for these types of loans will come from a borrower’s income sources that are typically independent of the loan purpose. Credit risk is driven by consumer economic factors, such as unemployment and general economic
conditions in the Company’s market area and the creditworthiness of a borrower.
Loan grades are numbered 1 through 4. Grade 1 is considered satisfactory. The grades of 2 and 3, or Watch and Special Mention, respectively, represent loans of lower quality and are
considered criticized. Grade of 4, or Substandard, refers to loans that are classified.
|
|
• |
Grade 1
(Pass)
– These loans generally conform to Bank policies, and are characterized by policy conforming advance rates on collateral, and have
well-defined repayment sources. In addition, these credits are extended to Borrowers and/or Guarantors with a strong balance sheet and either substantial liquidity or a reliable income history.
|
|
|
• |
Grade 2 (Watch)
– These loans are still considered “Pass” credits; however, various factors such as industry stress, material changes in cash flow or financial conditions, or deficiencies in loan
documentation, or other risk issues determined by the Lending Officer, Commercial Loan Committee (CLC), or Credit Quality Committee (CQC) warrant a heightened sense and frequency of monitoring.
|
Bank7 Corp.
Notes to Consolidated Financial Statements
|
|
• |
Grade 3 (Special Mention)
– These loans must have observable weaknesses or evidence of imprudent handling or structural issues. The weaknesses require close attention and the remediation of those
weaknesses is necessary. No risk of probable loss exists. Credits in this category are expected to quickly migrate to a “2” or a “4” as this is viewed as a transitory loan grade.
|
|
|
• |
Grade 4 (Substandard)
– These loans are not adequately protected by the sound worth and debt service capacity of the Borrower, but may be well – secured. They have defined weaknesses relative to
cash flow, collateral, financial condition, or other factors that might jeopardize repayment of all of the principal and interest on a timely basis. There is the possibility that a future loss will occur if weaknesses are not remediated.
|
The Company evaluates the definitions of loan grades and the allowance for loan losses methodology on an ongoing basis. No changes were made to either during the period ended December 31, 2020.
The following table presents the credit risk profile of the Company’s loan portfolio based on internal rating category as of December 31, 2020 and December 31, 2019 (dollars in thousands):
|
Construction &
Development
|
1 - 4 Family
Real Estate
|
Commercial
Real Estate -
Other
|
Commercial
& Industrial
|
Agricultural
|
Consumer
|
Total
|
||||||||||||||||||||||
|
December 31, 2020
|
||||||||||||||||||||||||||||
|
Grade
|
||||||||||||||||||||||||||||
|
1 (Pass)
|
$
|
107,855
|
$
|
28,711
|
$
|
248,194
|
$
|
328,656
|
$
|
50,051
|
$
|
9,898
|
$
|
773,365
|
||||||||||||||
|
2 (Watch)
|
-
|
368
|
24,155
|
7,691
|
-
|
-
|
32,214
|
|||||||||||||||||||||
|
3 (Special Mention)
|
-
|
-
|
10,086
|
300
|
-
|
-
|
10,386
|
|||||||||||||||||||||
|
4 (Substandard)
|
-
|
-
|
8,054
|
14,601
|
468
|
-
|
23,123
|
|||||||||||||||||||||
|
Total
|
$
|
107,855
|
$
|
29,079
|
$
|
290,489
|
$
|
351,248
|
$
|
50,519
|
$
|
9,898
|
$
|
839,088
|
||||||||||||||
|
Construction &
Development
|
1 - 4 Family
Real Estate
|
Commercial
Real Estate -
Other
|
Commercial
& Industrial
|
Agricultural
|
Consumer
|
Total
|
||||||||||||||||||||||
|
December 31, 2019
|
||||||||||||||||||||||||||||
|
Grade
|
||||||||||||||||||||||||||||
|
1 (Pass)
|
$
|
70,628
|
$
|
33,622
|
$
|
267,437
|
$
|
241,176
|
$
|
53,290
|
$
|
11,895
|
$
|
678,048
|
||||||||||||||
|
2 (Watch)
|
-
|
538
|
-
|
5,312
|
-
|
-
|
5,850
|
|||||||||||||||||||||
|
3 (Special Mention)
|
-
|
-
|
-
|
11,524
|
2,128
|
-
|
13,652
|
|||||||||||||||||||||
|
4 (Substandard)
|
-
|
-
|
5,841
|
2,750
|
2,527
|
-
|
11,118
|
|||||||||||||||||||||
|
Total
|
$
|
70,628
|
$
|
34,160
|
$
|
273,278
|
$
|
260,762
|
$
|
57,945
|
$
|
11,895
|
$
|
708,668
|
||||||||||||||
Bank7 Corp.
Notes to Consolidated Financial Statements
|
|
Past Due
|
|
Total Loans
> 90 Days &
Accruing
|
|||||||||||||||||||||||||
|
30–59
Days
|
60–89
Days
|
Greater than
90 Days
|
Total
|
Current
|
Total
Loans
|
|||||||||||||||||||||||
|
December 31, 2020
|
||||||||||||||||||||||||||||
|
Construction & development
|
$
|
714
|
$
|
-
|
$
|
-
|
$
|
714
|
$
|
107,141
|
$
|
107,855
|
$
|
-
|
||||||||||||||
|
1 - 4 Family Real Estate
|
-
|
-
|
-
|
-
|
29,079
|
29,079
|
-
|
|||||||||||||||||||||
|
Commercial Real Estate - other
|
1,444
|
-
|
1,960
|
3,404
|
287,085
|
290,489
|
1,960
|
|||||||||||||||||||||
|
Commercial & industrial
|
-
|
-
|
-
|
-
|
351,248
|
351,248
|
-
|
|||||||||||||||||||||
|
Agricultural
|
-
|
-
|
-
|
-
|
50,519
|
50,519
|
-
|
|||||||||||||||||||||
|
Consumer
|
193
|
-
|
-
|
193
|
9,705
|
9,898
|
-
|
|||||||||||||||||||||
|
Total
|
$
|
2,351
|
$
|
-
|
$
|
1,960
|
$
|
4,311
|
$
|
834,777
|
$
|
839,088
|
$
|
1,960
|
||||||||||||||
|
December 31, 2019
|
||||||||||||||||||||||||||||
|
Construction & development
|
$
|
-
|
$
|
-
|
$
|
-
|
$
|
-
|
$
|
70,628
|
$
|
70,628
|
$
|
-
|
||||||||||||||
|
1 - 4 Family Real Estate
|
-
|
-
|
-
|
-
|
34,160
|
34,160
|
-
|
|||||||||||||||||||||
|
Commercial Real Estate - other
|
-
|
-
|
-
|
-
|
273,278
|
273,278
|
-
|
|||||||||||||||||||||
|
Commercial & industrial
|
-
|
-
|
14
|
14
|
260,748
|
260,762
|
14
|
|||||||||||||||||||||
|
Agricultural
|
-
|
-
|
598
|
598
|
57,347
|
57,945
|
598
|
|||||||||||||||||||||
|
Consumer
|
90
|
-
|
-
|
90
|
11,805
|
11,895
|
-
|
|||||||||||||||||||||
|
Total
|
$
|
90
|
$
|
-
|
$
|
612
|
$
|
702
|
$
|
707,966
|
$
|
708,668
|
$
|
612
|
The following table presents impaired loans as of December 31, 2020 and December 31, 2019 (dollars in thousands):
|
Unpaid
Principal
Balance
|
Recorded
Investment
with No
Allowance
|
Recorded
Investment
with an
Allowance
|
Total
Recorded
Investment
|
Related
Allowance
|
Average
Recorded
Investment
|
Interest
Income
Recognized
|
||||||||||||||||||||||
|
|
||||||||||||||||||||||||||||
|
December 31, 2020
|
||||||||||||||||||||||||||||
|
Construction & development
|
$
|
-
|
$
|
-
|
$
|
-
|
$
|
-
|
$
|
-
|
$
|
-
|
$
|
-
|
||||||||||||||
|
1 - 4 Family Real Estate
|
-
|
-
|
-
|
-
|
-
|
570
|
-
|
|||||||||||||||||||||
|
Commercial Real Estate - other
|
8,353
|
8,054
|
-
|
8,054
|
-
|
5,209
|
554
|
|||||||||||||||||||||
|
Commercial & industrial
|
18,082
|
14,424
|
177
|
14,601
|
177
|
15,668
|
1,049
|
|||||||||||||||||||||
|
Agricultural
|
768
|
468
|
-
|
468
|
-
|
2,318
|
(13
|
)
|
||||||||||||||||||||
|
Consumer
|
-
|
-
|
-
|
-
|
-
|
-
|
-
|
|||||||||||||||||||||
|
Total
|
$
|
27,203
|
$
|
22,946
|
$
|
177
|
$
|
23,123
|
$
|
177
|
$
|
23,765
|
$
|
1,590
|
||||||||||||||
|
December 31, 2019
|
||||||||||||||||||||||||||||
|
Construction & development
|
$
|
-
|
$
|
-
|
$
|
-
|
$
|
-
|
$
|
-
|
$
|
-
|
$
|
-
|
||||||||||||||
|
1 - 4 Family Real Estate
|
-
|
-
|
-
|
-
|
-
|
208
|
-
|
|||||||||||||||||||||
|
Commercial Real Estate - other
|
5,841
|
4,032
|
1,809
|
5,841
|
26
|
2,557
|
440
|
|||||||||||||||||||||
|
Commercial & industrial
|
2,750
|
2,750
|
-
|
2,750
|
-
|
5,495
|
281
|
|||||||||||||||||||||
|
Agricultural
|
2,527
|
1,744
|
-
|
1,744
|
-
|
2,238
|
174
|
|||||||||||||||||||||
|
Consumer
|
-
|
-
|
-
|
-
|
-
|
98
|
-
|
|||||||||||||||||||||
|
Total
|
$
|
11,118
|
$
|
8,526
|
$
|
1,809
|
$
|
10,335
|
$
|
26
|
$
|
10,596
|
$
|
895
|
||||||||||||||
Impaired loans include nonperforming loans and also include loans modified in troubled-debt restructurings where concessions have been granted to borrowers experiencing financial difficulties.
These concessions could include a reduction in interest rate on the loan, payment extensions, forgiveness of principal, forbearance or other actions intended to maximize collection.
Included in certain loan categories in the impaired loans are troubled debt restructurings that were classified as impaired. At December 31, 2020, the Company had $1.6 million of commercial
real estate, $10.9 million of commercial and industrial, and $469,000 of agricultural loans that were modified in troubled-debt restructurings and impaired and $1.8 million of commercial real estate and $900,000 of agricultural loan modifications
as of December 31, 2019. There were $11.4 million in newly modified troubled-debt restructurings during the year ended December 31, 2020, consisting of $10.9 million of commercial and industrial loans and $469,000 in agricultural loans. The
modification of the terms of the TDR loan included a reduction of the stated interest rate of the loan to a stated rate of interest lower than the current market rate for new debt with similar risk.
Bank7 Corp.
Notes to Consolidated Financial Statements
Troubled-debt restructurings of $10.9 million in commercial and industrial and $469,000 in agricultural loans modified in the past twelve months subsequently defaulted during the period ended
December 31, 2020.
The following table represents information regarding nonperforming assets at December 31, 2020 and December 31, 2019 (dollars in thousands):
|
Construction &
Development
|
1 - 4 Family
Real Estate
|
Commercial
Real Estate -
Other
|
Commercial
& Industrial
|
Agricultural
|
Consumer
|
Total
|
||||||||||||||||||||||
|
December 31, 2020
|
||||||||||||||||||||||||||||
|
Nonaccrual loans
|
$
|
-
|
$
|
-
|
$
|
3,043
|
$
|
11,063
|
$
|
469
|
$
|
-
|
$
|
14,575
|
||||||||||||||
|
Troubled-debt restructurings (1)
|
-
|
-
|
-
|
-
|
-
|
-
|
-
|
|||||||||||||||||||||
|
Accruing loans 90 or more days past due
|
-
|
-
|
1,960
|
-
|
-
|
-
|
1,960
|
|||||||||||||||||||||
|
Total nonperforming loans
|
$
|
-
|
$
|
-
|
$
|
5,003
|
$
|
11,063
|
$
|
469
|
$
|
-
|
$
|
16,535
|
||||||||||||||
|
Construction &
Development
|
1 - 4 Family
Real Estate
|
Commercial
Real Estate -
Other
|
Commercial
& Industrial
|
Agricultural
|
Consumer
|
Total
|
||||||||||||||||||||||
|
December 31, 2019
|
||||||||||||||||||||||||||||
|
Nonaccrual loans
|
$
|
-
|
$
|
-
|
$
|
1,809
|
$
|
-
|
$
|
-
|
$
|
-
|
$
|
1,809
|
||||||||||||||
|
Troubled-debt restructurings (1)
|
-
|
-
|
-
|
-
|
912
|
-
|
912
|
|||||||||||||||||||||
|
Accruing loans 90 or more days past due
|
-
|
-
|
-
|
14
|
598
|
-
|
612
|
|||||||||||||||||||||
|
Total nonperforming loans
|
$
|
-
|
$
|
-
|
$
|
1,809
|
$
|
14
|
$
|
1,510
|
$
|
-
|
$
|
3,333
|
||||||||||||||
(1) $12.98 million and $1.81 million of TDRs as of December 31, 2020 and 2019, respectively, are included in the nonaccrual loans balance in the line above.
The CARES Act includes a provision that permits a financial institution to elect to suspend temporarily troubled debt restructuring accounting under ASC Subtopic 310-40 in certain circumstances
(“section 4013”). To be eligible under section 4013, a loan modification must be (1) related to COVID-19; (2) executed on a loan that was not more than 30 days past due as of December 31, 2019; and (3) executed between March 1, 2020, and the
earlier of (A) 60 days after the date of termination of the National Emergency or (B) January 1, 2022. In response to this section of the CARES Act, the federal banking agencies issued a revised interagency statement on April 7, 2020 that, in
consultation with the Financial Accounting Standards Board, confirmed that for loans not subject to section 4013, short-term modifications made on a good faith basis in response to COVID-19 to borrowers who were current prior to any relief are
not troubled debt restructurings under ASC Subtopic 310-40. This includes short-term (e.g., up to six months) modifications such as payment deferrals, fee waivers, extensions of repayment terms, or delays in payment that are insignificant.
Borrowers considered current are those that are less than 30 days past due on their contractual payments at the time a modification program is implemented. As of December 31, 2020, eight loans totaling $33.0 million were modified, related to
COVID-19, which were not considered troubled debt restructurings.
Bank7 Corp.
Notes to Consolidated Financial Statements
| Note 6: |
Premises and Equipment
|
Major classifications of premises and equipment, stated at cost and net of accumulated depreciation are as follows (dollars in thousands):
|
December,
2020
|
December 31,
2019
|
|||||||
|
Land, buildings and improvements
|
$
|
10,172
|
$
|
9,942
|
||||
|
Furniture and equipment
|
2,177
|
2,117
|
||||||
|
Automobiles
|
846
|
760
|
||||||
|
13,195
|
12,819
|
|||||||
|
Less accumulated depreciation
|
(4,044
|
)
|
(3,195
|
)
|
||||
|
Net premises and equipment
|
$
|
9,151
|
$
|
9,624
|
||||
| Note 7: |
Intangible Assets
|
The gross carrying amount and accumulated amortization of recognized intangible assets at December 31, 2020 and 2019, were (dollars in thousands):
|
December 31,
2020
|
December 31,
2019
|
|||||||||||||||
|
Gross
Carrying
Amount
|
Accumulated
Amortization
|
Gross
Carrying
Amount
|
Accumulated
Amortization
|
|||||||||||||
|
Core deposit intangible
|
$
|
2,061
|
$
|
(1,489
|
)
|
$
|
2,061
|
$
|
(1,283
|
)
|
||||||
Bank7 Corp.
Notes to Consolidated Financial Statements
|
2021
|
$
|
206
|
||
|
2022
|
206
|
|||
|
2023
|
160
|
|||
|
$
|
572
|
| Note 8: |
Interest-Bearing Deposits
|
Interest-bearing time deposits in denominations of $250,000 or more were $76.8 million and $57.0 million at December 31, 2020 and 2019, respectively.
At December 31, 2020, the scheduled maturities of interest-bearing time deposits were as follows (dollars in thousands):
|
2021
|
$
|
164,753
|
||
|
2022
|
27,950
|
|||
|
2023
|
18,613
|
|||
|
2024
|
771
|
|||
|
Thereafter
|
51
|
|||
|
$
|
212,138
|
| Note 9: |
Income Taxes
|
In connection with the initial public offering, as discussed in Note 2, the Company terminated its S Corporation status and became a taxable entity (“C Corporation”) effective September 24,
2018.
Bank7 Corp.
Notes to Consolidated Financial Statements
|
|
Year Ended December 31,
|
|||||||||||
|
|
2020
|
2019
|
2018
|
|||||||||
|
Federal:
|
||||||||||||
|
Current
|
$
|
5,944
|
$
|
5,516
|
$
|
1,563
|
||||||
|
Deferred
|
(684
|
)
|
-
|
(1,036
|
)
|
|||||||
|
Total federal tax provision
|
$
|
5,260
|
$
|
5,516
|
$
|
527
|
||||||
|
State:
|
||||||||||||
|
Current
|
$
|
1,549
|
$
|
1,308
|
$
|
303
|
||||||
|
Deferred
|
(191
|
)
|
20
|
(33
|
)
|
|||||||
|
Total state tax provision
|
$
|
1,358
|
$
|
1,328
|
$
|
270
|
||||||
|
Total income tax provision
|
$
|
6,618
|
$
|
6,844
|
$
|
797
|
||||||
The provision for income taxes for the years ended December 31, 2020, 2019 and 2018 differs from the federal rate of 21% due to the following:
|
|
Year Ended December 31,
|
|||||||||||
|
|
2020
|
2019
|
2018
|
|||||||||
|
Statutory U.S. Federal Income Tax
|
$
|
5,434
|
$
|
3,160
|
$
|
5,417
|
||||||
|
Increase (decrease) resulting from:
|
||||||||||||
|
State Taxes
|
1,077
|
1,048
|
213
|
|||||||||
|
Benefit of S corporation status
|
-
|
-
|
(3,933
|
)
|
||||||||
|
Permanent Differences
|
118
|
2,327
|
-
|
|||||||||
|
Conversion as of September 24, 2018 to C Corporation
|
-
|
-
|
(863
|
)
|
||||||||
|
Other
|
(11
|
)
|
309
|
(37
|
)
|
|||||||
|
Provision for income taxes
|
$
|
6,618
|
$
|
6,844
|
$
|
797
|
||||||
Bank7 Corp.
Notes to Consolidated Financial Statements
|
|
Year Ended December 31,
|
|||||||
|
2020
|
2019
|
|||||||
|
Deferred tax assets:
|
||||||||
|
Allowance for loan losses
|
$
|
2,395
|
$
|
1,918
|
||||
|
Non-accrual loans
|
156
|
60
|
||||||
|
Deferred revenue
|
302
|
165
|
||||||
|
Deferred compensation
|
152
|
78
|
||||||
|
Total deferred tax assets
|
$
|
3,005
|
$
|
2,221
|
||||
|
Deferred tax liabilities:
|
||||||||
|
Property and equipment
|
$
|
(753
|
)
|
$
|
(320
|
)
|
||
|
Intangible assets
|
(180
|
)
|
(202
|
)
|
||||
|
Prepaid expenses
|
(94
|
)
|
(122
|
)
|
||||
|
Method change IRC 481(a)
|
-
|
(476
|
)
|
|||||
|
Other
|
(14
|
)
|
(12
|
)
|
||||
|
Total deferred tax liabilities
|
$
|
(1,041
|
)
|
$
|
(1,132
|
)
|
||
|
Net deferred tax assets
|
$
|
1,964
|
$
|
1,089
|
||||
In assessing the Company’s ability to realize deferred tax assets, management considers whether it is more likely than not that some portion or all of the deferred tax assets will not be
realized. The ultimate realization of deferred tax assets is dependent upon the generation of future taxable income during the periods in which those temporary differences become deductible. Management considers projected future taxable income
and tax planning strategies in making this assessment. Based upon the level of historical taxable income and projections for future taxable income over the periods in which the deferred tax assets are deductible, management believes it is more
likely than not that the Company will realize all benefits related to these deductible differences as of December 31, 2020.
The Company does not have any net operating loss or tax credit carryforwards as of December 31, 2020.
The Company is not presently under examination by the Internal Revenue Service or any state tax authority.
The Company establishes reserves for uncertain tax positions that reflect management’s best estimate of deductions and credits that may not be sustained on a more-likely-than-not basis.
Recognized income tax positions are measured at the largest amount that is considered greater than 50% likely of being realized. Changes in recognition or measurement are reflected in the period in which the change in judgment occurs. A
reconciliation of the beginning and ending amount of uncertain tax positions is as follows (in thousands):
Bank7 Corp.
Notes to Consolidated Financial Statements
|
|
For the Year Ended December 31,
|
|||||||
|
|
2020
|
2019
|
||||||
|
|
||||||||
|
Balance at beginning of year
|
$
|
13
|
$
|
13
|
||||
|
Additions for positions taken in prior years
|
-
|
-
|
||||||
|
Reductions for positions taken in prior years
|
-
|
-
|
||||||
|
Balance at end of year
|
$
|
13
|
$
|
13
|
||||
There were no interest or penalties related to uncertain tax positions reflected in the consolidated statements of income for the years ended December 31, 2020, 2019, and 2018.
| Note 10: |
Letters of Credit
|
The Bank has entered into an arrangement with the FHLB resulting in the FHLB issuing letters of credit on behalf of the Bank with the resulting beneficiary being certain public funds in
connection with these deposits. Outstanding letters of credit to secure these public funds at December 31, 2020 and 2019 were $884,000 and $1.3 million, respectively. Loans with a collateral value of approximately $65.7 million were used to
secure the letters of credit.
| Note 11: |
Advances and Borrowings
|
The Bank has a blanket floating lien security agreement with a maximum borrowing capacity of $64.8 million at December 31, 2020, with the FHLB, under which the Bank is required to maintain
collateral for any advances, including its stock in the FHLB, as well as qualifying first mortgage and other loans. The Bank had no advances from the FHLB at December 31, 2020 or 2019.
Bank7 Corp.
Notes to Consolidated Financial Statements
| Note 12: |
Shareholders’ Equity
|
On September 5, 2019, the Company adopted a Repurchase Plan (the “RP”). The RP initially authorized the repurchase of up to 500,000 shares of the Company’s common stock. On March 13, 2020, the
Company’s Board of Directors approved a 500,000 share expansion, and on November 2, 2020, approved a 750,000 share expansion to the existing stock repurchase program, for a total of 1,750,000 shares authorized under the program. All shares
repurchased under the RP have been retired and not held as treasury stock. The timing, price and amount of stock repurchases under the RP may be determined by management. At December 31, 2020, there were 717,822 shares remaining that could be
repurchased under the Company’s Repurchase Program. Stock repurchases under the RP will take place pursuant to a Rule 10b5-1 Plan with pricing and purchasing parameters established by management. A summary of the activity under the RP is as
follows:
|
Year Ended December 31,
|
||||||||
|
|
2020
|
2019
|
||||||
|
Number of shares repurchased
|
1,032,178
|
-
|
||||||
|
Average price of shares repurchased
|
$
|
8.73
|
$
|
-
|
||||
|
Shares remaining to be repurchased
|
717,822
|
500,000
|
||||||
The Company and Bank are subject to risk-based capital guidelines issued by the federal banking agencies. Failure to meet minimum capital requirements can initiate certain mandatory and
possibly additional discretionary actions by regulators that, if undertaken, could have a direct material effect on the Company’s consolidated financial statements. Under capital adequacy guidelines and the regulatory framework for prompt
corrective action, the Company and Bank must meet specific capital guidelines that involve quantitative measures of assets, liabilities and certain off-balance-sheet items as calculated under GAAP, regulatory reporting requirements and regulatory
capital standards. The Company’s and Bank’s capital amounts and classification are also subject to qualitative judgments by the regulators about components, risk weightings and other factors. Furthermore, the Company’s and the Bank’s regulators
could require adjustments to regulatory capital not reflected in these financial statements.
Quantitative measures established by regulation to ensure capital adequacy require the Company and Bank to maintain minimum amounts and ratios (set forth in the following table) of total, Tier
I, and Common Equity capital (as defined in the regulations) to risk-weighted assets (as defined) and of Tier I capital (as defined) to average assets (as defined). Management believes, as of December 31, 2020, that the Company and Bank meet all
capital adequacy requirements to which it is subject and maintains capital conservation buffers that allow the Company and Bank to avoid limitations on capital distributions, including dividend payments and certain discretionary bonus payments to
certain executive officers.
As of December 31, 2020, the most recent notification from the Federal Deposit Insurance Corporation (FDIC) categorized the Bank as well capitalized under the regulatory framework for prompt
corrective action. To be categorized as well capitalized, the Bank must maintain capital ratios as set forth in the table. There are no conditions or events since that notification that management believes have changed the Bank’s category.
Bank7 Corp.
Notes to Consolidated Financial Statements
The Company’s and Bank’s actual capital amounts and ratios are presented in the following table (dollars in thousands):
|
|
Actual
|
Minimum
Capital Requirements
|
With Capital
Conservation Buffer
|
Minimum
To Be Well Capitalized
Under Prompt
Corrective Action
|
||||||||||||||||||||||||||||
|
|
||||||||||||||||||||||||||||||||
|
Amount
|
Ratio
|
Amount
|
Ratio
|
Amount
|
Ratio
|
Amount
|
Ratio
|
|||||||||||||||||||||||||
|
As of December 31, 2020
|
||||||||||||||||||||||||||||||||
|
Total capital to risk-weighted assets
|
||||||||||||||||||||||||||||||||
|
Company
|
$
|
115,375
|
14.73
|
%
|
$
|
62,641
|
8.00
|
%
|
$
|
82,216
|
10.50
|
%
|
N/A
|
N/A
|
||||||||||||||||||
|
Bank
|
$
|
115,335
|
14.75
|
%
|
$
|
62,563
|
8.00
|
%
|
$
|
82,114
|
10.50
|
%
|
$
|
78,204
|
10.00
|
%
|
||||||||||||||||
|
Tier I capital to risk-weighted assets
|
||||||||||||||||||||||||||||||||
|
Company
|
$
|
105,736
|
13.50
|
%
|
$
|
46,981
|
6.00
|
%
|
$
|
66,556
|
8.50
|
%
|
N/A
|
N/A
|
||||||||||||||||||
|
Bank
|
$
|
105,696
|
13.51
|
%
|
$
|
46,922
|
6.00
|
%
|
$
|
66,473
|
8.50
|
%
|
$
|
62,563
|
8.00
|
%
|
||||||||||||||||
|
CET I capital to risk-weighted assets
|
||||||||||||||||||||||||||||||||
|
Company
|
$
|
105,736
|
13.50
|
%
|
$
|
35,236
|
4.50
|
%
|
$
|
54,811
|
7.00
|
%
|
N/A
|
N/A
|
||||||||||||||||||
|
Bank
|
$
|
105,696
|
13.51
|
%
|
$
|
35,192
|
4.50
|
%
|
$
|
54,743
|
7.00
|
%
|
$
|
50,832
|
6.50
|
%
|
||||||||||||||||
|
Tier I capital to average assets
|
||||||||||||||||||||||||||||||||
|
Company
|
$
|
105,736
|
10.78
|
%
|
$
|
39,218
|
4.00
|
%
|
N/A
|
N/A
|
N/A
|
N/A
|
||||||||||||||||||||
|
Bank
|
$
|
105,696
|
10.78
|
%
|
$
|
39,233
|
4.00
|
%
|
N/A
|
N/A
|
$
|
49,041
|
5.00
|
%
|
||||||||||||||||||
|
As of December 31, 2019
|
||||||||||||||||||||||||||||||||
|
Total capital to risk-weighted assets
|
||||||||||||||||||||||||||||||||
|
Company
|
$
|
105,137
|
15.25
|
%
|
$
|
55,157
|
8.00
|
%
|
$
|
72,393
|
10.50
|
%
|
N/A
|
N/A
|
||||||||||||||||||
|
Bank
|
$
|
106,148
|
15.42
|
%
|
$
|
55,076
|
8.00
|
%
|
$
|
72,287
|
10.50
|
%
|
$
|
68,845
|
10.00
|
%
|
||||||||||||||||
|
Tier I capital to risk-weighted assets
|
||||||||||||||||||||||||||||||||
|
Company
|
$
|
97,291
|
14.11
|
%
|
$
|
41,368
|
6.00
|
%
|
$
|
58,604
|
8.50
|
%
|
N/A
|
N/A
|
||||||||||||||||||
|
Bank
|
$
|
98,302
|
14.28
|
%
|
$
|
41,307
|
6.00
|
%
|
$
|
58,518
|
8.50
|
%
|
$
|
55,076
|
8.00
|
%
|
||||||||||||||||
|
CET I capital to risk-weighted assets
|
||||||||||||||||||||||||||||||||
|
Company
|
$
|
97,291
|
14.11
|
%
|
$
|
31,026
|
4.50
|
%
|
$
|
48,262
|
7.00
|
%
|
N/A
|
N/A
|
||||||||||||||||||
|
Bank
|
$
|
98,302
|
14.28
|
%
|
$
|
30,980
|
4.50
|
%
|
$
|
48,192
|
7.00
|
%
|
$
|
44,749
|
6.50
|
%
|
||||||||||||||||
|
Tier I capital to average assets
|
||||||||||||||||||||||||||||||||
|
Company
|
$
|
97,291
|
11.53
|
%
|
$
|
33,833
|
4.00
|
%
|
N/A
|
N/A
|
N/A
|
N/A
|
||||||||||||||||||||
|
Bank
|
$
|
98,302
|
11.65
|
%
|
$
|
33,793
|
4.00
|
%
|
N/A
|
N/A
|
$
|
42,241
|
5.00
|
%
|
||||||||||||||||||
The federal banking agencies require that banking organizations meet several risk-based capital adequacy requirements. The current risk-based capital standards applicable to the Company and the
Bank are based on the Basel III Capital Rules established by the Basel Committee on Banking Supervision (the “Basel Committee”). The Basel Committee is a committee of central banks and bank supervisors/regulators from the major industrialized
countries that develops broad policy guidelines for use by each country’s supervisors in determining the supervisory policies they apply. The requirements are intended to ensure that banking organizations have adequate capital given the risk
levels of assets and off-balance sheet financial instruments.
The Basel III Capital Rules require the Bank and the Company to comply with four minimum capital standards: a Tier 1 leverage ratio of at least 4.0%; a CET1 to risk-weighted assets of 4.5%; a
Tier 1 capital to risk-weighted assets of at least 6.0%; and a total capital to risk-weighted assets of at least 8.0%. The calculation of all types of regulatory capital is subject to definitions, deductions and adjustments specified in the
regulations.
Bank7 Corp.
Notes to Consolidated Financial Statements
As of December 31, 2020, the Company’s and the Bank’s capital ratios exceeded the minimum capital adequacy guideline percentage requirements under the Basel III Capital Rules on a fully
phased-in basis.
Bank7 Corp.
Notes to Consolidated Financial Statements
The Bank is subject to certain restrictions on the amount of dividends that it may declare without prior regulatory approval. At December 31, 2020, approximately $36.8 million of retained
earnings was available for dividend declaration from the Bank without prior regulatory approval.
| Note 13: |
Related-Party Transactions
|
At December 31, 2020 and December 31, 2019, the Company had loans outstanding to executive officers, directors, significant shareholders and their affiliates (related parties) approximating $0
and $1.1 million, respectively. A summary of these loans is as follows (dollars in thousands):
|
Balance
Beginning of
the Period
|
Additions
|
Collections/
Terminations
|
Balance
End of
the Period
|
|||||||||||||
|
Year ended December 31, 2020
|
$
|
1,055
|
$
|
-
|
$
|
(1,055
|
)
|
$
|
-
|
|||||||
|
Year ended December 31, 2019
|
$
|
6,897
|
$
|
2,613
|
$
|
(8,455
|
)
|
$
|
1,055
|
|||||||
In management’s opinion, such loans and other extensions of credit and deposits were made in the ordinary course of business and were made on substantially the same terms (including interest
rates and collateral) as those prevailing at the time for comparable transactions with other persons. Further, in management’s opinion, these loans did not involve more than normal risk of collectability or present other unfavorable features.
The Bank leases office and retail banking space in Woodward, Oklahoma from Haines Realty Investments Company, LLC, a related party of the Company. Lease expense totaled $177,000, $184,000 and
$184,000 for the years ended December 31, 2020, 2019 and 2018, respectively. In addition, payroll and office sharing arrangements were in place between the Company and certain of its affiliates.
During the year, the Bank sold two loans to Haines Capital Group, LLC, a related party of the Company, totaling $20.4 million in principal and accrued interest. The loans were sold in-full, at
par value and without recourse.
| Note 14: |
Employee Benefits
|
401(k) Savings Plan
The Company has a retirement savings 401(k) plan covering substantially all employees. Employees may contribute up to the maximum legal limit with the Bank matching up to 5% of the employee’s
salary. Employer contributions charged to expense for the years ended December 31, 2020, 2019 and 2018 totaled $230,000, $223,000 and $198,000, respectively.
Bank7 Corp.
Notes to Consolidated Financial Statements
The Company adopted a nonqualified incentive stock option plan (the “Bank7 Corp. 2018 Equity Incentive Plan”) in September 2018 and amended the Bank7 Corp. 2018 Equity Plan on May 20, 2020
adding an additional 507,500 shares to the plan. The Bank7 Corp. 2018 Equity Incentive Plan will terminate in September 2028, if not extended. Compensation expense related to the Plan for the years ended December 31, 2020, 2019 and 2018 totaled
$771,000, $628,000 and $154,000, respectively. There were 694,750 shares available for future grants as of December 31, 2020.
On September 5, 2019, our largest shareholders, the Haines Family Trusts, contributed approximately 6.5% of their shares (656,925 shares) to the Company. Subsequently, the Company immediately
issued those shares to certain executive officers, which was charged as compensation expense of $11.8 million, including payroll taxes, through the income statement of the Company. Additionally, at the discretion of the employees receiving shares
to assist in paying tax withholdings, 149,425 shares were withheld and subsequently canceled, resulting in a charge to retained earnings of $2.6 million.
The Company grants to employees and directors restricted stock units (RSUs) which vest ratably over either three or five years and stock options which vest ratably over four years. All RSUs
and stock options are granted at the fair value of the common stock at the time of the award. The RSUs are considered fixed awards as the number of shares and fair value are known at the date of grant and the fair value at the grant date is
amortized over the vesting and/or service period.
The Company uses newly issued shares for granting RSUs and stock options.
Bank7 Corp.
Notes to Consolidated Financial Statements
The following table is a summary of the stock option activity under the Bank7 Corp. 2018 Equity Incentive Plan (dollar amounts in thousands, except per share data):
|
Options
|
Wgtd. Avg. Exercise
Price
|
Wgtd. Avg. Remaining Contractual Term
|
Aggregate
Intrinsic
Value
|
|||||||||||||
|
Twelve Months Ended December 31, 2020
|
||||||||||||||||
|
Outstanding at December 31, 2019
|
163,000
|
$
|
18.75
|
|||||||||||||
|
Options Granted
|
26,500
|
18.49
|
||||||||||||||
|
Options Exercised
|
-
|
-
|
||||||||||||||
|
Options Forfeited
|
(4,250
|
)
|
17.73
|
|||||||||||||
|
Outstanding at December 31, 2020
|
185,250
|
18.73
|
7.94
|
$
|
0
|
|||||||||||
|
Exercisable at December 31, 2020
|
75,625
|
18.88
|
7.75
|
$
|
0
|
|||||||||||
|
Twelve Months Ended December 31, 2019
|
||||||||||||||||
|
Outstanding at December 31, 2018
|
150,000
|
$
|
19.00
|
|||||||||||||
|
Options Granted
|
20,500
|
16.98
|
||||||||||||||
|
Options Exercised
|
-
|
-
|
||||||||||||||
|
Options Forfeited
|
(7,500
|
)
|
19.00
|
|||||||||||||
|
Outstanding at December 31, 2019
|
163,000
|
18.75
|
8.79
|
$
|
41
|
|||||||||||
|
Exercisable at December 31, 2019
|
35,625
|
19.00
|
8.73
|
$
|
0
|
|||||||||||
The fair value of each option grant is estimated on the date of grant using the Black-Scholes option-pricing model and is based on certain assumptions including risk-free rate of return,
dividend yield, stock price volatility and the expected term. The fair value of each option is expensed over its vesting period.
Bank7 Corp.
Notes to Consolidated Financial Statements
The following table shows the assumptions used for computing stock-based compensation expense under the fair value method on options granted during the period presented:
|
|
Year Ended
|
|||||||
|
|
December 31, 2020
|
December 31, 2019
|
||||||
|
Risk-free interest rate
|
1.71
|
%
|
2.48
|
%
|
||||
|
Dividend yield
|
2.20
|
%
|
2.20
|
%
|
||||
|
Stock price volatility
|
41.27
|
%
|
31.14
|
%
|
||||
|
Expected term
|
7.51
|
7.01
|
||||||
The following table summarizes share information about RSUs for the years ended December 31, 2020 and 2019:
|
Number of
Shares
|
Wgtd. Avg. Grant
Date Fair Value
|
|||||||
|
Twelve Months Ended December 31, 2020
|
||||||||
|
Outstanding at December 31, 2019
|
104,000
|
$
|
19.09
|
|||||
|
Shares granted
|
41,000
|
16.19
|
||||||
|
Shares settled
|
(26,000
|
)
|
19.09
|
|||||
|
Shares forfeited
|
(1,000
|
)
|
18.49
|
|||||
|
End of the period balance
|
118,000
|
$
|
18.09
|
|||||
|
Twelve Months Ended December 31, 2019
|
||||||||
|
Outstanding at December 31, 2018
|
130,000
|
$
|
19.09
|
|||||
|
Shares granted
|
-
|
-
|
||||||
|
Shares settled
|
(26,000
|
)
|
19.09
|
|||||
|
Shares forfeited
|
-
|
-
|
||||||
|
End of the period balance
|
104,000
|
$
|
19.09
|
|||||
As of December 31, 2020, there was approximately $1.9 million of unrecognized compensation expense related to 118,000 unvested RSUs and $363,000 of unrecognized compensation expense related to
185,250 unvested and/or unexercised stock options. The stock option expense is expected to be recognized over a weighted average period of 2.22 years, and the RSU expense is expected to be recognized over a weighted average period of 3.08 years.
| Note 15: |
Disclosures About Fair Value of Assets and Liabilities
|
Fair value is the price that would be received to sell an asset or paid to transfer a liability in an orderly transaction between market participants at the measurement date. Fair value
measurements must maximize the use of observable inputs and minimize the use of unobservable inputs. There is a hierarchy of three levels of inputs that may be used to measure fair value:
|
|
Level 1 |
Quoted prices in active markets for identical assets or liabilities
|
|
|
Level 2 |
Observable inputs other than Level 1 prices, such as quoted prices for similar assets or liabilities; quoted prices in markets that are not active; or other inputs that are observable or can be corroborated by observable market data
for substantially the full term of the assets or liabilities
|
Bank7 Corp.
Notes to Consolidated Financial Statements
|
|
Level 3 |
Unobservable inputs supported by little or no market activity and significant to the fair value of the assets or liabilities
|
Recurring Measurements
There were no assets measured at fair value on a recurring basis as of December 31, 2020 and December 31, 2019.
Nonrecurring Measurements
The following table presents the fair value measurement of assets measured at fair value on a nonrecurring basis and the level within the fair value hierarchy in which the fair value
measurements fall at December 31, 2020 and December 31, 2019 (dollars in thousands):
|
Fair Value
|
(Level 1)
|
(Level 2)
|
(Level 3)
|
|||||||||||||
|
December 31, 2020
|
||||||||||||||||
|
Impaired loans (collateral- dependent)
|
$
|
11,358
|
$
|
-
|
$
|
-
|
$
|
11,358
|
||||||||
|
December 31, 2019
|
||||||||||||||||
|
Impaired loans (collateral- dependent)
|
$
|
1,783
|
$
|
-
|
$
|
-
|
$
|
1,783
|
||||||||
Following is a description of the valuation methodologies and inputs used for assets measured at fair value on a nonrecurring basis and recognized in the accompanying consolidated balance
sheets, as well as the general classification of such assets pursuant to the valuation hierarchy. For assets classified within Level 3 of the fair value hierarchy, the process used to develop the reported fair value is described below.
Collateral-Dependent Impaired Loans, Net of Allowance for Loan Losses
The estimated fair value of collateral-dependent impaired loans is based on fair value, less estimated cost to sell. Collateral-dependent impaired loans are classified within Level 3 of the
fair value hierarchy.
The Company considers evaluation analysis as the starting point for determining fair value and then considers other factors and events in the environment that may affect the fair value. Values
of the collateral underlying collateral-dependent loans are obtained when the loan is determined to be collateral-dependent and subsequently as deemed necessary by executive management and loan administration. Values are reviewed for accuracy
and consistency by executive management and loan administration. The ultimate collateral values are reduced by discounts to consider lack of marketability and estimated cost to sell if repayment or satisfaction of the loan is dependent on the
sale of the collateral.
Bank7 Corp.
Notes to Consolidated Financial Statements
The following table presents quantitative information about unobservable inputs used in recurring and nonrecurring Level 3 fair value measurements.
|
Fair Value
|
Valuation
Technique
|
Unobservable
Inputs
|
Weighted-
Average
|
|||||||
|
December 31, 2020
|
|
|
||||||||
|
Collateral-dependent impaired loans
|
$
|
11,358
|
Appraisals from comparable properties
|
Estimated cost to sell
|
3-5
|
%
|
||||
|
|
|
|||||||||
|
December 31, 2019
|
|
|
||||||||
|
Collateral-dependent impaired loans
|
$
|
1,783
|
Appraisals from comparable properties
|
Estimated cost to sell
|
3-5
|
%
|
||||
Bank7 Corp.
Notes to Consolidated Financial Statements
|
Carrying
|
Fair Value Measurements
|
|||||||||||||||||||
|
Amount
|
Level 1
|
Level 2
|
Level 3
|
Total
|
||||||||||||||||
|
December 31, 2020
|
||||||||||||||||||||
|
Financial Assets
|
||||||||||||||||||||
|
Cash and due from banks
|
$
|
153,901
|
$
|
153,901
|
$
|
-
|
$
|
-
|
$
|
153,901
|
||||||||||
|
Interest-bearing time deposits in other banks
|
$
|
16,412
|
$
|
-
|
$
|
16,412
|
$
|
-
|
$
|
16,412
|
||||||||||
|
Loans, net of allowance
|
$
|
826,974
|
$
|
-
|
$
|
815,223
|
$
|
11,358
|
$
|
826,581
|
||||||||||
|
Mortgage loans held for sale
|
$
|
324
|
$
|
-
|
$
|
324
|
$
|
-
|
$
|
324
|
||||||||||
|
Nonmarketable equity securities
|
$
|
1,172
|
$
|
-
|
$
|
1,172
|
$
|
-
|
$
|
1,172
|
||||||||||
|
Interest receivable
|
$
|
4,365
|
$
|
-
|
$
|
4,365
|
$
|
-
|
$
|
4,365
|
||||||||||
|
|
||||||||||||||||||||
|
Financial Liabilities
|
||||||||||||||||||||
|
Deposits
|
$
|
905,514
|
$
|
-
|
$
|
904,928
|
$
|
-
|
$
|
904,928
|
||||||||||
|
Interest payable
|
$
|
286
|
$
|
-
|
$
|
286
|
$
|
-
|
$
|
286
|
||||||||||
|
December 31, 2019
|
||||||||||||||||||||
|
Financial Assets
|
||||||||||||||||||||
|
Cash and due from banks
|
$
|
117,128
|
$
|
117,128
|
$
|
-
|
$
|
-
|
$
|
117,128
|
||||||||||
|
Interest-bearing time deposits in other banks
|
$
|
30,147
|
$
|
-
|
$
|
30,147
|
$
|
-
|
$
|
30,147
|
||||||||||
|
Loans, net of allowance
|
$
|
699,458
|
$
|
-
|
$
|
698,698
|
$
|
1,783
|
$
|
700,481
|
||||||||||
|
Mortgage loans held for sale
|
$
|
1,031
|
$
|
-
|
$
|
1,031
|
$
|
-
|
$
|
1,031
|
||||||||||
|
Nonmarketable equity securities
|
$
|
1,100
|
$
|
-
|
$
|
1,100
|
$
|
-
|
$
|
1,100
|
||||||||||
|
Interest receivable
|
$
|
3,954
|
$
|
-
|
$
|
3,954
|
$
|
-
|
$
|
3,954
|
||||||||||
|
Financial Liabilities
|
||||||||||||||||||||
|
Deposits
|
$
|
757,483
|
$
|
-
|
$
|
757,520
|
$
|
-
|
$
|
757,520
|
||||||||||
|
Interest payable
|
$
|
636
|
$
|
-
|
$
|
636
|
$
|
-
|
$
|
636
|
||||||||||
The following methods were used to estimate the fair value of all other financial instruments recognized in the accompanying consolidated balance sheets at amounts other than fair value:
Cash and Due from Banks, Interest-Bearing Time Deposits in Other Banks, Nonmarketable Equity Securities, Interest Receivable and Interest Payable
The carrying amount approximates fair value.
Bank7 Corp.
Notes to Consolidated Financial Statements
The fair value of loans is estimated by discounting the future cash flows using the market rates at which similar loans would be made to borrowers with similar credit ratings and for the same
remaining maturities. Loans with similar characteristics were aggregated for purposes of the calculations.
Deposits
Deposits include demand deposits, savings accounts, NOW accounts and certain money market deposits. The carrying amount approximates fair value. The fair value of fixed-maturity time deposits
is estimated using a discounted cash flow calculation that applies the rates currently offered for deposits of similar remaining maturities.
Commitments to Extend Credit, Lines of Credit and Standby Letters of Credit
The fair values of unfunded commitments are estimated using the fees currently charged to enter into similar agreements, taking into account the remaining terms of the agreements and the
present creditworthiness of the counterparties. The fair values of standby letters of credit and lines of credit are based on fees currently charged for similar agreements or on the estimated cost to terminate or otherwise settle the obligations
with the counterparties at the reporting date. The estimated fair values of the Company’s commitments to extend credit, lines of credit and standby letters of credit were not material at December 31, 2020 or December 31, 2019.
| Note 16: |
Financial Instruments with Off-Balance Sheet Risk
|
The Company is a party to financial instruments with off-balance sheet risk in the normal course of business to meet the financing needs of its customers. These financial instruments include
commitments to extend credit and standby letters of credit. Those instruments involve, to varying degrees, elements of credit risk in excess of the amount recognized in the accompanying consolidated balance sheets. The following summarizes
those financial instruments with contract amounts representing credit risk as of December 31, 2020 and December 31, 2019 (dollars in thousands):
|
December 31,
2020
|
December 31,
2019
|
|||||||
|
Commitments to extend credit
|
$
|
206,520
|
$
|
191,459
|
||||
|
Financial and performance standby letters of credit
|
2,366
|
3,338
|
||||||
|
$
|
208,886
|
$
|
194,797
|
|||||
Commitments to extend credit are agreements to lend to a customer as long as there is no violation of any condition established in the contract. Each instrument generally has fixed expiration
dates or other termination clauses. Since many of the instruments are expected to expire without being drawn upon, total commitments to extend credit amounts do not necessarily represent future cash requirements. The Company evaluates each
customer’s creditworthiness on a case-by-case basis. The amount of collateral obtained, if deemed necessary, by the Company upon extension of credit is based on management’s credit evaluation of the customer. Standby letters of credit are
irrevocable conditional commitments issued by the Company to guarantee the performance of a customer to a third party. The credit risk involved in issuing letters of credit is essentially the same as that involved in extending loan facilities to
customers.
Bank7 Corp.
Notes to Consolidated Financial Statements
| Note 17: |
Significant Estimates and Concentrations
|
GAAP requires disclosure of certain significant estimates and current vulnerabilities due to certain concentrations. Estimates related to the allowance for loan losses are reflected in
Note 4
regarding loans. Current vulnerabilities due to off-balance sheet credit risk are discussed in
Note 9
.
As of December 31, 2020, hospitality loans were 23% of gross total loans with outstanding balances of $194.3 million and unfunded commitments of $65.0 million; energy loans were 12% of gross
total loans with outstanding balances of $101.9 million and unfunded commitments of $10.7 million.
The Company evaluates goodwill for potential goodwill impairment on an annual basis or more often based on consideration if any impairment indicators have occurred. A prolonged strain on the
U.S. economy impacting the Company could result in goodwill being partially or fully impaired. At December 31, 2020, goodwill of $1.0 million was recorded on the consolidated balance sheet.
| Note 18: |
Operating Leases
|
The Company leases certain of its branch facilities and office equipment under operating leases. Rental expense for these leases was $837,000, $770,000 and $596,000 for the years ended
December 31, 2020, 2019, and 2018 respectively.
Future minimum rental commitments of branch facilities and office equipment due under non-cancelable operating leases at December 31, 2020, were as follows (dollars in thousands):
|
2021
|
470
|
|||
|
2022
|
225
|
|||
|
2023
|
164
|
|||
|
2024
|
46
|
|||
|
Thereafter
|
4
|
|||
|
|
$
|
909
|
Bank7 Corp.
Notes to Consolidated Financial Statements
| Note 19: |
Parent-only Financial Statements
|
|
Condensed Balance Sheets
|
||||||||
|
Assets
|
December 31,
2020
|
December 31,
2019
|
||||||
|
|
||||||||
|
Cash and due from banks
|
$
|
302
|
$
|
296
|
||||
|
Investment in bank subsidiary
|
106,268
|
99,076
|
||||||
|
Dividends receivable
|
995
|
5,029
|
||||||
|
Goodwill
|
1,011
|
1,011
|
||||||
|
Other assets
|
-
|
-
|
||||||
|
Total assets
|
$
|
108,576
|
$
|
105,412
|
||||
|
Liabilities and Shareholders’ Equity
|
||||||||
|
Other liabilities
|
1,257
|
5,286
|
||||||
|
Total liabilities
|
1,257
|
5,286
|
||||||
|
|
||||||||
|
Total shareholders’ equity
|
107,319
|
100,126
|
||||||
|
|
||||||||
|
Total liabilities and shareholders’ equity
|
$
|
108,576
|
$
|
105,412
|
||||
Bank7 Corp.
Notes to Consolidated Financial Statements
|
Condensed Statements of Income
|
For the Years Ended December 31,
|
|||||||||||
|
2020
|
2019
|
2018
|
||||||||||
|
Income
|
||||||||||||
|
Dividends received from subsidiary bank
|
$
|
12,846
|
$
|
6,035
|
$
|
11,930
|
||||||
|
Other
|
-
|
155
|
-
|
|||||||||
|
Total Income
|
12,846
|
6,190
|
11,930
|
|||||||||
|
Expense
|
||||||||||||
|
Interest expense
|
-
|
-
|
175
|
|||||||||
|
Other
|
-
|
4
|
315
|
|||||||||
|
Total expense
|
-
|
4
|
490
|
|||||||||
|
Income and equity in undistributed net income of bank subsidiary
|
12,846
|
6,185
|
11,440
|
|||||||||
|
Equity in undistributed net income of bank subsidiary
|
6,420
|
2,040
|
13,521
|
|||||||||
|
Income before Taxes
|
19,266
|
8,225
|
24,961
|
|||||||||
|
Income tax expense
|
-
|
-
|
(39
|
)
|
||||||||
|
Net Income Available to Common Shareholders
|
$
|
19,266
|
$
|
8,225
|
$
|
25,000
|
||||||
|
Condensed Statements of Cash Flows
|
For the Years Ended December 31,
|
|||||||||||
|
2020
|
2019
|
2018
|
||||||||||
|
Operating Activities
|
||||||||||||
|
Net income
|
$
|
19,266
|
$
|
8,225
|
$
|
25,000
|
||||||
|
Items not requiring (providing) cash
|
||||||||||||
|
Equity in undistributed net income
|
(6,420
|
)
|
(2,040
|
)
|
(13,521
|
)
|
||||||
|
Dividends receivable from subsidiary bank
|
(995
|
)
|
(5,029
|
)
|
-
|
|||||||
|
Stock-based compensation expense
|
-
|
-
|
154
|
|||||||||
|
Changes in
|
||||||||||||
|
Accounts payable and accrued expenses
|
-
|
(149
|
)
|
-
|
||||||||
|
Other current assets and liabilities
|
5,034
|
-
|
199
|
|||||||||
|
Net cash provided by operating activities
|
16,885
|
1,007
|
11,832
|
|||||||||
|
Financing Activities
|
||||||||||||
|
Repayment of borrowed funds
|
-
|
-
|
(5,600
|
)
|
||||||||
|
Common stock acquired and canceled
|
(9,076
|
)
|
-
|
50,154
|
||||||||
|
Dividends paid
|
(7,803
|
)
|
(1,006
|
)
|
(56,155
|
)
|
||||||
|
Net cash used in financing activities
|
(16,879
|
)
|
(1,006
|
)
|
(11,601
|
)
|
||||||
|
Increase in Cash and Due from Banks
|
6
|
1
|
231
|
|||||||||
|
Cash and Due from Banks, Beginning of Period
|
296
|
295
|
64
|
|||||||||
|
Cash and Due from Banks, End of Period
|
$
|
302
|
$
|
296
|
$
|
295
|
||||||
|
Supplemental Disclosure of Cash Flows Information
|
||||||||||||
|
Interest paid
|
$
|
-
|
$
|
-
|
$
|
175
|
||||||
|
Dividends declared and not paid
|
$
|
995
|
$
|
5,029
|
$
|
-
|
||||||
Bank7 Corp.
Notes to Consolidated Financial Statements
| Note 20: |
Selected Quarterly Financial Data (Unaudited)
|
The following tables summarize the unaudited condensed results of operations for each of the quarters during the fiscal years ended December 31, 2020 and 2019:
|
For the three months ended
|
||||||||||||||||
|
|
March 31,
2020
|
June 30,
2020
|
September 30,
2020
|
December 31,
2020
|
||||||||||||
|
Net interest income
|
$
|
11,432
|
$
|
11,929
|
$
|
11,601
|
$
|
12,199
|
||||||||
|
Provision for loan losses
|
650
|
1,400
|
1,250
|
2,050
|
||||||||||||
|
Noninterest income
|
330
|
301
|
334
|
700
|
||||||||||||
|
Noninterest expense
|
4,353
|
4,123
|
4,584
|
4,532
|
||||||||||||
|
Income before income taxes
|
6,759
|
6,707
|
6,101
|
6,317
|
||||||||||||
|
Income tax expense
|
1,708
|
1,671
|
1,661
|
1,578
|
||||||||||||
|
Net income
|
$
|
5,051
|
$
|
5,036
|
$
|
4,440
|
$
|
4,739
|
||||||||
|
EPS
|
||||||||||||||||
|
Basic
|
$
|
0.51
|
$
|
0.54
|
$
|
0.48
|
$
|
0.52
|
||||||||
|
Diluted
|
$
|
0.51
|
$
|
0.54
|
$
|
0.48
|
$
|
0.52
|
||||||||
|
For the three months ended
|
||||||||||||||||
|
March 31,
2019
|
June 30,
2019
|
September 30,
2019
|
December 31,
2019
|
|||||||||||||
|
Net interest income
|
$
|
10,353
|
$
|
10,583
|
$
|
10,600
|
$
|
10,657
|
||||||||
|
Provision for loan losses
|
-
|
-
|
-
|
-
|
||||||||||||
|
Noninterest income
|
223
|
295
|
509
|
281
|
||||||||||||
|
Noninterest expense
|
3,755
|
4,048
|
16,072
|
4,557
|
||||||||||||
|
Income (loss) before income taxes
|
6,821
|
6,830
|
(4,963
|
)
|
6,381
|
|||||||||||
|
Income tax expense
|
1,705
|
1,704
|
1,556
|
1,879
|
||||||||||||
|
Net income (loss)
|
$
|
5,116
|
$
|
5,126
|
$
|
(6,519
|
)
|
$
|
4,502
|
|||||||
|
EPS
|
||||||||||||||||
|
Basic
|
$
|
0.50
|
$
|
0.50
|
$
|
(0.64
|
)
|
$
|
0.45
|
|||||||
|
Diluted
|
$
|
0.50
|
$
|
0.50
|
$
|
(0.64
|
)
|
$
|
0.45
|
|||||||
Item 9. Changes in and Disagreements with Accountants on Accounting and Financial Disclosure
None.
Item 9A. Controls and Procedures
Evaluation of Disclosure
|
|
a) |
Controls and Procedures
|
Management of the Company, with the participation of its Chief Executive Officer and Chief Financial Officer, conducted an evaluation of the effectiveness as of December 31, 2020 of
the Company’s disclosure controls and procedures, as defined Rules 13a-15(e) and 15d-15(e) under the Exchange Act. In designing and evaluating the disclosure controls and procedures, management recognizes that any controls and procedures, no matter
how well designed and operated, can provide only reasonable assurance of achieving the desired control objectives, and management was required to apply judgment in evaluating its controls and procedures. Based on this evaluation, the Company’s Chief
Executive Officer and Chief Financial Officer concluded that the Company’s disclosure controls and procedures were effective as of the end of the fiscal quarter covered by this Form 10-K.
|
|
b) |
Management’s Annual Report on Internal Control over Financial Reporting
|
This annual report does not include a management’s report regarding internal control over financial reporting due to a transition period established by rules of the Securities and
Exchange Commission for newly public companies.
|
|
c) |
Attestation Report of the Independent Registered Public Accounting Firm
|
Not applicable because the Company is an emerging growth company.
|
|
d) |
Changes in Internal Control Over Financial Reporting
|
There were no significant changes made in the Company’s internal control over financial reporting during the fourth quarter of the year ended December 31, 2020 that has materially
affected, or is reasonably likely to materially affect, the Company’s internal control over financial reporting.
Item 9B. Other Information
None.
PART III
The information required by this Item is incorporated herein by reference to the Proxy Statement (Schedule 14A) for its 2021 Annual Meeting of Shareholders to be filed with the
SEC within 120 days of our fiscal year-end.
The information required by this Item is incorporated herein by reference to the Proxy Statement (Schedule 14A) for its 2021 Annual Meeting of Shareholders to be filed with the
SEC within 120 days of our fiscal year-end.
Item 12. Security Ownership of Certain Beneficial Owners and Management and Related Stockholder Matters
The information required by this Item is incorporated herein by reference to the Proxy Statement (Schedule 14A) for its 2021 Annual Meeting of Shareholders to be filed with the
SEC within 120 days of our fiscal year-end.
The information required by this Item is incorporated herein by reference to the Proxy Statement (Schedule 14A) for its 2021 Annual Meeting of Shareholders to be filed with the
SEC within 120 days of our fiscal year-end.
The information required by this Item is incorporated herein by reference to the Proxy Statement (Schedule 14A) for its 2021 Annual Meeting of Shareholders to be filed with the
SEC within 120 days of our fiscal year-end.
PART IV
Financial Statements
See index to Consolidated Financial Statements on page 55.
Financial Statement Schedules
Financial statement schedules have been omitted because they are not applicable or not required or the required information is shown in the Consolidated Financial Statements or
Notes thereto under “Part II — Item 8. Financial Statements and Supplementary Data.”
Exhibits
|
|
Amended and Restated Certificate of Incorporation of Bank7 Corp.(1)
|
|
|
|
Amended and Restated Bylaws of Bank7 Corp.(2)
|
|
|
|
Specimen Common Stock Certificate of Bank7 Corp.(3)
|
|
|
Description of Common Stock Securities Registered Pursuant to Section 12 of the Exchange Act of 1934(4)
|
|
Form of Indenture for Senior Debt Securities(5)
|
||
|
Form of Indenture for Subordinated Debt Securities(6)
|
||
|
|
Form of Tax Sharing Agreement(7)
|
|
|
|
Bank7 Corp. 2018 Equity Incentive Plan(8)
|
|
|
10.2.1
|
First Amendment to Bank7 Corp. 2018 Equity Incentive Plan(9)
|
|
|
|
Form of Stock Option award Agreement under the Bank7 Corp. 2018 Equity Incentive Plan(10)
|
|
|
|
Form of Restricted Stock Unit Award Agreement under the Bank7 Corp. 2018 Equity Incentive Plan(11)
|
|
|
|
Form of Indemnification Agreement(12)
|
|
|
|
Form of Registration Rights Agreement(13)
|
|
|
|
Subsidiaries of Bank7 Corp.
|
|
|
|
Consent of Independent Registered Public Accounting Firm
|
|
|
|
Certification of Chief Executive Officer pursuant to Section 302 of the Sarbanes-Oxley Act of 2002
|
|
|
|
Certification of Principal Financial Officer pursuant to Section 302 of the Sarbanes-Oxley Act of 2002
|
|
|
|
Certification of Chief Executive Officer and Principal Financial Officer pursuant to Section 906 of the Sarbanes-Oxley Act of 2002
|
|
|
101
|
|
Interactive data files from the Company's Annual Report on Form 10-K for the year ended December 31, 2020: (i) Consolidated Balance Sheets, (ii) Consolidated Statements of Operations, (iii) Consolidated
Statement of Changes in Shareholders' Equity, (iv) Consolidated Statements of Cash Flows and (v) Notes to Consolidated Financial Statements.
|
| (1) |
Incorporated by reference to Exhibit 3.1 to the Registration Statement on Form S-1 filed with the Securities and Exchange Commission on August 24, 2018 (File No. 333-227010).
|
| (2) |
Incorporated by reference to Exhibit 3.2 to the Registration Statement on Form S-1 filed with the Securities and Exchange Commission on August 24, 2018 (File No. 333-227010).
|
| (3) |
Incorporated by reference to Exhibit 4.1 to the Registration Statement on Form S-1/A filed with the Securities and Exchange Commission on September 10, 2018 (File No. 333-227010).
|
| (4) |
Incorporated by reference to Exhibit 4.2 to the Annual Report on Form 10-K for the fiscal year ended December 31, 2019 filed with the Securities and Exchange Commission on March 30, 2020.
|
| (5) |
Incorporated by reference to Exhibit 4.3 to the Registration Statement on Form S-3 filed with the Securities and Exchange Commission on November 16, 2020.
|
| (6) |
Incorporated by reference to Exhibit 4.4 to the Registration Statement on Form S-3 filed with the Securities and Exchange Commission on November 16, 2020.
|
| (7) |
Incorporated by reference to Exhibit 10.1 to the Registration Statement on Form S-1 filed with the Securities and Exchange Commission on August 24, 2018 (File No. 333-227010).
|
| (8) |
Incorporated by reference to Exhibit 10.2 to the Registration Statement on Form S-1/A filed with the Securities and Exchange Commission on September 10, 2018 (File No. 333-227010).
|
| (9) |
Incorporated by reference to Appendix A to the Registrant Proxy Statement for its 2020 Annual Meeting of Shareholders filed with the Securities and Exchange Commission on March 31, 2020.
|
| (10) |
Incorporated by reference to Exhibit 10.3 to the Registration Statement on Form S-1/A filed with the Securities and Exchange Commission on September 10, 2018 (File No. 333-227010).
|
| (11) |
Incorporated by reference to Exhibit 10.4 to the Registration Statement on Form S-1/A filed with the Securities and Exchange Commission on September 10, 2018 (File No. 333-227010).
|
| (12) |
Incorporated by reference to Exhibit 10.5 to the Registration Statement on Form S-1/A filed with the Securities and Exchange Commission on September 10, 2018 (File No. 333-227010).
|
| (13) |
Incorporated by reference to Exhibit 10.4 to the Registration Statement on Form S-1 filed with the Securities and Exchange Commission on August 24, 2018 (File No. 333-227010).
|
None.
Pursuant to the requirements of Section 13 of the Securities Exchange Act of 1934, the Company has duly caused this report to be signed on its behalf by the undersigned,
thereunto duly authorized.
|
Bank7 Corp.
|
|||
|
Date: March 25, 2021
|
By:
|
/s/ Thomas L. Travis
|
|
|
Thomas L. Travis
|
|||
|
President and Chief Executive Officer
|
|||
|
(Principal Executive Officer)
|
|||
|
By:
|
/s/ Kelly J. Harris
|
||
|
Kelly J. Harris
|
|||
|
Senior Vice President and Chief Financial Officer
|
|||
|
(Principal Financial and Accounting Officer)
|
|||
Pursuant to the requirements of the Securities Exchange of 1934, this report has been signed below by the following persons on behalf of the Registrant and in the capacities and
on the dates indicated.
|
Signatures
|
Title
|
Date
|
|
|
|
|||
|
/s/ William B. Haines
|
Director; Chairman
|
March 25, 2021
|
|
|
William B. Haines
|
|||
|
/s/ Thomas L. Travis
|
Director; President and Chief Executive Officer (Principal Executive Officer)
|
March 25, 2021
|
|
|
Thomas L. Travis
|
|
|
|
|
/s/ Charles W. Brown
|
Director
|
March 25, 2021
|
|
|
Charles W. Brown
|
|
|
|
|
/s/ William M. Buergler
|
Director
|
March 25, 2021
|
|
|
William M. Buergler
|
|
|
|
|
/s/ John T. Phillips
|
Director
|
March 25, 2021
|
|
|
John T. Phillips
|
|
|
|
|
/s/ Gary D. Whitcomb
|
Director
|
March 25, 2021
|
|
|
Gary D. Whitcomb
|
|
|
|
|
/s/ J. Michael Sanner
|
Director
|
March 25, 2021
|
|
|
J. Michael Sanner
|
|
|
|
TABLE OF CONTENTS
Item 1. BusinessItem 1A. Risk FactorsItem 1B. Unresolved Staff CommentsItem 2. PropertiesItem 3. Legal ProceedingsItem 4. Mine Safety DisclosuresPart IIItem 5. Market For Registrant S Common Equity, Related Stockholder Matters and Issuer Purchases Of Equity SecuritiesItem 6. Selected Financial DataItem 7. Management S Discussion and Analysis Of Financial Condition and Results Of OperationsItem 7A. Quantitative and Qualitative Disclosures About Market RiskItem 8. Financial Statements and Supplementary DataNote 1: Nature Of Operations and Summary Of Significant Accounting PoliciesNote 2: Change in Capital StructureNote 3: Restriction on Cash and Due From BanksNote 4: Earnings Per ShareNote 5: Loans and Allowance For Loan LossesNote 6: Premises and EquipmentNote 7: Intangible AssetsNote 8: Interest-bearing DepositsNote 9: Income TaxesNote 10: Letters Of CreditNote 11: Advances and BorrowingsNote 12: Shareholders EquityNote 13: Related-party TransactionsNote 14: Employee BenefitsNote 15: Disclosures About Fair Value Of Assets and LiabilitiesNote 16: Financial Instruments with Off-balance Sheet RiskNote 17: Significant Estimates and ConcentrationsNote 18: Operating LeasesNote 19: Parent-only Financial StatementsNote 20: Selected Quarterly Financial Data (unaudited)Item 9. Changes in and Disagreements with Accountants on Accounting and Financial DisclosureItem 9A. Controls and ProceduresItem 9B. Other InformationPart IIIItem 10. Directors, Executive Officers and Corporate GovernanceItem 11. Executive CompensationItem 12. Security Ownership Of Certain Beneficial Owners and Management and Related Stockholder MattersItem 13. Certain Relationships and Related Transactions, and Director IndependenceItem 14. Principal Accounting Fees and ServicesPart IVItem 15. Exhibits, Financial Statement SchedulesItem 16. Form 10-k Summary