BTCS INC.
10-Ks and 10-Qs
|
|
|
|
|
|
|
|
|
|
|
|
|
|
UNITED STATES
SECURITIES AND EXCHANGE COMMISSION
Washington, D.C. 20549
FORM 10-K
|
[X]
|
ANNUAL REPORT PURSUANT TO SECTION 13 OR 15(d) OF THE SECURITIES EXCHANGE ACT OF 1934
For the fiscal year ended December 31, 2013
|
or
|
[ ]
|
TRANSITION REPORT UNDER SECTION 13 OR 15(d) OF THE SECURITIES EXCHANGE ACT OF 1934
For the transition period from _____________ to ______________
|
Commissions file number 000-55141
BITCOIN SHOP, INC.
(Exact name of registrant as specified in its charter)
|
Nevada
|
26-2477977
|
|
|
(State or other jurisdiction of
Incorporation or organization)
|
(I.R.S. Employer
Identification No.)
|
|
10020 Raynor Rd.
Silver Spring, Maryland
|
20901
|
|
|
(Address of principal executive offices)
|
(Zip Code)
|
Registrant’s telephone number, including area code (
202) 430-6576
Securities registered under Section 12(b) of the Exchange Act:
None.
|
Title of each class
|
Name of each exchange on
which registered
|
Securities registered under Section 12(g) of the Exchange Act:
Common Stock, $0.001 par value
(Title of class)
Indicate by check mark if the registrant is a well-known seasoned issuer, as defined in Rule 405 of the Securities Act Yes [ ] No [X]
Indicate by check mark if the registrant is not required to file reports pursuant to Section 13 or 15(d) of the Act.
Yes [ ] No [X]
Indicate by check mark whether the registrant (1) filed all reports required to be filed by Section 13 or 15(d) of the Securities Exchange Act of 1934 during the preceding 12 months (or for such shorter period that the registrant was required to file such reports), and (2) has been subject to such filing requirements for the past 90 days. Yes [X] No [ ]
Indicate by check mark whether the registrant has submitted electronically and posted on its corporate Website, if any, every Interactive Data File required to be submitted and posted pursuant to Rule 405 of Regulation S-T (§232.405 of this chapter) during the preceding 12 months (or for such shorter period that the registrant was required to submit and post such files). Yes [X] No [ ]
Indicate by check mark if disclosure of delinquent filers in response to Item 405 of Regulation S-K (§229.405 of this chapter) is not contained herein, and will not be contained, to the best registrant’s knowledge, in definitive proxy or information statements incorporated by reference in Part III of this Form 10-K or any amendments to this From 10-K.
Indicate by check mark whether the registrant is a large accelerated filer, an accelerated filer, a non-accelerated filer, or a smaller reporting company. See definitions of “large accelerated filer,” “accelerated filer” and “smaller reporting company” in Rule 12b-2 of the Exchange Act.
| Large accelerated filer | [ ] | Accelerated filer | [ ] |
|
Non-accelerated filer
(Do not check if a smaller reporting company)
|
[ ]
|
Smaller reporting company
|
[X]
|
Indicate by check mark whether the registrant is a shell company (as defined in Rule 12b-2 of the Act). Yes [ ] No [X]
State the aggregate market value of the voting and non-voting common equity held by non-affiliates computed by reference to the price at which the common equity was sold, or the average bid and asked price of such common equity, as of the last business day of the registrant’s most recently completed second fiscal quarter
As of June 30, 2013, the aggregate market value of voting stock held by non-affiliates of the registrant, based on the closing sales price of Common Stock on the Over the Counter Bulletin Board on June 28, 2013 ($0.002), was approximately $182,000. As of March 26, 2014, the registrant had 124,440,204 shares of Common Stock outstanding.
TABLE OF
CONTENTS
|
Page
|
||||
| 1 | ||||
| 2 | ||||
| 9 | ||||
| 25 | ||||
| 25 | ||||
| 25 | ||||
| 26 | ||||
| 26 | ||||
| 27 | ||||
| 27 | ||||
| 34 | ||||
| 34 | ||||
| 34 | ||||
| 35 | ||||
| 36 | ||||
| 37 | ||||
| 37 | ||||
| 40 | ||||
| 44 | ||||
| 44 | ||||
| 45 | ||||
| 46 | ||||
| 46 | ||||
BITCOIN SHOP, INC.
FORWARD LOOKING STATEMENTS
This Annual Report contains forward-looking statements. Forward-looking statements are projections of events, revenues, income, future economic performance or management’s plans and objectives for our future operations. In some cases, you can identify forward-looking statements by terminology such as “may”, “should”, “expects”, “plans”, “anticipates”, “believes”, “estimates”, “predicts”, “potential” or “continue” or the negative of these terms or other comparable terminology. These statements are only predictions and involve known and unknown risks, uncertainties and other factors, including the risks in the section entitled “Risk Factors” and the risks set out below, any of which may cause our or our industry’s actual results, levels of activity, performance or achievements to be materially different from any future results, levels of activity, performance or achievements expressed or implied by these forward-looking statements. These risks include, by way of example and not in limitation:
-
The uncertainty of profitability based upon our history of losses;
-
Risks related to failure to obtain adequate financing on a timely basis and on acceptable terms to continue as going concern; and
-
Other risks and uncertainties related to our business plan and business strategy.
This list is not an exhaustive list of the factors that may affect any of our forward-looking statements. These and other factors should be considered carefully and readers should not place undue reliance on our forward-looking statements. Forward looking statements are made based on management’s beliefs, estimates and opinions on the date the statements are made and we undertake no obligation to update forward-looking statements if these beliefs, estimates and opinions or other circumstances should change. Although we believe that the expectations reflected in the forward-looking statements are reasonable, we cannot guarantee future results, levels of activity, performance or achievements. Except as required by applicable law, including the securities laws of the United States we do not intend to update any of the forward-looking statements to conform these statements to actual results.
Our financial statements are stated in United States dollars (US$) and are prepared in accordance with United States Generally Accepted Accounting Principles. All references to “common stock” refer to the common shares in our capital stock.
As used in this annual report, the terms “we”, “us”, “our”, and the “Company” mean Bitcoin Shop, Inc. and its subsidiaries, unless otherwise indicated.
General
Bitcoin Shop, Inc.
f/k/a
Touchit Technologies, Inc. (the “Company” or “we”), was incorporated in the State of Nevada as “Hotel Management Systems, Inc.” (“HMSI”) in 2008. On May 7, 2010, the Company entered into a Share Exchange Agreement with TouchIT Technologies Koll Sti (“TouchIT Tech KS”), the stockholders of TouchIT Tech KS, TouchIT Education Koll Sti (“TouchIT Ed”), and the stockholders of TouchIT Ed whereby HMSI effectively ceased doing business as HMSI. Both TouchIT Tech KS and TouchIT Ed are corporations formed under the laws of Turkey and are based in Istanbul, Turkey. Historically, the Company has operated as a manufacturer of a large range of touch screen and touch board products to suit all types of application from small interactive whiteboard displays to large liquid crystal display (“LCD”) touch-screens and Light Emitting Diode (“LED”) displays. On February 5, 2014, the Company entered into an exchange agreement with BitcoinShop.us, LLC a Maryland Limited Liability Company (“BitcoinShop”), and the holders of the membership interests of BitcoinShop. Upon consummation of the Share Exchange (as defined below), the Company is now solely in the business of hosting an online presence whereby third party vendors can sell merchandise and consumers can purchase such merchandise using virtual currencies such as Bitcoin. On February 5, 2014 Company entered into an Asset Purchase and Debt Assumption Agreement with Touchit Technologies Holdings, Inc. pursuant to which it sold all of its rights, title and interest in and to those certain assets relating to the technology products under TouchIT Technologies™ in consideration for Touchit Technologies Holdings, Inc.’s agreement to assume and be solely responsible for satisfying the debt and obligations associated with the debts and liabilities reflected on the audited and/or reviewed financial statements of the Company immediately prior to the Share Exchange. Accordingly, we discontinued our prior operations as a manufacturer of touch based visual communication products.
Recent Updates
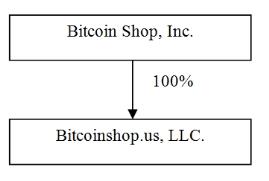
On February 5, 2014, the Company entered into a Securities Exchange Agreement (the “Exchange Agreement”) with BitcoinShop and the holders of the membership interests in BitcoinShop. Upon closing of the transaction contemplated under the Exchange Agreement (the “Share Exchange”), on February 5, 2014, the holders of BitcoinShop’s outstanding membership interests (the “BitcoinShop Members”) transferred all the outstanding membership interests of BitcoinShop to the Company in exchange for an aggregate of 100,773,923 shares of the Company’s common stock. As a result, BitcoinShop became a wholly-owned subsidiary of the Company.
Pursuant to the Share Exchange:
|
■
|
At the closing of the Share Exchange, all of the membership interests of BitcoinShop outstanding immediately prior to the closing of the Share Exchange was exchanged for the right to receive an aggregate of 100,773,923 shares of the Company’s common stock. Concurrently, all members of BitcoinShop executed Lock-Up Agreements pursuant to which they agreed to refrain from the sale of any securities of the Company, including the shares received by them as a result of the Share Exchange, for a period of eighteen (18) months. The lockup agreement provides for a leak out provision, allowing the shareholder the right to sell 5% of its holdings in the Company per month beginning on the twelve month anniversary of the lockup agreement.
|
|
|
■
|
Upon the closing of the Share Exchange, Andrew Brabin resigned from all officer and director positions he held with the Company and Charles W. Allen was appointed Chief Executive Officer and Chief Financial Officer, Michal Handerhan was appointed Chief Operating Officer and Chairman of the Board, Timothy Sidie was appointed as Chief Technology Officer and Charles A. Kiser was appointed Chief Marketing Officer of the Company. In addition, Michal Handerhan (Chairman), Timothy Sidie and Charles W. Allen were appointed to the Company's Board of Directors.
|
|
■
|
Following the closing of the Share Exchange, the Company consummated a private placement of units of its securities at a purchase price of $0.50 per unit with each unit consisting of (i) one share of the Company’s Series C Convertible Preferred Stock, par value $0.001 per share, which is convertible into one (1) share of common stock and (ii) a three year warrant to purchase ½ share of common stock at an exercise price of $1.00 per share.
|
On February 6, 2014, the Company sold an aggregate of 3,750,000 units in a private placement (the “Private Placement”) of its securities to certain investors at a purchase price of $0.50 per unit pursuant to subscription agreements for an aggregate purchase price of $1,875,000. The units sold in the Private Placement are subject to a “Most Favored Nations” provision for a period of 12 months from the closing of the Private Placement in the event the Company issues common stock or securities convertible into or exercisable for shares of common stock at a price per share or conversion or exercise price per share which shall be less than $0.50 per share, subject to certain customary exceptions. Additionally, the shares of common stock issuable upon conversion of Series C Preferred Stock and common stock issuable upon exercise of the warrants are subject to “piggy-back” and “demand” registration rights until such shares of Common Stock may be sold under Rule 144 under the Securities Act of 1933, as amended (the “Securities Act”). Each share of the Series C Preferred Stock is convertible into one (1) share of common stock and has a stated value of $0.001. The conversion ratio is subject to adjustment in the event of stock splits, stock dividends, combination of shares and similar recapitalization transactions. The Company is prohibited from effecting the conversion of the Series C Preferred Stock to the extent that, as a result of such conversion, the holder beneficially owns more than 4.99% (subject to increase to 9.99% on 61 days’ written notice), in the aggregate, of the issued and outstanding shares of the Company’s Common Stock calculated immediately after giving effect to the issuance of shares of Common Stock upon the conversion of the Series C Preferred Stock. Each share of the Series C Preferred Stock is entitled to the number of votes equal to the number of shares of common stock such share is convertible into at such time, but not in excess of the beneficial ownership limitation. Each warrant is exercisable into ½ share of common stock at an exercise price of $1.00 per share. The warrant may be exercised on a cashless basis. The Company is prohibited from effecting the exercise of warrant to the extent that, as a result of such exercise, the holder beneficially owns more than 4.99%, in the aggregate, of the issued and outstanding shares of the Company’s common stock calculated immediately after giving effect to the issuance of shares of common stock upon the exercise of the warrant.
Amended and Restated Convertible Notes
On January 24, 2014, the Company’s Board of Directors authorized and approved the amendment and restatement of the convertible promissory notes originally issued to BASE Group LLC (“BASE”) on May 7, 2010 in the principal amount of $400,000 and the convertible promissory notes originally issued to Denville and Dover Fund LLC (D&D) on May 10, 2010 in the principal amount of $100,000. On January 24, 2014, BASE and D&D entered in note purchase agreement with various assignees pursuant to which BASE and D&D assigned a portion of their right, title and interest in each of their respective convertible notes to such assignees. Thereafter, in accordance with the governing purchase agreements, the Company issued amended and restated convertible notes to the assignees of the convertible notes originally held by BASE and D&D on January 24, 2014.
D&D Exchange Agreements
On February 5, 2014, the Company entered into exchange agreements with D&D and the assignees of the D&D convertible note (the D&D Amended and Restated Notes”), pursuant to which the Company exchanged the outstanding principal balance of the respective D&D Amended and Restated Notes into shares of common stock of the Company. Therefore, in accordance with the terms and provisions of each of the exchange agreements, the Company issued an aggregate of 10,000,000 post – reverse split shares of its common stock to the holders of the D&D Amended and Restated Notes.
BASE Exchange Agreements
On February 5, 2014, the Company entered into exchange agreements with the assignees of the BASE convertible note (the “BASE Amended and Restated Notes”), pursuant to which the Company exchanged the outstanding principal balance of the respective BASE Amended and Restated Notes into shares of Series B Convertible Preferred Stock of the Company. Therefore, in accordance with the terms and provisions of each of the exchange agreements, the Company issued an aggregate of 400,000 shares of its Series B Convertible Preferred Stock to the holders of the BASE Amended and Restated Notes.
2014 Equity Incentive Plan
On January 30, 2014, the Board of Directors of the Company approved and authorized the adoption of the 2014 Equity Incentive Plan (the “2014 Plan”). The purpose of the 2014 Plan is to promote the success of the Company and to increase stockholder value by providing an additional means through the grant of awards to attract, motivate, retain and reward selected employees and other eligible persons. The 2014 Plan provides for the grant of incentive stock options, nonqualified stock options, restricted stock, restricted stock units, stock appreciation rights and other types of stock-based awards to the Company’s employees, officers, directors and consultants. Pursuant to the terms of the 2014 Plan, either the Board or a board committee is authorized to administer the plan, including by determining which eligible participants will receive awards, the number of shares of common stock subject to the awards and the terms and conditions of such awards. Unless earlier terminated by the Board, the Plan shall terminate at the close of business on January 30, 2024. Up to 15,503,680 shares of common stock are issuable pursuant to awards under the 2014 Plan.
Novation Agreement
On January 30, 2014, the Board of Directors authorized and approved a novation agreement (the "Novation Agreement") by and among the Company, as the original buyer, Sahara Presentation Systems PLC, as the vendor (the "Vendor"), and Touchit Technologies Holdings Inc., as the new buyer (the "New Buyer"), relating to a debt in the amount of $221,138.56 (the "Debt") due and owing by the company to the Vendor as evidenced in the audited and/or reviewed financial statements of the Company for fiscal year end December 31, 2012 and September 30, 2013, respectively. The Novation Agreement provides that the Company and the New Buyer have agreed that the rights and obligations of the Company under said Debt shall be assumed by the New Buyer and the New Buyer shall be substituted for the Company as the buyer under the Debt, and the Vendor shall agree to such substitution.
Effective January 22, 2014, Board of Directors of the Company and the majority shareholders of the Company, approved an amendment to the articles of incorporation to change the name of the Company to "Bitcoin Shop Inc.". The Amendment was filed with the Secretary of State of Nevada on January 30, 2014 changing the name of the Company to "Bitcoin Shop Inc." Additionally, on January 22, 2014, the Company’s Board of Directors and the majority shareholders of the Company approved a reverse split of the Company’s issued and outstanding common stock on a one for three hundred (1:300) basis. The reverse split was effective as of February 5, 2014. All per share amounts set forth herein take into account the reverse split. On March 5, 2014, in connection with the Company’s name change, the Company’s trading symbol changed from “TUCN” to “BTCS”.
Description of Business
GLOSSARY OF DEFINED TERMS
In this Annual Report, each of the following quoted terms has the meanings set forth after such term:
“Bitcoin”—A type of a Digital Math-Based Asset based on an open source math-based protocol existing on the Bitcoin Network and utilizing cryptographic security.
“Bitcoin Exchange”—An electronic marketplace where exchange participants may trade, buy and sell Bitcoins based on bid-ask trading.
“Bitcoin Exchange Market”—The global Bitcoin exchange market for the trading of Bitcoins, which consists of transactions on electronic Bitcoin Exchanges.
“Bitcoin Network”—The online, end-user-to-end-user network hosting the public transaction ledger, known as the Blockchain, and the source code comprising the basis for the math-based protocols and cryptographic security governing the Bitcoin Network.
“Blockchain”—The public transaction ledger of the Bitcoin Network on which miners or Mining pools solve algorithmic equations allowing them to add records of recent transactions (called “blocks”) to the chain of transactions in exchange for an award of Bitcoins from the Bitcoin Network and the payment of transaction fees, if any, from users whose transactions are recorded in the block being added.
“Cryptocurrency,”—Currency that uses cryptography for security.
“Digital Math-Based Assets”—Collectively, all digital assets based upon a computer-generated math-based and/or cryptographic protocol that may, among other things, be used to buy and sell goods or pay for services. Bitcoins represent one type of Digital Math-Based Asset.
“FinCEN”—The Financial Crimes Enforcement Network, a bureau of the US Department of the Treasury.
“Fiat Currency” — Currency that a government has declared to be legal tender, but is not backed by a physical commodity. The value of fiat money is derived from the relationship between supply and demand rather than the value of the material that the money is made of.
“Mining”—The process by which Bitcoins are created involving programmers solving complex math problems with the computers in the Bitcoin Network.
Industry and Market Overview (Overview of Bitcoin)
Bitcoins are a digital or virtual currency that use peer-to-peer technology to facilitate instant payments. A Bitcoin is a type of alternative currency known as a cryptocurrency, which uses cryptography for security. Bitcoin issuance and transactions are carried out collectively by the network, with no central authority, and allow users to make verified transfers. Bitcoin is an accepted form of payment by a growing, but still limited number of businesses, while governments and regulators are beginning to create more regulation and structure to legitimize it as a currency.
The total number of Bitcoins that will be issued is capped at 21 million to ensure they are not devalued by limitless supply. They are divisible to 8 decimal places. Bitcoins exist only in digital form and can be bought with traditional currency through exchanges. Users store their Bitcoins in a digital wallet, while transactions are verified by a digital signature known as a public-encryption key. The first Bitcoin specification and proof-of-concept was published in 2009 by an individual or individuals under the pseudonym Satoshi Nakamoto. Bitcoins are created through a “mining” process that involves programmers solving complex math problems with the computers in this network. This process currently creates 25 Bitcoins every 10 minutes. The limit of 21 million is expected to be reached in the year 2140, after which the total number of Bitcoins will remain unchanged.
Bitcoin Shop, Inc.
BitcoinShop was formed on July 28, 2013 as a Maryland limited liability company and launched its ecommerce website in August 2013.
The Company intends to list merchandise for customers to purchase with virtual currencies, primarily Bitcoin. Similar to other online retailers with solely an online presence, such as Amazon, eBay, or Rakuten, customers experience a traditional browse and checkout process, the major difference being able to pay with virtual currencies at checkout instead of Fiat Currency. Vendors can supply inventory information via private API access or traditional inventory management systems, and are paid in USD. The Company exists primarily as a medium between consumers wishing to spend Bitcoin and sellers wishing to receive sales driven by Bitcoin.
The online presence that the Company operates is hosted, maintained, and developed by the Company. We have developed software that allows us to interface with vendors in order to display up-to-date inventory, and present prices in Bitcoin according to the exchange rate from USD. The exchange rate is updated every 1 minute and at each stage of the checkout process, when customers reach the checkout page the exchange rate is locked in by our payment processor for 15 minutes and they assume the currency exchange risk.
The Company, through its ecommerce website, currently lists over 140,000 products for sale, however, we do not have any inventory and we seek to oversee the fulfillment process through delivery but are not a part of the logistics chain. We charge our customers a processing fee and an operational margin on transactions. Revenue generated in Bitcoins from our sales are converted to U.S. dollars to settle with our vendors. Our payment processor allows us to select a ratio of cash versus Bitcoins for our account. We set this ratio so that approximately 80% of our gross profit is converted to cash and the remaining 20% is retained in Bitcoins. This 20% ratio is not an exact number as the margin we receive varies by product. Further our payment processor only has knowledge of one side of the transactions i.e. the Bitcoins being received by the Company. Management may elect to change this ratio from time to time.
The Company’s business strategy is to become a leading virtual currency marketplace where consumers and sellers of products and services can use any virtual currency to transact business. We focus on delivering value and convenience to our online customers while providing a reliable and scalable platform for vendors and sellers.
The Company will also evaluate other strategic Bitcoin opportunities as well as technologies that are complementary to its business strategy in an effort to minimize risks and drive shareholder value. This will include evaluating opportunities that cross market our e-commerce site, diversify our revenue streams and provide on-ramps for new users.
Corporate Structure:
Our current corporate structure is set forth below:
Consumers:
Customers access our website through the web and mobile devices. We place orders on behalf of our customers and oversee the fulfillment process through delivery. We support these transactions with strong customer service.
Vendors and Distributors:
We have consented to the terms of service of our current vendor and plan to enter agreements with other vendors and distributors to offer products for sale on our site. We are not the seller of record in these transactions, but instead earn a combination of processing fees and operational margin on the transactions. We use payment processers to manage the conversion of the virtual currency into the desired currency acceptable to the vendor, and we remit the final payment to the vendor or distributor. We manage the product data import into our platform on behalf of the vendor by leveraging both APIs (application programming interfaces) that allow fast and accurate integration between our online platform and their inventory and product category information, along with leveraging traditional product inventory management systems.
Competition
The virtual currency ecommerce ecosystem is in its infancy so there are currently few direct online retailers who offer a platform similar to ours. Our current and future competition is centered on the following areas:
1) Vendors and retailers that choose to accept virtual currencies at their branded websites and affiliate sellers websites;
2) Physical “brick and mortar” locations, distributors, vendors and manufacturers that sell products and accept virtual currencies as payment;
3) Other mobile applications, websites, shopping sites, niche aggregation sites, private sale sites and group buying sites that sell or distribute products in exchange for virtual currency; and
4) Virtual currency companies that offer exchange, payment processing, remittance, money transmission service, and financial services that enable consumers or vendors to exchange or improve the acceptance of virtual currency in online or physical consumer/seller transactions.
The main competitive factor which we believe drives our customers’ online shopping decisions center around our ability to accept virtual currency and provide a wide selection of products and a convenient shopping experience with a focus on quality customer service. Many of our current and potential competitors have greater resources, longer histories, more customers, and greater brand recognition. They may secure better terms from suppliers, adopt more aggressive pricing, and devote more resources to technology, infrastructure, fulfillment, and marketing. Other companies also may enter into business combinations or alliances that strengthen their competitive positions.
Intellectual Property and Trade Secrets
Our trademark (in application), domain names, and proprietary technology are needed for us to remain competitive and we rely on trademark, copyright, patent law, trade-secret protection, and confidentiality and/or license agreements with our employees, customers, partners, and others to protect our proprietary rights. We have registered, or applied for the registration of, a number of U.S. and international domain names, and trademarks.
On January 2, 2014 the Company applied for a trademark of “BitcoinShop” with the United States Patent and
Trademark Office and the application is still in process.
Technology
We use third party open source platforms as well as internally developed tools to operate our website, and a combination of proprietary technologies and commercially available licensed technologies and solutions to support our operations.
Seasonality
Based on comparable and established ecommerce trends we expect our business will be affected by seasonality throughout the year with increased growth in the fourth fiscal quarter. Due to our short operating history we are unable to determine if our current growth is due to our general business operations, or was attributable to year-end holiday shopping patterns. However we expect this pattern may repeat in the future based on comparisons to established ecommerce marketplaces and traditional “brick and mortar” stores.
Growth Strategy
We plan on focusing on three core areas: growing revenue, improving margin and building competitive differentiators. We anticipate that growing revenue will consist of both generating sales from our existing customer base and increasing site traffic and acquiring new customers. In addition to site traffic, we plan on increasing the selection and categories of products offered to include higher per transaction sales that result in higher revenue and margin per transaction. We intend to leverage our corporate structure and our access to the public markets to increase our appeal to vendors, brands, and customers when compared to potential competitors.
As competition builds from brands and sites which start to accept Bitcoins and other virtual currencies we plan to be positioned both as a primary gateway partner for brands that are not prepared to develop their own solutions for virtual currency. We also plan to explore additional product offerings including digital media, and software.
Research and Development
We believe that an agile development approach combined with being at the leading edge of technology trends in virtual currency could be a powerful competitive advantage for us. We enlist best practices engineering and development models from our founder’s experiences at NASA to deliver solutions that we believe will scale rapidly and reliably. We believe that new technologies will evolve rapidly within the virtual currency ecosystem. We anticipate that part of our value proposition will be our ability to successfully test and integrate new technologies, and to develop proprietary systems.
Our technology allows us to integrate with numerous vendors, although we are currently only integrated with one major vendor. However, when selection or pricing advantages can be sourced from alternative vendors, we source these on a limited case by case basis to the benefit of our customers. We intend to automate this process to achieve efficiencies that are scalable.
Environmental Law Compliance
It is the Company’s policy to conduct its operations in accordance with all applicable laws, regulations and other requirements. While it is not possible to quantify with certainty the potential impact of actions regarding environmental matters, particularly remediation and other compliance efforts that the Company may undertake in the future, in the opinion of management, compliance with the present environmental protection laws, before taking into account estimated recoveries from third parties, will not have a material adverse effect on the Company’s consolidated annual results of operations, financial position or cash flows.
Employees
We currently have 4 full-time employees and 1 part-time employee. In the future, if our activities grow, we may hire personnel on an as-needed basis.
ITE
M
1A. RISK FACTORS
Risk Factors
There are numerous and varied risks, known and unknown, that may prevent us from achieving our goals. If any of these risks actually occur, our business, financial condition or results of operation may be materially adversely affected. In such case, the trading price of our common stock could decline and investors could lose all or part of their investment.
The Company has changed the focus of its business to developing, marketing and operating the business of BitcoinShop. The Company may not be able to successfully compete in this business, and thus it may fail to realize all of the anticipated benefits of consummating the Share Exchange (as described above).
Risks Related to Our Business:
BITCOIN AND VIRTUAL CURRENCY RISKS
The further development and acceptance of the Bitcoin Network and other Digital Math-Based Asset systems, which represent a new and rapidly changing industry, are subject to a variety of factors that are difficult to evaluate. The slowing or stopping of the development of the Bitcoin Network or the acceptance of the Bitcoin may adversely affect an investment in the Company.
The use of Digital Math-Based Assets such as Bitcoins, among other things, to buy and sell goods and services, is a new and rapidly evolving industry of which the Bitcoin Network is a prominent, but not unique, part. The growth of the Digital Math-Based Assets industry in general, and the Bitcoin Network in particular, is subject to a high degree of uncertainty. Because the respective values of the trading system and exchange are closely related to and dependent upon the underlying value of the Bitcoin, any risk to the proper adoption, implementation, or functioning of Bitcoin also poses a risk to the Company’s ecommerce platform. The factors affecting the further development of the Digital Math-Based Assets industry, as well as the Bitcoin Network, include:
|
•
|
Continued worldwide growth in the adoption and use of Bitcoin;
|
|
•
|
Global Bitcoin supply;
|
|
•
|
Global Bitcoin demand, which is influenced by the growth of retail merchants’ and commercial businesses’ acceptance of Bitcoins as payment for goods and services, the security of online Bitcoin Exchanges and digital wallets that hold Bitcoins, the perception that the use and holding of Bitcoins is safe and secure, and the lack of regulatory restrictions on their use;
|
||
|
•
|
Government and quasi-government regulation of Bitcoin and its use, or restrictions on or regulation of access to and operation of the Bitcoin Network and derivative industries and technologies;
|
|
•
|
General global economic conditions, including interest rates, inflation, currency exchange rates, governmental monetary policies and trade restrictions;
|
|
•
|
Changes in consumer demographics and public taste preferences;
|
||
|
•
|
The availability and popularity of other forms or methods of buying and selling goods and services, including new means of using fiat currencies;
|
||
|
•
|
Investors’ expectations with respect to the rate of inflation;
|
||
|
•
|
Interest rates;
|
|
•
|
Currency exchange rates, including the rates at which Bitcoins may be exchanged for Fiat Currencies;
|
||
|
•
|
Fiat Currency withdrawal and deposit policies of Bitcoin Exchanges and liquidity on such Bitcoin Exchanges;
|
|
•
|
Investment and trading activities of large investors, including private and registered funds, that may directly or indirectly invest in Bitcoins;
|
|
•
|
Global or regional political, economic or financial events and situations; and
|
||
|
•
|
Expectations among Bitcoin economy participants that the value of Bitcoins will soon change.
|
Currently, there is relatively small use of Bitcoins in the retail and commercial marketplace in comparison to relatively large use by speculators, thus contributing to price volatility that could adversely affect an investment in the Company.
Bitcoins and the Bitcoin Network have not been widely adopted as a means of payment for goods and services by major retail and commercial outlets. Conversely, a significant portion of Bitcoin demand is generated by speculators and investors seeking to profit from the short or long-term holding of Bitcoins. The relative lack of acceptance of Bitcoins in the retail and commercial marketplace limits the ability of end-users to pay for goods and services with Bitcoins. A lack of expansion of Bitcoin into retail and commercial markets, or a contraction of such use, may result in increased volatility or a reduction in the Bitcoin price, either of which could adversely impact an investment in the Company.
The administrators of the Bitcoin Network’s source code could propose amendments to the Bitcoin Network’s protocols and software that, if accepted and authorized by the Bitcoin Network’s community, could adversely affect an investment in the Company.
The Bitcoin Network is based on a cryptographic, algorithmic protocol that governs the end-user-to-end-user interactions between computers connected to the Bitcoin Network. The code that sets forth the protocol is managed by a development team that was appointed by the Bitcoin Network’s purported creator, Satoshi Nakamoto. The development team can propose amendments to the Bitcoin Network’s source code through one or more software upgrades that alter the protocols and software that govern the Bitcoin Network and the properties of Bitcoins, including the irreversibility of transactions and limitations on Mining. To the extent that a significant majority of the users and miners on the Bitcoin Network install such software upgrade(s), the Bitcoin Network would be subject to new protocols and software that may adversely affect an investment in the Company. If less than a significant majority of the users and miners on the Bitcoin Network install such software upgrade(s), the Bitcoin Network could “fork” and two separate Bitcoin Networks could result, one running the pre-upgrade software and the other running the upgraded software. Such a fork could adversely affect an investment in the Company.
If a malicious actor or botnet obtains control in excess of 50 percent of the processing power active on the Bitcoin Network, such actor or botnet could manipulate the source code of the Bitcoin Network or the Blockchain in a manner that adversely affects an investment in the Company.
To the extent that a malicious actor or botnet (a volunteer or hacked collection of computers controlled by networked software coordinating the actions of the computers) obtains a majority of the processing power on the Bitcoin Network, it could alter the source code and Blockchain on which the Bitcoin Network and all Bitcoin transactions rely. To the extent that such malicious actor or botnet does not yield its majority control of the processing power on the Bitcoin Network, reversing any changes made to the source code or Blockchain may not be possible. Such changes could adversely affect an investment in the Company.
As the number of Bitcoins awarded for solving a block in the Blockchain decreases, the incentive for miners to continue to contribute processing power to the Bitcoin Network will transition from a set reward to transaction fees. The requirement from miners of higher transaction fees in exchange for recording transactions in the Blockchain may decrease demand for Bitcoins and prevent the expansion of the Bitcoin Network to retail merchants and commercial businesses, resulting in a reduction in the value of Bitcoins.
If transaction fees paid for the recording of transactions in the Blockchain become too high, the marketplace may be reluctant to accept Bitcoins as a means of payment and existing users may be motivated to switch from Bitcoins to another Digital Math-Based Asset or back to fiat currency. Decreased use and demand for Bitcoins may adversely affect their value.
If the award of Bitcoins for solving blocks and transaction fees for recording transactions are not sufficiently high to incentivize miners, miners may cease expending processing power to solve blocks and confirmations of transactions on the Blockchain could be slowed. A reduction in the processing power expended by miners on the Bitcoin Network could increase the likelihood of a malicious actor or botnet obtaining control in excess of 50 percent of the processing power active on the Bitcoin Network or the Blockchain, permitting such actor or botnet to manipulate the source code of the Bitcoin Network in a manner that adversely affects an investment in the Company.
If transaction fees are not sufficiently high, miners may not have an adequate incentive to continue Mining and may cease their Mining operations. Miners ceasing operations would reduce the collective processing power on the Bitcoin Network, which would adversely affect the confirmation process for transactions and make the Bitcoin Network more vulnerable to a malicious actor or botnet obtaining control in excess of 50 percent of the processing power on the Bitcoin Network. Any reduction in confidence in the confirmation process or processing power of the Bitcoin Network may adversely impact an investment in the Company.
The acceptance of Bitcoin Network software patches or upgrades by a significant, but not overwhelming, percentage of the users and miners in the Bitcoin Network could result in a “fork” in the Blockchain, resulting in the operation of two separate networks until such time as the forked Blockchains are merged if they are in fact changed. The temporary or permanent existence of forked Blockchains could adversely impact an investment in the Company.
Bitcoin is an open source project and, although there is an influential group of leaders in the Bitcoin Network community including developers, there is no official developer or group of developers that formally controls the Bitcoin Network. Any individual can download the Bitcoin Network software and make any desired modifications, which are proposed to users and miners on the Bitcoin Network through software downloads and upgrades. However, miners and users must consent to those software modifications by downloading the altered software or upgrade implementing the changes; otherwise, the changes do not become a part of the Bitcoin Network. Since the Bitcoin Network’s inception, changes to the Bitcoin Network have been accepted by the vast majority of users and miners, ensuring that the Bitcoin Network remains a coherent economic system. However, a developer or group of developers could potentially propose a modification to the Bitcoin Network that is not accepted by a vast majority of miners and users, but that is nonetheless accepted by a substantial population of participants in the Bitcoin Network. In such a case, a fork in the Blockchain could develop and two separate Bitcoin Networks could result, one running the pre-modification software program and the other running the modified version. Such a fork in the Blockchain typically would be addressed by community-led efforts to merge the forked Blockchains, and several prior forks have been so merged. This kind of split in the Bitcoin Network could materially and adversely affect the value of Bitcoins, in the worst case scenario, harm the sustainability of the Bitcoin economy, in which case an investment in the Company may be negatively impacted.
Intellectual property rights claims may adversely affect the operation of the Bitcoin Network.
Third parties may assert intellectual property claims relating to the operation of Digital Math-Based Assets and their source code relating to the holding and transfer of such assets. Regardless of the merit of any intellectual property or other legal action, any threatened action that reduces confidence in the Bitcoin Network’s long-term viability or the ability of end-users to hold and transfer Bitcoins may adversely affect an investment in the Company. Additionally, a meritorious intellectual property claim could prevent the Company from accessing the Bitcoin Network.
The value of Bitcoins may be subject to momentum pricing whereby the current Bitcoin value may account for speculation regarding future appreciation in value. Momentum pricing of Bitcoins may subject Bitcoin to greater volatility and adversely affect an investment in the Company.
Momentum pricing typically is associated with growth stocks and other assets whose valuation, as determined by the investing public, accounts for anticipated future appreciation in value. Momentum pricing of Bitcoins has resulted, and may continue to result, in speculation regarding future appreciation in the value of Bitcoins, inflating and making Bitcoin more volatile. As a result, Bitcoins may be more likely to fluctuate in value due to changing investor confidence in future appreciation of Bitcoin, which could adversely affect an investment in the Company.
The Bitcoin exchanges on which Bitcoins trade are relatively new and largely unregulated and may therefore be more exposed to fraud and failure than established, regulated exchanges for other products. To the extent that the Bitcoin exchanges representing a substantial portion of the volume in Bitcoin trading are involved in fraud or experience security failures or other operational issues, such Bitcoin exchanges’ failures may result in a reduction in Bitcoin value and can adversely affect an investment in the Company.
Over the past three years, many Bitcoin Exchanges have been closed due to fraud, failure or security breaches. In many of these instances, the customers of such Bitcoin Exchanges were not compensated or made whole for the partial or complete losses of their account balances in such Bitcoin Exchanges. While smaller Bitcoin Exchanges are less likely to have the infrastructure and capitalization that make larger Bitcoin Exchanges more stable, larger Bitcoin Exchanges are more likely to be appealing targets for hackers and “malware” (
i.e.
, software used or programmed by attackers to disrupt computer operation, gather sensitive information or gain access to private computer systems).
A lack of stability in the Bitcoin Exchange Market and the closure or temporary shutdown of Bitcoin Exchanges due to fraud, business failure, or hackers or malware may reduce confidence in the Bitcoin Network and result in greater volatility in Bitcoin value. These potential consequences of a Bitcoin Exchange’s failure could adversely affect an investment in the Company.
Political or economic crises may motivate large-scale sales of Bitcoins, which could result in a reduction in Bitcoin value and adversely affect an investment in the Company.
As an alternative to Fiat Currencies that are backed by central governments, Digital Math-Based Assets such as Bitcoins, which are relatively new, are subject to supply and demand forces based upon the desirability of an alternative, decentralized means of buying and selling goods and services, and it is unclear how such supply and demand will be impacted by geopolitical events. Nevertheless, political or economic crises may motivate large-scale acquisitions or sales of Bitcoins either globally or locally. Large-scale sales of Bitcoins would result in a reduction in Bitcoin value and could adversely affect an investment in the Company.
The Company may be required to terminate and liquidate its business at a time that is disadvantageous to shareholders.
If the Company is required to terminate and liquidate, such termination and liquidation could occur at a time that is disadvantageous to shareholders, such as when the value of Bitcoin is lower than it was when shareholders purchased their shares.
The United States tax rules applicable to an investment in Bitcoin businesses are uncertain and the tax consequences to an investor of an investment in the Company could differ from the investor’s expectations.
The relevant tax rules are complex, and no statutory, judicial, or administrative authority directly addresses the characterization of an investment in Bitcoins. The tax consequences to an investor of an investment in the Company could differ from the investor’s expectations.
Regulatory changes or actions may alter the nature of an investment in the Company or restrict the use of Bitcoins or the operation of the Bitcoin Network in a manner that adversely affects an investment in the Company.
Until recently, little or no regulatory attention has been directed toward Bitcoins and the Bitcoin Network by US federal and state governments, foreign governments and self-regulatory agencies. As Bitcoins have grown in popularity and in market size, certain US agencies (
e.g.
, FinCEN) have begun to examine the operations of the Bitcoin Network, Bitcoin users and the Bitcoin Exchange Market. There is a possibility of future regulatory change altering, perhaps to a material extent, the nature of an investment in the Company and/or the Company’s ability to operate its Bitcoin business.
Currently, neither the Securities and Exchange Commission (the “SEC”) nor the U.S. Commodity Futures Trading Commission (the “CFTC”) has formally asserted regulatory authority over the Bitcoin Network or Bitcoin trading and ownership. To the extent that Bitcoins are determined to be a security, commodity future or other regulated asset, or to the extent that a US or foreign government or quasi-governmental agency exerts regulatory authority over the Bitcoin Network or Bitcoin trading and ownership, trading or ownership in Bitcoins, our ability to deliver an ecommerce platform based on virtual currency may be adversely affected.
To the extent that future regulatory actions or policies limit the ability to exchange Bitcoins or utilize them for payments, the demand for Bitcoins will be reduced. Furthermore, regulatory actions may limit the ability of end-users to convert Bitcoins into Fiat Currency (
e.g.
, US Dollars) or use Bitcoins to pay for goods and services. Such regulatory actions or policies would result in a reduction Bitcoin value and by extension the Company’s Bitcoin business.
Bitcoin currently faces an uncertain regulatory landscape in not only the United States but also in many foreign jurisdictions such as the European Union. Various foreign jurisdictions may, in the near future, adopt laws, regulations or directives that affect the Bitcoin Network and its users, particularly Bitcoin Exchanges and service providers that fall within such jurisdictions’ regulatory scope. Such laws, regulations or directives may conflict with those of the United States and may negatively impact the acceptance of Bitcoins by users, merchants and service providers outside of the United States and may therefore impede the growth of the Bitcoin economy.
The effect of any future regulatory change regarding Bitcoins is impossible to predict, but such change could be substantial and adverse to the Company.
It may be illegal now, or in the future, to acquire, own, hold, sell or use Bitcoins in one or more countries.
Although currently Bitcoins are not regulated or are lightly regulated in most countries, including the United States, one or more countries may take regulatory actions in the future that severely restricts the right to acquire, own, hold, sell or use Bitcoins or to exchange Bitcoins for Fiat Currency. Such restrictions may adversely affect an investment in the Company.
We target keeping approximately 20% of our gross profit in Bitcoins.
Management from time to time may increase or decrease this target amount, as well as considering diversifying our holdings in new and evolving alternative currencies like Bitcoin. As the value of Bitcoins fluctuates we may either benefit or suffer financial losses or gains in these holdings.
ECOMMERCE RISK FACTORS:
We are an ecommerce business and we depend on the continued use of the Internet and the adequacy of the Internet infrastructure.
Our business depends upon the widespread use of the Internet and ecommerce. Factors which could reduce the widespread use of the Internet for ecommerce include:
|
•
|
actual or perceived lack of security of information or privacy protection;
|
|
•
|
cyber attacks or other disruptions or damage to the Internet or to users’ computers;
|
| • | significant increases in the costs of transportation of goods; and |
|
•
|
taxation and governmental regulation. |
We depend on our relationships with an independent fulfillment partner for the products that we offer for sale on our Website. If we fail to maintain this relationship, our business will suffer.
If we do not maintain our existing relationships or build new relationships with fulfillment partners on acceptable commercial terms, we may not be able to maintain a broad selection of merchandise, and our business and prospects would suffer severely. Our agreements with fulfillment partners are generally terminable at will by either party upon short notice.
We depend on our fulfillment partners to perform certain services regarding the products that we offer.
In general, we agree to offer the fulfillment partners’ products on our Website and these fulfillment partners agree to conduct a number of other traditional retail operations with respect to their respective products, including maintaining inventory, preparing merchandise for shipment to individual customers and delivering purchased merchandise on a timely basis. We may be unable to ensure that these third parties will continue to perform these services to our satisfaction or on commercially reasonable terms. In addition, because we do not take possession of these fulfillment parties’ products (other than on the return of such products), we are generally unable to fulfill these traditional retail traditional retail operations ourselves. If our customers become dissatisfied with the services provided by these third parties, our business, reputation andbrand could suffer.
Risks associated with the supplier from whom our products are sourced and the safety of those products could adversely affect our financial performance.
Global sourcing of many of the products we sell is an important aspect of our business. We depend on our ability to access products from our qualified supplier in a timely and efficient manner. Political and economic instability, the financial stability of suppliers, suppliers’ ability to meet our standards, labor problems experienced by our suppliers, the availability of raw materials, merchandise quality issues, currency exchange rates, transport availability and cost, transport security, inflation, and other factors relating to the suppliers and the countries in which they are located are beyond our control. Further, our customers count on us to provide them with safe products. Concerns regarding the safety of products that we source from our supplier and then sell could cause shoppers to avoid purchasing certain products from us, or to seek alternative sources of supply for all of their needs, even if the basis for the concern is outside of our control. Any lost confidence on the part of our customers would be difficult and costly to reestablish. As such, any issue regarding the safety of any items we sell, regardless of the cause, could adversely affect our financial performance. Further, we sell products manufactured for us by third parties, some of which may be defective. If any product that we sell were to cause physical injury or injury to property, the injured party or parties might bring claims against us as the manufacturer and/or retailer of the product. Our insurance coverage may not be adequate to cover claims that could be asserted. Even unsuccessful claims could result in the expenditure of funds and management time and could have a negative impact on our business.
Our business depends on our Website, network infrastructure and transaction-processing systems.
As an ecommerce company, we are completely dependent on our infrastructure. Any system interruption that results in the unavailability of our Website or reduced performance of our transaction systems could reduce our ability to conduct our business. We use internally and externally developed systems for our Website and our transaction processing systems,. We have experienced system interruptions due to software failure in the past, which we expect will continue to occur from time to time. We may also experience temporary capacity constraints due to sharply increased traffic during sales or other promotions and during the holiday shopping season. Capacity constraints can cause system disruptions, slower response times, delayed page presentation, degradation in levels of customer service and other problems. We may also experience difficulties with our infrastructure upgrades. Any future difficulties with our transaction processing systems or difficulties upgrading, expanding or integrating aspects of our systems may cause system disruptions, slower response times, and degradation in levels of customer service, additional expense, impaired quality and speed of order fulfillment or other problems.
If the location where all of our computer and communications hardware is located is compromised, our business, prospects, financial condition and results of operations could be harmed. If we suffer an interruption or degradation of services at the location for any reason, our business could be harmed. Our success, and in particular, our ability to successfully receive and fulfill orders and provide high-quality customer service, largely depends on the efficient and uninterrupted operation of our computer and communications systems. These limitations could have an adverse effect on our conversion rate and sales. Our disaster recovery plan may be inadequate, and we do not carry business interruption insurance sufficient to compensate us for the losses that could occur. Despite our implementation of network security measures, our servers are vulnerable to computer viruses, physical or electronic break-ins and similar disruptions, the occurrence of any of which could lead to interruptions, delays, loss of critical data or the inability to accept and fulfill customer orders. The occurrence of any of the foregoing risks could harm our business.
Our platform requires frequent updates on pricing from our vendor. If these updates are inaccurate or do not occur, there could be a negative influence on our business.
We update the prices of products listed on our site frequently as the product vendor informs us of changes. If we are unable to obtain, or are not provided updated pricing information from our vendor, or if we fail to act on information provided by our vendor, then it could cause us to remedy the pricing difference to complete the transaction, or source the product from an alternative vendor at their price.
We rely upon paid and natural search engines like Google, Bing, and Yahoo to rank our product offerings and may at times be subject to ranking penalties if they believe we are not in compliance with their guidelines.
We rely on paid and natural search engines to attract consumer interest in our product offerings. Potential and existing customers use search engines provided by search engine companies, including Google, Bing, and Yahoo, which use algorithms and other devices to provide users a natural ranked listing of relevant Internet sites matching a user’s search criteria and specifications. Generally, Internet sites ranked higher in the paid and natural search results lists furnished to users attract the largest visitor share among similar Internet sites. Among retail Internet sites, those sites achieving the highest natural search ranking often benefit from increased sales. Natural search engine algorithms use information available throughout the Internet, including information available on our site. Rules and guidelines of these natural search engine companies govern our participation on their sites and how we share relevant Internet information that may be considered or incorporated into the algorithms used by these sites. If these rules and guidelines or the search engine algorithms change, or if we fail to present, or improperly present, our site information for use by natural search engine companies, or if any of these natural search engine companies determine that we have violated their rules or guidelines, or if others improperly present our site information to these search engine companies, we may fail to achieve an optimum ranking in natural search engine listing results, or we may be penalized in a way that could harm our business.
We are subject to cyber security risks and may incur increasing costs in an effort to minimize those risks and to respond to cyber incidents.
Our business is entirely dependent on the secure operation of our website and systems as well as the operation of the Internet generally. Our business involves the storage and transmission of users’ proprietary information, and security breaches could expose us to a risk of loss or misuse of this information, litigation, and potential liability. A number of large Internet companies have suffered security breaches, some of which have involved intentional attacks. From time to time we and many other Internet businesses also may be subject to a denial of service attacks wherein attackers attempt to block customers’ access to our Website. If we are unable to avert a denial of service attack for any significant period, we could sustain substantial revenue loss from lost sales and customer dissatisfaction. We may not have the resources or technical sophistication to anticipate or prevent rapidly evolving types of cyber-attacks. Cyber attacks may target us, our customers, our suppliers, banks, payment processors, ecommerce in general or the communication infrastructure on which we depend. If an actual or perceived attack or breach of our security occurs, customer and/or supplier perception of the effectiveness of our security measures could be harmed and we could lose customers, suppliers or both. Actual or anticipated attacks and risks may cause us to incur increasing costs, including costs to deploy additional personnel and protection technologies, train employees, and engage third party experts and consultants. A person who is able to circumvent our security measures might be able to misappropriate our or our users’ proprietary information, cause interruption in our operations, damage our computers or those of our users, or otherwise damage our reputation and business. Any compromise of our security could result in a violation of applicable privacy and other laws, significant legal and financial exposure, damage to our reputation, and a loss of confidence in our security measures, which could harm our business.
We rely on a third party payment processor to verify a successful transaction between us and our customers.
We rely on a third party processor to facilitate the transaction from the customer’s virtual currency wallet to our virtual currency wallet. If we are unable to source processors to verify these transactions our business could suffer.
Natural disasters and geo-political events could adversely affect our business.
Natural disasters, including hurricanes, cyclones, typhoons, tropical storms, floods, earthquakes and tsunamis, weather conditions, including winter storms, droughts and tornados, whether as a result of climate change or otherwise, and geo-political events, including civil unrest or terrorist attacks, that affect us or our delivery services, suppliers, credit card processors or other service providers could adversely affect our business.
We may not be able to compete successfully against existing or future competitors.
The online retail market is rapidly evolving and intensely competitive. Barriers to entry are minimal, and current and new competitors can launch new websites at a relatively low cost. We currently compete with numerous competitors, including:
| • | liquidation e-tailers such as SmartBargains, Optoro and Overstock ; |
|
•
|
online retailers with discount departments such as Amazon.com, Inc., eBay, Inc. and
Rakuten.com, Inc. (formerly Buy.com, Inc.);
|
|
•
|
private sale sites such as Rue La La and Gilt Groupe;
|
|
•
|
online specialty retailers such as Bluefly, Inc., Blue Nile, Inc. and Zappos.com; and
|
|
•
|
traditional general merchandise and specialty retailers and liquidators such as Ross Stores, Inc., Wal-Mart Stores, Inc., Costco Wholesale Corporation, J.C. Penny Company, Inc., Sears Holding Corporation, Target Corporation, Best Buy Co., Inc., Home Depot, Inc. and Barnes and Noble, Inc., all of which also have an online presence.
|
We expect the online retail market to become even more competitive as traditional liquidators and online retailers continue to develop and improve services that compete with our services. In addition, more traditional manufacturers and retailers may continue to add or improve their ecommerce offerings. Traditional or online retailers may create proprietary, store-based distribution and returns channels. Competitive pressures, including the introduction of same-day delivery capabilities, from any of our competitors, many of whom have longer operating histories, larger customer bases, greater brand recognition and significantly greater financial, marketing and other resources than we do, could harm our business. Further, as a strategic response to changes in the competitive environment, we may from time to time make competitive pricing, service, marketing or other decisions that could harm our business.
If one or more states successfully assert that we should collect sales or other taxes on the sale of our merchandise or the merchandise of third parties that we offer for sale on our Website, or that we should pay commercial activity taxes, our business could be harmed.
We do not currently collect sales or other similar taxes for physical shipments of goods into states where we have no duty to do so under federal court decisions construing applicable constitutional law. One or more local, state or foreign jurisdictions may seek to impose sales tax collection obligations on us because we are engaged in online commerce, even though to do so would be contrary to existing court decisions. The future location of our fulfillment or customer service centers networks, or any other operation, service contracts with third parties located in another state, channel distribution arrangements or other agreements with third party sellers, or any act that may be deemed by a state to have established a physical presence in states where we are not now present, may result in additional sales and other tax obligations. New York and other states have passed so-called ‘‘Internet affiliate advertising’’ statutes, which require a remote seller, with no physical presence in the state, to collect state sales tax if the remote seller contracted for advertising services with an Internet advertiser in that state. Our business could be harmed if one or more states or any foreign country successfully asserts that we should collect sales or other taxes on the sale of our merchandise.
Several other states have enacted laws requiring remote vendors to notify resident purchasers in those states of their obligation to pay a use tax on their purchases and, in some instances, to report untaxed purchases to the state tax authorities. In Colorado, a federal court on constitutional grounds granted a preliminary injunction against the state’s enforcement its tax-notice and reporting law. However, other states may enact legislation similar to these laws. Such laws could harm our business by imposing unreasonable notice burdens upon us, by interposing burdensome transaction notices that negatively affect conversion, or by discouraging customer purchases by requiring detailed purchase reporting.
Economic pressure on states could harm our business.
The recent economic climate has resulted in a sharp decline in state revenues, and states have projected large state budget shortfalls in the years ahead. These shortfalls require state legislatures and agencies to examine the means to increase state revenues. States may increase sales and use tax rates, create new tax laws covering previously untaxed activities, or increase existing license fees or create new fees all of which may directly or indirectly harm our business. Similarly, administrative agencies may apply more rigorous enforcement efforts or take inflexible positions respecting the laws they administer, especially if the laws permit the imposition of monetary penalties and fines which either the state or the administrative agency may use to balance their budgets. To the extent that states pass additional revenue measures, or significantly increase their enforcement efforts, these activities could directly or indirectly harm our business.
If we do not respond to rapid technological changes, our services could become obsolete and we could lose customers.
The Internet and the online commerce industry are changing rapidly. To remain competitive, we must continue to enhance and improve the functionality and features of our ecommerce businesses. If we fail to do so, we may lose customers. If competitors introduce new products or services using new technologies or if new industry standards and practices emerge, our Website and our proprietary technology and systems may become obsolete. Our failure to respond to technological change or to adequately maintain, upgrade and develop our computer network and the systems used to process customers’ orders and payments could harm our business.
We have an evolving business model.
As virtual currencies evolve so will our business model. We may continue to try to offer additional types of products or services, and we cannot offer any assurance that any of them will be successful. From time to time we may also modify aspects of our business model relating to our product mix and the mix of direct/fulfillment partner sourcing of the products we offer. We cannot offer any assurance that these or any other modifications will be successful or will not result in harm to the business. We may not be able to manage growth effectively, which could damage our reputation, limit our growth and negatively affect our operating results.
We may need to implement additional finance and accounting systems, procedures and controls as we grow our business and organization and to satisfy new reporting requirements
.
We are required to comply with a variety of reporting, accounting and other rules and regulations. Compliance with existing requirements is expensive. Further requirements may increase our costs and require additional management time and resources. We may need to implement additional finance and accounting systems, procedures and controls to satisfy our reporting requirements. If our internal control over financial reporting is determined to be ineffective, such failure could cause investors to lose confidence in our reported financial information, negatively affect the market price of our common stock, subject us to regulatory investigations and penalties, and adversely impact our business and financial condition.
Since there has been limited precedence set for financial accounting of virtual currencies, it is unclear how we will be required to account for virtual currency transactions in the future.
Since there has been limited precedence set for the financial accounting of virtual currencies, it is unclear how we will be required to account for virtual currency transactions or assets. Furthermore, a change in regulatory or financial accounting standards could result in the necessity to restate our financial statements. Such a restatement could negatively impact our business, prospects, financial condition and results of operation.
Significant merchandise returns could harm our business.
We allow our customers to return products, subject to our returns policies. If merchandise returns are significant, our business, prospects, financial condition and results of operations could be harmed. Further, we may modify our policies relating to returns from time to time and any policies intended to reduce the number of product returns may result in customer dissatisfaction and fewer repeat customers.
If the products that we offer on our Website do not reflect our customers’ tastes and preferences, our sales and profit margins would decrease.
Our success depends in part on our ability to offer products that reflect consumers’ tastes and preferences. Consumers’ tastes are subject to frequent, significant and sometimes unpredictable changes and any failure to offer products in line with customers’ preferences could allow our competitors to gain market share. This could have an adverse effect on our business.
The loss of key personnel or any inability to attract and retain additional personnel could affect our ability to successfully grow our business.
Our performance is substantially dependent on the continued services and on the performance of our senior management and other key personnel. Our performance also depends on our ability to retain and motivate our officers and key employees. The loss of the services of any of our executive officers or other key employees for any reason could harm our business. Occasionally, members of senior management or key employees may find it necessary to take a leave of absence due to medical or other causes. Our future success also depends on our ability to identify, attract, hire, train, retain and motivate other highly-skilled technical, managerial, editorial, merchandising, marketing and customer service personnel. Competition for such personnel is intense. Our failure to retain and attract the necessary technical, managerial, editorial, merchandising, marketing, and customer service personnel could harm our business.
In order to obtain future revenue growth and sustain profitability, we will have to attract and retain customers on cost-effective terms.
Our success depends on our ability to attract and retain customers on cost-effective terms. We have relationships with online services, search engines, affiliate marketing websites, directories and other website and ecommerce businesses to provide content, advertising banners and other links that direct customers to our Website. We rely on these relationships as significant sources of traffic to our Website and to generate new customers. If we are unable to develop or maintain these relationships on acceptable terms, our ability to attract new customers and our financial condition would suffer. In addition, certain of our online marketing agreements may require us to pay upfront fees and make other payments prior to the realization of the sales, if any, associated with those payments. Current or future relationships or agreements may fail to produce the sales that we anticipate.
Existing or future government regulation could harm our business.
We are subject to regulation at the federal, state and international levels, including regulation relating to privacy, security, retention, transfer and use of personal user information and telemarketing laws. Increasing regulation, along with increased governmental or private enforcement, may increase the cost of our business. Compliance with existing and new privacy and security laws may be difficult and costly and may further restrict our ability to collect demographic and personal information from users, which could harm our marketing efforts, and could require us to implement new and potentially costly processes, procedures and/or protective measures. The expansion of these and other laws, both in terms of their number and their applicability to the Internet could also harm our business. Many laws, adopted prior to the advent of the Internet, do not contemplate or address the unique issues raised thereby. Consequently, courts or regulators may apply these laws to Internet commerce in ways that may present difficult or impossible compliance challenges. Many of those laws that do reference the Internet are still being interpreted by the courts and their applicability and reach are therefore uncertain. Moreover, Internet advances and innovations may result in new questions about the applicability and reach of these laws. Additionally, laws governing the permissible contents of products may adversely affect us, and we are subject to federal and state consumer laws, including those governing advertising, product labeling, product content requirements and product safety. The laws apply to future manufacture of consumer products. Some of the products we sell may, under statutory or common law, from time to time expose us to claims related to personal injury, death, environmental or property damage and may from time to time require product recalls or other actions which we are not covered by any insurance policy. These current and future laws and regulations could harm our business, prospects, financial condition and results of operation.
Decreases in discretionary consumer spending may have an adverse effect on us.
A substantial portion of the products and services we offer and may offer in the future are products or services that consumers may view as discretionary items rather than necessities. As a result, our results of operations are sensitive to changes in macro-economic conditions that impact consumer spending, including discretionary spending. Difficult macro-economic conditions, particularly high levels of unemployment, also impact our customers’ ability to obtain consumer credit. Other factors, including consumer confidence, employment levels, interest rates, tax rates, consumer debt levels, and fuel and energy costs could reduce consumer spending or change consumer purchasing habits. Slowdowns in the U.S. or global economy, or an uncertain economic outlook, could materially adversely affect consumer spending habits and our operating results.
We may need to implement additional finance and accounting systems, procedures and controls as we grow our business and organization and to satisfy new reporting requirements.
We are required to comply with a variety of reporting, accounting and other rules and regulations. Compliance with existing requirements is expensive. Further requirements may increase our costs and require additional management time and resources. We may need to implement additional finance and accounting systems, procedures and controls to satisfy our reporting requirements. If our internal control over financial reporting is determined to be ineffective, such failure could cause investors to lose confidence in our reported financial information, negatively affect the market price of our common stock, subject us to regulatory investigations and penalties, and adversely impact our business and financial condition.
Changes in accounting standards and subjective assumptions, estimates and judgments by management related to complex accounting matters could significantly affect our financial results
.
Generally accepted accounting principles and related accounting pronouncements, implementation guidelines and interpretations with regard to a wide range of matters that are relevant to our business, including but not limited to revenue recognition, estimating valuation allowances and accrued liabilities (including allowances for returns, credit card chargebacks, doubtful accounts and obsolete and damaged inventory), internal use software and website development (acquired and developed internally), accounting for income taxes, valuation of long-lived and intangible assets and goodwill, stock-based compensation and loss contingencies, are highly complex and involve many subjective assumptions, estimates and judgments by our management. Changes in these rules or their interpretation or changes in underlying assumptions, estimates or judgments by our management could significantly change our reported or expected financial performance.
If we fail to accurately forecast our expenses and revenues, our business, prospects, financial condition and results of operations may suffer and the price of our securities may decline.
The rapidly evolving nature of our industry and the constantly evolving nature of our business, make forecasting operating results difficult. We plan to upgrade and further expand the components of our infrastructure. We may experience difficulties with upgrades of our infrastructure, and may incur increased expenses as a result of these difficulties. As a result of these potential expenditures on our infrastructure, our ability to reduce spending may become limited. Therefore, any significant shortfall in the revenues for which we have built and are continuing to build our infrastructure would likely harm our business.
The seasonality of our business places increased strain on our operations.
A disproportionate amount of our sales may occur during our fourth quarter. If we are unable to source products sufficient to meet customer demand, our business would be adversely affected. If too many customers access our website within a short period of time due to increased holiday demand, we may experience system interruptions that make our website unavailable or prevent us from efficiently fulfilling orders, which may reduce the volume of goods we sell and the attractiveness of our products and services. In addition, we may be unable to adequately staff our customer service centers during peak periods, and our vendor’s delivery services and other fulfillment companies and customer service providers may be unable to meet the seasonal demand.
In order to obtain future revenue growth and sustain profitability, we will have to attract and retain customers on cost-effective terms.
Our success depends on our ability to attract and retain customers on cost-effective terms. We have relationships with online services, search engines, affiliate marketing websites, directories and other website and ecommerce businesses to provide content, advertising banners and other links that direct customers to our Website. We rely on these relationships as significant sources of traffic to our Website and to generate new customers. In the past we have terminated affiliate marketing websites as a result of efforts by certain states to require us to collect sales taxes based on the presence of those third party Internet advertising affiliates in those states, and we are likely to do so again in the future if necessary. If we are unable to develop or maintain these relationships on acceptable terms, our ability to attract new customers and our financial condition would suffer. In addition, certain of our online marketing agreements may require us to pay upfront fees and make other payments prior to the realization of the sales, if any, associated with those payments. Current or future relationships or agreements may fail to produce the sales that we anticipate.
We may be unable to protect our proprietary technology or keep up with that of our competitors.
Our success depends to a significant degree upon the protection of our software and other proprietary intellectual property rights. We may be unable to deter misappropriation of our proprietary information, detect unauthorized use or take appropriate steps to enforce our intellectual property rights. In addition, our competitors may now have or may in the future develop technologies that are as good as or better than our technology without violating our proprietary rights. Our failure to protect our software and other proprietary intellectual property rights or to utilize technologies that are as good as our competitors’ could put us at a disadvantage to our competitors.
We may not be able to obtain trademark protection for our marks, which could impede our efforts to build brand identity.
We have filed a trademark application with the Patent and Trademark Office seeking registration of the trademark, “BitcoinShop”. There can be no assurance that our application will be successful or that we will be able to secure significant protection for our trademark in the United States or elsewhere as we expand internationally. Our competitors or others could adopt product or service marks similar to our mark, or try to prevent us from using our mark, thereby impeding our ability to build brand identity and possibly leading to customer confusion. Any claim by another party against us or customer confusion related to our trademark, or our failure to obtain trademark registration, could harm our business.
We may be accused of infringing intellectual property rights of third parties.
Other parties may claim that we infringe their intellectual property rights. In the future we may be subject to legal claims of alleged infringement of the intellectual property rights of third parties. The ready availability of damages, royalties and the potential for injunctive relief has increased the defense litigation costs of patent infringement claims, especially those asserted by third parties whose sole or primary business is to assert such claims. Such claims, even if not meritorious, may result in significant expenditure of financial and managerial resources, and the payment of damages or settlement amounts. Additionally, we may become subject to injunctions prohibiting us from using software or business processes we currently use or may need to use in the future, or requiring us to obtain licenses from third parties when such licenses may not be available on financially feasible terms or terms acceptable to us or at all. In addition, we may not be able to obtain on favorable terms, or at all, licenses or other rights with respect to intellectual property we do not own in providing ecommerce services to other businesses and individuals under commercial agreements.
Use of social media may adversely impact our reputation.
There has been a marked increase in use of social media platforms and similar devices, including weblogs (blogs), social media websites, and other forms of Internet-based communications which allow individual access to a broad audience of consumers and other interested persons. Consumers value readily available information concerning retailers, manufacturers, and their goods and services and often act on such information without further investigation, authentication and without regard to its accuracy. The availability of information on social media platforms and devices is virtually immediate as is its impact. Social media platforms and devices immediately publish the content their subscribers and participants post, often without filters or checks on accuracy of the content posted. The opportunity for dissemination of information, including inaccurate information, is virtually limitless. Information concerning or affecting us may be posted on such platforms and devices at any time. Information posted may be inaccurate and adverse to us, and it may harm our business. The harm may be immediate without affording us an opportunity for redress or correction. Such platforms also could be used for the dissemination of trade secret information or compromise of other valuable company assets, any of which could harm our business.
Sales by our significant stockholders could have an adverse effect on the market price of our stock.
Several of our stockholders own significant portions of our common stock. If one or more of stockholders were to sell all or a portion of their holdings of our common stock, the market price of our common stock could be negatively impacted. The effect of such sales, or of significant portions of our stock being offered or made available for sale, could result in strong downward pressure on our stock price. Investors should be aware that they could experience significant short-term volatility in our stock if such stockholders decide to sell all or a portion of their holdings of our common stock at once or within a short period of time.
Lack of experience as officers of publicly-traded companies of our management team may hinder our ability to comply with Sarbanes-Oxley Act.
It may be time consuming, difficult and costly for us to develop and implement the internal controls and reporting procedures required by the Sarbanes-Oxley Act. We may need to hire additional financial reporting, internal controls and other finance staff or consultants in order to develop and implement appropriate internal controls and reporting procedures. If we are unable to comply with the Sarbanes-Oxley Act’s internal controls requirements, we may not be able to obtain the independent auditor certifications that Sarbanes-Oxley Act requires publicly-traded companies to obtain.
We are subject to the information and reporting requirements of the Securities and Exchange Act of 1934, as amended (the “Exchange Act”), and other federal securities laws, including compliance with the Sarbanes-Oxley Act of 2002 (the “Sarbanes-Oxley Act”).
The costs of preparing and filing annual and quarterly reports and other information with the Securities and Exchange Commission and furnishing audited reports to stockholders will cause our expenses to be higher than they would have been if we were privately held. It may be time consuming, difficult and costly for us to develop, implement and maintain the internal controls and reporting procedures required by the Sarbanes-Oxley Act. We may need to hire additional financial reporting, internal controls and other finance personnel in order to develop and implement appropriate internal controls and reporting procedures.
If we fail to establish and maintain an effective system of internal control, we may not be able to report our financial results accurately or to prevent fraud. Any inability to report and file our financial results accurately and timely could harm our reputation and adversely impact the trading price of our common stock.
Effective internal control is necessary for us to provide reliable financial reports and prevent fraud. If we cannot provide reliable financial reports or prevent fraud, we may not be able to manage our business as effectively as we would if an effective control environment existed, and our business and reputation with investors may be harmed. As a result, our small size and any current internal control deficiencies may adversely affect our financial condition, results of operation and access to capital. Management has determined that our internal audit function is significantly deficient due to insufficient qualified resources to perform internal audit functions. During our assessment of the effectiveness of internal control over financial reporting as of December 31, 2013, management identified significant deficiency related to presence of weakness in our disclosure control and procedure resulting from limited internal audit functions. Because of its inherent limitations, internal control over financial reporting may not prevent or detect misstatements. Projections of any evaluation of effectiveness to future periods are subject to the risk that controls may become inadequate because of changes in conditions, or that the degree of compliance with any policies and procedures may deteriorate.
Public company compliance may make it more difficult to attract and retain officers and directors.
The Sarbanes-Oxley Act and rules implemented by the Securities and Exchange Commission have required changes in corporate governance practices of public companies. As a public company, we expect these rules and regulations to increase our compliance costs in 2014 and beyond and to make certain activities more time consuming and costly. As a public company, we also expect that these rules and regulations may make it more difficult and expensive for us to obtain director and officer liability insurance and we may be required to accept reduced policy limits and coverage or incur substantially higher costs to obtain the same or similar coverage. As a result, it may be more difficult for us to attract and retain qualified persons to serve on our board of directors or as executive officers, and to maintain insurance at reasonable rates, or at all.
Our stock price may be volatile.
The market price of our common stock is likely to be highly volatile and could fluctuate widely in price in response to various factors, many of which are beyond our control, including the following:
|
•
|
changes in our industry;
|
||
|
•
|
competitive pricing pressures;
|
||
|
•
|
our ability to obtain working capital financing;
|
||
|
•
|
additions or departures of key personnel;
|
||
|
•
|
sales of our common stock;
|
||
|
•
|
our ability to execute our business plan;
|
||
|
•
|
operating results that fall below expectations;
|
||
|
•
|
loss of any strategic relationship;
|
||
|
•
|
regulatory developments; and
|
||
|
•
|
economic and other external factors.
|
In addition, the securities markets have from time to time experienced significant price and volume fluctuations that are unrelated to the operating performance of particular companies. These market fluctuations may also materially and adversely affect the market price of our common stock. As a result, you may be unable to resell your shares at a desired price.
We have not paid cash dividends in the past and do not expect to pay dividends in the future. Any return on investment may be limited to the value of our common stock.
We have never paid cash dividends on our common stock and do not anticipate doing so in the foreseeable future. The payment of dividends on our common stock will depend on earnings, financial condition and other business and economic factors affecting us at such time as our board of directors may consider relevant. If we do not pay dividends, our common stock may be less valuable because a return on your investment will only occur if our stock price appreciates.
There is currently a very limited trading market for our common stock and we cannot ensure that one will ever develop or be sustained.
Our shares of common stock are very thinly traded, only a small percentage of our common stock is available to be traded and is held by a small number of holders and the price, if traded, may not reflect our actual or perceived value. There can be no assurance that there will be an active market for our shares of common stock either now or in the future. The market liquidity will be dependent on the perception of our operating business, among other things. We may, in the future, take certain steps, including utilizing investor awareness campaigns, press releases, road shows and conferences to increase awareness of our business and any steps that we might take to bring us to the awareness of investors may require we compensate consultants with cash and/or stock. There can be no assurance that there will be any awareness generated or the results of any efforts will result in any impact on our trading volume. Consequently, investors may not be able to liquidate their investment or liquidate it at a price that reflects the value of the business and trading may be at an inflated price relative to the performance of our company due to, among other things, availability of sellers of our shares. If a market should develop, the price may be highly volatile. Because there may be a low price for our shares of common stock, many brokerage firms or clearing firms may not be willing to effect transactions in the securities or accept our shares for deposit in an account. Even if an investor finds a broker willing to effect a transaction in the shares of our common stock, the combination of brokerage commissions, transfer fees, taxes, if any, and any other selling costs may exceed the selling price. Further, many lending institutions will not permit the use of low priced shares of common stock as collateral for any loans.
Our common stock is deemed a “penny stock,” which would make it more difficult for our investors to sell their shares.
Our common stock is subject to the “penny stock” rules adopted under Section 15(g) of the Exchange Act. The penny stock rules generally apply to companies whose common stock is not listed on the NASDAQ Stock Market or other national securities exchange and trades at less than $4.00 per share, other than companies that have had average revenue of at least $6,000,000 for the last three years or that have tangible net worth of at least $5,000,000 ($2,000,000 if the company has been operating for three or more years). These rules require, among other things, that brokers who trade penny stock to persons other than “established customers” complete certain documentation, make suitability inquiries of investors and provide investors with certain information concerning trading in the security, including a risk disclosure document and quote information under certain circumstances. Many brokers have decided not to trade penny stocks because of the requirements of the penny stock rules and, as a result, the number of broker-dealers willing to act as market makers in such securities is limited. If we remain subject to the penny stock rules for any significant period, it could have an adverse effect on the market, if any, for our securities. If our securities are subject to the penny stock rules, investors will find it more difficult to dispose of our securities.
Offers or availability for sale of a substantial number of shares of our common stock may cause the price of our common stock to decline.
If our stockholders sell substantial amounts of our common stock in the public market or upon the expiration of any statutory holding period, under Rule 144, or upon expiration of lock-up periods applicable to outstanding shares, or issued upon the exercise of outstanding convertible preferred stock, options or warrants, it could create a circumstance commonly referred to as an “overhang” and in anticipation of which the market price of our common stock could fall. The existence of an overhang, whether or not sales have occurred or are occurring, also could make more difficult our ability to raise additional financing through the sale of equity or equity-related securities in the future at a time and price that we deem reasonable or appropriate.
Our articles of incorporation allow for our board to create new series of preferred stock without further approval by our stockholders, which could adversely affect the rights of the holders of our common stock.
Our board of directors has the authority to fix and determine the relative rights and preferences of preferred stock. Our board of directors also has the authority to issue preferred stock without further stockholder approval. As a result, our board of directors could authorize the issuance of a series of preferred stock that would grant to holders the preferred right to our assets upon liquidation, the right to receive dividend payments before dividends are distributed to the holders of common stock and the right to the redemption of the shares, together with a premium, prior to the redemption of our common stock. In addition, our board of directors could authorize the issuance of a series of preferred stock that has greater voting power than our common stock or that is convertible into our common stock, which could decrease the relative voting power of our common stock or result in dilution to our existing stockholders.
IT
EM
2. PROPERTIES.
We do not hold ownership or leasehold interest in any property.
We know of no material, active or pending legal proceedings against us. There are no proceedings in which any of our directors, officers or affiliates, or any registered beneficial shareholder are an adverse party or has a material interest adverse to us.
Not applicable.
PA
R
T II
IT
EM
5. MARKET FOR REGISTRANT’S COMMON EQUITY, RELATED STOCKHOLDER MATTERS AND ISSUER PURCHASES OF EQUITY SECURITIES.
Market Information
Our common stock is currently quoted on the OTCQB and has been quoted under the symbol “BTCS” since March 5, 2014. Prior to that, our common stock was quoted under the symbol “TUCN”. Because we are quoted on the OTCQB, our securities may be less liquid, receive less coverage by security analysts and news media, and generate lower prices than might otherwise be obtained if they were listed on a national securities exchange.
The following table sets forth the high and low bid quotations for our common stock as reported on the OTCQB for the periods indicated.
|
High
|
Low
|
|||||||
|
Fiscal 2013
|
||||||||
|
First Quarter
|
$
|
0.06
|
$
|
0.01
|
||||
|
Second Quarter
|
0.03
|
0.01
|
||||||
|
Third Quarter
|
0.01
|
0.01
|
||||||
|
Fourth Quarter
|
0.01
|
0.01
|
||||||
|
Fiscal 2012
|
||||||||
|
First Quarter
|
$
|
0.019
|
$
|
0.007
|
||||
|
Second Quarter
|
0.0122
|
0.0034
|
||||||
|
Third Quarter
|
0.027
|
0.0021
|
||||||
|
Fourth Quarter
|
0.019
|
0.001
|
||||||
Holders
As of March 26, 2014, there are 59 record holders of 124,440,204 shares of our common stock.
We have not paid any cash dividends to date and do not anticipate or contemplate paying dividends in the foreseeable future. It is the present intention of management to utilize all available funds for the development of our business.
Securities Authorized for Issuance under Equity Compensation Plans
As of December 31, 2013, the Company did not have any equity compensation plan in place. On January 30, 2014, the Board of Directors approved the adoption of a 2014 Plan. The 2014 Plan provides for the grant of incentive stock options, nonqualified stock options, restricted stock, restricted stock units, stock appreciation rights and other types of stock-based awards to the Company’s employees, officers, directors and consultants. Pursuant to the terms of the 2014 Plan, either the Board or a board committee is authorized to administer the plan, including by determining which eligible participants will receive awards, the number of shares of common stock subject to the awards and the terms and conditions of such awards. Up to 15,503,680 shares of common stock are issuable pursuant to awards under the 2014 Plan. Unless earlier terminated by the Board, the 2014 Plan shall terminate at the close of business on January 30, 2024.
Recent Sales of Unregistered Securities
The sales of unregistered securities of the Company during the year ended December 31, 2013 have been previously reported in its current report on Form 8-K.
In February 2014, the Company issued 4,269,500 shares of common stock upon conversion of an aggregate of 42,695 shares of Series B Convertible Preferred Stock.
In March 2014, the Company issued 8,633,900 shares of common stock upon conversion of an aggregate of 86,339 shares of Series B Convertible Preferred Stock.
The foregoing issuance of shares of common stock of the Company was in reliance on the exemption from registration afforded by Sections 3(a)(9) and 4(a)(2) of the Securities Act of 1933, as amended and/or Rule 506 promulgated thereunder.
I
TEM
6. SELECTED FINANCIAL DATA
We are a smaller reporting company as defined by Rule 12b-2 of the Securities Exchange Act of 1934 and are not required to provide the information under this item.
The following discussion should be read in conjunction with the financial statements and the notes to those statements included elsewhere in this report. This report contains certain statements that are forward-looking within the meaning of the Private Securities Litigation Reform Act of 1995. Certain statements contained in this section are forward-looking statements that involve risks and uncertainties. The forward-looking statements are not historical facts, but rather are based on current expectations, estimates, assumptions and projections about our industry, business and future financial results. Our actual results could differ materially from the results contemplated by these forward-looking statements due to a number of factors, including those discussed in other sections of this report.
Overview
We were incorporated in the State of Nevada as “Hotel Management Systems, Inc.” (“HMSI”) in 2008. On May 7, 2010, the Company entered into a Share Exchange Agreement with TouchIT Tech KS, the stockholders of TouchIT Tech KS, TouchIT Ed, and the stockholders of TouchIT Ed whereby HMSI effectively ceased doing business as HMSI. Both TouchIT Tech KS and TouchIT Ed are corporations formed under the laws of Turkey and are based in Istanbul, Turkey. On February 5, 2014, the Company entered into the Exchange Agreement with BitcoinShop and the holders of the membership interests in BitcoinShop. Upon closing of Share Exchange, on February 5, 2014, the BitcoinShop Members transferred all the outstanding membership interests of BitcoinShop to the Company in exchange for an aggregate of 100,773,923 shares of the Company’s common stock. As a result, BitcoinShop became a wholly-owned subsidiary of the Company. Immediately following the Share Exchange with BitcoinShop, the Company discontinued its prior operations as a manufacturer of touch based visual communication products. The Company entered into an Asset Purchase and Debt Assumption Agreement with Touchit Technologies Holdings, Inc.’s (“Holdings Company”), pursuant to which Holdings Company purchased all of the Company’s rights, title and interest in and to those certain assets relating to the technology products under the TouchIT Technologies™ (collectively, the ”Assets”). In consideration of the sale of the Assets, the Holdings Company agreed to assume and be solely responsible for satisfying the debt and obligations associated with the debts and liabilities reflected on the audited and/or reviewed financial statements of the Company immediately prior to the Share Exchange. In connection with the Share Exchange and the sale of the Assets, the Company entered into two Release Agreements with the Company’s former officer and director, Andrew Brabin and the Company’s former officer and director Ronald Murphy. Pursuant to the Release Agreements Mr. Brabin and Mr. Murphy agreed to release the Company of any and all claims they may have against the Company and to release the Company of any and all obligations related to the $32,585.79 and $59,913.40 loans advanced to the Company by Mr. Brabin and Mr. Murphy, respectively, deeming any instrument evidencing such debts null and void.
Critical Accounting Policies and Estimates
We believe that the following accounting policies are the most critical to aid you in fully understanding and evaluating this management discussion and analysis:
Basis of presentation financial statements:
We maintain our books of account and prepare its statutory financial statements in accordance with accounting principles in the United States of America. The accompanying financial statements are based on the statutory records, with adjustments and reclassifications, for the purpose of fair presentation in accordance with United States generally accepted accounting principles (“US GAAP”).
Revenue recognition:
Revenue is measured at the fair value of the consideration received or receivable. Revenue is reduced for customer returns, rebates, and other similar allowances.
Inventories:
Inventories are stated at the lower of cost or net realizable value. Costs, including an appropriate portion of fixed and variable overhead expenses, are assigned to inventories held by the method most appropriate to the particular class of inventory being valued on the weighted average basis. Net realizable value represents the estimated selling price less all estimated costs of completion and costs necessary to deliver service.
Property, plant and equipment:
Property, plant and equipment are carried at cost less accumulated depreciation and any accumulated impairment losses, if any. Depreciation is charged so as to write off the cost of assets, other than land and construction in progress, over their estimated useful lives, using straight-line method. The estimated useful lives, residual values and depreciation method are reviewed at each year-end, with the effect of any changes in estimate accounted for on a prospective basis.
Assets held under finance leases are depreciated over their expected useful lives on the same basis as owned assets or, where shorter, the term of the relevant lease. The gain or loss arising on the disposal or retirement of an item of property, plant and equipment is determined as the difference between the sales proceeds and the carrying amount of the asset and is recognized in profit or loss.
The ranges of estimated useful lives are as follows:
|
-
|
Machinery and equipment 2-6 years
|
|
-
|
Motor vehicles 4 years
|
Shipping and handling:
Shipping and handling costs related to costs of the raw material purchased is included in cost of revenues.
Research and development costs:
Research and development costs are expensed as incurred. The costs of material and equipment that are acquired or constructed for research and development activities, and have alternative future uses, either in research and development, marketing, or sales, are classified as property and equipment or depreciated over their estimated useful lives.
Company reporting year-end:
Our company uses a calendar year as its fiscal year ending December 31.
Results of Operations for the years ended December 31, 2013 and December 31 2012.
|
12/31/2013
|
12/31/2012
|
|||||||
|
NET SALES
|
1,610,704 | 1,287,709 | ||||||
|
COST OF SALES
|
1,111,310 | 885,021 | ||||||
|
Gross profit
|
499,394 | 402,688 | ||||||
|
MARKETING AND SELLING EXPENSE
|
33,779 | 112,304 | ||||||
|
GENERAL AND ADMINISTRATIVE EXPENSES
|
376,944 | 319,399 | ||||||
|
Profit from operations
|
88,671 | (29,442 | ) | |||||
|
OTHER INCOME AND EXPENSES, net
|
-- | 4,301 | ||||||
|
FINANCIAL INCOME AND EXPENSES, net
|
-- | -- | ||||||
|
Profit Loss before taxation and currency translation gain/(loss)
|
88,671 | (25,141 | ) | |||||
|
TAXATION CHARGE
|
-- | -- | ||||||
|
Taxation current
|
-- | -- | ||||||
|
Deferred
|
-- | -- | ||||||
|
CURRENCY TRANSLATION GAIN/(LOSS)
|
(1,485 | ) | -- | |||||
|
Net income/(loss) for the year
|
87,186 | (25,141 | ) | |||||
|
OTHER COMPREHENSIVE INCOME
|
11,172 | -- | ||||||
|
Total comprehensive income
|
98,358 | (25,141 | ) | |||||
Net Sales
Net sales for the fiscal year ended December 31, 2013 were $1,610,704, an increase of approximately $322,995 compared to the net sales for the year ended December 31, 2012. The increase in our revenues from 2012 to 2013 was due primarily to change in focus of products sold to concentrate of the LCD and LED product lines.
Cost of Sales
The cost of sales for the fiscal year ended December 31, 2013 was $1,111,310 compared to a cost of $885,021 for the cost of sales for the fiscal year ended December 31, 2012. The increase in the cost of sales from 2012 to 2013 was due to an increase in NET sales and proportional to the increase in revenue.
|
12/31/2013
|
12/31/2012
|
|||||||
|
NET SALES
|
1,610,704
|
1,287,709
|
||||||
|
COST OF SALES
|
(1,111,310
|
)
|
(885,021
|
)
|
||||
|
As a percentage of sales
|
69
|
%
|
69
|
%
|
||||
Marketing and Selling Expenses
Marketing and selling expenses for the fiscal year ended December 31, 2013 were a cost of $33,779 compared to a cost of $112,304 for the fiscal year ended December 31 2012. Marketing and selling expenses were down 70% from 2012 to 2013, which was primarily due to the cost control of management. All unessential marketing spend was cut out of the budget for 2013.
General and Administrative Expenses
General and administrative expenses for the fiscal year ended December 31, 2013 were a cost of $376,944, compared to a cost of $319,399 for the fiscal year ended December 31, 2012. General and administrative expenses decreased by $78,525 from 2012 to 2013. This decrease can be attributed to the maintenance of fixed overheads without the need for further expenditure in this area.
|
12/31/2013
|
12/31/2012
|
|||||||
|
MARKETING AND SELLING EXPENSE
|
(33,779
|
)
|
(112,304
|
)
|
||||
|
As a percentage of revenue
|
2
|
%
|
9
|
%
|
||||
|
GENERAL AND ADMINISTRATIVE EXPENSES
|
(376,944
|
)
|
(319,399
|
)
|
||||
|
As a percentage of revenue
|
23
|
%
|
25
|
%
|
||||
Operational Profit
The operational profit for the fiscal year ended December 31, 2013 was $88,671 compared to a loss of $29,442 for the fiscal year ended December 31, 2012. Operational profit has increased by $118,113 from 2012 to 2013 primarily due to management focusing on selling the interactive LED product lines which are both higher price and higher margin products.
Other Income and Expenses, net
Other Income and Expenses, net has decreased by $4,301 from $4,302 for the fiscal year ended December 31, 2012 to $0 for the fiscal year ended December 31, 2013.
Total Comprehensive Income
Our total comprehensive loss has increased by $123,499 from $25,141 loss in 2012 to $98,358 profit in 2013. This increase can be attributed to the change in direction of sales revenue to products that deliver profit such as the LCD & LED range and the focus on geographic sales efforts in countries where higher prices thus higher margins are more acceptable.
|
CURRENT ASSETS
|
12/31/2013
|
12/31/2012
|
|||
|
Cash and cash equivalents
|
20,778
|
6,412
|
|||
|
Trade receivables, net
|
68,364
|
64,170
|
|||
|
Due from related parties
|
-
|
-
|
|||
|
Due from Shareholders
|
-
|
-
|
|||
|
Inventories
|
28,249
|
111,461
|
|||
|
Prepaid Inventory
|
28,000
|
-
|
|||
|
Other Current Assets
|
28,552
|
-
|
|||
|
Total current assets
|
173,943
|
182,043
|
|||
|
NON CURRENT ASSETS
|
|||||
|
Property, plant and equipment, net
|
27,180
|
6,076
|
|||
|
Other non current assets
|
400,000
|
400,000
|
|||
|
Total non current assets
|
427,180
|
406,076
|
|||
|
TOTAL ASSETS
|
601,123
|
588,119
|
|||
|
CURRENT LIABILITIES
|
|||||
|
Borrowings
|
-
|
-
|
|||
|
Trade payables
|
265,648
|
274,352
|
|||
|
Due to shareholders
|
-
|
-
|
|||
|
Due to related parties
|
96,699
|
261,499
|
|||
|
Other current liabilities
|
99,776
|
11,310
|
|||
|
Total current liabilities
|
462,123
|
547,161
|
|||
|
NON CURRENT LIABILITIES
|
|||||
|
Borrowings
|
-
|
-
|
|||
|
Employee termination benefits
|
-
|
-
|
|||
|
Reserve for retirement pay
|
-
|
-
|
|||
|
Convertible Notes
|
629,856
|
583,200
|
|||
|
Total non current liabilities
|
629,856
|
583,200
|
|||
|
COMMITMENTS AND CONTINGENCIES
|
|||||
|
SHAREHOLDERS' EQUITY
|
|||||
|
Share capital
|
544,303
|
544,303
|
|||
|
Retained earnings
|
(1,133,518)
|
(1,061,404)
|
|||
|
Net income / (loss) for the period
|
98,359
|
(25,141)
|
|||
|
Total shareholders’ equity
|
(490,856)
|
(542,241)
|
|||
|
TOTAL LIABILITIES AND
|
|||||
|
SHAREHOLDERS' EQUITY
|
601,123
|
588,119
|
|||
Cash and Equivalents
Cash and equivalents have increased by $14,365 from $6,413 for the fiscal year ended December 31, 2012 compared to $20,778 for the fiscal year ended December 31, 2013.
Trade Receivables
Trade receivables for the fiscal year ended December 31, 2013 were $68,364, compared to $64,170 for the fiscal year ended December 31, 2012. Trade receivables have increased by $4,194 from 2012 to 2013. This is the by-product of decreased revenues but also tighter control on credit in uncertain markets at present.
Related Party Transactions
Related party transactions NET for the fiscal year ended December 31, 2013 were $(96,669) compared to $(261,449) for the fiscal year ended December 31, 2012. Related party transactions have decreased by 37%. The related party transactions are the salaries of our directors which remain unpaid due to cash restraints on the company’s finances. In February 2014, Mr. Brabin and Mr. Murphy each waived the right to receive any fees owed to him relating to his position as a prior officer or director of the Company.
|
12/31/2013
|
12/31/2012
|
|||||||
|
Due from related parties
|
0
|
0
|
||||||
|
Due to related parties
|
96,699
|
261,449
|
||||||
|
NET Amount
|
(96,699
|
)
|
(261,449
|
)
|
||||
Inventories
Inventories for the fiscal year ended December 31, 2013 were $28,249, compared to $111,461 for fiscal year ended December 31, 2012. Inventories have increased from 2012 to 2013 by $83,212 or 25% reflecting our move to lower our inventory holding due to financial restraints.
|
12/31/2013
|
12/31/2012
|
|||||||
|
Total current assets
|
601,123
|
588,119
|
||||||
Trade Payables
Trade payables for the fiscal year ended December 31, 2013 were $265,648, compared to $274,352 for the fiscal year ended December 31, 2012. Trade Payables have decreased by 3% or $8,704. This is due to the Company’s improved cash flow to pay suppliers in a timely manor.
Due to Related Parties
Due to related parties for the fiscal year ended December 31, 2013 were $(96,669) compared to $(261,449) for the fiscal year ended December 31, 2012. Related party transactions have decreased by 37%. The related party transactions are the salaries of our directors which remain unpaid due to cash restraints on the company’s finances. In February 2014, Mr. Brabin and Mr. Murphy each waived the right to receive any fees owed to him relating to his position as a prior officer or director of the Company. Current related party transactions are with Kamron Inc which is Ronnie Murphy’s USA Tax entity and ASB Trading, which is Andrew Brabin’s UK Tax entity – both are used for payroll.
|
12/31/2013
|
12/31/2012
|
|||||||
|
Due from related parties
|
0
|
0
|
||||||
|
Due to related parties
|
96,699
|
261,449
|
||||||
|
NET Amount
|
(96,699
|
)
|
(261,449
|
)
|
||||
Convertible Notes
Two 8% convertible notes due May 17, 2015 in the principal amounts of $400,000 and $100,000, respectively, on the balance sheets as of the dates indicated (collectively, the "Convertible Notes"), and accrued interest payable under the Convertible Notes. The Convertible Notes were issued in connection with certain subscription agreements entered into by the Company and the related share exchange agreement dated May 7, 2010 among the Company, TouchIt Tech KS, the stock holders of TouchIt Tech KS, TouchIt Ed, and the stockholders of TouchIt Ed, pursuant to which we entered into various agreements with purchasers of the Convertible Notes.
NET Income
Our NET income has increased by $123,500 from $25,141 loss in 2012 to $98,359 profit in 2013. This increase can be attributed to the change in direction of sales revenue to products that deliver profit such as the LCD & LED range and the focus on geographic sales efforts in countries where higher prices thus higher margins are more acceptable.
|
12/31/2013
|
12/31/2012
|
|||||||
|
Net income / (loss) for the period
|
98,359
|
(25,141
|
)
|
|||||
Liquidity and Capital Resources
Net Income
Our NET income has increased by $123,500 from $25,141 loss in 2012 to $98,359 profit in 2013. This increase can be attributed to the change in direction of sales revenue to products that deliver profit such as the LCD & LED range and the focus on geographic sales efforts in countries where higher prices thus higher margins are more acceptable. Management expects this trend to continue in 2014
Net Cash Generated from Operating Activities
For fiscal year ended December 31, 2013, when compared to the same period in 2012, NET cash generated by operating activities was $252,930 compared to ($532,024) for the same period in 2012. This is an increase of $784,954. This increase was due to managements focus on selling products with high profit margins into markets that accept high prices.
Cash Flow Used Investing Activities
For fiscal year ended December 31, 2013, when compared to the same period in 2012, there was a NET cash flow decrease of $20,437 from ($3,284) in 2012 to ($23,721) in 2013. This decrease was due to management controlling and thus reducing capital expenditure throughout 2013.
Cash Position
There was a net increase in cash and cash equivalents of $14,365 for the beginning and the end of the period from $6,413 at the beginning of the period, to $20,778 for fiscal year ended December 31, 2013. The company’s cash position remains poor but Management is currently seeking to improve this for 2014.
We must raise additional funds or increase revenues from our new line of business in order to fund our continuing operations. We may not be successful in our efforts to raise additional funds or achieve profitable operations. Even if we are able to raise additional funds through the sale of our securities or through the issuance of debt securities, or loans from our directors or financial institutions our cash needs could be greater than anticipated in which case we could be forced to raise additional capital.
At the present time, we have no commitments for any additional financing, and there can be no assurance that, if needed, additional capital will be available to us on commercially acceptable terms or at all. These conditions raise substantial doubt as to our ability to continue as a going concern, which may make it more difficult for us to raise additional capital when needed. If we cannot get the needed capital, we may not be able to become profitable and may have to curtail or cease our operations.
Due to the "start up" nature of our business, we expect to incur losses as we expand and explore new strategies and business opportunities. To date, our cash flow requirements have been primarily met by equity and debt financing as well as minimal revenues from our new line of business. Management expects to keep operating costs to a minimum until sufficient cash is available through financing or operating activities. Management plans to continue to seek other sources of financing on favorable terms; however, there are no assurances that any such financing can be obtained on favorable terms, if at all. If we are unable to generate sufficient profits or unable to obtain additional funds for our working capital needs, we may need to cease or curtail operations. Furthermore, there is no assurance the net proceeds from any successful financing arrangement will be sufficient to cover cash requirements during the initial stages of our operations. For these reasons, our auditors believe that there is substantial doubt that we will be able to continue as a going concern.
Going Concern
The audited consolidated financial statements for the year ended December 31, 2013, included in this Annual Report, have been prepared on a going concern basis, which implies that we will continue to realize our assets and discharge our liabilities and commitments in the normal course of business. We have generated $1,610,704 in revenues during the year ended December 31, 2013 and have never paid any dividends and are unlikely to pay dividends or generate substantial earnings in the immediate or foreseeable future. Our continuation as a going concern is dependent upon the continued financial support from our shareholders, the ability of our company to obtain necessary financing to achieve our operating objectives, and the attainment of profitable operations. As of December 31, 2013, we have accumulated losses of $1,035,159 since inception. As we do not have sufficient funds for our planned or new operations, we will need to raise additional funds for operations.
Due to the uncertainty of our ability to meet our current operating expenses, in their report on the annual consolidated financial statements for the year ended December 31, 2013, our independent auditors included an explanatory paragraph regarding concerns about our ability to continue as a going concern. Our consolidated financial statements contain additional note disclosures describing the circumstances that lead to this disclosure by our independent auditors.
The continuation of our business is dependent upon us raising additional financial support. The issuance of additional equity or convertible debt securities by us could result in a significant dilution in the equity interests of our current stockholders. Obtaining commercial loans, assuming those loans would be available, will increase our liabilities and future cash commitments.
Off Balance Sheet Arrangements
As of December 31, 2013, there were no off balance sheet arrangements.
I
TE
M 7A. QUANTITATIVE AND QUALITATIVE DISCLOSURES ABOUT MARKET RISK
We are a smaller reporting company as defined by Rule 12b-2 of the Securities Exchange Act of 1934 and are not required to provide the information under this item.
I
TEM
8. FINANCIAL STATEMENTS AND SUPPLEMENTARY DATA
I
TEM
9. CHANGES IN AND DISAGREEMENTS WITH ACCOUNTANTS ON ACCOUNTING AND FINANCIAL DISCLOSURE
None.
IT
EM
9A. CONTROLS AND PROCEDURES
Evaluation of Disclosure Controls and Procedures
We maintain disclosure controls and procedures that are designed to ensure that information required to be disclosed in the reports that we file with the SEC under the Exchange Act is recorded, processed, summarized and reported within the time periods specified in the SEC’s rules and forms and that such information is accumulated and communicated to our management, including our principal executive officer and principal financial officer, as appropriate, to allow for timely decisions regarding required disclosure. As required by SEC Rule 15d-15(b), we carried out an evaluation, under the supervision and with the participation of our management, including our principal executive officer Mr. Charles Allen, who is also our principal financial officer, of the effectiveness of the design and operation of our disclosure controls and procedures as of the end of the period covered by this report.
Based on the foregoing, Mr. Allen concluded that as of and for the year ended December 31, 2013, our disclosure controls and procedures are not effective due to the Company’s limited internal audit functions. This conclusion was in part based on the fact that prior to Mr. Allen joining the Company on February 5, 2014, the Board of Directors was advised on approximately January 18, 2014 by the Company's independent public accountant, Edward Richardson Jr. CPA that its financial statements reviewed and/or audited by Edward Richardson Jr. CPA for the quarters referenced below as filed with the Securities and Exchange Commission could not be relied upon based upon the inadvertent non-disclosure of two 8% convertible notes due May 17, 2015 in the principal amounts of $400,000 and $100,000, respectively, on the balance sheets as of the dates indicated, and accrued interest payable under the convertible notes.
|
Period Ended
|
Form
|
Date Filed with SEC
|
||
|
September 30, 2011
|
10-Q |
November 14, 2011
|
||
|
December 31, 2011
|
10-K |
April 5, 2012
|
||
|
March 31, 2012
|
10-Q |
May 10, 2012
|
||
|
June 30, 2012
|
10-Q |
August 2, 2012
|
||
|
September 30, 2012
|
10-Q |
November 9, 2012
|
||
|
December 31, 2012
|
10-K |
March 28, 2013
|
||
|
March 31, 2013
|
10-Q |
May 15, 2013
|
||
|
June 30, 2013
|
10-Q |
August 14, 2013
|
||
|
September 30, 2013
|
10-K |
November 14, 2013
|
Due to the size and nature of the Company, segregation of all conflicting duties may not always be possible or economically feasible. However, to the extent possible, the Company plans to implement procedures to assure the initiation of transactions, the custody of assets the recording of transactions and the approval of reports will be performed by separate individuals. The Company believes that the foregoing steps will remediate the significant deficiency identified above, and the Company continue to monitor the effectiveness of these steps and make any changes that management deems appropriate. The Company does not believe that the impact of the limitations are material as the Company compensates for the lack of segregation of duties by employing close involvement of management day to day operations and outsourcing to financial consultants.
Management's Report on Internal Control over Financial Reporting
Our management is responsible for establishing and maintaining adequate internal control over financial reporting as defined in Rules 13a-15(f) and 15d-15(f) under the Exchange Act. Management has employed a framework consistent with Exchange Act Rule 13a-15(c), to evaluate internal control over financial reporting described below. Internal control over financial reporting is a process designed to provide reasonable assurance regarding the reliability of financial reporting and the preparation and fair presentation of financial statements for external purposes in accordance with generally accepted accounting principles.
Because of its inherent limitations, internal control over financial reporting may not prevent or detect misstatements. Projections of any evaluation of effectiveness to future periods are subject to the risk that controls may become inadequate because of changes in conditions, or that the degree of compliance with the policies or procedures may deteriorate.
Management, including our principal executive officer Mr. Allen, who is also our principal financial officer, conducted an evaluation of the design and operation of our internal control over financial reporting as of and for the year ended December 31, 2013. In making this assessment, management used the criteria set forth by the Committee of Sponsoring Organizations of the Treadway Commission in Internal Control-Integrated Framework. As a result of this assessment, Mr. Allen concluded that, as of and for the year ended December 31, 2013, our internal control over financial reporting was not effective in providing reasonable assurance regarding the reliability of financial reporting and the preparation of financial statements for external purposes in accordance with generally accepted accounting principles as of the year ended December 31, 2013.
The conclusion that our internal control over financial reporting was not effective was due to the presence of the weaknesses identified above with respect to our disclosure controls and procedures. We anticipate effective internal control over financial reporting once we rectify our deficiencies in our disclosure controls and procedures. However, due to the limited size of our operations and the fact that our sole director and officer approves and carries out all the transactions and reviews and approves all reports, the impact of the ineffective internal control over our financial reporting is immaterial.
This annual report does not include an attestation report of the Company's registered public accounting firm regarding internal control over financial reporting. Management's report was not subject to attestation by the company's registered public accounting firm pursuant to temporary rules of the Securities and Exchange Commission that permit the company to provide only management's report in this annual report.
Restatement of Consolidated Financial Statements
On approximately January 18, 2014, the Company’s Board of Directors was advised by its independent public accountants that its financial statements contained in the Company’s quarterly and annual reports, beginning with the Company’s Quarterly Report on Form 10-Q for the period ended September 30, 2011 until the Company’s Quarterly Report on Form 10-Q for the period ended September 30, 2013, could not be relied upon based upon the inadvertent non-disclosure of two 8% convertible notes due May 17, 2015 in the principal amounts of $400,000 and $100,000, respectively, on the balance sheets as of the dates indicated and accrued interest payable under the Convertible Notes.
The Company plans to devote resources to the remediation and improvement of our internal control over financial reporting. On February 27, 2014 the Company hired a part time comptroller to assist in maintaining the books and records of the Company.
Changes in Internal Control over Financial Reporting
There were no changes in the Company’s internal control over financial reporting during the period covered by this report that have materially affected, or are reasonably likely to materially affect, the Company’s internal control over financial reporting.
None.
The following table presents information with respect to our officers and directors as of the date of this report:
|
Name and Address
|
Age
|
Date First Elected or Appointed
|
Position(s)
|
|||
|
Charles W. Allen
|
38
|
February 5, 2014
|
Chief Executive Officer, Chief Financial Officer and Director
|
|||
|
Michal Handerhan
|
37
|
February 5, 2014
|
Chief Operating Officer, Chairman and Secretary
|
|||
|
Timothy Sidie
|
26
|
February 5, 2014
|
Chief Technology Officer and Director
|
|||
|
Charles Kiser
|
48
|
February 5, 2014
|
Chief Marketing Officer
|
Each director serves until our next annual meeting of the stockholders or unless they resign earlier. The Board of Directors elects officers and their terms of office are at the discretion of the Board of Directors.
Background of Officers and Directors
The following is a brief account of the education and business experience during at least the past five years of our officers and directors, indicating the person’s principal occupation during that period, and the name and principal business of the organization in which such occupation and employment were carried out.
Charles W. Allen,
age 38, was appointed our Chief Executive Officer and Chief Financial Officer and one of our directors upon the closing of the Share Exchange on February 5, 2014. Mr. Allen is responsible for our overall corporate strategy and direction as well as managing our corporate finances. Mr. Allen has extensive experience in business strategy and structuring and executing a variety of investment banking and capital markets transactions, including financings, IPO’s and mergers and acquisitions. From February, 2012 through January, 2014, Mr. Allen was a Managing Director at RK Equity Capital Markets LLC (“RK”) and focused on natural resources investment banking and added to RK's capital markets efforts. In August, 2012 Mr. Allen co-founded RK Equity Investment Corp. (“RKEIC”) and currently serves as a member of its board. RKEIC is an investment company established to co-invest in mining projects with JDS Energy and Mining Inc. Current RKEIC investments include Craigmont Industries Ltd. a coal washing magnetite and iron ore producer. Mr. Allen founded Allen Consulting LLC in January 2010 and currently serves as its president. Allen Consulting LLC provides financial and strategic consulting services to financial advisory firms, investment banks and corporate clients. In January, 2012 Mr. Allen co-founded ZA Investments LLC (“ZA”) and played an integral part in the evaluation of their investment opportunities and oversaw its investment in ADI Logistics, Corp. From January 2012, through April 2013 Mr. Allen served as board member of ADI Logistics, Corp. (“ADI”) a third party logistics company and advised, governed, and oversaw policy and direction, including expansion into west coast operations, as well as providing financial oversight. ZA was dissolved in December 2013 following the successful exit from its investment in ADI. From March, 2010 through June 2012 Mr. Allen was the chief financial officer, secretary and a director of Pantheon China Acquisition Corp. II (“PCACII”) and Pantheon China Acquisition Corp. III (“PCACIII”). PCACII and PCACIII were public special purpose acquisition vehicles created by Mr. Allen and affiliates of Pantheon China Acquisition LTD to provide a means for small and medium size companies to access the U.S. capital markets. Pantheon China Acquisition LTD is a financial advisor and investment bank focused on the unique needs of foreign Small to Medium Enterprises. From October 2009 through May 2012 Mr. Allen was a Managing Director at TriPoint Global Equities, LLC, a boutique investment bank focused on helping small cap companies access the capital markets. Prior to joining TriPoint, Mr. Allen was a Managing Director at Broadband Capital Management LLC, where he also advised small and mid-cap companies concerning capital markets transactions. Mr. Allen worked at Broadband from March 2006 to October 2009. In 2005 Mr. Allen worked as an Associate for the Akul Group, an equity hedge fund and provided fundamental research coverage, investment strategies and risk management analysis. Mr. Allen began his career as a field engineer for Emcore Corporation, where he assisted customers in connection with their compound semiconductor manufacturing capabilities, and as a senior manufacturing engineer for Agility Communications, where he focused on the manufacture and development of tunable lasers for fiber optic communications. Mr. Allen received a B.S. in Mechanical Engineering from Lehigh University and a M.B.A. from the Mason School of Business at the College of William & Mary.
Michal Handerhan
,
age 37, was appointed our Chief Operating Officer and Chairman of the board of directors since the closing of the Share Exchange on February 5, 2014 and was a co-founder of BitcoinShop. Mr. Handerhan was appointed as the Company’s Secretary on March 11, 2014. He supports both our business and development strategy across the management team. From February 2011 through February 2014 Mr. Handerhan served as an independent IT and web services consultant to the National Aeronautics and Space Administration (“NASA”). From October 2005 until February 2014Michal was the President and CEO of Meesha Media Group, LLC which provided high-definition (HD) video production services, Web 2.0 development, database management, and social media solutions. From March 2002 through October 2006 Mr. Handerhan served as a team leader for NASA in their Peer Review Services group. Prior to NASA Peer Review Services Michal served as the web developer for Folio Investments. Mr. Handerhan received a B.S. in Computer Science from Czech Technical University.
Tim Sidie
,
age 26, was appointed our Chief Technical Officer and one of our directors upon closing of the Share Exchange on February 5, 2014 and was a co-founder of BitcoinShop. Mr. Sidie is overseeing the development of our technological plan and platform architecture. From May 2013 through February 2014 Mr. Sidie was a Software Engineer II at the Space Telescope Science Institute in its mission to support the Hubble Space Telescope and develop the James Webb Space Telescope. From June 2011 to July 2013 Mr. Sidie was a Software Engineer at NASA's Goddard Space Flight Center for the Direct Readout Laboratory, building software for earth observing satellite systems. After obtaining his Computer Science degree and prior to 2011, Mr. Sidie was a Support Engineer for Sourcefire, Inc., providing emergency response services to large corporations with pressing security issues. Mr. Sidie attended the University of Delaware from 2006 to 2008 and completed his B.S. in Computer Science from Ursinus College in 2010.
Charles Kiser Jr.
, age 48, was appointed our Chief Marketing Officer upon closing of the Share Exchange on February 5, 2014 and is responsible for our overall marketing and business development strategy. From March 2013 until January 2014 Mr. Kiser was the Chief Operating Officer and Director of Corporate Strategy for 60 Degrees Pharmaceuticals LLC, a Washington DC based pharmaceutical company focused on Tropical Diseases, with operations both in the U.S. and in Australia through its wholly owned subsidiary, 60P Australia, Pty. Ltd. Mr. Kiser remains a member of 60 Degrees Pharmaceuticals LLC. Mr. Kiser served as Director of Sales and Business Development for Apiphany Inc., an early stage application programming interface (“API”) management company also in Washington DC. He supported Apiphany as the first Sales, Marketing and Business Development employee resource from August 2012 to April 2013, and helped prepare the company for a successful acquisition by Microsoft in October 2013. From August 2010 until August 2011 Mr. Kiser consulted for, and then was employed by KZO Innovations Inc., an on-demand video management platform provider, as Director of Business Development. From December 2008 until June 2010 Mr. Kiser, as both a consultant and then employee, served as Vice President of Sales and Business Development for FortiusOne Inc., later renamed GeoIQ, Inc. Mr. Kiser has also served various other technology clients over the years as Chief Marketing Officer and Vice President of Sales. Along with serving as an Advisor to several early stage startup companies in the Washington DC region, Mr. Kiser is a Venture Mentor for AccelerateDC, the Washington, DC Economic Partnership Mentorship Program. Mr. Kiser graduated from West Virginia University in 1987 with a BS/BA Degree in Finance.
Board Leadership Structure and Role in Risk Oversight
Since February 5, 2014, we have separated the roles of Chairman of the Board and Chief Executive Officer. Although the separation of roles has been appropriate for us during that time period, in the view of the board of directors, the advisability of the separation of these roles depends upon the specific circumstances and dynamics of our leadership.
As Chairman of the Board, Mr. Handerhan serves as the primary liaison between the CEO and the Board and provides strategic input and counseling to the CEO. With input from other members of the board of directors and management, he presides over meetings of the board of directors. Mr. Handerhan has developed an extensive knowledge of our company, its challenges and opportunities and has a productive working relationship with our senior management team.
The board of directors, as a unified body and through committee participation, organizes the execution of its monitoring and oversight roles and does not expect its Chairman to organize those functions. Our primary rationale for separating the positions of Board Chairman and the CEO is the recognition of the time commitments and activities required to function effectively as Chairman and as the CEO of a company with a relatively flat management structure. The separation of roles has also permitted the board of directors to recruit senior executives into the CEO position with skills and experience that meet the board of director’s planning for the position who may not have extensive public company board experience.
Risk is inherent with every business, and how well a business manages risk can ultimately determine its success. Management is responsible for the day-to-day management of risks the company faces, while the board of directors, as a whole and through its committees, has responsibility for the oversight of risk management. In its risk oversight role, the board of directors has the responsibility to satisfy itself that the risk management processes designed and implemented by management are adequate and functioning as designed.
The board of directors believes that establishing the right “tone at the top” and that full and open communication between executive management and the board of directors are essential for effective risk management and oversight. Our CEO communicates frequently with members of the board to discuss strategy and challenges facing the company.
Code of Ethics
We have not yet adopted a code of ethics that applies to our principal executive officers, principal financial officer, principal accounting officer or controller, or persons performing similar functions, since we have been focusing our efforts on obtaining financing for the Company. We expect to adopt a code as we develop our business.
Family Relationships
There are no family relationships between any of our directors, executive officers or directors.
Committees of the Board of Directors
Due to our size, we have not formally designated a nominating committee, an audit committee, a compensation committee, or committees performing similar functions.
The Board currently acts as our audit committee. Since we are still a developing company, the Board of Directors is still in the process of finding an “audit committee financial expert” as defined in Regulation S-K.
Compensation Committee Interlocks and Insider Participation
None of our executive officers serves as a member of the Board of Directors or compensation committee of any other entity that has one or more of its executive officers serving as a member of our Board of Directors.
Involvement in Certain Legal Proceedings
During the past ten years, none of our officers, directors, promoters or control persons has been involved in any legal proceedings as described in Item 401(f) of Regulation S-K.
Section 16(a) Beneficial Ownership Reporting Compliance
Section 16(a) of the Exchange Act requires our directors, executive officers, and persons who own more than 10% of our common stock to file reports of ownership and changes in ownership of our common stock with the SEC. Based on the information available to us during the fiscal year ended December 31, 2013, we believe that all applicable Section 16(a) filing requirements were met on a timely basis.
The following summary compensation table sets forth information concerning compensation for services rendered in all capacities during the fiscal years ended December 31, 2013 and 2012 awarded to, earned by or paid to our executive officers.
|
SUMMARY COMPENSATION TABLE
|
|||||||||||||||||||||||||||
|
Name and
principal position
|
Year
|
Salary
($)
|
Bonus
($)
|
Stock
Awards
($)
|
Option
Awards
($)
|
Non-Equity
Incentive Plan
Compensation
($)
|
Non-qualified
Deferred
Compensation
Earnings ($)
|
All Other
Compensation
($)
|
Total
($)
|
||||||||||||||||||
|
Ronald George Murphy
(1)
|
2013
|
82,400
|
82,400
|
||||||||||||||||||||||||
|
2012
|
144,000
|
0
|
0
|
0
|
0
|
0
|
0
|
144,000
|
|||||||||||||||||||
|
|
|||||||||||||||||||||||||||
|
Andrew Stuart Brabin
(2)
|
2013
|
82,400
|
82,400
|
||||||||||||||||||||||||
|
2012
|
144,000
|
0
|
0
|
0
|
0
|
0
|
0
|
144,000
|
|||||||||||||||||||
|
(1)
|
Mr. Murphy resigned from all positions with the Company in May 2013.
|
|
(2)
|
Mr. Brabin resigned from all positions with the Company on February 5, 2014.
|
Employment Agreements with Executive Officers
Andrew Brabin
Mr. Brabin’s employment agreement provideed for an annual base salary of $144,000.00. In addition, Mr. Brabin is entitled to receive an annual bonus determined by the Board of Directors along with vacation days and reimbursement for all reasonable business expenses. In the event that Mr. Brabin’s employment is terminated without cause (as defined in the agreement), change of control (as defined in the agreement), disability, or by the employee for good reason, then Mr. Brabin is entitled to an amount equal to his base salary as of his last day of employment for a period of 36 months from the date of termination. In the event that Mr. Brabin’s employment is terminated for cause or other than for good reason, he is entitled to any base salary earned but not paid through the date of termination, plus any accrued vacation time, and any other monies owed to him by the Company. Mr. Brabin resigned from all positions held by him with the Company on February 5, 2014. In February 2014, Mr. Brabin waived the right to receive any fees owed to him relating to his position as a prior officer or director of the Company.
Ronald Murphy
Mr. Murphy’s employment agreement provided for an annual base salary of $144,000.00. In addition, Mr. Murphy is entitled to receive an annual bonus determined by the Board of Directors along with vacation days and reimbursement for all reasonable business expenses. In the event that Mr. Murphy’s employment is terminated without cause (as defined in the agreement), change of control (as defined in the agreement), disability, or by the employee for good reason, Mr. Murphy is entitled to an amount equal to his base salary as of his last day of employment for a period of 36 months from the date of termination. In the event that Mr. Murphy’s employment is terminated for cause or other than for good reason, he is entitled to any base salary earned but not paid through the date of termination, plus any accrued vacation time, and any other monies owed to him by the Company. Mr. Murphy resigned from all positions with the Company on May 10, 2013. In February 2014, Mr. Murphy waived the right to receive any fees owed to him relating to his position as a prior officer or director of the Company.
Charles W. Allen.
On February 5, 2014, we entered into an employment agreement with Charles W. Allen (the “Allen Employment Agreement”), whereby Mr. Allen agreed to serve as our Chief Executive Officer and Chief Financial Officer for a period of two (2) years, subject to renewal, in consideration for an annual salary of $150,000. Additionally, under the terms of the Allen Employment Agreement, Mr. Allen shall be eligible for an annual bonus if the Company meets certain criteria, as established by the Board of Directors. Mr. Allen shall be entitled to participate in all benefits plans the Company provides to its senior executive. The Company shall reimburse Mr. Allen for all reasonable expenses incurred in the course of his employment. In the event Mr. Allen’s employment is terminated without Cause or by Mr. Allen with Good Reason (as such term is defined in the Allen Employment Agreement), Mr. Allen shall be entitled to a scaled severance package, including scaled salary benefits, 12 months of benefits commensurate to senior executives, and pro-rated bonuses earned. Additionally, pursuant to the terms of the Allen Employment Agreement, the Company has agreed to execute and deliver in favor of Mr. Allen an indemnification agreement and to maintain directors’ and officers’ insurance with terms and in the amounts commensurate with a senior executive of the Company.
In connection with his employment with the Company, the Company granted Mr. Allen a five-year stock option to purchase up to 1,550,368 shares of the Company’s common stock at an exercise price of $0.50 per share (the “Allen Options”), which options shall vest in twelve (12) equal monthly installments, beginning on the one (1) year anniversary of the date of issuance and every one (1) month anniversary thereafter, provided Mr. Allen remains continuously engaged as a director or officer of the Company through the applicable vesting date. In the event that Mr. Allen is removed as a director, officer or employee by the Company at any time other than for “Cause” or resigns as a director, officer or employee for “Good Reason” the Allen Options shall immediately vest in full.
Michael Handerhan
On February 5, 2014, we entered into an employment agreement with Michal Handerhan (the “Handerhan Employment Agreement”), whereby Mr. Handerhan agreed to serve as our Chief Operating Officer and Chairman for a period of two (2) years, subject to renewal, in consideration for an annual salary of $160,000. Additionally, under the terms of the Handerhan Employment Agreement, Mr. Handerhan shall be eligible for an annual bonus if the Company meets certain criteria, as established by the Board of Directors. Mr. Handerhan shall be entitled to participate in all benefits plans the Company provides to its senior executive. The Company shall reimburse Mr. Handerhan for all reasonable expenses incurred in the course of his employment. In the event Mr. Handerhan’s employment is terminated without Cause or by Mr. Handerhan with Good Reason (as such term is defined in the Handerhan Employment Agreement), Mr. Handerhan shall be entitled to a scaled severance package, including scaled salary benefits, 12 months of benefits commensurate to senior executives, and pro-rated bonuses earned. Additionally, pursuant to the terms of the Handerhan Employment Agreement, the Company has agreed to execute and deliver in favor of Mr. Handerhan an indemnification agreement and to maintain directors’ and officers’ insurance with terms and in the amounts commensurate with a senior executive of the Company.
In connection with his employment with the Company, the Company granted Mr. Handerhan a five-year stock option to purchase up to 1,550,368 shares of the Company’s common stock at an exercise price of $0.50 per share (the “Handerhan Options”), which options shall vest in twelve (12) equal monthly installments, beginning on the one (1) year anniversary of the date of issuance and every one (1) month anniversary thereafter, provided Mr. Handerhan remains continuously engaged as a director or officer of the Company through the applicable vesting date. In the event that Mr. Handerhan is removed as a director, officer or employee by the Company at any time other than for “Cause” or resigns as a director, officer or employee for “Good Reason” the Handerhan Options shall immediately vest in full.
Tim Sidie
On February 5, 2014, we entered into an employment agreement with Timothy Sidie (the “Sidie Employment Agreement”), whereby Mr. Sidie agreed to serve as our Chief Technology Officer for a period of two (2) years, subject to renewal, in consideration for an annual salary of $140,000. Additionally, under the terms of the Sidie Employment Agreement, Mr. Sidie shall be eligible for an annual bonus if the Company meets certain criteria, as established by the Board of Directors. Mr. Sidie shall be entitled to participate in all benefits plans the Company provides to its senior executive. The Company shall reimburse Mr. Sidie for all reasonable expenses incurred in the course of his employment. In the event Mr. Sidie’s employment is terminated without Cause or by Mr. Sidie with Good Reason (as such term is defined in the Sidie Employment Agreement), Mr. Sidie shall be entitled to a scaled severance package, including scaled salary benefits, 12 months of benefits commensurate to senior executives, and pro-rated bonuses earned. Additionally, pursuant to the terms of the Sidie Employment Agreement, the Company has agreed to execute and deliver in favor of Mr. Sidie an indemnification agreement and to maintain directors’ and officers’ insurance with terms and in the amounts commensurate with a senior executive of the Company.
In connection with his employment with the Company, the Company granted Mr. Sidie a five-year non-qualified stock option to purchase up to 1,550,368 shares of the Company’s common stock at an exercise price of $0.50 per share (the “Sidie Options”), which options shall vest in twelve (12) equal monthly installments, beginning on the one (1) year anniversary of the date of issuance and every one (1) month anniversary thereafter, provided Mr. Sidie remains continuously engaged as a director or officer of the Company through the applicable vesting date. In the event that Mr. Sidie is removed as a director, officer or employee by the Company at any time other than for “Cause” or resigns as a director, officer or employee for “Good Reason” the Sidie Options shall immediately vest in full.
Charles Kiser
On February 5, 2014, we entered into an employment agreement with Charles A. Kiser (the “Kiser Employment Agreement”), whereby Mr. Kiser agreed to serve as our Chief Executive Officer and Chief Financial Officer for a period of one (1) year, subject to renewal, in consideration for an annual salary of $135,000. Additionally, under the terms of the Kiser Employment Agreement, Mr. Kiser shall be eligible for an annual bonus if the Company meets certain criteria, as established by the Board of Directors. Mr. Kiser shall be entitled to participate in all benefits plans the Company provides to its senior executive. The Company shall reimburse Mr. Kiser for all reasonable expenses incurred in the course of his employment. In the event Mr. Kiser’s employment is terminated without Cause or by Mr. Kiser with Good Reason (as such term is defined in the Allen Employment Agreement), Mr. Kiser shall be entitled to a scaled severance package, including scaled salary benefits, 12 months of benefits commensurate to senior executives, and pro-rated bonuses earned. Additionally, pursuant to the terms of the Kiser Employment Agreement, the Company has agreed to execute and deliver in favor of Mr. Kiser an indemnification agreement and to maintain directors’ and officers’ insurance with terms and in the amounts commensurate with a senior executive of the Company.
In connection with his employment with the Company, the Company granted Mr. Kiser a five-year non-qualified stock option to purchase up to 1,550,368 shares of the Company’s common stock at an exercise price of $0.50 per share (the “Kiser Options”), which options shall vest in twelve (12) equal monthly installments, beginning on the one (1) year anniversary of the date of issuance and every one (1) month anniversary thereafter, provided Mr. Kiser remains continuously engaged as a director or officer of the Company through the applicable vesting date. In the event that Mr. Kiser is removed as a director, officer or employee by the Company at any time other than for “Cause” or resigns as a director, officer or employee for “Good Reason” the Kiser Options shall immediately vest in full.
Grants of Plan Based Award
None.
Outstanding Equity Awards At Fiscal Year-end Table
None.
Compensation of Directors Table
The table below summarizes all compensation paid to our directors for our last completed fiscal year.
|
DIRECTOR COMPENSATION
|
||||||||||||||||||||||||||||
|
Name
|
Fees Earned
or
Paid in
Cash
($)
|
Stock
Awards
($)
|
Option Awards
($)
|
Non-Equity
Incentive
Plan
Compensation
($)
|
Non-Qualified
Deferred
Compensation
Earnings
($)
|
All
Other
Compensation
($)
|
Total
($)
|
|||||||||||||||||||||
|
Andrew Brabin
|
82,400
|
0
|
0
|
0
|
0
|
0
|
82,400
|
*
|
||||||||||||||||||||
|
Ronald Murphy
|
82,400
|
0
|
0
|
0
|
0
|
0
|
82,400
|
*
|
||||||||||||||||||||
*Represents fees earned but unpaid. The Company was released of its obligation to pay any accrued but unpaid director fees to Mr. Brabin and Mr. Murphy on February 5, 2014.
Narrative Disclosure to the Director Compensation Table
Due to financial constraints typical of those faced by a company in this stage of its growth, the company has not paid the officers in full for 2013. These costs reside in the related party transactions (as monies owed) of our financial statements. The company officers draw on these monies owed when the company is in a position to pay them.
The following table sets forth certain information regarding beneficial ownership of our common stock as of March 26, 2014 and as of the date of this Report: (i) by each of our directors, (ii) by each of the Named Executive Officers, (iii) by all of our executive officers and directors as a group, and (iv) by each person or entity known by us to beneficially own more than five percent (5%) of any class of our outstanding shares.
|
Title of class
|
Name and address of beneficial owner
(2)
|
Amount and nature of beneficial ownership
(1)
|
Percent of class
(1)
|
||||||
|
Officers and Directors
|
|||||||||
|
Common stock
|
Charles W. Allen
|
25,193,481 | (3) | 20.25 | % | ||||
|
Common stock
|
Michal Handerhan
|
36,278,612 | (3) | 29.15 | % | ||||
|
Common stock
|
Tim Sidie
|
24,185,741 | (3) | 19.44 | % | ||||
|
Common Stock
|
Charles Kiser
|
12,596,740 | (3) | 10.12 | % | ||||
|
Common stock
|
All officers and directors as a group (four persons)
|
98,254,574 | (3) | 78.96 | % | ||||
*Represents less than 1%.
|
(1)
|
Percentage ownership is determined based on shares owned together with securities exercisable or convertible into shares of common stock within 60 days of March 26, 2014, for each stockholder. Beneficial ownership is determined in accordance with the rules of the SEC and generally includes voting or investment power with respect to securities. Shares of common stock subject to securities exercisable or convertible into shares of common stock that are currently exercisable or exercisable within 60 days of March 26, 2014, are deemed to be beneficially owned by the person holding such securities for the purpose of computing the percentage of ownership of such person, but are not treated as outstanding for the purpose of computing the percentage ownership of any other person. As of March 26, 2014, there were 124,440,204 shares of our common stock issued and outstanding.
|
|
(2)
|
The address of these persons, unless otherwise noted, is C/O Bitcoin Shop, Inc., 10020 Raynor Road, Silver Spring, MD 20901.
|
|
(3)
|
Excludes options to purchase shares of common stock not exercisable within 60 days.
|
Review of Related Person Transactions
We do not have a formal written policy for the review and approval of transactions with related parties. Our Board of Directors is responsible for reviewing and approving or ratifying related-persons transactions.
Related Person Transactions
The related party transactions for the period covered by this report are the salaries of our directors which remain unpaid due to cash restraints on the company’s finances. In February 2014, Mr. Brabin and Mr. Murphy each waived the right to receive any fees owed to him relating to his position as a prior officer or director of the Company. Current related party transactions are with Kamron Inc which is Ronnie Murphy’s USA Tax entity and ASB Trading, which is Andrew Brabin’s UK Tax entity – both are used for payroll.
Director Independence
Our common stock is quoted on the OTCQB quotation system, which does not have director independence requirements. Using the definition of independence set forth in the rules of the NASDAQ Stock Market, none of our directors would be considered an independent director of the Company.
IT
EM
14. PRINCIPAL ACCOUNTING FEES AND SERVICES
During the years ended December 31, 2013 and 2012, we engaged Edward Richardson Jr., CPA as our independent auditor. For the years ended December 31, 2013, and 2012, we incurred fees as discussed below:
|
Fiscal Year Ended
|
||||||||
|
December 31, 2013
|
December 31, 2012
|
|||||||
|
Audit fees and auditors’ review fees
|
$
|
10,000
|
$
|
10,000
|
||||
|
Audit – related fees
|
$
|
0
|
$
|
0
|
||||
|
Tax fees
|
$
|
0
|
$
|
0
|
||||
|
All other fees
|
$
|
0
|
$
|
0
|
||||
Audit fees consist of fees related to professional services rendered in connection with the audit of our annual financial statements. All other fees relate to professional services rendered in connection with the review of the quarterly financial statements.
Our policy is to pre-approve all audit and permissible non-audit services performed by the independent accountants. These services may include audit services, audit-related services, tax services and other services. Under our policy, pre-approval is generally provided for particular services or categories of services, including planned services, project based services and routine consultations. In addition, the Board of Directors may also pre-approve particular services on a case-by-case basis. Our Board of Directors approved all services that our independent accountants provided to us in the past two fiscal years.
|
Exhibit No.
|
Document Description
|
|
|
3.1
|
Amended and Restated Articles of Incorporation (incorporated by reference to Exhibit 2.1 of Form 8-K filed on May 12, 2010)
|
|
|
3.2
|
Bylaws of TouchIT Technologies, Inc. (incorporated by reference to Exhibit 3.2 of Form S-1 filed May 29, 2008)
|
|
|
3.3
|
Amendment to Articles of Incorporation filed with the Nevada Secretary of State on January 30, 2014 regarding change in name. (Incorporated by reference to the Current Report on Form 8-K filed on February 5, 2014)
|
|
|
3.4
|
Amendment to Articles of Incorporation filed with the Nevada Secretary of State on January 31, 2014 regarding authorized capital. (Incorporated by reference to the Current Report on Form 8-K filed on February 5, 2014)
|
|
|
3.5
|
Certificate of Designations of Rights, Preferences and Limitations of Series B Convertible Preferred Stock filed with the Nevada Secretary of State on February 3, 2014 (Incorporated by reference to the Current Report on Form 8-K filed on February 5, 2014)
|
|
|
3.6
|
Certificate of Designation of Series C Preferred Stock filed with the Nevada Secretary of State on February 5, 2014 (Incorporated by Reference to the Current Report on Form 8-K filed on February 6, 2014)
|
|
|
10.1
|
Form of Amended and Restated Denville & Dover Convertible Note dated January 24, 2014 (Incorporated by reference to the Current Report on Form 8-K filed on February 5, 2014)
|
|
|
10.2
|
Form of Amended and Restated BASE Group Convertible Note dated January 24, 2014 (Incorporated by reference to the Current Report on Form 8-K filed on February 5, 2014)
|
|
|
10.7
|
Form of Denville & Dover Securities Exchange Agreement dated February 5, 2014 (Incorporated by reference to the Current Report on Form 8-K filed on February 5, 2014)
|
|
|
10.8
|
Form of BASE Group Securities Exchange Agreement dated February 5, 2014 (Incorporated by reference to the Current Report on Form 8-K filed on February 5, 2014)
|
|
|
10.9
|
2014 Equity Incentive Plan of Bitcoin Shop Inc. (Incorporated by reference to the Current Report on Form 8-K filed on February 5, 2014)
|
|
|
10.10
|
Novation agreement dated January 30, 2014 by and among Touchit Technologies Inc., Sahara Presentation Systems PLC, and Touchit Technologies Holdings Inc. (Incorporated by reference to the Current Report on Form 8-K filed on February 5, 2014)
|
|
|
10.11
|
Share Exchange Agreement (Incorporated by Reference to the Current Report on Form 8-K filed on February 6, 2014)
|
|
|
10.12
|
Employment Agreement between the Company and Charles Allen dated February 5, 2014 (Incorporated by Reference to the Current Report on Form 8-K filed on February 6, 2014)
|
|
|
10.13
|
Employment Agreement between the Company and Michal Handerhan dated February 5, 2014 (Incorporated by Reference to the Current Report on Form 8-K filed on February 6, 2014)
|
|
|
10.14
|
Employment Agreement between the Company and Tim Sidie dated February 5, 2014 (Incorporated by Reference to the Current Report on Form 8-K filed on February 6, 2014)
|
|
|
10.15
|
Employment Agreement between the Company and Charles Kiser dated February 5, 2014 (Incorporated by Reference to the Current Report on Form 8-K filed on February 6, 2014)
|
|
|
10.16
|
Form of Indemnification Agreement (Incorporated by Reference to the Current Report on Form 8-K filed on February 6, 2014)
|
|
|
10.17
|
Form of Founder Lockup Agreement (Incorporated by Reference to the Current Report on Form 8-K filed on February 6, 2014)
|
|
|
10.18
|
Form of Subscription Agreement Agreement (Incorporated by Reference to the Current Report on Form 8-K filed on February 6, 2014)
|
|
|
10.19
|
Form of Warrant Agreement (Incorporated by Reference to the Current Report on Form 8-K filed on February 6, 2014)
|
|
|
10.20
|
Asset Purchase and Debt Assumption Agreement (Incorporated by Reference to the Current Report on Form 8-K filed on February 6, 2014)
Agreement and Release between the Company and Andrew Brabin Agreement (Incorporated by Reference to the Current Report on Form 8-K filed on February 6, 2014)
Agreement and Release between the Company and Ronald Murphy Agreement (Incorporated by Reference to the Current Report on Form 8-K filed on February 6, 2014)
|
|
|
21.1
|
List of subsidiaries*
|
|
|
23.1
|
Consent of Edward Richardson Jr., CPA*
|
|
|
31
|
Certification of the Principal Executive Officer and Principal Financial Officer pursuant to Rules 13a-14(a) and 15d-14(a), as adopted pursuant to Section 302 of the Sarbanes-Oxley Act of 2002*
|
|
|
32
|
Certification of the Principal Executive Officer and Principal Financial Officer pursuant to 18 U.S.C Section 1350, as adopted pursuant to Section 906 of the Sarbanes-Oxley Act of 2002.**
|
|
|
101.INS
|
XBRL Instance Document*
|
|
|
101.SCH
|
XBRL Taxonomy Extension Schema Document*
|
|
|
101.CAL
|
XBRL Taxonomy Extension Calculation Linkbase Document*
|
|
|
101.DEF
|
XBRL Taxonomy Extension Definition Linkbase Document*
|
|
|
101.LAB
|
XBRL Taxonomy Extension Label Linkbase Document*
|
|
|
101.PRE
|
XBRL Taxonomy Extension Presentation Linkbase Document*
|
_______
|
*
|
Filed herewith.
|
|
**
|
Furnished herewith.
|
S
IGNA
TURES
In accordance with Section 13 or 15(d) of the Exchange Act, the registrant caused this report to be signed on its behalf by the undersigned, thereunto duly authorized on March 28, 2014.
|
BITCOIN SHOP, INC.
|
|||
|
Date: March 28, 2014
|
By:
|
/s/ Charles Allen
|
|
|
Charles W. Allen
|
|||
|
Chief Executive Officer and Chief Financial Officer (Principal Executive Officer and Principal Financial and Accounting Officer)
|
|||
In accordance with the Exchange Act, this report has been signed below by the following persons on behalf of Bitcoin Shop, Inc. and in the capacities and on the dates indicated.
| Signature | Title | Date | ||
| /s/ Charles Allen | Chief Executive Officer and Chief Financial Officer (Principal Executive Officer and Principal Financial and Accounting Officer) | March 28, 2014 | ||
|
Charles W. Allen
|
||||
| /s/ Michal Handerhan |
Chief Operating Officer, Chairman and Secretary
|
March 28, 2014 | ||
| Michal Handerhan | ||||
| /s/ Tim Sidie | Chief Technology Officer and Director | March 28, 2014 | ||
| Tim Sidie | ||||
| /s/ Charles Kiser | Chief Marketing Officer | March 28, 2014 | ||
| Charles Kiser |
Edward Richardson Jr. , CPA
15565 Northland Dr W Ste 508
Southfield Ml 48075
248-559-4514
Independent Auditor's Report
Board of Directors
TouchIt Technologies, Inc.
Report on the Financial Statements
I have audited the accompanying statement of financial condition of TouchIt Technologies, Inc. as December 31, 2013 and the related statements of income, changes in stockholder's equity, changes in liabilities to claims of general creditors, and cash flows for the year ended that are filed pursuant to Rule 17a-5 under the Securities Exchange Act of 1934, and the related notes to the financial statements.
Management's Responsibility for the Financial Statements
Management is responsible for the presentation and fair presentation of these financial statements with accounting principles generally accepted in the United States of America; this includes the design, implementation, and maintenance of internal control relevant to the preparation and fair presentation of financial statements that are free from material misstatement, whether due to fraud or error.
Auditor's Responsibility
My responsibility is to express an opinion on these financial statements based on my audit. I conducted my audit in accordance with auditing standards generally accepted in the United States of America. Those standards require that we plan and perfonn the audit to obtain assurance about whether the financial statements are free of material misstatement.
An audit involves performing procedures to obtain audit evidence about the amounts and disclosures in the financial statements. The procedures selected depend on the auditor's judgment, including the assessment of the risks of material misstatement of the financial statements, whether due to fraud or error. In making those risk assessments, the auditor considers internal control relevant to the Company's preparation and fair presentation of the financial statements in order to design audit procedures that are appropriate in the circumstances, but not for the purpose of expressing an opinion of the effectiveness of the Company's internal control. Accordingly, we express no such opinion. An audit also includes evaluating the appropriateness of accounting policies used and reasonableness of significant accounting estimates made by management, as well as evaluating the overall presentation of the financial statements.
I believe that the audit evidence I have obtained is sufficient and appropriate to provide a basis for my opinion.
Opinion
In my opinion, the financial statements referred to above present fairly, in all material respects, the financial position of Touchit Technologies, Inc. as of December 31. 2013, and results of operations and its cash flows for the year then ended in accordance with principles generally accepted in the United States of America.
/s/Edward Richarson Jr., CPA
Edward Richarson Jr., CPA
Southfield, MI. 48075
March 14,2014
TOUCHIT TECHNOLOGIES, INC
BA
LAN
CE SHEETS
FOR THE PERIODS ENDED 31 DECEMBER 2013 & 2012
(Amounts expressed in US Dollars (USD) in full unless otherwise indicated)
|
CURRENT ASSETS
|
12/31/2013
|
12/31/2012
|
|||||
|
Cash and cash equivalents
|
20,778
|
6,412
|
|||||
|
Trade receivables, net
|
68,364
|
64,170
|
|||||
|
Due from related parties
|
-
|
-
|
|||||
|
Due from Shareholders
|
-
|
-
|
|||||
|
Inventories
|
28,249
|
111,461
|
|||||
|
Prepaid Inventory
|
28,000
|
-
|
|||||
|
Other Current Assets
|
28,552
|
-
|
|||||
|
Total current assets
|
173,943
|
182,043
|
|||||
|
NON CURRENT ASSETS
|
|||||||
|
Property, plant and equipment,net
|
27,180
|
6,076
|
|||||
|
Other non current assets
|
400,000
|
400,000
|
|||||
|
Total non current assets
|
427,180
|
406,076
|
|||||
|
TOTAL ASSETS
|
601,123
|
588,119
|
|||||
|
CURRENT LIABILITIES
|
|||||||
|
Borrowings
|
-
|
-
|
|||||
|
Trade payables
|
265,648
|
274,352
|
|||||
|
Due to shareholders
|
-
|
-
|
|||||
|
Due to related parties
|
96,699
|
261,499
|
|||||
|
Other current liabilities
|
99,776
|
11,310
|
|||||
|
Total current liabilities
|
462,123
|
547,161
|
|||||
|
NON CURRENT LIABILITIES
|
|||||||
|
Borrowings
|
-
|
-
|
|||||
|
Employee termination benefits
|
-
|
-
|
|||||
|
Reserve for retirement pay
|
-
|
-
|
|||||
|
Convertible Notes
|
629,856
|
583,200
|
|||||
|
Total non current liabilities
|
629,856
|
583,200
|
|||||
|
COMMITMENTS AND CONTINGENCIES
|
|||||||
|
SHAREHOLDERS' EQUITY
|
|||||||
|
Share capital
|
544,303
|
544,303
|
|||||
|
Retained earnings
|
(1,133,518
|
) |
(1,061,404
|
) | |||
|
Net income / (loss) for the period
|
98,359
|
(25,141
|
) | ||||
|
Total shareholders’ equity
|
(490,856
|
) |
(542,241
|
) | |||
|
TOTAL LIABILITIES AND
|
|||||||
|
SHAREHOLDERS' EQUITY
|
601,123
|
588,119
|
|||||
TOUCHIT TECHNOLOGIES, INC
FOR THE PERIODS ENDED 31 DECEMBER 2013 & 2012
(Amounts expressed in US Dollars (USD) in full unless otherwise indicated)
|
12/31/2013
|
12/31/2012
|
|||||||
|
NET SALES
|
1,610,704 | 1,287,709 | ||||||
|
COST OF SALES
|
1,111,310 | 885,021 | ||||||
|
Gross profit
|
499,394 | 402,688 | ||||||
|
MARKETING AND SELLING EXPENSE
|
33,779 | 112,304 | ||||||
|
GENERAL AND ADMINISTRATIVE EXPENSES
|
376,944 | 319,399 | ||||||
|
Profit from operations
|
88,671 | (29,442 | ) | |||||
|
OTHER INCOME AND EXPENSES,net
|
-- | 4,301 | ||||||
|
FINANCIAL INCOME AND EXPENSES, net
|
-- | -- | ||||||
|
Profit Loss before taxation and currency translation gain/(loss)
|
88,671 | (25,141 | ) | |||||
|
TAXATION CHARGE
|
-- | -- | ||||||
|
Taxation current
|
-- | -- | ||||||
|
Deferred
|
-- | -- | ||||||
|
CURRENCY TRANSLATION GAIN/(LOSS)
|
(1,485 | ) | -- | |||||
|
Net income/(loss) for the year
|
87,186 | (25,141 | ) | |||||
|
OTHER COMPREHENSIVE INCOME
|
11,172 | -- | ||||||
|
Total comprehensive income
|
98,358 | (25,141 | ) | |||||
TOUCHIT TECHNOLOGIES, INC
FOR THE PERIODS ENDED 31 DECEMBER 2013 & 2012
(Amounts expressed in US Dollars (USD) in full unless otherwise indicated)
|
12/31/2013
|
12/31/2012
|
|||||||
|
CASH FLOWS FROM OPERATING ACTIVITIES
|
||||||||
|
Net income
|
98,359 | (25,141 | ) | |||||
|
Adjustments to reconcile net income to net cash provided
|
(46,982 | ) | (439,207 | ) | ||||
|
By operating activities:
|
||||||||
| Depreciation and amortisation | 2,627 | 427 | ||||||
| Provision for employee benefit | -- | |||||||
|
Changes in operating assets and liabilities
|
||||||||
|
Trade receivables, net
|
(32,746 | ) | 176,698 | |||||
|
Due from shareholders
|
-- | -- | ||||||
|
Due from related parties
|
-- | -- | ||||||
|
Inventories
|
55,212 | (55,772 | ) | |||||
|
Other current assets
|
-- | |||||||
|
Other non current assets
|
-- | |||||||
|
Trade payables
|
(8,704 | ) | (172,949 | ) | ||||
|
Due to shareholders
|
-- | -- | ||||||
|
Due to related parties
|
-- | -- | ||||||
|
Other current liabilities
|
185,164 | (16,080 | ) | |||||
|
Convertible Notes
|
-- | -- | ||||||
|
Net cash generated from (used for) operating activities
|
252,930 | (532,024 | ) | |||||
|
CASH FLOWS FROM FINANCING ACTIVITIES
|
||||||||
|
Increase/(decrease) in short-term borrowings
|
-- | |||||||
|
Increase/(decrease) in long-term borrowings
|
(214,843 | ) | 471,432 | |||||
|
Dividends paid
|
-- | -- | ||||||
|
Net cash (used for) provided from financing activities
|
(214,843 | ) | 471,432 | |||||
|
CASH FLOWS FROM INVESTING ACTIVITIES
|
||||||||
|
Purchases of property, plant and equipment and intangible assets
|
(23,721 | ) | (3,284 | ) | ||||
|
Share capital increase
|
||||||||
|
Net cash used for investing activities
|
(23,721 | ) | (3,284 | ) | ||||
|
NET INCREASE / (DECREASE) IN CASH AND BANKS
|
14,365 | (63,877 | ) | |||||
|
CASH AND BANKS AT BEGINNING OF THE YEAR
|
6,413 | 70,289 | ||||||
|
CASH AND BANKS AT END OF THE PERIOD
|
20,778 | 6,412 | ||||||
TOUCHIT TECHNOLOGIES, INC.
STATEMENT OF CHANGES IN STOCKHOLDER'S EQUITY
FOR THE PERIOD ENDED DECEMBER 31, 2013 & 2012
|
Common Stock
|
Preferred Stock
|
Paid-in Capital
|
Treasury Stock
|
Retained
Earnings
|
Total
Stockholder's
Equity
|
|||||||||||||||||||||||||||||||||||
|
Shares
|
Amount
|
Shares
|
Amount
|
Shares
|
Amount
|
Shares
|
Amount
|
Amount
|
Amount
|
|||||||||||||||||||||||||||||||
|
Balance at January 1, 2012
|
47,220,000 | $ | 127,570 | $ | - | $ | - | 47,220,000 | $ | 416,733 | - | $ | - | $ | (1,024,389 | ) | $ | (480,086 | ) | |||||||||||||||||||||
|
Net Income
|
- | - | - | - | - | - | - | - | $ | (25,141 | ) | $ | (25,141 | ) | ||||||||||||||||||||||||||
|
Capital Transactions
|
- | - | - | - | - | - | - | - | - | - | ||||||||||||||||||||||||||||||
|
Prior Period Adjustments
|
- | - | - | - | - | - | - | - | (37,015 | ) | (37,015 | ) | ||||||||||||||||||||||||||||
|
Balance at December 31, 2012
|
74,189,419 | $ | 127,570 | $ | - | $ | - | 127,570 | $ | 416,733 | - | $ | - | $ | (1,086,545 | ) | $ | (542,241 | ) | |||||||||||||||||||||
|
Common Stock
|
Preferred Stock
|
Paid-in Capital
|
Treasury Stock
|
Retained
Earnings
|
Total
Stockholder's
Equity
|
|||||||||||||||||||||||||||||||||||
|
Shares
|
Amount
|
Shares
|
Amount
|
Shares
|
Amount
|
Shares
|
Amount
|
Amount
|
Amount
|
|||||||||||||||||||||||||||||||
|
Balance at January 1, 2013
|
137,220,000 | $ | 127,570 | $ | - | $ | - | 137,220,000 | $ | 416,733 | - | $ | - | $ | (1,086,545 | ) | $ | (542,241 | ) | |||||||||||||||||||||
|
Net Income
|
- | - | - | - | - | - | - | - | $ | 98,359 | $ | 98,359 | ||||||||||||||||||||||||||||
|
Capital Transactions
|
- | - | - | - | - | - | - | - | - | - | ||||||||||||||||||||||||||||||
|
Prior Period Adjustments
|
- | - | - | - | - | - | - | - | (46,973 | ) | (46,973 | ) | ||||||||||||||||||||||||||||
|
Balance at December 31, 2013
|
137,220,000 | $ | 127,570 | $ | - | $ | - | 127,570 | $ | 416,733 | - | $ | - | $ | (1,035,159 | ) | $ | (490,856 | ) | |||||||||||||||||||||
TOUCHIT TECHNOLOGIES, INC
FOR THE PERIODS ENDED 31 DECEMBER 2013, 2012, 2011 AND 2010
(Amounts expressed in US Dollars (USD) in full unless otherwise indicated)
|
CURRENT ASSETS
|
12/31/2013
|
12/31/2012
|
12/31/2011
|
12/31/2010
|
||||||||||||
|
Cash and cash equivalents
|
20,778
|
6,412
|
70,289
|
50,556
|
||||||||||||
|
Trade receivables, net
|
68,364
|
64,170
|
240,867
|
705,225
|
||||||||||||
|
Due from related parties
|
-
|
-
|
-
|
863,395
|
||||||||||||
|
Due from Shareholders
|
-
|
-
|
-
|
50,585
|
||||||||||||
|
Inventories
|
28,249
|
111,461
|
55,689
|
365,643
|
||||||||||||
|
Other current assets
|
28,552
|
1,106
|
||||||||||||||
|
Prepaid Inventory
|
28,000
|
|||||||||||||||
|
Total current assets
|
173,943
|
182,043
|
366,845
|
2,036,510
|
||||||||||||
|
NON CURRENT ASSETS
|
||||||||||||||||
|
Property, plant and equipment,net
|
27,180
|
6,076
|
1,027
|
64,495
|
||||||||||||
|
Intangible assets, net
|
-
|
25,145
|
||||||||||||||
|
Other non current assets
|
400,000
|
400,000
|
-
|
3,555
|
||||||||||||
|
Total non current assets
|
427,180
|
406,076
|
1,027
|
93,195
|
||||||||||||
|
TOTAL ASSETS
|
601,123
|
588,119
|
367,872
|
2,129,705
|
||||||||||||
|
CURRENT LIABILITIES
|
||||||||||||||||
|
Borrowings
|
-
|
-
|
-
|
2,351
|
||||||||||||
|
Trade payables
|
265,648
|
274,352
|
181,984
|
124,745
|
||||||||||||
|
Due to shareholders
|
-
|
-
|
-
|
47,257
|
||||||||||||
|
Due to related parties
|
96,699
|
261,499
|
265,318
|
1,145,992
|
||||||||||||
|
Other current liabilities
|
99,776
|
11,310
|
27,390
|
73,233
|
||||||||||||
|
Total current liabilities
|
462,123
|
547,161
|
474,692
|
1,393,578
|
||||||||||||
|
NON CURRENT LIABILITIES
|
||||||||||||||||
|
Borrowings
|
-
|
-
|
250,000
|
-
|
||||||||||||
|
Employee termination benefits
|
-
|
-
|
-
|
-
|
||||||||||||
|
Reserve for retirement pay
|
-
|
-
|
-
|
1,842
|
||||||||||||
|
Convertible Notes
|
629,856
|
583,200
|
540,000
|
750,000
|
||||||||||||
|
Total non current liabilities
|
629,856
|
583,200
|
790,000
|
751,842
|
||||||||||||
|
COMMITMENTS AND CONTINGENCIES
|
||||||||||||||||
|
SHAREHOLDERS' EQUITY
|
||||||||||||||||
|
Share capital
|
544,303
|
544,303
|
127,570
|
127,570
|
||||||||||||
|
Retained earnings
|
(1,133,518
|
) |
(1,061,404
|
)
|
(137,698
|
)
|
(308,463
|
)
|
||||||||
|
Net income / (loss) for the period
|
98,359
|
(25,141
|
) |
(346,692
|
)
|
173,899
|
)
|
|||||||||
|
Total shareholders’ equity
|
(490,856
|
) |
(542,241
|
) |
(356,820
|
)
|
(7,004
|
)
|
||||||||
|
TOTAL LIABILITIES AND
|
||||||||||||||||
|
SHAREHOLDERS' EQUITY
|
601,123
|
588,119
|
367,872
|
3,138,416
|
||||||||||||
TOUCHIT TECHNOLOGIES, INC
COMBINED STATEMENTS OF COMPREHENSIVE INCOME
FOR THE PERIODS ENDED 31 DECEMBER 2013, 2012, 2011 AND 2010
(Amounts expressed in US Dollars (USD) in full unless otherwise indicated)
|
12/31/2013
|
12/31/2012
|
12/31/2011
|
12/31/2010
|
|||||||||||||
|
NET SALES
|
1,610,704
|
1,287,709
|
1,595,943
|
3,577,881
|
||||||||||||
|
COST OF SALES
|
1,111,310
|
885,021
|
(1,341,374
|
)
|
(2,502,037
|
)
|
||||||||||
|
Gross profit
|
499,394
|
402,688
|
254,569
|
1,075,844
|
||||||||||||
|
MARKETING AND SELLING EXPENSE
|
33,779
|
112,304
|
(578,887
|
)
|
(504,329
|
)
|
||||||||||
|
GENERAL AND ADMINISTRATIVE EXPENSES
|
376,944
|
319,826
|
(356,528
|
)
|
(479,064
|
)
|
||||||||||
|
Profit from operations
|
88,671
|
(29,442
|
) |
(640,847
|
)
|
92,451
|
||||||||||
|
OTHER INCOME AND EXPENSES,net
|
--
|
4,301
|
294,154
|
24,094
|
||||||||||||
|
FINANCIAL INCOME AND EXPENSES, net
|
--
|
--
|
--
|
(8,294
|
)
|
|||||||||||
|
Profit Loss before taxation and currency translation gain/(loss)
|
88,671
|
(25,141
|
) |
(386,692
|
)
|
60,063
|
||||||||||
|
TAXATION CHARGE
|
--
|
--
|
--
|
|||||||||||||
|
Taxation current
|
--
|
--
|
--
|
|||||||||||||
|
Deferred
|
--
|
--
|
--
|
|||||||||||||
|
CURRENCY TRANSLATION GAIN/(LOSS)
|
(1,485
|
) |
--
|
--
|
60,063
|
|||||||||||
|
Net income/(loss) for the year
|
87,186
|
(25,141
|
) |
(386,692
|
)
|
105,115
|
||||||||||
|
OTHER COMPREHENSIVE INCOME
|
11,172
|
--
|
--
|
|||||||||||||
|
Total comprehensive income
|
98,358
|
(25,141
|
) |
(386,692
|
)
|
165,178
|
||||||||||
TOUCHIT TECHNOLOGIES, INC.
STATEMENT OF CHANGES IN STOCKHOLDER'S EQUITY
FOR THE PERIOD ENDED DECEMBER 31, 2013
|
Common Stock
|
Preferred Stock
|
Paid-in Capital
|
Treasury Stock
|
Retained
Earnings
|
Total
Stockholder's
Equity
|
|||||||||||||||||||||||||||||||||||
|
Shares
|
Amount
|
Shares
|
Amount
|
Shares
|
Amount
|
Shares
|
Amount
|
Amount
|
Amount
|
|||||||||||||||||||||||||||||||
|
Balance at January 1, 2013
|
137,220,000
|
$
|
127,570
|
$
|
-
|
$
|
-
|
137,220,000
|
$
|
416,733
|
-
|
$
|
-
|
$
|
(1,086,545
|
)
|
$
|
(542,241
|
) | |||||||||||||||||||||
|
Net Income
|
-
|
-
|
-
|
-
|
-
|
-
|
-
|
-
|
98,359
|
98,359
|
||||||||||||||||||||||||||||||
|
Capital Transactions
|
-
|
-
|
-
|
-
|
-
|
-
|
-
|
-
|
-
|
-
|
||||||||||||||||||||||||||||||
|
Prior Period Adjustments
|
-
|
-
|
-
|
-
|
-
|
-
|
-
|
-
|
(46,973
|
)
|
(46,973
|
)
|
||||||||||||||||||||||||||||
|
Balance at December 31, 2013
|
137,220,000
|
$
|
127,570
|
$
|
-
|
$
|
-
|
127,570
|
$
|
416,733
|
-
|
$
|
-
|
$
|
(1,035,159
|
)
|
$
|
(490,856
|
) | |||||||||||||||||||||
TOUCHIT TECHNOLOGIES, INC
STATEMENT OF CASH FLOWS
FOR THE PERIODS ENDED 31 DECEMBER 2013, 2012, 2011 AND 2010
(Amounts expressed in US Dollars (USD) in full unless otherwise indicated)
|
12/31/2013
|
12/31/2012
|
12/31/2011
|
12/31/2010
|
|||||||||||||
|
CASH FLOWS FROM OPERATING ACTIVITIES
|
||||||||||||||||
|
Net income
|
98,359
|
(25,141)
|
(386,692
|
)
|
165,178
|
|||||||||||
|
Adjustments to reconcile net income to net cash provided
|
(46,982
|
) |
(439,207
|
)
|
(401,447
|
) |
--
|
|||||||||
|
By operating activities:
|
||||||||||||||||
|
Depreciation and amortization
|
2,627
|
427
|
--
|
17,516
|
||||||||||||
|
Provision for employee benefit
|
--
|
--
|
801
|
|||||||||||||
|
Changes in operating assets and liabilities
|
||||||||||||||||
|
Trade receivables, net
|
(32,746
|
) |
176,698
|
1,378,337
|
(430,428
|
)
|
||||||||||
|
Due from shareholders
|
--
|
--
|
--
|
(773,544
|
) | |||||||||||
|
Due from related parties
|
--
|
--
|
--
|
|||||||||||||
|
Inventories
|
55,212
|
(55,772
|
)
|
309,953
|
(17,620
|
) | ||||||||||
|
Other current assets
|
--
|
1,106
|
98,467
|
|||||||||||||
|
Other non current assets
|
--
|
--
|
331
|
|||||||||||||
|
Trade payables
|
(8,704
|
) |
(172,949
|
)
|
322,557
|
54,126
|
||||||||||
|
Due to shareholders
|
--
|
--
|
--
|
54,413
|
||||||||||||
|
Due to related parties
|
--
|
--
|
--
|
392,276
|
||||||||||||
|
Other current liabilities
|
185,164
|
(16,080
|
)
|
(1,241,442
|
)
|
(47,386
|
) | |||||||||
|
Share Purchase Advances
|
--
|
--
|
--
|
750,000
|
||||||||||||
|
Net cash generated from (used for) operating activities
|
252,930
|
(532,024
|
)
|
(17,628
|
) |
67,197
|
||||||||||
|
CASH FLOWS FROM FINANCING ACTIVITIES
|
||||||||||||||||
|
Increase/(decrease) in short-term borrowings
|
--
|
--
|
(8,931
|
) | ||||||||||||
|
Increase/(decrease) in long-term borrowings
|
(214,843
|
) |
471,432
|
(38,158
|
)
|
--
|
||||||||||
|
Dividends paid
|
--
|
--
|
--
|
--
|
||||||||||||
|
Net cash (used for) provided from financing activities
|
(214,843
|
) |
471,432
|
|
(38,158
|
)
|
(8,931
|
) | ||||||||
|
CASH FLOWS FROM INVESTING ACTIVITIES
|
||||||||||||||||
|
Purchases of property, plant and equipment and intangible assets
|
(23,721
|
) |
(3,284
|
)
|
797
|
(62,304
|
)
|
|||||||||
|
Share capital increase
|
--
|
--
|
||||||||||||||
|
Net cash used for investing activities
|
(23,721
|
) |
(3,284
|
)
|
(797
|
) |
(62,304
|
)
|
||||||||
|
NET INCREASE / (DECREASE) IN CASH AND BANKS
|
14,365
|
(63,876
|
)
|
19,733
|
(4,289
|
) | ||||||||||
|
CASH AND BANKS AT BEGINNING OF THE YEAR
|
6,413
|
70,289
|
50,556
|
54,845
|
||||||||||||
|
CASH AND BANKS AT END OF THE PERIOD
|
20,778
|
6,413
|
70,289
|
50,556
|
||||||||||||
TOUCHIT TECHNOLOGIES, INC
NOTES TO THE FINANCIAL STATEMENTS
FOR THE PERIOD ENDED DECEMBER 31, 2013
|
1.
|
OPERATIONS OF THE COMPANY:
|
General
The Company was established as a form of partnership. In Turkey, partnership is the association of two or people who co-own a business for trading goods under a trade name. The owners have unlimited responsibility to their creditors. This form of company does not have minimum capital requirements. On May 7, 2010, the company became TouchIT Technologies, Inc., a Nevada domiciled company in the United States of America by means of a reverse merge transaction detailed herewith.
Organization
TouchIT Education Technologies Dis Ticaret Killektik Sirketi Andrew Stuart Brabin ve Ortagi formerly RT Lojistik Dis Ticaret Recep Tanisman ve Ortagi (referred as “TouchIT Education”) was established on August 27, 2007 with a “Share Transfer of Open Company and amendment Agreement.”
On May 7, 2010 TouchIT Education, TouchIT Technologies and their stockholders (“TouchIT Turkey”) entered into a Share Exchange Agreement with Hotel Management Systems, Inc. (“Hotel Management”), a Nevada corporation.
Pursuant to the terms of the Share Exchange Agreement, Hotel Management issued a total of 48,330,000 shares of their common stock, par value USD 01 per share (the “Common Stock”) to the shareholders of TouchIT Technologies and TouchIT Education in exchange for the transfer of 100% of the shares of TouchIT Tech and TouchIT Education to Hotel Management. This exchange transaction resulted in TouchIT Technologies and TouchIT Education becoming Hotel Management. The wholly-owned subsidiaries and the stockholders of TouchIT Turkey own approximately 78.93% of the Hotel Management’s issued and outstanding stock, prior to any financing.
Simultaneously with the closing of the Share Exchange Agreement, on May 7, 2010, Management entered into a Subscription Agreement (the “Subscription Agreement”) with investors for the sale of shares up to the value of USD 1,500,000 (the Purchase Price”). As a result USD 750,000 of the Purchase Price was recognized in TouchIT Education’s balance sheet as a future obligation to one of the investors.
The Turkish subsidiaries were officially closed in August 2011.
Average number of employees of the Company as of December 31, 2013 and December 31, 2012 is five.
TOUCHIT TECHNOLOGIES, INC
NOTES TO THE FINANCIAL STATEMENTS
FOR THE PERIOD ENDED DECEMBER 31, 2013
Description of Business
TouchIT Technologies, Inc. is a designer, producer (via 3rd party) and marketer of touch-based visual communication products. The Company manufactures a large range of touch screen and touch board products containing TouchIT's proprietary technology to suit all types of applications, from LCD & LED touch-screens to large interactive whiteboard displays and audience response systems, with applications to several industry segments including education, business, and government. For more information, please visit the Company's Website: www.touchittechnologies.com.
|
2.
|
IMPACT OF RECENTLY ISSUED ACCOUNTING STANDARDS
|
In January 2010, the FASB issued an amendment to ASC, “Fair Value Measurements and Disclosure,” to require entities to separately disclose the amounts and business rationale for significant transfers in and out of Level 1 and Level 2 fair value measurements and separately present information regarding purchase, sale, issuance, and settlement of Level 3 fair value measures on a gross basis. This standard is effective for interim and annual periods beginning after December 15, 2009 with the exception of disclosures regarding the purchase, sale, issuance, and settlement of Level 3 fair measures which are effective for fiscal years beginning after December 15, 2010, its adoption will not have a material impact on the Company’s financial statements.
|
3.
|
BASIS OF PRESENTATION
|
The Company maintains its books of account and prepares financial statements in accordance with Generally Accepted Accounting Principles (GAAP) in the United States of America. The Company’s fiscal year ends on December 31.
|
4.
|
SIGNIFICANT ACCOUNTING POLICIES:
|
Cash and Cash Equivalents
Cash equivalents consist of highly liquid investments, which are readily convertible into, cash, with original maturities of three months or less.
Basis of Accounting
The Company uses the accrual basis of accounting.
The Corporation considers accounts receivable to be fully collectible; accordingly, no allowance for doubtful accounts is required. If amounts become uncollectible, they will be charged to operations when that determination is made.
TOUCHIT TECHNOLOGIES, INC
NOTES TO THE FINANCIAL STATEMENTS
FOR THE PERIOD ENDED DECEMBER 31, 2013
Revenue recognition
The company recognizes revenue when there is persuasive evidence of an arrangement, delivery has occurred or services are rendered, the sales price is terminable, and collectability is reasonably assured. Revenue typically is recognized at the time of shipment. Sales are recorded net of discounts, rebates, and returns.
Inventories
Inventories are stated at the lower of cost or market. Costs, including an appropriate portion of fixed and variable overhead expenses are assigned to inventories by the method most appropriate to the particular class of inventory being valued on the weighted average basis.
Related Parties
Parties are considered to be related if one party has the ability to control the other party or exercise significant influence over the other party in making the financial and operating decisions. For the purpose of these financial statements shareholders are referred to as related parities. Related parties are also included individuals that are principle owners, management and members of the Company’s Board of Directors and their families.
Capitalization
All costs incurred over $500 are capitalized. Costs which lengthen the life of a fixed asset are capitalized and depreciated over the extended life of the asset.
Depreciation
Depreciation is computed on the straight-line method over the estimated useful lives of the assets. Assets reviewed for impairment whenever changes in circumstances or events may indicate that the carrying amounts are not recoverable. If the fair value is less that the carrying amount of the asset, a loss is recognized for the difference.
Taxation
The Company has elected to be treated as a regular “C” corporation; therefore, the corporation, not the stockholders, will pay income taxes.
Leases
Leases are classified as capital leases whenever the terms of the lease transfer substantially all the risks and rewards of ownership to the lessee. All other leases are classified as operating leases.
TOUCHIT TECHNOLOGIES, INC
NOTES TO THE FINANCIAL STATEMENTS
FOR THE PERIOD ENDED DECEMBER 31, 2013
Comprehensive Income
In June 1997, the Financial Accounting Standard Board issued SFAS No. 130, “Reporting Comprehensive Income.” SFAS No. 130 is effective for years beginning after June 15, 1997. This statement provides reporting standards of comprehensive income and its components and requires that all components of comprehensive income be reported in the financial statements in the period in which they are recognized. The Company has adopted the provisions of SFAS No. 130 in its financial statements and adoption of this statement did not have any effect.
Financial Instruments
Fair value is defined as the price that would be received to sell assets or paid to transfer a liability in an orderly transaction between participants at the measurement date (i.e., an exit price). The guidance includes a fair value hierarchy that prioritizes the inputs to valuation techniques used to measure fair value. The hierarchy gives the highest priority to unadjusted quoted prices in active markets for identical assets and liabilities (Level 1) and the lowest priority
To unobservable inputs (Level 3). The three levels of the fair value hierarchy are described below:
Level 1
– Quoted, active market prices for identical assets or liabilities. Level 1 also includes U.S. Treasury and federal agency securities and federal agency mortgage-backed securities, which are traded by dealers of brokers in active markets. Valuations are obtained from readily available pricing sources for market transactions involving identical assets or liabilities. The Company did not have any Level 1 assets or liabilities.
Level 2 –
Observable inputs other than Level 1, such as quoted market prices for similar assets or liabilities, quoted for identical or similar assets in inactive markets, and model derived valuations in which all significant inputs are observable in active markets. The Company did not have any Level 2 assets or liabilities.
Level 3 –
Valuation techniques in which one or more significant inputs are observable in the market. The Company did not have any Level 3 assets or liabilities.
TOUCHIT TECHNOLOGIES, INC
NOTES TO THE FINANCIAL STATEMENTS
FOR THE PERIOD ENDED DECEMBER 31, 2013
|
5.
|
CASH AND CASH EQUIVALENTS
|
As of December 31, 2013 and December 30, 2012, cash and cash equivalents comprised were comprised of the following:
|
31.12.2013
|
31.12.2012
|
|||||||
|
Cash on Hand
|
$
|
0
|
$
|
0
|
||||
|
Banks
|
$
|
20,778
|
$
|
6,413
|
||||
|
Total
|
$
|
20,778
|
$
|
6,413
|
|
6.
|
TRADE RECEIVABLES
|
As of December 31, 2013 and December 31, 2012, trade receivables comprised were comprised of the following:
|
31.12.2013
|
31.12.2012
|
|||||||
|
Trade Receivables
|
$
|
70,364
|
$
|
66,170
|
||||
|
Provision for doubtful accounts
|
$
|
(2,000
|
) |
$
|
(2,000
|
) | ||
|
Total
|
$
|
68,364
|
$
|
64,170
|
||||
|
7.
|
RELATED PARTY TRANSACTIONS:
|
In the course of conducting its business, the Company conducted various business transactions with related parities on commercial terms.
Related parties and shareholders balances and transactions have been presented as follows:
|
Due from related parties
|
31.12.2013
|
31.12.2012
|
||||||
|
$
|
0
|
$
|
0
|
|||||
|
Total
|
$
|
0
|
$
|
0
|
TOUCHIT TECHNOLOGIES, INC
NOTES TO THE FINANCIAL STATEMENTS
FOR THE PERIOD ENDED DECEMBER 31, 2013
|
Due from shareholders
|
31.12.2013
|
31.12.2012
|
||||||
|
Andrew Stuart Brabin
|
$
|
0
|
$
|
0
|
||||
|
Ronald George Murphy
|
$
|
0
|
$
|
0
|
||||
|
Total
|
$
|
0
|
$
|
0
|
|
Due to related parties
|
31.12.2013
|
31.12.2012
|
||||||
|
Kamron, Inc.
|
$
|
61,413
|
$
|
144,413
|
||||
|
ASB Trading
|
$
|
35,286
|
$
|
117,086
|
||||
|
Total
|
$
|
96,699
|
$
|
261,499
|
|
Due to shareholders
|
31.12.2013
|
31.12.2012
|
||||||
|
Ronald George Murphy
|
$
|
0
|
$
|
0
|
||||
|
Andrew Stuart Brabin
|
$
|
0
|
$
|
0
|
||||
|
Total
|
$
|
0
|
$
|
0
|
|
Major purchases from related parties
|
31.12.2013
|
31.12.2012
|
||||||
|
Total
|
$
|
0
|
$
|
0
|
TOUCHIT TECHNOLOGIES, INC
NOTES TO THE FINANCIAL STATEMENTS
FOR THE PERIOD ENDED DECEMBER 31, 2013
|
Major sales to related parties
|
31.12.2013
|
31.12.2012
|
||||||
|
Total
|
$
|
0
|
$
|
0
|
|
Service provided by
|
31.12.2013
|
31.12.2012
|
||||||
|
Kamron, Inc.
|
$
|
61,413
|
$
|
144,413
|
||||
|
ASB Trading
|
$
|
35,286
|
$
|
117,086
|
||||
|
Total
|
$
|
96,699
|
$
|
261,499
|
|
8.
|
INVENTORIES
|
|
31.12.2013
|
31.12.2012
|
|||||||
|
Trade goods
|
$
|
28,249
|
$
|
111,461
|
||||
|
Advances given for purchases
|
$
|
28,000
|
$
|
0
|
||||
|
Total
|
$
|
56,249
|
$
|
111,461
|
|
9.
|
OTHER CURRENT ASSETS
|
As of December 31, 2013 and December 30, 2012, other receivables comprised of the following:
|
31.12.2013
|
31.12.2012
|
|||||||
|
Prepaid Expense
|
$
|
28,552
|
$
|
0
|
||||
|
Advances given to personnel
|
$
|
0
|
$
|
0
|
||||
|
Total
|
$
|
28,552
|
$
|
0
|
TOUCHIT TECHNOLOGIES, INC
NOTES TO THE FINANCIAL STATEMENTS
FOR THE PERIOD ENDED DECEMBER 31, 2013
|
10.
|
NON-CURRENT ASSETS
|
As of December 31, 2013 and December 31, 2012 non current assets comprised of the following:
|
31.12.2013
|
31.12.2012
|
|||||||
|
Property, Plan and Equipment, net
|
$
|
27,180
|
$
|
6,076
|
||||
|
Total
|
$
|
27,180
|
$
|
6,076
|
|
11.
|
TRADE PAYABLES
|
As of December 31, 2013 and December 31, 2012, trade payables were comprised of the following:
|
31.12.2013
|
31.12.2012
|
|||||||
|
Suppliers
|
$
|
265,648
|
$
|
274,352
|
||||
|
Totals
|
$
|
265,648
|
$
|
274,352
|
|
12.
|
OTHER CURRENT LIABILITIES
|
As of December 31, 2013 and December 31, 2012, other current liabilities of the following:
|
31.12.2013
|
31.12.2012
|
|||||||
|
Other Current Liabilities
|
$
|
99,776
|
$
|
11,310
|
||||
|
Total
|
$
|
99,776
|
$
|
11,310
|
TOUCHIT TECHNOLOGIES, INC
NOTES TO THE FINANCIAL STATEMENTS
FOR THE PERIOD ENDED DECEMBER 31, 2013
|
13.
|
CAPITAL STOCK
|
The issued share capital of the Company is respectively for the period ended at December 31, 2013 and 2012 is comprised of the following:
| 31.12.2013 | 31.12.2012 | |||||||
|
Insider
Holdings
|
Insider
Holdings
|
|||||||
|
|
||||||||
|
Andrew Stuart Brabin
|
68,610,000
|
23,610,000
|
||||||
|
Ronald George Murphy
|
68,610,000
|
23,610,000
|
||||||
|
Total
|
137,220,000
|
47,220,000
|
||||||
|
14.
|
SALES
|
The composition of sales by principal for the periods ended December 31, 2013 and 2012 can be summarized as follows:
|
31.12.2013
|
31.12.2012
|
|||||||
|
Interactive Whiteboards
|
$
|
240,019
|
$
|
484,063
|
||||
|
Wireless Tablets
|
$
|
4,805
|
$
|
4,977
|
||||
|
Interactive LCD/LED
|
$
|
1,216,323
|
$
|
689,648
|
||||
|
Others
|
$
|
125,164
|
$
|
81,961
|
||||
|
Delivery Income
|
$
|
24,393
|
29,990
|
|||||
|
Returns (-)
|
$
|
0
|
$
|
(2,930)
|
||||
|
Total
|
$
|
1,610,704
|
$
|
1,287,709
|
TOUCHIT TECHNOLOGIES, INC
NOTES TO THE FINANCIAL STATEMENTS
FOR THE PERIOD ENDED DECEMBER 31, 2013
|
15.
|
COST OF SALES
|
The composition of cost of sales by principal for the periods ended December 31, 2013 and 2012 can be summarized as follows:
|
31.12.2013
|
31.12.2012
|
|||||||
|
Purchases
|
$
|
968,811
|
$
|
802,028
|
||||
|
Ending inventory of trade goods (-)
|
$
|
0
|
$
|
0
|
||||
|
Other Expenses
|
$
|
142,499
|
$
|
82,993
|
||||
|
Total
|
$
|
1,111,310
|
$
|
885,021
|
|
16.
|
MARKETING AND SELLING EXPENSES
|
The composition of marketing and selling expenses by principal for the periods ended December 31, 2013 and 2012 are summarized as follows:
|
31.12.2013
|
31.12.2012
|
|||||||
|
Marketing and Selling Expenses
|
$
|
33,779
|
$
|
112,304
|
||||
|
Total
|
$
|
33,779
|
$
|
112,304
|
|
17.
|
GENERAL AND ADMINISTRACTIVE EXPENSES
|
The composition of general and administrative expenses by the principal operations for the periods ended December 31, 2013 and 2012 are as follows:
|
31.12.2013
|
31.12.2012
|
|||||||
|
General and Administrative Expenses
|
$
|
376,944
|
$
|
319,826
|
||||
|
Total
|
$
|
376,944
|
$
|
319,826
|
TOUCHIT TECHNOLOGIES, INC
NOTES TO THE FINANCIAL STATEMENTS
FOR THE PERIOD ENDED DECEMBER 31, 2013
|
18.
|
OTHER INCOME AND (EXPENSES), net
|
The composition of other income and expenses for the years December 31, 2012 and 2012 can be summarized as follows:
|
31.12.2013
|
31.12.2012
|
|||||||
|
Other Income and Expenses
|
$
|
9,687
|
$
|
4,301
|
||||
|
Total
|
$
|
9,687
|
$
|
4,301
|
|
19.
|
FINANCIAL RISK MANAGEMENT OBJECTIVES AND POLICIES
|
The Company manages its capital to ensure that it will be able to continue as a going concern while maximizing the return to stockholders through the optimization of the debt and equity balance. The capital structure of the Company consists of debt, which includes the borrowings, cash and cash equivalents and equity, comprising issued capital reserves and retained earnings.
Financial risk factors
The Company’s activities expose it to a variety of financial risks, credit risk and liquidity risk. The Company’s overall risk management program focuses on the unpredictability of financial markets seeks to minimize potential adverse effects on the Company’s financial performance.
Credit risk management
Credit risk refers to the risk that the counterparty will default on its contractual obligations resulting in a financial loss to the company. The Company has adopted a policy of only dealing with creditworthy counterparties. The Company’s exposure and the credit ratings of it counterparties are continuously monitored and the aggregate value of transactions concluded is spread amongst approved counterparties.
TOUCHIT TECHNOLOGIES, INC
NOTES TO THE FINANCIAL STATEMENTS
FOR THE PERIOD ENDED DECEMBER 31, 2013
Liquidity risk management
Liquidity risk arises from the fact that the Company may not receive funds from its counterparties at the expected time. This risk is managed by maintaining a balance between continuity of funding and flexibility through the use of overdrafts and trade receivables.
|
20.
|
SUBSEQUENT EVENTS
|
The Company has evaluated events subsequent to the balance sheet date for items requiring recording or disclosure in the financial statements. The evaluation was performed through March 14, 2014, which is the date the financial statement were available to be issued. Based upon this review, the Company has determined that there were no events which took place that would have a material impact on its financial statements.
On the 6
th
of February, 2014, the Company and its directors entered into an Asset Purchase and Debt Assumption Agreement with TouchIT Technologies Holdings Incorporated. This transaction moved all assets and liabilities along with the operating business of the Company, leaving only the Convertible Notes, to TouchIT Technologies Holdings Incorporated. TouchIT Technologies Inc. ceased to operate the activities of the Company.
On the 20
th
of March, 2014 the Company invested $150,000 into Series A preferred units of GoCoin LLC (“GoCoin”). GoCoin is a leading international payment platform enabling merchants to accept Bitcoin and Litecoin payments at checkout.
F-21
TABLE OF CONTENTS
Part IItem 1. BusinessItem 3. Legal ProceedingsItem 4. Mine Safety DisclosuresItem 7 . Management S Discussion and Analysis Of Financial Condition and Results Of OperationsItem 9B . Other InformationPart IIIItem 10. Directors, Executive Officers and Corporate GovernanceItem 11: Executive CompensationItem 12. Security Ownership Of Certain Beneficial Owners and Management and Related Stockholder MattersItem 13 . Certain Relationships and Related Transactions, and Director IndependencePart IVItem 15 . Exhibits