|
|
|
|
|
|
|
|
|
|
|
|
|
|
|
|
|
|
|
|
|
|
|
|
|
|
|
|
|
|
|
|
|
|
|
|
|
|
|
|
|
|
|
|
|
|
|
|
|
|
|
|
|
Table of Contents
SECURITIES AND EXCHANGE COMMISSION
|
þ
|
ANNUAL REPORT PURSUANT TO SECTION 13 OR 15(d) OF THE SECURITIES EXCHANGE ACT OF 1934 | |
| For the Fiscal Year Ended December 31, 2010 | ||
|
or
|
||
|
o
|
TRANSITION REPORT PURSUANT TO SECTION 13 OR 15(d) OF THE SECURITIES EXCHANGE ACT OF 1934 | |

|
Delaware
(State or other jurisdiction of incorporation or organization) |
13-4004153
(I.R.S. Employer Identification No.) |
|
|
701 Market Street, St. Louis, Missouri
(Address of principal executive offices) |
63101
(Zip Code) |
| Title of Each Class | Name of Each Exchange on Which Registered | |
| Common Stock, par value $0.01 per share | New York Stock Exchange | |
| Preferred Share Purchase Rights | New York Stock Exchange |
None
| Large accelerated filer þ | Accelerated filer o | Non-accelerated filer o | Smaller reporting company o |
Table of Contents
| • | demand for coal in the United States (U.S.) and the Pacific Rim thermal and metallurgical coal seaborne markets; | |
| • | price volatility and demand, particularly in higher-margin products and in our trading and brokerage businesses; | |
| • | impact of weather on demand, production and transportation; | |
| • | reductions and/or deferrals of purchases by major customers and ability to renew sales contracts; | |
| • | credit and performance risks associated with customers, suppliers, co-shippers, and trading, banks and other financial counterparties; | |
| • | geologic, equipment, permitting and operational risks related to mining; | |
| • | transportation availability, performance and costs; | |
| • | availability, timing of delivery and costs of key supplies, capital equipment or commodities such as diesel fuel, steel, explosives and tires; | |
| • | successful implementation of business strategies, including our Btu Conversion and generation development initiatives; | |
| • | negotiation of labor contracts, employee relations and workforce availability; | |
| • | changes in postretirement benefit and pension obligations and their related funding requirements; | |
| • | replacement and development of coal reserves; | |
| • | availability, access to and the related cost of capital and financial markets; | |
| • | effects of changes in interest rates and currency exchange rates (primarily the Australian dollar); | |
| • | effects of acquisitions or divestitures; | |
| • | economic strength and political stability of countries in which we have operations or serve customers; | |
| • | legislation, regulations and court decisions or other government actions, including new environmental requirements, changes in income tax regulations or other regulatory taxes; |
i
Table of Contents
| • | litigation, including claims not yet asserted; | |
| • | terrorist attacks or threats; | |
| • | impacts of pandemic illnesses; and | |
| • | other factors, including those discussed in Legal Proceedings, set forth in Item 3 of this report and Risk Factors, set forth in Item 1A of this report. |
ii
1
Table of Contents
| Note: | The words “we,” “our,” “Peabody” or “the Company” as used in this report, refer to Peabody Energy Corporation or its applicable subsidiary or subsidiaries. Unless otherwise noted herein, disclosures in this Annual Report on Form 10-K relate only to our continuing operations. |
| Item 1. | Business. |
| 1) | Executing the basics of best-in-class safety, operations and marketing; | |
| 2) | Capitalizing on organic growth opportunities; | |
| 3) | Expanding in high-growth global markets; and | |
| 4) | Participating in new generation and Btu Conversion technologies designed to expand the uses of coal technologies, including carbon capture and storage. |
2
Table of Contents
3
Table of Contents
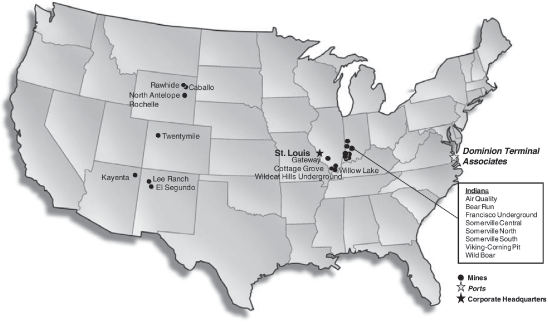
|
2010
|
||||||||||||||
|
Mine
|
Mining
|
Coal
|
Transport
|
Tons Sold
|
||||||||||
| Mine | Location | Type | Method | Type | Method | (In millions) | ||||||||
|
Western U.S. Mining
|
||||||||||||||
|
North Antelope Rochelle
|
Wright, WY | S | DL, T/S | Thermal | R | 105.8 | ||||||||
|
Caballo
|
Gillette, WY | S | D, T/S | Thermal | R | 23.5 | ||||||||
|
Rawhide
|
Gillette, WY | S | D, T/S | Thermal | R | 11.3 | ||||||||
|
Twentymile
|
Oak Creek, CO | U | LW | Thermal | R, T | 7.1 | ||||||||
|
Kayenta
|
Kayenta, AZ | S | DL, T/S | Thermal | R | 7.8 | ||||||||
|
El Segundo
|
Grants, NM | S | T/S | Thermal | R | 6.6 | ||||||||
|
Lee Ranch
|
Grants, NM | S | DL, T/S | Thermal | R | 1.7 | ||||||||
|
Midwestern U.S. Mining
|
||||||||||||||
|
Somerville Central
|
Oakland City, IN | S | DL, D, T/S | Thermal | R, T/R, T/B | 3.3 | ||||||||
|
Viking — Corning Pit
|
Cannelburg, IN | S | D, T/S | Thermal | T, T/R | 3.2 | ||||||||
|
Gateway
|
Coulterville, IL | U | CM | Thermal | T, R, R/B | 3.0 | ||||||||
|
Willow Lake
|
Equality, IL | U | CM | Thermal | T/B | 2.9 | ||||||||
|
Bear Run
|
Sullivan County, IN | S | DL, D, T/S | Thermal | T, R | 2.8 | ||||||||
|
Francisco Underground
|
Francisco, IN | U | CM | Thermal | R | 2.7 | ||||||||
|
Cottage Grove
|
Equality, IL | S | D, T/S | Thermal | T/B | 2.1 | ||||||||
|
Somerville
North
(1)
|
Oakland City, IN | S | D, T/S | Thermal | R, T/R, T/B | 2.0 | ||||||||
|
Somerville
South
(1)
|
Oakland City, IN | S | D, T/S | Thermal | R, T/R, T/B | 1.7 | ||||||||
|
Air Quality
|
Vincennes, IN | U | CM | Thermal | T, T/R, T/B | 1.1 | ||||||||
|
Wildcat Hills Underground
|
Eldorado, IL | U | CM | Thermal | T/B | 0.7 | ||||||||
|
Wild Boar
|
Lynville, IN | S | D, T/S | Thermal | T, R, R/B | 0.1 | ||||||||
|
Other
(2)
|
— | — | — | — | — | 4.1 | ||||||||
|
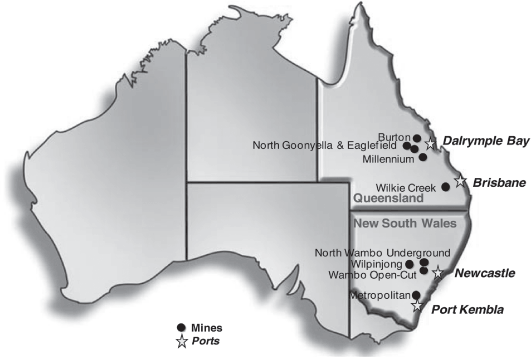
Australian Mining
|
||||||||||||||
|
Wilpinjong*
|
Wilpinjong, New South Wales | S | T/S | Thermal | R, EV | 9.2 | ||||||||
|
North Wambo
Underground
(1)
|
Warkworth, New South Wales | U | LW | Thermal/Met** | R, EV | 3.6 | ||||||||
|
Wambo
Open-Cut
(1)*
|
Warkworth, New South Wales | S | T/S | Thermal | R, EV | 3.0 | ||||||||
|
Burton*
(3)
|
Glenden, Queensland | S | T/S | Thermal/Met** | R, EV | 2.6 | ||||||||
|
North Goonyella
|
Glenden, Queensland | U | LW | Met** | R, EV | 2.5 | ||||||||
|
Wilkie Creek
|
Macalister, Queensland | S | T/S | Thermal | R, EV | 1.7 | ||||||||
|
Metropolitan
|
Helensburgh, New South Wales | U | LW | Met** | R, EV | 1.7 | ||||||||
|
Millennium*
|
Moranbah, Queensland | S | T/S | Met** | R, EV | 1.6 | ||||||||
|
Eaglefield*
|
Glenden, Queensland | S | T/S | Met** | R, EV | 1.1 | ||||||||
|
Legend:
|
||||||
|
S
|
Surface Mine | R | Rail | |||
|
U
|
Underground Mine | T | Truck | |||
|
DL
|
Dragline | R/B | Rail and Barge | |||
|
D
|
Dozer/Casting | T/B | Truck and Barge | |||
|
T/S
|
Truck and Shovel | T/R | Truck and Rail | |||
|
LW
|
Longwall | EV | Export Vessel | |||
|
CM
|
Continuous Miner | Thermal | Thermal/Steam | |||
| Met | Metallurgical | |||||
| * | Mine is operated by a contract miner | |
| ** | Metallurgical coals range from pulverized coal injection (PCI) to high quality hard coking coal on the heat value scale. |
| (1) | Represents mines that have non-controlling ownership interests. | |
| (2) | “Other” in Midwestern U.S. Mining primarily consists of purchased coal used to satisfy certain coal supply agreements and shipments made from operations closed during 2010. | |
| (3) | The Burton Mine is a 95% proportionally owned and consolidated mine. |
4
Table of Contents
5
Table of Contents
6
Table of Contents
7
Table of Contents
8
Table of Contents
9
Table of Contents
10
Table of Contents
11
Table of Contents
12
Table of Contents
13
Table of Contents
14
Table of Contents
15
Table of Contents
| Item 1A. | Risk Factors. |
| • | the demand for electricity and the strength of the global economy; | |
| • | the demand for steel, which may lead to price fluctuations in the quarterly and annual repricing of our metallurgical coal contracts; | |
| • | the supply of U.S. domestic and international thermal and metallurgical coal; | |
| • | adverse weather and natural disasters; | |
| • | competition within our industry and the availability and price of alternative fuels and energy sources; | |
| • | the proximity, capacity and cost of transportation; | |
| • | coal industry capacity; | |
| • | domestic and foreign governmental regulations and taxes, including those establishing air emission standards for coal-fueled power plants; | |
| • | regulatory, administrative and judicial decisions, including those affecting future mining permits; and | |
| • | technological developments, including those intended to convert coal-to-liquids or gas and those aimed at capturing and storing carbon dioxide. |
16
Table of Contents
17
Table of Contents
18
Table of Contents
19
Table of Contents
| • | lack of availability, higher expense or unfavorable market terms of new surety bonds; | |
| • | restrictions on the availability of collateral for current and future third-party surety bond issuers under the terms of our indentures or Credit Facility; | |
| • | the exercise by third-party surety bond issuers of their right to refuse to renew the surety; and | |
| • | the inability to renew our Credit Facility. |
20
Table of Contents
21
Table of Contents
| • | making it more difficult for us to pay interest and satisfy our debt obligations; | |
| • | increasing our vulnerability to general adverse economic and industry conditions; |
22
Table of Contents
| • | requiring the dedication of a substantial portion of our cash flow from operations to the payment of principal and interest on our indebtedness, thereby reducing the availability of our cash flow to fund working capital, capital expenditures, business development, Btu Conversion and clean coal technology projects or other general corporate uses; | |
| • | limiting our ability to obtain additional financing to fund future working capital, capital expenditures, business development, Btu Conversion and clean coal technology projects or other general corporate requirements; | |
| • | limiting our flexibility in planning for, or reacting to, changes in our business and in the coal industry; and | |
| • | placing us at a competitive disadvantage compared to less leveraged competitors. |
23
Table of Contents
24
Table of Contents
| Item 1B. | Unresolved Staff Comments. |
| Item 2. | Properties. |
25
Table of Contents
|
Proven and Probable
|
||||||||||||||
|
Reserves as of
|
||||||||||||||
| December 31, 2010 (1) | ||||||||||||||
|
Owned
|
Leased
|
Total
|
||||||||||||
| Operating Regions | Locations | Tons | Tons | Tons | ||||||||||
| (Tons in millions) | ||||||||||||||
|
Midwest
|
Illinois, Indiana and Kentucky | 2,749 | 901 | 3,650 | ||||||||||
|
Powder River Basin
|
Wyoming and Montana | 67 | 2,805 | 2,872 | ||||||||||
|
Southwest
|
Arizona and New Mexico | 792 | 284 | 1,076 | ||||||||||
|
Colorado
|
Colorado | 44 | 186 | 230 | ||||||||||
|
Total United States
|
3,652 | 4,176 | 7,828 | |||||||||||
|
Australia
|
New South Wales | — | 418 | 418 | ||||||||||
|
Australia
|
Queensland | — | 767 | 767 | ||||||||||
|
Total Australia
|
— | 1,185 | 1,185 | |||||||||||
|
Total Proven and Probable Coal Reserves
|
3,652 | 5,361 | 9,013 | |||||||||||
| (1) | Reserves have been adjusted to take into account estimated losses involved in producing a saleable product. |
26
Table of Contents
27
Table of Contents
28
Table of Contents
(Tons in Millions)
| Production | Sulfur Content (2) | |||||||||||||||||||||||||||||||||||||||||||||||||
|
Year
|
Year
|
Year
|
<1.2 lbs.
|
>1.2 to 2.5 lbs.
|
>2.5 lbs.
|
As
|
As of December 31, 2010 | |||||||||||||||||||||||||||||||||||||||||||
|
Ended
|
Ended
|
Ended
|
sulfur dioxide
|
sulfur dioxide
|
sulfur dioxide
|
Received
|
Assigned
|
|||||||||||||||||||||||||||||||||||||||||||
|
Dec. 31,
|
Dec. 31,
|
Dec. 31,
|
Type of
|
per
|
per
|
per
|
Btu
|
Proven and
|
||||||||||||||||||||||||||||||||||||||||||
| Geographic Region / Mining Complex | 2010 | 2009 | 2008 | Coal | Million Btu | Million Btu | Million Btu | per pound (3) | Probable Reserves | Owned | Leased | Surface | Underground | |||||||||||||||||||||||||||||||||||||
|
Midwest:
|
||||||||||||||||||||||||||||||||||||||||||||||||||
|
Somerville Central
|
3.4 | 3.3 | 3.5 | Thermal | — | — | 9 | 11,200 | 9 | 7 | 2 | 9 | — | |||||||||||||||||||||||||||||||||||||
|
Gateway
|
3.2 | 3.3 | 3.2 | Thermal | — | — | 15 | 11,000 | 15 | 14 | 1 | — | 15 | |||||||||||||||||||||||||||||||||||||
|
Willow Lake
|
2.9 | 3.4 | 3.6 | Thermal | — | — | 25 | 12,100 | 25 | 16 | 9 | — | 25 | |||||||||||||||||||||||||||||||||||||
|
Bear Run
|
2.8 | — | — | Thermal | 6 | 26 | 227 | 11,500 | 259 | 135 | 124 | 259 | — | |||||||||||||||||||||||||||||||||||||
|
Francisco Underground
|
2.7 | 2.0 | 1.5 | Thermal | — | — | 43 | 11,300 | 43 | 8 | 35 | — | 43 | |||||||||||||||||||||||||||||||||||||
|
Cottage Grove
|
2.1 | 0.7 | 0.7 | Thermal | — | — | 23 | 12,300 | 23 | 15 | 8 | 23 | — | |||||||||||||||||||||||||||||||||||||
|
Somerville North
|
2.0 | 2.0 | 2.2 | Thermal | — | — | 3 | 10,600 | 3 | 3 | — | 3 | — | |||||||||||||||||||||||||||||||||||||
|
Viking — Knox Pit
|
1.7 | 2.0 | 1.9 | Thermal | — | — | — | NA | — | — | — | — | — | |||||||||||||||||||||||||||||||||||||
|
Somerville South
|
1.7 | 1.8 | 2.2 | Thermal | — | — | 3 | 11,100 | 3 | 3 | — | 3 | — | |||||||||||||||||||||||||||||||||||||
|
Farmersburg (Closed in 2010)
|
1.5 | 3.5 | 3.4 | Thermal | — | — | — | NA | — | — | — | — | — | |||||||||||||||||||||||||||||||||||||
|
Viking — Corning Pit
|
1.5 | 1.6 | 1.6 | Thermal | — | — | 5 | 11,500 | 5 | — | 5 | 5 | — | |||||||||||||||||||||||||||||||||||||
|
Air Quality
|
1.1 | 1.6 | 1.9 | Thermal | 22 | 2 | 33 | 11,300 | 57 | 4 | 53 | — | 57 | |||||||||||||||||||||||||||||||||||||
|
Wildcat Hills Underground
|
0.8 | 2.1 | 2.2 | Thermal | — | — | 19 | 12,200 | 19 | 13 | 6 | — | 19 | |||||||||||||||||||||||||||||||||||||
|
Wild Boar
|
0.1 | — | — | Thermal | — | — | 17 | 11,000 | 17 | 13 | 4 | 17 | — | |||||||||||||||||||||||||||||||||||||
|
Francisco Surface (Closed in 2009)
|
— | 1.4 | 1.9 | Thermal | — | — | — | NA | — | — | — | — | — | |||||||||||||||||||||||||||||||||||||
|
Total
|
27.5 | 28.7 | 29.8 | 28 | 28 | 422 | 478 | 231 | 247 | 319 | 159 | |||||||||||||||||||||||||||||||||||||||
|
Powder River Basin:
|
||||||||||||||||||||||||||||||||||||||||||||||||||
|
North Antelope Rochelle
|
105.8 | 98.3 | 97.6 | Thermal | 1,184 | — | 33 | 8,700 | 1,217 | — | 1,217 | 1,217 | — | |||||||||||||||||||||||||||||||||||||
|
Caballo
|
23.5 | 23.3 | 31.2 | Thermal | 669 | 130 | 23 | 8,200 | 822 | — | 822 | 822 | — | |||||||||||||||||||||||||||||||||||||
|
Rawhide
|
11.2 | 15.8 | 18.4 | Thermal | 293 | 72 | 4 | 8,300 | 369 | — | 369 | 369 | — | |||||||||||||||||||||||||||||||||||||
|
Total
|
140.5 | 137.4 | 147.2 | 2,146 | 202 | 60 | 2,408 | — | 2,408 | 2,408 | — | |||||||||||||||||||||||||||||||||||||||
|
Southwest:
|
||||||||||||||||||||||||||||||||||||||||||||||||||
|
Kayenta
|
7.8 | 7.5 | 8.0 | Thermal | 169 | 76 | 3 | 10,600 | 248 | — | 248 | 248 | — | |||||||||||||||||||||||||||||||||||||
|
El Segundo
|
6.6 | 5.1 | 3.3 | Thermal | 24 | 83 | 65 | 9,000 | 172 | 157 | 15 | 172 | — | |||||||||||||||||||||||||||||||||||||
|
Lee Ranch
|
1.6 | 1.8 | 3.3 | Thermal | 18 | 114 | 13 | 9,300 | 145 | 124 | 21 | 145 | — | |||||||||||||||||||||||||||||||||||||
|
Total
|
16.0 | 14.4 | 14.6 | 211 | 273 | 81 | 565 | 281 | 284 | 565 | — | |||||||||||||||||||||||||||||||||||||||
|
Colorado:
|
||||||||||||||||||||||||||||||||||||||||||||||||||
|
Twentymile
|
7.7 | 7.8 | 8.0 | Thermal | 44 | — | — | 11,200 | 44 | 8 | 36 | — | 44 | |||||||||||||||||||||||||||||||||||||
|
Australia:
|
||||||||||||||||||||||||||||||||||||||||||||||||||
|
Wilpinjong
|
9.6 | 8.4 | 7.5 | Thermal | — | 197 | — | 11,200 | 197 | — | 197 | 197 | — | |||||||||||||||||||||||||||||||||||||
|
Wambo
(4)
|
6.6 | 4.1 | 5.4 | Thermal/Met. | 178 | — | — | 12,200 | 178 | — | 178 | 30 | 148 | |||||||||||||||||||||||||||||||||||||
|
North Goonyella / Eaglefield
|
3.2 | 2.5 | 2.8 | Met. | 114 | — | — | 12,900 | 114 | — | 114 | 4 | 110 | |||||||||||||||||||||||||||||||||||||
|
Burton
(95%)
(5)
|
2.5 | 2.0 | 2.6 | Thermal/Met. | 45 | — | — | 12,700 | 45 | — | 45 | 45 | — | |||||||||||||||||||||||||||||||||||||
|
Metropolitan
|
1.6 | 1.5 | 1.5 | Met. | 43 | — | — | 12,600 | 43 | — | 43 | — | 43 | |||||||||||||||||||||||||||||||||||||
|
Wilkie Creek
|
1.6 | 2.3 | 2.6 | Thermal | 337 | — | — | 10,800 | 337 | — | 337 | 337 | — | |||||||||||||||||||||||||||||||||||||
|
Millennium
|
1.6 | 0.9 | 1.2 | Met. | 46 | — | — | 12,600 | 46 | — | 46 | 46 | — | |||||||||||||||||||||||||||||||||||||
|
Total
|
26.7 | 21.7 | 23.6 | 763 | 197 | — | 960 | — | 960 | 659 | 301 | |||||||||||||||||||||||||||||||||||||||
|
Total Continuing Operations
|
218.4 | 210.0 | 223.2 | 3,192 | 700 | 563 | 4,455 | 520 | 3,935 | 3,951 | 504 | |||||||||||||||||||||||||||||||||||||||
|
Discontinued Operations
|
— | 0.8 | 2.0 | — | — | — | — | — | — | — | — | |||||||||||||||||||||||||||||||||||||||
|
Total Assigned
|
218.4 | 210.8 | 225.2 | 3,192 | 700 | 563 | 4,455 | 520 | 3,935 | 3,951 | 504 | |||||||||||||||||||||||||||||||||||||||
29
Table of Contents
AS OF DECEMBER 31, 2010
| Sulfur Content (2) | ||||||||||||||||||||||||||||||||||||||||||||||||||||||
|
<1.2 lbs.
|
>1.2 to 2.5 lbs.
|
>2.5 lbs.
|
As
|
|||||||||||||||||||||||||||||||||||||||||||||||||||
|
Proven and
|
sulfur dioxide
|
sulfur dioxide
|
sulfur dioxide
|
Received
|
||||||||||||||||||||||||||||||||||||||||||||||||||
| Total Tons |
Probable
|
Type of
|
per
|
per
|
per
|
Btu
|
Reserve Control | Mining Method | ||||||||||||||||||||||||||||||||||||||||||||||
| Coal Seam Location | Assigned | Unassigned | Reserves | Proven | Probable | Coal | Million Btu | Million Btu | Million Btu | per pound (3) | Owned | Leased | Surface | Underground | ||||||||||||||||||||||||||||||||||||||||
|
Midwest:
|
||||||||||||||||||||||||||||||||||||||||||||||||||||||
|
Illinois
|
82 | 2,266 | 2,348 | 1,208 | 1,140 | Thermal | — | — | 2,348 | 10,900 | 1,973 | 375 | 70 | 2,278 | ||||||||||||||||||||||||||||||||||||||||
|
Indiana
|
396 | 403 | 799 | 591 | 208 | Thermal | 27 | 38 | 734 | 11,400 | 472 | 327 | 430 | 369 | ||||||||||||||||||||||||||||||||||||||||
|
Kentucky
|
— | 503 | 503 | 265 | 238 | Thermal | — | — | 503 | 11,900 | 304 | 199 | 98 | 405 | ||||||||||||||||||||||||||||||||||||||||
|
Total
|
478 | 3,172 | 3,650 | 2,064 | 1,586 | 27 | 38 | 3,585 | 2,749 | 901 | 598 | 3,052 | ||||||||||||||||||||||||||||||||||||||||||
|
Powder River Basin:
|
||||||||||||||||||||||||||||||||||||||||||||||||||||||
|
Montana
|
— | 161 | 161 | 157 | 4 | Thermal | 9 | 121 | 31 | 8,500 | 67 | 94 | 161 | — | ||||||||||||||||||||||||||||||||||||||||
|
Wyoming
|
2,408 | 303 | 2,711 | 2,668 | 43 | Thermal | 2,450 | 202 | 59 | 8,500 | — | 2,711 | 2,711 | — | ||||||||||||||||||||||||||||||||||||||||
|
Total
|
2,408 | 464 | 2,872 | 2,825 | 47 | 2,459 | 323 | 90 | 67 | 2,805 | 2,872 | — | ||||||||||||||||||||||||||||||||||||||||||
|
Southwest:
|
||||||||||||||||||||||||||||||||||||||||||||||||||||||
|
Arizona
|
248 | — | 248 | 248 | — | Thermal | 169 | 76 | 3 | 10,600 | — | 248 | 248 | — | ||||||||||||||||||||||||||||||||||||||||
|
New Mexico
|
317 | 511 | 828 | 750 | 78 | Thermal | 156 | 402 | 270 | 8,700 | 792 | 36 | 804 | 24 | ||||||||||||||||||||||||||||||||||||||||
|
Total
|
565 | 511 | 1,076 | 998 | 78 | 325 | 478 | 273 | 792 | 284 | 1,052 | 24 | ||||||||||||||||||||||||||||||||||||||||||
|
Colorado
|
44 | 186 | 230 | 146 | 84 | Thermal | 227 | — | 3 | 10,700 | 44 | 186 | — | 230 | ||||||||||||||||||||||||||||||||||||||||
|
Australia:
|
||||||||||||||||||||||||||||||||||||||||||||||||||||||
|
New South Wales
|
418 | — | 418 | 335 | 83 | Thermal/Met. | 221 | 197 | — | 11,800 | — | 418 | 227 | 191 | ||||||||||||||||||||||||||||||||||||||||
|
Queensland
|
542 | 225 | 767 | 576 | 191 | Thermal/Met. | 767 | — | — | 11,600 | — | 767 | 657 | 110 | ||||||||||||||||||||||||||||||||||||||||
|
Total
|
960 | 225 | 1,185 | 911 | 274 | 988 | 197 | — | — | 1,185 | 884 | 301 | ||||||||||||||||||||||||||||||||||||||||||
|
Total Proven and Probable
|
4,455 | 4,558 | 9,013 | 6,944 | 2,069 | 4,026 | 1,036 | 3,951 | 3,652 | 5,361 | 5,406 | 3,607 | ||||||||||||||||||||||||||||||||||||||||||
30
Table of Contents
| (1) | Assigned reserves represent recoverable coal reserves that are controlled and accessible at active operations as of December 31, 2010. Unassigned reserves represent coal at currently non-producing locations that would require new mine development, mining equipment or plant facilities before operations could begin on the property. | |
| (2) | Compliance coal is defined by Phase II of the Clean Air Act as coal having sulfur dioxide content of 1.2 pounds or less per million Btu. Non-compliance coal is defined as coal having sulfur dioxide content in excess of this standard. Electricity generators are able to use coal that exceeds these specifications by using emissions reduction technology, using emissions allowance credits or blending higher sulfur coal with lower sulfur coal. | |
| (3) | As-received Btu per pound includes the weight of moisture in the coal on an as sold basis. The range of variability of the moisture content in coal across a given region may affect the actual shipped Btu content of current production from assigned reserves. | |
| (4) | Wambo includes the Wambo Open-Cut Mine and the North Wambo Underground Mine. The North Wambo Underground Mine produces both thermal and pulverized coal injection, or PCI metallurgical coal. | |
| (5) | Proven and probable coal reserves for our Burton Mine reflects our 95% proportional ownership and consolidation. |
| Item 3. | Legal Proceedings. |
| Item 4. | [Removed and Reserved] |
| Name | Age | Position | ||||
|
Gregory H. Boyce
|
56 | Chairman and Chief Executive Officer, Director | ||||
|
Richard A. Navarre
|
50 | President and Chief Commercial Officer | ||||
|
Michael C. Crews
|
43 | Executive Vice President and Chief Financial Officer | ||||
|
Sharon D. Fiehler
|
54 | Executive Vice President and Chief Administrative Officer | ||||
|
Eric Ford
|
56 | Executive Vice President and Chief Operating Officer | ||||
|
Alexander C. Schoch
|
56 | Executive Vice President Law, Chief Legal Officer and Secretary | ||||
31
Table of Contents
32
Table of Contents
| Item 5. | Market for Registrant’s Common Equity, Related Stockholder Matters and Issuer Purchases of Equity Securities. |
| Share Price |
Dividends
|
|||||||||||
| High | Low | Paid | ||||||||||
|
2010
|
||||||||||||
|
First Quarter
|
$ | 52.14 | $ | 39.88 | $ | 0.070 | ||||||
|
Second Quarter
|
50.25 | 34.89 | 0.070 | |||||||||
|
Third Quarter
|
49.94 | 38.08 | 0.070 | |||||||||
|
Fourth Quarter
|
64.59 | 48.76 | 0.085 | |||||||||
|
2009
|
||||||||||||
|
First Quarter
|
$ | 30.95 | $ | 20.17 | $ | 0.060 | ||||||
|
Second Quarter
|
37.44 | 23.56 | 0.060 | |||||||||
|
Third Quarter
|
41.54 | 27.19 | 0.060 | |||||||||
|
Fourth Quarter
|
48.21 | 34.54 | 0.070 | |||||||||
33
Table of Contents
|
Maximum Dollar
|
||||||||||||||||
|
Value that May Yet
|
||||||||||||||||
|
Total Number of
|
Be Used to
|
|||||||||||||||
|
Total
|
Shares Purchased
|
Repurchase
|
||||||||||||||
|
Number of
|
Average
|
as Part of Publicly
|
Shares Under the
|
|||||||||||||
|
Shares
|
Price per
|
Announced
|
Publicly Announced
|
|||||||||||||
| Period | Purchased (1) | Share | Program | Program (In millions) | ||||||||||||
|
October 1 through October 31, 2010
|
1,392 | $ | 50.53 | — | $ | 700.4 | ||||||||||
|
November 1 through November 30, 2010
|
11,122 | 53.91 | — | 700.4 | ||||||||||||
|
December 1 through December 31, 2010
|
70,087 | 63.98 | — | 700.4 | ||||||||||||
|
Total
|
82,601 | $ | 62.40 | — | ||||||||||||
| (1) | Represents shares withheld to cover the withholding taxes upon the vesting of restricted stock, which are not a part of the share repurchase program. |
| Item 6. | Selected Financial Data. |
34
Table of Contents
| Year Ended December 31, | ||||||||||||||||||||
| 2010 | 2009 | 2008 | 2007 | 2006 | ||||||||||||||||
| (In millions, except per share data) | ||||||||||||||||||||
|
Results of Operations Data
|
||||||||||||||||||||
|
Total revenues
|
$ | 6,860.0 | $ | 6,012.4 | $ | 6,561.0 | $ | 4,523.8 | $ | 4,045.6 | ||||||||||
|
Costs and expenses
|
5,534.3 | 5,167.6 | 5,164.7 | 3,924.1 | 3,432.8 | |||||||||||||||
|
Operating profit
|
1,325.7 | 844.8 | 1,396.3 | 599.7 | 612.8 | |||||||||||||||
|
Interest expense, net
|
212.5 | 193.1 | 217.0 | 228.8 | 127.8 | |||||||||||||||
|
Income from continuing operations before income taxes
|
1,113.2 | 651.7 | 1,179.3 | 370.9 | 485.0 | |||||||||||||||
|
Income tax provision (benefit)
|
308.1 | 193.8 | 191.4 | (70.7 | ) | (85.6 | ) | |||||||||||||
|
Income from continuing operations, net of income taxes
|
805.1 | 457.9 | 987.9 | 441.6 | 570.6 | |||||||||||||||
|
Income (loss) from discontinued operations, net of income taxes
|
(2.9 | ) | 5.1 | (28.8 | ) | (180.1 | ) | 30.7 | ||||||||||||
|
Net income
|
802.2 | 463.0 | 959.1 | 261.5 | 601.3 | |||||||||||||||
|
Less: net income (loss) attributable to noncontrolling interests
|
28.2 | 14.8 | 6.2 | (2.3 | ) | 0.6 | ||||||||||||||
|
Net income attributable to common stockholders
|
$ | 774.0 | $ | 448.2 | $ | 952.9 | $ | 263.8 | $ | 600.7 | ||||||||||
|
Basic earnings per share from continuing operations
|
$ | 2.89 | $ | 1.66 | $ | 3.63 | $ | 1.67 | $ | 2.15 | ||||||||||
|
Diluted earnings per share from continuing operations
|
$ | 2.86 | $ | 1.64 | $ | 3.60 | $ | 1.64 | $ | 2.11 | ||||||||||
|
Weighted average shares used in calculating basic earnings per
share
|
267.0 | 265.5 | 268.9 | 264.1 | 263.4 | |||||||||||||||
|
Weighted average shares used in calculating diluted earnings per
share
|
269.9 | 267.5 | 270.7 | 268.6 | 268.8 | |||||||||||||||
|
Dividends declared per share
|
$ | 0.295 | $ | 0.250 | $ | 0.240 | $ | 0.240 | $ | 0.240 | ||||||||||
|
Other Data
|
||||||||||||||||||||
|
Tons sold
|
245.9 | 243.6 | 255.0 | 235.5 | 221.2 | |||||||||||||||
|
Net cash provided by (used in) continuing operations:
|
||||||||||||||||||||
|
Operating activities
|
$ | 1,103.7 | $ | 1,055.8 | $ | 1,420.8 | $ | 465.0 | $ | 611.1 | ||||||||||
|
Investing activities
|
(703.6 | ) | (408.2 | ) | (419.3 | ) | (538.9 | ) | (2,055.6 | ) | ||||||||||
|
Financing activities
|
(77.1 | ) | (104.6 | ) | (498.0 | ) | 37.4 | 1,403.0 | ||||||||||||
|
Adjusted EBITDA
|
1,815.1 | 1,290.1 | 1,846.9 | 969.7 | 909.7 | |||||||||||||||
|
Balance Sheet Data (at period end)
|
||||||||||||||||||||
|
Total assets
|
$ | 11,363.1 | $ | 9,955.3 | $ | 9,695.6 | $ | 9,082.3 | $ | 9,504.7 | ||||||||||
|
Total long-term debt (including capital leases)
|
2,750.0 | 2,752.3 | 2,793.6 | 2,909.0 | 2,911.6 | |||||||||||||||
|
Total stockholders’ equity
|
4,689.3 | 3,755.9 | 3,119.5 | 2,735.3 | 2,587.0 | |||||||||||||||
35
Table of Contents
| Year Ended December 31, | ||||||||||||||||||||
| 2010 | 2009 | 2008 | 2007 | 2006 | ||||||||||||||||
| (Dollars in millions) | ||||||||||||||||||||
|
Income from continuing operations, net of income taxes
|
$ | 805.1 | $ | 457.9 | $ | 987.9 | $ | 441.6 | $ | 570.6 | ||||||||||
|
Income tax provision (benefit)
|
308.1 | 193.8 | 191.4 | (70.7 | ) | (85.6 | ) | |||||||||||||
|
Depreciation, depletion and amortization
|
440.9 | 405.2 | 402.4 | 346.3 | 282.7 | |||||||||||||||
|
Asset retirement obligation expense
|
48.5 | 40.1 | 48.2 | 23.7 | 14.2 | |||||||||||||||
|
Interest expense, net
|
212.5 | 193.1 | 217.0 | 228.8 | 127.8 | |||||||||||||||
|
Adjusted EBITDA
|
$ | 1,815.1 | $ | 1,290.1 | $ | 1,846.9 | $ | 969.7 | $ | 909.7 | ||||||||||
| Item 7. | Management’s Discussion and Analysis of Financial Condition and Results of Operations. |
36
Table of Contents
| • | Seaborne coal demand increased an estimated 13% in 2010, led by a 32% recovery in global metallurgical coal demand; | |
| • | Pacific thermal coal demand for electricity generation rose 15% in 2010, while the Atlantic market declined 10%; | |
| • | Benchmark pricing of high quality, hard coking coal in the seaborne market has ranged between $200 to $225 per tonne since April 2010; | |
| • | The benchmark prompt seaborne thermal coal price in Newcastle, Australia rose 34% in 2010; | |
| • | U.S. coal generation accounted for nearly two-thirds of the growth in total power output in 2010 due to new coal-fueled generation, favorable weather, and a partial reversal of 2009’s coal-to-gas switching; and | |
| • | Indexed U.S. coal prices rose in 2010 in all regions, with increases ranging from 30 to 50%. |
| Year Ended December 31, | Increase (Decrease) | |||||||||||||||
| 2010 | 2009 | Tons | % | |||||||||||||
| (Tons in millions) | ||||||||||||||||
|
Western U.S. Mining
|
163.8 | 160.1 | 3.7 | 2.3 | % | |||||||||||
|
Midwestern U.S. Mining
|
29.7 | 31.8 | (2.1 | ) | (6.6 | )% | ||||||||||
|
Australian Mining
|
27.0 | 22.3 | 4.7 | 21.1 | % | |||||||||||
|
Trading and Brokerage
|
25.4 | 29.4 | (4.0 | ) | (13.6 | )% | ||||||||||
|
Total tons sold
|
245.9 | 243.6 | 2.3 | 0.9 | % | |||||||||||
37
Table of Contents
|
Increase (Decrease)
|
||||||||||||||||
| Year Ended December 31, | to Revenues | |||||||||||||||
| 2010 | 2009 | $ | % | |||||||||||||
| (Dollars in millions) | ||||||||||||||||
|
Western U.S. Mining
|
$ | 2,706.3 | $ | 2,612.6 | $ | 93.7 | 3.6 | % | ||||||||
|
Midwestern U.S. Mining
|
1,320.6 | 1,303.8 | 16.8 | 1.3 | % | |||||||||||
|
Australian Mining
|
2,520.0 | 1,678.0 | 842.0 | 50.2 | % | |||||||||||
|
Trading and Brokerage
|
291.1 | 391.0 | (99.9 | ) | (25.5 | )% | ||||||||||
|
Corporate and Other
|
22.0 | 27.0 | (5.0 | ) | (18.5 | )% | ||||||||||
|
Total revenues
|
$ | 6,860.0 | $ | 6,012.4 | $ | 847.6 | 14.1 | % | ||||||||
|
Increase (Decrease) to
|
||||||||||||||||
| Year Ended December 31, | Segment Adjusted EBITDA | |||||||||||||||
| 2010 | 2009 | $ | % | |||||||||||||
| (Dollars in millions) | ||||||||||||||||
|
Western U.S. Mining
|
$ | 816.7 | $ | 721.5 | $ | 95.2 | 13.2 | % | ||||||||
|
Midwestern U.S. Mining
|
322.1 | 281.9 | 40.2 | 14.3 | % | |||||||||||
|
Australian Mining
|
953.8 | 437.8 | 516.0 | 117.9 | % | |||||||||||
|
Trading and Brokerage
|
77.2 | 193.4 | (116.2 | ) | (60.1 | )% | ||||||||||
|
Total Segment Adjusted EBITDA
|
$ | 2,169.8 | $ | 1,634.6 | $ | 535.2 | 32.7 | % | ||||||||
38
Table of Contents
|
Increase (Decrease)
|
||||||||||||||||
| Year Ended December 31, | to Income | |||||||||||||||
| 2010 | 2009 | $ | % | |||||||||||||
| (Dollars in millions) | ||||||||||||||||
|
Total Segment Adjusted EBITDA
|
$ | 2,169.8 | $ | 1,634.6 | $ | 535.2 | 32.7 | % | ||||||||
|
Corporate and Other Adjusted
EBITDA
(1)
|
(354.7 | ) | (344.5 | ) | (10.2 | ) | (3.0 | )% | ||||||||
|
Depreciation, depletion and amortization
|
(440.9 | ) | (405.2 | ) | (35.7 | ) | (8.8 | )% | ||||||||
|
Asset retirement obligation expense
|
(48.5 | ) | (40.1 | ) | (8.4 | ) | (20.9 | )% | ||||||||
|
Interest expense
|
(222.1 | ) | (201.2 | ) | (20.9 | ) | (10.4 | )% | ||||||||
|
Interest income
|
9.6 | 8.1 | 1.5 | 18.5 | % | |||||||||||
|
Income from continuing operations before income taxes
|
$ | 1,113.2 | $ | 651.7 | $ | 461.5 | 70.8 | % | ||||||||
| (1) | Corporate and Other Adjusted EBITDA results include selling and administrative expenses, equity income (loss) from our joint ventures, net gains on asset disposals or exchanges, costs associated with past mining obligations and revenues and expenses related to our other commercial activities such as generation development and Btu Conversion development costs. |
| • | Corporate and Other Adjusted EBITDA: higher expense was primarily driven by a current year increase in selling and administrative expenses due to costs to support our business development and international expansion (e.g. headcount, travel, professional services, legal). We also incurred increased post mining costs driven by higher retiree healthcare amortization of actuarial losses and interest cost. These items were partially offset by improved results from equity affiliates primarily due to prior year losses of $54.6 million related to our equity investment in Carbones del Guasare, which included a $34.7 million impairment loss and $19.9 million of operating losses. See Note 1 to our consolidated financial statements for additional information. |
39
Table of Contents
| • | Depreciation, depletion and amortization: higher compared to the prior year due to increased production at our Australian mines with higher per-ton depletion rates reflecting higher demand and additional depreciation expense associated with our new Bear Run Mine (commissioned in the second quarter of 2010). | |
| • | Interest expense: higher primarily due to refinancing charges ($9.3 million) associated with our new five-year Credit Facility and charges ($8.4 million) associated with the extinguishment and refinancing of $650.0 million of senior notes. |
|
Increase (Decrease)
|
||||||||||||||||
| Year Ended December 31, | to Income | |||||||||||||||
| 2010 | 2009 | $ | % | |||||||||||||
| (Dollars in millions) | ||||||||||||||||
|
Income from continuing operations before income taxes
|
$ | 1,113.2 | $ | 651.7 | $ | 461.5 | 70.8 | % | ||||||||
|
Income tax provision
|
(308.1 | ) | (193.8 | ) | (114.3 | ) | (59.0 | )% | ||||||||
|
Income from continuing operations, net of income taxes
|
805.1 | 457.9 | 347.2 | 75.8 | % | |||||||||||
|
Income (loss) from discontinued operations, net of income taxes
|
(2.9 | ) | 5.1 | (8.0 | ) | 156.9 | % | |||||||||
|
Net income
|
802.2 | 463.0 | 339.2 | 73.3 | % | |||||||||||
|
Net income attributable to noncontrolling interests
|
(28.2 | ) | (14.8 | ) | (13.4 | ) | (90.5 | )% | ||||||||
|
Net income attributable to common stockholders
|
$ | 774.0 | $ | 448.2 | $ | 325.8 | 72.7 | % | ||||||||
| • | Increased expense due to higher current year earnings ($161.5 million) and current year income tax resulting from foreign earnings repatriation ($84.5 million), partially offset by | |
| • | A change in the valuation allowance ($46.4 million) related primarily to alternative minimum tax credits, lower expense associated with the remeasurement of non-U.S. tax accounts as a result of the larger increase in the Australian exchange rate against the U.S. dollar in the prior year compared to the current year ($26.8 million) as set forth in the table below, the favorable rate difference resulting from higher foreign generated income in the current year ($42.5 million), and lower expense in the current year due to the reduction of our gross unrecognized tax benefit resulting from the completion of the Internal Revenue Service examination of the 2005 federal income tax year ($15.2 million). |
| December 31, | Rate Change | |||||||||||||||||||
| 2010 | 2009 | 2008 | 2010 | 2009 | ||||||||||||||||
|
Australian dollar to U.S. dollar exchange rate
|
$ | 1.0163 | $ | 0.8969 | $ | 0.6928 | $ | 0.1194 | $ | 0.2041 | ||||||||||
40
Table of Contents
| Year Ended December 31, | Increase (Decrease) | |||||||||||||||
| 2009 | 2008 | Tons | % | |||||||||||||
| (Tons in millions) | ||||||||||||||||
|
Western U.S. Mining
|
160.1 | 169.7 | (9.6 | ) | (5.7 | )% | ||||||||||
|
Midwestern U.S. Mining
|
31.8 | 30.7 | 1.1 | 3.6 | % | |||||||||||
|
Australian Mining
|
22.3 | 23.4 | (1.1 | ) | (4.7 | )% | ||||||||||
|
Trading and Brokerage
|
29.4 | 31.2 | (1.8 | ) | (5.8 | )% | ||||||||||
|
Total tons sold
|
243.6 | 255.0 | (11.4 | ) | (4.5 | )% | ||||||||||
41
Table of Contents
|
Increase (Decrease)
|
||||||||||||||||
| Year Ended December 31, | to Revenues | |||||||||||||||
| 2009 | 2008 | $ | % | |||||||||||||
| (Dollars in millions) | ||||||||||||||||
|
Western U.S. Mining
|
$ | 2,612.6 | $ | 2,533.1 | $ | 79.5 | 3.1 | % | ||||||||
|
Midwestern U.S. Mining
|
1,303.8 | 1,154.6 | 149.2 | 12.9 | % | |||||||||||
|
Australian Mining
|
1,678.0 | 2,242.8 | (564.8 | ) | (25.2 | )% | ||||||||||
|
Trading and Brokerage
|
391.0 | 601.8 | (210.8 | ) | (35.0 | )% | ||||||||||
|
Corporate and Other
|
27.0 | 28.7 | (1.7 | ) | (5.9 | )% | ||||||||||
|
Total revenues
|
$ | 6,012.4 | $ | 6,561.0 | $ | (548.6 | ) | (8.4 | )% | |||||||
| • | Australian Mining operations’ average sales price decreased 21.4% from the prior year reflecting the lower annual export contract pricing that commenced April 1, 2009 compared to the record pricing realized in 2008. The price decreases were combined with volume decreases from the prior year (4.7%) due to overall lower demand experienced in the first half of 2009. 2009 metallurgical coal shipments of 6.9 million tons were 1.3 million tons below the prior year. In the second half of 2009, 5.0 million tons of metallurgical coal were shipped, reflecting a partial recovery from the lower metallurgical coal shipments that occurred in the first half of the year. | |
| • | Trading and Brokerage revenues decreased from the prior year primarily due to lower coal pricing volatility in 2009 resulting in lower margins on trading transactions, partially offset by profit from business contracted in 2008 that was realized in 2009 on an international brokerage arrangement. |
| • | Midwestern U.S. Mining operations’ average sales price increased over the prior year (9.3%) driven by the benefit of higher Illinois Basin prices and increased shipments, including purchased coal used to satisfy certain coal supply agreements. | |
| • | Western U.S. Mining operations’ average sales price increased over the prior year (9.2%) due to a combination of higher contract pricing and a shift in sales mix. Revenues were also higher due to increased shipments from our El Segundo Mine (commissioned in June 2008) and customer contract termination and restructuring agreements. These increases were partially offset by the prior year revenue recovery on a long-term coal supply agreement ($56.9 million) and an overall volume decrease (5.7%) reflecting our planned Powder River Basin production decreases to match demand. |
42
Table of Contents
|
Increase (Decrease) to
|
||||||||||||||||
| Year Ended December 31, | Segment Adjusted EBITDA | |||||||||||||||
| 2009 | 2008 | $ | % | |||||||||||||
| (Dollars in millions) | ||||||||||||||||
|
Western U.S. Mining
|
$ | 721.5 | $ | 681.3 | $ | 40.2 | 5.9 | % | ||||||||
|
Midwestern U.S. Mining
|
281.9 | 177.3 | 104.6 | 59.0 | % | |||||||||||
|
Australian Mining
|
437.8 | 1,016.6 | (578.8 | ) | (56.9 | )% | ||||||||||
|
Trading and Brokerage
|
193.4 | 218.9 | (25.5 | ) | (11.6 | )% | ||||||||||
|
Total Segment Adjusted EBITDA
|
$ | 1,634.6 | $ | 2,094.1 | $ | (459.5 | ) | (21.9 | )% | |||||||
|
Increase (Decrease)
|
||||||||||||||||
| Year Ended December 31, | to Income | |||||||||||||||
| 2009 | 2008 | $ | % | |||||||||||||
| (Dollars in millions) | ||||||||||||||||
|
Total Segment Adjusted EBITDA
|
$ | 1,634.6 | $ | 2,094.1 | $ | (459.5 | ) | (21.9 | )% | |||||||
|
Corporate and Other Adjusted
EBITDA
(1)
|
(344.5 | ) | (247.2 | ) | (97.3 | ) | (39.4 | )% | ||||||||
|
Depreciation, depletion and amortization
|
(405.2 | ) | (402.4 | ) | (2.8 | ) | (0.7 | )% | ||||||||
|
Asset retirement obligation expense
|
(40.1 | ) | (48.2 | ) | 8.1 | 16.8 | % | |||||||||
|
Interest expense
|
(201.2 | ) | (227.0 | ) | 25.8 | 11.4 | % | |||||||||
|
Interest income
|
8.1 | 10.0 | (1.9 | ) | (19.0 | )% | ||||||||||
|
Income from continuing operations before income taxes
|
$ | 651.7 | $ | 1,179.3 | $ | (527.6 | ) | (44.7 | )% | |||||||
43
Table of Contents
| (1) | Corporate and Other Adjusted EBITDA results include selling and administrative expenses, equity income (loss) from our joint ventures, net gains on asset disposals or exchanges, costs associated with past mining obligations and revenues and expenses related to our other commercial activities such as generation development and Btu Conversion development costs. |
| • | Lower results from equity affiliates ($69.1 million) primarily from our joint venture interest in Carbones del Guasare (owner and operator of the Paso Diablo Mine in Venezuela). Carbones del Guasare incurred unfavorable results in 2009 compared to 2008 (our share of which was $25.6 million) due to lower productivity, higher operating costs and ongoing labor issues; in addition, we recognized a $34.7 million impairment loss on this investment. See Note 1 to our consolidated financial statements for additional information. | |
| • | Lower net gains on disposal or exchange of assets ($49.7 million) was due primarily to a $54.0 million gain in the prior year from the sale of non-strategic coal reserves and surface lands located in Kentucky. | |
| • | The above decreases to Corporate and Other Adjusted EBITDA were offset by lower costs associated with Btu Conversion activities ($16.9 million). |
|
Increase (Decrease)
|
||||||||||||||||
| Year Ended December 31, | to Income | |||||||||||||||
| 2009 | 2008 | $ | % | |||||||||||||
| (Dollars in millions) | ||||||||||||||||
|
Income from continuing operations before income taxes
|
$ | 651.7 | $ | 1,179.3 | $ | (527.6 | ) | (44.7 | )% | |||||||
|
Income tax provision
|
(193.8 | ) | (191.4 | ) | (2.4 | ) | (1.3 | )% | ||||||||
|
Income from continuing operations, net of income taxes
|
457.9 | 987.9 | (530.0 | ) | (53.6 | )% | ||||||||||
|
Income (loss) from discontinued operations, net of income taxes
|
5.1 | (28.8 | ) | 33.9 | 117.7 | % | ||||||||||
|
Net income
|
463.0 | 959.1 | (496.1 | ) | (51.7 | )% | ||||||||||
|
Net income attributable to noncontrolling interests
|
(14.8 | ) | (6.2 | ) | (8.6 | ) | (138.7 | )% | ||||||||
|
Net income attributable to common stockholders
|
$ | 448.2 | $ | 952.9 | $ | (504.7 | ) | (53.0 | )% | |||||||
44
Table of Contents
| • | Increased expense associated with the remeasurement of non-U.S. tax accounts as a result of the strengthening Australian dollar against the U.S dollar ($139.6 million; exchange rate rose 29% in 2009 compared to a 21% decrease in 2008, as illustrated below); and |
| December 31, | Rate Change | |||||||||||||||||||
| 2009 | 2008 | 2007 | 2009 | 2008 | ||||||||||||||||
|
Australian dollar to U.S. dollar exchange rate
|
$ | 0.8969 | $ | 0.6928 | $ | 0.8816 | $ | 0.2041 | $ | (0.1888 | ) | |||||||||
| • | The prior year release of a foreign valuation allowance related to our Australian net operating loss carry forwards ($45.3 million) as a result of significantly higher earnings resulting from the higher contract pricing that was secured during 2008. | |
| • | The above increases to income tax expense were partially offset by lower pre-tax earnings in 2009, which drove a decrease to the income tax provision ($184.6 million). |
| • | According to the World Steel Association (WSA), global steel use was expected to increase 13.1% in 2010, followed by another 5.3% in 2011 to a record 1.3 billion tonnes. The WSA forecasts India’s steel demand would rise 8.2% in 2010 and 13.6% in 2011. Similar trends are apparent in steel production. For 2010, global steel production exceeded prior year levels by 15%, led by Asia-based production (Japan, Taiwan, South Korea, China and India). Industry reports indicate China, the world’s largest steel consumer, is expected to grow its steel use 11% in 2010, and is projected to grow a further 8% to 9% in 2011. | |
| • | Industry reports forecast nearly 85 gigawatts of new coal-fueled generation globally were due to come on line during 2010; nearly 80% of which were in China and India. New global coal-fueled generation for 2010 is estimated to require approximately 290 million tons of coal annually. For 2011, approximately 90 gigawatts are expected to be under construction and/or come online, requiring more than 340 million tons of coal. China and India continue to make up the vast majority. | |
| • | Given the pace of coal demand in the Pacific throughout 2010, coupled with late-2010 weather-related demand increases in the Northern Hemisphere and supply constraints in key nations such as Australia, Indonesia, South Africa, South America and Canada, prices for seaborne metallurgical and thermal coal |
45
Table of Contents
| have been increasing. High quality, hard coking coal prices have increased from $129 per tonne for annual contracts commencing April 2009, to quarterly (April, July, October 2010) prices ranging between $200 and $225 per tonne, with January 2011 spot price exceeding $350 per tonne. Prompt index prices for Australian seaborne thermal coal rose 34% by year-end 2010, and have risen another 10% as of January 18, 2011. |
46
Table of Contents
47
Table of Contents
48
Table of Contents
49
Table of Contents
| December 31, | ||||||||
| 2010 | 2009 | |||||||
| (Dollars in millions) | ||||||||
|
Term Loan
|
$ | 493.8 | $ | 490.3 | ||||
|
6.875% Senior Notes due March 2013
|
— | 650.0 | ||||||
|
5.875% Senior Notes due April 2016
|
218.1 | 218.1 | ||||||
|
7.375% Senior Notes due November 2016
|
650.0 | 650.0 | ||||||
|
6.5% Senior Notes due September 2020
|
650.0 | — | ||||||
|
7.875% Senior Notes due November 2026
|
247.2 | 247.1 | ||||||
|
6.34% Series B Bonds due December 2014
|
12.0 | 15.0 | ||||||
|
6.84% Series C Bonds due December 2016
|
33.0 | 33.0 | ||||||
|
Convertible Junior Subordinated Debentures due 2066
|
373.3 | 371.5 | ||||||
|
Capital lease obligations
|
69.6 | 67.5 | ||||||
|
Fair value hedge adjustment
|
2.2 | 8.4 | ||||||
|
Other
|
0.8 | 1.4 | ||||||
|
Total
|
$ | 2,750.0 | $ | 2,752.3 | ||||
50
Table of Contents
|
Increase (Decrease) to
|
||||||||||||||||
| Year Ended December 31, | Cash Flow | |||||||||||||||
| 2010 | 2009 | $ | % | |||||||||||||
| (Dollars in millions) | ||||||||||||||||
|
Net cash provided by operating activities
|
$ | 1,087.1 | $ | 1,050.2 | $ | 36.9 | 3.5 | % | ||||||||
|
Net cash used in investing activities
|
(703.6 | ) | (406.5 | ) | (297.1 | ) | 73.1 | % | ||||||||
|
Net cash used in financing activities
|
(77.1 | ) | (104.6 | ) | 27.5 | (26.3 | )% | |||||||||
| • | Strong operating cash flows generated from our Australian Mining operations driven by higher volumes and pricing; partially offset by | |
| • | Increased margin posted for our derivative trading instruments; | |
| • | Lower utilization of our accounts receivable securitization program in the current year; and | |
| • | Higher pension payments in the current year. |
| • | Higher current year capital spending of $296.4 million related primarily to our Bear Run Mine; | |
| • | Current year net cash outflows related to our pro-rata share of funding for the NCIG coal transloading facility; and | |
| • | The collection of a note receivable of $30.0 million in the prior year; partially offset by | |
| • | Federal coal lease expenditures of $123.6 million in the prior year. |
| Payments Due By Year | ||||||||||||||||||||
|
Less than
|
2 - 3
|
4 - 5
|
More than
|
|||||||||||||||||
| Total | 1 Year | Years | Years | 5 Years | ||||||||||||||||
| (Dollars in millions) | ||||||||||||||||||||
|
Long-term debt obligations (principal and interest)
|
$ | 5,621.6 | $ | 213.4 | $ | 436.6 | $ | 789.4 | $ | 4,182.2 | ||||||||||
|
Capital lease obligations (principal and interest)
|
74.6 | 17.0 | 42.1 | 15.5 | — | |||||||||||||||
|
Operating lease obligations
|
455.8 | 95.6 | 147.2 | 106.1 | 106.9 | |||||||||||||||
|
Unconditional purchase
obligations
(1)
|
458.2 | 406.7 | 51.5 | — | — | |||||||||||||||
|
Coal reserve lease and royalty obligations
|
62.0 | 7.2 | 14.3 | 10.2 | 30.3 | |||||||||||||||
|
Take or pay
obligations
(2)
|
2,892.9 | 217.5 | 465.9 | 425.7 | 1,783.8 | |||||||||||||||
|
Other long-term
liabilities
(3)
|
2,204.1 | 154.6 | 301.7 | 298.7 | 1,449.1 | |||||||||||||||
|
Total contractual cash obligations
|
$ | 11,769.2 | $ | 1,112.0 | $ | 1,459.3 | $ | 1,645.6 | $ | 7,552.3 | ||||||||||
51
Table of Contents
| (1) | We have purchase agreements with approved vendors for most types of operating expenses. However, our specific open purchase orders (which have not been recognized as a liability) under these purchase agreements, combined with any other open purchase orders, are not material. The commitments in the table above relate to capital purchases. The purchase obligations for capital expenditures relate to new mines and expansion and extension projects in Australia and the U.S. | |
| (2) | Represents various long- and short-term take or pay arrangements associated with rail and port commitments for the delivery of coal including amounts relating to export facilities. | |
| (3) | Represents long-term liabilities relating to our postretirement benefit plans, work-related injuries and illnesses, defined benefit pension plans and mine reclamation and end of mine closure costs. |
52
Table of Contents
|
One-Percentage-
|
One-Percentage-
|
|||||||
| Point Increase | Point Decrease | |||||||
| (Dollars in millions) | ||||||||
|
Effect on total service and interest cost
components
(1)
|
$ | 7.8 | $ | (6.6 | ) | |||
|
Effect on total postretirement benefit
obligation
(1)
|
$ | 112.5 | $ | (94.4 | ) | |||
53
Table of Contents
|
One-Half
|
One-Half
|
|||||||
|
Percentage-
|
Percentage-
|
|||||||
| Point Increase | Point Decrease | |||||||
| (Dollars in millions) | ||||||||
|
Effect on total service and interest cost
components
(1)
|
$ | 0.6 | $ | (0.6 | ) | |||
|
Effect on total postretirement benefit
obligation
(1)
|
$ | (51.1 | ) | $ | 58.8 | |||
| (1) | In addition to the effect on total service and interest cost components of expense, changes in trend and discount rates would also increase or decrease the actuarial gain or loss amortization expense component. The gain or loss amortization would approximate the increase or decrease in the obligation divided by 11.93 years at December 31, 2010. |
54
Table of Contents
| Item 7A. | Quantitative and Qualitative Disclosures About Market Risk |
55
Table of Contents
| Year Ended December 31, 2010 | Low | High | Average | |||||||||
| (Dollars in millions) | ||||||||||||
|
Previous Methodology
|
$ | 4.5 | $ | 37.6 | $ | 10.1 | ||||||
|
New Methodology
|
$ | 3.4 | $ | 18.8 | $ | 7.0 | ||||||
|
Year of
|
Percentage of
|
|||
| Expiration | Portfolio Total | |||
|
2011
|
70 | % | ||
|
2012
|
21 | % | ||
|
2013
|
3 | % | ||
|
2014
|
4 | % | ||
|
2015
|
2 | % | ||
| 100 | % | |||
56
Table of Contents
57
Table of Contents
| Notional Amount by Year of Maturity | ||||||||||||||||||||||||||||
| Total | 2011 | 2012 | 2013 | 2014 | 2015 | 2016 and thereafter | ||||||||||||||||||||||
|
Foreign Currency
|
||||||||||||||||||||||||||||
|
A$:US$ hedge contracts (A$ millions)
|
$ | 4,187.5 | $ | 1,484.2 | $ | 1,355.2 | $ | 926.6 | $ | 421.5 | $ | — | $ | — | ||||||||||||||
|
Commodity Contracts
|
||||||||||||||||||||||||||||
|
Diesel fuel hedge contracts (million gallons)
|
191.4 | 89.5 | 76.2 | 25.7 | — | — | — | |||||||||||||||||||||
|
U.S. explosives hedge contracts (million MMBtu)
|
8.4 | 3.9 | 3.0 | 1.5 | — | — | — | |||||||||||||||||||||
| Account Classification by | |||||||||||||||||
|
Cash flow
|
Fair value
|
Economic
|
Fair Value Asset
|
||||||||||||||
| hedge | hedge | hedge | (Liability) | ||||||||||||||
|
(Dollars in
|
|||||||||||||||||
| millions) | |||||||||||||||||
|
Foreign Currency
|
|||||||||||||||||
|
A$:US$ hedge contracts (A$ millions)
|
$ | 4,187.5 | $ | — | $ | — | $ | 640.1 | |||||||||
|
Commodity Contracts
|
|||||||||||||||||
|
Diesel fuel hedge contracts (million gallons)
|
191.4 | — | — | $ | 40.3 | ||||||||||||
|
U.S. explosives hedge contracts (million MMBtu)
|
8.4 | — | — | $ | (0.1 | ) | |||||||||||
| Item 8. | Financial Statements and Supplementary Data. |
| Item 9. | Changes in and Disagreements with Accountants on Accounting and Financial Disclosure. |
| Item 9A. | Controls and Procedures. |
58
Table of Contents
|
/s/
Gregory
H. Boyce
Chairman and Chief Executive Officer |
/s/
Michael
C. Crews
Executive Vice President and Chief Financial Officer |
|||
59
Table of Contents
60
Table of Contents
| Item 9B. | Other Information. |
| Year Ended December 31, | ||||||||||||
| 2010 | 2009 | 2008 | ||||||||||
|
U.S.
|
1.95 | 2.08 | 1.70 | |||||||||
|
Australia
|
4.03 | 4.43 | 7.24 | |||||||||
|
Total Peabody Energy Corporation
|
2.69 | 2.87 | 3.55 | |||||||||
|
MSHA
|
3.86 | 4.14 | 4.41 | |||||||||
61
Table of Contents
| • | Section 104 Citations: The total number of violations received from MSHA under section 104 of the Mine Act, which includes citations for health or safety standards that could significantly and substantially contribute to a serious injury if left unabated. | |
| • | Section 104(b) Orders: The total number of orders issued by MSHA under section 104(b) of the Mine Act, which represents a failure to abate a citation under section 104(a) within the period of time prescribed by MSHA. This results in an order of immediate withdrawal from the area of the mine affected by the condition until MSHA determines that the violation has been abated. | |
| • | Section 104(d) Citations and Orders: The total number of citations and orders issued by MSHA under section 104(d) of the Mine Act for unwarrantable failure to comply with mandatory health or safety standards. | |
| • | Section 110(b)(2) Violations: The total number of flagrant violations issued by MSHA under section 110(b)(2) of the Mine Act. | |
| • | Section 107(a) Orders: The total number of orders issued by MSHA under section 107(a) of the Mine Act for situations in which MSHA determined an imminent danger existed. |
|
Section
|
Section
|
($)
|
||||||||||||||||||||||||||||||
|
Section
|
Section
|
104(d)
|
104(e)
|
Section
|
Section
|
Proposed
|
||||||||||||||||||||||||||
|
104
|
104(b)
|
Citations and
|
Potential pattern
|
110(b)(2)
|
107(a)
|
MSHA
|
||||||||||||||||||||||||||
| Mine (1) | Citations | Orders | Orders | of Violations | Violations | Orders | Assessments | Fatalities | ||||||||||||||||||||||||
| (In thousands) | ||||||||||||||||||||||||||||||||
|
Western U.S. Mining
|
||||||||||||||||||||||||||||||||
|
Caballo
|
1 | — | — | — | — | — | 0.1 | — | ||||||||||||||||||||||||
|
El Segundo
|
1 | — | — | — | — | — | 0.1 | — | ||||||||||||||||||||||||
|
Kayenta
|
10 | — | — | — | — | — | 14.5 | — | ||||||||||||||||||||||||
|
Lee Ranch
|
2 | — | — | — | — | — | 2.4 | — | ||||||||||||||||||||||||
|
North Antelope Rochelle
|
9 | — | — | — | — | — | 1.1 | — | ||||||||||||||||||||||||
|
Rawhide
|
5 | — | — | — | — | — | 2.0 | — | ||||||||||||||||||||||||
|
Twentymile (Foidel Creek)
|
55 | — | 1 | — | — | — | 45.9 | — | ||||||||||||||||||||||||
|
Midwestern U.S. Mining
|
||||||||||||||||||||||||||||||||
|
Air Quality
|
133 | 1 | — | — | — | — | 175.1 | — | ||||||||||||||||||||||||
|
Bear Run
|
13 | 1 | — | — | — | — | 1.7 | — | ||||||||||||||||||||||||
|
Francisco Underground
|
90 | 1 | 1 | — | — | — | 132.6 | — | ||||||||||||||||||||||||
|
Gateway
|
135 | — | 3 | — | — | — | 200.7 | — | ||||||||||||||||||||||||
|
Somerville Central
|
23 | — | — | — | — | — | 29.4 | — | ||||||||||||||||||||||||
|
Viking (Viking-Corning and Knot Pit)
|
9 | — | — | — | — | — | 12.0 | — | ||||||||||||||||||||||||
|
Wildcat Hills Underground
|
82 | — | — | — | — | — | 52.2 | |||||||||||||||||||||||||
|
Willow Lake (Willow Lake Portal and Central Preparation Plant)
|
185 | 2 | 1 | 1 | 1 | — | 347.3 | — | ||||||||||||||||||||||||
62
Table of Contents
|
Section
|
Section
|
($)
|
||||||||||||||||||||||||||||||
|
Section
|
Section
|
104(d)
|
104(e)
|
Section
|
Section
|
Proposed
|
||||||||||||||||||||||||||
|
104
|
104(b)
|
Citations and
|
Potential pattern
|
110(b)
(2)
|
107(a)
|
MSHA
|
||||||||||||||||||||||||||
| Mine (1) | Citations | Orders | Orders | of Violations | Violations | Orders | Assessments | Fatalities | ||||||||||||||||||||||||
| (In thousands) | ||||||||||||||||||||||||||||||||
|
Western U.S. Mining
|
||||||||||||||||||||||||||||||||
|
Caballo
|
19 | — | — | — | — | — | 8.7 | — | ||||||||||||||||||||||||
|
El Segundo
|
14 | — | — | — | — | — | 3.3 | — | ||||||||||||||||||||||||
|
Kayenta
|
66 | — | — | — | — | 1 | 68.7 | — | ||||||||||||||||||||||||
|
Lee Ranch
|
22 | — | — | — | — | — | 33.2 | — | ||||||||||||||||||||||||
|
North Antelope Rochelle
|
49 | — | — | — | — | — | 69.8 | — | ||||||||||||||||||||||||
|
Rawhide
|
12 | — | — | — | — | 1 | 13.0 | — | ||||||||||||||||||||||||
|
Twentymile (Foidel Creek)
|
262 | — | 1 | — | — | 1 | 327.7 | — | ||||||||||||||||||||||||
|
Midwestern U.S. Mining
|
||||||||||||||||||||||||||||||||
|
Air Quality
|
497 | 2 | 8 | — | — | — | 922.0 | — | ||||||||||||||||||||||||
|
Bear Run
|
27 | 1 | — | — | — | — | 4.3 | — | ||||||||||||||||||||||||
|
Cottage Grove (Wildcat Hills-Cottage Grove Pit)
|
11 | — | — | — | — | — | 3.5 | — | ||||||||||||||||||||||||
|
Farmersburg
(2)
|
15 | — | — | — | — | — | 19.7 | — | ||||||||||||||||||||||||
|
Francisco Underground
|
427 | 2 | 9 | — | — | — | 586.6 | — | ||||||||||||||||||||||||
|
Francisco
Surface
(2)
|
17 | — | — | — | — | — | 50.1 | — | ||||||||||||||||||||||||
|
Gateway
|
481 | — | 9 | — | — | 1 | 1,172.8 | — | ||||||||||||||||||||||||
|
Midwest Repair Facility (Columbia Maintenance Services)
|
6 | — | — | — | — | — | 0.7 | — | ||||||||||||||||||||||||
|
Somerville Central
|
50 | — | — | — | — | — | 89.2 | — | ||||||||||||||||||||||||
|
Viking (Viking-Corning and Knot Pit)
|
47 | — | — | — | — | — | 55.3 | — | ||||||||||||||||||||||||
|
Wildcat Hills Underground
|
307 | — | — | — | — | — | 252.7 | — | ||||||||||||||||||||||||
|
Willow Lake (Willow Lake Portal and Central Preparation Plant)
|
904 | 3 | 17 | 1 | 1 | — | 2,213.5 | 1 | ||||||||||||||||||||||||
| (1) | The definition of mine under section 3 of the Mine Act includes the mine, as well as other items used in, or to be used in, or resulting from, the work of extracting coal, such as land, structures, facilities, equipment, machines, tools, and coal preparation facilities. Unless otherwise indicated, any of these other items associated with a single mine have been aggregated in the totals for that mine. Also, there are instances where the mine name per the MSHA system differs from the mine name utilized by us. Where applicable, we have parenthetically listed the name(s) of the mine per the MSHA system. | |
| (2) | The Francisco Surface Mine was closed in the fourth quarter of 2009 and the Farmersburg Mine was closed in the fourth quarter of 2010. |
63
Table of Contents
| • | Contests of Citations and Orders — A contest proceeding may be filed with the Commission by operators, miners or miners’ representatives to challenge the issuance of a citation or order issued by MSHA. | |
| • | Contests of Proposed Penalties (Petitions for Assessment of Penalties) — A contest of a proposed penalty is an administrative proceeding before the Commission challenging a civil penalty that MSHA has proposed for the violation contained in a citation or order. | |
| • | Complaints for Compensation — A complaint for compensation may be filed with the Commission by miners entitled to compensation when a mine is closed by certain withdrawal orders issued by MSHA. The purpose of the proceeding is to determine the amount of compensation, if any, due miners idled by the orders. | |
| • | Complaints of Discharge, Discrimination or Interference — A discrimination proceeding is a case that involves a miner’s allegation that he or she has suffered a wrong by the operator because he or she engaged in some type of activity protected under the Mine Act, such as making a safety complaint. | |
| • | Temporary Reinstatement Proceedings — Temporary reinstatement proceedings involve cases in which a miner has filed a complaint with MSHA stating he or she has suffered discrimination and the miner has lost his or her position. | |
| • | Emergency Response Plan (ERP) Dispute Proceedings — ERP dispute proceedings are cases brought before the Commission when an operator is issued a citation because it has not agreed to include a certain provision in its ERP. |
|
Legal
|
||||
| Mine (1) | Actions | |||
|
Western U.S. Mining
|
||||
|
Caballo
|
1 | |||
|
Kayenta
|
7 | |||
|
Lee Ranch
|
1 | |||
|
North Antelope Rochelle
|
12 | |||
|
Rawhide
|
4 | |||
|
Twentymile (Foidel Creek)
|
27 | |||
|
Midwestern U.S. Mining
|
||||
|
Air Quality
|
26 | |||
|
Cottage Grove (Wildcat Hills-Cottage Grove Pit)
|
2 | |||
|
Francisco Underground
|
8 | |||
|
Gateway
|
12 | |||
|
Somerville Central
|
2 | |||
|
Vermilion Grove
|
1 | |||
|
Viking (Viking-Corning and Knot Pit)
|
1 | |||
|
Wildcat Hills Underground
|
1 | |||
|
Willow Lake (Willow Lake Portal and Central Preparation Plant)
|
42 | |||
| (1) | The definition of mine under section 3 of the Mine Act includes the mine, as well as other items used in, or to be used in, or resulting from, the work of extracting coal, such as land, structures, facilities, equipment, machines, tools and coal preparation facilities. Unless otherwise indicated, any of these other items associated with a single mine have been aggregated in the totals for that mine. Also, there are instances where the mine name per the MSHA system differs from the mine name utilized by us. Where applicable, we have parenthetically listed the name(s) of the mine per the MSHA system. |
64
Table of Contents
| Item 10. | Directors, Executive Officers and Corporate Governance. |
| Item 11. | Executive Compensation. |
| Item 12. | Security Ownership of Certain Beneficial Owners and Management and Related Stockholder Matters. |
|
Number of Securities
|
||||||||||||
|
Remaining Available
|
||||||||||||
|
for Future Issuance
|
||||||||||||
|
(a)
|
Under Equity
|
|||||||||||
|
Number of Securities
|
Compensation Plans
|
|||||||||||
|
to be Issued
|
Weighted-Average
|
(Excluding
|
||||||||||
|
upon Exercise of
|
Exercise Price of
|
Securities
|
||||||||||
|
Outstanding Options,
|
Outstanding Options,
|
Reflected in Column
|
||||||||||
| Plan Category | Warrants and Rights | Warrants and Rights | (a)) | |||||||||
|
Equity compensation plans approved
|
||||||||||||
|
by security holders
|
1,437,039 | (1) | $ | 27.61 | (2) | 13,541,829 | (3) | |||||
|
Equity compensation plans not approved
|
||||||||||||
|
by security holders
|
— | — | — | |||||||||
|
Total
|
1,437,039 | $ | 27.61 | 13,541,829 | ||||||||
| (1) | Includes 38,331 shares issuable pursuant to outstanding deferred stock units and 159,553 shares issuable pursuant to outstanding performance units. | |
| (2) | The weighted average exercise price shown in the table does not take into account outstanding deferred stock units or performance awards. | |
| (3) | Includes 2,310,734 shares available for issuance under our U.S. Employee Stock Purchase Plan and 976,823 shares available for issuance under our Australian Employee Stock Purchase Plan. |
65
Table of Contents
| Item 13. | Certain Relationships and Related Transactions, and Director Independence. |
| Item 14. | Principal Accounting Fees and Services. |
| Item 15. | Exhibit, Financial Statement Schedules. |
| Page | ||||
|
Report of Independent Registered Public Accounting Firm
|
F-1 | |||
|
Consolidated Statements of Operations — Years Ended
December 31, 2010, 2009 and 2008
|
F-2 | |||
|
Consolidated Balance Sheets — December 31, 2010
and December 31, 2009
|
F-3 | |||
|
Consolidated Statements of Cash Flows — Years Ended
December 31, 2010, 2009 and 2008
|
F-4 | |||
|
Consolidated Statements of Changes in Stockholders’
Equity — Years Ended December 31, 2010, 2009 and
2008
|
F-5 | |||
|
Notes to Consolidated Financial Statements
|
F-6 | |||
| Page | ||||
|
Valuation and Qualifying Accounts
|
F-69 | |||
66
Table of Contents
| Signature | Title | Date | ||||
|
/s/
GREGORY
H. BOYCE
|
Chairman and Chief Executive Officer,
Director (principal executive officer) |
February 28, 2011 | ||||
|
/s/
MICHAEL
C. CREWS
|
Executive Vice President and Chief Financial Officer (principal financial and accounting officer) | February 28, 2011 | ||||
|
/s/
WILLIAM
A. COLEY
|
Director | February 28, 2011 | ||||
|
/s/
WILLIAM
E. JAMES
|
Director | February 28, 2011 | ||||
|
/s/
ROBERT
B. KARN III
|
Director | February 28, 2011 | ||||
|
/s/
M.
FRANCES KEETH
|
Director | February 28, 2011 | ||||
|
/s/
HENRY
E. LENTZ
|
Director | February 28, 2011 | ||||
|
/s/
ROBERT
A. MALONE
|
Director | February 28, 2011 | ||||
|
/s/
WILLIAM
C. RUSNACK
|
Director | February 28, 2011 | ||||
|
/s/
JOHN
F. TURNER
|
Director | February 28, 2011 | ||||
|
/s/
SANDRA
VAN TREASE
|
Director | February 28, 2011 | ||||
|
/s/
ALAN
H. WASHKOWITZ
|
Director | February 28, 2011 | ||||
67
Table of Contents
F-1
Table of Contents
| Year Ended December 31, | ||||||||||||
| 2010 | 2009 | 2008 | ||||||||||
| (Dollars in millions, except per share data) | ||||||||||||
|
Revenues
|
||||||||||||
|
Sales
|
$ | 6,331.3 | $ | 5,468.1 | $ | 6,004.0 | ||||||
|
Other revenues
|
528.7 | 544.3 | 557.0 | |||||||||
|
Total revenues
|
6,860.0 | 6,012.4 | 6,561.0 | |||||||||
|
Costs and expenses
|
||||||||||||
|
Operating costs and expenses
|
4,841.0 | 4,472.6 | 4,589.7 | |||||||||
|
Depreciation, depletion and amortization
|
440.9 | 405.2 | 402.4 | |||||||||
|
Asset retirement obligation expense
|
48.5 | 40.1 | 48.2 | |||||||||
|
Selling and administrative expenses
|
232.2 | 203.8 | 197.3 | |||||||||
|
Other operating (income) loss:
|
||||||||||||
|
Net gain on disposal or exchange of assets
|
(30.0 | ) | (23.2 | ) | (72.9 | ) | ||||||
|
Loss from equity affiliates
|
1.7 | 69.1 | — | |||||||||
|
Operating profit
|
1,325.7 | 844.8 | 1,396.3 | |||||||||
|
Interest expense
|
222.1 | 201.2 | 227.0 | |||||||||
|
Interest income
|
(9.6 | ) | (8.1 | ) | (10.0 | ) | ||||||
|
Income from continuing operations before income taxes
|
1,113.2 | 651.7 | 1,179.3 | |||||||||
|
Income tax provision
|
308.1 | 193.8 | 191.4 | |||||||||
|
Income from continuing operations, net of income taxes
|
805.1 | 457.9 | 987.9 | |||||||||
|
Income (loss) from discontinued operations, net of income taxes
|
(2.9 | ) | 5.1 | (28.8 | ) | |||||||
|
Net income
|
802.2 | 463.0 | 959.1 | |||||||||
|
Less: Net income attributable to noncontrolling interests
|
28.2 | 14.8 | 6.2 | |||||||||
|
Net income attributable to common stockholders
|
$ | 774.0 | $ | 448.2 | $ | 952.9 | ||||||
|
Income From Continuing Operations
|
||||||||||||
|
Basic earnings per share
|
$ | 2.89 | $ | 1.66 | $ | 3.63 | ||||||
|
Diluted earnings per share
|
$ | 2.86 | $ | 1.64 | $ | 3.60 | ||||||
|
Net Income Attributable to Common Stockholders
|
||||||||||||
|
Basic earnings per share
|
$ | 2.88 | $ | 1.68 | $ | 3.52 | ||||||
|
Diluted earnings per share
|
$ | 2.85 | $ | 1.66 | $ | 3.50 | ||||||
|
Dividends declared per share
|
$ | 0.295 | $ | 0.250 | $ | 0.240 | ||||||
F-2
Table of Contents
| December 31, | ||||||||
| 2010 | 2009 | |||||||
|
(Amounts in millions,
|
||||||||
| except per share data) | ||||||||
|
ASSETS
|
||||||||
|
Current assets
|
||||||||
|
Cash and cash equivalents
|
$ | 1,295.2 | $ | 988.8 | ||||
|
Accounts receivable, net of allowance for doubtful accounts of
$30.3 at
|
||||||||
|
December 31, 2010 and $18.3 at December 31, 2009
|
558.2 | 303.0 | ||||||
|
Inventories
|
332.9 | 325.1 | ||||||
|
Assets from coal trading activities, net
|
192.5 | 276.8 | ||||||
|
Deferred income taxes
|
120.4 | 40.0 | ||||||
|
Other current assets
|
459.0 | 255.3 | ||||||
|
Total current assets
|
2,958.2 | 2,189.0 | ||||||
|
Property, plant, equipment and mine development
|
||||||||
|
Land and coal interests
|
7,657.0 | 7,557.3 | ||||||
|
Buildings and improvements
|
1,079.8 | 908.0 | ||||||
|
Machinery and equipment
|
1,699.3 | 1,391.2 | ||||||
|
Less: accumulated depreciation, depletion and amortization
|
(3,010.0 | ) | (2,595.0 | ) | ||||
|
Property, plant, equipment and mine development, net
|
7,426.1 | 7,261.5 | ||||||
|
Investments and other assets
|
978.8 | 504.8 | ||||||
|
Total assets
|
$ | 11,363.1 | $ | 9,955.3 | ||||
| LIABILITIES AND STOCKHOLDERS’ EQUITY | ||||||||
|
Current liabilities
|
||||||||
|
Current maturities of long-term debt
|
$ | 43.2 | $ | 14.1 | ||||
|
Liabilities from coal trading activities, net
|
181.7 | 110.6 | ||||||
|
Accounts payable and accrued expenses
|
1,288.8 | 1,187.7 | ||||||
|
Total current liabilities
|
1,513.7 | 1,312.4 | ||||||
|
Long-term debt, less current maturities
|
2,706.8 | 2,738.2 | ||||||
|
Deferred income taxes
|
539.8 | 299.1 | ||||||
|
Asset retirement obligations
|
501.3 | 452.1 | ||||||
|
Accrued postretirement benefit costs
|
963.9 | 914.1 | ||||||
|
Other noncurrent liabilities
|
448.3 | 483.5 | ||||||
|
Total liabilities
|
6,673.8 | 6,199.4 | ||||||
|
Stockholders’ equity
|
||||||||
|
Preferred Stock — $0.01 per share par value;
10.0 shares authorized, no shares issued or outstanding as
of December 31, 2010 or December 31, 2009
|
— | — | ||||||
|
Series A Junior Participating Preferred Stock —
1.5 shares authorized, no shares issued or outstanding as
of December 31, 2010 or December 31, 2009
|
— | — | ||||||
|
Perpetual Preferred Stock — 0.8 shares
authorized, no shares issued or outstanding as of
December 31, 2010 or December 31, 2009
|
— | — | ||||||
|
Series Common Stock — $0.01 per share par value;
40.0 shares authorized, no shares issued or outstanding as
of December 31, 2010 or December 31, 2009
|
— | — | ||||||
|
Common Stock — $0.01 per share par value;
800.0 shares authorized, 279.1 shares issued and
270.2 shares outstanding as of December 31, 2010 and
276.8 shares issued and 268.2 shares outstanding as of
December 31, 2009
|
2.8 | 2.8 | ||||||
|
Additional paid-in capital
|
2,182.0 | 2,067.7 | ||||||
|
Retained earnings
|
2,878.4 | 2,183.8 | ||||||
|
Accumulated other comprehensive loss
|
(67.9 | ) | (183.5 | ) | ||||
|
Treasury shares, at cost: 8.9 shares as of
December 31, 2010 and 8.6 shares as of
December 31, 2009
|
(334.6 | ) | (321.1 | ) | ||||
|
Peabody Energy Corporation’s stockholders’ equity
|
4,660.7 | 3,749.7 | ||||||
|
Noncontrolling interests
|
28.6 | 6.2 | ||||||
|
Total stockholders’ equity
|
4,689.3 | 3,755.9 | ||||||
|
Total liabilities and stockholders’ equity
|
$ | 11,363.1 | $ | 9,955.3 | ||||
F-3
Table of Contents
| Year Ended December 31, | ||||||||||||
| 2010 | 2009 | 2008 | ||||||||||
| (Dollars in millions) | ||||||||||||
|
Cash Flows From Operating Activities
|
||||||||||||
|
Net income
|
$ | 802.2 | $ | 463.0 | $ | 959.1 | ||||||
|
(Income) loss from discontinued operations, net of income taxes
|
2.9 | (5.1 | ) | 28.8 | ||||||||
|
Income from continuing operations, net of income taxes
|
805.1 | 457.9 | 987.9 | |||||||||
|
Adjustments to reconcile income from continuing operations, net
of income taxes
|
||||||||||||
|
to net cash provided by operating activities:
|
||||||||||||
|
Depreciation, depletion and amortization
|
440.9 | 405.2 | 402.4 | |||||||||
|
Deferred income taxes
|
71.7 | 131.1 | (33.3 | ) | ||||||||
|
Share-based compensation
|
41.1 | 38.8 | 34.9 | |||||||||
|
Net gain on disposal or exchange of assets
|
(30.0 | ) | (23.2 | ) | (72.9 | ) | ||||||
|
Loss from equity affiliates
|
1.7 | 69.1 | — | |||||||||
|
Revenue recovery on coal supply agreement
|
— | — | (56.9 | ) | ||||||||
|
Dividends received from equity affiliates
|
— | — | 19.9 | |||||||||
|
Changes in current assets and liabilities:
|
||||||||||||
|
Accounts receivable
|
(149.2 | ) | 101.8 | (114.7 | ) | |||||||
|
Change in receivable from accounts receivable securitization
program
|
(104.6 | ) | (20.4 | ) | — | |||||||
|
Inventories
|
(7.7 | ) | (48.9 | ) | (13.2 | ) | ||||||
|
Net assets from coal trading activities
|
(109.6 | ) | 70.9 | (43.0 | ) | |||||||
|
Other current assets
|
(28.5 | ) | (3.2 | ) | 2.3 | |||||||
|
Accounts payable and accrued expenses
|
223.3 | (121.6 | ) | 245.7 | ||||||||
|
Asset retirement obligations
|
32.5 | 27.7 | 32.9 | |||||||||
|
Workers’ compensation obligations
|
(8.9 | ) | 3.0 | 10.3 | ||||||||
|
Accrued postretirement benefit costs
|
23.1 | 7.2 | 13.6 | |||||||||
|
Contributions to pension plans
|
(112.6 | ) | (38.7 | ) | (21.3 | ) | ||||||
|
Other, net
|
15.4 | (0.9 | ) | 26.2 | ||||||||
|
Net cash provided by continuing operations
|
1,103.7 | 1,055.8 | 1,420.8 | |||||||||
|
Net cash used in discontinued operations
|
(16.6 | ) | (5.6 | ) | (123.0 | ) | ||||||
|
Net cash provided by operating activities
|
1,087.1 | 1,050.2 | 1,297.8 | |||||||||
|
Cash Flows From Investing Activities
|
||||||||||||
|
Additions to property, plant, equipment and mine development
|
(557.0 | ) | (260.6 | ) | (264.1 | ) | ||||||
|
Investment in Prairie State Energy Campus
|
(76.0 | ) | (56.8 | ) | (40.9 | ) | ||||||
|
Federal coal lease expenditures
|
— | (123.6 | ) | (178.5 | ) | |||||||
|
Proceeds from disposal of assets, net of notes receivable
|
19.2 | 53.9 | 72.8 | |||||||||
|
Investments in equity affiliates and joint ventures
|
(18.8 | ) | (15.0 | ) | (2.6 | ) | ||||||
|
Investments in debt and equity securities
|
(74.6 | ) | — | — | ||||||||
|
Proceeds from sale of debt securities
|
12.4 | — | — | |||||||||
|
Other, net
|
(8.8 | ) | (6.1 | ) | (6.0 | ) | ||||||
|
Net cash used in continuing operations
|
(703.6 | ) | (408.2 | ) | (419.3 | ) | ||||||
|
Net cash provided by discontinued operations
|
— | 1.7 | 23.9 | |||||||||
|
Net cash used in investing activities
|
(703.6 | ) | (406.5 | ) | (395.4 | ) | ||||||
|
Cash Flows From Financing Activities
|
||||||||||||
|
Change in revolving line of credit
|
— | — | (97.7 | ) | ||||||||
|
Proceeds from long-term debt
|
1,150.0 | — | — | |||||||||
|
Payments of long-term debt
|
(1,167.3 | ) | (37.1 | ) | (32.7 | ) | ||||||
|
Common stock repurchase
|
— | — | (199.8 | ) | ||||||||
|
Dividends paid
|
(79.4 | ) | (66.8 | ) | (64.9 | ) | ||||||
|
Repurchase of employee common stock relinquished for tax
withholding
|
(13.5 | ) | (2.3 | ) | (11.0 | ) | ||||||
|
Payment of debt issuance costs
|
(32.2 | ) | — | — | ||||||||
|
Excess tax benefits related to share-based compensation
|
51.0 | — | — | |||||||||
|
Proceeds from stock options exercised
|
16.4 | 3.6 | 14.1 | |||||||||
|
Acquisition of noncontrolling interests (Millennium Mine)
|
— | — | (110.1 | ) | ||||||||
|
Other, net
|
(2.1 | ) | (2.0 | ) | 4.1 | |||||||
|
Net cash used in financing activities
|
(77.1 | ) | (104.6 | ) | (498.0 | ) | ||||||
|
Net change in cash and cash equivalents
|
306.4 | 539.1 | 404.4 | |||||||||
|
Cash and cash equivalents at beginning of year
|
988.8 | 449.7 | 45.3 | |||||||||
|
Cash and cash equivalents at end of year
|
$ | 1,295.2 | $ | 988.8 | $ | 449.7 | ||||||
F-4
Table of Contents
| Peabody Energy Corporation’s Stockholders’ Equity | ||||||||||||||||||||||||||||
|
Accumulated
|
||||||||||||||||||||||||||||
|
Additional
|
Other
|
Total
|
||||||||||||||||||||||||||
|
Common
|
Paid-in
|
Treasury
|
Retained
|
Comprehensive
|
Noncontrolling
|
Stockholders’
|
||||||||||||||||||||||
| Stock | Capital | Stock | Earnings | Loss | Interests | Equity | ||||||||||||||||||||||
| (Dollars in millions) | ||||||||||||||||||||||||||||
|
December 31, 2007
|
$ | 2.7 | $ | 1,966.1 | $ | (108.0 | ) | $ | 940.9 | $ | (67.1 | ) | $ | 0.7 | $ | 2,735.3 | ||||||||||||
|
Comprehensive income:
|
||||||||||||||||||||||||||||
|
Net income
|
— | — | — | 952.9 | — | 6.2 | 959.1 | |||||||||||||||||||||
|
Decrease in fair value of cash flow hedges (net of $178.2 tax
benefit)
|
— | — | — | — | (217.9 | ) | — | (217.9 | ) | |||||||||||||||||||
|
Postretirement plans and workers’ compensation obligations
(net of $59.3 tax benefit)
|
— | — | — | — | (103.5 | ) | — | (103.5 | ) | |||||||||||||||||||
|
Comprehensive income
|
952.9 | (321.4 | ) | 6.2 | 637.7 | |||||||||||||||||||||||
|
Dividends paid
|
— | — | — | (64.9 | ) | — | — | (64.9 | ) | |||||||||||||||||||
|
Patriot Coal Corporation spin-off adjustment
|
— | — | — | (26.5 | ) | — | — | (26.5 | ) | |||||||||||||||||||
|
Share-based compensation
|
— | 34.9 | — | — | — | — | 34.9 | |||||||||||||||||||||
|
Stock options exercised
|
0.1 | 14.0 | — | — | — | — | 14.1 | |||||||||||||||||||||
|
Employee stock purchases
|
— | 5.2 | — | — | — | — | 5.2 | |||||||||||||||||||||
|
Repurchase of employee common stock relinquished for tax
withholding
|
— | — | (11.0 | ) | — | — | — | (11.0 | ) | |||||||||||||||||||
|
Common stock repurchased
|
— | — | (199.8 | ) | — | — | — | (199.8 | ) | |||||||||||||||||||
|
Distributions to noncontrolling interests
|
— | — | — | — | — | (1.1 | ) | (1.1 | ) | |||||||||||||||||||
|
Eliminations of noncontrolling interests due to acquisitions
|
— | — | — | — | — | (4.4 | ) | (4.4 | ) | |||||||||||||||||||
|
December 31, 2008
|
$ | 2.8 | $ | 2,020.2 | $ | (318.8 | ) | $ | 1,802.4 | $ | (388.5 | ) | $ | 1.4 | $ | 3,119.5 | ||||||||||||
|
Comprehensive income:
|
||||||||||||||||||||||||||||
|
Net income
|
— | — | — | 448.2 | — | 14.8 | 463.0 | |||||||||||||||||||||
|
Increase in fair value of cash flow hedges (net of $220.9 tax
provision)
|
— | — | — | — | 319.8 | — | 319.8 | |||||||||||||||||||||
|
Postretirement plans and workers’ compensation obligations
(net of $71.8 tax benefit)
|
— | — | — | — | (114.8 | ) | — | (114.8 | ) | |||||||||||||||||||
|
Comprehensive income
|
448.2 | 205.0 | 14.8 | 668.0 | ||||||||||||||||||||||||
|
Dividends paid
|
— | — | — | (66.8 | ) | — | — | (66.8 | ) | |||||||||||||||||||
|
Share-based compensation
|
— | 38.8 | — | — | — | — | 38.8 | |||||||||||||||||||||
|
Stock options exercised
|
— | 3.6 | — | — | — | — | 3.6 | |||||||||||||||||||||
|
Employee stock purchases
|
— | 5.1 | — | — | — | — | 5.1 | |||||||||||||||||||||
|
Repurchase of employee common stock relinquished for tax
withholding
|
— | — | (2.3 | ) | — | — | — | (2.3 | ) | |||||||||||||||||||
|
Distributions to noncontrolling interests
|
— | — | — | — | — | (10.0 | ) | (10.0 | ) | |||||||||||||||||||
|
December 31, 2009
|
$ | 2.8 | $ | 2,067.7 | $ | (321.1 | ) | $ | 2,183.8 | $ | (183.5 | ) | $ | 6.2 | $ | 3,755.9 | ||||||||||||
|
Comprehensive income:
|
||||||||||||||||||||||||||||
|
Net income
|
— | — | — | 774.0 | — | 28.2 | 802.2 | |||||||||||||||||||||
|
Increase in fair value of cash flow hedges
|
||||||||||||||||||||||||||||
|
(net of $129.5 tax provision)
|
— | — | — | — | 127.5 | — | 127.5 | |||||||||||||||||||||
|
Postretirement plans and workers’ compensation obligations
(net of $2.1 tax benefit)
|
— | — | — | — | (11.9 | ) | — | (11.9 | ) | |||||||||||||||||||
|
Comprehensive income
|
774.0 | 115.6 | 28.2 | 917.8 | ||||||||||||||||||||||||
|
Dividends paid
|
— | — | — | (79.4 | ) | — | — | (79.4 | ) | |||||||||||||||||||
|
Share-based compensation
|
— | 41.1 | — | — | — | — | 41.1 | |||||||||||||||||||||
|
Excess tax benefits related to share based compensation
|
— | 51.0 | — | — | — | — | 51.0 | |||||||||||||||||||||
|
Stock options exercised
|
— | 16.4 | — | — | — | — | 16.4 | |||||||||||||||||||||
|
Employee stock purchases
|
— | 5.8 | — | — | — | — | 5.8 | |||||||||||||||||||||
|
Repurchase of employee common stock relinquished for tax
withholding
|
— | — | (13.5 | ) | — | — | — | (13.5 | ) | |||||||||||||||||||
|
Distributions to noncontrolling interests
|
— | — | — | — | — | (5.8 | ) | (5.8 | ) | |||||||||||||||||||
|
December 31, 2010
|
$ | 2.8 | $ | 2,182.0 | $ | (334.6 | ) | $ | 2,878.4 | $ | (67.9 | ) | $ | 28.6 | $ | 4,689.3 | ||||||||||||
F-5
Table of Contents
| (1) | Summary of Significant Accounting Policies Discussion |
F-6
Table of Contents
F-7
Table of Contents
| Years | ||||
|
Building and improvements
|
10 to 20 | |||
|
Machinery and equipment
|
3 to 33 | |||
|
Leasehold improvements
|
Life of Lease | |||
F-8
Table of Contents
|
Income (Loss) from Equity
|
||||||||||||||||||||
|
Affiliates for the Year Ended
|
||||||||||||||||||||
| Book Value at December 31, | December 31, | |||||||||||||||||||
| 2010 | 2009 | 2010 | 2009 | 2008 | ||||||||||||||||
| (Dollars in millions) | ||||||||||||||||||||
|
Interest in Carbones del Guasare
|
$ | — | $ | — | $ | — | $ | (54.6 | ) | $ | 5.7 | |||||||||
|
Other equity method investments
|
2.7 | 5.1 | (1.7 | ) | (14.5 | ) | (5.7 | ) | ||||||||||||
|
Total equity method investments
|
$ | 2.7 | $ | 5.1 | $ | (1.7 | ) | $ | (69.1 | ) | $ | — | ||||||||
F-9
Table of Contents
F-10
Table of Contents
F-11
Table of Contents
| (2) | Discontinued Operations |
| (3) | Inventories |
| December 31, | ||||||||
| 2010 | 2009 | |||||||
| (Dollars in millions) | ||||||||
|
Materials and supplies
|
$ | 97.1 | $ | 106.5 | ||||
|
Raw coal
|
55.4 | 80.5 | ||||||
|
Saleable coal
|
180.4 | 138.1 | ||||||
|
Total
|
$ | 332.9 | $ | 325.1 | ||||
| (4) | Derivatives and Fair Value Measurements |
F-12
Table of Contents
| Notional Amount by Year of Maturity | ||||||||||||||||||||||||||||
|
2016 and
|
||||||||||||||||||||||||||||
| Total | 2011 | 2012 | 2013 | 2014 | 2015 | thereafter | ||||||||||||||||||||||
|
Foreign Currency
|
||||||||||||||||||||||||||||
|
A$:US$ hedge contracts (A$ millions)
|
$ | 4,187.5 | $ | 1,484.2 | $ | 1,355.2 | $ | 926.6 | $ | 421.5 | $ | — | $ | — | ||||||||||||||
|
Commodity Contracts
|
||||||||||||||||||||||||||||
|
Diesel fuel hedge contracts (million gallons)
|
191.4 | 89.5 | 76.2 | 25.7 | — | — | — | |||||||||||||||||||||
|
U.S. explosives hedge contracts (million MMBtu)
|
8.4 | 3.9 | 3.0 | 1.5 | — | — | — | |||||||||||||||||||||
| Account Classification by | |||||||||||||||||
|
Cash
|
Fair
|
||||||||||||||||
|
flow
|
value
|
Economic
|
Fair Value
|
||||||||||||||
| hedge | hedge | hedge | Asset (Liability) | ||||||||||||||
| (Dollars in millions) | |||||||||||||||||
|
Foreign Currency
|
|||||||||||||||||
|
A$:US$ hedge contracts (A$ millions)
|
$ | 4,187.5 | $ | — | $ | — | $ | 640.1 | |||||||||
|
Commodity Contracts
|
|||||||||||||||||
|
Diesel fuel hedge contracts (million gallons)
|
191.4 | — | — | $ | 40.3 | ||||||||||||
|
U.S. explosives hedge contracts (million MMBtu)
|
8.4 | — | — | $ | (0.1 | ) | |||||||||||
F-13
Table of Contents
| Year Ended December 31, 2010 | ||||||||||||||||||
|
Gain (loss)
|
||||||||||||||||||
|
Gain (loss)
|
Gain (loss)
|
reclassified
|
||||||||||||||||
|
recognized in
|
reclassified
|
from other
|
||||||||||||||||
|
Gain (loss)
|
other
|
from other
|
comprehensive
|
|||||||||||||||
|
recognized in
|
comprehensive
|
comprehensive
|
income into
|
|||||||||||||||
|
Income Statement
|
income on non-
|
income on
|
income into
|
income
|
||||||||||||||
|
Classification
|
designated
|
derivative
|
income (effective
|
(ineffective
|
||||||||||||||
| Financial Instrument | Gains (Losses) - Realized | derivatives (1) | (effective portion) | portion) | portion) | |||||||||||||
| (Dollars in millions) | ||||||||||||||||||
|
Interest rate swaps:
|
||||||||||||||||||
|
- Cash flow hedges
|
Interest expense | $ | (8.5 | ) | $ | 0.8 | $ | (0.5 | ) | $ | — | |||||||
|
Diesel fuel hedge contracts:
|
||||||||||||||||||
|
- Cash flow hedges
|
Operating costs and expenses | — | 34.1 | (27.3 | ) | (1.1 | ) | |||||||||||
|
Explosives cash flow hedge contracts:
|
||||||||||||||||||
|
- Cash flow hedges
|
Operating costs and expenses | — | (4.2 | ) | (8.9 | ) | — | |||||||||||
|
Foreign currency cash flow hedge contracts
|
Operating costs and expenses | — | 622.2 | 188.2 | — | |||||||||||||
|
Total
|
$ | (8.5 | ) | $ | 652.9 | $ | 151.5 | $ | (1.1 | ) | ||||||||
| (1) | Amounts relate to swaps that were de-designated and terminated in conjunction with the refinancing of the Company’s previous credit facility. |
F-14
Table of Contents
| Year Ended December 31, 2009 | ||||||||||||||||||
|
Gain (loss)
|
Gain (loss)
|
|||||||||||||||||
|
Gain (loss)
|
reclassified
|
reclassified
|
||||||||||||||||
|
recognized in
|
from other
|
from other
|
||||||||||||||||
|
Gain (loss)
|
other
|
comprehensive
|
comprehensive
|
|||||||||||||||
|
recognized in
|
comprehensive
|
income into
|
income into
|
|||||||||||||||
|
Income Statement
|
income on non-
|
income on
|
income
|
income
|
||||||||||||||
|
Classification
|
designated
|
derivative
|
(effective
|
(ineffective
|
||||||||||||||
| Financial Instrument | Gains (Losses) - Realized | derivatives (2) | (effective portion) | portion) | portion) | |||||||||||||
| (Dollars in millions) | ||||||||||||||||||
|
Interest rate swaps:
|
||||||||||||||||||
|
- Cash flow hedges
|
Interest expense | $ | — | $ | 0.2 | $ | (5.5 | ) | $ | — | ||||||||
|
Diesel fuel hedge contracts:
|
||||||||||||||||||
|
- Cash flow hedges
|
Operating costs and expenses | — | 67.9 | (84.4 | ) | 0.7 | ||||||||||||
|
- Economic hedges
|
Operating costs and expenses | (0.6 | ) | — | — | — | ||||||||||||
|
Explosives cash flow hedge contracts:
|
||||||||||||||||||
|
- Cash flow hedges
|
Operating costs and expenses | — | (2.4 | ) | (13.9 | ) | — | |||||||||||
|
- Economic hedges
|
Operating costs and expenses | (2.1 | ) | — | — | — | ||||||||||||
|
Foreign currency cash flow hedge contracts
|
Operating costs and expenses | — | 458.0 | (30.8 | ) | — | ||||||||||||
|
Total
|
$ | (2.7 | ) | $ | 523.7 | $ | (134.6 | ) | $ | 0.7 | ||||||||
| (2) | Amounts relate to diesel fuel and explosives hedge derivatives that were de-designated in 2009. |
| Fair Value as of December 31, 2010 | ||||||||||||||||
|
Current
|
Noncurrent
|
Current
|
Noncurrent
|
|||||||||||||
| Financial Instrument | Assets | Assets | Liabilities | Liabilities | ||||||||||||
| (Dollars in millions) | ||||||||||||||||
|
Diesel fuel cash flow hedge contracts
|
$ | 25.3 | $ | 26.9 | $ | 11.9 | $ | — | ||||||||
|
Explosives cash flow hedge contracts
|
0.5 | 0.1 | 0.1 | 0.6 | ||||||||||||
|
Foreign currency cash flow hedge contracts
|
273.5 | 366.6 | — | — | ||||||||||||
|
Total
|
$ | 299.3 | $ | 393.6 | $ | 12.0 | $ | 0.6 | ||||||||
| Fair Value as of December 31, 2009 | ||||||||||||||||
|
Current
|
Noncurrent
|
Current
|
Noncurrent
|
|||||||||||||
| Financial Instrument | Assets | Assets | Liabilities | Liabilities | ||||||||||||
| (Dollars in millions) | ||||||||||||||||
|
Interest rate swaps:
|
||||||||||||||||
|
- Fair value hedges
|
$ | — | $ | 1.5 | $ | — | $ | — | ||||||||
|
- Cash flow hedges
|
— | — | — | 9.8 | ||||||||||||
|
Diesel fuel cash flow hedge contracts
|
6.7 | 18.0 | 31.3 | 15.6 | ||||||||||||
|
Explosives cash flow hedge contracts
|
0.1 | — | 4.9 | — | ||||||||||||
|
Foreign currency cash flow hedge contracts
|
110.6 | 100.2 | 1.6 | 3.1 | ||||||||||||
|
Total
|
$ | 117.4 | $ | 119.7 | $ | 37.8 | $ | 28.5 | ||||||||
F-15
Table of Contents
| December 31 , 2010 | ||||||||||||||||
| Level 1 | Level 2 | Level 3 | Total | |||||||||||||
| (Dollars in millions) | ||||||||||||||||
|
Investment in debt securities
|
$ | 17.9 | $ | — | $ | — | $ | 17.9 | ||||||||
|
Commodity swaps and options — diesel fuel
|
— | 40.3 | — | 40.3 | ||||||||||||
|
Commodity swaps and options — explosives
|
— | (0.1 | ) | — | (0.1 | ) | ||||||||||
|
Foreign currency hedge contracts
|
— | 640.1 | — | 640.1 | ||||||||||||
|
Total net financial assets
|
$ | 17.9 | $ | 680.3 | $ | — | $ | 698.2 | ||||||||
| December 31, 2009 | ||||||||||||||||
| Level 1 | Level 2 | Level 3 | Total | |||||||||||||
| (Dollars in millions) | ||||||||||||||||
|
Commodity swaps and options — diesel fuel
|
$ | — | $ | (22.2 | ) | $ | — | $ | (22.2 | ) | ||||||
|
Commodity swaps and options — explosives
|
— | (4.8 | ) | — | (4.8 | ) | ||||||||||
|
Interest rate swaps
|
— | (8.3 | ) | — | (8.3 | ) | ||||||||||
|
Foreign currency hedge contracts
|
— | 206.1 | — | 206.1 | ||||||||||||
|
Total net financial assets
|
$ | — | $ | 170.8 | $ | — | $ | 170.8 | ||||||||
| • | Investment in debt securities: valued based on quoted prices in active markets (Level 1). | |
| • | Commodity swaps and options — diesel fuel and explosives: generally valued based on a valuation that is corroborated by the use of market-based pricing (Level 2). | |
| • | Interest rate swaps: valued based on modeling observable market data and corroborated with statements from counterparties (Level 2). | |
| • | Foreign currency hedge contracts: valued utilizing inputs obtained in quoted public markets (Level 2). |
F-16
Table of Contents
| • | Cash and cash equivalents, accounts receivable, including accounts receivable within the Company’s securitization program, and accounts payable and accrued expenses have carrying values which approximate fair value due to the short maturity or the financial nature of these instruments. | |
| • | Investments and other assets in the consolidated balance sheets includes the Company’s investments in debt and equity securities related to the Company’s pro-rata share of funding in the Newcastle Coal Infrastructure Group (NCIG). The investments are recorded at cost, which approximate fair value. See Note 20 for additional information related to NCIG. | |
| • | Long-term debt fair value estimates are based on observed prices for securities with an active trading market when available, and otherwise on estimated borrowing rates to discount the cash flows to their present value. The carrying amounts of the 7.875% Senior Notes due 2026 and the Convertible Junior Subordinated Debentures due 2066 are net of the respective unamortized note discounts. |
| December 31, 2010 | December 31, 2009 | |||||||||||||||
|
Carrying
|
Estimated
|
Carrying
|
Estimated
|
|||||||||||||
| Amount | Fair Value | Amount | Fair Value | |||||||||||||
| (Dollars in millions) | ||||||||||||||||
|
Long-term debt
|
$ | 2,750.0 | $ | 2,960.0 | $ | 2,752.3 | $ | 2,828.8 | ||||||||
| (5) | Coal Trading |
F-17
Table of Contents
| Year Ended December 31, | ||||||||
| Trading Revenue by Type of Instrument | 2010 | 2009 | ||||||
| (Dollars in millions) | ||||||||
|
Commodity swaps and options
|
$ | 23.2 | $ | 176.5 | ||||
|
Physical commodity purchase / sale contracts
|
135.5 | 85.0 | ||||||
|
Total trading revenue
|
$ | 158.7 | $ | 261.5 | ||||
| December 31, | ||||||||||||||||
| 2010 | 2009 | |||||||||||||||
| Gross Basis | Net Basis | Gross Basis | Net Basis | |||||||||||||
| (Dollars in millions) | ||||||||||||||||
|
Assets from coal trading activities
|
$ | 1,706.2 | $ | 192.5 | $ | 949.8 | $ | 276.8 | ||||||||
|
Liabilities from coal trading activities
|
(1,843.5 | ) | (181.7 | ) | (779.3 | ) | (110.6 | ) | ||||||||
|
Subtotal
|
(137.3 | ) | 10.8 | 170.5 | 166.2 | |||||||||||
|
Net margin posted
(held)
(1)
|
148.1 | — | (4.3 | ) | — | |||||||||||
|
Net value of coal trading positions
|
$ | 10.8 | $ | 10.8 | $ | 166.2 | $ | 166.2 | ||||||||
| (1) | Represents margin posted with counterparties of $148.2 million, net of margin held from counterparties of $0.1 million at December 31, 2010; and margin held from counterparties of $22.4 million, net of margin posted with counterparties of $18.1 million at December 31, 2009. |
F-18
Table of Contents
| December 31 , 2010 | ||||||||||||||||
| Level 1 | Level 2 | Level 3 | Total | |||||||||||||
| (Dollars in millions) | ||||||||||||||||
|
Commodity swaps and options
|
$ | 10.7 | $ | (76.2 | ) | $ | — | $ | (65.5 | ) | ||||||
|
Physical commodity purchase/sale contracts
|
— | 57.7 | 18.6 | 76.3 | ||||||||||||
|
Total net financial assets (liabilities)
|
$ | 10.7 | $ | (18.5 | ) | $ | 18.6 | $ | 10.8 | |||||||
| December 31, 2009 | ||||||||||||||||
| Level 1 | Level 2 | Level 3 | Total | |||||||||||||
| (Dollars in millions) | ||||||||||||||||
|
Commodity swaps and options
|
$ | (1.7 | ) | $ | 80.7 | $ | — | $ | 79.0 | |||||||
|
Physical commodity purchase/sale contracts
|
— | 70.2 | 17.0 | 87.2 | ||||||||||||
|
Total net financial assets (liabilities)
|
$ | (1.7 | ) | $ | 150.9 | $ | 17.0 | $ | 166.2 | |||||||
| • | Commodity swaps and options — generally valued based on unadjusted quoted prices in active markets (Level 1) or a valuation that is corroborated by the use of market-based pricing (Level 2). | |
| • | Physical commodity purchase/sale contracts — purchases and sales at locations with significant market activity corroborated by market-based information (Level 2). |
F-19
Table of Contents
| Year Ended December 31, | ||||||||||||
| 2010 | 2009 | 2008 | ||||||||||
| (Dollars in millions) | ||||||||||||
|
Beginning of year
|
$ | 17.0 | $ | 37.8 | $ | 128.7 | ||||||
|
Total gains or losses (realized/unrealized):
|
||||||||||||
|
Included in earnings
|
2.1 | (2.9 | ) | (9.8 | ) | |||||||
|
Included in other comprehensive income
|
(0.5 | ) | (1.6 | ) | 3.4 | |||||||
|
Purchases, issuances and settlements
|
(0.1 | ) | (20.5 | ) | (58.8 | ) | ||||||
|
Net transfers in (out)
|
0.1 | 4.2 | (25.7 | ) | ||||||||
|
End of year
|
$ | 18.6 | $ | 17.0 | $ | 37.8 | ||||||
| Year Ended December 31, | ||||||||||||
| 2010 | 2009 | 2008 | ||||||||||
| (Dollars in millions) | ||||||||||||
|
Changes in unrealized gains
(losses)
(1)
|
$ | 6.7 | $ | 15.6 | $ | (34.8 | ) | |||||
| (1) | Within the consolidated statements of operations for the periods presented, unrealized gains and losses from Level 3 items are combined with unrealized gains and losses on positions classified in Level 1 or 2, as well as other positions that have been realized during the applicable periods. |
|
Year of
|
Percentage of
|
|||
| Expiration | Portfolio Total | |||
|
2011
|
70 | % | ||
|
2012
|
21 | % | ||
|
2013
|
3 | % | ||
|
2014
|
4 | % | ||
|
2015
|
2 | % | ||
| 100 | % | |||
F-20
Table of Contents
F-21
Table of Contents
| (6) | Income Taxes |
| Year Ended December 31, | ||||||||||||
| 2010 | 2009 | 2008 | ||||||||||
| (Dollars in millions) | ||||||||||||
|
U.S.
|
$ | 535.5 | $ | 281.4 | $ | 185.2 | ||||||
|
Non U.S.
|
577.7 | 370.3 | 994.1 | |||||||||
|
Total
|
$ | 1,113.2 | $ | 651.7 | $ | 1,179.3 | ||||||
| Year Ended December 31, | ||||||||||||
| 2010 | 2009 | 2008 | ||||||||||
| (Dollars in millions) | ||||||||||||
|
Current:
|
||||||||||||
|
U.S. federal
|
$ | 113.9 | $ | (0.7 | ) | $ | — | |||||
|
Non U.S.
|
70.5 | 61.7 | 224.7 | |||||||||
|
State
|
1.0 | 1.7 | — | |||||||||
|
Total current
|
185.4 | 62.7 | 224.7 | |||||||||
|
Deferred:
|
||||||||||||
|
U.S. federal
|
47.9 | 56.0 | 47.1 | |||||||||
|
Non U.S.
|
69.1 | 74.4 | (81.7 | ) | ||||||||
|
State
|
5.7 | 0.7 | 1.3 | |||||||||
|
Total deferred
|
122.7 | 131.1 | (33.3 | ) | ||||||||
|
Total provision
|
$ | 308.1 | $ | 193.8 | $ | 191.4 | ||||||
| Year Ended December 31, | ||||||||||||
| 2010 | 2009 | 2008 | ||||||||||
| (Dollars in millions) | ||||||||||||
|
Expected income tax provision at federal statutory rate
|
$ | 389.6 | $ | 228.1 | $ | 412.7 | ||||||
|
Excess depletion
|
(53.5 | ) | (44.0 | ) | (40.1 | ) | ||||||
|
Foreign earnings provision differential
|
(121.4 | ) | (83.6 | ) | (119.7 | ) | ||||||
|
Foreign earnings repatriation
|
84.5 | — | — | |||||||||
|
Remeasurement of foreign income tax accounts
|
47.6 | 74.4 | (65.2 | ) | ||||||||
|
State income taxes, net of U.S. federal tax benefit
|
(4.8 | ) | 3.4 | (1.6 | ) | |||||||
|
General business tax credits
|
(17.0 | ) | (12.2 | ) | (12.6 | ) | ||||||
|
Changes in valuation allowance
|
(28.7 | ) | 17.3 | (44.2 | ) | |||||||
|
Changes in tax reserves
|
— | 5.9 | 34.4 | |||||||||
|
Other, net
|
11.8 | 4.5 | 27.7 | |||||||||
|
Total provision
|
$ | 308.1 | $ | 193.8 | $ | 191.4 | ||||||
F-22
Table of Contents
| December 31, | ||||||||
| 2010 | 2009 | |||||||
| (Dollars in millions) | ||||||||
|
Deferred tax assets:
|
||||||||
|
Tax credits and loss carryforwards
|
$ | 425.2 | $ | 557.1 | ||||
|
Postretirement benefit obligations
|
427.7 | 474.7 | ||||||
|
Intangible tax asset and purchased contract rights
|
15.1 | 30.9 | ||||||
|
Accrued reclamation and mine closing liabilities
|
97.8 | 57.0 | ||||||
|
Accrued long-term workers’ compensation liabilities
|
15.5 | 23.1 | ||||||
|
Employee benefits
|
53.5 | 80.3 | ||||||
|
Hedge activities
|
30.6 | — | ||||||
|
Financial guarantee
|
18.8 | 20.1 | ||||||
|
Others
|
45.4 | 39.5 | ||||||
|
Total gross deferred tax assets
|
1,129.6 | 1,282.7 | ||||||
|
Deferred tax liabilities:
|
||||||||
|
Property, plant, equipment and mine development, leased coal
interests and advance royalties, principally due to differences
in depreciation, depletion and asset writedowns
|
1,241.5 | 1,221.0 | ||||||
|
Unamortized discount on Convertible Junior Subordinated
Debentures
|
135.5 | 139.6 | ||||||
|
Hedge activities
|
— | 29.2 | ||||||
|
Investments and other assets
|
107.0 | 64.8 | ||||||
|
Total gross deferred tax liabilities
|
1,484.0 | 1,454.6 | ||||||
|
Valuation allowance
|
(65.0 | ) | (87.2 | ) | ||||
|
Net deferred tax liability
|
$ | (419.4 | ) | $ | (259.1 | ) | ||
|
Deferred taxes are classified as follows:
|
||||||||
|
Current deferred income taxes
|
$ | 120.4 | $ | 40.0 | ||||
|
Noncurrent deferred income taxes
|
(539.8 | ) | (299.1 | ) | ||||
|
Net deferred tax liability
|
$ | (419.4 | ) | $ | (259.1 | ) | ||
F-23
Table of Contents
| Year Ended December 31, | ||||||||||||
| 2010 | 2009 | 2008 | ||||||||||
|
Balance at beginning of period
|
$ | 113.2 | $ | 186.3 | $ | 152.6 | ||||||
|
Additions for current year tax positions
|
3.4 | 2.7 | 30.3 | |||||||||
|
Additions for prior year positions
|
13.8 | 15.7 | 3.4 | |||||||||
|
Reductions for settlements with tax authorities
|
(19.4 | ) | (88.5 | ) | — | |||||||
|
Reductions for expirations of statute of limitations
|
— | (3.0 | ) | — | ||||||||
|
Balance at end of period
|
$ | 111.0 | $ | 113.2 | $ | 186.3 | ||||||
F-24
Table of Contents
| Year Ended December 31, | ||||||||||||
| 2010 | 2009 | 2008 | ||||||||||
| (Dollars in millions) | ||||||||||||
|
U.S. — federal
|
$ | 65.0 | $ | — | $ | — | ||||||
|
U.S. — state and local
|
0.4 | 0.9 | — | |||||||||
|
Non U.S.
|
83.0 | 169.7 | 65.8 | |||||||||
|
Total tax payments
|
$ | 148.4 | $ | 170.6 | $ | 65.8 | ||||||
| (7) | Accounts Payable and Accrued Expenses |
| December 31, | ||||||||
| 2010 | 2009 | |||||||
| (Dollars in millions) | ||||||||
|
Trade accounts payable
|
$ | 467.1 | $ | 387.6 | ||||
|
Other accrued expenses
|
193.3 | 160.0 | ||||||
|
Accrued taxes other than income
|
185.4 | 172.3 | ||||||
|
Accrued payroll and related benefits
|
155.7 | 135.0 | ||||||
|
Accrued health care
|
85.9 | 78.7 | ||||||
|
Accrued royalties
|
74.7 | 51.1 | ||||||
|
Income taxes payable
|
59.6 | 80.7 | ||||||
|
Accrued interest
|
30.5 | 31.7 | ||||||
|
Workers’ compensation obligations
|
14.6 | 8.7 | ||||||
|
Accrued environmental
|
6.3 | 7.9 | ||||||
|
Other accrued benefits
|
4.2 | 4.0 | ||||||
|
Commodity hedge contracts
|
2.9 | 29.4 | ||||||
|
Liabilities associated with discontinued operations
|
8.6 | 40.6 | ||||||
|
Total accounts payable and accrued expenses
|
$ | 1,288.8 | $ | 1,187.7 | ||||
F-25
Table of Contents
| (8) |
|
| December 31, | ||||||||
| 2010 | 2009 | |||||||
| (Dollars in millions) | ||||||||
|
Term Loan
|
$ | 493.8 | $ | 490.3 | ||||
|
6.875% Senior Notes due March 2013
|
— | 650.0 | ||||||
|
5.875% Senior Notes due April 2016
|
218.1 | 218.1 | ||||||
|
7.375% Senior Notes due November 2016
|
650.0 | 650.0 | ||||||
|
6.5% Senior Notes due September 2020
|
650.0 | — | ||||||
|
7.875% Senior Notes due November 2026
|
247.2 | 247.1 | ||||||
|
6.34% Series B Bonds due December 2014
|
12.0 | 15.0 | ||||||
|
6.84% Series C Bonds due December 2016
|
33.0 | 33.0 | ||||||
|
Convertible Junior Subordinated Debentures due 2066
|
373.3 | 371.5 | ||||||
|
Capital lease obligations
|
69.6 | 67.5 | ||||||
|
Fair value hedge adjustment
|
2.2 | 8.4 | ||||||
|
Other
|
0.8 | 1.4 | ||||||
|
Total
|
$ | 2,750.0 | $ | 2,752.3 | ||||
F-26
Table of Contents
F-27
Table of Contents
F-28
Table of Contents
F-29
Table of Contents
| December 31, | ||||||||
| 2010 | 2009 | |||||||
| (Dollars in millions) | ||||||||
|
Carrying amount of the equity component
|
$ | 215.4 | $ | 215.4 | ||||
|
Principal amount of the liability component
|
732.5 | 732.5 | ||||||
|
Unamortized discount
|
(359.2 | ) | (361.0 | ) | ||||
|
Net carrying amount
|
$ | 373.3 | $ | 371.5 | ||||
| Year Ended December 31, | ||||||||||||
| 2010 | 2009 | 2008 | ||||||||||
| (Dollars in millions) | ||||||||||||
|
Effective interest rate
|
4.9 | % | 4.9 | % | 4.9 | % | ||||||
|
Interest expense — contractual interest coupon
|
$ | 34.8 | $ | 34.8 | $ | 34.5 | ||||||
|
Interest expense — amortization of debt discount
|
1.8 | 1.6 | 1.5 | |||||||||
F-30
Table of Contents
| Year of Maturity | (Dollars in millions) | |||
|
2011
|
$ | 43.2 | ||
|
2012
|
50.2 | |||
|
2013
|
58.8 | |||
|
2014
|
50.0 | |||
|
2015
|
400.4 | |||
|
2016 and thereafter
|
2,147.4 | |||
|
Total
|
$ | 2,750.0 | ||
| (9) | Leases |
F-31
Table of Contents
F-32
Table of Contents
|
Coal Lease
|
||||||||||||
|
and
|
||||||||||||
|
Capital
|
Operating
|
Royalty
|
||||||||||
| Year Ending December 31, | Leases | Leases | Obligations | |||||||||
| (Dollars in millions) | ||||||||||||
|
2011
|
$ | 17.0 | $ | 95.6 | $ | 7.2 | ||||||
|
2012
|
17.0 | 78.7 | 6.9 | |||||||||
|
2013
|
25.1 | 68.5 | 7.4 | |||||||||
|
2014
|
15.5 | 59.0 | 6.2 | |||||||||
|
2015
|
— | 47.1 | 4.0 | |||||||||
|
2016 and thereafter
|
— | 106.9 | 30.3 | |||||||||
|
Total minimum lease payments
|
$ | 74.6 | $ | 455.8 | $ | 62.0 | ||||||
|
Less interest
|
5.0 | |||||||||||
|
Present value of minimum capital lease payments
|
$ | 69.6 | ||||||||||
| (10) | Asset Retirement Obligations |
| December 31, | ||||||||
| 2010 | 2009 | |||||||
| (Dollars in millions) | ||||||||
|
Balance at beginning of year
|
$ | 452.1 | $ | 418.7 | ||||
|
Liabilities incurred or acquired
|
8.2 | 0.4 | ||||||
|
Liabilities settled or disposed
|
(7.9 | ) | (8.1 | ) | ||||
|
Accretion expense
|
26.7 | 24.0 | ||||||
|
Revisions to estimates
|
22.2 | 17.1 | ||||||
|
Balance at end of year
|
$ | 501.3 | $ | 452.1 | ||||
|
Balance at end of year — active locations
|
$ | 465.4 | $ | 422.0 | ||||
|
Balance at end of year — closed or inactive locations
|
$ | 35.9 | $ | 30.1 | ||||
F-33
Table of Contents
| (11) | Postretirement Health Care and Life Insurance Benefits |
| Year Ended December 31, | ||||||||||||
| 2010 | 2009 | 2008 | ||||||||||
| (Dollars in millions) | ||||||||||||
|
Service cost for benefits earned
|
$ | 12.9 | $ | 10.5 | $ | 10.1 | ||||||
|
Interest cost on accumulated postretirement benefit obligation
|
58.2 | 55.2 | 54.0 | |||||||||
|
Amortization of prior service cost
|
2.6 | 1.5 | 0.4 | |||||||||
|
Amortization of actuarial loss
|
24.9 | 14.5 | 17.3 | |||||||||
|
Net periodic postretirement benefit cost
|
$ | 98.6 | $ | 81.7 | $ | 81.8 | ||||||
| Year Ended December 31, | ||||||||||||
| 2010 | 2009 | 2008 | ||||||||||
| (Dollars in millions) | ||||||||||||
|
Net actuarial (gain) loss arising during year
|
$ | 45.3 | $ | 165.2 | $ | (18.3 | ) | |||||
|
Prior service cost arising during year
|
7.9 | (10.5 | ) | — | ||||||||
|
Amortization:
|
||||||||||||
|
Actuarial loss
|
(24.9 | ) | (14.5 | ) | (17.3 | ) | ||||||
|
Prior service cost
|
(2.6 | ) | (1.5 | ) | (0.4 | ) | ||||||
|
Total recognized in other comprehensive loss
|
25.7 | 138.7 | (36.0 | ) | ||||||||
|
Net periodic postretirement benefit cost
|
98.6 | 81.7 | 81.8 | |||||||||
|
Total recognized in net periodic postretirement benefit cost and
other comprehensive loss
|
$ | 124.3 | $ | 220.4 | $ | 45.8 | ||||||
F-34
Table of Contents
| December 31, | ||||||||
| 2010 | 2009 | |||||||
| (Dollars in millions) | ||||||||
|
Change in benefit obligation:
|
||||||||
|
Accumulated postretirement benefit obligation at beginning of
period
|
$ | 982.2 | $ | 833.4 | ||||
|
Service cost
|
12.9 | 10.5 | ||||||
|
Interest cost
|
58.2 | 55.2 | ||||||
|
Participant contributions
|
2.1 | 1.2 | ||||||
|
Plan
amendments
(1)
|
7.9 | (10.5 | ) | |||||
|
Benefits paid
|
(77.4 | ) | (72.8 | ) | ||||
|
Actuarial loss
|
45.3 | 165.2 | ||||||
|
Accumulated postretirement benefit obligation at end of period
|
1,031.2 | 982.2 | ||||||
|
Change in plan assets:
|
||||||||
|
Fair value of plan assets at beginning of period
|
— | — | ||||||
|
Employer contributions
|
75.3 | 71.6 | ||||||
|
Participant contributions
|
2.1 | 1.2 | ||||||
|
Benefits paid and administrative fees (net of Medicare
Part D reimbursements)
|
(77.4 | ) | (72.8 | ) | ||||
|
Fair value of plan assets at end of period
|
— | — | ||||||
|
Funded status at end of year
|
(1,031.2 | ) | (982.2 | ) | ||||
|
Less current portion (included in Accounts payable and accrued
expenses)
|
67.3 | 68.1 | ||||||
|
Noncurrent obligation (included in Accrued postretirement
benefit costs)
|
$ | (963.9 | ) | $ | (914.1 | ) | ||
| (1) | Effective January 1, 2011, certain plans were modified to ensure consistency of benefits across the Company, the impact of which is reflected in the December 31, 2010 figures above. Effective January 1, 2010, the benefits provided to certain salaried retirees were capped at a fixed level, which resulted in a decrease to the retiree health care liability of $7.3 million, the impact of which is reflected in the December 31, 2009 figures above. The Company began realizing the effect of this plan amendment over 13.54 years beginning January 1, 2010. |
| Year Ended December 31, | ||||||||
| 2010 | 2009 | |||||||
|
Discount rate
|
5.81 | % | 6.14 | % | ||||
|
Rate of compensation increase
|
3.50 | % | 3.50 | % | ||||
|
Measurement date
|
December 31, 2010 | December 31, 2009 | ||||||
F-35
Table of Contents
| Year Ended December 31, | ||||||||||||
| 2010 | 2009 | 2008 | ||||||||||
|
Discount rate
|
6.14 | % | 6.85 | % | 6.60 | % | ||||||
|
Rate of compensation increase
|
3.50 | % | 3.50 | % | 3.50 | % | ||||||
|
Measurement date
|
December 31, 2009 | December 31, 2008 | December 31, 2007 | |||||||||
| Year Ended December 31, | ||||||||
| 2010 | 2009 | |||||||
|
Health care cost trend rate assumed for next year
|
9.00 | % | 7.50 | % | ||||
|
Rate to which the cost trend is assumed to decline (the ultimate
trend rate)
|
5.00 | % | 5.00 | % | ||||
|
Year that the rate reaches the ultimate trend rate
|
2017 | 2016 | ||||||
|
One Percentage-
|
One Percentage-
|
|||||||
| Point Increase | Point Decrease | |||||||
| (Dollars in millions) | ||||||||
|
Effect on total service and interest cost components
|
$ | 7.8 | $ | (6.6 | ) | |||
|
Effect on total postretirement benefit obligation
|
$ | 112.5 | $ | (94.4 | ) | |||
|
Postretirement
|
||||
| Benefits | ||||
| (Dollars in millions) | ||||
|
2011
|
$ | 67.3 | ||
|
2012
|
68.8 | |||
|
2013
|
72.6 | |||
|
2014
|
74.6 | |||
|
2015
|
76.5 | |||
|
Years
2016-2020
|
402.2 | |||
| (12) | Pension and Savings Plans |
F-36
Table of Contents
| Year Ended December 31, | ||||||||||||
| 2010 | 2009 | 2008 | ||||||||||
| (Dollars in millions) | ||||||||||||
|
Service cost for benefits earned
|
$ | 1.5 | $ | 1.4 | $ | 2.0 | ||||||
|
Interest cost on projected benefit obligation
|
50.5 | 51.3 | 51.0 | |||||||||
|
Expected return on plan assets
|
(58.3 | ) | (60.9 | ) | (60.6 | ) | ||||||
|
Amortization of prior service cost
|
1.4 | 1.4 | 1.3 | |||||||||
|
Amortization of actuarial (gains) losses
|
21.9 | 1.9 | (0.5 | ) | ||||||||
|
Net periodic pension costs
|
17.0 | (4.9 | ) | (6.8 | ) | |||||||
|
Curtailment gain
|
— | — | (0.6 | ) | ||||||||
|
Total net periodic pension (benefit) cost
|
$ | 17.0 | $ | (4.9 | ) | $ | (7.4 | ) | ||||
| Year Ended December 31, | ||||||||||||
| 2010 | 2009 | 2008 | ||||||||||
| (Dollars in millions) | ||||||||||||
|
Net actuarial loss arising during year
|
$ | 13.1 | $ | 46.1 | $ | 199.2 | ||||||
|
Amortization:
|
||||||||||||
|
Actuarial gain (loss)
|
(21.9 | ) | (1.9 | ) | 0.5 | |||||||
|
Prior service cost
|
(1.4 | ) | (1.4 | ) | (0.7 | ) | ||||||
|
Total recognized in other comprehensive loss
|
(10.2 | ) | 42.8 | 199.0 | ||||||||
|
Net periodic pension (benefit) cost
|
17.0 | (4.9 | ) | (6.8 | ) | |||||||
|
Total recognized in net periodic pension cost and other
comprehensive loss
|
$ | 6.8 | $ | 37.9 | $ | 192.2 | ||||||
F-37
Table of Contents
| December 31, | ||||||||
| 2010 | 2009 | |||||||
| (Dollars in millions) | ||||||||
|
Change in benefit obligation:
|
||||||||
|
Projected benefit obligation at beginning of period
|
$ | 844.9 | $ | 768.6 | ||||
|
Service cost
|
1.5 | 1.4 | ||||||
|
Interest cost
|
50.5 | 51.3 | ||||||
|
Benefits paid
|
(50.4 | ) | (48.3 | ) | ||||
|
Actuarial loss
|
34.5 | 71.9 | ||||||
|
Projected benefit obligation at end of period
|
881.0 | 844.9 | ||||||
|
Change in plan assets:
|
||||||||
|
Fair value of plan assets at beginning of period
|
629.6 | 552.6 | ||||||
|
Actual return on plan assets
|
79.8 | 86.6 | ||||||
|
Employer contributions
|
112.6 | 38.7 | ||||||
|
Benefits paid
|
(50.4 | ) | (48.3 | ) | ||||
|
Fair value of plan assets at end of period
|
771.6 | 629.6 | ||||||
|
Funded status at end of year
|
$ | (109.4 | ) | $ | (215.3 | ) | ||
|
Amounts recognized in the consolidated balance sheets:
|
||||||||
|
Current obligation (included in Accounts payable and accrued
expenses)
|
$ | (1.8 | ) | $ | (1.8 | ) | ||
|
Noncurrent obligation (included in Other noncurrent liabilities)
|
(107.6 | ) | (213.5 | ) | ||||
|
Net amount recognized
|
$ | (109.4 | ) | $ | (215.3 | ) | ||
| Year Ended December 31, | ||||||||
| 2010 | 2009 | |||||||
|
Discount rate
|
5.84 | % | 6.19 | % | ||||
|
Rate of compensation increase
|
N/A | N/A | ||||||
|
Measurement date
|
December 31, 2010 | December 31, 2009 | ||||||
| Year Ended December 31, | ||||||||||||
| 2010 | 2009 | 2008 | ||||||||||
|
Discount rate
|
6.19 | % | 6.90 | % | 6.75 | % | ||||||
|
Expected long-term return on plan assets
|
8.25 | % | 8.75 | % | 8.75 | % | ||||||
|
Measurement date
|
December 31, 2010 | December 31, 2009 | December 31, 2008 | |||||||||
F-38
Table of Contents
F-39
Table of Contents
| December 31, 2010 | ||||||||||||||||
| Level 1 | Level 2 | Level 3 | Total | |||||||||||||
| (Dollars in millions) | ||||||||||||||||
|
U.S. equity securities
|
$ | 82.6 | $ | 250.5 | $ | — | $ | 333.1 | ||||||||
|
International equity securities
|
— | 118.9 | — | 118.9 | ||||||||||||
|
Mortgage-backed debt securities
|
— | 108.2 | — | 108.2 | ||||||||||||
|
U.S. debt securities
|
0.6 | 60.2 | — | 60.8 | ||||||||||||
|
International debt securities
|
— | 25.7 | — | 25.7 | ||||||||||||
|
Corporate debt securities
|
— | 46.1 | — | 46.1 | ||||||||||||
|
Short-term investments
|
— | 31.1 | — | 31.1 | ||||||||||||
|
Interests in real estate
|
— | — | 47.7 | 47.7 | ||||||||||||
|
Total assets at fair value
|
$ | 83.2 | $ | 640.7 | $ | 47.7 | $ | 771.6 | ||||||||
F-40
Table of Contents
| December 31, 2009 | ||||||||||||||||
| Level 1 | Level 2 | Level 3 | Total | |||||||||||||
| (Dollars in millions) | ||||||||||||||||
|
U.S. equity securities
|
$ | 68.1 | $ | 200.2 | $ | — | $ | 268.3 | ||||||||
|
International equity securities
|
— | 102.2 | — | 102.2 | ||||||||||||
|
Mortgage-backed debt securities
|
— | 77.5 | — | 77.5 | ||||||||||||
|
U.S. debt securities
|
10.5 | 35.3 | — | 45.8 | ||||||||||||
|
International debt securities
|
— | 19.2 | — | 19.2 | ||||||||||||
|
Corporate debt securities
|
— | 37.2 | — | 37.2 | ||||||||||||
|
Short-term investments
|
— | 32.0 | — | 32.0 | ||||||||||||
|
Interests in real estate
|
— | — | 47.4 | 47.4 | ||||||||||||
|
Total assets at fair value
|
$ | 78.6 | $ | 503.6 | $ | 47.4 | $ | 629.6 | ||||||||
| Year Ended December 31, | ||||||||
| Interests in Real Estate | 2010 | 2009 | ||||||
| (Dollars in millions) | ||||||||
|
Beginning of year
|
$ | 47.4 | $ | 62.2 | ||||
|
Assets held at the reporting date:
|
||||||||
|
Realized loss
|
(0.1 | ) | (0.8 | ) | ||||
|
Unrealized gain (loss)
|
1.3 | (19.3 | ) | |||||
|
Purchases, sales and settlements, net
|
(0.9 | ) | 5.3 | |||||
|
End of year
|
$ | 47.7 | $ | 47.4 | ||||
F-41
Table of Contents
| Pension Benefits | ||||
| (Dollars in millions) | ||||
|
2011
|
$ | 55.7 | ||
|
2012
|
57.0 | |||
|
2013
|
58.5 | |||
|
2014
|
60.6 | |||
|
2015
|
62.7 | |||
|
Years
2016-2020
|
330.7 | |||
| (13) | Stockholders’ Equity |
F-42
Table of Contents
| 2010 | 2009 | 2008 | ||||||||||
|
Shares outstanding at the beginning of the year
|
268,203,815 | 266,644,979 | 270,066,621 | |||||||||
|
Stock options exercised
|
1,529,501 | 463,490 | 1,388,174 | |||||||||
|
Stock grants to employees
|
585,897 | 794,213 | 788,895 | |||||||||
|
Employee stock purchases
|
179,611 | 374,548 | 119,737 | |||||||||
|
Stock grants to non-employee directors
|
5,740 | 4,788 | 2,870 | |||||||||
|
Shares repurchased
|
— | — | (5,524,574 | ) | ||||||||
|
Shares relinquished
|
(268,308 | ) | (78,203 | ) | (196,744 | ) | ||||||
|
Shares outstanding at the end of the year
|
270,236,256 | 268,203,815 | 266,644,979 | |||||||||
F-43
Table of Contents
| (14) | Share-Based Compensation |
F-44
Table of Contents
| Year Ended December 31, | ||||||||||||
| 2010 | 2009 | 2008 | ||||||||||
| (Dollars in millions) | ||||||||||||
|
Share-based compensation expense
|
$ | 41.1 | $ | 38.8 | $ | 34.9 | ||||||
|
Tax benefit
|
15.4 | 15.0 | 13.5 | |||||||||
|
Share-based compensation expense, net of tax benefit
|
25.7 | 23.8 | 21.4 | |||||||||
|
Cash received upon the exercise of stock options and from
employee stock purchases
|
22.2 | 8.7 | 19.3 | |||||||||
|
Excess tax benefits related to share-based compensation
|
51.0 | — | — | |||||||||
|
Weighted
|
||||||||
|
Year Ended
|
Average
|
|||||||
|
December 31,
|
Grant-Date
|
|||||||
| 2010 | Fair Value | |||||||
|
Nonvested at December 31, 2009
|
2,144,865 | $ | 35.51 | |||||
|
Granted
|
493,360 | 47.18 | ||||||
|
Vested
|
(643,828 | ) | 31.86 | |||||
|
Forfeited
|
(100,098 | ) | 39.40 | |||||
|
Nonvested at December 31, 2010
|
1,894,299 | $ | 39.32 | |||||
F-45
Table of Contents
|
Weighted
|
||||||||||||||||
|
Weighted
|
Average
|
Aggregate
|
||||||||||||||
|
Year Ended
|
Average
|
Remaining
|
Intrinsic
|
|||||||||||||
|
December 31,
|
Exercise
|
Contractual
|
Value (in
|
|||||||||||||
| 2010 | Price | Life | millions) | |||||||||||||
|
Options Outstanding at December 31, 2009
|
3,246,030 | $ | 20.44 | 4.7 | $ | 85.1 | ||||||||||
|
Granted
|
257,375 | 47.87 | ||||||||||||||
|
Exercised
|
(1,310,059 | ) | 11.88 | |||||||||||||
|
Forfeited
|
(277,045 | ) | 3.30 | |||||||||||||
|
Options Outstanding at December 31, 2010
|
1,916,301 | $ | 32.25 | 5.9 | $ | 61.2 | ||||||||||
|
Vested and Exercisable
|
1,239,155 | $ | 27.61 | 4.6 | $ | 45.1 | ||||||||||
| Year Ended December 31, | ||||||||||||
| 2010 | 2009 | 2008 | ||||||||||
|
Weighted-average fair value
|
$ | 25.70 | $ | 26.84 | $ | 64.31 | ||||||
|
Risk-free interest rate
|
2.8 | % | 1.5 | % | 3.3 | % | ||||||
|
Expected option life
|
5.0 years | 5.0 years | 5.0 years | |||||||||
|
Expected volatility
|
64 | % | 60 | % | 40 | % | ||||||
|
Dividend yield
|
0.6 | % | 0.9 | % | 0.5 | % | ||||||
F-46
Table of Contents
|
Weighted
|
||||||||
|
Average
|
||||||||
|
Year Ended
|
Remaining
|
|||||||
|
December 31,
|
Contractual
|
|||||||
| 2010 | Life | |||||||
|
Nonvested at December 31, 2009
|
356,444 | 1.5 | ||||||
|
Granted
|
138,399 | |||||||
|
Forfeited
|
— | |||||||
|
Vested
|
(108,181 | ) | ||||||
|
Nonvested at December 31, 2010
|
386,662 | 1.5 | ||||||
| Year Ended December 31, | ||||||||||||
| 2010 | 2009 | 2008 | ||||||||||
|
Risk-free interest rate
|
1.7 | % | 1.3 | % | 2.9 | % | ||||||
|
Expected volatility
|
64 | % | 60 | % | 40 | % | ||||||
|
Dividend yield
|
0.6 | % | 0.9 | % | 0.5 | % | ||||||
F-47
Table of Contents
| (15) | Accumulated Other Comprehensive Income (Loss) |
|
Net
|
||||||||||||||||||||||||
|
Actuarial Loss
|
||||||||||||||||||||||||
|
Associated with
|
||||||||||||||||||||||||
|
Postretirement
|
Prior Service
|
Total
|
||||||||||||||||||||||
|
Foreign
|
Plans and
|
Cost Associated
|
Accumulated
|
|||||||||||||||||||||
|
Currency
|
Workers’
|
with
|
Other
|
|||||||||||||||||||||
|
Translation
|
Compensation
|
Postretirement
|
Cash Flow
|
Comprehensive
|
||||||||||||||||||||
| Adjustment | Obligations | Plans | Hedges | Loss | ||||||||||||||||||||
| (Dollars in millions) | ||||||||||||||||||||||||
|
December 31, 2007
|
$ | 3.1 | $ | (116.7 | ) | $ | (18.9 | ) | $ | 65.4 | $ | (67.1 | ) | |||||||||||
|
Net decrease in fair value of cash flow hedges
|
— | — | — | (194.5 | ) | (194.5 | ) | |||||||||||||||||
|
Reclassification from other comprehensive income to earnings
|
— | 14.1 | 0.2 | (23.4 | ) | (9.1 | ) | |||||||||||||||||
|
Current period change
|
— | (117.8 | ) | — | — | (117.8 | ) | |||||||||||||||||
|
December 31, 2008
|
3.1 | (220.4 | ) | (18.7 | ) | (152.5 | ) | (388.5 | ) | |||||||||||||||
|
Net increase in fair value of cash flow hedges
|
— | — | — | 235.2 | 235.2 | |||||||||||||||||||
|
Reclassification from other comprehensive income to earnings
|
— | 11.8 | 1.8 | 84.6 | 98.2 | |||||||||||||||||||
|
Current period change
|
— | (134.9 | ) | 6.5 | — | (128.4 | ) | |||||||||||||||||
|
December 31, 2009
|
3.1 | (343.5 | ) | (10.4 | ) | 167.3 | (183.5 | ) | ||||||||||||||||
|
Net increase in fair value of cash flow hedges
|
— | — | — | 229.9 | 229.9 | |||||||||||||||||||
|
Reclassification from other comprehensive income to earnings
|
— | 31.8 | 2.5 | (102.4 | ) | (68.1 | ) | |||||||||||||||||
|
Current period change
|
— | (46.2 | ) | — | — | (46.2 | ) | |||||||||||||||||
|
December 31, 2010
|
$ | 3.1 | $ | (357.9 | ) | $ | (7.9 | ) | $ | 294.8 | $ | (67.9 | ) | |||||||||||
| (16) | Resource Management and Other Commercial Events |
F-48
Table of Contents
| (17) | Earnings per Share |
| Year Ended December 31, | ||||||||||||
| 2010 | 2009 | 2008 | ||||||||||
| (In millions, except per share amounts) | ||||||||||||
|
EPS numerator:
|
||||||||||||
|
Income from continuing operations, net of income taxes
|
$ | 805.1 | $ | 457.9 | $ | 987.9 | ||||||
|
Less: Net income attributable to noncontrolling interests
|
28.2 | 14.8 | 6.2 | |||||||||
|
Income from continuing operations attributable to common
stockholders before allocation of earnings to participating
securities
|
776.9 | 443.1 | 981.7 | |||||||||
|
Less: Earnings allocated to participating securities
|
(5.6 | ) | (2.9 | ) | (5.5 | ) | ||||||
|
Income from continuing operations attributable to common
stockholders, after earnings allocated to participating
securities
(1)
|
771.3 | 440.2 | 976.2 | |||||||||
|
Income (loss) from discontinued operations, net of income taxes
|
(2.9 | ) | 5.1 | (28.8 | ) | |||||||
|
Net income attributable to common stockholders, after earnings
allocated to participating
securities
(1)
|
$ | 768.4 | $ | 445.3 | $ | 947.4 | ||||||
|
EPS denominator:
|
||||||||||||
|
Weighted average shares outstanding — basic
|
267.0 | 265.5 | 268.9 | |||||||||
|
Impact of dilutive securities
|
2.9 | 2.0 | 1.8 | |||||||||
|
Weighted average shares outstanding —
diluted
(2)
|
269.9 | 267.5 | 270.7 | |||||||||
|
Basic EPS attributable to common stockholders:
|
||||||||||||
|
Income from continuing operations
|
$ | 2.89 | $ | 1.66 | $ | 3.63 | ||||||
|
Income (loss) from discontinued operations
|
(0.01 | ) | 0.02 | (0.11 | ) | |||||||
|
Net income
|
$ | 2.88 | $ | 1.68 | $ | 3.52 | ||||||
|
Diluted EPS attributable to common stockholders:
|
||||||||||||
|
Income from continuing operations
|
$ | 2.86 | $ | 1.64 | $ | 3.60 | ||||||
|
Income (loss) from discontinued operations
|
(0.01 | ) | 0.02 | (0.10 | ) | |||||||
|
Net income
|
$ | 2.85 | $ | 1.66 | $ | 3.50 | ||||||
| (1) | The reallocation adjustment for participating securities to arrive at the numerator used to calculate diluted EPS was less than $0.1 million for the periods presented. | |
| (2) | Weighted average shares outstanding excludes anti-dilutive shares that totaled 0.2 million for the years ended December 31, 2010 and 2009 and 0.1 million for the year ended December 31, 2008. |
F-49
Table of Contents
| (18) | Risk Management — Labor Relations |
| (19) | Financial Instruments and Guarantees With Off-Balance-Sheet Risk |
F-50
Table of Contents
|
Workers’
|
||||||||||||||||||||
|
Reclamation
|
Lease
|
Compensation
|
||||||||||||||||||
| Obligations | Obligations | Obligations | Other (1) | Total | ||||||||||||||||
| (Dollars in millions) | ||||||||||||||||||||
|
Self bonding
|
$ | 920.3 | $ | — | $ | — | $ | — | $ | 920.3 | ||||||||||
|
Surety bonds
|
577.2 | 110.3 | 7.3 | 10.5 | 705.3 | |||||||||||||||
|
Bank guarantees
|
127.2 | — | — | 128.3 | 255.5 | |||||||||||||||
|
Letters of credit
|
0.1 | — | 68.8 | 87.4 | 156.3 | |||||||||||||||
| $ | 1,624.8 | $ | 110.3 | $ | 76.1 | $ | 226.2 | $ | 2,037.4 | |||||||||||
| (1) | Other includes letter of credit obligations described below and an additional $138.9 million in letters of credit and surety bonds related to collateral for surety companies, road maintenance, performance guarantees and other operations. |
F-51
Table of Contents
F-52
Table of Contents
| (20) | Commitments and Contingencies |
F-53
Table of Contents
F-54
Table of Contents
F-55
Table of Contents
F-56
Table of Contents
| (21) | Summary Quarterly Financial Information (Unaudited) |
| Year Ended December 31, 2010 | ||||||||||||||||
| First Quarter | Second Quarter | Third Quarter | Fourth Quarter | |||||||||||||
| (In millions except per share data) | ||||||||||||||||
|
Revenues
|
$ | 1,515.6 | $ | 1,661.4 | $ | 1,864.7 | $ | 1,818.3 | ||||||||
|
Operating profit
|
242.2 | 324.4 | 444.7 | 314.4 | ||||||||||||
|
Income from continuing operations, net of income taxes
|
137.1 | 214.7 | 237.6 | 215.7 | ||||||||||||
|
Net income
|
136.7 | 214.2 | 236.3 | 215.0 | ||||||||||||
|
Net income attributable to common stockholders
|
133.7 | 206.2 | 224.1 | 210.0 | ||||||||||||
|
Basic earnings per share — continuing
operations
(1)
|
0.50 | 0.77 | 0.84 | 0.78 | ||||||||||||
|
Diluted earnings per share — continuing
operations
(1)
|
$ | 0.50 | $ | 0.76 | $ | 0.83 | $ | 0.77 | ||||||||
|
Weighted average shares used in calculating basic earnings per
share
|
266.5 | 266.6 | 267.1 | 267.7 | ||||||||||||
|
Weighted average shares used in calculating diluted earnings per
share
|
268.2 | 268.3 | 268.6 | 270.3 | ||||||||||||
| (1) | Earnings per share for the quarters may not sum to the amounts for the year as each period is computed on a discrete basis. |
F-57
Table of Contents
| Year Ended December 31, 2009 | ||||||||||||||||
| First Quarter | Second Quarter | Third Quarter | Fourth Quarter | |||||||||||||
| (In millions except per share data) | ||||||||||||||||
|
Revenues
|
$ | 1,453.0 | $ | 1,338.2 | $ | 1,667.0 | $ | 1,554.2 | ||||||||
|
Operating profit
|
219.7 | 215.4 | 220.3 | 189.4 | ||||||||||||
|
Income from continuing operations, net of income taxes
|
141.2 | 90.0 | 113.2 | 113.5 | ||||||||||||
|
Net income
|
175.2 | 82.0 | 110.8 | 95.0 | ||||||||||||
|
Net income attributable to common stockholders
|
170.0 | 79.2 | 106.8 | 92.2 | ||||||||||||
|
Basic earnings per share — continuing
operations
(1)
|
0.51 | 0.33 | 0.41 | 0.41 | ||||||||||||
|
Diluted earnings per share — continuing
operations
(1)
|
$ | 0.50 | $ | 0.32 | $ | 0.41 | $ | 0.41 | ||||||||
|
Weighted average shares used in calculating basic earnings per
share
|
265.3 | 265.4 | 265.7 | 265.8 | ||||||||||||
|
Weighted average shares used in calculating diluted earnings per
share
|
267.3 | 267.1 | 267.3 | 267.7 | ||||||||||||
| (1) | Earnings per share for the quarters may not sum to the amounts for the year as each period is computed on a discrete basis. |
| (22) | Segment Information |
F-58
Table of Contents
|
Western
|
Midwestern
|
Australian
|
Trading and
|
Corporate
|
||||||||||||||||||||
| U.S. Mining | U.S. Mining | Mining | Brokerage | and Other | Consolidated | |||||||||||||||||||
| (Dollars in millions) | ||||||||||||||||||||||||
|
Revenues
|
$ | 2,706.3 | $ | 1,320.6 | $ | 2,520.0 | $ | 291.1 | $ | 22.0 | $ | 6,860.0 | ||||||||||||
|
Adjusted EBITDA
|
816.7 | 322.1 | 953.8 | 77.2 | (354.7 | ) | 1,815.1 | |||||||||||||||||
|
Total assets
|
3,008.4 | 608.0 | 3,603.4 | 398.2 | 3,745.1 | 11,363.1 | ||||||||||||||||||
|
Additions to property, plant, equipment and mine development
|
143.3 | 224.9 | 147.8 | 0.9 | 40.1 | 557.0 | ||||||||||||||||||
|
Federal coal lease expenditures
|
— | — | — | — | — | — | ||||||||||||||||||
|
Loss from equity affiliates
|
— | — | — | — | 1.7 | 1.7 | ||||||||||||||||||
|
Additions to advance mining royalties
|
1.3 | 1.3 | — | — | 3.1 | 5.7 | ||||||||||||||||||
|
Western
|
Midwestern
|
Australian
|
Trading and
|
Corporate
|
||||||||||||||||||||
| U.S. Mining | U.S. Mining | Mining | Brokerage | and Other | Consolidated | |||||||||||||||||||
| (Dollars in millions) | ||||||||||||||||||||||||
|
Revenues
|
$ | 2,612.6 | $ | 1,303.8 | $ | 1,678.0 | $ | 391.0 | $ | 27.0 | $ | 6,012.4 | ||||||||||||
|
Adjusted EBITDA
|
721.5 | 281.9 | 437.8 | 193.4 | (344.5 | ) | 1,290.1 | |||||||||||||||||
|
Total assets
|
3,087.6 | 444.4 | 3,386.8 | 673.0 | 2,363.5 | 9,955.3 | ||||||||||||||||||
|
Additions to property, plant, equipment and mine development
|
78.3 | 104.2 | 70.1 | 1.8 | 6.2 | 260.6 | ||||||||||||||||||
|
Federal coal lease expenditures
|
123.6 | — | — | — | — | 123.6 | ||||||||||||||||||
|
Income (loss) from equity affiliates
|
— | — | — | — | (69.1 | ) | (69.1 | ) | ||||||||||||||||
|
Additions to advance mining royalties
|
1.5 | 1.6 | — | — | 3.0 | 6.1 | ||||||||||||||||||
F-59
Table of Contents
|
Western
|
Midwestern
|
Australian
|
Trading and
|
Corporate
|
||||||||||||||||||||
| U.S. Mining | U.S. Mining | Mining | Brokerage | and Other | Consolidated | |||||||||||||||||||
| (Dollars in millions) | ||||||||||||||||||||||||
|
Revenues
|
$ | 2,533.1 | $ | 1,154.6 | $ | 2,242.8 | $ | 601.8 | $ | 28.7 | $ | 6,561.0 | ||||||||||||
|
Adjusted EBITDA
|
681.3 | 177.3 | 1,016.6 | 218.9 | (247.2 | ) | 1,846.9 | |||||||||||||||||
|
Total assets
|
3,140.4 | 552.0 | 2,985.9 | 920.3 | 2,097.0 | 9,695.6 | ||||||||||||||||||
|
Additions to property, plant, equipment and mine development
|
140.4 | 30.3 | 62.8 | — | 30.6 | 264.1 | ||||||||||||||||||
|
Federal coal lease expenditures
|
178.5 | — | — | — | — | 178.5 | ||||||||||||||||||
|
Income (loss) from equity affiliates
|
— | — | — | — | — | — | ||||||||||||||||||
|
Additions to advance mining royalties
|
2.1 | 2.2 | — | — | 1.7 | 6.0 | ||||||||||||||||||
| Year Ended December 31, | ||||||||||||
| 2010 | 2009 | 2008 | ||||||||||
| (Dollars in millions) | ||||||||||||
|
Total adjusted EBITDA
|
$ | 1,815.1 | $ | 1,290.1 | $ | 1,846.9 | ||||||
|
Depreciation, depletion and amortization
|
(440.9 | ) | (405.2 | ) | (402.4 | ) | ||||||
|
Asset retirement obligation expense
|
(48.5 | ) | (40.1 | ) | (48.2 | ) | ||||||
|
Interest expense
|
(222.1 | ) | (201.2 | ) | (227.0 | ) | ||||||
|
Interest income
|
9.6 | 8.1 | 10.0 | |||||||||
|
Income tax provision
|
(308.1 | ) | (193.8 | ) | (191.4 | ) | ||||||
|
Income from continuing operations, net of income taxes
|
$ | 805.1 | $ | 457.9 | $ | 987.9 | ||||||
| (23) | Supplemental Guarantor/Non-Guarantor Financial Information |
F-60
Table of Contents
| Year Ended December 31, 2010 | ||||||||||||||||||||
|
Parent
|
Guarantor
|
Non-Guarantor
|
||||||||||||||||||
| Company | Subsidiaries | Subsidiaries | Eliminations | Consolidated | ||||||||||||||||
| (Dollars in millions) | ||||||||||||||||||||
|
Total revenues
|
$ | — | $ | 3,716.2 | $ | 3,916.9 | $ | (773.1 | ) | $ | 6,860.0 | |||||||||
|
Costs and expenses
|
||||||||||||||||||||
|
Operating costs and expenses
|
(145.1 | ) | 2,616.4 | 3,142.8 | (773.1 | ) | 4,841.0 | |||||||||||||
|
Depreciation, depletion and amortization
|
— | 297.9 | 143.0 | — | 440.9 | |||||||||||||||
|
Asset retirement obligation expense
|
— | 33.2 | 15.3 | — | 48.5 | |||||||||||||||
|
Selling and administrative expenses
|
31.6 | 194.3 | 6.3 | — | 232.2 | |||||||||||||||
|
Other operating (income) loss:
|
||||||||||||||||||||
|
Net (gain) loss on disposal or exchange of assets
|
— | (34.5 | ) | 4.5 | — | (30.0 | ) | |||||||||||||
|
(Income) loss from equity affiliates
|
(838.4 | ) | 7.1 | 6.0 | 827.0 | 1.7 | ||||||||||||||
|
Interest expense
|
219.7 | 52.8 | 17.9 | (68.3 | ) | 222.1 | ||||||||||||||
|
Interest income
|
(18.8 | ) | (21.8 | ) | (37.3 | ) | 68.3 | (9.6 | ) | |||||||||||
|
Income from continuing operations before income taxes
|
751.0 | 570.8 | 618.4 | (827.0 | ) | 1,113.2 | ||||||||||||||
|
Income tax provision (benefit)
|
(24.2 | ) | 176.0 | 156.3 | — | 308.1 | ||||||||||||||
|
Income from continuing operations, net of income taxes
|
775.2 | 394.8 | 462.1 | (827.0 | ) | 805.1 | ||||||||||||||
|
Loss from discontinued operations, net of income taxes
|
(1.2 | ) | (1.7 | ) | — | — | (2.9 | ) | ||||||||||||
|
Net income
|
774.0 | 393.1 | 462.1 | (827.0 | ) | 802.2 | ||||||||||||||
|
Less: Net income attributable to noncontrolling interests
|
— | — | 28.2 | — | 28.2 | |||||||||||||||
|
Net income attributable to common stockholders
|
$ | 774.0 | $ | 393.1 | $ | 433.9 | $ | (827.0 | ) | $ | 774.0 | |||||||||
F-61
Table of Contents
| Year Ended December 31, 2009 | ||||||||||||||||||||
|
Parent
|
Guarantor
|
Non-Guarantor
|
||||||||||||||||||
| Company | Subsidiaries | Subsidiaries | Eliminations | Consolidated | ||||||||||||||||
| (Dollars in millions) | ||||||||||||||||||||
|
Total revenues
|
$ | — | $ | 4,449.3 | $ | 2,312.5 | $ | (749.4 | ) | $ | 6,012.4 | |||||||||
|
Costs and expenses
|
||||||||||||||||||||
|
Operating costs and expenses
|
104.4 | 3,383.8 | 1,733.8 | (749.4 | ) | 4,472.6 | ||||||||||||||
|
Depreciation, depletion and amortization
|
— | 287.6 | 117.6 | — | 405.2 | |||||||||||||||
|
Asset retirement obligation expense
|
— | 33.3 | 6.8 | — | 40.1 | |||||||||||||||
|
Selling and administrative expenses
|
29.3 | 168.9 | 5.6 | — | 203.8 | |||||||||||||||
|
Other operating (income) loss:
|
||||||||||||||||||||
|
Net gain on disposal or exchange of assets
|
— | (17.1 | ) | (6.1 | ) | — | (23.2 | ) | ||||||||||||
|
(Income) loss from equity affiliates
|
(620.9 | ) | 6.3 | 62.8 | 620.9 | 69.1 | ||||||||||||||
|
Interest expense
|
198.4 | 52.6 | 16.2 | (66.0 | ) | 201.2 | ||||||||||||||
|
Interest income
|
(15.3 | ) | (28.9 | ) | (29.9 | ) | 66.0 | (8.1 | ) | |||||||||||
|
Income from continuing operations before income taxes
|
304.1 | 562.8 | 405.7 | (620.9 | ) | 651.7 | ||||||||||||||
|
Income tax provision (benefit)
|
(122.3 | ) | 184.1 | 132.0 | — | 193.8 | ||||||||||||||
|
Income from continuing operations, net of income taxes
|
426.4 | 378.7 | 273.7 | (620.9 | ) | 457.9 | ||||||||||||||
|
Income (loss) from discontinued operations, net of income taxes
|
21.8 | (2.7 | ) | (14.0 | ) | — | 5.1 | |||||||||||||
|
Net income
|
448.2 | 376.0 | 259.7 | (620.9 | ) | 463.0 | ||||||||||||||
|
Less: Net income attributable to noncontrolling interests
|
— | — | 14.8 | — | 14.8 | |||||||||||||||
|
Net income attributable to common stockholders
|
$ | 448.2 | $ | 376.0 | $ | 244.9 | $ | (620.9 | ) | $ | 448.2 | |||||||||
F-62
Table of Contents
| Year Ended December 31, 2008 | ||||||||||||||||||||
|
Parent
|
Guarantor
|
Non-Guarantor
|
||||||||||||||||||
| Company | Subsidiaries | Subsidiaries | Eliminations | Consolidated | ||||||||||||||||
| (Dollars in millions) | ||||||||||||||||||||
|
Total revenues
|
$ | — | $ | 3,788.4 | $ | 2,981.4 | $ | (208.8 | ) | $ | 6,561.0 | |||||||||
|
Costs and expenses
|
||||||||||||||||||||
|
Operating costs and expenses
|
(51.5 | ) | 3,034.7 | 1,815.3 | (208.8 | ) | 4,589.7 | |||||||||||||
|
Depreciation, depletion and amortization
|
— | 265.9 | 136.5 | — | 402.4 | |||||||||||||||
|
Asset retirement obligation expense
|
— | 42.8 | 5.4 | — | 48.2 | |||||||||||||||
|
Selling and administrative expenses
|
22.0 | 171.6 | 3.7 | — | 197.3 | |||||||||||||||
|
Other operating (income) loss:
|
||||||||||||||||||||
|
Net gain on disposal or exchange of assets
|
— | (72.7 | ) | (0.2 | ) | — | (72.9 | ) | ||||||||||||
|
(Income) loss from equity affiliates
|
(1,075.0 | ) | 5.7 | (5.7 | ) | 1,075.0 | — | |||||||||||||
|
Interest expense
|
220.5 | 22.4 | 42.0 | (57.9 | ) | 227.0 | ||||||||||||||
|
Interest income
|
(15.1 | ) | (24.2 | ) | (28.6 | ) | 57.9 | (10.0 | ) | |||||||||||
|
Income from continuing operations before income taxes
|
899.1 | 342.2 | 1,013.0 | (1,075.0 | ) | 1,179.3 | ||||||||||||||
|
Income tax provision (benefit)
|
(67.7 | ) | 101.3 | 157.8 | — | 191.4 | ||||||||||||||
|
Income from continuing operations, net of income taxes
|
966.8 | 240.9 | 855.2 | (1,075.0 | ) | 987.9 | ||||||||||||||
|
Income (loss) from discontinued operations, net of income taxes
|
(13.9 | ) | (27.9 | ) | 13.0 | — | (28.8 | ) | ||||||||||||
|
Net income
|
952.9 | 213.0 | 868.2 | (1,075.0 | ) | 959.1 | ||||||||||||||
|
Less: Net income (loss) attributable to noncontrolling interests
|
— | (0.1 | ) | 6.3 | — | 6.2 | ||||||||||||||
|
Net income attributable to common stockholders
|
$ | 952.9 | $ | 213.1 | $ | 861.9 | $ | (1,075.0 | ) | $ | 952.9 | |||||||||
F-63
Table of Contents
| December 31, 2010 | ||||||||||||||||||||
|
Parent
|
Guarantor
|
Non-Guarantor
|
Reclassifications/
|
|||||||||||||||||
| Company | Subsidiaries | Subsidiaries | Eliminations | Consolidated | ||||||||||||||||
| (Dollars in millions) | ||||||||||||||||||||
|
Assets
|
||||||||||||||||||||
|
Current assets
|
||||||||||||||||||||
|
Cash and cash equivalents
|
$ | 903.8 | $ | 5.2 | $ | 386.2 | $ | — | $ | 1,295.2 | ||||||||||
|
Accounts receivable, net
|
2.1 | 5.5 | 550.6 | — | 558.2 | |||||||||||||||
|
Inventories
|
— | 168.0 | 164.9 | — | 332.9 | |||||||||||||||
|
Assets from coal trading activities, net
|
— | 23.8 | 168.7 | — | 192.5 | |||||||||||||||
|
Deferred income taxes
|
— | 78.6 | 47.9 | (6.1 | ) | 120.4 | ||||||||||||||
|
Other current assets
|
307.9 | 30.7 | 120.4 | — | 459.0 | |||||||||||||||
|
Total current assets
|
1,213.8 | 311.8 | 1,438.7 | (6.1 | ) | 2,958.2 | ||||||||||||||
|
Property, plant, equipment and mine development
|
||||||||||||||||||||
|
Land and coal interests
|
— | 4,860.7 | 2,796.3 | — | 7,657.0 | |||||||||||||||
|
Buildings and improvements
|
— | 945.8 | 134.0 | — | 1,079.8 | |||||||||||||||
|
Machinery and equipment
|
— | 1,300.6 | 398.7 | — | 1,699.3 | |||||||||||||||
|
Less: accumulated depreciation, depletion and amortization
|
— | (2,374.4 | ) | (635.6 | ) | — | (3,010.0 | ) | ||||||||||||
|
Property, plant, equipment and mine development, net
|
— | 4,732.7 | 2,693.4 | — | 7,426.1 | |||||||||||||||
|
Investments and other assets
|
9,331.0 | 179.8 | 99.1 | (8,631.1 | ) | 978.8 | ||||||||||||||
|
Total assets
|
$ | 10,544.8 | $ | 5,224.3 | $ | 4,231.2 | $ | (8,637.2 | ) | $ | 11,363.1 | |||||||||
|
Liabilities and Stockholders’ Equity
|
||||||||||||||||||||
|
Current liabilities
|
||||||||||||||||||||
|
Current maturities of long-term debt
|
$ | 25.0 | $ | — | $ | 18.2 | $ | — | $ | 43.2 | ||||||||||
|
Payables to (receivables from) affiliates, net
|
2,225.3 | (2,528.3 | ) | 303.0 | — | — | ||||||||||||||
|
Liabilities from coal trading activities, net
|
— | 29.5 | 152.2 | — | 181.7 | |||||||||||||||
|
Deferred income taxes
|
6.1 | — | — | (6.1 | ) | — | ||||||||||||||
|
Accounts payable and accrued expenses
|
47.4 | 777.2 | 464.2 | — | 1,288.8 | |||||||||||||||
|
Total current liabilities
|
2,303.8 | (1,721.6 | ) | 937.6 | (6.1 | ) | 1,513.7 | |||||||||||||
|
Long-term debt, less current maturities
|
2,609.6 | 0.1 | 97.1 | — | 2,706.8 | |||||||||||||||
|
Deferred income taxes
|
93.2 | 135.4 | 311.2 | — | 539.8 | |||||||||||||||
|
Notes payable to (receivables from) affiliates, net
|
818.9 | (825.3 | ) | 6.4 | — | — | ||||||||||||||
|
Other noncurrent liabilities
|
58.6 | 1,652.8 | 202.1 | — | 1,913.5 | |||||||||||||||
|
Total liabilities
|
5,884.1 | (758.6 | ) | 1,554.4 | (6.1 | ) | 6,673.8 | |||||||||||||
|
Peabody Energy Corporation’s stockholders’ equity
|
4,660.7 | 5,982.9 | 2,648.2 | (8,631.1 | ) | 4,660.7 | ||||||||||||||
|
Noncontrolling interests
|
— | — | 28.6 | — | 28.6 | |||||||||||||||
|
Total stockholders’ equity
|
4,660.7 | 5,982.9 | 2,676.8 | (8,631.1 | ) | 4,689.3 | ||||||||||||||
|
Total liabilities and stockholders’ equity
|
$ | 10,544.8 | $ | 5,224.3 | $ | 4,231.2 | $ | (8,637.2 | ) | $ | 11,363.1 | |||||||||
F-64
Table of Contents
| December 31, 2009 | ||||||||||||||||||||
|
Parent
|
Guarantor
|
Non-Guarantor
|
Reclassifications/
|
|||||||||||||||||
| Company | Subsidiaries | Subsidiaries | Eliminations | Consolidated | ||||||||||||||||
| (Dollars in millions) | ||||||||||||||||||||
|
Assets
|
||||||||||||||||||||
|
Current assets
|
||||||||||||||||||||
|
Cash and cash equivalents
|
$ | 368.4 | $ | 0.2 | $ | 620.2 | $ | — | $ | 988.8 | ||||||||||
|
Accounts receivable, net
|
0.6 | 55.5 | 246.9 | — | 303.0 | |||||||||||||||
|
Inventories
|
— | 152.5 | 172.6 | — | 325.1 | |||||||||||||||
|
Assets from coal trading activities, net
|
— | 92.8 | 184.0 | — | 276.8 | |||||||||||||||
|
Deferred income taxes
|
11.6 | 56.5 | — | (28.1 | ) | 40.0 | ||||||||||||||
|
Other current assets
|
133.9 | 30.7 | 90.7 | — | 255.3 | |||||||||||||||
|
Total current assets
|
514.5 | 388.2 | 1,314.4 | (28.1 | ) | 2,189.0 | ||||||||||||||
|
Property, plant, equipment and mine development
|
||||||||||||||||||||
|
Land and coal interests
|
— | 4,807.3 | 2,750.0 | — | 7,557.3 | |||||||||||||||
|
Buildings and improvements
|
— | 783.4 | 124.6 | — | 908.0 | |||||||||||||||
|
Machinery and equipment
|
— | 1,117.3 | 273.9 | — | 1,391.2 | |||||||||||||||
|
Less: accumulated depreciation, depletion and amortization
|
— | (2,096.6 | ) | (498.4 | ) | — | (2,595.0 | ) | ||||||||||||
|
Property, plant, equipment and mine development, net
|
— | 4,611.4 | 2,650.1 | — | 7,261.5 | |||||||||||||||
|
Deferred income taxes
|
124.0 | — | — | (124.0 | ) | — | ||||||||||||||
|
Investments and other assets
|
8,893.5 | 110.5 | 32.0 | (8,531.2 | ) | 504.8 | ||||||||||||||
|
Total assets
|
$ | 9,532.0 | $ | 5,110.1 | $ | 3,996.5 | $ | (8,683.3 | ) | $ | 9,955.3 | |||||||||
|
Liabilities and Stockholders’ Equity
|
||||||||||||||||||||
|
Current liabilities
|
||||||||||||||||||||
|
Current maturities of long-term debt
|
$ | — | $ | — | $ | 14.1 | $ | — | $ | 14.1 | ||||||||||
|
Payables to (receivables from) affiliates, net
|
1,937.2 | (1,975.9 | ) | 38.7 | — | — | ||||||||||||||
|
Liabilities from coal trading activities, net
|
— | 45.1 | 65.5 | — | 110.6 | |||||||||||||||
|
Deferred income taxes
|
— | — | 28.1 | (28.1 | ) | — | ||||||||||||||
|
Accounts payable and accrued expenses
|
106.6 | 661.7 | 419.4 | — | 1,187.7 | |||||||||||||||
|
Total current liabilities
|
2,043.8 | (1,269.1 | ) | 565.8 | (28.1 | ) | 1,312.4 | |||||||||||||
|
Long-term debt, less current maturities
|
2,635.4 | 0.1 | 102.7 | — | 2,738.2 | |||||||||||||||
|
Deferred income taxes
|
— | 173.3 | 249.8 | (124.0 | ) | 299.1 | ||||||||||||||
|
Notes payable to (receivables from) affiliates, net
|
1,032.5 | (1,035.0 | ) | 2.5 | — | — | ||||||||||||||
|
Other noncurrent liabilities
|
70.6 | 1,667.8 | 111.3 | — | 1,849.7 | |||||||||||||||
|
Total liabilities
|
5,782.3 | (462.9 | ) | 1,032.1 | (152.1 | ) | 6,199.4 | |||||||||||||
|
Peabody Energy Corporation’s stockholders’ equity
|
3,749.7 | 5,573.0 | 2,958.2 | (8,531.2 | ) | 3,749.7 | ||||||||||||||
|
Noncontrolling interests
|
— | — | 6.2 | — | 6.2 | |||||||||||||||
|
Total stockholders’ equity
|
3,749.7 | 5,573.0 | 2,964.4 | (8,531.2 | ) | 3,755.9 | ||||||||||||||
|
Total liabilities and stockholders’ equity
|
$ | 9,532.0 | $ | 5,110.1 | $ | 3,996.5 | $ | (8,683.3 | ) | $ | 9,955.3 | |||||||||
F-65
Table of Contents
| Year Ended December 31, 2010 | ||||||||||||||||
|
Parent
|
Guarantor
|
Non-Guarantor
|
||||||||||||||
| Company | Subsidiaries | Subsidiaries | Consolidated | |||||||||||||
| (Dollars in millions) | ||||||||||||||||
|
Cash Flows From Operating Activities
|
||||||||||||||||
|
Net cash provided by (used in) continuing operations
|
$ | (126.4 | ) | $ | 1,090.6 | $ | 139.5 | $ | 1,103.7 | |||||||
|
Net cash provided by (used in) discontinued operations
|
(14.2 | ) | (2.4 | ) | — | (16.6 | ) | |||||||||
|
Net cash provided by (used in) operating activities
|
(140.6 | ) | 1,088.2 | 139.5 | 1,087.1 | |||||||||||
|
Cash Flows From Investing Activities
|
||||||||||||||||
|
Additions to property, plant, equipment and
|
||||||||||||||||
|
mine development
|
— | (404.5 | ) | (152.5 | ) | (557.0 | ) | |||||||||
|
Investment in Prairie State Energy Campus
|
— | (76.0 | ) | — | (76.0 | ) | ||||||||||
|
Proceeds from disposal of assets, net of notes receivable
|
— | 14.1 | 5.1 | 19.2 | ||||||||||||
|
Investment in equity affiliates and joint ventures
|
— | (15.0 | ) | (3.8 | ) | (18.8 | ) | |||||||||
|
Investments in debt and equity securities
|
— | — | (74.6 | ) | (74.6 | ) | ||||||||||
|
Proceeds from sale of debt securities
|
— | — | 12.4 | 12.4 | ||||||||||||
|
Other, net
|
— | (8.7 | ) | (0.1 | ) | (8.8 | ) | |||||||||
|
Net cash used in investing activities
|
— | (490.1 | ) | (213.5 | ) | (703.6 | ) | |||||||||
|
Cash Flows From Financing Activities
|
||||||||||||||||
|
Proceeds from long-term debt
|
1,150.0 | — | — | 1,150.0 | ||||||||||||
|
Payments of long-term debt
|
(1,146.8 | ) | — | (20.5 | ) | (1,167.3 | ) | |||||||||
|
Dividends paid
|
(79.4 | ) | — | — | (79.4 | ) | ||||||||||
|
Repurchase of employee common stock relinquished for tax
withholding
|
(13.5 | ) | — | — | (13.5 | ) | ||||||||||
|
Payment of debt issuance costs
|
(32.2 | ) | — | — | (32.2 | ) | ||||||||||
|
Excess tax benefits related to share-based compensation
|
51.0 | — | — | 51.0 | ||||||||||||
|
Proceeds from stock options exercised
|
16.4 | — | — | 16.4 | ||||||||||||
|
Other, net
|
5.9 | (5.9 | ) | (2.1 | ) | (2.1 | ) | |||||||||
|
Transactions with affiliates, net
|
724.6 | (587.2 | ) | (137.4 | ) | — | ||||||||||
|
Net cash provided by (used in) financing activities
|
676.0 | (593.1 | ) | (160.0 | ) | (77.1 | ) | |||||||||
|
Net change in cash and cash equivalents
|
535.4 | 5.0 | (234.0 | ) | 306.4 | |||||||||||
|
Cash and cash equivalents at beginning of year
|
368.4 | 0.2 | 620.2 | 988.8 | ||||||||||||
|
Cash and cash equivalents at end of year
|
$ | 903.8 | $ | 5.2 | $ | 386.2 | $ | 1,295.2 | ||||||||
F-66
Table of Contents
| Year Ended December 31, 2009 | ||||||||||||||||
|
Parent
|
Guarantor
|
Non-Guarantor
|
||||||||||||||
| Company | Subsidiaries | Subsidiaries | Consolidated | |||||||||||||
| (Dollars in millions) | ||||||||||||||||
|
Cash Flows From Operating Activities
|
||||||||||||||||
|
Net cash provided by (used in) continuing operations
|
$ | (213.7 | ) | $ | 792.7 | $ | 476.8 | $ | 1,055.8 | |||||||
|
Net cash provided by (used in) discontinued operations
|
7.4 | (5.3 | ) | (7.7 | ) | (5.6 | ) | |||||||||
|
Net cash provided by (used in) operating activities
|
(206.3 | ) | 787.4 | 469.1 | 1,050.2 | |||||||||||
|
Cash Flows From Investing Activities
|
||||||||||||||||
|
Additions to property, plant, equipment and
|
||||||||||||||||
|
mine development
|
— | (189.7 | ) | (70.9 | ) | (260.6 | ) | |||||||||
|
Investment in Prairie State Energy Campus
|
— | (56.8 | ) | — | (56.8 | ) | ||||||||||
|
Federal coal lease expenditures
|
— | (123.6 | ) | — | (123.6 | ) | ||||||||||
|
Proceeds from disposal of assets, net of notes receivable
|
— | 43.8 | 10.1 | 53.9 | ||||||||||||
|
Investment in equity affiliates and joint ventures
|
— | (5.0 | ) | (10.0 | ) | (15.0 | ) | |||||||||
|
Other, net
|
— | (5.8 | ) | (0.3 | ) | (6.1 | ) | |||||||||
|
Net cash used in continuing operations
|
— | (337.1 | ) | (71.1 | ) | (408.2 | ) | |||||||||
|
Net cash provided by discontinued operations
|
— | — | 1.7 | 1.7 | ||||||||||||
|
Net cash used in investing activities
|
— | (337.1 | ) | (69.4 | ) | (406.5 | ) | |||||||||
|
Cash Flows From Financing Activities
|
||||||||||||||||
|
Payments of long-term debt
|
— | — | (37.1 | ) | (37.1 | ) | ||||||||||
|
Dividends paid
|
(66.8 | ) | — | — | (66.8 | ) | ||||||||||
|
Proceeds from stock options exercised
|
3.6 | — | — | 3.6 | ||||||||||||
|
Repurchase of employee common stock relinquished for tax
withholding
|
(2.3 | ) | — | — | (2.3 | ) | ||||||||||
|
Other, net
|
5.1 | — | (7.1 | ) | (2.0 | ) | ||||||||||
|
Transactions with affiliates, net
|
473.9 | (454.6 | ) | (19.3 | ) | — | ||||||||||
|
Net cash provided by (used in) financing activities
|
413.5 | (454.6 | ) | (63.5 | ) | (104.6 | ) | |||||||||
|
Net change in cash and cash equivalents
|
207.2 | (4.3 | ) | 336.2 | 539.1 | |||||||||||
|
Cash and cash equivalents at beginning of year
|
161.2 | 4.5 | 284.0 | 449.7 | ||||||||||||
|
Cash and cash equivalents at end of year
|
$ | 368.4 | $ | 0.2 | $ | 620.2 | $ | 988.8 | ||||||||
F-67
Table of Contents
| Year Ended December 31, 2008 | ||||||||||||||||
|
Parent
|
Guarantor
|
Non-Guarantor
|
||||||||||||||
| Company | Subsidiaries | Subsidiaries | Consolidated | |||||||||||||
| (Dollars in millions) | ||||||||||||||||
|
Cash Flows From Operating Activities
|
||||||||||||||||
|
Net cash provided by continuing operations
|
$ | 28.7 | $ | 465.6 | $ | 926.5 | $ | 1,420.8 | ||||||||
|
Net cash used in discontinued operations
|
(94.5 | ) | (17.3 | ) | (11.2 | ) | (123.0 | ) | ||||||||
|
Net cash provided by (used in) operating activities
|
(65.8 | ) | 448.3 | 915.3 | 1,297.8 | |||||||||||
|
Net cash provided by continuing operations
|
||||||||||||||||
|
Net cash provided by (used in) discontinued operations
|
||||||||||||||||
|
Net cash provided by operating activities
|
— | (198.0 | ) | (66.1 | ) | (264.1 | ) | |||||||||
|
Investment in Prairie State Energy Campus
|
— | (40.9 | ) | — | (40.9 | ) | ||||||||||
|
Federal coal lease expenditures
|
— | (178.5 | ) | — | (178.5 | ) | ||||||||||
|
Proceeds from disposal of assets, net of notes receivable
|
— | 72.3 | 0.5 | 72.8 | ||||||||||||
|
Investments in equity affiliates and joint ventures
|
— | (2.6 | ) | — | (2.6 | ) | ||||||||||
|
Other, net
|
— | (5.7 | ) | (0.3 | ) | (6.0 | ) | |||||||||
|
Net cash used in continuing operations
|
— | (353.4 | ) | (65.9 | ) | (419.3 | ) | |||||||||
|
Net cash provided by (used in) discontinued operations
|
— | (0.4 | ) | 24.3 | 23.9 | |||||||||||
|
Net cash used in investing activities
|
— | (353.8 | ) | (41.6 | ) | (395.4 | ) | |||||||||
|
Cash Flows From Financing Activities
|
||||||||||||||||
|
Change in revolving line of credit
|
(97.7 | ) | — | — | (97.7 | ) | ||||||||||
|
Payments of long-term debt
|
(18.8 | ) | — | (13.9 | ) | (32.7 | ) | |||||||||
|
Common stock repurchase
|
(199.8 | ) | — | — | (199.8 | ) | ||||||||||
|
Dividends paid
|
(64.9 | ) | — | — | (64.9 | ) | ||||||||||
|
Repurchase of employee common stock relinquished for tax
withholding
|
(11.0 | ) | — | — | (11.0 | ) | ||||||||||
|
Proceeds from stock options exercised
|
14.1 | — | — | 14.1 | ||||||||||||
|
Acquisition of noncontrolling interests (Millennium Mine)
|
— | — | (110.1 | ) | (110.1 | ) | ||||||||||
|
Other, net
|
5.2 | — | (1.1 | ) | 4.1 | |||||||||||
|
Transactions with affiliates, net
|
592.9 | (93.9 | ) | (499.0 | ) | — | ||||||||||
|
Net cash provided by (used in) financing activities
|
220.0 | (93.9 | ) | (624.1 | ) | (498.0 | ) | |||||||||
|
Net change in cash and cash equivalents
|
154.2 | 0.6 | 249.6 | 404.4 | ||||||||||||
|
Cash and cash equivalents at beginning of year
|
7.0 | 3.9 | 34.4 | 45.3 | ||||||||||||
|
Cash and cash equivalents at end of year
|
$ | 161.2 | $ | 4.5 | $ | 284.0 | $ | 449.7 | ||||||||
F-68
Table of Contents
|
Balance at
|
Charged to
|
Balance
|
||||||||||||||||||
|
Beginning
|
Costs and
|
at End
|
||||||||||||||||||
| Description | of Period | Expenses | Deductions (1) | Other | of Period | |||||||||||||||
| (Dollars in millions) | ||||||||||||||||||||
|
Year ended December 31, 2010
|
||||||||||||||||||||
|
Reserves deducted from asset accounts:
|
||||||||||||||||||||
|
Advance royalty recoupment reserve
|
$ | 17.2 | $ | 1.9 | $ | (0.2 | ) | $ | 1.0 | (2) | $ | 19.9 | ||||||||
|
Reserve for materials and supplies
|
6.2 | 0.9 | (0.9 | ) | — | 6.2 | ||||||||||||||
|
Allowance for doubtful accounts
|
18.3 | 26.7 | (6.9 | ) | (7.8 | ) (3) | 30.3 | |||||||||||||
|
Year ended December 31, 2009
|
||||||||||||||||||||
|
Reserves deducted from asset accounts:
|
||||||||||||||||||||
|
Advance royalty recoupment reserve
|
$ | 17.2 | $ | 1.6 | $ | (2.2 | ) | $ | 0.6 | (2) | $ | 17.2 | ||||||||
|
Reserve for materials and supplies
|
4.9 | 3.6 | (2.3 | ) | — | 6.2 | ||||||||||||||
|
Allowance for doubtful accounts
|
24.8 | 7.7 | (3.6 | ) | (10.6 | ) (3) | 18.3 | |||||||||||||
|
Year ended December 31, 2008
|
||||||||||||||||||||
|
Reserves deducted from asset accounts:
|
||||||||||||||||||||
|
Advance royalty recoupment reserve
|
$ | 13.6 | $ | 4.0 | $ | (3.0 | ) | $ | 2.6 | (2) | $ | 17.2 | ||||||||
|
Reserve for materials and supplies
|
4.3 | 1.7 | (1.1 | ) | — | 4.9 | ||||||||||||||
|
Allowance for doubtful accounts
|
11.9 | 13.9 | (1.0 | ) | — | 24.8 | ||||||||||||||
| (1) | Reserves utilized, unless otherwise indicated. | |
| (2) | Balances transferred (to) from other accounts or reserves recorded as part of a property transaction or acquisition. | |
| (3) | Reflects subsequent recovery of amounts previously reserved. |
F-69
Table of Contents
| Exhibit No. | Description of Exhibit | |||
| 3 | .1 | Third Amended and Restated Certificate of Incorporation of the Registrant, as amended (Incorporated by reference to Exhibit 3.1 of the Registrant’s Quarterly Report on Form 10-Q for the quarter ended June 30, 2008). | ||
| 3 | .2 | Amended and Restated By-Laws of the Registrant (Incorporated by reference to Exhibit 3.1 of the Registrant’s Current Report on Form 8-K, filed September 16, 2008). | ||
| 4 | .1 | Rights Agreement, dated as of July 24, 2002, between the Registrant and EquiServe Trust Company, N.A., as Rights Agent (which includes the form of Certificate of Designations of Series A Junior Preferred Stock of the Registrant as Exhibit A, the form of Right Certificate as Exhibit B and the Summary of Rights to Purchase Preferred Shares as Exhibit C) (Incorporated herein by reference to Exhibit 4.1 to the Registrant’s Registration Statement on Form 8-A, filed July 24, 2002). | ||
| 4 | .2 | Certificate of Designations of Series A Junior Participating Preferred Stock of the Registrant, filed with the Secretary of State of the State of Delaware on July 24, 2002 (Incorporated herein by reference to Exhibit 3.1 to the Registrant’s Registration Statement on Form 8-A, filed July 24, 2002). | ||
| 4 | .3 | Certificate of Adjustment delivered by the Registrant to Equiserve Trust Company, N.A., as Rights Agent, on March 29, 2005 (Incorporated by reference to Exhibit 4.2 to Amendment No. 1 to the Registrant’s Registration Statement on Form 8-A/A, filed March 29, 2005). | ||
| 4 | .4 | Certificate of Adjustment delivered by the Registrant to American Stock Transfer & Trust Company, as Rights Agent, on February 22, 2006 (Incorporated by reference to Exhibit 4.2 to Amendment No. 2 to the Registrant’s Registration Statement on Form 8-A/A, filed February 22, 2006). | ||
| 4 | .5 | Specimen of stock certificate representing the Registrant’s common stock, $.01 par value (Incorporated by reference to Exhibit 4.13 to Amendment No. 4 to the Registrant’s Form S-1 Registration Statement No. 333-55412, filed May 1, 2001). | ||
| 4 | .6 | 5 7 / 8 % Senior Notes Due 2016 Indenture, dated as of March 19, 2004, between the Registrant and U.S. Bank National Association, as trustee (Incorporated by reference to Exhibit 4.12 of the Registrant’s Quarterly Report on Form 10-Q for the quarter ended March 31, 2004). | ||
| 4 | .7 | 5 7 / 8 % Senior Notes Due 2016 First Supplemental Indenture, dated as of March 23, 2004, between the Registrant and U.S. Bank National Association, as trustee (Incorporated by reference to Exhibit 4.1 of the Registrant’s Current Report on Form 8-K, filed March 25, 2004). | ||
| 4 | .8 | 5 7 / 8 % Senior Notes Due 2016 Second Supplemental Indenture, dated as of April 22, 2004, among the Registrant, the Guaranteeing Subsidiaries (as defined therein), and U.S. Bank National Association, as trustee (Incorporated by reference to Exhibit 10.58 of the Registrant’s Quarterly Report on Form 10-Q for the quarter ended June 30, 2004). | ||
| 4 | .9 | 5 7 / 8 % Senior Notes Due 2016 Third Supplemental Indenture, dated as of October 18, 2004, among the Registrant, the Guaranteeing Subsidiaries (as defined therein), and U.S. Bank National Association, as trustee (Incorporated by reference to Exhibit 4.13 of the Registrant’s Annual Report on Form 10-K for the year ended December 31, 2004). | ||
| 4 | .10 | 5 7 / 8 % Senior Notes Due 2016 Fourth Supplemental Indenture, dated as of January 20, 2005, among the Registrant, the Guaranteeing Subsidiaries (as defined therein), and U.S. Bank National Association, as trustee (Incorporated by reference to Exhibit 4.2 of the Registrant’s Quarterly Report on Form 10-Q for the quarter ended March 31, 2005). | ||
| 4 | .11 | 5 7 / 8 % Senior Notes Due 2016 Fifth Supplemental Indenture, dated as of September 30, 2005, among the Registrant, the Guaranteeing Subsidiaries (as defined therein), and U.S. Bank National Association, as trustee (Incorporated by reference to Exhibit 4.2 of the Registrant’s Quarterly Report on Form 10-Q for the quarter ended September 30, 2005). | ||
Table of Contents
| Exhibit No. | Description of Exhibit | |||
| 4 | .12 | 5 7 / 8 % Senior Notes Due 2016 Sixth Supplemental Indenture, dated as of January 20, 2006, among the Registrant, the Guaranteeing Subsidiaries (as defined therein), and U.S. Bank National Association, as trustee (Incorporated by reference to Exhibit 4.21 of the Registrant’s Annual Report on Form 10-K for the year ended December 31, 2005). | ||
| 4 | .13 | 5 7 / 8 % Senior Notes Due 2016 Seventh Supplemental Indenture, dated as of June 13, 2006, among the Registrant, the Guaranteeing Subsidiaries (as defined therein), and U.S. Bank National Association, as trustee (Incorporated by reference to Exhibit 4.3 of the Registrant’s Quarterly Report on Form 10-Q for the quarter ended June 30, 2006). | ||
| 4 | .14 | 5 7 / 8 % Senior Notes Due 2016 Eighth Supplemental Indenture, dated as of June 30, 2006, among the Registrant, the Guaranteeing Subsidiaries (as defined therein), and U.S. Bank National Association, as trustee (Incorporated by reference to Exhibit 4.4 of the Registrant’s Quarterly Report on Form 10-Q for the quarter ended June 30, 2006). | ||
| 4 | .15 | 5 7 / 8 % Senior Notes Due 2016 Ninth Supplemental Indenture, dated as of September 29, 2006, among the Registrant, the Guaranteeing Subsidiaries (as defined therein), and U.S. Bank National Association, as trustee (Incorporated by reference to Exhibit 4.1 of the Registrant’s Quarterly Report on Form 10-Q for the quarter ended September 30, 2006). | ||
| 4 | .16 | 5 7 / 8 % Senior Notes Due 2016 Twelfth Supplemental Indenture, dated as of November 10, 2006, among the Registrant, the Guaranteeing Subsidiaries (as defined therein), and U.S. Bank National Association, as trustee. (Incorporated by reference to Exhibit 4.30 of the Registrant’s Annual Report on Form 10-K for the year ended December 31, 2006). | ||
| 4 | .17 | 5 7 / 8 % Senior Notes Due 2016 Fifteenth Supplemental Indenture, dated as of January 31, 2007, among the Registrant, the Guaranteeing Subsidiaries (as defined therein), and U.S. Bank National Association, as trustee. (Incorporated by reference to Exhibit 4.31 of the Registrant’s Annual Report on Form 10-K for the year ended December 31, 2006). | ||
| 4 | .18 | 5 7 / 8 % Senior Notes Due 2016 Eighteenth Supplemental Indenture, dated as of June 14, 2007, among the Registrant, the Guaranteeing Subsidiaries (as defined therein), and U.S. Bank National Association, as trustee (Incorporated by reference to Exhibit 4.2 of the Registrant’s Quarterly Report on Form 10-Q for the quarter ended June 30, 2007). | ||
| 4 | .19 | 5 7 / 8 % Senior Notes Due 2016 Twenty-First Supplemental Indenture, dated as of November 14, 2007, among the Registrant, the Guaranteeing Subsidiaries (as defined therein), and U.S. Bank National Association, as trustee (Incorporated by reference to Exhibit 4.35 of the Registrant’s Annual Report on Form 10-K for the year ended December 31, 2007). | ||
| 4 | .20 | 5 7 / 8 % Senior Notes Due 2016 Thirtieth Supplemental Indenture, dated as of March 13, 2009, among the Registrant, the Guaranteeing Subsidiaries (as defined therein), and U.S. Bank National Association, as trustee (Incorporated by reference to Exhibit 4.1 of the Registrant’s Quarterly Report on Form 10-Q for the quarter ended March 31, 2009). | ||
| 4 | .21 | 7 3 / 8 % Senior Notes Due 2016 Tenth Supplemental Indenture, dated as of October 12, 2006 among the Registrant, the Guaranteeing Subsidiaries (as defined therein), and U.S. Bank National Association, as trustee (Incorporated by reference to Exhibit 4.1 of the Registrant’s Current Report on Form 8-K, filed October 13, 2006). | ||
| 4 | .22 | 7 3 / 8 % Senior Notes Due 2016 Thirteenth Supplemental Indenture, dated as of November 10, 2006 among the Registrant, the Guaranteeing Subsidiaries (as defined therein), and U.S. Bank National Association, as trustee (Incorporated by reference to Exhibit 4.33 of the Registrant’s Annual Report on Form 10-K for the year ended December 31, 2006). | ||
| 4 | .23 | 7 3 / 8 % Senior Notes Due 2016 Sixteenth Supplemental Indenture, dated as of January 31, 2007, among the Registrant, the Guaranteeing Subsidiaries (as defined therein), and U.S. Bank National Association, as trustee (Incorporated by reference to Exhibit 4.34 of the Registrant’s Annual Report on Form 10-K for the year ended December 31, 2006). | ||
| 4 | .24 | 7 3 / 8 % Senior Notes Due 2016 Nineteenth Supplemental Indenture, dated as of June 14, 2007, among the Registrant, the Guaranteeing Subsidiaries (as defined therein), and U.S. Bank National Association, as trustee (Incorporated by reference to Exhibit 4.3 of the Registrant’s Quarterly Report on Form 10-Q for the quarter ended June 30, 2007). | ||
Table of Contents
| Exhibit No. | Description of Exhibit | |||
| 4 | .25 | 7 3 / 8 % Senior Notes Due 2016 Thirty-First Supplemental Indenture, dated as of March 13, 2009, among the Registrant, the Guaranteeing Subsidiaries (as defined therein), and U.S. Bank National Association, as trustee (Incorporated by reference to Exhibit 4.2 of the Registrant’s Quarterly Report on Form 10-Q for the quarter ended March 31, 2009). | ||
| 4 | .26 | 7 3 / 8 % Senior Notes Due 2016 Twenty-Second Supplemental Indenture, dated as of November 14, 2007, among the Registrant, the Guaranteeing Subsidiaries (as defined therein), and U.S. Bank National Association, as trustee (Incorporated by reference to Exhibit 4.40 of the Registrant’s Annual Report on Form 10-K for the year ended December 31, 2007). | ||
| 4 | .27 | 7 7 / 8 % Senior Notes Due 2026 Eleventh Supplemental Indenture, dated as of October 12, 2006, among the Registrant, the Guaranteeing Subsidiaries (as defined therein), and U.S. Bank National Association, as trustee (Incorporated by reference to Exhibit 4.2 of the Registrant’s Current Report on Form 8-K, filed October 13, 2006). | ||
| 4 | .28 | 7 7 / 8 % Senior Notes Due 2026 Fourteenth Supplemental Indenture, dated as of November 10, 2006, among the Registrant, the Guaranteeing Subsidiaries (as defined therein), and U.S. Bank National Association, as trustee (Incorporated by reference to Exhibit 4.36 of the Registrant’s Annual Report on Form 10-K for the year ended December 31, 2006). | ||
| 4 | .29 | 7 7 / 8 % Senior Notes Due 2026 Seventeenth Supplemental Indenture, dated as of January 31, 2007, among the Registrant, the Guaranteeing Subsidiaries (as defined therein), and U.S. Bank National Association, as trustee (Incorporated by reference to Exhibit 4.37 of the Registrant’s Annual Report on Form 10-K for the year ended December 31, 2006). | ||
| 4 | .30 | 7 7 / 8 % Senior Notes Due 2026 Twentieth Supplemental Indenture, dated as of June 14, 2007, among the Registrant, the Guaranteeing Subsidiaries (as defined therein), and U.S. Bank National Association, as trustee (Incorporated by reference to Exhibit 4.4 of the Registrant’s Quarterly Report on Form 10-Q for the quarter ended June 30, 2007). | ||
| 4 | .31 | 7 7 / 8 % Senior Notes Due 2026 Twenty-Third Supplemental Indenture, dated as of November 14, 2007, among the Registrant, the Guaranteeing Subsidiaries (as defined therein), and U.S. Bank National Association, as trustee (Incorporated by reference to Exhibit 4.45 of the Registrant’s Annual Report on Form 10-K for the year ended December 31, 2007). | ||
| 4 | .32 | 7 7 / 8 % Senior Notes Due 2026 Thirty-Second Supplemental Indenture, dated as of March 13, 2009, among the Registrant, the Guaranteeing Subsidiaries (as defined therein), and U.S. Bank National Association, as trustee (Incorporated by reference to Exhibit 4.3 of the Registrant’s Quarterly Report on Form 10-Q for the quarter ended March 31, 2009). | ||
| 4 | .33 | Thirty-Third Supplemental Indenture, dated as of August 25, 2010, among Peabody Energy Corporation, the guarantors named therein and U.S. Bank National Association, as trustee, relating to the 6.500% Senior Notes due 2020 (Incorporated by reference to Exhibit 4.1 of the Registrant’s Current Report on Form 8-K filed on August 27, 2010). | ||
| 4 | .34 | Subordinated Indenture, dated as of December 20, 2006, between the Registrant and U.S. Bank National Association, as trustee (Incorporated by reference to Exhibit 4.1 of the Registrant’s Current Report on Form 8-K, filed December 20, 2006). | ||
| 4 | .35 | 4.75% Convertible Junior Subordinated Debentures Due 2066 First Supplemental Indenture, dated as December 20, 2006, among the Registrant and U.S. Bank National Association, as trustee (Incorporated by reference to Exhibit 4.2 of the Registrant’s Current Report on Form 8-K, filed December 20, 2006). | ||
| 4 | .36 | Capital Replacement Covenant dated December 19, 2006 (Incorporated by reference to Exhibit 99.1 of the Registrant’s Current Report on Form 8-K, filed December 20, 2006). | ||
| 4 | .37 | Notice of Adjustment of Conversion Rate of 4.75% Convertible Junior Subordinated Debentures Due 2066, dated November 26, 2007 (Incorporated by reference to Exhibit 4.49 of the Registrant’s Annual Report on Form 10-K for the year ended December 31, 2007). | ||
| 4 | .38 | Notice of Adjustment of Conversion Rate of 4.75% Convertible Junior Subordinated Debentures Due 2066, dated February 8, 2009 (Incorporated by reference to Exhibit 4.5 of the Registrant’s Quarterly Report on Form 10-Q for the quarter ended March 31, 2009). | ||
| 4 | .39 | Notice of Adjustment of Conversion Rate of 4.75% Convertible Junior Subordinated Debentures due 2066, dated February 8, 2010 (Incorporated by reference to Exhibit 4.1 of the Registrant’s Quarterly Report on Form 10-Q for the quarter ended March 31, 2010). | ||
Table of Contents
| Exhibit No. | Description of Exhibit | |||
| 10 | .1 | Credit Agreement, dated as of June 18, 2010, by and among the Company, Bank of America, N.A., as administrative agent, swing line lender and L/C issuer, and Banc of America Securities LLC, Citigroup Global Markets, Inc. and HSBC Securities (USA) Inc., as joint lead arrangers and joint book managers, and the lenders named therein (Incorporated by reference to Exhibit 10.1 of the Registrant’s Current Report on Form 8-K filed on June 24, 2010). | ||
| 10 | .2 | Federal Coal Lease WYW0321779: North Antelope/Rochelle Mine (Incorporated by reference to Exhibit 10.3 of the Registrant’s Form S-4 Registration Statement No. 333-59073). | ||
| 10 | .3 | Federal Coal Lease WYW119554: North Antelope/Rochelle Mine (Incorporated by reference to Exhibit 10.4 of the Registrant’s Form S-4 Registration Statement No. 333-59073, filed July 14, 1998). | ||
| 10 | .4 | Federal Coal Lease WYW5036: Rawhide Mine (Incorporated by reference to Exhibit 10.5 of the Registrant’s Form S-4 Registration Statement No. 333-59073, filed July 14, 1998). | ||
| 10 | .5 | Federal Coal Lease WYW3397: Caballo Mine (Incorporated by reference to Exhibit 10.6 of the Registrant’s Form S-4 Registration Statement No. 333-59073, filed July 14, 1998). | ||
| 10 | .6 | Federal Coal Lease WYW83394: Caballo Mine (Incorporated by reference to Exhibit 10.7 of the Registrant’s Form S-4 Registration Statement No. 333-59073, filed July 14, 1998). | ||
| 10 | .7 | Federal Coal Lease WYW136142 (Incorporated by reference to Exhibit 10.8 of Amendment No. 1 to the Registrant’s Form S-4 Registration Statement No. 333-59073, filed September 8, 1998). | ||
| 10 | .8 | Royalty Prepayment Agreement by and among Peabody Natural Resources Company, Gallo Finance Company and Chaco Energy Company, dated September 30, 1998 (Incorporated by reference to Exhibit 10.9 of the Registrant’s Quarterly Report on Form 10-Q for the quarter ended September 30, 1998). | ||
| 10 | .9 | Federal Coal Lease WYW154001: North Antelope Rochelle South (Incorporated by reference to Exhibit 10.68 of the Registrant’s Quarterly Report on Form 10-Q for the quarter ended September 30, 2004). | ||
| 10 | .10 | Federal Coal Lease WYW150210: North Antelope Rochelle Mine (Incorporated by reference to Exhibit 10.8 of the Registrant’s Quarterly Report on Form 10-Q for the quarter ended March 31, 2005). | ||
| 10 | .11 | Federal Coal Lease WYW151134 effective May 1, 2005: West Roundup (Incorporated by reference to Exhibit 10.1 of the Registrant’s Quarterly Report on Form 10-Q for the quarter ended June 30, 2005). | ||
| 10 | .12 | Separation Agreement, Plan of Reorganization and Distribution, dated October 22, 2007, between the Registrant and Patriot Coal Corporation (Incorporated by reference to Exhibit 10.1 of the Registrant’s Current Report on Form 8-K, filed October 25, 2007). | ||
| 10 | .13 | Tax Separation Agreement, dated October 22, 2007, between the Registrant and Patriot Coal Corporation (Incorporated by reference to Exhibit 10.2 of the Registrant’s Current Report on Form 8-K, filed October 25, 2007). | ||
| 10 | .14 | Coal Act Liabilities Assumption Agreement, dated October 22, 2007, among Patriot Coal Corporation, Peabody Holding Company, LLC and the Registrant (Incorporated by reference to Exhibit 10.3 of the Registrant’s Current Report on Form 8-K, filed October 25, 2007). | ||
| 10 | .15 | NBCWA Liabilities Assumption Agreement, dated October 22, 2007, among Patriot Coal Corporation, Peabody Holding Company, LLC, Peabody Coal Company, LLC and the Registrant (Incorporated by reference to Exhibit 10.4 of the Registrant’s Current Report on Form 8-K, filed October 25, 2007). | ||
| 10 | .16 | Salaried Employee Liabilities Assumption Agreement, dated October 22, 2007, among Patriot Coal Corporation, Peabody Holding Company, LLC, Peabody Coal Company, LLC and the Registrant (Incorporated by reference to Exhibit 10.5 of the Registrant’s Current Report on Form 8-K, filed October 25, 2007). | ||
| 10 | .17 | Coal Supply Agreement, dated October 22, 2007, between Patriot Coal Sales LLC and COALSALES II, LLC (Incorporated by reference to Exhibit 10.6 of the Registrant’s Current Report on Form 8-K, filed October 25, 2007). | ||
Table of Contents
| Exhibit No. | Description of Exhibit | |||
| 10 | .18* | 1998 Stock Purchase and Option Plan for Key Employees of the Registrant (Incorporated by reference to Exhibit 4.9 of the Registrant’s Form S-8 Registration Statement No. 333-105456, filed May 21, 2003). | ||
| 10 | .19* | Amendment to the 1998 Stock Purchase and Option Plan for Key Employees of the Registrant (Incorporated by reference to Exhibit 10.4 of the Registrant’s Current Report on Form 8-K, filed October 17, 2007). | ||
| 10 | .20* | Amendment No. 2 to the 1998 Stock Purchase and Option Plan for Key Employees of the Registrant (Incorporated by reference to Exhibit 10.2 of the Registrant’s Current Report on Form 8-K, filed December 11, 2007). | ||
| 10 | .21* | Form of Non-Qualified Stock Option Agreement under the Registrant’s 1998 Stock Purchase and Option Plan for Key Employees (Incorporated by reference to Exhibit 10.15 of the Registrant’s Annual Report on Form 10-K for the year ended December 31, 2003). | ||
| 10 | .22* | Form of Amendment to Non-Qualified Stock Option Agreement under the Registrant’s 1998 Stock Purchase and Option Plan for Key Employees (Incorporated by reference to Exhibit 10.16 of the Registrant’s Annual Report on Form 10-K for the year ended December 31, 2003). | ||
| 10 | .23* | Form of Amendment, dated as of June 15, 2004, to Non-Qualified Stock Option Agreement under the Registrant’s 1998 Stock Purchase and Option Plan for Key Employees (Incorporated by reference to Exhibit 10.65 of the Registrant’s Quarterly Report on Form 10-Q for the quarter ended June 30, 2004). | ||
| 10 | .24* | Form of Incentive Stock Option Agreement under the Registrant’s 1998 Stock Purchase and Option Plan for Key Employees (Incorporated by reference to Exhibit 10.17 of the Registrant’s Annual Report on Form 10-K for the year ended December 31, 2003). | ||
| 10 | .25* | Long-Term Equity Incentive Plan of the Registrant (Incorporated by reference to Exhibit 99.2 of the Registrant’s Form S-8 Registration Statement No. 333-61406, filed May 22, 2001). | ||
| 10 | .26* | Amendment to the Registrant’s 2001 Long-Term Equity Incentive Plan (Incorporated by reference to Exhibit 10.3 of the Registrant’s Current Report on Form 8-K, filed October 17, 2007). | ||
| 10 | .27* | The Registrant’s 2004 Long-Term Equity Incentive Plan (Incorporated by reference to Annex A to the Registrant’s Proxy Statement for the 2004 Annual Meeting of Stockholders, filed April 2, 2004). | ||
| 10 | .28* | Amendment No. 1 to the Registrant’s 2004 Long Term Equity Incentive Plan (Incorporated by reference to Exhibit 10.67 of the Registrant’s Quarterly Report on Form 10-Q for the quarter ended September 30, 2004). | ||
| 10 | .29* | Amendment No. 2 to the Registrant’s 2004 Long-Term Equity Incentive Plan (Incorporated by reference to Exhibit 10.1 of the Registrant’s Current Report on Form 8-K, filed October 17, 2007). | ||
| 10 | .30* | Amendment No. 3 to the Registrant’s 2004 Long-Term Equity Incentive Plan (Incorporated by reference to Exhibit 10.2 of the Registrant’s Current Report on Form 8-K, filed October 17, 2007). | ||
| 10 | .31* | Amendment No. 4 to the Registrant’s 2004 Long-Term Equity Incentive Plan (Incorporated by reference to Exhibit 10.1 of the Registrant’s Current Report on Form 8-K, filed December 11, 2007). | ||
| 10 | .32* | Form of Non-Qualified Stock Option Agreement under the Registrant’s 2004 Long-Term Equity Incentive Plan (Incorporated by reference to Exhibit 10.1 to the Registrant’s Current Report on Form 8-K, filed January 7, 2005). | ||
| 10 | .33* | Form of Performance Units Agreement under the Registrant’s 2004 Long-Term Equity Incentive Plan (Incorporated by reference to Exhibit 10.2 of the Registrant’s Current Report on Form 8-K, filed January 7, 2005). | ||
| 10 | .34* | Form of Performance Units Agreement under the Registrant’s 2004 Long-Term Equity Incentive Plan. (Incorporated by reference to Exhibit 10.36 of the Registrant’s Annual Report on Form 10-K for the year ended December 31, 2007). | ||
| 10 | .35* | Equity Incentive Plan for Non-Employee Directors of the Registrant (Incorporated by reference to Exhibit 99.3 of the Registrant’s Form S-8 Registration Statement No. 333-61406, filed May 22, 2001). | ||
Table of Contents
| Exhibit No. | Description of Exhibit | |||
| 10 | .36* | Form of Non-Qualified Stock Option Agreement for Outside Directors under the Registrant’s Long-Term Equity Incentive Plan (Incorporated by reference to Exhibit 10.1 to the Registrant’s Current Report on Form 8-K, filed December 14, 2005). | ||
| 10 | .37* | Form of Non-Qualified Stock Option Agreement under the Registrant’s Long-Term Equity Incentive Plan (Incorporated by reference to Exhibit 10.18 of the Registrant’s Annual Report on Form 10-K for the year ended December 31, 2003). | ||
| 10 | .38* | Form of Performance Unit Award Agreement under the Registrant’s Long-Term Equity Incentive Plan (Incorporated by reference to Exhibit 10.19 of the Registrant’s Annual Report on Form 10-K for the year ended December 31, 2003). | ||
| 10 | .39* | Form of Non-Qualified Stock Option Agreement under the Registrant’s Equity Incentive Plan for Non-Employee Directors (Incorporated by reference to Exhibit 10.20 of the Registrant’s Annual Report on Form 10-K for the year ended December 31, 2003). | ||
| 10 | .40* | Form of Restricted Stock Agreement under the Registrant’s Equity Incentive Plan for Non-Employee Directors (Incorporated by reference to Exhibit 10.21 of the Registrant’s Annual Report on Form 10-K for the year ended December 31, 2003). | ||
| 10 | .41* | Form of Restricted Stock Award Agreement for Outside Directors under the Registrant’s Long-Term Equity Incentive Plan (Incorporated by reference to Exhibit 10.2 to the Registrant’s Current Report on Form 8-K, filed December 14, 2005). | ||
| 10 | .42* | Form of Performance Unit Award Agreement under the Registrant’s 2004 Long-Term Equity Incentive Plan (Incorporated by reference to Exhibit 10.2 of the Registrant’s Quarterly Report on Form 10-Q for the quarter ended June 30, 2009). | ||
| 10 | .43*† | Form of Deferred Stock Units Agreement for Non-Employee Directors. | ||
| 10 | .44* | 2009 Amendment entered into effective December 31, 2009 to the Stock Grant Agreement dated as of October 1, 2003 between the Registrant and Gregory H. Boyce (Incorporated by reference to Exhibit 10.45 of the Registrant’s Annual Report on Form 10-K for the year ended December 31, 2009). | ||
| 10 | .45* | 2009 Amendment entered into effective December 31, 2009 to the Non-Qualified Stock Option Agreement dated January 2, 2008 between the Registrant and Gregory H. Boyce (Incorporated by reference to Exhibit 10.46 of the Registrant’s Annual Report on Form 10-K for the year ended December 31, 2009). | ||
| 10 | .46* | 2009 Amendment entered into effective December 31, 2009 to the Non-Qualified Stock Option Agreement dated January 5, 2009 between the Registrant and Gregory H. Boyce (Incorporated by reference to Exhibit 10.47 of the Registrant’s Annual Report on Form 10-K for the year ended December 31, 2009). | ||
| 10 | .47* | 2009 Amendment entered into effective December 31, 2009 to the Performance Units Agreement dated January 2, 2008 between the Registrant and Gregory H. Boyce (Incorporated by reference to Exhibit 10.48 of the Registrant’s Annual Report on Form 10-K for the year ended December 31, 2009). | ||
| 10 | .48* | 2009 Amendment entered into effective December 31, 2009 to the Performance Units Agreement dated January 5, 2009 between the Registrant and Gregory H. Boyce (Incorporated by reference to Exhibit 10.49 of the Registrant’s Annual Report on Form 10-K for the year ended December 31, 2009). | ||
| 10 | .49* | 2010 Amendment entered into effective March 17, 2010, to the 2008 Performance Units Award Agreement dated January 2, 2008 between the Registrant and Gregory H. Boyce (Incorporated by reference to Exhibit 10.3 of the Registrant’s Quarterly Report on Form 10-Q for the quarter ended March 31, 2010). | ||
| 10 | .50* | 2010 Amendment entered into effective March 17, 2010, to the 2009 Performance Units Award Agreement dated January 5, 2009 between the Registrant and Gregory H. Boyce (Incorporated by reference to Exhibit 10.4 of the Registrant’s Quarterly Report on Form 10-Q for the quarter ended March 31, 2010). | ||
| 10 | .51* | Amended and Restated Employee Stock Purchase Plan of the Registrant (Incorporated by reference to Exhibit 10.44 of the Registrant’s Annual Report on Form 10-K for the year ended December 31, 2008). | ||
Table of Contents
| Exhibit No. | Description of Exhibit | |||
| 10 | .52* | Amendment to the Amended and Restated Employee Stock Purchase Plan of the Registrant (Incorporated by reference to Exhibit 10.51 of the Registrant’s Annual Report on Form 10-K for the year ended December 31, 2009). | ||
| 10 | .53* | Amended and Restated Australian Employee Stock Purchase Plan of the Registrant (Incorporated by reference to Exhibit 10.45 of the Registrant’s Annual Report on Form 10-K for the year ended December 31, 2008). | ||
| 10 | .54* | Amendment to the Amended and Restated Australian Employee Stock Purchase Plan of the Registrant (Incorporated by reference to Exhibit 10.53 of the Registrant’s Annual Report on Form 10-K for the year ended December 31, 2009). | ||
| 10 | .55* | Management Annual Incentive Compensation Plan (Incorporated by reference to Exhibit 10.61 of the Registrant’s Annual Report on Form 10-K for the year ended December 31, 2007). | ||
| 10 | .56* | 2008 Management Annual Incentive Compensation Plan (Incorporated by reference to Appendix B to the Registrant’s Proxy Statement for the 2008 Annual Meeting of Shareholders, filed March 27, 2008). | ||
| 10 | .57* | The Registrant’s Deferred Compensation Plan (Incorporated by reference to Exhibit 10.30 of the Registrant’s Quarterly Report on Form 10-Q for the quarter ended September 30, 2001). | ||
| 10 | .58* | First Amendment to the Registrant’s Deferred Compensation Plan (Incorporated by reference to Exhibit 10.49 of the Registrant’s Annual Report on Form 10-K for the year ended December 31, 2004). | ||
| 10 | .59* | Letter Agreement, dated as of March 1, 2005, by and between the Registrant and Gregory H. Boyce (Incorporated by reference to Exhibit 10.1 of the Registrant’s Current Report on Form 8-K, filed March 4, 2005). | ||
| 10 | .60* | Restated Employment Agreement effective December 31, 2009 by and between the Registrant and Gregory H. Boyce (Incorporated by reference to Exhibit 10.1 of the Registrant’s Current Report on Form 8-K, filed December 24, 2009). | ||
| 10 | .61* | Restated Employment Agreement entered into as of December 31, 2008 by and between the Registrant and Richard A. Navarre (Incorporated by reference to Exhibit 10.2 of the Registrant’s Current Report on Form 8-K, filed December 31, 2008). | ||
| 10 | .62* | Employment Agreement entered into as of December 31, 2008 by and between the Registrant and Michael C. Crews (Incorporated by reference to Exhibit 10.3 of the Registrant’s Current Report on Form 8-K, filed December 31, 2008). | ||
| 10 | .63* | Restated Employment Agreement entered into as of December 31, 2008 by and between the Registrant and Sharon D. Fiehler (Incorporated by reference to Exhibit 10.4 of the Registrant’s Current Report on Form 8-K, filed December 31, 2008). | ||
| 10 | .64* | Letter Agreement, dated as of December 22, 2006, by and between the Registrant and Eric Ford (Incorporated by reference to Exhibit 10.1 of the Registrant’s Current Report on Form 8-K, filed December 29, 2006). | ||
| 10 | .65* | Form of Restricted Stock Agreement -- Exhibit A (Incorporated by reference to Exhibit 10.3 of the Registrant’s Current Report on Form 8-K, filed December 29, 2006). | ||
| 10 | .66* | Form of Restricted Stock Agreement -- Exhibit B (Incorporated by reference to Exhibit 10.4 of the Registrant’s Current Report on Form 8-K, filed December 29, 2006). | ||
| 10 | .67* | Restated Employment Agreement entered into as of December 31, 2008 by and between the Registrant and Eric Ford (Incorporated by reference to Exhibit 10.5 of the Registrant’s Current Report on Form 8-K, filed December 31, 2008). | ||
| 10 | .68* | Restated Employment Agreement entered into as of December 31, 2008 by and between the Registrant and Alexander C. Schoch (Incorporated by Reference to Exhibit 10.59 of the Registrant’s Annual Report on Form 10-K for the year ended December 31, 2008). | ||
| 10 | .69* | Indemnification Agreement, dated as of December 5, 2002, by and between Registrant and William E. James (Incorporated by reference to Exhibit 10.34 of the Registrant’s Annual Report on Form 10-K for the year ended December 31, 2002). | ||
| 10 | .70* | Indemnification Agreement dated as of December 5, 2002, by and between Registrant and Henry E. Lentz (Incorporated by reference to Exhibit 10.35 of the Registrant’s Annual Report on Form 10-K for the year ended December 31, 2002). | ||
Table of Contents
| Exhibit No. | Description of Exhibit | |||
| 10 | .71* | Indemnification Agreement dated as of December 5, 2002, by and between Registrant and William C. Rusnack (Incorporated by reference to Exhibit 10.36 of the Registrant’s Annual Report on Form 10-K for the year ended December 31, 2002). | ||
| 10 | .72* | Indemnification Agreement dated as of December 5, 2002, by and between Registrant and Alan H. Washkowitz (Incorporated by reference to Exhibit 10.39 of the Registrant’s Annual Report on Form 10-K for the year ended December 31, 2002). | ||
| 10 | .73* | Indemnification Agreement dated as of December 5, 2002, by and between Registrant and Richard A. Navarre (Incorporated by reference to Exhibit 10.40 of the Registrant’s Annual Report on Form 10-K for the year ended December 31, 2002). | ||
| 10 | .74* | Indemnification Agreement dated as of January 16, 2003, by and between Registrant and Robert B. Karn III (Incorporated by reference to Exhibit 10.41 of the Registrant’s Annual Report on Form 10-K for the year ended December 31, 2002). | ||
| 10 | .75* | Indemnification Agreement dated as of January 16, 2003, by and between Registrant and Sandra A. Van Trease (Incorporated by reference to Exhibit 10.42 of the Registrant’s Annual Report on Form 10-K for the year ended December 31, 2002). | ||
| 10 | .76* | Indemnification Agreement dated as of March 22, 2004, by and between Registrant and William A. Coley (Incorporated by reference to Exhibit 10.53 of the Registrant’s Quarterly Report on Form 10-Q for the quarter ended March 31, 2004). | ||
| 10 | .77* | Indemnification Agreement dated as of April 8, 2005, by and between the Registrant and Gregory H. Boyce (Incorporated by reference to Exhibit 10.1 of the Registrant’s Current Report on Form 8-K, filed April 14, 2005). | ||
| 10 | .78* | Indemnification Agreement dated July 21, 2005, by and between the Registrant and John F. Turner (Incorporated by reference to Exhibit 10.1 of the Registrant’s Current Report on Form 8-K, filed August 5, 2005). | ||
| 10 | .79* | Indemnification Agreement dated as of March 2, 2009 by and between the Registrant and M. Frances Keeth (Incorporated by reference to Exhibit 10.1 of the Registrant’s Current Report on Form 8-K filed on March 2, 2009). | ||
| 10 | .80* | Indemnification Agreement dated as of July 23, 2009 by and between Peabody Energy Corporation and Robert A. Malone (Incorporated by reference to Exhibit 10.1 of the Registrant’s Current Report on Form 8-K filed on July 23, 2009). | ||
| 10 | .81* | Indemnification Agreement dated as of June 19, 2008, by and between the Registrant and Michael C. Crews (Incorporated by reference to Exhibit 10.1 of the Registrant’s Current Report on Form 8-K, filed July 29, 2008). | ||
| 10 | .82* | Indemnification Agreement dated as of October 22, 2008, by and between the Registrant and Sharon D. Fiehler (Incorporated by reference to Exhibit 10.72 of the Registrant’s Annual Report on Form 10-K for the year ended December 31, 2008). | ||
| 10 | .83* | Indemnification Agreement dated as of October 22, 2008, by and between the Registrant and Eric Ford (Incorporated by reference to Exhibit 10.73 of the Registrant’s Annual Report on Form 10-K for the year ended December 31, 2008). | ||
| 10 | .84* | Indemnification Agreement dated as of October 22, 2008, by and between the Registrant and Alexander C. Schoch (Incorporated by reference to Exhibit 10.74 of the Registrant’s Annual Report on Form 10-K for the year ended December 31, 2008). | ||
| 10 | .85* | Peabody Investments Corp. Supplemental Employee Retirement Account (Incorporated by reference to Exhibit 10.1 of the Registrant’s Quarterly Report on Form 10-Q for the quarter ended June 30, 2007). | ||
| 10 | .86 | Third Amended and Restated Receivables Purchase Agreement, dated as of January 25, 2010, by and among P&L Receivables Company, LLC, Peabody Energy Corporation, the various Sub-Servicers listed on the signature pages thereto, all Conduit Purchasers listed on the signature pages thereto, all Related Committed Purchasers listed on the signature pages thereto, all Purchaser Agents listed on the signature pages thereto, all LC Participants listed on the signature pages thereto, and PNC Bank, National Association, as Administrator and as LC Bank (Incorporated by reference to Exhibit 10.1 of the Registrant’s Current Report on Form 8-K filed on January 27, 2010). | ||
Table of Contents
| Exhibit No. | Description of Exhibit | |||
| 10 | .87 | First Amendment to Third Amended and Restated Receivables Purchase Agreement, dated as of March 1, 2010, by and among P&L Receivables Company, LLC, Peabody Energy Corporation, the various Sub-Servicers listed on the signature pages thereto, all Conduit Purchasers listed on the signature pages thereto, all Related Committed Purchasers listed on the signature pages thereto, all Purchaser Agents listed on the signature pages thereto, all LC Participants listed on the signature pages thereto, and PNC Bank, National Association, as Administrator and as LC Bank (Incorporated by reference to Exhibit 10.2 of the Registrant’s Quarterly Report on Form 10-Q for the quarter ended March 31, 2010). | ||
| 10 | .88 | Second Amendment to Third Amended and Restated Receivables Purchase Agreement, dated as of May 11, 2010, by and among P&L Receivables Company, LLC, Peabody Energy Corporation, the various Sub-Servicers listed on the signature pages thereto, all Conduit Purchasers listed on the signature pages thereto, all Related Committed Purchasers listed on the signature pages thereto, all Purchaser Agents listed on the signature pages thereto, all LC Participants listed on the signature pages thereto, and PNC Bank, National Association, as Administrator and as LC Bank (Incorporated by reference to Exhibit 10.1 of the Registrant’s Current Report on Form 8-K filed on May 17, 2010). | ||
| 10 | .89 | Third Amendment to Third Amended and Restated Receivables Purchase Agreement, dated as of September 16, 2010, by and among P&L Receivables Company, LLC, Peabody Energy Corporation, the various Sub-Servicers listed on the signature pages thereto, all Conduit Purchasers listed on the signature pages thereto, all Related Committed Purchasers listed on the signature pages thereto, all Purchaser Agents listed on the signature pages thereto, all LC Participants listed on the signature pages thereto, and PNC Bank, National Association, as Administrator and as LC Bank (Incorporated by reference to Exhibit 10.1 of the Registrant’s Quarterly Report on Form 10-Q for the quarter ended September 30, 2010). | ||
| 21 | † | List of Subsidiaries. | ||
| 23 | † | Consent of Ernst & Young LLP, Independent Registered Public Accounting Firm. | ||
| 31 | .1† | Certification of periodic financial report by the Registrant’s Chief Executive Officer pursuant to Rule 13a-14(a) under the Securities Exchange Act of 1934, as amended pursuant to Section 302 of the Sarbanes-Oxley Act of 2002. | ||
| 31 | .2† | Certification of periodic financial report by the Registrant’s Chief Financial Officer pursuant to Rule 13a-14(a) under the Securities Exchange Act of 1934, as amended pursuant to Section 302 of the Sarbanes-Oxley Act of 2002. | ||
| 32 | .1† | Certification of periodic financial report pursuant to 18 U.S.C. Section 1350, adopted pursuant to Section 906 of the Sarbanes-Oxley Act of 2002, by the Registrant’s Chief Executive Officer. | ||
| 32 | .2† | Certification of periodic financial report pursuant to 18 U.S.C. Section 1350, adopted pursuant to Section 906 of the Sarbanes-Oxley Act of 2002, by the Registrant’s Chief Financial Officer. | ||
| 101 | † | Interactive Data File (Form 10-K for the year ended December 31, 2010 furnished in XBRL). Users of this data are advised in accordance with Rule 406T of Regulation S-T promulgated by the Securities and Exchange Commission that this Interactive Data File is deemed not filed or part of a registration statement or prospectus for purposes of sections 11 or 12 of the Securities Act of 1933, is deemed not filed for purposes of section 18 of the Securities Exchange Act of 1934, and otherwise is not subject to liability under these sections. The financial information contained in the XBRL-related documents is “unaudited” and “unreviewed.” | ||
| * | These exhibits constitute all management contracts, compensatory plans and arrangements required to be filed as an exhibit to this form pursuant to Item 15(a)(3) and 15(b) of this report. | |
| † | Filed herewith. |