PEABODY ENERGY CORP
10-Ks and 10-Qs
|
|
|
|
|
|
|
|
|
|
|
|
|
|
|
|
|
|
|
|
|
|
|
|
|
|
|
|
|
|
|
|
|
|
|
|
|
|
|
|
|
|
|
|
|
|
|
|
|
|
|
|
|
UNITED STATES
SECURITIES AND EXCHANGE COMMISSION
Washington, D.C. 20549
_____________________________________________
FORM 10-K
|
þ
ANNUAL REPORT PURSUANT TO SECTION 13 OR 15(d) OF THE
SECURITIES EXCHANGE ACT OF 1934
|
|
For the Fiscal Year Ended December 31, 2013
|
|
or
|
|
¨
TRANSITION REPORT PURSUANT TO SECTION 13 OR 15(d) OF THE
SECURITIES EXCHANGE ACT OF 1934
|
Commission File Number 1-16463
____________________________________________

PEABODY ENERGY CORPORATION
(Exact name of registrant as specified in its charter)
|
Delaware
(State or other jurisdiction of incorporation or organization)
|
|
13-4004153
(I.R.S. Employer Identification No.)
|
|
701 Market Street, St. Louis, Missouri
(Address of principal executive offices)
|
|
63101
(Zip Code)
|
(314) 342-3400
Registrant’s telephone number, including area code
Securities Registered Pursuant to Section 12(b) of the Act:
|
Title of Each Class
|
|
Name of Each Exchange on Which Registered
|
|
Common Stock, par value $0.01 per share
|
|
New York Stock Exchange
|
None
Indicate by check mark if the registrant is a well-known seasoned issuer, as defined in Rule 405 of the Securities Act. Yes
þ
No
¨
Indicate by check mark if the registrant is not required to file reports pursuant to Section 13 or Section 15(d) of the Act. Yes
¨
No
þ
Indicate by check mark whether the registrant (1) has filed all reports required to be filed by Section 13 or 15(d) of the Securities Exchange Act of 1934 during the preceding 12 months (or for such shorter period that the registrant was required to file such reports) and (2) has been subject to such filing requirements for the past 90 days. Yes
þ
No
¨
Indicate by check mark whether the registrant has submitted electronically and posted on its corporate Web site, if any, every Interactive Data File required to be submitted and posted pursuant to Rule 405 of Regulation S-T (§ 232.405 of this chapter) during the preceding 12 months (or for such shorter period that the registrant was required to submit and post such files). Yes
þ
No
¨
Indicate by check mark if disclosure of delinquent filers pursuant to Item 405 of Regulation S-K (§ 229.405 of this chapter) is not contained herein, and will not be contained, to the best of registrant’s knowledge, in definitive proxy or information statements incorporated by reference in Part III of this Form 10-K or any amendment to this Form 10-K.
¨
Indicate by check mark whether the registrant is a large accelerated filer, an accelerated filer, a non-accelerated filer, or a smaller reporting company. See the definitions of “large accelerated filer,” “accelerated filer” and “smaller reporting company” in Rule 12b-2 of the Exchange Act. (Check one):
|
Large accelerated filer
þ
|
Accelerated filer
¨
|
Non-accelerated filer
¨
|
Smaller reporting company
¨
|
(Do not check if a smaller reporting company)
Indicate by check mark whether the registrant is a shell company (as defined in Rule 12b-2 of the Exchange Act). Yes
¨
No
þ
Aggregate market value of the voting stock held by non-affiliates (shareholders who are not directors or executive officers) of the Registrant, calculated using the closing price on
June 30, 2013
: Common Stock, par value $0.01 per share,
$3.9 billion
.
Number of shares outstanding of each of the Registrant’s classes of Common Stock, as of February 14, 2014: Common Stock, par value $0.01 per share,
271,298,814
shares outstanding.
DOCUMENTS INCORPORATED BY REFERENCE
Portions of the Company’s Proxy Statement to be filed with the Securities and Exchange Commission in connection with the Company’s
2014
Annual Meeting of Shareholders (the Company’s
2014
Proxy Statement) are incorporated by reference into Part III hereof. Other documents incorporated by reference in this report are listed in the Exhibit Index of this Form 10-K.
CAUTIONARY NOTICE REGARDING FORWARD-LOOKING STATEMENTS
This report includes statements of our expectations, intentions, plans and beliefs that constitute “forward-looking statements” within the meaning of Section 27A of the Securities Act of 1933 and Section 21E of the Securities Exchange Act of 1934 and are intended to come within the safe harbor protection provided by those sections. These statements relate to future events or our future financial performance, including, without limitation, the section captioned “Outlook” in Management’s Discussion and Analysis of Financial Condition and Results of Operations. We use words such as “anticipate,” “believe,” “expect,” “may,” "forecast," “project,” “should,” “estimate,” “plan,” "outlook" or other similar words to identify forward-looking statements.
Without limiting the foregoing, all statements relating to our future operating results, anticipated capital expenditures, future cash flows and borrowings and sources of funding are forward-looking statements and speak only as of the date of this report. These forward-looking statements are based on numerous assumptions that we believe are reasonable, but are subject to a wide range of uncertainties and business risks and actual results may differ materially from those discussed in these statements. Among the factors that could cause actual results to differ materially are:
|
•
|
global supply and demand for coal, including the seaborne thermal and metallurgical coal markets;
|
|
•
|
price volatility, particularly in higher-margin products and in our trading and brokerage businesses;
|
|
•
|
impact of alternative energy sources, including natural gas and renewables;
|
|
•
|
global steel demand and the downstream impact on metallurgical coal prices;
|
|
•
|
impact of weather and natural disasters on demand, production and transportation;
|
|
•
|
reductions and/or deferrals of purchases by major customers and ability to renew sales contracts;
|
|
•
|
credit and performance risks associated with customers, suppliers, contract miners, co-shippers and trading, banks and other financial counterparties;
|
|
•
|
geologic, equipment, permitting, site access, operational risks and new technologies related to mining;
|
|
•
|
transportation availability, performance and costs;
|
|
•
|
availability, timing of delivery and costs of key supplies, capital equipment or commodities such as diesel fuel, steel, explosives and tires;
|
|
•
|
impact of take-or-pay arrangements for rail and port commitments for the delivery of coal;
|
|
•
|
successful implementation of business strategies;
|
|
•
|
negotiation of labor contracts, employee relations and workforce availability;
|
|
•
|
changes in postretirement benefit and pension obligations and their related funding requirements;
|
|
•
|
replacement and development of coal reserves;
|
|
•
|
availability, access to and the related cost of capital and financial markets;
|
|
•
|
effects of changes in interest rates and currency exchange rates (primarily the Australian dollar);
|
|
•
|
effects of acquisitions or divestitures;
|
|
•
|
economic strength and political stability of countries in which we have operations or serve customers;
|
|
•
|
legislation, regulations and court decisions or other government actions, including, but not limited to, new environmental and mine safety requirements, changes in income tax regulations, sales-related royalties or other regulatory taxes and changes in derivatives laws and regulations;
|
|
•
|
litigation, including claims not yet asserted;
|
|
•
|
terrorist attacks or security threats;
|
|
•
|
impacts of pandemic illnesses; and
|
|
•
|
other factors, including those discussed in "Legal Proceedings," set forth in Part I, Item 3 of this report and "Risk Factors," set forth in Part I, Item 1A of this report.
|
When considering these forward-looking statements, you should keep in mind the cautionary statements in this document and in our other Securities and Exchange Commission (SEC) filings. These forward-looking statements speak only as of the date on which such statements were made, and we undertake no obligation to update these statements, except as required by the federal securities laws.
i
TABLE OF CONTENTS
|
|
|
Page
|
|
|
||
|
|
||
1
|
Note:
|
The words “we,” “our,” “Peabody” or “the Company” as used in this report, refer to Peabody Energy Corporation or its applicable subsidiary or subsidiaries. Unless otherwise noted herein, disclosures in this Annual Report on Form 10-K relate only to our continuing operations.
|
|
When used in this filing, the term "ton" refers to short or net tons, equal to 2,000 pounds (907.18 kilograms), while "tonne" refers to metric tons, equal to 2,204.62 pounds (1,000 kilograms).
|
|
Item 1.
Business.
Overview
Peabody Energy Corporation is the world’s largest private-sector coal company. We own interests in
28
active coal mining operations located in the United States (U.S.) and Australia. We have a majority interest in
27
of those coal operations and a 50% equity interest in the Middlemount Mine in Australia. In addition to our mining operations, we market and broker coal from our operations and other coal producers, both as principal and agent, and trade coal and freight-related contracts through trading and business offices in China, Australia, the United Kingdom, Germany, Singapore, India, Indonesia and the U.S.
History and Development
We were incorporated in Delaware in 1998 and became a public company in 2001. Our history in the coal mining business dates back to 1883. Over the past decade, we have made strategic acquisitions and divestitures to position our company to serve U.S. and international coal markets with the highest demand. Acquisitions and divestitures of note include the following:
|
•
|
In 2006, we further expanded our presence in Australia with the acquisition of Excel Coal Limited.
|
|
•
|
In 2007, we spun off Patriot Coal Corporation (Patriot), which included mines in West Virginia and Kentucky and coal reserves in the Illinois Basin and Appalachia, through a dividend of all outstanding Patriot shares.
|
|
•
|
In 2011, we acquired PEA-PCI (formerly Macarthur Coal Limited), an independent coal company in Australia, which included two operating mines, a 50% equity-affiliate joint venture arrangement and several development projects.
|
Our core strategies to achieve long-term growth and generate positive returns on investment are:
|
1)
|
Execute the basics of best-in-class safety, operational performance and marketing;
|
|
2)
|
Continue to target cost improvements across our global platform to improve our competitive position;
|
|
3)
|
Capitalize on organic growth and development opportunities as warranted by global coal market conditions;
|
|
4)
|
Expand our presence in high-growth global markets, particularly in Asia; and
|
|
5)
|
Advance our new global coal advocacy initiative aimed at improving energy policies around the world.
|
In response to the challenged environment continuing to be faced by global coal markets in 2013, we advanced multiple projects focused on holding our strong competitive position in the market segments in which we operate. Such advancements included completing owner-operator conversions at the Wilpinjong, Millennium, Wambo Open-Cut and Middlemount mines in Australia; realizing productivity improvements at PEA-PCI operations in Australia as a result of optimization and remediation efforts completed in the prior year; continuing equipment and facility upgrades at our Metropolitan Mine in Australia; and continuing our ongoing cost containment initiatives across our global platform.
Moving forward into 2014, we expect to maintain a disciplined approach to capital spending as we continue to navigate through the near-term challenges in global coal markets. Planned capital and operational projects for 2014 are mainly focused on driving operational improvements and preserving the productive capacity of our existing mining platform. Such projects include completing the commissioning and post start-up modifications of longwall top coal caving technology at our North Goonyella Mine in Australia, converting our Moorvale Mine in Australia to owner-operator status and advancing development of our planned Gateway North Mine in the U.S.
We will continue to explore opportunities to extend our presence in the Asia-Pacific region through joint mine development partnerships or trading agreements with other companies and governments to leverage our experience in managing safe and reliable coal mining operations.
2
Segment and Geographic Information
We conduct business through four principal segments: Western U.S. Mining, Midwestern U.S. Mining, Australian Mining and Trading and Brokerage. Our fifth segment, Corporate and Other, includes mining and export/transportation joint ventures, activities associated with certain energy-related commercial matters, Btu Conversion, the optimization of our coal reserve and real estate holdings and costs associated with past mining obligations.
Segment and geographic financial information is contained in Note 27. "Segment and Geographic Information" to our consolidated financial statements and is incorporated herein by reference.
Mining Segments
The maps that follow display our active mine locations as of
December 31, 2013
. Also shown are the primary ports that we use in the U.S. and in Australia for coal exports and our corporate headquarters in St. Louis, Missouri.
U.S. Mining Operations
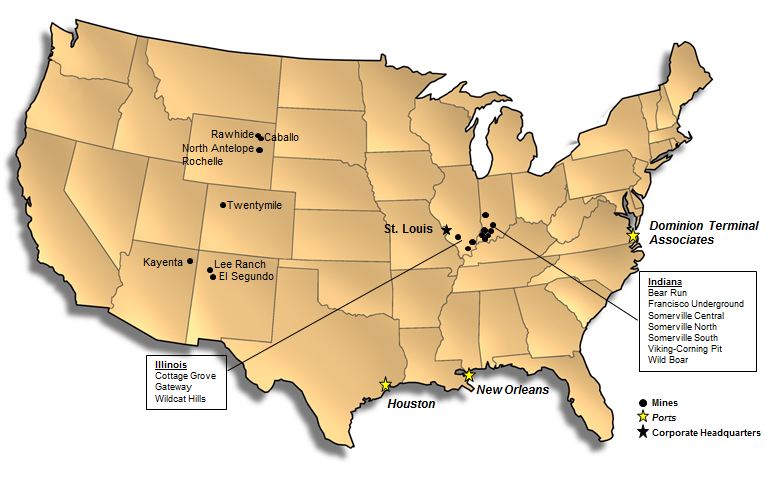
The principal business of our Western and Midwestern U.S. Mining segments is the mining, preparation and sale of thermal coal, which is typically supplied to U.S. electricity generators and industrial customers for power generation, with a portion sold into seaborne export markets.
Our Western U.S. Mining segment is comprised of our Powder River Basin, Southwest and Colorado mining operations. The mines in that segment are generally characterized by surface mining extraction processes and coal with a low sulfur and Btu content. Our Midwestern U.S. Mining segment includes our active mining operations in Illinois and Indiana, which are characterized by a mix of surface and underground mining extraction processes and coal with a high sulfur and Btu content.
Customer transportation costs associated with our Western U.S. Mining coal products are generally higher than those of our Midwestern U.S. Mining segment due to comparatively longer shipping distances. The impact of those higher transportation costs on delivered costs to our customers is generally offset by lower coal prices.
3
Australian Mining Operations
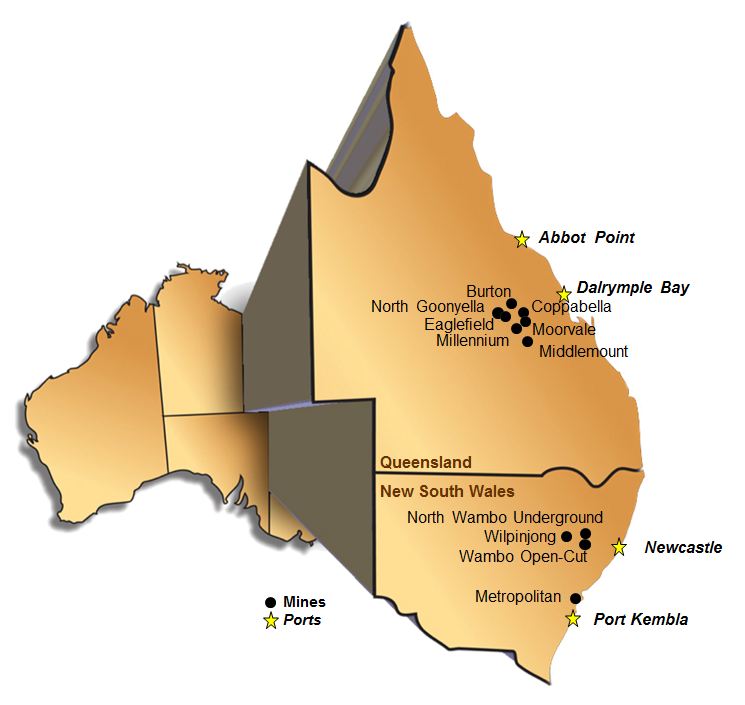
Our Australian Mining segment operations consist of our mines in Queensland and New South Wales, Australia. The mines in that segment are characterized by both surface and underground extraction processes for the mining of various qualities of metallurgical and thermal coal. Metallurgical coal qualities produced by that segment include hard coking, semi-hard coking, semi-soft and low volatile pulverized coal injection (LV PCI) coals. LV PCI coal is generally used by steel producers as a partial replacement for coke made from coking coal.
Our Australian Mining segment operations are primarily export focused with customers spread across several countries, with a portion of our coal being sold within Australia. Revenues from individual countries generally vary year by year based on demand for electricity and steel, global economic conditions and several other factors, including weather, governmental policies, transportation costs, economic conditions and other items specific to each country.
4
The table below summarizes information regarding the operating characteristics of each of our active mines (excluding mines classified as discontinued operations) in the U.S. and Australia. The mines are listed within their respective mining segment in descending order, as determined by tons sold in
2013
.
|
Segment/Mining Complex
|
Location
|
Mine
Type
|
Mining
Method
|
Coal
Type
|
Transport
Method
|
2013 Tons Sold
(In millions)
|
|||||||
|
Western U.S. Mining
|
|
|
|
|
|
|
|
||||||
|
North Antelope Rochelle
|
Wyoming
|
S
|
D, DL, T/S
|
T
|
R
|
110.9
|
|
||||||
|
Rawhide
|
Wyoming
|
S
|
D, T/S
|
T
|
R
|
14.2
|
|
||||||
|
Caballo
|
Wyoming
|
S
|
D, T/S
|
T
|
R
|
9.0
|
|
||||||
|
El Segundo
|
New Mexico
|
S
|
D, D/L, T/S
|
T
|
R
|
8.4
|
|
||||||
|
Kayenta
|
Arizona
|
S
|
DL, T/S
|
T
|
R
|
7.9
|
|
||||||
|
Twentymile
|
Colorado
|
U
|
LW
|
T
|
R, T
|
7.2
|
|
||||||
|
Lee Ranch
|
New Mexico
|
S
|
T/S
|
T
|
R
|
0.1
|
|
||||||
|
Other
(1)
|
—
|
—
|
—
|
—
|
—
|
1.1
|
|
||||||
|
Midwestern U.S. Mining
|
|
|
|
|
|
||||||||
|
Bear Run
|
Indiana
|
S
|
DL, D, T/S
|
T
|
T, R
|
8.2
|
|
||||||
|
Francisco Underground
|
Indiana
|
U
|
CM
|
T
|
R
|
2.9
|
|
||||||
|
Gateway
|
Illinois
|
U
|
CM
|
T
|
T, R, R/B, T/B
|
2.8
|
|
||||||
|
Somerville Central
|
Indiana
|
S
|
DL, D, T/S
|
T
|
R, T/R, T/B
|
2.7
|
|
||||||
|
Wild Boar
|
Indiana
|
S
|
D, T/S
|
T
|
T, R, R/B, T/B
|
2.0
|
|
||||||
|
Cottage Grove
|
Illinois
|
S
|
D, T/S
|
T
|
T/B
|
1.9
|
|
||||||
|
Wildcat Hills Underground
|
Illinois
|
U
|
CM
|
T
|
T/B
|
1.6
|
|
||||||
|
Somerville North
(2)
|
Indiana
|
S
|
D, T/S
|
T
|
T, R, T/R, T/B
|
1.5
|
|
||||||
|
Somerville South
(2)
|
Indiana
|
S
|
D, T/S
|
T
|
T, R, T/R, T/B
|
1.5
|
|
||||||
|
Viking - Corning Pit
(3)
|
Indiana
|
S
|
D, T/S
|
T
|
T, T/R
|
1.1
|
|
||||||
|
Other
(1)
|
—
|
—
|
—
|
—
|
—
|
0.1
|
|
||||||
|
Australian Mining
|
|
|
|
|
|
||||||||
|
Wilpinjong
|
New South Wales
|
S
|
D, T/S
|
T
|
R, EV
|
13.7
|
|
||||||
|
North Wambo Underground
(2)
|
New South Wales
|
U
|
LW
|
T, P
|
R, EV
|
3.5
|
|
||||||
|
Millennium
|
Queensland
|
S
|
D, T/S
|
M, P
|
R, EV
|
3.4
|
|
||||||
|
Coppabella
(4)
|
Queensland
|
S
|
DL, D, T/S
|
P
|
R, EV
|
3.1
|
|
||||||
|
Wambo Open-Cut
(2)
|
New South Wales
|
S
|
T/S
|
T
|
R, EV
|
2.6
|
|
||||||
|
Burton *
|
Queensland
|
S
|
T/S
|
T, M
|
R, EV
|
2.1
|
|
||||||
|
Moorvale *
(4)
|
Queensland
|
S
|
T/S
|
M, P
|
R, EV
|
2.1
|
|
||||||
|
North Goonyella
|
Queensland
|
U
|
LTCC
|
M
|
R, EV
|
1.7
|
|
||||||
|
Metropolitan
|
New South Wales
|
U
|
LW
|
M
|
R, EV
|
1.4
|
|
||||||
|
Eaglefield *
|
Queensland
|
S
|
T/S
|
M
|
R, EV
|
1.3
|
|
||||||
|
Middlemount
(5)
|
Queensland
|
S
|
T/S
|
M, P
|
R, EV
|
—
|
|
||||||
|
Legend:
|
R
|
Rail
|
||
|
S
|
Surface Mine
|
T
|
Truck
|
|
|
U
|
Underground Mine
|
R/B
|
Rail and Barge
|
|
|
DL
|
Dragline
|
T/B
|
Truck and Barge
|
|
|
D
|
Dozer/Casting
|
T/R
|
Truck and Rail
|
|
|
T/S
|
Truck and Shovel
|
EV
|
Export Vessel
|
|
|
LW
|
Longwall
|
T
|
Thermal/Steam
|
|
|
LTCC
|
Longwall Top Coal Caving
|
M
|
Metallurgical
|
|
|
CM
|
Continuous Miner
|
P
|
Pulverized Coal Injection
|
|
|
*
|
Mine is operated by a contract miner
|
|||
|
(1)
|
“Other” in Western and Midwestern U.S. Mining primarily consists of purchased coal used to satisfy certain specific coal supply agreements.
|
|
(2)
|
Represents our majority-owned mines in which there is an outside non-controlling ownership interest.
|
|
(3)
|
Mine is expected to close in the first half of 2014.
|
|
(4)
|
We own a 73.3% undivided interest in an unincorporated joint venture that owns the Coppabella and Moorvale mines.
|
|
(5)
|
We own a 50.0% equity interest in Middlemount Coal Pty Ltd., which owns the Middlemount Mine. Because that entity is accounted for as an unconsolidated equity affiliate,
2013
tons sold from that mine have been excluded from the table above.
|
5
Refer to the "Summary of Coal Production and Sulfur Content of Assigned Reserves" table within Part I, Item 2. "Properties," which is incorporated by reference herein, for additional information regarding coal reserves, product characteristics and production volume associated with each mine.
Trading and Brokerage Segment
Our Trading and Brokerage segment engages in the direct and brokered trading of coal and freight-related contracts through trading and business offices in Australia, China, Germany, India, Indonesia, Singapore, the United Kingdom and the U.S. (listed alphabetically). Coal brokering is conducted both as principal and agent in support of various coal production-related activities that may involve coal produced from our mines, coal sourcing arrangements with third-party mining companies or offtake agreements with other coal producers. From time to time and where possible, our Trading and Brokerage segment may enter into financial derivative contract positions offsetting certain coal purchase and sale contracts included in our portfolio in an effort to reduce market price risk and secure a margin on forecasted transactions. Our Trading and Brokerage segment also provides transportation-related services, including economic hedging, in support of our coal trading strategy, as well as cash flow hedging activities in support of sales from our mining operations.
Corporate and Other Segment
Our Corporate and Other Segment includes selling and administrative items, activity associated with our joint ventures, resource management activity, past mining obligations and our other commercial activities such as generation development and the evaluation of Btu Conversion projects.
Resource Management.
As of December 31,
2013
, we held approximately
8.3
billion tons of proven and probable coal reserves and approximately 500,000 acres of surface property. We have an ongoing asset optimization program whereby our resource development group regularly reviews these reserves and surface properties for opportunities to generate earnings and cash flow through the sale or exchange of non-strategic coal reserves and surface lands. In addition, we generate revenue through royalties from coal reserves and oil and gas rights leased to third parties and farm income from surface lands under third-party contracts.
Middlemount Mine.
We own a 50% equity interest in the Middlemount Mine in Queensland, Australia. The mine predominantly produces semi-hard coking coal and LV PCI coal for sale into seaborne coal markets through rail and port capacity contracted through Abbot Point Coal Terminal, with future capacity also secured at Dalrymple Bay Coal Terminal. Mining operations commenced at Middlemount Mine in late 2011 and that mine continued to ramp up production and invest in operational improvements through 2013. During the year ended December 31, 2013, the mine sold approximately 3 million tons of coal (on a 100% basis).
Paso Diablo Mine.
We own a 48.37% noncontrolling interest in Carbones del Guasare S.A. (CdG), which previously operated the Paso Diablo Mine, a surface mining operation in northwestern Venezuela that produced thermal coal for export primarily to the U.S. and Europe. In the fourth quarter of 2013, the Venezuelan government, at the discretion of the Minister of Energy for the Republic of Venezuela, refused to act upon CdG's request for an extension or renewal of the underlying mining concession for the Paso Diablo Mine and the concession expired. The expiration of the concession triggered, by law, the extinguishment of the underlying mining rights that were granted to CdG and the transfer of all of the mining assets previously owned by CdG related to the mine to the Republic of Venezuela. In addition, these events converted an ongoing condition of force majeure under the one remaining coal sales contract we had for coal supplied from the Paso Diablo Mine into a permanent force majeure, resulting in the termination of the coal sales contract. We had previously fully impaired the carrying value of our equity investment in CdG in 2009. Accordingly, the expiration of CdG's mining concession did not impact our results of operations, financial condition or cash flows for the year ended December 31, 2013.
Singapore Joint Venture.
We own a 50% interest in Sino-Pacific Coal Trading Corporation Pte. Ltd. (Sino-Pacific), a Singapore-based joint venture agreement with Shenhua Group Corporation Limited (Shenhua), a large-scale state-owned energy company headquartered in Beijing, China. The joint venture is intended to supply Shenhua's Chinese coal import demand with thermal coal. Sino-Pacific is expected to commence operations in 2014, subject to regulatory approvals.
Mongolia Joint Venture.
We own a 50% interest in Peabody-Winsway Resources B.V., a joint venture agreement with Winsway Coking Coal Holdings Ltd. (Winsway), a Hong Kong stock exchange listed company in which we also own an equity interest. The joint venture holds several exploration licenses in Mongolia.
Export Facilities.
We have a 37.5% interest in Dominion Terminal Associates, a partnership that operates a coal export terminal in Newport News, Virginia that exports both metallurgical and thermal coal primarily to European and Brazilian markets.
6
Generation Development.
We are a 5.06% owner in the Prairie State Energy Campus (Prairie State), a 1,600 megawatt coal-fueled electricity generation plant and adjacent coal mine in Washington, St. Clair and Randolph counties in Illinois, which commenced commercial operations during 2012. We are responsible for our 5.06% share of Prairie State's production costs and marketing and selling our share of electricity generated by the facility.
Btu Conversion.
Btu Conversion involves projects designed to expand the uses of coal such as through conversion to transportation fuels and coal gasification technologies.
Clean Coal Technology.
We continue to support clean coal technology development and other “green coal” initiatives seeking to reduce global atmospheric levels of carbon dioxide and other emissions. In China, we are the only non-Chinese equity partner in GreenGen, an integrated gasification combined cycle coal-fueled power plant near Tianjin, China that began electric generation for commercial consumption in 2012 and plans to utilize carbon capture and storage (CCS) in its next stage of development. We are also a founding member of the U.S.-China Energy Cooperation Program. In Australia, we have an ongoing commitment to the Australian COAL21 Fund, an industry effort to pursue a collection of low-carbon emission technologies in Australia, and are also a founding member of the Global Carbon Capture and Storage Institute, an international initiative hosted by the Australian government. In the U.S., we are a founding member of the FutureGen Alliance in Illinois and are presently developing the FutureGen 2.0 project. We are also a founding member of the Consortium for Clean Coal Utilization at Washington University in St. Louis in Missouri and the National Carbon Capture Center in Alabama.
Captive Insurance Entities.
A portion of our insurance risks associated with workers’ compensation, general liability and auto liability coverage is self-insured through two wholly-owned captive insurance companies. The captive entities invoice certain of our subsidiaries for the premiums on these policies, pay the related claims, maintain reserves for anticipated losses and invest funds to pay future claims. Historically, the actuarially-determined reserves maintained by our captive insurance companies have provided adequate coverage of actual claims incurred.
Coal Supply Agreements
Customers.
Our coal supply agreements are primarily with electricity generators, industrial facilities and steel manufacturers. Most of our sales (excluding trading transactions) are made under long-term coal supply agreements (those with terms longer than one year and which typically include price reopener and/or extension provisions). A smaller portion of our sales are made on a shorter-term or a spot basis. Sales under long-term coal supply agreements comprised approximately
80%
,
89%
and
91%
of our worldwide sales from our mining operations (by volume) for the years ended December 31,
2013
,
2012
and
2011
, respectively.
For the year ended December 31,
2013
, we derived
25%
of our total revenues from our five largest customers. Those five customers were supplied primarily from
46
coal supply agreements (excluding trading transactions) expiring at various times from 2014 to 2026. The contract contributing the greatest amount of annual revenue in
2013
was approximately $
340 million
, or approximately
5%
of our
2013
total revenues, and is due to expire in 2026.
Backlog.
Our sales backlog, which includes coal supply agreements subject to price reopener and/or extension provisions, was approximately
900 million
tons of coal as of both January 1,
2014
and
2013
. Contracts in backlog have remaining terms ranging from one to
14
years and represent approximately four years of production based on our
2013
production volume of
218.4 million
tons. Approximately
77%
of our backlog is expected to be filled beyond
2014
.
U.S. Mining Operations.
Revenues from our Western and Midwestern U.S. Mining segments, in aggregate, represented approximately 57%, 54% and 55% of our total revenue base for the years ended December 31,
2013
,
2012
and
2011
, respectively, during which periods the coal mining activities of those segments contributed respective aggregate amounts of approximately 84%, 85% and 89% of our sales volumes from mining operations. We expect to continue selling a significant portion of our Western U.S. Mining and Midwestern U.S. Mining segment coal production under long-term supply agreements, and customers of those segments continue to pursue long-term sales agreements in recognition of the importance of reliability, service and predictable coal prices to their operations. The terms of coal supply agreements result from competitive bidding and extensive negotiations with customers. Consequently, the terms of those agreements vary significantly in many respects, including price adjustment features, price reopener terms, coal quality requirements, quantity parameters, permitted sources of supply, treatment of environmental constraints, extension options, force majeure and termination and assignment provisions. Our strategy is to selectively renew, or enter into new, long-term supply agreements when we can do so at prices we believe are favorable.
7
Australian Mining Operations.
Revenues from our Australian Mining segment represented approximately 41%, 43% and 39% of our total revenue base for the years ended December 31,
2013
,
2012
and
2011
, respectively, during which periods the coal mining activities of that segment contributed respective amounts of
16%
,
15%
and
11%
of our sales volumes from mining operations. Our production is primarily sold into the seaborne metallurgical and thermal markets, with a majority of those sales executed through annual and multi-year international coal supply agreements that contain provisions requiring both parties to renegotiate pricing periodically. Industry commercial practice, and our typical practice, is to negotiate pricing for those metallurgical and seaborne thermal coal contracts on a quarterly and annual basis, respectively, with a portion sold on a shorter-term basis.
Transportation
Methods of Distribution.
Coal consumed in the U.S. is usually sold at the mine with transportation costs borne by the purchaser. Our Australian export coal is usually sold at the loading port, with purchasers paying ocean freight. Our U.S. export coal is more typically sold on a delivered basis into the unloading port, with us paying ocean freight. In each case, exporters usually pay shipping costs from the mine to the port, including any demurrage costs (fees paid to third-party shipping companies for loading time that exceeded the stipulated time). Demurrage continues to be a component of the shipping costs of our Australian exports as certain ports continue to experience vessel queues, though such conditions generally continued to improve during
2013
, as in the prior year.
We believe we have good relationships with U.S. and Australian rail carriers and barge companies due, in part, to our modern coal-loading facilities and the experience of our transportation coordinators. Refer to the table on page 5 in the foregoing "Mining Segments" section for a summary of transportation methods by mine.
Export Facilities.
Our U.S. Mining operations exported approximately 2%, 3% and 3% of its tons sold for the years ended December 31,
2013
,
2012
and
2011
, respectively. Our primary ports used for U.S. exports are the Dominion Terminal Associates coal terminal in Newport News, Virginia, the United Bulk Terminal near New Orleans, Louisiana, the St. James Stevedoring Anchorages terminal in Convent, Louisiana and the Kinder Morgan terminal near Houston, Texas. We are continuing to pursue access to U.S. west coast port facilities that will allow us to export our Powder River Basin coal products to serve demand in the Asian region.
Our Australian Mining operations sold approximately 75%, 77% and 74% of its tons into the seaborne coal markets for the years ended December 31,
2013
,
2012
and
2011
, respectively. We have generally secured our ability to transport coal in Australia through rail contracts and interests in three east coast coa
l export terminals that are primarily funded through take-or-pay arrangements (see the "Liquidity and Capital Resources" section in Part II, Item 7. "Management's Discussion and Analysis of Financial Condition and Results of Operations" for additional information).
In Queensland, seaborne metallurgical and thermal coal from our mines is exported through the Dalrymple Bay Coal Terminal, in addition to the Abbot Point Coal Terminal used by our joint venture Middlemount Mine. In New South Wales, our primary ports for exporting metallurgical and thermal coal are at Port Kembla and Newcastle, which includes both the Port Waratah Coal Services terminal and the terminal operated by Newcastle Coal Infrastructure Group (NCIG).
Suppliers
Mining Supplies and Equipment.
The principal goods we purchase in support of our mining activities are mining equipment and replacement parts, diesel fuel, ammonium-nitrate and emulsion-based explosives, off-the-road (OTR) tires, steel-related products (including roof control materials), lubricants and electricity. We have many well-established, strategic relationships with our key suppliers of goods and do not believe that we are overly dependent on any of our individual suppliers.
Historically, there has been some consolidation in the supplier base providing mining materials to the coal industry for certain of these goods, such as explosives in the U.S. and both surface and underground mining equipment globally, which has limited the number of sources for these materials. In situations where we have elected to concentrate a large portion of our purchases with one supplier in lieu of seeking other alternatives, it has been to take advantage of cost savings from larger volumes of purchases, benefit from long-term pricing for parts, ensure security of supply and/or allow for equipment fleet standardization. Supplier concentration related to our mining equipment also allows us to benefit from fleet standardization, which in turn improves asset utilization by facilitating the development of common maintenance practices across our global platform and enhancing our flexibility to move equipment between mines as necessary.
While demand growth has outpaced supply in recent periods, market demand and lead times for certain OTR tires stabilized in 2013. We do not expect lead times or any supply constraints to have a near-term material impact on our financial condition, results of operations or cash flows due to the strategic relationships and long-term supply contracts we have with our OTR tire suppliers.
8
Surface and underground mining equipment demand and lead times decreased substantially on a year-over-year basis in 2012 and remained lower in 2013 due to challenged market conditions experienced across several extractive industry sectors. This is consistent with a decline in our own near-term demand for such equipment as we have sought to defer new and early stage development projects, while continuing to evaluate the timing associated with such projects based on changes in global coal market demand. We continue to use our global leverage with major suppliers to either ensure security of supply to meet the requirements of our active projects or to delay deliveries when warranted by coal market conditions.
Services.
We also purchase services at our mine sites, including services related to maintenance for mining equipment, construction, temporary labor and other various contracted services, such as contract mining for both production and development and explosive services. We do not believe that we are overly dependent on any of our individual service providers.
Technical Innovation
We continue to advance new technologies to maximize safety, including partnering with other companies and certain governmental agencies to pursue technologies that have the potential to improve our safety performance and provide better safety protection for employees. We are currently partnering with three of our mining equipment vendors to incorporate proximity detection systems on our continuous miners and proximity detection and video surveillance systems on our battery-powered coal haulage equipment, shuttle cars and section scoops at our U.S. underground mines. Additionally, we have installed and are testing a proximity detection system for large mining equipment and light vehicles at one of our Australian surface mines. We have also initiated a collaborative effort with certain vendors to identify and evaluate potential fatigue monitoring programs and technologies for our surface operations.
We emphasize the application of technical innovation to improve equipment performance and operating efficiencies. Development is typically undertaken and funded by equipment suppliers with our engineering, maintenance and purchasing personnel providing input and expertise to those suppliers who then design and produce equipment that we believe will improve our operating performance and mining capabilities.
We seek to deploy the best mining technologies available based on the specific geologic conditions of each of our mining operations. For example, we commenced with the the commissioning of longwall top coal caving technology at our North Goonyella Mine in Australia in 2013, which technology we expect will be fully operational in 2014.
We leverage technology and data systems to enhance our operating and maintenance efforts thr
ough the integration of original equipment manufacturer systems, mobile technologies and automated reporting systems to provide an integrated, real time picture of of our mining operations and equipment performance. We continue to advance the use of in-house developed software to schedule trains, monitor coal quality and customer shipments and manage mine operations and pit blending to enhance our reliability and product consistency.
We employ maintenance standards based on reliability-centered maintenance practices at all operations to increase equipment utilization and reduce maintenance and capital spending over time by extending the equipment life, while minimizing the risk of premature failures. Specialized maintenance reliability software is used at many operations to better support improved equipment strategies, predict equipment condition and aid analysis necessary for better decision-making for such issues as component replacement timing.
Competition
The markets in which we sell our coal are highly competitive. We compete directly with other coal producers and, with respect to our thermal coal products, indirectly with producers of other energy products that provide an alternative to coal use. We compete on the basis of coal quality and characteristics, delivered price, customer service and support and reliability of supply. Our principal U.S. direct competitors (listed alphabetically) are other large coal producers, including Alliance Resource Partners, Alpha Natural Resources, Inc., Arch Coal, Inc. and Cloud Peak Energy Inc., who collectively accounted for approximately 36% of total U.S. coal production in 2012 according to the National Mining Association's "2012 Coal Producer Survey," the most recent data publicly available as of
February 21, 2014
. Major international direct competitors (listed alphabetically) include Anglo-American PLC, BHP Billiton, China Coal, Glencore Xstrata PLC, Rio Tinto and Shenhua Group.
Demand for coal and the prices that we will be able to obtain for our coal are influenced by factors beyond our control, including global economic conditions, the demand for electricity and steel, the impact of weather on heating and cooling demand and taxes and environmental regulations imposed by the U.S. and foreign governments. Metallurgical coal demand is also impacted by competing technologies used to make steel, some of which do not use coal as a manufacturing input.
9
The use of thermal coal is further influenced by the availability and relative cost of alternative fuels, with customers focused on securing the lowest cost fuel supply in order to produce electric power reliably at a competitive price. The International Energy Agency (IEA) reported in its World Energy Outlook 2013 that coal's share of worldwide electric power generation mix was 41% in 2011. Alternative fuels to thermal coal include natural gas, fuel oil and nuclear, hydroelectric, wind, biomass and solar power sources.
Due to domestic growth in the use of hydraulic fracturing, natural gas is the most significant substitute to thermal coal for electricity generation in the U.S., and vice versa. The U.S. Energy Information Administration (EIA) reported in its February 2014 "Short-Term Energy Outlook" that, driven by a 36% increase in full year average U.S. natural gas prices during 2013, coal's share of U.S. electricity generation for all sectors increased from 37% in 2012 to 39% in 2013, while still falling short of the 42% level experienced in 2011. We believe the economics of gas-to-coal switching enable demand for thermal coals produced in the U.S. Powder River and Illinois basins in which we produce to benefit when natural gas prices rise above a range of $2.75 to $3.00 per mmBtu and $3.50 to $3.75 per mmBtu, respectively, and to decline when natural gas prices fall below those levels. The EIA expects full year average U.S. natural gas prices of $4.17 per mmBtu in 2014 and correspondingly projects coal's share of U.S. electricity generation for all sectors to increase to 40% in that period.
Working Capital
We generally fund our working capital requirements through a combination of existing cash and cash equivalents and proceeds from the sale of our coal production to customers and our trading and brokerage activities. Our revolving credit facility (the 2013 Revolver) under our secured credit agreement entered into in 2013 (the 2013 Credit Facility) and our accounts receivable securitization program are also available to fund our working capital requirements. Refer to the "Liquidity and Capital Resources" section of Part II, Item 7. "Management's Discussion and Analysis of Financial Condition and Results of Operations" for additional information regarding working capital.
Employees
We had approximately
8,300
employees as of
December 31, 2013
, including approximately
5,900
hourly employees. Additional information on our employees and related labor relations matters is contained in Note 22. "Management - Labor Relations" to our consolidated financial statements, which information is incorporated herein by reference.
Executive Officers of the Company
Set forth below are the names, ages and positions of our executive officers. Executive officers are appointed by, and hold office at the discretion of, our Board of Directors, subject to the terms of any employment agreements.
|
Name
|
Age
(1)
|
Position
(2)
|
||
|
Gregory H. Boyce
|
59
|
Chairman and Chief Executive Officer, Director
|
||
|
Glenn L. Kellow
|
46
|
President and Chief Operating Officer
|
||
|
Michael C. Crews
|
46
|
Executive Vice President and Chief Financial Officer
|
||
|
Sharon D. Fiehler
|
57
|
Executive Vice President and Chief Administrative Officer
|
||
|
Eric Ford
|
59
|
Executive Vice President - Office of the Chief Executive Officer
|
||
|
Christopher J. Hagedorn
|
41
|
President - Asia and Trading
|
||
|
Jeane L. Hull
|
59
|
Executive Vice President and Chief Technical Officer
|
||
|
Charles F. Meintjes
|
51
|
President - Australia
|
||
|
Alexander C. Schoch
|
59
|
Executive Vice President Law, Chief Legal Officer and Secretary
|
||
|
Kemal Williamson
|
54
|
President - Americas
|
||
(1)
As of
February 14, 2014
.
(2)
As of
December 31, 2013
.
10
Gregory H. Boyce
was elected Chairman of the Board in October 2007 and has been a director of the Company since March 2005. He was named Chief Executive Officer Elect of the Company in March 2005 and assumed the position of Chief Executive Officer in January 2006. He was President of the Company from October 2003 to December 2007 and was Chief Operating Officer of the Company from October 2003 to December 2005. He previously served as Chief Executive - Energy of Rio Tinto plc (an international natural resource company) from 2000 to 2003. Other prior positions include President and Chief Executive Officer of Kennecott Energy Company from 1994 to 1999 and President of Kennecott Minerals Company from 1993 to 1994. He has extensive engineering and operating experience with Kennecott. Mr. Boyce serves on the board of directors of Marathon Oil Corporation and Monsanto Company. He is Chairman of the Coal Industry Advisory Board of the International Energy Agency and is a former Chairman of the National Mining Association. He serves on the Board of Directors of the U.S.-China Business Council, and is a member of The Business Council, Business Roundtable and the National Coal Council. In addition, Mr. Boyce is a member of the Board of Trustees of Washington University in St. Louis and the Advisory Council of the University of Arizona’s Department of Mining and Geological Engineering. He also is President of the Board for Variety - The Children’s Charity of St. Louis and is a member of the Board of Commissioners for the St. Louis Science Center.
Glenn L. Kellow
was named our President and Chief Operating Officer in August 2013. He has executive responsibility for all aspects of our global operations including safety, production, sales and marketing, environmental, productivity improvement, engineering and planning. Mr. Kellow has extensive experience in the global resource industry, where he has served in multiple executive, operational and financial roles in coal and other commodities in the United States, Australia and South America. From 1985 to 2013, Mr. Kellow served in a number of roles with BHP Billiton, the world’s largest mining company, including senior appointments as President, Aluminum and Nickel (2012-2013), President, Stainless Steel Materials (2010-2012), President and Chief Operating Officer, New Mexico Coal (2007-2010), and Chief Financial Officer, Base Metals (2003-2007). He is a former director of the World Coal Association and the National Mining Association and was the Chairman of Worsley Alumina (Australia), Chairman of Mozal (Mozambique) and Vice Chairman of the Nickel Institute. Mr. Kellow is a graduate of the advanced management program at the University of Pennsylvania’s Wharton School of Business and holds a master’s degree in business administration and a bachelor’s degree in commerce from the University of Newcastle.
Michael C. Crews
was named our Executive Vice President and Chief Financial Officer in June 2008. He joined us in 1998 as Senior Manager of Financial Reporting, and has served as Assistant Corporate Controller, Director of Planning, Assistant Treasurer, Vice President of Planning, Analysis, and Performance Assessment, and Vice President of Operations Planning. Prior to joining us, Mr. Crews served for three years in financial positions with MEMC Electronic Materials, Inc. and six years at KPMG Peat Marwick in St. Louis. Mr. Crews serves on the Board of Directors of the St. Louis Regional Chamber and is a member of the advisory board of Washington University's Wells Fargo Advisors Center for Financial and Accounting Research. Mr. Crews has a Bachelor of Science degree in Accountancy from the University of Missouri at Columbia, a Master of Business Administration degree from Washington University in St. Louis and is a Certified Public Accountant in the State of Missouri.
Sharon D. Fiehler
has been our Executive Vice President and Chief Administrative Officer since January 2008. From April 2002 to January 2008, she served as our Executive Vice President of Human Resources and Administration. Ms. Fiehler joined us in 1981 as Manager - Salary Administration and has held a series of employee relations, compensation and salaried benefits positions. Prior to joining us, she was a personnel representative for Ford Motor Company. Ms. Fiehler is Deputy Chair and a Director of the Federal Reserve Bank of St. Louis; a member of the Board of Trustees of the Missouri Botanical Garden; and a member of the Board of Directors of Junior Achievement of Greater St. Louis. She is also a member of the International Women's Forum/Missouri and the St. Louis Forum. Ms. Fiehler holds a Master of Business Administration degree from the University of Missouri-St. Louis and bachelor degrees in psychology and social work from Southern Illinois University Edwardsville.
Eric Ford
was named Executive Vice President, Office of the Chief Executive Officer, in August 2013. He retired from Peabody on January 31, 2014. Mr. Ford served as Chairman - Australia from October 2012 to August 2013, as President - Australia from March 2012 to October 2012 and as Executive Vice President and Chief Operating Officer from March 2007 to March 2012. Mr. Ford has 40 years of extensive international management, operating and engineering experience and, prior to joining us, most recently served as Chief Executive Officer of Anglo Coal Australia Pty Ltd. He joined Anglo Coal in 1971 and, after a series of increasingly complex operating assignments, was appointed President and Chief Executive Officer of Anglo American's joint venture coal mining operation in Colombia in 1998. In 2000, he returned to Anglo American Corporation as Executive Director of Operations for Anglo Platinum Corporation Limited. He was subsequently appointed Chief Executive Officer of Anglo Coal Australia Pty Ltd in 2001. Mr. Ford holds a Master of Science degree in Management Science from Imperial College in London and a Bachelor of Science degree in Mining Engineering (cum laude) from the University of the Witwatersrand in Johannesburg, South Africa. He serves on the board of directors of Compass Minerals International Inc. and as a Director of the Minerals Council of Australia. Mr. Ford was previously Deputy Chairman and a member of the Executive Committee of the Coal Industry Advisory Board of the IEA.
11
Christopher J. Hagedorn
was named our President - Asia and Trading in March 2012. He has executive responsibility for our business and growth activities in Asia, including China, Mongolia, Indonesia and India; our global COALTRADE business, which includes global coal trading plus structured products and origination; Asian finance and administration; Asia business development activities; and the law function for Asia and Global Trading activities. He most recently served as our Senior Vice President Global Sales and Trading Support, and previously held positions with us of Senior Vice President, Chief Procurement Officer, and Vice President - Business Performance. Prior to joining us in August, 2006, he was an Associate Principal at McKinsey & Company in Cleveland, Ohio, where he provided management consulting services on various operations, marketing and business strategy topics to international clients in the energy, metals and mining, and chemicals sectors. Mr. Hagedorn holds a Bachelor of Science in chemical engineering from Washington University in St. Louis and a Doctorate in chemical engineering from the University of California - Santa Barbara. He is a member of the Board of Directors of the Sheldon Concert Hall in St. Louis.
Jeane L. Hull
was named our Executive Vice President and Chief Technical Officer in March 2011. She joined us in May 2007 as the Senior Vice President of Engineering and Technical Services, and then served as Group Executive - Powder River Basin and Southwest from June 2008 to March 2011. Prior to joining us, Ms. Hull served as Chief Operating Officer of Kennecott Utah Copper, a subsidiary of Rio Tinto. She held numerous management, engineering and operations positions with Rio Tinto and affiliates and also spent 12 years with Mobil Mining and Minerals and Mobil Chemical Company. A registered professional engineer, Ms. Hull graduated from the South Dakota School of Mines and Technology with a Bachelor of Science degree in Civil Engineering. She holds a Master of Business Administration degree from Nova University in Florida. Ms. Hull is a member of the University of Wyoming School of Energy Resources Council. She also serves on the University Advisory Board for South Dakota School of Mines and Technology, the Industry Advisory Board for Missouri University of Science and Technology Mining Department and the Washington University Olin Business School Women’s Leadership Forum Steering Committee.
Charles F. Meintjes
was named our President - Australia in October 2012. He has executive responsibility for our Australia operating platform, which includes overseeing the areas of health and safety, operations, sales and marketing, product delivery and support functions. Mr. Meintjes has extensive senior operational, strategy, continuous improvement and information technology experience with mining companies on three continents. He joined us in 2007, and most recently served as Acting President - Americas. Other past positions with us include Group Executive of Midwest and Colorado Operations, Senior Vice President of Operations Improvement and Senior Vice President Engineering and Continuous Improvement. Prior to joining us, Mr. Meintjes served as a consultant to Exxaro Resources Limited in South Africa, and is a former Executive Director and Board Member for Kumba Resources Limited in South Africa. He also served on the boards of two public companies, AST Gijima in South Africa and Ticor Limited in Australia and has senior management experience in the steel and the aluminum industry with Iscor and Alusaf in South Africa. Mr. Meintjes holds dual Bachelor of Commerce degrees in accounting from Rand Afrikaans University and the University of South Africa. He is a Chartered Accountant in South Africa and completed the advanced management program at the University of Pennsylvania’s Wharton School of Business.
Alexander C. Schoch
was named our Executive Vice President Law and Chief Legal Officer in October 2006 and our Secretary in May 2008. Prior to joining us, Mr. Schoch served as Vice President and General Counsel for Emerson Process Management, an operating segment of Emerson Electric Co. and a leading supplier of process-automation products, from August 2004 to October 2006. Mr. Schoch also served in several legal positions with Goodrich Corporation, a global supplier to the aerospace and defense industries, from 1987 to 2004, including Vice President, Associate General Counsel and Secretary. Prior to that, he worked for Marathon Oil Company as an attorney in its international exploration and production division. Mr. Schoch holds a Juris Doctorate from Case Western Reserve University in Ohio, as well as a Bachelor of Arts in Economics from Kenyon College in Ohio. He is admitted to practice law in several states, and is a member of the American and International Bar Associations. Mr. Schoch serves as a Trustee at Large on the Board of Trustees for the Energy & Mineral Law Foundation, and on the following Boards of Directors: the National Blues Museum, St. Louis, Missouri; Safe Connections, St. Louis, Missouri; and Case Western Reserve University Law Alumni Association, Cleveland, Ohio.
Kemal Williamson
was named our President - Americas in October 2012. He has executive responsibility for our U.S. operating platform and business development activities. He oversees the areas of health and safety; operations; sales and marketing; product delivery; and support functions. Mr. Williamson has more than 30 years experience in mining engineering and operations roles across North America and Australia. He most recently served as Group Executive Operations for the Peabody Energy Australia operations. He also has held executive leadership roles across project development, as well as in positions overseeing our Western U.S., Powder River Basin and Midwest operations. Mr. Williamson joined us in 2000 as Director of Land Management. Prior to that, he served two years at Cyprus Australia Coal Corporation as Director of Operations and managed coal operations in Australia for half a decade. He also has mining engineering, financial analysis and management experience across Colorado, Kentucky and Illinois. Mr. Williamson holds a Bachelor of Science degree in mining engineering from Pennsylvania State University as well as a Master of Business Administration degree from the Kellogg School of Management, Northwestern University in Evanston, Illinois.
12
Regulatory Matters — U.S.
Federal, state and local authorities regulate the U.S. coal mining industry with respect to matters such as employee health and safety, permitting and licensing requirements, air quality standards, water pollution, plant and wildlife protection, the reclamation and restoration of mining properties after mining has been completed, the discharge of materials into the environment, surface subsidence from underground mining and the effects of mining on groundwater quality and availability. In addition, the industry is affected by significant legislation mandating certain benefits for current and retired coal miners. Numerous federal, state and local governmental permits and approvals are required for mining operations. We believe that we have obtained all permits currently required to conduct our present mining operations.
We endeavor to conduct our mining operations in compliance with all applicable federal, state and local laws and regulations. However, because of extensive and comprehensive regulatory requirements, violations during mining operations occur from time to time in the industry. None of our violations to date or the monetary penalties assessed have been material.
Mine Safety and Health
We are subject to health and safety standards both at the federal and state level. The regulations are comprehensive and affect numerous aspects of mining operations, including training of mine personnel, mining procedures, blasting, the equipment used in mining operations and other matters.
Mine Safety and Health Administration (MSHA) is the entity responsible for monitoring compliance with the federal mine health and safety standards. MSHA has various enforcement tools that it can use, including the issuance of monetary penalties and orders of withdrawal from a mine or part of a mine. Some, but not all, of the costs of complying with existing regulations and implementing new safety and health regulations may be passed on to customers.
MSHA has taken a number of actions to identify mines with safety issues, and has engaged in a number of targeted enforcement, awareness, outreach and rulemaking activities to reduce the number of mining fatalities, accidents and illnesses. There has also been an industry-wide increase in the monetary penalties assessed for citations of a similar nature.
In Part I, Item 4. "Mine Safety Disclosures" and in Exhibit 95 to this Annual Report on Form 10-K, we provide additional details on how we monitor safety performance and MSHA compliance, as well as provide the mine safety disclosures required by SEC regulations.
Black Lung
Under the Black Lung Benefits Revenue Act of 1977 and the Black Lung Benefits Reform Act of 1977, as amended in 1981, each U.S. coal mine operator must pay federal black lung benefits and medical expenses to claimants who are current and former employees and last worked for the operator after July 1, 1973. Coal mine operators must also make payments to a trust fund for the payment of benefits and medical expenses to claimants who last worked in the coal industry prior to July 1, 1973. Historically, less than 7% of the miners currently seeking federal black lung benefits are awarded these benefits. The trust fund is funded by an excise tax on U.S. production of up to $1.10 per ton for deep-mined coal and up to $0.55 per ton for surface-mined coal, neither amount to exceed 4.4% of the gross sales price.
Environmental Laws and Regulations
We are subject to various federal, state, local and tribal environmental laws and regulations. These laws and regulations place substantial requirements on our coal mining operations, and require regular inspection and monitoring of our mines and other facilities to ensure compliance. We are also affected by various other federal, state, local and tribal environmental laws and regulations that our customers are subject to.
Surface Mining Control and Reclamation Act.
In the U.S., the Surface Mining Control and Reclamation Act of 1977 (SMCRA), which is administered by the Office of Surface Mining Reclamation and Enforcement (OSM), established mining, environmental protection and reclamation standards for all aspects of U.S. surface mining and many aspects of deep mining. Mine operators must obtain SMCRA permits and permit renewals for mining operations from the OSM. Where state regulatory agencies have adopted federal mining programs under SMCRA, the state becomes the regulatory authority. Except for Arizona, states in which we have active mining operations have achieved primary control of enforcement through federal authorization. In Arizona, we mine on tribal lands and are regulated by the OSM because the tribes do not have SMCRA authorization.
13
After a permit application is prepared and submitted to the regulatory agency, it goes through a completeness and technical review. Public notice of the proposed permit is given for a comment period before a permit can be issued. Regulatory authorities have considerable discretion in the timing of the permit issuance and the public has the right to comment on and otherwise engage in the permitting process, including public hearings and through intervention in the courts. Before a SMCRA permit is issued, a mine operator must submit a bond or other form of financial security to guarantee the performance of reclamation obligations.
In situations where our coal resources are federally owned, the U.S. Bureau of Land Management oversees a substantive exploration and leasing process. If surface land is managed by the U.S. Forest Service, that agency serves as the cooperating agency during the federal coal leasing process. Federal coal leases also require an approved federal mining permit under the signature of the Assistant Secretary of the Department of the Interior.
The SMCRA Abandoned Mine Land Fund requires a fee on all coal produced in the U.S. The proceeds are used to rehabilitate lands mined and left unreclaimed prior to August 3, 1977 and to pay health care benefit costs of orphan beneficiaries of the Combined Fund created by the Coal Industry Retiree Health Benefit Act of 1992. The fee amount can change periodically. Pursuant to the Tax Relief and Health Care Act of 2006, from October 1, 2007 to September 30, 2012, the fee was $0.315 and $0.135 per ton of surface-mined and underground-mined coal, respectively. From October 1, 2012 through September 30, 2021, the fee is $0.28 and $0.12 per ton of surface-mined and underground-mined coal, respectively.
The OSM has been in the process of developing a “stream protection rule,” which could result in changes to mining operations under the SMCRA program. The OSM has projected that it will issue a proposed stream protection rule in 2014. Other rulemaking proceedings have been proposed or are being considered by the OSM. Notably, the Proposed Rule for Cost Recovery for Permit Processing, Administration and Enforcement was published in March 2013. If finalized as proposed, it will result in minor cost increases at our mine operations on tribal lands in Arizona. Additionally, the OSM is working on a Coal Combustion Residues rulemaking for minefill operations. The agency has projected it may publish a proposed rule by May 2014. These OSM rulemakings and others could have a direct impact on our operations.
Clean Air Act.
The Clean Air Act, enacted in 1970, and comparable state and tribal laws that regulate air emissions affect our U.S. coal mining operations both directly and indirectly.
Direct impacts on coal mining and processing operations may occur through the Clean Air Act permitting requirements and/or emission control requirements relating to particulate matter (PM), sulfur dioxide and ozone. It is possible that modifications to the national ambient air quality standards (NAAQS) could directly impact our mining operations in a manner that includes, but is not limited to, requiring changes in vehicle emissions standards or resulting in newly designated non-attainment areas. Furthermore, the U.S. Environmental Protection Agency (EPA) in 2009 adopted revised rules to add more stringent PM emissions limits for coal preparation and processing plants constructed or modified after April 28, 2008. Since 2011, the EPA has required underground coal mines to report on their greenhouse gas emissions.
The Clean Air Act indirectly, but more significantly, affects the U.S. coal industry by extensively regulating the air emissions of sulfur dioxide, nitrogen oxides, mercury, PM and other substances emitted by coal-fueled electricity generating plants. The air emissions programs that may affect our operations, directly or indirectly, include, but are not limited to, the Acid Rain Program, interstate transport rules, New Source Performance Standards (NSPS), Maximum Achievable Control Technology (MACT) emissions limits for Hazardous Air Pollutants, the Regional Haze program and New Source Review. In addition, in recent years the U.S. EPA has adopted more stringent NAAQS for PM, nitrogen oxide and sulfur dioxide. The EPA is expected to propose a more stringent ozone standard from the current standard. The Sierra Club and others requested the U.S. District Court for the Northern District of California on January 21, 2014 to order the EPA to propose a new ozone NAAQS by December 1, 2014 and issue a final rule by October 1, 2015. The actual final rule date remains unknown at this time. More stringent standards may trigger additional control technology for mining equipment, or result in additional challenges to permitting and expansion efforts. Many of these air emissions programs and regulations have resulted in litigation which has not been completely resolved.
14
In December 2009, the EPA published its finding that atmospheric concentrations of greenhouse gases endanger public health and welfare within the meaning of the Clean Air Act, and that emissions of greenhouse gases from new motor vehicles and motor vehicle engines are contributing to air pollution that are endangering public health and welfare within the meaning of the Clean Air Act. In May 2010, the EPA published final greenhouse gas emission standards for new motor vehicles pursuant to the Clean Air Act. Both the endangerment finding and motor vehicle standards have been the subject of litigation. Because the Clean Air Act specifies that the prevention of significant deterioration (PSD) program applies once emissions of regulated pollutants exceed either 100 or 250 tons per year (depending on the type of source), millions of sources previously unregulated under the Clean Air Act could be subject to greenhouse gas reduction measures. The EPA published a rule in June 2010 to limit the number of greenhouse gas sources that would be subject to the PSD program. In the so-called “tailoring rule,” the EPA limited the regulation of greenhouse gases from certain stationary sources to those that emit more than 75,000 tons of greenhouse gases per year (for sources that would be subject to PSD permitting regardless of greenhouse gas emissions due to other emissions) or 100,000 tons of greenhouse gases per year (for sources not subject to PSD permitting for any other air emissions), measured by “carbon dioxide equivalent.”
In a decision issued on June 26, 2012, the U.S. Court of Appeals for the District of Columbia (D.C. Circuit) affirmed the EPA's endangerment finding, its motor vehicle greenhouse gas rule and the tailoring rule. In a decision issued on December 20, 2012, the same court denied petitions to reconsider that decision. Petitions for review to the U.S. Supreme Court (Supreme Court) were filed, and on October 15, 2013, the Supreme Court accepted six petitions for review, but only a single question is being considered: “Whether the EPA permissibly determined that its regulation of greenhouse gas emissions from new motor vehicles triggered permitting requirements under the Clean Air Act for stationary sources that emit greenhouse gases.” A decision in the case will likely come by June 2014. This review will not affect the D.C. Circuit decision upholding the EPA’s 2009 “endangerment finding” with respect to greenhouse gas emissions from new motor vehicles. However, the decision could have a significant impact on EPA rules, proposed rules and rules under development that may affect the demand for coal, including the proposed NSPS for carbon dioxide emissions from new fossil fuel-fired electric utility generating units and the performance standards under development for carbon dioxide emissions from existing power plants.
Proposed NSPS for Fossil Fuel-Fired Electricity Utility Generating Units.
On April 13, 2012, the EPA published for comment proposed NSPS for emissions of carbon dioxide from new fossil fuel-fired electric utility generating units. If those standards are adopted as proposed, it is unlikely, with a few possible exceptions, that any new coal-fired electric utility generating units could be constructed in the U.S. as CCS technologies are not yet commercially viable.
In light of over 2 million comments on its April 13, 2012 proposal and ongoing developments in the industry, the EPA subsequently indicated its intention to issue a new proposal. On June 25, 2013, the U.S. President directed the EPA to issue that new proposal by September 30, 2013 and to finalize it in a timely manner. On September 20, 2013, the EPA revoked its April 13, 2012 proposal and issued a new proposed NSPS for emissions of carbon dioxide from new fossil fuel-fired electric utility generating units, using section 111(b) of the Clean Air Act. On January 8, 2014, the re-proposal was published in the Federal Register, with the comment deadline stated as March 10, 2014.
The EPA has not yet proposed rules for modified sources under section 111(b) of the Clean Air Act or existing sources under section 111(d) of the Clean Air Act. However, the U.S. President directed the EPA, in the June 25, 2013 statement referred to above, to issue such standards, regulations or guidelines, as appropriate, addressing carbon pollution from existing, modified and reconstructed power plants. The President also requested that the EPA: (a) issue a proposal addressing such matters by June 1, 2014; (b) finalize it by June 1, 2015; and (c) include, in the guidelines addressing existing power plants, a requirement that states submit to the EPA implementation plans required under Section 111(d) of the Clean Air Act by June 30, 2016. We believe that any final rules issued by the EPA in this area will be challenged.
Cross State Air Pollution Rule (CSAPR).
On July 6, 2011, the EPA finalized the CSAPR, which requires 28 states from Texas eastward (not including the New England states or Delaware) to significantly improve air quality by reducing power plant emissions that cross state lines and contribute to ozone and/or fine particle pollution in other states. Under the CSAPR, the first phase of the nitrogen oxide and sulfur dioxide emissions reductions was to commence in 2012 with further reductions effective in 2014. In October 2011, the EPA proposed amendments to the CSAPR to increase emission budgets in ten states, including Texas, and ease limits on market-based compliance options. While the CSAPR had an initial compliance deadline of January 1, 2012, the rule was challenged and on December 30, 2011, the D.C. Circuit stayed the rule and advised that the EPA is expected to continue administering the Clean Air Interstate Rule (CAIR) until the pending challenges are resolved. The court vacated the CSAPR on August 21, 2012, in a 2 to 1 decision, concluding that the rule was beyond the EPA's statutory authority. On October 5, 2012, the EPA petitioned for en banc review of that decision by the entire D.C. Circuit, which denied the EPA's petition on January 24, 2013. On March 29, 2013, the Solicitor General's Office, on behalf of the EPA, and, separately, certain non-governmental organizations, filed petitions for writs of certiorari with the Supreme Court seeking Supreme Court review of the D.C. Circuit's decision. The Supreme Court granted these petitions on June 24, 2013, held oral arguments on December 10, 2013 and will likely issue a decision by June 2014.
15
Mercury and Air Toxic Standards (MATS).
On December 16, 2011, the EPA issued MATS, which imposes MACT emission limits on hazardous air emissions from new and existing coal-fueled electric generating plants. The rule also revised NSPS for nitrogen oxides, sulfur dioxides and particulate matter for new and modified coal-fueled electricity generating plants. The MACT rule provides three years for compliance and a possible fourth year as a state permitting agency may deem necessary. On March 28, 2013, the EPA issued reconsidered MACT standards for new plants that are less stringent in some aspects than the standards issued in December 2011. On June 24, 2013, certain environmental organizations and industry groups filed an appeal of these regulations in the D.C. Circuit, and oral arguments were held on December 10, 2013. The rule could result in the retirement of certain older coal plants.
Clean Water Act.
The Clean Water Act of 1972 directly impacts U.S. coal mining operations by requiring effluent limitations and treatment standards for wastewater discharge from mines through the National Pollutant Discharge Elimination System (NPDES). Regular monitoring, reporting and performance standards are requirements of NPDES permits that govern the discharge of water from mine-related point sources into receiving waters.
The U.S. Army Corps of Engineers (Corps) regulates certain activities affecting navigable waters and waters of the U.S., including wetlands. Section 404 of the Clean Water Act requires mining companies to obtain Corps permits to place material in streams for the purpose of creating slurry ponds, water impoundments, refuse areas, valley fills or other mining activities.
States are empowered to develop and apply “in stream” water quality standards. These standards are subject to change and must be approved by the EPA. Discharges must either meet state water quality standards or be authorized through available regulatory processes such as alternate standards or variances. “In stream” standards vary from state to state. Additionally, through the Clean Water Act section 401 certification program, states have approval authority over federal permits or licenses that might result in a discharge to their waters. States consider whether the activity will comply with their water quality standards and other applicable requirements in deciding whether or not to certify the activity.
In September 2013, a draft rule identifying waters protected by the Clean Water Act was sent to the Office of Management and Budget. This draft rule may be formally proposed by the EPA in early 2014, but we believe the final rule will not likely be issued until 2015. Litigation is likely from various stakeholders. If CWA authority is eventually expanded, it may impact our operations in some areas by way of additional requirements.
National Environmental Policy Act (NEPA).
NEPA, signed into law in 1970, requires federal agencies to review the environmental impacts of their decisions and issue either an environmental assessment or an environmental impact statement. We must provide information to agencies when we propose actions that will be under the authority of the federal government. The NEPA process involves public participation and can involve lengthy timeframes.
Resource Conservation and Recovery Act (RCRA).
RCRA, which was enacted in 1976, affects U.S. coal mining operations by establishing “cradle to grave” requirements for the treatment, storage and disposal of hazardous wastes. Typically, the only hazardous wastes generated at a mine site are those from products used in vehicles and for machinery maintenance. Coal mine wastes, such as overburden and coal cleaning wastes, are not considered hazardous wastes under RCRA.
Subtitle C of RCRA exempted fossil fuel combustion wastes from hazardous waste regulation until the EPA completed a report to Congress and made a determination on whether the wastes should be regulated as hazardous. A recent federal district court decision in the District of Columbia requires the EPA to soon submit to the court a proposed deadline for completing the agency’s CCR rulemaking process. This EPA initiative is separate from the OSM CCR rulemaking mentioned above.
Comprehensive Environmental Response, Compensation and Liability Act (CERCLA).
Although typically not applied to the coal mining sector, CERCLA, which was enacted in 1980, nonetheless may affect U.S. coal mining operations by creating liability for investigation and remediation in response to releases of hazardous substances into the environment and for damages to natural resources. Under CERCLA, joint and several liabilities may be imposed on waste generators, site owners or operators and others, regardless of fault.
Toxic Release Inventory.
Arising out of the passage of the Emergency Planning and Community Right-to-Know Act in 1986 and the Pollution Prevention Act passed in 1990, the EPA's Toxic Release Inventory program requires companies to report the use, manufacture or processing of listed toxic materials that exceed established thresholds, including chemicals used in equipment maintenance, reclamation, water treatment and ash received for mine placement from power generation customers.
Endangered Species Act (ESA).
The ESA of 1973 and counterpart state legislation is intended to protect species whose populations allow for categorization as either endangered or threatened. Changes in listings or requirements under these regulations could have a material adverse effect on our our costs or our ability to mine some of our properties in accordance with our current mining plans.
16
Use of Explosives.
Our surface mining operations are subject to numerous regulations relating to blasting activities. Pursuant to these regulations, we incur costs to design and implement blast schedules and to conduct pre-blast surveys and blast monitoring. The storage of explosives is subject to strict federal regulatory requirements. The U.S. Bureau of Alcohol, Tobacco and Firearms (ATF) regulates the use of explosive blasting materials. In addition to ATF regulation, the Department of Homeland Security (DHS) is expected to finalize an ammonium nitrate security program rule in 2014. While such new regulations may result in additional costs related to our surface mining operations, such costs are not expected to have a material adverse effect on our results of operations, financial condition or cash flows.
Regulatory Matters — Australia
The Australian mining industry is regulated by Australian federal, state and local governments with respect to environmental issues such as land reclamation, water quality, air quality, dust control, noise, planning issues (such as approvals to expand existing mines or to develop new mines) and health and safety issues. The Australian federal government retains control over the level of foreign investment and export approvals. Industrial relations are regulated under both federal and state laws. Australian state governments also require coal companies to post deposits or give other security against land which is being used for mining, with those deposits being returned or security released after satisfactory reclamation is completed.
Native Title and Cultural Heritage.
Since 1992, the Australian courts have recognized that native title to lands, as recognized under the laws and customs of the Aboriginal inhabitants of Australia, may have survived the process of European settlement. These developments are supported by the Federal Native Title Act which recognizes and protects native title, and under which a national register of native title claims has been established. Native title rights do not extend to minerals; however, native title rights can be affected by the mining process unless those rights have previously been extinguished. There is also federal and state legislation to prevent damage to Aboriginal cultural heritage and archaeological sites.
Mining Tenements and Environmental.
In Queensland and New South Wales, the development of a mine requires both the grant of a right to impact the environment and an approval which authorizes the environmental impact. These approvals are obtained under separate legislation from separate government authorities. However, the application processes run concurrently and are also concurrent with any native title or cultural heritage process that is required. The environmental impacts of mining projects are regulated by state and federal governments. Federal regulation will only apply if the particular project will significantly impact a matter of national environmental significance (for example, a water resource, an endangered species or particular protected places). Environmental approvals processes involve complex issues that, on occasion, require lengthy studies and documentation.
Our Australian mining operations are generally subject to local, state and federal laws and regulations. At the federal level, these legislative acts include, but are not limited to, the Environment Protection and Biodiversity Act 1999, Native Title Act 1993, Australian Heritage Council Act 2003 and the Aboriginal and Torres Strait Islander Heritage Protection Act 1984.
In Queensland, laws and regulations related to mining include, but are not limited to, the Mineral Resources Act 1989, Environmental Protection Act 1994 (EP Act), Environmental Protection Regulation 1998, Integrated Planning Act 1997, Building Act 1975, Explosives Act 1999, Aboriginal Cultural Heritage Act 2003, Water Act 2000, State Development and Public Works Organisation Act 1971, Queensland Heritage Act 1992, Transport Infrastructure Act 1994, Nature Conservation Act 1992, Vegetation Management Act 1999, Land Protection (Pest and Stock Route Management) Act 2002, Land Act 1994, Fisheries Act 1994 and Forestry Act 1959. Under the EP Act, policies have been developed to achieve the objectives of the law and provide guidance on specific areas of the environment, including air, noise, water and waste management. State planning policies address matters of Queensland State interest, and must be adhered to during mining project approvals. Increased emphasis has recently been placed on topics including, but not limited to, hazardous dams assessment and the protection of strategic cropping land.
In New South Wales, laws and regulations related to mining include, but are not limited to, the Mining Act 1992, Coal Mines Regulation Act 1982, Mine Subsidence Compensation Act 1961, Environmental Planning and Assessment Act 1979 (EP&A Act), Environmental Planning and Assessment Regulations 2000, Protection of the Environment Operations Act 1997, Contaminated Land Management Act 1997, Explosives Act 2003, Water Management Act 2000, Water Act 1912, Radiation Control Act 1990, Heritage Act 1977, Aboriginal Land Rights Act 1983, Crown Lands Act 1989, Dangerous Goods Act 2008, Fisheries Management Act 1994, Forestry Act 1916, Native Title (New South Wales) Act 1994, Native Vegetation Act 2003, Noxious Weeds Act 1993, Roads Act 1993, and National Parks & Wildlife Act 1974. Under the EP&A Act, environmental planning instrument provisions must be taken into consideration. There are multiple State Environmental Planning Policies (SEPPs) relevant to coal projects in New South Wales. Amendments to the SEPPs related to mining surrounding the protection of agriculture, water resources and critical industry clusters are under consideration.
17
Occupational Health and Safety.
State legislation requires us to provide and maintain a safe working environment for the people employed in our mines including by providing safe systems of work, safety equipment and appropriate information, instruction, training and supervision. In recognition of the specialized nature of mining and mining activities, specific occupational health and safety obligations have been mandated under state legislation specific to the coal mining industry. There are some differences in the application and detail of the laws, and mining operators, directors, officers and certain other employees are all subject to the obligations under this legislation.
Industrial Relations.
A national industrial relations system administered by the federal government applies to all private sector employers and employees. The matters regulated under the national system include employment conditions, unfair dismissal, enterprise bargaining, industrial action and resolution of workplace disputes. Many of the workers employed in our mines are covered by enterprise agreements approved under the national system.
National Greenhouse and Energy Reporting Act 2007 (NGER Act).
In 2007, a single, national reporting system relating to greenhouse gas emissions, energy use and energy production was introduced. The NGER Act imposes requirements for corporations meeting a certain threshold to register and report greenhouse gas emissions and abatement actions, as well as energy production and consumption. Information collected through this system provides the basis for assessing liability under a carbon pricing mechanism. The Clean Energy Regulator administers the NGER Act. The Department of Environment is responsible for NGER Act-related policy developments and review. Both foreign and local corporations that meet the prescribed carbon dioxide and energy production or consumption limits in Australia (Controlling Corporations) must comply with the NGER Act. One of our subsidiaries is now registered as a Controlling Corporation and must report annually on the greenhouse gas emissions and energy production and consumption of our Australian entities.
Queensland Royalty
. In September 2012, the State of Queensland announced new royalty rates on coal prices. The royalty change went into effect on October 1, 2012 and raised the royalty payment to the State of Queensland on coal prices over $100 per tonne from 10% to 12.5% for pricing up to $150 per tonne and 15% on pricing over $150 per tonne. There was no change to the 7% rate for coal sold below $100 per tonne. The ultimate impact of these royalty rates will depend upon the volume of tonnes produced at each of our Queensland mining locations and coal prices received for those tonnes.
2013 Australian Elections.
A federal election to determine the members of the 44th Parliament of Australia was held on September 7, 2013, resulting in the overall defeat of the incumbent Australian Labor Party by the Liberal-National Party coalition (the Coalition). Prior to the election, the Coalition called for the repeal of the Australian government’s carbon pricing framework and Minerals Resource Rent Tax (MRRT), both of which are discussed in additional detail below, and reiterated that stance when it released its Resource and Energy Policy. On November 20, 2013, Australia's House of Representatives voted to repeal the carbon pricing framework and the MRRT, thereby sending the related legislative packages to the Senate for consideration in 2014. While we would anticipate a modest improvement in our costs from the repeal of this legislation, the timing and likelihood of success of such a repeal remains uncertain.
Carbon Pricing Framework.
The Australian government's carbon pricing framework commenced on July 1, 2012, with an initial carbon price of $23.00 Australian dollars per tonne of carbon dioxide equivalent emissions, scheduled to escalate by 2.5% per year for inflation over a three year period and transition to an emissions trading scheme after June 30, 2015. All of our Australian operations have been impacted by the fugitive emissions portion of the framework (defined as the methane and carbon dioxide which escapes into the atmosphere when coal is mined and gas is produced). Net of transition benefits, we recognized expense of approximately $40 million and $15 million in 2013 and 2012, respectively, related to this framework.
MRRT.
On March 29, 2012, Australia passed legislation creating the MRRT effective from July 1, 2012. The MRRT is a profits-based tax of our existing and future Australian coal projects at an effective tax rate of 22.5%. Under the MRRT, taxpayers are able to elect a market value asset starting base for existing projects which allows for the fair market value of the tenements to be deducted over the life of the mine as an allowance against MRRT. The market value allowance, and ultimately any future benefit, is subject to numerous uncertainties, including review and approval by the Australian Tax Office, realization only after other MRRT allowances provided under the law and estimates of long-term pricing and cost data necessary to estimate the future benefit and any MRRT liability. We have evaluated the provisions of the new tax and assessed recoverability of deferred tax assets and the valuation of liabilities associated with the implementation of the MRRT. As of December 31, 2013, we had recorded a net deferred tax asset of approximately $15 million related to the MRRT.
18
Regulatory Matters — Financial Markets and Derivatives
Dodd-Frank Act - Derivatives Regulation.
On July 21, 2010, the Dodd-Frank Wall Street Reform and Consumer Protection Act (the Dodd-Frank Act) was enacted, which among other things, requires the Commodity Futures Trading Commission (CFTC) and the SEC to adopt new comprehensive regulations related to financial derivative transactions. The CFTC and SEC have finalized many definitions and rule makings and the full impact of the new regulatory regime has mostly taken shape. We are eligible for the commercial end-user exemption available under the Dodd-Frank Act and are in full compliance with the finalized portion of these regulations. We expect that the Dodd-Frank Act will primarily continue to impact us through an increase in compliance and transaction costs associated with our corporate hedging and trading and brokerage activities.
European Markets Infrastructure Regulation (EMIR).
In July 2012, the European Commission adopted EMIR, which is related to over-the-counter derivatives, central counterparties and trade repositories. EMIR requires that information on all European derivative transactions be reported to trade repositories and accessible to supervisory authorities, including the European Securities and Markets Authority. The regulation also requires standard derivative contracts to be cleared through Central Counterparties (CCPs), requires margining for uncleared trades and establishes stringent organizational, business conduct and prudential requirements for these CCPs. In December 2012, the European Commission adopted technical standards complimenting the regulation. We expect that EMIR and the related technical standards will increase compliance and transaction costs associated with our corporate hedging and trading and brokerage activities. The legislation is not expected to have an impact on our trading strategies utilized to hedge or mitigate risk related to asset production and commercial activities.
Markets in Financial Instruments Directive (MiFID).
In October 2011, the European Commission adopted proposals to revise its MiFID and to enact a new Markets in Financial Instruments Regulation. We expect these will increase compliance and transaction costs associated with our corporate hedging and trading and brokerage activities.
Regulatory Matters — Mongolia
As noted above, we currently own a 50% interest in the Peabody-Winsway Resources B.V. joint venture, which holds coal and mineral interests in Mongolia and is regulated by Mongolian federal, provincial and local governments with respect to exploration, development, production, occupational health, mine safety, water use, environmental protection and remediation, foreign investment and other related matters. The Mineral Resources Authority of Mongolia is the government agency with the authority to issue, extend and revoke mineral licenses, which generally give the license holder the right to engage in the mining of minerals within the license area for 30 years (with the right to extend for two additional periods of 20 years). Mongolian law provides for state participation in the exploitation of any mineral deposit of “strategic importance,” as determined by the Mongolian Parliament.
Global Climate
In the U.S., Congress has considered legislation addressing global climate issues and greenhouse gas emissions, but to date nothing has been enacted. While it is possible that the U.S. will adopt legislation in the future, the timing and specific requirements of any such legislation are uncertain. In the absence of new U.S. federal legislation, the EPA is undertaking steps to regulate greenhouse gas emissions pursuant to the Clean Air Act. In response to the 2007 U.S. Supreme Court ruling in Massachusetts v. EPA, the EPA has commenced several rulemaking projects as described under “Regulatory Matters-U.S. - Clean Air Act.”
A number of states in the U.S. have adopted programs to regulate greenhouse gas emissions. For example, 10 northeastern states (Connecticut, Delaware, Maine, Maryland, Massachusetts, New Hampshire, New Jersey, New York, Rhode Island and Vermont) entered into the Regional Greenhouse Gas Initiative (RGGI) in 2005, which is a mandatory cap-and-trade program to cap regional carbon dioxide emissions from power plants. In 2011, New Jersey announced its withdrawal from RGGI effective January 1, 2012. Six midwestern states (Illinois, Iowa, Kansas, Michigan, Minnesota and Wisconsin) and one Canadian province have entered into the Midwestern Regional Greenhouse Gas Reduction Accord (MGGRA) to establish voluntary regional greenhouse gas reduction targets and develop a voluntary multi-sector cap-and-trade system to help meet the targets. It has been reported that, while the MGGRA has not been formally suspended, the participating states are no longer pursuing it. Seven western states (Arizona, California, Montana, New Mexico, Oregon, Utah and Washington) and four Canadian provinces entered into the Western Climate Initiative (WCI) in 2008 to establish a voluntary regional greenhouse gas reduction goal and develop market-based strategies to achieve emissions reductions. However, in November 2011, the WCI announced that six states had withdrawn from the WCI, leaving California and four Canadian provinces as the remaining members. Of those five jurisdictions, only California and Quebec have adopted greenhouse gas cap-and-trade regulations to date and both programs have begun operating. Many of the states and provinces that left WCI, RGGI and MGGRA, along with many that continue to participate, have joined the new North America 2050 initiative, which seeks to reduce greenhouse gas emissions and create economic opportunities in ways not limited to cap-and-trade programs.
19
In the U.S., several states have enacted legislation establishing greenhouse gas emissions reduction goals or requirements. In addition, several states have enacted legislation or have in effect regulations requiring electricity suppliers to use renewable energy sources to generate a certain percentage of power or that provide financial incentives to electricity suppliers for using renewable energy sources.
We participated in the Department of Energy's Voluntary Reporting of Greenhouse Gases Program until its suspension in May 2011, and regularly disclose in our Corporate and Social Responsibility Report the quantity of emissions per ton of coal produced by us in the U.S. The vast majority of our emissions are generated by the operation of heavy machinery to extract and transport material at our mines.
In 2013, the U.S. and a number of international development banks, including the World Bank, the European Investment Bank and the European Bank for Reconstruction and Development, announced that they would no longer provide financing for the development of new coal-fueled power plants or would do so only in narrowly defined circumstances. Other international development banks, such as the Asian Development Bank, have indicated that they will continue to provide such financing.
The Kyoto Protocol, adopted in December 1997 by the signatories to the 1992 United Nations Framework Convention on Climate Change, established a binding set of emission targets for developed nations. The U.S. signed the Kyoto Protocol but it was not ratified by the U.S. Senate. Australia ratified the Kyoto Protocol in December 2007 and became a full member in March 2008. There are continuing discussions to develop a treaty to replace the Kyoto Protocol after its expiration in 2012, including at the Cancun meetings in late 2010, the Durban meeting in late 2011 and the Doha meeting in late 2012. At the Doha meeting, an amendment to the Kyoto Protocol was adopted, which includes new commitments for certain parties in a second commitment period, from 2013 to 2020.
Australia's Parliament passed carbon pricing legislation in November 2011. The first three years of the program involve the imposition of a carbon tax that commenced in July 2012 and a mandatory greenhouse gas emissions trading program commencing in 2015. On November 20, 2013, Australia's House of Representatives voted to repeal the carbon pricing framework, thereby sending the related legislative package to the Senate for consideration in 2014.
Enactment of laws or passage of regulations by the U.S. or some of its states or by other countries regarding emissions from the mining of coal, or other actions to limit such emissions, are not expected to have a material adverse effect on our results of operations, financial condition or cash flows.
Enactment of laws or passage of regulations regarding emissions from the combustion of coal by the U.S., some of its states or other countries, or other actions to limit such emissions, could result in electricity generators switching from coal to other fuel sources. Further, policies limiting available financing for the development of new coal-fueled power plants could adversely impact the global demand for coal in the future. The potential financial impact on us of future laws, regulations or other policies will depend upon the degree to which any such laws or regulations force electricity generators to diminish their reliance on coal as a fuel source. That, in turn, will depend on a number of factors, including the specific requirements imposed by any such laws, regulations or other policies, the time periods over which those laws, regulations or other policies would be phased in, the state of commercial development and deployment of CCS technologies and the alternative markets for coal. In view of the significant uncertainty surrounding each of these factors, it is not possible for us to reasonably predict the impact that any such laws, regulations or other policies may have on our results of operations, financial condition or cash flows.
Available Information
We file or furnish annual, quarterly and current reports (including any exhibits or amendments to those reports), proxy statements and other information with the SEC. These materials are available free of charge through our website (www.peabodyenergy.com) as soon as reasonably practicable after such material is electronically filed with, or furnished to, the SEC. Information included on our website does not constitute part of this document. These materials may also be accessed through the SEC's website (www.sec.gov) or in the SEC’s Public Reference Room located at 100 F Street, N.E., Washington, D.C. 20549. Information on the operation of the Public Reference Room may be obtained by calling 1-800-SEC-0330.
In addition, copies of our filings will be made available, free of charge, upon request by telephone at (314) 342-7900 or by mail at: Peabody Energy Corporation, Peabody Plaza, 701 Market Street, St. Louis, Missouri 63101-1826, attention: Investor Relations.
20
Item 1A.
Risk Factors.
We operate in a rapidly changing environment that involves a number of risks. The following discussion highlights some of these risks and others are discussed elsewhere in this report. These and other risks could materially and adversely affect our business, financial condition, prospects, operating results or cash flows. The following risk factors are not an exhaustive list of the risks associated with our business. New factors may emerge or changes to these risks could occur that could materially affect our business.
Risks Associated with Our Operations
Our profitability depends upon the prices we receive for our coal.
Coal prices are dependent upon factors beyond our control, including:
|
•
|
the strength of the global economy;
|
|
•
|
the demand for electricity;
|
|
•
|
the demand for steel, which may lead to price fluctuations in the periodic repricing of our metallurgical coal contracts;
|
|
•
|
the global supply of thermal and metallurgical coal;
|
|
•
|
changes in the fuel consumption patterns of electric power generators;
|
|
•
|
weather patterns and natural disasters;
|
|
•
|
competition within our industry and the availability, quality and price of alternative fuels, including natural gas, fuel oil, nuclear, hydroelectric, wind, biomass and solar power;
|
|
•
|
the proximity, capacity and cost of transportation and terminal facilities;
|
|
•
|
coal and natural gas industry output and capacity;
|
|
•
|
governmental regulations and taxes, including those establishing air emission standards for coal-fueled power plants or mandating increased use of electricity from renewable energy sources;
|
|
•
|
regulatory, administrative and judicial decisions, including those affecting future mining permits and leases; and
|
|
•
|
technological developments, including those related to alternative energy sources, those intended to convert coal-to-liquids or gas and those aimed at capturing and storing carbon dioxide.
|
In the U.S., our strategy is to selectively renew, or enter into new, long-term supply agreements when we can do so at prices we believe are favorable. In Australia, current industry practice, and our typical practice, is to negotiate pricing for metallurgical coal contracts quarterly and seaborne thermal coal contracts annually, with a portion sold on a shorter-term basis.
If a substantial number of our long-term coal supply agreements terminate, our revenues and operating profits could suffer if we are unable to find alternate buyers willing to purchase our coal on comparable terms to those in our contracts.
Most of our sales are made under coal supply agreements, which are important to the stability and profitability of our operations. The execution of a satisfactory coal supply agreement is frequently the basis on which we undertake the development of coal reserves required to be supplied under the contract, particularly in the U.S.
Many of our coal supply agreements contain provisions that permit the parties to adjust the contract price upward or downward at specified times. We may adjust these contract prices based on inflation or deflation and/or changes in the factors affecting the cost of producing coal, such as taxes, fees, royalties and changes in the laws regulating the mining, production, sale or use of coal. In a limited number of contracts, failure of the parties to agree on a price under those provisions may allow either party to terminate the contract. We sometimes experience a reduction in coal prices in new long-term coal supply agreements replacing some of our expiring contracts. Coal supply agreements also typically contain force majeure provisions allowing temporary suspension of performance by us or the customer during the duration of specified events beyond the control of the affected party. Most of our coal supply agreements contain provisions requiring us to deliver coal meeting quality thresholds for certain characteristics such as Btu, sulfur content, ash content, grindability and ash fusion temperature. Failure to meet these specifications could result in economic penalties, including price adjustments, the rejection of deliveries or termination of the contracts. Moreover, some of these agreements permit the customer to terminate the contract if transportation costs, which our customers typically bear, increase substantially. In addition, some of these contracts allow our customers to terminate their contracts in the event of changes in regulations affecting our industry that restrict the use or type of coal permissible at the customer’s plant or increase the price of coal beyond specified limits.
21
The operating profits we realize from coal sold under supply agreements depend on a variety of factors. In addition, price adjustment and other provisions may increase our exposure to short-term coal price volatility provided by those contracts. If a substantial portion of our coal supply agreements were modified or terminated, we could be materially adversely affected to the extent that we are unable to find alternate buyers for our coal at the same level of profitability. Market prices for coal vary by mining region and country. As a result, we cannot predict the future strength of the coal market overall or by mining region and cannot provide assurance that we will be able to replace existing long-term coal supply agreements at the same prices or with similar profit margins when they expire.
The loss of, or significant reduction in, purchases by our largest customers could adversely affect our revenues.
For the year ended December 31,
2013
, we derived
25%
of our total revenues from our five largest customers. Those five customers were supplied primarily from
46
coal supply agreements (excluding trading transactions) expiring at various times from 2014 to 2026. The contract contributing the greatest amount of annual revenue in
2013
was approximately
$340 million
, or approximately
5%
of our
2013
total revenue base. We are currently discussing the extension of existing agreements or entering into new long-term agreements with some of these customers, but these negotiations may not be successful and those customers may not continue to purchase coal from us under long-term coal supply agreements. If a number of these customers significantly reduce their purchases of coal from us, or if we are unable to sell coal to them on terms as favorable to us as the terms under our current agreements, our financial condition and results of operations could suffer materially. In addition, our revenue could be adversely affected by a decline in customer purchases due to lack of demand, cost of competing fuels and environmental and other governmental regulations.
Our operating results could be adversely affected by unfavorable economic and financial market conditions.
In recent years, the global economic recession and the worldwide financial and credit market disruptions had a negative impact on us and on the coal industry generally. If any of these conditions return, if coal prices continue at or below levels experienced in
2013
for a prolonged period or if there are further downturns in economic conditions, particularly in developing countries such as China and India, our business, financial condition or results of operations could be adversely affected. While we are focused on cost control, productivity improvements, increased contributions from our high-margin operations and capital discipline, there can be no assurance that these actions, or any others we may take, will be sufficient in response to challenging economic and financial conditions.
Our ability to collect payments from our customers could be impaired if their creditworthiness or contractual performance deteriorates.
Our ability to receive payment for coal sold and delivered or for financially settled contracts depends on the continued creditworthiness and contractual performance of our customers and counterparties. Our customer base has changed with deregulation in the U.S. as utilities have sold their power plants to their non-regulated affiliates or third parties and with our continued expansion in the Asia-Pacific region. These new customers may have credit ratings that are below investment grade or are not rated. If deterioration of the creditworthiness of our customers occurs or they fail to perform the terms of their contracts with us, our accounts receivable securitization program and our business could be adversely affected.
Risks inherent to mining could increase the cost of operating our business.
Our mining operations are subject to conditions that can impact the safety of our workforce, or delay coal deliveries or increase the cost of mining at particular mines for varying lengths of time. These conditions include fires and explosions from methane gas or coal dust; accidental mine water discharges; weather, flooding and natural disasters; unexpected maintenance problems; unforeseen delays in implementation of mining technologies that are new to our operations; key equipment failures; variations in coal seam thickness; variations in coal quality; variations in the amount of rock and soil overlying the coal deposit; variations in rock and other natural materials and variations in geologic conditions. We maintain insurance policies that provide limited coverage for some of these risks, although there can be no assurance that these risks would be fully covered by our insurance policies. Despite our efforts, such conditions could occur and have a substantial impact on our results of operations, financial condition or cash flows.
If transportation for our coal becomes unavailable or uneconomic for our customers, our ability to sell coal could suffer.
Transportation costs represent a significant portion of the total cost of coal use and the cost of transportation is a critical factor in a customer’s purchasing decision. Increases in transportation costs and the lack of sufficient rail and port capacity could lead to reduced coal sales. As of December 31,
2013
, certain of our coal supply agreements permit the customer to terminate the contract if the cost of transportation increases by an amount over specified levels in any given 12-month period.
22
We depend upon rail, barge, trucking, overland conveyor and ocean-going vessels to deliver coal to our customers. While our coal customers typically arrange and pay for transportation of coal from the mine or port to the point of use, disruption of these transportation services because of weather-related problems, infrastructure damage, strikes, lock-outs, lack of fuel or maintenance items, underperformance of the port and rail infrastructure, congestion and balancing systems which are imposed to manage vessel queuing and demurrage, non-performance or delays by co-shippers, transportation delays or other events could temporarily impair our ability to supply coal to our customers and thus could adversely affect our results of operations.
A decrease in the availability or increase in costs of key supplies, capital equipment or commodities such as diesel fuel, steel, explosives and tires could decrease our anticipated profitability.
Our mining operations require a reliable supply of mining equipment, replacement parts, fuel, explosives, tires, steel-related products (including roof control materials), lubricants and electricity. There has been some consolidation in the supplier base providing mining materials to the coal industry, such as with suppliers of explosives in the U.S. and both surface and underground equipment globally, that has limited the number of sources for these materials. In situations where we have chosen to concentrate a large portion of purchases with one supplier, it has been to take advantage of cost savings from larger volumes of purchases and to ensure security of supply. If the cost of any of these inputs increased significantly, or if a source for these supplies or mining equipment were unavailable to meet our replacement demands, our profitability could be reduced or we could experience a delay or halt in our production.
Take-or-pay arrangements within the coal industry could significantly affect our costs and the prices we receive for our coal products.
We have substantial take-or-pay arrangements, predominately in Australia, totaling
$3.7 billion
, with terms ranging up to
26
years, that commit us to pay a minimum amount for rail and port commitments for the delivery of coal even if those commitments go unused. The take-or-pay provisions in these contracts allow us to subsequently apply take-or-pay payments made to deliveries subsequently taken, but these provisions have limitations and we may not be able to utilize all such amounts paid if the limitations apply or if we do not subsequently take sufficient volumes to utilize the amounts previously paid. Additionally, coal companies, including us, may continue to deliver coal during times when it might otherwise be optimal to suspend operations because these take-or-pay provisions effectively convert a marginal cost of selling coal to a fixed operating cost.
An inability of trading, brokerage, mining or freight counterparties to fulfill the terms of their contracts with us could reduce our profitability.
In conducting our trading, brokerage and mining operations, we utilize third-party sources of coal production and transportation, including contract miners and brokerage sources, to fulfill deliveries under our coal supply agreements. While we completed several conversions to owner-operator status at certain of our Australian operations in 2013, a portion of our sales volume continues to come from mines that utilize contract miners. Employee relations at mines that use contract miners are the responsibility of the contractor.
Our profitability or exposure to loss on transactions or relationships is dependent upon the reliability (including financial viability) and price of the third-party suppliers; our obligation to supply coal to customers in the event that weather, flooding, natural disasters or adverse geologic mining conditions restrict deliveries from our suppliers; our willingness to participate in temporary cost increases experienced by our third-party coal suppliers; our ability to pass on temporary cost increases to our customers; the ability to substitute, when economical, third-party coal sources with internal production or coal purchased in the market and the ability of our freight sources to fulfill their delivery obligations. Market volatility and price increases for coal or freight on the international and domestic markets could result in non-performance by third-party suppliers under existing contracts with us, in order to take advantage of the higher prices in the current market. Such non-performance could have an adverse impact on our ability to fulfill deliveries under our coal supply agreements.
Our trading and hedging activities may expose us to earnings volatility and other risks.
We enter into hedging arrangements designed primarily to manage market price volatility of foreign currency (primarily the Australian dollar), diesel fuel, coal and explosives. Also, from time to time, we manage the interest rate risk associated with our variable and fixed rate borrowings using interest rate swaps. Generally, we attempt to designate hedging arrangements as cash flow hedges with gains or losses recorded as a separate component of stockholders’ equity until the hedged transaction occurs (or until hedge ineffectiveness is determined). While we utilize a variety of risk monitoring and mitigation strategies, those strategies require judgment and they cannot anticipate every potential outcome or the timing of such outcomes. As such, there is potential for these hedges to no longer qualify for hedge accounting. If that were to happen, we would be required to recognize the mark to market movements through current year earnings, possibly resulting in increased volatility in our income in future periods. In addition, to the extent that we engage in hedging activities, we may be prevented from realizing the benefits of future price changes of foreign currency, diesel fuel, coal and explosives.
23
We also enter into derivative trading instruments, some of which require us to post margin based on the value of those instruments and other credit factors. If our credit is downgraded, the fair value of our hedge portfolio moves significantly, or laws or regulations are passed requiring all hedge arrangements to be exchange-traded or exchange-cleared, we could be required to post additional margin, which could impact our liquidity.
Through our trading and hedging activities, we are also exposed to the nonperformance and credit risk with various counterparties, including exchanges and other financial intermediaries. Should the counterparties to these arrangements fail to perform, we may be forced to enter into alternative arrangements, which could negatively impact our profitability and/or liquidity. In addition, some of our trading and brokerage activities include an increasing number of exchange-settled transactions, which expose us to the margin requirements of the exchange for daily changes in the value of our positions. If there are significant and extended unfavorable price movements against our positions, or if there are future regulations that impose new margin requirements, position limits and capital charges, even if not directly applicable to us, our liquidity could be impacted.
We may not recover our investments in our mining, exploration and other assets, which may require us to recognize impairment charges related to those assets.
The value of our assets may be adversely affected by numerous uncertain factors, some of which are beyond our control, including unfavorable changes in the economic environments in which we operate, lower-than-expected coal pricing, technical and geological operating difficulties, an inability to economically extract our coal reserves and unanticipated increases in operating costs. These may cause us to fail to recover all or a portion of our investments in those assets and may trigger the recognition of impairment charges in the future, which could have a substantial impact on our results of operations.
As described in Note 2. "Asset Impairment and Mine Closure Costs" to the accompanying consolidated financial statements, we recognized aggregate asset impairment and mine closure costs of
$528.3 million
and
$929.0 million
in 2013 and 2012, respectively. Because of the volatile nature of U.S. and international coal markets, it is reasonably possible that our current estimates of projected future cash flows from our mining assets may change in the near term, which may result in the need for further adjustments to the carrying value of those assets or adjustments to assets not previously impaired.
Our ability to operate our company effectively could be impaired if we lose key personnel or fail to attract qualified personnel.
We manage our business with a number of key personnel, the loss of whom could have a material adverse effect on us, absent the completion of an orderly transition. In addition, we believe that our future success will depend greatly on our continued ability to attract and retain highly skilled and qualified personnel, particularly personnel with mining experience. We cannot provide assurance that key personnel will continue to be employed by us or that we will be able to attract and retain qualified personnel in the future. Failure to retain or attract key personnel could have a material adverse effect on us.
We could be negatively affected if we fail to maintain satisfactory labor relations.
As of December 31,
2013
, we had approximately
8,300
employees, which included approximately
5,900
hourly employees. Approximately
35%
of our hourly employees were represented by organized labor unions and generated
19%
of
2013
coal production. Additionally, those employed through contract mining relationships in Australia are also members of trade unions. Relations with our employees and, where applicable, organized labor are important to our success. If some or all of our current non-union operations were to become unionized, we could incur an increased risk of work stoppages, reduced productivity and higher labor costs. Also, if we fail to maintain good relations with our union workforce, we could experience labor disputes, work stoppages or other disruptions in production that could negatively impact our profitability.
24
Our mining operations could be adversely affected if we fail to appropriately secure our obligations.
U.S. federal and state laws and Australian laws require us to secure certain of our obligations to reclaim lands used for mining, to pay federal and state workers’ compensation, to secure coal lease obligations and to satisfy other miscellaneous obligations. The primary methods we use to meet those obligations are to post a corporate guarantee (i.e., self bond), provide a third-party surety bond or provide a letter of credit. As of December 31,
2013
, we had
$1,365.1 million
of self bonding in place for our reclamation obligations. As of December 31,
2013
, we also had outstanding surety bonds with third parties, bank guarantees and letters of credit of $
1,086.6 million
, of which $
586.0 million
was for post-mining reclamation, $
135.0 million
related to workers’ compensation obligations, $
109.9 million
was for coal lease obligations and $
255.7 million
was for other obligations, including road maintenance and performance guarantees. Surety bonds are typically renewable on a yearly basis. Surety bond issuers and holders may not continue to renew the bonds or may demand additional collateral upon those renewals, which may in turn affect our available liquidity. Our ability to maintain and acquire letters of credit is subject to us maintaining compliance under our two primary facilities used for such items, which is our 2013 Credit Facility and our accounts receivable securitization program. Our failure to retain, or inability to acquire, surety bonds or letters of credit or to provide a suitable alternative would have a material adverse effect on us. That failure could result from a variety of factors including the following:
|
•
|
lack of availability, higher expense or unfavorable market terms of new surety bonds;
|
|
•
|
restrictions on the availability of collateral for current and future third-party surety bond issuers under the terms of our indentures or our 2013 Credit Facility;
|
|
•
|
the exercise by third-party surety bond issuers of their right to refuse to renew the surety; and
|
|
•
|
the inability to renew our 2013 Credit Facility or a default thereunder.
|
Our ability to self bond reduces our costs of providing financial assurances. To the extent we are unable to maintain our current level of self bonding due to legislative or regulatory changes or changes in our financial condition, our costs would increase and our liquidity available for other uses would be reduced.
Our mining operations are extensively regulated, which imposes significant costs on us, and future regulations and developments could increase those costs or limit our ability to produce coal.
Governmental authorities regulate the coal mining industry with respect to matters such as employee health and safety, permitting and licensing requirements, air quality standards, water pollution, plant and wildlife protection, reclamation and restoration of mining properties after mining is completed, the discharge of materials into the environment, surface subsidence from underground mining and the effects that mining has on groundwater quality and availability. Numerous governmental permits and approvals are required for mining operations. We are required to prepare and present to governmental authorities data pertaining to the effect that any proposed exploration for or production of coal may have upon the environment. The public, including non-governmental organizations, opposition groups and individuals, have statutory rights to comment upon and submit objections to requested permits and approvals. The costs, liabilities and requirements associated with these regulations may be costly and time-consuming and may delay commencement or continuation of exploration or production.
The possibility exists that new legislation and/or regulations and orders related to the environment or employee health and safety may be adopted and may materially adversely affect our mining operations, our cost structure and/or our customers’ ability to use coal. New legislation or administrative regulations (or new interpretations by the relevant government of existing laws and regulations), including proposals related to the protection of the environment or the reduction of greenhouse gas emissions that would further regulate and tax the coal industry, may also require us or our customers to change operations significantly or incur increased costs. Some of our coal supply agreements contain provisions that allow a purchaser to terminate its contract if legislation is passed that either restricts the use or type of coal permissible at the purchaser’s plant or results in specified increases in the cost of coal or its use. These factors and legislation, if enacted, could have a material adverse effect on our financial condition and results of operations.
25
A number of laws, including in the U.S., CERCLA, impose liability relating to contamination by hazardous substances. Such liability may involve the costs of investigating or remediating contamination and damages to natural resources, as well as claims seeking to recover for property damage or personal injury caused by hazardous substances. Such liability may arise from conditions at formerly, as well as currently, owned or operated properties, and at properties to which hazardous substances have been sent for treatment, disposal or other handling. Liability under CERCLA and similar state statutes is without regard to fault, and typically is joint and several, meaning that a person may be held responsible for more than its share, or even all, of the liability involved. Our mining operations involve some use of hazardous materials. In addition, we have accrued for liability arising out of contamination associated with Gold Fields Mining, LLC (Gold Fields), a dormant, non-coal-producing subsidiary of ours that was previously managed and owned by Hanson PLC, or with Gold Fields’ former affiliates. Hanson PLC, which is a predecessor owner of ours, transferred ownership of Gold Fields to us in the February 1997 spin-off of its energy business. Gold Fields is currently a defendant in several lawsuits and has received notices of several other potential claims arising out of lead contamination from mining and milling operations. Gold Fields is also involved in investigating or remediating a number of other contaminated sites. See Note 24. "Commitments and Contingencies" to our consolidated financial statements for a description of pending legal proceedings involving Gold Fields.
Our mining operations are subject to extensive forms of taxation, which imposes significant costs on us, and future regulations and developments could increase those costs or limit our ability to produce coal competitively.
Federal, state, provincial or local governmental authorities in nearly all countries across the global coal mining industry impose various forms of taxation, including production taxes, sales-related taxes, royalties, environmental taxes, mining profits taxes and income taxes. If new legislation or regulations related to various forms of coal taxation, which increase our costs or limit our ability to compete in the areas in which we sell our coal, are adopted, our business, financial condition or results of operations could be adversely affected.
If the assumptions underlying our asset retirement obligations for reclamation and mine closures are materially inaccurate, our costs could be significantly greater than anticipated.
Our asset retirement obligations primarily consist of spending estimates for surface land reclamation and support facilities at both surface and underground mines in accordance with federal and state reclamation laws in the U.S. and Australia as defined by each mining permit. These obligations are determined for each mine using various estimates and assumptions including, among other items, estimates of disturbed acreage as determined from engineering data, estimates of future costs to reclaim the disturbed acreage and the timing of these cash flows, discounted using a credit-adjusted, risk-free rate. Our management and engineers periodically review these estimates. If our assumptions do not materialize as expected, actual cash expenditures and costs that we incur could be materially different than currently estimated. Moreover, regulatory changes could increase our obligation to perform reclamation and mine closing activities. The resulting estimated asset retirement obligation could change significantly if actual amounts change significantly from our assumptions, which could have a material adverse effect on our results of operations and financial condition.
Our future success depends upon our ability to continue acquiring and developing coal reserves that are economically recoverable.
Our recoverable reserves decline as we produce coal. We have not yet applied for the permits required or developed the mines necessary to use all of our reserves. Moreover, the amount of proven and probable coal reserves described in Part I, Item 2. “Properties” involved the use of certain estimates and those estimates could be inaccurate. Information about our reserves consists of estimates based on engineering, economic and geological data assembled and analyzed by our staff. Some of the factors and assumptions which impact economically recoverable coal reserve estimates include geological conditions, historical production from the area compared with production from other producing areas, the assumed effects of regulations and taxes by governmental agencies and assumptions governing future prices and future operating costs. Actual production, revenues and expenditures with respect to our coal reserves may vary materially from estimates.
Our future success depends upon our conducting successful exploration and development activities or acquiring properties containing economically recoverable reserves. Our current strategy includes increasing our reserves through acquisitions of government and other leases and producing properties and continuing to use our existing properties and infrastructure. In certain locations, leases for oil, natural gas and coalbed methane reserves are located on, or adjacent to, some of our reserves, potentially creating conflicting interests between us and lessees of those interests. Other lessees’ rights relating to these mineral interests could prevent, delay or increase the cost of developing our coal reserves. These lessees may also seek damages from us based on claims that our coal mining operations impair their interests. Additionally, the U.S. federal government limits the amount of federal land that may be leased by any company to 150,000 acres nationwide. As of December 31,
2013
, we leased a total of
72,580
acres from the federal government subject to those limitations. The limit could restrict our ability to lease additional U.S. federal lands.
26
Our planned mine development projects and acquisition activities may not result in significant additional reserves, and we may not have success developing additional mines. Most of our mining operations are conducted on properties owned or leased by us. Because we do not thoroughly verify title to most of our leased properties and mineral rights until we obtain a permit to mine the property, our right to mine some of our reserves may be materially adversely affected if defects in title or boundaries exist. In addition, in order to develop our reserves, we must also own the rights to the related surface property and receive various governmental permits. We cannot predict whether we will continue to receive the permits or appropriate land access necessary for us to operate profitably in the future. We may not be able to negotiate new leases from the government or from private parties, obtain mining contracts for properties containing additional reserves or maintain our leasehold interest in properties on which mining operations have not commenced during the term of the lease. From time to time, we have experienced litigation with lessors of our coal properties and with royalty holders. In addition, from time to time, our permit applications have been challenged.
Our global operations increase our risks unique to international mining and trading operations.
Our international platform increases our exposure to country risks and the effects of changes in currency exchange rates. Some of our international activities are in developing countries where the economic strength, business practices and counterparty reputations may not be as well developed as in our U.S. or Australian operations. We are exposed to various political risks, including political instability, the potential for expropriation of assets, costs associated with the repatriation of earnings and the potential for unexpected changes in regulatory requirements. Despite our efforts to mitigate these risks, our results of operations, financial position or cash flow could be adversely affected by these activities.
Joint ventures, partnerships or non-managed operations may not be successful and may not comply with our operating standards.
We participate in several joint venture and partnership arrangements, and may enter into others, all of which necessarily involve risk. Whether or not we hold majority interests or maintain operational control in our joint ventures, our partners may, among other things, have economic or business interests or goals that are inconsistent with, or opposed to, ours; seek to block actions that the we believe are in our or the joint venture’s best interests or be unable or unwilling to fulfill their obligations under the joint venture or other agreements, such as contributing capital. Where these joint ventures are jointly controlled or managed, we may provide expertise and advice but have limited control over compliance with our operational standards. Failure to adhere to equivalent standards at these operations could unfavorably affect operating costs and productivity and adversely impact our results of operations and reputation.
We are exposed to significant liability, reputational harm, loss of revenue, increased costs or other risks if we sustain cyber attacks or other security breaches that disrupt our operations or result in the dissemination of proprietary or confidential information about us, our customers or other third-parties.
We have implemented security protocols and systems with the intent of maintaining the physical security of our operations and protecting our and our counterparties' confidential information and information related to identifiable individuals against unauthorized access. Despite such efforts, we may be subject to security breaches which could result in unauthorized access to our facilities or the information we are trying to protect. Unauthorized physical access to one of our facilities or electronic access to our information systems could result in, among other things, unfavorable publicity, litigation by affected parties,
damage to sources of competitive advantage, disruptions to our operations, loss of customers, financial obligations for damages related to the theft or misuse of such information
and costs to remediate such security vulnerabilities, any of which could have a substantial impact on our results of operations, financial condition or cash flows.
Risks Associated with Our Indebtedness
We could be adversely affected by the failure of financial institutions to fulfill their commitments under our 2013 Credit Facility.
As of
December 31, 2013
, we had $1.65 billion of maximum borrowing capacity under the 2013 Revolver portion of our 2013 Credit Facility and
$1.5 billion
of available capacity under that facility, net of outstanding letters of credit. This committed facility, which matures on September 24, 2018 (or on August 15, 2018 if our 6.00% Senior Notes due 2018 are still in existence on such date), is provided by a syndicate of financial institutions, with each institution agreeing severally (and not jointly) to make revolving credit loans to us in accordance with the terms of the facility. Although the 2013 Credit Facility syndicate consists of over 25 financial institutions, if one or more of these institutions were to default on its obligation to fund its commitment, the portion of the facility provided by such defaulting financial institution would not be available to us.
27
Our financial performance could be adversely affected by our debt.
As of December 31,
2013
, our total indebtedness was
$6.0 billion
, and we had
$1.5 billion
of maximum borrowing capacity under the 2013 Revolver portion of our 2013 Credit Facility, net of outstanding letters of credit. The indentures governing our Convertible Junior Subordinated Debentures (the Debentures) and the 7.375%, 7.875%, 6.50%, 6.25% and 6.00% Senior Notes (collectively our Senior Notes) do not limit the amount of indebtedness that we may issue. The degree to which we are leveraged could have important consequences, including, but not limited to:
|
•
|
making it more difficult for us to pay interest and satisfy our debt obligations;
|
|
•
|
increasing the costs of borrowing under our existing credit facilities;
|
|
•
|
increasing our vulnerability to general adverse economic and industry conditions;
|
|
•
|
requiring the dedication of a substantial portion of our cash flow from operations to the payment of principal and interest on our indebtedness, thereby reducing the availability of our cash flow to fund working capital, capital expenditures, business development or other general corporate requirements;
|
|
•
|
limiting our ability to obtain additional financing to fund future working capital, capital expenditures, business development or other general corporate requirements;
|
|
•
|
making it more difficult to obtain surety bonds, letters of credit or other financing, particularly during periods in which credit markets are weak;
|
|
•
|
limiting our flexibility in planning for, or reacting to, changes in our business and in the coal industry;
|
|
•
|
causing a decline in our credit ratings; and
|
|
•
|
placing us at a competitive disadvantage compared to less leveraged competitors.
|
In addition, our debt agreements subject us to financial and other restrictive covenants. Failure by us to comply with these covenants could result in an event of default that, if not cured or waived, could have a material adverse effect on us and result in amounts outstanding thereunder to be immediately due and payable.
Any downgrade in our credit ratings could result in requirements to post additional collateral on derivative trading instruments, the loss of trading counterparties for corporate hedging and trading and brokerage activities or an increase in the cost of, or a limit our access to, various forms of credit used in operating our business.
If our cash flows and capital resources are insufficient to fund our debt service obligations, we may be forced to sell assets, seek additional capital or seek to restructure or refinance our indebtedness. These alternative measures may not be successful and may not permit us to meet our scheduled debt service obligations. In the absence of such operating results and resources, we could face substantial liquidity problems and might be required to sell material assets or operations to attempt to meet our debt service and other obligations. Certain agreements governing our indebtedness restrict our ability to sell assets and use the proceeds from the sales. We may not be able to complete those sales or obtain the proceeds which we could realize from them and these proceeds may not be adequate to meet any debt service obligations then due.
The covenants in our 2013 Credit Facility, and the indentures governing our Senior Notes and Debentures impose restrictions that may limit our operating and financial flexibility.
Our 2013 Credit Facility, the indentures governing our Senior Notes and our Debentures and the instruments governing our other indebtedness contain certain restrictions and covenants which restrict our ability to incur liens and/or debt or provide guarantees in respect of obligations of any other person. Under our 2013 Credit Facility, we must comply with certain financial covenants on a quarterly basis including a maximum net secured leverage ratio and minimum interest coverage ratio, as defined. The covenants also place limitations on our investments in joint ventures, unrestricted subsidiaries, indebtedness and the imposition of liens on our assets. If we do not remain in compliance with the covenants in our 2013 Credit Facility, we may be restricted in our ability to pay dividends, sell assets and make redemptions or repurchase capital stock. Also, because our ability to borrow under the 2013 Credit Facility is conditioned upon compliance with these covenants, our actual borrowing capacity under the 2013 Credit Facility at any time may be less than the maximum borrowing capacity.
Adverse factors could result in our inability to comply with the financial covenants contained in our 2013 Credit Facility. If we violate these covenants and are unable to obtain waivers from our lenders, our 2013 Credit Facility, our Senior Notes and our Debentures would be in default and the debt owing under such agreements could be accelerated. If our indebtedness is accelerated, we may not be able to repay our debt or borrow sufficient funds to refinance it. Even if we are able to obtain new financing, it may not be on commercially reasonable terms or on terms that are acceptable to us. If our debt is in default for any reason, our business, financial condition and results of operations could be materially and adversely affected. In addition, complying with these covenants may also cause us to take actions that are not favorable to holders of our other debt or equity securities and may make it more difficult for us to successfully execute our business strategy and compete against companies who are not subject to such restrictions.
28
The occurrence of a mandatory trigger event with respect to our Debentures would affect our ability to pay dividends on our common stock.
Our failure to meet certain financial covenants contained in the indenture governing the Debentures would result in a mandatory trigger event (as defined therein and which does not necessarily involve an event of default). If a mandatory trigger event has occurred and is continuing, we may not pay interest on the Debentures unless we obtain funds for such payment through the sale of qualifying warrants or qualifying preferred stock. During any mandatory deferral period, we will be prohibited from declaring or paying any dividends on, or making any distributions regarding, or redeeming, purchasing, acquiring or making liquidation payments with respect to our common stock.
The conversion of our Debentures may result in the dilution of the ownership interests of our existing stockholders.
If the conditions permitting the conversion of our Debentures are met and holders of the Debentures exercise their conversion rights, any conversion value in excess of the principal amount will be delivered in shares of our common stock. If any common stock is issued in connection with a conversion of our Debentures, our existing stockholders will experience dilution in the voting power of their common stock.
Provisions of our Debentures could discourage an acquisition of us by a third-party.
Certain provisions of our Debentures could make it more difficult or more expensive for a third-party to acquire us. Upon the occurrence of certain transactions constituting a “change of control” as defined in the indenture relating to our Debentures, holders of our Debentures will have the right, at their option, to convert their Debentures and thereby require us to pay the principal amount of such Debentures in cash and, if applicable, shares of our Common Stock.
Other Business Risks
Under certain circumstances, we could be responsible for certain federal and state black lung occupational disease liabilities assumed by Patriot in connection with its 2007 spin-off from us.
Patriot Coal Company (Patriot) has approximately
$150 million
in federal and state black lung occupational disease liabilities related to workers employed in periods prior to Patriot’s spin-off from us in 2007. At the time of the spin-off, Patriot indemnified us against any claim relating to these liabilities, including any claim made by the U.S. Department of Labor (“DOL”) against us with respect to these obligations as a potentially liable operator under the Federal Coal Mine Health and Safety Act of 1969.
In 2012, Patriot and certain of its wholly owned subsidiaries filed voluntary petitions for reorganization under Chapter 11 of the U.S. Code. In 2013, we entered into a definitive settlement agreement with Patriot and the United Mine Workers of America (UMWA), on behalf of itself, its represented Patriot employees and its represented Patriot retirees, to resolve all disputed issues related to Patriot’s bankruptcy. That agreement, which included Patriot’s affirmance of the indemnity relating to such black lung liabilities, became effective upon Patriot's emergence from bankruptcy on December 18, 2013.
If Patriot does not pay the black lung liabilities in the future, the DOL would first look to Patriot and any related credit support for payment before asserting any claims against the Company. While Patriot has agreed to indemnify us against any such claims by the DOL, we could be responsible for those liabilities if Patriot were not able to fund such indemnification.
Our expenditures for postretirement benefit and pension obligations could be materially higher than we have predicted if our underlying assumptions prove to be incorrect.
We provide postretirement health and life insurance benefits to eligible union and non-union employees. We calculated the total accumulated postretirement benefit obligation, which was a liability of
$735.4 million
as of December 31,
2013
,
$51.4 million
of which was a current liability. Net pension liabilities were
$95.9 million
as of December 31,
2013
,
$1.7 million
of which was a current liability.
29
These liabilities are actuarially determined and we use various actuarial assumptions, including the discount rate and future cost trends, to estimate the costs and obligations for these items. Our discount rate is determined by utilizing a hypothetical bond portfolio model which approximates the future cash flows necessary to service our liabilities. We have made assumptions related to future trends for medical care costs in the estimates of retiree health care and work-related injuries and illnesses obligations. Our medical trend assumption is developed by annually examining the historical trend of our cost per claim data. In addition, we make assumptions related to rates of return on plan assets in the estimates of pension obligations. If our assumptions do not materialize as expected, actual cash expenditures and costs that we incur could differ materially from our current estimates. Moreover, regulatory changes or changes in medical benefits provided by the government could increase our obligation to satisfy these or additional obligations. In addition, a decrease in the discount rate used to determine pension obligations could result in an increase in the valuation of pension obligations, which could affect the reported funding status of our pension plans and future contributions, as well as the periodic pension cost in subsequent fiscal years. If we experience poor financial performance in asset markets in future years, we may be required to increase contributions.
Concerns about the environmental impacts of coal combustion, including perceived impacts on global climate issues, are resulting in increased regulation of coal combustion in many jurisdictions and unfavorable lending policies by government-backed lending institutions and development banks toward the financing of new overseas coal-fueled power plants, and interest in further such regulation and policies, which could significantly affect demand for our products.
Global climate issues continue to attract public and scientific attention. Numerous reports, such as the Fourth Assessment Report of the Intergovernmental Panel on Climate Change, have also engendered concern about the impacts of human activity, especially fossil fuel combustion, on global climate issues. In turn, increasing government attention is being paid to global climate issues and to emissions of what are commonly referred to as greenhouse gases, including emissions of carbon dioxide from coal combustion by power plants.
Enactment of laws or passage of regulations regarding emissions from the combustion of coal by the U.S., some of its states or other countries, or other actions to limit such emissions, could result in electricity generators switching from coal to other fuel sources. Further, policies limiting available financing for the development of new coal-fueled power plants could adversely impact the global demand for coal in the future. The potential financial impact on us of future laws, regulations or other policies will depend upon the degree to which any such laws or regulations force electricity generators to diminish their reliance on coal as a fuel source. That, in turn, will depend on a number of factors, including the specific requirements imposed by any such laws, regulations or other policies, the time periods over which those laws, regulations or other policies would be phased in, the state of commercial development and deployment of CCS technologies and the alternative markets for coal. In view of the significant uncertainty surrounding each of these factors, it is not possible for us to reasonably predict the impact that any such laws, regulations or other policies may have on our results of operations, financial condition or cash flows.
Our certificate of incorporation and by-laws include provisions that may discourage a takeover attempt.
Provisions contained in our certificate of incorporation and by-laws and Delaware law could make it more difficult for a third-party to acquire us, even if doing so might be beneficial to our stockholders. Provisions of our by-laws and certificate of incorporation impose various procedural and other requirements that could make it more difficult for stockholders to effect certain corporate actions. These provisions could limit the price that certain investors might be willing to pay in the future for shares of our common stock and may have the effect of delaying or preventing a change in control.
Diversity in interpretation and application of accounting literature in the mining industry may impact our reported financial results.
The mining industry has limited industry-specific accounting literature and, as a result, we understand diversity in practice exists in the interpretation and application of accounting literature to mining-specific issues. As diversity in mining industry accounting is addressed, we may need to restate our reported results if the resulting interpretations differ from our current accounting practices. Refer to Note 1 to the accompanying consolidated financial statements for a summary of our significant accounting policies.
Item 1B.
Unresolved Staff Comments.
None.
30
Item 2.
Properties.
Coal Reserves
We had an estimated
8.3
billion tons of proven and probable coal reserves as of
December 31, 2013
. An estimated
7.3
billion tons of our attributable proven and probable coal reserves are in the U.S, with the remainder in Australia.
Approximately 76% of our Australian proven and probable coal reserves, or 700 million tons, are metallurgical coal with the remainder being thermal coal. Approximately 53% of our reserves, or 4.3 billion tons, are compliance coal and 47% are non-compliance coal (assuming application of the U.S. industry standard definition of compliance coal to all of our reserves). We own approximately 33% of these reserves and lease property containing the remaining 67%. Compliance coal is defined by Phase II of the Clean Air Act as coal having sulfur dioxide content of 1.2 pounds or less per million Btu. Electricity generators are able to use coal that exceeds these specifications by using emissions reduction technology, using emission allowance credits or blending higher sulfur coal with lower sulfur coal.
Below is a table summarizing the locations and proven and probable coal reserves of our major operating regions.
|
Proven and Probable
Reserves as of
December 31, 2013
(1)
|
|||||||||||
|
|
|
Owned
Tons
|
Leased
Tons
|
Total
Tons
|
|||||||
|
Operating Regions
|
Locations
|
||||||||||
|
|
|
(Tons in millions)
|
|||||||||
|
Midwest
|
Illinois, Indiana and Kentucky
|
2,401
|
|
798
|
|
3,199
|
|
||||
|
Powder River Basin
|
Wyoming
|
—
|
|
3,386
|
|
3,386
|
|
||||
|
Southwest
|
Arizona and New Mexico
|
303
|
|
245
|
|
548
|
|
||||
|
Colorado
|
Colorado
|
28
|
|
179
|
|
207
|
|
||||
|
Total United States
|
|
2,732
|
|
4,608
|
|
7,340
|
|
||||
|
New South Wales
|
Australia
|
—
|
|
304
|
|
304
|
|
||||
|
Queensland
|
Australia
|
—
|
|
621
|
|
621
|
|
||||
|
Total Australia
|
|
—
|
|
925
|
|
925
|
|
||||
|
Total Proven and Probable Coal Reserves
|
|
2,732
|
|
5,533
|
|
8,265
|
|
||||
|
(1)
|
Estimated proven and probable coal reserves have been adjusted to account for estimated processing losses involved in producing a saleable coal product.
|
Reserves are defined by SEC Industry Guide 7 as that part of a mineral deposit which could be economically and legally extracted or produced at the time of the reserve determination. Proven and probable coal reserves are defined by SEC Industry Guide 7 as follows:
|
•
|
Proven (Measured) Reserves
— Reserves for which (a) quantity is computed from dimensions revealed in outcrops, trenches, workings or drill holes; grade and/or quality are computed from the results of detailed sampling and (b) the sites for inspection, sampling and measurement are spaced so close and the geographic character is so well defined that size, shape, depth and mineral content of reserves are well-established.
|
|
•
|
Probable (Indicated) Reserves
— Reserves for which quantity and grade and/or quality are computed from information similar to that used for proven (measured) reserves, but the sites for inspection, sampling and measurement are farther apart or are otherwise less adequately spaced. The degree of assurance, although lower than that for proven (measured) reserves, is high enough to assume continuity between points of observation.
|
Our estimates of proven and probable coal reserves are established within these guidelines. Estimates within the proven category have the highest degree of assurance, while estimates within the probable category have only a moderate degree of geologic assurance. Further exploration is necessary to place probable reserves into the proven reserve category. Our active properties generally have a much higher degree of reliability because of increased drilling density.
Our guidelines for geologic assurance surrounding estimated proven and probable U.S. and Australian coal reserves generally follow the respective industry-accepted practices of those countries. In the U.S., our estimated proven coal reserves lie within one-quarter mile of a valid point of measure or point of observation, such as exploratory drill holes or previously mined areas, while our estimated probable coal reserves may lie more than one-quarter mile, but less than three-quarters of a mile, from a point of thickness measurement. In Australia, our estimated proven coal reserves lie within 250 meters of a point of observation, while our estimated probable coal reserves may lie more than 250 meters, but less than 500 meters, from a point of observation.
31
The preparation of our coal reserve estimates is completed in accordance with our prescribed internal control procedures, which include verification of input data into a coal reserve forecasting and economic evaluation software system, as well as multi-functional management review. Our reserve estimates are prepared by our staff of experienced geologists. Our corporate Geological Services group is responsible for tracking changes in reserve estimates, supervising our other geologists and coordinating periodic third-party reviews of our reserve estimates by qualified mining consultants.
Our coal reserve estimates are predicated on information obtained from an extensive historical database of nearly 500,000 individual drill holes and information obtained from our ongoing drilling program. We compile data from individual drill holes in a computerized drill-hole database from which the depth, thickness and, where core drilling is used, the quality of the coal is determined. The density of a drill pattern determines whether the related coal reserves will be classified as proven or probable. Our coal reserve estimates are then input into our computerized land management system, which overlays that geological data with data on ownership or control of the mineral and surface interests to determine the extent of our attributable coal reserves in a given area. Our land management system contains reserve information, including the quantity and quality (where available) of reserves, as well as production rates, surface ownership, lease payments and other information relating to our coal reserves and land holdings. We periodically update our coal reserve estimates to reflect production of coal from those reserves and new drilling or other data received. Accordingly, our coal reserve estimates will change from time to time to reflect the effects of our mining activities, analysis of new engineering and geological data, changes in coal reserve holdings, modification of mining methods and other factors.
Our estimate of the economic recoverability of our coal reserves is generally based upon a comparison of unassigned reserves to assigned reserves currently in production in the same geologic setting to determine an estimated mining cost. These estimated mining costs are compared to expected market prices for the quality of coal expected to be mined and take into consideration typical contractual sales agreements for the region and product. Where possible, we also review coal production by competitors in similar mining areas. Only coal reserves expected to be mined economically are included in our reserve estimates. Finally, our coal reserve estimates include reductions for recoverability factors to estimate a saleable product. Factors impacting our assessment include geological conditions, production expectations for certain areas, the effects of regulation and taxes by governmental agencies, future price and operating cost assumptions and adverse changes in certain coal market segment conditions and mine closure activities. The estimates are also impacted by decreases resulting from current year production and increases resulting from information obtained from additional drilling. Our estimation as of December 31, 2013 reflected a reduction of 866 million tons of coal reserves, comprised of 578 million tons and 288 million tons in the U.S. and Australia, respectively, that were included in our prior year estimates but are no longer considered reserves under SEC Industry Guide 7. The reduction in the U.S. relates to reserves that were under consideration for a coal-to-gas project that have been removed from our estimate based on additional review performed by us in the current year. The reserves in Australia relate to reserves in the Surat Basin that are no longer considered economical due to mine closure activities.
We periodically engage independent mining and geological consultants and consider their input regarding the procedures used by us to prepare our internal estimates of coal reserves, selected property reserve estimates and tabulation of reserve groups according to standard classifications of reliability.
With respect to the accuracy of our coal reserve estimates, our experience is that recovered reserves are within plus or minus 10% of our proven and probable estimates, on average, and our probable estimates are generally within the same statistical degree of accuracy when the necessary drilling is completed to move reserves from the probable to the proven classification.
We have numerous U.S. federal coal leases that are administered by the U.S. Department of the Interior under the Federal Coal Leasing Amendments Act of 1976. These leases cover our principal reserves in the Powder River Basin and other reserves in Colorado. Each of these leases continues indefinitely, provided there is diligent development of the property and continued operation of the related mine or mines. The U.S. Bureau of Land Management (BLM) has asserted the right to adjust the terms and conditions of these leases, including rent and royalties, after the first 20 years of their term and at 10-year intervals thereafter. Annual rents on surface land under our federal coal leases are now set at $3.00 per acre. Production royalties on federal leases are set by statute at 12.5% of the gross proceeds of coal mined and sold for surface-mined coal and 8% for underground-mined coal. The U.S. federal government limits by statute the amount of federal land that may be leased by any company and its affiliates at any time to 75,000 acres in any one state and 150,000 acres nationwide. As of
December 31, 2013
, we leased 11,768 acres of federal land in Colorado, 640 acres in New Mexico and 51,910 acres in Wyoming, for a total of
64,318
nationwide subject to those limitations. An additional
8,262
acres in Wyoming are held under U.S. federal coal reserves we lease from the BLM, which are also subject to the U.S. federal government limits.
Similar provisions govern three coal leases with the Navajo and Hopi Indian tribes. These leases cover coal contained in 64,785 acres of land in northern Arizona lying within the boundaries of the Navajo Nation and Hopi Indian reservations. We also lease coal-mining properties from various state governments in the U.S.
32
Private U.S. coal leases normally have terms of between 10 and 20 years and usually give us the right to renew the lease for a stated period or to maintain the lease in force until the exhaustion of mineable and merchantable coal contained on the relevant site. These private U.S. leases provide for royalties to be paid to the lessor either as a fixed amount per ton or as a percentage of the sales price. Many U.S. leases also require payment of a lease bonus or minimum royalty, payable either at the time of execution of the lease or in periodic installments. The terms of our private U.S. leases are normally extended by active production at or near the end of the lease term. U.S. leases containing undeveloped reserves may expire or these leases may be renewed periodically.
Mining and exploration in Australia is generally carried out under leases or licenses granted by state governments. Mining leases are typically for an initial term of up to 21 years (but which may be renewed) and contain conditions relating to such matters as minimum annual expenditures, restoration and rehabilitation. Royalties are paid to the state government as a percentage of the sales price. Generally landowners do not own the mineral rights or have the ability to grant rights to mine those minerals. These rights are retained by state governments. Compensation is payable to landowners for loss of access to the land, and the amount of compensation can be determined by agreement or arbitration. Surface rights are typically acquired directly from landowners and, in the absence of agreement, there is an arbitration provision in the mining law.
Consistent with industry practice, we conduct only limited investigation of title to our coal properties prior to leasing. Title to lands and reserves of the lessors or grantors and the boundaries of our leased properties are not completely verified until we prepare to mine those reserves.
With a portfolio of approximately
8.3
billion tons, we believe that we have sufficient coal reserves to replace capacity from depleting mines for the foreseeable future and that our significant coal reserve holdings is one of our competitive strengths. We believe that the current level of production at our major mines is sustainable for the foreseeable future.
33
The following charts provide a summary, by mining complex, of production for the years ended
December 31, 2013
,
2012
and
2011
, tonnage of coal reserves that is assigned to our active operating mines, our property interest in those reserves and other characteristics of the facilities.
|
SUMMARY OF COAL PRODUCTION AND SULFUR CONTENT OF ASSIGNED RESERVES
|
||||||||||||||||||||||
|
(Tons in Millions)
|
||||||||||||||||||||||
|
Production
|
Sulfur Content of Assigned Reserves as of Dec. 31, 2013
(1)
|
|||||||||||||||||||||
|
Year
|
Year
|
Year
|
<1.2 lbs.
|
>1.2 to 2.5 lbs.
|
>2.5 lbs.
|
As
|
||||||||||||||||
|
Ended
|
Ended
|
Ended
|
Sulfur
|
Sulfur
|
Sulfur
|
Received
|
||||||||||||||||
|
Geographic Region /
|
Dec. 31,
|
Dec. 31,
|
Dec. 31,
|
Type of
|
Dioxide per
|
Dioxide per
|
Dioxide per
|
Btu per
|
||||||||||||||
|
Mining Complex
|
2013
|
2012
|
2011
|
Coal
|
Million Btu
|
Million Btu
|
Million Btu
|
pound
(2)
|
||||||||||||||
|
Midwest:
|
||||||||||||||||||||||
|
Bear Run
|
8.2
|
|
7.9
|
|
6.5
|
|
T
|
5
|
|
28
|
|
241
|
|
11,500
|
||||||||
|
Francisco Underground
|
2.9
|
|
2.8
|
|
3.0
|
|
T
|
—
|
|
—
|
|
46
|
|
11,500
|
||||||||
|
Gateway
|
2.8
|
|
2.8
|
|
3.3
|
|
T
|
—
|
|
—
|
|
3
|
|
11,000
|
||||||||
|
Somerville Central
|
2.6
|
|
2.3
|
|
3.0
|
|
T
|
—
|
|
—
|
|
3
|
|
11,500
|
||||||||
|
Wild Boar
|
2.1
|
|
2.0
|
|
1.8
|
|
T
|
—
|
|
—
|
|
11
|
|
11,000
|
||||||||
|
Cottage Grove
|
2.0
|
|
2.0
|
|
1.9
|
|
T
|
—
|
|
—
|
|
19
|
|
12,700
|
||||||||
|
Wildcat Hills Underground
|
1.6
|
|
1.5
|
|
1.0
|
|
T
|
—
|
|
—
|
|
28
|
|
12,100
|
||||||||
|
Somerville South
|
1.5
|
|
1.4
|
|
1.2
|
|
T
|
—
|
|
—
|
|
6
|
|
11,100
|
||||||||
|
Somerville North
|
1.5
|
|
1.2
|
|
1.4
|
|
T
|
—
|
|
—
|
|
3
|
|
11,200
|
||||||||
|
Viking - Corning Pit
(3)
|
1.1
|
|
1.3
|
|
1.5
|
|
T
|
—
|
|
—
|
|
—
|
|
11,500
|
||||||||
|
Willow Lake (Closed in 2012)
|
—
|
|
2.1
|
|
2.2
|
|
T
|
—
|
|
—
|
|
—
|
|
NA
|
||||||||
|
Total
|
26.3
|
|
27.3
|
|
26.8
|
|
5
|
|
28
|
|
360
|
|
||||||||||
|
Powder River Basin:
|
||||||||||||||||||||||
|
North Antelope Rochelle
|
111.0
|
|
107.6
|
|
109.1
|
|
T
|
2,254
|
|
—
|
|
—
|
|
8,800
|
||||||||
|
Rawhide
|
14.2
|
|
14.7
|
|
15.0
|
|
T
|
238
|
|
56
|
|
2
|
|
8,300
|
||||||||
|
Caballo
|
9.0
|
|
16.9
|
|
24.1
|
|
T
|
722
|
|
100
|
|
14
|
|
8,300
|
||||||||
|
Total
|
134.2
|
|
139.2
|
|
148.2
|
|
3,214
|
|
156
|
|
16
|
|
||||||||||
|
Southwest:
|
||||||||||||||||||||||
|
El Segundo
|
8.7
|
|
8.6
|
|
8.1
|
|
T
|
27
|
|
63
|
|
68
|
|
9,100
|
||||||||
|
Kayenta
|
7.2
|
|
7.5
|
|
8.1
|
|
T
|
153
|
|
68
|
|
3
|
|
10,600
|
||||||||
|
Lee Ranch
|
—
|
|
1.3
|
|
2.0
|
|
T
|
20
|
|
61
|
|
57
|
|
9,300
|
||||||||
|
Total
|
15.9
|
|
17.4
|
|
18.2
|
|
200
|
|
192
|
|
128
|
|
||||||||||
|
Colorado:
|
||||||||||||||||||||||
|
Twentymile
|
7.2
|
|
8.0
|
|
7.7
|
|
T
|
14
|
|
—
|
|
38
|
|
11,200
|
||||||||
|
Australia:
|
||||||||||||||||||||||
|
Wilpinjong
|
13.3
|
|
12.2
|
|
10.9
|
|
T
|
—
|
|
162
|
|
—
|
|
11,200
|
||||||||
|
Wambo
(4)
|
6.9
|
|
6.6
|
|
5.8
|
|
T/P
|
109
|
|
—
|
|
—
|
|
12,200
|
||||||||
|
Millennium
|
3.5
|
|
3.2
|
|
1.9
|
|
M/P
|
27
|
|
—
|
|
—
|
|
12,600
|
||||||||
|
Coppabella
|
3.2
|
|
2.8
|
|
0.4
|
|
P
|
74
|
|
—
|
|
—
|
|
12,700
|
||||||||
|
North Goonyella / Eaglefield
|
2.3
|
|
4.1
|
|
2.2
|
|
M
|
98
|
|
—
|
|
—
|
|
12,900
|
||||||||
|
Moorvale
|
2.1
|
|
1.9
|
|
0.3
|
|
M/P
|
19
|
|
—
|
|
—
|
|
12,100
|
||||||||
|
Burton
|
2.0
|
|
1.2
|
|
2.1
|
|
T/M
|
12
|
|
—
|
|
—
|
|
12,700
|
||||||||
|
Metropolitan
|
1.5
|
|
1.8
|
|
1.8
|
|
M
|
33
|
|
—
|
|
—
|
|
12,600
|
||||||||
|
Middlemount
(5)
|
—
|
|
—
|
|
—
|
|
M/P
|
34
|
|
—
|
|
—
|
|
12,300
|
||||||||
|
Total
|
34.8
|
|
33.8
|
|
25.4
|
|
406
|
|
162
|
|
—
|
|
||||||||||
|
Total Continuing Operations
|
218.4
|
|
225.7
|
|
226.3
|
|
3,839
|
|
538
|
|
542
|
|
||||||||||
|
Discontinued Operations
|
4.0
|
|
3.3
|
|
2.6
|
|
—
|
|
—
|
|
—
|
|
||||||||||
|
Total Assigned
|
222.4
|
|
229.0
|
|
228.9
|
|
3,839
|
|
538
|
|
542
|
|
||||||||||
T: Thermal
M: Metallurgical
P: Pulverized Coal Injection
34
|
ASSIGNED RESERVES
(6)
|
||||||||||||||||||||||||||||||||
|
AS OF DECEMBER 31, 2013
|
||||||||||||||||||||||||||||||||
|
Attributable Ownership
|
100% Project Basis
|
|||||||||||||||||||||||||||||||
|
(Tons in Millions)
|
Proven and
|
Proven and
|
||||||||||||||||||||||||||||||
|
Geographic Region/Mining Complex
|
Interest
|
Probable Reserves
|
Owned
|
Leased
|
Surface
|
Underground
|
Probable Reserves
|
Owned
|
Leased
|
Surface
|
Underground
|
|||||||||||||||||||||
|
Midwest:
|
||||||||||||||||||||||||||||||||
|
Bear Run
|
100%
|
274
|
|
121
|
|
153
|
|
274
|
|
—
|
|
274
|
|
121
|
|
153
|
|
274
|
|
—
|
|
|||||||||||
|
Francisco Underground
|
100%
|
46
|
|
9
|
|
37
|
|
—
|
|
46
|
|
46
|
|
9
|
|
37
|
|
—
|
|
46
|
|
|||||||||||
|
Wildcat Hills Underground
|
100%
|
28
|
|
15
|
|
13
|
|
—
|
|
28
|
|
28
|
|
15
|
|
13
|
|
—
|
|
28
|
|
|||||||||||
|
Cottage Grove
|
100%
|
19
|
|
10
|
|
9
|
|
19
|
|
—
|
|
19
|
|
10
|
|
9
|
|
19
|
|
—
|
|
|||||||||||
|
Wild Boar
|
100%
|
11
|
|
8
|
|
3
|
|
11
|
|
—
|
|
11
|
|
8
|
|
3
|
|
11
|
|
—
|
|
|||||||||||
|
Somerville South
|
100%
|
6
|
|
5
|
|
1
|
|
6
|
|
—
|
|
6
|
|
5
|
|
1
|
|
6
|
|
—
|
|
|||||||||||
|
Gateway
|
100%
|
3
|
|
2
|
|
1
|
|
—
|
|
3
|
|
3
|
|
2
|
|
1
|
|
—
|
|
3
|
|
|||||||||||
|
Somerville Central
|
100%
|
3
|
|
2
|
|
1
|
|
3
|
|
—
|
|
3
|
|
2
|
|
1
|
|
3
|
|
—
|
|
|||||||||||
|
Somerville North
|
100%
|
3
|
|
1
|
|
2
|
|
3
|
|
—
|
|
3
|
|
1
|
|
2
|
|
3
|
|
—
|
|
|||||||||||
|
Viking - Corning Pit
|
100%
|
—
|
|
—
|
|
—
|
|
—
|
|
—
|
|
—
|
|
—
|
|
—
|
|
—
|
|
—
|
|
|||||||||||
|
Total
|
393
|
|
173
|
|
220
|
|
316
|
|
77
|
|
|
|
|
|
|
|||||||||||||||||
|
Powder River Basin:
|
||||||||||||||||||||||||||||||||
|
North Antelope Rochelle
|
100%
|
2,254
|
|
—
|
|
2,254
|
|
2,254
|
|
—
|
|
2,254
|
|
—
|
|
2,254
|
|
2,254
|
|
—
|
|
|||||||||||
|
Caballo
|
100%
|
836
|
|
—
|
|
836
|
|
836
|
|
—
|
|
836
|
|
—
|
|
836
|
|
836
|
|
—
|
|
|||||||||||
|
Rawhide
|
100%
|
296
|
|
—
|
|
296
|
|
296
|
|
—
|
|
296
|
|
—
|
|
296
|
|
296
|
|
—
|
|
|||||||||||
|
Total
|
3,386
|
|
—
|
|
3,386
|
|
3,386
|
|
—
|
|
|
|
|
|
|
|||||||||||||||||
|
Southwest:
|
||||||||||||||||||||||||||||||||
|
Kayenta
|
100%
|
224
|
|
—
|
|
224
|
|
224
|
|
—
|
|
224
|
|
—
|
|
224
|
|
224
|
|
—
|
|
|||||||||||
|
El Segundo
|
100%
|
158
|
|
145
|
|
13
|
|
158
|
|
—
|
|
158
|
|
145
|
|
13
|
|
158
|
|
—
|
|
|||||||||||
|
Lee Ranch
|
100%
|
138
|
|
130
|
|
8
|
|
138
|
|
—
|
|
138
|
|
130
|
|
8
|
|
138
|
|
—
|
|
|||||||||||
|
Total
|
520
|
|
275
|
|
245
|
|
520
|
|
—
|
|
|
|
|
|
|
|||||||||||||||||
|
Colorado:
|
||||||||||||||||||||||||||||||||
|
Twentymile
|
100%
|
52
|
|
13
|
|
39
|
|
—
|
|
52
|
|
52
|
|
13
|
|
39
|
|
—
|
|
52
|
|
|||||||||||
|
Australia:
|
||||||||||||||||||||||||||||||||
|
Wilpinjong
|
100%
|
162
|
|
—
|
|
162
|
|
162
|
|
—
|
|
162
|
|
—
|
|
162
|
|
162
|
|
—
|
|
|||||||||||
|
Wambo
(4)
|
100%
|
109
|
|
—
|
|
109
|
|
47
|
|
62
|
|
109
|
|
—
|
|
109
|
|
47
|
|
62
|
|
|||||||||||
|
North Goonyella / Eaglefield
|
100%
|
98
|
|
—
|
|
98
|
|
1
|
|
97
|
|
98
|
|
—
|
|
98
|
|
1
|
|
97
|
|
|||||||||||
|
Coppabella
|
73.3%
|
74
|
|
—
|
|
74
|
|
67
|
|
7
|
|
101
|
|
—
|
|
101
|
|
91
|
|
10
|
|
|||||||||||
|
Metropolitan
|
100%
|
33
|
|
—
|
|
33
|
|
—
|
|
33
|
|
33
|
|
—
|
|
33
|
|
—
|
|
33
|
|
|||||||||||
|
Millennium
|
100%
|
27
|
|
—
|
|
27
|
|
27
|
|
—
|
|
27
|
|
—
|
|
27
|
|
27
|
|
—
|
|
|||||||||||
|
Moorvale
|
73.3%
|
19
|
|
—
|
|
19
|
|
19
|
|
—
|
|
26
|
|
—
|
|
26
|
|
26
|
|
—
|
|
|||||||||||
|
Burton
|
100%
|
12
|
|
—
|
|
12
|
|
12
|
|
—
|
|
12
|
|
—
|
|
12
|
|
12
|
|
—
|
|
|||||||||||
|
Middlemount
(5)
|
50.0%
|
34
|
|
—
|
|
34
|
|
34
|
|
—
|
|
68
|
|
—
|
|
68
|
|
68
|
|
—
|
|
|||||||||||
|
Total
|
568
|
|
—
|
|
568
|
|
369
|
|
199
|
|
|
|
|
|
|
|||||||||||||||||
|
Total Assigned
|
4,919
|
|
461
|
|
4,458
|
|
4,591
|
|
328
|
|
|
|
|
|
|
|||||||||||||||||
35
|
ASSIGNED AND UNASSIGNED PROVEN AND PROBABLE COAL RESERVES
|
||||||||||||||||||||||||||||||||
|
AS OF DECEMBER 31, 2013
|
||||||||||||||||||||||||||||||||
|
(Tons in Millions)
|
||||||||||||||||||||||||||||||||
|
Attributable Ownership
|
100% Project Basis
|
|||||||||||||||||||||||||||||||
|
Proven and
|
Proven and
|
|||||||||||||||||||||||||||||||
|
Total Tons
|
Probable
|
Total Tons
|
Probable
|
|||||||||||||||||||||||||||||
|
Coal Seam Location
|
Assigned
|
Unassigned
|
Reserves
|
Proven
|
Probable
|
Assigned
|
Unassigned
|
Reserves
|
Proven
|
Probable
|
||||||||||||||||||||||
|
Midwest:
|
||||||||||||||||||||||||||||||||
|
Illinois
|
50
|
|
2,157
|
|
2,207
|
|
1,043
|
|
1,164
|
|
50
|
|
2,157
|
|
2,207
|
|
1,043
|
|
1,164
|
|
||||||||||||
|
Indiana
|
343
|
|
309
|
|
652
|
|
496
|
|
156
|
|
343
|
|
309
|
|
652
|
|
496
|
|
156
|
|
||||||||||||
|
Kentucky
|
—
|
|
340
|
|
340
|
|
151
|
|
189
|
|
—
|
|
340
|
|
340
|
|
151
|
|
189
|
|
||||||||||||
|
Total
|
393
|
|
2,806
|
|
3,199
|
|
1,690
|
|
1,509
|
|
|
|
|
|
|
|||||||||||||||||
|
Powder River Basin (Wyoming)
|
3,386
|
|
—
|
|
3,386
|
|
3,221
|
|
165
|
|
3,386
|
|
—
|
|
3,386
|
|
3,221
|
|
165
|
|
||||||||||||
|
Southwest:
|
||||||||||||||||||||||||||||||||
|
Arizona
|
224
|
|
—
|
|
224
|
|
224
|
|
—
|
|
224
|
|
—
|
|
224
|
|
224
|
|
—
|
|
||||||||||||
|
New Mexico
|
296
|
|
28
|
|
324
|
|
302
|
|
22
|
|
296
|
|
28
|
|
324
|
|
302
|
|
22
|
|
||||||||||||
|
Total
|
520
|
|
28
|
|
548
|
|
526
|
|
22
|
|
|
|
|
|
|
|||||||||||||||||
|
Colorado
|
52
|
|
155
|
|
207
|
|
126
|
|
81
|
|
52
|
|
155
|
|
207
|
|
126
|
|
81
|
|
||||||||||||
|
Australia:
|
||||||||||||||||||||||||||||||||
|
New South Wales
|
304
|
|
—
|
|
304
|
|
207
|
|
97
|
|
304
|
|
—
|
|
304
|
|
207
|
|
97
|
|
||||||||||||
|
Queensland
(7)
|
264
|
|
357
|
|
621
|
|
450
|
|
171
|
|
332
|
|
535
|
|
867
|
|
605
|
|
262
|
|
||||||||||||
|
Total
|
568
|
|
357
|
|
925
|
|
657
|
|
268
|
|
|
|
|
|
|
|||||||||||||||||
|
Total Proven and Probable
|
4,919
|
|
3,346
|
|
8,265
|
|
6,220
|
|
2,045
|
|
|
|
|
|
|
|||||||||||||||||
36
|
ASSIGNED AND UNASSIGNED - RESERVE CONTROL AND MINING METHOD
|
||||||||||||||||||||||||||
|
AS OF DECEMBER 31, 2013
|
||||||||||||||||||||||||||
|
(Tons in Millions)
|
||||||||||||||||||||||||||
|
Attributable Ownership
|
100% Project Basis
|
|||||||||||||||||||||||||
|
Reserve Control
|
Mining Method
|
Reserve Control
|
Mining Method
|
|||||||||||||||||||||||
|
Coal Seam Location
|
Owned
|
Leased
|
Surface
|
Underground
|
Owned
|
Leased
|
Surface
|
Underground
|
||||||||||||||||||
|
Midwest:
|
||||||||||||||||||||||||||
|
Illinois
|
1,867
|
|
340
|
|
62
|
|
2,145
|
|
1,867
|
|
340
|
|
62
|
|
2,145
|
|
||||||||||
|
Indiana
|
346
|
|
306
|
|
454
|
|
198
|
|
346
|
|
306
|
|
454
|
|
198
|
|
||||||||||
|
Kentucky
|
188
|
|
152
|
|
32
|
|
308
|
|
188
|
|
152
|
|
32
|
|
308
|
|
||||||||||
|
Total
|
2,401
|
|
798
|
|
548
|
|
2,651
|
|
|
|
|
|
||||||||||||||
|
Powder River Basin (Wyoming)
|
—
|
|
3,386
|
|
3,386
|
|
—
|
|
—
|
|
3,386
|
|
3,386
|
|
—
|
|
||||||||||
|
Southwest:
|
||||||||||||||||||||||||||
|
Arizona
|
—
|
|
224
|
|
224
|
|
—
|
|
—
|
|
224
|
|
224
|
|
—
|
|
||||||||||
|
New Mexico
|
303
|
|
21
|
|
324
|
|
—
|
|
303
|
|
21
|
|
324
|
|
—
|
|
||||||||||
|
Total
|
303
|
|
245
|
|
548
|
|
—
|
|
|
|
|
|
||||||||||||||
|
Colorado
|
28
|
|
179
|
|
—
|
|
207
|
|
28
|
|
179
|
|
—
|
|
207
|
|
||||||||||
|
Australia:
|
||||||||||||||||||||||||||
|
New South Wales
|
—
|
|
304
|
|
209
|
|
95
|
|
—
|
|
304
|
|
209
|
|
95
|
|
||||||||||
|
Queensland
(7)
|
—
|
|
621
|
|
517
|
|
104
|
|
—
|
|
867
|
|
704
|
|
163
|
|
||||||||||
|
Total
|
—
|
|
925
|
|
726
|
|
199
|
|
|
|
|
|
||||||||||||||
|
Total Proven and Probable
|
2,732
|
|
5,533
|
|
5,208
|
|
3,057
|
|
|
|
|
|
||||||||||||||
37
|
ASSIGNED AND UNASSIGNED PROVEN AND PROBABLE COAL RESERVES - SULFUR CONTENT
|
||||||||||||||||||||||||
|
AS OF DECEMBER 31, 2013
|
||||||||||||||||||||||||
|
(Tons in Millions)
|
||||||||||||||||||||||||
|
Attributable Ownership
|
100% Project Basis
|
|||||||||||||||||||||||
|
Sulfur Content
(1)
|
Sulfur Content
(1)
|
|||||||||||||||||||||||
|
<1.2 lbs.
|
>1.2 to 2.5 lbs.
|
>2.5 lbs.
|
<1.2 lbs.
|
>1.2 to 2.5 lbs.
|
>2.5 lbs.
|
As
|
||||||||||||||||||
|
Sulfur Dioxide
|
Sulfur Dioxide
|
Sulfur Dioxide
|
Sulfur Dioxide
|
Sulfur Dioxide
|
Sulfur Dioxide
|
Received
|
||||||||||||||||||
|
Type of
|
per
|
per
|
per
|
per
|
per
|
per
|
Btu
|
|||||||||||||||||
|
Coal Seam Location
|
Coal
|
Million Btu
|
Million Btu
|
Million Btu
|
Million Btu
|
Million Btu
|
Million Btu
|
per Pound
(2)
|
||||||||||||||||
|
Midwest:
|
||||||||||||||||||||||||
|
Illinois
|
T
|
—
|
|
—
|
|
2,207
|
|
—
|
|
—
|
|
2,207
|
|
10,300
|
|
|||||||||
|
Indiana
|
T
|
5
|
|
36
|
|
611
|
|
5
|
|
36
|
|
611
|
|
10,200
|
|
|||||||||
|
Kentucky
|
T
|
—
|
|
—
|
|
340
|
|
—
|
|
—
|
|
340
|
|
10,900
|
|
|||||||||
|
Total
|
5
|
|
36
|
|
3,158
|
|
|
|
|
|
||||||||||||||
|
Powder River Basin (Wyoming)
|
T
|
3,214
|
|
156
|
|
16
|
|
3,214
|
|
156
|
|
16
|
|
8,700
|
|
|||||||||
|
Southwest:
|
||||||||||||||||||||||||
|
Arizona
|
T
|
154
|
|
68
|
|
2
|
|
154
|
|
68
|
|
2
|
|
11,000
|
|
|||||||||
|
New Mexico
|
T
|
48
|
|
145
|
|
131
|
|
48
|
|
145
|
|
131
|
|
9,400
|
|
|||||||||
|
Total
|
202
|
|
213
|
|
133
|
|
|
|
|
|
||||||||||||||
|
Colorado
|
T
|
157
|
|
—
|
|
50
|
|
157
|
|
—
|
|
50
|
|
10,700
|
|
|||||||||
|
Australia:
|
||||||||||||||||||||||||
|
New South Wales
|
T/M/P
|
142
|
|
162
|
|
—
|
|
142
|
|
162
|
|
—
|
|
11,800
|
|
|||||||||
|
Queensland
(7)
|
T/M/P
|
621
|
|
—
|
|
—
|
|
867
|
|
—
|
|
—
|
|
12,100
|
|
|||||||||
|
Total
|
763
|
|
162
|
|
—
|
|
|
|
|
|
||||||||||||||
|
Total Proven and Probable
|
4,341
|
|
567
|
|
3,357
|
|
|
|
|
|
||||||||||||||
T: Thermal
M: Metallurgical
P: Pulverized Coal Injection
38
|
(1)
|
Compliance coal is defined by Phase II of the Clean Air Act as coal having sulfur dioxide content of 1.2 pounds or less per million Btu. Non-compliance coal is defined as coal having sulfur dioxide content in excess of this standard. Electricity generators are able to use coal that exceeds these specifications by using emissions reduction technology, using emissions allowance credits or blending higher sulfur coal with lower sulfur coal.
|
|
(2)
|
As-received Btu per pound includes the weight of moisture in the coal on an as sold basis. The range of variability of the moisture content in coal across a given region may affect the actual shipped Btu content of current production from assigned reserves.
|
|
(3)
|
The Viking - Corning Pit mine is scheduled to close in the first half of 2014 due to the exhaustion of coal reserves.
|
|
(4)
|
Wambo includes the Wambo Open-Cut Mine and the North Wambo Underground Mine. The North Wambo Underground Mine produces both thermal and pulverized coal injection, or PCI metallurgical coal.
|
|
(5)
|
Middlemount represents our 50.0% interest in Middlemount Coal Pty Ltd., which owns the Middlemount Mine in Queensland, Australia. Because that entity is accounted for as an unconsolidated equity affiliate, 2013 tons produced have been excluded from the "Summary of Coal Production and Sulfur Content of Assigned Reserves" table.
|
|
(6)
|
Assigned reserves represent recoverable coal reserves that are controlled and accessible at active operations as of
December 31, 2013
. Unassigned reserves represent coal at currently non-producing locations that would require new mine development, mining equipment or plant facilities before operations could begin on the property.
|
|
(7)
|
Unassigned reserves in Queensland include approximately 56 million tons of reserves for a non-strategic exploration tenement asset that was sold in January 2014.
|
Item 3.
Legal Proceedings.
See Note 24. "Commitments and Contingencies" to our consolidated financial statements for a description of our pending legal proceedings, which information is incorporated herein by reference.
Item 4.
Mine Safety Disclosures.
Safety is a core value that is integrated into all areas of our business. Our goal is to provide a workplace that is incident free. We believe that it is our responsibility to provide a safe and healthy work environment. We seek to implement this goal by: training employees in safe work practices; openly communicating with employees; establishing, following and improving safety standards; involving employees in safety processes and recording, reporting and investigating accidents, incidents and losses to avoid recurrence. As part of our training, we collaborate with the Mine Safety and Health Administration (MSHA) and other government agencies to identify and test emerging safety technologies. We also believe personal accountability is key; every employee commits to our safety goals and governing principles. All employees are held accountable for their own safety and the safety of other employees.
We also partner with other companies and certain governmental agencies to pursue new technologies that have the potential to improve our safety performance and provide better safety protection for employees. We are currently partnering with three of our mining equipment vendors to incorporate proximity detection systems on our continuous miners and proximity detection and video surveillance systems on our battery-powered coal haulage equipment, shuttle cars and section scoops at our U.S. underground mines. Additionally, we have installed and are testing a proximity detection system for large mining equipment and light vehicles at one of our Australian surface mines. We have also initiated a collaborative effort with certain vendors to identify and evaluate potential fatigue monitoring programs and technologies for our surface operations.
In 2012, we announced our endorsement and participation in CORESafety
™
, a new safety and health management system developed by member companies of the National Mining Association for the U.S. mining industry. CORESafety
™
is an approach to safety and health focused on preventing accidents through the use of a management system that focuses on leadership development, management processes, individual accountability and assurance techniques. As a continuation of the integration of the elements of CORESafety
™
into our "Safety, A Way of Life Management System," we conducted a safety risk management workshop with the senior management team of our U.S. operations facilitated by a global expert on safety risk management in mining. We are putting these concepts into action by developing and implementing Safety Risk Registers for all of our U.S. mining operations. Such actions were completed at five of our U.S. mines in 2013 and will be completed at our remaining U.S. locations in 2014.
We primarily measure our safety performance based on our incidence rate, which is monitored through our safety tracking system and represents the number of injuries that occurred for each 200,000 employee hours worked. Accordingly, it is computed as the number of injury occurrences (MSHA reportable injury degree codes 1 through 6) divided by the number of employee hours worked and multiplied by 200,000 [(number of injury occurrences ÷ number of employee hours worked) x 200,000]. Since MSHA is a branch of the U.S. Department of Labor, its jurisdiction applies only to our U.S. mines. While not required by U.S. law, we also track incidence rates for our Australian mines using the same criteria.
39
For the U.S., the most comparable industry measure with which to compare our safety performance is the all incidence rate for operators at all U.S. bituminous coal mines, excluding the impact of office workers, from MSHA's periodic Mine Injury and Worktime report (All Incidence Rate). Historical incidence rates may be adjusted over time to reflect the final resolution of incidents by MSHA. The impact of these adjustments, which has not historically resulted in significant changes to the results originally reported, is reflected retrospectively in the MSHA database. Similarly, our reported incidence rates are adjusted retrospectively to reflect the final resolution of the underlying incidents, when applicable.
The following table reflects our incidence rates and the most comparable industry measure:
|
|
Year Ended December 31,
|
|||||||
|
|
2013
|
2012
|
2011
|
|||||
|
MSHA (U.S. coal mines)
(1)
|
3.42
|
|
3.56
|
|
3.76
|
|
||
|
U.S.
(2)
|
1.00
|
|
1.28
|
|
1.50
|
|
||
|
Australia
(2)
|
2.79
|
|
2.50
|
|
2.77
|
|
||
|
Total Peabody Energy Corporation
(2)
|
1.87
|
|
1.87
|
|
2.00
|
|
||
(1)
T
he 2013 MSHA all incidence rate for operators at all U.S. bituminous coal mines, excluding the impact of office workers, reflected above represents preliminary results for January through September 2013 based on the data most recently published by MSHA as of February 20,
2014
.
(2)
Results for the year ended December 31, 2011 exclude PEA-PCI, previously Macarthur Coal Limited. Results for all periods include certain mines classified a
s discontinued operations and inactive operations in the process of being reclaimed during the periods presented. Excluding those impacts, our incidence rates for the U.S., Australia and worldwide were 0.97, 2.69 and 1.80, respectively, in
2013
and 1.20, 2.50 and 1.83, respectively, in
2012
.
We monitor MSHA compliance using violations per inspection day (in the U.S. only), which is calculated as the total count of violations per five hour MSHA inspector day. Similar to historical incidence rates, historical violations per inspection day may be adjusted over time to reflect the final resolution of the underlying matters. For the years ended
December 31, 2013
,
2012
and
2011
, our U.S. violations per inspection day were 0.57, 0.79 and 0.80, respectively.
On July 2, 2013, an employee at our Wildcat Hills underground mine in Illinois was fatally injured as the result of a coal haulage incident. The mine was immediately idled for investigation. The mine resumed production with MSHA's concurrence with three out of five continuous miners on July 9, 2013, and an additional continuous miner resumed production on July 11, 2013. The mine was issued a citation and a 104(b) order by MSHA on July 24, 2013, was temporarily idled again and resumed full production on August 2, 2013 when practices were adopted to comply with a MSHA-imposed safety requirement. The 104(b) order was subsequently vacated pursuant to a settlement with MSHA approved on October 25, 2013.
The information concerning mine safety violations or other regulatory matters required by SEC regulations is included in Exhibit 95 to this Annual Report on Form 10-K.
Item 5.
Market for Registrant’s Common Equity, Related Stockholder Matters and Issuer Purchases of Equity Securities.
Our common stock is listed on the New York S
tock Exchange, under the symbol “BTU.” As of February 14, 2014, there were 1,387 holders of record of our common stock.
40
The table below sets forth the range of quarterly high and low sales prices (including intraday prices) for our common stock on the New York Stock Exchange and the amount of cash dividends paid per share of our common stock during the calendar quarters indicated.
|
|
Share Price
|
Dividends
|
|||||||||
|
|
High
|
Low
|
Paid
|
||||||||
|
2013
|
|
|
|
|
|
|
|||||
|
First Quarter
|
$
|
27.32
|
|
$
|
20.44
|
|
$
|
0.085
|
|
||
|
Second Quarter
|
21.17
|
|
14.54
|
|
0.085
|
|
|||||
|
Third Quarter
|
18.88
|
|
14.65
|
|
0.085
|
|
|||||
|
Fourth Quarter
|
20.87
|
|
16.93
|
|
0.085
|
|
|||||
|
2012
|
|
|
|
|
|
|
|||||
|
First Quarter
|
$
|
38.90
|
|
$
|
28.83
|
|
$
|
0.085
|
|
||
|
Second Quarter
|
31.59
|
|
21.12
|
|
0.085
|
|
|||||
|
Third Quarter
|
26.21
|
|
19.05
|
|
0.085
|
|
|||||
|
Fourth Quarter
|
29.28
|
|
21.81
|
|
0.085
|
|
|||||
Dividend Policy
We have declared and paid quarterly dividends since our initial public offering in 2001. On January 23, 2014, our Board of Directors declared a dividend of $0.085 per share of Common Stock, payable on February 27, 2014, to stockholders of record on February 6, 2014. The declaration and payment of dividends and the amount of dividends will depend on our results of operations, financial condition, cash requirements, future prospects, any limitations imposed by our debt instruments and other factors deemed relevant by our Board of Directors. Limitations on our ability to pay dividends imposed by our debt instruments are discussed in Part II, Item 7. “Management’s Discussion and Analysis of Financial Condition and Results of Operations.”
Share Repurchases
On October 24, 2008, we announced that our Board of Directors approved an amendment to the then existing share repurchase program to authorize repurchases of up to $1.0 billion of the then outstanding shares of our common stock (Repurchase Program). The Repurchase Program does not have an expiration date and may be discontinued at any time. Through December 31, 2013, we have repurchased a total of 7.7 million shares under the Repurchase Program at a cost of $299.6 million ($199.8 million and $99.8 million in 2008 and 2006, respectively), leaving $700.4 million available for share repurchases under the Repurchase Program. Repurchases may be made from time to time based on an evaluation of our outlook and general business conditions, as well as alternative investment and debt repayment options. No share repurchases were made under the Repurchase Program during the years ended December 31, 2013, 2012 or 2011.
Our Chairman and Chief Executive Officer had authority to direct the repurchase up to $100.0 million of common stock outside of the Repurchase Program. During the second quarter of 2012, we utilized existing cash on hand to repurchase 4.2 million shares of outstanding common stock for $99.9 million pursuant to that authority through open-market transactions.
Share Relinquishments
We routinely allow employees to relinquish common stock to pay estimated taxes upon the vesting of restricted stock and the payout of performance units that are settled in common stock under our equity incentive plans. The value of common stock tendered by employees is determined based on the closing price of our common stock on the dates of the respective relinquishments.
41
Purchases of Equity Securities
The following table summarizes all share purchases for the three months ended December 31, 2013:
|
Period
|
Total
Number of
Shares
Purchased
(1)
|
Average
Price per Share
|
Total Number of
Shares Purchased
as Part of Publicly
Announced
Program
|
Maximum Dollar
Value that May Yet
Be Used to
Repurchase
Shares Under the
Publicly Announced
Program (In millions)
|
|||||||||
|
October 1 through October 31, 2013
|
1,157
|
|
$
|
17.25
|
|
—
|
|
$
|
700.4
|
|
|||
|
November 1 through November 30, 2013
|
—
|
|
—
|
|
—
|
|
700.4
|
|
|||||
|
December 1 through December 31, 2013
|
11,438
|
|
19.49
|
|
—
|
|
700.4
|
|
|||||
|
Total
|
12,595
|
|
$
|
19.28
|
|
—
|
|
|
|
||||
(1)
Represents shares withheld to cover the withholding taxes upon the vesting of restricted stock, which are not a part of the Repurchase Program.
Equity Compensation Plan Information
Refer to Part II, Item 12. "Security Ownership of Certain Beneficial Owners and Management and Related Stockholder Matters" for the information required by Item 201(d) of Regulation S-K regarding our equity compensation plans, which information is incorporated herein by reference.
Item 6.
Selected Financial Data.
The following table presents selected financial and other data about us for the most recent five fiscal years.
The following table and the discussion of our results of operations in
2013
,
2012
and
2011
in Part II, Item 7. “Management’s Discussion and Analysis of Financial Condition and Results of Operations” includes references to and analysis of Adjusted EBITDA, Adjusted Income from Continuing Operations and Adjusted Diluted EPS, which are financial measures not recognized in accordance with U.S. generally accepted accounting principles (GAAP). These financial measures are not intended to serve as alternatives to U.S. GAAP measures of performance and may not be comparable to similarly-titled measures presented by other companies. Beginning with this report, we have modified the definitions of these non-GAAP financial measures to also exclude the impact of charges for the settlement of claims and litigation related to previously divested operations because we believe that excluding these impacts is useful in comparing our 2013 results with those of prior and future periods.
Adjusted EBITDA is defined as (loss) income from continuing operations before deducting net interest expense, income taxes, asset retirement obligation expenses, depreciation, depletion and amortization, asset impairment and mine closure costs, charges for the settlement of claims and litigation related to previously divested operations and amortization of basis difference related to equity affiliates. Adjusted EBITDA is the primary metric used by management to measure our segments’ operating performance and we believe it is useful to external users of our financial statements in comparing our current results with those of prior and future periods and in evaluating our operating performance without regard to our capital structure or the cost basis of our assets.
Adjusted Income from Continuing Operations and Adjusted Diluted EPS are defined as (loss) income from continuing operations and diluted earnings per share from continuing operations (EPS), respectively, excluding the impacts of asset impairment and mine closure costs and charges for the settlement of claims and litigation related to previously divested operations, net of tax, and the remeasurement of foreign income tax accounts on our income tax provision. The income tax benefits related to asset impairment and mine closure costs and charges for the settlement of claims and litigation related to previously divested operations have been calculated based on the enacted tax rate in the jurisdiction in which they have been or will be realized, adjusted for the estimated recoverability of those benefits. We have included Adjusted Income from Continuing Operations and Adjusted Diluted EPS in our discussion because, in the opinion of management, excluding those foregoing items is useful in comparing our current results with those of prior and future periods. We also believe that excluding the impact of the remeasurement of our foreign income tax accounts represents a meaningful indicator of our ongoing effective tax rate.
Reconciliations of Adjusted EBITDA, Adjusted Income from Continuing Operations and Adjusted Diluted EPS to their most comparable measures under U.S. GAAP are included below.
The selected financial data for all periods presented reflect the classification as discontinued operations of certain operations previously divested (by sale or otherwise).
42
On October 26, 2011, we acquired Macarthur Coal Limited (PEA-PCI). Our results of operations include PEA-PCI's results of operations from that date.
We have derived the selected historical financial data as of and for the years ended December 31,
2013
,
2012
,
2011
,
2010
and
2009
from our audited financial statements, adjusted retrospectively for items subsequently classified as discontinued operations and the implementation of certain accounting literature. The following table should be read in conjunction with the accompanying financial statements, including the related notes to those financial statements, and Part II, Item 7. “Management’s Discussion and Analysis of Financial Condition and Results of Operations.”
The results of operations for the historical periods included in the following table are not necessarily indicative of the results to be expected for future periods. In addition, Part I, Item 1A. “Risk Factors” of this report includes a discussion of risk factors that could impact our future results of operations.
|
|
Year Ended December 31,
|
||||||||||||||||||
|
|
2013
|
2012
|
2011
|
2010
|
2009
|
||||||||||||||
|
|
(In millions, except per share data)
|
||||||||||||||||||
|
Results of Operations Data
|
|
|
|
|
|
|
|
|
|
|
|||||||||
|
Total revenues
|
$
|
7,013.7
|
|
$
|
8,077.5
|
|
$
|
7,895.9
|
|
$
|
6,668.2
|
|
$
|
5,746.4
|
|
||||
|
Costs and expenses
|
7,338.5
|
|
7,905.0
|
|
6,300.2
|
|
5,317.1
|
|
4,919.6
|
|
|||||||||
|
Operating (loss) profit
|
(324.8
|
)
|
172.5
|
|
1,595.7
|
|
1,351.1
|
|
826.8
|
|
|||||||||
|
Interest expense, net
|
409.5
|
|
381.1
|
|
219.7
|
|
212.4
|
|
193.0
|
|
|||||||||
|
(Loss) income from continuing operations before income taxes
|
(734.3
|
)
|
(208.6
|
)
|
1,376.0
|
|
1,138.7
|
|
633.8
|
|
|||||||||
|
Income tax (benefit) provision
|
(448.3
|
)
|
262.3
|
|
363.2
|
|
313.7
|
|
187.8
|
|
|||||||||
|
(Loss) income from continuing operations, net of income taxes
|
(286.0
|
)
|
(470.9
|
)
|
1,012.8
|
|
825.0
|
|
446.0
|
|
|||||||||
|
(Loss) income from discontinued operations, net of income taxes
|
(226.6
|
)
|
(104.2
|
)
|
(66.5
|
)
|
(22.8
|
)
|
17.0
|
|
|||||||||
|
Net (loss) income
|
(512.6
|
)
|
(575.1
|
)
|
946.3
|
|
802.2
|
|
463.0
|
|
|||||||||
|
Less: Net income (loss) attributable to noncontrolling interests
|
12.3
|
|
10.6
|
|
(11.4
|
)
|
28.2
|
|
14.8
|
|
|||||||||
|
Net (loss) income attributable to common stockholders
|
$
|
(524.9
|
)
|
$
|
(585.7
|
)
|
$
|
957.7
|
|
$
|
774.0
|
|
$
|
448.2
|
|
||||
|
Basic EPS - (Loss) income from continuing operations
|
$
|
(1.12
|
)
|
$
|
(1.80
|
)
|
$
|
3.78
|
|
$
|
2.96
|
|
$
|
1.61
|
|
||||
|
Diluted EPS - (Loss) income from continuing operations
|
$
|
(1.12
|
)
|
$
|
(1.80
|
)
|
$
|
3.77
|
|
$
|
2.92
|
|
$
|
1.60
|
|
||||
|
Weighted average shares used in calculating basic EPS
|
267.1
|
|
268.0
|
|
269.1
|
|
267.0
|
|
265.5
|
|
|||||||||
|
Weighted average shares used in calculating diluted EPS
|
267.1
|
|
268.0
|
|
270.3
|
|
269.9
|
|
267.5
|
|
|||||||||
|
Dividends declared per share
|
$
|
0.340
|
|
$
|
0.340
|
|
$
|
0.340
|
|
$
|
0.295
|
|
$
|
0.250
|
|
||||
|
Other Data
|
|
|
|
|
|
|
|
|
|
|
|||||||||
|
Tons sold
|
251.7
|
|
248.5
|
|
249.4
|
|
243.1
|
|
239.7
|
|
|||||||||
|
Net cash provided by (used in) continuing operations:
|
|
|
|
|
|
|
|
|
|
|
|||||||||
|
Operating activities
|
$
|
780.1
|
|
$
|
1,599.8
|
|
$
|
1,652.1
|
|
$
|
1,104.5
|
|
$
|
1,038.6
|
|
||||
|
Investing activities
|
(514.2
|
)
|
(1,070.1
|
)
|
(3,737.2
|
)
|
(692.7
|
)
|
(404.2
|
)
|
|||||||||
|
Financing activities
|
(321.5
|
)
|
(663.3
|
)
|
1,678.5
|
|
(77.1
|
)
|
(104.6
|
)
|
|||||||||
|
Adjusted EBITDA
|
1,047.2
|
|
1,836.5
|
|
2,122.6
|
|
1,826.5
|
|
1,291.2
|
|
|||||||||
|
Adjusted Income from Continuing Operations
|
104.5
|
|
238.7
|
|
1,011.9
|
|
872.9
|
|
543.0
|
|
|||||||||
|
Adjusted Diluted EPS
|
$
|
0.34
|
|
$
|
0.84
|
|
$
|
3.77
|
|
$
|
3.10
|
|
$
|
1.96
|
|
||||
|
Balance Sheet Data (at period end)
|
|
|
|
|
|
|
|
|
|
|
|||||||||
|
Total assets
|
$
|
14,133.4
|
|
$
|
15,809.0
|
|
$
|
16,733.0
|
|
$
|
11,363.1
|
|
$
|
9,955.3
|
|
||||
|
Total long-term debt (including capital leases)
|
6,002.4
|
|
6,252.9
|
|
6,657.5
|
|
2,750.0
|
|
2,752.3
|
|
|||||||||
|
Total stockholders’ equity
|
3,947.9
|
|
4,938.8
|
|
5,515.8
|
|
4,689.3
|
|
3,755.9
|
|
|||||||||
43
Adjusted EBITDA is calculated as follows:
|
|
Year Ended December 31,
|
||||||||||||||||||
|
|
2013
|
2012
|
2011
|
2010
|
2009
|
||||||||||||||
|
|
|
(Dollars in millions)
|
|
||||||||||||||||
|
(Loss) income from continuing operations, net of income taxes
|
$
|
(286.0
|
)
|
$
|
(470.9
|
)
|
$
|
1,012.8
|
|
$
|
825.0
|
|
$
|
446.0
|
|
||||
|
Depreciation, depletion and amortization
|
740.3
|
|
663.4
|
|
474.3
|
|
429.5
|
|
390.8
|
|
|||||||||
|
Asset retirement obligation expenses
|
66.5
|
|
67.0
|
|
52.6
|
|
45.9
|
|
38.9
|
|
|||||||||
|
Asset impairment and mine closure costs
|
528.3
|
|
929.0
|
|
—
|
|
—
|
|
34.7
|
|
|||||||||
|
Settlement charges related to the Patriot bankruptcy reorganization
|
30.6
|
|
—
|
|
—
|
|
—
|
|
—
|
|
|||||||||
|
Amortization of basis difference related to equity affiliates
|
6.3
|
|
4.6
|
|
—
|
|
—
|
|
—
|
|
|||||||||
|
Interest expense, net
|
409.5
|
|
381.1
|
|
219.7
|
|
212.4
|
|
193.0
|
|
|||||||||
|
Income tax (benefit) provision
|
(448.3
|
)
|
262.3
|
|
363.2
|
|
313.7
|
|
187.8
|
|
|||||||||
|
Adjusted EBITDA
|
$
|
1,047.2
|
|
$
|
1,836.5
|
|
$
|
2,122.6
|
|
$
|
1,826.5
|
|
$
|
1,291.2
|
|
||||
Adjusted Income from Continuing Operations is calculated as follows:
|
Year Ended December 31,
|
|||||||||||||||||||
|
|
2013
|
2012
|
2011
|
2010
|
2009
|
||||||||||||||
|
|
(Dollars in millions)
|
||||||||||||||||||
|
(Loss) income from continuing operations, net of income taxes
|
$
|
(286.0
|
)
|
$
|
(470.9
|
)
|
$
|
1,012.8
|
|
$
|
825.0
|
|
$
|
446.0
|
|
||||
|
Asset impairment and mine closure costs
|
528.3
|
|
929.0
|
|
—
|
|
—
|
|
34.7
|
|
|||||||||
|
Settlement charges related to the Patriot bankruptcy reorganization
|
30.6
|
|
—
|
|
—
|
|
—
|
|
—
|
|
|||||||||
|
Income tax benefit related to asset impairment and mine closure costs
|
(112.8
|
)
|
(227.3
|
)
|
—
|
|
—
|
|
(12.1
|
)
|
|||||||||
|
Income tax benefit related to the settlement charges related to the Patriot bankruptcy reorganization
|
(11.3
|
)
|
—
|
|
—
|
|
—
|
|
—
|
|
|||||||||
|
Remeasurement (benefit) expense related to foreign income tax accounts
|
(44.3
|
)
|
7.9
|
|
(0.9
|
)
|
47.9
|
|
74.4
|
|
|||||||||
|
Adjusted Income from Continuing Operations
|
$
|
104.5
|
|
$
|
238.7
|
|
$
|
1,011.9
|
|
$
|
872.9
|
|
$
|
543.0
|
|
||||
Adjusted Diluted EPS is calculated as follows:
|
Year Ended December 31,
|
|||||||||||||||||||
|
|
2013
|
2012
|
2011
|
2010
|
2009
|
||||||||||||||
|
Diluted EPS - (Loss) income from continuing operations
|
$
|
(1.12
|
)
|
$
|
(1.80
|
)
|
$
|
3.77
|
|
$
|
2.92
|
|
$
|
1.60
|
|
||||
|
Asset impairment and mine closure costs, net of income taxes
|
1.56
|
|
2.61
|
|
—
|
|
—
|
|
0.08
|
|
|||||||||
|
Settlement charges related to the Patriot bankruptcy reorganization, net of income taxes
|
0.07
|
|
—
|
|
—
|
|
—
|
|
—
|
|
|||||||||
|
Remeasurement (benefit) expense related to foreign income tax accounts
|
(0.17
|
)
|
0.03
|
|
—
|
|
0.18
|
|
0.28
|
|
|||||||||
|
Adjusted Diluted EPS
|
$
|
0.34
|
|
$
|
0.84
|
|
$
|
3.77
|
|
$
|
3.10
|
|
$
|
1.96
|
|
||||
Item 7.
Management’s Discussion and Analysis of Financial Condition and Results of Operations.
Overview
We are the world’s largest private sector coal company. We own interests in
28
active coal mining operations located in the United States (U.S.) and Australia. We have a majority interest in
27
of those mining operations and a 50% equity interest in the Middlemount Mine in Australia. In addition to our mining operations, we market and broker coal from other coal producers, both as principal and agent, and trade coal and freight-related contracts through trading and business offices in China, Australia, the United Kingdom, Germany, Singapore, India, Indonesia and the U.S.
44
In
2013
, we produced and sold
218.4 million
and
251.7 million
tons of coal, respectively, from continuing operations. During that period, approximately
80%
of our worldwide sales (by volume) were under long-term contracts. For the year ended December 31,
2013
,
73%
of our total sales (by volume) were to U.S. electricity generators,
26%
were to customers outside the U.S. and
1%
were to the U.S. industrial sector.
We conduct business through four principal operating segments: Western U.S. Mining, Midwestern U.S. Mining, Australian Mining and Trading and Brokerage. Our Western U.S. Mining segment consists of our Powder River Basin, Southwest and Colorado operations, while our Midwestern U.S. Mining segment consists of our operations in Illinois and Indiana.
The principal business of the Western and Midwestern U.S. Mining segments is the mining, preparation and sale of thermal coal. In the U.S., we typically supply thermal coal to domestic electricity generators and industrial customers for power generation under long-term contracts, with a portion sold into seaborne export markets.
The business of our Australian Mining segment is the mining of various qualities of metallurgical coal, as well as thermal coal. Our Australian Mining segment operations are primarily export focused with customers spread across several countries, with a portion of our coal being sold within Australia. Revenues from individual countries generally vary year by year based on demand for electricity and steel, global economic conditions and several other factors, including those specific to each country. Industry commercial practice, and our typical practice, is to negotiate pricing for those metallurgical and seaborne thermal coal contracts on a quarterly and annual basis, respectively, with a portion sold on a shorter-term basis.
The principal business of our Trading and Brokerage segment is the marketing and brokering of coal for other producers, both as principal and agent, and the trading of coal and freight-related contracts. From time to time and where possible, our Trading and Brokerage segment may enter into financial derivative contract positions offsetting certain coal purchase and sale contracts included in our portfolio in an effort to reduce market price risk and secure a margin on forecasted transactions. The segment also provides transportation-related services in support of our coal trading strategy, including economic hedging, and conducts cash flow hedging activities in support of sales from our mining operations.
Our fifth segment, Corporate and Other, includes mining and export/transportation joint ventures and activities associated with certain energy-related commercial matters, Btu Conversion, the optimization of our coal reserve and real estate holdings and the closure of inactive mining sites.
To maximize our coal assets and land holdings for long-term growth, we are evaluating Btu Conversion projects that would convert coal to natural gas (CTG) or transportation fuels (CTL) and contributing to the development of clean coal technologies, including carbon capture and storage (CCS).
As discussed more fully in Part I, Item 1A. “Risk Factors,” our results of operations in the near-term could be negatively impacted by weather conditions, cost of competing fuels, availability of transportation for coal shipments, labor relations, unforeseen geologic conditions or equipment problems at mining locations and adverse changes in economic conditions in the regions in which we sell coal. On a long-term basis, our results of operations could be impacted by our ability to secure or acquire high-quality coal reserves, find replacement buyers for coal under contracts with comparable terms to existing contracts, competition from other fuel sources or the passage of new or expanded regulations that could limit our ability to mine, increase our mining costs or limit our customers’ ability to utilize coal as fuel for electricity generation. In the past, we have achieved production levels that are relatively consistent with our projections. We may adjust our production levels in response to changes in market demand.
Results of Operations
Non-U.S. GAAP Financial Measures
The following discussion of our results of operations includes references to and analysis of Adjusted EBITDA, Adjusted Income from Continuing Operations and Adjusted Diluted EPS, which are financial measures not recognized in accordance with U.S. generally accepted accounting principles (GAAP). These financial measures are not intended to serve as alternatives to U.S. GAAP measures of performance and may not be comparable to similarly-titled measures presented by other companies. Beginning with this report, we have modified the definitions of these non-GAAP financial measures to also exclude the impact of charges for the settlement of claims and litigation related to previously divested operations because we believe that excluding these impacts is useful in comparing our 2013 results with those of prior and future periods.
45
Adjusted EBITDA is defined as (loss) income from continuing operations before deducting net interest expense, income taxes, asset retirement obligation expenses, depreciation, depletion and amortization, asset impairment and mine closure costs, charges for the settlement of claims and litigation related to previously divested operations and amortization of basis difference related to equity affiliates. Adjusted EBITDA is the primary metric used by management to measure our segments’ operating performance and we believe it is useful to external users of our financial statements in comparing our current results with those of prior and future periods and in evaluating our operating performance without regard to our capital structure or the cost basis of our assets.
Adjusted Income from Continuing Operations and Adjusted Diluted EPS are defined as (loss) income from continuing operations and diluted earnings per share from continuing operations (EPS), respectively, excluding the impacts of asset impairment and mine closure costs and charges for the settlement of claims and litigation related to previously divested operations, net of tax, and the remeasurement of foreign income tax accounts on our income tax provision. The income tax benefits related to asset impairment and mine closure costs and charges for the settlement of claims and litigation related to previously divested operations have been calculated based on the enacted tax rate in the jurisdiction in which they have been or will be realized, adjusted for the estimated recoverability of those benefits. We have included Adjusted Income from Continuing Operations and Adjusted Diluted EPS in our discussion because, in the opinion of management, excluding those foregoing items is useful in comparing our current results with those of prior periods. We also believe that excluding the impact of the remeasurement of our foreign income tax accounts represents a meaningful indicator of our ongoing effective tax rate.
A reconciliation of Adjusted EBITDA to its most comparable measure under U.S. GAAP is included in Note 27. "Segment and Geographic Information" of the consolidated financ
ial statements, which information is incorporated herein by reference. Adjusted Income from Continuing Operations and Adjusted Diluted EPS are reconciled to their most comparable measures under U.S. GAAP in the sections that follow.
Year Ended December 31,
2013
Compared to Year Ended December 31,
2012
Summary
During the year ended December 31, 2013, the global coal market segments in which we sell our products were confronted with excess international seaborne coal supply and high coal stockpile inventories at U.S. electric power generation customers, the effects of which have impacted our results for the period. Indicators of improvement since the beginning of 2013 have been mixed.
Trends in global demand for metallurgical coal were positive during the year ended December 31, 2013, corresponding with a 3.5% increase in worldwide steel production during that period compared to the prior year, according to data recently published by the World Steel Association (WSA), with an increase in Asian steel production during that period offsetting a decline in steel production for the rest of the world. Similarly, international seaborne thermal coal demand increased in the year ended December 31, 2013 compared to the prior year, led by imports into China, India, Japan and Germany. Nonetheless, growth in seaborne coal market supply outpaced the increase in demand in 2013, leading to continued constraints on international coal prices. Quarterly benchmark pricing for seaborne high quality hard coking coal (HQHCC), low volatile pulverized coal injection products (LV PCI) and thermal coal originating from Newcastle, Australia (NEWC) for 2013 and 2012 were as follows (on a per tonne basis):
|
Contract Commencement Month:
|
HQHCC
|
Increase (Decrease) to Prices %
|
LV PCI
|
Increase (Decrease) to Prices %
|
NEWC
|
Increase (Decrease) to Prices %
|
|||||||||||||||||||||||||||
|
2013
|
2012
|
2013
|
2012
|
2013
|
2012
|
||||||||||||||||||||||||||||
|
January
|
$
|
165
|
|
$
|
235
|
|
(30
|
)%
|
$
|
124
|
|
$
|
171
|
|
(27
|
)%
|
$
|
91
|
|
$
|
115
|
|
(21
|
)%
|
|||||||||
|
April
|
$
|
172
|
|
$
|
210
|
|
(18
|
)%
|
$
|
141
|
|
$
|
153
|
|
(8
|
)%
|
$
|
95
|
|
$
|
115
|
|
(17
|
)%
|
|||||||||
|
July
|
$
|
145
|
|
$
|
225
|
|
(36
|
)%
|
$
|
116
|
|
$
|
162
|
|
(28
|
)%
|
$
|
90
|
|
$
|
95
|
|
(5
|
)%
|
|||||||||
|
October
|
$
|
152
|
|
$
|
170
|
|
(11
|
)%
|
$
|
121
|
|
$
|
125
|
|
(3
|
)%
|
$
|
86
|
|
$
|
97
|
|
(11
|
)%
|
|||||||||
U.S. coal consumption increased by 3.5% during the year ended December 31, 2013 compared to the prior year, led by the electric power generation sector, according to the U.S. Energy Information Administration (EIA). Current year U.S. electric power generation from coal has benefited from gas-to-coal switching due to higher natural gas prices and higher heating-degree days during the winter months of 2013, partially offset by lower cooling-degree days in 2013. Despite the year-over-year increase in U.S. coal consumption, our U.S. sales volumes declined in 2013 compared to 2012 as electric power generation customers continued to draw down on their coal stockpile inventories throughout the year to serve that increase in demand.
46
Our revenues decreased during the year ended December 31, 2013 compared to the prior year (
$1,063.8 million
) due to lower average realized pricing across our global platform, lower volumes in the U.S. and lower Trading and Brokerage contributions, partially offset by an increase in Australian Mining segment tons sold from expansion projects completed in 2012.
In light of lower revenues, we focused on controlling costs at all levels of the organization throughout 2013. We completed owner-operator conversions at several of our Australian mines during the second quarter of 2013, realized productivity improvements at certain Australian operations acquired in late 2011 from optimization and remediation efforts completed in the prior year and reduced the use of contractors, temporary labor and overtime across the platform. These cost control initiatives partially offset the effect of lower coal prices. Overall, Segment Adjusted EBITDA decreased during the year ended December 31, 2013 compared to the prior year (
$902.1 million
).
Net results attributable to common stockholders improved during the year ended December 31, 2013 compared to the prior year (
$60.8 million
). The impact of lower Adjusted EBITDA, an increase in depreciation, depletion and amortization, higher interest expense and adverse changes in results from discontinued operations were more than offset by the positive effect of an overall income tax benefit recorded in 2013 and a decrease in asset impairment and mine closures costs, as discussed below.
As of December 31, 2013, our available liquidity was approximately $2.1 billion. Refer to the "Liquidity and Capital Resources" section contained within this Item 7 for further discussion of factors affecting our available liquidity.
Tons Sold
The following table presents tons sold by operating segment for the years ended December 31,
2013
and
2012
:
|
|
Year Ended December 31,
|
Increase (Decrease)
to Tons Sold
|
|||||||||
|
|
2013
|
2012
|
Tons
|
%
|
|||||||
|
|
(Tons in millions)
|
||||||||||
|
Australian Mining
|
34.9
|
|
33.0
|
|
1.9
|
|
5.8
|
%
|
|||
|
Western U.S. Mining
|
158.8
|
|
165.2
|
|
(6.4
|
)
|
(3.9
|
)%
|
|||
|
Midwestern U.S. Mining
|
26.3
|
|
27.4
|
|
(1.1
|
)
|
(4.0
|
)%
|
|||
|
Trading and Brokerage
|
31.7
|
|
22.9
|
|
8.8
|
|
38.4
|
%
|
|||
|
Total tons sold
|
251.7
|
|
248.5
|
|
3.2
|
|
1.3
|
%
|
|||
Revenues
The following table presents revenues by operating segment for the years ended December 31,
2013
and
2012
:
|
Year Ended December 31,
|
Increase (Decrease)
to Revenues
|
|||||||||||||
|
|
2013
|
2012
|
$
|
%
|
||||||||||
|
|
(Dollars in millions)
|
|||||||||||||
|
Australian Mining
|
$
|
2,904.6
|
|
$
|
3,503.6
|
|
$
|
(599.0
|
)
|
(17.1
|
)%
|
|||
|
Western U.S. Mining
|
2,669.6
|
|
2,949.3
|
|
(279.7
|
)
|
(9.5
|
)%
|
||||||
|
Midwestern U.S. Mining
|
1,335.5
|
|
1,403.7
|
|
(68.2
|
)
|
(4.9
|
)%
|
||||||
|
Trading and Brokerage
|
66.0
|
|
199.9
|
|
(133.9
|
)
|
(67.0
|
)%
|
||||||
|
Corporate and Other
|
38.0
|
|
21.0
|
|
17.0
|
|
81.0
|
%
|
||||||
|
Total revenues
|
$
|
7,013.7
|
|
$
|
8,077.5
|
|
$
|
(1,063.8
|
)
|
(13.2
|
)%
|
|||
The decrease in our Australian Mining segment revenues for the year ended December 31, 2013 compared to the prior year was primarily driven by the aforementioned decline in settlement prices for metallurgical and thermal coal ($742.7 million). That unfavorable pricing effect was partially offset by an increase in tons sold in 2013 ($143.7 million) attributed to improved production capacity and efficiency from certain growth and development projects completed in the second half of 2012. The increase in production was somewhat tempered in 2013 by geologic issues and delays in the commissioning of longwall top coal caving technology at our North Goonyella Mine and geologic issues and an industrial action at our Metropolitan Mine that was resolved in November 2013. Metallurgical coal sales totaled 15.9 million and 14.1 million tons in 2013 and 2012, respectively.
47
Western U.S. Mining segment revenues were negatively affected by lower realized pricing in the year ended December 31, 2013 compared to the prior year ($145.7 million). The impact of year-over-year changes in volume and mix was also unfavorable in 2013 ($134.0 million), corresponding with the
3.9%
decrease in tons sold noted above.
Midwestern U.S. Mining segment revenues decreased slightly in 2013 compared to the prior year, predominantly from a
4.0%
decrease in sales volumes.
The decline in our Trading and Brokerage segment revenues during the year ended December 31, 2013 compared to the prior year reflected lower realized prices on export shipments, a decrease in throughput and margins from certain third-party Eastern U.S. coal miners due to lower year-over-year coal production, unfavorable changes in the fair value of our global financial trading positions and supply performance issues related to certain international counterparties.
Segment Adjusted EBITDA
The following table presents Segment Adjusted EBITDA for the years ended December 31,
2013
and
2012
:
|
Year Ended December 31,
|
Increase (Decrease) to
Segment Adjusted EBITDA
|
|||||||||||||
|
|
2013
|
2012
|
$
|
%
|
||||||||||
|
|
(Dollars in millions)
|
|
||||||||||||
|
Australian Mining
|
$
|
316.6
|
|
$
|
938.9
|
|
$
|
(622.3
|
)
|
(66.3
|
)%
|
|||
|
Western U.S. Mining
|
693.2
|
|
832.8
|
|
(139.6
|
)
|
(16.8
|
)%
|
||||||
|
Midwestern U.S. Mining
|
426.4
|
|
427.0
|
|
(0.6
|
)
|
(0.1
|
)%
|
||||||
|
Trading and Brokerage
|
(19.9
|
)
|
119.7
|
|
(139.6
|
)
|
(116.6
|
)%
|
||||||
|
Total Segment Adjusted EBITDA
|
$
|
1,416.3
|
|
$
|
2,318.4
|
|
$
|
(902.1
|
)
|
(38.9
|
)%
|
|||
Adjusted EBITDA from our Australian Mining segment was adversely affected during the year ended December 31, 2013 compared to the prior year by lower realized metallurgical and thermal coal pricing, net of sales-related costs ($686.1 million), costs associated with delays in the commissioning of longwall top coal caving technology and geologic issues at the North Goonyella Mine noted above ($116.0 million) and inflationary cost escalations ($61.8 million). Those factors were partially offset by the benefits of production efficiencies realized in the current year at several surface mining operations due to certain owner-operator conversions completed in April 2013 and comparatively favorable geologic conditions ($130.0 million) and the effect of our ongoing cost containment initiatives ($127.8 million). While tons sold increased by
5.8%
in 2013 compared to the prior year, the resulting benefits were largely offset by lower weighted-average margins experienced across the platform.
Lower Western U.S. Mining segment Adjusted EBITDA for the year ended December 31, 2013 compared to the prior year mainly reflected lower realized coal pricing, net of sales-related costs ($97.2 million), and a decline in tons sold ($73.1 million). Western U.S. Mining segment Adjusted EBITDA results for 2013 were also unfavorably impacted by higher costs associated with production-related commodities, net of hedging ($14.9 million). Those factors were partially offset by lower year-over-year expenditures related to materials and supplies, maintenance, labor and other operations support spending attributed to cost containment initiatives ($42.9 million).
Midwestern U.S. Mining segment Adjusted EBITDA for the year ended December 31, 2013 was in line with results from the prior year. The negative effects of lower volumes and revenues discussed above and higher costs associated with production-related commodities, net of hedging ($21.6 million), were largely offset by a change in production mix toward lower-cost operations and other cost containment initiatives.
Trading and Brokerage segment Adjusted EBITDA for the year ended December 31, 2013 decreased compared to the prior year. In addition to the revenue items noted above, Trading and Brokerage results were adversely impacted in 2013 by a $20.6 million charge related to the Gulf Power litigation. Refer to Note 24. "Commitments and Contingencies" to the accompanying consolidated financial statements for additional information related to that matter, which information is incorporated herein by reference.
48
Loss From Continuing Operations Before Income Taxes
The following table presents loss from continuing operations before income taxes for the years ended December 31,
2013
and
2012
:
|
Year Ended December 31,
|
Increase (Decrease)
to Income
|
|||||||||||||
|
|
2013
|
2012
|
$
|
%
|
||||||||||
|
|
(Dollars in millions)
|
|||||||||||||
|
Total Segment Adjusted EBITDA
|
$
|
1,416.3
|
|
$
|
2,318.4
|
|
$
|
(902.1
|
)
|
(38.9
|
)%
|
|||
|
Corporate and Other Adjusted EBITDA
(1)
|
(369.1
|
)
|
(481.9
|
)
|
112.8
|
|
23.4
|
%
|
||||||
|
Depreciation, depletion and amortization
|
(740.3
|
)
|
(663.4
|
)
|
(76.9
|
)
|
(11.6
|
)%
|
||||||
|
Asset retirement obligation expenses
|
(66.5
|
)
|
(67.0
|
)
|
0.5
|
|
0.7
|
%
|
||||||
|
Asset impairment and mine closure costs
|
(528.3
|
)
|
(929.0
|
)
|
400.7
|
|
43.1
|
%
|
||||||
|
Settlement charges related to the Patriot bankruptcy reorganization
|
(30.6
|
)
|
—
|
|
(30.6
|
)
|
n.m.
|
|
||||||
|
Amortization of basis difference related to equity affiliates
|
(6.3
|
)
|
(4.6
|
)
|
(1.7
|
)
|
(37.0
|
)%
|
||||||
|
Interest expense
|
(425.2
|
)
|
(405.6
|
)
|
(19.6
|
)
|
(4.8
|
)%
|
||||||
|
Interest income
|
15.7
|
|
24.5
|
|
(8.8
|
)
|
(35.9
|
)%
|
||||||
|
Loss from continuing operations before income taxes
|
$
|
(734.3
|
)
|
$
|
(208.6
|
)
|
$
|
(525.7
|
)
|
(252.0
|
)%
|
|||
|
(1)
|
Corporate and Other Adjusted EBITDA includes selling and administrative expenses, income (losses) from equity affiliates, gains (losses) on certain asset sales, costs associated with past mining activities, certain coal royalty expenses, resource management costs and revenues and expenses related to our other commercial activities, such as generation development and Btu Conversion.
|
Results from continuing operations before income taxes for the year ended December 31, 2013 declined compared to the prior year. In addition to the decrease in Segment Adjusted EBITDA discussed above, our 2013 results reflect comparatively higher depreciation, depletion and amortization and interest expense, in addition to a settlement charge related to the bankruptcy reorganization of Patriot Coal Corporation (Patriot). Those negative factors were partially offset by lower asset impairment and mine closure costs and an improvement in Corporate and Other Adjusted EBITDA.
The favorable change in Corporate and Other Adjusted EBITDA during the year ended December 31, 2013 compared to the prior year reflected a second quarter 2013 gain on the sale of non-strategic coal reserves and surface lands in Kentucky ($40.3 million), lower postretirement health care costs due to favorable health care costs trend rates ($25.6 million), improved results from equity affiliates ($22.7 million) and reduced selling and administrative expenses resulting from our ongoing cost containment initiatives ($19.7 million). The improvement in results from equity affiliates was driven by the implementation of certain operational improvements at the Middlemount Mine in Queensland, Australia during the second half of 2013, which improvements included a conversion to owner-operator status. Those factors were partially offset by a charge of $20.0 million recorded in 2013 due to an increase in estimate of our undiscounted liabilities for environmental clean-up related costs associated with Gold Fields Mining, LLC, a dormant, non-coal producing entity that was previously managed and owned by our predecessor owner and transferred to us in a February 1997 spin-off.
49
The following table presents a summary of depreciation, depletion and amortization expense by segment for the years ended December 31,
2013
and
2012
:
|
Increase (Decrease)
|
||||||||||||||
|
Year Ended December 31,
|
to Income
|
|||||||||||||
|
|
2013
|
2012
|
$
|
%
|
||||||||||
|
|
(Dollars in millions)
|
|
||||||||||||
|
Australian Mining
|
$
|
(406.4
|
)
|
$
|
(344.0
|
)
|
$
|
(62.4
|
)
|
(18.1
|
)%
|
|||
|
Western U.S. Mining
|
(220.2
|
)
|
(209.5
|
)
|
(10.7
|
)
|
(5.1
|
)%
|
||||||
|
Midwestern U.S. Mining
|
(80.4
|
)
|
(81.6
|
)
|
1.2
|
|
1.5
|
%
|
||||||
|
Trading and Brokerage
|
(0.7
|
)
|
(0.7
|
)
|
—
|
|
—
|
%
|
||||||
|
Corporate and Other
|
(32.6
|
)
|
(27.6
|
)
|
(5.0
|
)
|
(18.1
|
)%
|
||||||
|
Total
|
$
|
(740.3
|
)
|
$
|
(663.4
|
)
|
$
|
(76.9
|
)
|
(11.6
|
)%
|
|||
Additionally, the following table presents a summary of our weighted-average depletion rate per ton for active mines in each of our mining segments for the years ended December 31,
2013
and
2012
:
|
Year Ended December 31,
|
|||||||
|
|
2013
|
2012
|
|||||
|
Australian Mining
|
$
|
5.03
|
|
$
|
5.32
|
|
|
|
Western U.S. Mining
|
0.81
|
|
0.69
|
|
|||
|
Midwestern U.S. Mining
|
0.66
|
|
0.67
|
|
|||
The increase in depreciation, depletion and amortization expense noted in the year ended December 31, 2013 compared to the prior year was predominantly driven by higher expense from our Australian Mining segment. That increase was primarily due to a year-over-year increase in tons sold, additional expense from growth and development projects completed in late 2012 and the depreciation of additional capital equipment acquired in connection with owner-operator conversions completed at certain mines in the second quarter of 2013. Those increases were partially offset by lower asset bases at certain sites due to asset impairment charges recognized in the fourth quarter of 2012. Depreciation, depletion and amortization expense in the year ended December 31, 2012 was affected by provisional fair value adjustments associated with our 2011 acquisition of Macarthur Coal Limited (PEA-PCI), which lowered expense by $9.2 million.
The increase in depreciation, depletion and amortization from our Western U.S. Mining segment during the year ended December 31, 2013 compared to the prior year reflected a shift in production mix toward higher depletion rate coal reserve locations, which more than offset the effect of the
3.9%
decrease in tons sold.
Asset retirement obligation expenses for the year ended December 31, 2013 were in line with the prior year. The slight decrease was largely attributable to lower ongoing reclamation rates from our Western U.S. Mining segment due to favorable changes in cost trends and lower volumes, partially offset by the effect of increased production volumes from our Australian Mining segment and an increase in reclamation rates at certain of our Australian mines associated with recently completed expansion projects.
We recognized
$528.3 million
and
$929.0 million
in aggregate asset impairment and mine closure charges during the years ended December 31, 2013 and 2012, respectively. Refer to Note 2. "Asset Impairment and Mine Closure Costs" to the accompanying consolidated financial statements for further information regarding the nature and composition of those charges, which information is incorporated herein by reference.
Results from continuing operations before income taxes for the year ended December 31, 2013 included $30.6 million in before-tax charges associated with the settlement of claims and litigation related to the Patriot bankruptcy reorganization. Refer to Note 25. "Matters Related to the Bankruptcy of Patriot Coal Corporation" to the accompanying consolidated financial statements for additional information surrounding the related matters, which information is incorporated herein by reference.
Interest expense for the year ended December 31, 2013 included higher early debt extinguishment charges compared to the prior year ($13.6 million), which was mainly attributable to the 2013 Credit Facility that was entered into during the third quarter of 2013. Refer to the "Liquidity and Capital Resources" section below for additional information related to the 2013 Credit Facility. Interest expense also increased in 2013 due to higher interest rates associated with our term loan borrowings and $6.9 million in prejudgment interest recognized in the second quarter of 2013 associated with the Gulf Power litigation. Those factors were partially offset by the beneficial effect of lower average debt levels in the current year.
50
Loss from Continuing Operations, Net of Income Taxes
The following table presents loss from continuing operations, net of income taxes, for the years ended December 31,
2013
and
2012
:
|
Year Ended December 31,
|
Increase (Decrease)
to Income
|
|||||||||||||
|
|
2013
|
2012
|
$
|
%
|
||||||||||
|
|
(Dollars in millions)
|
|||||||||||||
|
Loss from continuing operations before income taxes
|
$
|
(734.3
|
)
|
$
|
(208.6
|
)
|
$
|
(525.7
|
)
|
(252.0
|
)%
|
|||
|
Income tax (benefit) provision
|
(448.3
|
)
|
262.3
|
|
710.6
|
|
270.9
|
%
|
||||||
|
Loss from continuing operations, net of income taxes
|
$
|
(286.0
|
)
|
$
|
(470.9
|
)
|
$
|
184.9
|
|
39.3
|
%
|
|||
Loss from continuing operations, net of income taxes, for the year ended December 31, 2013 improved compared to the prior year, with the adverse changes in before-tax earnings discussed above more than offset by the positive effect of the overall income tax benefit recorded in 2013.
The year-over-year positive effect of income taxes in 2013 was driven by the following:
|
•
|
A prior year increase in our valuation allowance against Australian ($332.2 million) and U.S. ($85.5 million) loss carryforwards based on changes in the estimated future realization of those carryforwards;
|
|
•
|
The impact of lower current year earnings, including the income tax effects of asset impairment and mine closure costs and charges associated with the settlement of claims and litigation related to the Patriot bankruptcy reorganization ($210.3 million);
|
|
•
|
Recoverable benefits (royalty allowance) recognized in 2013 related to the Australian minerals and resource rent tax (MRRT) ($148.4 million); and
|
|
•
|
The impact from the remeasurement of non-U.S. tax accounts as a result of the current year weakening of the Australian dollar compared with strengthening in the prior year ($52.2 million), as set forth in the table below; partially offset by
|
|
•
|
The recognition of a net tax benefit in 2012 due to the restructuring of foreign operations ($74.7 million), comprised of a realized U.S. capital loss benefit, net of valuation allowance, and a foreign tax benefit due to the tax basis reset required upon the PEA-PCI operations joining our Australian consolidated tax group.
|
|
|
December 31,
|
Rate Change
|
|||||||||||||||||
|
|
2013
|
2012
|
2011
|
2013
|
2012
|
||||||||||||||
|
Australian dollar to U.S. dollar exchange rate (period end)
|
$
|
0.8948
|
|
$
|
1.0384
|
|
$
|
1.0156
|
|
$
|
(0.1436
|
)
|
$
|
0.0228
|
|
||||
Adjusted Income From Continuing Operations
The following table presents Adjusted Income from Continuing Operations for the years ended December 31,
2013
and
2012
:
|
Year Ended December 31,
|
Increase (Decrease)
to Income
|
|||||||||||||
|
|
2013
|
2012
|
$
|
%
|
||||||||||
|
|
(Dollars in millions)
|
|||||||||||||
|
Loss from continuing operations, net of income taxes
|
$
|
(286.0
|
)
|
$
|
(470.9
|
)
|
$
|
184.9
|
|
39.3
|
%
|
|||
|
Asset impairment and mine closure costs
|
528.3
|
|
929.0
|
|
(400.7
|
)
|
(43.1
|
)%
|
||||||
|
Settlement charges related to the Patriot bankruptcy reorganization
|
30.6
|
|
—
|
|
30.6
|
|
n.m.
|
|
||||||
|
Income tax benefit related to asset impairment and mine closure costs
|
(112.8
|
)
|
(227.3
|
)
|
114.5
|
|
50.4
|
%
|
||||||
|
Income tax benefit related to the settlement charges related to the Patriot bankruptcy reorganization
|
(11.3
|
)
|
—
|
|
(11.3
|
)
|
n.m.
|
|
||||||
|
Remeasurement (benefit) expense related to foreign income tax accounts
|
(44.3
|
)
|
7.9
|
|
(52.2
|
)
|
(660.8
|
)%
|
||||||
|
Adjusted Income from Continuing Operations
|
$
|
104.5
|
|
$
|
238.7
|
|
$
|
(134.2
|
)
|
(56.2
|
)%
|
|||
51
Adjusted Income from Continuing Operations decreased in the year ended December 31, 2013 compared to the prior year due to unfavorable year-over-year changes in Adjusted EBITDA and higher depreciation, depletion and amortization and interest expense, partially offset by the effect of income taxes, as discussed above.
Net Loss Attributable to Common Stockholders
The following table presents net loss attributable to common stockholders for the years ended December 31,
2013
and
2012
:
|
Year Ended December 31,
|
Increase (Decrease)
to Income
|
|||||||||||||
|
|
2013
|
2012
|
$
|
%
|
||||||||||
|
|
(Dollars in millions)
|
|||||||||||||
|
Loss from continuing operations, net of income taxes
|
$
|
(286.0
|
)
|
$
|
(470.9
|
)
|
$
|
184.9
|
|
39.3
|
%
|
|||
|
Loss from discontinued operations, net of income taxes
|
(226.6
|
)
|
(104.2
|
)
|
(122.4
|
)
|
(117.5
|
)%
|
||||||
|
Net loss
|
(512.6
|
)
|
(575.1
|
)
|
62.5
|
|
10.9
|
%
|
||||||
|
Net income attributable to noncontrolling interests
|
12.3
|
|
10.6
|
|
(1.7
|
)
|
(16.0
|
)%
|
||||||
|
Net loss attributable to common stockholders
|
$
|
(524.9
|
)
|
$
|
(585.7
|
)
|
$
|
60.8
|
|
10.4
|
%
|
|||
Net results attributable to common stockholders improved during the year ended December 31, 2013 compared to the prior year largely due to the favorable change in results from continuing operations, net of income taxes, discussed above, partially offset by the unfavorable impact of changes in results from discontinued operations.
Loss from discontinued operations for the year ended December 31, 2013 reflected before- and after-tax asset impairment and mine closure costs of
$167.4 million
and
$117.2 million
, respectively, recognized in connection with the closure of the Wilkie Creek Mine in Queensland, Australia. Results for that period also included before- and after-tax charges of $98.0 million and $61.8 million, respectively, associated with the settlement of claims and litigation related to the Patriot bankruptcy reorganization. Loss from discontinued operations for the year ended December 31, 2012 included before- and after-tax asset impairment and mine closure costs of
$116.7 million
and
$75.0 million
, respectively, recognized in connection with the closure of our former Air Quality Mine in Indiana. Additional information surrounding the aforementioned asset impairment and mine closure costs and charges for the settlement of claims and litigation related to the Patriot bankruptcy reorganization is included in Note 2. "Asset Impairment and Mine Closure Costs" and Note 25. "Matters Related to the Bankruptcy of Patriot Coal Corporation" to the accompanying consolidated financial statements, respectively, which information is incorporated herein by reference.
Diluted EPS
The following table presents diluted EPS for the years ended December 31,
2013
and
2012
:
|
Year Ended December 31,
|
Increase (Decrease)
to EPS
|
|||||||||||||
|
|
2013
|
2012
|
$
|
%
|
||||||||||
|
Diluted EPS attributable to common stockholders:
|
||||||||||||||
|
Loss from continuing operations
|
$
|
(1.12
|
)
|
$
|
(1.80
|
)
|
$
|
0.68
|
|
37.8
|
%
|
|||
|
Loss from discontinued operations
|
(0.85
|
)
|
(0.39
|
)
|
(0.46
|
)
|
(117.9
|
)%
|
||||||
|
Net loss
|
$
|
(1.97
|
)
|
$
|
(2.19
|
)
|
$
|
0.22
|
|
10.0
|
%
|
|||
Diluted EPS increased in the year ended December 31, 2013 compared to the prior year commensurate with the improvement in results from continuing operations between those periods, partially offset by higher losses from discontinued operations.
52
Adjusted Diluted EPS
The following table presents Adjusted Diluted EPS for the years ended December 31,
2013
and
2012
:
|
Year Ended December 31,
|
Increase (Decrease)
to EPS
|
|||||||||||||
|
|
2013
|
2012
|
$
|
%
|
||||||||||
|
Adjusted Diluted EPS Reconciliation:
|
||||||||||||||
|
Loss from continuing operations
|
$
|
(1.12
|
)
|
$
|
(1.80
|
)
|
$
|
0.68
|
|
37.8
|
%
|
|||
|
Asset impairment and mine closure costs, net of income taxes
|
1.56
|
|
2.61
|
|
(1.05
|
)
|
(40.2
|
)%
|
||||||
|
Settlement charges related to the Patriot bankruptcy reorganization, net of income taxes
|
0.07
|
|
—
|
|
0.07
|
|
n/a
|
|
||||||
|
Remeasurement (benefit) expense related to foreign income tax accounts
|
(0.17
|
)
|
0.03
|
|
(0.20
|
)
|
(666.7
|
)%
|
||||||
|
Adjusted Diluted EPS
|
$
|
0.34
|
|
$
|
0.84
|
|
$
|
(0.50
|
)
|
(59.5
|
)%
|
|||
Adjusted Diluted EPS for the year ended December 31, 2013 decreased compared to the prior year commensurate with the decline in Adjusted Income from Continuing Operations during that period.
Other
The net fair value of our foreign currency cash flow hedges decreased from a net asset of
$286.9 million
at
December 31, 2012
to a net liability of
$473.3 million
at
December 31, 2013
primarily due to the weakening of the Australian dollar relative to the U.S. dollar during that period. This change is reflected in “Other current assets,” “Investments and other assets,” "Accounts payable and accrued expenses" and “Other noncurrent liabilities” in the consolidated balance sheets.
The fair value of our coal trading positions designated as cash flow hedges of future sales, before the application of counterparty cash margin, decreased from a net asset of
$153.1 million
at
December 31, 2012
to
$62.9 million
at
December 31, 2013
due mainly to positions realized during that period.
Year Ended December 31,
2012
Compared to Year Ended December 31,
2011
Summary
Global coal markets reflected a challenged environment during the year ended December 31, 2012, characterized by year-over-year declines in coal use in the U.S. and weak international pricing.
Coal's share of U.S. electricity generation for all sectors declined from 42.3% in 2011 to 37.6% in 2012 according to t
he EIA's February 2013 "Short-Term Energy Outlook,"
with a majority of that loss having occurred during the first half of the year. A substantial portion of that lost share was assumed by natural gas due to
a year-over-year decline in full year average U.S. natural gas prices of 31% during that same period. U.S. coal consumption was further hindered in 2012 by a year-over-year decline in heating-degree days due to mild winter weather experienced in the first and fourth quarter of that year and weak economic activity. We were not immune to these market conditions. In addition to implementing planned year-over-year reductions in our coal production in the U.S., we permanently ceased production at our Air Quality Mine in Indiana in September 2012 due to uneconomic market conditions for the type of coal previously produced at that site. We also announced the permanent closure of our Willow Lake Mine in Illinois in November 2012 due to a continued failure by that site to meet standards for safety, compliance and operating performance we deem acceptable. Reflecting this challenged domestic environment, we sold 10.1 million fewer tons of coal from our Western and Midwestern U.S. Mining segments in 2012 compared with 2011.
Steel production in the major Asian economies grew by approximately 3% in 2012 compared to the prior year according to data published by the WSA, a modest rate compared with that observed during 2011. During that same period, worldwide steel production grew by 1%, with growth in Asia and the U.S. offset by reduced production in Europe due to an economic slowdown in that region. That softness in international steel markets led to a decline in settled prices for seaborne metallurgical coal as 2012 progressed.
International thermal coal markets continued to grow in 2012 compared to the prior year, led by imports into China, India, Japan and Europe. Nonetheless, year-over-year increases in seaborne thermal coal supply outpaced that increase in demand in 2012, which led to a decline in index prices from the prior year for thermal coal originating from Newcastle, Australia.
53
In spite of a modest year-over-year revenue increase of 2.3%, our Segment Adjusted EBITDA decreased by 9.4% compared to 2011 led by reductions in realized seaborne coal pricing ($432.7 million, net of sales-related costs), and lower U.S. volumes, partially offset by higher volumes from our Australian platform due to the fourth quarter 2011 acquisition of PEA-PCI and the benefits of mine expansions and higher contract pricing in the U.S.
(Loss) income from continuing operations, net of income taxes, changed unfavorably by $1,483.7 million in 2012 compared to the prior year due to lower Segment and Corporate and Other Adjusted EBITDA, increases in interest expense and depreciation, depletion and amortization resulting from the PEA-PCI acquisition and $929.0 million in charges related to asset impairments and mine closures. Year-over-year changes in our effective tax rate further reduced earnings in 2012 compared to 2011 due mainly to an increase in our valuation allowance against Australian loss carryforwards. Adjusted Income from Continuing Operations, which excludes the impacts of asset impairment and mine closure costs, net of tax, and the remeasurement of foreign income tax accounts, also decreased in 2012 compared to the prior year, though by a lesser amount of $773.2 million, or 76.4%.
Net (loss) income also decreased on a year-over-year basis in 2012 due to lower results from continuing operations and charges recognized in 2012 related to the closure of our Air Quality Mine, which is classified as a discontinued operation for all periods presented.
We ended 2012 with total available liquidity of approximately $2.2 billion.
Tons Sold
The following table presents tons sold by operating segment for the years ended December 31,
2012
and
2011
:
|
|
Year Ended December 31,
|
Increase (Decrease)
to Tons Sold
|
|||||||||
|
|
2012
|
2011
|
Tons
|
%
|
|||||||
|
|
(Tons in millions)
|
|
|||||||||
|
Australian Mining
|
33.0
|
|
25.3
|
|
7.7
|
|
30.4
|
%
|
|||
|
Western U.S. Mining
|
165.2
|
|
173.6
|
|
(8.4
|
)
|
(4.8
|
)%
|
|||
|
Midwestern U.S. Mining
|
27.4
|
|
29.1
|
|
(1.7
|
)
|
(5.8
|
)%
|
|||
|
Trading and Brokerage
|
22.9
|
|
21.4
|
|
1.5
|
|
7.0
|
%
|
|||
|
Total tons sold
|
248.5
|
|
249.4
|
|
(0.9
|
)
|
(0.4
|
)%
|
|||
Revenues
The following table presents revenues for the years ended December 31,
2012
and
2011
:
|
Year Ended December 31,
|
Increase (Decrease)
to Revenues
|
|||||||||||||
|
|
2012
|
2011
|
$
|
%
|
||||||||||
|
|
(Dollars in millions)
|
|
||||||||||||
|
Australian Mining
|
$
|
3,503.6
|
|
$
|
3,080.7
|
|
$
|
422.9
|
|
13.7
|
%
|
|||
|
Western U.S. Mining
|
2,949.3
|
|
2,900.4
|
|
48.9
|
|
1.7
|
%
|
||||||
|
Midwestern U.S. Mining
|
1,403.7
|
|
1,402.6
|
|
1.1
|
|
0.1
|
%
|
||||||
|
Trading and Brokerage
|
199.9
|
|
475.1
|
|
(275.2
|
)
|
(57.9
|
)%
|
||||||
|
Corporate and Other
|
21.0
|
|
37.1
|
|
(16.1
|
)
|
(43.4
|
)%
|
||||||
|
Total revenues
|
$
|
8,077.5
|
|
$
|
7,895.9
|
|
$
|
181.6
|
|
2.3
|
%
|
|||
Revenues from our Australian Mining segment increased in the year ended December 31, 2012 compared to the prior year due to the benefit of additional sales volumes ($910.3 million), which were driven by incremental year-over-year volume contributions from PEA-PCI mines acquired in the fourth quarter of 2011 ($508.8 million) and an overall production increase in our legacy Australian platform ($401.5 million). The year-over-year increase in our legacy platform production in 2012 resulted from the benefit of completed mine expansions at our Wilpinjong and Millennium mines, lower overall downtimes due to longwall moves and the adverse production effects experienced in the second half of 2011 due to a roof fall during the third quarter of that year, partially offset by production challenges from certain of our contractor-operated mines. The favorable volume variance in 2012 compared to 2011 was partially offset by an unfavorable price variance between those periods due to the impact of lower year-over-year average coal prices discussed above ($487.4 million). Metallurgical coal sales totaled 14.1 million and 9.3 million tons in 2012 and 2011, respectively, with the year-over-year increase largely attributable to incremental volumes contributed by PEA-PCI.
54
Revenues from our Western U.S. Mining segment increased during the year ended December 31, 2012 compared to the prior year resulting mainly from higher contract pricing ($167.9 million). That favorable price variance was partially offset by the unfavorable net impact of sales volume and mix ($119.0 million). Demand from electric power generators served by this segment was adversely affected in 2012 compared to the prior year by competition from natural gas and a decrease in heating-degree days from mild winter weather. Those effects were only partially offset by a slight increase in heating-degree days in 2012 compared to 2011 due to warm summer weather.
Midwestern U.S. Mining segment revenues were relatively unchanged in the year ended December 31, 2012 compared to the prior year. Revenues from that segment benefited from higher contract prices in 2012 compared to 2011 ($70.6 million), the effect of which was almost entirely offset by the unfavorable net impact of sales volume and mix in 2012 versus the prior year ($69.5 million) due to soft U.S. coal market demand.
The decline in our Trading and Brokerage segment revenues during the year ended December 31, 2012 compared to 2011 was mainly driven by a comparatively higher portion of our contract revenue being recognized on a net basis in the current period due to the expiration of certain physical delivery contracts that were recognized on a gross basis in 2011 ($180.3 million). Revenues from that segment were also affected in 2012 compared to the prior year by lower realized prices on physical shipments and counterparty nonperformance under certain contracts.
The decrease in our Corporate and Other segment revenues for the year ended December 31, 2012 compared to the prior year mainly resulted from our receipt of a $14.6 million project development fee associated with our involvement in the Prairie State Energy Campus (Prairie State) in the second quarter of 2011.
Segment Adjusted EBITDA
The following table presents Segment Adjusted EBITDA for the years ended December 31,
2012
and
2011
:
|
|
|
|
Increase (Decrease) to
|
|||||||||||
|
|
Year Ended December 31,
|
Segment Adjusted EBITDA
|
||||||||||||
|
|
2012
|
2011
|
$
|
%
|
||||||||||
|
|
(Dollars in millions)
|
|
||||||||||||
|
Australian Mining
|
$
|
938.9
|
|
$
|
1,194.3
|
|
$
|
(255.4
|
)
|
(21.4
|
)%
|
|||
|
Western U.S. Mining
|
832.8
|
|
766.0
|
|
66.8
|
|
8.7
|
%
|
||||||
|
Midwestern U.S. Mining
|
427.0
|
|
402.9
|
|
24.1
|
|
6.0
|
%
|
||||||
|
Trading and Brokerage
|
119.7
|
|
197.0
|
|
(77.3
|
)
|
(39.2
|
)%
|
||||||
|
Total Segment Adjusted EBITDA
|
$
|
2,318.4
|
|
$
|
2,560.2
|
|
$
|
(241.8
|
)
|
(9.4
|
)%
|
|||
Adjusted EBITDA from our Australian Mining segment was adversely affected during the year ended December 31, 2012 compared to the prior year by lower seaborne coal pricing, net of sales-related costs ($432.7 million), cost increases and production performance and geological challenges encountered at certain of our mines that remained in contractor-operated status in 2012 ($92.6 million), inflationary cost escalations ($76.8 million), the foreign currency impact on operating costs, net of hedging and balance sheet remeasurement ($26.5 million) and the effect of the Australian government's carbon pricing framework implemented in July 2012, net of transition benefits received ($12.4 million). Those factors were partially offset in 2012 compared to 2011 by lower year-over-year costs associated with longwall moves and the roof fall experienced in the third quarter of 2011 ($206.9 million) and the benefit of higher sales volumes ($174.8 million), which were due to the inclusion of PEA-PCI results on a full year basis in 2012 and the effect of mine expansions in our legacy Australian platform.
Higher contract pricing, net of sales-related costs, drove an increase in Western U.S. Mining segment Adjusted EBITDA for the year ended December 31, 2012 compared to the prior year ($135.6 million). Adjusted EBITDA results for 2012 also rose year-over-year from the impacts of a provision for a litigation settlement ($24.5 million) and expenditures associated with certain geologic events encountered at our Twentymile Mine ($17.1 million) in 2011. Those benefits were partially offset during the year ended December 31, 2012 compared to 2011 by an unfavorable net volume and mix variance ($87.1 million) and the effect of higher costs and usage of labor and materials and services ($31.3 million), the latter of which includes costs associated with planned longwall moves that occurred during the period.
Midwestern U.S. Mining segment Adjusted EBITDA for the year ended December 31, 2012 benefited from higher contract pricing, net of sales-related costs, compared to the prior year ($60.0 million) and the absence of costs incurred in response to heavy rains experienced in the Midwest region during 2011 ($12.2 million). These benefits were partially offset by higher costs incurred during 2012 compared to the prior year associated with overburden removal ($18.2 million) and labor wages and benefits ($13.8 million). The net impact of changes in sales volume and mix during 2012 compared to 2011 was immaterial, with the decrease in shipped volumes offset by the effect of the expiration of a low-margin purchased coal contract in 2011.
55
Trading and Brokerage segment Adjusted EBITDA for the year ended December 31, 2012 decreased compared to the prior year due to lower realized price margins on U.S. and Australian export volumes ($63.1 million).
(Loss) Income From Continuing Operations Before Income Taxes
The following table presents (loss) income from continuing operations before income taxes for the years ended December 31,
2012
and
2011
:
|
|
|
|
Increase (Decrease)
|
|||||||||||
|
|
Year Ended December 31,
|
to Income
|
||||||||||||
|
|
2012
|
2011
|
$
|
%
|
||||||||||
|
|
(Dollars in millions)
|
|
||||||||||||
|
Total Segment Adjusted EBITDA
|
$
|
2,318.4
|
|
$
|
2,560.2
|
|
$
|
(241.8
|
)
|
(9.4
|
)%
|
|||
|
Corporate and Other Adjusted EBITDA
(1)
|
(481.9
|
)
|
(437.6
|
)
|
(44.3
|
)
|
(10.1
|
)%
|
||||||
|
Depreciation, depletion and amortization
|
(663.4
|
)
|
(474.3
|
)
|
(189.1
|
)
|
(39.9
|
)%
|
||||||
|
Asset retirement obligation expense
|
(67.0
|
)
|
(52.6
|
)
|
(14.4
|
)
|
(27.4
|
)%
|
||||||
|
Asset impairment and mine closure costs
|
(929.0
|
)
|
—
|
|
(929.0
|
)
|
n.m.
|
|
||||||
|
Amortization of basis difference related to equity affiliates
|
(4.6
|
)
|
—
|
|
(4.6
|
)
|
n.m.
|
|
||||||
|
Interest expense
|
(405.6
|
)
|
(238.6
|
)
|
(167.0
|
)
|
(70.0
|
)%
|
||||||
|
Interest income
|
24.5
|
|
18.9
|
|
5.6
|
|
29.6
|
%
|
||||||
|
(Loss) income from continuing operations before income taxes
|
$
|
(208.6
|
)
|
$
|
1,376.0
|
|
$
|
(1,584.6
|
)
|
(115.2
|
)%
|
|||
|
(1)
|
Corporate and Other Adjusted EBITDA includes selling and administrative expenses, income (losses) from equity affiliates, gains (losses) on certain asset sales, costs associated with past mining activities, certain coal royalty expenses, resource management costs and revenues and expenses related to our other commercial activities, such as generation development and Btu Conversion.
|
(Loss) income from continuing operations before income taxes for the year ended December 31, 2012 changed unfavorably compared to the prior year. In addition to the decrease in Segment Adjusted EBITDA discussed above, our results were negatively affected compared to 2011 by lower Corporate and Other Adjusted EBITDA, increased depreciation, depletion and amortization and higher asset retirement obligation expenses, asset impairment and mine closure costs and interest expense.
Corporate and Other Adjusted EBITDA was adversely impacted in 2012 by higher losses associated with our 50% interest in the newly operational Middlemount Mine acquired as part of the PEA-PCI acquisition compared to the prior year ($41.4 million), which were affected in 2012 by unfavorable metallurgical coal pricing and contractor mining issues. Corporate and Other Adjusted EBITDA also declined during 2012 compared to the prior year as a result of gains recognized in 2011 related to non-cash exchanges of coal reserves in Kentucky and coal reserves and surface lands in Illinois for coal reserves in West Virginia ($37.7 million) and sales of non-strategic coal reserves in Kentucky ($31.7 million) executed during that period, in addition to our prior year receipt of a project development fee related to our involvement in Prairie State ($14.6 million). The effect of those factors was partially offset by the impact of costs incurred during 2011 related to the acquisition of PEA-PCI ($85.2 million) that did not recur in 2012.
56
The following table presents a summary of depreciation, depletion and amortization expense by segment for the years ended December 31,
2012
and
2011
:
|
Increase (Decrease)
|
||||||||||||||
|
Year Ended December 31,
|
to Income
|
|||||||||||||
|
|
2012
|
2011
|
$
|
%
|
||||||||||
|
|
(Dollars in millions)
|
|
||||||||||||
|
Australian Mining
|
$
|
(344.0
|
)
|
$
|
(181.6
|
)
|
$
|
(162.4
|
)
|
(89.4
|
)%
|
|||
|
Western U.S. Mining
|
(209.5
|
)
|
(204.5
|
)
|
(5.0
|
)
|
(2.4
|
)%
|
||||||
|
Midwestern U.S. Mining
|
(81.6
|
)
|
(68.1
|
)
|
(13.5
|
)
|
(19.8
|
)%
|
||||||
|
Trading and Brokerage
|
(0.7
|
)
|
(0.6
|
)
|
(0.1
|
)
|
(16.7
|
)%
|
||||||
|
Corporate and Other
|
(27.6
|
)
|
(19.5
|
)
|
(8.1
|
)
|
(41.5
|
)%
|
||||||
|
Total
|
$
|
(663.4
|
)
|
$
|
(474.3
|
)
|
$
|
(189.1
|
)
|
(39.9
|
)%
|
|||
Additionally, the following table presents a summary of our weighted-average depletion rate per ton for active mines in each of our mining segments for the years ended December 31,
2012
and
2011
:
|
Year Ended December 31,
|
|||||||
|
|
2012
|
2011
|
|||||
|
Australian Mining
|
$
|
5.32
|
|
$
|
3.45
|
|
|
|
Western U.S. Mining
|
0.69
|
|
0.63
|
|
|||
|
Midwestern U.S. Mining
|
0.67
|
|
0.56
|
|
|||
Depreciation, depletion and amortization expenses increased during the year ended December 31, 2012 compared to the prior year due to incremental expenses associated with PEA-PCI mines acquired in the fourth quarter of 2011 ($108.3 million) and higher expenses from our legacy Australian mining platform caused by increased depletion rates and higher overall production ($54.1 million). Also impacting the increase in 2012 compared to the prior year were additional expenses from our Midwestern U.S. Mining and Corporate and Other segments from the continued expansion of our Bear Run Mine and the 2012 commencement of commercial operations at Prairie State, respectively.
Asset retirement obligation expenses were higher in the year ended December 31, 2012 compared to 2011. The increase was largely attributable to incremental expense associated with acquired PEA-PCI mines and the impact of 2012 reclamation plan changes at certain of our U.S. mines.
We recognized $929.0 million in aggregate asset impairment and mine closure charges during 2012, which contributed significantly to the unfavorable year-over-year decrease in earnings observed in that period. Refer to Note 2. "Asset Impairment and Mine Closure Costs" to the accompanying consolidated financial statements, which is incorporated herein by reference, for further information regarding the nature and composition of the charges.
Additional debt incurred in connection with the PEA-PCI acquisition resulted in higher interest expense during the year ended December 31, 2012 compared to the prior year. The impact of those expenses was partially offset by the effect of interest expense associated with bridge financing obtained during 2011 in support of that acquisition.
(Loss) Income from Continuing Operations, Net of Income Taxes
The following table presents (loss) income from continuing operations, net of income taxes, for the years ended December 31,
2012
and
2011
:
|
Year Ended December 31,
|
Increase (Decrease)
to Income
|
|||||||||||||
|
|
2012
|
2011
|
$
|
%
|
||||||||||
|
|
(Dollars in millions)
|
|
||||||||||||
|
(Loss) income from continuing operations before income taxes
|
$
|
(208.6
|
)
|
$
|
1,376.0
|
|
$
|
(1,584.6
|
)
|
(115.2
|
)%
|
|||
|
Income tax provision
|
262.3
|
|
363.2
|
|
100.9
|
|
27.8
|
%
|
||||||
|
(Loss) income from continuing operations, net of income taxes
|
$
|
(470.9
|
)
|
$
|
1,012.8
|
|
$
|
(1,483.7
|
)
|
(146.5
|
)%
|
|||
(Loss) income from continuing operations, net of income taxes, changed unfavorably in the year ended December 31, 2012 compared to 2011 due to adverse changes in before-tax earnings discussed above, partially offset by a lower income tax provision.
57
Our 2012 income tax provision benefited from the following factors compared to 2011:
|
•
|
The impact of lower current year earnings, including the income tax benefit associated with asset impairment and mine closure costs ($456.8 million); and
|
|
•
|
The recognition of a net tax benefit in 2012 due to the tax restructuring of foreign operations ($74.7 million), comprised of a realized U.S. capital loss benefit, net of valuation allowance, and a foreign tax benefit due to the tax basis reset required upon the PEA-PCI operations joining our Australian consolidated tax group.
|
The impact of those benefits was partially offset by the following adverse factors affecting our 2012 income tax provision and effective tax rate compared to the prior year:
|
•
|
An increase in our valuation allowance against Australian loss carryforwards recognized during 2012 based on changes in the estimated future realization of those carryforwards, the assessment of which was affected by a loss utilization factor on Australian net operating losses ($332.2 million);
|
|
•
|
A net deferred tax liability recognized in connection with the MRRT, which was implemented in 2012 ($77.2 million); and
|
|
•
|
The impact from the remeasurement of non-U.S. tax accounts as a result of the current year strengthening of the Australian dollar compared with weakening in the prior year ($8.8 million), as set forth in the table below.
|
|
|
December 31,
|
Rate Change
|
|||||||||||||||||
|
|
2012
|
2011
|
2010
|
2012
|
2011
|
||||||||||||||
|
Australian dollar to U.S. dollar exchange rate (period end)
|
$
|
1.0384
|
|
$
|
1.0156
|
|
$
|
1.0163
|
|
$
|
0.0228
|
|
$
|
(0.0007
|
)
|
||||
Adjusted Income From Continuing Operations
The following table presents Adjusted Income from Continuing Operations for the years ended December 31,
2012
and
2011
:
|
Year Ended December 31,
|
Increase (Decrease)
to Income
|
|||||||||||||
|
|
2012
|
2011
|
$
|
%
|
||||||||||
|
|
(Dollars in millions)
|
|||||||||||||
|
(Loss) income from continuing operations, net of income taxes
|
$
|
(470.9
|
)
|
$
|
1,012.8
|
|
$
|
(1,483.7
|
)
|
(146.5
|
)%
|
|||
|
Asset impairment and mine closure costs
|
929.0
|
|
—
|
|
$
|
929.0
|
|
n.m.
|
|
|||||
|
Income tax benefit related to asset impairment and mine closure costs
|
(227.3
|
)
|
—
|
|
$
|
(227.3
|
)
|
n.m.
|
|
|||||
|
Remeasurement expense (benefit) related to foreign income tax accounts
|
7.9
|
|
(0.9
|
)
|
8.8
|
|
977.8
|
%
|
||||||
|
Adjusted Income from Continuing Operations
|
$
|
238.7
|
|
$
|
1,011.9
|
|
$
|
(773.2
|
)
|
(76.4
|
)%
|
|||
Adjusted Income from Continuing Operations decreased in 2012 compared to 2011 due to unfavorable year-over-year changes in Segment and Corporate and Other Adjusted EBITDA and higher depreciation, depletion and amortization, asset retirement obligation expenses and interest expense, partially offset by higher interest income and a lower income tax provision recognized in 2012 compared to 2011, as discussed above.
Net (Loss) Income Attributable to Common Stockholders
The following table presents net (loss) income attributable to common stockholders for the years ended December 31,
2012
and
2011
:
|
Year Ended December 31,
|
Increase (Decrease)
to Income
|
|||||||||||||
|
|
2012
|
2011
|
$
|
%
|
||||||||||
|
|
(Dollars in millions)
|
|
||||||||||||
|
(Loss) income from continuing operations, net of income taxes
|
$
|
(470.9
|
)
|
$
|
1,012.8
|
|
$
|
(1,483.7
|
)
|
(146.5
|
)%
|
|||
|
Loss from discontinued operations, net of income taxes
|
(104.2
|
)
|
(66.5
|
)
|
(37.7
|
)
|
(56.7
|
)%
|
||||||
|
Net (loss) income
|
(575.1
|
)
|
946.3
|
|
(1,521.4
|
)
|
(160.8
|
)%
|
||||||
|
Net income (loss) attributable to noncontrolling interests
|
10.6
|
|
(11.4
|
)
|
(22.0
|
)
|
(193.0
|
)%
|
||||||
|
Net (loss) income attributable to common stockholders
|
$
|
(585.7
|
)
|
$
|
957.7
|
|
$
|
(1,543.4
|
)
|
(161.2
|
)%
|
|||
58
Net (loss) income attributable to common stockholders decreased in the year ended December 31, 2012 compared to the prior year largely due to the adverse changes in (loss) income from continuing operations, net of income taxes, discussed above, and the unfavorable impact of current year results from discontinued operations and losses allocated to noncontrolling interests in the prior year.
Loss from discontinued operations, net of income taxes, for the year ended December 31, 2012 was negatively affected by aggregate after-tax charges of $75.0 million (which included an after-tax impairment charge of $68.8 million) recognized in that period related to the closure of our Air Quality Mine due to uneconomic market conditions for the type of coal previously produced at that site. The effect of those charges was partially offset by improved results during 2012 compared to the prior year from our Wilkie Creek Mine, which was adversely impacted by flooding in 2011.
The effect of allocating net income (loss) to noncontrolling interests was unfavorable on a year-over-year basis in 2012. This adverse change was driven by the impact of the allocation of losses related to ArcelorMittal Mining Australia B.V.'s interest in PEA-PCI from the acquisition and control date of October 26, 2011 to the date we acquired that noncontrolling interest on December 21, 2011.
Diluted EPS
The following table presents diluted EPS for the years ended December 31,
2012
and
2011
:
|
Year Ended December 31,
|
Increase (Decrease)
to EPS
|
|||||||||||||
|
|
2012
|
2011
|
$
|
%
|
||||||||||
|
Diluted EPS attributable to common stockholders:
|
||||||||||||||
|
(Loss) income from continuing operations
|
$
|
(1.80
|
)
|
$
|
3.77
|
|
$
|
(5.57
|
)
|
(147.7
|
)%
|
|||
|
Loss from discontinued operations
|
(0.39
|
)
|
(0.25
|
)
|
(0.14
|
)
|
(56.0
|
)%
|
||||||
|
Net (loss) income
|
$
|
(2.19
|
)
|
$
|
3.52
|
|
$
|
(5.71
|
)
|
(162.2
|
)%
|
|||
Diluted EPS decreased in 2012 compared to 2011 commensurate with the decline in results from continuing and discontinued operations between those periods.
Adjusted Diluted EPS
The following table presents Adjusted Diluted EPS for the years ended December 31,
2012
and
2011
:
|
Year Ended December 31,
|
Increase (Decrease)
to EPS
|
|||||||||||||
|
|
2012
|
2011
|
$
|
%
|
||||||||||
|
Adjusted Diluted EPS Reconciliation:
|
||||||||||||||
|
(Loss) income from continuing operations
|
$
|
(1.80
|
)
|
$
|
3.77
|
|
$
|
(5.57
|
)
|
(147.7
|
)%
|
|||
|
Asset impairment and mine closure costs, net of income taxes
|
2.61
|
|
—
|
|
2.61
|
|
n.m.
|
|
||||||
|
Remeasurement expense (benefit) related to foreign income tax accounts
|
0.03
|
|
—
|
|
0.03
|
|
n.m.
|
|
||||||
|
Adjusted Diluted EPS
|
$
|
0.84
|
|
$
|
3.77
|
|
$
|
(2.93
|
)
|
(77.7
|
)%
|
|||
Adjusted Diluted EPS decreased in the year ended December 31, 2012 compared to 2011 commensurate with the decline in Adjusted Income from Continuing Operations during that period.
Outlook
Our near-term outlook is intended to coincide with the next 12 to 24 months, with subsequent periods addressed in our long-term outlook.
Near-Term Outlook
In 2013, seaborne coal demand continued to grow year-over-year, particularly in the Asia-Pacific region. According to the BP Statistical Review of World Energy 2013, coal has been the fastest growing major fuel in the world for the past decade. However, seaborne coal supplies outpaced demand during the year, resulting in lower coal prices. Despite milder-than-normal summer weather, U.S. thermal coal consumption increased in 2013 compared to the prior year due to a year-over-year increase in natural gas prices, thus driving a drawdown in coal stockpiles as coal shipments declined during the period.
59
Global Macroeconomic Indicators.
The World Bank increased its global economic growth estimates for 2014 in its January 2014 Global Economic Prospects compared to previous forecasts, reflecting increased projected growth in high-income countries. Selected regional and worldwide projections of 2014 macroeconomic growth, as measured by recent World Bank forecasts of gross domestic product (GDP), are presented below:
|
GDP Growth (%)
|
|||
|
Region:
|
2014
|
||
|
U.S.
|
2.8
|
%
|
|
|
China
|
7.7
|
%
|
|
|
India
|
6.2
|
%
|
|
|
Worldwide
|
3.2
|
%
|
|
Seaborne Thermal Coal Market Segments and Our Position.
We estimate that global seaborne thermal coal demand increased by 40 million tonnes in 2013, led by China and India. According to China Customs data, China's thermal coal imports increased to a record 252 million tonnes in 2013. Similarly, India's coal imports increased by 31 million tonnes in 2013 to a new record of 168 million tonnes, according to our internal estimates. We expect these trends to continue in 2014 and project 70 gigawatts of new coal-fueled electricity generation to come online and 30 to 40 million tonnes in seaborne thermal coal demand growth during that period, with China and India accounting for the majority of that growth.
In spite of the continued increases in international thermal coal demand, seaborne thermal coal market segments remained well-supplied in 2013, which led to a decrease in prices for thermal coal originating from Newcastle, Australia compared to 2012. We expect production growth to moderate in 2014 due to a slowdown in new coal mine developments and the closure of certain high cost mines. We are targeting our 2014 Australian thermal exports to be 11 to 12 million tons.
Seaborne Metallurgical Coal Market Segments and Our Position.
The WSA reported that global steel production grew by 3.5% in the year ended December 31, 2013 compared to the prior year, with an increase in Asian steel production offsetting a decline in steel production from Europe and North America. In its October 2013 Short Range Outlook, the WSA forecasted year-over-year apparent steel use growth of 3.3% in 2014. Based on our projections of reduced capital spending and supply reductions from high-cost metallurgical coal producers, we expect lower seaborne metallurgical coal supply growth in 2014 compared to 2013.
Metallurgical coal prices for HQHCC and LV PCI settled at approximately $143 and $116 per tonne, respectively, for quarterly contracts commencing in January 2014. We expect to settle the majority of our 2014 metallurgical coal production in line with quarterly or monthly benchmarks, as adjusted for quality differentials on delivered coal, with approximately 30% to 40% expected to be sold on a shorter-term basis. We are targeting our total 2014 Australian metallurgical coal sales at approximately
16 to 17 million tons
.
Our total Australian coal sales for 2014 are targeted at 35 to 37 million tons, including both metallurgical and thermal coal products supplied internationally and within Australia.
U.S. Thermal Coal Market Segments and Our Position.
Thermal coal market conditions in the U.S. improved during 2013 compared to the prior year, as coal accounted for 39% of electricity generation in 2013 according to the EIA's February 2014 Short-Term Energy Outlook. We observed gas-to-coal switching during that period as natural gas prices increased from 2012 levels, driving a 10% decline in electric power generation from natural gas during 2013 compared to the prior year. According to the EIA, coal consumption increased over 30 million tons during 2013 compared to the prior year, while coal production declined by 21 million tons, falling below 1 billion tons for the first time since 1993, which led to increased customer drawdowns on coal inventory stockpiles. We estimate that coal inventories for Southern Powder River Basin customers improved 28% in 2013 on a day's-burn basis.
In its February 2014 Short-Term Energy Outlook, the EIA projected U.S. electricity generation from coal to increase by 4% in 2014 compared to 2013, while electricity generation from natural gas is expected to decline. The EIA further projected that coal will hold a share of over 40% of U.S. electric power generation in 2014. We expect that U.S. coal consumption for electric power generation will increase by 20 to 30 million tons in 2014.
We are targeting our 2014 U.S. volumes at 185 to 195 million tons, with approximately 10% to 15% of projected sales unpriced. As of December 31, 2013, we had 45% to 55% of 2015 volumes priced based on targeted 2014 production levels. We anticipate that average realized pricing from our U.S. mining operations will decrease 5% to 8% on a per-ton basis in 2014 compared to 2013 due to new U.S. coal supply agreements and price reopener provisions in certain of our existing U.S. coal supply agreements, primarily in our Midwestern U.S. Mining segment.
60
Operating Cost and Capital Update.
In an effort to mitigate pressures from the challenging global coal market environment, we remain focused on cost containment activities. We expect a 1% to 3% decrease in our per-ton U.S. operating costs and expenses in 2014 compared to the prior year. In Australia, we expect 2014 costs in the low-to-mid-$70 per ton range as additional savings from cost containment activities offset the effects of a higher mix of metallurgical coal and costs related to the delayed longwall commissioning at the North Goonyella Mine.
We also remain focused on tightly controlling capital spending. Our targeted 2014 capital spending levels of $275 million to $325 million are below 2013 expenditures.
Long-Term Outlook
While the declines in global coal prices due to well-supplied coal markets have tempered near-term expectations, our long-term global outlook for coal remains positive, particularly in the Asia-Pacific region. We expect global coal demand to rise by 700 million tonnes between 2013 and 2016, led by urbanization and industrialization trends in China and India, and that approximately 250 gigawatts of new global coal-fueled generation will be built during that time. We also estimate that seaborne metallurgical coal demand will grow by 10 to 15 percent during that period.
The International Energy Agency (IEA) estimates in its World Energy Outlook 2013, Current Policies Scenario, that worldwide primary energy demand will grow 43% between 2011 and 2035. Demand for coal during this time period is projected to rise 44%, and the growth in global electricity generation from coal is expected to be greater than the growth in oil, natural gas, nuclear, geothermal and solar combined. China and India are expected to account for more than 75% of the coal-based primary energy demand growth projected from 2011 to 2035.
Under its Current Policies Scenario, the IEA expects coal to retain its strong presence as a fuel for the power sector worldwide. Coal's share of the power generation mix was 41% in 2011. By 2035, the IEA estimates that coal's fuel share of global power generation will be 40% as it continues to have the largest share of worldwide electric power production. Under that scenario, the IEA also projects that global natural gas-fueled electricity generation will have a compound annual growth rate of 2.7%, from 4.8 trillion kilowatt hours in 2010 to 9.2 trillion kilowatt hours in 2035. The total amount of electricity generated from natural gas is expected to be a little over one-half the total for coal, even in 2035. Renewables are projected to comprise 26% of the 2035 fuel mix versus 20% in 2011. Nuclear power is expected to grow 51%, however its share of total generation is expected to fall from 12% to 10% between 2011 and 2035. Generation from liquid fuels is projected to decline at an average pace of 2.3% annually to a 1.6% share of the 2035 generation mix.
The Current Policies Scenario, which is one of four scenarios presented in the IEA World Energy Outlook 2013, considers government policies that had been enacted or adopted by mid-2013 and does not take into account government policies that may be enacted or adopted in the future. It is prepared by the IEA as a baseline that shows how energy markets would evolve if underlying trends in energy demand and supply are not changed. We believe that the Current Policies Scenario is the most appropriate scenario for our investors to consider based on the substantial uncertainty as to the nature, extent and timing of possible new laws or regulations regarding the extraction or use of our products.
The IEA World Energy Outlook 2013 also contains (1) a New Policies Scenario, which assumes that existing policies are maintained and recently announced commitments and plans, including those yet to be formally adopted, are implemented in a cautious manner, (2) a 450 Scenario, which assumes that policies are adopted that put the world on a pathway that is consistent with having around a 50% chance of limiting the global increase in average temperatures to 2º C in the long term, compared with pre-industrial levels and (3) an Energy Efficiency Scenario, which assumes that all energy efficiency investments that are economically viable are made and all necessary policies to eliminate market barriers to energy efficiency are adopted. The full report is available from the IEA on its website at iea.org.
In the U.S., coal remains a significant fuel for electricity generation, though its share is expected to decline through 2040 due to competition from natural gas and renewables according to the EIA's 2014 Annual Energy Outlook Early Release.
Our long-term plans also include advancing projects to expand our presence in the Asia-Pacific region, some of which include sourcing third-party coal and partnerships to utilize our mining experience for joint mine development, such as projects we are exploring in Xinjiang, China and the Tavan Tolgoi project in the South Gobi region of Mongolia.
61
Enactment of laws or passage of regulations regarding emissions from the combustion of coal by the U.S., some of its states or other countries, or other actions to limit such emissions, could result in electricity generators switching from coal to other fuel sources. Further, policies limiting available financing for the development of new coal-fueled power plants could adversely impact the global demand for coal in the future. The potential financial impact on us of future laws, regulations or other policies will depend upon the degree to which any such laws or regulations force electricity generators to diminish their reliance on coal as a fuel source. That, in turn, will depend on a number of factors, including the specific requirements imposed by any such laws, regulations or other policies, the time periods over which those laws, regulations or other policies would be phased in, the state of commercial development and deployment of CCS technologies and the alternative markets for coal. In view of the significant uncertainty surrounding each of these factors, it is not possible for us to reasonably predict the impact that any such laws, regulations or other policies may have on our results of operations, financial condition or cash flows.
Liquidity and Capital Resources
Capital Resources
Our primary sources of cash are proceeds from the sale of our coal production to customers and cash provided by our trading and brokerage activities. To a lesser extent, we also generate cash from the sale of non-strategic assets, including coal reserves and surface lands, and, from time to time, the issuance of securities.
Credit Facility Refinancing.
In order to extend our debt maturities and enhance our liquidity and financial flexibility, on September 24, 2013, we entered into an amended and restated secured credit agreement (the 2013 Credit Facility), which provides for a $1.65 billion revolving credit facility (the 2013 Revolver) and a $1.20 billion term loan facility (the 2013 Term Loan Facility), and concurrently terminated our obligations under our previously outstanding term loan and revolving credit facilities. Proceeds of the 2013 Term Loan Facility, which amounted to $1.19 billion, net of original issue discount, were used to pay off amounts outstanding under our terminated credit agreement dated as of June 18, 2010 (as amended, the Term Loan) and our terminated credit agreement dated as of October 28, 2011 (as amended, the 2011 Term Loan Facility), which had then-outstanding principal amounts of $301.8 million and $862.5 million, respectively. We recognized an aggregate loss of $11.5 million on the write-off of previously deferred financing costs related to those facilities during the year ended December 31, 2013, which was classified in "Interest expense" in the consolidated statement of operations for that period.
Refer to Note 12. "Long-term Debt" to the accompanying consolidated financial statements for additional information related to our 2013 Credit Facility, which information is incorporated herein by reference.
Cash and Cash Equivalents.
We follow a diversified investment approach for our cash and cash equivalents by maintaining such funds with a diversified portfolio of banks within our group of relationship banks in high quality, highly liquid investments with original maturities of three months or less, generally comprised of money market funds, term deposits and government securities. We monitor the amounts held with each bank on a routine basis and do not believe our cash and cash equivalents are exposed to any material risk of principal loss.
We hold cash balances within the U.S. and in several foreign locations around the world. As of
December 31, 2013
, approximately $300 million of our cash was held by U.S. entities, with the remaining balance held by foreign subsidiaries in accounts predominantly domiciled in the U.S. A significant majority of the cash held by our foreign subsidiaries is denominated in U.S. dollars. This cash is generally used to support non-U.S. liquidity needs, including capital and operating expenditures in Australia and the foreign operations of our Trading and Brokerage segment. Under current law, earnings repatriated to the U.S. are subject to U.S. federal income tax, less applicable foreign tax credits. We had no undistributed earnings of foreign subsidiaries as of December 31, 2013. Historically, we have not provided deferred taxes on undistributed earnings of foreign subsidiaries because such earnings are considered to be indefinitely reinvested outside of the U.S. We utilize a variety of tax planning and financing strategies with the objective of having our worldwide cash available in the locations where it is needed. When appropriate, we may access our foreign cash in a tax efficient manner. Where local regulations or other circumstances may limit an efficient intercompany transfer of amounts held outside of the U.S., we will continue to utilize those funds for local liquidity needs. We do not expect restrictions or potential taxes on the repatriation of amounts held by our foreign subsidiaries to have a material effect on our overall liquidity, financial condition or results of operations.
Liquidity.
In addition to cash and cash equivalents, our liquidity includes the available balances from the 2013 Revolver and an accounts receivable securitization program. Our available liquidity as of
December 31, 2013
was
$2.1 billion
, which was substantially comprised of
$1.5 billion
available for borrowing under the 2013 Revolver (net of outstanding letters of credit of
$131.9 million
), cash and cash equivalents of
$444.0 million
and available capacity under our accounts receivable securitization program of
$117.2 million
.
Proceeds from the Sale of Non-Strategic Assets.
In 2013, we sold non-strategic coal reserves and surface lands located in Kentucky in exchange for cash proceeds of $70.0 million. Subsequent to December 31, 2013, we sold a non-strategic exploration tenement asset in Australia in exchange for $62.6 million in cash proceeds.
62
Capital Requirements
Our primary uses of cash include the cash costs of coal production and sale, capital expenditures, coal reserve lease and royalty payments, debt service costs (including interest and principal), capital and operating lease payments, postretirement plans, take or pay obligations, past mining retirement obligations and the payment of dividends.
We expect our available liquidity and cash flows from operations will be sufficient to meet our anticipated capital requirements during 2014 and for the foreseeable future. We routinely monitor our current and expected capital requirements and capital market conditions to evaluate the use of alternative financing sources, which include our ability to offer and sell securities under our shelf registration statement and access to credit markets.
Our ability to obtain external financing and the cost of such financing may be affected by our credit ratings, which are periodically reviewed by the three major credit rating agencies. During the third quarter of 2013, those agencies downgraded our corporate credit rating by one notch, due in part to prolonged weakness in global coal markets, while maintaining a stable ratings outlook. Based on our current financial condition and credit relationships, we continue to believe that we currently have the ability to access capital markets, if needed, as evidenced by the completion of the 2013 Credit Facility Refinancing. That refinancing extended our debt maturities such that we have no significant debt maturities until 2016. Any adverse changes in our financial condition or liquidity or additional uncertainty in capital markets could negatively impact our ability to access such funds and, in turn, reduce the availability of our cash flows to fund discretionary spending, including capital expenditures for growth and development projects, acquisitions, share repurchases, dividend payments, contributions to our postretirement plans in excess of regulatory requirements and voluntary debt repayments.
Additions to Property, Plant, Equipment and Mine Development.
We generally fund our capital additions with cash generated from operations. Accordingly, we evaluate our capital project portfolio on an ongoing basis and believe we have the appropriate flexibility to adjust our growth capital spending as appropriate based on any material changes in our cash flows from operations and liquidity position.
Additions to property, plant, equipment and mine development for the year ended December 31, 2013 included expenditures associated with the completion of late-stage owner-operator conversions at our Wilpinjong, Millennium and Wambo Open-Cut mines in Australia, which were finalized in April 2013, and the ongoing modernization of our Metropolitan Mine in Australia.
In response to the current challenges faced by the global coal market environment, we have remained focused on carefully controlling capital spending. We reduced our additions to property, plant, equipment and mine development by 67% in 2013 compared to the prior year. As noted previously, we expect to again lower our capital spending levels in 2014 to a range of $275 million to $325 million. We expect to allocate approximately 60% of that target to maintaining the existing productive capacity of our global mining platform, with the remainder allotted to development and operational improvement projects, mainly in Australia. We currently plan to defer certain new and early-stage growth and development projects across our global platform to time periods beyond 2014 and continue to evaluate the timing associated with those projects based on changes in global coal market demand.
Federal Coal Lease Expenditures.
Federal coal lease expenditures, which pertain to U.S. federal coal reserves we lease from the U.S. Bureau of Land Management in support of our Western U.S. Mining segment operations, amounted to
$276.8 million
in 2013. We currently anticipate that our annual federal coal lease expenditures will total approximately $280 million in each of 2014 and 2015 and $250 million in 2016. These expenditures may increase in 2014 and beyond depending upon our participation in and successful bidding on future federal coal leases; however, no significant additional bidding is planned at present.
63
Total Indebtedness.
Our total indebtedness as of December 31, 2013 and 2012 consisted of the following:
|
|
December 31,
|
||||||
|
|
2013
|
2012
|
|||||
|
|
(Dollars in millions)
|
||||||
|
Term Loan due June 2015
|
$
|
—
|
|
$
|
418.8
|
|
|
|
2011 Term Loan Facility due October 2016
|
—
|
|
912.5
|
|
|||
|
2013 Term Loan Facility due September 2020
|
1,185.4
|
|
—
|
|
|||
|
7.375% Senior Notes due November 2016
|
650.0
|
|
650.0
|
|
|||
|
6.00% Senior Notes due November 2018
|
1,518.8
|
|
1,518.8
|
|
|||
|
6.50% Senior Notes due September 2020
|
650.0
|
|
650.0
|
|
|||
|
6.25% Senior Notes due November 2021
|
1,339.6
|
|
1,339.6
|
|
|||
|
7.875% Senior Notes due November 2026
|
247.5
|
|
247.4
|
|
|||
|
Convertible Junior Subordinated Debentures due December 2066
|
379.7
|
|
377.4
|
|
|||
|
Capital lease obligations
|
30.5
|
|
104.6
|
|
|||
|
Other
|
0.9
|
|
33.8
|
|
|||
|
Total
|
$
|
6,002.4
|
|
$
|
6,252.9
|
|
|
Long-term Debt Covenants.
Certain of our long-term debt arrangements contain various administrative, reporting, legal and financial covenants, with which we were in compliance as of December 31, 2013. We are permitted to pay dividends, buy and sell assets and make redemptions or repurchases of capital stock when in compliance with our financial covenants and customary default provisions (including compliance on a pro forma basis giving effect to such transactions), subject to certain restrictions imposed by the 2013 Credit Facility. That agreement also limits our ability to make dividends from the top-level Gibraltar holding company of our Australian operations to our domestic subsidiaries in an amount in excess of $500 million
per year. We do not expect the restrictions imposed by our debt covenants to have a material effect on our overall liquidity, financial condition or ability to continue to pay dividends for the foreseeable future.
Debt Prepayments and Repurchases.
As market conditions warrant, we may from time to time repurchase debt securities issued by us, in the open market, in privately negotiated transactions, by tender offer or otherwise.
During the year ended December 31, 2013, prior to the completion of the 2013 Credit Facility, we voluntarily prepaid $167.0 million in aggregate principal amount of our Term Loan and 2011 Term Loan Facility with existing cash on hand. Additionally, we repurchased $32.4 million of certain Australian private placement bonds (previously presented in "Other" in the above schedule) with existing cash on hand. We recognized losses on debt extinguishment of $5.4 million associated with the foregoing transactions, which were classified in "Interest expense" in the consolidated statement of operations for the year ended December 31, 2013.
Dividends.
We have declared and paid quarterly dividends since our initial public offering in 2001, including
$91.7 million
paid in 2013. On January 23, 2014, our Board of Directors approved a dividend of $0.085 per share of common stock, payable on February 27, 2014. The declaration and payment of dividends in the future and the amount of those dividends will depend on our results of operations, financial condition, cash requirements, future prospects, any limitations imposed by our debt covenants and other factors deemed relevant by our Board of Directors.
Margin.
As part of our trading and brokerage activities, we may be eligible to receive or required to post margin with an exchange or certain of our over-the-counter contract counterparties. The amount and timing of margin posted can vary with the volume of trades, market price volatility and trade settlements. Total net margin held by us at
December 31, 2013
and 2012 was $35.5 million and $133.2 million, respectively. Net cash flows from margin were a net outflow of $97.7 million for the year ended December 31, 2013 and a net inflow of $115.1 million in the prior year.
Settlement Agreement with Patriot and the UMWA.
In connection with our settlement agreement with Patriot and the United Mine Workers of America (UMWA), on behalf of itself, its represented Patriot employees and its represented Patriot retirees, that became effective on December 18, 2013, we will provide total payments of
$310 million
, payable over four years through 2017, to partially fund the newly established voluntary employee beneficiary association (VEBA) and settle all Patriot and UMWA claims involving the Patriot bankruptcy. Those payments include an initial payment of $90 million made in January of 2014, comprised of $70 million paid to Patriot and $20 million paid to the VEBA, and subsequent payments of $75 million in 2015, $75 million in 2016 and $70 million in 2017 to be paid to the VEBA. Refer to Note 25. "Matters Related to the Bankruptcy of Patriot Coal Corporation" to the accompanying consolidated financial statements for additional information surrounding the settlement agreement.
64
Pension Contributions.
Annual contributions to the qualified plans are made in accordance with minimum funding standards and our agreement with the Pension Benefit Guaranty Corporation (PBGC). Funding decisions also consider certain funded status thresholds defined by the Pension Protection Act of 2006 (generally 80%). On July 6, 2012, the Moving Ahead for Progress in the 21st Century Act (MAP-21), a highway reauthorization and student loan bill that included both pension funding stabilization provisions and PBGC premium increases, was signed into law. The pension funding stabilization provisions temporarily increased the discount rates used to determine pension liabilities for purposes of minimum funding requirements. MAP-21 is not expected to change our total required cash contributions over the long term, but is expected to reduce our required cash contributions through 2015 relative to prior law if current interest rate levels persist and the qualified plans' asset returns are in line with expectations. As of December 31, 2013, our qualified plans are expected to be at or above the Pension Protection Act thresholds and will therefore avoid benefit restrictions and at-risk penalties for 2014. We contributed
$2.3 million
to our pension plans in 2013 and expect to contribute approximately $13 million to those plans in 2014.
Share Repurchases.
As of December 31, 2013, our remaining available capacity for share repurchases under our publicly-announced repurchase program authorized by our Board of Directors was $700.4 million. Repurchases may be made from time to time based on an evaluation of our outlook and general business conditions, as well as alternative investment and debt repayment options.
Shelf Registration.
We have an effective shelf registration statement on file with the SEC for an indeterminate number of securities that is effective for three years (expires October 19, 2015), after which time we expect to be able to file an automatic shelf registration statement that would become immediately effective for another three-year term. Under this universal shelf registration statement, we have the capacity to offer and sell from time to time securities, including common stock, debt securities, preferred stock, warrants and units.
Historical Cash Flows
The following table summarizes our cash flows for the years ended December 31,
2013
and
2012
, as reported in the accompanying consolidated financial statements:
|
Year Ended December 31,
|
Increase (Decrease) to
Cash Flow
|
|||||||||||||
|
|
2013
|
2012
|
$
|
%
|
||||||||||
|
|
(Dollars in millions)
|
|
||||||||||||
|
Net cash provided by operating activities
|
$
|
722.4
|
|
$
|
1,515.1
|
|
$
|
(792.7
|
)
|
(52.3
|
)%
|
|||
|
Net cash used in investing activities
|
(515.7
|
)
|
(1,092.1
|
)
|
576.4
|
|
52.8
|
%
|
||||||
|
Net cash used in financing activities
|
(321.5
|
)
|
(663.3
|
)
|
341.8
|
|
51.5
|
%
|
||||||
|
Net change in cash and cash equivalents
|
(114.8
|
)
|
(240.3
|
)
|
125.5
|
|
52.2
|
%
|
||||||
|
Cash and cash equivalents at beginning of period
|
558.8
|
|
799.1
|
|
(240.3
|
)
|
(30.1
|
)%
|
||||||
|
Cash and cash equivalents at end of period
|
$
|
444.0
|
|
$
|
558.8
|
|
$
|
(114.8
|
)
|
(20.5
|
)%
|
|||
Operating Activities.
The decrease in net cash provided by operating activities for the year ended December 31,
2013
compared to the prior year was driven by the following:
|
•
|
A year-over-year decrease in Adjusted EBITDA;
|
|
•
|
An unfavorable change in cash flows from counterparty margin associated with our trading and brokerage activities ($212.8 million); and
|
|
•
|
The monetization of certain foreign currency hedge positions in the fourth quarter of 2012 ($151.8 million); partially offset by
|
|
•
|
A reduction of our inventory levels in response to market demand ($152.8 million).
|
Investing Activities.
The decrease in net cash used in investing activities for the year ended December 31,
2013
compared to the prior year was driven by the following:
|
•
|
Lower current year additions to property, plant, equipment and mine development ($432.2 million, net of changes in accrued expenses related to capital expenditures); and
|
|
•
|
Greater proceeds from the disposal of assets, driven by cash received from the sale of non-strategic U.S. coal reserves and surface lands ($30.4 million).
|
65
Financing Activities.
The decrease in net cash used in financing activities for the year ended December 31,
2013
compared to the prior year was driven by the following:
|
•
|
Lower repayments of long-term debt, net of proceeds ($212.8 million), mainly due to lower voluntary debt repayments and repurchases in 2013 compared with 2012;
|
|
•
|
Prior year common stock repurchases ($99.9 million); and
|
|
•
|
Payments made in the prior year associated with the acquisition of the noncontrolling interest in MCG Holdings Pty Ltd ($49.8 million).
|
Contractual Obligations
The following is a summary of our contractual obligations as of
December 31, 2013
:
|
|
Payments Due By Year
|
||||||||||||||||||
|
Total
|
Less than
1 Year
|
2 - 3
Years
|
4 - 5
Years
|
More than
5 Years
|
|||||||||||||||
|
|
(Dollars in millions)
|
||||||||||||||||||
|
Long-term debt obligations (principal and interest)
|
$
|
9,285.8
|
|
$
|
390.1
|
|
$
|
1,447.8
|
|
$
|
2,257.1
|
|
$
|
5,190.8
|
|
||||
|
Capital lease obligations (principal and interest)
|
37.6
|
|
19.7
|
|
5.8
|
|
1.0
|
|
11.1
|
|
|||||||||
|
Operating lease obligations
(1)
|
962.5
|
|
207.4
|
|
378.2
|
|
262.8
|
|
114.1
|
|
|||||||||
|
Unconditional purchase obligations
(2)
|
52.3
|
|
52.3
|
|
—
|
|
—
|
|
—
|
|
|||||||||
|
Coal reserve lease and royalty obligations
(3)
|
882.6
|
|
285.8
|
|
544.4
|
|
11.3
|
|
41.1
|
|
|||||||||
|
Take or pay obligations
(4)
|
3,724.8
|
|
385.8
|
|
779.6
|
|
702.9
|
|
1,856.5
|
|
|||||||||
|
Other long-term liabilities
(5)
|
3,076.4
|
|
242.5
|
|
439.8
|
|
346.8
|
|
2,047.3
|
|
|||||||||
|
Total contractual cash obligations
|
$
|
18,022.0
|
|
$
|
1,583.6
|
|
$
|
3,595.6
|
|
$
|
3,581.9
|
|
$
|
9,260.9
|
|
||||
|
(1)
|
Excludes contingent rents. Refer to Note 13. "Leases" to the accompanying consolidated financial statements for additional discussion of contingent rental agreements.
|
|
(2)
|
We routinely enter into purchase agreements with approved vendors for most types of operating expenses in the ordinary course of business. Our specific open purchase orders (which have not been recognized as a liability) under these purchase agreements, combined with any other open purchase orders, are not material and though they are considered enforceable and legally binding, the related terms generally allow us the option to cancel, reschedule or adjust our requirements based on our business needs prior to the delivery of goods or performance of services. Accordingly, the commitments in the table above relate to orders to suppliers for capital purchases.
|
|
(3)
|
Includes $0.8 billion of federal coal lease expenditures due in annual installments through 2017.
|
|
(4)
|
Represents various short- and long-term take or pay arrangements in Australia and the U.S. associated with rail and port commitments for the delivery of coal, including amounts relating to export facilities. Also includes commitments under electricity, water and coal washing agreements with joint ventures.
|
|
(5)
|
Represents long-term liabilities relating to our postretirement benefit plans, work-related injuries and illnesses, defined benefit pension plans, mine reclamation and end of mine closure costs and exploration obligations. Also includes $0.3 billion of required payments to the VEBA established in connection with Patriot's bankruptcy emergence, as discussed in further detail in the "Capital Requirements" section above.
|
We do not expect any of the $140.5 million of net unrecognized tax benefits reported in our consolidated financial statements to require cash settlement within the next year in excess of deposits already posted with the Australian Tax Office as of December 31, 2013. Beyond that, we are unable to make reasonably reliable estimates of periodic cash settlements with respect to such unrecognized tax benefits.
Off-Balance Sheet Arrangements
In the normal course of business, we are a party to certain off-balance sheet arrangements. These arrangements include guarantees, indemnifications, financial instruments with off-balance sheet risk, such as bank letters of credit, bank guarantees and surety bonds, and our accounts receivable securitization program. Assets and liabilities related to these arrangements are not reflected in our consolidated balance sheets and we do not expect any material adverse effects on our financial condition, results of operations or cash flows to result from these off-balance sheet arrangements.
66
Accounts Receivable Securitization.
We have an accounts receivable securitization program (securitization program) with a maximum capacity of
$275.0 million
through our wholly-owned, bankruptcy-remote subsidiary (Seller). At December 31,
2013
, we had
$117.2 million
available under the securitization program, net of amounts drawn. Under the securitization program, we contribute trade receivables of most of our U.S. subsidiaries on a revolving basis to the Seller, which then sells the receivables in their entirety to a consortium of unaffiliated asset-backed commercial paper conduits (the Conduits). After the sale, we, as servicer of the assets, collect the receivables on behalf of the Conduits for a nominal servicing fee. We utilize proceeds from the sale of our accounts receivable as an alternative to short-term borrowings under the 2013 Revolver portion of our 2013 Credit Facility, effectively managing our overall borrowing costs and providing an additional source of working capital. The securitization program was renewed in May 2013 and will expire in April 2016.
The Seller is a separate legal entity whose assets are available first and foremost to satisfy the claims of its creditors. Of the receivables sold to the Conduits, a portion of the amount due to the Seller is deferred until the ultimate collection of the underlying receivables. During the year ended
December 31, 2013
, we received total consideration of
$4,205.9 million
related to accounts receivable sold under the securitization program, including
$2,719.1 million
of cash up front from the sale of the receivables, an additional
$1,347.9 million
of cash upon the collection of the underlying receivables and
$138.9 million
that had not been collected at
December 31, 2013
and was recorded at carrying value, which approximates fair value. The reduction in accounts receivable as a result of securitization activity with the Conduits was
$100.0 million
and
$25.0 million
at December 31,
2013
and
2012
, respectively.
Securitization activity has been reflected in the consolidated statements of cash flows as an operating activity because cash received from the Conduits upon the sale of receivables, as well as cash received from the Conduits upon the ultimate collection of receivables, are not subject to significantly different risks given the short-term nature of our trade receivables. We recorded expense associated with securitization transactions of
$1.5 million
,
$2.0 million
and
$2.0 million
for the years ended
December 31, 2013
,
2012
and
2011
, respectively.
Patriot Bankruptcy Reorganization
. As part of our settlement agreement with Patriot and the UMWA, on behalf of itself, its represented Patriot employees and its represented Patriot retirees, that became effective on December 18, 2013, we have also provided
$141.5 million
of credit support to Patriot, with
$100.0 million
of this total credit support ending after five years. As of December 31, 2013,
$31.5 million
of this credit support took the form of corporate guarantees to Patriot beneficiaries; $87.6 million of this credit support took the form of surety bonds issued for the benefit of Patriot beneficiaries; and $22.4 million of this credit support took the form of letters of credit issued for the benefit of Patriot beneficiaries. A total of $56.5 million of the credit support (all in the form of surety bonds) relates to Patriot’s Coal Act obligations that we agreed to fund at the time of the Patriot spin-off pursuant to the Coal Act Liabilities Assumption Agreement and to Patriot’s Federal Black Lung obligations.
Patriot has approximately
$150 million
in federal and state black lung occupational disease liabilities related to workers employed in periods prior to Patriot’s spin-off from us in 2007. At the time of the spin-off, Patriot indemnified us against any claim relating to these liabilities, including any claim made by the U.S. Department of Labor (“DOL”) against us with respect to these obligations as a potentially liable operator under the Federal Coal Mine Health and Safety Act of 1969.
In 2012, Patriot and certain of its wholly owned subsidiaries filed voluntary petitions for reorganization under Chapter 11 of the U.S. Code. In 2013, we entered into a definitive settlement agreement with Patriot and the United Mine Workers of America (UMWA), on behalf of itself, its represented Patriot employees and its represented Patriot retirees, to resolve all disputed issues related to Patriot’s bankruptcy. That agreement, which included Patriot’s affirmance of the indemnity relating to such black lung liabilities, became effective upon Patriot's emergence from bankruptcy on December 18, 2013.
If Patriot does not pay the black lung liabilities in the future, the DOL would first look to Patriot and any related credit support for payment before asserting any claims against us. While Patriot has agreed to indemnify us against any such claims by the DOL, we could be responsible for those liabilities if Patriot were not able to fund such indemnification.
Guarantees.
Refer to Note 23. "Financial Instruments, Guarantees with Off-Balance-Sheet Risk and Other Guarantees" to our consolidated financial statements for a discussion of our guarantees.
Critical Accounting Policies and Estimates
Our discussion and analysis of our financial condition, results of operations, liquidity and capital resources is based upon our financial statements, which have been prepared in accordance with U.S. GAAP. We are also required under U.S. GAAP to make estimates and judgments that affect the reported amounts of assets, liabilities, revenues and expenses, and related disclosure of contingent assets and liabilities. On an ongoing basis, we evaluate our estimates. We base our estimates on historical experience and on various other assumptions that we believe are reasonable under the circumstances, the results of which form the basis for making judgments about the carrying values of assets and liabilities that are not readily apparent from other sources. Actual results may differ from these estimates.
67
Postretirement Benefit and Pension Liabilities.
We have long-term liabilities for our employees’ postretirement benefit costs and defined benefit pension plans. Liabilities for postretirement benefit costs are not funded. Our pension obligations are funded in accordance with the provisions of applicable law. Expense for the year ended December 31, 2013 for postretirement benefit costs and pension liabilities totaled $195.7 million (including $63.2 million included as a component of settlement charges related to the Patriot bankruptcy reorganization), while employer contributions were $66.5 million.
Each of these liabilities is actuarially determined and we use various actuarial assumptions, including the discount rate, future cost trends and expected asset returns to estimate the costs and obligations for these items. Our discount rate is determined by utilizing a hypothetical bond portfolio model which approximates the future cash flows necessary to service our liabilities. We make assumptions related to future trends for medical care costs in the estimates of postretirement benefit costs. Our medical trend assumption is developed by annually examining the historical trend of cost per claim data. In addition, we make assumptions related to rates of return on plan assets in the estimates of pension obligations. If our assumptions do not materialize as expected, actual cash expenditures and costs that we incur could differ materially from our current estimates. Moreover, regulatory changes could affect our obligation to satisfy these or additional obligations.
For our postretirement benefit obligation, assumed discount rates and health care cost trend rates have a significant effect on the expense and liability amounts reported for our health care plans. Below we have provided two separate sensitivity analyses to demonstrate the significance of these assumptions in relation to reported amounts.
|
For Year Ended December 31, 2013
|
|||||||
|
One-Percentage-
Point Increase
|
One-Percentage-
Point Decrease
|
||||||
|
|
(Dollars in millions)
|
||||||
|
Health care cost trend rate:
|
|||||||
|
Effect on total net periodic postretirement benefit cost
|
$
|
13.0
|
|
$
|
(11.5
|
)
|
|
|
Effect on total postretirement benefit obligation
|
$
|
64.5
|
|
$
|
(56.7
|
)
|
|
|
For Year Ended December 31, 2013
|
|||||||
|
One-Half
Percentage-
Point Increase
|
One-Half
Percentage-
Point Decrease
|
||||||
|
(Dollars in millions)
|
|||||||
|
Discount rate:
|
|||||||
|
Effect on total net periodic postretirement benefit cost
|
$
|
(3.0
|
)
|
$
|
3.0
|
|
|
|
Effect on total postretirement benefit obligation
|
$
|
(38.5
|
)
|
$
|
40.2
|
|
|
For our pension obligation, assumed discount rates and expected returns on assets have a significant effect on the expense and funded status amounts reported for our defined benefit pension plans. Below we have provided two separate sensitivity analyses to demonstrate the significance of these assumptions in relation to reported amounts.
|
For Year Ended December 31, 2013
|
|||||||
|
One-Half
Percentage-
Point Increase
|
One-Half
Percentage-
Point Decrease
|
||||||
|
|
(Dollars in millions)
|
||||||
|
Discount rate:
|
|||||||
|
Effect on total net periodic pension cost
|
$
|
(7.1
|
)
|
$
|
7.7
|
|
|
|
Effect on defined benefit pension plans' funded status
|
$
|
47.1
|
|
$
|
(51.5
|
)
|
|
|
Expected return on assets:
|
|||||||
|
Effect on total net periodic pension cost
|
$
|
(4.0
|
)
|
$
|
4.0
|
|
|
See Note 15. "Postretirement Health Care and Life Insurance Benefits" and Note 16. "Pension and Savings Plans" to our consolidated financial statements for additional information regarding postretirement benefit and pension plans.
68
Asset Retirement Obligations.
Our asset retirement obligations primarily consist of spending estimates for surface land reclamation and support facilities at both surface and underground mines in accordance with applicable reclamation laws in the U.S. and Australia as defined by each mining permit. Asset retirement obligations are determined for each mine using various estimates and assumptions including, among other items, estimates of disturbed acreage as determined from engineering data, estimates of future costs to reclaim the disturbed acreage and the timing of these cash flows, discounted using a credit-adjusted, risk-free rate. As changes in estimates occur (such as mine plan revisions, changes in estimated costs or changes in timing of the reclamation activities), the obligation and asset are revised to reflect the new estimate after applying the appropriate credit-adjusted, risk-free rate. If our assumptions do not materialize as expected, actual cash expenditures and costs that we incur could be materially different than currently estimated. Moreover, regulatory changes could increase our obligation to perform reclamation and mine closing activities. Asset retirement obligation expense for the year ended December 31, 2013 was $
66.5 million
, and payments totaled $21.0 million. See Note 14. "Asset Retirement Obligations" to our consolidated financial statements for additional information regarding our asset retirement obligations.
Income Taxes.
We account for income taxes in accordance with accounting guidance which requires deferred tax assets and liabilities be recognized using enacted tax rates for the effect of temporary differences between the book and tax bases of recorded assets and liabilities. The guidance also requires that deferred tax assets be reduced by a valuation allowance if it is “more likely than not” that some portion or all of the deferred tax asset will not be realized. In our evaluation of the need for a valuation allowance, we take into account various factors, including the expected level of future taxable income, available tax planning strategies, reversals of existing taxable temporary differences and taxable income in carryback years. As of December 31, 2013, we had valuation allowances for income taxes totaling $1,634.1 million including both the valuation allowance on income taxes and the valuation allowance on our minerals resource rent tax assets in Australia. If actual results differ from the assumptions made in our annual evaluation of our valuation allowance, we may record a change in valuation allowance through income tax expense in the period such determination is made.
Our liability for unrecognized tax benefits contains uncertainties because management is required to make assumptions and to apply judgment to estimate the exposures associated with our various filing positions. We recognize the tax benefit from an uncertain tax position only if it is “more likely than not” that the tax position will be sustained on examination by the taxing authorities, based on the technical merits of the position. The tax benefits recognized in the financial statements from such a position must be measured based on the largest benefit that has a greater than 50% likelihood of being realized upon ultimate settlement. As of December 31, 2013, we had net unrecognized tax benefits of $140.5 million included in recorded liabilities in the consolidated balance sheet. We believe that our judgments and estimates are reasonable; however, to the extent we prevail in matters for which liabilities have been established, or are required to pay amounts in excess of our recorded liabilities, our effective tax rate in a given period could be materially affected.
See Note 10. "Income Taxes" to our consolidated financial statements for additional information regarding valuation allowances and unrecognized tax benefits.
Impairment of Long-Lived Assets.
We evaluate our long-lived assets used in operations for impairment as events and changes in circumstances indicate that the carrying amount of such assets might not be recoverable. Factors that would indicate potential impairment to be present include, but are not limited to, a sustained history of operating or cash flow losses, an unfavorable change in earnings and cash flow outlook, prolonged adverse industry or economic trends and a significant adverse change in the extent or manner in which a long-lived asset is being used or in its physical condition. We generally do not view short-term declines in thermal and metallurgical coal prices in the markets in which we sell those products as a triggering event for conducting impairment tests because such markets have a history of price volatility. However, we generally do view a sustained trend of depressed coal market pricing (for example, over periods exceeding one year) as an indicator of potential impairment.
Assets are grouped at the lowest level for which there are identifiable cash flows that are largely independent of the cash flows of other groups of assets. For our active mining operations, we generally group such assets at the mine level, or the mining complex level for mines that share infrastructure, with the exception of impairment evaluations triggered by mine closures. In those cases involving mine closures, the related assets are evaluated at the individual asset level for transferability to ongoing operating sites, remaining economic life for use in reclamation-related activities or for expected salvage. For our development and exploration properties and portfolio of surface land and coal reserve holdings, we consider several factors to determine whether to evaluate those assets individually or on a grouped basis for purposes of impairment testing. Such factors include geographic proximity to one another, the expectation of shared infrastructure upon development based on future mining plans and whether it would be most advantageous to bundle such assets in the event of sale to a third party.
69
When indicators of impairment are present, we evaluate our long-lived assets used in operations for recoverability by comparing the estimated undiscounted cash flows expected to be generated by those assets under various assumptions to their carrying amounts. If such undiscounted cash flows indicate that the carrying value of the asset group is not recoverable, impairment losses are measured by comparing the estimated fair value of the asset group to its carrying amount. As quoted market prices are unavailable for our individual mining operations, fair value is determined through the use of an expected present value technique based on the income approach, except for non-strategic coal reserves and surface lands, in which case a market approach is utilized. The estimated future cash flows and underlying assumptions used to assess recoverability and, if necessary, measure the fair value of our long-lived assets are derived from those developed in connection with our planning and budgeting process. We believe our assumptions are consistent with those a market participant would use for valuation purposes.
Impairment of long-lived assets included in continuing operations was $463.6 million for the year ended December 31, 2013. The most critical assumptions underlying our projections include those surrounding future coal prices for unpriced coal, production costs (including costs for labor, commodity supplies and contractors), transportation costs, foreign currency exchange rates, a risk-adjusted, after-tax cost of capital and market multiples for non-strategic coal reserves and surface lands, all of which generally constitute unobservable Level 3 inputs under the fair value hierarchy. The assumptions used are based on our best knowledge at the time we prepare our analysis but can vary significantly due to regulatory issues, unforeseen mining conditions, changes in commodity prices, availability and costs of labor and changes in supply and demand. See Note 2. "Asset Impairment and Mine Closure Costs" to our consolidated financial statements for additional information regarding impairment charges.
Fair Value Measurements of Financial Instruments.
We evaluate the quality and reliability of the assumptions and data used in our Trading and Brokerage segment to measure fair value in the three level hierarchy, Levels 1, 2 and 3. Level 3 fair value measurements are those where inputs are unobservable, or observable but cannot be market-corroborated, requiring us to make assumptions about pricing by market participants. Commodity swaps and options and physical commodity purchase/sale contracts transacted in less liquid markets or contracts, such as long-term arrangements, with limited price availability were classified in Level 3. Indicators of less liquid markets are those with periods of low trade activity or when broker quotes reflect wide pricing spreads. Generally, these instruments or contracts are valued using internally generated models that include forward pricing curve quotes from one to three reputable brokers. Our valuation techniques also include basis adjustments for heat rate, sulfur and ash content, port and freight costs, and credit and nonperformance risk. We validate our valuation inputs with third-party information and settlement prices from other sources where available. We also consider credit and nonperformance risk in the fair value measurement by analyzing the counterparty’s exposure balance, credit rating and average default rate, net of any counterparty credit enhancements (e.g., collateral), as well as our own credit rating for financial liability trading positions.
We have consistently applied these valuation techniques in all periods presented, and believe we have obtained the most accurate information reasonably available for the types of derivative contracts held. Valuation changes from period to period for each level will increase or decrease depending on: (1) the relative change in fair value for positions held, (2) new positions added, (3) realized amounts for completed trades, and (4) transfers between levels. Our coal trading strategies utilize various swaps and derivative physical contracts. Periodic changes in fair value for purchase and sale positions, which are executed to lock in coal trading spreads, occur in each level and therefore the overall change in value of our coal trading platform requires consideration of valuation changes across all levels.
At December 31, 2013 and 2012, 7% (
$2.1 million
) and 16% ($5.2 million), respectively, of our net financial asset trading positions were categorized as Level 3. See Note 7. "Coal Trading" to our consolidated financial statements for additional information regarding fair value measurements of our net financial asset trading positions.
Newly Adopted Accounting Standards and Accounting Standards Not Yet Implemented
See Note 1. "Summary of Significant Accounting Policies" to our consolidated financial statements for a discussion of newly adopted accounting standards and accounting standards not yet implemented.
Item 7A.
Quantitative and Qualitative Disclosures About Market Risk.
The potential for changes in the market value of our coal and freight-related trading, crude oil, diesel fuel, natural gas, explosives, interest rate and foreign currency contract portfolios is referred to as “market risk.” Market risk related to our coal trading and freight-related contract portfolio, which includes bilaterally-settled and over-the-counter (OTC) exchange-settled trading, in addition to, from time to time, the brokered trading of coal, is evaluated using a value at risk (VaR) analysis. VaR analysis is not used to evaluate our non-trading diesel fuel, explosives, foreign currency or interest rate hedging portfolios or coal trading activities we employ in support of coal production (as discussed below). We attempt to manage market price risks through diversification, controlling position sizes and executing hedging strategies. Due to a lack of quoted market prices and the long-term, illiquid nature of the positions, we have not quantified market price risk related to our non-trading, long-term coal supply agreement portfolio.
70
Coal Trading Activities and Related Commodity Price Risk
Coal Price Risk Monitored Using VaR.
We engage in direct and brokered trading of physical coal and freight-related commodities in OTC markets. These activities give rise to commodity price risk, which represents the potential loss that can be caused by an adverse change in the market value of a particular commitment. We actively measure, monitor, manage and hedge market price risk due to current and anticipated trading activities to remain within risk limits prescribed by management. For example, we have policies in place that limit the amount of market price risk, as measured by VaR, that we may assume at any point in time from our trading and brokerage activities.
We generally account for our coal trading activities using the fair value method, which requires us to reflect contracts with third parties that meet the definition of a derivative at market value in our consolidated financial statements, with the exception of contracts for which we have elected to apply the normal purchases and normal sales exception. Our trading portfolio included futures, forwards and swaps as of
December 31, 2013
. The use of VaR allows us to quantify in dollars, on a daily basis, a measure of price risk inherent in our trading portfolio. VaR represents the expected loss in portfolio value due to adverse market price movements over a defined time horizon (liquidation period) within a specified confidence level. Our VaR model is based on a variance/co-variance approach, which captures our potential loss exposure related to future, forward, swap and option positions. Our VaR model assumes a 5- to 15-day holding period, dependent upon the products within our portfolio, at the time of VaR measurement and produces an output corresponding with a 95% one-tailed confidence interval, which means that there is a one in 20 statistical chance that our portfolio could lose more than the VaR estimates during the assumed liquidation period. Our volatility calculation incorporates an exponentially weighted moving average algorithm based on price movements during the previous 60 market days, which makes our volatility more representative of recent market conditions while still reflecting an awareness of historical price movements. VaR does not estimate the maximum potential loss expected in the 5% of the time that changes in the portfolio value during the assumed liquidation period is expected to exceed measured VaR.
VaR analysis allows us to aggregate market price risk across products in the portfolio, compare market price risk on a consistent basis and identify the drivers of risk and changes thereto over time. We use historical data to estimate price volatility as an input to VaR. Given our reliance on historical data, we believe VaR is reasonably effective in characterizing market price risk exposures in markets in which there are not sudden fundamental changes or shifts in market conditions. Nonetheless, an inherent limitation of VaR is that past changes in market price risk factors may not produce accurate predictions of future market price risk. Due to that limitation, combined with the subjectivity in the choice of the liquidation period and reliance on historical data to calibrate our models, we perform regular stress and scenario analyses to estimate the impacts of market price changes on the value of the portfolio. Additionally, back-testing is regularly performed to monitor the effectiveness of our VaR measure. The results of these analyses are used to supplement the VaR methodology and identify additional market price-related risks.
During the year ended
December 31, 2013
, the actual low, high and average VaR was $2.4 million, $12.3 million and $5.7 million, respectively.
Other Risk Exposures.
We also use our coal trading and brokerage platform to support various coal production-related activities. These transactions may involve coal to be produced from our mines, coal sourcing arrangements with third-party mining companies, joint venture positions with producers or offtake agreements with producers. While the support activities (such as the forward sale of coal to be produced and/or purchased) may ultimately involve instruments sensitive to market price risk, the sourcing of coal in these arrangements does not involve market risk sensitive instruments and does not encompass the commodity price risks that we monitor through VaR analysis, as discussed above.
Future Realization.
As of
December 31, 2013
, the timing of the estimated future realization of the value of our trading portfolio was as follows:
|
Percentage of
|
||
|
Year of Expiration
|
Portfolio Total
|
|
|
2014
|
84%
|
|
|
2015
|
9%
|
|
|
2016
|
7%
|
|
|
100%
|
||
We also monitor other types of risk associated with our coal trading activities, including credit, market liquidity and counterparty nonperformance.
71
Nonperformance and Credit Risk
Coal Trading.
The fair value of our coal trading assets and liabilities reflects adjustments for nonperformance and credit risk. Our exposure is substantially with electric utilities, other industrial energy users, energy marketers and nonfinancial trading houses. Our policy is to independently evaluate each customer’s creditworthiness prior to entering into transactions and to regularly monitor the credit extended. If we engage in a transaction with a counterparty that does not meet our credit standards, we seek to protect our position by requiring the counterparty to provide an appropriate credit enhancement. Also, when appropriate (as determined by our credit management function), we have taken steps to reduce our exposure to customers or counterparties whose credit has deteriorated and who may pose a higher risk of failure to perform under their contractual obligations. These steps include obtaining letters of credit or cash collateral (margin), requiring prepayments for shipments or the creation of customer trust accounts held for our benefit to serve as collateral in the event of a failure to pay or perform. To reduce our credit exposure related to trading and brokerage activities, we seek to enter into netting agreements with counterparties that permit us to offset receivables and payables with such counterparties and, to the extent required, will post or receive margin amounts associated with exchange-cleared positions.
Non-Coal Trading.
The fair value of our non-coal trading derivative assets and liabilities also reflects adjustments for nonperformance and credit risk. We manage our counterparty risk from our hedging activities related to foreign currency, fuel and explosives and interest rate exposures through established credit standards, diversification of counterparties, utilization of highly-rated commercial banks, adherence to established tenor limits based on counterparty creditworthiness and continual monitoring of that creditworthiness. To reduce our credit exposure for these hedging activities, we seek to enter into netting agreements with counterparties that permit us to offset receivables and payables with such counterparties in the event of default.
Foreign Currency Risk
We utilize currency forwards and options to hedge currency risk associated with anticipated Australian dollar expenditures. The accounting for these derivatives is discussed in Note 6 "Derivatives and Fair Value Measurements" to our consolidated financial statements. Assuming we had no foreign currency hedges in place, our exposure in operating costs and expenses due to a $0.05 change in the Australian dollar/U.S. dollar exchange rate is approximately $140 million for
2014
. Taking into consideration hedges in place as of December 31, 2013, our net exposure to the same rate change is approximately $36 million for
2014
. The notional amounts of our foreign currency hedge contracts as of
December 31, 2013
are noted in the "Notional Amounts and Fair Value" section of Note 6 to our consolidated financial statements, which information is incorporated herein by reference.
Other Non-Coal Trading Activities — Commodity Price Risk
Long-Term Coal Contracts.
We predominantly manage our commodity price risk for our non-trading, long-term coal contract portfolio through the use of long-term coal supply agreements (those with terms longer than one year), rather than through the use of derivative instruments. Sales under such agreements comprised approximately
80%
,
89%
and
91%
of our worldwide sales (by volume) for the years ended December 31,
2013
,
2012
and
2011
, respectively. As of December 31, 2013, approximately 85% to 90% of our projected
2014
U.S. coal production is priced at planned production levels. We had 30% to 40% of seaborne thermal coal volumes available for pricing at January 29,
2014
. We expect near-term macroeconomic movements to dictate quarterly metallurgical coal pricing for the remainder of
2014
and we are targeting total
2014
metallurgical coal sales of approximately
16 to 17 million tons
.
Diesel Fuel and Explosives Hedges.
We manage commodity price risk of the diesel fuel and explosives used in our mining activities through the use of cost pass-through contracts and derivatives, primarily swaps. Notional amounts outstanding under fuel-related and explosives-related derivative swap contracts are noted in the "Notional Amounts and Fair Value" section of Note 6 to our consolidated financial statements, which information is incorporated herein by reference.
We expect to consume 160 to 170 million gallons of diesel fuel in
2014
. Assuming we had no hedges in place, a $10 per barrel change in the price of crude oil (the primary component of a refined diesel fuel product) would increase or decrease our annual diesel fuel costs by approximately $39 million based on our expected usage. Taking into consideration hedges in place as of December 31, 2013, our net exposure to the same change in the price of crude oil is approximately $13 million.
We expect to consume 365,000 to 375,000 tons of explosives during
2014
in the U.S. Assuming we had no hedges in place, a price change in natural gas (often a key component in the production of explosives) of one dollar per mmBtu would result in an increase or decrease in our annual explosives costs of approximately $6 million based on our expected usage. Taking into consideration hedges in place as of December 31, 2013, our net exposure to the same change in the price of natural gas is approximately $5 million.
72
Interest Rate Risk
Our objectives in managing exposure to interest rate changes are to limit the impact of interest rate changes on earnings and cash flows and to lower overall borrowing costs. From time to time, we manage our debt to achieve a certain ratio of fixed-rate debt and variable-rate debt as a percent of net debt through the use of various hedging instruments. As of
December 31, 2013
, we had $4.8 billion of fixed-rate borrowings and $1.2 billion of variable-rate borrowings outstanding and had no interest rate swaps in place. A one percentage point increase in interest rates would result in an annualized increase to interest expense of approximately $12 million on our variable-rate borrowings. With respect to our fixed-rate borrowings, a one percentage point increase in interest rates would result in a decrease of approximately $165 million in the estimated fair value of these borrowings.
Item 8.
Financial Statements and Supplementary Data.
See Part IV, Item 15. "Exhibits, Financial Statement Schedules" of this report for the information required by this Item 8, which information is incorporated by reference herein.
Item 9.
Changes in and Disagreements with Accountants on Accounting and Financial Disclosure.
None.
Item 9A.
Controls and Procedures.
Evaluation of Disclosure Controls and Procedures
Our disclosure controls and procedures are designed to, among other things, provide reasonable assurance that material information, both financial and non-financial, and other information required under the securities laws to be disclosed is accumulated and communicated to senior management, including the principal executive officer and principal financial officer, on a timely basis. As of
December 31, 2013
, the end of the period covered by this Annual Report on Form 10-K, we carried out an evaluation of the effectiveness of the design and operation of our disclosure controls and procedures. Based upon that evaluation, our Chief Executive Officer and Chief Financial Officer have evaluated our disclosure controls and procedures (as defined in Rules 13a-15(e) and 15d-15(e) under the Securities Exchange Act of 1934) as of
December 31, 2013
, and concluded that such controls and procedures are effective to provide reasonable assurance that the desired control objectives were achieved.
Changes in Internal Control Over Financial Reporting
We periodically review our internal control over financial reporting as part of our efforts to ensure compliance with the requirements of Section 404 of the Sarbanes-Oxley Act of 2002. In addition, we routinely review our system of internal control over financial reporting to identify potential changes to our processes and systems that may improve controls and increase efficiency, while ensuring that we maintain an effective internal control environment. Changes may include such activities as implementing new systems, consolidating the activities of acquired business units, migrating certain processes to our shared services organizations, formalizing and refining policies and procedures, improving segregation of duties and adding monitoring controls. In addition, when we acquire new businesses, we incorporate our controls and procedures into the acquired business as part of our integration activities. There have been no changes in our internal control over financial reporting that occurred during the three months ended
December 31, 2013
that have materially affected, or are reasonably likely to materially affect, our internal control over financial reporting.
Management's Report on Internal Control Over Financial Reporting
Management is responsible for maintaining and establishing adequate internal control over financial reporting. Our internal control framework and processes are designed to provide reasonable assurance regarding the reliability of financial reporting and the preparation of our consolidated financial statements for external purposes in accordance with U.S. generally accepted accounting principles.
Because of inherent limitations, any system of internal control over financial reporting may not prevent or detect misstatements. Also, projections of any evaluation of effectiveness to future periods are subject to the risk that controls may become inadequate because of changes in conditions, or that the degree of compliance with the policies or procedures may deteriorate.
73
Management conducted an assessment of the effectiveness of our internal control over financial reporting using the criteria set by the Committee of Sponsoring Organizations of the Treadway Commission (COSO) in
Internal Control - Integrated Framework (1992)
. Based on this assessment, management concluded that the Company's internal control over financial reporting was effective to provide reasonable assurance that the desired control objectives were achieved as of
December 31, 2013
.
Our Independent Registered Public Accounting Firm, Ernst & Young LLP, has audited our internal control over financial reporting, as stated in their unqualified opinion report included herein.
|
/s/ Gregory H. Boyce
|
/s/ Michael C. Crews
|
|||
|
Gregory H. Boyce
Chairman and Chief Executive Officer
|
|
Michael C. Crews
Executive Vice President and
Chief Financial Officer
|
||
February 21, 2014
74
REPORT OF INDEPENDENT REGISTERED PUBLIC ACCOUNTING FIRM
The Board of Directors and Stockholders of Peabody Energy Corporation
We have audited Peabody Energy Corporation’s (the Company’s) internal control over financial reporting as of
December 31, 2013
, based on criteria established in Internal Control-Integrated Framework issued by the Committee of Sponsoring Organizations of the Treadway Commission (1992 framework), (the COSO criteria). The Company’s management is responsible for maintaining effective internal control over financial reporting, and for its assessment of the effectiveness of internal control over financial reporting included in the accompanying Management’s Report on Internal Control Over Financial Reporting. Our responsibility is to express an opinion on the Company’s internal control over financial reporting based on our audit.
We conducted our audit in accordance with the standards of the Public Company Accounting Oversight Board (United States). Those standards require that we plan and perform the audit to obtain reasonable assurance about whether effective internal control over financial reporting was maintained in all material respects. Our audit included obtaining an understanding of internal control over financial reporting, assessing the risk that a material weakness exists, testing and evaluating the design and operating effectiveness of internal control based on the assessed risk, and performing such other procedures as we considered necessary in the circumstances. We believe that our audit provides a reasonable basis for our opinion.
A company’s internal control over financial reporting is a process designed to provide reasonable assurance regarding the reliability of financial reporting and the preparation of financial statements for external purposes in accordance with generally accepted accounting principles. A company’s internal control over financial reporting includes those policies and procedures that (1) pertain to the maintenance of records that, in reasonable detail, accurately and fairly reflect the transactions and dispositions of the assets of the company; (2) provide reasonable assurance that transactions are recorded as necessary to permit preparation of financial statements in accordance with generally accepted accounting principles, and that receipts and expenditures of the company are being made only in accordance with authorizations of management and directors of the company; and (3) provide reasonable assurance regarding prevention or timely detection of unauthorized acquisition, use, or disposition of the company’s assets that could have a material effect on the financial statements.
Because of its inherent limitations, internal control over financial reporting may not prevent or detect misstatements. Also, projections of any evaluation of effectiveness to future periods are subject to the risk that controls may become inadequate because of changes in conditions, or that the degree of compliance with the policies or procedures may deteriorate.
In our opinion, Peabody Energy Corporation maintained, in all material respects, effective internal control over financial reporting as of
December 31, 2013
, based on the COSO criteria.
We also have audited, in accordance with the standards of the Public Company Accounting Oversight Board (United States), the consolidated balance sheets of Peabody Energy Corporation as of
December 31, 2013
and
2012
, and the related consolidated statements of operations, comprehensive income, changes in stockholders’ equity, and cash flows for each of the three years in the period ended
December 31, 2013
of Peabody Energy Corporation and our report dated
February 21, 2014
expressed an unqualified opinion thereon.
/s/ Ernst & Young LLP
St. Louis, Missouri
February 21, 2014
75
Item 9B.
Other Information.
None.
Item 10.
Directors, Executive Officers and Corporate Governance.
The information required by Item 401 of Regulation S-K is included under the caption “Election of Directors-Director Qualifications” in our
2014
Proxy Statement and in Part I, Item 1. "Business" of this report under the caption “Executive Officers of the Company.” The information required by Items 405, 406 and 407(c)(3), (d)(4) and (d)(5) of Regulation S-K is included under the captions “Ownership of Company Securities — Section 16(a) Beneficial Ownership Reporting Compliance,” “Corporate Governance Matters” and “Information Regarding Board of Directors and Committees-Committees of the Board of Directors-Audit Committee” in our
2014
Proxy Statement. Such information is incorporated herein by reference.
Item 11.
Executive Compensation.
The information required by Items 402 and 407(e)(4) and (e)(5) of Regulation S-K is included under the captions “Executive Compensation,” “Compensation Committee Interlocks and Insider Participation” and “Report of the Compensation Committee” in our
2014
Proxy Statement and is incorporated herein by reference.
Item 12.
Security Ownership of Certain Beneficial Owners and Management and Related Stockholder Matters.
The information required by Item 403 of Regulation S-K is included under the caption “Ownership of Company Securities” in our
2014
Proxy Statement and is incorporated herein by reference.
Equity Compensation Plan Information
As required by Item 201(d) of Regulation S-K, the following table provides information regarding our equity compensation plans as of
December 31, 2013
:
|
(a)
Number of Securities
to be Issued
upon Exercise of
Outstanding Options,
Warrants and Rights
|
Weighted-Average
Exercise Price of
Outstanding Options,
Warrants and Rights
|
Number of Securities
Remaining Available
for Future Issuance
Under Equity
Compensation Plans
(Excluding
Securities
Reflected in Column
(a))
|
|||||||||
|
Plan Category
|
|
|
|
||||||||
|
Equity compensation plans approved by security holders
|
1,682,919
|
|
(1)
|
$
|
41.05
|
|
(2)
|
11,678,171
|
|
(3)
|
|
|
Equity compensation plans not approved by security holders
|
—
|
|
|
—
|
|
|
—
|
|
|
||
|
Total
|
1,682,919
|
|
|
$
|
41.05
|
|
|
11,678,171
|
|
|
|
|
(1)
|
Includes 100,676 shares issuable pursuant to outstanding deferred stock units and 115,972 shares issuable pursuant to outstanding performance units.
|
|
(2)
|
The weighted-average exercise price shown in the table does not take into account outstanding deferred stock units or performance awards.
|
|
(3)
|
Includes 1,438,588 shares available for issuance under our U.S. Employee Stock Purchase Plan and 881,679 shares available for issuance under our Australian Employee Stock Purchase Plan.
|
Refer to Note 18. "Share-Based Compensation" to the accompanying consolidated financial statements for additional information regarding the material features of our equity compensation plans.
76
Item 13.
Certain Relationships and Related Transactions, and Director Independence.
The information required by Items 404 and 407(a) of Regulation S-K is included under the captions “Policy for Approval of Related Person Transactions” and “Information Regarding Board of Directors and Committees-Director Independence” in our
2014
Proxy Statement and is incorporated herein by reference.
Item 14.
Principal Accounting Fees and Services.
The information required by Item 9(e) of Schedule 14A is included under the caption “Fees Paid to Independent Registered Public Accounting Firm” in our
2014
Proxy Statement and is incorporated herein by reference.
Item 15.
Exhibits, Financial Statement Schedules.
(a) Documents Filed as Part of the Report
(1) Financial Statements.
The following consolidated financial statements of Peabody Energy Corporation are included herein on the pages indicated:
|
|
Page
|
|
Report of Independent Registered Public Accounting Firm
|
F-1
|
|
Consolidated Statements of Operations — Years Ended December 31, 2013, 2012 and 2011
|
F-2
|
|
Consolidated Statements of Comprehensive Income — Years Ended December 31, 2013, 2012 and 2011
|
F-3
|
|
Consolidated Balance Sheets — December 31, 2013 and 2012
|
F-4
|
|
Consolidated Statements of Cash Flows — Years Ended December 31, 2013, 2012 and 2011
|
F-5
|
|
Consolidated Statements of Changes in Stockholders’ Equity — Years Ended December 31, 2013, 2012 and 2011
|
F-7
|
|
Notes to Consolidated Financial Statements
|
F-8
|
(2) Financial Statement Schedules.
The following financial statement schedules of Peabody Energy Corporation and the report thereon of the independent registered public accounting firm are at the pages indicated:
|
|
Page
|
|
Valuation and Qualifying Accounts
|
F-
85
|
All other schedules for which provision is made in the applicable accounting regulation of the Securities and Exchange Commission are not required under the related instructions or are not applicable and, therefore, have been omitted.
(3) Exhibits.
See Exhibit Index hereto.
Pursuant to the Instructions to Exhibits, certain instruments defining the rights of holders of long-term debt securities of the Company and its consolidated subsidiaries are not filed because the total amount of securities authorized under any such instrument does not exceed 10% of the total assets of the Company and its subsidiaries on a consolidated basis. A copy of such instrument will be furnished to the Securities and Exchange Commission upon request.
77
SIGNATURES
Pursuant to the requirements of Section 13 or 15(d) of the Securities Exchange Act of 1934, the registrant has duly caused this report to be signed on its behalf by the undersigned, thereunto duly authorized.
|
PEABODY ENERGY CORPORATION
|
|
|
/s/ GREGORY H. BOYCE
|
|
|
Gregory H. Boyce
Chairman and Chief Executive Officer
|
|
Date:
February 21, 2014
Pursuant to the requirements of the Securities Exchange Act of 1934, this report has been signed below by the following persons, on behalf of the registrant and in the capacities and on the dates indicated.
|
Signature
|
|
Title
|
|
Date
|
||
|
|
|
|
|
|
||
|
/s/ GREGORY H. BOYCE
|
|
Chairman and Chief Executive Officer,
Director (principal executive officer)
|
|
February 21, 2014
|
||
|
Gregory H. Boyce
|
||||||
|
|
|
|
|
|
||
|
/s/ MICHAEL C. CREWS
|
|
Executive Vice President and Chief Financial Officer (principal financial and accounting officer)
|
|
February 21, 2014
|
||
|
Michael C. Crews
|
||||||
|
|
|
|
|
|
||
|
/s/ WILLIAM A. COLEY
|
|
Director
|
|
February 21, 2014
|
||
|
William A. Coley
|
||||||
|
|
|
|
|
|
||
|
/s/ WILLIAM E. JAMES
|
|
Director
|
|
February 21, 2014
|
||
|
William E. James
|
||||||
|
|
|
|
|
|
||
|
/s/ ROBERT B. KARN III
|
|
Director
|
|
February 21, 2014
|
||
|
Robert B. Karn III
|
||||||
|
|
|
|
|
|
||
|
/s/ HENRY E. LENTZ
|
|
Director
|
|
February 21, 2014
|
||
|
Henry E. Lentz
|
||||||
|
|
|
|
|
|
||
|
/s/ ROBERT A. MALONE
|
|
Director
|
|
February 21, 2014
|
||
|
Robert A. Malone
|
||||||
|
|
|
|
|
|
||
|
/s/ WILLIAM C. RUSNACK
|
|
Director
|
|
February 21, 2014
|
||
|
William C. Rusnack
|
||||||
|
|
|
|
|
|
||
|
/s/ MICHAEL W. SUTHERLIN
|
Director
|
February 21, 2014
|
||||
|
Michael W. Sutherlin
|
||||||
|
/s/ JOHN F. TURNER
|
|
Director
|
|
February 21, 2014
|
||
|
John F. Turner
|
||||||
|
|
|
|
|
|
||
|
/s/ SANDRA A. VAN TREASE
|
|
Director
|
|
February 21, 2014
|
||
|
Sandra A. Van Trease
|
||||||
|
|
|
|
|
|
||
|
/s/ ALAN H. WASHKOWITZ
|
|
Director
|
|
February 21, 2014
|
||
|
Alan H. Washkowitz
|
||||||
|
|
|
|
|
|
||
|
/s/ HEATHER A. WILSON
|
|
Director
|
|
February 21, 2014
|
||
|
Heather A. Wilson
|
||||||
78
REPORT OF INDEPENDENT REGISTERED PUBLIC ACCOUNTING FIRM
The Board of Directors and Stockholders of Peabody Energy Corporation
We have audited the accompanying consolidated balance sheets of Peabody Energy Corporation (the Company) as of December 31, 2013 and 2012, and the related consolidated statements of operations, comprehensive income, changes in stockholders’ equity, and cash flows for each of the three years in the period ended December 31, 2013. Our audits also included the financial statement schedule listed in the Index at Item 15(a). These financial statements and schedule are the responsibility of the Company's management. Our responsibility is to express an opinion on these financial statements and schedule based on our audits.
We conducted our audits in accordance with the standards of the Public Company Accounting Oversight Board (United States). Those standards require that we plan and perform the audit to obtain reasonable assurance about whether the financial statements are free of material misstatement. An audit includes examining, on a test basis, evidence supporting the amounts and disclosures in the financial statements. An audit also includes assessing the accounting principles used and significant estimates made by management, as well as evaluating the overall financial statement presentation. We believe that our audits provide a reasonable basis for our opinion.
In our opinion, the financial statements referred to above present fairly, in all material respects, the consolidated financial position of Peabody Energy Corporation at December 31, 2013 and 2012, and the consolidated results of its operations and its cash flows for each of the three years in the period ended December 31, 2013, in conformity with U.S. generally accepted accounting principles. Also, in our opinion, the related financial statement schedule, when considered in relation to the basic financial statements taken as a whole, presents fairly, in all material respects the information set forth therein.
We also have audited, in accordance with the standards of the Public Company Accounting Oversight Board (United States), Peabody Energy Corporation’s internal control over financial reporting as of
December 31, 2013
, based on criteria established in Internal Control-Integrated Framework issued by the Committee of Sponsoring Organizations of the Treadway Commission (1992 framework), and our report dated
February 21, 2014
expressed unqualified opinion thereon.
/s/ Ernst & Young LLP
St. Louis, Missouri
February 21, 2014
F -
1
PEABODY ENERGY CORPORATION
|
|
Year Ended December 31,
|
||||||||||
|
|
2013
|
2012
|
2011
|
||||||||
|
|
(Dollars in millions, except per share data)
|
||||||||||
|
Revenues
|
|
|
|
|
|
|
|||||
|
Sales
|
$
|
6,380.0
|
|
$
|
7,041.7
|
|
$
|
7,013.0
|
|
||
|
Other revenues
|
633.7
|
|
1,035.8
|
|
882.9
|
|
|||||
|
Total revenues
|
7,013.7
|
|
8,077.5
|
|
7,895.9
|
|
|||||
|
Costs and expenses
|
|
|
|||||||||
|
Operating costs and expenses (exclusive of items shown separately below)
|
5,736.1
|
|
5,932.7
|
|
5,477.6
|
|
|||||
|
Depreciation, depletion and amortization
|
740.3
|
|
663.4
|
|
474.3
|
|
|||||
|
Asset retirement obligation expenses
|
66.5
|
|
67.0
|
|
52.6
|
|
|||||
|
Selling and administrative expenses
|
249.1
|
|
268.8
|
|
268.2
|
|
|||||
|
Acquisition costs related to Macarthur Coal Limited
|
—
|
|
—
|
|
85.2
|
|
|||||
|
Other operating (income) loss:
|
|||||||||||
|
Net gain on disposal or exchange of assets
|
(52.6
|
)
|
(17.1
|
)
|
(76.9
|
)
|
|||||
|
Asset impairment and mine closure costs
|
528.3
|
|
929.0
|
|
—
|
|
|||||
|
Settlement charges related to the Patriot bankruptcy reorganization
|
30.6
|
|
—
|
|
—
|
|
|||||
|
Loss from equity affiliates
|
40.2
|
|
61.2
|
|
19.2
|
|
|||||
|
Operating (loss) profit
|
(324.8
|
)
|
172.5
|
|
1,595.7
|
|
|||||
|
Interest expense
|
425.2
|
|
405.6
|
|
238.6
|
|
|||||
|
Interest income
|
(15.7
|
)
|
(24.5
|
)
|
(18.9
|
)
|
|||||
|
(Loss) income from continuing operations before income taxes
|
(734.3
|
)
|
(208.6
|
)
|
1,376.0
|
|
|||||
|
Income tax (benefit) provision
|
(448.3
|
)
|
262.3
|
|
363.2
|
|
|||||
|
(Loss) income from continuing operations, net of income taxes
|
(286.0
|
)
|
(470.9
|
)
|
1,012.8
|
|
|||||
|
Loss from discontinued operations, net of income taxes
|
(226.6
|
)
|
(104.2
|
)
|
(66.5
|
)
|
|||||
|
Net (loss) income
|
(512.6
|
)
|
(575.1
|
)
|
946.3
|
|
|||||
|
Less: Net income (loss) attributable to noncontrolling interests
|
12.3
|
|
10.6
|
|
(11.4
|
)
|
|||||
|
Net (loss) income attributable to common stockholders
|
$
|
(524.9
|
)
|
$
|
(585.7
|
)
|
$
|
957.7
|
|
||
|
(Loss) income from continuing operations
|
|||||||||||
|
Basic (loss) earnings per share
|
$
|
(1.12
|
)
|
$
|
(1.80
|
)
|
$
|
3.78
|
|
||
|
Diluted (loss) earnings per share
|
$
|
(1.12
|
)
|
$
|
(1.80
|
)
|
$
|
3.77
|
|
||
|
Net (loss) income attributable to common stockholders
|
|||||||||||
|
Basic (loss) earnings per share
|
$
|
(1.97
|
)
|
$
|
(2.19
|
)
|
$
|
3.53
|
|
||
|
Diluted (loss) earnings per share
|
$
|
(1.97
|
)
|
$
|
(2.19
|
)
|
$
|
3.52
|
|
||
|
Dividends declared per share
|
$
|
0.34
|
|
$
|
0.34
|
|
$
|
0.34
|
|
||
See accompanying notes to consolidated financial statements
F -
2
PEABODY ENERGY CORPORATION
CONSOLIDATED STATEMENTS OF COMPREHENSIVE INCOME
|
Year Ended December 31,
|
|||||||||||
|
2013
|
2012
|
2011
|
|||||||||
|
(Dollars in millions)
|
|||||||||||
|
Net (loss) income
|
$
|
(512.6
|
)
|
$
|
(575.1
|
)
|
$
|
946.3
|
|
||
|
Other comprehensive (loss) income, net of income taxes:
|
|||||||||||
|
Net change in unrealized gains (losses) on available-for-sale securities (net of $0.5 and $4.0 tax provision for 2013 and 2012, respectively, and $3.9 tax benefit for 2011)
|
|||||||||||
|
Unrealized holding losses on available-for-sale securities
|
(12.3
|
)
|
(15.5
|
)
|
(5.8
|
)
|
|||||
|
Less: Reclassification for realized losses (gains) included in net income
|
12.8
|
|
22.5
|
|
(0.9
|
)
|
|||||
|
Net change in unrealized gains (losses) on available-for-sale securities
|
0.5
|
|
7.0
|
|
(6.7
|
)
|
|||||
|
Net unrealized (losses) gains on cash flow hedges (net of $300.0, $3.9 and $6.2 tax benefit for 2013, 2012 and 2011, respectively)
|
|||||||||||
|
(Decrease) increase in fair value of cash flow hedges
|
(333.6
|
)
|
350.4
|
|
291.9
|
|
|||||
|
Less: Reclassification for realized gains included in net income
|
(209.6
|
)
|
(298.6
|
)
|
(251.0
|
)
|
|||||
|
Net unrealized (losses) gains on cash flow hedges
|
(543.2
|
)
|
51.8
|
|
40.9
|
|
|||||
|
Postretirement plans and workers' compensation obligations (net of $121.7 and $43.9 tax provision for 2013 and 2012, respectively, and $63.4 tax benefit for 2011)
|
|||||||||||
|
Prior service (cost) credit for the period
|
(1.4
|
)
|
20.1
|
|
0.9
|
|
|||||
|
Net actuarial gain (loss) for the period
|
110.9
|
|
—
|
|
(150.1
|
)
|
|||||
|
Amortization of actuarial loss and prior service cost included in net income
|
95.7
|
|
55.4
|
|
40.5
|
|
|||||
|
Postretirement plan and workers' compensation obligations
|
205.2
|
|
75.5
|
|
(108.7
|
)
|
|||||
|
Foreign currency translation adjustment
|
(92.7
|
)
|
19.1
|
|
—
|
|
|||||
|
Other comprehensive (loss) income, net of income taxes
|
(430.2
|
)
|
153.4
|
|
(74.5
|
)
|
|||||
|
Comprehensive (loss) income
|
(942.8
|
)
|
(421.7
|
)
|
871.8
|
|
|||||
|
Less: Comprehensive income (loss) attributable to noncontrolling interests
|
12.3
|
|
10.6
|
|
(11.4
|
)
|
|||||
|
Comprehensive (loss) income attributable to common stockholders
|
$
|
(955.1
|
)
|
$
|
(432.3
|
)
|
$
|
883.2
|
|
||
See accompanying notes to consolidated financial statements
F -
3
PEABODY ENERGY CORPORATION
|
|
December 31,
|
||||||
|
|
2013
|
2012
|
|||||
|
(Amounts in millions,
except per share data)
|
|||||||
|
ASSETS
|
|||||||
|
Current assets
|
|
|
|
|
|||
|
Cash and cash equivalents
|
$
|
444.0
|
|
$
|
558.8
|
|
|
|
Accounts receivable, net of allowance for doubtful accounts of $7.4 at December 31, 2013 and $13.7 at December 31, 2012
|
557.9
|
|
737.8
|
|
|||
|
Inventories
|
506.7
|
|
548.4
|
|
|||
|
Assets from coal trading activities, net
|
36.1
|
|
52.4
|
|
|||
|
Deferred income taxes
|
66.4
|
|
56.4
|
|
|||
|
Other current assets
|
381.6
|
|
621.7
|
|
|||
|
Total current assets
|
1,992.7
|
|
2,575.5
|
|
|||
|
Property, plant, equipment and mine development, net
|
11,082.5
|
|
11,801.7
|
|
|||
|
Deferred income taxes
|
7.8
|
|
—
|
|
|||
|
Investments and other assets
|
1,050.4
|
|
1,431.8
|
|
|||
|
Total assets
|
$
|
14,133.4
|
|
$
|
15,809.0
|
|
|
|
LIABILITIES AND STOCKHOLDERS’ EQUITY
|
|||||||
|
Current liabilities
|
|
|
|
|
|||
|
Current maturities of long-term debt
|
$
|
31.7
|
|
$
|
47.8
|
|
|
|
Liabilities from coal trading activities, net
|
6.1
|
|
19.4
|
|
|||
|
Accounts payable and accrued expenses
|
1,737.7
|
|
1,606.9
|
|
|||
|
Total current liabilities
|
1,775.5
|
|
1,674.1
|
|
|||
|
Long-term debt, less current maturities
|
5,970.7
|
|
6,205.1
|
|
|||
|
Deferred income taxes
|
40.9
|
|
577.3
|
|
|||
|
Asset retirement obligations
|
712.8
|
|
687.5
|
|
|||
|
Accrued postretirement benefit costs
|
684.0
|
|
960.7
|
|
|||
|
Other noncurrent liabilities
|
1,001.6
|
|
765.5
|
|
|||
|
Total liabilities
|
10,185.5
|
|
10,870.2
|
|
|||
|
Stockholders’ equity
|
|
|
|
|
|||
|
Preferred Stock — $0.01 per share par value; 10.0 shares authorized, no shares issued or outstanding as of December 31, 2013 or December 31, 2012
|
—
|
|
—
|
|
|||
|
Perpetual Preferred Stock — 0.8 shares authorized, no shares issued or outstanding as of December 31, 2013 or December 31, 2012
|
—
|
|
—
|
|
|||
|
Series Common Stock — $0.01 per share par value; 40.0 shares authorized, no shares issued or outstanding as of December 31, 2013 or December 31, 2012
|
—
|
|
—
|
|
|||
|
Common Stock — $0.01 per share par value; 800.0 shares authorized, 283.9 shares issued and 270.1 shares outstanding as of December 31, 2013 and 282.3 shares issued and 268.6 shares outstanding as of December 31, 2012
|
2.8
|
|
2.8
|
|
|||
|
Additional paid-in capital
|
2,340.0
|
|
2,286.3
|
|
|||
|
Treasury stock, at cost — 13.8 shares as of December 31, 2013 and 13.7 shares as of December 31, 2012
|
(464.7
|
)
|
(461.6
|
)
|
|||
|
Retained earnings
|
2,449.8
|
|
3,066.4
|
|
|||
|
Accumulated other comprehensive (loss) income
|
(419.2
|
)
|
11.0
|
|
|||
|
Peabody Energy Corporation stockholders’ equity
|
3,908.7
|
|
4,904.9
|
|
|||
|
Noncontrolling interests
|
39.2
|
|
33.9
|
|
|||
|
Total stockholders’ equity
|
3,947.9
|
|
4,938.8
|
|
|||
|
Total liabilities and stockholders’ equity
|
$
|
14,133.4
|
|
$
|
15,809.0
|
|
|
See accompanying notes to consolidated financial statements
F -
4
PEABODY ENERGY CORPORATION
|
|
Year Ended December 31,
|
||||||||||
|
|
2013
|
2012
|
2011
|
||||||||
|
|
(Dollars in millions)
|
||||||||||
|
Cash Flows From Operating Activities
|
|
|
|
|
|
|
|||||
|
Net (loss) income
|
$
|
(512.6
|
)
|
$
|
(575.1
|
)
|
$
|
946.3
|
|
||
|
Loss from discontinued operations, net of income taxes
|
226.6
|
|
104.2
|
|
66.5
|
|
|||||
|
(Loss) income from continuing operations, net of income taxes
|
(286.0
|
)
|
(470.9
|
)
|
1,012.8
|
|
|||||
|
Adjustments to reconcile (loss) income from continuing operations, net of income taxes to net cash provided by operating activities:
|
|
|
|
|
|
|
|||||
|
Depreciation, depletion and amortization
|
740.3
|
|
663.4
|
|
474.3
|
|
|||||
|
Noncash interest expense
|
32.0
|
|
20.7
|
|
15.5
|
|
|||||
|
Deferred income taxes
|
(434.1
|
)
|
(2.6
|
)
|
180.6
|
|
|||||
|
Share-based compensation
|
50.9
|
|
45.4
|
|
43.9
|
|
|||||
|
Asset impairment and mine closure costs
|
528.3
|
|
929.0
|
|
—
|
|
|||||
|
Settlement charges related to the Patriot bankruptcy reorganization
|
30.6
|
|
—
|
|
—
|
|
|||||
|
Net gain on disposal or exchange of assets
|
(52.6
|
)
|
(17.1
|
)
|
(76.9
|
)
|
|||||
|
Loss from equity affiliates
|
40.2
|
|
61.2
|
|
19.2
|
|
|||||
|
Changes in current assets and liabilities:
|
|
|
|
|
|
|
|||||
|
Accounts receivable
|
104.8
|
|
285.3
|
|
(221.0
|
)
|
|||||
|
Accounts receivable securitization program
|
75.0
|
|
(125.0
|
)
|
—
|
|
|||||
|
Inventories
|
39.9
|
|
(112.9
|
)
|
(50.4
|
)
|
|||||
|
Net assets from coal trading activities
|
(83.7
|
)
|
125.2
|
|
172.4
|
|
|||||
|
Other current assets
|
3.1
|
|
10.3
|
|
(27.4
|
)
|
|||||
|
Accounts payable and accrued expenses
|
(108.9
|
)
|
(87.8
|
)
|
97.5
|
|
|||||
|
Monetization of foreign currency hedge positions
|
—
|
|
151.8
|
|
—
|
|
|||||
|
Asset retirement obligations
|
45.5
|
|
46.4
|
|
30.4
|
|
|||||
|
Workers’ compensation obligations
|
7.3
|
|
9.4
|
|
10.4
|
|
|||||
|
Accrued postretirement benefit costs
|
17.0
|
|
38.9
|
|
35.4
|
|
|||||
|
Accrued pension costs
|
51.8
|
|
32.4
|
|
(15.6
|
)
|
|||||
|
Other, net
|
(21.3
|
)
|
(3.3
|
)
|
(49.0
|
)
|
|||||
|
Net cash provided by continuing operations
|
780.1
|
|
1,599.8
|
|
1,652.1
|
|
|||||
|
Net cash used in discontinued operations
|
(57.7
|
)
|
(84.7
|
)
|
(18.9
|
)
|
|||||
|
Net cash provided by operating activities
|
722.4
|
|
1,515.1
|
|
1,633.2
|
|
|||||
|
Cash Flows From Investing Activities
|
|
|
|
|
|
|
|||||
|
Additions to property, plant, equipment and mine development
|
(328.4
|
)
|
(986.0
|
)
|
(847.4
|
)
|
|||||
|
Changes in accrued expenses related to capital expenditures
|
(120.7
|
)
|
104.7
|
|
51.2
|
|
|||||
|
Federal coal lease expenditures
|
(276.8
|
)
|
(276.5
|
)
|
(42.4
|
)
|
|||||
|
Investment in Prairie State Energy Campus
|
—
|
|
(10.7
|
)
|
(36.2
|
)
|
|||||
|
Proceeds from disposal of assets, net of notes receivable
|
178.3
|
|
147.9
|
|
40.1
|
|
|||||
|
Investments in equity affiliates and joint ventures
|
—
|
|
—
|
|
(39.7
|
)
|
|||||
|
Purchases of debt and equity securities
|
(22.8
|
)
|
(46.7
|
)
|
(147.7
|
)
|
|||||
|
Proceeds from sales and maturities of debt and equity securities
|
22.9
|
|
46.4
|
|
104.6
|
|
|||||
|
Purchases of short-term investments
|
—
|
|
(4.8
|
)
|
(100.0
|
)
|
|||||
|
Maturity of short-term investments
|
4.8
|
|
—
|
|
100.0
|
|
|||||
|
Acquisition of Macarthur Coal Limited, net of cash acquired
|
—
|
|
—
|
|
(2,756.7
|
)
|
|||||
|
Contributions to joint ventures
|
(671.7
|
)
|
(824.0
|
)
|
(145.4
|
)
|
|||||
|
Distributions from joint ventures
|
722.9
|
|
823.0
|
|
128.6
|
|
|||||
|
Advances to related parties
|
(42.1
|
)
|
(148.0
|
)
|
(371.3
|
)
|
|||||
|
Repayment of loans from related parties
|
25.2
|
|
110.8
|
|
331.7
|
|
|||||
|
Other, net
|
(5.8
|
)
|
(6.2
|
)
|
(6.6
|
)
|
|||||
|
Net cash used in continuing operations
|
(514.2
|
)
|
(1,070.1
|
)
|
(3,737.2
|
)
|
|||||
|
Net cash used in discontinued operations
|
(1.5
|
)
|
(22.0
|
)
|
(70.6
|
)
|
|||||
|
Net cash used in investing activities
|
(515.7
|
)
|
(1,092.1
|
)
|
(3,807.8
|
)
|
|||||
See accompanying notes to consolidated financial statements
F -
5
PEABODY ENERGY CORPORATION
CONSOLIDATED STATEMENTS OF CASH FLOWS - (Continued)
|
Year Ended December 31,
|
|||||||||||
|
2013
|
2012
|
2011
|
|||||||||
|
(Dollars in millions)
|
|||||||||||
|
Cash Flows From Financing Activities
|
|
|
|
|
|
|
|||||
|
Repayments of long-term debt
|
$
|
(1,390.2
|
)
|
$
|
(415.8
|
)
|
$
|
(263.9
|
)
|
||
|
Proceeds from long-term debt
|
1,188.0
|
|
0.8
|
|
4,101.4
|
|
|||||
|
Payment of debt issuance costs
|
(22.8
|
)
|
(6.9
|
)
|
(61.5
|
)
|
|||||
|
Dividends paid
|
(91.7
|
)
|
(91.9
|
)
|
(92.1
|
)
|
|||||
|
Common stock repurchase
|
—
|
|
(99.9
|
)
|
—
|
|
|||||
|
Repurchase of employee common stock relinquished for tax withholding
|
(3.1
|
)
|
(8.4
|
)
|
(18.7
|
)
|
|||||
|
Excess tax benefits related to share-based compensation
|
—
|
|
8.3
|
|
8.1
|
|
|||||
|
Acquisition of MCG Coal Holdings Pty Ltd noncontrolling interests
|
—
|
|
(49.8
|
)
|
—
|
|
|||||
|
Acquisition of PEAMCoal Pty Ltd noncontrolling interests
|
—
|
|
—
|
|
(1,994.8
|
)
|
|||||
|
Other, net
|
(1.7
|
)
|
0.3
|
|
—
|
|
|||||
|
Net cash (used in) provided by financing activities
|
(321.5
|
)
|
(663.3
|
)
|
1,678.5
|
|
|||||
|
Net change in cash and cash equivalents
|
(114.8
|
)
|
(240.3
|
)
|
(496.1
|
)
|
|||||
|
Cash and cash equivalents at beginning of year
|
558.8
|
|
799.1
|
|
1,295.2
|
|
|||||
|
Cash and cash equivalents at end of year
|
$
|
444.0
|
|
$
|
558.8
|
|
$
|
799.1
|
|
||
See accompanying notes to consolidated financial statements
F -
6
PEABODY ENERGY CORPORATION
CONSOLIDATED STATEMENTS OF CHANGES IN STOCKHOLDERS’ EQUITY
|
|
Peabody Energy Corporation Stockholders’ Equity
|
|
|
||||||||||||||||||||||||
|
Common
Stock
|
Additional
Paid-in
Capital
|
Treasury
Stock
|
Retained
Earnings
|
Accumulated
Other
Comprehensive
(Loss) Income
|
Noncontrolling
Interests
|
Total
Stockholders’
Equity
|
|||||||||||||||||||||
|
|
(Dollars in millions)
|
||||||||||||||||||||||||||
|
December 31, 2010
|
$
|
2.8
|
|
$
|
2,182.0
|
|
$
|
(334.6
|
)
|
$
|
2,878.4
|
|
$
|
(67.9
|
)
|
$
|
28.6
|
|
$
|
4,689.3
|
|
||||||
|
Net income (loss)
|
—
|
|
—
|
|
—
|
|
957.7
|
|
—
|
|
(11.4
|
)
|
946.3
|
|
|||||||||||||
|
Net change in unrealized losses on available-for-sale securities (net of $3.9 tax benefit)
|
—
|
|
—
|
|
—
|
|
—
|
|
(6.7
|
)
|
—
|
|
(6.7
|
)
|
|||||||||||||
|
Net unrealized gains on cash flow hedges (net of $6.2 tax benefit)
|
—
|
|
—
|
|
—
|
|
—
|
|
40.9
|
|
—
|
|
40.9
|
|
|||||||||||||
|
Postretirement plans and workers’ compensation obligations (net of $63.4 tax benefit)
|
—
|
|
—
|
|
—
|
|
—
|
|
(108.7
|
)
|
—
|
|
(108.7
|
)
|
|||||||||||||
|
Dividends paid
|
—
|
|
—
|
|
—
|
|
(92.1
|
)
|
—
|
|
—
|
|
(92.1
|
)
|
|||||||||||||
|
Share-based compensation
|
—
|
|
43.9
|
|
—
|
|
—
|
|
—
|
|
—
|
|
43.9
|
|
|||||||||||||
|
Excess tax benefits related to share-based compensation
|
—
|
|
8.1
|
|
—
|
|
—
|
|
—
|
|
—
|
|
8.1
|
|
|||||||||||||
|
Stock options exercised
|
—
|
|
4.8
|
|
—
|
|
—
|
|
—
|
|
—
|
|
4.8
|
|
|||||||||||||
|
Employee stock purchases
|
—
|
|
6.3
|
|
—
|
|
—
|
|
—
|
|
—
|
|
6.3
|
|
|||||||||||||
|
Repurchase of employee common stock relinquished for tax withholding
|
—
|
|
—
|
|
(18.7
|
)
|
—
|
|
—
|
|
—
|
|
(18.7
|
)
|
|||||||||||||
|
Macarthur Coal Limited noncontrolling interests at control date
|
—
|
|
—
|
|
—
|
|
—
|
|
—
|
|
2,011.9
|
|
2,011.9
|
|
|||||||||||||
|
Acquisition of PEAMCoal Pty Ltd noncontrolling interests
|
—
|
|
(11.1
|
)
|
—
|
|
—
|
|
—
|
|
(1,983.7
|
)
|
(1,994.8
|
)
|
|||||||||||||
|
Distributions to noncontrolling interests
|
—
|
|
—
|
|
—
|
|
—
|
|
—
|
|
(15.9
|
)
|
(15.9
|
)
|
|||||||||||||
|
Contributions from noncontrolling interests
|
—
|
|
—
|
|
—
|
|
—
|
|
—
|
|
1.2
|
|
1.2
|
|
|||||||||||||
|
December 31, 2011
|
$
|
2.8
|
|
$
|
2,234.0
|
|
$
|
(353.3
|
)
|
$
|
3,744.0
|
|
$
|
(142.4
|
)
|
$
|
30.7
|
|
$
|
5,515.8
|
|
||||||
|
Net (loss) income
|
—
|
|
—
|
|
—
|
|
(585.7
|
)
|
—
|
|
10.6
|
|
(575.1
|
)
|
|||||||||||||
|
Net change in unrealized gains on available-for-sale securities (net of $4.0 tax provision)
|
—
|
|
—
|
|
—
|
|
—
|
|
7.0
|
|
—
|
|
7.0
|
|
|||||||||||||
|
Net unrealized gains on cash flow hedges (net of $3.9 tax benefit)
|
—
|
|
—
|
|
—
|
|
—
|
|
51.8
|
|
—
|
|
51.8
|
|
|||||||||||||
|
Postretirement plans and workers’ compensation obligations (net of $43.9 tax provision)
|
—
|
|
—
|
|
—
|
|
—
|
|
75.5
|
|
—
|
|
75.5
|
|
|||||||||||||
|
Foreign currency translation adjustment
|
—
|
|
—
|
|
—
|
|
—
|
|
19.1
|
|
—
|
|
19.1
|
|
|||||||||||||
|
Dividends paid
|
—
|
|
—
|
|
—
|
|
(91.9
|
)
|
—
|
|
—
|
|
(91.9
|
)
|
|||||||||||||
|
Share-based compensation
|
—
|
|
45.4
|
|
—
|
|
—
|
|
—
|
|
—
|
|
45.4
|
|
|||||||||||||
|
Excess tax benefits related to share-based compensation
|
—
|
|
8.3
|
|
—
|
|
—
|
|
—
|
|
—
|
|
8.3
|
|
|||||||||||||
|
Stock options exercised
|
—
|
|
2.4
|
|
—
|
|
—
|
|
—
|
|
—
|
|
2.4
|
|
|||||||||||||
|
Employee stock purchases
|
—
|
|
7.0
|
|
—
|
|
—
|
|
—
|
|
—
|
|
7.0
|
|
|||||||||||||
|
Repurchase of employee common stock relinquished for tax withholding
|
—
|
|
—
|
|
(8.4
|
)
|
—
|
|
—
|
|
—
|
|
(8.4
|
)
|
|||||||||||||
|
Common stock repurchase
|
—
|
|
—
|
|
(99.9
|
)
|
—
|
|
—
|
|
—
|
|
(99.9
|
)
|
|||||||||||||
|
MCG Coal Holdings Pty Ltd noncontrolling interests at conversion
|
—
|
|
—
|
|
—
|
|
—
|
|
—
|
|
39.0
|
|
39.0
|
|
|||||||||||||
|
Acquisition of MCG Coal Holdings Pty Ltd noncontrolling interests
|
—
|
|
(10.8
|
)
|
—
|
|
—
|
|
—
|
|
(39.0
|
)
|
(49.8
|
)
|
|||||||||||||
|
Distributions to noncontrolling interests
|
—
|
|
—
|
|
—
|
|
—
|
|
—
|
|
(7.4
|
)
|
(7.4
|
)
|
|||||||||||||
|
December 31, 2012
|
$
|
2.8
|
|
$
|
2,286.3
|
|
$
|
(461.6
|
)
|
$
|
3,066.4
|
|
$
|
11.0
|
|
$
|
33.9
|
|
$
|
4,938.8
|
|
||||||
|
Net (loss) income
|
—
|
|
—
|
|
—
|
|
(524.9
|
)
|
—
|
|
12.3
|
|
(512.6
|
)
|
|||||||||||||
|
Net change in unrealized gains on available-for-sale-securities (net of $0.5 tax provision)
|
—
|
|
—
|
|
—
|
|
—
|
|
0.5
|
|
—
|
|
0.5
|
|
|||||||||||||
|
Net unrealized losses on cash flow hedges (net of $300.0 tax benefit)
|
—
|
|
—
|
|
—
|
|
—
|
|
(543.2
|
)
|
—
|
|
(543.2
|
)
|
|||||||||||||
|
Postretirement plans and workers compensation obligations (net of $121.7 tax provision)
|
—
|
|
—
|
|
—
|
|
—
|
|
205.2
|
|
—
|
|
205.2
|
|
|||||||||||||
|
Foreign currency translation adjustment
|
—
|
|
—
|
|
—
|
|
—
|
|
(92.7
|
)
|
—
|
|
(92.7
|
)
|
|||||||||||||
|
Dividends paid
|
—
|
|
—
|
|
—
|
|
(91.7
|
)
|
—
|
|
—
|
|
(91.7
|
)
|
|||||||||||||
|
Share-based compensation
|
—
|
|
50.9
|
|
—
|
|
—
|
|
—
|
|
—
|
|
50.9
|
|
|||||||||||||
|
Write-off of excess tax benefits related to share-based compensation
|
—
|
|
(4.5
|
)
|
—
|
|
—
|
|
—
|
|
—
|
|
(4.5
|
)
|
|||||||||||||
|
Stock options exercised
|
—
|
|
1.0
|
|
—
|
|
—
|
|
—
|
|
—
|
|
1.0
|
|
|||||||||||||
|
Employee stock purchases
|
—
|
|
6.3
|
|
—
|
|
—
|
|
—
|
|
—
|
|
6.3
|
|
|||||||||||||
|
Repurchase of employee common stock relinquished for tax withholding
|
—
|
|
—
|
|
(3.1
|
)
|
—
|
|
—
|
|
—
|
|
(3.1
|
)
|
|||||||||||||
|
Distributions to noncontrolling interests
|
—
|
|
—
|
|
—
|
|
—
|
|
—
|
|
(7.0
|
)
|
(7.0
|
)
|
|||||||||||||
|
December 31, 2013
|
$
|
2.8
|
|
$
|
2,340.0
|
|
$
|
(464.7
|
)
|
$
|
2,449.8
|
|
$
|
(419.2
|
)
|
$
|
39.2
|
|
$
|
3,947.9
|
|
||||||
See accompanying notes to consolidated financial statements
F -
7
PEABODY ENERGY CORPORATION
NOTES TO CONSOLIDATED FINANCIAL STATEMENTS
|
(1)
|
Summary of Significant Accounting Policies
|
Basis of Presentation
The consolidated financial statements include the accounts of Peabody Energy Corporation (the Company) and its affiliates. Interests in subsidiaries controlled by the Company are consolidated with any outside shareholder interests reflected as noncontrolling interests, except when the Company has an undivided interest in an unincorporated joint venture. In those cases, the Company includes its proportionate share in the assets, liabilities, revenues and expenses of the jointly controlled entities within each applicable line item of the consolidated financial statements. All intercompany transactions, profits and balances have been eliminated in consolidation. Certain amounts from prior years have been reclassified to conform with 2013 presentation.
Description of Business
The Company is engaged in the mining of thermal coal for sale primarily to electric utilities and metallurgical coal for sale to industrial customers. The Company’s mining operations are located in the United States (U.S.) and Australia, including an equity-affiliate mining operation in Australia. The Company also markets and brokers coal from other coal producers, both as principal and agent, and trades coal and freight-related contracts through trading and business offices in China, Australia, the United Kingdom, Germany, Singapore, India, Indonesia and the U.S. The Company’s other energy-related commercial activities include participating in operations of a mine-mouth coal-fueled generating plant, managing its coal reserve and real estate holdings and supporting the development of Btu Conversion and clean coal technologies.
Newly Adopted Accounting Standards and Accounting Standards Not Yet Implemented
Presentation of Unrecognized Tax Benefits
In July 2013, the Financial Accounting Standards Board (FASB) issued accounting guidance requiring entities to present unrecognized tax benefits as a reduction to any related deferred tax assets for net operating losses, similar tax losses or tax credit carryforwards if such settlement is required or expected in the event an uncertain tax position is disallowed. Currently effective U.S. GAAP does not provide explicit guidance on the topic. The new presentation guidance will become effective for interim and annual periods beginning after December 15, 2013 (January 1, 2014 for the Company). While the adoption of this guidance may impact the presentation of unrecognized tax benefits in the Company's consolidated balance sheet, it will not affect the Company's results of operations, financial condition or cash flows.
Balance Sheet Offsetting
In December 2011, the FASB issued accounting guidance, which was further clarified in January 2013, requiring additional information intended to help reconcile existing differences in balance sheet offsetting requirements under U.S. GAAP and International Financial Reporting Standards. While this standard leaves existing guidance surrounding the offsetting of financial assets and liabilities unchanged, it requires several additional disclosures, including gross and net information about instruments and transactions eligible for offset in the balance sheet and instruments and transactions subject to a master netting arrangement or a similar agreement. The guidance applies to the Company's derivatives, which include both non-coal trading derivative financial instruments held for risk management purposes and derivative contracts associated with the Company's trading and brokerage activities. The guidance became effective for the Company for interim and annual reporting periods beginning on or after January 1, 2013. While the adoption of this guidance impacted the Company's disclosures, it did not affect the Company's results of operations, financial condition or cash flows.
F -
8
PEABODY ENERGY CORPORATION
NOTES TO CONSOLIDATED FINANCIAL STATEMENTS — (Continued)
Non-Coal Trading Derivatives.
The Company's non-coal trading derivative financial instruments are transacted in over-the-counter (OTC) markets with financial institutions under International Swaps and Derivatives Association (ISDA) Master Agreements. Those agreements contain symmetrical default provisions which allow for the net settlement of amounts owed by either counterparty in the event of default or contract termination. The Company offsets its non-coal trading asset and liability derivative positions on a counterparty-by-counterparty basis in the consolidated balance sheets, with the fair values of those respective derivatives reflected in “Other current assets,” “Investments and other assets,” “Accounts payable and accrued expenses” and “Other noncurrent liabilities." Though the symmetrical default provisions associated with the Company's non-coal trading derivatives exist at the overall counterparty level across its foreign currency, diesel fuel and explosives hedging strategy derivative contract portfolios, it is the Company's accounting policy to apply counterparty offsetting separately within those derivative contract portfolios for presentation in the consolidated balance sheets because that application is more consistent with the fact that the Company generally net settles its non-coal trading derivatives with each counterparty by derivative contract portfolio on a routine basis.
Coal Trading Derivatives.
The Company's coal trading assets and liabilities include financial instruments, such as swaps, futures and options, cleared through various commodities exchanges, which involve the daily net settlement of closed positions. The Company is required to post cash collateral, known as variation margin, on exchange-cleared positions that are in a net liability position and entitled to receive variation margin when in a net asset position. The Company also transacts in coal trading financial swaps and options through OTC markets with financial institutions and other non-financial trading entities under ISDA Master Agreements, which contain symmetrical default provisions. Certain of the Company's coal trading agreements with OTC counterparties also contain credit support provisions that may periodically require the Company to post, or entitle the Company to receive, variation margin. Physical coal and freight-related purchase and sale contracts included in the Company's coal trading assets and liabilities are executed pursuant to master purchase and sale agreements that also contain symmetrical default provisions and allow for the netting and setoff of receivables and payables that arise during the same time period. The Company offsets its coal trading asset and liability derivative positions, and variation margin related to those positions, on a counterparty-by-counterparty basis in the consolidated balance sheets, with the fair values of those respective derivatives reflected in “Assets from coal trading activities, net” and “Liabilities from coal trading activities, net."
Refer to Note 6. "Derivatives and Fair Value Measurements" and Note 7. "Coal Trading" herein for the additional quantitative disclosures related to this guidance.
Accumulated Other Comprehensive Income
In June 2011, the FASB issued accounting guidance, which was finalized in February 2013, that introduced new disclosure requirements requesting that entities provide additional information about reclassification adjustments out of accumulated other comprehensive income, including changes in accumulated other comprehensive income balances by component and significant reclassification items. The new disclosure requirements became effective for interim and annual reporting periods beginning after December 15, 2012 (January 1, 2013 for the Company). While the adoption of this guidance impacted the Company's disclosures, it did not affect the Company's results of operations, financial condition or cash flows. Refer to Note 19. "Accumulated Other Comprehensive (Loss) Income" herein for the additional disclosures related to this guidance.
Sales
The Company’s revenue from coal sales is realized and earned when risk of loss passes to the customer. Under the typical terms of the Company’s coal supply agreements, title and risk of loss transfer to the customer at the mine or port, where coal is loaded to the transportation source(s) that serves each of the Company’s mines. The Company incurs certain “add-on” taxes and fees on coal sales. Reported coal sales include taxes and fees charged by various federal and state governmental bodies and the freight charged on destination customer contracts.
Other Revenues
Other revenues include net revenues from coal trading activities as discussed in Note 7. "Coal Trading," as well as coal sales revenues that were derived from the Company’s mining operations and sold through the Company’s coal trading business. Also included are revenues from contract termination or restructuring payments, royalties related to coal lease agreements, sales agency commissions, farm income, property and facility rentals and generation development activities. Royalty income generally results from the lease or sublease of mineral rights to third parties, with payments based upon a percentage of the selling price or an amount per ton of coal produced.
F -
9
PEABODY ENERGY CORPORATION
NOTES TO CONSOLIDATED FINANCIAL STATEMENTS — (Continued)
Discontinued Operations and Assets Held for Sale
The Company classifies items within discontinued operations in the consolidated financial statements when the operations and cash flows of a particular component of the Company have been (or will be) eliminated from the ongoing operations of the Company as a result of a disposal (by sale or otherwise) and the Company will no longer have any significant continuing involvement in the operation of that component. Refer to Note 3. "Discontinued Operations" for additional details related to discontinued operations.
Cash and Cash Equivalents
Cash and cash equivalents are stated at cost, which approximates fair value. Cash equivalents consist of highly liquid investments with original maturities of
three months or less
.
Inventories
Coal is reported as inventory at the point in time the coal is extracted from the mine. Raw coal represents coal stockpiles that may be sold in current condition or may be further processed prior to shipment to a customer. Saleable coal represents coal stockpiles which require no further processing prior to shipment to a customer.
Coal inventory is valued at the lower of average cost or market. Coal inventory costs include labor, supplies, equipment (including depreciation thereto), operating overhead and other related costs. Market represents the estimated net realizable value of the inventory, which considers the projected future sales price of the particular coal product, less applicable selling costs, and, in the case of raw coal, estimated remaining processing costs. The valuation of coal inventory is subject to several additional estimates, including those related to ground and aerial surveys used to measure quantities and processing recovery rates.
Materials and supplies inventory is valued at the lower of average cost or market, less a reserve for obsolete or surplus items. This reserve incorporates several factors, such as anticipated usage, inventory turnover and inventory levels.
Investments in Marketable Securities
The Company’s short-term investments in marketable securities, which are included in "Other current assets" in the consolidated balance sheets, are defined as those investments with original maturities of greater than three months and up to one year. Long-term investments, which are included in "Investments and other assets" in the consolidated balance sheets, are defined as those investments with original maturities greater than one year.
The Company classifies its investments in debt securities as either held-to-maturity or available-for-sale at the time of purchase and reevaluates such designation periodically. Such investments are classified as held-to-maturity when the Company has the intent and ability to hold the securities to maturity. Investments in debt securities not classified as held-to-maturity and investments in marketable equity securities are classified as available-for-sale. Available-for-sale securities are carried at fair value, with unrealized gains and losses, net of income taxes, generally reported in “Accumulated other comprehensive (loss) income” in the consolidated balance sheets. Realized gains and losses, determined on a specific identification method, are included in “Interest income” in the consolidated statements of operations.
At each reporting date, the Company performs separate evaluations of its marketable securities to determine if any unrealized losses present are other-than-temporary. Such evaluations involve the consideration of several factors, including, but not limited to, the length of time the market value has been less than cost, the financial condition and near-term prospects of the issuer of the securities and whether the Company has the positive intent and ability to hold the securities until recovery. Refer to Note 2. "Asset Impairment and Mine Closure Costs" and Note 5. "Investments" for details regarding other-than-temporary impairment losses of
$21.5 million
and
$35.5 million
recognized during the years ended
December 31, 2013
and 2012, respectively, related to the Company's marketable equity securities holdings. There were
no
other-than-temporary impairment losses recorded during the year ended December 31,
2011
.
Property, Plant, Equipment and Mine Development
Property, plant, equipment and mine development are recorded at cost. Interest costs applicable to major asset additions are capitalized during the construction period. Capitalized interest in
2013
,
2012
and
2011
was immaterial. Expenditures which extend the useful lives of existing plant and equipment assets are capitalized. Maintenance and repairs are charged to operating costs as incurred. Costs incurred to develop coal mines or to expand the capacity of operating mines are capitalized. Costs incurred to maintain current production capacity at a mine are charged to operating costs as incurred. Costs to acquire computer hardware and the development and/or purchase of software for internal use are capitalized and depreciated over the estimated useful lives.
F -
10
PEABODY ENERGY CORPORATION
NOTES TO CONSOLIDATED FINANCIAL STATEMENTS — (Continued)
Coal reserves are recorded at cost, or at fair value in the case of nonmonetary exchanges of reserves or business acquisitions.
Depletion of coal reserves and amortization of advance royalties is computed using the units-of-production method utilizing only proven and probable reserves (as adjusted for recoverability factors) in the depletion base. Mine development costs are principally amortized over the estimated lives of the mines using the straight-line method. Depreciation of plant and equipment is computed using the straight-line method over the shorter of the asset's estimated useful life or the life of the mine. The estimated useful lives by category of assets are as follows:
|
|
|
|
Years
|
|
Building and improvements
|
|
|
1 to 38
|
|
Machinery and equipment
|
|
|
1 to 38
|
|
Leasehold improvements
|
|
|
Shorter of Useful Life or Remaining Life of Lease
|
Equity and Cost Method Investments
The Company accounts for its investments in less than majority owned corporate joint ventures under either the equity or cost method. The Company applies the equity method to investments in joint ventures when it has the ability to exercise significant influence over the operating and financial policies of the joint venture. Investments accounted for under the equity method are initially recorded at cost and any difference between the cost of the Company’s investment and the underlying equity in the net assets of the joint venture at the investment date is amortized over the lives of the related assets that gave rise to the difference. The Company’s pro-rata share of the operating results of joint ventures and basis difference amortization is reported in the consolidated statements of operations in “Loss from equity affiliates.” Similarly, the Company's pro-rata share of the cumulative foreign currency translation adjustment of its equity method investments whose functional currency is not the U.S. dollar is reported in the consolidated balances sheet as a component of "Accumulated other comprehensive (loss) income," with periodic changes thereto reflected in the consolidated statements of comprehensive income.
The Company monitors its equity and cost method investments for indicators that a decrease in investment value has occurred that is other than temporary. Examples of such indicators include a sustained history of operating losses and adverse changes in earnings and cash flow outlook. In the absence of quoted market prices for an investment, discounted cash flow projections are used to assess fair value, the underlying assumptions to which are generally considered unobservable Level 3 inputs under the fair value hierarchy. If the fair value of an investment is determined to be below its carrying value and that loss in fair value is deemed other than temporary, an impairment loss is recognized. Refer to Note 2. "Asset Impairment and Mine Closure Costs" and Note 5. "Investments" for details regarding other-than-temporary impairment losses of
$43.2 million
and
$39.4 million
recorded during the years ended December 31, 2013 and 2012, respectively, related to certain of the Company's equity and cost method investments.
No
such impairment losses were recorded during the year ended December 31, 2011.
Asset Retirement Obligations
The Company’s asset retirement obligation (ARO) liabilities primarily consist of spending estimates for surface land reclamation and support facilities at both surface and underground mines in accordance with applicable reclamation laws in the U.S. and Australia as defined by each mining permit.
The Company estimates its ARO liabilities for final reclamation and mine closure based upon detailed engineering calculations of the amount and timing of the future cash spending for a third party to perform the required work. Spending estimates are escalated for inflation and then discounted at the credit-adjusted, risk-free rate. The Company records an ARO asset associated with the discounted liability for final reclamation and mine closure. The obligation and corresponding asset are recognized in the period in which the liability is incurred. The ARO asset is amortized on the units-of-production method over its expected life and the ARO liability is accreted to the projected spending date. As changes in estimates occur (such as mine plan revisions, changes in estimated costs or changes in timing of the performance of reclamation activities), the revisions to the obligation and asset are recognized at the appropriate credit-adjusted, risk-free rate. The Company also recognizes an obligation for contemporaneous reclamation liabilities incurred as a result of surface mining. Contemporaneous reclamation consists primarily of grading, topsoil replacement and re-vegetation of backfilled pit areas.
Contingent Liabilities
From time to time, the Company is subject to legal and environmental matters related to our continuing and discontinued operations and certain historical, non-coal producing operations. In connection with such matters, the Company is required to assess the likelihood of any adverse judgments or outcomes, as well as potential ranges of probable losses.
F -
11
PEABODY ENERGY CORPORATION
NOTES TO CONSOLIDATED FINANCIAL STATEMENTS — (Continued)
A determination of the amount of reserves required for these matters is made after considerable analysis of each individual issue. The Company accrues for legal and environmental matters within "Operating costs and expenses" when it is probable that a liability has been incurred and the amount of the loss can be reasonably estimated. Adjustments to contingent liabilities are made when additional information becomes available that affects the amount of estimated loss, which information may include changes in facts and circumstances, changes in interpretations of law in the relevant courts, the results of new or updated environmental remediation cost studies and the ongoing consideration of trends in environmental remediation costs.
Accrued contingent liabilities exclude claims against third parties and are not discounted. The current portion of these accruals is included in “Accounts payables and accrued expenses” and the long-term portion is included in “Other noncurrent liabilities” in the consolidated balance sheets. In general, legal fees related to environmental remediation and litigation are charged to expense. The Company includes the interest component of any litigation-related penalties within "Interest expense" in the consolidated statements of operations.
Income Taxes
Income taxes are accounted for using a balance sheet approach. The Company accounts for deferred income taxes by applying statutory tax rates in effect at the reporting date of the balance sheet to differences between the book and tax basis of assets and liabilities. A valuation allowance is established if it is “more likely than not” that the related tax benefits will not be realized. In determining the appropriate valuation allowance, the Company considers the projected realization of tax benefits based on expected levels of future taxable income, available tax planning strategies, reversals of existing taxable temporary differences and taxable income in carryback years.
The Company recognizes the tax benefit from uncertain tax positions only if it is “more likely than not” the tax position will be sustained on examination by the taxing authorities based on the technical merits of the position. The tax benefits recognized from such a position are measured based on the largest benefit that has a
greater than fifty percent likelihood of being realized upon ultimate settlement
. To the extent the Company’s assessment of such tax positions changes, the change in estimate will be recorded in the period in which the determination is made. Tax-related interest and penalties are classified as a component of income tax expense.
Postretirement Health Care and Life Insurance Benefits
The Company accounts for postretirement benefits other than pensions by accruing the costs of benefits to be provided over the employees’ period of active service. These costs are determined on an actuarial basis. The Company’s consolidated balance sheets reflect the accumulated postretirement benefit obligations of its postretirement benefit plans. The Company accounts for changes in its postretirement benefit obligations as a settlement when an irrevocable action has been effected that relieves the Company of its actuarially-determined liability to individual plan participants and removes substantial risk surrounding the nature, amount and timing of the obligation’s funding and the assets used to effect the settlement. See Note 15. "Postretirement Health Care and Life Insurance Benefits" for information related to postretirement benefits.
Pension Plans
The Company sponsors non-contributory defined benefit pension plans accounted for by accruing the cost to provide the benefits over the employees’ period of active service. These costs are determined on an actuarial basis. The Company’s consolidated balance sheets reflect the funded status of the defined benefit pension plans. See Note 16. "Pension and Savings Plans" for information related to pension plans.
Derivatives
The Company recognizes at fair value all contracts meeting the definition of a derivative as assets or liabilities in the consolidated balance sheets, with the exception of certain coal trading contracts for which the Company has elected to apply a normal purchases and normal sales exception.
Gains or losses on derivative financial instruments designated as cash flow hedges are recorded as a separate component of stockholders’ equity until the hedged transaction occurs (or until hedge ineffectiveness is determined), at which time gains or losses are reclassified to earnings. To the extent that the periodic changes in the fair value of a derivative exceeds the corresponding changes in the hedged item, the ineffective portion of the periodic non-cash changes are recorded in earnings in the period of the change. If the hedge ceases to qualify for hedge accounting, the Company prospectively recognizes the mark-to-market movements in earnings in the period of the change. The potential for hedge ineffectiveness is present in the design of certain of the Company’s cash flow hedge relationships and is discussed in detail in Note 6. "Derivatives and Fair Value Measurements" and Note 7. "Coal Trading." Gains or losses from derivative financial instruments designated as fair value hedges are recognized immediately in earnings, along with the offsetting gain or loss related to the underlying hedged item.
F -
12
PEABODY ENERGY CORPORATION
NOTES TO CONSOLIDATED FINANCIAL STATEMENTS — (Continued)
The Company’s asset and liability derivative positions are offset on a counterparty-by-counterparty basis if the contractual agreement provides for the net settlement of contracts with the counterparty in the event of default or termination of any one contract.
Non-derivative contracts and derivative contracts for which the Company has elected to apply the normal purchases and normal sales exception are accounted for on an accrual basis.
Business Combinations
The Company accounts for business combinations using the purchase method of accounting. The purchase method requires the Company to determine the fair value of all acquired assets, including identifiable intangible assets and all assumed liabilities. The total cost of acquisitions is allocated to the underlying identifiable net assets, based on their respective estimated fair values. Determining the fair value of assets acquired and liabilities assumed requires management's judgment and the utilization of independent valuation experts, and often involves the use of significant estimates and assumptions, including assumptions with respect to future cash inflows and outflows, discount rates and asset lives, among other items.
Use of Estimates in the Preparation of the Consolidated Financial Statements
The preparation of financial statements in conformity with U.S. GAAP requires management to make estimates and assumptions that affect the reported amounts of assets and liabilities and disclosure of contingent assets and liabilities at the date of the financial statements and reported amounts of revenues and expenses during the reporting period. Actual results could differ from those estimates.
Impairment of Long-Lived Assets
The Company evaluates its long-lived assets held and used in operations for impairment as events and changes in circumstances indicate that the carrying amount of such assets might not be recoverable. Factors that would indicate potential impairment to be present include, but are not limited to, a sustained history of operating or cash flow losses, an unfavorable change in earnings and cash flow outlook, prolonged adverse industry or economic trends and a significant adverse change in the extent or manner in which a long-lived asset is being used or in its physical condition. The Company generally does not view short-term declines in thermal and metallurgical coal prices in the markets in which it sells those products as a triggering event for conducting impairment tests because such markets have a history of price volatility. However, the Company generally does view a sustained trend of depressed coal market pricing (for example, over periods exceeding one year) as an indicator of potential impairment.
Assets are grouped at the lowest level for which there are identifiable cash flows that are largely independent of the cash flows of other groups of assets. For its active mining operations, the Company generally groups such assets at the mine level, or the mining complex level for mines that share infrastructure, with the exception of impairment evaluations triggered by mine closures. In those cases involving mine closures, the related assets are evaluated at the individual asset level for remaining economic life based on transferability to ongoing operating sites and for use in reclamation-related activities, or for expected salvage. For its development and exploration properties and portfolio of surface land and coal reserve holdings, the Company considers several factors to determine whether to evaluate those assets individually or on a grouped basis for purposes of impairment testing. Such factors include geographic proximity to one another, the expectation of shared infrastructure upon development based on future mining plans and whether it would be most advantageous to bundle such assets in the event of sale to a third party.
When indicators of impairment are present, the Company evaluates its long-lived assets for recoverability by comparing the estimated undiscounted cash flows expected to be generated by those assets under various assumptions to their carrying amounts. If such undiscounted cash flows indicate that the carrying value of the asset group is not recoverable, impairment losses are measured by comparing the estimated fair value of the asset group to its carrying amount. As quoted market prices are unavailable for the Company's individual mining operations, fair value is determined through the use of an expected present value technique based on the income approach, except for non-strategic coal reserves and surface lands, in which case a market approach is utilized. The estimated future cash flows and underlying assumptions used to assess recoverability and, if necessary, measure the fair value of the Company's long-lived mining assets are derived from those developed in connection with the Company's planning and budgeting process. The Company believes its assumptions to be consistent with those a market participant would use for valuation purposes. The most critical assumptions underlying the Company's projections and fair value estimates include those surrounding future tons sold, coal prices for unpriced coal, production costs (including costs for labor, commodity supplies and contractors), transportation costs, foreign currency exchange rates, a risk-adjusted, after-tax cost of capital and market multiples for non-strategic coal reserves and surface lands, all of which generally constitute unobservable Level 3 inputs under the fair value hierarchy.
F -
13
PEABODY ENERGY CORPORATION
NOTES TO CONSOLIDATED FINANCIAL STATEMENTS — (Continued)
Refer to Note 2. "Asset Impairment and Mine Closure Costs" for details regarding impairment charges of
$463.6 million
and
$833.6 million
recognized during the years ended
December 31, 2013
and
2012
, respectively, related to long-lived assets. There were
no
impairment losses recorded during the year ended December 31,
2011
.
Fair Value
For assets and liabilities that are recognized or disclosed at fair value in the consolidated financial statements, the Company defines fair value as the price that would be received to sell an asset or paid to transfer a liability in an orderly transaction between market participants at the measurement date.
Foreign Currency
Functional currency is determined by the primary economic environment in which an entity operates, which for the Company's foreign operations is generally the U.S. dollar because sales prices in international coal markets and the Company's sources of financing those operations is denominated in that currency. Accordingly, substantially all of the Company’s consolidated foreign subsidiaries utilize the U.S. dollar as their functional currency. Monetary assets and liabilities are remeasured at year-end exchange rates while non-monetary items are remeasured at historical rates. Income and expense accounts are remeasured at the average rates in effect during the year, except for those expenses related to balance sheet amounts that are remeasured at historical exchange rates. Gains and losses from foreign currency remeasurement related to tax balances are included as a component of "Income tax (benefit) provision," while all other remeasurement gains and losses are included in "Operating costs and expenses." The total impact of foreign currency remeasurement on the consolidated statements of operations was a net gain of
$34.1 million
and
$4.8 million
for the years ended December 31, 2013 and 2012, respectively, and a net loss of
$0.9 million
for the year ended December 31, 2011.
The Middlemount Mine, in which the Company owns a
50%
equity interest, utilizes the Australian dollar as its functional currency. Accordingly, the assets and liabilities of that equity investee are translated to U.S. dollars at the year-end exchange rate and income and expense accounts are translated at the average rate in effect during the year. The Company's pro-rata share of the translation gains and losses of the equity investee are recorded as a component of "Accumulated other comprehensive (loss) income." Australian dollar denominated shareholder loans to the Middlemount Mine, which are long term in nature, are considered part of the Company's net investment in that operation. Accordingly, foreign currency gains or losses on those loans are recorded as a component of foreign currency translation adjustment. The Company recorded a foreign currency translation loss of
$92.7 million
and a gain of
$19.1 million
for the years ended December 31, 2013 and 2012, respectively.
No
foreign currency translation gains or losses occurred in 2011.
Share-Based Compensation
The Company accounts for share-based compensation at the grant date fair value of awards and recognizes the related expense over the vesting period of the awards. See Note 18. "Share-Based Compensation" for information related to share-based compensation.
Exploration and Drilling Costs
Exploration expenditures are charged to operating costs as incurred, including costs related to drilling and study costs incurred to convert or upgrade mineral resources to reserves.
Advance Stripping Costs
Pre-production.
At existing surface operations, additional pits may be added to increase production capacity in order to meet customer requirements. These expansions may require significant capital to purchase additional equipment, expand the workforce, build or improve existing haul roads and create the initial pre-production box cut to remove overburden (that is, advance stripping costs) for new pits at existing operations. If these pits operate in a separate and distinct area of the mine, the costs associated with initially uncovering coal (that is, advance stripping costs incurred for the initial box cuts) for production are capitalized and amortized over the life of the developed pit consistent with coal industry practices.
Post-production.
Advance stripping costs related to post-production are expensed as incurred. Where new pits are routinely developed as part of a contiguous mining sequence, the Company expenses such costs as incurred. The development of a contiguous pit typically reflects the planned progression of an existing pit, thus maintaining production levels from the same mining area utilizing the same employee group and equipment.
F -
14
PEABODY ENERGY CORPORATION
NOTES TO CONSOLIDATED FINANCIAL STATEMENTS — (Continued)
|
(2)
|
Asset Impairment and Mine Closure Costs
|
Year Ended December 31, 2013
The following costs are reflected in "Asset impairment and mine closure costs" in the consolidated statement of operations for the year ended December 31, 2013:
|
Reportable Segment
|
||||||||||||
|
Australian
Mining
|
Corporate
and Other
|
Consolidated
|
||||||||||
|
|
(Dollars in millions)
|
|||||||||||
|
Asset impairment charges:
|
||||||||||||
|
Long-lived assets
|
390.8
|
|
72.8
|
|
463.6
|
|
||||||
|
Equity method investment
|
—
|
|
43.2
|
|
43.2
|
|
||||||
|
Marketable securities
|
—
|
|
21.5
|
|
21.5
|
|
||||||
|
Total
|
$
|
390.8
|
|
$
|
137.5
|
|
$
|
528.3
|
|
|||
Long-Lived Assets
Australian Mining.
In 2013, the Company observed continued weakness in seaborne metallurgical and thermal coal pricing that has persisted longer than the Company previously anticipated and a downward trend in transaction prices observed in international coal industry asset sales. Accordingly, the Company determined indicators of long-lived asset impairment to be present associated with its Australian Mining segment assets and conducted a review of those assets for recoverability. Based on that evaluation, the Company determined that the long-lived assets of one of its active surface mines that produces metallurgical and thermal coal, one of its surface mining development projects that the Company now instead intends to proceed with as an underground operation and an exploration tenement were not recoverable, in whole or in part, and correspondingly recognized an aggregate impairment charge of
$390.8 million
to write each of those assets down from their carrying value to their estimated fair value. In addition to the impairment indicators surrounding the Australian Mining segment as a whole, the fair value of the impaired surface mining operation was affected by a short remaining economic life compared to those of other operations and site-specific adverse changes in 2013 surrounding realized coal quality yields, contractor performance and contract mining terms, the latter of which were amended during the fourth quarter of that period. The Company determined the fair value of the exploration tenement based on an indicative sale offer received in December 2013, which constitutes a Level 2 input under the fair value hierarchy. That sale was executed in January 2014.
Western and Midwestern U.S. Mining.
Based on a trend of sustained depressed domestic coal prices, a year-over-year decline in U.S. coal production and observed low transaction prices observed in domestic coal industry asset sales, the Company determined indicators of impairment to be present associated with its Western and Midwestern U.S. Mining segment assets and reviewed those assets for recoverability. As a result of that assessment, the Company determined that no impairment was present in 2013 related to those assets.
Corporate and Other.
In December 2013, contract mining at a coal reserve property in the Eastern U.S. substantially ended upon completion of mining within the existing permit area and new permits were not obtained for the remaining reserves at that property due to new permitting conditions that the Company deemed unacceptable and projected poor near-term economic performance. As a result of that decision and a lack of observed interest from certain financial and strategic buyers in acquiring the remaining coal reserves, the Company recorded an impairment charge of
$66.3 million
to write down the carrying value of the related reserves. Also, due to the adverse coal industry conditions previously noted, the Company reviewed its portfolio of surface land and coal reserve holdings for indicators of impairment in 2013. In connection with that review, the Company determined the carrying value of one of its coal reserve holdings leased to a third-party underground miner to not be fully recoverable and recognized an impairment charge of
$6.5 million
to write down the carrying value of those reserves to their estimated fair value.
Risks and Uncertainties.
Because of the volatile and cyclical nature of U.S. and international coal market conditions, it is reasonably possible that the Company's estimate of expected future cash flows may change in the near term, which may result in the need for further adjustments to the carrying value of the Company's long-lived mining assets in the future.
F -
15
PEABODY ENERGY CORPORATION
NOTES TO CONSOLIDATED FINANCIAL STATEMENTS — (Continued)
Mine Closures
Wilkie Creek Mine.
In December 2013, the Company approved a decision to cease production at the Wilkie Creek Mine in the Surat Basin in Queensland, Australia, and commence with the closure of that mine. The results of that mine are reported as a discontinued operation for all periods presented because the operations and cash flows of the mine have been eliminated from the ongoing operations of the Company as a result of its closure. Refer to Note 3. "Discontinued Operations" for additional details regarding charges recognized during the year ended
December 31, 2013
associated with this mine closure.
Equity Method Investment
Refer to Note 5. "Investments" for additional details surrounding an other-than-temporary impairment charge of
$43.2 million
recognized in 2013 associated with the Company's
50%
equity interest in Middlemount Coal Pty Ltd. (Middlemount), which owns the Middlemount Mine in Queensland, Australia.
Marketable Securities
Refer to Note 5. "Investments" for additional details surrounding an other-than-temporary impairment charge of
$21.5 million
recorded during the second quarter of 2013 related to the Company's investment in Winsway Coking Coal Holdings Limited (Winsway) marketable equity securities.
Year Ended December 31, 2012
The following costs are reflected in "Asset impairment and mine closure costs" in the consolidated statement of operations for the year ended December 31, 2012:
|
Reportable Segment
|
||||||||||||||||||||
|
Australian
Mining
|
Western
U.S. Mining
|
Midwestern
U.S. Mining
|
Corporate
and Other
|
Consolidated
|
||||||||||||||||
|
|
(Dollars in millions)
|
|||||||||||||||||||
|
Charges related to mine closures:
|
||||||||||||||||||||
|
Impairment of long-lived assets
|
$
|
—
|
|
$
|
—
|
|
$
|
26.9
|
|
$
|
—
|
|
$
|
26.9
|
|
|||||
|
Acceleration of asset retirement obligations
|
—
|
|
—
|
|
7.1
|
|
—
|
|
7.1
|
|
||||||||||
|
Employee termination benefits
|
—
|
|
—
|
|
6.7
|
|
—
|
|
6.7
|
|
||||||||||
|
Other
|
—
|
|
—
|
|
4.3
|
|
—
|
|
4.3
|
|
||||||||||
|
Other asset impairment charges:
|
|
|
||||||||||||||||||
|
Long-lived assets
|
806.7
|
|
—
|
|
—
|
|
—
|
|
806.7
|
|
||||||||||
|
Marketable securities
|
—
|
|
—
|
|
—
|
|
35.5
|
|
35.5
|
|
||||||||||
|
Cost method investments
|
—
|
|
—
|
|
—
|
|
39.4
|
|
39.4
|
|
||||||||||
|
Other
|
—
|
|
2.4
|
|
—
|
|
—
|
|
2.4
|
|
||||||||||
|
Total
|
$
|
806.7
|
|
$
|
2.4
|
|
$
|
45.0
|
|
$
|
74.9
|
|
$
|
929.0
|
|
|||||
Long-Lived Assets
Australian Mining.
Due to a general weakening in international coal market conditions, a sustained trend of depressed seaborne metallurgical and thermal coal prices and a persistent strengthening of the Australian dollar compared to the U.S. dollar during 2012, the Company determined indicators of long-lived asset impairment to be present associated with its Australian Mining segment assets and conducted a review of those assets for recoverability in December 2012. Based on that evaluation, the Company determined that the long-lived assets of three of its surface mines that produce metallurgical coal (in whole or in part) were not fully recoverable and recognized an impairment charge of
$806.7 million
to write each of those mines down from their carrying value to their estimated fair value.
F -
16
PEABODY ENERGY CORPORATION
NOTES TO CONSOLIDATED FINANCIAL STATEMENTS — (Continued)
Mine Closures
Willow Lake Mine.
In November 2012, the Company announced the permanent closure of its Willow Lake Mine in Illinois due to a continued failure by the site to meet standards for safety, compliance and operating performance deemed acceptable by the Company. Because the performance obligations under the customer coal supply agreements previously serviced by the site were migrated to other mines within the Western and Midwestern U.S. Mining segments, the Willow Lake Mine continued to be classified in continuing operations for all periods presented. The results of that mine, prior to closing, were included in the Midwestern U.S. Mining segment. The Company recognized total charges of
$45.0 million
in the fourth quarter of 2012 in connection with the shutdown of this mine, which were primarily related to the impairment of long-lived assets, an acceleration in the timing of asset retirement obligations and employee termination benefits.
Air Quality Mine.
In September 2012, the Company announced it had permanently ceased production at its Air Quality Mine in Indiana due to uneconomic market conditions for the type of coal product previously produced at that site. The results of that mine, which were previously included within the Midwestern U.S. Mining reportable segment, have been reported as a discontinued operation for all periods presented because the operations and cash flows of the mine and the related coal product was eliminated from the ongoing operations of the Company as a result of the mine closure. Refer to Note 3. "Discontinued Operations" for additional details regarding charges recognized during the year ended December 31, 2012 associated with this mine closure.
Marketable Securities
Refer to Note 5. "Investments" for additional details surrounding an other-than-temporary impairment charge of
$35.5 million
recorded during the fourth quarter of 2012 related to the Company's investment in Winsway marketable equity securities.
Cost Method Investments
During the year ended December 31, 2012, the Company evaluated the commercial viability of the partnership projects underlying certain of its investments accounted for under the cost method due to adverse changes in the operating and regulatory environment surrounding those projects. As a result of that review, the Company concluded there to be significant doubt as to the ability of those projects to continue development and recorded an aggregate charge of
$39.4 million
in 2012 to fully impair the carrying value of those investments.
|
(3)
|
Discontinued Operations
|
Discontinued operations include former Australian Mining and Midwestern U.S. Mining segment assets that have ceased production and other previously divested operations.
Summarized Results of Discontinued Operations
Results from discontinued operations were as follows during the years ended
December 31, 2013
,
2012
and
2011
:
|
Year Ended December 31,
|
||||||||||||
|
2013
|
2012
|
2011
|
||||||||||
|
(Dollars in millions)
|
||||||||||||
|
Total revenues
|
$
|
136.5
|
|
$
|
229.1
|
|
$
|
200.1
|
|
|||
|
Loss from discontinued operations before income taxes
|
$
|
(329.7
|
)
|
$
|
(163.9
|
)
|
$
|
(88.8
|
)
|
|||
|
Income tax benefit
|
103.1
|
|
59.7
|
|
22.3
|
|
||||||
|
Loss from discontinued operations, net of income taxes
|
$
|
(226.6
|
)
|
$
|
(104.2
|
)
|
$
|
(66.5
|
)
|
|||
Loss from discontinued operations for the year ended December 31, 2013 included before- and after-tax charges of
$98.0 million
and
$61.8 million
, respectively, associated with the settlement of claims and litigation related to the bankruptcy reorganization of Patriot Coal Corporation (Patriot). Refer to Note 25. "Matters Related to the Bankruptcy of Patriot Coal Corporation" for additional information surrounding those matters.
F -
17
PEABODY ENERGY CORPORATION
NOTES TO CONSOLIDATED FINANCIAL STATEMENTS — (Continued)
Asset Impairment and Mine Closure Costs Related to Discontinued Operations
Wilkie Creek Mine.
Reflected in the results from discontinued operations for the year ended December 31, 2013 are total before- and after-tax charges of
$167.4 million
and
$117.2 million
, respectively, including before- and after-tax impairment charges of
$107.0 million
and
$74.9 million
, respectively, recognized in connection with the Company's previous efforts to sell the Wilkie Creek Mine in Queensland, Australia and the ultimate shutdown of that site. Mine closure-related charges related to Wilkie Creek that are expected to result in future cash expenditures included
$34.5 million
for potential port and rail take-or-pay contractual liabilities,
$21.1 million
for the acceleration in the timing of asset retirement obligations and
$4.8 million
for other charges. The Company expects the majority of those expenditures to occur in 2014, except for those related to asset retirement obligations, for which the Company expects reclamation procedures to continue through 2020.
Air Quality Mine.
Reflected in the results from discontinued operations for the y
ear ended
December 31, 2012
are total before- and after-tax charges of
$116.7 million
and
$75.0 million
, respectively, including before- and after-tax impairment charges of
$108.9 million
and
$68.8 million
, respectively, recognized in connection with the shutdown of the Air Quality Mine in Indiana.
Refer to Note 2. "Asset Impairment and Mine Closure Costs" for additional details surrounding these mine closures.
Assets and Liabilities of Discontinued Operations
Assets and liabilities classified as discontinued operations included in the Company's consolidated balance sheets were as follows:
|
December 31,
|
||||||||
|
2013
|
2012
|
|||||||
|
(Dollars in millions)
|
||||||||
|
Assets:
|
||||||||
|
Other current assets
|
$
|
38.6
|
|
$
|
37.5
|
|
||
|
Investments and other assets
|
47.4
|
|
140.8
|
|
||||
|
Total assets classified as discontinued operations
|
$
|
86.0
|
|
$
|
178.3
|
|
||
|
Liabilities:
|
||||||||
|
Accounts payable and accrued expenses
|
$
|
127.8
|
|
$
|
33.3
|
|
||
|
Other noncurrent liabilities
|
90.2
|
|
27.1
|
|
||||
|
Total liabilities classified as discontinued operations
|
$
|
218.0
|
|
$
|
60.4
|
|
||
|
(4)
|
Inventories
|
Inventories consisted of the following:
|
|
December 31,
|
||||||
|
|
2013
|
2012
|
|||||
|
|
(Dollars in millions)
|
||||||
|
Materials and supplies
|
$
|
166.8
|
|
$
|
157.6
|
|
|
|
Raw coal
|
122.6
|
|
164.3
|
|
|||
|
Saleable coal
|
217.3
|
|
226.5
|
|
|||
|
Total
|
$
|
506.7
|
|
$
|
548.4
|
|
|
Materials and supplies inventories presented above have been shown net of reserves of
$7.4 million
and
$16.0 million
as of
December 31, 2013
and
2012
, respectively.
F -
18
PEABODY ENERGY CORPORATION
NOTES TO CONSOLIDATED FINANCIAL STATEMENTS — (Continued)
|
(5)
|
Investments
|
Investments in Marketable Securities
Investments in available-for-sale securities at
December 31, 2013
were as follows:
|
Available-for-sale securities
|
Amortized Cost
|
Gross
Unrealized
Gains
|
Gross
Unrealized
Losses
|
Fair Value
|
||||||||||||
|
|
(Dollars in millions)
|
|||||||||||||||
|
Current:
|
|
|
|
|
||||||||||||
|
Federal government securities
|
$
|
2.8
|
|
$
|
—
|
|
$
|
—
|
|
$
|
2.8
|
|
||||
|
U.S. corporate bonds
|
2.4
|
|
—
|
|
—
|
|
2.4
|
|
||||||||
|
Noncurrent:
|
|
|
|
|
||||||||||||
|
Marketable equity securities
|
10.9
|
|
1.3
|
|
—
|
|
12.2
|
|
||||||||
|
Federal government securities
|
28.8
|
|
—
|
|
(0.1
|
)
|
28.7
|
|
||||||||
|
U.S. corporate bonds
|
20.8
|
|
0.1
|
|
—
|
|
20.9
|
|
||||||||
|
Total
|
$
|
65.7
|
|
$
|
1.4
|
|
$
|
(0.1
|
)
|
$
|
67.0
|
|
||||
Investments in available-for-sale securities at
December 31, 2012
were as follows:
|
Available-for-sale securities
|
Amortized Cost
|
Gross
Unrealized
Gains
|
Gross
Unrealized
Losses
|
Fair Value
|
||||||||||||
|
|
|
(Dollars in millions)
|
|
|||||||||||||
|
Current:
|
|
|
|
|
||||||||||||
|
U.S. corporate bonds
|
4.1
|
|
—
|
|
—
|
|
4.1
|
|
||||||||
|
Noncurrent:
|
|
|
||||||||||||||
|
Marketable equity securities
|
32.4
|
|
—
|
|
—
|
|
32.4
|
|
||||||||
|
Federal government securities
|
32.0
|
|
0.2
|
|
—
|
|
32.2
|
|
||||||||
|
U.S. corporate bonds
|
19.5
|
|
0.2
|
|
—
|
|
19.7
|
|
||||||||
|
Total
|
$
|
88.0
|
|
$
|
0.4
|
|
$
|
—
|
|
$
|
88.4
|
|
||||
Contractual maturities for available-for-sale investments in debt securities at
December 31, 2013
were as shown below. Expected maturities will differ from contractual maturities because borrowers may have the right to call or prepay obligations with or without call or prepayment penalties.
|
Contractual maturities for available-for-sale securities
|
Cost
|
Fair Value
|
||||||
|
|
(Dollars in millions)
|
|||||||
|
Due in one year or less
|
$
|
5.2
|
|
$
|
5.2
|
|
||
|
Due in one to five years
|
49.6
|
|
49.6
|
|
||||
|
Total
|
$
|
54.8
|
|
$
|
54.8
|
|
||
The Company’s investments in marketable equity securities consist of an investment in Winsway.
Proceeds from sales and maturities of available-for-sale debt securities amounted to
$22.9 million
,
$17.2 million
and
$52.8 million
for the years ended
December 31, 2013
,
2012
and
2011
, respectively. The Company realized net gains associated with those sales and maturities of
$0.2 million
,
$0.1 million
and
$1.6 million
for the years ended
December 31, 2013
,
2012
and
2011
, respectively.
F -
19
PEABODY ENERGY CORPORATION
NOTES TO CONSOLIDATED FINANCIAL STATEMENTS — (Continued)
In addition to the securities described above, the Company previously held investments in debt and equity securities related to the Company's pro-rata share of funding in the Newcastle Coal Infrastructure Group (NCIG), which was included in "Investments and other assets" in the consolidated balance sheets. The debt securities were recorded at cost, which approximated fair value, and were denominated in U.S. dollars. The Company received proceeds from the sale of NCIG debt and equity securities of
$29.2 million
and
$51.8 million
for the years ended December 31, 2012 and 2011, respectively. The Company recognized a loss on these sales of
$0.2 million
and
$0.4 million
for the years ended December 31, 2012 and 2011, respectively. There were
no
NCIG securities held during the year ended
December 31, 2013
.
At each reporting date, the Company performs separate evaluations of debt and equity securities to determine if any unrealized losses are other-than-temporary. In connection with Winsway's historical credit downgrades, which occurred in the second quarter of 2013 and fourth quarter of 2012 and due to the duration and severity of the market losses incurred at those times, the Company recognized respective other-than-temporary impairment losses of
$21.5 million
and
$35.5 million
during those periods, each time resetting the cost basis of the Company's investment. Since the second quarter of 2013, the fair value of the Company's investment in Winsway equity securities increased by
$1.3 million
above its new cost basis. That unrealized gain, net of income taxes, is reported in "Accumulated other comprehensive (loss) income" as of December 31, 2013.
In November 2012, the Company purchased
$4.8 million
of time deposits denominated in Chinese Renminbi with six month maturities. These investments are classified as held-to-maturity investments which are recorded at amortized cost and are included in "Other current assets" in the consolidated balance sheets at December 31, 2012. Proceeds from the maturity of these investments amounted to
$4.8 million
in the year ended December 31, 2013. The Company had
no
held-to-maturity securities at December 31, 2013.
Equity Method Investments
The Company’s equity method investments include its joint venture interest in the Middlemount, which was acquired in connection with the 2011 acquisition of PEA-PCI (formerly Macarthur Coal Limited), in addition to certain other equity method investments. The table below summarizes the book value of those investments, which is reported in “Investments and other assets” in the consolidated balance sheets, and the related loss from equity affiliates:
|
Book Value at December 31,
|
Loss from Equity
Affiliates for the Year Ended
December 31,
|
||||||||||||||||||
|
|
2013
|
2012
|
2013
|
2012
|
2011
|
||||||||||||||
|
|
(Dollars in millions)
|
||||||||||||||||||
|
Equity interest in Middlemount Coal Pty Ltd
|
$
|
173.4
|
|
$
|
295.9
|
|
$
|
33.5
|
|
$
|
52.1
|
|
$
|
7.3
|
|
||||
|
Other equity method investments
|
6.7
|
|
2.7
|
|
6.7
|
|
9.1
|
|
11.9
|
|
|||||||||
|
Total equity method investments
|
$
|
180.1
|
|
$
|
298.6
|
|
$
|
40.2
|
|
$
|
61.2
|
|
$
|
19.2
|
|
||||
Due to sustained weakness in seaborne metallurgical coal prices that have persisted longer than the Company previously anticipated, a history of operating losses at the mine and the magnitude of the difference between the estimated fair value and the carrying value of its equity investment, the Company determined the carrying value of its equity investment in Middlemount to be other-than-temporarily impaired as of December 31, 2013, in spite of a successful owner-operator conversion completed in 2013 and an ongoing series of operational efficiency initiatives being conducted at the site aimed at improving Middlemount's cost structure. Correspondingly, the Company recorded an impairment charge of
$43.2 million
during the year ended December 31, 2013 to write down the carrying value of its equity investment, which has been reflected in "Asset impairment and mine closure costs" in the consolidated statement of operations for that period.
The reset carrying value of the Company's equity interest in Middlemount Coal Pty Ltd, reflected in the table above, includes a remaining unamortized difference between the carrying value of that investment and the underlying equity in the net assets of the joint venture of
$100.4 million
as of
December 31, 2013
.
In addition to its equity method investment, the Company periodically makes loans to Middlemount pursuant to the related shareholders' agreement. Refer to Note 8. "Financing Receivables" for addition details surrounding those loans.
F -
20
PEABODY ENERGY CORPORATION
NOTES TO CONSOLIDATED FINANCIAL STATEMENTS — (Continued)
|
(6)
|
Derivatives and Fair Value Measurements
|
Risk Management — Non Coal Trading Activities
The Company is exposed to various types of risk in the normal course of business, including foreign currency exchange rate risk for non-U.S. dollar expenditures and balances, price risk on commodities utilized in the Company's mining operations and interest rate risk on long-term debt. The Company manages commodity price risk (excluding coal trading activities) related to the sale of coal, in part, through the use of long-term coal supply agreements (those with terms longer than one year), rather than through the use of derivative instruments. In order to manage its exposure related to price risk on certain commodities used in production, as well as for foreign currency exchange rate and interest rate risk, the Company utilizes derivative financial instruments. These risks are actively monitored in an effort to ensure compliance with the risk management policies of the Company.
Foreign Currency Hedges.
The Company is exposed to foreign currency exchange rate risk, primarily on Australian dollar expenditures made in its Australian Mining segment. This risk is managed through the use of forward contracts and options that the Company designates as cash flow hedges, with the objective of reducing the variability of cash flows associated with forecasted foreign currency expenditures.
Diesel Fuel and Explosives Hedges.
The Company is exposed to commodity price risk associated with diesel fuel and explosives utilized in production in the U.S. and Australia. This risk is managed through the use of derivatives, primarily swaps, and to a lesser extent through the use of cost pass-through contracts. The Company generally designates the swap contracts as cash flow hedges, with the objective of reducing the variability of cash flows associated with forecasted diesel fuel and explosives purchases.
Interest Rate Swaps.
The Company is exposed to interest rate risk on its fixed rate and variable rate long-term debt. From time to time, the Company manages the interest rate risk associated with the fair value of its fixed rate borrowings using fixed-to-floating interest rate swaps to effectively convert a portion of the underlying cash flows on the debt into variable rate cash flows. The Company designates these swaps as fair value hedges, with the objective of hedging against adverse changes in the fair value of the fixed rate debt that result from market interest rate changes. In addition, from time to time, interest rate risk associated with the Company’s variable rate borrowings is managed using floating-to-fixed interest rate swaps. The Company designates these swaps as cash flow hedges, with the objective of reducing the variability of cash flows associated with market interest rate changes. As of
December 31, 2013
, the Company had
no
interest rate swaps in place.
Notional Amounts and Fair Value.
The following summarizes the Company’s foreign currency and commodity positions at
December 31, 2013
:
|
|
Notional Amount by Year of Maturity
|
||||||||||||||||||
|
Total
|
2014
|
2015
|
2016
|
2017
|
|||||||||||||||
|
Foreign Currency
|
|
|
|
|
|
|
|
|
|
|
|||||||||
|
A$:US$ hedge contracts (A$ millions)
|
$
|
5,203.6
|
|
$
|
2,074.5
|
|
$
|
1,645.1
|
|
$
|
997.0
|
|
$
|
487.0
|
|
||||
|
Commodity Contracts
|
|
|
|
|
|
|
|
|
|
|
|||||||||
|
Diesel fuel hedge contracts (million gallons)
|
203.7
|
|
101.0
|
|
68.6
|
|
34.1
|
|
—
|
|
|||||||||
|
U.S. explosives hedge contracts (million MMBtu)
|
1.2
|
|
1.2
|
|
—
|
|
—
|
|
—
|
|
|||||||||
|
|
Account Classification by
|
|
||||||||||||||
|
Cash
Flow
Hedge
|
Fair
Value
Hedge
|
Economic
Hedge
|
Fair Value
Asset (Liability)
|
|||||||||||||
|
|
|
|
|
(Dollars in millions)
|
||||||||||||
|
Foreign Currency
|
|
|
|
|
|
|
|
|
||||||||
|
A$:US$ hedge contracts (A$ millions)
|
$
|
5,203.6
|
|
$
|
—
|
|
$
|
—
|
|
$
|
(473.3
|
)
|
||||
|
Commodity Contracts
|
|
|
|
|
|
|
|
|
||||||||
|
Diesel fuel hedge contracts (million gallons)
|
203.7
|
|
—
|
|
—
|
|
6.4
|
|
||||||||
|
U.S. explosives hedge contracts (million MMBtu)
|
1.2
|
|
—
|
|
—
|
|
(1.3
|
)
|
||||||||
F -
21
PEABODY ENERGY CORPORATION
NOTES TO CONSOLIDATED FINANCIAL STATEMENTS — (Continued)
Based on the net fair value of the Company’s non-coal trading commodity contract hedge positions held in “Accumulated other comprehensive (loss) income” at
December 31, 2013
, the Company expects to reclassify an unrealized net gain associated with the Company’s diesel fuel hedge programs of approximately
$6 million
and an unrealized net loss associated with the Company's explosives hedge programs of approximately
$1 million
from comprehensive income into earnings over the next 12 months. Based on net unrealized losses associated with the Company's foreign currency hedge contract portfolio and realized gains related to foreign currency cash flow hedge contracts monetized in the fourth quarter of 2012 held in "Accumulated other comprehensive (loss) income" at
December 31, 2013
, the net loss expected to be reclassified from comprehensive income to earnings over the next 12 months associated with that hedge program is approximately
$75 million
. As these realized and unrealized gains and losses are associated with derivative instruments that represent hedges of forecasted transactions, the amounts reclassified to earnings are expected to partially offset the effect of the realized underlying transactions.
Hedge Ineffectiveness.
The Company assesses, both at inception and at least quarterly thereafter, whether the derivatives used in hedging activities are highly effective at offsetting the changes in the anticipated cash flows of the hedged item. The effective portion of the change in the fair value is recorded in “Accumulated other comprehensive (loss) income” until the hedged transaction impacts reported earnings, at which time any gain or loss is reclassified to earnings. To the extent that periodic changes in the fair value of derivatives deemed highly effective exceeds such changes in the hedged item, the ineffective portion of the periodic non-cash changes are recorded in earnings in the period of the change. If the hedge ceases to qualify for hedge accounting, the Company prospectively recognizes changes in the fair value of the instrument in earnings in the period of the change.
A measure of ineffectiveness is inherent in hedging future diesel fuel purchases with derivative positions based on refined petroleum products as a result of location and/or product differences. Transportation surcharges, which may vary over time, for purchased diesel fuel in certain regions can also result in ineffectiveness, though such surcharges have historically changed infrequently and comprise a small portion of the total cost of delivered diesel.
The Company’s derivative positions for the hedging of future explosives purchases are based on natural gas, which is the primary price component of explosives. However, a small measure of ineffectiveness exists as the contractual purchase price includes manufacturing fees that are subject to periodic adjustments. In addition, other fees, such as storage and transportation surcharges, can result in ineffectiveness, but have historically changed infrequently and comprise a small portion of the total explosives cost.
The Company’s derivative positions for the hedging of forecasted foreign currency expenditures contain a small measure of ineffectiveness due to timing differences between the hedge settlement and the purchase transaction, which could differ by less than a day and up to a maximum of 30 days.
The tables below show the classification and amounts of pre-tax gains and losses related to the Company’s non-coal trading hedges during the years ended
December 31, 2013
,
2012
and
2011
:
|
|
|
Year Ended December 31, 2013
|
||||||||||||||||
|
Income Statement Classification
Gains (Losses) - Realized |
Gain
recognized in
income on non-
designated
derivatives
|
Gain (loss)
recognized in
other
comprehensive
income on
derivative
(effective portion)
|
Gain
reclassified
from other
comprehensive
income into
income (effective
portion)
|
Loss
reclassified
from other
comprehensive
income into
income
(ineffective
portion)
|
||||||||||||||
|
Financial Instrument
|
||||||||||||||||||
|
|
|
(Dollars in millions)
|
||||||||||||||||
|
Commodity swaps and
options |
Operating costs and expenses
|
$
|
—
|
|
$
|
12.5
|
|
$
|
11.9
|
|
$
|
(0.5
|
)
|
|||||
|
Foreign currency forward contracts
|
Operating costs and expenses
|
—
|
|
(597.8
|
)
|
162.4
|
|
—
|
|
|||||||||
|
Total
|
|
$
|
—
|
|
$
|
(585.3
|
)
|
$
|
174.3
|
|
$
|
(0.5
|
)
|
|||||
F -
22
PEABODY ENERGY CORPORATION
NOTES TO CONSOLIDATED FINANCIAL STATEMENTS — (Continued)
|
|
|
Year Ended December 31, 2012
|
||||||||||||||||
|
Income Statement Classification
Gains (Losses) - Realized |
Gain
recognized in
income on non-
designated
derivatives
|
Gain
recognized in
other
comprehensive
income on
derivative
(effective portion)
|
Gain
reclassified
from other
comprehensive
income into
income
(effective
portion)
|
Gain
reclassified
from other
comprehensive
income into
income
(ineffective
portion)
|
||||||||||||||
|
Financial Instrument
|
||||||||||||||||||
|
|
|
(Dollars in millions)
|
||||||||||||||||
|
Commodity swaps and
options |
Operating costs and expenses
|
$
|
—
|
|
$
|
14.5
|
|
$
|
48.3
|
|
$
|
(4.7
|
)
|
|||||
|
Foreign currency forward contracts
|
Operating costs and expenses
|
—
|
|
148.0
|
|
351.7
|
|
—
|
|
|||||||||
|
Total
|
|
$
|
—
|
|
$
|
162.5
|
|
$
|
400.0
|
|
$
|
(4.7
|
)
|
|||||
|
|
|
Year Ended December 31, 2011
|
||||||||||||||||
|
Income Statement Classification
Gains (Losses) - Realized
|
Loss
recognized in
income on non-
designated
derivatives
|
Gain (loss)
recognized in
other
comprehensive
income on
derivative
(effective portion)
|
Gain (loss)
reclassified
from other
comprehensive
income into
income
(effective
portion)
|
Loss
reclassified
from other
comprehensive
income into
income
(ineffective
portion)
|
||||||||||||||
|
Financial Instrument
|
||||||||||||||||||
|
|
|
(Dollars in millions)
|
||||||||||||||||
|
Commodity swaps and
options |
Operating costs and expenses
|
$
|
—
|
|
$
|
30.7
|
|
$
|
42.7
|
|
$
|
4.8
|
|
|||||
|
Foreign currency forward contracts
|
||||||||||||||||||
|
- Operating costs
|
Operating costs and expenses
|
—
|
|
193.4
|
|
342.2
|
|
—
|
|
|||||||||
|
- Capital expenditures
|
Depreciation, depletion and amortization
|
—
|
|
(0.5
|
)
|
—
|
|
—
|
|
|||||||||
|
Foreign currency economic hedge contracts
(1)
|
Acquisition costs related to PEA-PCI
|
(32.8
|
)
|
—
|
|
—
|
|
—
|
|
|||||||||
|
Total
|
|
$
|
(32.8
|
)
|
$
|
223.6
|
|
$
|
384.9
|
|
$
|
4.8
|
|
|||||
|
(1)
|
Relates to foreign currency contracts associated with the 2011 acquisition of Macarthur Coal Limited (PEA-PCI).
|
Cash Flow Presentation.
The Company classifies the cash effects of its non-coal trading derivatives within the "Cash Flows From Operating Activities" section of the consolidated statements of cash flows during the period of settlement for those instruments. In November 2012, with the Australian dollar trading at elevated levels against the U.S. dollar, the Company terminated certain of its Australian dollar forward contracts in exchange for aggregate realized cash proceeds of
$151.8 million
. Prior to discontinuation, those contracts comprised an aggregate notional amount of
A$1.9 billion
originally contracted for settlement during 2014 and 2015 and were designated as cash flow hedges of Australian dollar expenditures forecasted to occur at those times. Upon termination, the Company executed at-market Australian dollar forward contracts with notional amounts and forward settlement dates identical to the terminated contracts and designated those replacement contracts as cash flow hedges of the anticipated future Australian dollar expenditures previously hedged by the terminated contracts. Because those forecasted expenditures remained probable of occurring as of
December 31, 2013
, the Company continued to reflect the effective portion of the realized gains on the terminated forward contracts in "Accumulated other comprehensive (loss) income" at that date and expects to reclassify those gains to earnings in conjunction with the occurrence of the related hedged expenditures during 2014 and 2015.
F -
23
PEABODY ENERGY CORPORATION
NOTES TO CONSOLIDATED FINANCIAL STATEMENTS — (Continued)
Offsetting and Balance Sheet Presentation
The classification and amount of non-coal trading derivative financial instruments presented on a gross and net basis as of
December 31, 2013
and
2012
are presented in the tables that follow.
|
|
Fair Value of Assets as of December 31, 2013
|
|||||||||||||||||||
|
|
Gross Amounts Recognized
|
Gross Amounts Offset in the Consolidated Balance Sheet
|
Net Amounts Presented in the Consolidated Balance Sheet
|
Derivatives Not Offset in the Consolidated Balance Sheet
(1)
|
Net Amount
|
|||||||||||||||
|
Financial Instrument
|
||||||||||||||||||||
|
|
(Dollars in millions)
|
|||||||||||||||||||
|
Current Assets:
|
||||||||||||||||||||
|
Commodity swap contracts
|
$
|
8.7
|
|
$
|
(2.3
|
)
|
$
|
6.4
|
|
n.a.
|
|
n.a.
|
|
|||||||
|
Foreign currency forward contracts
|
—
|
|
—
|
|
—
|
|
n.a.
|
|
n.a.
|
|
||||||||||
|
Total
|
$
|
8.7
|
|
$
|
(2.3
|
)
|
$
|
6.4
|
|
$
|
(5.0
|
)
|
$
|
1.4
|
|
|||||
|
Noncurrent Assets:
|
||||||||||||||||||||
|
Commodity swap contracts
|
$
|
2.8
|
|
$
|
(0.9
|
)
|
$
|
1.9
|
|
n.a.
|
|
n.a.
|
|
|||||||
|
Foreign currency forward contracts
|
0.2
|
|
(0.2
|
)
|
—
|
|
n.a.
|
|
n.a.
|
|
||||||||||
|
Total
|
$
|
3.0
|
|
$
|
(1.1
|
)
|
$
|
1.9
|
|
$
|
(1.3
|
)
|
$
|
0.6
|
|
|||||
|
(1)
|
Adjustments relate to the further netting of derivative contracts with a common counterparty across the Company's foreign currency, diesel fuel and explosives hedging strategy derivative contract portfolios that would be contractually enforceable in the event of default.
|
|
|
Fair Value of Liabilities as of December 31, 2013
|
|||||||||||||||||||
|
|
Gross Amounts Recognized
|
Gross Amounts Offset in the Consolidated Balance Sheet
|
Net Amounts Presented in the Consolidated Balance Sheet
|
Derivatives Not Offset in the Consolidated Balance Sheet
(1)
|
Net Amount
|
|||||||||||||||
|
Financial Instrument
|
||||||||||||||||||||
|
|
(Dollars in millions)
|
|||||||||||||||||||
|
Current Liabilities:
|
||||||||||||||||||||
|
Commodity swap contracts
|
$
|
3.9
|
|
$
|
(1.9
|
)
|
$
|
2.0
|
|
n.a.
|
|
n.a.
|
|
|||||||
|
Foreign currency forward contracts
|
211.9
|
|
—
|
|
211.9
|
|
n.a.
|
|
n.a.
|
|
||||||||||
|
Total
|
$
|
215.8
|
|
$
|
(1.9
|
)
|
$
|
213.9
|
|
$
|
(5.4
|
)
|
$
|
208.5
|
|
|||||
|
Noncurrent Liabilities:
|
||||||||||||||||||||
|
Commodity swap contracts
|
$
|
2.5
|
|
$
|
(1.3
|
)
|
$
|
1.2
|
|
n.a.
|
|
n.a.
|
|
|||||||
|
Foreign currency forward contracts
|
261.6
|
|
(0.2
|
)
|
261.4
|
|
n.a.
|
|
n.a.
|
|
||||||||||
|
Total
|
$
|
264.1
|
|
$
|
(1.5
|
)
|
$
|
262.6
|
|
$
|
(0.9
|
)
|
$
|
261.7
|
|
|||||
|
(1)
|
Adjustments relate to the further netting of derivative contracts with a common counterparty across the Company's foreign currency, diesel fuel and explosives hedging strategy derivative contract portfolios that would be contractually enforceable in the event of default.
|
F -
24
PEABODY ENERGY CORPORATION
NOTES TO CONSOLIDATED FINANCIAL STATEMENTS — (Continued)
|
|
Fair Value of Assets as of December 31, 2012
|
|||||||||||||||||||
|
|
Gross Amounts Recognized
|
Gross Amounts Offset in the Consolidated Balance Sheet
|
Net Amounts Presented in the Consolidated Balance Sheet
|
Derivatives Not Offset in the Consolidated Balance Sheet
(1)
|
Net Amount
|
|||||||||||||||
|
Financial Instrument
|
||||||||||||||||||||
|
|
(Dollars in millions)
|
|||||||||||||||||||
|
Current Assets:
|
||||||||||||||||||||
|
Commodity swap contracts
|
$
|
18.3
|
|
$
|
(3.8
|
)
|
$
|
14.5
|
|
n.a.
|
|
n.a.
|
|
|||||||
|
Foreign currency forward contracts
|
260.1
|
|
—
|
|
260.1
|
|
n.a.
|
|
n.a.
|
|
||||||||||
|
Total
|
$
|
278.4
|
|
$
|
(3.8
|
)
|
$
|
274.6
|
|
$
|
(8.0
|
)
|
$
|
266.6
|
|
|||||
|
Noncurrent Assets:
|
||||||||||||||||||||
|
Commodity swap contracts
|
$
|
2.5
|
|
$
|
(1.4
|
)
|
$
|
1.1
|
|
n.a.
|
|
n.a.
|
|
|||||||
|
Foreign currency forward contracts
|
27.6
|
|
(0.8
|
)
|
26.8
|
|
n.a.
|
|
n.a.
|
|
||||||||||
|
Total
|
$
|
30.1
|
|
$
|
(2.2
|
)
|
$
|
27.9
|
|
$
|
(3.4
|
)
|
$
|
24.5
|
|
|||||
|
(1)
|
Adjustments relate to the further netting of derivative contracts with a common counterparty across the Company's foreign currency, diesel fuel and explosives hedging strategy derivative contract portfolios that would be contractually enforceable in the event of default.
|
|
|
Fair Value of Liabilities as of December 31, 2012
|
|||||||||||||||||||
|
|
Gross Amounts Recognized
|
Gross Amounts Offset in the Consolidated Balance Sheet
|
Net Amounts Presented in the Consolidated Balance Sheet
|
Derivatives Not Offset in the Consolidated Balance Sheet
(1)
|
Net Amount
|
|||||||||||||||
|
Financial Instrument
|
||||||||||||||||||||
|
|
(Dollars in millions)
|
|||||||||||||||||||
|
Current Liabilities:
|
||||||||||||||||||||
|
Commodity swap contracts
|
$
|
8.5
|
|
$
|
(2.8
|
)
|
$
|
5.7
|
|
n.a.
|
|
n.a.
|
|
|||||||
|
Foreign currency forward contracts
|
—
|
|
—
|
|
—
|
|
n.a.
|
|
n.a.
|
|
||||||||||
|
Total
|
$
|
8.5
|
|
$
|
(2.8
|
)
|
$
|
5.7
|
|
$
|
(5.7
|
)
|
$
|
—
|
|
|||||
|
Noncurrent Liabilities:
|
||||||||||||||||||||
|
Commodity swap contracts
|
$
|
8.3
|
|
$
|
(2.4
|
)
|
$
|
5.9
|
|
n.a.
|
|
n.a.
|
|
|||||||
|
Foreign currency forward contracts
|
0.8
|
|
(0.8
|
)
|
—
|
|
n.a.
|
|
n.a.
|
|
||||||||||
|
Total
|
$
|
9.1
|
|
$
|
(3.2
|
)
|
$
|
5.9
|
|
$
|
(5.7
|
)
|
$
|
0.2
|
|
|||||
|
(1)
|
Adjustments relate to the further netting of derivative contracts with a common counterparty across the Company's foreign currency, diesel fuel and explosives hedging strategy derivative contract portfolios that would be contractually enforceable in the event of default.
|
After netting by counterparty where permitted, the fair values of the respective derivatives are reflected in “Other current assets,” “Investments and other assets,” “Accounts payable and accrued expenses” and “Other noncurrent liabilities” in the consolidated balance sheets.
See Note 7. "Coal Trading" for information on balance sheet offsetting related to the Company’s coal trading activities.
Fair Value Measurements
The Company uses a three-level fair value hierarchy that categorizes assets and liabilities measured at fair value based on the observability of the inputs utilized in the valuation. These levels include: Level 1 - inputs are quoted prices in active markets for the identical assets or liabilities; Level 2 - inputs are other than quoted prices included in Level 1 that are directly or indirectly observable through market-corroborated inputs; and Level 3 - inputs are unobservable, or observable but cannot be market-corroborated, requiring the Company to make assumptions about pricing by market participants.
F -
25
PEABODY ENERGY CORPORATION
NOTES TO CONSOLIDATED FINANCIAL STATEMENTS — (Continued)
Financial Instruments Measured on a Recurring Basis.
The following tables set forth the hierarchy of the Company’s net financial asset (liability) positions for which fair value is measured on a recurring basis:
|
|
December 31, 2013
|
||||||||||||||
|
|
Level 1
|
Level 2
|
Level 3
|
Total
|
|||||||||||
|
|
|
(Dollars in millions)
|
|
||||||||||||
|
Investments in debt and equity securities
|
$
|
28.8
|
|
$
|
38.2
|
|
$
|
—
|
|
$
|
67.0
|
|
|||
|
Commodity swaps and options
|
—
|
|
5.1
|
|
—
|
|
5.1
|
|
|||||||
|
Foreign currency cash flow hedge contracts
|
—
|
|
(473.3
|
)
|
—
|
|
(473.3
|
)
|
|||||||
|
Total net financial assets (liabilities)
|
$
|
28.8
|
|
$
|
(430.0
|
)
|
$
|
—
|
|
$
|
(401.2
|
)
|
|||
|
|
December 31, 2012
|
||||||||||||||
|
|
Level 1
(1)
|
Level 2
(1)
|
Level 3
|
Total
|
|||||||||||
|
|
|
(Dollars in millions)
|
|
||||||||||||
|
Investments in debt and equity securities
|
$
|
51.6
|
|
$
|
36.8
|
|
$
|
—
|
|
$
|
88.4
|
|
|||
|
Commodity swaps and options
|
—
|
|
4.0
|
|
—
|
|
4.0
|
|
|||||||
|
Foreign currency cash flow hedge contracts
|
—
|
|
286.9
|
|
—
|
|
286.9
|
|
|||||||
|
Total net financial assets
|
$
|
51.6
|
|
$
|
327.7
|
|
$
|
—
|
|
$
|
379.3
|
|
|||
|
(1)
|
Certain amounts have been revised from a Level 1 to a Level 2 fair value hierarchy classification to conform to the current year presentation, which had no effect on previously reported consolidated results and was not material to the footnotes to the consolidated financial statements.
|
For Level 1 and 2 financial assets and liabilities, the Company utilizes both direct and indirect observable price quotes, including interest rate yield curves, exchange indices, broker/dealer quotes, published indices, issuer spreads, benchmark securities and other market quotes. In the case of certain debt securities, fair value is provided by a third-party pricing service. Below is a summary of the Company’s valuation techniques for Level 1 and 2 financial assets and liabilities:
|
•
|
Investments in debt and equity securities: U.S. government securities and marketable equity securities are valued based on quoted prices in active markets (Level 1) and investment-grade corporate bonds and U.S. government agency securities are valued based on the various inputs listed above that may preclude the security from being measured using an identical asset in an active market (Level 2).
|
|
•
|
Commodity swap contracts — diesel fuel and explosives: valued based on a valuation that is corroborated by the use of market-based pricing (Level 2).
|
|
•
|
Foreign currency forward and option contracts: valued utilizing inputs obtained in quoted public markets (Level 2).
|
The Company did not have any transfers between levels during the years ended
December 31, 2013
,
2012
or
2011
for its non-coal trading positions. The Company’s policy is to value all transfers between levels using the beginning of period valuation.
Other Financial Instruments.
The following methods and assumptions were used by the Company in estimating fair values for other financial instruments as of
December 31, 2013
and
2012
:
|
•
|
Cash and cash equivalents, accounts receivable, including those within the Company’s accounts receivable securitization program, notes receivable and accounts payable have carrying values which approximate fair value due to the short maturity or the liquid nature of these instruments.
|
|
•
|
Held-to-maturity investments in time deposits denominated in Chinese Renminbi of
$4.8 million
held at December 31, 2012 had carrying values based on amortized cost, which approximated fair value due to the short maturity of the investment.
|
|
•
|
Long-term debt fair value estimates are based on observed prices for securities with an active trading market when available (Level 2), and otherwise on estimated borrowing rates to discount the cash flows to their present value (Level 3).
|
F -
26
PEABODY ENERGY CORPORATION
NOTES TO CONSOLIDATED FINANCIAL STATEMENTS — (Continued)
The carrying amounts and estimated fair values of the Company’s long-term debt are summarized as follows:
|
|
December 31, 2013
|
December 31, 2012
|
|||||||||||||
|
Carrying
Amount
|
Estimated
Fair Value
|
Carrying
Amount
|
Estimated
Fair Value
|
||||||||||||
|
|
|
(Dollars in millions)
|
|
||||||||||||
|
Long-term debt
|
$
|
6,002.4
|
|
$
|
6,167.5
|
|
$
|
6,252.9
|
|
$
|
6,583.9
|
|
|||
Nonperformance and Credit Risk
The fair value of the Company’s non-coal trading derivative assets and liabilities reflects adjustments for nonperformance and credit risk. The Company manages its counterparty risk through established credit standards, diversification of counterparties, utilization of investment grade commercial banks, adherence to established tenor limits based on counterparty creditworthiness and continuous monitoring of that creditworthiness. To reduce its credit exposure for these hedging activities, the Company seeks to enter into netting agreements with counterparties that permit the Company to offset asset and liability positions with such counterparties in the event of default.
|
(7)
|
Coal Trading
|
The Company engages in the direct and brokered trading of coal and freight-related contracts (coal trading). Except those for which the Company has elected to apply a normal purchases and normal sales exception, all derivative coal trading contracts are accounted for at fair value.
The Company's policy is to include instruments associated with coal trading transactions as a part of its trading book. Trading revenues from such transactions are recorded in “Other revenues” in the consolidated statements of operations and include realized and unrealized gains and losses on derivative instruments, including those that arise from coal deliveries related to contracts accounted for on an accrual basis under the normal purchases and normal sales exception. Therefore, the Company has elected the trading exemption surrounding disclosures related to its coal trading activities.
Trading revenues recognized during the years ended December 31,
2013
,
2012
and
2011
were as follows:
|
|
Year Ended December 31,
|
|||||||||||
|
Trading Revenue by Type of Instrument
|
2013
|
2012
|
2011
|
|||||||||
|
|
(Dollars in millions)
|
|||||||||||
|
Commodity futures, swaps and options
|
$
|
183.9
|
|
$
|
159.9
|
|
$
|
(41.4
|
)
|
|||
|
Physical commodity purchase/sale contracts
|
(117.9
|
)
|
(8.1
|
)
|
187.0
|
|
||||||
|
Total trading revenue
|
$
|
66.0
|
|
$
|
151.8
|
|
$
|
145.6
|
|
|||
Risk Management
Hedge Ineffectiveness.
The Company assesses, both at inception and at least quarterly thereafter, whether the derivatives used in cash flow hedging activities are highly effective at offsetting the changes in the anticipated cash flows of the hedged item. The effective portion of the change in the fair value is recorded in “Accumulated other comprehensive (loss) income” until the hedged transaction impacts reported earnings, at which time gains and losses are also reclassified to earnings. To the extent that periodic changes in the fair value of a derivative exceeds the changes in the hedged item to which it has been designated, the ineffective portion is recorded in earnings in the period of the change. If the hedge ceases to qualify for hedge accounting, the Company prospectively recognizes the changes in fair value of the instrument in earnings in the period of the change.
In some instances, the Company has designated an existing coal trading derivative as a hedge and, thus, the derivative has a non-zero fair value at hedge inception. The “off-market” nature of these derivatives, which is best described as an embedded financing element within the derivative, is a source of ineffectiveness. In other instances, the Company uses a coal trading derivative that settles at a different time, has different quality specifications or has a different location basis than the occurrence of the cash flow being hedged. These collectively yield ineffectiveness to the extent that the derivative hedge contract does not exactly offset changes in the fair value or expected cash flows of the hedged item.
F -
27
PEABODY ENERGY CORPORATION
NOTES TO CONSOLIDATED FINANCIAL STATEMENTS — (Continued)
The gross fair value of coal trading positions designated as cash flow hedges of forecasted sales was an asset of
$62.9 million
and
$153.1 million
as of
December 31, 2013
and
2012
, respectively. Based on the net fair value of the Company’s coal trading positions held in “Accumulated other comprehensive (loss) income” at
December 31, 2013
, unrealized gains to be reclassified from comprehensive income to earnings over the next 12 months are expected to be approximately
$50 million
. As these unrealized gains are associated with derivative instruments that represent hedges of forecasted transactions, the amounts reclassified to earnings may partially offset the effect of the realized underlying transactions in the consolidated statements of operations.
Offsetting and Balance Sheet Presentation
The fair value of assets and liabilities from coal trading activities presented on a gross and net basis as of
December 31, 2013
and
2012
is set forth below:
|
Affected line item in the consolidated balance sheets
|
Gross Amounts of Recognized Assets (Liabilities)
|
Gross Amounts Offset in the Consolidated Balance Sheets
|
Variation margin (held) posted
(1)
|
Net Amounts of Assets (Liabilities) Presented in the Consolidated Balance Sheets
|
||||||||||||
|
(Dollars in millions)
|
||||||||||||||||
|
Fair Value as of December 31, 2013
|
||||||||||||||||
|
Assets from coal trading activities, net
|
$
|
418.8
|
|
$
|
(324.7
|
)
|
$
|
(58.0
|
)
|
$
|
36.1
|
|
||||
|
Liabilities from coal trading activities, net
|
(332.7
|
)
|
324.7
|
|
1.9
|
|
(6.1
|
)
|
||||||||
|
Total, Net
|
$
|
86.1
|
|
$
|
—
|
|
$
|
(56.1
|
)
|
$
|
30.0
|
|
||||
|
Fair Value as of December 31, 2012
|
||||||||||||||||
|
Assets from coal trading activities, net
|
$
|
380.4
|
|
$
|
(170.8
|
)
|
$
|
(157.2
|
)
|
$
|
52.4
|
|
||||
|
Liabilities from coal trading activities, net
|
(190.5
|
)
|
170.8
|
|
0.3
|
|
(19.4
|
)
|
||||||||
|
Total, Net
|
$
|
189.9
|
|
$
|
—
|
|
$
|
(156.9
|
)
|
$
|
33.0
|
|
||||
|
(1)
|
Approximately
$42 million
and
$76 million
of the net variation margin held at December 31,
2013
and
2012
, respectively, related to cash flow hedges.
|
See Note 6. "Derivatives and Fair Value Measurements" for information on balance sheet offsetting related to the Company’s non-coal trading activities.
Fair Value Measurements
The following tables set forth the hierarchy of the Company’s net financial asset trading positions for which fair value is measured on a recurring basis as of
December 31, 2013
and
2012
:
|
|
December 31, 2013
|
||||||||||||||
|
|
Level 1
|
Level 2
|
Level 3
|
Total
|
|||||||||||
|
|
(Dollars in millions)
|
||||||||||||||
|
Commodity futures, swaps and options
|
$
|
—
|
|
$
|
26.4
|
|
$
|
—
|
|
$
|
26.4
|
|
|||
|
Physical commodity purchase/sale contracts
|
—
|
|
1.5
|
|
2.1
|
|
3.6
|
|
|||||||
|
Total net financial assets
|
$
|
—
|
|
$
|
27.9
|
|
$
|
2.1
|
|
$
|
30.0
|
|
|||
|
|
December 31, 2012
|
||||||||||||||
|
|
Level 1
|
Level 2
|
Level 3
|
Total
|
|||||||||||
|
|
|
(Dollars in millions)
|
|
||||||||||||
|
Commodity futures, swaps and options
|
$
|
1.2
|
|
$
|
24.4
|
|
$
|
—
|
|
$
|
25.6
|
|
|||
|
Physical commodity purchase/sale contracts
|
—
|
|
2.2
|
|
5.2
|
|
7.4
|
|
|||||||
|
Total net financial assets
|
$
|
1.2
|
|
$
|
26.6
|
|
$
|
5.2
|
|
$
|
33.0
|
|
|||
F -
28
PEABODY ENERGY CORPORATION
NOTES TO CONSOLIDATED FINANCIAL STATEMENTS — (Continued)
For Level 1 and 2 financial assets and liabilities, the Company utilizes both direct and indirect observable price quotes, including U.S. interest rate curves; LIBOR yield curves; Chicago Mercantile Exchange (CME) Group, Intercontinental Exchange indices (ICE), LCH.Clearnet (formerly known as the London Clearing House), NOS Clearing ASA and Singapore Exchange (SGX) contract prices; broker quotes; published indices and other market quotes. Below is a summary of the Company’s valuation techniques for Level 1 and 2 financial assets and liabilities:
|
•
|
Commodity futures, swaps and options: generally valued based on unadjusted quoted prices in active markets (Level 1) or a valuation that is corroborated by the use of market-based pricing (Level 2).
|
|
•
|
Physical commodity purchase/sale contracts: purchases and sales at locations with significant market activity corroborated by market-based information (Level 2).
|
Physical commodity purchase/sale contracts transacted in less liquid markets or contracts, such as long-term arrangements with limited price availability, are classified in Level 3. Indicators of less liquid markets are those with periods of low trade activity or wide pricing spreads between broker quotes.
The Company's risk management function, which is independent of the Company's commercial trading function, is responsible for valuation policies and procedures, with oversight from executive management. Generally, the Company's Level 3 instruments or contracts are valued using bid/ask price quotations and other market assessments obtained from multiple, independent third-party brokers or other transactional data incorporated into internally-generated discounted cash flow models. While the Company does not anticipate any decrease in the number of third-party brokers or market liquidity, the occurrence of such events could erode the quality of market information and therefore the valuation of its market positions. The Company's valuation techniques include basis adjustments to the foregoing price inputs for quality, such as heat rate and sulfur and ash content; location differentials, expressed as port and freight costs, and credit and nonperformance risk. The Company's risk management function independently validates the Company's valuation inputs, including unobservable inputs, with third-party information and settlement prices from other sources where available. A daily process is performed to analyze market price changes and changes to the portfolio. Further periodic validation occurs at the time contracts are settled with the counterparty. These valuation techniques have been consistently applied in all periods presented, and the Company believes it has obtained the most accurate information available for the types of derivative contracts held.
The following table summarizes the quantitative unobservable inputs utilized in the Company's internally-developed valuation models for physical commodity purchase/sale contracts classified as Level 3 as of
December 31, 2013
:
|
Range
|
Weighted
|
||||||||
|
Input
|
Low
|
High
|
Average
|
||||||
|
Quality adjustments
|
1
|
%
|
10
|
%
|
9
|
%
|
|||
|
Location differentials
|
25
|
%
|
26
|
%
|
26
|
%
|
|||
|
Non-performance adjustments
|
4
|
%
|
4
|
%
|
4
|
%
|
|||
Significant increases or decreases in the inputs in isolation could result in a significantly higher or lower fair value measurement. The unobservable inputs do not have a direct interrelationship; therefore, a change in one unobservable input would not necessarily correspond with a change in another unobservable input.
The following table summarizes the changes in the Company’s recurring Level 3 net financial assets:
|
|
Year Ended December 31,
|
||||||||||
|
|
2013
|
2012
|
2011
|
||||||||
|
|
(Dollars in millions)
|
||||||||||
|
Beginning of year
|
$
|
5.2
|
|
$
|
8.7
|
|
$
|
18.6
|
|
||
|
Total gains realized/unrealized:
|
|
|
|
|
|
|
|||||
|
Included in earnings
|
0.3
|
|
17.5
|
|
8.9
|
|
|||||
|
Settlements
|
(3.4
|
)
|
(21.0
|
)
|
(2.1
|
)
|
|||||
|
Transfers in
|
—
|
|
—
|
|
1.0
|
|
|||||
|
Transfers out
|
—
|
|
—
|
|
(17.7
|
)
|
|||||
|
End of year
|
$
|
2.1
|
|
$
|
5.2
|
|
$
|
8.7
|
|
||
F -
29
PEABODY ENERGY CORPORATION
NOTES TO CONSOLIDATED FINANCIAL STATEMENTS — (Continued)
The following table summarizes the changes in unrealized (losses) gains relating to Level 3 net financial assets held both as of the beginning and the end of the year:
|
|
Year Ended December 31,
|
||||||||||
|
|
2013
|
2012
|
2011
|
||||||||
|
|
(Dollars in millions)
|
||||||||||
|
Changes in unrealized (losses) gains
(1)
|
$
|
(0.4
|
)
|
$
|
4.1
|
|
$
|
8.7
|
|
||
|
(1)
|
Within the consolidated statements of operations and consolidated statements of comprehensive income for the periods presented, unrealized gains and losses from Level 3 items are combined with unrealized gains and losses on positions classified in Level 1 or 2, as well as other positions that have been realized during the applicable periods.
|
The Company did not have any significant transfers between Level 1 and Level 2 during
2013
,
2012
or
2011
. Certain of the Company’s physical commodity purchase/sale contracts were transferred from Level 3 to Level 2 in 2011 as the settlement dates entered a more liquid market. The Company’s policy is to value all transfers between levels using the beginning of period valuation.
As of
December 31, 2013
, the timing of the estimated future realization of the value of the Company’s trading portfolio was as follows:
|
Percentage of
|
|||
|
Year of Expiration
|
Portfolio Total
|
||
|
|
|||
|
2014
|
84
|
%
|
|
|
2015
|
9
|
%
|
|
|
2016
|
7
|
%
|
|
|
|
100
|
%
|
|
Nonperformance and Credit Risk.
The fair value of the Company’s coal derivative assets and liabilities reflects adjustments for nonperformance and credit risk. The Company’s exposure is substantially with electric utilities, energy marketers and steel producers. The Company’s policy is to independently evaluate each customer’s creditworthiness prior to entering into transactions and to regularly monitor the credit extended. If the Company engages in a transaction with a counterparty that does not meet its credit standards, the Company seeks to protect its position by requiring the counterparty to provide an appropriate credit enhancement. Also, when appropriate (as determined by its credit management function), the Company has taken steps to reduce its exposure to customers or counterparties whose credit has deteriorated and who may pose a higher risk of failure to perform under their contractual obligations. These steps include obtaining letters of credit or cash collateral (margin), requiring prepayments for shipments or the creation of customer trust accounts held for the Company’s benefit to serve as collateral in the event of a failure to pay or perform. To reduce its credit exposure related to trading and brokerage activities, the Company seeks to enter into netting agreements with counterparties that permit the Company to offset asset and liability positions with such counterparties and, to the extent required, will post or receive margin amounts associated with exchange-cleared and certain OTC positions.
As of
December 31, 2013
,
81%
of the Company’s credit exposure related to coal trading activities with investment grade counterparties, while
9%
was with non-investment grade counterparties and
10%
was with counterparties that are not rated.
Performance Assurances and Collateral
Certain of the Company’s derivative trading instruments require the parties to provide additional performance assurances whenever a material adverse event jeopardizes one party’s ability to perform under the instrument. If the Company was to sustain a material adverse event (using commercially reasonable standards), its counterparties could request collateralization on derivative trading instruments in net liability positions which, based on an aggregate fair value at
December 31, 2013
and
2012
, would have amounted to collateral postings to counterparties of approximately
$7 million
and
$8 million
, respectively. As of
December 31, 2013
and
2012
,
no
collateral was posted to counterparties for such positions.
F -
30
PEABODY ENERGY CORPORATION
NOTES TO CONSOLIDATED FINANCIAL STATEMENTS — (Continued)
Certain of the Company’s other derivative trading instruments require the parties to provide additional performance assurances whenever a credit downgrade occurs below a certain level as specified in each underlying contract. The terms of such derivative trading instruments typically require additional collateralization, which is commensurate with the severity of the credit downgrade. During the third quarter of 2013, the three major credit rating agencies downgraded the Company's corporate credit rating by one notch, while maintaining a stable ratings outlook. The Company was not required to post additional margin as a result of that downgrade. If a credit downgrade were to have occurred below contractually specified levels, the Company’s additional collateral requirement owed to its counterparties would have been
zero
at
December 31, 2013
and
2012
based on the aggregate fair value of all derivative trading instruments with such features. Accordingly, the Company had posted
no
margin related to such features as of
December 31, 2013
and
2012
.
The Company is required to post variation margin on positions that are in a net liability position and is entitled to receive and hold variation margin on positions that are in a net asset position with an exchange and certain of its OTC derivative contract counterparties. At
December 31, 2013
and
2012
, the Company held net variation margin of
$56.1 million
and
$156.9 million
, respectively.
In addition to the requirements surrounding variation margin, the Company is required by the exchanges upon which it transacts to post certain additional collateral, known as initial margin, which represents an estimate of potential future adverse price movements across the Company’s portfolio under normal market conditions. As of
December 31, 2013
and
2012
, the Company had posted initial margin of
$19.6 million
and
$23.2 million
, respectively, which is reflected in “Other current assets” in the consolidated balance sheets. The Company also posted
$1.0 million
and
$0.5 million
of margin in excess of the exchange-required variation and initial margin discussed above as of
December 31, 2013
and
2012
, respectively.
|
(8)
|
Financing Receivables
|
The Company had total financing receivables of
$351.8 million
and
$391.7 million
at
December 31, 2013
and
2012
, respectively, which consisted of the following:
|
Balance Sheet Classification
|
December 31, 2013
|
December 31, 2012
|
||||||
|
(Dollars in millions)
|
||||||||
|
Accounts receivable, net
|
$
|
0.1
|
|
$
|
0.7
|
|
||
|
Investments and other assets
|
351.7
|
|
391.0
|
|
||||
|
Total financing receivables
|
$
|
351.8
|
|
$
|
391.7
|
|
||
The Company periodically assesses the collectability of accounts and loans receivable by considering factors such as specific evaluation of collectability, historical collection experience, the age of the receivable and other available evidence. Below is a description of the Company's financing receivables at
December 31, 2013
.
Codrilla Mine Project.
In 2011, a wholly owned subsidiary of PEA-PCI, then Macarthur Coal Limited, completed the sale of its
85%
interest in the Codrilla Mine Project to participants of the Coppabella Moorvale Joint Venture (CMJV) where PEA-PCI sold down its interest in the Codrilla project to the CMJV (Codrilla sell down) so that, following completion of the sale, ownership of the Codrilla Mine Project reflected the existing ownership of the Coppabella and Moorvale mines with PEA-PCI retaining a
73.3%
ownership. Prior to the acquisition of PEA-PCI by the Company, consideration of
$15 million
Australian dollars was received by PEA-PCI upon completion of the Codrilla sell down, representing
20%
of the agreed price. Two installments, for which the Company holds non-interest-bearing receivables, are due upon the completion of certain milestones. The first installment, with
40%
due on the granting of the related mining lease, was received during the three months ended September 30, 2012. The final
40%
is due upon the earlier of the mine's first coal shipment or a specified date. The sales agreement was amended in the second quarter of 2013 to delay the specified date from March 31, 2015 to June 30, 2016, resulting in an adjustment to the discounted value of the note receivable in the amount of
$1.6 million
. This adjustment was recorded in "Interest income" in the statements of operations for the year ended December 31, 2013. There are currently no indications of impairment on the remaining installment and the Company expects to receive full payment upon the earlier of the mine's first shipment or June 30, 2016. The remaining balance associated with these receivables is recorded in "Investments and other assets" which was
$28.5 million
and
$33.6 million
at
December 31, 2013
and
2012
, respectively, in the consolidated balance sheets.
F -
31
PEABODY ENERGY CORPORATION
NOTES TO CONSOLIDATED FINANCIAL STATEMENTS — (Continued)
Middlemount Mine.
The Company periodically makes loans to Middlemount, in which the Company owns a
50%
equity interest, pursuant to the related shareholders' agreement for purposes of funding capital expenditures and working capital requirements. Middlemount intends to pay down the loans as excess cash is generated as required by the shareholders’ agreement. The loans bear interest at a rate equal to the monthly average 30-day Australian Bank Bill Swap Reference Rate plus
3.5%
and expire December 24, 2015. Based on the expected timing of repayment on these loans, which is projected to extend beyond the stated expiration date, the Company considers these loans to be of a long-term nature. As a result, the foreign currency impact related to the shareholder loans is included in foreign currency translation adjustment in the consolidated balance sheet as of December 31, 2013 and the consolidated statement of comprehensive income for the year then ended. As a result of the expected timing of interest repayments, interest income on these loans for the year ended
December 31, 2013
was recognized when cash was received. Interest income of
$6.4 million
was recognized on these loans for the year ended December 31, 2013. Interest income under a full accrual basis would have resulted in an additional
$5.8 million
of interest income during the year ended December 31, 2013. "Investments and other assets" included
$323.2 million
and
$357.4 million
at
December 31, 2013
and
2012
, respectively, related to these loans in the consolidated balance sheets.
Other Financing Receivables.
From time to time, the Company may enter into transactions resulting in accounts or notes receivable held by the Company, which have been reflected in "Accounts receivable, net." These notes are generally short term in nature with positive historical collection experience and do not represent a material credit risk to the Company.
|
(9)
|
Property, Plant, Equipment and Mine Development
|
Property, plant, equipment and mine development, net, consisted of the following:
|
December 31,
|
|||||||
|
2013
|
2012
|
||||||
|
(Dollars in millions)
|
|||||||
|
Land and coal interests
|
$
|
11,024.1
|
|
$
|
10,947.7
|
|
|
|
Buildings and improvements
|
1,525.4
|
|
1,784.5
|
|
|||
|
Machinery and equipment
|
2,777.5
|
|
2,699.0
|
|
|||
|
Less: Accumulated depreciation, depletion and amortization
|
(4,244.5
|
)
|
(3,629.5
|
)
|
|||
|
Total, net
|
$
|
11,082.5
|
|
$
|
11,801.7
|
|
|
The net book value of coal reserves totaled
$6.3 billion
as of
December 31, 2013
and
$6.4 billion
as of
December 31, 2012
, which excludes the carrying value of acquired interests in mineral rights at certain Australian exploration properties of
$1.3 billion
at each date. The coal reserves include mineral rights for leased coal interests and advance royalties that had a net book value of
$5.1 billion
as of
December 31, 2013
and
$5.2 billion
as of
December 31, 2012
. The remaining net book value of coal reserves of
$1.2 billion
at
December 31, 2013
and
2012
relates to coal reserves held by fee ownership. Amounts attributable to coal reserves at properties where the Company was not currently engaged in mining operations or leasing to third parties and, therefore, the coal reserves were not currently being depleted, was
$1.9 billion
as of
December 31, 2013
and
$2.2 billion
as of
December 31, 2012
.
|
(10)
|
Income Taxes
|
(Loss) income from continuing operations before income taxes consisted of the following:
|
|
Year Ended December 31,
|
||||||||||
|
|
2013
|
2012
|
2011
|
||||||||
|
|
(Dollars in millions)
|
||||||||||
|
U.S.
|
$
|
220.6
|
|
$
|
1,049.1
|
|
$
|
818.0
|
|
||
|
Non-U.S.
|
(954.9
|
)
|
(1,257.7
|
)
|
558.0
|
|
|||||
|
Total
|
$
|
(734.3
|
)
|
$
|
(208.6
|
)
|
$
|
1,376.0
|
|
||
F -
32
PEABODY ENERGY CORPORATION
NOTES TO CONSOLIDATED FINANCIAL STATEMENTS — (Continued)
Total income tax (benefit) provision consisted of the following:
|
|
Year Ended December 31,
|
||||||||||
|
|
2013
|
2012
|
2011
|
||||||||
|
|
(Dollars in millions)
|
||||||||||
|
Current:
|
|
|
|
|
|
|
|||||
|
U.S. federal
|
$
|
(47.9
|
)
|
$
|
116.8
|
|
$
|
103.4
|
|
||
|
Non-U.S.
|
38.4
|
|
127.6
|
|
58.9
|
|
|||||
|
State
|
(4.7
|
)
|
12.2
|
|
12.2
|
|
|||||
|
Total current
|
(14.2
|
)
|
256.6
|
|
174.5
|
|
|||||
|
Deferred:
|
|
|
|
|
|
|
|||||
|
U.S. federal
|
4.8
|
|
(32.7
|
)
|
138.0
|
|
|||||
|
Non-U.S.
|
(440.3
|
)
|
28.8
|
|
42.8
|
|
|||||
|
State
|
1.4
|
|
9.6
|
|
7.9
|
|
|||||
|
Total deferred
|
(434.1
|
)
|
5.7
|
|
188.7
|
|
|||||
|
Total income tax (benefit) provision
|
$
|
(448.3
|
)
|
$
|
262.3
|
|
$
|
363.2
|
|
||
The following is a reconciliation of the expected statutory federal income tax (benefit) provision to the Company’s income tax (benefit) provision:
|
|
Year Ended December 31,
|
||||||||||
|
|
2013
|
2012
|
2011
|
||||||||
|
|
(Dollars in millions)
|
||||||||||
|
Expected income tax (benefit) provision at U.S. federal statutory rate
|
$
|
(257.0
|
)
|
$
|
(73.0
|
)
|
$
|
480.8
|
|
||
|
Excess depletion
|
(72.7
|
)
|
(69.4
|
)
|
(70.8
|
)
|
|||||
|
Capital loss
|
—
|
|
(118.1
|
)
|
—
|
|
|||||
|
Minerals resource rent tax, net of federal tax
|
(87.4
|
)
|
77.2
|
|
—
|
|
|||||
|
Foreign earnings provision differential
|
62.7
|
|
(59.6
|
)
|
(91.6
|
)
|
|||||
|
Remeasurement of foreign income tax accounts
|
(44.3
|
)
|
7.9
|
|
(0.9
|
)
|
|||||
|
State income taxes, net of federal tax benefit
|
(0.2
|
)
|
(1.1
|
)
|
12.3
|
|
|||||
|
General business tax credits
|
(18.9
|
)
|
(17.4
|
)
|
(17.8
|
)
|
|||||
|
Changes in valuation allowance
|
(29.4
|
)
|
521.5
|
|
15.4
|
|
|||||
|
Changes in tax reserves
|
8.8
|
|
24.5
|
|
14.7
|
|
|||||
|
Other, net
|
(9.9
|
)
|
(30.2
|
)
|
21.1
|
|
|||||
|
Total income tax (benefit) provision
|
$
|
(448.3
|
)
|
$
|
262.3
|
|
$
|
363.2
|
|
||
Certain reconciliation items in the above table exclude the remeasurement of foreign income tax accounts as these foreign currency effects are separately presented.
F -
33
PEABODY ENERGY CORPORATION
NOTES TO CONSOLIDATED FINANCIAL STATEMENTS — (Continued)
The tax effects of temporary differences that give rise to significant portions of the deferred tax assets and liabilities consisted of the following:
|
|
December 31,
|
||||||
|
|
2013
|
2012
|
|||||
|
|
(Dollars in millions)
|
||||||
|
Deferred tax assets:
|
|
|
|
|
|||
|
Tax credits and loss carryforwards
|
$
|
1,558.0
|
|
$
|
1,390.1
|
|
|
|
Minerals resource rent tax
|
993.2
|
|
689.7
|
|
|||
|
Accrued postretirement benefit obligations
|
309.9
|
|
473.3
|
|
|||
|
Asset retirement obligations
|
141.6
|
|
137.9
|
|
|||
|
Workers’ compensation obligations
|
10.4
|
|
15.7
|
|
|||
|
Employee benefits
|
88.5
|
|
64.7
|
|
|||
|
Financial guarantees
|
16.9
|
|
18.6
|
|
|||
|
Other
|
96.4
|
|
64.4
|
|
|||
|
Total gross deferred tax assets
|
3,214.9
|
|
2,854.4
|
|
|||
|
Deferred tax liabilities:
|
|
|
|
|
|||
|
Property, plant, equipment and mine development, principally due to differences in depreciation, depletion and asset impairments
|
1,322.3
|
|
1,596.9
|
|
|||
|
Unamortized discount on Convertible Junior Subordinated Debentures
|
131.8
|
|
132.8
|
|
|||
|
Hedge activities
|
11.4
|
|
37.5
|
|
|||
|
Investments and other assets
|
82.0
|
|
126.3
|
|
|||
|
Total gross deferred tax liabilities
|
1,547.5
|
|
1,893.5
|
|
|||
|
Valuation allowance, income tax
|
(656.4
|
)
|
(714.9
|
)
|
|||
|
Valuation allowance, minerals resource rent tax
|
(977.7
|
)
|
(766.9
|
)
|
|||
|
Net deferred tax asset (liability)
|
$
|
33.3
|
|
$
|
(520.9
|
)
|
|
|
Deferred taxes are classified as follows:
|
|
|
|
|
|||
|
Current deferred income taxes
|
$
|
66.4
|
|
$
|
56.4
|
|
|
|
Noncurrent deferred income taxes
|
(33.1
|
)
|
(577.3
|
)
|
|||
|
Net deferred tax asset (liability)
|
$
|
33.3
|
|
$
|
(520.9
|
)
|
|
The Company's tax credits and tax effected loss carryforwards includes U.S. alternative minimum tax (AMT) credits of
$271.2 million
, foreign tax credits of
$74.7 million
, tax general business credits of
$71.1 million
, U.S. capital losses of
$66.2 million
, state net operating loss (NOL) carryforwards of
$40.3 million
and foreign NOL carryforwards of
$1,034.5 million
as of December 31, 2013. The AMT credits and foreign NOLs have no expiration date. The U.S. capital losses and state NOL's begin to expire in 2017 and 2018, respectively. The foreign tax credits and general business credits begin to expire in 2020 and 2027, respectively. In assessing the near term use of NOL's and tax credits and corresponding valuation allowance adjustments, the Company evaluated the expected level of future taxable income, available tax planning strategies, reversals of existing taxable temporary differences and taxable income in carryback years. The income tax valuation allowance at December 31, 2013 of
$656.4 million
represents a partial reserve for U.S. capital losses, state NOL's, foreign NOL's and certain deferred tax assets.
During 2013, the Company recorded a benefit related to the Australian minerals resource rent tax of
$87.4 million
. As of December 31, 2013, the Company has recorded a gross deferred tax asset of
$1,230.4 million
from the market value allowance, royalty credit carryforwards and other adjustments. The gross deferred tax asset is offset by a deferred tax liability of
$237.2 million
primarily related to excess book over tax basis in certain exploration properties. The Company separately recorded a valuation allowance of
$977.7 million
on the market value allowance due to limitations on recoverability.
F -
34
PEABODY ENERGY CORPORATION
NOTES TO CONSOLIDATED FINANCIAL STATEMENTS — (Continued)
Unrecognized Tax Benefits
The net unrecognized tax benefits (excluding interest and penalties) are recorded as follows in the consolidated balance sheets:
|
|
December 31,
|
||||||
|
|
2013
|
2012
|
|||||
|
Accounts payable and accrued expenses
|
$
|
20.3
|
|
$
|
—
|
|
|
|
Deferred income taxes
|
90.3
|
|
—
|
|
|||
|
Other noncurrent liabilities
|
29.9
|
|
119.7
|
|
|||
|
Net unrecognized tax benefits
|
$
|
140.5
|
|
$
|
119.7
|
|
|
|
Gross unrecognized tax benefits
|
$
|
143.9
|
|
$
|
122.8
|
|
|
The amount of the Company's gross unrecognized tax benefits has increased by
$21.1 million
since January 1, 2013 due to additions for current positions and the Company's reassessment of its prior year foreign positions associated with acquisition restructuring, partially offset by the expiration of statutes of limitations. The amount of the net unrecognized tax benefits that, if recognized, would directly affect the effective tax rate was
$140.5 million
at December 31, 2013 and
$119.7 million
at December 31, 2012. A reconciliation of the beginning and ending amount of gross unrecognized tax benefits is as follows (dollars in millions):
|
|
Year Ended December 31,
|
||||||||||
|
|
2013
|
2012
|
2011
|
||||||||
|
Balance at beginning of period
|
$
|
122.8
|
|
$
|
119.6
|
|
$
|
111.0
|
|
||
|
Additions for current year tax positions
|
6.3
|
|
17.4
|
|
5.2
|
|
|||||
|
Additions for prior year tax positions
|
63.8
|
|
31.9
|
|
3.4
|
|
|||||
|
Reductions for settlements with tax authorities
|
—
|
|
(46.1
|
)
|
—
|
|
|||||
|
Reductions for expirations of statutes of limitations
|
(49.0
|
)
|
—
|
|
—
|
|
|||||
|
Balance at end of period
|
$
|
143.9
|
|
$
|
122.8
|
|
$
|
119.6
|
|
||
The Company recognizes interest and penalties related to unrecognized tax benefits in its income tax provision. The Company (reversed) expensed gross interest and penalties of
($36.0) million
,
$21.2 million
and
$11.4 million
for the years ended December 31, 2013, 2012 and 2011, respectively. The Company had
$11.4 million
and
$47.4 million
of accrued gross interest and penalties related to unrecognized tax benefits at December 31, 2013 and 2012, respectively.
The Company believes during the next twelve months it is reasonably possible for a
$20.3 million
decrease in its net unrecognized tax benefits due to potential audit settlements and the expiration of statutes of limitations.
Tax Returns Subject to Examination
The Company's U.S. federal income tax returns are under examination by the IRS for the 2009 and 2010 income tax years. The U.S. federal income tax returns for the year 2011 and 2012 remain potentially subject to examination. The Company's state income tax returns for the tax years 1999 and thereafter remain potentially subject to examination by various state taxing authorities due to NOL carryforwards. The Company's Australian income tax returns for the tax years 2004 through 2012 are under examination by the Australian Tax Office (ATO). In December 2013, the Company and the ATO tentatively agreed to settle an audit issue regarding certain financing transactions with a proposed assessment of
$28.1 million
(tax of
$20.3 million
plus interest and penalties of
$7.8 million
). The Company previously made a deposit payment of
$32.7 million
and expects to receive a refund in 2014. The deposit balance has been reflected in “Other current assets” in the consolidated balance sheet as of December 31, 2013.
Foreign Earnings
The Company currently has no undistributed earnings of foreign subsidiaries as of December 31, 2013. Historically, the Company has not provided deferred taxes on undistributed earnings because such earnings are considered to be indefinitely reinvested outside the U.S.
F -
35
PEABODY ENERGY CORPORATION
NOTES TO CONSOLIDATED FINANCIAL STATEMENTS — (Continued)
Tax Payments and Refunds
The following table summarizes the Company’s income tax payments, net of refunds:
|
|
Year Ended December 31,
|
||||||||||
|
|
2013
|
2012
|
2011
|
||||||||
|
|
(Dollars in millions)
|
||||||||||
|
U.S. — federal
|
$
|
(0.8
|
)
|
$
|
63.0
|
|
$
|
200.0
|
|
||
|
U.S. — state and local
|
2.9
|
|
11.8
|
|
13.2
|
|
|||||
|
Non-U.S.
|
79.8
|
|
55.7
|
|
60.8
|
|
|||||
|
Total income tax payments, net of refunds
|
$
|
81.9
|
|
$
|
130.5
|
|
$
|
274.0
|
|
||
|
(11)
|
Accounts Payable and Accrued Expenses
|
Accounts payable and accrued expenses consisted of the following:
|
|
December 31,
|
||||||
|
|
2013
|
2012
|
|||||
|
|
(Dollars in millions)
|
||||||
|
Trade accounts payable
|
$
|
483.0
|
|
$
|
555.0
|
|
|
|
Other accrued expenses
|
267.3
|
|
372.2
|
|
|||
|
Accrued payroll and related benefits
|
248.0
|
|
256.8
|
|
|||
|
Accrued taxes other than income
|
223.5
|
|
203.8
|
|
|||
|
Commodity and foreign currency hedge contracts
|
213.9
|
|
5.7
|
|
|||
|
Liabilities associated with discontinued operations
|
127.8
|
|
33.3
|
|
|||
|
Accrued royalties
|
67.1
|
|
82.3
|
|
|||
|
Accrued interest
|
47.9
|
|
47.5
|
|
|||
|
Payable to voluntary employee beneficiary association for certain Patriot retirees
(1)
|
20.0
|
|
—
|
|
|||
|
Accrued environmental cleanup-related costs
|
18.3
|
|
10.6
|
|
|||
|
Workers’ compensation obligations
|
10.0
|
|
18.4
|
|
|||
|
Accrued health care insurance
|
7.1
|
|
21.3
|
|
|||
|
Income taxes payable
|
3.8
|
|
—
|
|
|||
|
Total accounts payable and accrued expenses
|
$
|
1,737.7
|
|
$
|
1,606.9
|
|
|
|
(1)
|
Refer to Note 25. "Matters Related to the Bankruptcy of Patriot Coal Corporation" herein for additional details related to this transaction.
|
F -
36
PEABODY ENERGY CORPORATION
NOTES TO CONSOLIDATED FINANCIAL STATEMENTS — (Continued)
|
(12)
|
|
The Company’s total indebtedness as of
December 31, 2013
and
2012
consisted of the following:
|
|
December 31,
|
||||||
|
|
2013
|
2012
|
|||||
|
|
(Dollars in millions)
|
||||||
|
Term Loan due June 2015
(1)
|
$
|
—
|
|
$
|
418.8
|
|
|
|
2011 Term Loan Facility due October 2016
(1)
|
—
|
|
912.5
|
|
|||
|
2013 Term Loan Facility due September 2020
(1)
|
1,185.4
|
|
—
|
|
|||
|
7.375% Senior Notes due November 2016
(1)
|
650.0
|
|
650.0
|
|
|||
|
6.00% Senior Notes due November 2018
(1)
|
1,518.8
|
|
1,518.8
|
|
|||
|
6.50% Senior Notes due September 2020
(1)
|
650.0
|
|
650.0
|
|
|||
|
6.25% Senior Notes due November 2021
(1)
|
1,339.6
|
|
1,339.6
|
|
|||
|
7.875% Senior Notes due November 2026
(1)
|
247.5
|
|
247.4
|
|
|||
|
Convertible Junior Subordinated Debentures due December 2066
(1)
|
379.7
|
|
377.4
|
|
|||
|
Capital lease obligations
|
30.5
|
|
104.6
|
|
|||
|
Other
|
0.9
|
|
33.8
|
|
|||
|
Total
|
$
|
6,002.4
|
|
$
|
6,252.9
|
|
|
(1)
Denotes indebtedness issued by Peabody Energy Corporation.
The carrying amounts of the 2013 Term Loan Facility due September 2020, the
7.875%
Senior Notes due December 2026 and the Convertible Junior Subordinated Debentures due December 2066 (the Debentures) have been presented above net of the respective unamortized original issue discounts.
2013 Credit Agreement
On September 24, 2013, the Company entered into a secured credit agreement (the 2013 Credit Facility), which provides for a
$1.65 billion
revolving credit facility (the 2013 Revolver) and a
$1.20 billion
term loan facility (the 2013 Term Loan Facility). In connection with the closing of the 2013 Credit Facility, the Company borrowed
$1.19 billion
under the 2013 Term Loan Facility, net of original issue discount of
$12.0 million
that will be amortized over its seven-year term, and transferred
$94.7 million
of existing letters of credit from its unsecured credit agreement dated as of June 18, 2010 (as amended, the 2010 Credit Agreement). The 2013 Revolver commitment will mature on September 24, 2018, or on August 15, 2018 if the Company’s
6.00%
Senior Notes due 2018 are still in existence on such date. The 2013 Term Loan Facility matures on September 24, 2020. The Company has total capitalized deferred financing costs of
$18.3 million
and
$10.1 million
related to the 2013 Revolver and 2013 Term Loan Facility, respectively, which will be amortized over the respective five and seven year terms of those facilities.
Proceeds of the 2013 Term Loan Facility were used primarily to pay off amounts outstanding under the 2010 Credit Agreement and the Company's unsecured credit agreement dated October 28, 2011 (as amended, the 2011 Credit Agreement), which had then-outstanding principal amounts of
$301.8 million
and
$862.5 million
, respectively. The Company recognized expense of
$11.5 million
on the write-off of previously deferred financing costs related to those facilities during the year, which was classified in "Interest expense" in the consolidated statement of operations.
The obligations under the 2013 Credit Facility are guaranteed by the Company and substantially all of its domestic subsidiaries and are secured by a pledge of
65%
of the stock of Peabody Investments (Gibraltar) Limited, a holding company for the Australian operations of the Company, and a pledge of the stock of Peabody IC Funding Corp., whose sole asset is intercompany debt owed to it by the top-level Gibraltar holding company of the Company’s Australian operations.
All borrowings under the 2013 Credit Facility (other than swingline borrowings and borrowings denominated in currencies other than U.S. dollars) bear interest, at the Company’s option, at either a base rate (subject to a floor of
2.00%
for borrowings under the 2013 Term Loan Facility) or a eurocurrency rate (subject to a floor of
1.00%
for borrowings under the 2013 Term Loan Facility), each as defined in the 2013 Credit Agreement, plus: (1) in the case of the 2013 Term Loan Facility, a margin of
2.25%
and
3.25%
per year for borrowings bearing interest at the base rate and the eurocurrency rate, respectively; or (2) in the case of the 2013 Revolver, a margin dependent on the Company's consolidated net leverage ratio, as defined in the 2013 Credit Agreement, ranging from
0.75%
to
1.50%
and
1.75%
to
2.50%
per year for borrowings bearing interest at the base rate and eurocurrency rate, respectively.
F -
37
PEABODY ENERGY CORPORATION
NOTES TO CONSOLIDATED FINANCIAL STATEMENTS — (Continued)
As of December 31, 2013, the Company had
$1,185.4 million
outstanding under the 2013 Term Loan Facility with an interest rate payable of LIBOR (with a floor of
1.00%
) plus
3.25%
, or
4.25%
in total.
The Company pays a usage-dependent commitment fee under the 2013 Revolver, which is dependent upon the Company's consolidated net leverage ratio, as defined in the 2013 Credit Agreement, and ranges from
0.375%
to
0.500%
of the available unused commitment. In addition, the Company pays a letter of credit fee, which is also dependent upon the Company's leverage ratio and ranges from
1.75%
to
2.50%
per year of the undrawn amount of each letter of credit, and a fronting fee equal to
0.125%
per year of the face amount drawn under each letter of credit.
The 2013 Term Loan Facility is subject to quarterly amortization of
0.25%
per quarter that commenced on October 1, 2013, with the final payment of all amounts outstanding (including accrued interest) being due on September 24, 2020. It is also subject to a repayment premium of
1.0%
during the six-month period after the execution of the 2013 Credit Agreement and a requirement to prepay the term loan borrowing thereunder with proceeds from dispositions made by foreign subsidiaries, subject to thresholds and customary reinvestment rights.
Under the 2013 Revolver, the Company must comply with two financial covenants on a quarterly basis, which are a maximum net secured leverage ratio and a minimum interest coverage ratio. The Company was in compliance with those covenants as of December 31, 2013. The Company is permitted to pay dividends, buy and sell assets and make redemptions or repurchases of capital stock when in compliance with its financial covenants (including compliance on a pro forma basis giving effect to such transactions), subject to certain restrictions imposed by the 2013 Credit Facility. That agreement also imposes certain restrictions on the Company's ability to incur liens, incur debt, make investments (including acquisitions), engage in fundamental changes such as mergers and dissolutions, dispose of assets, change the nature of its business, enter into transactions with affiliates, enter into agreements that restrict the Company's ability to make dividends or distributions, enter into agreements with negative pledge clauses and make dividends from the top-level Gibraltar holding company of the Company's Australian operations to the Company's domestic subsidiaries in an amount in excess of
$500
million per year. It also contains customary events of default. The agreement generally does not restrict the Company’s ability to provide for loans and advances between the parent company and the subsidiaries that secure or guarantee the related indebtedness, provided that certain of such loans and advances are subordinated to the Company’s obligations under the 2013 Credit Agreement.
As of
December 31, 2013
, the Company had
no
borrowings under the 2013 Revolver, but had
$131.9 million
of letters of credit outstanding. The remaining capacity under the 2013 Revolver at
December 31, 2013
was
$1,518.1 million
. The interest rate payable on the 2013 Revolver was LIBOR plus
2.25%
, or
2.42%
at December 31, 2013.
6.00%, 6.25%, 6.50%, 7.375% and 7.875% Senior Notes (collectively the Senior Notes)
The Senior Notes are senior unsecured obligations and rank senior in right of payment to any subordinated indebtedness; equally in right of payment with any senior indebtedness; are effectively junior in right of payment to the Company’s secured indebtedness, to the extent of the value of the collateral securing that indebtedness; and effectively junior to all the indebtedness and other liabilities of its subsidiaries that do not guarantee the notes.
The Senior Notes are jointly and severally guaranteed by nearly all of the Company’s domestic subsidiaries, as defined in the note indentures. The note indentures contain covenants that, among other things, limit the Company’s ability to create liens and enter into sale and lease-back transactions. The Senior Notes are redeemable at a redemption price equal to
100%
of the principal amount of the notes being redeemed plus a make-whole premium and any accrued unpaid interest to the redemption date. If the Company experiences specific kinds of changes in control and the credit rating assigned to the Senior Notes declines below specified levels within 90 days of that time, holders of such notes have the right to require the Company to repurchase their notes at a repurchase price equal to
101%
of their principal amount, plus accrued and unpaid interest, if any, to the date of repurchase.
Interest payments on the Senior Notes are scheduled to occur each year as follows:
|
Senior Notes
|
Interest Payment Dates
|
|
|
6.00% Senior Notes
|
May 15 and November 15
|
|
|
6.25% Senior Notes
|
May 15 and November 15
|
|
|
6.50% Senior Notes
|
March 15 and September 15
|
|
|
7.375% Senior Notes
|
May 1 and November 1
|
|
|
7.875% Senior Notes
|
May 1 and November 1
|
|
F -
38
PEABODY ENERGY CORPORATION
NOTES TO CONSOLIDATED FINANCIAL STATEMENTS — (Continued)
On November 15, 2011, the Company completed a $
1.6 billion
offering of
6.00%
Senior Notes due November 2018 (the
6.00%
Senior Notes) and a
$1.5 billion
offering of
6.25%
Senior Notes due
November 2021
(the
6.25%
Senior Notes), with the proceeds of the offering used, in part, to finance the acquisition of Macarthur. On the same date, the Company, the Guarantors and the initial purchasers of the
6.00%
Senior Notes and the
6.25%
Senior Notes entered into a registration rights agreement (the Registration Rights Agreement). During the second quarter of 2012, the Company repurchased
$81.2 million
and
$160.4 million
in aggregate principal amount of its
6.00%
and
6.25%
Senior Notes due 2018 and 2021, respectively, with existing cash on hand. The Company recognized a loss on debt extinguishment of
$2.8 million
associated with these repurchases, which was comprised of
$3.4 million
of expense related to the write-off of deferred financing costs and a gain of
$0.6 million
as the repurchases were made below par value. The loss is classified in "Interest expense" in the consolidated statement of operations for the year ended December 31, 2012. In the third quarter of 2012, the Company commenced an offer to exchange any and all of its
6.00%
and
6.25%
Senior Notes outstanding for substantially identical freely tradable debt securities registered under the Securities Act of 1933. The exchange offer was completed in October 2012 and did not affect the Company's indebtedness outstanding.
Convertible Junior Subordinated Debentures
As of
December 31, 2013
, the Company had
$732.5 million
aggregate principal outstanding of Debentures that generally require interest to be paid semiannually at a rate of
4.75%
per year. The Company may elect to, and to the extent that a mandatory trigger event (as defined in the indenture governing the Debentures and which does not necessarily involve an event of default) has occurred and is continuing will be required to, defer interest payments on the Debentures.
After five years of deferral at the Company’s option, or upon the occurrence of a mandatory trigger event
, the Company generally must sell warrants or preferred stock with specified characteristics and use the funds from that sale to pay deferred interest, subject to certain limitations. In no event may the Company defer payments of interest on the Debentures for more than
10
years.
The Debentures are convertible at any time on or prior to December 15, 2036 if any of the following conditions occur: (1) the Company’s closing common stock price exceeds
140%
of the then applicable conversion price for the Debentures (currently
$80.66
per share) for at least
20
of the final
30
trading days in any quarter; (2) a notice of redemption is issued with respect to the Debentures; (3) a change of control, as defined in the indenture governing the Debentures; (4) satisfaction of certain trading price conditions; and (5) other specified corporate transactions described in the indenture governing the Debentures. In addition, the Debentures are convertible at any time after December 15, 2036 to December 15, 2041, the scheduled maturity date. In the case of conversion following a notice of redemption or upon a non-stock change of control, as defined in the indenture governing the Debentures, holders may convert their Debentures into cash in the amount of the principal amount of their Debentures and shares of the Company’s common stock for any conversion value in excess of the principal amount. In all other conversion circumstances, holders will receive perpetual preferred stock (see Note 17. "Stockholders' Equity") with a liquidation preference equal to the principal amount of their Debentures, and any conversion value in excess of the principal amount will be settled with the Company’s common stock. As a result of the Patriot Coal Corporation (Patriot) spin-off, the conversion rate was adjusted. The conversion rate has also been adjusted when there has been a change in the Company’s dividend distribution rate. The current conversion rate is
17.3564
shares of common stock per
$1,000
principal amount of Debentures effective February 5, 2014. This adjusted conversion rate represents a conversion price of
$57.62
.
Between December 20, 2011 and December 19, 2036, the Company may redeem the Debentures, in whole or in part, if for
at least 20 out of the 30 consecutive trading days immediately prior to the date on which notice of redemption is given
, the Company’s closing common stock price has exceeded
130%
of the then applicable conversion price for the Debentures (currently
$74.91
per share). On or after December 20, 2036, whether or not the redemption condition is satisfied, the Company may redeem the Debentures, in whole or in part. The Company may not redeem any Debentures unless (1) all accrued and unpaid interest on the Debentures has been paid in full on or prior to the redemption date and (2) if any perpetual preferred stock is outstanding, the Company has first given notice to redeem the perpetual preferred stock in the same proportion as the redemption of the Debentures. Any redemption of the Debentures will be at a cash redemption price of
100%
of the principal amount of the Debentures to be redeemed, plus accrued and unpaid interest to the date of redemption.
On December 15, 2041, the scheduled maturity date, the Company is required to use commercially reasonable efforts, subject to the occurrence of a market disruption event, as defined in the indenture governing the Debentures, to issue securities of equivalent equity content in an amount sufficient to pay the principal amount of the Debentures, together with accrued and unpaid interest. At the final maturity date of the Debentures on December 15, 2066, the entire principal amount will become due and payable, together with accrued and unpaid interest.
F -
39
PEABODY ENERGY CORPORATION
NOTES TO CONSOLIDATED FINANCIAL STATEMENTS — (Continued)
In connection with the issuance of the Debentures, the Company entered into a Capital Replacement Covenant (the CRC). Pursuant to the CRC, the Company covenanted for the benefit of holders of covered debt, as defined in the CRC (currently the Company’s
7.875%
Senior Notes, issued in an aggregate principal amount of
$250.0 million
), that neither the Company nor any of its subsidiaries shall repay, redeem or repurchase all or any part of the Debentures on or after December 15, 2041 and prior to December 15, 2046, except to the extent that the total repayment, redemption or repurchase price does not exceed the sum of: (1)
400%
of the Company’s net cash proceeds from the sale of its common stock and rights to acquire its common stock (including common stock issued pursuant to the Company’s dividend reinvestment plan or employee benefit plans); (2) the Company’s net cash proceeds from the sale of its mandatorily convertible preferred stock, as defined in the CRC, or debt exchangeable for equity, as defined in the CRC; and (3) the Company’s net cash proceeds from the sale of other replacement capital securities, as defined in the CRC, in each case, during the six months prior to the notice date for the relevant payment, redemption or repurchase.
The Debentures are unsecured obligations of the Company, ranking junior to all existing and future senior and subordinated debt (excluding trade accounts payable or accrued liabilities arising in the ordinary course of business) except for any future debt that ranks equal to or junior to the Debentures. The Debentures rank equal in right of payment with the Company’s obligations to trade creditors. In addition, the Debentures are effectively subordinated to all indebtedness of the Company’s subsidiaries. The indenture governing the Debentures places no limitation on the amount of additional indebtedness that the Company or any of the Company’s subsidiaries may incur, but do impose certain financial covenants. The Company was in compliance with all such covenants as of December 31, 2013.
The Company accounts for the liability and equity components of the Debentures in a manner that reflects the nonconvertible debt borrowing rate when recognizing interest cost in subsequent periods. The following table illustrates the carrying amount of the equity and debt components of the Debentures:
|
|
December 31,
|
||||||
|
|
2013
|
2012
|
|||||
|
|
(Dollars in millions)
|
||||||
|
Carrying amount of the equity component
|
$
|
215.4
|
|
$
|
215.4
|
|
|
|
Principal amount of the liability component
|
$
|
732.5
|
|
$
|
732.5
|
|
|
|
Unamortized discount
|
(352.8
|
)
|
(355.1
|
)
|
|||
|
Net carrying amount
|
$
|
379.7
|
|
$
|
377.4
|
|
|
The following table illustrates the effective interest rate and the interest expense related to the Debentures:
|
|
Year Ended December 31,
|
||||||||||
|
|
2013
|
2012
|
2011
|
||||||||
|
|
(Dollars in millions)
|
||||||||||
|
Effective interest rate
|
4.9
|
%
|
4.9
|
%
|
4.9
|
%
|
|||||
|
Interest expense — contractual interest coupon
|
$
|
34.8
|
|
$
|
34.8
|
|
$
|
34.8
|
|
||
|
Interest expense — amortization of debt discount
|
2.3
|
|
2.1
|
|
1.8
|
|
|||||
The remaining period over which the discount will be amortized is
28
years as of
December 31, 2013
.
Capital Lease Obligations
In June 2013, the Company executed an amendment to its master equipment hire agreement with an unconsolidated equity affiliate in Australia to allow for the legal right of offset of receivables and payables due between parties. The operations of that equity affiliate are funded through equity interests and shareholder loans for the purpose of purchasing on behalf of and leasing equipment to its shareholders. Because the Company intends to use the right of offset provided by that amendment,
$51.9 million
of capital lease obligations due to that equity affiliate have been presented on a net basis in the consolidated balance sheet as of
December 31, 2013
and offset against the related shareholder loans due from that equity affiliate included in "Investments and other assets." Prior to the amendment, such amounts were presented on a gross basis in the Company's consolidated financial statements.
Refer to Note 13. "Leases" for additional information associated with the Company's capital leases, which pertain to the financing of mining equipment used in operations.
F -
40
PEABODY ENERGY CORPORATION
NOTES TO CONSOLIDATED FINANCIAL STATEMENTS — (Continued)
Debt Maturities, Interest Paid and Financing Costs
The aggregate amounts of long-term debt maturities (including unamortized debt discounts) subsequent to
December 31, 2013
, including capital lease obligations, were as follows:
|
|
|
|
||
|
Year of Maturity
|
(Dollars in millions)
|
|||
|
2014
|
$
|
31.7
|
|
|
|
2015
|
19.2
|
|
||
|
2016
|
666.3
|
|
||
|
2017
|
12.0
|
|
||
|
2018
|
1,530.8
|
|
||
|
2019 and thereafter
|
3,742.4
|
|
||
|
Total
|
$
|
6,002.4
|
|
|
Interest paid on long-term debt was
$388.2 million
,
$396.1 million
and
$205.3 million
for the years ended
December 31, 2013
,
2012
and
2011
, respectively.
Financing costs incurred with the issuance of the Company’s debt are being amortized to interest expense over the remaining term of the associated debt. The remaining balance at
December 31, 2013
was
$84.2 million
, of which
$69.6 million
will be amortized to interest expense over the next five years.
|
(13)
|
Leases
|
The Company leases equipment and facilities under various noncancelable lease agreements. Certain lease agreements require the maintenance of specified ratios and are subject to the restrictive covenants of the Company's credit facilities. Rental expense under operating leases, including expense related to short-term operating leases, was
$305.9 million
,
$247.5 million
and
$170.6 million
for the years ended
December 31, 2013
,
2012
and
2011
, respectively. One of the Company's operating lease agreements for underground mining equipment in Australia entered into in 2013 requires contingent rent to be paid only if and when certain coal is mined at a specified margin as defined in the agreements. There was
no
contingent expense related to that arrangement in 2013. The gross value of property, plant, and equipment under capital leases was
$175.1 million
as of
December 31, 2013
and
$162.5 million
as of
December 31, 2012
, related primarily to the leasing of mining equipment. The accumulated depreciation for these items was
$111.3 million
and
$83.3 million
at
December 31, 2013
and
2012
, respectively, and changes thereto have been included in "Depreciation, depletion and amortization" in the consolidated statements of operations.
The Company also leases coal reserves under agreements that require royalties to be paid as the coal is mined. Certain agreements also require minimum annual royalties to be paid regardless of the amount of coal mined during the year. Total royalty expense was
$546.0 million
,
$637.5 million
and
$610.6 million
for the years ended
December 31, 2013
,
2012
and
2011
, respectively.
A substantial amount of the coal mined by the Company is produced from mineral reserves leased from the owner. One of the major lessors is the U.S. government, from which the Company leases substantially all of the coal it mines in Wyoming under terms set by Congress and administered by the U.S. Bureau of Land Management. These leases are generally for an initial term of
ten years
but may be extended by diligent development and mining of the reserves until all economically recoverable reserves are depleted. The Company has met the diligent development requirements for substantially all of these federal leases either directly through production, by including the lease as a part of a logical mining unit with other leases upon which development has occurred, or by paying an advance royalty in lieu of continued operations. Annual production on these federal leases must total at least
1.0%
of the original amount of coal in the entire logical mining unit. In addition, royalties are payable monthly at a rate of
12.5%
of the gross realization from the sale of the coal mined using surface mining methods and at a rate of
8.0%
of the gross realization for coal produced using underground mining methods. The Company also leases coal reserves in Arizona from The Navajo Nation and the Hopi Tribe under leases that are administered by the U.S. Department of the Interior. These leases expire upon exhaustion of the leased reserves or upon the permanent ceasing of all mining activities on the related reserves as a whole. The royalty rates are also generally based upon a percentage of the gross realization from the sale of coal. These rates are subject to redetermination
every ten years
under the terms of the leases. The remainder of the leased coal is generally leased from state governments, land holding companies and various individuals. The duration of these leases varies greatly. Typically, the lease terms are automatically extended as long as active mining continues. Royalty payments are generally based upon a specified rate per ton or a percentage of the gross realization from the sale of the coal.
F -
41
PEABODY ENERGY CORPORATION
NOTES TO CONSOLIDATED FINANCIAL STATEMENTS — (Continued)
Mining and exploration in Australia is generally executed under leases or licenses granted by state governments. Mining leases are typically for an initial term of
up to 21 years
(but may be renewed) and contain conditions relating to such matters as minimum annual expenditures, restoration and rehabilitation. Royalties are paid to the state government as a percentage of the sales price. Generally landowners do not own the mineral rights or have the ability to grant rights to mine those minerals. These rights are retained by state governments. Compensation is payable to landowners for the loss of access to the land where the landowner retains the surface rights, and the amount and type of compensation can be determined by agreement or arbitration as provided in the mining law. Surface rights are typically acquired directly from landowners by mutual agreement.
Future minimum lease and royalty payments as of
December 31, 2013
are as follows:
|
Capital
Leases
|
Operating
Leases
|
Coal Lease
and
Royalty
Obligations
|
||||||||||
|
Year Ending December 31,
|
||||||||||||
|
|
(Dollars in millions)
|
|||||||||||
|
2014
|
$
|
19.7
|
|
$
|
207.4
|
|
$
|
285.8
|
|
|||
|
2015
|
4.2
|
|
195.4
|
|
290.2
|
|
||||||
|
2016
|
1.6
|
|
182.8
|
|
254.2
|
|
||||||
|
2017
|
0.5
|
|
168.4
|
|
6.3
|
|
||||||
|
2018
|
0.5
|
|
94.4
|
|
5.0
|
|
||||||
|
2019 and thereafter
|
11.1
|
|
114.1
|
|
41.1
|
|
||||||
|
Total minimum lease payments
|
37.6
|
|
$
|
962.5
|
|
$
|
882.6
|
|
||||
|
Less interest
|
7.1
|
|
|
|
|
|
||||||
|
Present value of minimum capital lease payments
|
$
|
30.5
|
|
|
|
|
|
|||||
As of
December 31, 2013
, certain of the Company’s coal lease obligations were secured by outstanding surety bonds totaling
$109.9 million
.
|
(14)
|
Asset Retirement Obligations
|
Reconciliations of the Company’s asset retirement obligations are as follows:
|
|
December 31,
|
||||||
|
|
2013
|
2012
|
|||||
|
|
(Dollars in millions)
|
||||||
|
Balance at beginning of year
|
$
|
687.5
|
|
$
|
615.2
|
|
|
|
Liabilities incurred or acquired
|
—
|
|
13.6
|
|
|||
|
Liabilities settled or disposed
|
(15.4
|
)
|
(12.8
|
)
|
|||
|
Accretion expense
|
39.3
|
|
34.3
|
|
|||
|
Revisions to estimates
|
1.4
|
|
37.2
|
|
|||
|
Balance at end of year
|
$
|
712.8
|
|
$
|
687.5
|
|
|
|
Balance at end of year — active locations
|
$
|
660.8
|
|
$
|
629.1
|
|
|
|
Balance at end of year — closed or inactive locations
|
$
|
52.0
|
|
$
|
58.4
|
|
|
The credit-adjusted, risk-free interest rates were
6.44%
,
6.28%
, and
5.76%
at
December 31, 2013
,
2012
and
2011
, respectively.
As of
December 31, 2013
and
2012
, the Company had
$568.4 million
and
$571.6 million
, respectively, in surety bonds and bank guarantees outstanding to secure reclamation obligations or activities. The amount of reclamation self-bonding in certain states in which the Company qualifies was
$1,365.1 million
and
$1,275.8 million
as of
December 31, 2013
and
2012
, respectively. Additionally, the Company had
$17.6 million
of letters of credit in support of reclamation obligations or activities as of December 31, 2013.
F -
42
PEABODY ENERGY CORPORATION
NOTES TO CONSOLIDATED FINANCIAL STATEMENTS — (Continued)
|
(15)
|
Postretirement Health Care and Life Insurance Benefits
|
The Company currently provides health care and life insurance benefits to qualifying salaried and hourly retirees and their dependents from benefit plans established by the Company. Plan coverage for health benefits is provided to future hourly and salaried retirees in accordance with the applicable plan document. Life insurance benefits are provided to future hourly retirees in accordance with the applicable labor agreement.
Net periodic postretirement benefit cost included the following components:
|
|
Year Ended December 31,
|
||||||||||
|
|
2013
|
2012
|
2011
|
||||||||
|
|
(Dollars in millions)
|
||||||||||
|
Service cost for benefits earned
|
$
|
15.8
|
|
$
|
14.9
|
|
$
|
13.9
|
|
||
|
Interest cost on accumulated postretirement benefit obligation
|
41.8
|
|
54.9
|
|
57.9
|
|
|||||
|
Amortization of prior service (credit) cost
|
(1.7
|
)
|
2.5
|
|
2.8
|
|
|||||
|
Amortization of actuarial loss
|
24.1
|
|
32.8
|
|
26.9
|
|
|||||
|
Settlement related to the Patriot bankruptcy reorganization
(1)
|
63.2
|
|
—
|
|
—
|
|
|||||
|
Special termination benefits
|
0.9
|
|
—
|
|
—
|
|
|||||
|
Net periodic postretirement benefit cost
|
$
|
144.1
|
|
$
|
105.1
|
|
$
|
101.5
|
|
||
|
(1)
|
Refer to Note 25. "Matters Related to the Bankruptcy of Patriot Coal Corporation" herein for additional details related to this transaction.
|
The following includes pre-tax amounts recorded in "Accumulated other comprehensive (loss) income":
|
|
Year Ended December 31,
|
||||||||||
|
|
2013
|
2012
|
2011
|
||||||||
|
|
(Dollars in millions)
|
||||||||||
|
Net actuarial (gain) loss arising during year
|
$
|
(24.3
|
)
|
$
|
(68.3
|
)
|
$
|
86.0
|
|
||
|
Prior service credit arising during year
|
—
|
|
(31.9
|
)
|
(1.4
|
)
|
|||||
|
Amortization:
|
|
|
|
|
|
|
|||||
|
Actuarial loss
|
(24.1
|
)
|
(32.8
|
)
|
(26.9
|
)
|
|||||
|
Prior service credit (cost)
|
1.7
|
|
(2.5
|
)
|
(2.8
|
)
|
|||||
|
Settlement related to the Patriot bankruptcy reorganization:
(1)
|
|||||||||||
|
Actuarial loss
|
(61.3
|
)
|
—
|
|
—
|
|
|||||
|
Prior service cost
|
(1.9
|
)
|
—
|
|
—
|
|
|||||
|
Total recorded in other comprehensive (income) loss
|
$
|
(109.9
|
)
|
$
|
(135.5
|
)
|
$
|
54.9
|
|
||
|
(1)
|
Refer to Note 25. "Matters Related to the Bankruptcy of Patriot Coal Corporation" herein for additional details related to this transaction.
|
The Company amortizes actuarial gain and loss using a
0%
corridor with an amortization period that covers the average future working lifetime of active employees (
11.96
years and
11.75
years at
January 1, 2014
and
2013
, respectively). The estimated net actuarial loss and prior service credit that will be amortized from accumulated other comprehensive income (loss) into net periodic postretirement benefit cost during the year ending December 31, 2014 are
$14.5 million
and
$1.8 million
, respectively.
F -
43
PEABODY ENERGY CORPORATION
NOTES TO CONSOLIDATED FINANCIAL STATEMENTS — (Continued)
The following table sets forth the plans' funded status reconciled with the amounts shown in the consolidated balance sheets:
|
|
December 31,
|
||||||
|
|
2013
|
2012
|
|||||
|
|
(Dollars in millions)
|
||||||
|
Change in benefit obligation:
|
|
|
|
|
|||
|
Accumulated postretirement benefit obligation at beginning of period
|
$
|
1,026.1
|
|
$
|
1,121.5
|
|
|
|
Service cost
|
15.8
|
|
14.9
|
|
|||
|
Interest cost
|
41.8
|
|
54.9
|
|
|||
|
Participant contributions
|
2.3
|
|
2.3
|
|
|||
|
Plan changes
(1)
|
—
|
|
(31.9
|
)
|
|||
|
Benefits paid
|
(66.5
|
)
|
(67.3
|
)
|
|||
|
Actuarial gain
|
(24.3
|
)
|
(68.3
|
)
|
|||
|
Settlement related to the Patriot bankruptcy reorganization
(2)
|
(260.7
|
)
|
—
|
|
|||
|
Special termination benefits
|
0.9
|
|
—
|
|
|||
|
Accumulated postretirement benefit obligation at end of period
|
735.4
|
|
1,026.1
|
|
|||
|
Change in plan assets:
|
|
|
|
|
|||
|
Fair value of plan assets at beginning of period
|
—
|
|
—
|
|
|||
|
Employer contributions
|
64.2
|
|
65.0
|
|
|||
|
Participant contributions
|
2.3
|
|
2.3
|
|
|||
|
Benefits paid and administrative fees (net of Medicare Part D reimbursements)
|
(66.5
|
)
|
(67.3
|
)
|
|||
|
Fair value of plan assets at end of period
|
—
|
|
—
|
|
|||
|
Funded status at end of year
|
(735.4
|
)
|
(1,026.1
|
)
|
|||
|
Less current portion (included in "Accounts payable and accrued expenses")
|
51.4
|
|
65.4
|
|
|||
|
Noncurrent obligation (included in "Accrued postretirement benefit costs")
|
$
|
(684.0
|
)
|
$
|
(960.7
|
)
|
|
|
(1)
|
Effective January 1, 2013, certain participants for whom the Company pays retiree healthcare liabilities began participation in a Medicare Advantage Program.
|
|
(2)
|
Refer to Note 25. "Matters Related to the Bankruptcy of Patriot Coal Corporation" herein for additional details related to this transaction.
|
The weighted-average assumptions used to determine the benefit obligations as of the end of each year were as follows:
|
|
December 31,
|
||||
|
|
2013
|
2012
|
|||
|
Discount rate
|
4.90
|
%
|
4.21
|
%
|
|
|
Rate of compensation increase
|
N/A
|
|
N/A
|
|
|
|
Measurement date
|
December 31, 2013
|
|
December 31, 2012
|
|
|
The weighted-average assumptions used to determine net periodic benefit cost during each year were as follows:
|
|
Year Ended December 31,
|
|||||||
|
|
2013
|
2012
|
2011
|
|||||
|
Discount rate
|
4.21
|
%
|
5.05
|
%
|
5.81
|
%
|
||
|
Rate of compensation increase
|
N/A
|
|
N/A
|
|
3.50
|
%
|
||
|
Measurement date
|
December 31, 2012
|
|
December 31, 2011
|
|
December 31, 2010
|
|
||
F -
44
PEABODY ENERGY CORPORATION
NOTES TO CONSOLIDATED FINANCIAL STATEMENTS — (Continued)
The following presents information about the assumed health care cost trend rate:
|
|
Year Ended December 31,
|
||||
|
|
2013
|
2012
|
|||
|
Health care cost trend rate assumed for next year
|
6.26
|
%
|
6.43
|
%
|
|
|
Rate to which the cost trend is assumed to decline (the ultimate trend rate)
|
4.67
|
%
|
4.67
|
%
|
|
|
Year that the rate reaches the ultimate trend rate
|
2023
|
|
2023
|
|
|
Assumed health care cost trend rates have a significant effect on the expense and liability amounts reported for health care plans. A one-percentage-point change in the assumed health care cost trend would have the following effects:
|
One Percentage-
Point Increase
|
One Percentage-
Point Decrease
|
||||||
|
|
(Dollars in millions)
|
||||||
|
Effect on total service and interest cost components
(1)
|
$
|
5.1
|
|
$
|
(4.6
|
)
|
|
|
Effect on total postretirement benefit obligation
(1)
|
$
|
64.5
|
|
$
|
(56.7
|
)
|
|
|
(1)
|
In addition to the effect on total service and interest cost components of expense, changes in trend rates would also increase or decrease the actuarial gain or loss amortization expense component. The impact on actuarial gain or loss amortization would approximate the increase or decrease in the obligation divided by
11.96
years at January 1, 2014.
|
Plan Assets
The Company’s postretirement benefit plans are unfunded.
Estimated Future Benefit Payments
The following benefit payments (net of retiree contributions), which reflect expected future service, as appropriate, are expected to be paid by the Company:
|
|
Postretirement
|
||
|
|
Benefits
|
||
|
|
(Dollars in millions)
|
||
|
2014
|
$
|
51.4
|
|
|
2015
|
52.5
|
|
|
|
2016
|
53.6
|
|
|
|
2017
|
54.3
|
|
|
|
2018
|
54.7
|
|
|
|
Years 2019-2023
|
277.0
|
|
|
|
(16)
|
Pension and Savings Plans
|
One of the Company’s subsidiaries, Peabody Investments Corp. (PIC), sponsors a defined benefit pension plan covering certain U.S. salaried employees and eligible hourly employees at certain PIC subsidiaries (the Peabody Plan). A subsidiary of PIC also has a defined benefit pension plan covering eligible employees who are represented by the United Mine Workers of America (UMWA) under the Western Surface Agreement (the Western Plan). PIC also sponsors an unfunded supplemental retirement plan to provide senior management with benefits in excess of limits under the federal tax law (collectively, the Plans).
Effective May 31, 2008, the Peabody Plan was frozen in its entirety for both participation and benefit accrual purposes. The Company adopted an enhanced savings plan contribution structure in lieu of benefits formerly accrued under the Peabody Plan.
F -
45
PEABODY ENERGY CORPORATION
NOTES TO CONSOLIDATED FINANCIAL STATEMENTS — (Continued)
Net periodic pension cost included the following components:
|
|
Year Ended December 31,
|
||||||||||
|
|
2013
|
2012
|
2011
|
||||||||
|
|
(Dollars in millions)
|
||||||||||
|
Service cost for benefits earned
|
$
|
2.2
|
|
$
|
2.0
|
|
$
|
1.7
|
|
||
|
Interest cost on projected benefit obligation
|
42.2
|
|
46.7
|
|
49.8
|
|
|||||
|
Expected return on plan assets
|
(59.5
|
)
|
(63.7
|
)
|
(64.4
|
)
|
|||||
|
Amortization of prior service cost
|
1.0
|
|
1.0
|
|
1.0
|
|
|||||
|
Amortization of net actuarial losses
|
65.7
|
|
48.6
|
|
30.1
|
|
|||||
|
Total net periodic pension cost
|
$
|
51.6
|
|
$
|
34.6
|
|
$
|
18.2
|
|
||
The following includes pre-tax amounts recorded in "Accumulated other comprehensive (loss) income":
|
|
Year Ended December 31,
|
||||||||||
|
|
2013
|
2012
|
2011
|
||||||||
|
|
(Dollars in millions)
|
||||||||||
|
Net actuarial (gain) loss arising during year
|
$
|
(133.8
|
)
|
$
|
67.6
|
|
$
|
144.2
|
|
||
|
Prior service cost arising during year
|
2.2
|
|
—
|
|
—
|
|
|||||
|
Amortization:
|
|
|
|
|
|
|
|||||
|
Net actuarial loss
|
(65.7
|
)
|
(48.6
|
)
|
(30.1
|
)
|
|||||
|
Prior service cost
|
(1.0
|
)
|
(1.0
|
)
|
(1.0
|
)
|
|||||
|
Total recorded in other comprehensive (income) loss
|
$
|
(198.3
|
)
|
$
|
18.0
|
|
$
|
113.1
|
|
||
The Company amortizes actuarial gain and loss using a
5%
corridor with a
five
-year amortization period. The estimated net actuarial loss and prior service cost that will be amortized from accumulated other comprehensive income (loss) into net periodic pension cost during the year ending December 31, 2014 are
$30.2 million
and
$1.3 million
, respectively.
F -
46
PEABODY ENERGY CORPORATION
NOTES TO CONSOLIDATED FINANCIAL STATEMENTS — (Continued)
The following summarizes the change in benefit obligation, change in plan assets and funded status of the Plans:
|
|
December 31,
|
||||||
|
|
2013
|
2012
|
|||||
|
|
(Dollars in millions)
|
||||||
|
Change in benefit obligation:
|
|
|
|
|
|||
|
Projected benefit obligation at beginning of period
|
$
|
1,058.6
|
|
$
|
963.6
|
|
|
|
Service cost
|
2.2
|
|
2.0
|
|
|||
|
Interest cost
|
42.2
|
|
46.7
|
|
|||
|
Benefits paid
|
(59.1
|
)
|
(54.1
|
)
|
|||
|
Actuarial (gain) loss
|
(98.8
|
)
|
100.4
|
|
|||
|
Plan amendments
|
2.2
|
|
—
|
|
|||
|
Projected benefit obligation at end of period
|
947.3
|
|
1,058.6
|
|
|||
|
Change in plan assets:
|
|
|
|
|
|||
|
Fair value of plan assets at beginning of period
|
813.7
|
|
769.6
|
|
|||
|
Actual return on plan assets
|
94.5
|
|
96.5
|
|
|||
|
Employer contributions
|
2.3
|
|
1.7
|
|
|||
|
Benefits paid
|
(59.1
|
)
|
(54.1
|
)
|
|||
|
Fair value of plan assets at end of period
|
851.4
|
|
813.7
|
|
|||
|
Funded status at end of year
|
$
|
(95.9
|
)
|
$
|
(244.9
|
)
|
|
|
Amounts recognized in the consolidated balance sheets:
|
|
|
|
|
|||
|
Current obligation (included in "Accounts payable and accrued expenses")
|
$
|
(1.7
|
)
|
$
|
(1.7
|
)
|
|
|
Noncurrent obligation (included in "Other noncurrent liabilities")
|
(94.2
|
)
|
(243.2
|
)
|
|||
|
Net amount recognized
|
$
|
(95.9
|
)
|
$
|
(244.9
|
)
|
|
The weighted-average assumptions used to determine the benefit obligations as of the end of each year were as follows:
|
|
December 31,
|
||||
|
|
2013
|
2012
|
|||
|
Discount rate
|
4.95
|
%
|
4.10
|
%
|
|
|
Measurement date
|
December 31, 2013
|
|
December 31, 2012
|
|
|
The weighted-average assumptions used to determine net periodic benefit cost during each year were as follows:
|
|
Year Ended December 31,
|
|||||||
|
|
2013
|
2012
|
2011
|
|||||
|
Discount rate
|
4.10
|
%
|
5.00
|
%
|
5.84
|
%
|
||
|
Expected long-term return on plan assets
|
7.75
|
%
|
8.00
|
%
|
8.25
|
%
|
||
|
Measurement date
|
December 31, 2012
|
|
December 31, 2011
|
|
December 31, 2010
|
|
||
The expected rate of return on plan assets is determined by taking into consideration expected long-term returns associated with each major asset class (net of inflation) based on long-term historical ranges, inflation assumptions and the expected net value from active management of the assets based on actual results. Effective January 1, 2014, the Company lowered its expected rate of return on plan assets from
7.75%
to
6.85%
reflecting the impact of the Company's asset allocation.
The projected benefit obligation and the accumulated benefit obligation exceeded plan assets for all plans as of
December 31, 2013
and
2012
. The accumulated benefit obligation for all plans was
$947.3 million
and
$1,058.6 million
as of
December 31, 2013
and
2012
, respectively.
F -
47
PEABODY ENERGY CORPORATION
NOTES TO CONSOLIDATED FINANCIAL STATEMENTS — (Continued)
Assets of the Plans
Assets of the PIC Master Trust (the Master Trust) are invested in accordance with investment guidelines established by the Peabody Plan Retirement Committee and the Western Plan Retirement Committee (collectively, the Retirement Committees) after consultation with outside investment advisors and actuaries.
The asset allocation targets have been set with the expectation that the assets of the Master Trust will be managed with an appropriate level of risk to fund each Plan's expected liabilities. To determine the appropriate target asset allocations, the Retirement Committees consider the demographics of each Plan's participants, the funded status of each Plan, the business and financial profile of the Company and other associated risk preferences. These allocation targets are reviewed by the Retirement Committees on a regular basis and revised as necessary. In 2013, the Retirement Committees developed and implemented a dynamic asset-liability management investment strategy (the Dynamic Investment Strategy) designed to reduce each Plan's funded status volatility risk as funded status increases resulting from changes in liabilities due to discount rates and other factors, investment returns and funding contributions. The Dynamic Investment Strategy adjusts allocations between return-seeking (i.e., equities and other similar investments) and liability hedging (i.e., fixed income duration and derivative spread exposure) portfolios in a pre-established manner, with changes triggered when the Plans reach certain funded status thresholds. The Company sold equity securities and invested in various fixed income investments throughout 2013 in accordance with its Dynamic Investment Strategy. As of December 31, 2013, the investment portfolio reflected an asset mix of
35%
equity securities and
65%
fixed income investments compared to December 31, 2012 investment portfolio target allocations of
55%
equity securities and
45%
fixed income investments. Master Trust assets also include funds invested in various real estate properties representing approximately
4%
of total Master Trust assets as of December 31, 2013. The Retirement Committees' intention is to liquidate these real estate holdings when allowable per the terms of the limited partnership agreements. Generally, dissolution and liquidation of the limited partnerships is required before the Master Trust’s real estate holdings can be liquidated and is estimated to occur at various times through 2021.
Assets of the Master Trust are either under active management by third-party investment advisors or in index funds, all of which are selected and monitored by the Retirement Committees. Specific investment guidelines have been established by the Retirement Committees for each major asset class including performance benchmarks, allowable and prohibited investment types and concentration limits. In general, investment guidelines do not permit leveraging the assets held in the Master Trust. However, investment managers may employ various strategies and derivative instruments in establishing overall portfolio characteristics consistent with the guidelines and investment objectives established by the Retirement Committees for their portfolios. Equity investment guidelines do not permit entering into put or call options (except as deemed appropriate to manage currency risk), and futures contracts are permitted only to the extent necessary to facilitate liquidity management. Fixed income investment guidelines only allow for exchange-traded derivatives if the investment manager deems the derivative vehicle to be more attractive than a similar direct investment in an underlying cash market or to manage the duration of the fixed income portfolio.
A financial instrument’s level within the valuation hierarchy is based upon the lowest level of input that is significant to the fair value measurement. Following is a description of the valuation techniques and inputs used for investments measured at fair value, including the general classification of such investments pursuant to the valuation hierarchy.
U.S. equity securities.
The Master Trust invests in U.S. equity securities for growth and diversification. Investment vehicles include a mutual fund (benchmarked against the performance of the S&P 500 Index) that invests in large-cap publicly traded common stocks and a common/collective trust (benchmarked against the performance of the Russell 2000 Index) that invests in small-cap publicly traded common stocks. The mutual fund, which is traded on a national securities exchange in an active market, is valued using daily publicly quoted net asset value (NAV) prices and accordingly classified within Level 1 of the valuation hierarchy. The common/collective trust (CCT), which is not publicly traded on a national securities exchange, is valued using a NAV that is based on a derived price in an active market and accordingly classified within Level 2 of the valuation hierarchy. U.S. equity securities are not subject to liquidity redemption restrictions.
International equity securities.
The Master Trust invests in international equity securities for growth and diversification. Investment vehicles include a CCT that invests in publicly traded non-U.S. equity securities (the Equity CCT) and another CCT (benchmarked against the performance of the MSCI Emerging Markets Index) that primarily invests in equity index securities of companies in global emerging markets (the Equity Index CCT), collectively, the CCTs. Equity and equity index securities within both CCTs are valued using the closing price reported by their primary stock exchange and translated at each valuation date from local currency into U.S. dollars based on independently published currency exchange rates. The NAV is determined in U.S. dollars and calculated as of the last business day of each month for the Equity CCT and daily for the Equity Index CCT. Both CCTs are classified within the Level 2 valuation hierarchy since NAV is based on a derived price in an active market and is not traded on a national securities exchange. Redemptions for both CCTs are at NAV. Equity CCT redemptions can only occur on the first business day of each month subject to a notification period and minimum withdrawal limits. Equity Index CCT redemptions can occur daily.
F -
48
PEABODY ENERGY CORPORATION
NOTES TO CONSOLIDATED FINANCIAL STATEMENTS — (Continued)
Debt securities.
The Master Trust invests in debt securities for diversification, volatility reduction of equity securities and to provide a hedge to interest rate movements affecting liabilities. As of December 31, 2013, investment vehicles include numerous U.S. government and agency securities, investment-grade corporate bonds, U.S. municipal bonds, non-U.S. government bonds and an institutional mutual fund that holds a diversified portfolio of long-duration corporate fixed income investments. Fair value for these securities is provided by a third-party pricing service that utilizes various inputs such as benchmark yields, reported trades, broker/dealer quotes, issuer spreads and benchmark securities as well as other relevant economic measures. If fair value is based on quoted prices in active markets and traded on a national securities exchange, debt securities are classified within the Level 1 valuation hierarchy; otherwise, debt securities are classified within the Level 2 valuation hierarchy. NAV for the institutional mutual fund is calculated daily in actively traded markets and is classified within the Level 2 valuation hierarchy since fair value inputs are derived prices in active markets and the fund is not traded on a national securities exchange. As of December 31, 2012, an institutional mutual fund also held mortgage-backed debt securities. Debt securities are not subject to liquidity redemption restrictions.
Short-term investments.
The Master Trust invests in short-term investments to manage liquidity resulting from payment of participant benefits and certain administrative fees. Investment vehicles primarily include a non-interest bearing cash fund with an earnings credit allowance feature; an institutional mutual fund that consists of a diversified portfolio of liquid, short-term instruments of varying maturities; and various exchange-traded derivative instruments consisting of futures and interest rate swap agreements used to manage the duration of certain liability-hedging investments. The non-interest bearing cash fund is classified within the Level 1 valuation hierarchy. The institutional mutual fund is classified within the Level 2 valuation hierarchy since fair value inputs are derived prices in active markets and the fund is not traded on a national securities exchange. Exchange traded derivatives, such as options and futures, for which market quotations are readily available, are valued at the last reported sale price or official closing price on the primary market or exchange on which they are traded and are classified within the Level 1 valuation hierarchy. Short-term investments are not subject to liquidity redemption restrictions.
Interests in real estate.
The Master Trust invests in real estate interests for diversification. Investments in real estate represent interests in several limited partnerships, which invest in various real estate properties. Interests in real estate are valued using various methodologies, including independent third party appraisals; fair value measurements are not developed by the Company. For some investments, little market activity may exist and determination of fair value is then based on the best information available in the circumstances. This involves a significant degree of judgment by taking into consideration a combination of internal and external factors. Accordingly, interests in real estate are classified within the Level 3 valuation hierarchy. Some limited partnerships issue dividends to their investors in the form of cash distributions that the Plans invest elsewhere within the Master Trust. Certain interests in real estate are subject to liquidity redemption restrictions and voluntary redemptions are generally not permitted. Upon liquidation of the limited partnerships, redemptions will generally be in the form of cash distributions and invested elsewhere within the Master Trust.
The methods described above may produce a fair value calculation that may not be indicative of net realizable value or reflective of future fair values. Furthermore, while the Company believes its valuation methods are appropriate and consistent with other market participants, the use of different methodologies or assumptions to determine the fair value of certain financial instruments could result in a different fair value measurement at the reporting date. The inputs or methodologies used for valuing investments are not necessarily an indication of the risk associated with investing in those investments.
The following tables present the fair value of assets in the Master Trust by asset category and by fair value hierarchy:
|
|
December 31, 2013
|
||||||||||||||
|
|
Level 1
|
Level 2
|
Level 3
|
Total
|
|||||||||||
|
|
(Dollars in millions)
|
||||||||||||||
|
U.S. equity securities
|
$
|
141.8
|
|
$
|
54.2
|
|
$
|
—
|
|
$
|
196.0
|
|
|||
|
International equity securities
|
—
|
|
80.6
|
|
—
|
|
80.6
|
|
|||||||
|
U.S. debt securities
|
30.6
|
|
30.7
|
|
—
|
|
61.3
|
|
|||||||
|
International debt securities
|
—
|
|
21.9
|
|
—
|
|
21.9
|
|
|||||||
|
Corporate debt securities
|
—
|
|
424.3
|
|
—
|
|
424.3
|
|
|||||||
|
Short-term investments
|
23.9
|
|
13.5
|
|
—
|
|
37.4
|
|
|||||||
|
Interests in real estate
|
—
|
|
—
|
|
29.9
|
|
29.9
|
|
|||||||
|
Total assets at fair value
|
$
|
196.3
|
|
$
|
625.2
|
|
$
|
29.9
|
|
$
|
851.4
|
|
|||
F -
49
PEABODY ENERGY CORPORATION
NOTES TO CONSOLIDATED FINANCIAL STATEMENTS — (Continued)
|
|
December 31, 2012
|
||||||||||||||
|
|
Level 1
(1)
|
Level 2
(1)
|
Level 3
|
Total
|
|||||||||||
|
|
(Dollars in millions)
|
||||||||||||||
|
U.S. equity securities
|
$
|
255.6
|
|
$
|
83.6
|
|
$
|
—
|
|
$
|
339.2
|
|
|||
|
International equity securities
|
—
|
|
126.1
|
|
—
|
|
126.1
|
|
|||||||
|
Mortgage-backed debt securities
|
—
|
|
105.2
|
|
—
|
|
105.2
|
|
|||||||
|
U.S. debt securities
|
5.7
|
|
104.9
|
|
—
|
|
110.6
|
|
|||||||
|
International debt securities
|
—
|
|
35.4
|
|
—
|
|
35.4
|
|
|||||||
|
Corporate debt securities
|
—
|
|
54.9
|
|
—
|
|
54.9
|
|
|||||||
|
Short-term investments
|
8.1
|
|
6.4
|
|
—
|
|
14.5
|
|
|||||||
|
Interests in real estate
|
—
|
|
—
|
|
27.8
|
|
27.8
|
|
|||||||
|
Total assets at fair value
|
$
|
269.4
|
|
$
|
516.5
|
|
$
|
27.8
|
|
$
|
813.7
|
|
|||
|
(1)
|
Certain amounts have been revised from a Level 1 to a Level 2 fair value hierarchy classification and between asset categories to conform to the current year presentation, which had no effect on previously reported consolidated results and was not material to the notes to the consolidated financial statements.
|
The table below sets forth a summary of changes in the fair value of the Master Trust’s Level 3 investments:
|
|
Year Ended December 31,
|
||||||
|
2013
|
2012
|
||||||
|
|
(Dollars in millions)
|
||||||
|
Balance, beginning of year
|
$
|
27.8
|
|
$
|
25.3
|
|
|
|
Realized gains
|
0.7
|
|
—
|
|
|||
|
Unrealized gains relating to investments still held at the reporting date
|
2.6
|
|
2.5
|
|
|||
|
Purchases, sales and settlements, net
|
(1.2
|
)
|
—
|
|
|||
|
Balance, end of year
|
$
|
29.9
|
|
$
|
27.8
|
|
|
Contributions
Annual contributions to qualified plans are made in accordance with minimum funding standards and the Company's agreement with the Pension Benefit Guaranty Corporation (PBGC). Funding decisions also consider certain funded status thresholds defined by the Pension Protection Act of 2006 (generally
80%
). On July 6, 2012, the Moving Ahead for Progress in the 21st Century Act (MAP-21), a highway reauthorization and student loan bill that included both pension funding stabilization provisions and PBGC premium increases, was signed into law. The pension funding stabilization provisions temporarily increased the discount rates used to determine pension liabilities for purposes of minimum funding requirements. MAP-21 is not expected to change the Company's total required cash contributions over the long term, but is expected to reduce the Company's required cash contributions through 2015 relative to prior law. As of December 31, 2013, the Company's qualified plans are expected to be at or above the Pension Protection Act thresholds and will therefore avoid benefit restrictions and at-risk penalties for 2014. The Company expects to contribute approximately
$13 million
to its pension plans to meet minimum funding requirements for its qualified plans and benefit payments for its non-qualified plans in 2014.
F -
50
PEABODY ENERGY CORPORATION
NOTES TO CONSOLIDATED FINANCIAL STATEMENTS — (Continued)
Estimated Future Benefit Payments
The following benefit payments, which reflect expected future service, as appropriate, are expected to be paid by the Master Trust:
|
|
Pension Benefits
|
||
|
|
(Dollars in millions)
|
||
|
2014
|
$
|
58.9
|
|
|
2015
|
60.6
|
|
|
|
2016
|
62.1
|
|
|
|
2017
|
63.6
|
|
|
|
2018
|
64.7
|
|
|
|
Years 2019-2023
|
329.0
|
|
|
Defined Contribution Plans
The Company sponsors employee retirement accounts under
three
401(k) plans for eligible U.S. employees. The Company matches voluntary contributions to each plan up to specified levels. The expense for these plans was
$46.4 million
,
$51.1 million
and
$54.5 million
for the years ended
December 31, 2013
,
2012
and
2011
, respectively. A performance contribution feature in one of the plans allows for additional contributions from the Company based upon meeting specified Company performance targets. Performance contributions paid during the years ended
December 31, 2013
,
2012
and
2011
were
$16.5 million
,
$22.5 million
and
$20.0 million
, respectively.
|
(17)
|
Stockholders’ Equity
|
Common Stock
The Company has
800.0 million
authorized shares of
$0.01
par value common stock. Holders of common stock are entitled to
one vote per share
on all matters to be voted upon by the stockholders. The holders of common stock do not have cumulative voting rights in the election of directors. Holders of common stock are entitled to receive ratably dividends if, as and when dividends are declared from time to time by the Company’s Board of Directors out of funds legally available for that purpose, after payment of dividends required to be paid on outstanding preferred stock or series common stock, as described below. Upon liquidation, dissolution or winding up, any business combination or a sale or disposition of all or substantially all of the assets, the holders of common stock are entitled to receive ratably the assets available for distribution to the stockholders after payment of liabilities and accrued but unpaid dividends and liquidation preferences on any outstanding preferred stock or series common stock. The common stock has no preemptive or conversion rights and is not subject to further calls or assessment by the Company. There are no redemption or sinking fund provisions applicable to the common stock.
The following table summarizes common stock activity from January 1, 2011 to
December 31, 2013
:
|
2013
|
2012
|
2011
|
||||||
|
(In millions)
|
||||||||
|
Shares outstanding at the beginning of the year
|
268.6
|
|
271.1
|
|
270.2
|
|
||
|
Stock options exercised
|
0.1
|
|
0.2
|
|
0.3
|
|
||
|
Stock grants to employees
|
1.0
|
|
1.5
|
|
0.7
|
|
||
|
Employee stock purchases
|
0.5
|
|
0.3
|
|
0.2
|
|
||
|
Shares relinquished
|
(0.1
|
)
|
(0.3
|
)
|
(0.3
|
)
|
||
|
Shares repurchased
|
—
|
|
(4.2
|
)
|
—
|
|
||
|
Shares outstanding at the end of the year
|
270.1
|
|
268.6
|
|
271.1
|
|
||
F -
51
PEABODY ENERGY CORPORATION
NOTES TO CONSOLIDATED FINANCIAL STATEMENTS — (Continued)
Preferred Stock and Series Common Stock
The Board of Directors is authorized to issue up to
10.0 million
shares of preferred stock and up to
40.0 million
shares of series common stock, both with a
$0.01
per share par value. The Board of Directors can determine the terms and rights of each series, whether dividends (if any) will be cumulative or non-cumulative and the dividend rate of the series, redemption or sinking fund provisions, conversion terms, prices and rates and amounts payable on shares of the series in the event of any voluntary or involuntary liquidation, dissolution or winding up of the affairs of the Company and whether the shares of the series will be convertible into shares of any other class or series, or any other security, of the Company or any other corporation. The Board of Directors may also determine restrictions on the issuance of shares of the same series or of any other class or series, and the voting rights (if any) of the holders of the series. There were no outstanding shares of preferred stock or series common stock as of
December 31, 2013
.
Perpetual Preferred Stock
As discussed in Note 12. "Long-term Debt," the Company had
$732.5 million
aggregate principal amount of the Debentures outstanding as of
December 31, 2013
. Perpetual preferred stock issued upon a conversion of the Debentures will be fully paid and non-assessable, and holders will have no preemptive or preferential right to purchase any of the Company’s other securities. The perpetual preferred stock has a liquidation preference of
$1,000
per share, is not convertible and is redeemable at the Company’s option at any time at a cash redemption price per share equal to the liquidation preference plus any accumulated dividends. Holders are entitled to receive cumulative dividends at an annual rate of
3.0875%
if and when declared by the Company’s Board of Directors. If the Company fails to pay dividends on the perpetual preferred stock for
five
years, or upon the occurrence of a mandatory trigger event, as defined in the certificate of designations governing the perpetual preferred stock, the Company generally must sell warrants or preferred stock with specified characteristics and use the funds from that sale to pay accumulated dividends after the payment in full of any deferred interest on the Debentures, subject to certain limitations. In the event of a mandatory trigger event, the Company may not declare dividends on the perpetual preferred stock other than those funded through the sale of warrants or preferred stock as described above. Any deferred interest on the Debentures at the time of notice of conversion will be reflected as accumulated dividends on the perpetual preferred stock at issuance. Additionally, holders of the perpetual preferred stock are entitled to elect
two
additional members to serve on the Company’s Board of Directors if (1) prior to any remarketing of the perpetual preferred stock, the Company fails to declare and pay dividends with respect to the perpetual preferred stock for
10
consecutive years or (2) after any successful remarketing or any final failed remarketing of the perpetual preferred stock, the Company fails to declare and pay
six
dividends thereon, whether or not consecutive. The perpetual preferred stock may be remarketed at the holder’s election after December 15, 2046 or earlier, upon the first occurrence of a change of control if the Company does not redeem the perpetual preferred stock. There were no outstanding shares of perpetual preferred stock as of
December 31, 2013
.
Treasury Stock
Share repurchases.
The Company has a share repurchase program for its common stock with an authorized amount of
$1.0 billion
in which repurchases may be made from time to time based on an evaluation of the Company’s outlook and general business conditions, as well as alternative investment and debt repayment options (Repurchase Program). The Repurchase Program does not have an expiration date and may be discontinued at any time. Through
December 31, 2013
, the Company had made total repurchases of
7.7 million
shares at a cost of
$299.6 million
(
$199.8 million
in 2008 and
$99.8 million
in 2006), leaving
$700.4 million
available under the Repurchase Program. No share repurchases were made under the Repurchase Program during the years ended December 31, 2013, 2012 and 2011.
The Company’s Chairman and Chief Executive Officer had authority to direct the Company to repurchase up to
$100.0 million
of common stock outside of the share repurchase program. During the second quarter of 2012, the Company utilized existing cash on hand to repurchase
4.2 million
shares of outstanding common stock for
$99.9 million
pursuant to that authority through open-market transactions.
Shares relinquished.
The Company routinely allows employees to relinquish common stock to pay estimated taxes upon the payout of performance units that are settled in common stock and the vesting of restricted stock. The number of shares of common stock relinquished was
0.1 million
for the year ended
December 31, 2013
and
0.3 million
for the years ended December 31, 2012 and 2011. The value of the common stock tendered by employees was based upon the closing price on the dates of the respective transactions.
F -
52
PEABODY ENERGY CORPORATION
NOTES TO CONSOLIDATED FINANCIAL STATEMENTS — (Continued)
|
(18)
|
Share-Based Compensation
|
The Company has an equity incentive plan for employees and non-employee directors that allows for the issuance of share-based compensation in the form of stock appreciation rights, restricted stock, performance awards, incentive stock options, nonqualified stock options, deferred stock units and restricted stock units. The plan made
14.0 million
shares of the Company’s common stock available for grant, with
9.4 million
shares available for grant as of
December 31, 2013
. The Company has
two
employee stock purchase plans that provide for the purchase of up to
6.0 million
shares of the Company’s common stock, with
5.0 million
shares authorized for purchase by U.S. employees and
1.0 million
shares authorized for purchase by Australian employees.
Share-Based Compensation Expense and Cash Flows
The Company’s share-based compensation expense is recorded in “Selling and administrative expenses” in the consolidated statements of operations. Cash received by the Company upon the exercise of stock options and when employees purchase stock under the employee stock purchase plans is reflected as a financing activity in the consolidated statements of cash flows. Share-based compensation expense and cash flow amounts were as follows:
|
|
Year Ended December 31,
|
||||||||||
|
|
2013
|
2012
|
2011
|
||||||||
|
|
(Dollars in millions)
|
||||||||||
|
Share-based compensation expense
|
$
|
50.9
|
|
$
|
45.4
|
|
$
|
43.9
|
|
||
|
Tax benefit
|
18.8
|
|
16.7
|
|
16.3
|
|
|||||
|
Share-based compensation expense, net of tax benefit
|
32.1
|
|
28.7
|
|
27.6
|
|
|||||
|
Cash received upon the exercise of stock options and from employee stock purchases
|
7.3
|
|
9.4
|
|
11.1
|
|
|||||
|
(Write-off) excess tax benefits related to share-based compensation
|
(4.5
|
)
|
8.3
|
|
8.1
|
|
|||||
As of
December 31, 2013
, the total unrecognized compensation cost related to nonvested awards was
$29.5 million
, net of taxes, which is expected to be recognized over
three
years with a weighted-average period of
0.8
years.
Deferred Stock Units
In
2013
,
2012
and
2011
, the Company granted deferred stock units to each of its non-employee directors. The fair value of these units is equal to the market price of the Company’s common stock at the date of grant. These deferred stock units generally vest after
one
year and are settled in common stock on the specified distribution date elected by each non-employee director. Beginning in 2011, non-employee directors were also given the option to receive their total annual cash retainer in the form of additional deferred stock units (based on the fair market value of the Company's common stock on the date of grant). The additional grant of deferred stock units is subject to the same grant timing, vesting and distribution date elections as the annual equity compensation grant.
Restricted Stock Awards
The primary share-based compensation tool used by the Company for its employees is awards of restricted stock. The majority of restricted stock awards are granted in January of each year, with a lesser portion granted in the first month of the subsequent three quarters. Awards generally cliff vest after
three
years of service and only contain a service condition, with compensation cost recognized on a straight-line basis over the requisite service period, net of estimated forfeitures. For awards with service and performance conditions, the Company recognizes compensation cost using the graded-vesting method, net of estimated forfeitures. The fair value of restricted stock is equal to the market price of the Company’s common stock at the date of grant.
F -
53
PEABODY ENERGY CORPORATION
NOTES TO CONSOLIDATED FINANCIAL STATEMENTS — (Continued)
A summary of restricted stock award activity is as follows:
|
Year Ended
December 31,
2013
|
Weighted
Average
Grant-Date
Fair Value
|
|||||
|
Nonvested at December 31, 2012
|
2,039,331
|
|
$
|
42.34
|
|
|
|
Granted
|
1,149,731
|
|
25.42
|
|
||
|
Vested
|
(530,578
|
)
|
43.68
|
|
||
|
Forfeited
|
(165,438
|
)
|
34.73
|
|
||
|
Nonvested at December 31, 2013
|
2,493,046
|
|
$
|
34.60
|
|
|
The total fair value of restricted stock awards granted during the years ended
December 31, 2013
,
2012
and
2011
, was
$29.2 million
,
$44.4 million
and
$36.9 million
, respectively. The total fair value of restricted stock awards vested during the years ended
December 31, 2013
,
2012
and
2011
, was
$13.2 million
,
$19.9 million
and
$50.0 million
, respectively.
Restricted Stock Units
In
2013
, the Company granted restricted stock units to certain senior management employees. One of the restricted stock unit grants contained market conditions valued utilizing a Monte Carlo simulation and was made as an inducement award for a certain senior management employee. The Monte Carlo simulation model incorporated the total stockholder return hurdles set for each grant and included the following assumptions: risk free interest rate of
1.7%
; expected volatility of
48.1%
and dividend yield of
1.6%
. In addition, the Company granted restricted stock units to non-senior management employees who either met the Company's retirement eligibility guidelines or would meet the guidelines during the vesting period of the award. For units granted to both senior and non-senior management employees containing only service conditio
ns, the fair value of the award is equal to the market price of the Company’s common stock at the date of grant.
Units granted to non-senior management retirement-eligible employees vest quarterly. Units granted to senior management employees vest at various times (none of which exceed
five
years) in accordance with the underlying award agreement. Compensation cost for both senior and non-senior management employees is recognized on a straight-line basis over the requisite service period.
A summary of restricted stock unit activity is as follows:
|
Year Ended
December 31,
2013
|
Weighted
Average
Grant-Date
Fair Value
|
|||||
|
Nonvested at December 31, 2012
|
—
|
|
$
|
—
|
|
|
|
Granted
|
350,254
|
|
20.64
|
|
||
|
Vested
|
(7,241
|
)
|
25.84
|
|
||
|
Forfeited
|
(55,638
|
)
|
25.84
|
|
||
|
Nonvested at December 31, 2013
|
287,375
|
|
$
|
19.50
|
|
|
The total fair value of restricted stock units granted and vested during the year ended December 31, 2013 was
$7.6 million
and
$0.1 million
, respectively.
Stock Options
Over the past few years, the Company’s stock option awards have been primarily limited to senior management personnel. All stock options are granted at an exercise price equal to the market price of the Company’s common stock at the date of grant. Stock options generally vest in one-third increments over a period of
three
years or cliff vest after
three
years, and expire after
10
years from the date of grant. Expense is recognized ratably over the vesting period, net of estimated forfeitures. Option grants are typically made in January of each year or upon hire for eligible plan participants.
The Company used the Black-Scholes option pricing model to determine the fair value of stock options. The Company utilized U.S. Treasury yields as of the grant date for its risk-free interest rate assumption, matching the U.S. Treasury yield terms to the expected life of the option. The Company utilized historical company data to develop its dividend yield, expected volatility and expected option life assumptions.
F -
54
PEABODY ENERGY CORPORATION
NOTES TO CONSOLIDATED FINANCIAL STATEMENTS — (Continued)
A summary of outstanding option activity under the plans is as follows:
|
Year Ended
December 31,
2013
|
Weighted
Average
Exercise
Price
|
Weighted
Average
Remaining
Contractual
Life
|
Aggregate
Intrinsic
Value (in
millions)
|
|||||||||
|
Options Outstanding at December 31, 2012
|
1,825,225
|
|
$
|
39.85
|
|
5.7
|
$
|
2.5
|
|
|||
|
Granted
|
565,266
|
|
25.02
|
|
|
|
|
|||||
|
Exercised
|
(82,647
|
)
|
9.42
|
|
|
|
|
|||||
|
Forfeited
|
(12,768
|
)
|
34.51
|
|
|
|
|
|||||
|
Options Outstanding at December 31, 2013
|
2,295,076
|
|
$
|
37.32
|
|
6.0
|
$
|
0.5
|
|
|||
|
Vested and Exercisable
|
1,466,271
|
|
$
|
41.05
|
|
4.4
|
$
|
0.4
|
|
|||
During the years ended
December 31, 2013
,
2012
and
2011
, the total intrinsic value of options exercised, defined as the excess fair value of the underlying stock over the exercise price of the options, was
$0.9 million
,
$4.2 million
and
$10.3 million
, respectively. The weighted-average fair values of the Company’s stock options and the assumptions used in applying the Black-Scholes option pricing model were as follows:
|
|
Year Ended December 31,
|
||||||||||
|
|
2013
|
2012
|
2011
|
||||||||
|
Weighted-average fair value
|
$
|
12.13
|
|
$
|
18.59
|
|
$
|
33.92
|
|
||
|
Risk-free interest rate
|
0.7
|
%
|
0.9
|
%
|
2.0
|
%
|
|||||
|
Expected option life
|
5 years
|
|
5 years
|
|
5 years
|
|
|||||
|
Expected volatility
|
64.1
|
%
|
64.0
|
%
|
64.1
|
%
|
|||||
|
Dividend yield
|
1.2
|
%
|
0.6
|
%
|
0.6
|
%
|
|||||
Performance Units
Performance units are typically granted annually in January and vest over a three-year measurement period and are primarily limited to senior management personnel. The performance units are usually subject to the achievement of goals based on the following conditions or any combination thereof: three-year stock price performance compared to both an industry peer group and a S&P index (market condition) and/or three-year return on capital target (performance condition). Generally,
three
performance unit grants are outstanding for any given year. The payouts related to all active grants will be settled in the Company’s common stock.
A summary of performance unit activity is as follows:
|
Year Ended
December 31,
2013
|
Weighted
Average
Remaining
Contractual
Life
|
|||
|
Nonvested at December 31, 2012
|
286,632
|
|
1.5
|
|
|
Granted
|
355,880
|
|
|
|
|
Forfeited
|
(76,418
|
)
|
|
|
|
Vested
|
(102,777
|
)
|
|
|
|
Nonvested at December 31, 2013
|
463,317
|
|
1.6
|
|
As of
December 31, 2013
, there were
102,777
performance units vested that had an aggregate intrinsic value of
$1.9 million
and a conversion price per share of
$18.72
.
F -
55
PEABODY ENERGY CORPORATION
NOTES TO CONSOLIDATED FINANCIAL STATEMENTS — (Continued)
The performance condition awards were valued utilizing the grant date fair values of the Company’s stock adjusted for dividends foregone during the vesting period. The market condition awards were valued utilizing a Monte Carlo simulation which incorporates the total stockholder return hurdles set for each grant. The assumptions used in the valuations for grants were as follows:
|
|
Year Ended December 31,
|
|||||||
|
|
2013
|
2012
|
2011
|
|||||
|
Risk-free interest rate
|
0.4
|
%
|
0.4
|
%
|
1.0
|
%
|
||
|
Expected volatility
|
47.3
|
%
|
52.8
|
%
|
63.9
|
%
|
||
|
Dividend yield
|
1.4
|
%
|
0.6
|
%
|
0.6
|
%
|
||
Employee Stock Purchase Plans
The Company’s eligible full-time and part-time employees are able to contribute up to
15%
of their base compensation into the employee stock purchase plans, subject to an annual limit of
$25,000
per person. Employees are able to purchase Company common stock at a
15%
discount to the lower of the fair market value of the Company’s common stock on the initial or final trading dates of each six-month offering period. Offering periods begin on January 1 and July 1 of each year. The Company uses the Black-Scholes option pricing model to determine the fair value of employee stock purchase plan share-based payments. The fair value of the six-month “look-back” option in the Company’s employee stock purchase plans is
estimated by adding the fair value of 0.15 of one share of stock to the fair value of 0.85 of an option on one share of stock
. The Company utilized U.S. Treasury yields as of the grant date for its risk-free interest rate assumption, matching the Treasury yield terms to the six-month offering period. The Company utilized historical company data to develop its dividend yield and expected volatility assumptions.
Shares purchased under the plans were
0.5 million
for the year ended
December 31, 2013
,
0.3 million
for the year ended
December 31, 2012
and
0.2 million
for the year ended
December 31, 2011
.
F -
56
PEABODY ENERGY CORPORATION
NOTES TO CONSOLIDATED FINANCIAL STATEMENTS — (Continued)
|
(19)
|
Accumulated Other Comprehensive (Loss) Income
|
The following table sets forth the after-tax components of comprehensive (loss) income:
|
Foreign
Currency
Translation
Adjustment
|
Net
Actuarial Loss
Associated with
Postretirement
Plans and
Workers’
Compensation
Obligations
|
Prior Service
Cost Associated
with
Postretirement
Plans
|
Cash Flow
Hedges
|
Available-For-Sale Securities
|
Total
Accumulated
Other
Comprehensive
(Loss) Income
|
||||||||||||||||||
|
|
(Dollars in millions)
|
||||||||||||||||||||||
|
December 31, 2010
|
$
|
3.1
|
|
$
|
(353.0
|
)
|
$
|
(12.8
|
)
|
$
|
294.8
|
|
$
|
—
|
|
$
|
(67.9
|
)
|
|||||
|
Net change in fair value
|
—
|
|
—
|
|
—
|
|
291.9
|
|
(5.8
|
)
|
286.1
|
|
|||||||||||
|
Reclassification from other comprehensive income to earnings
|
—
|
|
38.2
|
|
2.3
|
|
(251.0
|
)
|
(0.9
|
)
|
(211.4
|
)
|
|||||||||||
|
Current period change
|
—
|
|
(150.1
|
)
|
0.9
|
|
—
|
|
—
|
|
(149.2
|
)
|
|||||||||||
|
December 31, 2011
|
3.1
|
|
(464.9
|
)
|
(9.6
|
)
|
335.7
|
|
(6.7
|
)
|
(142.4
|
)
|
|||||||||||
|
Net change in fair value
|
—
|
|
—
|
|
—
|
|
350.4
|
|
(15.5
|
)
|
334.9
|
|
|||||||||||
|
Reclassification from other comprehensive income to earnings
|
—
|
|
53.2
|
|
2.2
|
|
(298.6
|
)
|
22.5
|
|
(220.7
|
)
|
|||||||||||
|
Current period change
|
19.1
|
|
—
|
|
20.1
|
|
—
|
|
—
|
|
39.2
|
|
|||||||||||
|
December 31, 2012
|
22.2
|
|
(411.7
|
)
|
12.7
|
|
387.5
|
|
0.3
|
|
11.0
|
|
|||||||||||
|
Net change in fair value
|
—
|
|
—
|
|
—
|
|
(333.6
|
)
|
(12.3
|
)
|
(345.9
|
)
|
|||||||||||
|
Reclassification from other comprehensive income to earnings
|
—
|
|
95.0
|
|
0.7
|
|
(209.6
|
)
|
12.8
|
|
(101.1
|
)
|
|||||||||||
|
Current period change
|
(92.7
|
)
|
110.9
|
|
(1.4
|
)
|
—
|
|
—
|
|
16.8
|
|
|||||||||||
|
December 31, 2013
|
$
|
(70.5
|
)
|
$
|
(205.8
|
)
|
$
|
12.0
|
|
$
|
(155.7
|
)
|
$
|
0.8
|
|
$
|
(419.2
|
)
|
|||||
F -
57
PEABODY ENERGY CORPORATION
NOTES TO CONSOLIDATED FINANCIAL STATEMENTS — (Continued)
The following table provides additional information regarding items reclassified out of "Accumulated other comprehensive (loss) income" into earnings during the year ended December 31, 2013:
|
Year Ended December 31, 2013
|
||||||
|
Details about accumulated other comprehensive (loss) income components
|
Amount reclassified from accumulated other comprehensive (loss) income
(1)
|
Affected line item in the consolidated statement of operations
|
||||
|
(Dollars in millions)
|
||||||
|
Net actuarial loss associated with postretirement plans and workers' compensation obligations:
|
||||||
|
Postretirement health care and life insurance benefits
|
$
|
(24.1
|
)
|
Operating costs and expenses
|
||
|
Postretirement health care and life insurance benefits
|
(61.3
|
)
|
Settlement charges related to the Patriot bankruptcy reorganization
|
|||
|
Defined benefit pension plans
|
(54.4
|
)
|
Operating costs and expenses
|
|||
|
Defined benefit pension plans
|
(11.3
|
)
|
Selling and administrative expenses
|
|||
|
Insignificant items
|
(1.1
|
)
|
||||
|
(152.2
|
)
|
Total before income taxes
|
||||
|
57.2
|
|
Income tax benefit
|
||||
|
$
|
(95.0
|
)
|
Total after income taxes
|
|||
|
Prior service credit (cost) associated with postretirement plans:
|
||||||
|
Postretirement health care and life insurance benefits
|
$
|
1.7
|
|
Operating costs and expenses
|
||
|
Postretirement health care and life insurance benefits
|
(1.9
|
)
|
Settlement charges related to the Patriot bankruptcy reorganization
|
|||
|
Defined benefit pension plans
|
(1.0
|
)
|
Operating costs and expenses
|
|||
|
(1.2
|
)
|
Total before income taxes
|
||||
|
0.5
|
|
Income tax benefit
|
||||
|
$
|
(0.7
|
)
|
Total after income taxes
|
|||
|
Cash flow hedges:
|
||||||
|
Foreign currency forward contracts
|
$
|
162.4
|
|
Operating costs and expenses
|
||
|
Fuel and explosives commodity swaps
|
11.4
|
|
Operating costs and expenses
|
|||
|
Coal trading commodity futures, swaps and options
|
130.6
|
|
Other revenues
|
|||
|
Insignificant items
|
(0.5
|
)
|
||||
|
303.9
|
|
Total before income taxes
|
||||
|
(94.3
|
)
|
Income tax provision
|
||||
|
$
|
209.6
|
|
Total after income taxes
|
|||
|
Available-for-sale securities:
|
||||||
|
Debt securities
|
$
|
0.2
|
|
Interest income
|
||
|
Equity securities
|
(21.5
|
)
|
Asset impairment and mine closure costs
|
|||
|
(21.3
|
)
|
Total before income taxes
|
||||
|
8.5
|
|
Income tax benefit
|
||||
|
$
|
(12.8
|
)
|
Total after income taxes
|
|||
(1)
Presented as gains (losses) in the consolidated statements of operations.
F -
58
PEABODY ENERGY CORPORATION
NOTES TO CONSOLIDATED FINANCIAL STATEMENTS — (Continued)
Comprehensive (loss) income differs from net (loss) income by the amount of unrealized gain or loss resulting from valuation changes of the Company’s cash flow hedges (see Note 6. "Derivatives and Fair Value Measurements" and Note 7. "Coal Trading" for information related to the Company’s cash flow hedges), changes in the fair value of available-for-sale securities (see Note 5. "Investments" for information related to the Company's investments in available-for-sale securities), the change in actuarial loss and prior service cost of postretirement plans and workers' compensation obligations (see Note 15. "Postretirement Health Care and Life Insurance Benefits," Note 16. "Pension and Savings Plans" and Note 25. "Matters Related to the Bankruptcy of Patriot Coal Corporation" for information related to the Company's postretirement and pension plans) and foreign currency translation adjustment related to the Company's investment in Middlemount, whose functional currency is the Australian dollar. The values of the Company’s cash flow hedging instruments are primarily affected by the U.S. dollar/Australian dollar exchange rate and changes in the prices of certain coal and diesel fuel products.
|
(20)
|
Resource Management, Acquisitions and Other Commercial Events
|
Divestitures
In 2013, the Company sold non-strategic coal reserves and surface lands located in Kentucky in exchange for cash proceeds of
$70.0 million
. The Company recognized a gain on sale of
$40.3 million
related to the transaction, which was classified in "Net gain on disposal or exchange of assets" in the consolidated statements of operations for the year ended December 31, 2013.
In 2011, the Company recognized gains of
$31.7 million
for similar transactions related to coal reserves and surface lands located in Kentucky and Illinois.
Coal Reserves and Land Exchanges
In 2011, the Company exchanged coal reserves in Kentucky and coal reserves and surface lands in Illinois for coal reserves in West Virginia in a nonmonetary exchange with a third party. Based on the fair value of the coal reserves received, the Company recognized a
$37.7 million
gain on the exchange, which was classified in "Net gain on disposal or exchange of assets" in the consolidated statement of operations. Fair value was determined by using a discounted cash flow model that included assumptions surrounding future coal sales prices, operating costs and the discount rate, all of which constituted Level 3 inputs under the fair value hierarchy. Based on the non-cash nature of the transaction, there was no impact to the investing section of the Company's consolidated statement of cash flows.
Prairie State Energy Campus (Prairie State)
A subsidiary of the Company owns a
5.06%
undivided interest in Prairie State, a
1,600
megawatt coal-fueled electricity generation plant and adjacent coal mine in Washington, St. Clair and Randolph counties in Illinois. On June 6, 2012, the first of two
800
megawatt electricity generation units (Unit 1) commenced commercial operations, with the second
800
megawatt electricity generation unit (Unit 2) initiating commercial operations on November 2, 2012.
Subsequent to June 6, 2012 and November 2, 2012, the
5.06%
share of the results of operations of Unit 1 and Unit 2, respectively, have been included in the Company's consolidated statements of operations, which for the years ended December 31, 2013 and 2012 amounted to total revenues of
$9.8 million
and
$4.0 million
, respectively, and a loss before income taxes of
$9.1 million
and
$6.3 million
, respectively.
In 2011, the Company recognized income associated with the receipt of a
$14.6 million
project development fee related to its involvement in Prairie State, which was classified in "Other revenues" in the consolidated statement of operations.
Acquisition of PEA-PCI
On October 23, 2011, PEAMCoal Pty Ltd (PEAMCoal), an Australian company that was then indirectly owned
60%
by the Company and
40%
by ArcelorMittal, acquired a majority interest in PEA-PCI through an all cash off-market takeover offer. On October 26, 2011 (the acquisition and control date), the Company appointed its nominees to the acquiree's Board of Directors and executive management team. The acquisition was completed on December 20, 2011 as PEAMCoal acquired all of PEA-PCI's remaining outstanding shares of common stock for
$4.8 billion
, net of
$261.2 million
of acquired cash, of which the Company's share was
$2.8 billion
(PEA-PCI acquisition). PEAMCoal accounted for share acceptances under the takeover process as a single transaction occurring on October 26, 2011. On December 21, 2011, the Company acquired ArcelorMittal Mining
Australasia
B.V., an indirect subsidiary of ArcelorMittal that indirectly owned
40%
of PEAMCoal, for
$2.0 billion
resulting in the Company's
100%
ownership of PEA-PCI.
F -
59
PEABODY ENERGY CORPORATION
NOTES TO CONSOLIDATED FINANCIAL STATEMENTS — (Continued)
The following unaudited pro forma financial information presents the combined results of operations of the Company and PEA-PCI, on a pro forma basis, as though the companies had been combined as of January 1, 2010. The unaudited pro forma financial information does not necessarily reflect the results of operations that would have occurred had the Company and PEA-PCI constituted a single entity during the periods presented or that may be attained in the future.
|
Year Ended
December 31, 2011
|
|||
|
(Dollars in millions, except per share data)
|
|||
|
Revenue
|
$
|
8,618.0
|
|
|
Income from continuing operations, net of income taxes
|
1,305.7
|
|
|
|
Basic earnings per share
|
$
|
3.55
|
|
|
Diluted earnings per share
|
3.55
|
|
|
Pro forma income from continuing operations, net of income taxes, includes adjustments to operating costs and depreciation, depletion and amortization to reflect the additional expense for the estimated impact of fair value adjustments to coal inventory and property, plant and equipment (including mineral rights), respectively.
Included in "Investments and other assets" as of December 31, 2011 was a
$368.9 million
loan receivable from MCG Coal Holdings Pty Ltd (MCGH) that was initially meas
ured based on the amount PEA-PCI loaned to MCGH. PEA-PCI had previously agreed to convert its receivable for a
90%
equity interest in MCGH. The transaction was initially expected to be completed in May 2011. However, non-performance by a third party to the transaction resulted in PEA-PCI commencing litigation. The original loan balance was classified as a receivable pending the outcome of the legal proceedings. The loan receivable was subsequently adjusted downward during the measurement period based on the completion of a third-party valuation appraisal on the underlying net assets of MCGH, which were substantially comprised of mineral rights. In January 2012, the court ruled that the outstanding loan balance be converted to a
90%
equity interest in MCGH, resulting in consolidation of MCGH and recognition of noncontrolling interests of
$39.0 million
at conversion. In June 2012, the Company acquired the remaining noncontrolling interests in MCGH for total consideration of
$49.8 million
. This acquisition was accounted for as an equity transaction as the Company previously maintained control of MCGH. Accordingly, the Company recorded a decrease to additional paid-in capital of
$10.8 million
related to this transaction, representing the difference between the consideration paid and the carrying value. As discussed in Note 2. "Asset Impairment and Mine Closure Costs," the Company completed the sale of the related exploration tenement in January 2014.
|
(21)
|
Earnings per Share (EPS)
|
Basic and diluted EPS are computed using the two-class method, which is an earnings allocation that determines EPS for each class of common stock and participating securities according to dividends declared and participation rights in undistributed earnings. The Company’s restricted stock awards are considered participating securities because holders are entitled to receive non-forfeitable dividends during the vesting term. Diluted EPS includes securities that could potentially dilute basic EPS during a reporting period, for which the Company includes share-based compensation awards and the Debentures. Dilutive securities are not included in the computation of loss per share when the Company reports a net loss from continuing operations as the impact would be anti-dilutive.
For all but the performance units, the potentially dilutive impact of the Company’s share-based compensation awards is determined using the treasury stock method. Under the treasury stock method, awards are treated as if they had been exercised, with any proceeds used to repurchase common stock at the average market price during the period. Any incremental difference between the assumed number of shares issued and purchased is included in the diluted share computation. For the Company’s performance units, their contingent features result in an assessment for any potentially dilutive common stock by using the end of the reporting period as if it were the end of the contingency period for all units granted. For further discussion of the Company’s share-based compensation awards, see Note 18. "Share-Based Compensation."
A conversion of the Debentures may result in payment for any conversion value in excess of the principal amount of the Debentures in the Company’s common stock. For diluted EPS purposes, potential common stock is calculated based on whether the market price of the Company’s common stock at the end of each reporting period is in excess of the conversion price of the Debentures. For a full discussion of the conditions under which the Debentures may be converted, the conversion rate to common stock and the conversion price, see Note 12. "Long-term Debt." The effect of the Debentures was excluded from the calculation of diluted EPS for all periods presented because to do so would have been anti-dilutive for those periods.
F -
60
PEABODY ENERGY CORPORATION
NOTES TO CONSOLIDATED FINANCIAL STATEMENTS — (Continued)
The computation of diluted EPS also excluded aggregate stock options and restricted stock awards of approximately
2.3 million
,
1.2 million
and
0.1 million
for the years ended
December 31, 2013
,
2012
and
2011
, respectively, because to do so would have been anti-dilutive for those periods. The potential dilutive impact of such share-based compensation awards is calculated under the treasury stock method. Anti-dilution generally occurs when the exercise prices or unrecognized compensation costs per share of such awards are higher than the Company’s average stock price during the applicable period.
The following illustrates the earnings allocation method utilized in the calculation of basic and diluted EPS:
|
|
Year Ended December 31,
|
||||||||||
|
|
2013
|
2012
|
2011
|
||||||||
|
|
(In millions, except per share amounts)
|
||||||||||
|
EPS numerator:
|
|
|
|
|
|
|
|||||
|
(Loss) income from continuing operations, net of income taxes
|
$
|
(286.0
|
)
|
$
|
(470.9
|
)
|
$
|
1,012.8
|
|
||
|
Less: Net income (loss) attributable to noncontrolling interests
|
12.3
|
|
10.6
|
|
(11.4
|
)
|
|||||
|
(Loss) income from continuing operations attributable to common stockholders before allocation of earnings to participating securities
|
(298.3
|
)
|
(481.5
|
)
|
1,024.2
|
|
|||||
|
Less: Earnings allocated to participating securities
|
0.8
|
|
0.7
|
|
5.3
|
|
|||||
|
(Loss) income from continuing operations attributable to common
stockholders, after earnings allocated to participating securities
(1)
|
(299.1
|
)
|
(482.2
|
)
|
1,018.9
|
|
|||||
|
Loss from discontinued operations, net of income taxes
|
(226.6
|
)
|
(104.2
|
)
|
(66.5
|
)
|
|||||
|
Less: Loss from discontinued operations allocated to participating securities
|
—
|
|
—
|
|
(0.4
|
)
|
|||||
|
Loss from discontinued operations attributable to common stockholders, after allocation of earnings to participating securities
(1)
|
$
|
(226.6
|
)
|
$
|
(104.2
|
)
|
$
|
(66.1
|
)
|
||
|
Net (loss) income attributable to common stockholders, after earnings
allocated to participating securities
(1)
|
$
|
(525.7
|
)
|
$
|
(586.4
|
)
|
$
|
952.8
|
|
||
|
EPS denominator:
|
|
|
|
|
|
|
|||||
|
Weighted average shares outstanding — basic
|
267.1
|
|
268.0
|
|
269.1
|
|
|||||
|
Impact of dilutive securities
|
—
|
|
—
|
|
1.2
|
|
|||||
|
Weighted average shares outstanding — diluted
|
267.1
|
|
268.0
|
|
270.3
|
|
|||||
|
Basic EPS attributable to common stockholders:
|
|
|
|
|
|
|
|||||
|
(Loss) income from continuing operations
|
$
|
(1.12
|
)
|
$
|
(1.80
|
)
|
$
|
3.78
|
|
||
|
Loss from discontinued operations
|
(0.85
|
)
|
(0.39
|
)
|
(0.25
|
)
|
|||||
|
Net (loss) income attributable to common stockholders
|
$
|
(1.97
|
)
|
$
|
(2.19
|
)
|
$
|
3.53
|
|
||
|
Diluted EPS attributable to common stockholders:
|
|
|
|
|
|
|
|||||
|
(Loss) income from continuing operations
|
$
|
(1.12
|
)
|
$
|
(1.80
|
)
|
$
|
3.77
|
|
||
|
Loss from discontinued operations
|
(0.85
|
)
|
(0.39
|
)
|
(0.25
|
)
|
|||||
|
Net (loss) income attributable to common stockholders
|
$
|
(1.97
|
)
|
$
|
(2.19
|
)
|
$
|
3.52
|
|
||
|
(1)
|
The reallocation adjustment for participating securities to arrive at the numerator used to calculate diluted EPS was less than
$0.1 million
for the periods presented.
|
F -
61
PEABODY ENERGY CORPORATION
NOTES TO CONSOLIDATED FINANCIAL STATEMENTS — (Continued)
(22) Management — Labor Relations
On
December 31, 2013
, the Company had approximately
8,300
employees worldwide, excluding those employees that were employed at operations classified as discontinued operations and including approximately
5,900
hourly employees. Approximately
35%
of those hourly employees were represented by organized labor unions and were employed by mines that generated
19%
of the Company's
2013
coal production from continuing operations. In the U.S.,
one
coal preparation facility and
one
surface mine are represented by organized labor unions. In Australia, the coal mining industry is unionized and the majority of workers employed at the Company’s Australian Mining operations are members of trade unions. The Construction Forestry Mining and Energy Union represents the Company’s Australian subsidiaries’ hourly production and engineering employees, including those employed through contract mining relationships. The Company believes labor relations with its employees are good. Should that condition change, the Company could experience labor disputes, work stoppages or other disruptions in production that could negatively impact the Company’s results of operations and cash flows. The following table presents the Company's operations in which the employees are represented by organized labor unions:
|
Mine
|
Current Agreement Expiration Date
|
|
|
U. S.
|
||
|
Willow Lake Preparation Facility
(1)
|
December 2014
|
|
|
Kayenta
(2)
|
September 2019
|
|
|
Australia
|
||
|
Owner-operated mines:
|
||
|
Wambo Open-Cut
(3)
|
August 2014
|
|
|
Wambo Coal Handling Plant
(3)
|
October 2014
|
|
|
North Wambo Underground
|
April 2015
|
|
|
North Goonyella
|
May 2015
|
|
|
Metropolitan
|
August 2015
|
|
|
Millennium
|
October 2015
|
|
|
Wilpinjong
|
May 2016
|
|
|
Coppabella
|
October 2016
|
|
|
Contractor-operated mines:
|
||
|
Eaglefield
(3)
|
July 2014
|
|
|
Moorvale
|
March 2015
|
|
|
Burton
|
December 2016
|
|
|
(1)
|
The Willow Lake Mine was permanently closed in the fourth quarter of 2012 but the preparation facility continued to service the Company's Cottage Grove and Wildcat Hills Underground Mines. The current labor agreement is effective through December 14, 2014 and the Company expects negotiations to occur prior to the expiration.
|
|
(2)
|
Hourly workers at the Company’s Kayenta Mine in Arizona are represented by the UMWA under the Western Surface Agreement, which is effective through September 16, 2019. This agreement covers approximately
9%
of the Company’s U.S. subsidiaries’ hourly employees, who generated approximately
4%
of the Company’s U.S. production during the year ended
December 31, 2013
.
|
|
(3)
|
Negotiations for the Wambo Open-Cut, Wambo Coal Handling Plant and Eaglefield mines and are underway
.
|
|
(23)
|
Financial Instruments, Guarantees With Off-Balance-Sheet Risk and Other Guarantees
|
In the normal course of business, the Company is a party to guarantees and financial instruments with off-balance-sheet risk, which are not reflected in the accompanying consolidated balance sheets. Such financial instruments are valued based on the amount of exposure under the instrument and the likelihood of required performance. In the Company’s past experience, virtually no claims have been made against these financial instruments. The Company does not expect any material losses to result from these guarantees or off-balance-sheet instruments.
F -
62
PEABODY ENERGY CORPORATION
NOTES TO CONSOLIDATED FINANCIAL STATEMENTS — (Continued)
Financial Instruments with Off-Balance Sheet Risk
As of
December 31, 2013
, the Company had the following financial instruments with off-balance-sheet risk:
|
Reclamation
Obligations
|
Coal Lease
Obligations
|
Workers’
Compensation
Obligations
|
Other
(1)
|
Total
(2)
|
|||||||||||||||
|
|
(Dollars in millions)
|
||||||||||||||||||
|
Self bonding
|
$
|
1,365.1
|
|
$
|
—
|
|
$
|
—
|
|
$
|
—
|
|
$
|
1,365.1
|
|
||||
|
Surety bonds
|
328.2
|
|
109.9
|
|
103.9
|
|
9.5
|
|
551.5
|
|
|||||||||
|
Bank guarantees
|
240.2
|
|
—
|
|
—
|
|
140.6
|
|
380.8
|
|
|||||||||
|
Letters of credit
|
17.6
|
|
—
|
|
31.1
|
|
105.6
|
|
154.3
|
|
|||||||||
|
|
$
|
1,951.1
|
|
$
|
109.9
|
|
$
|
135.0
|
|
$
|
255.7
|
|
$
|
2,451.7
|
|
||||
|
(1)
|
Other includes the
$79.7 million
in letters of credit related to Dominion Terminal Associates and the PBGC, as described below, and an additional
$176.0 million
in bank guarantees, letters of credit and surety bonds related to road maintenance, performance guarantees and other operations.
|
|
(2)
|
All of the surety bonds and
$131.9 million
of the letters of credit presented above have been issued by Peabody Energy Corporation. Peabody Energy Corporation is also an obligor of all of the above bank guarantees.
|
The Company owns a
37.5%
interest in Dominion Terminal Associates, a partnership that operates a coal export terminal in Newport News, Virginia under a
30
-year lease that permits the partnership to purchase the terminal at the end of the lease term for a nominal amount. The partners have severally (but not jointly) agreed to make payments under various agreements which in the aggregate provide the partnership with sufficient funds to pay rents and to cover the principal and interest payments on the floating-rate industrial revenue bonds issued by the Peninsula Ports Authority, and which are supported by letters of credit from a commercial bank. As of
December 31, 2013
, the Company’s maximum reimbursement obligation to the commercial bank was in turn supported by
four
letters of credit totaling
$42.7 million
.
The Company is party to an agreement with the PBGC and TXU Europe Limited, an affiliate of the Company’s former parent corporation, under which the Company is required to make special contributions to two of the Company’s defined benefit pension plans and to maintain a
$37.0 million
letter of credit in favor of the PBGC. If the Company or the PBGC gives notice of an intent to terminate one or more of the covered pension plans in which liabilities are not fully funded, or if the Company fails to maintain the letter of credit, the PBGC may draw down on the letter of credit and use the proceeds to satisfy liabilities under the Employee Retirement Income Security Act of 1974, as amended. The PBGC, however, is required to first apply amounts received from a
$110.0 million
guarantee in place from TXU Europe Limited in favor of the PBGC before it draws on the Company’s letter of credit. On November 19, 2002, TXU Europe Limited was placed under the administration process in the United Kingdom (a process similar to bankruptcy proceedings in the U.S.) and continues under this process as of
December 31, 2013
. As a result of these proceedings, TXU Europe Limited may be liquidated or otherwise reorganized in such a way as to relieve it of its obligations under its guarantee.
In June 2013, one of the Company's wholly-owned captive insurance subsidiaries entered into a letter of credit arrangement totaling
$22.5 million
in relation to certain of its workers' compensation and other insurance-related obligations whereby that subsidiary has pledged
$33.4 million
of its investments in debt securities as collateral. This arrangement reduces the letters of credit drawn on the Company's 2013 Credit Facility and effectively lowers the fees associated with the related letters of credit.
Patriot Bankruptcy Reorganization
Refer to Note 25. "Matters Related to the Bankruptcy of Patriot Coal Corporation" for a discussion of certain credit support provided to Patriot as part of the settlement agreement related to its emergence from bankruptcy, which support includes
$87.6 million
of surety bonds and
$22.4 million
of letters of credit included in the table above, in addition to
$31.5 million
of corporate guarantees to Patriot beneficiaries.
F -
63
PEABODY ENERGY CORPORATION
NOTES TO CONSOLIDATED FINANCIAL STATEMENTS — (Continued)
Accounts Receivable Securitization
The Company has an accounts receivable securitization program (securitization program) with a maximum capacity of
$275.0 million
through its wholly-owned, bankruptcy-remote subsidiary (Seller). At
December 31, 2013
, the Company had
$117.2 million
available under the securitization program, net of amounts drawn. Under the securitization program, the Company contributes trade receivables of most of the Company’s U.S. subsidiaries on a revolving basis to the Seller, which then sells the receivables in their entirety to a consortium of unaffiliated asset-backed commercial paper conduits (the Conduits). After the sale, the Company, as servicer of the assets, collects the receivables on behalf of the Conduits for a nominal servicing fee. The Company utilizes proceeds from the sale of its accounts receivable as an alternative to short-term borrowings under the revolving credit facility portion of the 2013 Credit Facility, effectively managing its overall borrowing costs and providing an additional source for working capital. The securitization program was renewed in May 2013 and will expire in April 2016.
The Seller is a separate legal entity whose assets are available first and foremost to satisfy the claims of its creditors. Of the receivables sold to the Conduits, a portion of the amount due to the Seller is deferred until the ultimate collection of the underlying receivables. During the year ended
December 31, 2013
, the Company received total consideration of
$4,205.9 million
related to accounts receivable sold under the securitization program, including
$2,719.1 million
of cash up front from the sale of the receivables, an additional
$1,347.9 million
of cash upon the collection of the underlying receivables and
$138.9 million
that had not been collected at
December 31, 2013
and was recorded at carrying value, which approximates fair value. The reduction in accounts receivable as a result of securitization activity with the Conduits was
$100.0 million
and
$25.0 million
at
December 31, 2013
and
2012
, respectively.
The securitization activity has been reflected in the consolidated statements of cash flows as operating activity because both the cash received from the Conduits upon sale of receivables as well as the cash received from the Conduits upon the ultimate collection of receivables are not subject to significantly different risks given the short-term nature of the Company’s trade receivables. The Company recorded expense associated with securitization transactions of
$1.5 million
,
$2.0 million
and
$2.0 million
for the years ended
December 31, 2013
,
2012
and
2011
, respectively.
Other
Included in "Other noncurrent liabilities" in the Company's consolidated balance sheets as of
December 31, 2013
and December 31, 2012 is a liability of
$45.6 million
related to reclamation, bonding commitments and worker's compensation provided on behalf of a third-party coal producer associated with a 2007 purchase of coal reserves and surface lands in the Illinois Basin.
The Company is the lessee under numerous equipment and property leases. It is common in such commercial lease transactions for the Company, as the lessee, to agree to indemnify the lessor for the value of the property or equipment leased, should the property be damaged or lost during the course of the Company’s operations. The Company expects that losses with respect to leased property, if any, would be covered by insurance (subject to deductibles). The Company and certain of its subsidiaries have guaranteed other subsidiaries’ performance under various lease obligations. Aside from indemnification of the lessor for the value of the property leased, the Company’s maximum potential obligations under its leases are equal to the respective future minimum lease payments, and the Company assumes that no amounts could be recovered from third parties.
The Company has provided financial guarantees under certain long-term debt agreements entered into by its subsidiaries and substantially all of the Company’s U.S. subsidiaries provide financial guarantees under long-term debt agreements entered into by the Company. The maximum amounts payable under the Company’s debt agreements are equal to the respective principal and interest payments.
|
(24)
|
Commitments and Contingencies
|
Commitments
Unconditional Purchase Obligations
As of
December 31, 2013
, purchase commitments for capital expenditures were
$52.3 million
, all of which is obligated within the next year. In Australia, the Company has generally secured the ability to transport coal through rail contracts and ownership interests in three east coast coal export terminals that are primarily funded through take-or-pay arrangements with terms ranging up to
26
years. In the U.S., the Company has entered into certain long-term coal export terminal agreements to secure and expand its Gulf Coast export platform. As of
December 31, 2013
, these Australian and U.S. commitments under take-or-pay arrangements totaled
$3,724.8 million
, of which
$385.8 million
is obligated within the next year.
F -
64
PEABODY ENERGY CORPORATION
NOTES TO CONSOLIDATED FINANCIAL STATEMENTS — (Continued)
Federal Coal Leases
In the second quarter of 2012, the Company was named by the U.S. Department of the Interior, Bureau of Land Management (BLM) as the winning bidder for control of approximately
1.1 billion
tons of federal coal reserves adjacent to its North Antelope Rochelle Mine in the Southern Powder River Basin of Wyoming, with a weighted average bid price of approximately
$1.10
per mineable ton. Consequently, the Company made aggregate payments of
$247.9 million
during each of the years ended
December 31, 2013
and 2012 pursuant to the two associated federal coal leases, with remaining annual payments of
$247.9 million
due in each of the next three years.
In July 2011, the Company was named by the BLM as the winning bidder for control of approximately
220 million
tons of federal coal reserves adjacent to its Caballo Mine in the Powder River Basin at a bid price of
$0.95
per mineable ton, with payments of
$42.1 million
due annually in each of the years from 2011 through 2015 pursuant to the associated federal coal lease (the Belle Ayr North Lease). Similarly, in September 2011, a subsidiary of Alpha Natural Resources, Inc. (Alpha) was named by the BLM as the winning bidder for control of approximately
130 million
tons of federal coal reserves in the Powder River Basin at a bid price of
$1.10
per mineable ton, with contractual payments of
$28.6 million
due annually in each of the years from 2011 through 2015 under the associated federal coal lease (the Caballo West Lease). In July 2012, the Company and Alpha executed a lease exchange agreement with the BLM whereby the Company agreed to sell, assign and transfer its interest in the Belle Ayr North Lease in exchange for (1) Alpha's interest in the Caballo West Lease, (2) reimbursement of
$13.5 million
for the difference in the related federal coal lease payments made by each party in 2011 and (3)
five
annual true up payments of
$3.9 million
for the excess of the
$1.10
bid price per mineable ton assumed under the Caballo West Lease over the
$0.95
price under the transferred lease. An aggregate of
$21.3 million
was received from Alpha during the year ended
December 31, 2012
for the reimbursement payment and first and second true up payments and the third true up payment was received in 2013. The
two
remaining true up payments are due from Alpha on November 1 in 2014 and 2015. Those cash receipts are classified in "Proceeds from disposal of assets, net of notes receivable" in the consolidated statement of cash flows.
The federal coal leases executed with the BLM described above expire after a
20
-year initial term, unless at such time there is ongoing production on the subject leases or within an active logical mining unit of which they are part.
Contingencies
From time to time, the Company or its subsidiaries are involved in legal proceedings arising in the ordinary course of business or related to indemnities or historical operations. The Company believes it has recorded adequate reserves for these liabilities and that there is no individual case pending that is likely to have a material adverse effect on the Company’s financial condition, results of operations or cash flows. The Company discusses its significant legal proceedings below, including ongoing proceedings and those that impacted the Company's results of operations for the periods presented.
Litigation Relating to Continuing Operations
Gulf Power Company.
On June 22, 2006, Gulf Power Company (Gulf Power) filed a breach of contract lawsuit against a Company subsidiary in the U.S. District Court, Northern District of Florida, contesting the force majeure declaration by the Company's subsidiary under a coal supply agreement with Gulf Power and seeking damages for alleged past and future tonnage shortfalls of nearly
five million
tons under the agreement, which expired on December 31, 2007. On June 30, 2009, the court granted Gulf Power's motion for partial summary judgment on liability and denied the Company subsidiary's motion for summary judgment. On September 30, 2010, the court entered its order on damages, awarding Gulf Power
zero
dollars in damages and the Company subsidiary its costs to defend the lawsuit. Gulf Power subsequently filed a motion to alter or amend the judgment, contesting the trial court's damages order, to which the Company subsidiary objected. The court entered an order on July 29, 2011 that affirmed its September 30, 2010 decision in all respects except for 2007 cover coal purchases and granted in part Gulf Power's motion to alter judgment with respect to 2007 cover coal purchases. On September 30, 2011, the court entered an order awarding Gulf Power damages in the amount of
$20.6 million
for its 2007 cover coal purchases. The court later entered another order awarding Gulf Power prejudgment interest in the amount of
$6.9 million
plus post-judgment interest. The Company's subsidiary and Gulf Power both appealed and, on June 26, 2013, the U.S. Court of Appeals for the Eleventh Circuit issued its order affirming the District Court's judgment in all respects. The Company and Gulf Power have agreed not to seek judicial review of the Eleventh Circuit's order and the Company paid the judgment during the third quarter of 2013. In connection with the order, the Company recorded a charge for the judgment amount of
$20.6 million
in "Operating costs and expenses" and
$6.9 million
in "Interest expense" in the consolidated statement of operations for the year ended
December 31, 2013
.
F -
65
PEABODY ENERGY CORPORATION
NOTES TO CONSOLIDATED FINANCIAL STATEMENTS — (Continued)
Monto Coal Pty Limited, Monto Coal 2 Pty Ltd Limited and Macarthur Coal Limited.
In October 2007, a statement of claim was delivered to Monto Coal Pty Ltd, a wholly owned subsidiary of PEA-PCI, then Macarthur Coal Limited, and Monto Coal 2 Pty Ltd, an equity accounted investee, from the minority interest holders in the Monto Coal Joint Venture, alleging that Monto Coal 2 Pty Ltd breached the Monto Coal Joint Venture Agreement and Monto Coal Pty Ltd breached the Monto Coal Management Agreement. Monto Coal Pty Ltd is the manager of the Monto Coal Joint Venture pursuant to the Management Agreement. Monto Coal 2 Pty Ltd holds a
51%
interest in the Monto Coal Joint Venture. The plaintiffs are Sanrus Pty Ltd, Edge Developments Pty Ltd and H&J Enterprises (Qld) Pty Ltd. An additional statement of claim was delivered to PEA-PCI in November 2010 from the same minority interest holders in the Monto Coal Joint Venture, alleging that PEA-PCI induced Monto Coal 2 Pty Ltd and Monto Coal Pty Ltd to breach the Monto Coal Joint Venture Agreement and the Monto Coal Management Agreement, respectively. These actions, which are pending before the Supreme Court of Queensland, Australia, seek damages from the three defendants collectively of no less than
$1,193.2
million Australian dollars, plus in
terest and costs. The defendants dispute the claims and are vigorously defending their positions. Based on the Company's evaluation of the issues and their potential impact, the amount of any future loss cannot be reasonably estimated. However, based on current information, the Company believes these claims are likely to be finalized without a material adverse effect on its financial condition, results of operations or cash flows.
Sumiseki Materials Co Ltd.
In 2010, the Class B shareholder (noncontrolling interest holder) in Wambo Coal Pty Ltd (Wambo), an Australian subsidiary of the Company, filed a lawsuit in the Supreme Court of Wales, Australia, against Wambo alleging the Class B shareholder was entitled to certain dividend payments from Wambo (subject to limited exceptions) and requested payment of those dividends for periods from 2009 to 2012.
On March 25, 2013, the Supreme Court issued a judgment in favor of the plaintiff's position that the Class B shareholder was entitled to dividend payments (subject to limited exceptions), thus requiring Wambo to pay dividends to the Class B shareholder for the periods in question. The Supreme Court issued finalized orders on May 3, 2013, including the final calculation of amounts due for dividends during the periods from 2009 to 2012 totaling
$28.0 million
plus interest of
$5.7 million
. Amounts of the finalized orders are presented in U.S. dollars at foreign currency exchange rates in effect at December 31, 2013.
Wambo appealed the Supreme Court's decision, and has posted the requisite security of
$34.9 million
with the court in the form of cash payment into an interest bearing trust account jointly operated by the parties. Wambo also posted an additional cash payment of
$4.1 million
into that account on October 11, 2013 related to potential Class B shareholder dividends for the six months ended June 30, 2013. Because the Supreme Court's order allows for the substitution of that posted cash payment with a bank guarantee from an Australian bank or another form of acceptable security, those funds remain readily available to the Company and have therefore been reflected in "Cash and cash equivalents" in the consolidated balance sheet as of December 31, 2013. Based on information currently available, the Company believes that its subsidiary should be successful in the appeals process, and therefore, has not declared any dividends and continues to reflect the previously allocated earnings to "Noncontrolling interests" in the consolidated balance sheet as of December 31, 2013. The matter is listed for determination in the NSW Court of Appeal in May 2014. If the Supreme Court's ruling is upheld, the Company believes the claims are likely to be finalized without a material adverse effect on its financial condition, results of operations or cash flows.
Environmental Claims and Litigation
Claims Arising From Historical, Non-Coal Producing Operations.
Gold Fields Mining, LLC (Gold Fields) is a dormant, non-coal producing entity that was previously managed and owned by Hanson plc, the Company's predecessor owner. In a February 1997 spin-off, Hanson plc transferred ownership of Gold Fields to the Company, despite the fact that Gold Fields had no ongoing operations and the Company had no prior involvement in its past operations. Gold Fields is currently one of the Company's subsidiaries. The Company indemnified TXU Group with respect to certain claims relating to the historical operations of a former affiliate of Gold Fields.
Environmental claims for remediation, past costs, future costs, and/or natural resource damages have been asserted against Gold Fields related to historical activities of Gold Fields or a former affiliate. Gold Fields or the former affiliate has been named a potentially responsible party (PRP) at
five
national priority list sites based on the Comprehensive Environmental Response, Compensation and Liability Act (CERCLA). CERCLA claims were asserted at
13
additional sites, bringing the total to
18
, which have since been reduced to
8
by completion of work, transfer or regulatory inactivity. The number of CERCLA sites alone is not a relevant measure of liability because the nature and extent of environmental concerns and costs varies by site, as does the estimated share of responsibility relative to other PRPs for Gold Fields or the former affiliate.
F -
66
PEABODY ENERGY CORPORATION
NOTES TO CONSOLIDATED FINANCIAL STATEMENTS — (Continued)
Undiscounted liabilities for environmental cleanup-related costs for all of the sites noted above were
$63.8 million
as of
December 31, 2013
and
$46.7 million
as of
December 31, 2012
,
$18.3 million
and
$10.6 million
of which was reflected as a current liability, respectively. These amounts represent those costs that the Company believes are probable and reasonably esti
mable.
Significant uncertainty exists as to whether claims will be pursued against Gold Fields or the former affiliate in all cases, and where they are pursued, the amount and timing of the eventual costs and liabilities, which could be greater or less than the liabilities recorded in the consolidated balance sheets. Changes to cost estimates associated with a particular site can occur for many reasons, including, but not limited to, the gathering of additional information at the site, the completion of the remedial design phase of the CERCLA remediation process, changes in anticipated remediation standards or labor and materials costs or the reaching of a settlement agreement or consent order by the parties at the site. Based on the Company's evaluation of the issues and their potential impact, the total amount of any future loss cannot be reasonably estimated. However, based on current information, the Company believes these claims are likely to be resolved without a material adverse effect on its financial condition, results of operations or cash flows.
Other
At times the Company becomes a party to other disputes, including those related to contract miner performance; claims; lawsuits; arbitration proceedings; and administrative procedures in the ordinary course of business in the U.S., Australia and other countries where the Company does business. For example, in June 2007, the New York Office of the Attorney General served a letter and subpoena on the Company, seeking information and documents relating to the Company's disclosure to investors of risks associated with possible climate change and related legislation and regulations. The Company believes it has made full and proper disclosure of these potential risks. In addition, in January 2013, the Securities and Exchange Commission (SEC) staff served a subpoena on the Company seeking information and documents relating to the development of Prairie State Energy Campus, a
1,600
megawatt coal-fueled electricity generation plant and adjacent coal mine in Illinois in which the Company owns a
5.06%
undivided interest. The Company is cooperating with the SEC's investigation. Based on current information, the Company believes that such other pending or threatened proceedings are likely to be resolved without a material adverse effect on its financial condition, results of operations or cash flows.
|
(25)
|
Matters Related to the Bankruptcy of Patriot Coal Corporation
|
Claims and Litigation
On October 31, 2007, the Company spun-off companies that constituted portions of its former Eastern U.S. Mining operations business segment to form Patriot. The spin-off included
eight
company-operated mines,
two
majority-owned joint venture mines and numerous contractor-operated mines serviced by
eight
coal preparation facilities, along with
1.2 billion
tons of proven and probable coal reserves. On July 9, 2012, Patriot and certain of its wholly owned subsidiaries filed voluntary petitions for reorganization under Chapter 11 of the U.S. Code in the U.S. Bankruptcy Court for the Southern District of New York. The case was subsequently moved to the U.S. Bankruptcy Court for the Eastern District of Missouri.
On March 14, 2013, Patriot filed a motion in its bankruptcy proceeding seeking authority to reject its collective bargaining agreements under section 1113 of the Bankruptcy Code and change its obligation to pay benefits it provided to certain of its retirees pursuant to section 1114 of the Bankruptcy Code and transferring the obligation to a Voluntary Employee Benefit Association (VEBA). At the same time, Patriot also filed a declaratory judgment complaint against the Company and one of its subsidiaries seeking a declaration that Section 1(d) of the NBCWA Individual Employer Plan Liabilities Assumption Agreement dated October 22, 2007 (NBCWA Agreement) would not apply to reduce the subsidiary's healthcare benefits funding obligations if Patriot were to be successful under the bankruptcy code in changing the benefits it is required to pay to certain of its retirees under its labor agreements. On April 5, 2013, Patriot filed a motion for summary judgment with respect to the declaratory judgment complaint. After hearing both motions, the Court granted Patriot's section 1113/1114 motion and, on its own accord, granted the Company summary judgment on the declaratory judgment complaint. After the United Mine Workers of America (UMWA) appealed the Court's ruling on the section 1113/1114 motion, Patriot and the UMWA entered into new labor agreements pursuant to which the UMWA agreed to dismiss its appeal upon satisfaction of certain conditions. Patriot appealed the Court's grant of the summary judgment motion in the Company's and its subsidiary's favor, which an appellate court reversed. The Company and its subsidiary appealed the reversal to the United States Court of Appeals for the Eighth Circuit and filed a counterclaim in the declaratory judgment action against Patriot and the UMWA seeking a declaration that the subsidiary's healthcare benefits funding obligation would reduce to zero when one of Patriot's subsidiary's obligation to pay for retiree healthcare benefits reduced to zero under the terms of the new labor agreements. Patriot and the Official Committee of Unsecured Creditors of Patriot Coal Corporation issued discovery requests to the Company pursuant to Rule 2004 of the Federal Rules of Bankruptcy Procedure. In connection with the settlement discussed below, the 2004 discovery was suspended and subsequently halted permanently, and the adversary proceeding and related appeal in the Patriot bankruptcy case were voluntarily dismissed with prejudice.
F -
67
PEABODY ENERGY CORPORATION
NOTES TO CONSOLIDATED FINANCIAL STATEMENTS — (Continued)
On October 4, 2013, the Company reached a preliminary agreement with Patriot and the UMWA, on behalf of itself, its represented Patriot employees (UMWA Employees) and its represented Patriot retirees (UMWA Retirees), to resolve all issues related to Patriot’s bankruptcy. On October 25, 2013, the parties entered into a definitive settlement agreement. On November 7, 2013, the bankruptcy court approved that agreement. On December 17, 2013, the bankruptcy court confirmed Patriot's plan of reorganization, and on December 18, 2013, Patriot closed on its exit financing and notified the bankruptcy court that the plan of reorganization had become effective. Upon Patriot's plan of reorganization becoming effective, the Company's settlement agreement with Patriot and the UMWA, on behalf of itself, the UMWA Employees and the UMWA Retirees, also became effective. Under the terms of the settlement agreement, the Company will provide total payments of
$310 million
, payable over four years through 2017, to partially fund the newly established VEBA and settle all Patriot and UMWA claims involving the Patriot bankruptcy. The Company’s and its subsidiary's obligations under the NBCWA Agreement have been deemed satisfied, and that agreement was terminated on December 18, 2013, the effective date of the settlement. Upon settlement, the Company had
$260.7 million
recorded in accumulated postretirement healthcare benefit obligations to Patriot on account of certain Patriot retirees under the NBCWA Agreement with
$63.2 million
of actuarial losses and prior service costs related to the NBCWA Agreement obligations included in "Accumulated other comprehensive (loss) income."
As part of the settlement agreement, the Company has also provided
$141.5 million
of credit support to Patriot, the fair value of which the Company estimated at
$28.0 million
as of December 31, 2013 using unobservable Level 3 inputs under the fair value hierarchy to determine the cost to acquire such support. A total of
$100.0 million
of this credit support ends after five years. As of December 31, 2013,
$31.5 million
of this credit support takes the form of corporate guarantees to Patriot beneficiaries;
$87.6 million
of this credit support takes the form of surety bonds issued for the benefit of Patriot beneficiaries; and
$22.4 million
of this credit support takes the form of letters of credit issued for the benefit of Patriot beneficiaries. A total of
$56.5 million
of the credit support (all in the form of surety bonds) relates to Patriot’s Coal Act obligations that the Company agreed to fund at the time of the Patriot spin-off pursuant to the Coal Act Liabilities Assumption Agreement and to Patriot’s Federal Black Lung obligations. The Company has also provided an extension of a coal terminaling agreement through March 2016 at a reduced price equal to the Company's estimated cost of providing the terminaling capacity.
As of December 18, 2013, the effective date of the settlement, Patriot assumed (1) the agreements executed in connection with the Patriot spin-off, including Patriot’s indemnification obligations contained therein (subject to certain specified exceptions) and (2) all other agreements entered into by Patriot and the Company prior to the bankruptcy filing and not previously assumed, rejected, terminated or expired.
In connection with the settlement agreement, effective as of December 18, 2013, Patriot, the UMWA, the UMWA Employees and the UMWA Retirees released the Company and its subsidiaries and affiliates and their current and former professionals, employees, advisors, officers, directors, insurers and agents (Peabody Released Parties) from all Causes of Action (as defined in the settlement agreement). In addition, Patriot included the Peabody Released Parties in the third-party release, exculpation and injunction provisions contained in the Patriot plan of reorganization to the extent permitted by law, and the UMWA did not object to any such releases.
At the time the settlement became effective, the Company recognized settlement charges totaling
$128.6 million
allocated between: (1) a charge of
$30.6 million
related to settlement of the accumulated postretirement healthcare benefit obligations of certain Patriot retirees under the NBCWA Agreement and (2) a charge to discontinued operations of
$98.0 million
related to the settlement of other claims involving the Patriot bankruptcy. The allocation of the settlement was based on the construct of the negotiated settlement whereby Patriot is to be paid
$70.0 million
and provided with the credit support, recorded as a liability at its fair value of
$28.0 million
, and modified coal terminaling arrangement discussed above. A total of
$240 million
is to be paid to the VEBA to settle the accumulated postretirement healthcare benefit obligations. At December 31, 2013, the Company's consolidated balance sheet reflected total liabilities of
$298.1 million
related to the settlement, representing the net present value of the payments due through 2017 to Patriot and the VEBA.
On October 23, 2012,
eight
individual plaintiffs and the UMWA filed a putative class action lawsuit in the U.S. District Court for the Southern District of West Virginia against the Company, one of its subsidiaries and an unrelated coal company (Lowe et al. v. Peabody Holding Company, LLC, et al.). The lawsuit sought to have the court obligate the defendants to maintain certain Patriot benefit plans at their current levels and to find the defendants' actions in violation of the Employee Retirement Income Security Act of 1974. On January 7, 2013, the Company defendants filed a motion to dismiss the complaint for failure to state a claim upon which relief can be granted. The plaintiffs thereafter amended their complaint to include new allegations and name two more individuals as plaintiffs. The Company defendants updated their motion to dismiss to respond to the new allegations and filed it with the Court. On September 27, 2013, the Court granted the Company defendants' motion to dismiss, and plaintiffs appealed the dismissal to the United States Court of Appeals for the Fourth Circuit. On December 20, 2013, after the effective date of the settlement agreement discussed above, the parties filed a joint stipulation with the Court dismissing the appeal as to the Company defendants with prejudice.
F -
68
PEABODY ENERGY CORPORATION
NOTES TO CONSOLIDATED FINANCIAL STATEMENTS — (Continued)
Off-Balance Sheet Arrangements
Patriot has approximately
$150 million
i
n federal and state black lung occupational disease liabilities related to workers employed in periods prior to Patriot’s spin-off from the Company in 2007. At the time of the spin-off, Patriot indemnified the Company against any claim relating to these liabilities, including any claim made by the U.S. Department of Labor (“DOL”) against the Company with respect to these obligations as a potentially liable operator under the Federal Coal Mine Health and Safety Act of 1969.
In 2012, Patriot and certain of its wholly owned subsidiaries filed voluntary petitions for reorganization under Chapter 11 of the U.S. Code. In 2013, the Company entered into a definitive settlement agreement with Patriot and the United Mine Workers of America (UMWA), on behalf of itself, its represented Patriot employees and its represented Patriot retirees, to resolve all disputed issues related to Patriot’s bankruptcy. That agreement, which included Patriot’s affirmance of the indemnity relating to such black lung liabilities, became effective upon Patriot's emergence from bankruptcy on December 18, 2013.
If Patriot does not pay the black lung liabilities in the future, the DOL would first look to Patriot and any related credit support for payment before asserting any claims against the Company. While Patriot has agreed to indemnify the Company against any such claims by the DOL, the Company could be responsible for those liabilities if Patriot were not able to fund such indemnification.
|
(26)
|
Summary of Quarterly Financial Information (Unaudited)
|
A summary of the unaudited quarterly results of operations for the years ended
December 31, 2013
and
2012
is presented below.
|
|
Year Ended December 31, 2013
|
||||||||||||||
|
|
First Quarter
|
Second Quarter
|
Third Quarter
|
Fourth Quarter
|
|||||||||||
|
|
(In millions, except per share data)
|
||||||||||||||
|
Revenues
|
$
|
1,748.0
|
|
$
|
1,725.3
|
|
$
|
1,797.6
|
|
$
|
1,742.8
|
|
|||
|
Operating profit (loss)
|
88.8
|
|
26.4
|
|
112.2
|
|
(552.2
|
)
|
|||||||
|
(Loss) income from continuing operations, net of income taxes
|
(10.3
|
)
|
101.4
|
|
24.0
|
|
(401.1
|
)
|
|||||||
|
Net (loss) income
|
(19.4
|
)
|
87.1
|
|
(19.1
|
)
|
(561.2
|
)
|
|||||||
|
Net (loss) income attributable to common stockholders
|
(23.4
|
)
|
90.3
|
|
(26.1
|
)
|
(565.7
|
)
|
|||||||
|
Basic EPS — continuing operations
(1)
|
$
|
(0.05
|
)
|
$
|
0.39
|
|
$
|
0.06
|
|
$
|
(1.52
|
)
|
|||
|
Diluted EPS — continuing operations
(1)
|
(0.05
|
)
|
0.39
|
|
0.06
|
|
(1.52
|
)
|
|||||||
|
Weighted average shares used in calculating basic EPS
|
266.9
|
|
266.9
|
|
267.2
|
|
267.3
|
|
|||||||
|
Weighted average shares used in calculating diluted EPS
|
266.9
|
|
267.5
|
|
267.7
|
|
267.3
|
|
|||||||
|
(1)
|
EPS for the quarters may not sum to the amounts for the year as each period is computed on a discrete basis.
|
F -
69
PEABODY ENERGY CORPORATION
NOTES TO CONSOLIDATED FINANCIAL STATEMENTS — (Continued)
Operating profit (loss) for the fourth quarter of 2013 included
$30.6 million
of charges associated with the settlement of claims and litigation related to the Patriot bankruptcy reorganization. Operating profit (loss) for the second quarter of 2013 included a
$20.6 million
charge related to the Gulf Power litigation. Operating profit (loss) for the second and fourth quarter of 2013 reflected
$21.5 million
and
$506.8 million
, respectively, of asset impairment and mine closure costs. (Loss) income from continuing operations, net of income taxes, for the first, second and third quarters of 2013 included aggregate losses on early debt extinguishment of
$0.9 million
,
$4.5 million
and
$11.5 million
, respectively, related to first and second quarter voluntary debt repayments and repurchases and the third quarter execution of the 2013 Credit Facility refinancing. (Loss) income from continuing operations, net of income taxes, for the second quarter of 2013 included
$6.9 million
in prejudgment interest attributable to the Gulf Power litigation. (Loss) income from continuing operations, net of income taxes, for the fourth quarter of 2013 included the
$11.3 million
tax effect of the aforementioned settlement related to Patriot's bankruptcy reorganization. (Loss) income from continuing operations, net of income taxes, for the fourth quarter of 2013 reflected a net tax benefit of
$112.8 million
related to asset impairment and mine closure costs. (Loss) income from continuing operations, net of income taxes, for all quarters in 2013 included the impact of the remeasurement of non-U.S. income tax accounts, which amounted to additional tax expense of
$1.6 million
in the first quarter of 2013 and a tax benefit of
$37.1 million
,
$2.6 million
and
$6.2 million
in the second, third and fourth quarters of 2013, respectively. Net (loss) income for the fourth quarter of 2013 included
$61.8 million
of after-tax charges recorded in loss from discontinued operations related to the settlement agreement reached with Patriot. Net (loss) income for the third and fourth quarter of 2013 reflected
$32.4 million
and
$42.5 million
, respectively, of after-tax asset impairment and mine closure costs related to a discontinued operation.
|
|
Year Ended December 31, 2012
|
||||||||||||||
|
|
First Quarter
|
Second Quarter
|
Third Quarter
|
Fourth Quarter
|
|||||||||||
|
|
(In millions, except per share data)
|
||||||||||||||
|
Revenues
|
$
|
2,020.7
|
|
$
|
1,981.1
|
|
$
|
2,058.8
|
|
$
|
2,016.9
|
|
|||
|
Operating profit (loss)
|
351.3
|
|
276.7
|
|
266.5
|
|
(722.0
|
)
|
|||||||
|
Income (loss) from continuing operations, net of income taxes
|
183.0
|
|
214.5
|
|
122.9
|
|
(991.3
|
)
|
|||||||
|
Net income (loss)
|
178.3
|
|
207.8
|
|
41.6
|
|
(1,002.8
|
)
|
|||||||
|
Net income (loss) attributable to common stockholders
|
172.7
|
|
204.7
|
|
42.9
|
|
(1,006.0
|
)
|
|||||||
|
Basic EPS — continuing operations
(1)
|
$
|
0.65
|
|
$
|
0.78
|
|
$
|
0.46
|
|
$
|
(3.73
|
)
|
|||
|
Diluted EPS — continuing operations
(1)
|
0.65
|
|
0.78
|
|
0.46
|
|
(3.73
|
)
|
|||||||
|
Weighted average shares used in calculating basic EPS
|
270.1
|
|
269.2
|
|
266.2
|
|
266.3
|
|
|||||||
|
Weighted average shares used in calculating diluted EPS
|
270.9
|
|
269.8
|
|
266.8
|
|
266.3
|
|
|||||||
|
(1)
|
EPS for the quarters may not sum to the amounts for the year as each period is computed on a discrete basis.
|
Operating profit (loss) for the third and fourth quarter of 2012 reflected
$7.7 million
and
$921.3 million
, respectively, of asset impairment and mine closure costs. Income (loss) from continuing operations, net of income taxes, for the second and fourth quarter of 2012 included aggregate losses on early debt extinguishment of
$2.8 million
and
$0.5 million
, respectively, associated with certain voluntary debt pay downs and repurchases. Income (loss) from continuing operations, net of income taxes, for the second and fourth quarter of 2012 included net tax benefits related to the acquisition restructuring of PEA-PCI of
$59.7 million
and
$15.0 million
, respectively. Income (loss) from continuing operations, net of income taxes, for the third and fourth quarter of 2012 reflected net tax benefits of
$2.9 million
and
$224.4 million
, respectively, related to asset impairment and mine closure costs. Income (loss) from continuing operations, net of income taxes, for all quarters in 2012 included the impact of the remeasurement of non-U.S. income tax accounts, which amounted to additional tax expense of
$8.9 million
and
$13.6 million
in the first and third quarter of 2012, respectively, and a tax benefit of
$13.8 million
and
$0.8 million
in the second and fourth quarter of 2012, respectively. Income (loss) from continuing operations, net of income taxes, for the fourth quarter of 2012 also included income tax charges related to a net deferred tax liability recognized in connection with the MRRT and an increase in valuation allowance against Australian loss carryforwards of
$77.2 million
and
$332.2 million
, respectively. Net income (loss) for the third quarter of 2012 reflected
$75.0 million
of after-tax asset impairment and mine closure costs related to a discontinued operation.
|
(27)
|
Segment and Geographic Information
|
The Company reports its operations primarily through the following reportable operating segments: "Western U.S. Mining," "Midwestern U.S. Mining," "Australian Mining," "Trading and Brokerage" and "Corporate and Other."
F -
70
PEABODY ENERGY CORPORATION
NOTES TO CONSOLIDATED FINANCIAL STATEMENTS — (Continued)
The Company's Western U.S. Mining operations reflect the aggregation of the Powder River Basin, Southwest and Colorado mining operations. The mines in that segment are characterized by predominantly surface mining extraction processes, coal with a lower sulfur content and Btu and higher customer transportation costs (due to longer shipping distances). The Company's Midwestern U.S. Mining operations reflect the Company’s Illinois and Indiana mining operations, which are characterized by a mix of surface and underground mining extraction processes, coal with a higher sulfur content and Btu and lower customer transportation costs (due to shorter shipping distances). Geologically, Western operations mine bituminous and sub-bituminous coal deposits, and Midwestern operations mine bituminous coal deposits. The principal business of the Western and Midwestern U.S. Mining segments is the mining, preparation and sale of thermal coal, sold primarily to electric utilities in the U.S., with a portion sold into the seaborne markets.
The Company’s Australian Mining operations consist of its mines in Queensland and New South Wales, Australia. The mines in that segment are characterized by both surface and underground extraction processes, mining various qualities of metallurgical (low-sulfur, high Btu coal) and thermal coal. The metallurgical coal qualities include hard coking coal, semi-hard coking coal, semi-soft coal and pulverized coal injection coal. The business of the Company's Australian Mining operations are primarily export focused with customers spread across several countries, while a portion of the coal is sold within Australia. Generally, revenues from individual countries vary year by year based on the demand for electricity, the demand for steel, the strength of the global economy and several other factors, including those specific to each country.
The Company’s Trading and Brokerage segment brokers coal sales of other coal producers both as principal and agent, and trades coal and freight-related contracts. Corporate and Other includes selling and administrative expenses, income (losses) from equity affiliates, gains (losses) on certain asset sales, costs associated with past mining activities, certain coal royalty expenses, resource management costs and revenues, expenses related to the Company's other commercial activities, such as generation development and Btu Conversion, and provisions for certain litigation.
The Company’s chief operating decision maker uses Adjusted EBITDA as the primary measure of segment profit and loss. The Company defines Adjusted EBITDA as (loss) income from continuing operations before deducting net interest expense, income taxes, asset retirement obligation expenses, depreciation, depletion and amortization, asset impairment and mine closure costs, charges for the settlement of claims and litigation related to previously divested operations and amortization of basis difference related to equity affiliates.
Segment results for the year ended
December 31, 2013
were as follows (assets as of
December 31, 2013
):
|
Western
U.S. Mining
|
Midwestern
U.S. Mining
|
Australian
Mining
|
Trading and
Brokerage
|
Corporate
and Other
|
Consolidated
|
||||||||||||||||||
|
|
(Dollars in millions)
|
||||||||||||||||||||||
|
Revenues
|
$
|
2,669.6
|
|
$
|
1,335.5
|
|
$
|
2,904.6
|
|
$
|
66.0
|
|
$
|
38.0
|
|
$
|
7,013.7
|
|
|||||
|
Adjusted EBITDA
|
693.2
|
|
426.4
|
|
316.6
|
|
(19.9
|
)
|
(369.1
|
)
|
1,047.2
|
|
|||||||||||
|
Total assets
|
3,307.6
|
|
716.8
|
|
7,081.2
|
|
389.6
|
|
2,638.2
|
|
14,133.4
|
|
|||||||||||
|
Property, plant, equipment and mine development, net
|
2,986.8
|
|
667.6
|
|
5,947.1
|
|
1.8
|
|
1,479.2
|
|
11,082.5
|
|
|||||||||||
|
Additions to property, plant, equipment and mine development
|
48.0
|
|
27.2
|
|
230.3
|
|
0.1
|
|
22.8
|
|
328.4
|
|
|||||||||||
|
Federal coal lease expenditures
|
276.8
|
|
—
|
|
—
|
|
—
|
|
—
|
|
276.8
|
|
|||||||||||
|
Loss from equity affiliates
|
—
|
|
—
|
|
—
|
|
—
|
|
40.2
|
|
40.2
|
|
|||||||||||
F -
71
PEABODY ENERGY CORPORATION
NOTES TO CONSOLIDATED FINANCIAL STATEMENTS — (Continued)
Segment results for the year ended
December 31, 2012
were as follows (assets as of
December 31, 2012
):
|
Western
U.S. Mining
|
Midwestern
U.S. Mining
|
Australian
Mining
|
Trading and
Brokerage
|
Corporate
and Other
|
Consolidated
|
||||||||||||||||||
|
|
(Dollars in millions)
|
||||||||||||||||||||||
|
Revenues
|
$
|
2,949.3
|
|
$
|
1,403.7
|
|
$
|
3,503.6
|
|
$
|
199.9
|
|
$
|
21.0
|
|
$
|
8,077.5
|
|
|||||
|
Adjusted EBITDA
|
832.8
|
|
427.0
|
|
938.9
|
|
119.7
|
|
(481.9
|
)
|
1,836.5
|
|
|||||||||||
|
Total assets
|
3,257.9
|
|
728.5
|
|
7,990.8
|
|
543.9
|
|
3,287.9
|
|
15,809.0
|
|
|||||||||||
|
Total property, plant, equipment and mine development, net
|
2,896.1
|
|
707.5
|
|
6,595.5
|
|
1.6
|
|
1,601.0
|
|
11,801.7
|
|
|||||||||||
|
Additions to property, plant, equipment and mine development
|
121.4
|
|
74.7
|
|
743.4
|
|
0.1
|
|
46.4
|
|
986.0
|
|
|||||||||||
|
Federal coal lease expenditures
|
276.5
|
|
—
|
|
—
|
|
—
|
|
—
|
|
276.5
|
|
|||||||||||
|
Loss from equity affiliates
|
—
|
|
—
|
|
—
|
|
—
|
|
61.2
|
|
61.2
|
|
|||||||||||
Segment results for the year ended
December 31, 2011
were as follows (assets as of
December 31, 2011
):
|
Western
U.S. Mining
|
Midwestern
U.S. Mining
|
Australian
Mining
|
Trading and
Brokerage
|
Corporate
and Other
|
Consolidated
|
||||||||||||||||||
|
|
(Dollars in millions)
|
||||||||||||||||||||||
|
Revenues
|
$
|
2,900.4
|
|
$
|
1,402.6
|
|
$
|
3,080.7
|
|
$
|
475.1
|
|
$
|
37.1
|
|
$
|
7,895.9
|
|
|||||
|
Adjusted EBITDA
|
766.0
|
|
402.9
|
|
1,194.3
|
|
197.0
|
|
(437.6
|
)
|
2,122.6
|
|
|||||||||||
|
Total assets
|
3,095.8
|
|
590.6
|
|
8,440.4
|
|
633.3
|
|
3,972.9
|
|
16,733.0
|
|
|||||||||||
|
Additions to property, plant, equipment and mine development
|
186.1
|
|
99.9
|
|
490.8
|
|
0.9
|
|
69.7
|
|
847.4
|
|
|||||||||||
|
Federal coal lease expenditures
|
42.4
|
|
—
|
|
—
|
|
—
|
|
—
|
|
42.4
|
|
|||||||||||
|
Loss from equity affiliates
|
—
|
|
—
|
|
—
|
|
—
|
|
19.2
|
|
19.2
|
|
|||||||||||
A reconciliation of Adjusted EBITDA to consolidated (loss) income from continuing operations, net of income taxes follows:
|
|
Year Ended December 31,
|
||||||||||
|
|
2013
|
2012
|
2011
|
||||||||
|
|
(Dollars in millions)
|
||||||||||
|
Total Adjusted EBITDA
|
$
|
1,047.2
|
|
$
|
1,836.5
|
|
$
|
2,122.6
|
|
||
|
Depreciation, depletion and amortization
|
(740.3
|
)
|
(663.4
|
)
|
(474.3
|
)
|
|||||
|
Asset retirement obligation expenses
|
(66.5
|
)
|
(67.0
|
)
|
(52.6
|
)
|
|||||
|
Asset impairment and mine closure costs
|
(528.3
|
)
|
(929.0
|
)
|
—
|
|
|||||
|
Settlement charges related to the Patriot bankruptcy reorganization
|
(30.6
|
)
|
—
|
|
—
|
|
|||||
|
Amortization of basis difference related to equity affiliates
|
(6.3
|
)
|
(4.6
|
)
|
—
|
|
|||||
|
Interest expense
|
(425.2
|
)
|
(405.6
|
)
|
(238.6
|
)
|
|||||
|
Interest income
|
15.7
|
|
24.5
|
|
18.9
|
|
|||||
|
Income tax benefit (provision)
|
448.3
|
|
(262.3
|
)
|
(363.2
|
)
|
|||||
|
(Loss) income from continuing operations, net of income taxes
|
$
|
(286.0
|
)
|
$
|
(470.9
|
)
|
$
|
1,012.8
|
|
||
F -
72
PEABODY ENERGY CORPORATION
NOTES TO CONSOLIDATED FINANCIAL STATEMENTS — (Continued)
The following table presents revenues as a percent of total revenue from external customers by geographic region:
|
|
Year Ended December 31,
|
|||||||
|
|
2013
|
2012
|
2011
|
|||||
|
U.S.
|
61.1
|
%
|
55.4
|
%
|
61.0
|
%
|
||
|
China
|
10.2
|
%
|
6.8
|
%
|
2.8
|
%
|
||
|
Japan
|
9.8
|
%
|
12.3
|
%
|
10.2
|
%
|
||
|
South Korea
|
3.8
|
%
|
5.8
|
%
|
5.5
|
%
|
||
|
India
|
3.1
|
%
|
4.1
|
%
|
5.2
|
%
|
||
|
Other
|
12.0
|
%
|
15.6
|
%
|
15.3
|
%
|
||
|
Total
|
100.0
|
%
|
100.0
|
%
|
100.0
|
%
|
||
The Company attributes revenue to individual countries based on the location of the physical delivery of the coal.
|
(28)
|
Supplemental Guarantor/Non-Guarantor Financial Information
|
In accordance with the indentures governing the
7.375%
Senior Notes due November 2016, the
6.00%
Senior Notes due November 2018, the
6.50%
Senior Notes due September 2020, the
6.25%
Senior Notes due November 2021 and the
7.875%
Senior Notes due November 2026 (collectively the Senior Notes), certain
100%
owned U.S. subsidiaries of the Company (each, a Guarantor Subsidiary) have fully and unconditionally guaranteed the Senior Notes, on a joint and several basis.The indentures governing the Senior Notes contain customary exceptions under which a guarantee of a Guarantor Subsidiary will terminate, including (1) the release or discharge of the guarantee of the Company’s Credit Agreement by such Guarantor Subsidiary, except a discharge or release by or as a result of payment under such guarantee, (2) a sale or other disposition, by way of merger, consolidation or otherwise, of all of the capital stock of such Guarantor Subsidiary, and (3) the legal defeasance or discharge of the indentures. Separate financial statements and other disclosures concerning the Guarantor Subsidiaries are not presented because management believes that such information is not material to the holders of the Senior Notes. The following historical financial statement information is provided for the Guarantor/Non-Guarantor Subsidiaries.
F -
73
PEABODY ENERGY CORPORATION
SUPPLEMENTAL CONDENSED CONSOLIDATING STATEMENTS OF OPERATIONS
|
|
Year Ended December 31, 2013
|
||||||||||||||||||
|
Parent
Company
|
Guarantor
Subsidiaries
|
Non-Guarantor
Subsidiaries
|
Eliminations
|
Consolidated
|
|||||||||||||||
|
|
(Dollars in millions)
|
||||||||||||||||||
|
Total revenues
|
$
|
—
|
|
$
|
4,027.9
|
|
$
|
3,199.5
|
|
$
|
(213.7
|
)
|
$
|
7,013.7
|
|
||||
|
Costs and expenses
|
|
|
|
|
|
|
|
|
|||||||||||
|
Operating costs and expenses (exclusive of items shown separately below)
|
(173.6
|
)
|
3,478.7
|
|
2,644.7
|
|
(213.7
|
)
|
5,736.1
|
|
|||||||||
|
Depreciation, depletion and amortization
|
—
|
|
329.4
|
|
410.9
|
|
—
|
|
740.3
|
|
|||||||||
|
Asset retirement obligation expenses
|
—
|
|
33.3
|
|
33.2
|
|
—
|
|
66.5
|
|
|||||||||
|
Selling and administrative expenses
|
50.9
|
|
172.8
|
|
25.4
|
|
—
|
|
249.1
|
|
|||||||||
|
Other operating (income) loss:
|
|
|
|
|
|
|
|
|
|||||||||||
|
Net gain on disposal or exchange of assets
|
—
|
|
(52.6
|
)
|
—
|
|
—
|
|
(52.6
|
)
|
|||||||||
|
Asset impairment and mine closure costs
|
21.5
|
|
72.8
|
|
434.0
|
|
—
|
|
528.3
|
|
|||||||||
|
Settlement charges related to the Patriot bankruptcy reorganization
|
30.6
|
|
—
|
|
—
|
|
—
|
|
30.6
|
|
|||||||||
|
Loss from equity affiliates and investment in subsidiaries
|
272.5
|
|
8.3
|
|
31.9
|
|
(272.5
|
)
|
40.2
|
|
|||||||||
|
Interest expense
|
420.8
|
|
165.3
|
|
169.0
|
|
(329.9
|
)
|
425.2
|
|
|||||||||
|
(Gain) loss from extinguishment of affiliate debt
|
—
|
|
(155.5
|
)
|
155.5
|
|
—
|
|
—
|
|
|||||||||
|
Interest income
|
(79.6
|
)
|
(232.4
|
)
|
(33.6
|
)
|
329.9
|
|
(15.7
|
)
|
|||||||||
|
Unrealized loss (gain) on derivatives
|
—
|
|
34.0
|
|
(34.0
|
)
|
—
|
|
—
|
|
|||||||||
|
(Loss) income from continuing operations before income taxes
|
(543.1
|
)
|
173.8
|
|
(637.5
|
)
|
272.5
|
|
(734.3
|
)
|
|||||||||
|
Income tax benefit
|
(92.2
|
)
|
(128.1
|
)
|
(228.0
|
)
|
—
|
|
(448.3
|
)
|
|||||||||
|
(Loss) income from continuing operations, net of income taxes
|
(450.9
|
)
|
301.9
|
|
(409.5
|
)
|
272.5
|
|
(286.0
|
)
|
|||||||||
|
Loss from discontinued operations, net of income taxes
|
(74.0
|
)
|
(5.6
|
)
|
(147.0
|
)
|
—
|
|
(226.6
|
)
|
|||||||||
|
Net (loss) income
|
(524.9
|
)
|
296.3
|
|
(556.5
|
)
|
272.5
|
|
(512.6
|
)
|
|||||||||
|
Less: Net income attributable to noncontrolling interests
|
—
|
|
—
|
|
12.3
|
|
—
|
|
12.3
|
|
|||||||||
|
Net (loss) income attributable to common stockholders
|
$
|
(524.9
|
)
|
$
|
296.3
|
|
$
|
(568.8
|
)
|
$
|
272.5
|
|
$
|
(524.9
|
)
|
||||
F -
74
PEABODY ENERGY CORPORATION
SUPPLEMENTAL CONDENSED CONSOLIDATING STATEMENTS OF OPERATIONS
|
|
Year Ended December 31, 2012
|
||||||||||||||||||
|
Parent
Company
|
Guarantor
Subsidiaries
|
Non-Guarantor
Subsidiaries
|
Eliminations
|
Consolidated
|
|||||||||||||||
|
|
(Dollars in millions)
|
||||||||||||||||||
|
Total revenues
|
$
|
—
|
|
$
|
4,571.3
|
|
$
|
3,729.2
|
|
$
|
(223.0
|
)
|
$
|
8,077.5
|
|
||||
|
Costs and expenses
|
|
|
|
|
|
|
|
|
|||||||||||
|
Operating costs and expenses (exclusive of items shown separately below)
|
(395.2
|
)
|
3,344.1
|
|
3,206.8
|
|
(223.0
|
)
|
5,932.7
|
|
|||||||||
|
Depreciation, depletion and amortization
|
—
|
|
315.6
|
|
347.8
|
|
—
|
|
663.4
|
|
|||||||||
|
Asset retirement obligation expenses
|
—
|
|
42.9
|
|
24.1
|
|
—
|
|
67.0
|
|
|||||||||
|
Selling and administrative expenses
|
38.7
|
|
199.7
|
|
30.4
|
|
—
|
|
268.8
|
|
|||||||||
|
Other operating (income) loss:
|
|
|
|
|
|
|
|
|
|||||||||||
|
Net gain on disposal or exchange of assets
|
—
|
|
(14.7
|
)
|
(2.4
|
)
|
—
|
|
(17.1
|
)
|
|||||||||
|
Asset impairment and mine closure costs
|
35.5
|
|
86.8
|
|
806.7
|
|
—
|
|
929.0
|
|
|||||||||
|
Loss from equity affiliates and investment in subsidiaries
|
720.0
|
|
12.5
|
|
48.7
|
|
(720.0
|
)
|
61.2
|
|
|||||||||
|
Interest expense
|
413.9
|
|
13.9
|
|
475.6
|
|
(497.8
|
)
|
405.6
|
|
|||||||||
|
Interest income
|
(309.8
|
)
|
(149.1
|
)
|
(63.4
|
)
|
497.8
|
|
(24.5
|
)
|
|||||||||
|
Unrealized (gain) loss on derivatives
|
—
|
|
(35.3
|
)
|
35.3
|
|
—
|
|
—
|
|
|||||||||
|
(Loss) income from continuing operations before income taxes
|
(503.1
|
)
|
754.9
|
|
(1,180.4
|
)
|
720.0
|
|
(208.6
|
)
|
|||||||||
|
Income tax provision
|
80.2
|
|
105.8
|
|
76.3
|
|
—
|
|
262.3
|
|
|||||||||
|
(Loss) income from continuing operations, net of income taxes
|
(583.3
|
)
|
649.1
|
|
(1,256.7
|
)
|
720.0
|
|
(470.9
|
)
|
|||||||||
|
Loss from discontinued operations, net of income taxes
|
(2.4
|
)
|
(82.2
|
)
|
(19.6
|
)
|
—
|
|
(104.2
|
)
|
|||||||||
|
Net (loss) income
|
(585.7
|
)
|
566.9
|
|
(1,276.3
|
)
|
720.0
|
|
(575.1
|
)
|
|||||||||
|
Less: Net income attributable to noncontrolling interests
|
—
|
|
—
|
|
10.6
|
|
—
|
|
10.6
|
|
|||||||||
|
Net (loss) income attributable to common stockholders
|
$
|
(585.7
|
)
|
$
|
566.9
|
|
$
|
(1,286.9
|
)
|
$
|
720.0
|
|
$
|
(585.7
|
)
|
||||
F -
75
PEABODY ENERGY CORPORATION
SUPPLEMENTAL CONDENSED CONSOLIDATING STATEMENTS OF OPERATIONS
|
|
Year Ended December 31, 2011
|
||||||||||||||||||
|
Parent
Company
|
Guarantor
Subsidiaries
|
Non-Guarantor
Subsidiaries
|
Eliminations
|
Consolidated
|
|||||||||||||||
|
|
(Dollars in millions)
|
||||||||||||||||||
|
Total revenues
|
$
|
—
|
|
$
|
4,679.9
|
|
$
|
3,509.4
|
|
$
|
(293.4
|
)
|
$
|
7,895.9
|
|
||||
|
Costs and expenses
|
|
|
|
|
|
|
|
|
|||||||||||
|
Operating costs and expenses (exclusive of items shown separately below)
|
(386.3
|
)
|
3,526.2
|
|
2,631.1
|
|
(293.4
|
)
|
5,477.6
|
|
|||||||||
|
Depreciation, depletion and amortization
|
—
|
|
289.5
|
|
184.8
|
|
—
|
|
474.3
|
|
|||||||||
|
Asset retirement obligation expenses
|
—
|
|
35.7
|
|
16.9
|
|
—
|
|
52.6
|
|
|||||||||
|
Selling and administrative expenses
|
34.0
|
|
215.0
|
|
19.2
|
|
—
|
|
268.2
|
|
|||||||||
|
Acquisition costs related to Macarthur Coal Limited
|
32.8
|
|
31.2
|
|
21.2
|
|
—
|
|
85.2
|
|
|||||||||
|
Other operating (income) loss:
|
|
|
|
|
|
|
|
|
|||||||||||
|
Net gain on disposal or exchange of assets
|
—
|
|
(73.2
|
)
|
(3.7
|
)
|
—
|
|
(76.9
|
)
|
|||||||||
|
(Income) loss from equity affiliates and investment in subsidiaries
|
(881.5
|
)
|
8.6
|
|
10.6
|
|
881.5
|
|
19.2
|
|
|||||||||
|
Interest expense
|
243.1
|
|
47.3
|
|
67.2
|
|
(119.0
|
)
|
238.6
|
|
|||||||||
|
Interest income
|
(50.9
|
)
|
(31.1
|
)
|
(55.9
|
)
|
119.0
|
|
(18.9
|
)
|
|||||||||
|
Unrealized (gain) loss on derivatives
|
—
|
|
(1.3
|
)
|
1.3
|
|
—
|
|
—
|
|
|||||||||
|
Income from continuing operations before income taxes
|
1,008.8
|
|
632.0
|
|
616.7
|
|
(881.5
|
)
|
1,376.0
|
|
|||||||||
|
Income tax provision
|
46.5
|
|
172.0
|
|
144.7
|
|
—
|
|
363.2
|
|
|||||||||
|
Income from continuing operations, net of income taxes
|
962.3
|
|
460.0
|
|
472.0
|
|
(881.5
|
)
|
1,012.8
|
|
|||||||||
|
Loss from discontinued operations, net of income taxes
|
(4.6
|
)
|
(5.4
|
)
|
(56.5
|
)
|
—
|
|
(66.5
|
)
|
|||||||||
|
Net income
|
957.7
|
|
454.6
|
|
415.5
|
|
(881.5
|
)
|
946.3
|
|
|||||||||
|
Less: Net loss attributable to noncontrolling interests
|
—
|
|
—
|
|
(11.4
|
)
|
—
|
|
(11.4
|
)
|
|||||||||
|
Net income attributable to common stockholders
|
$
|
957.7
|
|
$
|
454.6
|
|
$
|
426.9
|
|
$
|
(881.5
|
)
|
$
|
957.7
|
|
||||
F -
76
PEABODY ENERGY CORPORATION
SUPPLEMENTAL CONDENSED CONSOLIDATING STATEMENTS OF COMPREHENSIVE INCOME
|
|
Year Ended December 31, 2013
|
||||||||||||||||||
|
Parent
Company
|
Guarantor
Subsidiaries
|
Non-Guarantor
Subsidiaries
|
Eliminations
|
Consolidated
|
|||||||||||||||
|
|
(Dollars in millions)
|
||||||||||||||||||
|
Net (loss) income
|
$
|
(524.9
|
)
|
$
|
296.3
|
|
$
|
(556.5
|
)
|
$
|
272.5
|
|
$
|
(512.6
|
)
|
||||
|
Other comprehensive (loss) income, net of income taxes:
|
|||||||||||||||||||
|
Net change in unrealized gains (losses) on available-for-sale securities (net of $0.5 tax provision)
|
|||||||||||||||||||
|
Unrealized holding losses on available-for-sale securities
|
(12.2
|
)
|
—
|
|
(0.1
|
)
|
—
|
|
(12.3
|
)
|
|||||||||
|
Less: Reclassification for realized losses (gains) included in net income
|
13.0
|
|
—
|
|
(0.2
|
)
|
—
|
|
12.8
|
|
|||||||||
|
Net change in unrealized gains (losses) on available-for-sale securities
|
0.8
|
|
—
|
|
(0.3
|
)
|
—
|
|
0.5
|
|
|||||||||
|
Net unrealized losses on cash flow hedges (net of $300.0 tax benefit)
|
|||||||||||||||||||
|
(Decrease) increase in fair value of cash flow hedges
|
(368.4
|
)
|
—
|
|
34.8
|
|
—
|
|
(333.6
|
)
|
|||||||||
|
Less: Reclassification for realized gains included in net income
|
(109.0
|
)
|
—
|
|
(100.6
|
)
|
—
|
|
(209.6
|
)
|
|||||||||
|
Net unrealized losses on cash flow hedges
|
(477.4
|
)
|
—
|
|
(65.8
|
)
|
—
|
|
(543.2
|
)
|
|||||||||
|
Postretirement plans and workers' compensation obligations (net of $121.7 tax provision)
|
|||||||||||||||||||
|
Prior service cost for the period
|
—
|
|
(1.4
|
)
|
—
|
|
—
|
|
(1.4
|
)
|
|||||||||
|
Net actuarial gain for the period
|
—
|
|
103.8
|
|
7.1
|
|
—
|
|
110.9
|
|
|||||||||
|
Amortization of actuarial loss (gain) and prior service cost
|
—
|
|
95.8
|
|
(0.1
|
)
|
—
|
|
95.7
|
|
|||||||||
|
Postretirement plan and workers' compensation obligations
|
—
|
|
198.2
|
|
7.0
|
|
—
|
|
205.2
|
|
|||||||||
|
Foreign currency translation adjustment
|
—
|
|
—
|
|
(92.7
|
)
|
—
|
|
(92.7
|
)
|
|||||||||
|
Other comprehensive income from investment in subsidiaries
|
46.4
|
|
—
|
|
—
|
|
(46.4
|
)
|
—
|
|
|||||||||
|
Other comprehensive (loss) income, net of income taxes
|
(430.2
|
)
|
198.2
|
|
(151.8
|
)
|
(46.4
|
)
|
(430.2
|
)
|
|||||||||
|
Comprehensive (loss) income
|
(955.1
|
)
|
494.5
|
|
(708.3
|
)
|
226.1
|
|
(942.8
|
)
|
|||||||||
|
Less: Comprehensive income attributable to noncontrolling interests
|
—
|
|
—
|
|
12.3
|
|
—
|
|
12.3
|
|
|||||||||
|
Comprehensive (loss) income attributable to common stockholders
|
$
|
(955.1
|
)
|
$
|
494.5
|
|
$
|
(720.6
|
)
|
$
|
226.1
|
|
$
|
(955.1
|
)
|
||||
F -
77
PEABODY ENERGY CORPORATION
SUPPLEMENTAL CONDENSED CONSOLIDATING STATEMENTS OF COMPREHENSIVE INCOME
|
|
Year Ended December 31, 2012
|
||||||||||||||||||
|
Parent
Company
|
Guarantor
Subsidiaries
|
Non-Guarantor
Subsidiaries
|
Eliminations
|
Consolidated
|
|||||||||||||||
|
|
(Dollars in millions)
|
||||||||||||||||||
|
Net (loss) income
|
$
|
(585.7
|
)
|
$
|
566.9
|
|
$
|
(1,276.3
|
)
|
$
|
720.0
|
|
$
|
(575.1
|
)
|
||||
|
Other comprehensive income, net of income taxes:
|
|||||||||||||||||||
|
Net change in unrealized gains (losses) on available-for-sale securities (net of $4.0 tax provision)
|
|||||||||||||||||||
|
Unrealized holding losses on available-for-sale securities
|
(15.5
|
)
|
—
|
|
—
|
|
—
|
|
(15.5
|
)
|
|||||||||
|
Less: Reclassification for realized losses included in net income
|
22.5
|
|
—
|
|
—
|
|
—
|
|
22.5
|
|
|||||||||
|
Net change in unrealized gains on available-for-sale securities
|
7.0
|
|
—
|
|
—
|
|
—
|
|
7.0
|
|
|||||||||
|
Net unrealized losses on cash flow hedges (net of $3.9 tax benefit)
|
|||||||||||||||||||
|
Increase in fair value of cash flow hedges
|
205.9
|
|
—
|
|
144.5
|
|
—
|
|
350.4
|
|
|||||||||
|
Less: Reclassification for realized gains included in net income
|
(249.1
|
)
|
—
|
|
(49.5
|
)
|
—
|
|
(298.6
|
)
|
|||||||||
|
Net unrealized (losses) gains on cash flow hedges
|
(43.2
|
)
|
—
|
|
95.0
|
|
—
|
|
51.8
|
|
|||||||||
|
Postretirement plans and workers' compensation obligations (net of $43.9 tax provision)
|
|||||||||||||||||||
|
Prior service cost for the period
|
—
|
|
20.1
|
|
—
|
|
—
|
|
20.1
|
|
|||||||||
|
Net actuarial (loss) gain for the period
|
—
|
|
(0.9
|
)
|
0.9
|
|
—
|
|
—
|
|
|||||||||
|
Amortization of actuarial loss and prior service cost
|
—
|
|
54.5
|
|
0.9
|
|
—
|
|
55.4
|
|
|||||||||
|
Postretirement plan and workers' compensation obligations
|
—
|
|
73.7
|
|
1.8
|
|
—
|
|
75.5
|
|
|||||||||
|
Foreign currency translation adjustment
|
—
|
|
—
|
|
19.1
|
|
—
|
|
19.1
|
|
|||||||||
|
Other comprehensive income from investment in subsidiaries
|
189.6
|
|
—
|
|
—
|
|
(189.6
|
)
|
—
|
|
|||||||||
|
Other comprehensive income, net of income taxes
|
153.4
|
|
73.7
|
|
115.9
|
|
(189.6
|
)
|
153.4
|
|
|||||||||
|
Comprehensive (loss) income
|
(432.3
|
)
|
640.6
|
|
(1,160.4
|
)
|
530.4
|
|
(421.7
|
)
|
|||||||||
|
Less: Comprehensive income attributable to noncontrolling interests
|
—
|
|
—
|
|
10.6
|
|
—
|
|
10.6
|
|
|||||||||
|
Comprehensive (loss) income attributable to common stockholders
|
$
|
(432.3
|
)
|
$
|
640.6
|
|
$
|
(1,171.0
|
)
|
$
|
530.4
|
|
$
|
(432.3
|
)
|
||||
F -
78
PEABODY ENERGY CORPORATION
SUPPLEMENTAL CONDENSED CONSOLIDATING STATEMENTS OF COMPREHENSIVE INCOME
|
|
Year Ended December 31, 2011
|
||||||||||||||||||
|
Parent
Company
|
Guarantor
Subsidiaries
|
Non-Guarantor
Subsidiaries
|
Eliminations
|
Consolidated
|
|||||||||||||||
|
|
(Dollars in millions)
|
||||||||||||||||||
|
Net income
|
$
|
957.7
|
|
$
|
454.6
|
|
$
|
415.5
|
|
$
|
(881.5
|
)
|
$
|
946.3
|
|
||||
|
Other comprehensive (loss) income, net of income taxes:
|
|||||||||||||||||||
|
Net change in unrealized (losses) gains on available-for-sale securities (net of $3.9 tax benefit)
|
|||||||||||||||||||
|
Unrealized holding (losses) gains on available-for-sale securities
|
(6.0
|
)
|
—
|
|
0.2
|
|
—
|
|
(5.8
|
)
|
|||||||||
|
Less: Reclassification for realized gains included in net income
|
(0.9
|
)
|
—
|
|
—
|
|
—
|
|
(0.9
|
)
|
|||||||||
|
Net change in unrealized (losses) gains on available-for-sale securities
|
(6.9
|
)
|
—
|
|
0.2
|
|
—
|
|
(6.7
|
)
|
|||||||||
|
Net unrealized gains on cash flow hedges (net of $6.2 tax benefit)
|
|||||||||||||||||||
|
Increase in fair value of cash flow hedges
|
142.0
|
|
—
|
|
149.9
|
|
—
|
|
291.9
|
|
|||||||||
|
Less: Reclassification for realized gains included in net income
|
(241.9
|
)
|
—
|
|
(9.1
|
)
|
—
|
|
(251.0
|
)
|
|||||||||
|
Net unrealized (losses) gains on cash flow hedges
|
(99.9
|
)
|
—
|
|
140.8
|
|
—
|
|
40.9
|
|
|||||||||
|
Postretirement plans and workers' compensation obligations (net of $63.4 tax benefit)
|
|||||||||||||||||||
|
Prior service cost for the period
|
—
|
|
0.9
|
|
—
|
|
—
|
|
0.9
|
|
|||||||||
|
Net actuarial loss for the period
|
—
|
|
(148.6
|
)
|
(1.5
|
)
|
—
|
|
(150.1
|
)
|
|||||||||
|
Amortization of actuarial loss and prior service cost
|
—
|
|
39.4
|
|
1.1
|
|
—
|
|
40.5
|
|
|||||||||
|
Postretirement plan and workers' compensation obligations
|
—
|
|
(108.3
|
)
|
(0.4
|
)
|
—
|
|
(108.7
|
)
|
|||||||||
|
Other comprehensive income from investment in subsidiaries
|
32.3
|
|
—
|
|
—
|
|
(32.3
|
)
|
—
|
|
|||||||||
|
Other comprehensive (loss) income, net of income taxes
|
(74.5
|
)
|
(108.3
|
)
|
140.6
|
|
(32.3
|
)
|
(74.5
|
)
|
|||||||||
|
Comprehensive income
|
883.2
|
|
346.3
|
|
556.1
|
|
(913.8
|
)
|
871.8
|
|
|||||||||
|
Less: Comprehensive loss attributable to noncontrolling interests
|
—
|
|
—
|
|
(11.4
|
)
|
—
|
|
(11.4
|
)
|
|||||||||
|
Comprehensive income attributable to common
stockholders
|
$
|
883.2
|
|
$
|
346.3
|
|
$
|
567.5
|
|
$
|
(913.8
|
)
|
$
|
883.2
|
|
||||
F -
79
PEABODY ENERGY CORPORATION
SUPPLEMENTAL CONDENSED CONSOLIDATING BALANCE SHEETS
|
|
December 31, 2013
|
||||||||||||||||||
|
Parent
Company
|
Guarantor
Subsidiaries
|
Non-Guarantor
Subsidiaries
|
Reclassifications/
Eliminations
|
Consolidated
|
|||||||||||||||
|
|
(Dollars in millions)
|
||||||||||||||||||
|
Assets
|
|
|
|
|
|
|
|
|
|
|
|||||||||
|
Current assets
|
|
|
|
|
|
|
|
|
|
|
|||||||||
|
Cash and cash equivalents
|
$
|
300.7
|
|
$
|
0.3
|
|
$
|
143.0
|
|
$
|
—
|
|
$
|
444.0
|
|
||||
|
Accounts receivable, net
|
1.3
|
|
—
|
|
559.1
|
|
(2.5
|
)
|
557.9
|
|
|||||||||
|
Receivables from affiliates, net
|
68.4
|
|
—
|
|
—
|
|
(68.4
|
)
|
—
|
|
|||||||||
|
Inventories
|
—
|
|
235.1
|
|
271.6
|
|
—
|
|
506.7
|
|
|||||||||
|
Assets from coal trading activities, net
|
—
|
|
46.7
|
|
—
|
|
(10.6
|
)
|
36.1
|
|
|||||||||
|
Deferred income taxes
|
—
|
|
61.9
|
|
6.4
|
|
(1.9
|
)
|
66.4
|
|
|||||||||
|
Other current assets
|
34.5
|
|
73.7
|
|
273.4
|
|
—
|
|
381.6
|
|
|||||||||
|
Total current assets
|
404.9
|
|
417.7
|
|
1,253.5
|
|
(83.4
|
)
|
1,992.7
|
|
|||||||||
|
Property, plant, equipment and mine development, net
|
—
|
|
5,055.7
|
|
6,026.8
|
|
—
|
|
11,082.5
|
|
|||||||||
|
Deferred income taxes
|
16.5
|
|
—
|
|
7.8
|
|
(16.5
|
)
|
7.8
|
|
|||||||||
|
Investments and other assets
|
11,394.9
|
|
8.8
|
|
762.6
|
|
(11,115.9
|
)
|
1,050.4
|
|
|||||||||
|
Notes receivable from affiliates, net
|
—
|
|
1,433.0
|
|
—
|
|
(1,433.0
|
)
|
—
|
|
|||||||||
|
Total assets
|
$
|
11,816.3
|
|
$
|
6,915.2
|
|
$
|
8,050.7
|
|
$
|
(12,648.8
|
)
|
$
|
14,133.4
|
|
||||
|
Liabilities and Stockholders’ Equity
|
|
|
|
|
|
|
|
|
|
|
|||||||||
|
Current liabilities
|
|
|
|
|
|
|
|
|
|
|
|||||||||
|
Current maturities of long-term debt
|
$
|
12.0
|
|
$
|
0.1
|
|
$
|
19.6
|
|
$
|
—
|
|
$
|
31.7
|
|
||||
|
Payables to affiliates, net
|
—
|
|
10.4
|
|
58.0
|
|
(68.4
|
)
|
—
|
|
|||||||||
|
Deferred income taxes
|
1.9
|
|
—
|
|
—
|
|
(1.9
|
)
|
—
|
|
|||||||||
|
Liabilities from coal trading activities, net
|
—
|
|
0.2
|
|
16.5
|
|
(10.6
|
)
|
6.1
|
|
|||||||||
|
Accounts payable and accrued expenses
|
360.0
|
|
577.7
|
|
802.5
|
|
(2.5
|
)
|
1,737.7
|
|
|||||||||
|
Total current liabilities
|
373.9
|
|
588.4
|
|
896.6
|
|
(83.4
|
)
|
1,775.5
|
|
|||||||||
|
Long-term debt, less current maturities
|
5,959.1
|
|
6.5
|
|
5.1
|
|
—
|
|
5,970.7
|
|
|||||||||
|
Deferred income taxes
|
—
|
|
55.9
|
|
1.5
|
|
(16.5
|
)
|
40.9
|
|
|||||||||
|
Notes payable to affiliates, net
|
1,032.6
|
|
—
|
|
400.4
|
|
(1,433.0
|
)
|
—
|
|
|||||||||
|
Other noncurrent liabilities
|
542.0
|
|
1,476.2
|
|
380.2
|
|
—
|
|
2,398.4
|
|
|||||||||
|
Total liabilities
|
7,907.6
|
|
2,127.0
|
|
1,683.8
|
|
(1,532.9
|
)
|
10,185.5
|
|
|||||||||
|
Peabody Energy Corporation’s stockholders’ equity
|
3,908.7
|
|
4,788.2
|
|
6,327.7
|
|
(11,115.9
|
)
|
3,908.7
|
|
|||||||||
|
Noncontrolling interests
|
—
|
|
—
|
|
39.2
|
|
—
|
|
39.2
|
|
|||||||||
|
Total stockholders’ equity
|
3,908.7
|
|
4,788.2
|
|
6,366.9
|
|
(11,115.9
|
)
|
3,947.9
|
|
|||||||||
|
Total liabilities and stockholders’ equity
|
$
|
11,816.3
|
|
$
|
6,915.2
|
|
$
|
8,050.7
|
|
$
|
(12,648.8
|
)
|
$
|
14,133.4
|
|
||||
F -
80
PEABODY ENERGY CORPORATION
SUPPLEMENTAL CONDENSED CONSOLIDATING BALANCE SHEETS
|
|
December 31, 2012
|
||||||||||||||||||
|
Parent
Company
|
Guarantor
Subsidiaries
|
Non-Guarantor
Subsidiaries
|
Reclassifications/
Eliminations
|
Consolidated
|
|||||||||||||||
|
|
|
(Dollars in millions)
|
|
||||||||||||||||
|
Assets
|
|
|
|
|
|
|
|
|
|
|
|||||||||
|
Current assets
|
|
|
|
|
|
|
|
|
|
|
|||||||||
|
Cash and cash equivalents
|
$
|
269.6
|
|
$
|
0.3
|
|
$
|
288.9
|
|
$
|
—
|
|
$
|
558.8
|
|
||||
|
Accounts receivable, net
|
3.6
|
|
5.0
|
|
729.2
|
|
—
|
|
737.8
|
|
|||||||||
|
Receivables from affiliates, net
|
—
|
|
2,904.4
|
|
—
|
|
(2,904.4
|
)
|
—
|
|
|||||||||
|
Inventories
|
—
|
|
271.4
|
|
277.0
|
|
—
|
|
548.4
|
|
|||||||||
|
Assets from coal trading activities, net
|
—
|
|
87.5
|
|
—
|
|
(35.1
|
)
|
52.4
|
|
|||||||||
|
Deferred income taxes
|
—
|
|
57.3
|
|
2.3
|
|
(3.2
|
)
|
56.4
|
|
|||||||||
|
Other current assets
|
275.0
|
|
—
|
|
354.6
|
|
(7.9
|
)
|
621.7
|
|
|||||||||
|
Total current assets
|
548.2
|
|
3,325.9
|
|
1,652.0
|
|
(2,950.6
|
)
|
2,575.5
|
|
|||||||||
|
Property, plant, equipment and mine development, net
|
—
|
|
5,120.8
|
|
6,680.9
|
|
—
|
|
11,801.7
|
|
|||||||||
|
Investments and other assets
|
9,524.7
|
|
—
|
|
1,037.0
|
|
(9,129.9
|
)
|
1,431.8
|
|
|||||||||
|
Notes receivable from affiliates, net
|
3,421.3
|
|
1,100.4
|
|
—
|
|
(4,521.7
|
)
|
—
|
|
|||||||||
|
Total assets
|
$
|
13,494.2
|
|
$
|
9,547.1
|
|
$
|
9,369.9
|
|
$
|
(16,602.2
|
)
|
$
|
15,809.0
|
|
||||
|
Liabilities and Stockholders’ Equity
|
|
|
|
|
|
|
|
|
|
|
|||||||||
|
Current liabilities
|
|
|
|
|
|
|
|
|
|
|
|||||||||
|
Current maturities of long-term debt
|
$
|
—
|
|
$
|
—
|
|
$
|
47.8
|
|
$
|
—
|
|
$
|
47.8
|
|
||||
|
Payables to affiliates, net
|
2,309.3
|
|
—
|
|
595.1
|
|
(2,904.4
|
)
|
—
|
|
|||||||||
|
Deferred income taxes
|
3.2
|
|
—
|
|
—
|
|
(3.2
|
)
|
—
|
|
|||||||||
|
Liabilities from coal trading activities, net
|
—
|
|
4.0
|
|
50.5
|
|
(35.1
|
)
|
19.4
|
|
|||||||||
|
Accounts payable and accrued expenses
|
63.3
|
|
595.0
|
|
956.5
|
|
(7.9
|
)
|
1,606.9
|
|
|||||||||
|
Total current liabilities
|
2,375.8
|
|
599.0
|
|
1,649.9
|
|
(2,950.6
|
)
|
1,674.1
|
|
|||||||||
|
Long-term debt, less current maturities
|
6,114.5
|
|
6.6
|
|
84.0
|
|
—
|
|
6,205.1
|
|
|||||||||
|
Deferred income taxes
|
43.2
|
|
142.0
|
|
392.1
|
|
—
|
|
577.3
|
|
|||||||||
|
Notes payable to affiliates, net
|
—
|
|
—
|
|
4,521.7
|
|
(4,521.7
|
)
|
—
|
|
|||||||||
|
Other noncurrent liabilities
|
55.8
|
|
1,893.9
|
|
464.0
|
|
—
|
|
2,413.7
|
|
|||||||||
|
Total liabilities
|
8,589.3
|
|
2,641.5
|
|
7,111.7
|
|
(7,472.3
|
)
|
10,870.2
|
|
|||||||||
|
Peabody Energy Corporation’s stockholders’ equity
|
4,904.9
|
|
6,905.6
|
|
2,224.3
|
|
(9,129.9
|
)
|
4,904.9
|
|
|||||||||
|
Noncontrolling interests
|
—
|
|
—
|
|
33.9
|
|
—
|
|
33.9
|
|
|||||||||
|
Total stockholders’ equity
|
4,904.9
|
|
6,905.6
|
|
2,258.2
|
|
(9,129.9
|
)
|
4,938.8
|
|
|||||||||
|
Total liabilities and stockholders’ equity
|
$
|
13,494.2
|
|
$
|
9,547.1
|
|
$
|
9,369.9
|
|
$
|
(16,602.2
|
)
|
$
|
15,809.0
|
|
||||
F -
81
PEABODY ENERGY CORPORATION
SUPPLEMENTAL CONDENSED CONSOLIDATING STATEMENTS OF CASH FLOWS
|
|
Year Ended December 31, 2013
|
||||||||||||||
|
Parent
Company
|
Guarantor
Subsidiaries
|
Non-Guarantor
Subsidiaries
|
Consolidated
|
||||||||||||
|
|
|
(Dollars in millions)
|
|
||||||||||||
|
Cash Flows From Operating Activities
|
|
|
|
|
|
|
|
|
|||||||
|
Net cash provided by continuing operations
|
$
|
(24.3
|
)
|
$
|
778.7
|
|
$
|
25.7
|
|
780.1
|
|
||||
|
Net cash used in discontinued operations
|
(20.4
|
)
|
(7.6
|
)
|
(29.7
|
)
|
(57.7
|
)
|
|||||||
|
Net cash provided by (used in) operating activities
|
(44.7
|
)
|
771.1
|
|
(4.0
|
)
|
722.4
|
|
|||||||
|
Cash Flows From Investing Activities
|
|
|
|
|
|
|
|
|
|||||||
|
Additions to property, plant, equipment and mine development
|
—
|
|
(95.9
|
)
|
(232.5
|
)
|
(328.4
|
)
|
|||||||
|
Changes in accrued expenses related to capital expenditures
|
—
|
|
(1.2
|
)
|
(119.5
|
)
|
(120.7
|
)
|
|||||||
|
Federal coal lease expenditures
|
—
|
|
(276.8
|
)
|
—
|
|
(276.8
|
)
|
|||||||
|
Proceeds from disposal of assets, net of notes receivable
|
—
|
|
93.0
|
|
85.3
|
|
178.3
|
|
|||||||
|
Purchases of debt securities
|
—
|
|
—
|
|
(22.8
|
)
|
(22.8
|
)
|
|||||||
|
Proceeds from sales of debt securities
|
—
|
|
—
|
|
22.9
|
|
22.9
|
|
|||||||
|
Maturity of short-term investments
|
—
|
|
—
|
|
4.8
|
|
4.8
|
|
|||||||
|
Contributions to joint ventures
|
—
|
|
—
|
|
(671.7
|
)
|
(671.7
|
)
|
|||||||
|
Distributions from joint ventures
|
—
|
|
—
|
|
722.9
|
|
722.9
|
|
|||||||
|
Advances to related parties
|
—
|
|
—
|
|
(42.1
|
)
|
(42.1
|
)
|
|||||||
|
Repayment of loans from related parties
|
—
|
|
—
|
|
25.2
|
|
25.2
|
|
|||||||
|
Other, net
|
—
|
|
(5.7
|
)
|
(0.1
|
)
|
(5.8
|
)
|
|||||||
|
Net cash used in continuing operations
|
—
|
|
(286.6
|
)
|
(227.6
|
)
|
(514.2
|
)
|
|||||||
|
Net cash used in discontinued operations
|
—
|
|
—
|
|
(1.5
|
)
|
(1.5
|
)
|
|||||||
|
Net cash used in investing activities
|
—
|
|
(286.6
|
)
|
(229.1
|
)
|
(515.7
|
)
|
|||||||
|
Cash Flows From Financing Activities
|
|||||||||||||||
|
Repayments of long-term debt
|
(1,334.2
|
)
|
(0.2
|
)
|
(55.8
|
)
|
$
|
(1,390.2
|
)
|
||||||
|
Proceeds from long-term debt
|
1,188.0
|
|
—
|
|
—
|
|
1,188.0
|
|
|||||||
|
Payment of debt issuance costs
|
(22.8
|
)
|
—
|
|
—
|
|
(22.8
|
)
|
|||||||
|
Dividends paid
|
(91.7
|
)
|
—
|
|
—
|
|
(91.7
|
)
|
|||||||
|
Repurchase of employee common stock relinquished for tax withholding
|
(3.1
|
)
|
—
|
|
—
|
|
(3.1
|
)
|
|||||||
|
Other, net
|
7.3
|
|
(1.6
|
)
|
(7.4
|
)
|
(1.7
|
)
|
|||||||
|
Transactions with affiliates, net
|
332.3
|
|
(482.7
|
)
|
150.4
|
|
—
|
|
|||||||
|
Net cash (used in) provided by financing activities
|
75.8
|
|
(484.5
|
)
|
87.2
|
|
(321.5
|
)
|
|||||||
|
Net change in cash and cash equivalents
|
31.1
|
|
—
|
|
(145.9
|
)
|
(114.8
|
)
|
|||||||
|
Cash and cash equivalents at beginning of year
|
269.6
|
|
0.3
|
|
288.9
|
|
558.8
|
|
|||||||
|
Cash and cash equivalents at end of year
|
$
|
300.7
|
|
$
|
0.3
|
|
$
|
143.0
|
|
$
|
444.0
|
|
|||
F -
82
PEABODY ENERGY CORPORATION
SUPPLEMENTAL CONDENSED CONSOLIDATING STATEMENTS OF CASH FLOWS
|
|
Year Ended December 31, 2012
|
||||||||||||||
|
Parent
Company
|
Guarantor
Subsidiaries
|
Non-Guarantor
Subsidiaries
|
Consolidated
|
||||||||||||
|
|
|
(Dollars in millions)
|
|
||||||||||||
|
Cash Flows From Operating Activities
|
|
|
|
|
|
|
|
|
|||||||
|
Net cash provided by (used in) continuing operations
|
$
|
372.0
|
|
$
|
1,390.3
|
|
$
|
(162.5
|
)
|
$
|
1,599.8
|
|
|||
|
Net cash used in discontinued operations
|
(3.4
|
)
|
(11.6
|
)
|
(69.7
|
)
|
(84.7
|
)
|
|||||||
|
Net provided by (used in) operating activities
|
368.6
|
|
1,378.7
|
|
(232.2
|
)
|
1,515.1
|
|
|||||||
|
Cash Flows From Investing Activities
|
|
|
|
|
|
|
|
|
|||||||
|
Additions to property, plant, equipment and mine development
|
—
|
|
(237.4
|
)
|
(748.6
|
)
|
(986.0
|
)
|
|||||||
|
Changes in accrued expenses related to capital expenditures
|
—
|
|
3.1
|
|
101.6
|
|
104.7
|
|
|||||||
|
Federal coal lease expenditures
|
—
|
|
(276.5
|
)
|
—
|
|
(276.5
|
)
|
|||||||
|
Investment in Prairie State Energy Campus
|
—
|
|
(10.7
|
)
|
—
|
|
(10.7
|
)
|
|||||||
|
Proceeds from disposal of assets, net of notes receivable
|
—
|
|
70.1
|
|
77.8
|
|
147.9
|
|
|||||||
|
Purchases of debt and equity securities
|
—
|
|
—
|
|
(46.7
|
)
|
(46.7
|
)
|
|||||||
|
Proceeds from sales of debt and equity securities
|
—
|
|
—
|
|
46.4
|
|
46.4
|
|
|||||||
|
Purchases of short-term investments
|
—
|
|
—
|
|
(4.8
|
)
|
(4.8
|
)
|
|||||||
|
Contributions to joint ventures
|
—
|
|
—
|
|
(824.0
|
)
|
(824.0
|
)
|
|||||||
|
Distributions from joint ventures
|
—
|
|
—
|
|
823.0
|
|
823.0
|
|
|||||||
|
Advances to related parties
|
—
|
|
—
|
|
(148.0
|
)
|
(148.0
|
)
|
|||||||
|
Repayment of loan from related parties
|
—
|
|
—
|
|
110.8
|
|
110.8
|
|
|||||||
|
Other, net
|
—
|
|
(6.2
|
)
|
—
|
|
(6.2
|
)
|
|||||||
|
Net cash used in continuing operations
|
—
|
|
(457.6
|
)
|
(612.5
|
)
|
(1,070.1
|
)
|
|||||||
|
Net cash used in discontinued operations
|
—
|
|
(1.1
|
)
|
(20.9
|
)
|
(22.0
|
)
|
|||||||
|
Net cash used in investing activities
|
—
|
|
(458.7
|
)
|
(633.4
|
)
|
(1,092.1
|
)
|
|||||||
|
Cash Flows From Financing Activities
|
|||||||||||||||
|
Repayments of long-term debt
|
(379.0
|
)
|
(0.4
|
)
|
(36.4
|
)
|
(415.8
|
)
|
|||||||
|
Proceeds from long-term debt
|
—
|
|
—
|
|
0.8
|
|
0.8
|
|
|||||||
|
Payment of debt issuance costs
|
(6.9
|
)
|
—
|
|
—
|
|
(6.9
|
)
|
|||||||
|
Dividends paid
|
(91.9
|
)
|
—
|
|
—
|
|
(91.9
|
)
|
|||||||
|
Common stock repurchase
|
(99.9
|
)
|
—
|
|
—
|
|
(99.9
|
)
|
|||||||
|
Repurchase of employee common stock relinquished for tax withholding
|
(8.4
|
)
|
—
|
|
—
|
|
(8.4
|
)
|
|||||||
|
Excess tax benefits related to share-based compensation
|
8.3
|
|
—
|
|
—
|
|
8.3
|
|
|||||||
|
Acquisition of MCG Coal Holdings Pty Ltd noncontrolling interests
|
—
|
|
—
|
|
(49.8
|
)
|
(49.8
|
)
|
|||||||
|
Other, net
|
9.4
|
|
—
|
|
(9.1
|
)
|
0.3
|
|
|||||||
|
Transactions with affiliates, net
|
186.2
|
|
(920.1
|
)
|
733.9
|
|
—
|
|
|||||||
|
Net cash (used in) provided by financing activities
|
(382.2
|
)
|
(920.5
|
)
|
639.4
|
|
(663.3
|
)
|
|||||||
|
Net change in cash and cash equivalents
|
$
|
(13.6
|
)
|
$
|
(0.5
|
)
|
$
|
(226.2
|
)
|
$
|
(240.3
|
)
|
|||
|
Cash and cash equivalents at beginning of year
|
283.2
|
|
0.8
|
|
515.1
|
|
799.1
|
|
|||||||
|
Cash and cash equivalents at end of year
|
$
|
269.6
|
|
$
|
0.3
|
|
$
|
288.9
|
|
$
|
558.8
|
|
|||
F -
83
PEABODY ENERGY CORPORATION
SUPPLEMENTAL CONDENSED CONSOLIDATING STATEMENTS OF CASH FLOWS
|
|
Year Ended December 31, 2011
|
||||||||||||||
|
Parent
Company
|
Guarantor
Subsidiaries
|
Non-Guarantor
Subsidiaries
|
Consolidated
|
||||||||||||
|
|
|
(Dollars in millions)
|
|
||||||||||||
|
Cash Flows From Operating Activities
|
|
|
|
|
|
|
|
|
|||||||
|
Net cash provided by continuing operations
|
$
|
28.9
|
|
$
|
1,513.7
|
|
$
|
109.5
|
|
1,652.1
|
|
||||
|
Net cash provided by (used in) discontinued operations
|
4.4
|
|
(0.8
|
)
|
(22.5
|
)
|
(18.9
|
)
|
|||||||
|
Net cash provided by operating activities
|
33.3
|
|
1,512.9
|
|
87.0
|
|
1,633.2
|
|
|||||||
|
Cash Flows From Investing Activities
|
|
|
|
|
|
|
|
|
|||||||
|
Additions to property, plant, equipment and mine development
|
—
|
|
$
|
(350.4
|
)
|
(497.0
|
)
|
(847.4
|
)
|
||||||
|
Changes in accrued expenses related to capital expenditures
|
—
|
|
—
|
|
51.2
|
|
51.2
|
|
|||||||
|
Federal coal lease expenditures
|
—
|
|
(42.4
|
)
|
—
|
|
(42.4
|
)
|
|||||||
|
Investment in Prairie State Energy Campus
|
—
|
|
(36.2
|
)
|
—
|
|
(36.2
|
)
|
|||||||
|
Proceeds from disposal of assets, net of notes receivable
|
—
|
|
34.1
|
|
6.0
|
|
40.1
|
|
|||||||
|
Investments in equity affiliates and joint ventures
|
—
|
|
(2.0
|
)
|
(37.7
|
)
|
(39.7
|
)
|
|||||||
|
Purchases of debt and equity securities
|
—
|
|
(103.6
|
)
|
(44.1
|
)
|
(147.7
|
)
|
|||||||
|
Proceeds from sales of debt and equity securities
|
—
|
|
47.0
|
|
57.6
|
|
104.6
|
|
|||||||
|
Purchase of short-term investments
|
(75.0
|
)
|
—
|
|
(25.0
|
)
|
(100.0
|
)
|
|||||||
|
Maturity of short-term investments
|
75.0
|
|
—
|
|
25.0
|
|
100.0
|
|
|||||||
|
Acquisition of Macarthur Coal Limited, net of cash acquired
|
—
|
|
—
|
|
(2,756.7
|
)
|
(2,756.7
|
)
|
|||||||
|
Contributions to joint ventures
|
—
|
|
—
|
|
(145.4
|
)
|
(145.4
|
)
|
|||||||
|
Distributions from joint ventures
|
—
|
|
—
|
|
128.6
|
|
128.6
|
|
|||||||
|
Advances to related parties
|
—
|
|
—
|
|
(371.3
|
)
|
(371.3
|
)
|
|||||||
|
Repayment of loans from related parties
|
—
|
|
—
|
|
331.7
|
|
331.7
|
|
|||||||
|
Other, net
|
—
|
|
(6.5
|
)
|
(0.1
|
)
|
(6.6
|
)
|
|||||||
|
Net cash used in continuing operations
|
—
|
|
(460.0
|
)
|
(3,277.2
|
)
|
(3,737.2
|
)
|
|||||||
|
Net cash used in discontinued operations
|
—
|
|
(8.3
|
)
|
(62.3
|
)
|
(70.6
|
)
|
|||||||
|
Net cash used in investing activities
|
—
|
|
(468.3
|
)
|
(3,339.5
|
)
|
(3,807.8
|
)
|
|||||||
|
Cash Flows From Financing Activities
|
|
|
|
|
|
|
|
|
|||||||
|
Repayments of long-term debt
|
(243.1
|
)
|
—
|
|
(20.8
|
)
|
$
|
(263.9
|
)
|
||||||
|
Proceeds from long-term debt
|
4,100.0
|
|
—
|
|
1.4
|
|
4,101.4
|
|
|||||||
|
Payment of debt issuance costs
|
(61.5
|
)
|
—
|
|
—
|
|
(61.5
|
)
|
|||||||
|
Dividends paid
|
(92.1
|
)
|
—
|
|
—
|
|
(92.1
|
)
|
|||||||
|
Repurchase of employee common stock relinquished for tax withholding
|
(18.7
|
)
|
—
|
|
—
|
|
(18.7
|
)
|
|||||||
|
Excess tax benefits related to share-based compensation
|
8.1
|
|
—
|
|
—
|
|
8.1
|
|
|||||||
|
Acquisition of PEAMCoal Pty Ltd noncontrolling interests
|
—
|
|
—
|
|
(1,994.8
|
)
|
(1,994.8
|
)
|
|||||||
|
Other, net
|
—
|
|
(0.9
|
)
|
0.9
|
|
—
|
|
|||||||
|
Transactions with affiliates, net
|
(4,346.6
|
)
|
(1,048.1
|
)
|
5,394.7
|
|
—
|
|
|||||||
|
Net cash (used in) provided by financing activities
|
(653.9
|
)
|
(1,049.0
|
)
|
3,381.4
|
|
1,678.5
|
|
|||||||
|
Net change in cash and cash equivalents
|
(620.6
|
)
|
(4.4
|
)
|
128.9
|
|
(496.1
|
)
|
|||||||
|
Cash and cash equivalents at beginning of year
|
903.8
|
|
5.2
|
|
386.2
|
|
1,295.2
|
|
|||||||
|
Cash and cash equivalents at end of year
|
$
|
283.2
|
|
$
|
0.8
|
|
$
|
515.1
|
|
$
|
799.1
|
|
|||
F -
84
PEABODY ENERGY CORPORATION
SCHEDULE II — VALUATION AND QUALIFYING ACCOUNTS
|
Description
|
Balance at
Beginning of Period |
Charged to
Costs and Expenses |
Deductions
(1)
|
Other
|
|
Balance
at End of Period |
||||||||||||||
|
|
(Dollars in millions)
|
|||||||||||||||||||
|
Year Ended December 31, 2013
|
|
|
|
|
|
|
|
|
|
|
|
|||||||||
|
Reserves deducted from asset accounts:
|
|
|
|
|
|
|
|
|
|
|
|
|||||||||
|
Advance royalty recoupment reserve
|
$
|
15.3
|
|
$
|
0.1
|
|
$
|
(5.7
|
)
|
(2)
|
$
|
—
|
|
$
|
9.7
|
|
||||
|
Reserve for materials and supplies
|
16.0
|
|
1.7
|
|
(10.3
|
)
|
—
|
|
7.4
|
|
||||||||||
|
Allowance for doubtful accounts
|
13.7
|
|
4.3
|
|
(10.1
|
)
|
(0.5
|
)
|
(3)
|
7.4
|
|
|||||||||
|
Tax valuation allowances
|
1,481.8
|
|
(29.4
|
)
|
—
|
|
181.7
|
|
(4)
|
1,634.1
|
|
|||||||||
|
Year Ended December 31, 2012
|
|
|
|
|
|
|
|
|
|
|
|
|||||||||
|
Reserves deducted from asset accounts:
|
|
|
|
|
|
|
|
|
|
|
|
|||||||||
|
Advance royalty recoupment reserve
|
$
|
21.3
|
|
$
|
2.9
|
|
$
|
(9.0
|
)
|
(2)
|
$
|
0.1
|
|
(5)
|
$
|
15.3
|
|
|||
|
Reserve for materials and supplies
|
6.5
|
|
13.7
|
|
(4.2
|
)
|
—
|
|
16.0
|
|
||||||||||
|
Allowance for doubtful accounts
|
17.0
|
|
(0.5
|
)
|
(0.7
|
)
|
(2.1
|
)
|
(3)
|
13.7
|
|
|||||||||
|
Tax valuation allowances
|
79.8
|
|
521.5
|
|
(77.0
|
)
|
(6)
|
957.5
|
|
(7)
|
1,481.8
|
|
||||||||
|
Year Ended December 31, 2011
|
|
|
|
|
|
|
|
|
|
|
|
|||||||||
|
Reserves deducted from asset accounts:
|
|
|
|
|
|
|
|
|
|
|
|
|||||||||
|
Advance royalty recoupment reserve
|
$
|
19.9
|
|
$
|
1.8
|
|
$
|
(0.1
|
)
|
$
|
(0.3
|
)
|
(5)
|
$
|
21.3
|
|
||||
|
Reserve for materials and supplies
|
6.2
|
|
3.7
|
|
(3.4
|
)
|
—
|
|
6.5
|
|
||||||||||
|
Allowance for doubtful accounts
|
30.3
|
|
(3.7
|
)
|
(0.4
|
)
|
(9.2
|
)
|
(3)
|
17.0
|
|
|||||||||
|
Tax valuation allowances
|
65.0
|
|
15.4
|
|
—
|
|
(0.6
|
)
|
79.8
|
|
||||||||||
|
(1)
|
Reserves utilized, unless otherwise indicated.
|
|
(2)
|
Deductions to advance royalty recoupment reserve represents the termination of federal and state leases.
|
|
(3)
|
Represents subsequent recovery of receivable amounts previously reserved.
|
|
(4)
|
Related to the Australian minerals and resource rent tax, as offset by the impact of the 2013 decrease in Australian dollar exchange rates.
|
|
(5)
|
Balances transferred (to) from other accounts or reserves recorded as part of a property transaction or acquisition.
|
|
(6)
|
Deductions include write-off of loss carryforwards and reversal of related valuation allowances.
|
|
(7)
|
Includes changes to valuation allowances primarily related to deferred tax assets acquired in business combinations and initial deferred tax a
ssets resulting from the minerals resource rent tax implemented in Australia in 2012.
|
F -
85
EXHIBIT INDEX
The exhibits below are numbered in accordance with the Exhibit Table of Item 601 of Regulation S-K.
|
Exhibit No.
|
Description of Exhibit
|
|
|
3.1
|
Third Amended and Restated Certificate of Incorporation of the Registrant, as amended (Incorporated by reference to Exhibit 3.1 to the Registrant's Annual Report on Form 10-K for the year ended December 31, 2011).
|
|
|
3.2
|
Amended and Restated By-Laws of the Registrant (Incorporated by reference to Exhibit 3.1 of the Registrant's Current Report on Form 8-K, filed
July 29, 2013
).
|
|
|
4.1
|
Specimen of stock certificate representing the Registrant's common stock, $.01 par value (Incorporated by reference to Exhibit 4.13 to Amendment No. 4 to the Registrant's Form S-1 Registration Statement No. 333-55412, filed May 1, 2001).
|
|
|
4.2
|
Indenture, dated as of March 19, 2004, between the Registrant and U.S. Bank National Association, as trustee (Incorporated by reference to Exhibit 4.12 of the Registrant's Quarterly Report on Form 10-Q for the quarter ended March 31, 2004).
|
|
|
4.3
|
Subordinated Indenture, dated as of December 20, 2006, between the Registrant and U.S. Bank National Association, as trustee (Incorporated by reference to Exhibit 4.1 of the Registrant's Current Report on Form 8-K, filed December 20, 2006).
|
|
|
4.4
|
Indenture, dated as of November 15, 2011, among Peabody, the Guarantors named therein and U.S. Bank National Association, as trustee, governing the 6.00% Senior Notes Due 2018 and 6.25% Senior Notes Due 2021 (Incorporated by reference to Exhibit 4.1 of the Registrant's Current Report on Form 8-K, filed November 17, 2011).
Pursuant to CFR 229.601(b)(4)(iii), instruments with respect to long-term debt issues have been omitted where the amount of securities authorized under such instruments does not exceed 10% of the total consolidated assets of the Registrant. The Registrant hereby agrees to furnish a copy of any such instrument to the Commission upon its request.
|
|
|
10.1
|
Amended and Restated Credit Agreement, as amended and restated as of September 24, 2013, by and among Peabody Energy Corporation, Citibank, N.A., as administrative agent, swing line lender and L/C issuer, Citigroup Global Markets, Inc., Merrill Lynch, Pierce, Fenner & Smith Incorporated, BNP Paribas Securities Corp., Crédit Agricole Corporate and Investment Bank, HSBC Securities (USA) Inc., Morgan Stanley Senior Funding, Inc., PNC Capital Markets LLC and RBS Securities Inc., as joint lead arrangers and joint book managers, and the other agents and lending institutions identified in the Credit Agreement (Incorporated by reference to Exhibit 10.1 of the Registrant’s Quarterly Report on Form 10-Q for the quarter ended September 30, 2013).
|
|
|
10.2
|
Share Charge, dated as of September 24, 2013, between Peabody Holdings (Gibraltar) Limited, as grantor, and Citibank, N.A., as administrative agent. (Incorporated by reference to Exhibit 10.2 to the Registrant's Current Report on Form 8-K filed on September 30, 2013).
|
|
|
10.3
|
Pledge Agreement, dated as of September 24, 2013, among Peabody Investments Corp., as grantor, and Citibank, N.A., as administrative agent. (Incorporated by reference to Exhibit 10.3 to the Registrant's Current Report on Form 8-K filed on September 30, 2013).
|
|
|
10.4
|
Fourth Amended and Restated Receivables Purchase Agreement, dated as of May 1, 2013, by and among P&L Receivables Company, LLC, Peabody Energy Corporation, the various Sub-Servicers listed on the signature pages thereto, all Conduit Purchasers listed on the signature pages thereto, all Related Committed Purchasers listed on the signature pages thereto, all Purchaser Agents listed on the signature pages thereto, all LC Participants listed on the signature pages thereto, and PNC Bank, National Association, as Administrator and as LC Bank (Incorporated by reference to Exhibit 10.1 to the Registrant's Current Report on Form 8-K filed on May 3, 2013).
|
|
|
10.5
|
Federal Coal Lease WYW0321779: North Antelope/Rochelle Mine (Incorporated by reference to Exhibit 10.3 of the Registrant's Form S-4 Registration Statement No. 333-59073).
|
|
|
10.6
|
Federal Coal Lease WYW119554: North Antelope/Rochelle Mine (Incorporated by reference to Exhibit 10.4 of the Registrant's Form S-4 Registration Statement No. 333-59073, filed July 14, 1998).
|
|
|
10.7
|
Federal Coal Lease WYW5036: Rawhide Mine (Incorporated by reference to Exhibit 10.5 of the Registrant's Form S-4 Registration Statement No. 333-59073, filed July 14, 1998).
|
|
|
10.8
|
Federal Coal Lease WYW3397: Caballo Mine (Incorporated by reference to Exhibit 10.6 of the Registrant's Form S-4 Registration Statement No. 333-59073, filed July 14, 1998).
|
|
|
10.9
|
Federal Coal Lease WYW83394: Caballo Mine (Incorporated by reference to Exhibit 10.7 of the Registrant's Form S-4 Registration Statement No. 333-59073, filed July 14, 1998).
|
|
|
10.10
|
Federal Coal Lease WYW136142 (Incorporated by reference to Exhibit 10.8 of Amendment No. 1 to the Registrant's Form S-4 Registration Statement No. 333-59073, filed September 8, 1998).
|
|
|
Exhibit No.
|
Description of Exhibit
|
|
|
10.11
|
Royalty Prepayment Agreement by and among Peabody Natural Resources Company, Gallo Finance Company and Chaco Energy Company, dated September 30, 1998 (Incorporated by reference to Exhibit 10.9 of the Registrant's Quarterly Report on Form 10-Q for the quarter ended September 30, 1998).
|
|
|
10.12
|
Federal Coal Lease WYW154001: North Antelope Rochelle South (Incorporated by reference to Exhibit 10.68 of the Registrant's Quarterly Report on Form 10-Q for the quarter ended September 30, 2004).
|
|
|
10.13
|
Federal Coal Lease WYW150210: North Antelope Rochelle Mine (Incorporated by reference to Exhibit 10.8 of the Registrant's Quarterly Report on Form 10-Q for the quarter ended March 31, 2005).
|
|
|
10.14
|
Federal Coal Lease WYW151134 effective May 1, 2005: West Roundup (Incorporated by reference to Exhibit 10.1 of the Registrant's Quarterly Report on Form 10-Q for the quarter ended June 30, 2005).
|
|
|
10.15
|
Federal Coal Lease Readjustment WYW78663: Caballo (Incorporated by reference to Exhibit 10.24 of the Registrant’s Annual Report on Form 10-K for the year ended December 31, 2012).
|
|
|
10.16
|
Transfer by Assignment and Assumption of Federal Coal Lease WYW172657: Caballo West (Incorporated by reference to Exhibit 10.25 of the Registrant’s Annual Report on Form 10-K for the year ended December 31, 2012).
|
|
|
10.17
|
Federal Coal Lease WYW176095: Porcupine South (Incorporated by reference to Exhibit 10.26 of the Registrant’s Annual Report on Form 10-K for the year ended December 31, 2012).
|
|
|
10.18
|
Federal Coal Lease WYW173408: North Porcupine (Incorporated by reference to Exhibit 10.27 of the Registrant’s Annual Report on Form 10-K for the year ended December 31, 2012).
|
|
|
10.19
|
Federal Coal Lease WYW172413: School Creek (Incorporated by reference to Exhibit 10.28 of the Registrant’s Annual Report on Form 10-K for the year ended December 31, 2012).
|
|
|
10.20
|
Separation Agreement, Plan of Reorganization and Distribution, dated October 22, 2007, between the Registrant and Patriot Coal Corporation (Incorporated by reference to Exhibit 10.1 of the Registrant's Current Report on Form 8-K, filed October 25, 2007).
|
|
|
10.21
|
Tax Separation Agreement, dated October 22, 2007, between the Registrant and Patriot Coal Corporation (Incorporated by reference to Exhibit 10.2 of the Registrant's Current Report on Form 8-K, filed October 25, 2007).
|
|
|
10.22
|
Coal Act Liabilities Assumption Agreement, dated October 22, 2007, among Patriot Coal Corporation, Peabody Holding Company, LLC and the Registrant (Incorporated by reference to Exhibit 10.3 of the Registrant's Current Report on Form 8-K, filed October 25, 2007).
|
|
|
10.23
|
Salaried Employee Liabilities Assumption Agreement, dated October 22, 2007, among Patriot Coal Corporation, Peabody Holding Company, LLC, Peabody Coal Company, LLC and the Registrant (Incorporated by reference to Exhibit 10.5 of the Registrant's Current Report on Form 8-K, filed October 25, 2007).
|
|
|
10.24
|
Coal Supply Agreement, dated October 22, 2007, between Patriot Coal Sales LLC and COALSALES II, LLC (Incorporated by reference to Exhibit 10.6 of the Registrant's Current Report on Form 8-K, filed October 25, 2007).
|
|
|
10.25
|
Settlement Agreement entered into as of October 24, 2013, by and among Patriot Coal Corporation, on behalf of itself and its affiliates, the Registrant, on behalf of itself and its affiliates, and the United Mine Workers of America, on behalf of itself and the UMWA Employees and UMWA Retirees (Incorporated by reference to Exhibit 10.1 of the Registrant's Current Report on Form 8-K, filed October 30, 2013).
|
|
|
10.26*
|
1998 Stock Purchase and Option Plan for Key Employees of the Registrant (Incorporated by reference to Exhibit 4.9 of the Registrant's Form S-8 Registration Statement No. 333-105456, filed May 21, 2003).
|
|
|
10.27*
|
Amendment to the 1998 Stock Purchase and Option Plan for Key Employees of the Registrant (Incorporated by reference to Exhibit 10.4 of the Registrant's Current Report on Form 8-K, filed October 17, 2007).
|
|
|
10.28*
|
Amendment No. 2 to the 1998 Stock Purchase and Option Plan for Key Employees of the Registrant (Incorporated by reference to Exhibit 10.2 of the Registrant's Current Report on Form 8-K, filed December 11, 2007).
|
|
|
10.29*
|
Form of Non-Qualified Stock Option Agreement under the Registrant's 1998 Stock Purchase and Option Plan for Key Employees (Incorporated by reference to Exhibit 10.15 of the Registrant's Annual Report on Form 10-K for the year ended December 31, 2003).
|
|
|
10.30*
|
Form of Amendment to Non-Qualified Stock Option Agreement under the Registrant's 1998 Stock Purchase and Option Plan for Key Employees (Incorporated by reference to Exhibit 10.16 of the Registrant's Annual Report on Form 10-K for the year ended December 31, 2003).
|
|
|
10.31*
|
Form of Amendment, dated as of June 15, 2004, to Non-Qualified Stock Option Agreement under the Registrant's 1998 Stock Purchase and Option Plan for Key Employees (Incorporated by reference to Exhibit 10.65 of the Registrant's Quarterly Report on Form 10-Q for the quarter ended June 30, 2004).
|
|
|
Exhibit No.
|
Description of Exhibit
|
|
|
10.32*
|
Form of Incentive Stock Option Agreement under the Registrant's 1998 Stock Purchase and Option Plan for Key Employees (Incorporated by reference to Exhibit 10.17 of the Registrant's Annual Report on Form 10-K for the year ended December 31, 2003).
|
|
|
10.33*
|
Long-Term Equity Incentive Plan of the Registrant (Incorporated by reference to Exhibit 99.2 of the Registrant's Form S-8 Registration Statement No. 333-61406, filed May 22, 2001).
|
|
|
10.34*
|
Amendment to the Registrant's 2001 Long-Term Equity Incentive Plan (Incorporated by reference to Exhibit 10.3 of the Registrant's Current Report on Form 8-K, filed October 17, 2007).
|
|
|
10.35*
|
Form of Non-Qualified Stock Option Agreement under the Registrant's 2001 Long-Term Equity Incentive Plan (Incorporated by reference to Exhibit 10.18 of the Registrant's Annual Report on Form 10-K for the year ended December 31, 2003).
|
|
|
10.36*
|
Form of Performance Unit Award Agreement under the Registrant's 2001 Long-Term Equity Incentive Plan (Incorporated by reference to Exhibit 10.19 of the Registrant's Annual Report on Form 10-K for the year ended December 31, 2003).
|
|
|
10.37*
|
Form of Non-Qualified Stock Option Agreement for Outside Directors under the Registrant's 2001 Long-Term Equity Incentive Plan (Incorporated by reference to Exhibit 10.1 to the Registrant's Current Report on Form 8-K, filed December 14, 2005).
|
|
|
10.38*
|
Form of Restricted Stock Award Agreement for Outside Directors under the Registrant's 2001 Long-Term Equity Incentive Plan (Incorporated by reference to Exhibit 10.2 to the Registrant's Current Report on Form 8-K, filed December 14, 2005).
|
|
|
10.39*
|
Equity Incentive Plan for Non-Employee Directors of the Registrant (Incorporated by reference to Exhibit 99.3 of the Registrant's Form S-8 Registration Statement No. 333-61406, filed May 22, 2001).
|
|
|
10.40*
|
Form of Non-Qualified Stock Option Agreement under the Registrant's Equity Incentive Plan for Non-Employee Directors (Incorporated by reference to Exhibit 10.20 of the Registrant's Annual Report on Form 10-K for the year ended December 31, 2003).
|
|
|
10.41*
|
The Registrant's 2004 Long-Term Equity Incentive Plan (Incorporated by reference to Annex A to the Registrant's Proxy Statement for the 2004 Annual Meeting of Stockholders, filed April 2, 2004).
|
|
|
10.42*
|
Amendment No. 1 to the Registrant's 2004 Long Term Equity Incentive Plan (Incorporated by reference to Exhibit 10.67 of the Registrant's Quarterly Report on Form 10-Q for the quarter ended September 30, 2004).
|
|
|
10.43*
|
Amendment No. 2 to the Registrant's 2004 Long-Term Equity Incentive Plan (Incorporated by reference to Exhibit 10.1 of the Registrant's Current Report on Form 8-K, filed October 17, 2007).
|
|
|
10.44*
|
Amendment No. 3 to the Registrant's 2004 Long-Term Equity Incentive Plan (Incorporated by reference to Exhibit 10.2 of the Registrant's Current Report on Form 8-K, filed October 17, 2007).
|
|
|
10.45*
|
Amendment No. 4 to the Registrant's 2004 Long-Term Equity Incentive Plan (Incorporated by reference to Exhibit 10.1 of the Registrant's Current Report on Form 8-K, filed December 11, 2007).
|
|
|
10.46*
|
Form of Non-Qualified Stock Option Agreement under the Registrant's 2004 Long-Term Equity Incentive Plan (Incorporated by reference to Exhibit 10.1 to the Registrant's Current Report on Form 8-K, filed January 7, 2005).
|
|
|
10.47*
|
Form of Performance Units Agreement under the Registrant's 2004 Long-Term Equity Incentive Plan (Incorporated by reference to Exhibit 10.2 of the Registrant's Current Report on Form 8-K, filed January 7, 2005).
|
|
|
10.48*
|
Form of Performance Units Agreement under the Registrant's 2004 Long-Term Equity Incentive Plan (Incorporated by reference to Exhibit 10.36 of the Registrant's Annual Report on Form 10-K for the year ended December 31, 2007).
|
|
|
10.49*
|
Form of Performance Unit Award Agreement under the Registrant's 2004 Long-Term Equity Incentive Plan (Incorporated by reference to Exhibit 10.2 of the Registrant's Quarterly Report on Form 10-Q for the quarter ended June 30, 2009).
|
|
|
10.50*
|
Form of Deferred Stock Units Agreement for Non-Employee Directors under the Registrant's 2004 Long-Term Equity Incentive Plan (Incorporated by reference to Exhibit 10.43 of the Registrant's Annual Report on Form 10-K for the year ended December 31, 2010).
|
|
|
10.51*
|
Peabody Energy Corporation 2011 Long-Term Equity Incentive Plan (Incorporated by reference to Appendix A of the Registrant's Proxy Statement, filed March 22, 2011).
|
|
|
10.52*
|
Form of Non-Qualified Stock Option Agreement under the Registrant's 2011 Long-Term Equity Incentive Plan (Incorporated by reference to Exhibit 10.59 to the Registrant's Annual Report on Form 10-K for the year ended December 31, 2011).
|
|
|
10.53*
|
Form of Performance Units Agreement under the Registrant's 2011 Long-Term Equity Incentive Plan. (Incorporated by reference to Exhibit 10.60 to the Registrant's Annual Report on Form 10-K for the year ended December 31, 2011).
|
|
|
Exhibit No.
|
Description of Exhibit
|
|
|
10.54*
|
Form of Restricted Stock Award Agreement under the Registrant's 2011 Long-Term Equity Incentive Plan (Incorporated by reference to Exhibit 10.61 to the Registrant's Annual Report on Form 10-K for the year ended December 31, 2011).
|
|
|
10.55*
|
Form of Deferred Stock Unit Agreement under the Registrant's 2011 Long-Term Equity Incentive Plan (Incorporated by reference to Exhibit 10.62 to the Registrant's Annual Report on Form 10-K for the year ended December 31, 2011).
|
|
|
10.56*
|
2009 Amendment entered into effective December 31, 2009 to the Stock Grant Agreement dated as of October 1, 2003 between the Registrant and Gregory H. Boyce (Incorporated by reference to Exhibit 10.45 of the Registrant's Annual Report on Form 10-K for the year ended December 31, 2009).
|
|
|
10.57*
|
2009 Amendment entered into effective December 31, 2009 to the Non-Qualified Stock Option Agreement dated January 2, 2008 between the Registrant and Gregory H. Boyce (Incorporated by reference to Exhibit 10.46 of the Registrant's Annual Report on Form 10-K for the year ended December 31, 2009).
|
|
|
10.58*
|
2009 Amendment entered into effective December 31, 2009 to the Non-Qualified Stock Option Agreement dated January 5, 2009 between the Registrant and Gregory H. Boyce (Incorporated by reference to Exhibit 10.47 of the Registrant's Annual Report on Form 10-K for the year ended December 31, 2009).
|
|
|
10.59*
|
2009 Amendment entered into effective December 31, 2009 to the Performance Units Agreement dated January 2, 2008 between the Registrant and Gregory H. Boyce (Incorporated by reference to Exhibit 10.48 of the Registrant's Annual Report on Form 10-K for the year ended December 31, 2009).
|
|
|
10.60*
|
2009 Amendment entered into effective December 31, 2009 to the Performance Units Agreement dated January 5, 2009 between the Registrant and Gregory H. Boyce (Incorporated by reference to Exhibit 10.49 of the Registrant's Annual Report on Form 10-K for the year ended December 31, 2009).
|
|
|
10.61*
|
2010 Amendment entered into effective March 17, 2010, to the 2008 Performance Units Award Agreement dated January 2, 2008 between the Registrant and Gregory H. Boyce (Incorporated by reference to Exhibit 10.3 of the Registrant's Quarterly Report on Form 10-Q for the quarter ended March 31, 2010).
|
|
|
10.62*
|
2010 Amendment entered into effective March 17, 2010, to the 2009 Performance Units Award Agreement dated January 5, 2009 between the Registrant and Gregory H. Boyce (Incorporated by reference to Exhibit 10.4 of the Registrant's Quarterly Report on Form 10-Q for the quarter ended March 31, 2010).
|
|
|
10.63*
|
Amended and Restated Employee Stock Purchase Plan of the Registrant (Incorporated by reference to Exhibit 10.44 of the Registrant's Annual Report on Form 10-K for the year ended December 31, 2008).
|
|
|
10.64*
|
Amendment to the Amended and Restated Employee Stock Purchase Plan of the Registrant (Incorporated by reference to Exhibit 10.51 of the Registrant's Annual Report on Form 10-K for the year ended December 31, 2009).
|
|
|
10.65*
|
Amended and Restated Australian Employee Stock Purchase Plan of the Registrant (Incorporated by reference to Exhibit 10.45 of the Registrant's Annual Report on Form 10-K for the year ended December 31, 2008).
|
|
|
10.66*
|
Amendment to the Amended and Restated Australian Employee Stock Purchase Plan of the Registrant (Incorporated by reference to Exhibit 10.53 of the Registrant's Annual Report on Form 10-K for the year ended December 31, 2009).
|
|
|
10.67*
|
2008 Management Annual Incentive Compensation Plan (Incorporated by reference to Appendix B to the Registrant's Proxy Statement for the 2008 Annual Meeting of Shareholders, filed March 27, 2008).
|
|
|
10.68*
|
The Registrant's Deferred Compensation Plan (Incorporated by reference to Exhibit 10.30 of the Registrant's Quarterly Report on Form 10-Q for the quarter ended September 30, 2001).
|
|
|
10.69*
|
First Amendment to the Registrant's Deferred Compensation Plan (Incorporated by reference to Exhibit 10.49 of the Registrant's Annual Report on Form 10-K for the year ended December 31, 2004).
|
|
|
10.70*
|
Letter Agreement, dated as of March 1, 2005, by and between the Registrant and Gregory H. Boyce (Incorporated by reference to Exhibit 10.1 of the Registrant's Current Report on Form 8-K, filed March 4, 2005).
|
|
|
10.71*
|
Restated Employment Agreement effective December 31, 2009 by and between the Registrant and Gregory H. Boyce (Incorporated by reference to Exhibit 10.1 of the Registrant's Current Report on Form 8-K, filed December 24, 2009).
|
|
|
10.72*
|
Transition Agreement effective April 29, 2013 by and between Peabody Energy Corporation and Gregory H. Boyce (entered into on April 29, 2013) (Incorporated by reference to Exhibit 10.2 to the Registrant's Current Report on Form 8-K filed on May 3, 2013).
|
|
|
10.73*
|
2013 Restricted Stock Unit Agreement by and between Peabody Energy Corporation and Gregory H. Boyce (Incorporated by reference to Exhibit 10.3 to the Registrant's Current Report on Form 8-K filed on May 3, 2013).
|
|
|
10.74*
|
Employment Agreement entered into as of August 21, 2013, by and between Peabody Energy Corporation and Glenn L. Kellow (Incorporated by reference to Exhibit 10.1 to the Registrant's Current Report on Form 8-K filed on August 27, 2013).
|
|
|
Exhibit No.
|
Description of Exhibit
|
|
|
10.75*
|
Restrictive Covenant Agreement entered into as of August 21, 2013, by and between Peabody Energy Corporation and Glenn L. Kellow (Incorporated by reference to Exhibit 10.2 to the Registrant's Current Report on Form 8-K filed on August 27, 2013).
|
|
|
10.76*
|
Employment Agreement entered into as of December 31, 2008 by and between the Registrant and Michael C. Crews (Incorporated by reference to Exhibit 10.3 of the Registrant's Current Report on Form 8-K, filed December 31, 2008).
|
|
|
10.77*
|
Executive Service Agreement entered into on April 1, 2012 between Peabody Energy Australia Coal Pty Limited and Eric Ford (Incorporated by reference to Exhibit 10.1 of the Registrant's Current Report on Form 8-K, filed April 5, 2012).
|
|
|
10.78*
|
Deed of Retirement dated October 31, 2013, by and between Eric Ford and Peabody Energy Australia Coal Pty Limited (Incorporated by reference to Exhibit 10.1 to the Registrant's Current Report on Form 8-K filed on November 5, 2013).
|
|
|
10.79*
|
Consultancy Agreement dated October 31, 2013, by and between Eric Ford and Peabody Energy Australia Coal Pty Limited (Incorporated by reference to Exhibit 10.2 to the Registrant's Current Report on Form 8-K filed on November 5, 2013).
|
|
|
10.80*
|
Restricted Stock Award Agreement dated as of October 26, 2011 by and between the Registrant and Eric Ford (Incorporated by reference to Exhibit 10.3 to the Registrant's Current Report on Form 8-K filed on November 5, 2013).
|
|
|
10.81*
|
Amendment to Restricted Stock Award Agreement dated as of October 24, 2013 by and between the Registrant and Eric Ford (Incorporated by reference to Exhibit 10.4 to the Registrant's Current Report on Form 8-K filed on November 5, 2013).
|
|
|
10.82*
|
Restated Employment Agreement entered into as of January 7, 2013 by and between the Registrant and Charles F. Meintjes (Incorporated by reference to Exhibit 10.2 to the Registrant's Current Report on Form 8-K, filed January 10, 2013).
|
|
|
10.83*
|
Peabody Energy Corporation Executive Severance Plan (Incorporated by reference to Exhibit 10.1 of the Registrant's Current Report on Form 8-K, filed October 29, 2013).
|
|
|
10.84*
|
Form of Director and Executive Officer Indemnification Agreement between the Registrant and each of its directors and executive officers (Incorporated by reference to Exhibit 10.6 to the Registrant’s Quarterly Report on Form 10-Q for the quarter ended September 30, 2013).
|
|
|
10.85*
|
Peabody Investments Corp. Supplemental Employee Retirement Account (Incorporated by reference to Exhibit 10.1 of the Registrant's Quarterly Report on Form 10-Q for the quarter ended June 30, 2007).
|
|
|
21†
|
List of Subsidiaries.
|
|
|
23†
|
Consent of Ernst & Young LLP, Independent Registered Public Accounting Firm.
|
|
|
31.1†
|
Certification of periodic financial report by the Registrant's Chief Executive Officer pursuant to Rule 13a-14(a) under the Securities Exchange Act of 1934, as amended pursuant to Section 302 of the Sarbanes-Oxley Act of 2002.
|
|
|
31.2†
|
Certification of periodic financial report by the Registrant's Chief Financial Officer pursuant to Rule 13a-14(a) under the Securities Exchange Act of 1934, as amended pursuant to Section 302 of the Sarbanes-Oxley Act of 2002.
|
|
|
32.1†
|
Certification of periodic financial report pursuant to 18 U.S.C. Section 1350, adopted pursuant to Section 906 of the Sarbanes-Oxley Act of 2002, by the Registrant's Chief Executive Officer.
|
|
|
32.2†
|
Certification of periodic financial report pursuant to 18 U.S.C. Section 1350, adopted pursuant to Section 906 of the Sarbanes-Oxley Act of 2002, by the Registrant's Chief Financial Officer.
|
|
|
95†
|
Mine Safety Disclosure required by Item 104 of Regulation S-K.
|
|
|
101†
|
Interactive Data File (Form 10-K for the year ended December 31, 2013 filed in XBRL). The financial information contained in the XBRL-related documents is “unaudited” and “unreviewed.”
|
|
|
*
|
These exhibits constitute all management contracts, compensatory plans and arrangements required to be filed as an exhibit to this form pursuant to Item 15(a)(3) and 15(b) of this report.
|
|
|
|
|
†
|
Filed herewith.
|
TABLE OF CONTENTS
Part IItem 1. BusinessItem 1A. Risk FactorsItem 1B. Unresolved Staff CommentsItem 2. PropertiesItem 3. Legal ProceedingsItem 4. Mine Safety DisclosuresPart IIItem 5. Market For Registrant S Common Equity, Related Stockholder Matters and Issuer Purchases Of Equity SecuritiesItem 6. Selected Financial DataItem 7. Management S Discussion and Analysis Of Financial Condition and Results Of OperationsItem 7A. Quantitative and Qualitative Disclosures About Market RiskItem 8. Financial Statements and Supplementary DataItem 9. Changes in and Disagreements with Accountants on Accounting and Financial DisclosureItem 9A. Controls and ProceduresItem 9B. Other InformationPart IIIItem 10. Directors, Executive Officers and Corporate GovernanceItem 11. Executive CompensationItem 12. Security Ownership Of Certain Beneficial Owners and Management and Related Stockholder MattersItem 13. Certain Relationships and Related Transactions, and Director IndependenceItem 14. Principal Accounting Fees and ServicesPart IVItem 15. Exhibits, Financial Statement Schedules